


Bahasa
Halaman
Hukum


69
DAFTAR PUSTAKA
Aaker, 2004. Strategic Marketing Manajement. New York.
Andreas Surya Hardiman, 2008, Analisis Pengaruh Kepuasan Konsumenterhadap Loyalitas Pelanggan (Studi Kasus pada Mega JayaEmproidery), Skirpsi Jurusan Manajemen Universitas KatolikSoegijapranata Semarang.
Basu Swastha, 2009, Manajemen Pemasaran Modern, Liberty Offset,Yogyakarta.
Bebet Wijayanto, Apriautni Endang P. Sari Listyorini, 2013, Pengaruh BauranRitel terhadap Loyalitas Konsumen di Supermarket Sri RatuPeterongan, Diponegoro Journal of Social and Politic, hal 1-10.
Budi Wahyono, Dasar dan Tujuan Harga produk,http://www.pendidikanekonomi.com/2012/07/dasar-dan-tujuan-harga-produk.html.
Fandy Tjiptono,2009, Strategi Bisnis Pemasaran, Jilid II. Andi. Yogyakarta
Ferdinand, Augusty, 2006, Metode Penelitian Manajemen PedomanPenelitian untuk Penulisan Skripsi, Tesis dan Disertasi IlmuManajemen, Edisi Kedua,:Badan Penerbit Universitas Diponegoro.
Gujarati, Damodar, 2005. Dasar-Dasar Ekonometrika. Erlangga, Jakarta.
Hendri Ma’ruf, 2006, Pemasaran Ritel (Ed. Ke2), Gramedia Pustaka Utama,Jakarta.
Ismail Ishak dan Zhafiri Lutfi, 2011, Pengaruh Kepuasan dan KepercayaanKonsumen terhadap Loyalitas : Studi tentang Peran MediasiSwitching Costs, Jurnal Siasat Bisnis, Vol 15 No.1 Januari, hal55-66.
Kotler, Phillip dan Gary Amstrong, 2008, Dasar-Dasar Pemasaran,Edisi Ke enam, Jilid 1, Intermedia, Jakarta.
Mowen, John, C dan Michael Minor, 2002, Perilaku Konsumen, Jilid Kedua,Jakarta.
69
70
Nurullaili, 2013, Analisis Pengaruh Kualitas Produk, Harga, Promosi danDesain Terhadap Loyalitas Konsumen (Studi pada KonsumenTupperware di Universitas Diponegoro), Jurnial Bisnis FISIPUniversitas Diponegoro.
Rosnani, 2010, Perancangan Produk, Graha Ilmu, Yogyakarta.
Schiffman, Leon, & Kanuk, Leslie Lazar. 2010, Consumer Behaviour 7 th.Edition. (Perilaku Konsumen), Jakarta.
Sudjana, 2000, Metode Statistik, Tarsito, Bandung.
Sutisna, 2011, Perilaku Konsumen dan Komunikasi Pemasaran, Remaja,Rosdakarya, Bandung.
Suwarni dan Septina Dwi Mayasari, 2010, Pengaruh Kualitas dan Hargaterhadap Loyalitas melalui Kepuasan Konsumen, Jurnal Ekonomidan Bisnis Universitas Negeri Semarang Malang.
Suyanto, 2007, Marketing Strategy Top Brand Indonesia, Andi, Yogyakarta.

71
Variabel Harga (X1)
Case Processing Summary
N %
Cases
Valid 25 100.0
Excludeda 0 .0
Total 25 100.0
a. Listwise deletion based on all variables in the
procedure.
Reliability Statistics
Cronbach's
Alpha
N of Items
.922 4
Item Statistics
Mean Std. Deviation N
x1_1 4.04 .935 25
x1_2 4.08 .862 25
x1_3 4.08 1.038 25
x1_4 4.20 1.041 25
Item-Total Statistics
Scale Mean if
Item Deleted
Scale Variance
if Item Deleted
Corrected Item-
Total
Correlation
Cronbach's
Alpha if Item
Deleted
x1_1 12.36 7.323 .801 .905
x1_2 12.32 7.810 .767 .917
x1_3 12.32 6.727 .826 .898
x1_4 12.20 6.417 .901 .870

72
Variabel Desain (X2)
Case Processing Summary
N %
Cases
Valid 25 100.0
Excludeda 0 .0
Total 25 100.0
a. Listwise deletion based on all variables in the
procedure.
Reliability Statistics
Cronbach's
Alpha
N of Items
.799 4
Item Statistics
Mean Std. Deviation N
x2_1 3.92 .812 25
x2_2 3.60 .645 25
x2_3 3.80 .707 25
x2_4 4.08 .812 25
Item-Total Statistics
Scale Mean if
Item Deleted
Scale Variance
if Item Deleted
Corrected Item-
Total
Correlation
Cronbach's
Alpha if Item
Deleted
x2_1 11.48 3.010 .679 .714
x2_2 11.80 3.750 .567 .772
x2_3 11.60 3.500 .598 .756
x2_4 11.32 3.143 .618 .748

73
Variabel Kepuasan (X3)
Case Processing Summary
N %
Cases
Valid 25 100.0
Excludeda 0 .0
Total 25 100.0
a. Listwise deletion based on all variables in the
procedure.
Reliability Statistics
Cronbach's
Alpha
N of Items
.930 4
Item Statistics
Mean Std. Deviation N
x3_1 3.88 1.013 25
x3_2 3.76 1.052 25
x3_3 3.56 1.121 25
X3_4 3.80 1.000 25
Item-Total Statistics
Scale Mean if
Item Deleted
Scale Variance
if Item Deleted
Corrected Item-
Total
Correlation
Cronbach's
Alpha if Item
Deleted
x3_1 11.12 8.693 .800 .920
x3_2 11.24 8.107 .883 .892
x3_3 11.44 7.757 .879 .894
X3_4 11.20 8.833 .785 .924

74
VARIABEL LOYALITAS KONSUMEN (Y)
Case Processing Summary
N %
Cases
Valid 25 100.0
Excludeda 0 .0
Total 25 100.0
a. Listwise deletion based on all variables in the
procedure.
Reliability Statistics
Cronbach's
Alpha
N of Items
.813 4
Item Statistics
Mean Std. Deviation N
y_1 4.08 .909 25
y_2 3.84 .898 25
y_3 3.84 .746 25
y_4 4.00 .764 25
Item-Total Statistics
Scale Mean if
Item Deleted
Scale Variance
if Item Deleted
Corrected Item-
Total
Correlation
Cronbach's
Alpha if Item
Deleted
y_1 11.68 3.810 .696 .734
y_2 11.92 4.077 .613 .776
y_3 11.92 4.660 .587 .786
y_4 11.76 4.440 .647 .760
75
Regression
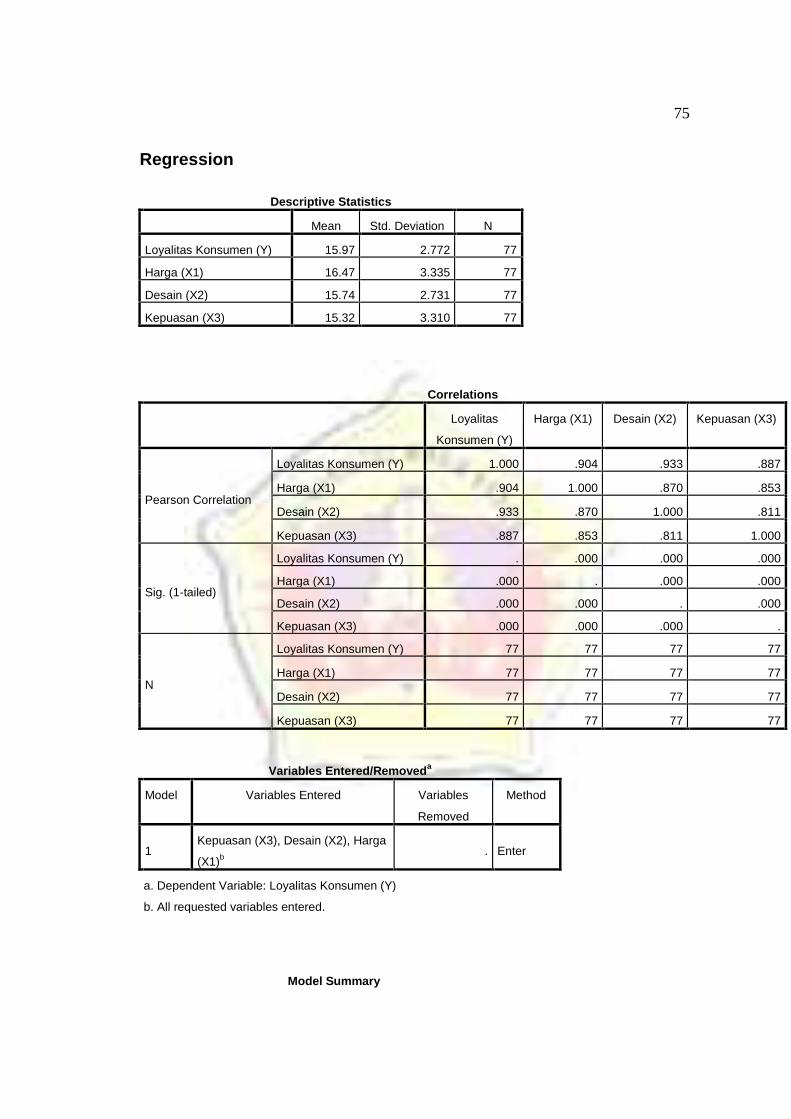
Descriptive Statistics
Mean Std. Deviation N
Loyalitas Konsumen (Y) 15.97 2.772 77
Harga (X1) 16.47 3.335 77
Desain (X2) 15.74 2.731 77
Kepuasan (X3) 15.32 3.310 77
Correlations
Loyalitas
Konsumen (Y)
Harga (X1) Desain (X2) Kepuasan (X3)
Pearson Correlation
Loyalitas Konsumen (Y) 1.000 .904 .933 .887
Harga (X1) .904 1.000 .870 .853
Desain (X2) .933 .870 1.000 .811
Kepuasan (X3) .887 .853 .811 1.000
Sig. (1-tailed)
Loyalitas Konsumen (Y) . .000 .000 .000
Harga (X1) .000 . .000 .000
Desain (X2) .000 .000 . .000
Kepuasan (X3) .000 .000 .000 .
N
Loyalitas Konsumen (Y) 77 77 77 77
Harga (X1) 77 77 77 77
Desain (X2) 77 77 77 77
Kepuasan (X3) 77 77 77 77
Variables Entered/Removeda
Model Variables Entered Variables
Removed
Method
1Kepuasan (X3), Desain (X2), Harga
(X1)b . Enter
a. Dependent Variable: Loyalitas Konsumen (Y)
b. All requested variables entered.
Model Summary

76
Model R R Square Adjusted R
Square
Std. Error of the
Estimate
1 .963a .927 .924 .766
a. Predictors: (Constant), Kepuasan (X3), Desain (X2), Harga (X1)
ANOVAa
Model Sum of Squares df Mean Square F Sig.
1
Regression 541.157 3 180.386 307.729 .000b
Residual 42.791 73 .586
Total 583.948 76
a. Dependent Variable: Loyalitas Konsumen (Y)
b. Predictors: (Constant), Kepuasan (X3), Desain (X2), Harga (X1)
Coefficientsa
Model Unstandardized Coefficients Standardized
Coefficients
t Sig.
B Std. Error Beta
1
(Constant) 1.158 .514 2.254 .027
Harga (X1) .168 .062 .202 2.704 .009
Desain (X2) .525 .068 .517 7.741 .000
Kepuasan (X3) .247 .053 .295 4.690 .000
a. Dependent Variable: Loyalitas Konsumen (Y)

77
FREKUENSI IDENTITAS RESPONDEN
Statistics
jenis kelamin Usia Pekerjaan
NValid 77 77 77
Missing 0 0 0
Frequency Table
jenis kelamin
Frequency Percent Valid Percent Cumulative
Percent
Valid
Laki-Laki 17 22.1 22.1 22.1
Perempuan 60 77.9 77.9 100.0
Total 77 100.0 100.0
Usia
Frequency Percent Valid Percent Cumulative
Percent
Valid
20-25 tahun 16 20.8 20.8 20.8
26-30 tahun 24 31.2 31.2 51.9
31-40 tahun 11 14.3 14.3 66.2
di atas 40 tahun 26 33.8 33.8 100.0
Total 77 100.0 100.0
Pekerjaan
Frequency Percent Valid Percent Cumulative
Percent
Valid
Lain-Lain 20 26.0 26.0 26.0
Karyawan Swasta 28 36.4 36.4 62.3
Wiraswasta/Pedagang 14 18.2 18.2 80.5
Pegawai Negeri 15 19.5 19.5 100.0
Total 77 100.0 100.0
78
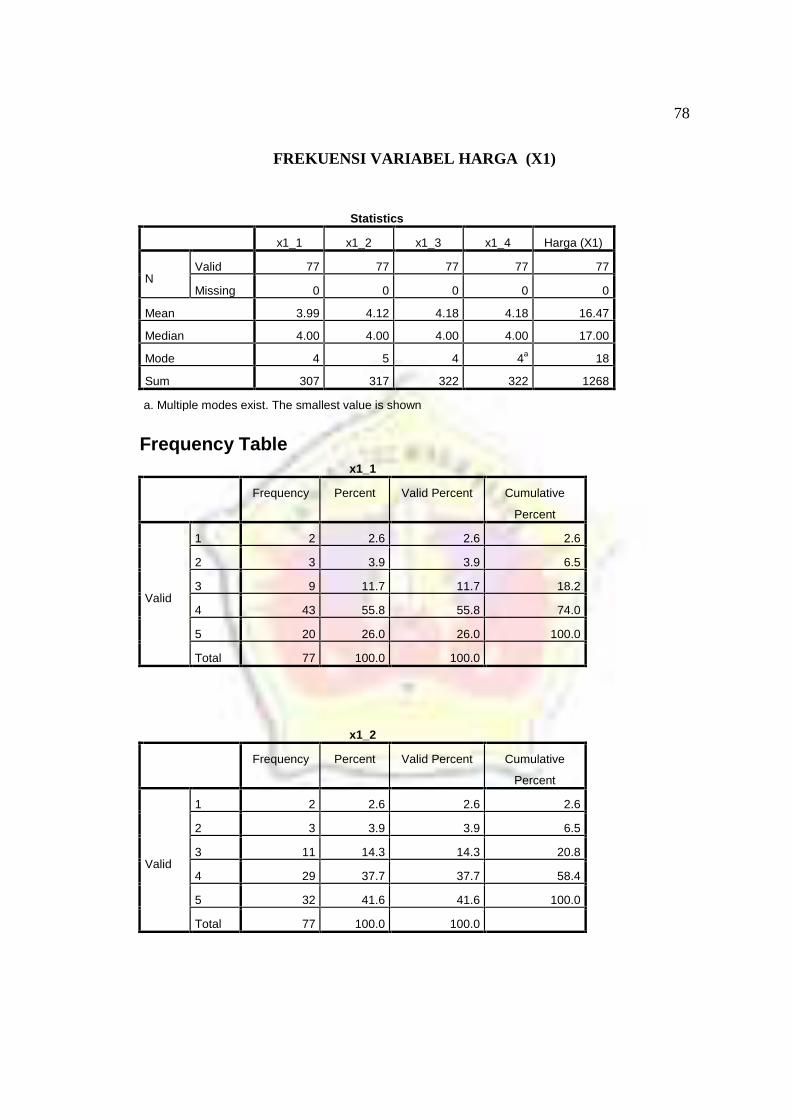
FREKUENSI VARIABEL HARGA (X1)
Statistics
x1_1 x1_2 x1_3 x1_4 Harga (X1)
NValid 77 77 77 77 77
Missing 0 0 0 0 0
Mean 3.99 4.12 4.18 4.18 16.47
Median 4.00 4.00 4.00 4.00 17.00
Mode 4 5 4 4a 18
Sum 307 317 322 322 1268
a. Multiple modes exist. The smallest value is shown
Frequency Tablex1_1
Frequency Percent Valid Percent Cumulative
Percent
Valid
1 2 2.6 2.6 2.6
2 3 3.9 3.9 6.5
3 9 11.7 11.7 18.2
4 43 55.8 55.8 74.0
5 20 26.0 26.0 100.0
Total 77 100.0 100.0
x1_2
Frequency Percent Valid Percent Cumulative
Percent
Valid
1 2 2.6 2.6 2.6
2 3 3.9 3.9 6.5
3 11 14.3 14.3 20.8
4 29 37.7 37.7 58.4
5 32 41.6 41.6 100.0
Total 77 100.0 100.0
79
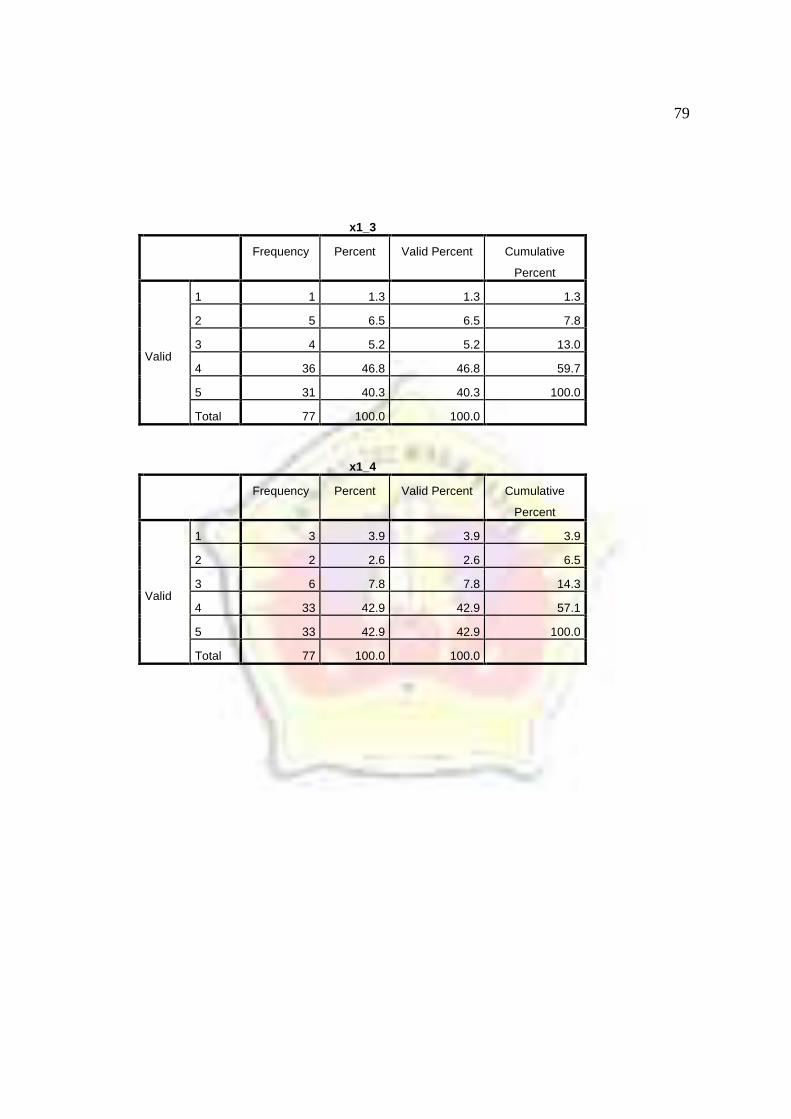
x1_3
Frequency Percent Valid Percent Cumulative
Percent
Valid
1 1 1.3 1.3 1.3
2 5 6.5 6.5 7.8
3 4 5.2 5.2 13.0
4 36 46.8 46.8 59.7
5 31 40.3 40.3 100.0
Total 77 100.0 100.0
x1_4
Frequency Percent Valid Percent Cumulative
Percent
Valid
1 3 3.9 3.9 3.9
2 2 2.6 2.6 6.5
3 6 7.8 7.8 14.3
4 33 42.9 42.9 57.1
5 33 42.9 42.9 100.0
Total 77 100.0 100.0

80
Harga (X1)
Frequency Percent Valid Percent Cumulative
Percent
Valid
5 2 2.6 2.6 2.6
6 1 1.3 1.3 3.9
8 1 1.3 1.3 5.2
10 2 2.6 2.6 7.8
11 1 1.3 1.3 9.1
13 1 1.3 1.3 10.4
14 4 5.2 5.2 15.6
15 10 13.0 13.0 28.6
16 7 9.1 9.1 37.7
17 12 15.6 15.6 53.2
18 15 19.5 19.5 72.7
19 12 15.6 15.6 88.3
20 9 11.7 11.7 100.0
Total 77 100.0 100.0

81
FREKUENSI VARIABEL DESAIN (X2)
Statistics
x2_1 x2_2 x2_3 x2_4 Desain (X2)
NValid 77 77 77 77 77
Missing 0 0 0 0 0
Mean 3.96 3.75 3.87 4.16 15.74
Median 4.00 4.00 4.00 4.00 16.00
Mode 4 4 4 4 16
Sum 305 289 298 320 1212
Frequency Table
x2_1
Frequency Percent Valid Percent Cumulative
Percent
Valid
1 2 2.6 2.6 2.6
2 3 3.9 3.9 6.5
3 3 3.9 3.9 10.4
4 57 74.0 74.0 84.4
5 12 15.6 15.6 100.0
Total 77 100.0 100.0
x2_2
Frequency Percent Valid Percent Cumulative
Percent
Valid
1 1 1.3 1.3 1.3
2 5 6.5 6.5 7.8
3 14 18.2 18.2 26.0
4 49 63.6 63.6 89.6
5 8 10.4 10.4 100.0
Total 77 100.0 100.0

82
x2_3
Frequency Percent Valid Percent Cumulative
Percent
Valid
1 2 2.6 2.6 2.6
2 2 2.6 2.6 5.2
3 7 9.1 9.1 14.3
4 59 76.6 76.6 90.9
5 7 9.1 9.1 100.0
Total 77 100.0 100.0
x2_4
Frequency Percent Valid Percent Cumulative
Percent
Valid
1 2 2.6 2.6 2.6
2 3 3.9 3.9 6.5
3 4 5.2 5.2 11.7
4 40 51.9 51.9 63.6
5 28 36.4 36.4 100.0
Total 77 100.0 100.0
Desain (X2)
Frequency Percent Valid Percent Cumulative
Percent
Valid
5 1 1.3 1.3 1.3
6 2 2.6 2.6 3.9
9 2 2.6 2.6 6.5
11 1 1.3 1.3 7.8
14 2 2.6 2.6 10.4
15 13 16.9 16.9 27.3
16 27 35.1 35.1 62.3
17 20 26.0 26.0 88.3
18 3 3.9 3.9 92.2
19 3 3.9 3.9 96.1
20 3 3.9 3.9 100.0
Total 77 100.0 100.0
83
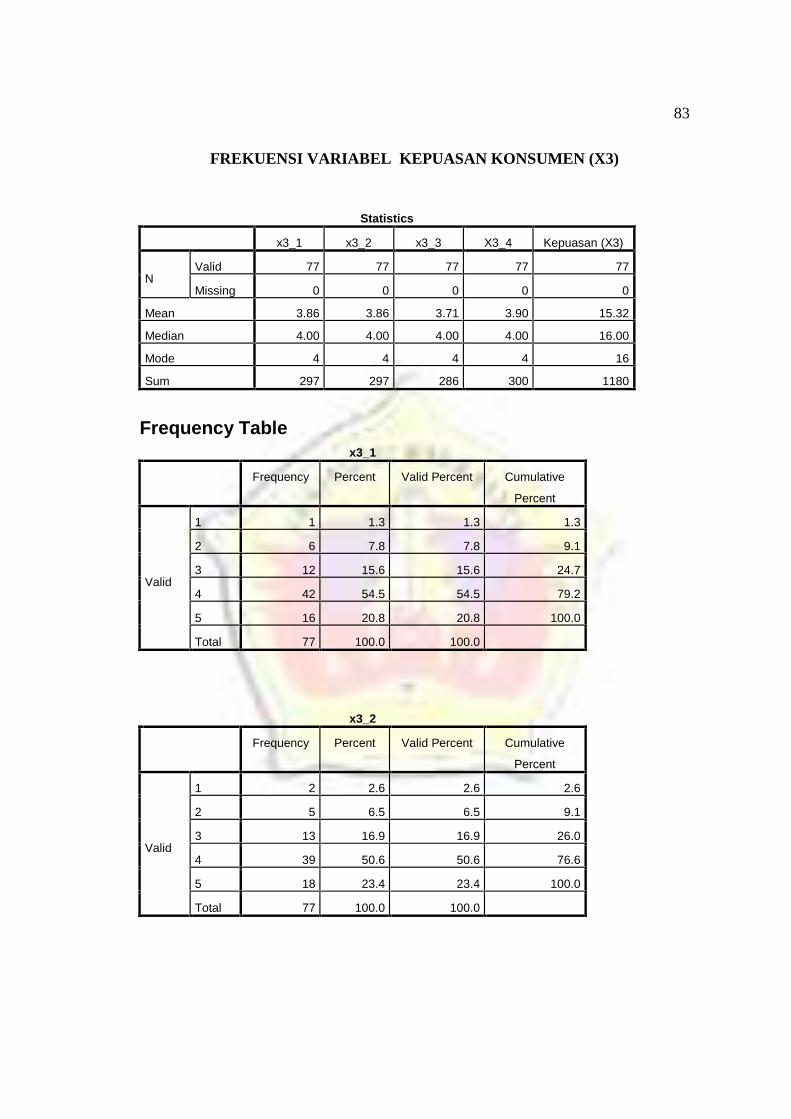
FREKUENSI VARIABEL KEPUASAN KONSUMEN (X3)
Statistics
x3_1 x3_2 x3_3 X3_4 Kepuasan (X3)
NValid 77 77 77 77 77
Missing 0 0 0 0 0
Mean 3.86 3.86 3.71 3.90 15.32
Median 4.00 4.00 4.00 4.00 16.00
Mode 4 4 4 4 16
Sum 297 297 286 300 1180
Frequency Tablex3_1
Frequency Percent Valid Percent Cumulative
Percent
Valid
1 1 1.3 1.3 1.3
2 6 7.8 7.8 9.1
3 12 15.6 15.6 24.7
4 42 54.5 54.5 79.2
5 16 20.8 20.8 100.0
Total 77 100.0 100.0
x3_2
Frequency Percent Valid Percent Cumulative
Percent
Valid
1 2 2.6 2.6 2.6
2 5 6.5 6.5 9.1
3 13 16.9 16.9 26.0
4 39 50.6 50.6 76.6
5 18 23.4 23.4 100.0
Total 77 100.0 100.0

84
x3_3
Frequency Percent Valid Percent Cumulative
Percent
Valid
1 4 5.2 5.2 5.2
2 2 2.6 2.6 7.8
3 22 28.6 28.6 36.4
4 33 42.9 42.9 79.2
5 16 20.8 20.8 100.0
Total 77 100.0 100.0
X3_4
Frequency Percent Valid Percent Cumulative
Percent
Valid
1 1 1.3 1.3 1.3
2 5 6.5 6.5 7.8
3 14 18.2 18.2 26.0
4 38 49.4 49.4 75.3
5 19 24.7 24.7 100.0
Total 77 100.0 100.0
85
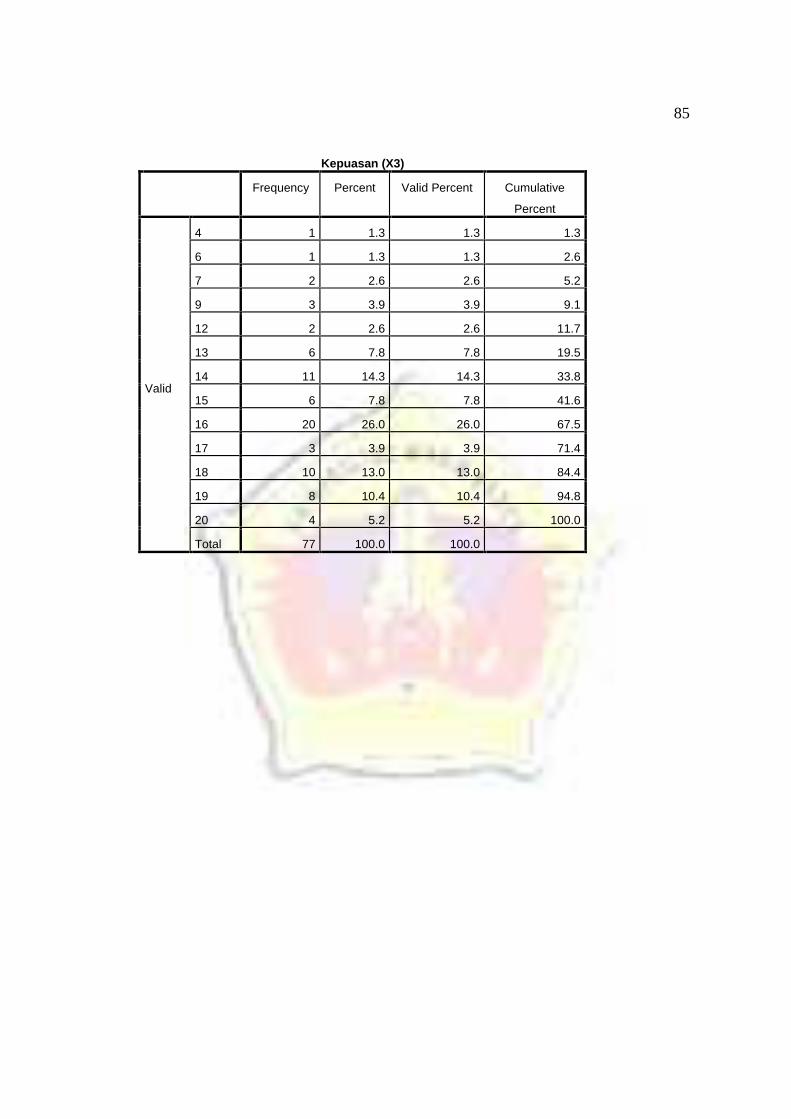
Kepuasan (X3)
Frequency Percent Valid Percent Cumulative
Percent
Valid
4 1 1.3 1.3 1.3
6 1 1.3 1.3 2.6
7 2 2.6 2.6 5.2
9 3 3.9 3.9 9.1
12 2 2.6 2.6 11.7
13 6 7.8 7.8 19.5
14 11 14.3 14.3 33.8
15 6 7.8 7.8 41.6
16 20 26.0 26.0 67.5
17 3 3.9 3.9 71.4
18 10 13.0 13.0 84.4
19 8 10.4 10.4 94.8
20 4 5.2 5.2 100.0
Total 77 100.0 100.0

86
FREKUENSI VARIABEL LOYALITAS KONSUMEN (Y)
Statistics
y_1 y_2 y_3 y_4 Loyalitas
Konsumen (Y)
NValid 77 77 77 77 77
Missing 0 0 0 0 0
Mean 4.01 3.88 3.92 4.16 15.97
Median 4.00 4.00 4.00 4.00 16.00
Mode 4 4 4 4 16
Sum 309 299 302 320 1230
Frequency Tabley_1
Frequency Percent Valid Percent Cumulative
Percent
Valid
1 2 2.6 2.6 2.6
2 2 2.6 2.6 5.2
3 5 6.5 6.5 11.7
4 52 67.5 67.5 79.2
5 16 20.8 20.8 100.0
Total 77 100.0 100.0
y_2
Frequency Percent Valid Percent Cumulative
Percent
Valid
1 1 1.3 1.3 1.3
2 4 5.2 5.2 6.5
3 14 18.2 18.2 24.7
4 42 54.5 54.5 79.2
5 16 20.8 20.8 100.0
Total 77 100.0 100.0

87
y_3
Frequency Percent Valid Percent Cumulative
Percent
Valid
1 2 2.6 2.6 2.6
2 3 3.9 3.9 6.5
3 6 7.8 7.8 14.3
4 54 70.1 70.1 84.4
5 12 15.6 15.6 100.0
Total 77 100.0 100.0
y_4
Frequency Percent Valid Percent Cumulative
Percent
Valid
1 1 1.3 1.3 1.3
2 3 3.9 3.9 5.2
3 6 7.8 7.8 13.0
4 40 51.9 51.9 64.9
5 27 35.1 35.1 100.0
Total 77 100.0 100.0

88
Loyalitas Konsumen (Y)
Frequency Percent Valid Percent Cumulative
Percent
Valid
4 1 1.3 1.3 1.3
6 1 1.3 1.3 2.6
9 2 2.6 2.6 5.2
10 1 1.3 1.3 6.5
11 1 1.3 1.3 7.8
14 4 5.2 5.2 13.0
15 12 15.6 15.6 28.6
16 20 26.0 26.0 54.5
17 16 20.8 20.8 75.3
18 11 14.3 14.3 89.6
19 5 6.5 6.5 96.1
20 3 3.9 3.9 100.0
Total 77 100.0 100.0
89
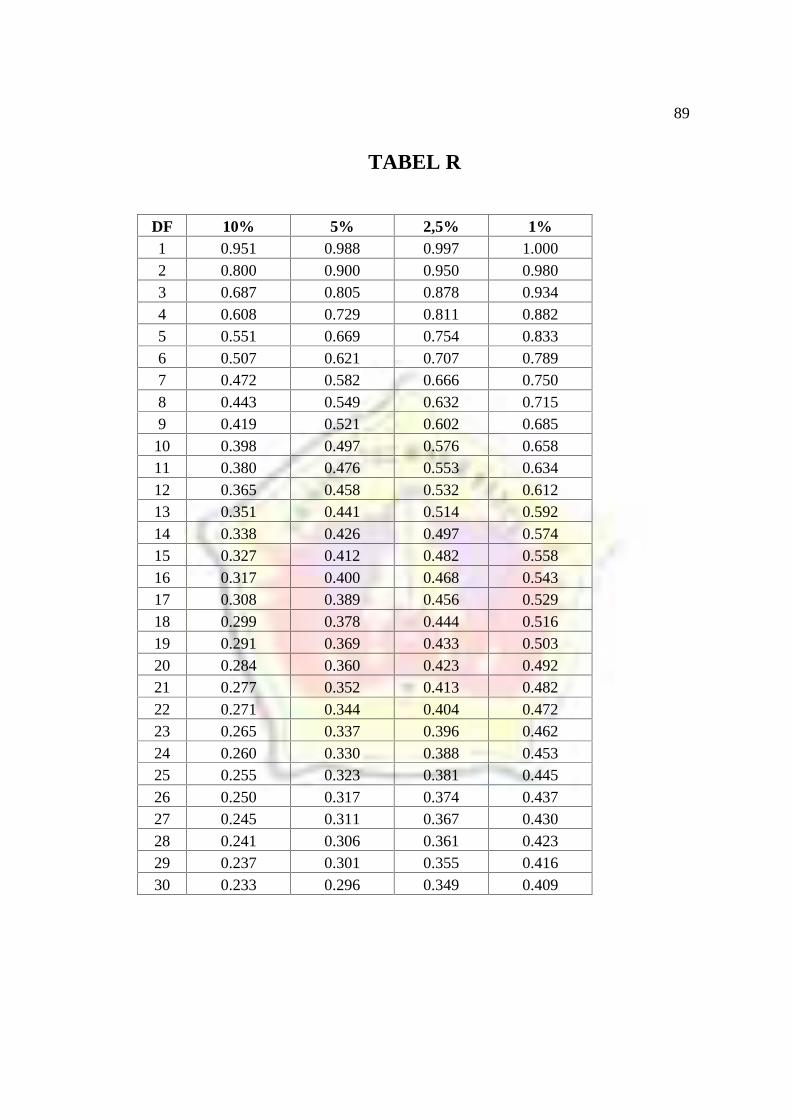
TABEL R
DF 10% 5% 2,5% 1%1 0.951 0.988 0.997 1.0002 0.800 0.900 0.950 0.9803 0.687 0.805 0.878 0.9344 0.608 0.729 0.811 0.8825 0.551 0.669 0.754 0.8336 0.507 0.621 0.707 0.7897 0.472 0.582 0.666 0.7508 0.443 0.549 0.632 0.7159 0.419 0.521 0.602 0.68510 0.398 0.497 0.576 0.65811 0.380 0.476 0.553 0.63412 0.365 0.458 0.532 0.61213 0.351 0.441 0.514 0.59214 0.338 0.426 0.497 0.57415 0.327 0.412 0.482 0.55816 0.317 0.400 0.468 0.54317 0.308 0.389 0.456 0.52918 0.299 0.378 0.444 0.51619 0.291 0.369 0.433 0.50320 0.284 0.360 0.423 0.49221 0.277 0.352 0.413 0.48222 0.271 0.344 0.404 0.47223 0.265 0.337 0.396 0.46224 0.260 0.330 0.388 0.45325 0.255 0.323 0.381 0.44526 0.250 0.317 0.374 0.43727 0.245 0.311 0.367 0.43028 0.241 0.306 0.361 0.42329 0.237 0.301 0.355 0.41630 0.233 0.296 0.349 0.409

90
Cuplikan Tabel t
0
No 10% 5% 2,5%70 1.294 1.667 1.99471 1.294 1.667 1.99472 1.293 1.666 1.99373 1.293 1.666 1.99374 1.293 1.666 1.99375 1.293 1.665 1.99276 1.293 1.665 1.99277 1.293 1.665 1.99178 1.292 1.665 1.99179 1.292 1.664 1.99080 1.292 1.664 1.99081 1.292 1.664 1.99082 1.292 1.664 1.98983 1.292 1.663 1.98984 1.292 1.663 1.98985 1.292 1.663 1.98886 1.291 1.663 1.98887 1.291 1.663 1.98888 1.291 1.662 1.98789 1.291 1.662 1.98790 1.291 1.662 1.98791 1.291 1.662 1.98692 1.291 1.662 1.98693 1.291 1.661 1.98694 1.291 1.661 1.98695 1.291 1.661 1.98596 1.290 1.661 1.98597 1.290 1.661 1.98598 1.290 1.661 1.98499 1.290 1.660 1.984
100 1.290 1.660 1.984

91
Tabel F untuk = 0.05
0
df 1 2 3 4 5 6 7 871 3.976 3.126 2.734 2.501 2.344 2.229 2.142 2.07272 3.974 3.124 2.732 2.499 2.342 2.227 2.140 2.07073 3.972 3.122 2.730 2.497 2.340 2.226 2.138 2.06874 3.970 3.120 2.728 2.495 2.338 2.224 2.136 2.06675 3.968 3.119 2.727 2.494 2.337 2.222 2.134 2.06476 3.967 3.117 2.725 2.492 2.335 2.220 2.133 2.06377 3.965 3.115 2.723 2.490 2.333 2.219 2.131 2.06178 3.963 3.114 2.722 2.489 2.332 2.217 2.129 2.05979 3.962 3.112 2.720 2.487 2.330 2.216 2.128 2.05880 3.960 3.111 2.719 2.486 2.329 2.214 2.126 2.05681 3.959 3.109 2.717 2.484 2.327 2.213 2.125 2.05582 3.957 3.108 2.716 2.483 2.326 2.211 2.123 2.05383 3.956 3.107 2.715 2.482 2.324 2.210 2.122 2.05284 3.955 3.105 2.713 2.480 2.323 2.209 2.121 2.05185 3.953 3.104 2.712 2.479 2.322 2.207 2.119 2.04986 3.952 3.103 2.711 2.478 2.321 2.206 2.118 2.04887 3.951 3.101 2.709 2.476 2.319 2.205 2.117 2.04788 3.949 3.100 2.708 2.475 2.318 2.203 2.115 2.04589 3.948 3.099 2.707 2.474 2.317 2.202 2.114 2.04490 3.947 3.098 2.706 2.473 2.316 2.201 2.113 2.04391 3.946 3.097 2.705 2.472 2.315 2.200 2.112 2.04292 3.945 3.095 2.704 2.471 2.313 2.199 2.111 2.04193 3.943 3.094 2.703 2.470 2.312 2.198 2.110 2.04094 3.942 3.093 2.701 2.469 2.311 2.197 2.109 2.03895 3.941 3.092 2.700 2.467 2.310 2.196 2.108 2.03796 3.940 3.091 2.699 2.466 2.309 2.195 2.106 2.03697 3.939 3.090 2.698 2.465 2.308 2.194 2.105 2.03598 3.938 3.089 2.697 2.465 2.307 2.193 2.104 2.03499 3.937 3.088 2.696 2.464 2.306 2.192 2.103 2.033100 3.936 3.087 2.696 2.463 2.305 2.191 2.103 2.032
Top Related
Copyright © 2022 FDOKUMEN

