Zero-latency data warehousing (ZLDWH): the state-of-the-art and experimental implementation...
10
Abstract— Increased data volumes and accelerating update speeds are fundamentally changing the role of the data warehouse in modern businesses. More data, coming in faster, and requiring immediate conversion into decisions means that organizations are confronting the need for a Zero-Latency Data Warehousing. The Zero-Latency Data Warehouse (ZLDWH) is an extended stage in the data warehouse development, which will enable a complete business intelligence process to observe, understand, predict, react to, reorganize, monitor, automate and control feedback loops in the minimal latency. This paper reviews the start-of-the-art of the Zero-Latency Data Warehouse and investigates two experimental approaches towards its implementations. (1) The Grid-based Zero-Latency Data Stream Warehouse (GZLDSWH) with the aim to tackle the resource limitation issues in data stream processing without using approximation approaches. (2) Sense & Response Service Architecture (SARESA) towards a complete Business Intelligence process to sense, interpret, predict, automate and respond to business processes. Index Terms—Zero-Latency Data Warehouse, Event-based Business Intelligence, Service Oriented Architecture, Grid Computing. I. INTRODUCTION HE widespread use of the Internet and related technologies in various business domains has accelerated the intensity of competition, increased the volume of data/information available, and shortened decision-making cycles considerably. Consequently, strategic managers are being exposed daily to huge inflows of data and information from the businesses they manage and they are under pressure to make sound decisions promptly [3]. Data Warehouse (DWH) is a Business Intelligence (BI) application with the capable of historical, multi-dimensional data analysis to support decision-making. As the pace of business accelerates, the amount of real-time electronic Tho Manh Nguyen is postdoctoral researcher at the Institute of Software Technology and Interactive System, Vienna University of Technology, Favoriten Strasse 9-11/188, A1040 Vienna, Austria, phone: +43-1-58801 18862; fax: +43-1-58801 18899; email: [email protected] A Min Tjoa is full professor, head of the Institute of Software Technology and Interactive System, Vienna University of Technology, Favoriten Strasse 9-11/188, A1040 Vienna, Austria, phone: +43-1-58801 18801; fax: +43-1- 58801 18899; email: [email protected] information that must be analyzed i.e. real-world event streams flowing into today’s business systems, is exploding and the required response to these real-world events often comes down to milliseconds [5]. Up-to-date information thus should be made available to decision makers with as little delay as possible. It is required that the DWH must have the ability to support analysis at the speed of the business, so that the end-users always have the information available in the DWH when they need it. For a long time it was assumed that data in the DWH can lag at least a day (if not a week or a month) behind the actual operational data. The warehouse data is refreshed via batch data loading during frequent update windows (e.g. every night) without affecting the analysis capabilities of DWHs. While this still holds true for a wide range of DWH applications, today’s DWHs are broadening their roles to include more and more business critical tasks, supporting not only strategic decisions but also the operational business process. We see a fundamental shift in the operations of businesses when they combine strategic data with operational data. For example, a large credit card company uses data from its own databases (account balance, customer name, billing zip code) to process a transaction. In addition, it may augment that data with tertiary sources such as credit scoring models, FICO scores and even neural networks to determine not only whether the transaction should be authorized, but also patterns of historical data and account profiling methods to evaluate risk potential on a single transaction [4]. In such a system, the data warehouse must gather the data from all source systems in a timely manner, and make the data immediately available to the analysis processes, to support all sorts of analysis required. Particularly, some applications require even the automatic reaction to critical situations such as Fraud detection, business activity management (BAM) etc. This paper introduces the concepts of Zero-latency Data warehouse (ZLDWH) and investigates two experimental approaches towards its implementation. The first approach, Grid-based Zero-Latency Data Stream Warehouse (GZLDSWH) is a proposed framework of building a Grid- service based Data Stream Warehouse to tackle the resource limitation issues in data stream processing without using approximation methods. The second approach, Sense & Response Service Architecture (SARESA) enables the real-time Zero-Latency Data Warehousing (ZLDWH): the State-of-the-art and experimental implementation approaches Tho Manh Nguyen, and A Min Tjoa T
-
Upload
independent -
Category
Documents
-
view
3 -
download
0
Transcript of Zero-latency data warehousing (ZLDWH): the state-of-the-art and experimental implementation...
Abstract— Increased data volumes and accelerating update
speeds are fundamentally changing the role of the data warehouse in modern businesses. More data, coming in faster, and requiring immediate conversion into decisions means that organizations are confronting the need for a Zero-Latency Data Warehousing.
The Zero-Latency Data Warehouse (ZLDWH) is an extended stage in the data warehouse development, which will enable a complete business intelligence process to observe, understand, predict, react to, reorganize, monitor, automate and control feedback loops in the minimal latency. This paper reviews the start-of-the-art of the Zero-Latency Data Warehouse and investigates two experimental approaches towards its implementations. (1) The Grid-based Zero-Latency Data Stream Warehouse (GZLDSWH) with the aim to tackle the resource limitation issues in data stream processing without using approximation approaches. (2) Sense & Response Service Architecture (SARESA) towards a complete Business Intelligence process to sense, interpret, predict, automate and respond to business processes.
Index Terms—Zero-Latency Data Warehouse, Event-based Business Intelligence, Service Oriented Architecture, Grid Computing.
I. INTRODUCTION HE widespread use of the Internet and related technologies in various business domains has accelerated the intensity
of competition, increased the volume of data/information available, and shortened decision-making cycles considerably. Consequently, strategic managers are being exposed daily to huge inflows of data and information from the businesses they manage and they are under pressure to make sound decisions promptly [3].
Data Warehouse (DWH) is a Business Intelligence (BI) application with the capable of historical, multi-dimensional data analysis to support decision-making. As the pace of business accelerates, the amount of real-time electronic
Tho Manh Nguyen is postdoctoral researcher at the Institute of Software
Technology and Interactive System, Vienna University of Technology, Favoriten Strasse 9-11/188, A1040 Vienna, Austria, phone: +43-1-58801 18862; fax: +43-1-58801 18899; email: [email protected]
A Min Tjoa is full professor, head of the Institute of Software Technology and Interactive System, Vienna University of Technology, Favoriten Strasse 9-11/188, A1040 Vienna, Austria, phone: +43-1-58801 18801; fax: +43-1-58801 18899; email: [email protected]
information that must be analyzed i.e. real-world event streams flowing into today’s business systems, is exploding and the required response to these real-world events often comes down to milliseconds [5]. Up-to-date information thus should be made available to decision makers with as little delay as possible. It is required that the DWH must have the ability to support analysis at the speed of the business, so that the end-users always have the information available in the DWH when they need it.
For a long time it was assumed that data in the DWH can lag at least a day (if not a week or a month) behind the actual operational data. The warehouse data is refreshed via batch data loading during frequent update windows (e.g. every night) without affecting the analysis capabilities of DWHs. While this still holds true for a wide range of DWH applications, today’s DWHs are broadening their roles to include more and more business critical tasks, supporting not only strategic decisions but also the operational business process. We see a fundamental shift in the operations of businesses when they combine strategic data with operational data. For example, a large credit card company uses data from its own databases (account balance, customer name, billing zip code) to process a transaction. In addition, it may augment that data with tertiary sources such as credit scoring models, FICO scores and even neural networks to determine not only whether the transaction should be authorized, but also patterns of historical data and account profiling methods to evaluate risk potential on a single transaction [4]. In such a system, the data warehouse must gather the data from all source systems in a timely manner, and make the data immediately available to the analysis processes, to support all sorts of analysis required. Particularly, some applications require even the automatic reaction to critical situations such as Fraud detection, business activity management (BAM) etc.
This paper introduces the concepts of Zero-latency Data warehouse (ZLDWH) and investigates two experimental approaches towards its implementation. The first approach, Grid-based Zero-Latency Data Stream Warehouse (GZLDSWH) is a proposed framework of building a Grid-service based Data Stream Warehouse to tackle the resource limitation issues in data stream processing without using approximation methods. The second approach, Sense & Response Service Architecture (SARESA) enables the real-time
Zero-Latency Data Warehousing (ZLDWH): the State-of-the-art and experimental
implementation approaches Tho Manh Nguyen, and A Min Tjoa
T
analytics across corporate processes, notifies with actionable recommendations or automatically triggers, effectively closing the gap between Business Intelligence systems and business processes. We will illustrate the concepts with the mobile phone fraud detection application prototype.
The remainder of this paper is organized as follows: Section II introduces the state-of-the-art of the ZLDWH. Other terms and related research activities are highlighted in Section III. Section IV enumerates the ZLDWH criteria. The GZLDSWH framework and its challenged issues are presented in Section V. Section VI describes the SARESA architecture and its use in mobile phone fraud detection scenario. Section VII draws a sketch comparison between the two approaches. Finally, Section VIII concludes the paper and proposes the intended future work.
II. ZERO-LATENCY DATA WAREHOUSING: THE STATE-OF-THE-ART
A. Traditional Data Warehouse Data Warehousing arose out of the need of many businesses
to view and analyze data from many different operational systems in order to get a complete understanding of the business. William Inmon, widely accepted as the mental-father of Data Warehousing, defined “Data Warehouse is a subject oriented, integrated, non-volatile and time-variant collection of data in support of management’s decisions” [1]. Ted Codd coins the term OLAP (On-Line Analytical Processing) and defined the famous 12 OLAP rules [2]. Based on their definitions, a data warehouse is actually a comprehensive system that includes all the processes, tools and technologies necessary for extracting data from many operational, legacy, possibly heterogeneous data sources and managing them in a separate storage (warehouse) to provide end-user decision-support access.
With the aim of speeding up analytical queries and not negatively effecting of the operational system’s performance, the Data Warehouse is implemented separately and redundantly to the operational data sources. Batch and transaction processing data first has to be extracted from operational data sources and then cleaned up to remove redundant data, fill in blank and missing fields and organized into consistent formats. The data is then loaded into a Warehouse. Business analysts can then dig into the Warehouse data using data access and reporting software including OLAP tools, statistical modeling tools, geographic information systems (GIS) and data mining tools. Building a data warehouse thus includes a set of multiple related processes, and is not just simply deployed software.
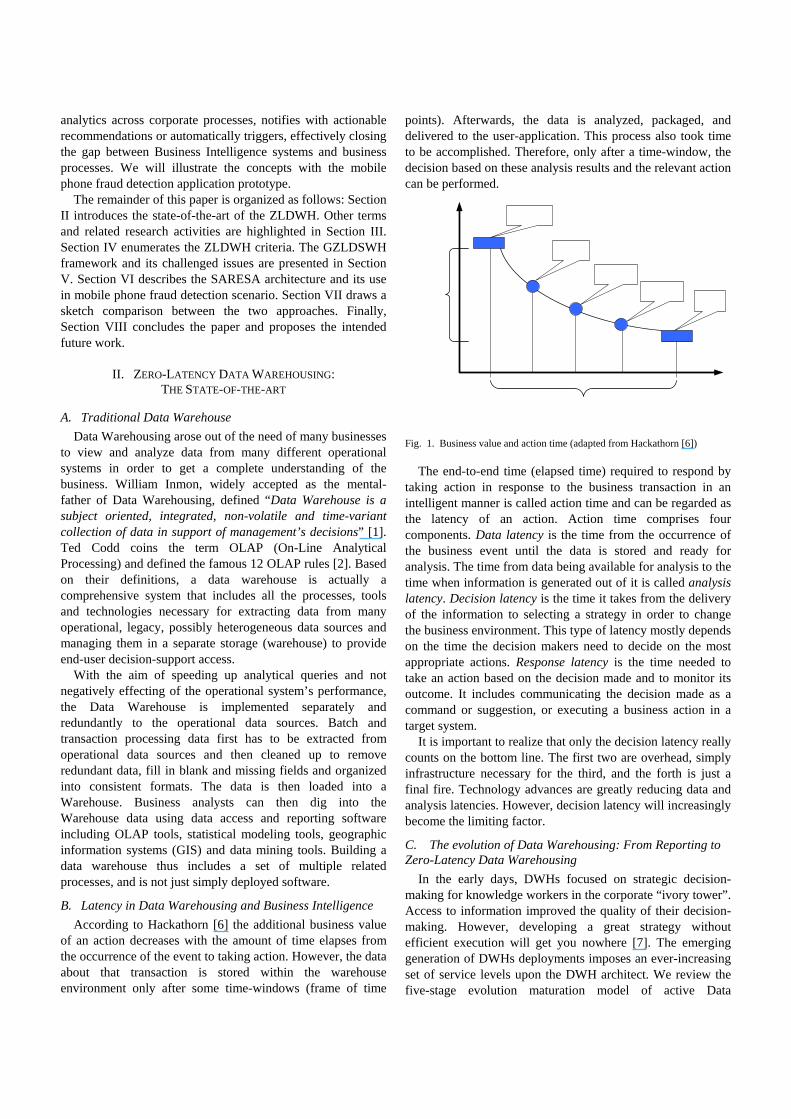
B. Latency in Data Warehousing and Business Intelligence According to Hackathorn [6] the additional business value
of an action decreases with the amount of time elapses from the occurrence of the event to taking action. However, the data about that transaction is stored within the warehouse environment only after some time-windows (frame of time
points). Afterwards, the data is analyzed, packaged, and delivered to the user-application. This process also took time to be accomplished. Therefore, only after a time-window, the decision based on these analysis results and the relevant action can be performed.
The end-to-end time (elapsed time) required to respond by
taking action in response to the business transaction in an intelligent manner is called action time and can be regarded as the latency of an action. Action time comprises four components. Data latency is the time from the occurrence of the business event until the data is stored and ready for analysis. The time from data being available for analysis to the time when information is generated out of it is called analysis latency. Decision latency is the time it takes from the delivery of the information to selecting a strategy in order to change the business environment. This type of latency mostly depends on the time the decision makers need to decide on the most appropriate actions. Response latency is the time needed to take an action based on the decision made and to monitor its outcome. It includes communicating the decision made as a command or suggestion, or executing a business action in a target system.
It is important to realize that only the decision latency really counts on the bottom line. The first two are overhead, simply infrastructure necessary for the third, and the forth is just a final fire. Technology advances are greatly reducing data and analysis latencies. However, decision latency will increasingly become the limiting factor.
C. The evolution of Data Warehousing: From Reporting to Zero-Latency Data Warehousing
In the early days, DWHs focused on strategic decision-making for knowledge workers in the corporate “ivory tower”. Access to information improved the quality of their decision-making. However, developing a great strategy without efficient execution will get you nowhere [7]. The emerging generation of DWHs deployments imposes an ever-increasing set of service levels upon the DWH architect. We review the five-stage evolution maturation model of active Data
Fig. 1. Business value and action time (adapted from Hackathorn [6])
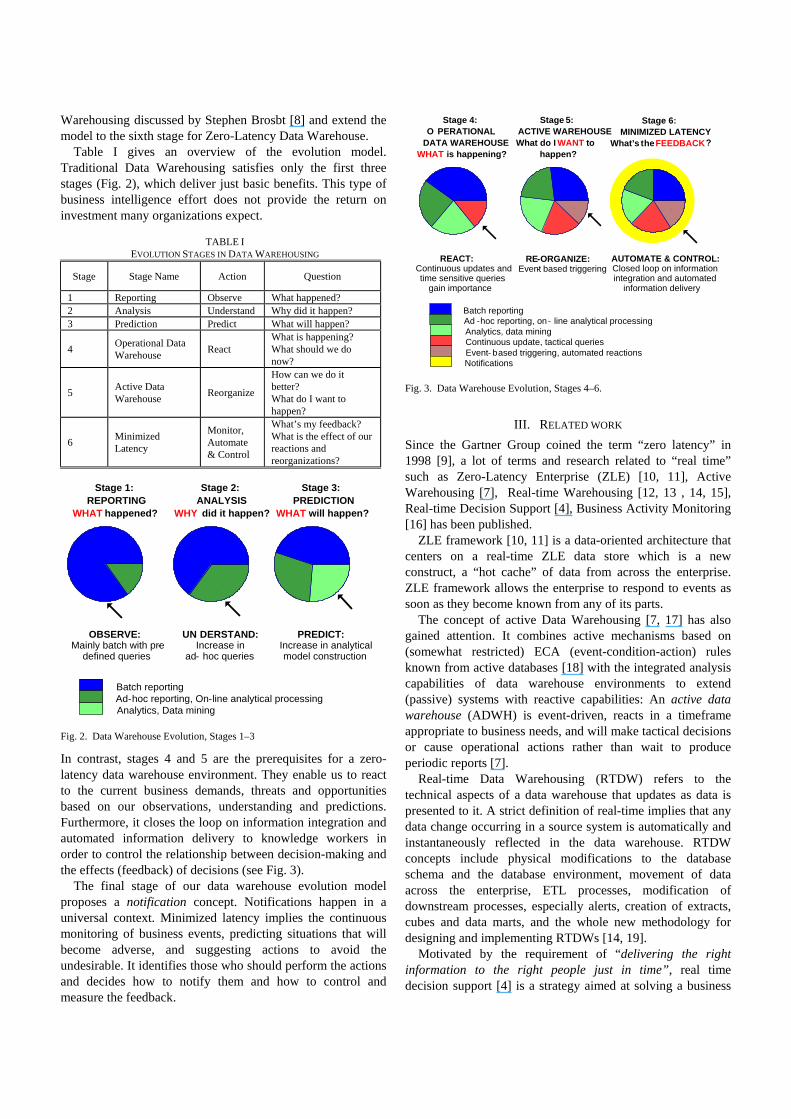
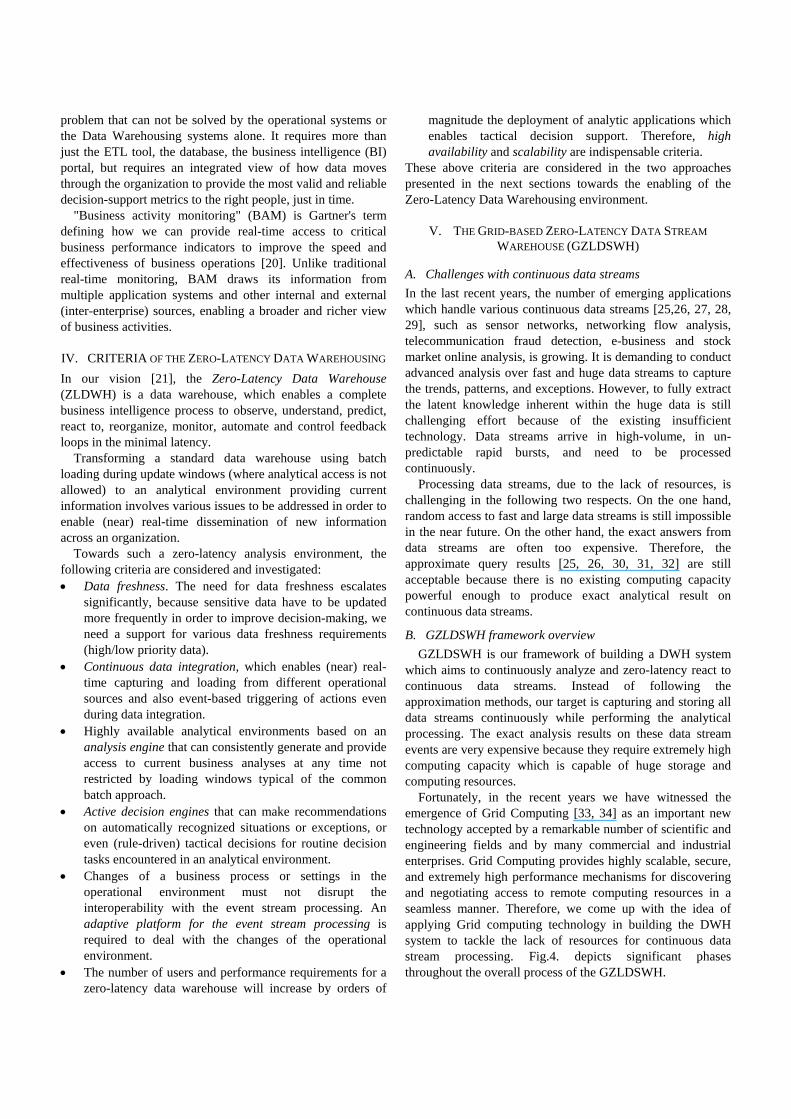
Warehousing discussed by Stephen Brosbt [8] and extend the model to the sixth stage for Zero-Latency Data Warehouse.
Table I gives an overview of the evolution model. Traditional Data Warehousing satisfies only the first three stages (Fig. 2), which deliver just basic benefits. This type of business intelligence effort does not provide the return on investment many organizations expect.
In contrast, stages 4 and 5 are the prerequisites for a zero-latency data warehouse environment. They enable us to react to the current business demands, threats and opportunities based on our observations, understanding and predictions. Furthermore, it closes the loop on information integration and automated information delivery to knowledge workers in order to control the relationship between decision-making and the effects (feedback) of decisions (see Fig. 3).
The final stage of our data warehouse evolution model proposes a notification concept. Notifications happen in a universal context. Minimized latency implies the continuous monitoring of business events, predicting situations that will become adverse, and suggesting actions to avoid the undesirable. It identifies those who should perform the actions and decides how to notify them and how to control and measure the feedback.
III. RELATED WORK Since the Gartner Group coined the term “zero latency” in 1998 [9], a lot of terms and research related to “real time” such as Zero-Latency Enterprise (ZLE) [10, 11], Active Warehousing [7], Real-time Warehousing [12, 13 , 14, 15], Real-time Decision Support [4], Business Activity Monitoring [16] has been published.
ZLE framework [10, 11] is a data-oriented architecture that centers on a real-time ZLE data store which is a new construct, a “hot cache” of data from across the enterprise. ZLE framework allows the enterprise to respond to events as soon as they become known from any of its parts.
The concept of active Data Warehousing [7, 17] has also gained attention. It combines active mechanisms based on (somewhat restricted) ECA (event-condition-action) rules known from active databases [18] with the integrated analysis capabilities of data warehouse environments to extend (passive) systems with reactive capabilities: An active data warehouse (ADWH) is event-driven, reacts in a timeframe appropriate to business needs, and will make tactical decisions or cause operational actions rather than wait to produce periodic reports [7].
Real-time Data Warehousing (RTDW) refers to the technical aspects of a data warehouse that updates as data is presented to it. A strict definition of real-time implies that any data change occurring in a source system is automatically and instantaneously reflected in the data warehouse. RTDW concepts include physical modifications to the database schema and the database environment, movement of data across the enterprise, ETL processes, modification of downstream processes, especially alerts, creation of extracts, cubes and data marts, and the whole new methodology for designing and implementing RTDWs [14, 19].
Motivated by the requirement of “delivering the right information to the right people just in time”, real time decision support [4] is a strategy aimed at solving a business
90 % 14 %
22 %
24 %
40 %
19 % 21 %
21 % 27 %
12 %
Stage 4: O PERATIONAL
DATA WAREHOUSE WHAT is happening?
REACT: Continuous updates and time sensitive queries
gain importance
Batch reporting Ad -hoc reporting, on- line analytical processing Analytics, data mining
RE-ORGANIZE: Event- based triggering
Stage 5: ACTIVE WAREHOUSE What do I WANT to
happen?
Stage 6: MINIMIZED LATENCY
What’s the FEEDBACK ?
AUTOMATE & CONTROL: Closed loop on information integration and automated
information delivery
Continuous update, tactical queries Event- based triggering, automated reactions Notifications
21 %
19 %
19 % 25 %
16 %
Fig. 3. Data Warehouse Evolution, Stages 4–6.
TABLE I
EVOLUTION STAGES IN DATA WAREHOUSING
Stage Stage Name Action Question
1 Reporting Observe What happened? 2 Analysis Understand Why did it happen? 3 Prediction Predict What will happen?
4 Operational Data Warehouse React
What is happening? What should we do now?
5 Active Data Warehouse Reorganize
How can we do it better? What do I want to happen?
6 Minimized Latency
Monitor, Automate & Control
What’s my feedback? What is the effect of our reactions and reorganizations?
15 %
85 %
35 %
65 %
26 % 29 %
45 %
Stage 1: REPORTING
WHAT happened?
OBSERVE: Mainly batch with pre-
defined queries
Batch reporting Ad-hoc reporting, On-line analytical processing Analytics, Data mining
UN DERSTAND: Increase in
ad- hoc queries
Stage 2: ANALYSIS
WHY did it happen?
Stage 3: PREDICTION
WHAT will happen?
PREDICT: Increase in analytical model construction
Fig. 2. Data Warehouse Evolution, Stages 1–3
problem that can not be solved by the operational systems or the Data Warehousing systems alone. It requires more than just the ETL tool, the database, the business intelligence (BI) portal, but requires an integrated view of how data moves through the organization to provide the most valid and reliable decision-support metrics to the right people, just in time.
"Business activity monitoring" (BAM) is Gartner's term defining how we can provide real-time access to critical business performance indicators to improve the speed and effectiveness of business operations [20]. Unlike traditional real-time monitoring, BAM draws its information from multiple application systems and other internal and external (inter-enterprise) sources, enabling a broader and richer view of business activities.
IV. CRITERIA OF THE ZERO-LATENCY DATA WAREHOUSING In our vision [21], the Zero-Latency Data Warehouse (ZLDWH) is a data warehouse, which enables a complete business intelligence process to observe, understand, predict, react to, reorganize, monitor, automate and control feedback loops in the minimal latency.
Transforming a standard data warehouse using batch loading during update windows (where analytical access is not allowed) to an analytical environment providing current information involves various issues to be addressed in order to enable (near) real-time dissemination of new information across an organization.
Towards such a zero-latency analysis environment, the following criteria are considered and investigated: • Data freshness. The need for data freshness escalates
significantly, because sensitive data have to be updated more frequently in order to improve decision-making, we need a support for various data freshness requirements (high/low priority data).
• Continuous data integration, which enables (near) real-time capturing and loading from different operational sources and also event-based triggering of actions even during data integration.
• Highly available analytical environments based on an analysis engine that can consistently generate and provide access to current business analyses at any time not restricted by loading windows typical of the common batch approach.
• Active decision engines that can make recommendations on automatically recognized situations or exceptions, or even (rule-driven) tactical decisions for routine decision tasks encountered in an analytical environment.
• Changes of a business process or settings in the operational environment must not disrupt the interoperability with the event stream processing. An adaptive platform for the event stream processing is required to deal with the changes of the operational environment.
• The number of users and performance requirements for a zero-latency data warehouse will increase by orders of
magnitude the deployment of analytic applications which enables tactical decision support. Therefore, high availability and scalability are indispensable criteria.
These above criteria are considered in the two approaches presented in the next sections towards the enabling of the Zero-Latency Data Warehousing environment.
V. THE GRID-BASED ZERO-LATENCY DATA STREAM WAREHOUSE (GZLDSWH)
A. Challenges with continuous data streams In the last recent years, the number of emerging applications which handle various continuous data streams [25,26, 27, 28, 29], such as sensor networks, networking flow analysis, telecommunication fraud detection, e-business and stock market online analysis, is growing. It is demanding to conduct advanced analysis over fast and huge data streams to capture the trends, patterns, and exceptions. However, to fully extract the latent knowledge inherent within the huge data is still challenging effort because of the existing insufficient technology. Data streams arrive in high-volume, in un-predictable rapid bursts, and need to be processed continuously.
Processing data streams, due to the lack of resources, is challenging in the following two respects. On the one hand, random access to fast and large data streams is still impossible in the near future. On the other hand, the exact answers from data streams are often too expensive. Therefore, the approximate query results [25, 26, 30, 31, 32] are still acceptable because there is no existing computing capacity powerful enough to produce exact analytical result on continuous data streams.
B. GZLDSWH framework overview GZLDSWH is our framework of building a DWH system
which aims to continuously analyze and zero-latency react to continuous data streams. Instead of following the approximation methods, our target is capturing and storing all data streams continuously while performing the analytical processing. The exact analysis results on these data stream events are very expensive because they require extremely high computing capacity which is capable of huge storage and computing resources.
Fortunately, in the recent years we have witnessed the emergence of Grid Computing [33, 34] as an important new technology accepted by a remarkable number of scientific and engineering fields and by many commercial and industrial enterprises. Grid Computing provides highly scalable, secure, and extremely high performance mechanisms for discovering and negotiating access to remote computing resources in a seamless manner. Therefore, we come up with the idea of applying Grid computing technology in building the DWH system to tackle the lack of resources for continuous data stream processing. Fig.4. depicts significant phases throughout the overall process of the GZLDSWH.
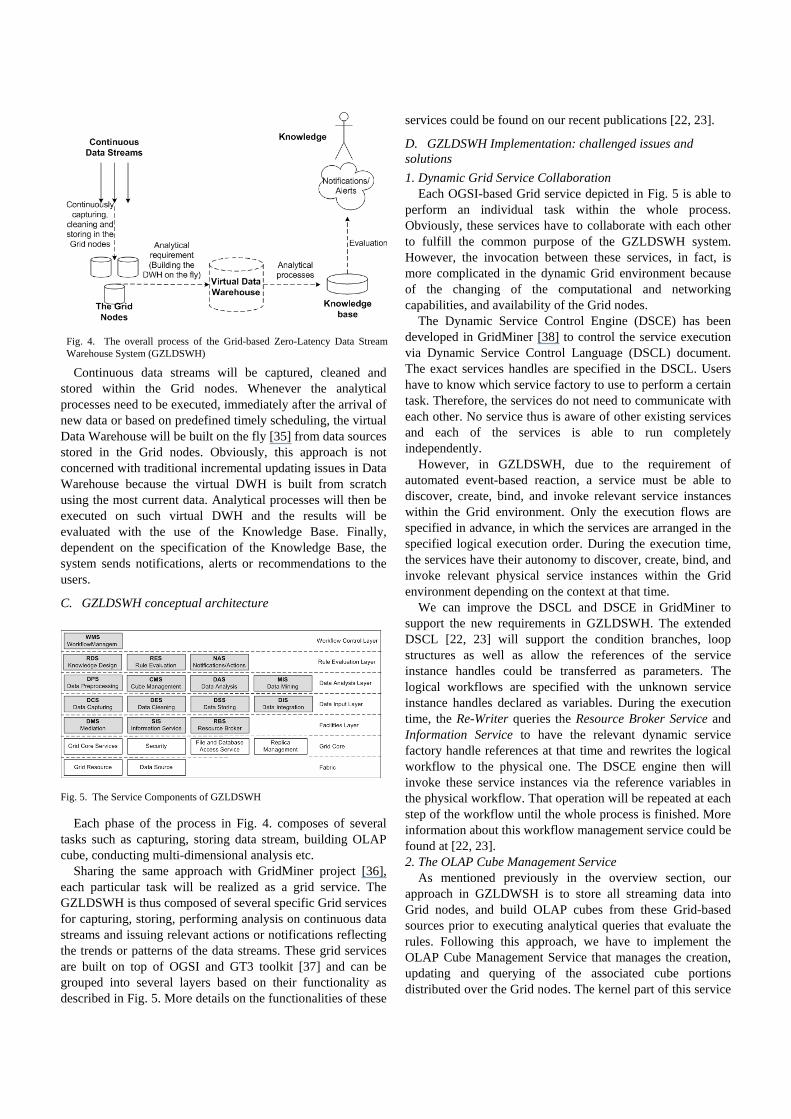
Continuous data streams will be captured, cleaned and
stored within the Grid nodes. Whenever the analytical processes need to be executed, immediately after the arrival of new data or based on predefined timely scheduling, the virtual Data Warehouse will be built on the fly [35] from data sources stored in the Grid nodes. Obviously, this approach is not concerned with traditional incremental updating issues in Data Warehouse because the virtual DWH is built from scratch using the most current data. Analytical processes will then be executed on such virtual DWH and the results will be evaluated with the use of the Knowledge Base. Finally, dependent on the specification of the Knowledge Base, the system sends notifications, alerts or recommendations to the users.
C. GZLDSWH conceptual architecture
Each phase of the process in Fig. 4. composes of several
tasks such as capturing, storing data stream, building OLAP cube, conducting multi-dimensional analysis etc.
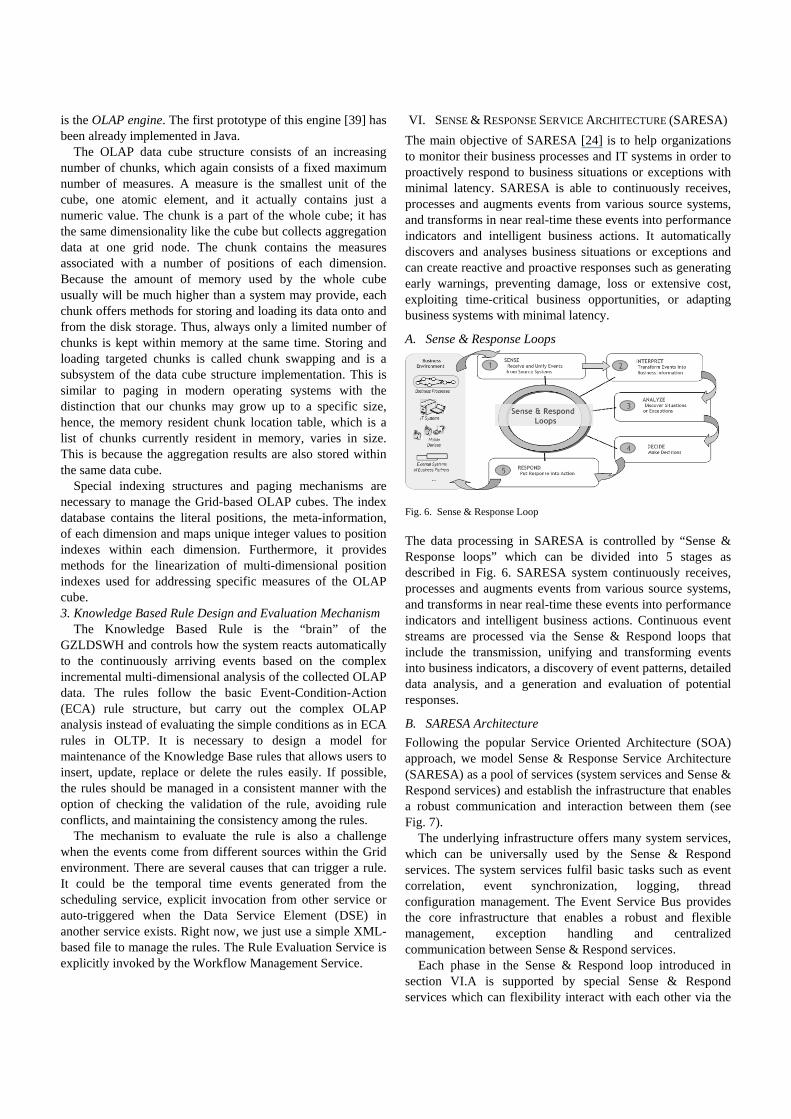
Sharing the same approach with GridMiner project [36], each particular task will be realized as a grid service. The GZLDSWH is thus composed of several specific Grid services for capturing, storing, performing analysis on continuous data streams and issuing relevant actions or notifications reflecting the trends or patterns of the data streams. These grid services are built on top of OGSI and GT3 toolkit [37] and can be grouped into several layers based on their functionality as described in Fig. 5. More details on the functionalities of these
services could be found on our recent publications [22, 23].
D. GZLDSWH Implementation: challenged issues and solutions 1. Dynamic Grid Service Collaboration
Each OGSI-based Grid service depicted in Fig. 5 is able to perform an individual task within the whole process. Obviously, these services have to collaborate with each other to fulfill the common purpose of the GZLDSWH system. However, the invocation between these services, in fact, is more complicated in the dynamic Grid environment because of the changing of the computational and networking capabilities, and availability of the Grid nodes.
The Dynamic Service Control Engine (DSCE) has been developed in GridMiner [38] to control the service execution via Dynamic Service Control Language (DSCL) document. The exact services handles are specified in the DSCL. Users have to know which service factory to use to perform a certain task. Therefore, the services do not need to communicate with each other. No service thus is aware of other existing services and each of the services is able to run completely independently.
However, in GZLDSWH, due to the requirement of automated event-based reaction, a service must be able to discover, create, bind, and invoke relevant service instances within the Grid environment. Only the execution flows are specified in advance, in which the services are arranged in the specified logical execution order. During the execution time, the services have their autonomy to discover, create, bind, and invoke relevant physical service instances within the Grid environment depending on the context at that time.
We can improve the DSCL and DSCE in GridMiner to support the new requirements in GZLDSWH. The extended DSCL [22, 23] will support the condition branches, loop structures as well as allow the references of the service instance handles could be transferred as parameters. The logical workflows are specified with the unknown service instance handles declared as variables. During the execution time, the Re-Writer queries the Resource Broker Service and Information Service to have the relevant dynamic service factory handle references at that time and rewrites the logical workflow to the physical one. The DSCE engine then will invoke these service instances via the reference variables in the physical workflow. That operation will be repeated at each step of the workflow until the whole process is finished. More information about this workflow management service could be found at [22, 23]. 2. The OLAP Cube Management Service
As mentioned previously in the overview section, our approach in GZLDWSH is to store all streaming data into Grid nodes, and build OLAP cubes from these Grid-based sources prior to executing analytical queries that evaluate the rules. Following this approach, we have to implement the OLAP Cube Management Service that manages the creation, updating and querying of the associated cube portions distributed over the Grid nodes. The kernel part of this service
Fig. 4. The overall process of the Grid-based Zero-Latency Data Stream Warehouse System (GZLDSWH)
Fig. 5. The Service Components of GZLDSWH
is the OLAP engine. The first prototype of this engine [39] has been already implemented in Java.
The OLAP data cube structure consists of an increasing number of chunks, which again consists of a fixed maximum number of measures. A measure is the smallest unit of the cube, one atomic element, and it actually contains just a numeric value. The chunk is a part of the whole cube; it has the same dimensionality like the cube but collects aggregation data at one grid node. The chunk contains the measures associated with a number of positions of each dimension. Because the amount of memory used by the whole cube usually will be much higher than a system may provide, each chunk offers methods for storing and loading its data onto and from the disk storage. Thus, always only a limited number of chunks is kept within memory at the same time. Storing and loading targeted chunks is called chunk swapping and is a subsystem of the data cube structure implementation. This is similar to paging in modern operating systems with the distinction that our chunks may grow up to a specific size, hence, the memory resident chunk location table, which is a list of chunks currently resident in memory, varies in size. This is because the aggregation results are also stored within the same data cube.
Special indexing structures and paging mechanisms are necessary to manage the Grid-based OLAP cubes. The index database contains the literal positions, the meta-information, of each dimension and maps unique integer values to position indexes within each dimension. Furthermore, it provides methods for the linearization of multi-dimensional position indexes used for addressing specific measures of the OLAP cube. 3. Knowledge Based Rule Design and Evaluation Mechanism
The Knowledge Based Rule is the “brain” of the GZLDSWH and controls how the system reacts automatically to the continuously arriving events based on the complex incremental multi-dimensional analysis of the collected OLAP data. The rules follow the basic Event-Condition-Action (ECA) rule structure, but carry out the complex OLAP analysis instead of evaluating the simple conditions as in ECA rules in OLTP. It is necessary to design a model for maintenance of the Knowledge Base rules that allows users to insert, update, replace or delete the rules easily. If possible, the rules should be managed in a consistent manner with the option of checking the validation of the rule, avoiding rule conflicts, and maintaining the consistency among the rules.
The mechanism to evaluate the rule is also a challenge when the events come from different sources within the Grid environment. There are several causes that can trigger a rule. It could be the temporal time events generated from the scheduling service, explicit invocation from other service or auto-triggered when the Data Service Element (DSE) in another service exists. Right now, we just use a simple XML-based file to manage the rules. The Rule Evaluation Service is explicitly invoked by the Workflow Management Service.
VI. SENSE & RESPONSE SERVICE ARCHITECTURE (SARESA) The main objective of SARESA [24] is to help organizations to monitor their business processes and IT systems in order to proactively respond to business situations or exceptions with minimal latency. SARESA is able to continuously receives, processes and augments events from various source systems, and transforms in near real-time these events into performance indicators and intelligent business actions. It automatically discovers and analyses business situations or exceptions and can create reactive and proactive responses such as generating early warnings, preventing damage, loss or extensive cost, exploiting time-critical business opportunities, or adapting business systems with minimal latency.
A. Sense & Response Loops
The data processing in SARESA is controlled by “Sense & Response loops” which can be divided into 5 stages as described in Fig. 6. SARESA system continuously receives, processes and augments events from various source systems, and transforms in near real-time these events into performance indicators and intelligent business actions. Continuous event streams are processed via the Sense & Respond loops that include the transmission, unifying and transforming events into business indicators, a discovery of event patterns, detailed data analysis, and a generation and evaluation of potential responses.
B. SARESA Architecture Following the popular Service Oriented Architecture (SOA) approach, we model Sense & Response Service Architecture (SARESA) as a pool of services (system services and Sense & Respond services) and establish the infrastructure that enables a robust communication and interaction between them (see Fig. 7).
The underlying infrastructure offers many system services, which can be universally used by the Sense & Respond services. The system services fulfil basic tasks such as event correlation, event synchronization, logging, thread configuration management. The Event Service Bus provides the core infrastructure that enables a robust and flexible management, exception handling and centralized communication between Sense & Respond services.
Each phase in the Sense & Respond loop introduced in section VI.A is supported by special Sense & Respond services which can flexibility interact with each other via the
Fig. 6. Sense & Response Loop
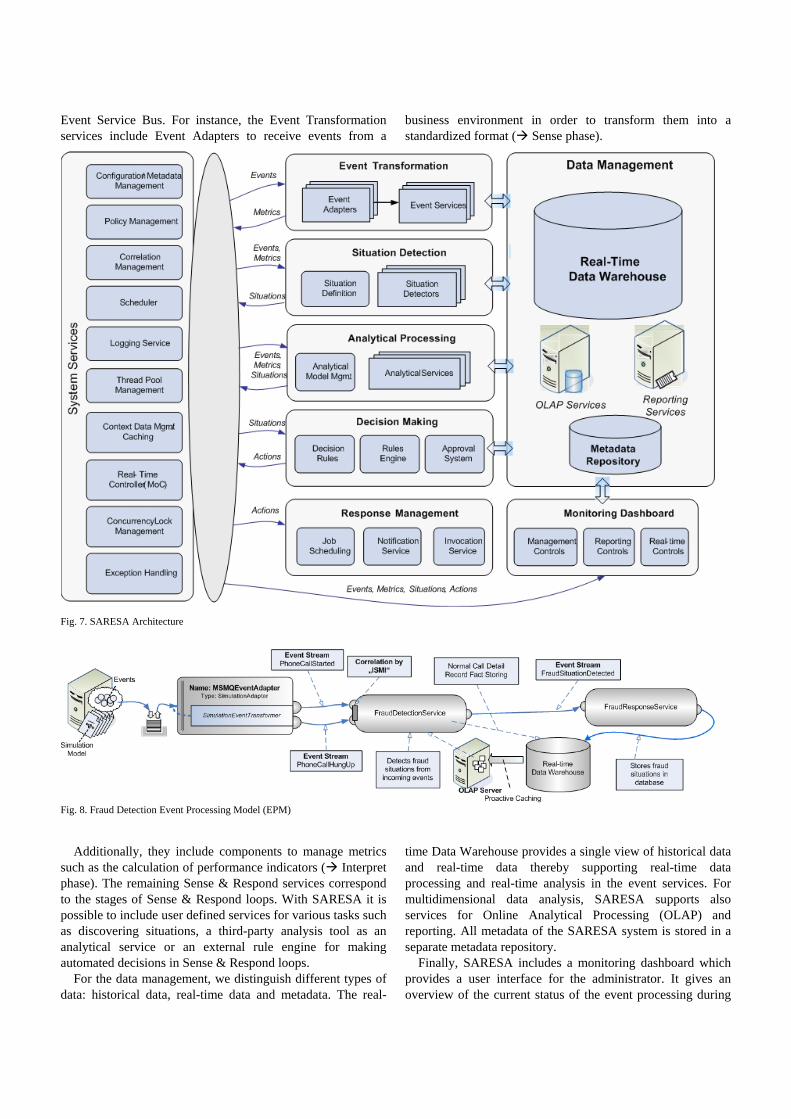
Event Service Bus. For instance, the Event Transformation services include Event Adapters to receive events from a
business environment in order to transform them into a standardized format ( Sense phase).
Additionally, they include components to manage metrics such as the calculation of performance indicators ( Interpret phase). The remaining Sense & Respond services correspond to the stages of Sense & Respond loops. With SARESA it is possible to include user defined services for various tasks such as discovering situations, a third-party analysis tool as an analytical service or an external rule engine for making automated decisions in Sense & Respond loops.
For the data management, we distinguish different types of data: historical data, real-time data and metadata. The real-
time Data Warehouse provides a single view of historical data and real-time data thereby supporting real-time data processing and real-time analysis in the event services. For multidimensional data analysis, SARESA supports also services for Online Analytical Processing (OLAP) and reporting. All metadata of the SARESA system is stored in a separate metadata repository.
Finally, SARESA includes a monitoring dashboard which provides a user interface for the administrator. It gives an overview of the current status of the event processing during
Fig. 7. SARESA Architecture
Fig. 8. Fraud Detection Event Processing Model (EPM)
the execution of Sense & Respond loops. With the monitoring dashboard, the administrator can easily recognize overloading situations in order to reconfigure the system. If failures arise during event processing, the administrator can intervene immediately and fix the problem.
C. Mobile Fraud Detection Scenario A Mobile Fraud Detection scenario is chosen to illustrate the Real-time event sense and response requirement. In this scenario, a timely analysis and response to prevent fraudulent activities is required. The most prominent fraud detection methods are based on the analysis of the usage patterns of mobile users. Call Detail Records (CDRs) are gathered as events and analyzed in order to generate business data such as calling time, geographic position of the mobile devices, call duration, and call frequency to recognize individual caller patterns of normal or fraudulent behaviour. In our application, it is a requirement that no CDR should be lost and a fraud should be countered as soon as it is detected.
Fraud is detected by checking some pre-defined rules. The mining approach to generate these rules is considered in a working paper [40]. The rules can be of a complex nature such as “an international mobile call from Austria to China of a certain customer lasts over 30 minutes will not be considered as a fraud if its duration is not over 1.5 times of his/her average call duration from Europe to Asia within the last 3 months, otherwise, it will be considered as a fraud and should be stopped immediately when it reaches such a thread hold”. The rules use aggregates which are provided and managed by an OLAP server (e.g. average call duration from Europe to Asia within the last 3 months for a certain user).
D. Event Processing Model (EPM) The processing steps, their relationships to each other, as well as the parameters of the analysis and data transformation processes can be individually defined for every organisation. SARESA uses an event processing model (EPM) for modelling Sense & Respond loops. Similar to a construction kit, the EPM offers various building blocks for Sense & Respond services which can be used to construct a Sense & Respond loop. Dependent on the requirements and the business problem, these building blocks can be flexibly conjoined or disconnected. Links between the building blocks represent a flow of events from one service to the next. The EPM allows for example: - Definition of the structure for the processed events and data - Interfaces to external systems for receiving data (Sense) and
also for responding by executing business transactions (Respond)
- Data transformations, data analysis and persistence - Definition of situations and exceptions in data to which a
response should be triggered - Modelling the data and control flows for the Sense &
Respond loop (e.g. calculation of a metric always occurs before data analysis)
- Declaration of Sense & Respond services for processing
steps including their input and output parameters - Definition of the relationships and dependencies of Sense &
Respond services and event data (e.g. data that has to be correlated before the processing starts)
Fig. 8. shows the EPM of SARESA in a mobile fraud detection scenario. Data (phone call information) is collected and received from source systems and continuously processed. The EPM shows the event flows of Sense & Respond processes and visualizes complex processing steps. For Sense & Respond loops it is vital that the processing steps work seamlessly together to enable a continuous and efficient execution of all processing stages.
E. SARESA System Deployment We have implemented the SARESA prototype and have used it to discover the fraud patterns for mobile phone calls. The prototype is implemented using Visual Studio.Net 2005 beta 2 and MS SQL Server 2005 beta 3.
Traditional Web applications architecture [41] has been proved as the "Best Practice" for various very scalable applications. To achieve high scalability, SARESA follows a similar approach for distributing load and fail over.
Events (CDR records) from heterogeneous sources are collected, normalized and dispatched to multiple process nodes (Worker Nodes) by a centralized service (dispatcher host). On each worker node, an instance of a SARESA application is running to process and to manage the Sense & Response loops. Some universal services such as synchronization and event correlation must be provided by a central coordination node (Admin Node) which is called by worker nodes.
A central server (Dispatcher Host) receives the events from various event sources and distributes them to computer nodes (Worker Nodes). The dispatcher host thus controls the load balancing among the worker nodes and assures the failover and recovery in case a worker node fails. Each worker node is hosting an application instance which processes events of Sense & Response loops. A central admin node hosts centralized system services such as event correlation and synchronization
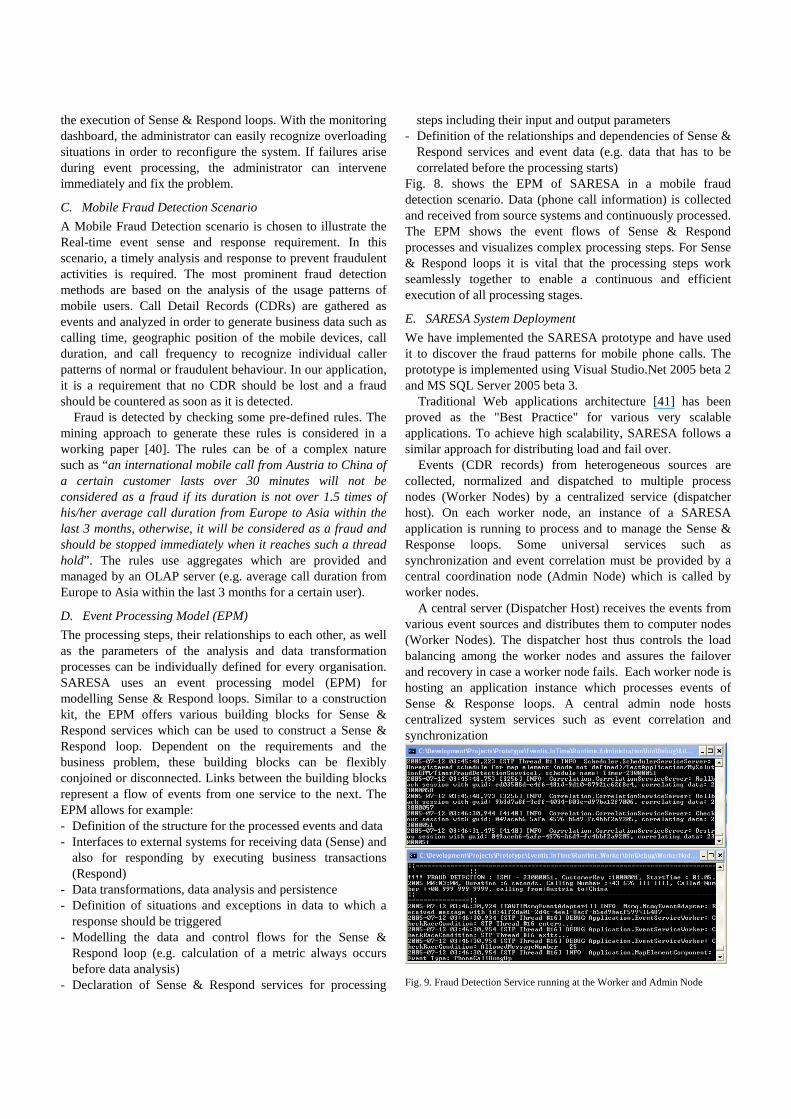
Fig. 9. Fraud Detection Service running at the Worker and Admin Node
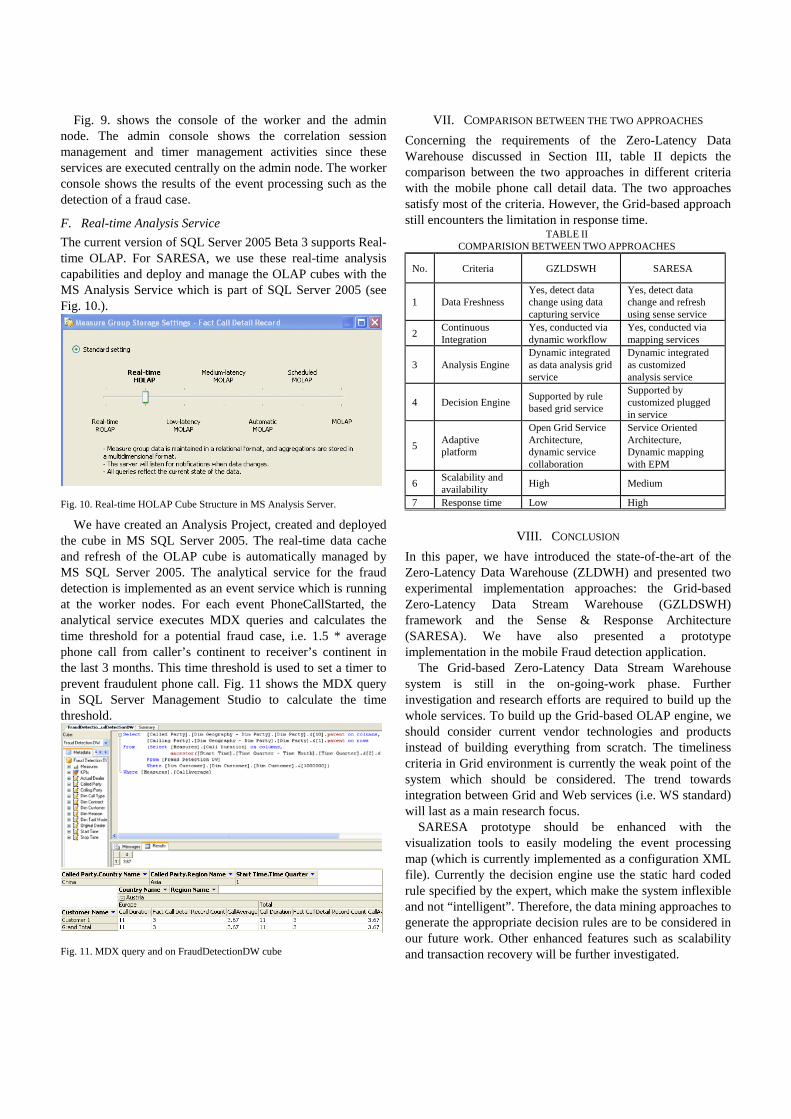
Fig. 9. shows the console of the worker and the admin node. The admin console shows the correlation session management and timer management activities since these services are executed centrally on the admin node. The worker console shows the results of the event processing such as the detection of a fraud case.
F. Real-time Analysis Service The current version of SQL Server 2005 Beta 3 supports Real-time OLAP. For SARESA, we use these real-time analysis capabilities and deploy and manage the OLAP cubes with the MS Analysis Service which is part of SQL Server 2005 (see Fig. 10.).
We have created an Analysis Project, created and deployed
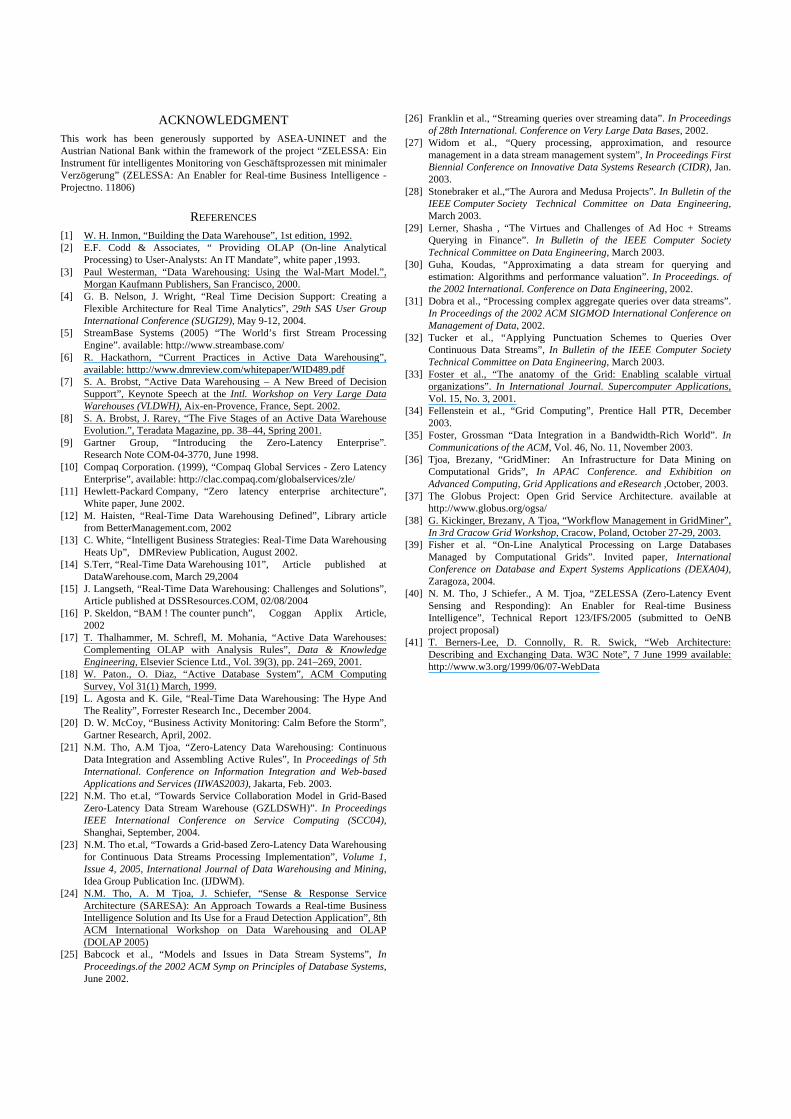
the cube in MS SQL Server 2005. The real-time data cache and refresh of the OLAP cube is automatically managed by MS SQL Server 2005. The analytical service for the fraud detection is implemented as an event service which is running at the worker nodes. For each event PhoneCallStarted, the analytical service executes MDX queries and calculates the time threshold for a potential fraud case, i.e. 1.5 * average phone call from caller’s continent to receiver’s continent in the last 3 months. This time threshold is used to set a timer to prevent fraudulent phone call. Fig. 11 shows the MDX query in SQL Server Management Studio to calculate the time threshold.
VII. COMPARISON BETWEEN THE TWO APPROACHES Concerning the requirements of the Zero-Latency Data Warehouse discussed in Section III, table II depicts the comparison between the two approaches in different criteria with the mobile phone call detail data. The two approaches satisfy most of the criteria. However, the Grid-based approach still encounters the limitation in response time.
VIII. CONCLUSION In this paper, we have introduced the state-of-the-art of the Zero-Latency Data Warehouse (ZLDWH) and presented two experimental implementation approaches: the Grid-based Zero-Latency Data Stream Warehouse (GZLDSWH) framework and the Sense & Response Architecture (SARESA). We have also presented a prototype implementation in the mobile Fraud detection application.
The Grid-based Zero-Latency Data Stream Warehouse system is still in the on-going-work phase. Further investigation and research efforts are required to build up the whole services. To build up the Grid-based OLAP engine, we should consider current vendor technologies and products instead of building everything from scratch. The timeliness criteria in Grid environment is currently the weak point of the system which should be considered. The trend towards integration between Grid and Web services (i.e. WS standard) will last as a main research focus.
SARESA prototype should be enhanced with the visualization tools to easily modeling the event processing map (which is currently implemented as a configuration XML file). Currently the decision engine use the static hard coded rule specified by the expert, which make the system inflexible and not “intelligent”. Therefore, the data mining approaches to generate the appropriate decision rules are to be considered in our future work. Other enhanced features such as scalability and transaction recovery will be further investigated.
Fig. 11. MDX query and on FraudDetectionDW cube
TABLE II COMPARISION BETWEEN TWO APPROACHES
No. Criteria GZLDSWH SARESA
1 Data Freshness Yes, detect data change using data capturing service
Yes, detect data change and refresh using sense service
2 Continuous Integration
Yes, conducted via dynamic workflow
Yes, conducted via mapping services
3 Analysis Engine Dynamic integrated as data analysis grid service
Dynamic integrated as customized analysis service
4 Decision Engine Supported by rule based grid service
Supported by customized plugged in service
5 Adaptive platform
Open Grid Service Architecture, dynamic service collaboration
Service Oriented Architecture, Dynamic mapping with EPM
6 Scalability and availability High Medium
7 Response time Low High Fig. 10. Real-time HOLAP Cube Structure in MS Analysis Server.
ACKNOWLEDGMENT This work has been generously supported by ASEA-UNINET and the Austrian National Bank within the framework of the project “ZELESSA: Ein Instrument für intelligentes Monitoring von Geschäftsprozessen mit minimaler Verzögerung” (ZELESSA: An Enabler for Real-time Business Intelligence -Projectno. 11806)
REFERENCES [1] W. H. Inmon, “Building the Data Warehouse”, 1st edition, 1992. [2] E.F. Codd & Associates, “ Providing OLAP (On-line Analytical
Processing) to User-Analysts: An IT Mandate”, white paper ,1993. [3] Paul Westerman, “Data Warehousing: Using the Wal-Mart Model.”,
Morgan Kaufmann Publishers, San Francisco, 2000. [4] G. B. Nelson, J. Wright, “Real Time Decision Support: Creating a
Flexible Architecture for Real Time Analytics”, 29th SAS User Group International Conference (SUGI29), May 9-12, 2004.
[5] StreamBase Systems (2005) “The World’s first Stream Processing Engine”. available: http://www.streambase.com/
[6] R. Hackathorn, “Current Practices in Active Data Warehousing”, available: htttp://www.dmreview.com/whitepaper/WID489.pdf
[7] S. A. Brobst, “Active Data Warehousing – A New Breed of Decision Support”, Keynote Speech at the Intl. Workshop on Very Large Data Warehouses (VLDWH), Aix-en-Provence, France, Sept. 2002.
[8] S. A. Brobst, J. Rarey, “The Five Stages of an Active Data Warehouse Evolution.”, Teradata Magazine, pp. 38–44, Spring 2001.
[9] Gartner Group, “Introducing the Zero-Latency Enterprise”. Research Note COM-04-3770, June 1998.
[10] Compaq Corporation. (1999), “Compaq Global Services - Zero Latency Enterprise”, available: http://clac.compaq.com/globalservices/zle/
[11] Hewlett-Packard Company, “Zero latency enterprise architecture”, White paper, June 2002.
[12] M. Haisten, “Real-Time Data Warehousing Defined”, Library article from BetterManagement.com, 2002
[13] C. White, “Intelligent Business Strategies: Real-Time Data Warehousing Heats Up”, DMReview Publication, August 2002.
[14] S.Terr, “Real-Time Data Warehousing 101”, Article published at DataWarehouse.com, March 29,2004
[15] J. Langseth, “Real-Time Data Warehousing: Challenges and Solutions”, Article published at DSSResources.COM, 02/08/2004
[16] P. Skeldon, “BAM ! The counter punch”, Coggan Applix Article, 2002
[17] T. Thalhammer, M. Schrefl, M. Mohania, “Active Data Warehouses: Complementing OLAP with Analysis Rules”, Data & Knowledge Engineering, Elsevier Science Ltd., Vol. 39(3), pp. 241–269, 2001.
[18] W. Paton., O. Diaz, “Active Database System”, ACM Computing Survey, Vol 31(1) March, 1999.
[19] L. Agosta and K. Gile, “Real-Time Data Warehousing: The Hype And The Reality”, Forrester Research Inc., December 2004.
[20] D. W. McCoy, “Business Activity Monitoring: Calm Before the Storm”, Gartner Research, April, 2002.
[21] N.M. Tho, A.M Tjoa, “Zero-Latency Data Warehousing: Continuous Data Integration and Assembling Active Rules”, In Proceedings of 5th International. Conference on Information Integration and Web-based Applications and Services (IIWAS2003), Jakarta, Feb. 2003.
[22] N.M. Tho et.al, “Towards Service Collaboration Model in Grid-Based Zero-Latency Data Stream Warehouse (GZLDSWH)”. In Proceedings IEEE International Conference on Service Computing (SCC04), Shanghai, September, 2004.
[23] N.M. Tho et.al, “Towards a Grid-based Zero-Latency Data Warehousing for Continuous Data Streams Processing Implementation”, Volume 1, Issue 4, 2005, International Journal of Data Warehousing and Mining, Idea Group Publication Inc. (IJDWM).
[24] N.M. Tho, A. M Tjoa, J. Schiefer, “Sense & Response Service Architecture (SARESA): An Approach Towards a Real-time Business Intelligence Solution and Its Use for a Fraud Detection Application”, 8th ACM International Workshop on Data Warehousing and OLAP (DOLAP 2005)
[25] Babcock et al., “Models and Issues in Data Stream Systems”, In Proceedings.of the 2002 ACM Symp on Principles of Database Systems, June 2002.
[26] Franklin et al., “Streaming queries over streaming data”. In Proceedings of 28th International. Conference on Very Large Data Bases, 2002.
[27] Widom et al., “Query processing, approximation, and resource management in a data stream management system”, In Proceedings First Biennial Conference on Innovative Data Systems Research (CIDR), Jan. 2003.
[28] Stonebraker et al.,“The Aurora and Medusa Projects”. In Bulletin of the IEEE Computer Society Technical Committee on Data Engineering, March 2003.
[29] Lerner, Shasha , “The Virtues and Challenges of Ad Hoc + Streams Querying in Finance”. In Bulletin of the IEEE Computer Society Technical Committee on Data Engineering, March 2003.
[30] Guha, Koudas, “Approximating a data stream for querying and estimation: Algorithms and performance valuation”. In Proceedings. of the 2002 International. Conference on Data Engineering, 2002.
[31] Dobra et al., “Processing complex aggregate queries over data streams”. In Proceedings of the 2002 ACM SIGMOD International Conference on Management of Data, 2002.
[32] Tucker et al., “Applying Punctuation Schemes to Queries Over Continuous Data Streams”, In Bulletin of the IEEE Computer Society Technical Committee on Data Engineering, March 2003.
[33] Foster et al., “The anatomy of the Grid: Enabling scalable virtual organizations”. In International Journal. Supercomputer Applications, Vol. 15, No. 3, 2001.
[34] Fellenstein et al., “Grid Computing”, Prentice Hall PTR, December 2003.
[35] Foster, Grossman “Data Integration in a Bandwidth-Rich World”. In Communications of the ACM, Vol. 46, No. 11, November 2003.
[36] Tjoa, Brezany, “GridMiner: An Infrastructure for Data Mining on Computational Grids”, In APAC Conference. and Exhibition on Advanced Computing, Grid Applications and eResearch ,October, 2003.
[37] The Globus Project: Open Grid Service Architecture. available at http://www.globus.org/ogsa/
[38] G. Kickinger, Brezany, A Tjoa, “Workflow Management in GridMiner”, In 3rd Cracow Grid Workshop, Cracow, Poland, October 27-29, 2003.
[39] Fisher et al. “On-Line Analytical Processing on Large Databases Managed by Computational Grids”. Invited paper, International Conference on Database and Expert Systems Applications (DEXA04), Zaragoza, 2004.
[40] N. M. Tho, J Schiefer., A M. Tjoa, “ZELESSA (Zero-Latency Event Sensing and Responding): An Enabler for Real-time Business Intelligence”, Technical Report 123/IFS/2005 (submitted to OeNB project proposal)
[41] T. Berners-Lee, D. Connolly, R. R. Swick, “Web Architecture: Describing and Exchanging Data. W3C Note”, 7 June 1999 available: http://www.w3.org/1999/06/07-WebData