X-ray diffraction and SEM study of kidney stones in Israel: quantitative analysis, crystallite size...
10
ORIGINAL PAPER X-ray diffraction and SEM study of kidney stones in Israel: quantitative analysis, crystallite size determination, and statistical characterization Vladimir Uvarov • Inna Popov • Nandakishore Shapur • Tamer Abdin • Ofer N. Gofrit • Dov Pode • Mordechai Duvdevani Received: 31 August 2010 / Accepted: 25 January 2011 / Published online: 10 February 2011 Ó Springer Science+Business Media B.V. 2011 Abstract Urinary calculi have been recognized as one of the most painful medical disorders. Tenable knowledge of the phase composition of the stones is very important to elucidate an underlying etiology of the stone disease. We report here the results of quantitative X-ray diffraction phase analysis performed on 278 kidney stones from the 275 patients treated at the Department of Urology of Hadassah Hebrew University Hospital (Jerusalem, Israel). Quantification of biominerals in multicomponent samples was per- formed using the normalized reference intensity ratio method. According to the observed phase composi- tions, all the tested stones were classified into five chemical groups: oxalates (43.2%), phosphates (7.7%), urates (10.3%), cystines (2.9%), and stones composed of a mixture of different minerals (35.9%). A detailed analysis of each allocated chemical group is presented along with the crystallite size calculations for all the observed crystalline phases. The obtained results have been compared with the published data originated from different geographical regions. Morphology and spatial distribution of the phases identified in the kidney stones were studied with scanning electron microscopy (SEM) and energy-dispersive X-ray spectroscopy (EDS). This type of detailed study of phase composition and structural characteristics of the kidney stones was performed in Israel for the first time. Keywords Kidney stones Urinary calculi Biominerals Quantitative XRD analysis EDS mapping Crystallite size Introduction Urolithiasis (kidney stone disease) is a long-standing medical illness and is still a common public health problem. It affects up to 10–20% of the general population worldwide (Moe 2006; Coe et al. 2005). The knowledge of phase composition of kidney stones is necessary for a better understanding of the nature of urolithiasis, its etiology, for choosing the correct treatment modality, and for preventive medical treat- ment. According to Smith (1998), the analysis of the kidney stones identifies risk factors leading to stone disease and this information can be utilized to direct therapy. Electronic supplementary material The online version of this article (doi:10.1007/s10653-011-9374-6) contains supplementary material, which is available to authorized users. V. Uvarov (&) I. Popov The Faculty of Natural Science, The Center for Nanoscience and Nanotechnology, The Unit for Nanoscopic Characterization, The Hebrew University of Jerusalem, E. Safra Campus, Givat Ram, 91904 Jerusalem, Israel e-mail: [email protected] N. Shapur T. Abdin O. N. Gofrit D. Pode M. Duvdevani The Department of Urology, Hadassah Hebrew University Hospital, 91904 Jerusalem, Israel 123 Environ Geochem Health (2011) 33:613–622 DOI 10.1007/s10653-011-9374-6
-
Upload
independent -
Category
Documents
-
view
2 -
download
0
Transcript of X-ray diffraction and SEM study of kidney stones in Israel: quantitative analysis, crystallite size...
ORIGINAL PAPER
X-ray diffraction and SEM study of kidney stones in Israel:quantitative analysis, crystallite size determination,and statistical characterization
Vladimir Uvarov • Inna Popov •
Nandakishore Shapur • Tamer Abdin •
Ofer N. Gofrit • Dov Pode • Mordechai Duvdevani
Received: 31 August 2010 / Accepted: 25 January 2011 / Published online: 10 February 2011
� Springer Science+Business Media B.V. 2011
Abstract Urinary calculi have been recognized as
one of the most painful medical disorders. Tenable
knowledge of the phase composition of the stones is
very important to elucidate an underlying etiology of
the stone disease. We report here the results of
quantitative X-ray diffraction phase analysis performed
on 278 kidney stones from the 275 patients treated at
the Department of Urology of Hadassah Hebrew
University Hospital (Jerusalem, Israel). Quantification
of biominerals in multicomponent samples was per-
formed using the normalized reference intensity ratio
method. According to the observed phase composi-
tions, all the tested stones were classified into five
chemical groups: oxalates (43.2%), phosphates (7.7%),
urates (10.3%), cystines (2.9%), and stones composed
of a mixture of different minerals (35.9%). A detailed
analysis of each allocated chemical group is presented
along with the crystallite size calculations for all the
observed crystalline phases. The obtained results have
been compared with the published data originated from
different geographical regions. Morphology and spatial
distribution of the phases identified in the kidney stones
were studied with scanning electron microscopy (SEM)
and energy-dispersive X-ray spectroscopy (EDS). This
type of detailed study of phase composition and
structural characteristics of the kidney stones was
performed in Israel for the first time.
Keywords Kidney stones � Urinary calculi �Biominerals � Quantitative XRD analysis �EDS mapping � Crystallite size
Introduction
Urolithiasis (kidney stone disease) is a long-standing
medical illness and is still a common public health
problem. It affects up to 10–20% of the general
population worldwide (Moe 2006; Coe et al. 2005).
The knowledge of phase composition of kidney stones
is necessary for a better understanding of the nature of
urolithiasis, its etiology, for choosing the correct
treatment modality, and for preventive medical treat-
ment. According to Smith (1998), the analysis of the
kidney stones identifies risk factors leading to stone
disease and this information can be utilized to direct
therapy.
Electronic supplementary material The online version ofthis article (doi:10.1007/s10653-011-9374-6) containssupplementary material, which is available to authorized users.
V. Uvarov (&) � I. Popov
The Faculty of Natural Science, The Center
for Nanoscience and Nanotechnology, The Unit
for Nanoscopic Characterization, The Hebrew University
of Jerusalem, E. Safra Campus, Givat Ram,
91904 Jerusalem, Israel
e-mail: [email protected]
N. Shapur � T. Abdin � O. N. Gofrit � D. Pode �M. Duvdevani
The Department of Urology, Hadassah Hebrew University
Hospital, 91904 Jerusalem, Israel
123
Environ Geochem Health (2011) 33:613–622
DOI 10.1007/s10653-011-9374-6
Powder X-ray diffraction analysis (XRD) and
Fourier transform infrared spectroscopy (FTIR) are
the powerful tools widely used for the identification
of crystalline phases in kidney stones. Both methods
have advantages and disadvantages. FTIR is faster
and easier to apply. But quantification of multicom-
ponent mixtures containing various oxalates, phos-
phates, and urates is rather problematic for this
method (Singh 2008; Kanchana et al. 2009) so that at
intricate phase compositions, only semiquantitative
results could be obtained. Corns (1983) emphasizes
that X-ray diffraction analysis does provide informa-
tion not given by other methods, for example,
distinguishing Ca(COO)2 • H2O from Ca(COO)2.
XRD method does not allow chemical identification
of an amorphous material of kidney stones if the
latter is present. However, the XRD method allows
calculation of chemical composition based on the
results of quantitative phase analysis. Therefore in
our opinion, for quantitative phase analysis, the XRD
method is preferable.
It is necessary to emphasize that the kidney stones
are not the simplest object for a phase analysis. The
majority of biominerals composing the stones have
low crystal symmetry (monoclinic or orthorhombic)
and rather large unit cell parameters. Therefore, XRD
patterns of their mixtures have strong overlapping of
peaks. Capabilities of different modern methods of
quantitative XRD analysis (QXRDA) to characterize
mixtures of various phases were studied by a number
of researchers (Stephenson et al. 2001; Newman and
Byrn 2003; Hillier 2000). However, similar type of
study had not been yet performed on significant
sampling of kidney stones.
It should be noted that there is no commonly
accepted agreement for the threshold phase composi-
tions under which the stone can be referred to one or
another basic type. Therefore, frequently it is difficult
to compare data reported by different researchers
(Abdel-Halim and Abdel-Aal 1999; Leonard 1961;
Fazil Marickar et al. 2009; Miller and Lingeman
2007; Bartoletti et al. 2007; Parmar 2004; Kleinman
et al. 2004; Tosukhowong et al. 2007).
In the present work, we investigated phase compo-
sition of kidney stones recovered from patients who
were treated for urolithiasis in Hadassah Hebrew
University Hospital. We classified kidney stones by the
QXRDA results, and the obtained results have been
compared with the published data originated from
different geographical regions. In addition, we applied
back-scattered electron imaging and EDS mapping in
order to study relation between morphological features
of stone and its phase composition as defined by XRD.
The relationships between mineral composition of
kidney stones and various medical aspects practically
were not considered in this work as we plan to consider
these aspects in our separate article.
Materials and methods
Two hundred and seventy-eight kidney stones were
obtained from 275 patients who were treated for
urolithiasis in the Department of Urology (Hadassah
Hebrew University Hospital, Jerusalem, Israel) in
2007–2010.
All of these stones that were either spontaneously
expelled or following procedural extraction were sent
for analysis. Samples were stored in pre-cleaned
plastic or glass vials. Prior to structural study, all the
samples were carefully washed using ethyl alcohol in
order to remove any remaining blood clots. Dimen-
sions of the tested stones varied from a few millime-
ters to 2 cm. The macroscopic shape of as-received
kidney stones was different for each sample varying
between a spherical one, an ellipsoidal or just
irregular. The majority of the studied samples were
represented by the zonal or breccia-like formations
that can be characterized by certain sequence of the
alternations or the changes of crystalline phases.
X-ray powder diffraction measurements were
performed on the D8 Advance diffractometer (Bruker
AXS, Karlsruhe, Germany) with a goniometer radius
217.5 mm, Gobel Mirror parallel-beam optics, 2�Sollers slits, and 0.6-mm receiving slit. The statistical
homogeneity and representativity of an analytical
specimen was achieved by crushing the stones down
to 3–5 mm size followed by quartering. After that,
the stones were grinded manually in an agate mortar
to a powder with grain size of about 5 micron which
subsequently was filled into a low-background quartz
sample holder. The specimen weight was about 0.2 g.
XRD patterns were recorded within an angle range of
6–66� 2h at room temperature using CuKa radiation
(k = 1.5418 A) with the following measurement
conditions: tube voltage of 40 kV, tube current of
40 mA, step-scan mode with a step size of 0.02� 2h,
and counting time of 1 s per step. The instrumental
614 Environ Geochem Health (2011) 33:613–622
123
broadening was determined using LaB6 powder
(NIST SRM 660). EVA software (Bruker DiffracPlus
2010) was used for phase identification, quantitative
phase analysis, and crystallite size calculation. In
EVA, phase quantification is performed via the
normalized reference intensity ratio (RIR) method
(Chung 1974) and a content of each crystalline phase
is calculated as:
Cið%Þ ¼ 100� ðIi=kiÞ=Xn
i¼1
Ii=ki ð1Þ
where Ci is the content of i-th phase, Ii is integral
intensity of i-th phase, and ki is corundum coefficient
(RIR) for i-th phase. The ki values for analyzed
phases are stored in PDF database.
In order to estimate the accuracy of phase content
determination, we cross-checked about 15% of sam-
ples using PCW software (Kraus and Nolze 1996) as
an alternative way for quantitative analysis. PCW
was chosen because it allows modeling of preferred
orientation which could take place at a preparation of
the samples and therefore should be taken into
account when phase content is quantified.
A value of crystallite size was calculated using
Scherrer equation:
d ¼ K � kb� cos h
ð2Þ
where d is the crystallite size, k is the X-ray
wavelength, b is the FWHM (full width at half
maximum) of the peak after correcting for instru-
mental peak broadening (b expressed in radians), h is
the Bragg angle, and K is the Scherrer constant.
Statistical treatment of the obtained results was
performed according to the recommendations of
Tobias and Croarkin (2006).
Morphology and spatial distribution of the identi-
fied phases within the kidney stones were studied
with environmental scanning electron microscope
(ESEM) Quanta 200 (FEI Company, Netherland)
operated in low vacuum mode (0.63–0.68 Torr) and
equipped with EDS detector (EDAX-TSL, USA).
Results and discussion
XRD analysis revealed the presence of 19 various
crystalline phases in the studied samples. All of them
have been identified using PDF-4 database (Interna-
tional Centre for Diffraction Data 2010). The major
identified crystalline phases were whewellite, weddel-
lite, hydroxylapatite, brushite, struvite, uric acid, uric
acid dihydrate, L-cystine. Whitlockite, newberyite,
sodium urate hydrate, ammonium acid urate, potas-
sium phosphate hydrate, and ferrowyllietite at alias
(see Supplementary Material, Table 1) have been
found out much less often. Most of these minerals
are repeatedly described in the medical and mineral-
ogical literature and are typical components of kidney
stones. A majority of the identified phases belong to
groups of oxalates, phosphates, and urates. Minor
amount of amorphous component was observed only
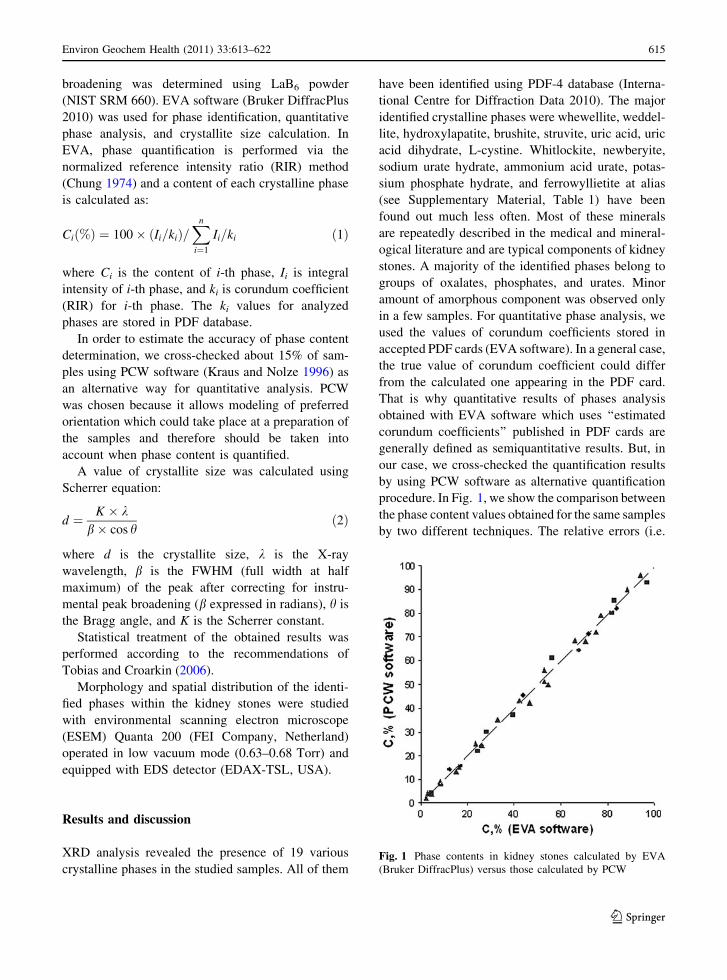
in a few samples. For quantitative phase analysis, we
used the values of corundum coefficients stored in
accepted PDF cards (EVA software). In a general case,
the true value of corundum coefficient could differ
from the calculated one appearing in the PDF card.
That is why quantitative results of phases analysis
obtained with EVA software which uses ‘‘estimated
corundum coefficients’’ published in PDF cards are
generally defined as semiquantitative results. But, in
our case, we cross-checked the quantification results
by using PCW software as alternative quantification
procedure. In Fig. 1, we show the comparison between
the phase content values obtained for the same samples
by two different techniques. The relative errors (i.e.
Fig. 1 Phase contents in kidney stones calculated by EVA
(Bruker DiffracPlus) versus those calculated by PCW
Environ Geochem Health (2011) 33:613–622 615
123
divergences between absolute phase content obtained
for the same sample by two quantification techniques)
were estimated by the procedure we used earlier
(Uvarov and Popov 2008). They did not exceed 9.4 and
3.8%, respectively, for low- and high-phase contents.
The examples of the QXRDA results and typical XRD
patterns obtained from investigated samples are pre-
sented in Supplementary materials.
Correctness of QXRDA results is usually estimated
by their comparison to the results obtained by other
method or by the analysis of artificial mixtures. In our
case, preparation of artificial mixes for all possible
combinations of biominerals was practically impossi-
ble, whereas alternative method for full quantitative
phase analysis does not exist. Therefore, we adopt the
value for relative errors from the published data
(Hillier 2000; Uvarov and Popov 2008; Grygar et al.
2008; De la Torre and Aranda 2003) and suggest that
it should be at the order of 2–5% for the main phases
and about 5–10% for the low-content components.
The error may be lower for the samples with rather
simple phase composition (whewellite–weddellite,
uric acid–uric acid dehydrate, whewellite–hydroxyl-
apatite, etc.) and higher for samples with intricate
phase composition (oxalates–urates, oxalates–phos-
phates, and oxalates–urates–phosphates) or with an
unfavorable quantitative proportion of minerals in a
mixture.
We systematized the whole data set of the phase
compositions obtained for all the tested samples and
divided it into several chemical groups: pure oxalates,
phosphates, urates, and rarer cystine stones. The
stones with the mixed phase composition (i.e. stones,
which contained minerals from different chemical
groups) were also allocated in separate group. Since
both applied methods give close quantitative results,
only results obtained with EVA software have been
used to organize kidney stones into chemical groups.
Then, phase compositions of the basic groups were
evaluated in more details. The results of this detailed
statistical analysis are presented in Fig. 2 and Fig. 3.
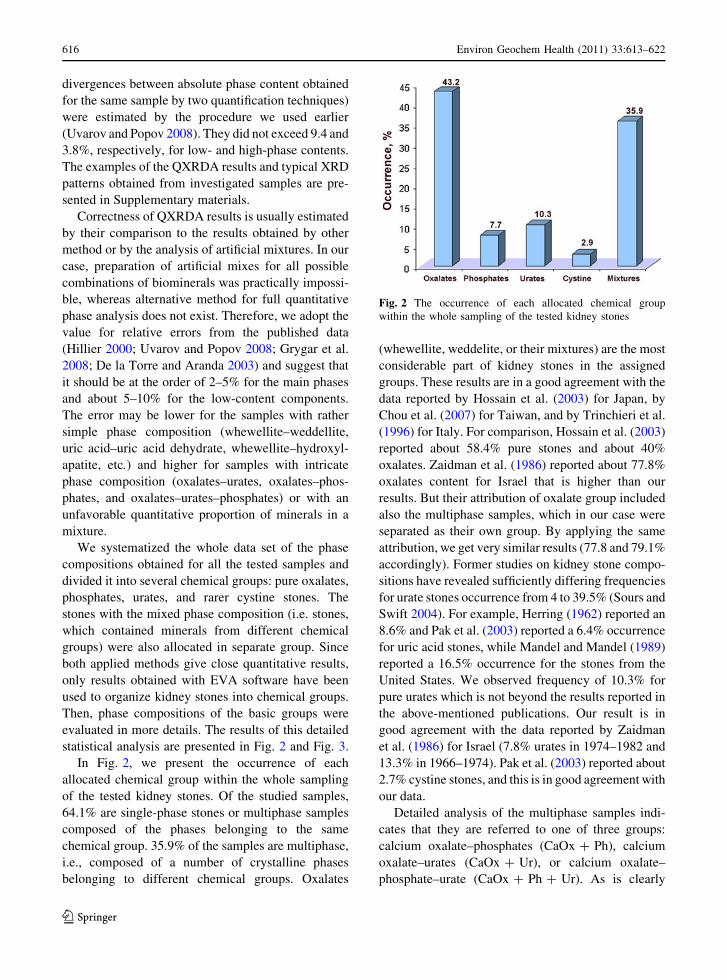
In Fig. 2, we present the occurrence of each
allocated chemical group within the whole sampling
of the tested kidney stones. Of the studied samples,
64.1% are single-phase stones or multiphase samples
composed of the phases belonging to the same
chemical group. 35.9% of the samples are multiphase,
i.e., composed of a number of crystalline phases
belonging to different chemical groups. Oxalates
(whewellite, weddelite, or their mixtures) are the most
considerable part of kidney stones in the assigned
groups. These results are in a good agreement with the
data reported by Hossain et al. (2003) for Japan, by
Chou et al. (2007) for Taiwan, and by Trinchieri et al.
(1996) for Italy. For comparison, Hossain et al. (2003)
reported about 58.4% pure stones and about 40%
oxalates. Zaidman et al. (1986) reported about 77.8%
oxalates content for Israel that is higher than our
results. But their attribution of oxalate group included
also the multiphase samples, which in our case were
separated as their own group. By applying the same
attribution, we get very similar results (77.8 and 79.1%
accordingly). Former studies on kidney stone compo-
sitions have revealed sufficiently differing frequencies
for urate stones occurrence from 4 to 39.5% (Sours and
Swift 2004). For example, Herring (1962) reported an
8.6% and Pak et al. (2003) reported a 6.4% occurrence
for uric acid stones, while Mandel and Mandel (1989)
reported a 16.5% occurrence for the stones from the
United States. We observed frequency of 10.3% for
pure urates which is not beyond the results reported in
the above-mentioned publications. Our result is in
good agreement with the data reported by Zaidman
et al. (1986) for Israel (7.8% urates in 1974–1982 and
13.3% in 1966–1974). Pak et al. (2003) reported about
2.7% cystine stones, and this is in good agreement with
our data.
Detailed analysis of the multiphase samples indi-
cates that they are referred to one of three groups:
calcium oxalate–phosphates (CaOx ? Ph), calcium
oxalate–urates (CaOx ? Ur), or calcium oxalate–
phosphate–urate (CaOx ? Ph ? Ur). As is clearly
Fig. 2 The occurrence of each allocated chemical group
within the whole sampling of the tested kidney stones
616 Environ Geochem Health (2011) 33:613–622
123
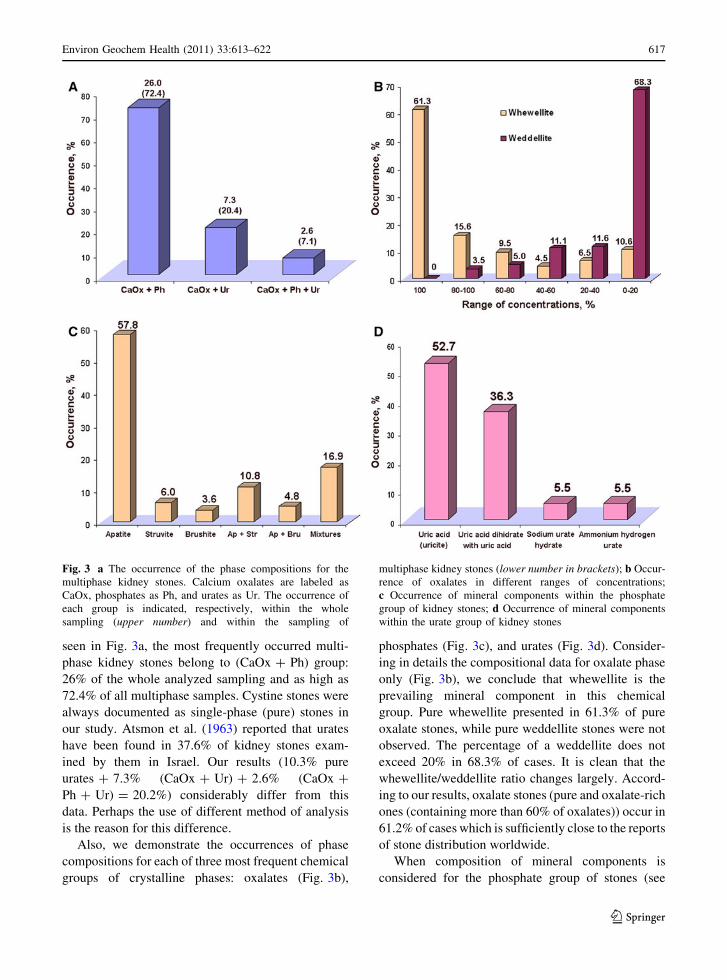
seen in Fig. 3a, the most frequently occurred multi-
phase kidney stones belong to (CaOx ? Ph) group:
26% of the whole analyzed sampling and as high as
72.4% of all multiphase samples. Cystine stones were
always documented as single-phase (pure) stones in
our study. Atsmon et al. (1963) reported that urates
have been found in 37.6% of kidney stones exam-
ined by them in Israel. Our results (10.3% pure
urates ? 7.3% (CaOx ? Ur) ? 2.6% (CaOx ?
Ph ? Ur) = 20.2%) considerably differ from this
data. Perhaps the use of different method of analysis
is the reason for this difference.
Also, we demonstrate the occurrences of phase
compositions for each of three most frequent chemical
groups of crystalline phases: oxalates (Fig. 3b),
phosphates (Fig. 3c), and urates (Fig. 3d). Consider-
ing in details the compositional data for oxalate phase
only (Fig. 3b), we conclude that whewellite is the
prevailing mineral component in this chemical
group. Pure whewellite presented in 61.3% of pure
oxalate stones, while pure weddellite stones were not
observed. The percentage of a weddellite does not
exceed 20% in 68.3% of cases. It is clean that the
whewellite/weddellite ratio changes largely. Accord-
ing to our results, oxalate stones (pure and oxalate-rich
ones (containing more than 60% of oxalates)) occur in
61.2% of cases which is sufficiently close to the reports
of stone distribution worldwide.
When composition of mineral components is
considered for the phosphate group of stones (see
Fig. 3 a The occurrence of the phase compositions for the
multiphase kidney stones. Calcium oxalates are labeled as
CaOx, phosphates as Ph, and urates as Ur. The occurrence of
each group is indicated, respectively, within the whole
sampling (upper number) and within the sampling of
multiphase kidney stones (lower number in brackets); b Occur-
rence of oxalates in different ranges of concentrations;
c Occurrence of mineral components within the phosphate
group of kidney stones; d Occurrence of mineral components
within the urate group of kidney stones
Environ Geochem Health (2011) 33:613–622 617
123

Fig. 2c), it is clearly seen that in most cases (67.4%),
such stones are pure single phase (i.e. either apatite or
struvite or brushite). Although apatite is the most
frequently naturally occurring phosphate mineral in
kidney stones, pure apatite stones are rather very rare
(only 1.7%), in contrast to struvite (6.0%) and
brushite (3.6%). Only in 7.6% of cases, more rare
phosphates (whitlockite, newberyite et al.) were
found in the samples of this group. The struvite-
apatite mixture was the most frequently occurring
when compared to other mixture mineral composi-
tions (brushite-apatite and others).
Considering the phase compositions within the
urate group presented in stones (see Fig. 2d), we find
the ordinary uric acid (C5H4N4O3) and a mixture of
uric acid and uric acid dihydrate (C5H4N4O3�2H2O)
covering most of urates (89.0%). The ratio of uric
acid to uric acid dihydrate in their mixture was
practically always around 3:1. We did not find pure
uric acid dihydrate single-phase stones. In 11% of
cases, the stones were formed of rather rare sodium
urate hydrate and ammonium hydrogen urate.
It is interesting to compare our results with data
reported for the geographical regions with similar to
Israel climatic conditions. For example, Abboud
(2008) reported the 6.7% urates among analyzed
kidney stones of patients from North Jordan, and it
well coincides with our results. Abdel-Halim et al.
(1993) reported about 24% uric acid stones and 15%
phosphate stones in samples originated from western
Saudi Arabia. These frequencies are, respectively, 2.3
and 2 times higher than our findings (10.3 and 7.7%
for urates and phosphates, respectively). Khan et al.
(2004) reported about 78% oxalates mixed with
calcium phosphate (it is in good agreement with our
data), 19% uric acid stones and 3% struvite in samples
from Riyadh (Saudi Arabia). As was concluded by
Newman and Byrn (2003), by Abdel-Halim et al.
(1993), and by Khan et al. (2004), the incidence of
uric acid stones in Saudi Arabia was found higher than
that for western countries. Statistical frequencies of
oxalates and phosphates found by us are in good
agreement with the data reported by Al-Naam et al.
(1987) for southern Iraq. Nasir (1999) reported the
data for the United Arab Emirates (oxalates-38.5%,
phosphates-11.5%, urates-11.5%, and mix-38.5%). It
is sufficiently close to our results. Dursun et al. (2008)
reported about 3% of cystine stones in the samples
originated from Turkey. It matches well our results
(2.9%). But they observed multiphase stones in 18.3%
of cases, while in our study, we found 35.9% of such
stones. It should therefore be noted that such signif-
icant differences arise not only because of natural
factors but also due to lack of coincidence in criteria
by which stones are related to specific chemical group.
The crystallite size is an important parameter, on
which sufficient attention has not been paid yet.
Crystallite size is inherently connected to the growth
conditions of the crystalline phases. That is why it
affected a chemistry of growth medium and its thermo-
dynamics, which both are defined by a metabolism of a
patient. Further, we present results of additional steps
of the samples characterization undertaken to learn
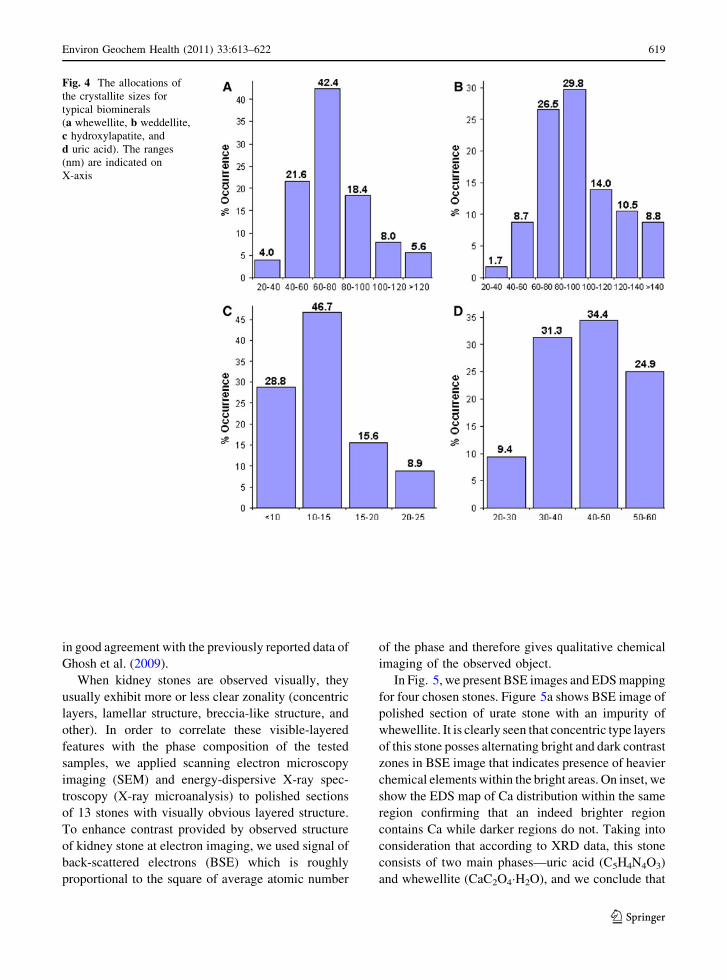
more about growth of kidney stones. In Fig. 4, we
present the histograms of allocations of the crystallite
sizes for typical biominerals. First of all, it should be
noted that we found significant differences in the
crystallite size of each mineral phase forming the
stones, while weddelite (oxylate stones) and brushites
(phosphate stones) crystals have 100 nm average sizes,
hydroxylapatite crystals were as small as 12.7 nm
average size. Important is that the observed crystallite
sizes differ by about one order of magnitude for all the
minerals, and the observed size range differs for each
mineral phase. The relative error of crystallite size
measurements has been estimated as described in our
work (Uvarov and Popov 2007) and did not exceed
12.8, 8.2, and 4.6%, respectively, for the crystallite
sizes of smaller than 10, 10–40 and larger than 40 nm.
The crystallite size of the weddellite was always more
than the crystallite size of the whewellite at their
simultaneous presence in the sample. Next interesting
fact is that hydroxylapatite always exhibited smallest
crystallite size with no relation on the presence of other
minerals in the sample. We suppose that this phenom-
enon indicates that one of the processes by which
mineral appears in the stone is its completely inde-
pendent formation. In contrast, appearance of wedd-
elite and whewellite is most likely provided by their
simultaneous growth, because these two phases form-
ing oxalate stones frequently simultaneously are pres-
ent in the sample. Brushite has the biggest crystallite
size and the smallest value of relative standard
deviation that could be understood as indication of a
unified growth mechanism by which this mineral
appears in either single or multiphase phosphate
stones. Finally, the values of average crystallite sizes
found by us for oxalates and apatite kidney stones are
618 Environ Geochem Health (2011) 33:613–622
123
in good agreement with the previously reported data of
Ghosh et al. (2009).
When kidney stones are observed visually, they
usually exhibit more or less clear zonality (concentric
layers, lamellar structure, breccia-like structure, and
other). In order to correlate these visible-layered
features with the phase composition of the tested
samples, we applied scanning electron microscopy
imaging (SEM) and energy-dispersive X-ray spec-
troscopy (X-ray microanalysis) to polished sections
of 13 stones with visually obvious layered structure.
To enhance contrast provided by observed structure
of kidney stone at electron imaging, we used signal of
back-scattered electrons (BSE) which is roughly
proportional to the square of average atomic number
of the phase and therefore gives qualitative chemical
imaging of the observed object.
In Fig. 5, we present BSE images and EDS mapping
for four chosen stones. Figure 5a shows BSE image of
polished section of urate stone with an impurity of
whewellite. It is clearly seen that concentric type layers
of this stone posses alternating bright and dark contrast
zones in BSE image that indicates presence of heavier
chemical elements within the bright areas. On inset, we
show the EDS map of Ca distribution within the same
region confirming that an indeed brighter region
contains Ca while darker regions do not. Taking into
consideration that according to XRD data, this stone
consists of two main phases—uric acid (C5H4N4O3)
and whewellite (CaC2O4�H2O), and we conclude that
Fig. 4 The allocations of
the crystallite sizes for
typical biominerals
(a whewellite, b weddellite,
c hydroxylapatite, and
d uric acid). The ranges
(nm) are indicated on
X-axis
Environ Geochem Health (2011) 33:613–622 619
123

for this case, layered morphology does correlate with
the phase composition, i.e., the stone most likely grew
through alternating chronological steps at which either
uric acid or whewellite minerals were formed. Simi-
larly, we may understand the data presented in Fig. 5b
for phosphate stone consisted of hydroxylapatite and
whewellite. The concentric type layered structure is
clearly recognized in BSE image where darker narrow
zones do not contain P while enriched with C (see C-
and P-maps in the inset). Apparently, this stone was
formed through alternating growth of hydroxylapatite
(thicker sub-millimeter zones) and whewellite (thinner
zones). Differences in visible thickness of zones could
be explained either by variation of growth duration
which was available for each mineral or by their
different growth rates. BSE image of oxalate stone
composed of a mixture of whewellite (CaC2O4�H2O)
and weddellite (CaC2O4�2H2O) is presented in Fig. 5c.
In this case, we have breccia-like structure and not a
concentric one, but still grains appearing in the image
could be distinguished by their contrast. Interestingly,
in this case, chemical sensitivity of BSE imaging was
higher than that of EDS, and therefore, no difference in
distribution of Ca and O was found at mapping. But
still, like in two previous cases, morphology of the
stone correlated with the phase content, i.e., observed
distinguishable structural features correlated of the
stone correlated to its phase composition. In contrast to
these observations, we show in Fig. 5d BSE and light
microscopy (lower inset) images of urate stone com-
posed of uric acid (95.3%) and uric acid dihydrate
(4.7%). Remarkably, this stone has strongly pro-
nounced concentric layered structure easily recog-
nized under visible light, which could not be
Fig. 5 BSE images and EDS maps of four kidney stones:
a urate stone composed of uric acid (88.2%)and whewellite
(11.8%), inset—Ca-map; b phosphate stone composed of
hydroxylapatite (92.1%) and whewellite (7.9%), inset—C- and
P-maps; c oxalate stone composed of whewellite (76.1%) and
weddelite (13.9%), inset—O- and Ca-maps; d urate stone
composed of uric acid (96.3%) and uric acid dehydrate (3.7%),
inset—C-map (upper) and light microscopy image (lower)
620 Environ Geochem Health (2011) 33:613–622
123

distinguished neither by BSE imaging nor by X-ray
mapping in SEM. This happens because chemical
composition of two coexisting minerals forming this
stone is practically identical. The only difference is one
water molecule that is far below the sensitivity of
SEM-based techniques. But optical properties of the
observed concentric layers could be utilized for
successful structural analysis. And finally, taking into
consideration the quantities of co-existing phases and
visible sizes of layers, we suggest that in this specific
case, morphology has more complicated relation to a
phase composition: each layer represents rather a
mixture of co-existing phases with different rations
and, moreover, it may contain varying degree of
porosity or microinclusions. Similar phenomenon is
well known in mineralogy (agate structure, for
example).
Conclusion
In summary, we report here the results of quantitative
phase analysis performed with X-ray diffraction on
278 kidney stones from 275 patients treated at the
Hadassah Hebrew University Hospital in 2007–2010.
The tested stones ware classified into chemical
groups according to their phase compositions. Cal-
cium oxalates are the dominating type of kidney
stones. Moreover, calcium oxalates were dominant
mineral within all the mixtures of crystalline phases.
Whewellite was the most widespread biomineral
component composing the tested kidney stones.
Within the group of phosphate stones, hydroxylapa-
tite was dominant biomineral component (about 75%
over all phosphate containing stones). Urate phase
was composed of a pure uric acid in 52.7% of the
cases, and this phase was dominating within the
group of urate and oxalate-urate stones. The relative
errors in quantification of phase content are supposed
to be about 2–5% for the main phases and about
5–10% for the low-content components.
The crystallite size was calculated for all the
observed crystalline phases using XRD data. Apatite
exhibited the smallest crystallite size among all the
detected biominerals. It indicates a derived character
of apatite in the process of kidney stones formation.
Relation between phase composition and morpholog-
ical features observed in the tested kidney stones was
studied by using BSE imaging and EDS mapping.
We suppose that extended information about spatial
distribution of mineral phases and their crystallite
size might contribute to understanding of etiology of
the stone diseases.
When compared with the previously published
data, our results show close similarity to the statistics
found for the developed countries, but they differ
appreciably from the statistics of the regions with
unfavorable environment and living conditions.
We believe that characterization approach used in
the present work may be of practical interest for the
specialists analyzing kidney stones with XRD- and
SEM-based techniques. The obtained quantitative data
about phase composition of the kidney stones can be
useful to the specialists in the study of features of the
kidney stones distribution in the different regions.
References
Abboud, I. A. (2008). Mineralogy and chemistry of urinary
stones: Patients from North Jordan. Environmental Geo-chemistry and Health, 30, 445–463.
Abdel-Halim, R. E., & Abdel-Aal, R. E. (1999). Classification
of urinary stones by cluster analysis of ionic composition
data. Computer Methods and Programs in Biomedicine,58, 69–81.
Abdel-Halim, R. E., Al-Sibaai, A., & Baghlaf, A. O. (1993).
Ionic associations within 460 non-infections urinary
stones. A quantitative chemical analytical study applying
a new classification. Scandinavian Journal of Urology andNephrology, 27, 155–162.
Al-Naam, L. M., Baqir, Y., Rasoul, H., Susan, L. P., & Alk-
haddar, M. (1987). The incidence and composition of
urinary stones in southern Iraq. Saudi Medical Journal, 8,
456–461.
Atsmon, A., De Vries, A., & Frank, M. (1963). Uric acidlithisasis. New York, NY: Elsevier.
Bartoletti, R., Cai, T., Mondaini, N., Melone, F., Travaglini, F.,
Carini, M., et al. (2007). Epidemiology and risk factors in
urolithiasis. Urologia Intertationalis, 79, 3–7.
Chou, Y. H., Li, C. C., Wu, W. J., Juan, Y. S., Huang, S. P.,
Lee, Y. C., et al. (2007). Urinary stone analysis of 1000
patients in southern Taiwan. Kaohsiung Journal of Med-ical Sciences, 23, 63–66.
Chung, F. H. (1974). Quantitative interpretation of X-ray dif-
fraction patterns. I. Matrix-flushing method of quantitative
multicomponent analysis. Journal of Applied Crystallog-raphy, 7, 519–525.
Coe, F. L., Evan, A., & Worcester, E. (2005). Kidney stone dis-
ease. Journal of Clinical Investigations, 115, 2598–2608.
Corns, C. M. (1983). Infrared analysis of renal calculi: A
comparison with conventional techniques. Annals ofClinical Biochemistry, 20, 20–25.
Environ Geochem Health (2011) 33:613–622 621
123
De la Torre, A. G., & Aranda, M. A. G. (2003). Accuracy in
Rietveld quantitative phase analysis of Portland cements.
Journal of Applied Crystallography, 36, 1169–1176.
DIFFRACplus EVA http://www.bruker-axs.de/eva.html.
Dursun, I., Poyrazoglu, H. M., Dusunsel, R., Gunduz, Z.,
Gurgoze, M. K., Demirci, D., et al. (2008). Pediatric
urolithiasis: An 8-year experience of single centre. Inter-national Journal of Nephrology and Urology, 40, 3–9.
Fazil Marickar, Y. M., Lekshmi, P. R., Varma, L., & Koshy, P.
(2009). Elemental distribution analysis of urinary crystals.
Urological Research, 37, 277–282.
Ghosh, S., Basu, S., Chakraborty, S., & Mukherjee, A. K.
(2009). Structural and microstructural characterization of
human kidney stones from eastern India using IR spec-
troscopy, scanning electron microscopy, thermal study
and X-ray Rietveld analysis. Journal of Applied Crystal-lography, 42, 629–635.
Grygar, T., Frybort, O., Bezdieka, P., & Pekarek, T. (2008).
Quantitative analysis of antipyretics and analgesics in
solid dosage forms by powder X-ray diffraction. ChemiaAnalityczna, Chemical Analysis (Warszawa), 53,
187–200.
Herring, L. (1962). Observations on the analysis of 10, 000
urinary calculi. Journal of Urology, 88, 545–562.
Hillier, S. (2000). Accurate quantitative analysis of clay and
other minerals in sandstones by XRD: Comparison of a
Rietveld and a reference intensity ratio (RIR) method and
the importance of sample preparation. Clay Minerals, 35,
291–302.
Hossain, R. Z., Ogawa, Y., Hokama, S., Morozumi, M., &
Hatano, T. (2003). Urolithiasis in Okinawa, Japan: A
relatively high prevalence of uric acid stones. Interna-tional Journal of Urology, 10, 411–415.
Kanchana, G., Sundaramoorthi, P., & Jeyanthi, G. P. (2009).
Bio-chemical analysis and FTIR-spectral studies of arti-
ficially removed renal stone mineral constituents. Journalof Minerals & Materials Characterization & Engineering,8, 161–170.
Khan, A. S., Rai, M. E., Gandapur Pervaiz, A., Shah, A. H.,
Hussain, A. A., & Siddiq, M. (2004). Epidemiological risk
factors and composition of urinary stones in Riyadh Saudi
Arabia. Journal of Ayub Medical College, 16, 56–58.
Kleinman, J. G., Wesson, J. A., & Sudakoff, G. S. (2004).
Pathogenesis, pathophysiology, and classification. Clini-cal Reviews in Bone and Mineral Metabolism, 2,
187–207.
Kraus, W., & Nolze, G. (1996). POWDER CELL—A program
for the representation and manipulation of crystal struc-
tures and calculation of the resulting X-ray powder pat-
terns. Journal of Applied Crystallography, 29, 301–303.
Leonard, R. H. (1961). Quantitative composition of kidney
stones. Clinical Chemistry, 7, 546–551.
Mandel, N. S., & Mandel, G. S. (1989). Urinary tract stone
disease in the United States veteran population: II geo-
graphical variation in composition. Journal of Urology,142, 1516–1521.
Miller, N. L., & Lingeman, J. E. (2007). Management of kid-
ney stones. British Medical Journal, 334, 468–472.
Moe, O. W. (2006). Kidney stones: Pathophysiology and
medical management. The Lancet, 367, 333–344.
Nasir, S. J. (1999). The mineralogy and chemistry of urinary
stones from the United Arab Emirates. Qatar UniversityScience Journal, 18, 189–202.
Newman, A. W., & Byrn, S. R. (2003). Solid-state analysis of
the active pharmaceutical ingredient in drug products.
Drug Discovery Today, 8, 898–905.
Pak, C. Y. C., Poindexter, J. R., Adams-Huet, B., & Pearle, M.
S. (2003). Predictive value of kidney stone composition in
the detection of metabolic abnormalities. AmericanJournal of Medicine, 115, 26–32.
Parmar, M. S. (2004). Kidney stones. British Medical Journal,328, 1420–1424.
Singh, I. (2008). Renal geology (quantitative renal stone
analysis) by ‘Fourier transform infrared spectroscopy’.
International Urology and Nephrology, 40, 595–602.
Smith, C. L. (1998). Renal stone analysis: Is there any clinical
value? Current Opinion in Nephrology and Hypertension,7, 703–709.
Sours, R. E., & Swift, J. A. (2004). The relationship between
uric acid crystals and kidney stone disease. ACA Trans-actions, 39, 83–89.
Stephenson, G. A., Forbes, R. A., & Reutzel-Edens, S. M.
(2001). Characterization of the solid state: quantitative
issues. Advanced Drag Delivery Reviews, 48, 67–90.
The International Centre for Diffraction Data, http://www.icdd.
com/products/pdf4.htm.
Tobias, P., & Croarkin, C. (Eds.). (2006). NIST/SEMATECHEngineering Statistics Internet Handbook, NationalInstitute of Standards and Technology. Washington: US
Dept. of Commerce.
Tosukhowong, P., Boonla, C., Ratchanon, S., Tanthanuch, M.,
Poonpirome, K., Supataravanich, P., et al. (2007). Crys-
talline composition and etiologic factors of kidney stone
in Thailand: Update 2007. Asian Biomedicine, 1, 87–95.
Trinchieri, A., Rovera, F., Nespoli, R., & Curro, A. (1996).
Clinical observations on 2086 patients with upper urinary
tract stone. Archivio Italiano di Urologia, Andrologia, 64,
251–262.
Uvarov, V., & Popov, I. (2007). Metrological characterization
of X-ray diffraction methods for determination of crys-
tallite size in nano-scale materials. Materials Character-ization, 58, 883–891.
Uvarov, V., & Popov, I. (2008). Development and metrological
characterization of quantitative X-ray diffraction phase
analysis for the mixtures of clopidogrel bisulphate poly-
morphs. Journal of Pharmaceutical and BiomedicalAnalysis, 46, 676–682.
Zaidman, J. L., Eidelman, A., Pinto, N., Negelev, S., & Assa,
S. (1986). Trends in urolithiasis in various ethnic groups
and by age, in Israel. Clinica Chimica Acta, 160, 87–92.
622 Environ Geochem Health (2011) 33:613–622
123