WORLD INVESTMENT DIRECTORY - UNCTAD
371
World Investment Direct UNITED NATIONS CONFERENCE ON TRADE AND DEVELOPMENT WORLD INVESTMENT DIRECTORY Volume X Africa Part 2 of 2 Country Profiles (Liberia to Zimbabwe) UNITED NATIONS 2008
-
Upload
khangminh22 -
Category
Documents
-
view
0 -
download
0
Transcript of WORLD INVESTMENT DIRECTORY - UNCTAD

WorldInvestment
Direct
UNITED NATIONS CONFERENCE ON TRADE AND DEVELOPMENT
WORLDINVESTMENT
DIRECTORY
Volume XAfrica
Part 2 of 2Country Profiles (Liberia to Zimbabwe)
UNITED NATIONS
2008

UNITED NATIONS CONFERENCE ON TRADE AND DEVELOPMENT
World Investment Directory
Volume X Africa 2008
Part 2 of 2
UNITED NATIONS
New York and Geneva, 2008

World Investment Directory Volume X Africa 2008
ii
Note
UNCTAD’s Division on Investment, Technology and Enterprise Development serves as the United Nations focal point for all matters of foreign direct investment (FDI) and transnational corporations (TNCs). The division seeks to further the understanding of TNCs and their contribution to development, and to create an enabling environment for international investment and enterprise development. The work of the division is carried out through intergovernmental deliberations, policy analysis and research, technical assistance activities, seminars, workshops and conferences.
Neither the designations employed nor the presentation of data or other information in this publication imply the expression of any opinion whatsoever on the part of the Secretariat of the United Nations concerning the legal status of any country, territory or area or of its authorities, or concerning the delimitation of its frontiers or boundaries. The designations of countries and territories in the tables and text do not necessarily express a judgement about the stage of development reached. Furthermore, the term “country” used in this study also refers, as appropriate, to territories or areas.
All the data in this publication have been obtained by the United Nations from sources believed by it to be accurate and reliable. Because of the possibility of human and mechanical error, as well as other factors, however, all the data are provided “as are” without warranty of any kind, and the United Nations cannot vouch for their accuracy, timeliness, completeness, merchantability or fitness for any particular purpose.
The following conventions have been used in the tables and text of this volume:
Two dots (..) imply that data are either not available or not separately available, unless otherwise specified in the table notes.
A hyphen (-) indicates that the amount is nil or negligible, unless otherwise specified in the table notes.
The totals appearing in the country tables represent the sums of the data in the tables, unless otherwise specified in the table notes. When data are unavailable, as indicated by two dots (..), the total will be equal to the sum of only those data that are available. The sum of two entries, one of which is not available (..) and the other of which is nil or negligible (-), will also be nil or negligible (-).
In all tables, the unavailability of data for an entire line results in the suppression of that line. As a result, the size of the tables varies between countries.
A slash (/) between dates indicates a financial year, for example, 2004/2005.
The use of a dash (–) between dates indicates the full period involved, including the beginning and end years.
UNCTAD/ITE/IIT/2007/5
UNITED NATIONS PUBLICATION
Sales No. E.08.II.D.3
ISBN 978-92-1-112733-1
Copyright © United Nations, 2008 All rights reserved

iii
Preface
Foreign direct investment (FDI) continues to gain in importance as a form of international economic transactions and as an instrument of international economic integration. World FDI inflows exceeded $1.3 trillion in 2006. The rate of growth of worldwide FDI inflows in the past two decades has substantially exceeded that of worldwide gross domestic product (GDP), exports and domestic investment. The number of transnational corporations (TNCs) increased significantly, to some 78,000 parent companies (with 780,000 foreign affiliates) in 2006. The sales of these affiliates amounted to about $25 trillion in 2006. As a result, TNCs account for an increasing share and, in some cases, a substantial part of the assets, employment, domestic capital formation, research and development, sales and trade of many countries. Through the continued development of their increasingly integrated international productions systems, TNCs have become one of the driving forces of integration in the world economy.
Despite the increasing importance of FDI in the world economy, published sources or readily accessible databases that provide comparable and accurate data on the investments and other activities of TNCs are scarce. The World Investment Directory series of UNCTAD is an attempt to centralize in the United Nations data-gathering efforts to measure systematically FDI, the activities of TNCs and related variables in the world economy. Accordingly, the purpose of the World Investment Directory and its database is to assemble comprehensive data and information on FDI, operations of TNCs, basic financial data on the largest TNCs, the legal framework in which such investment takes place and selected bibliographic information about FDI and TNCs in individual countries.
The present World Investment Directory publication series consists of the following volumes:
Volume I. Asia and the Pacific (United Nations publication, Sales No. E.92.II.A.11)
Volume II. Central and Eastern Europe (United Nations publication, Sales No. E.93.II.A.1)
Volume III. Developed Countries (United Nations publication, Sales No. E.93.II.A.9)
Volume IV. Latin America and the Caribbean (United Nations publication, Sales No. E.94.II.A.10)
Volume V. Africa (United Nations publication, Sales No. E.97.II.A.1)
Volume VI. West Asia (United Nations publication, Sales No. E.97.II.A.2)
Volume VII. Asia and the Pacific, Part I and Part II (United Nations publication, Sales No. E.00.II.D.1)
Volume VIII. Central and Eastern Europe 2003 (United Nations publication, Sales No. E.03.II.D.24)
Volume IX Latin America and the Caribbean 2004 (United Nations publication, Sales No. E.04.II.D.32)
The present publication covers 53 economies of the African region: Algeria, Angola, Benin, Botswana, Burkina Faso, Burundi, Cameroon, Cape Verde, Central African Republic, Chad, Comoros, Congo, Côte d’Ivoire, the Democratic Republic of the Congo, Djibouti, Egypt, Equatorial Guinea, Eritrea, Ethiopia, Gabon, Gambia, Ghana, Guinea, Guinea-Bissau, Kenya, Lesotho, Liberia, Libyan Arab Jamahiriya, Madagascar, Malawi, Mali, Mauritania, Mauritius, Morocco, Mozambique, Namibia, Niger,

World Investment Directory Volume X Africa 2008
iv
Nigeria, Rwanda, Sao Tome and Principe, Senegal, Seychelles, Sierra Leone, Somalia, South Africa, Sudan, Swaziland, Togo, Tunisia, Uganda, United Republic of Tanzania, Zambia and Zimbabwe. Profiles on all these countries are contained in this volume, based on data available to the secretariat.
Data are presented on both inward and outward flows and stocks of FDI and operations of TNCs. Basic information is provided on the largest TNCs in and from the countries and on the regulatory framework affecting FDI, organized by country. These are based on information available as of December 2007. It is the intention of UNCTAD to update the World Investment Directory series regularly, and country profiles contained in each volume of this series are regularly updated and placed on the UNCTAD’s FDI statistics website (www.unctad.org/fdistatistics). It is hoped that, as work progresses in this area, Governments will make it possible to enhance the frequency and scope of collection and quality of the data and information provided.
It is a widely recognized problem in research on FDI and TNCs that the statistics on them suffer from lack of comparability across sources and countries. The user is thus advised to read the technical introduction to this volume, definitions and sources in each country profile, and the explanatory notes at the end of each table. In presenting the national data on FDI, it is hoped that the need to harmonize these statistics in accordance with internationally accepted definitions will become more evident and inspire efforts at the national, regional and international levels to meet this difficult but necessary objective. UNCTAD provides technical assistance to efforts towards achieving this objective.
The World Investment Directory aims at becoming a standard reference series for policymakers, especially in developing countries, and for researchers and others in academia, governmental, intergovernmental and non-governmental organizations and the private sector who need to gain an understanding of the character, trends and patterns of FDI and TNC activities, and require reliable information as the basis for the formulation and monitoring of policies on FDI and TNCs.
This series has been prepared by a project team led by Masataka Fujita under the supervision of Anne Miroux. The principal officer responsible for the production of this volume was Hilary Nwokeabia, who oversaw the development of the volume at various stages. The other members of the team were Mohamed Chiraz Baly, Bradley Boicourt, John Bolmer, Jovan Licina and Lizanne Martinez. Hamed El-Kady, Justin Fisher, Torbjorn Fredrikkson, Joachim Karl, Hafiz Mirza, Jean-François Outreville, Thomas Pollan, Astrit Sulstarova and Aimable Uwizeye-Mapendano commented on the final draft. Production assistance was provided by Séverine Excoffier and Katia Vieu. Abraham Negash and Eric Kehinde Ogunleye contributed to the sections on regulatory frameworks for investment. Teresita Sabico did the desktop publishing for the volume. Many officials in central banks, statistical offices, investment promotion agencies and other government offices in Africa contributed to the volume through the provision of data.

v
COUNTRY PROFILES
Algeria ..................................................................................................................................................... 61 Angola ..................................................................................................................................................... 77 Benin ....................................................................................................................................................... 87Botswana ................................................................................................................................................. 97Burkina Faso.......................................................................................................................................... 109 Burundi.................................................................................................................................................. 119 Cameroon .............................................................................................................................................. 129 Cape Verde ............................................................................................................................................ 141 Central African Republic....................................................................................................................... 157 Chad ...................................................................................................................................................... 167 Comoros ................................................................................................................................................ 177 Congo .................................................................................................................................................... 185 Congo, Democratic Republic of the ...................................................................................................... 195 Côte d’Ivoire.......................................................................................................................................... 205 Djibouti.................................................................................................................................................. 217 Egypt ..................................................................................................................................................... 227 Equatorial Guinea.................................................................................................................................. 243 Eritrea .................................................................................................................................................... 251 Ethiopia ................................................................................................................................................. 259 Gabon .................................................................................................................................................... 271 Gambia .................................................................................................................................................. 283 Ghana .................................................................................................................................................... 293 Guinea ................................................................................................................................................... 309 Guinea-Bissau ....................................................................................................................................... 319 Kenya .................................................................................................................................................... 327 Lesotho .................................................................................................................................................. 343 Liberia ................................................................................................................................................... 355 Libyan Arab Jamahiriya ........................................................................................................................ 367 Madagascar............................................................................................................................................ 379 Malawi................................................................................................................................................... 397 Mali ....................................................................................................................................................... 409 Mauritania ............................................................................................................................................. 419 Mauritius ............................................................................................................................................... 427 Morocco ................................................................................................................................................ 443 Mozambique.......................................................................................................................................... 465 Namibia ................................................................................................................................................. 479 Niger...................................................................................................................................................... 493 Nigeria ................................................................................................................................................... 505 Rwanda.................................................................................................................................................. 523 Sao Tome and Principe.......................................................................................................................... 531 Senegal .................................................................................................................................................. 539 Seychelles.............................................................................................................................................. 551 Sierra Leone .......................................................................................................................................... 563 Somalia.................................................................................................................................................. 573 South Africa .......................................................................................................................................... 581 Sudan..................................................................................................................................................... 603 Swaziland .............................................................................................................................................. 615 Togo ...................................................................................................................................................... 627 Tunisia ................................................................................................................................................... 637 Uganda .................................................................................................................................................. 655 United Republic of Tanzania................................................................................................................. 667 Zambia................................................................................................................................................... 685 Zimbabwe.............................................................................................................................................. 699


Liberia
355
Liberia
A. Definitions and sources of data
The data on foreign direct investment (FDI) in Liberia were gathered from the tapes provided by the International Monetary Fund in its balance-of-payment statistics, the Organization for Economic Co-operation and Development, the Development Assistance Committee and International Development Statistics On-line Databases.
The Government of Liberia has implemented a series of reforms to reconstruct the country, improve financial management, strengthen the judiciary, combat corruption, and provide technical assistance to Liberians to help them manage their economy. The Liberian authorities have taken steps to improve fiscal discipline.
Efforts to work within integration schemes, international agreements and market access initiatives provide non-commercial risk coverage for foreign investors in the country. Liberia signed to the Convention on the Settlement of Investment Disputes between State and Nationals of other States on 19 September 1968. Liberia also belongs to the Economic Community of West African States, the African Union, New Partnership for Africa's Development and the Multilateral Investment Guarantee Agency. The country enjoys large preferential access to world markets under special access and duty reduction programmes. Among these are the generalized system of preferences for the least developed countries, the Everything But Arms initiative by the European Union, the Cotonou Agreement for renegotiating the partnership links between the African, Caribbean and Pacific countries with the EU and the United States' market access initiative for African countries - the African Growth and Opportunity Act.
World Investment Directory Volume X Africa 2008
356
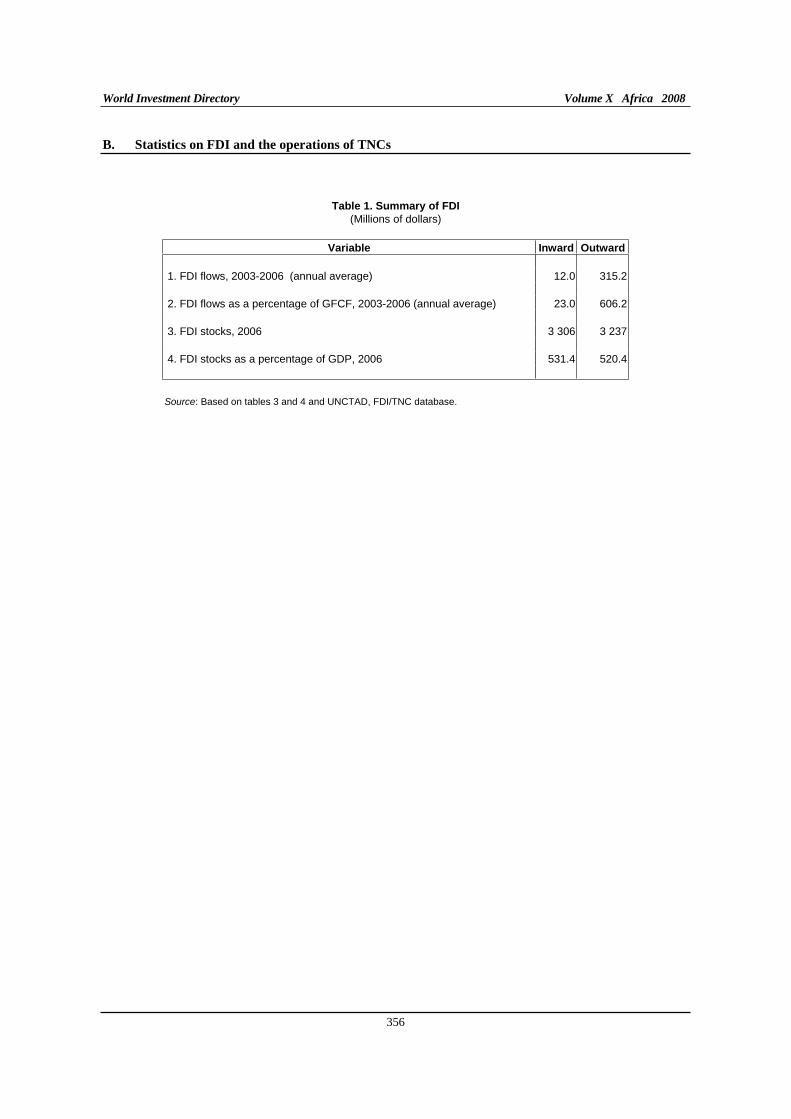
B. Statistics on FDI and the operations of TNCs
Table 1. Summary of FDI
(Millions of dollars)
Variable Inward Outward
1. FDI flows, 2003-2006 (annual average) 12.0 315.2
2. FDI flows as a percentage of GFCF, 2003-2006 (annual average) 23.0 606.2
3. FDI stocks, 2006 3 306 3 237
4. FDI stocks as a percentage of GDP, 2006 531.4 520.4
Source: Based on tables 3 and 4 and UNCTAD, FDI/TNC database.

Liberia
357
Table 3. FDI flows, by type of investment, 1980-2006
(Millions of dollars)
Inward investment Outward investment
Reinvested Reinvested
Year Equity earnings Other Total Equity earnings Other Total
1980 .. .. .. 71.9 .. .. .. 231.2
1981 .. .. .. 288.0 .. .. .. 40.7
1982 34.8 .. .. 312.9 .. .. .. 161.2
1983 41.8 2.5 4.8 49.1 .. .. .. 21.1
1984 24.9 1.8 9.5 36.2 .. .. .. 59.3
1985 0.3 1.7 - 18.2 - 16.2 .. .. .. 245.0
1986 - 16.5 .. .. - 16.5 .. .. .. - 264.8
1987 38.5 .. .. 38.5 .. .. 40.3
1988 .. .. .. 290.2 .. .. .. 194.5
1989 .. .. .. 656.0 .. .. .. 45.4
1990 .. .. .. 225.2 .. .. .. - 3.1
1991 .. .. .. 8.4 .. .. .. 365.6
1992 .. .. .. - 10.9 .. .. .. 55.2
1993 .. .. .. - 53.6 .. .. .. 96.6
1994 .. .. .. 17.4 .. .. .. 95.8
1995 .. .. .. 4.6 .. .. .. - 43.8
1996 .. .. .. - 132.1 .. .. .. - 59.5
1997 .. .. .. 213.8 .. .. .. 502.1
1998 .. .. .. 190.3 .. .. .. - 729.4
1999 .. .. .. 256.3 .. .. .. 310.6
2000 .. .. .. 20.8 .. .. .. 779.9
2001 .. .. .. 8.3 .. .. .. - 292.0
2002 .. .. .. 2.8 .. .. .. 402.9
2003 .. .. .. 372.2 .. .. .. 173.0
2004 .. .. .. 236.9 .. .. .. 304.5
2005 .. .. .. - 479.5 .. .. .. 436.8
2006 .. .. .. - 81.7 .. .. .. 346.4 Source: UNCTAD, FDI/TNC database (www.unctad.org/statistics). Notes: Data on inflows are from OECD for 1980-1982, 1988-1999 and 2003-2005; IMF for 1983-1987, the IMF Country Report,May 2005 No. 05/166 for 2002 and proxy data based on investment reported by Croatia and Japan for 2005. Data on outflows are proxy data for 1980-2002 and estimates for 2004-2005. Proxy data are based on investments reported by the following economies: 1980-1984 Brazil and the United States. 1985-1988 and 1990 Belgium and Luxembourg, Brazil and the United States. 1989 and 1991 Belgium and Luxembourg, Brazil, France and the United States. 1992-1993 Belgium and Luxembourg, Brazil, China, France and the United States. 1994 Belgium and Luxembourg, Brazil, China, France, Malaysia, Pakistan and the United States. 1995 Belgium and Luxembourg, China, France, Germany, Malaysia and the United States. 1996 France, Germany, Malaysia, Portugal and the United States. 1997 Belgium and Luxembourg, France, Portugal and the United States. 1998 Belgium and Luxembourg, Croatia, Germany, Portugal, Saudi Arabia and the United States. 1999 Belgium and Luxembourg and the United States. 2000 Belgium and Luxembourg, France and the United States. 2001 Belgium and Luxembourg, Brazil, Bulgaria, Chile, France, Germany, Latvia and the United States. 2002 Brazil, Bulgaria, Chile, Cyprus, France, Germany, Kazakhstan, Latvia, Sweden and the United States. 2003 Bulgaria, Cyprus, Germany, Kazakhstan and the United States. 2004 Brazil, Bulgaria, Cyprus, Germany, Kazakhstan, Latvia, Romania and the United States. 2005 Brazil, Bulgaria, Chile, Cyprus, Kazakhstan, Latvia and the United States. 2006 Brazil, Bulgaria, Estonia, Kazakhstan and Latvia.

World Investment Directory Volume X Africa 2008
358
Table 4. FDI stocks, by type of investment, 1980-2006
(Millions of dollars)
Inward investment Outward investment
Reinvested Reinvested
Year Equity earnings Other Total Equity earnings Other Total
1980 .. .. .. 868.2 .. .. .. 48.0
1981 .. .. .. 1 156.2 .. .. .. 74.0
1982 .. .. .. 1 469.1 .. .. .. 72.0
1983 .. .. .. 1 518.2 .. .. .. 74.0
1984 .. .. .. 1 554.4 .. .. .. 126.0
1985 .. .. .. 1 538.2 .. .. .. 361.0
1986 .. .. .. 1 521.7 .. .. .. 87.0
1987 .. .. .. 1 560.2 .. .. 212.0
1988 .. .. .. 1 850.3 .. .. .. 343.0
1989 .. .. .. 2 506.3 .. .. .. 430.0
1990 .. .. .. 2 731.6 .. .. .. 453.0
1991 .. .. .. 2 740.0 .. .. .. 935.0
1992 .. .. .. 2 729.1 .. .. .. 1 181.0
1993 .. .. .. 2 675.5 .. .. .. 1 229.0
1994 .. .. .. 2 692.9 .. .. .. 1 243.0
1995 .. .. .. 2 697.5 .. .. .. 1 370.0
1996 .. .. .. 2 565.4 .. .. .. 1 030.7
1997 .. .. .. 2 779.2 .. .. .. 1 466.3
1998 .. .. .. 2 969.5 .. .. .. 713.4
1999 .. .. .. 3 225.8 .. .. .. 1 116.6
2000 .. .. .. 3 246.6 .. .. .. 2 187.5
2001 .. .. .. 3 254.9 .. .. .. 1 631.1
2002 .. .. .. 3 257.7 .. .. .. 1 741.4
2003 .. .. .. 3 629.9 .. .. .. 1 979.5
2004 .. .. .. 3 866.7 .. .. .. 2 273.5
2005 .. .. .. 3 387.3 .. .. .. 2 929.5
2006 .. .. .. 3 305.5 .. .. .. 3 236.8
Source: UNCTAD, FDI/TNC database (www.unctad.org/statistics). Notes: Data on inward stock are estimated by accumulating inflows since 1970. Outward stock are proxy data for 1980-2002 and estimates for 2004-2005. Proxy data are based on investments reported by the following economies: 1980-1993 United States. 1994 Chile, Colombia, Indonesia, United States and Venezuela. 1995 Brazil, Chile, Colombia, Indonesia, United States and Venezuela. 1996 Chile, Colombia, Indonesia, Portugal, the United Status and Venezuela. 1997-1999 Chile, Colombia, Portugal, United Status and Venezuela. 2000 Brazil, Chile, Colombia, Croatia, Latvia, Portugal, the United States and Venezuela. 2001 Chile, Croatia, Latvia, Portugal, the United States and Venezuela. 2002 Chile, Kazakhstan, Latvia, Portugal, the United States and Venezuela. 2003 Chile, Kazakhstan, Latvia, Portugal and the United States. 2004-2005 Chile, Croatia, Kazakhstan, Latvia and the United States. 2006 Kazakhstan, Latvia and the United States.

Liberia
359
Table 6. FDI flows in the host economy, by geographical origin, 1995-2006(Millions of dollars)
Economy 1995 1996 1997 1998 1999 2000 2001 2002 2003 2004 2005 2006
Belgium/Luxembourg 26.0 5.2 - 33.8 - 12.2 - 5.3 8.3 - - - - - -China - - - - - - - - 0.4 0.6 8.7 -Croatia 2.7 0.2 11.5 - 9.4 1.3 - 0.1 33.7 13.7 - 27.2 2.9 - 24.9 17.8Cyprus - - - - - - - 8.3 - - - -Denmark - - - - - - - - - - 1.0 - 16.5France - 22.3 - 7.7 197.8 - 7.8 - 0.9 - 10.7 - 2.3 - 45.9 - 42.3 20.1Germany 4.2 - 21.3 - 75.5 39.2 - - 242.5 - 196.7 60.9 37.3 7.5 10.0Israel - - - - - 19.5 - 5.1 10.3 - 11.4 - 7.6 - 10.6 -Japan - - - - - - - - - - - 288.1 - 99.5Latvia - - - - 17.6 - - - - - -Malaysia 2.8 0.8 2.1 - - - - - - - - -Netherlands - - - - 7.8 - - - - - - - -Portugal - - 0.4 - - - - - - - - - -Sweden - 9.5 - - - - - - 14.6 - 0.9 2.9 15.5 - -United States 27 - 17 - 9 13 35 - 218 - 60 - 260 47 - 12 102 - 101 Source: UNCTAD, FDI / TNC database. Note: Data is based on the information reported by the economies listed above.
Table 9. FDI flows abroad, by geographical destination, 1995-2006(Millions of dollars)
Economy 1995 1996 1997 1998 1999 2000 2001 2002 2003 2004 2005 2006
Armenia - - - - - 0.6 - 0.5 - - - - -Belgium/Luxembourg - 19.2 - 14.7 22.2 11.7 237.7 3.6 - - - - -Brazil - - - - - - 0.1 0.1 - 0.0 0.4 0.1Bulgaria - - - - - 0.1 0.1 0.1 - 0.0 0.5 0.8 0.4 0.1Chile - - - - - - 7.9 0.1 - - 0.0 7.7China 12.5 - - - - - - - - - - -Croatia - - - 2.0 - - - - - - - -Cyprus - - - - - - - 12.4 15.0 2.6 2.3 -Czech Republic - - - - - - - 0.0 - - - - -France 25.0 12.8 12.4 - 22.4 - 7.4 - 4.5 - 9.4 - 2.3 2.5 1.2 1.3Germany 23.7 - 0.7 - - 1.1 - - 13.4 - 6.6 9.0 22.4 - 3.7 - 41.4Kazakhstan - - - - - - - 34.7 74.4 128.1 335.9 338.8Latvia - - - - - - 1.2 - 0.6 4.7 - - 0.9 - 2.8 - 2.0Lithuania - - - 0.0 0.0 - 0.0 - - - - - - -Malaysia 6.8 - - - - - - - - - - -Portugal - - 0.1 1.3 0.6 - - - - - - - -Korea, Republic of - - - 0.0 - 0.0 - - - - 0.0 - 0.1Romania - - - - - - - - - 2.5 - -Saudi Arabia - - - 1.0 - - - - - - - -Sweden - - - - - - - 279.9 - - - -United States - 96 - 71 474 - 753 299 550 - 312 87 74 152 106 100 Source: UNCTAD, FDI / TNC database. Note: Data is based on the information reported by the economies listed above.

World Investment Directory Volume X Africa 2008
360
Table 12. FDI stocks in the host economy, by geographical origin, 1994 - 2006(Millions of dollars)
Economy 1994 1995 1996 1997 1998 1999 2000 2001 2002 2003 2004 2005 2006
Brazil - - - - - - - 149.6 133.7 81.4 95.6 119.9 -Canada 117.6 38.1 46.0 42.0 - - - - - - - - -China - - - - - - - - - 5.8 6.4 16.0 -Croatia - - - - - - 4.5 - 255.0 275.5 305.0 262.7 288.9Denmark - - - - - - - - - - 158.8 157.5 128.6Germany 125.3 101.2 184.6 147.3 186.5 111.5 134.9 163.0 68.2 60.6 12.3 3.5 -Israel - - - - - - 25.1 22.7 28.5 7.1 29.8 8.7 30.7Latvia - - - 176.7 132.7 129.5 - - - - - - -Malaysia 0.8 3.5 4.3 4.4 4.5 4.5 4.5 4.5 4.5 4.5 4.5 4.5 -Norway - - - - 66.7 635.6 645.5 637.1 715.1 799.0 1 211.4 1 104.0 -Slovenia 17.1 22.2 28.1 28.5 22.7 24.1 23.8 21.0 24.9 44.4 70.9 -United Kingdom 112.5 - - - - - - - - - - - -United States 215 242 224 214 227 - 225 - 819 - 547 -1 344 273 272 378 289 Source: UNCTAD, FDI / TNC database. Note: Data is based on the information reported by the economies listed above.
Table 15. FDI stocks abroad, by geographical destination, 1994 - 2006(Millions of dollars)
Economy 1994 1995 1996 1997 1998 1999 2000 2001 2002 2003 2004 2005 2006
Armenia - - - - - - 0.6 0.1 0.1 0.1 0.1 0.1 0.1Brazil - 224.0 - - - - 140.1 - - - - - -Bulgaria - - - - - 0.2 0.1 0.3 1.2 2.2 2.9 2.8 3.2Canada - 3.7 - - - - - - - - - - -Chile 0.5 0.5 0.5 0.5 0.5 0.5 0.5 8.4 8.5 8.5 8.5 8.6 16.3Colombia 0.4 0.4 0.4 1.7 2.5 12.8 14.9 - - - - - -Croatia - - - - - 2.0 2.1 - - - 26.5 31.2 -Czech Republic - - - - - - 0.6 0.6 - - - - -Estonia - - - - - - - - - 0.0 0.0 0.0 2.1Indonesia 30.4 30.4 31.0 - - - - - - - - - -Kazakhstan - - - - - - - - 43.3 204.8 332.9 668.7 1 007.6Latvia - - - - - - 20.7 6.5 32.3 35.5 18.6 17.0 15.7Portugal - - 5.1 0.4 0.7 0.6 0.5 0.5 0.6 0.7 - - -Korea, Republic of - 1.1 1.1 1.1 1.2 1.1 1.1 1.1 1.1 1.1 1.2 1.2 1.3Saudi Arabia - - - - - - 26.0 - - - - 26.0 -United States 1 210 1 113 992 1 462 708 1 099 2 007 1 614 1 655 1 730 2 062 2 174 1 477Venezuela 1.7 1.7 1.7 1.7 1.7 1.7 1.7 1.7 1.7 - - - -Viet Nam - - - 0.2 0.2 0.2 0.2 0.2 0.2 - - - - Source: UNCTAD, FDI / TNC database. Note: Data is based on the information reported by the economies listed above.

Liberia
361
Table 21. The number of foreign affiliates of home-based transnational corporations, by geographical location abroad, 1991-2003
Economy 1991 1992 1993 1994 1995 1996 1997 1998 1999 2000 2001 2002 2003
Armenia .. .. .. .. .. .. .. .. 1 .. .. .. ..Hong Kong, China 8 7 6 4 9 8 4 .. .. .. .. .. ..Indonesia .. 6 .. 7 7 8 .. .. .. .. .. .. ..Romania .. .. .. .. .. .. .. .. .. .. .. 34 ..United States 19 32 28 26 26 25 7 8 7 7 7 7 5Source: UNCTAD, FDI/TNC database. Note: Data are based on information reported by the economies listed above.
Table 23. The number of affiliates of foreign TNCs in the host economy, by geographical origin, 1993-2005
Economy 1993 1994 1995 1996 1998 1999 2000 2001 2002 2003 2004 2005
Germany 16 14 12 14 13 13 14 13 13 5 4 4 3Republic of Korea .. .. .. 1 1 1 1 1 1 1 1 1 1United States 15 13 14 13 13 13 20 23 26 23 18 26 ..Source: UNCTAD, FDI/TNC database. Note: Data are based on information reported by the economies listed above.
Table 28. Assets of foreign affiliates of home-based transnational corporations, by geographical location abroad, 1992-2004
(Millions of dollars) Economy 1992 1993 1994 1995 1996 1997 1998 1999 2000 2001 2002 2003 2004
Hong Kong, China 77.9 34.9 7.4 72.0 107.7 93.7 .. .. .. .. .. .. ..United States 746 746 885 829 383 339 818 1 060 374 388 349 .. 335Source: UNCTAD, FDI/TNC database. Note: Data are based on information reported by the economies listed above. Table 30. Assets of affiliates of foreign TNCs in the host economy, by geographical origin, 1992-2004
(Millions of dollars) Economy 1992 1993 1994 1995 1996 1997 1998 1999 2000 2001 2002 2003 2004
Germany 433.7 347.6 387.4 348.8 385.9 334.8 358.6 301.4 186.1 264.4 .. .. ..United States 568 378 .. 887 1 437 1 622 938 .. 4 135 4 339 3 793 3 077 2 756Source: UNCTAD, FDI/TNC database. Note: Data are based on information reported by the economies listed above.
Table 33. Employment of foreign affiliates of home-based transnational corporations, by geographical location abroad, 1990-2002
(Thousands of employees) Economy 1990 1991 1992 1993 1994 1995 1996 1997 1998 1999 2000 2001 2002
Indonesia .. .. 0.3 .. 0.3 .. 0.3 .. .. .. .. .. ..United States 0.8 0.3 0.5 0.5 0.4 0.3 0.3 0.3 .. .. 0.4 0.3 0.4Source: UNCTAD, FDI/TNC database. Note: Data are based on information reported by the economies listed above.
Table 35. Employment of affiliates of foreign TNCs in the host economy, by geographical origin, 1992-2004
(Thousands of employees) Economy 1992 1993 1994 1995 1996 1997 1998 1999 2000 2001 2002 2003 2004
Germany .. 1.0 1.0 1.0 2.0 2.0 2.0 2.0 1.0 1.0 .. .. ..United States 0.5 0.4 0.5 0.3 0.3 .. .. 8.0 .. .. 7.6 8.2 9.9Source: UNCTAD, FDI/TNC database. Note: Data are based on information reported by the economies listed above.

World Investment Directory Volume X Africa 2008
362
Tables 38, 43, 48, 58 and 63. Wages and salaries, sales, value added, exports and imports of foreign affiliates of Liberian TNCs in the United States, 1993-2004
(Millions of dollars) Table no./Variable 1993 1994 1995 1996 1997 1998 1999 2000 2001 2002 2003 2004
38. Wages and salaries 18 13 12 9 13 .. .. 23 18 26 25 a 28 a
43. Sales 303 405 374 155 .. .. .. 177 261 336 .. ..
48. Value added 21 79 66 -12 -9 .. .. -20 -22 32 a .. ..
58. Exports .. .. .. .. 55 .. 2 1 .. .. .. ..
63. Imports .. 140 .. 150 .. .. .. .. .. .. .. ..
Source: UNCTAD, FDI/TNC database.
Note: Data are based on information reported by the United States. a Data refer to majority-owned affiliates only.
Tables 40 and 50. Wages and salaries and value added of affiliates of United States TNCs in Liberia, 1993-2004
(Millions of dollars) Table no./Variable 1993 1994 1995 1996 1997 1998 1999 2000 2001 2002 2003 2004
40. Wages and salaries 5 15 16 4 13 .. 83 .. .. 88 95 119
50. Value added a .. 11 21 22 .. .. 6 .. .. 62 204 421
Source: UNCTAD, FDI/TNC database.
Note: Data are based on information reported by the United States. a Data refer to majority-owned affiliates only.
Table 45. Sales of affiliates of foreign TNCs in the host economy, by geographical origin, 1993-2004
(Millions of dollars) Economy 1993 1994 1995 1996 1997 1998 1999 2000 2001 2002 2003 2004
Germany 181.5 246.5 209.3 199.4 173.0 170.5 213.1 276.4 268.5 .. .. ..
United States 116 .. 149 .. 160 137 .. 1 689 1 620 1 345 1 329 1 897
Source: UNCTAD, FDI/TNC database.
Note: Data are based on information reported by the economies listed above.

Liberia
363
Table 87. Largest affiliates of home-based TNCs, 2007
(Millions of dollars and number)
Company Name Host Economy Industry Sales Employees
A. Industrial
.. .. .. .. ..
B. Tertiary
Novoship (U K) Ltd England Supporting transport activities 11.8 82
C. Finance and insurance Assets Employees
.. .. .. .. .. Source: Who Owns Whom database (https://solutions.dnb.com/wow), retrieved January 2008.
Table 88. Largest affiliates of foreign TNCs in the host economy, 2007
(Millions of dollars and number) Company Home economy Industry Sales Employees
A. Industrial
Liberia Cement Corporation Norway Mining and quarrying .. ..
B. Tertiary
Ace Navigation Inc Japan Water Transport .. ..
Anda Fpso Inc Japan Public administration .. ..
Arco Ireland Exploration Inc United Kingdom Other business activities .. ..
Arco Ireland Inc United Kingdom Other business activities .. ..
Baratta Shipping Ltd Japan Water Transport .. ..
Buccimazza Industrial Works Corporation Limited Italy Public administration .. ..
Castlerock Shipping Ltd. Japan Water Transport .. ..
DHL International (Liberia) Ltd. Germany Air transport .. ..
Escravos Fso Inc Japan Water Transport .. ..
F Corporation Ltd Japan Water Transport .. ..
Gotaas-Larsen Shipping Corporation Bermuda Other services .. ..
Hiro Shipping Inc. Japan Water Transport .. ..
Maersk Liberia Ltd Denmark Other services .. ..
T.Y. Eri Maritime Co., Ltd. Japan Water Transport .. ..
C. Finance and insurance Assets Employees
.. .. .. .. ..
Source: Who Owns Whom database (https://solutions.dnb.com/wow), retrieved January 2008.

World Investment Directory Volume X Africa 2008
364
C. Legal frameworks for transnational corporations
Liberia has adopted a number of national and international legal instruments to regulate the activities of the transnational corporations and foreign direct investors in the country. The key instruments applicable include:
I. National framework
Patent, Copyright and Trademark Law of 31 May 1972; effective on 12 August 1972. Source: Copyright Laws and Treaties of the World, vol. I., Liberian Supplement, 1987-1988.
The Investment Incentives Code of 1973. Source: Liberian Code of Laws Revised, 1976 edition. Title 8. Also in International Bureau of Fiscal Documentation ATS, suppi. No. 87, August 1993.
The Industrial Free-Zones Law of 1975. Source: Liberian Code of Laws Revised, 1976 edition. Title 8.
The General Business Law of 1975 as amended in 1993. Source: Liberian Code of Laws Revised, 1976 edition. Title 15.
Associations Law of 1976. Effective 3 January 1977. Source: Liberian Code of Laws Revised, 1976 edition. Title 6.
II. International Framework
A. Liberia is a party to the following multilateral and regional instruments:
Convention on the Settlement of Investment Disputes between States and Nationals of other States of 1965. Entered into force on 14 October 1966
Convention Establishing the Multilateral Investment Guarantee Agency of 1985, entered into force on 12 April 1988 (In the process of fulfilling membership requirements).
Fourth ACP - EEC Convention (Lome IV) of 1989, entered into force on 1 March 1990.
Revised Treaty of the Economic Community of West African States (ECOWAS) 1993.
Paris Convention for the Protection of Industrial Property of 1883 (Revised at Brussels in 1900, Washington in 1911, The Hague in 1925, London in 1934, Lisbon in 1958 and Stockholm in 1967, and as amended in 1979). Signed in 1994.
B. Bilateral treaties
1. Bilateral investment treaties for the protection and promotion of investments: Germany 1961, Switzerland 1963, France 1979, Belgium / Luxembourg 1985.
2. Bilateral treaties for the avoidance of double taxation: Sweden 1969, Germany 1970, Spain 1977, United States 1987.

Liberia
365
D. Sources of Information
Official
..
Secondary
Collier, Paul and Anke, Hoeffler (1995). "War, peace and private portfolio", in World Development, vol. 23, no 2, pp. 233-41.
Cooper, Neil (2002). "The role of demilitarisation in promoting democracy and prosperity in Africa", Chapter 6 in Brauer and Dunne (2000).
Economist Intelligence Unit (EIU) (various years). Country Profile: Liberia (London: EIU Ltd.).
___________ (various years). Country Report: Liberia (London: EIU Ltd.).
International Monetary Fund (IMF) (2006). IMF's Sub-Saharan Africa Regional Economic Outlook, March 10, 2006. (Washington D.C.: IMF).
Soderbom, M. and F. Teal (2004). "Size and Efficiency in Africa Manufacturing firms: Evidence from Firm-Level Panel Data." Journal of Development Economics, 73. pp 369 - 394.
United Nations Conference on Trade and Development (UNCTAD) (2002). FDI in the Least Developed Countries at a Glance (Geneva: UNCTAD/ITE/IIA/6).
___________(2005a). Investor-Disputes Arising from Investment Treaties: A Review. UNCTAD Series of International Investment Policies for Development (UNCTAD/ITE/IIT/2005/4).
___________(2005b). A Survey of Support by Investment Promotion Agencies to Linkages. Advisory Studies No. 18 (UNCTAD/ITE/IPC/2005/12).
____________(2005c). FDI in least developed countries at a glance: 2005/2006
(UNCTAD/ITE/IIA/2005/17).
United States Trade Representative (2006). 2006 Comprehensive Report on U.S. Trade and Investment
Policy Toward Sub-Saharan Africa and Implementation of the Africa Growth and Opportunity Act:
The Sixth of Eight Annual Reports, May 2006. (Washington D.C.: US Government).
World Bank/International Finance Corporation (2007). Doing Business 2008 Liberia (Washington D.C.: The World Bank Group).


Libyan Arab Jamahiriya
367
Libyan Arab Jamahiriya
A. Definitions and sources of data
A clear definition of foreign direct investment (FDI) in Libyan Arab Jamahiriya is not available; however, in the 1997 Law on encouraging of foreign capital investment, foreign capital is defined as the total financial value brought into the Great Jamahiriya whether owned by Libyans or foreigners to undertake an investment activity (Law No.5 for the year 1997). Project is defined as any economic enterprise established in accordance with this law. The result of its work is the production of goods for end or intermediate consumption, or investment goods, or the export or provision of service, or any other enterprise approved as such by the General People’s Committee. Investor is defined as any natural or juridical entity, national or non-national, investing in accordance with the provisions of this law. The data on FDI were gathered from the Central Bank of Libyan Arab Jamahiriya. The International Monetary Fund also provides data on FDI in the country in its balance-of-payment statistics.
Libyan Arab Jamahiriya is a State-dominated economy that depends on oil revenues. The United Nations managed to lift its sanctions on the country in 2003. Foreign participation in industrial ventures set up after 1970 is permitted on a minority basis if it leads to increased production over local requirements, introduction of the latest technology and cooperation with foreign firms in exporting the surplus production.
Libyan Arab Jamahiriya allows foreigners to invest directly in the country as part of an effort to reduce the Government's dominant role in production and services. But the Government has yet to formulate a privatization plan; reform its investment regime; or address cumbersome bureaucracy, poor legal protection for investment and an unpredictable policy environment. At the moment, only residents may hold foreign currency accounts. Payments for authorized imports are not restricted. All other payments require government approval. Repatriation and most capital transactions, including approval requirements for transactions for capital and money market instruments, credit operations, direct investment, and real estate are controlled.
The country has maintained a relationship with the Arab League and has continued to pursue closer bilateral ties with African countries. Libyan Arab Jamahiriya is a member of the New Partnership for Africa's Development and African Union. Italy, its main trading partner, is cementing political co-operation and boosting investment. Italy’s Agency for Export Credit Insurance helped the situation when it decided to write-off some debt and review its credit policy for the country. The prospect of lucrative contracts and investments, especially in the hydrocarbons sector, has also encouraged countries such as Australia, Canada and China to develop or strengthen their ties with Libyan Arab Jamahiriya. Libyan Arab Jamahiriya has an observer status at the World Trade Organization.

World Investment Directory Volume X Africa 2008
368
B. Statistics on FDI and the operations of TNCs
Table 1. Summary of FDI
(Millions of dollars)
Variable Inward Outward
1. FDI flows, 2003-2006 (annual average) 818.0 11.4
2. FDI flows as a percentage of GFCF, 2003-2006 (annual average) 24.8 0.3
3. FDI stocks, 2006 3 755 1 677
4. FDI stocks as a percentage of GDP, 2006 7.5 3.3
Source: Based on tables 3 and 4 and UNCTAD, FDI/TNC database.
Table 3. FDI flows, by type of investment, 1980-2006
(Millions of dollars)
Inward investment Outward investment
Reinvested Reinvested
Year Equity earnings Other Total Equity earnings Other Total
1980 .. 141.9 -1 231.2 -1 089.3 46.6 .. .. 46.6
1981 .. 142.9 - 887.0 - 744.1 25.3 .. .. 25.3
1982 .. 126.0 - 517.8 - 391.8 19.3 .. .. 19.3
1983 .. 136.8 - 463.4 - 326.6 .. .. .. ..
1984 .. .. - 16.9 - 16.9 .. .. .. ..
1985 .. .. 119.2 119.2 .. .. .. ..
1986 .. .. - 176.9 - 176.9 .. .. .. ..
1987 .. .. - 97.6 - 97.6 113.5 .. .. 113.5
1988 .. .. 98.0 98.0 56.0 .. .. 56.0
1989 .. .. 125.2 125.2 35.1 .. .. 35.1
1990 .. .. 158.9 158.9 105.2 .. .. 105.2
1991 91.9 .. .. 91.9 173.8 .. .. 173.8
1992 99.1 .. .. 99.1 - 150.6 .. .. - 150.6
1993 58.2 .. .. 58.2 - 479.4 .. .. - 479.4
1994 - 72.6 .. .. - 72.6 25.8 .. .. 28.0
1995 - 88.5 .. .. - 88.5 68.6 .. .. 82.9
1996 - 111.7 .. .. - 111.7 52.2 .. .. 63.3
1997 .. .. .. - 67.9 .. .. .. 284.0
1998 .. .. .. - 148.0 .. .. .. 295.0
1999 .. .. .. - 128.1 .. .. .. 226.0
2000 .. .. .. 141.0 .. .. .. 98.0
2001 .. .. .. - 113.0 .. .. .. - 174.6
2002 .. .. .. 145.0 .. .. .. - 136.0
2003 .. .. .. 143.0 .. .. .. 62.6
2004 .. .. .. 357.0 .. .. .. - 286.0
2005 .. .. .. 1 038.0 .. .. .. 128.0
2006 .. .. .. 1 734.0 .. .. .. 141.0
Source: UNCTAD, FDI/TNC database (www.unctad.org/statistics). Notes: Data on inflows are from the IMF for 1980-1989 and the Central Bank of Libya thereafter. Outflow data are from the IMF for 1980-1982 and 1987-1989 and the Central Bank of Libya thereafter.

Libyan Arab Jamahiriya
369
Table 4. FDI stocks, by type of investment, 1980-2006
(Millions of dollars)
Inward investment Outward investment
Reinvested Reinvested
Year Equity earnings Other Total Equity earnings Other Total
1980 .. .. .. 1 855.4 .. .. .. 870.1
1981 .. .. .. 1 111.3 .. .. .. 895.4
1982 .. .. .. 719.5 .. .. .. 914.7
1983 .. .. .. 392.8 .. .. .. 914.7
1984 .. .. .. 376.0 .. .. .. 914.7
1985 .. .. .. 495.2 .. .. .. 914.7
1986 .. .. .. 318.3 .. .. .. 914.7
1987 .. .. .. 311.9 .. .. .. 1 185.4
1988 .. .. .. 394.0 .. .. .. 1 180.5
1989 .. .. .. 519.1 .. .. .. 1 215.5
1990 .. .. .. 678.0 .. .. .. 1 320.8
1991 .. .. .. 769.9 .. .. .. 1 494.6
1992 .. .. .. 869.0 .. .. .. 1 344.0
1993 .. .. .. 927.2 .. .. .. 864.7
1994 .. .. .. 854.6 .. .. .. 892.7
1995 .. .. .. 766.1 .. .. .. 975.6
1996 .. .. .. 654.4 .. .. .. 1 038.9
1997 .. .. .. 586.5 .. .. .. 1 322.9
1998 .. .. .. 438.5 .. .. .. 1 617.9
1999 .. .. .. 310.4 .. .. .. 1 843.9
2000 .. .. .. 451.4 .. .. .. 1 941.9
2001 .. .. .. 338.4 .. .. .. 1 767.3
2002 .. .. .. 483.4 .. .. .. 1 631.3
2003 .. .. .. 626.4 .. .. .. 1 693.9
2004 .. .. .. 983.4 .. .. .. 1 407.9
2005 .. .. .. 2 021.4 .. .. .. 1 535.9
2006 .. .. .. 3 755.4 .. .. .. 1 676.9
Source: UNCTAD, FDI/TNC database (www.unctad.org/statistics). Data prior to 1986 are estimated by subtracting flows from the stock of 1986. 1986-1988 are based on the IMF. 1989-2006 are estimated by adding flows to the 1988 stock.

World Investment Directory Volume X Africa 2008
370
Table 6. FDI flows in the host economy, by geographical origin, 1995-2006
(Millions of dollars)
Economy 1995 1996 1997 1998 1999 2000 2001 2002 2003 2004 2005 2006
Belgium/Luxembourg - - - - - - - - - - - -
China - - - - - - - - 0.1 0.1 0.3 -
Cyprus - - - - - - - 1.0 17.5 0.8 0.4 -
Estonia - - - - - - - - - - 0.1 - 0.0 -
France 10.5 73.1 15.7 36.7 9.6 6.4 - 47.4 224.0 - 86.9 1.2 7.5 25.1
Germany 14.0 - 34.6 13.3 50.0 - - 210.3 - 248.4 - 241.5 546.3 130.6 711.3
Japan - - - - - - - - - - 0.1 1.2
Pakistan 6.4 5.4 5.5 4.4 3.9 4.3 4.1 2.1 - - - -
Korea, Republic of - - - - 3.7 4.0 4.6 11.1 22.0 27.0 51.9 -
United States 28.0 23.0 - 67.0 - 61.0 38.0 3.0 2.0 2.0 4.0 4.0 284.0 -
Source: UNCTAD, FDI / TNC database.
Note: Data is based on the information reported by the economies listed above.
Table 9. FDI flows abroad, by geographical destination, 1995-2006
(Millions of dollars)
Economy 1995 1996 1997 1998 1999 2000 2001 2002 2003 2004 2005 2006
Belgium .. - - - - - - - - 4.5 - - -
Belgium/Luxembourg .. - - - - - - - - 4.5 - - -
Brazil .. - - - - - 0.3 0.1 0.0 0.1 0.0 0.0
Bulgaria .. 0.0 0.3 1.0 - 0.0 0.1 - 0.0 0.0 0.2 0.1 - 0.0 - 0.1
China .. - - - - - - - - - - -
Cyprus .. - - - - - - 1.2 2.7 1.2 0.3 -
Egypt .. - - - - - - 0.2 - - - -
Estonia .. - - - - - - - - 0.1 - -
France .. - 5.1 - 1.1 - - - 4.6 - 18.8 107.3 20.3 - 50.9 1.2 -
Georgia .. - - - - 1.8 0.8 - - - 0.0 -
Germany .. 15.3 13.3 23.9 - - 12.5 46.1 4.5 2.5 - 5.0 - 1.3
Malta .. - - - - - - - - 7.8 - 5.8 -
Morocco .. 16.0 26.0 19.0 - 0.3 0.5 - 2.7 2.7 0.5 0.9
Pakistan .. - - - - - - - - - - -
Portugal .. - - 0.1 - 0.1 - 0.3 - 0.4 - 0.0 - 0.1 - 0.1 - 0.2 - -
Korea, Republic of .. - - 0.0 - - 0.1 0.1 0.0 0.2 0.2 0.3
Tunisia .. .. .. 5.2 8.6 10.5 48.4 6.2 3.9 6.7 0.8 3.2
Source: UNCTAD, FDI / TNC database.
Note: Data is based on the information reported by the economies listed above.
Libyan Arab Jamahiriya
371
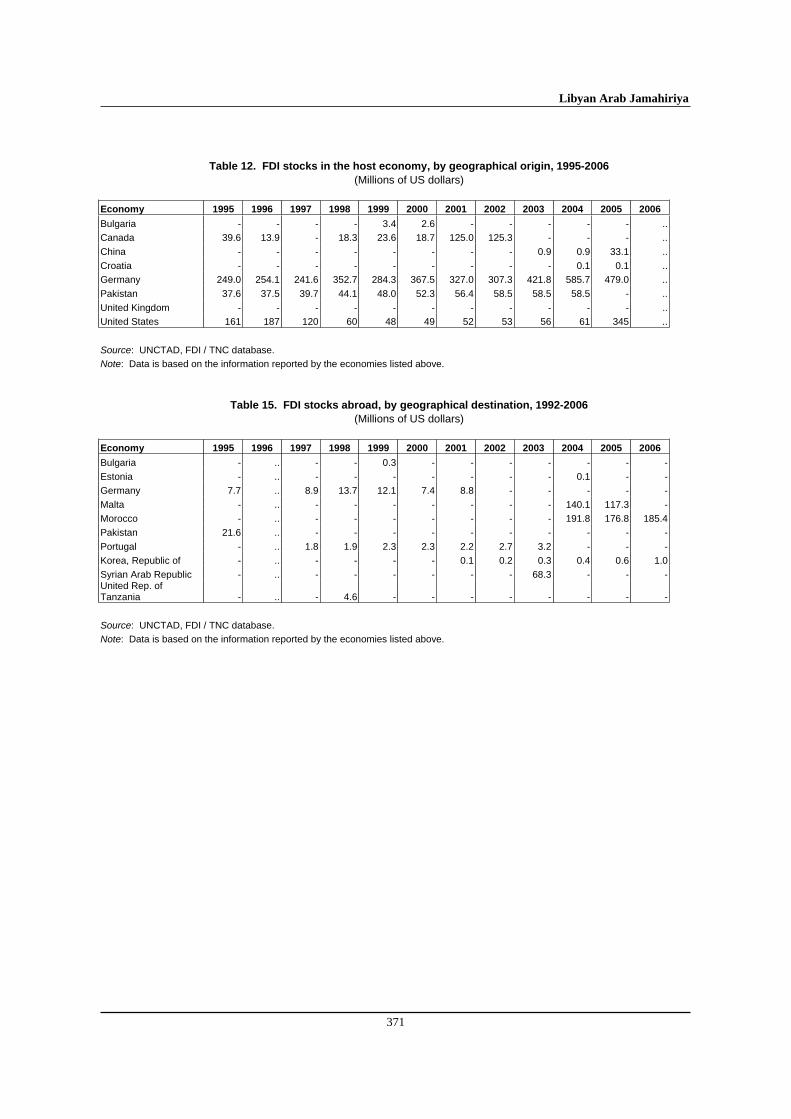
Table 12. FDI stocks in the host economy, by geographical origin, 1995-2006
(Millions of US dollars) Economy 1995 1996 1997 1998 1999 2000 2001 2002 2003 2004 2005 2006
Bulgaria - - - - 3.4 2.6 - - - - - ..
Canada 39.6 13.9 - 18.3 23.6 18.7 125.0 125.3 - - - ..
China - - - - - - - - 0.9 0.9 33.1 ..
Croatia - - - - - - - - - 0.1 0.1 ..
Germany 249.0 254.1 241.6 352.7 284.3 367.5 327.0 307.3 421.8 585.7 479.0 ..
Pakistan 37.6 37.5 39.7 44.1 48.0 52.3 56.4 58.5 58.5 58.5 - ..
United Kingdom - - - - - - - - - - - ..
United States 161 187 120 60 48 49 52 53 56 61 345 ..
Source: UNCTAD, FDI / TNC database.
Note: Data is based on the information reported by the economies listed above.
Table 15. FDI stocks abroad, by geographical destination, 1992-2006
(Millions of US dollars) Economy 1995 1996 1997 1998 1999 2000 2001 2002 2003 2004 2005 2006
Bulgaria - .. - - 0.3 - - - - - - -
Estonia - .. - - - - - - - 0.1 - -
Germany 7.7 .. 8.9 13.7 12.1 7.4 8.8 - - - - -
Malta - .. - - - - - - - 140.1 117.3 -
Morocco - .. - - - - - - - 191.8 176.8 185.4
Pakistan 21.6 .. - - - - - - - - - -
Portugal - .. 1.8 1.9 2.3 2.3 2.2 2.7 3.2 - - -
Korea, Republic of - .. - - - - 0.1 0.2 0.3 0.4 0.6 1.0
Syrian Arab Republic - .. - - - - - - 68.3 - - -United Rep. of Tanzania - .. - 4.6 - - - - - - - -
Source: UNCTAD, FDI / TNC database.
Note: Data is based on the information reported by the economies listed above.

World Investment Directory Volume X Africa 2008
372
Table 21. The number of foreign affiliates of home-based transnational corporations, by geographical location abroad, 1995-2006
Economy 1995 1996 1997 1998 1999 2000 2001 2002 2003 2004 2005 2006
Germany .. .. 3 3 3 3 3 .. .. .. .. ..Italy 1 .. 1 .. .. .. .. .. .. .. .. ..Tunisia .. .. .. .. .. .. .. .. .. .. .. 46United States .. .. 1 1 1 1 1 .. .. .. .. ..Source: UNCTAD, FDI/TNC database. Note: Data are based on information reported by the economies listed above.
Table 23. The number of affiliates of foreign TNCs in the host economy, by geographical origin, 1995-2006
Economy 1995 1996 1997 1998 1999 2000 2001 2002 2003 2004 2005 2006
Germany 8 7 6 8 9 9 9 4 6 8 11 ..Italy 1 .. 1 .. .. .. .. .. .. .. .. ..United States 9 9 9 9 6 6 6 6 6 4 .. ..Source: UNCTAD, FDI/TNC database. Note: Data are based on information reported by the economies listed above.
Table 28. Assets of foreign affiliates of home-based transnational corporations, by geographical location abroad, 1995-2006
(Millions of dollars) Economy 1995 1996 1997 1998 1999 2000 2001 2002 2003 2004 2005 2006
United States .. .. 4.0 4.0 5.0 5.0 .. .. .. .. .. .. Source: UNCTAD, FDI/TNC database. Note: Data are based on information reported by the United States.
Table 30. Assets of affiliates of foreign TNCs in the host economy, by geographical origin, 1995-2006 (Millions of dollars)
Economy 1995 1996 1997 1998 1999 2000 2001 2002 2003 2004 2005 2006
Germany 488.3 514.5 502.2 597.7 602.8 744.4 616.9 .. .. .. .. ..United States .. .. .. .. .. 619 407 411 404 320 .. .. Source: UNCTAD, FDI/TNC database. Note: Data are based on information reported by the economies listed above. Table 33. Employment of foreign affiliates of home-based transnational corporations, by geographical location abroad,
1995-2006 (Thousands of employees)
Economy 1995 1996 1997 1998 1999 2000 2001 2002 2003 2004 2005 2006
Italy 0.3 .. 0.3 .. .. .. .. .. .. .. .. ..Tunisia .. .. .. .. .. .. .. .. .. .. .. 4.4 Source: UNCTAD, FDI/TNC database. Note: Data are based on information reported by the economies listed above.
Table 35. Employment of affiliates of foreign TNCs in the host economy, by geographical origin, 1995-2006 (Thousands of employees)
Economy 1995 1996 1997 1998 1999 2000 2001 2002 2003 2004 2005 2006
Germany .. .. .. .. .. .. .. .. 1.0 2.0 3.0 ..Italy 1.0 .. 1.0 .. .. .. .. .. .. .. .. ..United States 0.5 0.7 0.7 .. .. .. 0.4 0.4 0.4 0.5 .. .. Source: UNCTAD, FDI/TNC database. Note: Data are based on information reported by the economies listed above.
Libyan Arab Jamahiriya
373
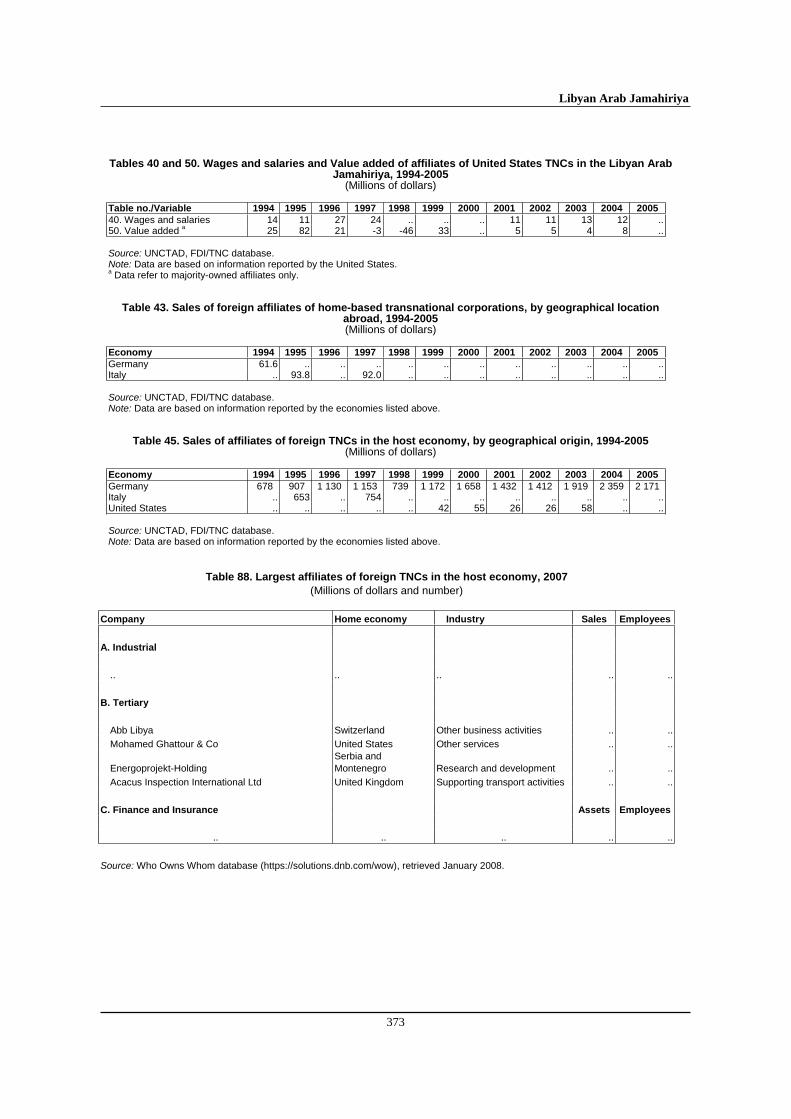
Tables 40 and 50. Wages and salaries and Value added of affiliates of United States TNCs in the Libyan Arab Jamahiriya, 1994-2005
(Millions of dollars) Table no./Variable 1994 1995 1996 1997 1998 1999 2000 2001 2002 2003 2004 2005
40. Wages and salaries 14 11 27 24 .. .. .. 11 11 13 12 ..50. Value added a 25 82 21 -3 -46 33 .. 5 5 4 8 .. Source: UNCTAD, FDI/TNC database. Note: Data are based on information reported by the United States. a Data refer to majority-owned affiliates only.
Table 43. Sales of foreign affiliates of home-based transnational corporations, by geographical location abroad, 1994-2005 (Millions of dollars)
Economy 1994 1995 1996 1997 1998 1999 2000 2001 2002 2003 2004 2005
Germany 61.6 .. .. .. .. .. .. .. .. .. .. ..Italy .. 93.8 .. 92.0 .. .. .. .. .. .. .. .. Source: UNCTAD, FDI/TNC database. Note: Data are based on information reported by the economies listed above.
Table 45. Sales of affiliates of foreign TNCs in the host economy, by geographical origin, 1994-2005 (Millions of dollars)
Economy 1994 1995 1996 1997 1998 1999 2000 2001 2002 2003 2004 2005
Germany 678 907 1 130 1 153 739 1 172 1 658 1 432 1 412 1 919 2 359 2 171Italy .. 653 .. 754 .. .. .. .. .. .. .. ..United States .. .. .. .. .. 42 55 26 26 58 .. .. Source: UNCTAD, FDI/TNC database. Note: Data are based on information reported by the economies listed above.
Table 88. Largest affiliates of foreign TNCs in the host economy, 2007
(Millions of dollars and number) Company Home economy Industry Sales Employees
A. Industrial
.. .. .. .. ..
B. Tertiary
Abb Libya Switzerland Other business activities .. ..
Mohamed Ghattour & Co United States Other services .. ..
Energoprojekt-Holding Serbia and Montenegro Research and development .. ..
Acacus Inspection International Ltd United Kingdom Supporting transport activities .. ..
C. Finance and Insurance Assets Employees
.. .. .. .. ..
Source: Who Owns Whom database (https://solutions.dnb.com/wow), retrieved January 2008.

World Investment Directory Volume X Africa 2008
374
C. Legal frameworks for transnational corporations
Libyan Arab Jamahiriya has a number of instruments to regulate the activities of the transnational corporations and foreign direct investors within its territory. The key legal instruments include the following:
I. National framework
Hydrocarbons law No(25) for the year 1955, as amended in 1961, 1965, and 1971. Source: http://www.1upinfo.com/country-guide-study/libya/libya73.html
Trade Marks: Law No. 40 of 1956. Source: WIPO (http://www.wipo.org).
Patent, Industrial Designs and Models Law (No. 8 of 1959) Source: Abu-Ghazaleh Intellectual Property/Arab World (http://www.agip.com).
Law No. (9) for 1968 Issuing the Copyright Protection Law Source: Abu-Ghazaleh Intellectual Property/Arab World (http://www.agip.com).
Law No. 37 of 1968 concerning Foreign Capital Investment. Source: Chambre de Commerce Franco-Arabe (Paris), Documentary fund.
Law No. 65 of 1970 A.D. "Some Decisions pertaining to Tradesmen and Commercial Companies and Controlling Them". Source: Official Gazette No. 33 of 25 June 1970 A.D.
Law No. 25 of 1971 amending the Commercial Code. Source: Official Gazette No. 28 of l June 1979 A.D.
Income Tax Law No. 64 for the year 1973 and its amendments. Source: Libyan Investment (http://www.libyaninvestment.com).
Customs Law No. 67 for the year 1973 and its amendments. Source: Libyan Investment (http://www.libyaninvestment.com).
Law No. 85 for the year 1975 on Establishment of Joint-Stock Contracting Companies. Source: Official Gazette of 27 Shaban 1395 H.Y. (3 September 1975 A.D.).
Decision number 10 of 1979 allowing NOC to enter into agreements with foreign companies. Source: MBendi Information for Africa (http://www.mbendi.co.za).
Decree of 3 May 1980 on Registration of Companies. Source: Chambre de Commerce Franco-Arabe (Paris), Documentary fund.
Law No. 5 of 1981 concerning the exemption from tax for foreign companies. Source: International Bureau of Fiscal Documentation, suppl. 53-54, Winter 1984.
Law No. 20 for the year 1991 concerning the Consolidation of freedom. Source: Libyan Investment (http://www.libyaninvestment.com).
Law No. 1 for the year 1993 concerning Banks, Currency and Credit and its amendments. Source: Libyan Investment (http://www.libyaninvestment.com).

Libyan Arab Jamahiriya
375
Law No. 5 For Year 1426 (1997) Concerning Encouragement Of Foreign Capitals Investment and its amendments by law No(7) of the year (2003).Source: Libyan Investment (http://www.libyaninvestment.com).
Establishment of the Free Zones Authority General People's Committee Resolution no. (495) for the year 1999. Source: Libyan Investment (http://www.libyaninvestment.com).
Libyanisation, November 2006. Source: www.eiu.com, EIU Country report Main report Jan 2007.
Foreign banks allowed to invest, January 2006. Source: www.viewswire.com, Libya regulations Feb 1st 2006.
Law on establishment of stock market, June 2006. Source: http://www.heritage.org/research/features/index/country.cfm?id=Libya.
II. International Framework
A. Libyan Arab Jamahiriya is a party to the following multilateral and regional instruments:
Agreement on Arab Economic Unity of 3 June 1957. Entered into force on 30 April 1964. Together with Agreement on Investment and Free Movement of Arab Capital Among Arab Countries of 29 August 1970 and the Unified Agreement for the Investment of Arab Capital in the Arab States of 26 November 1980.
Convention on the Settlement of Investment Disputes between States and Nationals of other States of 1965. Entered into force on 14 October 1966.
Agreement for the Promotion, Protection and Guarantee of Investment Among Member States of the Organization of Islamic Conference, of I June 1981; entered into force on 23 September 1986.
Unified Agreement for the Investment of Arab Capital in the Arab States of 1982.
Convention Establishing the Multilateral Investment Guarantee Agency of 1985, entered into force on 12 April 1988.
Fourth ACP - EEC Convention (Lome IV) of 1989, entered into force on 1st March 1990.
Paris Convention for the Protection of Industrial Property of 1883 (Revised at Brussels in 1900, Washington in 1911, The Hague in 1925, London in 1934, Lisbon in 1958 and Stockholm in 1967, and as amended in 1979). Signed in 1994.
Articles of Agreement of the Islamic Corporation for the Insurance of Investment and Export Credit of 19 February 1992. Entered into force on 1 August 1994.
Partnership Agreement between the Members of The African, Caribbean and Pacific Group of States, of the one part and the European Community and its member states, of the other part signed in Cotonou, Benin on 23 June 2000.
World Investment Directory Volume X Africa 2008
376
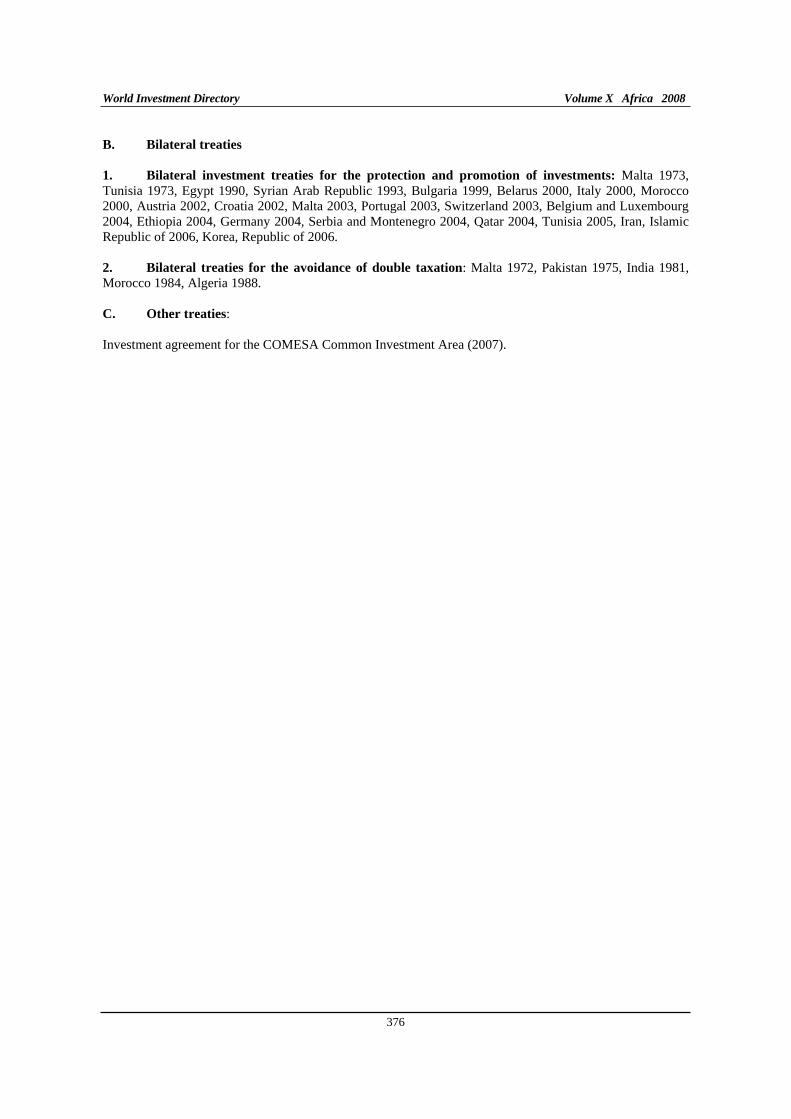
B. Bilateral treaties
1. Bilateral investment treaties for the protection and promotion of investments: Malta 1973, Tunisia 1973, Egypt 1990, Syrian Arab Republic 1993, Bulgaria 1999, Belarus 2000, Italy 2000, Morocco 2000, Austria 2002, Croatia 2002, Malta 2003, Portugal 2003, Switzerland 2003, Belgium and Luxembourg 2004, Ethiopia 2004, Germany 2004, Serbia and Montenegro 2004, Qatar 2004, Tunisia 2005, Iran, Islamic Republic of 2006, Korea, Republic of 2006.
2. Bilateral treaties for the avoidance of double taxation: Malta 1972, Pakistan 1975, India 1981, Morocco 1984, Algeria 1988.
C. Other treaties:
Investment agreement for the COMESA Common Investment Area (2007).

Libyan Arab Jamahiriya
377
D. Sources of information
Official
Central Bank of Libya (www.cbl-ly.com).
Libyan Foreign Investment Board (www.investinlibya.com).
Secondary
Economist Intelligence Unit (EIU) (various years). Country Profile: Libya (London: EIU Ltd.).
____________ (various years). Country Report: Libya (London: EIU Ltd.).
European Commission (1999). Report on United States barriers to trade and investment (Brussels: EC).
Guabr, Ahmed, Ali (1997). "A survey of public opinion", Kitab Al-Aktisadi, Ah-Ahram Institution, No. 116, September.
International Monetary Fund (IMF) (2001). "Recent trends in the transfer of resources to developing countries", (Washington D.C.: IMF).
Nabli, K., Mustapha (2003). Challenges to private investment in the Middle East North African region --- what the World Bank is doing (Washington D.C.: World Bank).
Reiffers, J.L. (1997). La Mediterranee aux portes de l'an 2000 (Massaeille: Institut de la Mediterrannee).
Sobhi, Yasser (2003). "Casualities of conflict", Al-Ahram Weekly on-line, No. 630, March 2003.
United Nations Conference on Trade and Development (UNCTAD) (2005a). Investor-Disputes Arising
from Investment Treaties: A Review. UNCTAD Series of International Investment Policies for Development (UNCTAD/ITE/IIT/2005/4).
_____________(2005b). A Survey of Support by Investment Promotion Agencies to Linkages. Advisory Studies No. 18 (UNCTAD/ITE/IPC/2005/12).
World Bank/International Finance Corporation (2007). Doing Business 2008 Libya (Washington D.C.: The World Bank Group).


Madagascar
379
Madagascar
A. Definitions and sources
Foreign direct investment (FDI) in Madagascar is defined as the “purchase, creation or extension of funds, branches or enterprises, or any other activity that would allow foreign entities to establish or to increase control of a corporation carrying out industrial, agricultural, commercial, financial or real estate activities of any form, or the extension of such a corporation already under their control” (Arrête no. 4100 of 30 December 1972). The Banque Centrale de Madagascar compiles data on FDI in the country. Aggregate data on inward FDI are available for 1990-2000, based on cash transfers, complemented by information on privatization of State-owned enterprises. Data are expressed in units of Special Drawing Rights. Data broken down by region or industry are currently not available. It is not known whether the application of the balance-of-payment manual 5th edition guidelines for compiling FDI data is envisaged. Additional data are available on the balance-of-payment statistics by the International Monetary Fund.
Foreign investment has mainly been in the free zones, particularly in textiles. With the abolition of the Investment Code in 1996, foreign investment no longer needs prior authorization. The Guichet Unique (established in 1994), which used to serve foreign investors in the past, now serves as a one-stop shop. In addition, the Espace des Promotions des Investissements was established in 1999, within the Ministère de l’Industrialisation et de l’Artisanat, to provide free assistance to investors interested in Madagascar, with advice on investment conditions, market potential, prospective local partners and advice on legal and financial issues. The Ministry also determines FDI policy and promotion measures related to industrial and handicraft activities, within the framework of government economic policy. The Export Free Zone (EFZ) regime, established in 1989, provides incentives to investors in export-oriented manufacturing activities, development or management of industrial free zones or provision of services to EFZ companies. The following incentives are offered: tax holidays for two to ten years following the initial investment and depending on the type of enterprise, exemption of customs duties for all exports and imports, and free transfer of funds abroad. To qualify for this regime, investors have to register with the Guichet Unique.
Madagascar signed to the Convention on the Settlement of Investment Disputes between State and Nationals of other States on 1 June 1966 and is a member of the African Union, New Partnership for Africa's Development, Multilateral Investment Guarantee Agency, World Intellectual Property Organization and World Trade Organization. Madagascar also has membership of the Common Market for Eastern and Southern Africa, Southern African Development Community, Indian Ocean Commission, and eligible for the provisions of the Cotonou Agreement for renegotiating the Lomé Convention between Africa, Caribbean and Pacific with the European Union; the United States' market access initiative for African countries - the African Growth and Opportunity Act and the European Commission's Everything But Arms market access initiative.
World Investment Directory Volume X Africa 2008
380
B. Statistics on FDI and the operations of TNCs
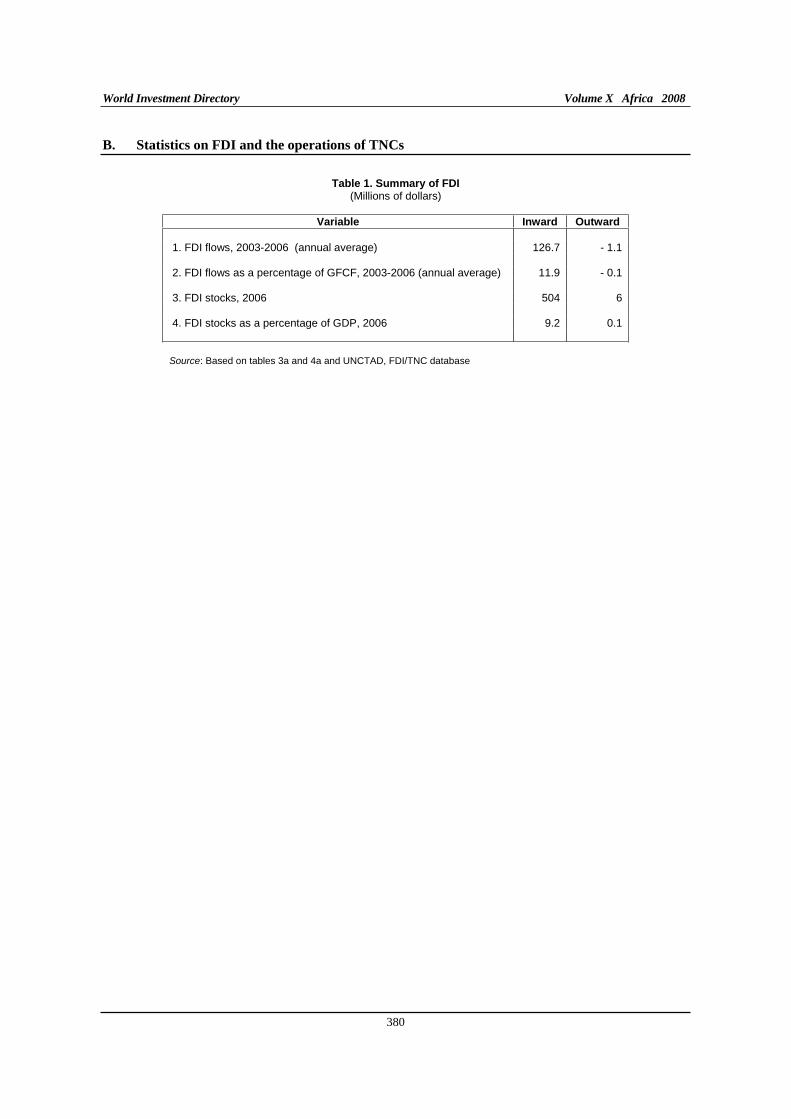
Table 1. Summary of FDI (Millions of dollars)
Variable Inward Outward
1. FDI flows, 2003-2006 (annual average) 126.7 - 1.1 2. FDI flows as a percentage of GFCF, 2003-2006 (annual average) 11.9 - 0.1 3. FDI stocks, 2006 504 6 4. FDI stocks as a percentage of GDP, 2006 9.2 0.1 Source: Based on tables 3a and 4a and UNCTAD, FDI/TNC database
Madagascar
381
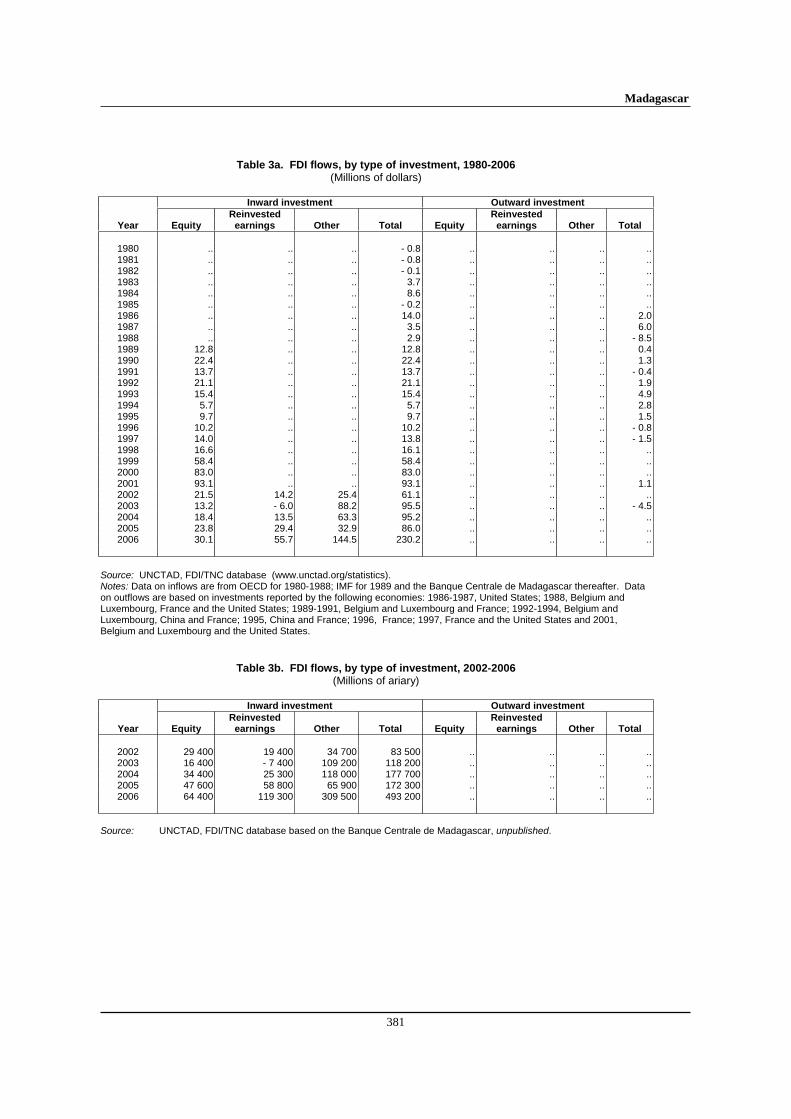
Table 3a. FDI flows, by type of investment, 1980-2006 (Millions of dollars)
Inward investment Outward investment
Reinvested Reinvested Year Equity earnings Other Total Equity earnings Other Total
1980 .. .. .. - 0.8 .. .. .. ..1981 .. .. .. - 0.8 .. .. .. ..1982 .. .. .. - 0.1 .. .. .. ..1983 .. .. .. 3.7 .. .. .. ..1984 .. .. .. 8.6 .. .. .. ..1985 .. .. .. - 0.2 .. .. .. ..1986 .. .. .. 14.0 .. .. .. 2.01987 .. .. .. 3.5 .. .. .. 6.01988 .. .. .. 2.9 .. .. .. - 8.51989 12.8 .. .. 12.8 .. .. .. 0.41990 22.4 .. .. 22.4 .. .. .. 1.31991 13.7 .. .. 13.7 .. .. .. - 0.41992 21.1 .. .. 21.1 .. .. .. 1.91993 15.4 .. .. 15.4 .. .. .. 4.91994 5.7 .. .. 5.7 .. .. .. 2.81995 9.7 .. .. 9.7 .. .. .. 1.51996 10.2 .. .. 10.2 .. .. .. - 0.81997 14.0 .. .. 13.8 .. .. .. - 1.51998 16.6 .. .. 16.1 .. .. .. ..1999 58.4 .. .. 58.4 .. .. .. ..2000 83.0 .. .. 83.0 .. .. .. ..2001 93.1 .. .. 93.1 .. .. .. 1.12002 21.5 14.2 25.4 61.1 .. .. .. ..2003 13.2 - 6.0 88.2 95.5 .. .. .. - 4.52004 18.4 13.5 63.3 95.2 .. .. .. ..2005 23.8 29.4 32.9 86.0 .. .. .. ..2006 30.1 55.7 144.5 230.2 .. .. .. ..
Source: UNCTAD, FDI/TNC database (www.unctad.org/statistics). Notes: Data on inflows are from OECD for 1980-1988; IMF for 1989 and the Banque Centrale de Madagascar thereafter. Data on outflows are based on investments reported by the following economies: 1986-1987, United States; 1988, Belgium and Luxembourg, France and the United States; 1989-1991, Belgium and Luxembourg and France; 1992-1994, Belgium and Luxembourg, China and France; 1995, China and France; 1996, France; 1997, France and the United States and 2001, Belgium and Luxembourg and the United States.
Table 3b. FDI flows, by type of investment, 2002-2006 (Millions of ariary)
Inward investment Outward investment
Reinvested Reinvested Year Equity earnings Other Total Equity earnings Other Total
2002 29 400 19 400 34 700 83 500 .. .. .. ..2003 16 400 - 7 400 109 200 118 200 .. .. .. ..2004 34 400 25 300 118 000 177 700 .. .. .. ..2005 47 600 58 800 65 900 172 300 .. .. .. ..2006 64 400 119 300 309 500 493 200 .. .. .. ..
Source: UNCTAD, FDI/TNC database based on the Banque Centrale de Madagascar, unpublished.

World Investment Directory Volume X Africa 2008
382
Table 4a. FDI stocks, by type of investment, 1980-2006 (Millions of dollars)
Inward investment Outward investment
Reinvested Reinvested Year Equity earnings Other Total Equity earnings Other Total
1980 .. .. .. 39.9 .. .. .. ..1981 .. .. .. 39.1 .. .. .. ..1982 .. .. .. 39.0 .. .. .. ..1983 .. .. .. 42.7 .. .. .. ..1984 .. .. .. 51.3 .. .. .. ..1985 .. .. .. 51.1 .. .. .. ..1986 .. .. .. 65.2 .. .. .. 2.01987 .. .. .. 68.6 .. .. .. 8.01988 .. .. .. 71.6 .. .. .. - 0.51989 .. .. .. 84.4 .. .. .. - 0.01990 .. .. .. 106.8 .. .. .. 1.31991 .. .. .. 120.4 .. .. .. 0.91992 .. .. .. 141.6 .. .. .. 2.81993 .. .. .. 156.9 .. .. .. 7.71994 .. .. .. 162.6 .. .. .. 10.51995 .. .. .. 172.4 .. .. .. 12.11996 .. .. .. 182.5 .. .. .. 11.31997 .. .. .. 196.3 .. .. .. 9.81998 .. .. .. 212.4 .. .. .. 9.81999 .. .. .. 270.8 .. .. .. 9.82000 .. .. 41.3 140.8 .. .. .. 9.82001 .. .. 51.5 142.6 .. .. .. 10.92002 .. .. 78.9 180.5 .. .. .. 10.92003 .. .. 138.3 259.0 .. .. .. 6.42004 .. .. 149.9 256.6 .. .. .. 6.42005 .. .. 135.4 249.2 .. .. .. 6.42006 .. .. 348.9 503.5 .. .. .. 6.4
Source: UNCTAD, FDI/TNC database (www.unctad.org/statistics). Notes: Data on Inward stock prior to 2000 are estimated by accumulating inflows since 1970. As of 2000 data are based on the Banque Centrale de Madagascar. Data for outward stock Estimated by accumulating inflows since 1986.
Table 4b. FDI stocks, by type of investment, 2000-2006 (Millions of ariary)
Inward investment Outward investment
Reinvested Reinvested Year Equity earnings Other Total Equity earnings Other Total
2000 .. .. 54 100 184 500 .. .. .. ..2001 .. .. 68 300 189 100 .. .. .. ..2002 .. .. 62 600 232 300 .. .. .. ..2003 .. .. 137 200 315 900 .. .. .. ..2004 .. .. 223 500 479 700 .. .. .. ..2005 .. .. 199 700 540 630 .. .. .. ..2006 .. .. .. 1 014 014 .. .. .. ..
Source: Banque Centrale de Madagascar.
Madagascar
383
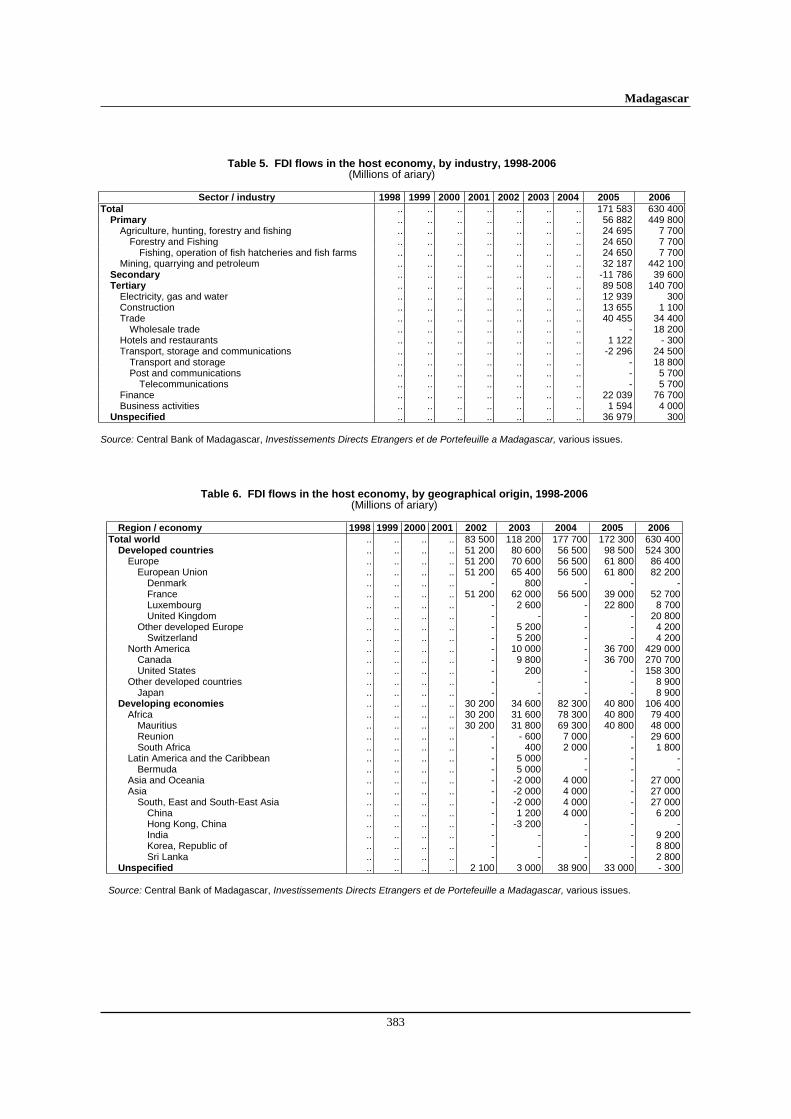
Table 5. FDI flows in the host economy, by industry, 1998-2006 (Millions of ariary)
Sector / industry 1998 1999 2000 2001 2002 2003 2004 2005 2006
Total .. .. .. .. .. .. .. 171 583 630 400Primary .. .. .. .. .. .. .. 56 882 449 800
Agriculture, hunting, forestry and fishing .. .. .. .. .. .. .. 24 695 7 700Forestry and Fishing .. .. .. .. .. .. .. 24 650 7 700
Fishing, operation of fish hatcheries and fish farms .. .. .. .. .. .. .. 24 650 7 700Mining, quarrying and petroleum .. .. .. .. .. .. .. 32 187 442 100
Secondary .. .. .. .. .. .. .. -11 786 39 600Tertiary .. .. .. .. .. .. .. 89 508 140 700
Electricity, gas and water .. .. .. .. .. .. .. 12 939 300Construction .. .. .. .. .. .. .. 13 655 1 100Trade .. .. .. .. .. .. .. 40 455 34 400
Wholesale trade .. .. .. .. .. .. .. - 18 200Hotels and restaurants .. .. .. .. .. .. .. 1 122 - 300Transport, storage and communications .. .. .. .. .. .. .. -2 296 24 500
Transport and storage .. .. .. .. .. .. .. - 18 800Post and communications .. .. .. .. .. .. .. - 5 700
Telecommunications .. .. .. .. .. .. .. - 5 700Finance .. .. .. .. .. .. .. 22 039 76 700Business activities .. .. .. .. .. .. .. 1 594 4 000
Unspecified .. .. .. .. .. .. .. 36 979 300 Source: Central Bank of Madagascar, Investissements Directs Etrangers et de Portefeuille a Madagascar, various issues.
Table 6. FDI flows in the host economy, by geographical origin, 1998-2006 (Millions of ariary)
Region / economy 1998 1999 2000 2001 2002 2003 2004 2005 2006
Total world .. .. .. .. 83 500 118 200 177 700 172 300 630 400Developed countries .. .. .. .. 51 200 80 600 56 500 98 500 524 300
Europe .. .. .. .. 51 200 70 600 56 500 61 800 86 400European Union .. .. .. .. 51 200 65 400 56 500 61 800 82 200
Denmark .. .. .. .. - 800 - - -France .. .. .. .. 51 200 62 000 56 500 39 000 52 700Luxembourg .. .. .. .. - 2 600 - 22 800 8 700United Kingdom .. .. .. .. - - - - 20 800
Other developed Europe .. .. .. .. - 5 200 - - 4 200Switzerland .. .. .. .. - 5 200 - - 4 200
North America .. .. .. .. - 10 000 - 36 700 429 000Canada .. .. .. .. - 9 800 - 36 700 270 700United States .. .. .. .. - 200 - - 158 300
Other developed countries .. .. .. .. - - - - 8 900Japan .. .. .. .. - - - - 8 900
Developing economies .. .. .. .. 30 200 34 600 82 300 40 800 106 400Africa .. .. .. .. 30 200 31 600 78 300 40 800 79 400
Mauritius .. .. .. .. 30 200 31 800 69 300 40 800 48 000Reunion .. .. .. .. - - 600 7 000 - 29 600South Africa .. .. .. .. - 400 2 000 - 1 800
Latin America and the Caribbean .. .. .. .. - 5 000 - - -Bermuda .. .. .. .. - 5 000 - - -
Asia and Oceania .. .. .. .. - -2 000 4 000 - 27 000Asia .. .. .. .. - -2 000 4 000 - 27 000
South, East and South-East Asia .. .. .. .. - -2 000 4 000 - 27 000China .. .. .. .. - 1 200 4 000 - 6 200Hong Kong, China .. .. .. .. - -3 200 - - -India .. .. .. .. - - - - 9 200Korea, Republic of .. .. .. .. - - - - 8 800Sri Lanka .. .. .. .. - - - - 2 800
Unspecified .. .. .. .. 2 100 3 000 38 900 33 000 - 300 Source: Central Bank of Madagascar, Investissements Directs Etrangers et de Portefeuille a Madagascar, various issues.

World Investment Directory Volume X Africa 2008
384
Table 7. FDI flows in the host economy, by industry and geographical origin, 2005
(Billions of ariary)
Sector/industry / Region/economy To
tal
wo
rld
De
ve
lop
ed
co
un
trie
s
Eu
rop
ea
n U
nio
n
Fra
nce
Develo
pin
g
ec
on
om
ies
Afr
ica
Ma
uriti
us
As
ia
Ch
ina
Un
spe
cifie
d
Total 171.6 25.4 25.4 25.4 112.2 35.7 35.7 76.5 76.5 34.0
Primary 57.0 8.3 8.3 8.3 74.8 - - 74.8 74.8-
26.1
Agriculture, hunting, forestry and fishing 24.8 4.0 4.0 4.0 - - - - - 20.8
Forestry and Fishing 24.7 4.0 4.0 4.0 - - - - - 20.7
Mining, quarrying and petroleum 32.2 4.3 4.3 4.3 74.8 - - 74.8 74.8-
46.9
Secondary - 11.8 - 1.4 - 1.4 - 1.4 9.8 8.2 8.2 1.6 1.6-
20.2
Tertiary 89.4 12.7 12.7 12.7 27.7 27.6 27.6 0.1 0.1 49.0
Electricity, gas and water 12.9 0.2 0.2 0.2 4.5 4.5 4.5 - - 8.2
Construction 13.6-
21.1-
21.1-
21.1 - - - - - 34.7
Trade 40.5 13.3 13.3 13.3 2.6 2.5 2.5 0.1 0.1 24.6
Hotels and restaurants 1.1 - - - - - - - - 1.1
Transport, storage and communications - 2.3 22.8 22.8 22.8 2.1 2.1 2.1 - --
27.2
Finance 22.0 1.6 1.6 1.6 17.5 17.5 17.5 - - 2.9
Business activities 1.6 - 4.1 - 4.1 - 4.1 1.0 1.0 1.0 - - 4.7
Unspecified 37.0 5.8 5.8 5.8 - 0.1 - 0.1 - 0.1 - - 31.3
Source: Central Bank of Madagascar, Investissements Directs Etrangers et de Portefeuille a Madagascar, various issues.

Madagascar
385
Table 9. FDI flows abroad, by geographical destination, 1995-2006
(Millions of dollars)
Economy 199
5199
6199
7199
8199
9200
0 2001 2002 2003 2004 2005 2006
Belgium/Luxembourg - - - .. .. - - 0.9 - - - - -
Bulgaria - - - .. .. - 0.0 - - - - -
China 0.7 - - .. .. - - - - - - -
France 1.3 - 1.3 - .. .. - 0.9 1.8 1.9 1.1 2.5 - 3.7 - 5.0
Germany - - - .. .. - - - - - 2.5 - 2.5
United States - - - 1.0 .. .. - 2.0 - - - - - Source: UNCTAD. FDI / TNC database.
Note: Data is based on the information reported by the economies listed above.
Table 15. FDI stocks abroad, by geographical destination, 1995-2006
(Millions of dollars)
Economy 199
5199
6199
7199
8199
9200
0 2001 2002 2003 2004 2005 2006
Bulgaria - - - - - - 0.03 0.03 0.04 0.04 0.03 0.04
United States - - - 1.0 - 1.0 - 2.0 - 2.0 - - - - - - Source: UNCTAD. FDI / TNC database.
Note: Data is based on the information reported by the economies listed above.
Table 11. FDI stocks in the host economy, by industry, 1998-2006
(Millions of ariary)
Sector / industry 1998 1999 2000 2001 2002 2003 2004 2005 2006
Total .. .. .. .. 213 000 277 000 479 700 540 600 1 877 900
Primary .. .. .. .. 14 600 24 800 35 100 103 500 917 900
Agriculture, hunting, forestry and fishing .. .. .. .. 9 600 8 400 12 700 56 400 15 100
Forestry and Fishing .. .. .. .. 9 600 8 400 12 600 51 000 15 100
Fishing, operation of fish hatcheries and fish farms .. .. .. .. 9 600 8 400 12 600 51 000 15 100
Mining, quarrying and petroleum .. .. .. .. 5 000 16 400 22 400 47 100 902 800
Secondary .. .. .. .. 28 200 21 400 64 300 111 300 427 800
Tertiary .. .. .. .. 168 800 223 800 358 400 320 900 531 500
Electricity, gas and water .. .. .. .. 14 800 10 400 14 900 10 800 22 600
Construction .. .. .. .. 30 200 58 000 96 100 40 200 40 700
Trade .. .. .. .. 47 400 48 000 80 300 76 600 90 000
Wholesale trade .. .. .. .. - - - 41 000 53 200
Hotels and restaurants .. .. .. .. 400 -1 200 200 900 900
Transport, storage and communications .. .. .. .. 32 000 62 400 74 500 67 200 213 200
Transport and storage .. .. .. .. - - - 9 400 46 500
Post and communications .. .. .. .. - - - 57 800 166 700
Telecommunications .. .. .. .. - - - 57 800 166 700
Finance .. .. .. .. 30 600 27 400 86 700 95 800 132 200
Business activities .. .. .. .. 13 400 18 800 5 700 29 400 31 900
Unspecified .. .. .. .. 1 400 7 000 21 900 4 900 700
Source: Central Bank of Madagascar, Investissements Directs Etrangers et de Portefeuille a Madagascar, various issues.
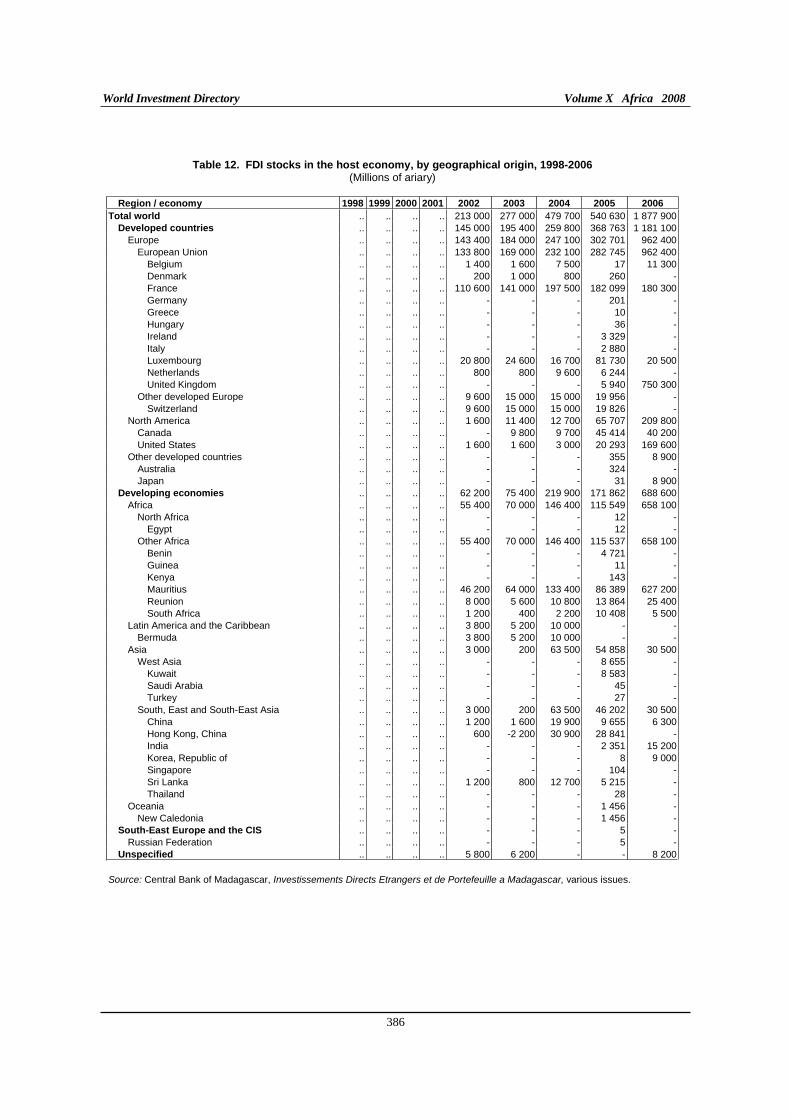
World Investment Directory Volume X Africa 2008
386
Table 12. FDI stocks in the host economy, by geographical origin, 1998-2006 (Millions of ariary)
Region / economy 1998 1999 2000 2001 2002 2003 2004 2005 2006
Total world .. .. .. .. 213 000 277 000 479 700 540 630 1 877 900Developed countries .. .. .. .. 145 000 195 400 259 800 368 763 1 181 100
Europe .. .. .. .. 143 400 184 000 247 100 302 701 962 400European Union .. .. .. .. 133 800 169 000 232 100 282 745 962 400
Belgium .. .. .. .. 1 400 1 600 7 500 17 11 300Denmark .. .. .. .. 200 1 000 800 260 -France .. .. .. .. 110 600 141 000 197 500 182 099 180 300Germany .. .. .. .. - - - 201 -Greece .. .. .. .. - - - 10 -Hungary .. .. .. .. - - - 36 -Ireland .. .. .. .. - - - 3 329 -Italy .. .. .. .. - - - 2 880 -Luxembourg .. .. .. .. 20 800 24 600 16 700 81 730 20 500Netherlands .. .. .. .. 800 800 9 600 6 244 -United Kingdom .. .. .. .. - - - 5 940 750 300
Other developed Europe .. .. .. .. 9 600 15 000 15 000 19 956 -Switzerland .. .. .. .. 9 600 15 000 15 000 19 826 -
North America .. .. .. .. 1 600 11 400 12 700 65 707 209 800Canada .. .. .. .. - 9 800 9 700 45 414 40 200United States .. .. .. .. 1 600 1 600 3 000 20 293 169 600
Other developed countries .. .. .. .. - - - 355 8 900Australia .. .. .. .. - - - 324 -Japan .. .. .. .. - - - 31 8 900
Developing economies .. .. .. .. 62 200 75 400 219 900 171 862 688 600Africa .. .. .. .. 55 400 70 000 146 400 115 549 658 100
North Africa .. .. .. .. - - - 12 -Egypt .. .. .. .. - - - 12 -
Other Africa .. .. .. .. 55 400 70 000 146 400 115 537 658 100Benin .. .. .. .. - - - 4 721 -Guinea .. .. .. .. - - - 11 -Kenya .. .. .. .. - - - 143 -Mauritius .. .. .. .. 46 200 64 000 133 400 86 389 627 200Reunion .. .. .. .. 8 000 5 600 10 800 13 864 25 400South Africa .. .. .. .. 1 200 400 2 200 10 408 5 500
Latin America and the Caribbean .. .. .. .. 3 800 5 200 10 000 - -Bermuda .. .. .. .. 3 800 5 200 10 000 - -
Asia .. .. .. .. 3 000 200 63 500 54 858 30 500West Asia .. .. .. .. - - - 8 655 -
Kuwait .. .. .. .. - - - 8 583 -Saudi Arabia .. .. .. .. - - - 45 -Turkey .. .. .. .. - - - 27 -
South, East and South-East Asia .. .. .. .. 3 000 200 63 500 46 202 30 500China .. .. .. .. 1 200 1 600 19 900 9 655 6 300Hong Kong, China .. .. .. .. 600 -2 200 30 900 28 841 -India .. .. .. .. - - - 2 351 15 200Korea, Republic of .. .. .. .. - - - 8 9 000Singapore .. .. .. .. - - - 104 -Sri Lanka .. .. .. .. 1 200 800 12 700 5 215 -Thailand .. .. .. .. - - - 28 -
Oceania .. .. .. .. - - - 1 456 -New Caledonia .. .. .. .. - - - 1 456 -
South-East Europe and the CIS .. .. .. .. - - - 5 -Russian Federation .. .. .. .. - - - 5 -
Unspecified .. .. .. .. 5 800 6 200 - - 8 200 Source: Central Bank of Madagascar, Investissements Directs Etrangers et de Portefeuille a Madagascar, various issues.

Madagascar
387
Table 13. FDI stocks in the host economy, by industry and geographical origin, 2005
(Billions of ariary)
Sector/industry / Region/economy To
tal
wo
rld
De
velo
pe
d
co
un
trie
s
Eur
ope
an
Un
ion
Fra
nce
De
velo
pin
g
eco
no
mie
s
Afr
ica
Ma
uri
tius
Asi
a
Ch
ina
Un
sp
ec
ifie
d
Total 540.6 207.3 207.3 207.3 192.9 114.2 114.2 78.7 78.7 140.4
Primary 79.5 10.5 10.5 10.5 81.8 5.4 5.4 76.4 76.4 - 12.8
Agriculture, hunting, forestry and fishing 37.4 4.5 4.5 4.5 2.0 2.0 2.0 - - 30.9
Forestry and Fishing 37.3 4.4 4.4 4.4 2.0 2.0 2.0 - - 30.9
Fishing, operation of fish hatcheries and fish farms 37.3 4.4 4.4 4.4 2.0 2.0 2.0 - - 30.9
Mining, quarrying and petroleum 42.1 6.0 6.0 6.0 79.8 3.4 3.4 76.4 76.4 - 43.7
Secondary 35.3 10.4 10.4 10.4 20.9 19.1 19.1 1.8 1.8 4.0
Tertiary 374.3 181.4 181.4 181.4 87.3 87.0 87.0 0.3 0.3 105.6
Electricity, gas and water 26.2 0.3 0.3 0.3 6.1 6.1 6.1 - - 19.8
Construction 109.8 74.4 74.4 74.4 22.3 22.3 22.3 - - 13.1
Trade 104.8 36.2 36.2 36.2 20.1 19.8 19.8 0.3 0.3 48.5
Hotels and restaurants 1.3 0.1 0.1 0.1 - - - - - 1.2
Transport, storage and communications 70.5 30.9 30.9 30.9 13.9 13.9 13.9 - - 25.7
Finance 54.7 38.7 38.7 38.7 23.7 23.7 23.7 - - - 7.7
Business activities 7.0 0.8 0.8 0.8 1.2 1.2 1.2 - - 5.0
Unspecified 51.5 5.0 5.0 5.0 2.9 2.7 2.7 0.2 0.2 43.6
Source: Central Bank of Madagascar, Investissements Directs Etrangers et de Portefeuille a Madagascar, various issues.
Table 22. The Number of affiliates of foreign TNCs in the host economy, by industry, 1994-1999
Sector/Industry 1994-1999 Total 2 768 Primary 185
Agriculture, hunting, forestry and fishing 92 Mining, quarrying and petroleum 93
Mining and quarrying 89 Petroleum 4
Secondary 332 Food, beverages and tobacco 44 Textiles, clothing and leather 103 Wood and wood products 53 Publishing, printing and reproduction of recorded media 28 Chemicals and chemical products 36 Machinery and equipment 49 Unspecified secondary 19
Tertiary 2 251 Construction 106 Trade 1 266 Transport, storage and communications 201 Finance 10 Business activities 264 Community, social and personal service activities 94 Other services 310
Source: INSTAT, Direction des Statistiques Economiques, unpublished data.Notes: Data refer to newly established enterprises during the period 1994-1999. Petroleum refers to energy. Wood and wood products include construction materials. Publishing, printing and reproduction of recorded media include paper.

World Investment Directory Volume X Africa 2008
388
Table 23a. The Number of affiliates of foreign TNCs in the host economy,
by geographical origin, 1994-1999
Region/economy 1994-1999 Region/economy 1994-1999
Total world 2 768 Cameroon 2
Developed countries 1 526 Comoros 2
Europe 1 464 Congo 1
European Union 1 436 Côte d'Ivoire 2
Austria 2 Democratic Republic of the Congo 1
Belgium / Luxembourg 31 Gambia 15
Czech Republic 1 Guinea 47
Denmark 2 Liberia 6
France 1 241 Mali 15
Germany 22 Mauritius 86
Greece 4 Rwanda 5
Ireland 4 Senegal 6
Italy 82 Sierra Leone 4
Netherlands 7 Somalia 1
Poland 2 United Republic of Tanzania 2
Portugal 4 Zimbabwe 2
Spain 8 Latin America and the Caribbean 3
United Kingdom 26 Brazil 3
Other Europe 28 Asia 381
Iceland 2 West Asia 1
Switzerland 26 Iran, Islamic Republic of 1
North America 26 South, East and South-East Asia 379
Canada 11 Cambodia 1
United States 15 China 185
Other developed countries 39 India 38
Australia 8 Indonesia 2
Israel 18 Malaysia 17
Japan 2 Pakistan 11
South Africa 11 Republic of Korea 29
Developing economies 591 Singapore 3
Africa 207 Sri Lanka 60
North Africa 10 Thailand 33
Algeria 2 Unspecified Asia 1
Libyan Arab Jamahiriya 2 South-East Europe and CIS 21
Morocco 2 Romania 1
Sudan 3 Russian Federation 16
Tunisia 1 Ukraine 1
Other Africa 197 Unspecified 630
Source: INSTAT, Direction des Statistiques Economiques, unpublished data.
Note: Data refer to newly established enterprises during the period 1994-1999. Zimbabwe includes Malawi.

Madagascar
389
Table 35a. Employees of affiliates of foreign TNCs in the host economy, by geographical origin, 1998
Region/economy 1998 Total world 81 410Developed countries 68 077
Western Europe a 65 787North America b 2 290
Developing economies 13 333Africa 10 343Asia c 2 990
Source: INSTAT/MADIO, Enquête annuelle de l'industrie/98.Notes: Data are for registered investments. a Includes Central and Eastern Europe. b Includes Latin America and the Caribbean. c Includes Australia, Israel, Japan and New Zealand.
Table 40. Sales of affiliates of foreign TNCs in the host economy, by geographical origin, 1998
(Billions of Madagascar francs)
Region/economy 1998 Total world 2 851.3Developed countries 2 602.9
Western Europe a 2 567.7North America b 35.2
Developing economies 248.4Africa 189.0Asia c 59.4
Source: INSTAT/MADIO, Enquête annuelle de l'industrie/98.Notes: Data are for registered investments. a Includes Central and Eastern Europe. b Includes Latin America and the Caribbean. c Includes Australia, Israel, Japan and New Zealand.
Table 50. Value added of affiliates of foreign TNCs in the host economy, by geographical origin, 1998
(Billions of Madagascar francs)
Region/economy 1998 Total world 958.7Developed countries 897.8
Western Europe a 891.4North America b 6.4
Developing economies 60.8Africa 34.3Asia c 26.6
Source: INSTAT/MADIO, Enquête annuelle de l'industrie/98.Notes: Data are for registered investments. a Includes Central and Eastern Europe. b Includes Latin America and the Caribbean. c Includes Australia, Israel, Japan and New Zealand.

World Investment Directory Volume X Africa 2008
390
Table 23b. The number of affiliates of foreign TNCs in the host economy, by geographical origin, 1993-2004
Economy 1993 1994 1995 1996 1997 1998 1999 2000 2001 2002 2003 2004
Italy 2 .. 2 .. 2 .. .. .. .. .. .. ..
United States 2 .. .. .. .. .. .. .. .. .. .. 1
Source: UNCTAD, FDI/TNC database.
Note: Data are based on information reported by the economies listed above.
Tables 30. Assets of affiliates of United States TNCs in Madasgascar, 1993-2004
(Millions of dollars) Economy 1993 1994 1995 1996 1997 1998 1999 2000 2001 2002 2003 2004
United States 7.0 .. .. .. .. .. .. 1.0 1.0 1.0 1.0 ..
Source: UNCTAD, FDI/TNC database.
Note: Data are based on information reported by the United States.
Table 35b. Employment of affiliates of foreign TNCs in the host economy, by geographical origin, 1993-2004
(Thousands of employees) Economy 1993 1994 1995 1996 1997 1998 1999 2000 2001 2002 2003 2004
Belgium .. .. .. .. .. .. .. .. .. .. 0.1 ..
Italy 0.3 .. 0.3 .. 0.3 .. .. .. .. .. .. ..
Source: UNCTAD, FDI/TNC database.
Note: Data are based on information reported by the economies listed above.
Table 45. Sales of affiliates of foreign TNCs in the host economy, by geographical origin, 1993-2004
(Millions of dollars) Economy 1993 1994 1995 1996 1997 1998 1999 2000 2001 2002 2003 2004
Italy 9.4 .. 9.5 .. 9.4 .. .. .. .. .. .. ..
United States .. .. .. .. .. .. .. .. 1.0 1.0 1.0 ..
Source: UNCTAD, FDI/TNC database.
Note: Data are based on information reported by the economies listed above.

Madagascar
391
Table 86. Largest home-based TNCs, 2007 (Billions of dollars)
Company Industry Sales
A. Industrial
.. .. .. B. Tertiary
Air Madagascar Air Transport 0.12
C. Finance and Insurance Assets
.. .. .. Source: Jeune Afrique Hors-serie No. 14, 2007.a 2004.
Table 88. Largest affiliates of foreign TNCs in the host economy, 2007 (Millions of dollars and number)
Company Home economy Industry Sales Employee
s
A. Industrial
Festival Sa France Textiles and clothing 9.3 850Floreal Madagascar S A Mauritius Textiles and clothing 7.0 4 100Crown Smem S A France Rubber and plastic products 5.5 .. Plg Confection Sa France Textiles and clothing 2.3 1 200Sdv Madagascar France Supporting transport activities .. .. Celtel Madagascar Sa Kuwait Telecommunications .. 2 500Polo Garments Majunga Sarl Belgium Textiles and clothing .. 800La Cotonniere D' Antsirabe S A Mauritius Textiles and clothing .. 436Apma United States Precision instruments .. ..
B. Tertiary
Hoechst Madagascar S A France Wholesale trade 7.7 ..Cimelta Madagascar Sa Virgin Islands, UK Construction 6.3 67Landis Madagascar S A Germany Wholesale trade 4.1 120Fimapila S A R L France Wholesale trade 2.3 20Societe Aquamad S A France Wholesale trade 1.8 20Mcfi Madagascar Sarl Mauritius Wholesale trade 1.5 69I B L Madagascar S A Mauritius Wholesale trade 0.7 17M C F I Madagascar S A R L Mauritius Wholesale trade 0.5 ..Sgs Madagascar Sarl Switzerland Agriculture and hunting .. 700Egl, Inc United Kingdom Water Transport .. 95Soval Madagascar S A France Wholesale trade .. 95Somaphar Sa France Wholesale trade .. 48T M V Sarl France Wholesale trade .. 20Setra Madagascar Sarl Germany Wholesale trade .. 20Dimaco United States Wholesale trade .. ..Geodis Overseas Madagascar France Public administration .. ..Nouvelles Frontieres Madagascar Germany Public administration .. ..Union Prospection Miniere United States Public administration .. ..
C. Finance and Insurance Assets Employee
s
B F V Societe Generale S A France Finance .. 64 600Banque Malgache De L'Ocean Indien France Finance .. 280
Source: Who Owns Whom database (https://solutions.dnb.com/wow), retrieved January 2008.

World Investment Directory Volume X Africa 2008
392
C. Legal frameworks for transnational corporations
In Madagascar, the Government applies several national, bilateral and multilateral legal instruments to regulate the activities of transnational corporations and foreign investors. The main instruments applicable in the country include the following:
I. National framework
Ordonnance no. 62-041 of 19 September 1962.
Ordonnance no. 60-050 of 22 June 1960: Commercial lease. Source: Ministry of Justice: (http://www.justice.gov.mg).
Ordonnance no. 60-146 of 3 October 1960: régime foncier de l’immatriculation. Source: Ministry of Justice: (http://www.justice.gov.mg).
Ordonnance no. 62-023 of 19 September 1962 relating to the expropriation for reasons of public utility, friendly acquisition of real estate by the State or secondary public cooperatives. Source: Ministry of Justice: (http://www.justice.gov.mg).
Law no. 80-001 of 6 June 1980 on the Petroleum Code, as amended by law no. 89-010 of 17 November 1989. Source: Ministry of Finance (official copy) (Antananarive, 1990).
Decree No. 90-070 on the Implementation of Law No. 89-026 of 29 December 1989 on the Investment Code; effective on 30 April 1990Source: Gazetim Panjakan Ni Repoblika Demokratika Malagasy of 30 April 1990.
Decree No. 90-071 on the implementation of law no. 89-027 of 29 December 1989 on the implementation of Industrial Free Zones, effective on 30 April 1990. Source: Gazetim Panjakan Ni Repoblika Demokratika Malagasy of 30 April 1990.
Law no. 89-027 of 29 December 1989 “Régime des Zones Franches Industrielles”, modified and completed by law no. 91-020 of 12 August 1991 and decree no. 92-809 of 16 November 1992.Source: Gazetim Panjakan Ni Repoblika Demokratika Malagasy of 2 January 1990.
Law no. 90-033 of 21 December 1990, Charte de l`environnement malgache, modified and completed by law no. 97-012 of 6 June 1997. Source: Ministry of Justice: (http://www.justice.gov.mg).
Order 1029 dated 03/10/93 Provisions relating to the establishment of export processing zones and tax-free companies. Source: http://www.justice.gov.mg/actus/trentloi.htm
Law no. 94-027 of 25 August 1995: Code du Travail. Source: Ministry of Justice: (http://www.justice.gov.mg).
Law no. 95-020 of 27 November 1995 on the acquisition of land by non-nationals. Source: Ministry of Justice: (http://www.justice.gov.mg).

Madagascar
393
Law no. 96-015 of 13 August 1996: Abolition of law no. 89-026 of 29 December 1989 (modified and completed by law no. 91-019 of 12 August 1991. Source: Gazetim Panjakan Ny Repoblikan I Madagasikara, of 26 August 1996.
Law no. 96-025 of 30 September 1996 regarding local administration of renewable natural resources. Source: Ministry of Justice: (http://www.justice.gov.mg).
Foreign Exchange Regulation: Article VIII of the IMF was adopted in September 1996. Source: Ministry of Justice: (http://www.justice.gov.mg).
Law no. 96-011 of 13 August 1998 on privatization. Source: Ministry of Justice: (http://www.justice.gov.mg).
Decrée no. 98-394 of 28 May 1998: Mining Policy.
Loi n° 98-019 sur l’arbitrage Publiée au Journal officiel du 15 décembre 1998 Source: Ministry of Justice: (http://www.justice.gov.mg).
Le code des assurances loi n° 99-013 du 2 aout 1999 portant: code des assurances. Source: Publiée au Journal officiel de la République de Madagascar n° 2592 du 16 / 08 / 99, p. 1739 à 1815 ( Edition spéciale ) http://www.justice.gov.mg/actus/ass.htm
Loi n° 99 - 018 du 2 aout 1999 relative au statut du commerçant ( J.O. n° 2592 du 16/08/99, p. 1865 - 1870 ). Source: http://www.justice.gov.mg/actus/stcoloi.htm
Law 99-022 of 19 August 1999 “Mining Code”. Loi sur la transparence des entreprises loi n° 99 - 025 du 19 aout 1999 relative à la transparence des entreprises ( J.O. n° 2595 du 30/08/99, p. 2006 - 2010, éd° spéciale ) Source: Ministry of Justice: (http://www.justice.gov.mg).
Loi de finances N° 99-032 du 3 février 2000 portant loi de finances pour 2000 Source: http://www.justice.gov.mg/actus/invest.htm
Decrée no. 2000-170 of 15 March 2000, determining the modalities and conditions of the application of law no. 99-022. Source: Ministry of Justice: (http://www.justice.gov.mg).
II. International Framework
A. Madagascar is a party to the following multilateral and regional instruments:
Convention on the Recognition and Enforcement of Foreign Arbitral Awards of 1958, which entered into force on 7th June 1959.
Convention on the Settlement of Investment Disputes between States and Nationals of other States of 1965. Entered into force on 14 October 1966.
Convention Establishing the Multilateral Investment Guarantee Agency of 1985, entered into force on 12 April 1988.
Fourth ACP - EEC Convention (Lome IV) of 1989, entered into force on 1st March 1990.
Treaty Establishing the Market for Eastern and Southern Africa (COMESA), 1993.

World Investment Directory Volume X Africa 2008
394
Paris Convention for the Protection of Industrial Property of 1883 (Revised at Brussels in 1900, Washington in 1911, The Hague in 1925, London in 1934, Lisbon in 1958 and Stockholm in 1967, and as amended in 1979). Signed in 1994.
Marrakesh Agreement Establishing the World Trade Organisation of 15 April 1994. Entered into force on 1 January 1995. Agreement on Trade-Related Investment Measures. General Agreement on Trade in Services. Agreement on Trade Related Aspects of Intellectual Property Rights.
Partnership Agreement between the Members of The African, Caribbean and Pacific Group of States, of the one part and the European Community and its member states, of the other part signed in Cotonou, Benin on 23 June 2000.
B. Bilateral treaties
1. Bilateral investment treaties for the protection and promotion of investments: Germany 1962, Switzerland 1964, Norway 1966, Sweden 1966, France 2003, Mauritius 2004, China 2005, Belgium and Luxembourg 2005, Germany 2006, South Africa 2006.
2. Bilateral treaties for the avoidance of double taxation: France 1983, Mauritius 1994.
C. Other treaties:
Investment agreement for the COMESA Common Investment Area (2007).

Madagascar
395
D. Sources of information
Official
Banque Centrale de Madagscar (www.mefb.gov.mg).
Secondary
African Connexion International (1995). “Corporate Law in Madagascar”, 10(2), pp. 34-35.
Andrianomanana, Pépé (2000). “Madagascar”, in World Economic Forum, The Africa Competitiveness
Report, 2000/2001 (New York: Oxford University Press) pp. 144-149.
Delebeque, Philippe (1999). “Le Droit du Commerce International à Madagascar”, in Annuaire des Pays de
l’Océan Indien, XV, 1997-1998 (CERSOL, Aix en Provence: Presses Universitaires d’Aix-Marseille) pp. 123-134.
Economist Intelligence Unit (EIU) (various years). Country Profile: Madagascar (London: EIU Ltd.).
_____________ (various years). Country Report: Madagascar (London: EIU Ltd.).
Fafchamps, M. and B. Minten (1999). “Relationships and Traders in Madagascar”, Journal of Development
Studies, 35(6), August, pp. 1-35.
Foreign Investment Advisory Service (FIAS) (1999). Madagascar: Administrative Barriers, (Washington, D.C.: FIAS), mimeo.
Emery, James (1999). Challenges Faced in Removing Administrative Barriers to FDI, FIAS Seminar, June 25, 1999 (Washington D.C.: FIAS).
Graham & Whiteside Limited (2000). Major Companies of Africa, South of the Sahara, 2000 (Graham & Whiteside Ltd.).
International Monetary Fund (IMF) (2006). IMF's Sub-Saharan Africa Regional Economic Outlook, March 10, 2006. (Washington D.C.: IMF).
Leisinger, Klaus M. (1987). “Multinational Companies and Agricultural Development: A Case Study of ‘Taona Zina’ in Madagascar”, Food Policy, 12(3), August, pp. 227-241.
Oil & Gas Journal (1995). “Madagascar Beckons Foreign Explorationists”, 93(20), May 15, pp. 18-20.
Soderbom, M. and F. Teal (2004). "Size and Efficiency in Africa Manufacturing firms: Evidence from Firm-Level Panel Data." Journal of Development Economics, 73. pp 369 - 394.
Trade Information Center (2000). Madagascar: Investment Climate, Openness to Foreign Investment,
http:/infoserv2.ita.doc.gov/afweb.nsf, November 10.
United Nations Conference on Trade and Development (UNCTAD) (2000). Capital Flows and Growth in
Africa (Geneva: UNCTAD/GDS/MDPB/7), July.
______________(2000). Foreign Direct Investment: Performance and Potential, Geneva: UNCTAD/ITE/IIT/Misc.15), June.

World Investment Directory Volume X Africa 2008
396
____________(2002). FDI in Least Developed Countries at a Glance (Geneva: UNCTAD) (www.unctad.org/en/subsites/dite/LDCs/ pdfs/Countries/benin.pdf).
United Nations Conference on Trade and Development (UNCTAD) (2005a). Investor-Disputes Arising
from Investment Treaties: A Review. UNCTAD Series of International Investment Policies for Development (UNCTAD/ITE/IIT/2005/4).
____________(2005b). A Survey of Support by Investment Promotion Agencies to Linkages. Advisory Studies No. 18 (UNCTAD/ITE/IPC/2005/12).
____________(2005c). FDI in least developed countries at a glance: 2005/2006
(UNCTAD/ITE/IIA/2005/17).
United States Trade Representative (2006). 2006 Comprehensive Report on U.S. Trade and Investment
Policy Toward Sub-Saharan Africa and Implementation of the Africa Growth and Opportunity Act:
The Sixth of Eight Annual Reports, May 2006. (Washington D.C.: US Government).
U.S Embassy Antananarivo (2000). FY 2001 Country Commercial Guides: Madagascar, Washington, D.C.: U.S. Department of State, July, http://www.state.gov/www/ about_state/business/com_guides/2001/africa/index.html.
World Bank (1995). “Madagascar: New Horizons, Building a Strategy for Private-Sector, Export-led Growth”, A Private Sector Assessment (Washington, D.C: The World Bank).
___________(2002). Global Economic Prospects and the Developing Countries 2003: Investing to Unlock
Opportunities (Washington D.C.: World Bank).
___________(2005). Madagascar Investment Climate Assessment. June, 2005.
World Bank/International Finance Corporation (2007). Doing Business 2008 Madagascar (Washington D.C.: The World Bank Group).
World Economic Forum (2000/2001). Africa competitiveness report (New York: Oxford University Press).

Malawi
397
Malawi
A. Definitions and sources of data
Malawi is undertaking a data gathering project with the International Monetary Fund (IMF) and World Bank in order to establish a primary national databank on foreign direct investment (FDI) and the activities of transnational corporations. In this process a foreign company is defined as an external company if it establishes a place of business or owns immovable property in Malawi. It must have at least one Malawian resident director (Investment Promotion Act. Act No. 28 of 1991). The IMF provides data on FDI in Malawi in its balance-of-payments statistics.
Malawi has taken initiatives to create an investor friendly environment and attract more FDI. Except for the repeal of the Forfeiture Act of 1992, there are effective laws derived from the English Common Law to protect foreign investment. The Malawian Investment Promotion Agency (MIPA), established under the Investment Promotion Act of 1991 promotes, encourages and facilitates FDI in Malawi. Currently, MIPA operates as a one-stop investment centre. Under this arrangement, investors are assured of speedy and efficient services on investment approval.
Malawi has also put in place a generous incentive package for FDI. This includes the corporate taxation policy and the special taxation for export-oriented manufacturers. Malawi signed to the Convention on the Settlement of Investment Disputes between State and Nationals of other States on June 9, 1966 and double taxation treaties with eight countries: Denmark, France, the Netherlands, Norway, South Africa, Sweden, Switzerland and the United Kingdom. Malawi is a member of the Southern African Development Community, the Common Market for Eastern and Southern Africa, Multilateral Investment Guarantee Agency, New Partnership for Africa's Development and the African Union. Malawi benefits from the European Union's (EU) duty-free, quota-free access for all products because of its status as a least developed country - the Everything But Arms initiative, and the United States' market access initiative for African countries - the African Growth and Opportunities Act. Also, it is eligible for the Cotonou Agreement for renegotiating the trade partnership agreement between African, Caribbean and Pacific countries with the EU and it is a member of the World Trade Organization.

World Investment Directory Volume X Africa 2008
398
B. Statistics on FDI and the operations of TNCs
Table 1. Summary of FDI
(Millions of dollars)
Variable Inward Outward
1. FDI flows, 2003-2006 (annual average) 62.5 1.1
2. FDI flows as a percentage of GFCF, 2003-2006 (annual average) 11.8 0.6
3. FDI stocks, 2006 640 17
4. FDI stocks as a percentage of GDP, 2006 29.2 0.7
Source: Based on tables 3 and 4 and UNCTAD, FDI/TNC database.
Table 3. FDI flows, by type of investment, 1980-2006 (Millions of dollars)
Inward investment Outward investment
Reinvested Reinvested Year Equity earnings Other Total Equity earnings Other Total
1980 9.5 - - 9.5 - - - -1981 1.1 - - 1.1 - - - -1982 .. - - 6.0 - - - -1983 2.6 - - 2.6 - - - -1984 .. - - 27.3 - - - -1985 0.5 - - 0.5 - - - -1986 .. - - - 2.9 - - - -1987 0.1 - - 0.1 - - - -1988 .. - - 17.4 - - - -1989 .. - - 9.3 - - - -1990 .. - - 23.3 - - - -1991 .. - - - 28.7 - - - -1992 .. - - - 7.1 - - - -1993 .. - - 8.0 - - - -1994 25.0 - - 25.0 - - - -1995 5.6 - - 5.6 - - - -1996 15.8 - - 15.8 - - - 1.91997 14.9 - - 14.9 - - - 0.91998 12.1 - - 12.1 - - - 5.61999 58.5 - - 58.5 - - - 0.12000 27.0 12.6 - 39.6 - - - - 0.62001 3.3 30.4 7.7 41.4 0.0 0.6 4.1 4.72002 10.5 18.0 - 11.8 16.7 - 0.0 0.3 0.32003 0.7 34.6 30.5 65.8 0.4 0.5 0.4 1.32004 4.4 34.4 68.9 107.7 1.2 0.1 0.5 1.82005 - - - 26.5 - - - 1.02006 - - - 29.7 - - - 0.9
Source: UNCTAD, FDI/TNC database (www.unctad.org/statistics). Notes: Data on inflows are from the IMF for 1980-1981, 1983, 1985, 1987 and 19994-1996; OECD for 1982, 1984, 1986, 1988-1989 and the Reserve Bank of Malawi for 1990-1993 and 1997-2006. Data on outflows are estimated by applying the difference in stock for 1996-1998. For 1999-2005, data are from the Reserve Bank of Malawi. Data for 2006 is an estimate.

Malawi
399
Table 4. FDI stocks, by type of investment, 1980-2006
(Millions of dollars)
Inward investment Outward investment
Equity & Equity &
Reinvested Reinvested Reinvested Reinvested
Year earnings earnings Other Total earnings earnings Other Total
1980 .. .. .. 142.9 .. .. .. ..
1981 .. .. .. 144.0 .. .. .. ..
1982 .. .. .. 150.0 .. .. .. ..
1983 .. .. .. 152.6 .. .. .. ..
1984 .. .. .. 179.9 .. .. .. ..
1985 .. .. .. 180.4 .. .. .. ..
1986 .. .. .. 177.4 .. .. .. ..
1987 .. .. .. 177.5 .. .. .. ..
1988 .. .. .. 195.0 .. .. .. ..
1989 .. .. .. 204.3 .. .. .. ..
1990 .. .. .. 227.6 .. .. .. ..
1991 .. .. .. 198.9 .. .. .. ..
1992 .. .. .. 191.8 .. .. .. ..
1993 .. .. .. 199.8 .. .. .. ..
1994 .. .. .. 224.8 .. .. .. ..
1995 .. .. .. 230.4 .. .. .. ..
1996 .. .. .. 246.2 .. .. .. 1.9
1997 .. .. .. 261.1 .. .. .. 2.8
1998 .. .. .. 273.2 .. .. .. 8.4
1999 .. .. .. 331.7 .. .. .. 8.5
2000 226.4 .. 131.3 357.7 .. .. .. 7.9
2001 322.4 .. 96.6 419.0 .. .. .. 12.6
2002 .. .. .. 390.5 .. .. .. 12.2
2003 .. .. .. 409.9 .. .. .. 12.2
2004 .. .. .. 562.3 .. .. .. 13.8
2005 .. .. .. 503.0 .. .. .. 14.8
2006 .. .. .. 535.6 .. .. .. 15.7
Source: UNCTAD, FDI/TNC database (www.unctad.org/statistics). Notes: Data on inward stock prior to 1997 are estimated by subtracting inflows from the stock of 1997. 1997-2006 data are based on the Reserve Bank of Malawi. Outward stock are estimated by accumulating flows since 1996.

World Investment Directory Volume X Africa 2008
400
Table 6. FDI flows in the host economy, by geographical origin, 1995-2006
(Millions of dollars) Economy 1995 1996 1997 1998 1999 2000 2001 2002 2003 2004 2005 2006
Belgium/Luxembourg - - - - - - - - - - - -
Denmark - - - - - - - - - - 1.7 - 0.3
Germany 4.9 2.0 - - 0.6 - - - - - - - 1.2 -
Malaysia 2.4 - 0.4 - 1.4 - - - - - - -
Portugal - - - - 0.0 0.2 3.0 6.9 1.8 0.5 - -
United States 5.0 - - - 5.0 - 3.0 - 3.0 - 2.0 - 1.0 - 3.0 -
Source: UNCTAD, FDI / TNC database.
Note: Data is based on the information reported by the economies listed above.
Table 9. FDI flows abroad, by geographical destination, 1995-2006
(Millions of dollars) Economy 1995 1996 1997 1998 1999 2000 2001 2002 2003 2004 2005 2006
Mozambique - - - - - - - - - - 2.1 0.4
Portugal - - - - - - - - - 0.0 - -
Source: UNCTAD, FDI / TNC database.
Note: Data is based on the information reported by the economies listed above.
Table 15. FDI stocks abroad, by geographical destination, 1995-2006
(Millions of dollars) Economy 1995 1996 1997 1998 1999 2000 2001 2002 2003 2004 2005 2006
United Rep. of Tanzania .. .. .. 10.5 .. .. .. .. .. .. .. ..
Source: UNCTAD, FDI / TNC database.
Note: Data is based on the information reported by the United Republic of Tanzania.

Malawi
401
Table 11. FDI stocks in the host economy, by industry, 1996-2006
(Millions of dollars)
Sector / industry 1996 1997 1998 1999 2000 2001 2002 2003 2004 2005 2006
Total .. .. .. .. 358 491 .. .. .. .. ..
Primary .. .. .. .. 48 65 .. .. .. .. ..
Agriculture, hunting, forestry and fishing .. .. .. .. 48 65 .. .. .. .. ..
Secondary .. .. .. .. 162 205 .. .. .. .. ..
Tertiary .. .. .. .. 146 219 .. .. .. .. ..
Construction .. .. .. .. 0 0 .. .. .. .. ..
Trade .. .. .. .. 80 122 .. .. .. .. ..
Hotels and restaurants .. .. .. .. 1 1 .. .. .. .. ..
Transport, storage and communications .. .. .. .. 34 37 .. .. .. .. ..
Finance .. .. .. .. 28 54 .. .. .. .. ..
Financial Intermediation .. .. .. .. 24 47 .. .. .. .. ..
Insurance and pension funding .. .. .. .. 4 7 .. .. .. .. ..
Business activities .. .. .. .. 1 2 .. .. .. .. ..
Real estate .. .. .. .. 1 2 .. .. .. .. ..
Health and social services .. .. .. .. 1 1 .. .. .. .. ..
Community, social and personal service activities .. .. .. .. 2 2 .. .. .. .. ..
Unspecified .. .. .. .. 2 2 .. .. .. .. ..
Source: National Statistics Office.

World Investment Directory Volume X Africa 2008
402
Table 12. FDI stocks in the host economy, by geographical origin, 1996-2006 (Millions of dollars)
Region / economy 1996 1997 1998 1999 2000 2001 2002 2003 2004 2005 2006
Total world .. .. .. .. 357.7 419.0 390.5 409.9 562.3 .. ..Developed countries .. .. .. .. 201.8 254.5 240.0 253.3 366.2 .. ..
Europe .. .. .. .. 114.5 147.0 147.8 148.4 196.8 .. ..European Union .. .. .. .. 96.9 141.7 143.3 143.8 191.3 .. ..
Austria .. .. .. .. .. 0.0 0.0 0.0 0.0 .. ..Cyprus .. .. .. .. .. 0.6 0.4 0.4 0.4 .. ..Denmark .. .. .. .. .. 0.9 8.8 10.5 14.4 .. ..France .. .. .. .. .. 1.9 5.5 2.8 3.8 .. ..Germany .. .. .. .. .. 6.3 5.5 4.7 5.4 .. ..Ireland .. .. .. .. .. 18.6 24.9 23.5 30.1 .. ..Netherlands .. .. .. .. .. 14.1 14.0 16.5 24.5 .. ..United Kingdom .. .. .. .. 96.9 99.3 84.1 85.2 112.7 .. ..
Other developed Europe .. .. .. .. 17.6 5.3 4.5 4.6 5.6 .. ..Norway .. .. .. .. 17.6 .. .. .. .. .. ..Switzerland .. .. .. .. .. 2.4 1.8 1.5 1.7 .. ..
North America .. .. .. .. 87.3 101.8 88.7 101.5 162.6 .. ..Canada .. .. .. .. .. 0.0 0.1 0.1 0.1 .. ..United States .. .. .. .. 87.3 101.8 88.6 101.5 162.6 .. ..
Other developed countries .. .. .. .. .. 5.7 3.6 3.4 6.8 .. ..Japan .. .. .. .. .. 5.7 3.6 3.4 6.8 .. ..
Developing economies .. .. .. .. 103.6 158.3 144.7 146.8 183.8 .. ..Africa .. .. .. .. 103.6 139.8 126.3 124.2 151.5 .. ..
Botswana .. .. .. .. 0.5 0.5 0.5 0.4 0.5 .. ..Kenya .. .. .. .. 1.0 3.9 4.4 5.3 7.4 .. ..Mauritius .. .. .. .. 15.1 18.7 13.3 18.1 23.0 .. ..Mozambique .. .. .. .. 3.9 2.6 0.7 0.6 5.4 .. ..South Africa .. .. .. .. 75.8 108.1 100.9 93.4 101.2 .. ..Tanzania, United Rep. of .. .. .. .. 0.6 .. .. .. 0.6 .. ..Uganda .. .. .. .. .. .. .. .. 1.2 .. ..Zambia .. .. .. .. .. 0.9 0.8 0.6 0.9 .. ..Zimbabwe .. .. .. .. 6.7 5.1 5.8 5.8 7.2 .. ..
Asia .. .. .. .. .. 18.5 18.4 22.6 32.3 .. ..West Asia .. .. .. .. .. 3.1 2.6 2.3 2.5 .. ..
United Arab Emirates .. .. .. .. .. 3.1 2.6 2.3 2.5 .. ..South, East and South-East Asia .. .. .. .. .. 15.3 15.7 20.3 29.8 .. ..
China .. .. .. .. .. 0.2 0.5 0.7 0.8 .. ..Hong Kong, China .. .. .. .. .. 0.1 0.1 0.2 .. .. ..Malaysia .. .. .. .. .. 13.8 12.2 14.3 20.8 .. ..Taiwan Province of China .. .. .. .. .. 1.2 2.9 5.2 8.1 .. ..
Unspecified .. .. .. .. 52.3 6.3 5.8 9.8 12.3 .. .. Source: National Statistics Office.
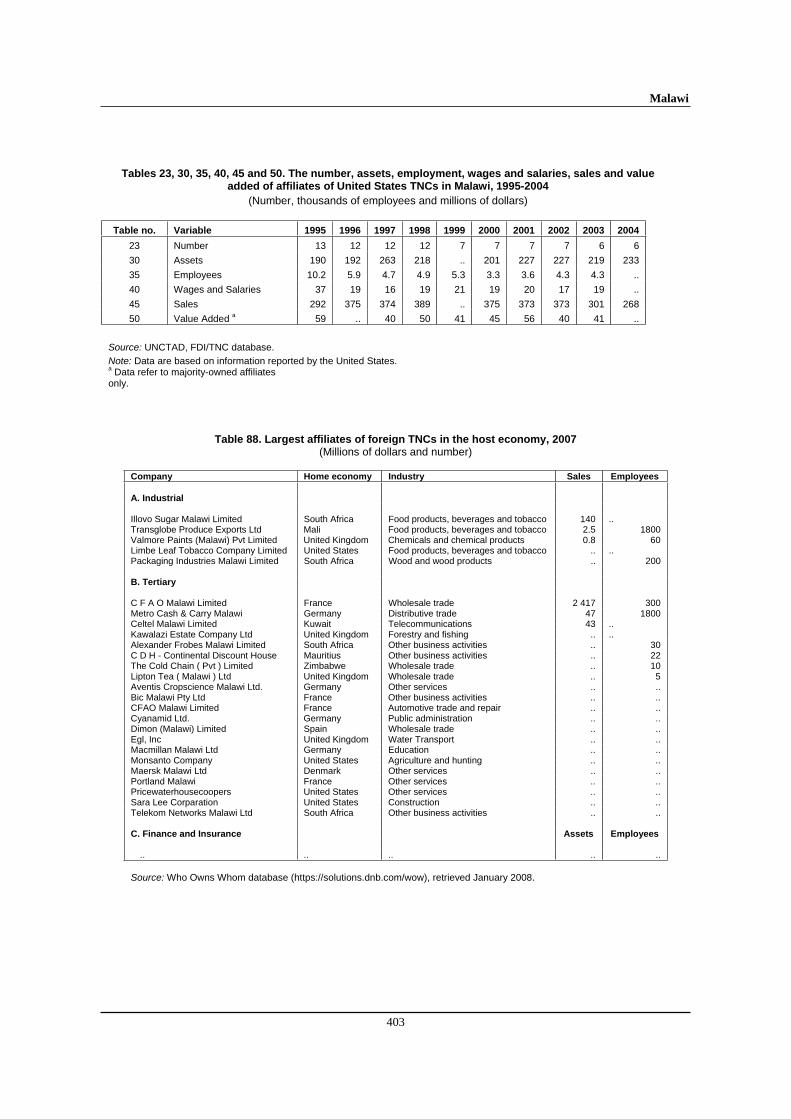
Malawi
403
Tables 23, 30, 35, 40, 45 and 50. The number, assets, employment, wages and salaries, sales and value added of affiliates of United States TNCs in Malawi, 1995-2004
(Number, thousands of employees and millions of dollars)
Table no. Variable 1995 1996 1997 1998 1999 2000 2001 2002 2003 2004
23 Number 13 12 12 12 7 7 7 7 6 6
30 Assets 190 192 263 218 .. 201 227 227 219 233
35 Employees 10.2 5.9 4.7 4.9 5.3 3.3 3.6 4.3 4.3 ..
40 Wages and Salaries 37 19 16 19 21 19 20 17 19 ..
45 Sales 292 375 374 389 .. 375 373 373 301 268
50 Value Added a 59 .. 40 50 41 45 56 40 41 ..
Source: UNCTAD, FDI/TNC database.
Note: Data are based on information reported by the United States. a Data refer to majority-owned affiliates only.
Table 88. Largest affiliates of foreign TNCs in the host economy, 2007 (Millions of dollars and number)
Company Home economy Industry Sales Employees
A. Industrial
Illovo Sugar Malawi Limited South Africa Food products, beverages and tobacco 140 .. Transglobe Produce Exports Ltd Mali Food products, beverages and tobacco 2.5 1800 Valmore Paints (Malawi) Pvt Limited United Kingdom Chemicals and chemical products 0.8 60 Limbe Leaf Tobacco Company Limited United States Food products, beverages and tobacco .. .. Packaging Industries Malawi Limited South Africa Wood and wood products .. 200 B. Tertiary
C F A O Malawi Limited France Wholesale trade 2 417 300 Metro Cash & Carry Malawi Germany Distributive trade 47 1800 Celtel Malawi Limited Kuwait Telecommunications 43 .. Kawalazi Estate Company Ltd United Kingdom Forestry and fishing .. .. Alexander Frobes Malawi Limited South Africa Other business activities .. 30 C D H - Continental Discount House Mauritius Other business activities .. 22 The Cold Chain ( Pvt ) Limited Zimbabwe Wholesale trade .. 10 Lipton Tea ( Malawi ) Ltd United Kingdom Wholesale trade .. 5 Aventis Cropscience Malawi Ltd. Germany Other services .. .. Bic Malawi Pty Ltd France Other business activities .. .. CFAO Malawi Limited France Automotive trade and repair .. .. Cyanamid Ltd. Germany Public administration .. .. Dimon (Malawi) Limited Spain Wholesale trade .. .. Egl, Inc United Kingdom Water Transport .. .. Macmillan Malawi Ltd Germany Education .. .. Monsanto Company United States Agriculture and hunting .. .. Maersk Malawi Ltd Denmark Other services .. .. Portland Malawi France Other services .. .. Pricewaterhousecoopers United States Other services .. .. Sara Lee Corparation United States Construction .. .. Telekom Networks Malawi Ltd South Africa Other business activities .. .. C. Finance and Insurance Assets Employees
.. .. .. .. ..
Source: Who Owns Whom database (https://solutions.dnb.com/wow), retrieved January 2008.

World Investment Directory Volume X Africa 2008
404
C. Legal frameworks for transnational corporations
Many legal instruments - national, bilateral and multilateral apply in the regulation of the activities of the transnational corporations and foreign direct investors in Malawi. The key instruments in the country inclue:
I. National framework
Patents Act No. 13 of 1957 as last amended by Act No. 9 of 1985. Source: Laws of Malawi, Cap. 49:02.
Regulation of Minimum Wages and Conditions of Employment Act No. 4 of 1958 as last amended by Act No. 12 of 1974. Source: Laws of Malawi, Cap. 55:01.
Industrial Designs: Registered Designs Act No. 12, cap. 49:05, December 1958(F). Statute Law (Miscellaneous Amendments) Act No. 9, April 1985; Section 7A: Designs registered under the [ARIPO] Harare Protocol, amending the Registered Designs Act cap. 49:05. Source: WIPO (http://www.wipo.org).
Trade Marks: Trade Marks Act No. 14, cap. 49:01, April 1958(F). Trade Descriptions Act No. 18, August 1987. Source: WIPO (http://www.wipo.org).
Trade Unions Act No. 32 of 1958 as last amended by Act No. 3 of 1963. Source: Laws of Malawi, Cap. 54:01.
Income Taxation Act of 1 January 1964 as amended by Taxation Amendment Act No. 4 of 1988. Effective: 1 April 1988. Source: Laws of Malawi, Cap. 41:01.
Malawi Development Corporation Act No. 13 of 1964. Effective 28 April 1964. Source: Laws of Malawi, Cap. 39:01, pp. 1-13.
Copyright Act No. 38 of 1965 as last amended by Act No. 9 of 26 April 1989; effective on 8 May 1989. Source: Laws of Malawi, Cap. 49:03, and WIPO, Copyright Laws and Treaties, No. 10, October 1990.
Industrial Development Act: effective on 13 January 1967. Source: Laws of Malawi, Cap. 51:01, pp. 1-6.
Industrial Development Rules (Government Notice No. 24/1967) as mended Source: International Center for Settlement of Investment Disputes (ICSID), Investment Laws of the World, August 1984, p. 7.
Partnership Act No. 4 of 1969. Source: Laws of Malawi, Cap. 46:04.
Export Promotion Council Act No. 32 of 1971 as mended by Act No. 16 of 1983. Source: Laws of Malawi, Cap. 39:03.
Property and Business (Presumptions of Ownership), Act No. I 1 of 1974. Source: Laws of Malawi, Cap. 46:05.
Malawi
405
Companies Act No. 19 of 1984; effective on 1 April 1986. Source: Malawi Gazette Supplement, No. 3C of 7 December 1984.
Statute Law (Miscellaneous Amendments) Act No. 9, April 1985; Section 10A: Patents granted under the ARIPO Harare Protocol, amending the Patents Act cap. 49:02. Source: WIPO (http://www.wipo.org).
Companies (Winding-up) Rules 1986 (Government Notice No. 29 of 7 February 1986). Effective:. 1 April 1986. Source: Malawi Gazette Extraordinary, Supplement No. 9A of 14 March 1986„ p. 147.
Companies (Second Schedule) (Amendment) Regulations 1986 (Government Notice No. 21 of 20 February 1985). Effective: 1 April 1986, p. 97. Source: Malawi Gazette Extraordinary, Supplement No. 9A of 14 March 1986, p. 97.
Companies (Fees) Regulations 1986 (Government Notice No. 22 of 20 February 1986); effective on 1 April 1986. Source: Malawi Gazette Extraordinary, Supplement No. 9A of 14 March 1986, p. 97.
External Companies Accounts Regulations 1986 (Government Notice No. 26 of 20 February 1986); effective on 1 April 1986. Source: Malawi Gazette Extraordinary, Supplement No. 9A of 14 March 1986„ p. 137.
Malawi Development Corporation (Amendment) Act No. 11 of 3 April 1986; date of assent 23 April 1986. Source: Malawi Gazette Supplement, 5 May 1986.
Statement of Development Policies, 1987-1996. Source: Office of the President and Cabinet, Department of Economic Planning and Development, Lilongwe.
Industrial Development (Amendment) Rules of 22 March 1989 (Government Notice No. 35). Source: Malawi Gazette Supplement, No. 13A of 12 May 1989, p. 149.
Industrial Licensing Act 1991 (Amending the Industrial Development Act of 1967) Source: Ministry of Trade, Industry and Tourism, Lilongwe, May 1991.
Investment Promotion Act. Act No. 28 of 1991, assented to by the President on 24 January 1992; effective on 16 March 1992. Source: Malawi Gazette Supplement No. 2C of 16 March 1992.
II. International Framework
A. Malawi is a party to the following multilateral and regional instruments:
Convention on the Settlement of Investment Disputes between States and Nationals of other States of 1965. Entered into force on 14 October 1966.
Convention Establishing the Multilateral Investment Guarantee Agency of 1985, entered into force on 12 April 1988.
Fourth ACP - EEC Convention (Lome IV) of 1989, entered into force on 1st March 1990.
Charter on a Regime of Multinational Industrial Enterprises (MIEs) in the Preferential Trade Area for Eastern and Southern African States (PTA), signed on 21 November 1990, entered into force August 1995.

World Investment Directory Volume X Africa 2008
406
Source: Preferential Trade Area for Eastern ans Southern African States: Report of the Sixteenth Meeting of the Council of Ministers, 17-19 november, 1990, Mbabane, Swaziland (PTA/CM/XVI/2)
Southern Africa Development Community (SADC), signed on 17 August, 1992.Source: http://www.sadc.int/about_sadc/history.php.
Treaty Establishing the Market for Eastern and Southern Africa (COMESA), 1993.
Paris Convention for the Protection of Industrial Property of 1883 (Revised at Brussels in 1900, Washington in 1911, The Hague in 1925, London in 1934, Lisbon in 1958 and Stockholm in 1967, and as amended in 1979). Signed in 1994.
Marrakesh Agreement Establishing the World Trade Organisation of 15 April 1994. Entered into force on 1 January 1995. Agreement on Trade-Related Investment Measures. General Agreement on Trade in Services. Agreement on Trade Related Aspects of Intellectual Property Rights.
Partnership Agreement between the Members of The African, Caribbean and Pacific Group of States, of the one part and the European Community and its member states, of the other part signed in Cotonou, Benin on 23 June 2000.
B. Bilateral treaties
1. Bilateral investment treaties for the protection and promotion of investments: Taiwan Province of China 1995, Malaysia 1996, Egypt 1997, Italy 2003, Netherlands 2003, Zimbabwe 2003.
2. Bilateral treaties for the avoidance of double taxation: Sweden 1954, United Kingdom 1955, Denmark 1959, France 1963, Norway 1963, Switzerland 1965, Netherlands 1969, South Africa 1971.
C. Other treaties:
Investment agreement for the COMESA Common Investment Area (2007).

Malawi
407
D. Sources of information
Official
Reserve Bank of Malawi (www.rbm.malawi.net).Malawi Investment Promotion Agency (MIPA - www.it-ab.net).
Secondary
Bennell, Paul (1997). "Foreign direct investment in Africa: rhetoric and reality", SAIS Review (Summer/Fall), pp. 127-139.
____________(1997). "Privatization in Sub-Saharan Africa: progress and prospects during the 1990s", World Development, vol. 25, no. 11, pp. 1785-1803.
Broll, U. (2003). "Foreign direct investment, credible policy: the role of risk sharing". International trade journal, vol. XVII, No. 2., pp. 165 – 176.
Dahl, J. (2002). "Incentives for foreign direct investments – the case of SADC in the 1990s" (Namibia: NEPRU, Working paper).
Economist Intelligence Unit (EIU) (various years). Country Profile: Malawi (London: EIU Ltd.).
____________ (various years). Country Report: Malawi (London: EIU Ltd.).
International Finance Corporation (IFC) (1997). "Foreign direct investment", IFC: lessons of experience series No. 5, (Washington, D.C.: World Bank).
International Monetary Fund (IMF) (2006). IMF's Sub-Saharan Africa Regional Economic Outlook, March 10, 2006. (Washington D.C.: IMF).
Soderbom, M. and F. Teal (2004). "Size and Efficiency in Africa Manufacturing firms: Evidence from Firm-Level Panel Data." Journal of Development Economics, 73. pp 369 - 394.
United Nations Conference on Trade and Development (1995). Foreign Direct Investment in Africa
(Geneva: United Nations, United Nations publication, Sales No. E.95.II.A.6).
____________ (2000). Capital Flows and Growth in Africa (Geneva: UNCTAD/GDS/MDPB/7), July.
_____________(2003). FDI in Landlocked Developing Countries at a Glance (Geneva: UNCTAD/ITE/IIA/2003/5).
_____________(2005a). Investor-Disputes Arising from Investment Treaties: A Review. UNCTAD Series of International Investment Policies for Development (UNCTAD/ITE/IIT/2005/4).
_____________(2005b). A Survey of Support by Investment Promotion Agencies to Linkages. Advisory Studies No. 18 (UNCTAD/ITE/IPC/2005/12).
_____________(2005c). FDI in least developed countries at a glance: 2005/2006
(UNCTAD/ITE/IIA/2005/17).
United States Trade Representative (2006). 2006 Comprehensive Report on U.S. Trade and Investment
Policy Toward Sub-Saharan Africa and Implementation of the Africa Growth and Opportunity Act:
The Sixth of Eight Annual Reports, May 2006. (Washington D.C.: US Government).

World Investment Directory Volume X Africa 2008
408
World Bank/International Finance Corporation (2007). Doing Business 2008 Malawi (Washington D.C.: The World Bank Group).

Mali
409
Mali
A. Definitions and sources of data
Mali has no explicit definition of foreign direct investment (FDI). In the national Investment Law (Loi 91-48/ANRM du mars 1991) it is regarded as part of investment, in the spirit of the law, the funding of assets and of the initial working capital in the framework of a development project. The data on FDI to Mali were gathered from the Banque Centrale des Etats de l'Afrique de l'Ouest. The International Monetary Fund also reports data on FDI in the country in its balance-of-payment statistics.
In Mali, the investment code allows foreign investors to have full ownership of new business. The Government of Mali also embraces a liberalization agenda that includes partly or fully privatizing or liquidating of public enterprises, without much restriction on foreign participation. As a result, the mining industry is gradually picking up as gold accounted for a large part of exports. The country is now Africa's third largest producer of gold.
As a standard practice in project approval, prospective investors must go through the same screening process as domestic investors. The "guichet unique" (one-stop shop procedure) is the body responsible for application processing. Residents and non-residents may hold foreign exchange accounts with permission from the Government and regional central banks. Criteria for granting authorization under the investment code include the size of capital investment, the potential for value-added and job creation. Transfer of money to countries except France, Monaco, West African Economic Monetary Union members, Central African Economic and Monetary Community member states and Comoros require Government approval. Credit and loan operations, issues and purchases of securities, derivatives, and other instruments are subject to various requirements, controls and authorization depending on the transaction. Purchase of real estate requires an authorization from the Ministry of Finance.
Mali signed to the Convention on the Settlement of Investment Disputes between State and Nationals of other States on 9 April 1966 and is a member of the West African Economic and Monetary Union, the African Union, New Partnership for Africa's Development, Economic Community of West African States, the Union Economique et Monetaire Ouest-Africaine and the Comite permanent inter-Etats de lutte contre la Secheresse dans le Sahel. As a least developed country, Mali benefits from the European Union (EU) generalized system of preferences – Everything But Arms initiative and the Cotonou agreement for renegotiating the partnership links between the African, Caribbean and Pacific countries with the EU, under the Lomé Convention. It is also an eligible for the United States' market access initiative for African countries – the African Growth and Opportunity Act. Mali is a signatory to New York convention of 1958 on the recognition and enforcement of foreign arbitrage awards and a member of the World Trade Organization.

World Investment Directory Volume X Africa 2008
410
B. Statistics on FDI and the operations of TNCs
Table 1. Summary of FDI
(Millions of dollars)
Variable Inward Outward
1. FDI flows, 2003-2006 (annual average) 160.5 0.5
2. FDI flows as a percentage of GFCF, 2003-2006 (annual average) 14.7 0.0
3. FDI stocks, 2006 1 057 84
4. FDI stocks as a percentage of GDP, 2006 17.1 1.4
Source: Based on tables 3a and 4a and UNCTAD, FDI/TNC database.

Mali
411
Table 3a. FDI flows, by type of investment, 1980-2006
(Millions of dollars)
Inward investment Outward investment
Reinvested Reinvested
Year Equity earnings Other Total Equity earnings Other Total
1980 .. .. 2.4 2.4 .. .. .. -
1981 .. .. 3.7 3.7 .. .. .. -
1982 .. .. 1.5 1.5 .. .. .. -
1983 .. .. 3.2 3.2 .. .. .. -
1984 .. .. 10.1 10.1 .. .. .. -
1985 .. .. 2.9 2.9 .. .. .. -
1986 .. .. - 8.4 - 8.4 .. .. .. -
1987 .. .. - 6.0 - 6.0 .. .. .. 0.2
1988 .. 1.7 5.3 7.1 .. .. .. 0.1
1989 .. 3.7 2.7 6.4 .. .. .. - 0.3
1990 .. 1.6 4.1 5.7 .. .. .. 0.2
1991 .. .. 1.2 1.2 .. .. .. - 1.0
1992 .. 2.2 - 24.1 - 21.9 .. .. .. 1.5
1993 .. - 8.0 12.0 4.2 .. .. .. 0.0
1994 .. - 2.2 19.7 17.5 .. .. .. 0.0
1995 - 5.1 106.3 111.4 - - - 0.0
1996 16.0 15.3 13.5 43.4 - - 1.6 3.9
1997 - 4.5 17.6 49.9 69.7 - - - 6.8 4.5
1998 0.1 34.9 - 26.2 8.9 - - - 0.0 26.9
1999 - 23.8 55.1 - 29.0 2.2 0.0 - 0.0 0.8 0.8
2000 19.5 24.5 38.5 82.4 0.6 - 0.0 3.5 4.0
2001 - 80.9 115.6 87.0 121.7 - 0.7 0.8 17.2 17.3
2002 256.3 72.2 - 84.7 243.8 0.3 - 0.0 1.2 1.6
2003 50.5 - 3.7 85.4 132.3 0.4 - 0.0 1.0 1.4
2004 - 2.1 93.9 9.2 101.0 1.7 - 0.0 - 0.9 0.8
2005 46.0 38.8 139.0 223.8 1.5 - 0.0 - 2.4 - 0.9
2006 .. .. .. 185.0 .. .. .. 0.8 Source: UNCTAD, FDI/TNC database (www.unctad.org/statistics). Notes: Data on inflows are from the IMF for 1980-1992 and 1998, the Banque Centrale de l'Afrique de l'Ouest (BCEAO) for 1993-1997 and 1999-2005, and estimate for 2006. Outflows are from the BCEAO for 1993-2005 and estimate for 2006. For 1987-1992, proxy data were used based on investments reported by the following economies: 1987-1989, Belgium and Luxembourg; 1990, France and 1991-1992, Belgium and Luxembourg and France.
Table 3b. FDI flows, by type of investment, 1999-2005
(Millions of CFA francs)
Inward investment Outward investment
Reinvested Reinvested
Year Equity earnings Other Total Equity earnings Other Total
1999 - 14 684 33 910 - 17 885 1 341 10 - 0.01 500 510
2000 13 894 17 424 27 377 58 695 395 - 0.01 2 462 2 857
2001 - 59 321 84 751 63 804 89 234 - 541 562 12 636 12 657
2002 178 639 50 337 - 59 047 169 929 237 - 0.01 860 1 097
2003 29 339 - 2 122 49 653 76 870 253 - 0.01 574 827
2004 - 1 112 49 628 4 842 53 358 890 - 0.01 - 477 413
2005 24 259 20 481 73 309 118 049 772 - 0.01 - 1 267 - 495
Source: UNCTAD, FDI/TNC database based on the Banque Centrale de l'Afrique de l'Ouest (BCEAO), unpublished.

World Investment Directory Volume X Africa 2008
412
Table 4a. FDI stocks, by type of investment, 1980-2006
(Millions of dollars)
Inward investment Outward investment
Equity & Equity &
Reinvested Reinvested Reinvested Reinvested
Year earnings earnings Other Total earnings earnings Other Total
1980 .. .. .. 203.3 .. .. .. 22.1
1981 .. .. .. 206.9 .. .. .. 22.1
1982 .. .. .. 208.5 .. .. .. 22.1
1983 .. .. .. 211.6 .. .. .. 22.1
1984 .. .. .. 221.7 .. .. .. 22.1
1985 .. .. .. 224.6 .. .. .. 22.1
1986 .. .. .. 216.2 .. .. .. 22.1
1987 .. .. .. 210.2 .. .. .. 22.3
1988 .. .. .. 217.3 .. .. .. 22.3
1989 .. .. .. 223.6 .. .. .. 22.1
1990 .. .. .. 229.4 .. .. .. 22.2
1991 .. .. .. 230.6 .. .. .. 21.2
1992 .. .. .. 208.7 .. .. .. 22.8
1993 .. .. .. 212.9 .. .. .. 22.8
1994 .. .. .. 230.3 .. .. .. 22.8
1995 .. .. .. 341.7 .. .. .. 22.8
1996 .. .. .. 385.1 .. .. .. 26.7
1997 .. .. .. 454.8 .. .. .. 31.2
1998 .. .. .. 309.9 .. .. .. 58.1
1999 78.5 .. 149.6 228.1 0.0 .. 0.7 59.0
2000 79.2 .. 53.2 132.4 0.6 .. 0.1 63.0
2001 81.9 .. 128.6 210.4 0.0 .. 15.8 80.2
2002 461.6 .. 62.5 524.2 0.4 .. 1.7 81.8
2003 551.4 .. 131.2 682.6 5.2 .. 1.4 83.2
2004 682.9 .. 73.5 756.4 7.5 .. 2.7 84.0
2005 654.6 .. 217.0 871.6 6.6 .. 1.3 83.1
2006 .. .. .. 1 056.6 .. .. .. 83.8
Source: UNCTAD, FDI/TNC database (www.unctad.org/statistics). Notes: Data on inward stock prior to 1997 are estimated by subtracting inflows from the 1997 stock. 1997-1998 are based the IMF. 1999-2005 are based on the Banque Centrale de l'Afrique de l'Ouest (BCEAO). 2006 is estimated by adding flows to the 2005 stock. Outward stock data are estimated by accumulating inflows since 1975.
Table 4b. FDI stocks, by type of investment, 1999-2005
(Millions of Franc de la Communauté financière africaine)
Inward investment Outward investment
Equity & Equity &
Reinvested Reinvested Reinvested Reinvested
Year earnings earnings Other Total earnings earnings Other Total
1999 51 266 .. 97 669 148 935 10 .. 430 440
2000 55 809 .. 37 501 93 310 395 .. 53 448
2001 60 940 .. 95 685 156 625 21 .. 11 790 11 811
2002 288 752 .. 39 109 327 861 237 .. 1 057 1 294
2003 286 381 .. 68 156 354 537 2 703 .. 729 3 432
2004 328 857 .. 35 389 364 246 3 593 .. 1 309 4 902
2005 363 962 .. 120 677 484 639 3 677 .. 697 4 374
Source: UNCTAD, FDI/TNC database based on the Banque Centrale de l'Afrique de l'Ouest (BCEAO), unpublished.

Mali
413
Table 6. FDI flows in the host economy, by geographical origin, 1995-2006 (Millions of dollars)
Economy 1995 1996 1997 1998 1999 2000 2001 2002 2003 2004 2005 2006
China - - - - - - - - 5.4 - - -Denmark - - - - - - - - - - - 0.2 0.2France - 17 11 13 37 - 119 17 - 6 16 9 22 10Germany - - - - - - - 0.9 - 0.9 - 1.2 - 6.2 -Portugal - - - - - 0.1 0.7 - - 0.0 - -Sweden - - - - - - - - 16.4 - 0.9 - 2.2 - 15.3United States - 16.0 23.0 1.0 1.0 - - - 5.0 - - - -Source: UNCTAD, FDI / TNC database. Note: Data are based on information reported by the economies listed above.
Table 9. FDI flows abroad, by geographical destination, 1995-2006 (Millions of dollars)
Economy 1995 1996 1997 1998 1999 2000 2001 2002 2003 2004 2005 2006
France - - 2.2 - 2.2 - 1.1 - - 0.9 3.8 5.6 3.7 - 1.3Germany - - - 0.6 - - - - - - - -Lithuania - - 0.0 - 0.1 - - - - - - -Portugal - 0.4 - - - - - - - - - -Source: UNCTAD, FDI / TNC database. Note: Data are based on information reported by the economies listed above.
Table 12. FDI stocks in the host economy, by geographical origin, 1995-2006 (Millions of dollars)
Economy 1995 1996 1997 1998 1999 2000 2001 2002 2003 2004 2005 2006
Canada 9.5 - - - - - - - - - - -China - - - - - - - - 12.1 13.2 13.3 -Denmark - - - - - - - - - 2.2 1.4 1.8Morocco - - - - - - - 6.5 7.8 8.6 7.4 12.1United States 3.0 202.0 225.0 5.0 5.0 5.0 2.0 - 5.0 - - - -Source: UNCTAD, FDI / TNC database. Note: Data are based on information reported by the economies listed above.
Table 15. FDI stocks abroad, by geographical destination, 1995-2006 (Millions of dollars)
Economy 1995 1996 1997 1998 1999 2000 2001 2002 2003 2004 2005 2006
Lithuania - 0.1 0.2 0.1 - - - - - - - -Source: UNCTAD, FDI/TNC database. Note: Data are based on information reported by Lithuania. Tables 23, 30, 35, 40, 45 and 50. The number, assets, employment, wages and salaries, sales and value added
of affiliates of United States TNCs in Mali, 1995-2006 (Number, thousands of employees and millions of dollars)
Table no./Variable 1995 1996 1997 1998 1999 2000 2001 2002 2003 2004 2005 2006
23. Number 1 3 3 1 1 1 1 1 1 1 .. ..30. Assets 8 .. 437 10 .. .. .. .. .. .. .. ..35. Employees 0.1 0.9 0.9 0.1 .. .. .. .. .. .. .. ..40. Wages and salaries .. 20 10 .. .. .. .. .. .. .. .. ..45. Sales .. 131.0 69.0 17.0 .. .. .. .. .. .. 50. Value added a 7 34 24 7 .. .. .. .. .. .. .. ..Source: UNCTAD, FDI/TNC database. Note: Data are based on information reported by the United States. a Majority-owned affiliates only.

World Investment Directory Volume X Africa 2008
414
Table 86. Largest home-based TNCs, 2007 (Billions of dollars)
Company Industry Sales
A. Industrial
Cie Malienne de Development des Textiles Clothing and textiles 437a
Société des Mines de Morila Mning 296Société d'Exploitation des Mines d'Or de Sadiola Mning 198Énergy du Mali Electricity/gas/water 124
a
B. Tertiary
Ethiopian Airlines Air Transportation 491Ethiopian Telecommunication Corporation Telecommunication 193Sté Télécommunications du Mali Telecommunication 152Ikatel Mali Telecommunication 124Groupe Tomota Diversified group 104
a
C. Finance and Insurance Assets
.. .. .. Source: Jeune Afrique Hors-serie No. 14, 2007.a 2004.
Table 87. Largest affiliates of home-based TNCs, 2007
(Millions of dollars and number) Company Name Host Economy Industry Sales Employees
A. Industrial
.. .. .. .. ..
B. Tertiary
Transglobe Produce Exports Ltd Malawi
Food products, beverages and tobacco 3 1800
C. Finance and insurance Assets Employees
.. .. .. .. ..
Source: Who Owns Whom database (https://solutions.dnb.com/wow), retrieved January 2008.

Mali
415
Table 88. Largest affiliates of foreign TNCs in the host economy, 2007
(Millions of dollars and number)
Company Home economy Industry Sales Employees
A. Industrial
Société Malienne De Gaz Industriel SA France Electricity, gas and water 2.0 26
Tambaoura Minings Company SA Canada Mining and quarrying .. 488
Mts Mali France Petroleum .. ..
B. Tertiary
Laborex Mali SA France Wholesale trade 166.2 55
CFAO Technologies Mali SA France Computer and related activities .. 61
Hydrosahel France Research and development .. 65
Société Auxilliaire De Distribution D' Eaux France Other services .. ..
Société Moderne Du Pneumatique Malien France Wholesale trade .. ..
Timac Agro Mali France Public administration .. ..
C. Finance and Insurance Assets Employees
Agf Mali Assurances Germany Insurance .. .. Source: Who Owns Whom database (https://solutions.dnb.com/wow), retrieved January 2008.

World Investment Directory Volume X Africa 2008
416
C. Legal frameworks for transnational corporations
Mali had adopted a number of national, bilateral and multilateral legal instruments to regulate the activities of transnational corporations and foreign direct investors. The following key legal instruments apply in the country:
I. National framework
Law 91-048/AN-RM of 26 February 1991, concerning the Investment Code. Repeals the Investment Code of 8 March 1986. Source: Republic of Mali. Ministry of Industries, Hydraulic and Energy-Direction of Industry, No. 324 of 13 March 1991 (official copy).
Implementation Decree No. 91-079 of 4 March 1991. Source: Republic of Mali. Ministry of Industries, Hydraulic and Energy-Direction of Industry, No. 324 of 13 March 1991 (official copy).
Law No. 92-002 concerning the Commercial Code of Mali. Source: Ministry of Economy, Finance and Planning (official copy), 1993.
Decree 92.028 of 14 May 1992 concerning the Real Property Investment Code. Source: Ministry of Economy, Finance and Planning (official copy), 1993.
Law No. 84/AN-RM, October 1994, abrogating and superseding the Ordinance No. 17-46, July 1977, and creating the Literary and Artistic Property Régime. Source: WIPO (http://www.wipo.org/about-ip/en/ipworldwide/pdf/ml.pdf).
Privatisation plan, Sept 2006 Source: www.eiu.com EIU Country report Main report Nov 2006.
II. International Framework
A. Mali is a party to the following multilateral and regional instruments:
Convention on the Recognition and Enforcement of Foreign Arbitral Awards of 1958, which entered into force on 7 June 1959.
Convention on the Settlement of Investment Disputes between States and Nationals of other States of 1965. Entered into force on 14 October 1966.
Bangui Agreement of March 2, 1977 (Annex I), since September 1984, as last amended in February 1999. Source: WIPO (http://www.wipo.org/about-ip/en/ipworldwide/pdf/ml.pdf).
Bangui Agreement of March 2, 1977 (Annex II), since September 1984, as last amended in February 1999. Source: WIPO (http://www.wipo.org/about-ip/en/ipworldwide/pdf/ml.pdf).
Bangui Agreement of March 2, 1977 (Annex III), since September 1984, as last amended in February 1999. Source: WIPO (http://www.wipo.org/about-ip/en/ipworldwide/pdf/ml.pdf).
Agreement for the Promotion, Protection and Guarantee of Investment Among Member States of the Organization of Islamic Conference, of I June 1981; entered into force on 23 September 1986.

Mali
417
Convention Establishing the Multilateral Investment Guarantee Agency of 1985, entered into force on 12 April 1988.
Fourth ACP - EEC Convention (Lome IV) of 1989, entered into force on 1st March 1990.
Articles of Agreement of the Islamic Corporation for the Insurance of Investment and Export Credit of 19 February 1992. Entered into force on 1 August 1994.
West African Economic and Monetary Union (WAEMU), signed in Dakar, Senegal 10 January 1994.
Paris Convention for the Protection of Industrial Property of 1883 (Revised at Brussels in 1900, Washington in 1911, The Hague in 1925, London in 1934, Lisbon in 1958 and Stockholm in 1967, and as amended in 1979). Signed in 1994.
Marrakesh Agreement Establishing the World Trade Organisation of 15 April 1994. Entered into force on 1 January 1995. Agreement on Trade-Related Investment Measures. General Agreement on Trade in Services. Agreement on Trade Related Aspects of Intellectual Property Rights.
Partnership Agreement between the Members of The African, Caribbean and Pacific Group of States, of the one part and the European Community and its member states, of the other part signed in Cotonou, Benin on 23 June 2000.
B. Bilateral treaties
1. Bilateral investment treaties for the protection and promotion of investments: Germany 1977, Switzerland 1978, Tunisia 1986, Algeria 1996, Egypt 1998, Korea, Democratic People's Republic of 1999, Benin 2001, Cameroon 2001, Chad 2001, Comoros 2001, Guinea 2001, Qatar 2002, Netherlands 2003, Gabon 2005, Senegal 2005.
2. Bilateral treaties for the avoidance of double taxation: France 1972, Algeria 1999.

World Investment Directory Volume X Africa 2008
418
D. Sources of information
Official
Banque Centrale des Etats De L'Afrique De L'Ouest (www.bceao.int).
Secondary
Dessallien, R et al. (2001). Strategie de reduction de la pauvrete; Experience du Mali (Quebec: IDEA International).
Economist Intelligence Unit (EIU) (various years). Country Profile: Mali (London: EIU Ltd.).
______________ (various years). Country Report: Mali (London: EIU Ltd.).
International Monetary Fund (IMF) (2006). IMF's Sub-Saharan Africa Regional Economic Outlook, March 10, 2006. (Washington D.C.: IMF).
Republique du Mali (1994). Loi 94-041 du 22 auot 1994 portant Principes fondamentaux de la privatisation des entreprises du secteur public.
Soderbom, M. and F. Teal (2004). "Size and Efficiency in Africa Manufacturing firms: Evidence from Firm-Level Panel Data." Journal of Development Economics, 73. pp 369 - 394.
United Nations Conference on Trade and Development (UNCTAD) (2007). An investment guide to Mali.
____________(2005a). Investor-Disputes Arising from Investment Treaties: A Review. UNCTAD Series of International Investment Policies for Development (UNCTAD/ITE/IIT/2005/4).
____________(2005b). A Survey of Support by Investment Promotion Agencies to Linkages. Advisory Studies No. 18 (UNCTAD/ITE/IPC/2005/12).
____________(2005c). FDI in least developed countries at a glance: 2005/2006
(UNCTAD/ITE/IIA/2005/17).
United Nations Development Programme (UNDP) -World Bank (1989). "Mali: Economic Policy and International Trade", Country Report 3 (New York: UNDP).
United States Trade Representative (2006). 2006 Comprehensive Report on U.S. Trade and Investment
Policy Toward Sub-Saharan Africa and Implementation of the Africa Growth and Opportunity Act:
The Sixth of Eight Annual Reports, May 2006. (Washington D.C.: US Government).
World Bank (2005). Une evaluation du Climat des Investissements; Mali. Juin 2005. Rapport No. xxxx - Mali.
World Bank/International Finance Corporation (2007). Doing Business 2008 Mali (Washington D.C.: The World Bank Group).
Mauritania
419
Mauritania
A. Definitions and sources of data
In Mauritania, the Investment Code (Ordonnance No. 89.013/CMSN of January 1989 and its revision number 71.028) does not contain a specific definition of foreign direct investment (FDI). But, foreign capital investment is defined as the contributions of foreign currency or new capital equipment in an enterprise, on the condition that it offers shares or stocks; the reinvestment of profits, which could have been transferred abroad; and the repurchase of existing enterprises or participation in existing enterprises effected by a return of foreign currency. The International Monetary Fund provides data on FDI in Mauritania in its balance-of-payments statistics.
Mauritania has considerable known quantities of mineral resources, notably iron ore, copper, cobalt, diamonds, gold, gypsum and phosphates, but reserves have yet to be fully surveyed and only iron ore is exploited industrially. Oil was discovered under the seabed off Nouakchott. Mauritania’s coastal waters also constitute one of the world’s richest fishing grounds. To improve the climate for inflow of investment, the 1989 investment code is continuously being updated to address the needs of foreign investors. In 1998, the mining code was updated and a new commercial code was drafted in 1999.
Mauritania offers several guarantees to foreign investors and these include availability of hard currency to import all goods and services needed for operating the enterprise and for repaying loans contracted; freedom to transfer foreign capital; ability to transfer professional income of foreign employees; protecting vested interests and equal treatment of Mauritanian and foreign individuals and legal entities. There is no legal or policy restrictions on converting or transferring funds associated with an investment. Government revenue has grown significantly since 2004, encouraging infrastructure investments.
Mauritania has also instituted measures to address investment disputes as well as respect property rights. Mauritania is a signatory to the procedures of arbitration through World Bank Group's Convention on the Settlement of Disagreements Related to Investments between states and citizens of other states and the 1958 New York Convention on the Recognition and Enforcement of Foreign Arbitral Awards. Mauritania is a member of the Multilateral Investment Guarantee Agency and the African Organization of Intellectual Property. In addition, Mauritania subscribes to the Paris Convention for the Protection of Industrial Property, the Berne Convention for the Protection of Literary and Artistic Works and the World Intellectual Property Organization.
Mauritania is also eligible for a wide access for its exports. It has signed bilateral investment agreement with the Arab Maghreb Union and Saudi Arabia. It has signed three fisheries agreements with the European Union (EU) and is party to the Cotonou Agreement for renegotiating the trade links with African, Caribbean and Pacific countries with the EU under the Lomé Convention. Mauritania is a member of the African Union, New Partnership for Africa's Development, eligible for the Everything But Arms initiative and the United States' market access initiative for African countries – the Africa Growth and Opportunity Act.

World Investment Directory Volume X Africa 2008
420
B. Statistics on FDI and the operations of TNCs
Table 1. Summary of FDI
(Millions of dollars)
Variable Inward Outward
1. FDI flows, 2003-2006 (annual average) 377.9 1.3
2. FDI flows as a percentage of GFCF, 2003-2006 (annual average) 192.7 0.6
3. FDI stocks, 2006 1 802 9
4. FDI stocks as a percentage of GDP, 2006 67.7 0.4
Source: Based on tables 3 and 4 and UNCTAD, FDI/TNC database.
Table 3. FDI flows, by type of investment, 1980-2006 (Millions of dollars)
Inward investment Outward investment
Reinvested Reinvested
Year Equity earnings Other Total Equity earnings Other Total
1980 27.1 - - 27.1 - - - -
1981 12.4 - - 12.4 - - - -
1982 15.0 - - 15.0 - - - -
1983 1.4 - - 1.4 - - - -
1984 8.5 - - 8.5 - - - -
1985 7.0 - - 7.0 - - - -
1986 4.5 - - 4.5 - - - 1.4
1987 1.7 - - 1.7 - - - 0.2
1988 1.9 - - 1.9 - - - 0.9
1989 3.5 - - 3.5 - - - -
1990 6.7 - - 6.7 - - - -
1991 2.3 - - 2.3 - - - -
1992 7.6 - - 7.0 - - - - 0.2
1993 16.1 - - 16.8 - - - 0.2
1994 2.1 - - 2.8 - - - 1.2
1995 7.0 - - 6.8 - - - 0.2
1996 - - - - 0.4 - - - 0.2
1997 - - - - 3.3 - - - 0.2
1998 0.1 - - - 0.3 - - - 0.1
1999 - - - 15.1 - - - -
2000 - - - 40.1 - - - -
2001 - - - 76.7 - - - -
2002 - - - 67.4 - - - -
2003 - - - 101.9 - - - - 1.0
2004 - - - 391.6 - - - 4.0
2005 - - - 863.6 - - - 2.0
2006 - - - 154.6 - - - -
Source: UNCTAD, FDI/TNC database (www.unctad.org/statistics). Notes: Data on inflows are from the IMF for 1980-1991 and the Banque Centrale de Mauritanie thereafter. Data on outflows are from the IMF for 1986-1988. Thereeafter, proxy data was used based on investments reported by the following economies: 1992, Belgium and Luxembourg and France. 1993 and 1995-1997, France. 1994, Belgium and Luxembourg, China and France. 1998, Lithuania. 2003-2005, United States.

Mauritania
421
Table 4. FDI stocks, by type of investment, 1980-2006 (Millions of dollars)
Inward investment Outward investment
Reinvested Reinvested Year Equity earnings Other Total Equity earnings Other Total
1980 - - - - 3.4 - - - .. 1981 - - - 9.0 - - - .. 1982 - - - 24.0 - - - .. 1983 - - - 25.4 - - - .. 1984 - - - 33.9 - - - .. 1985 - - - 40.9 - - - .. 1986 - - - 45.4 - - - 1.4 1987 - - - 47.0 - - - 1.6 1988 - - - 49.0 - - - 2.5 1989 - - - 52.4 - - - 2.5 1990 - - - 59.2 - - - 2.5 1991 - - - 61.4 - - - 2.5 1992 - - - 68.4 - - - 2.4 1993 - - - 85.2 - - - 2.6 1994 - - - 88.1 - - - 3.7 1995 - - - 94.9 - - - 3.9 1996 - - - 94.5 - - - 4.1 1997 - - - 91.1 - - - 4.3 1998 - - - 90.8 - - - 4.4 1999 - - - 106.0 - - - 4.4 2000 - - - 146.0 - - - 4.4 2001 - - - 222.7 - - - 4.4 2002 - - - 290.1 - - - 4.4 2003 - - - 392.0 - - - 3.4 2004 - - - 783.6 - - - 7.4 2005 - - - 1 647.2 - - - 9.4 2006 - - - 1 801.8 - - - 9.4
Source: UNCTAD, FDI/TNC database (www.unctad.org/statistics). Notes: Data on inward stock are estimated by accumulating inflows since 1970. Data on outward stock are estimated by accumulating inflows since 1986.
Table 5. FDI flows in the host economy, by industry, 1999-2006
(Millions of dollars)
Sector / industry 1996 1997 1998 1999 2000 2001 2002 2003 2004 2005 2006
Total .. .. .. 15 40 77 67 102 392 864 155
Primary .. .. .. 6 11 50 50 95 378 731 2
Mining, quarrying and petroleum .. .. .. 6 11 50 50 95 378 731 2
Petroleum .. .. .. 6 11 50 50 95 378 731 2
Unspecified .. .. .. 9 29 27 17 7 14 133 153
Source: Banque Centrale de Mauritanie.

World Investment Directory Volume X Africa 2008
422
Table 6. FDI flows in the host economy, by geographical origin, 1995-2006 (Millions of dollars)
Economy 1995 1996 1997 1998 1999 2000 2001 2002 2003 2004 2005 2006
Belgium/Luxembourg 1.4 - - - 1.1 - - - - - - - China - - - - - - - - 1.7 0.1 0.4 - Denmark - - - - - - - - - - 0.7 - 3.9 France - 5.1 1.1 - 1.1 1.1 9.2 - 8.1 0.9 - 2.5 1.2 13.8 Germany - - - - - - - - - 5.0 - 10.0 Source: UNCTAD, FDI / TNC database. Note: Data is based on the information reported by the economies listed above.
Table 9. FDI flows abroad, by geographical destination, 1995-2006 (Millions of dollars)
Economy 1995 1996 1997 1998 1999 2000 2001 2002 2003 2004 2005 2006
France .. .. .. - .. .. .. 0.9 - - - 5.0 Lithuania .. .. .. 0.1 .. .. .. - - - 0.0 - - Morocco .. .. .. - .. .. .. - - 0.0 0.0 0.1 United States .. .. .. - .. .. .. - - 1.0 4.0 2.0 - Source: UNCTAD, FDI / TNC database. Note: Data is based on the information reported by the economies listed above.
Table 12. FDI stocks in the host economy, by geographical origin, 1995-2006 (Millions of dollars)
Economy 1995 1996 1997 1998 1999 2000 2001 2002 2003 2004 2005 2006
China .. .. .. .. - - - - 1.8 2.1 2.4 - Denmark .. .. .. .. - - - - - 3.3 3.3 1.8 Morocco .. .. .. .. - - - 45.4 46.0 49.5 38.4 36.6 United States .. .. .. .. 1.0 1.0 1.0 1.0 1.0 5.0 1.0 1.0 Source: UNCTAD, FDI / TNC database. Note: Data is based on the information reported by the economies listed above.
Table 15. FDI stocks abroad, by geographical destination, 1995-2006 (Millions of dollars)
Economy 1995 1996 1997 1998 1999 2000 2001 2002 2003 2004 2005 2006
United States .. .. .. .. .. .. .. .. - 1.0 3.0 5.0 5.0 Source: UNCTAD, FDI / TNC database. Note: Data is based on the information reported by the United States.
Tables 30, 35, 40 and 45. Assets, employment, wages and salaries and sales of foreign affiliates of United States TNCs in Mauritania, 1995-2006
(Millions of dollars and thousands of employees)
Table no./Variable 1995 1996 1997 1998 1999 2000 2001 2002 2003 2004 2005 2006
30. Assets .. .. .. .. .. 3 3 4 3 13 .. .. 35. Employees .. .. .. .. .. .. .. .. .. 0.1 .. .. 40. Wages and salaries .. .. .. .. .. .. .. .. .. 1 .. .. 45. Sales .. .. .. .. .. 7 7 7 8 5 .. .. Source: UNCTAD, FDI/TNC database. Note: Data are based on information reported by the United States.

Mauritania
423
Table 86. Largest home-based TNCs, 2007 (Billions of dollars)
Company Industry Sales
A. Industrial
Société Nationale Industrielle et Miniére Mining 0.25 a
B. Tertiary
C. Finance and Insurance Assets
Source: Jeune Afrique Hors-serie No. 14, 2007. a 2004.
Table 87. Largest affiliates of home-based TNCs, 2007 (Millions of dollars and number)
Company Name Host Economy Industry Sales Employees
A. Industrial
.. .. .. .. .. B. Tertiary
Loteny Telecom S A Côte d' Ivoire Telecommunications .. 600 C. Finance and insurance Assets Employees
.. .. .. .. ..
Source: Who Owns Whom database (https://solutions.dnb.com/wow), retrieved January 2008.
Table 88. Largest affiliates of foreign TNCs in the host economy, 2007 (Millions of dollars and number)
Company Home economy Industry Sales Employees
A. Industrial
Elf Oil Mauritanie France Petroleum 43 ..Agence Mauritanienne aux Missions
d'Assistance Switzerland Mining and quarrying .. ..
B. Tertiary
Maersk Mauritanie Sa Denmark Other services Societe Mauritanienne Des
Telecommunications France Other services 36 580Sogeco Sa France Other business activities .. 150Souliemane Ould Choumad France Construction .. 28Administradora De Condominios
Metepec, S.A. De C.V. Mexico Real estate .. ..Air Mauritania Morocco Supporting transport activities .. ..
C. Finance and Insurance Assets Employees
Source: Who Owns Whom database (https://solutions.dnb.com/wow), retrieved January 2008.

World Investment Directory Volume X Africa 2008
424
C. Legal frameworks for transnational corporations
The activities of transnational corporations and foreign direct investors are regulated through several national, bilateral and multilateral legal instruments. The following key legal instruments apply in the country:
I. National framework
Law No. 77-204-Mining Code of 30 July 1977. Source: Unofficial translation. Chambre de Commerce Franco-Arabe (Paris). Documentary Fund.
Investment Code. Ordinance No. 89.031/CSM concerning the Investment Code of 23 January 1989. Repeals Ordinance No. 79/046 of 16 March 1979 and as amended by Ordinance 366 of 7 May 1985. Source: Official Journal of the Islamic Republic of Mauritania of 22 February 1989.
Ordinance 91-42 of 30 December 1991. New Banking Regulations. Repeals Ordinance of 20 April 1988. Source: MOCI 1024/11 May 1992.
Law No. 94-010 of 24 January 1994 amending the Tax Code and creating the Value Added Tax; effective on 1 January 1995. Source: CEPEX Africa-Actualities No. 442 of September 1994. Also in 1994- Editions Fiduciaries France-Afrique.
Foreign exchange restrictions abolished, September 2006. Source: www.viewswire.com Latest analysis, Mali industry September 18th 2006.
Establishment of Investment bank, 2006. Source: www.eiu.com EIU Country report Main report April 2006.
II. International Framework
A. Mauritania is a party to the following multilateral and regional instruments:
Convention on the Recognition and Enforcement of Foreign Arbitral Awards of 1958, which entered into force on 7th June 1959.
Convention on the Settlement of Investment Disputes between States and Nationals of other States of 1965. Entered into force on 14 October 1966.
Convention Establishing the Inter-Arab Investment Guarantee Corporation of May 1971; entered into force in April 1974.
Agreement for the Promotion, Protection and Guarantee of Investment Among Member States of the Organization of Islamic Conference, of I June 1981; entered into force on 23 September 1986.
Unified Agreement for the Investment of Arab Capital in the Arab States of 1982.
Convention Establishing the Multilateral Investment Guarantee Agency of 1985, entered into force on 12 April 1988.
Fourth ACP - EEC Convention (Lome IV) of 1989, entered into force on 1st March 1990.

Mauritania
425
Articles of Agreement of the Islamic Corporation for the Insurance of Investment and Export Credit of 19 February 1992. Entered into force on 1 August 1994.
Paris Convention for the Protection of Industrial Property of 1883 (Revised at Brussels in 1900, Washington in 1911, The Hague in 1925, London in 1934, Lisbon in 1958 and Stockholm in 1967, and as amended in 1979). Signed in 1994.
Marrakesh Agreement Establishing the World Trade Organisation of 15 April 1994. Entered into force on 1 January 1995. Agreement on Trade-Related Investment Measures. General Agreement on Trade in Services. Agreement on Trade Related Aspects of Intellectual Property Rights.
Partnership Agreement between the Members of The African, Caribbean and Pacific Group of States, of the one part and the European Community and its member states, of the other part signed in Cotonou, Benin on 23 June 2000.
B. Bilateral treaties
1. Bilateral investment treaties for the protection and promotion of investments: Switzerland 1976, Germany 1982, Belgium / Luxembourg 1983, Tunisia 1986, Romania 1988, Morocco 2000, Burkina Faso 2001, Cameroon 2001, Gambia 2001, Ghana 2001, Guinea 2001, Mauritius 2001, Italy 2003, Qatar 2003, Korea, Republic of 2004, Lebanon 2004, Kuwait 2006.
2. Bilateral treaties for the avoidance of double taxation: France 1967, Senegal 1971, Qatar 2003.

World Investment Directory Volume X Africa 2008
426
D. Sources of Information
Official
Banque Central de Mauritanie
Secondary
Busse, Mathias (2003). "Democracy and FDI", Discussion paper, 220 (Hamburg: Hamburg Institute of International Economics).
Economist Intelligence Unit (EIU) (various years). Country Profile: Mauritania (London: EIU Ltd.).
____________ (various years). Country Report: Mauritania (London: EIU Ltd.).
Igue, J. (1992). L'Etat entrepot au Benin: Commerce informel ou solution a la crise (Paris: Karthala).
Eid Florence and Fiona Pana (2003). "Foreign direct investment in Arab World: The changing investment landscape" (www.weforum.org/pdf/Global_Competitiveness_Reports/Reports/AWCR_2002_2003/FDI.pdf).
Frick, C (2002). Direct foreign investment and the environment: African mining sector (Paris: OECD).
International Monetary Fund (IMF) (1999). Mauritania: Enhanced structural adjustment facility Medium-Term Economic and Financial Policy Framework paper 1999-2002 (Washington D.C.: IMF).
____________(2006). IMF's Sub-Saharan Africa Regional Economic Outlook, March 10, 2006. (Washington D.C.: IMF).
Martine, Ivan (2000). "The Euro-Mediterranean Partnership and Inward FDI in Maghreb countries"; First Mediterranean Social and Political research meeting – Florence, March 22-26, 2000.
Soderbom, M. and F. Teal (2004). "Size and Efficiency in Africa Manufacturing firms: Evidence from Firm-Level Panel Data." Journal of Development Economics, 73. pp 369 - 394.
United Nations Conference on Trade and Development (UNCTAD) (2002). FDI in Least Developed Countries at a Glance (Geneva: UNCTAD) (www.unctad.org/en/subsites/dite/LDCs/ pdfs/Countries/benin.pdf).
_______________(2005a). Investor-Disputes Arising from Investment Treaties: A Review. UNCTAD Series of International Investment Policies for Development (UNCTAD/ITE/IIT/2005/4).
_______________(2005b). A Survey of Support by Investment Promotion Agencies to Linkages. Advisory Studies No. 18 (UNCTAD/ITE/IPC/2005/12).
_______________(2005c). FDI in least developed countries at a glance: 2005/2006(UNCTAD/ITE/IIA/2005/17).
United States Trade Representative (2006). 2006 Comprehensive Report on U.S. Trade and Investment Policy Toward Sub-Saharan Africa and Implementation of the Africa Growth and Opportunity Act: The Sixth of Eight Annual Reports, May 2006. (Washington D.C.: US Government).
World Trade Organization (WTO) (2992). "Enhanced international assistance would help Mauritania reap more benefits from its trade liberalization efforts" (Geneva: WTO).
Razin, Assaf (2003). "The contribution of FDI flows to domestic investment in capacity, and vice versa", mimeo.
World Bank/International Finance Corporation (2007). Doing Business 2008 Mauritania (Washington D.C.: The World Bank Group).

Mauritius
427
Mauritius
A. Definitions and sources of data
The Bank of Mauritius defines foreign direct investment (FDI) in line with the fifth edition of the International Monetary Fund’s (IMF) Balance of Payments Manual (BOPM5). FDI is considered a category of international investment in which the direct investor acquires a lasting interest in, or a significant influence on the management of an enterprise in another economy (the direct investment enterprise). A direct investment link is established between the two parties involved when the direct investor owns 10% or more of the ordinary shares or voting power in an enterprise. Once a direct investment link is established, all financial transactions occurring between the two parties involved are classified under direct investment. Direct investment data in Mauritius are recorded in the BOP on a directional basis.
The Bank of Mauritius, the primary source of FDI data, compiles the returns submitted by Category 1 (commercial) banks, which record FDI transactions of their customers. Starting from July 2002, data coverage was extended to Category 2 (offshore) banks. Returns from Category 2 banks however exclude all nonresident-to-nonresident transactions transiting through them. FDI transactions on banks’ own account are also included. The IMF and the Organization for Economic Cooperation and Development also provide data on FDI in Mauritius. FDI stock data were estimated as an accumulation of flows. Data specifying the geographic location and the origin of FDI inflows have been provided by the source-countries.
Since 1994, there are no restrictions on capital account transactions and foreign investors do not require the approval of the Bank of Mauritius for carrying out FDI activity. However, under the “Non Citizens Property Restriction Act”, non-citizens of Mauritius wishing to hold, purchase or acquire immovable property require authorization from the competent authority. In general, there are no restrictions with regard to foreign participation in equity holdings. Dividends, profits and invested capital may be repatriated freely.
Mauritius is pursuing its diversification strategy with a focus on the services sector. The country seeks to develop an Information and Communication Technology (ICT) sector by setting up a cyber park. Mauritius seeks to attract foreign ICT companies in English-speaking countries wishing to tap the African market, specifically the French-speaking countries, and conversely, investors from French-speaking countries wishing to tap the market of English-speaking countries. A special package of incentives has also been put in place to accommodate this.
Mauritius has been able to develop a Global Business (offshore) sector, enacted various legislations to enhance its image as a credible international financial center and signed a double taxation treaty with 26 countries, including the United Kingdom, South Africa and India. As part of its investment strategy, Mauritius has recently implemented two innovative schemes, namely the Permanent Residence Scheme, which enables investors investing more than $500,000 to be eligible for permanent residence and ownership of private property, and the Regional Headquarters Scheme, which aims to attract international companies with a minimum share capital of Rs 1 million to Mauritius where they can set up their office to supervise their operations in the region.
Mauritius signed to the Convention on the Settlement of Investment Disputes between State and Nationals of other States on 2 June 1968 and is actively engaged in regional cooperation and a number of trade and investment initiatives. The enactment of the African Growth and Opportunity Act (AGOA) has given a new impetus to the textiles and clothing sector as the AGOA provides duty free and quota free access to Mauritius for the United States market. Mauritius aspires to emerge as the textile hub of the region and is actively promoting the setting up of spinning units to enable companies to satisfy the rules of origin criteria. Enterprises engaged in spinning benefit from a package of incentives, which includes tax benefits and concessionary utilities rates. Mauritius is a member of the African Union, New Partnership for Africa's Development, the Common Market for the Eastern and Southern Africa countries, the Southern African Development Community and the World Trade Organization.

World Investment Directory Volume X Africa 2008
428
B. Statistics on FDI and the operations of TNCs
Table 1. Summary of FDI
(Millions of dollars)
Variable Inward Outward
1. FDI flows, 2003-2006 (annual average) 55.8 20.9 2. FDI flows as a percentage of GFCF, 2003-2006 (annual average) 4.0 1.5 3. FDI stocks, 2006 900 227 4. FDI stocks as a percentage of GDP, 2006 13.9 3.5
Source: Based on tables 3 and 4 and UNCTAD, FDI/TNC database.
Table 3. FDI flows, by type of investment, 1980-2006
(Millions of dollars)
Inward investment Outward investment
Reinvested Reinvested
Year Equity earnings Other Total Equity earnings Other Total
1980 1.2 .. .. 1.2 .. .. .. ..1981 0.7 .. .. 0.7 .. .. .. ..1982 1.8 .. .. 1.7 .. .. .. ..1983 1.6 .. .. 1.6 .. .. .. ..1984 4.9 .. .. 4.9 .. .. .. ..1985 8.0 .. .. 8.0 .. .. .. ..1986 7.4 .. .. 7.4 .. .. .. ..1987 17.2 .. .. 17.2 .. .. .. ..1988 22.4 .. .. 23.7 .. .. .. 0.11989 35.4 .. .. 35.8 .. .. .. 0.61990 36.4 .. .. 41.0 .. .. .. 0.61991 17.4 .. .. 17.4 .. .. .. 10.91992 13.8 .. .. 14.7 .. .. .. 43.31993 14.7 .. .. 14.7 .. .. .. 33.21994 20.0 .. .. 20.0 .. .. .. 1.11995 18.7 .. .. 18.7 .. .. .. 3.61996 36.7 .. .. 36.7 .. .. .. 2.71997 55.3 .. .. 55.3 .. .. .. 3.21998 12.2 .. .. 12.2 .. .. .. 13.71999 49.4 .. .. 49.4 .. .. .. 6.42000 265.6 .. .. 265.6 .. .. .. 13.02001 - 27.7 .. .. - 27.7 .. .. .. 2.92002 32.1 .. .. 32.1 .. .. .. 8.72003 62.6 .. .. 62.6 .. .. .. - 6.02004 13.9 .. .. 13.9 .. .. .. 31.82005 .. .. .. 41.6 .. .. .. 47.52006 .. .. .. 105.3 .. .. .. 10.1
Source: UNCTAD, FDI/TNC database (www.unctad.org/statistics) based on the Bank of Mauritius, unpublished.

Mauritius
429
Table 4. FDI stocks, by type of investment, 1980-2006
(Millions of dollars) Inward Investment Outward Investment
Year Equity Reinvested earnings Other Total Equity Reinvested earnings Other Total
1980 .. .. .. 25.7 .. .. .. ..1981 .. .. .. 26.4 .. .. .. ..1982 .. .. .. 28.1 .. .. .. ..1983 .. .. .. 29.7 .. .. .. ..1984 .. .. .. 34.6 .. .. .. ..1985 .. .. .. 42.6 .. .. .. ..1986 .. .. .. 50.0 .. .. .. ..1987 .. .. .. 67.2 .. .. .. ..1988 .. .. .. 90.9 .. .. .. 0.11989 .. .. .. 126.7 .. .. .. 0.71990 .. .. .. 167.8 .. .. .. 1.31991 .. .. .. 185.1 .. .. .. 12.21992 .. .. .. 199.8 .. .. .. 55.51993 .. .. .. 214.6 .. .. .. 88.71994 .. .. .. 234.6 .. .. .. 89.71995 .. .. .. 253.3 .. .. .. 93.41996 .. .. .. 289.9 .. .. .. 96.01997 .. .. .. 345.2 .. .. .. 99.21998 .. .. .. 357.4 .. .. .. 112.91999 .. .. .. 406.7 .. .. .. 119.32000 .. .. .. 672.4 .. .. .. 132.32001 .. .. .. 644.7 .. .. .. 135.22002 .. .. .. 676.7 .. .. .. 143.92003 .. .. .. 739.4 .. .. .. 137.82004 .. .. .. 753.3 .. .. .. 169.62005 .. .. .. 794.8 .. .. .. 217.22006 .. .. .. 900.1 .. .. .. 227.3
Source: UNCTAD, FDI/TNC database (www.unctad.org/statistics). Notes: Data on inward stock are estimated by accumulating inflows since 1970. Data on outward stock are estimated by accumulating outflows since 1988.
Table 5. FDI flows in the host economy, by industry, 1995-2006
(Millions of Rupees)
Sector / industry 1990 1991 1992 1993 1994 1995 1996 1997 1998 1999 2000 2001 2002 2003 2004 2005 2006
Total 609 297 230 271 360 325 658 1 164 292 1 243 7 265 936 979 1 966 1 796 2 807 7 222
Tertiary 422 249 214 244 170 315 141 1 142 219 542 7 222 603 457 1 481 717 1 271 6 254
Trade 270 130 203 92 41 245 51 - 27 300 8 3 41 77 248 106 90
Hotels and restaurants 152 68 8 152 129 70 35 20 75 27 10 - 100 103 121 536 2 610
Transport, storage and communications - - - - - - - - - - 7 204 - - - 38 175 43
Post and communications - - - - - - - - - - 7 204 - - - 38 175 43
Telecommunications - - - - - - - - - - 7 204 - - - 38 175 43
Finance - 51 3 - - - 55 1 122 117 215 - 600 316 1 301 310 454 3 511
Financial Intermediation - 51 3 - - - 55 1 122 117 215 - 600 316 1 301 310 454 3 511
Monetary intermediation - 51 3 - - - 55 1 122 117 215 - 600 316 1 301 310 454 3 511
Unspecified 187 48 16 27 190 10 517 22 73 701 43 333 522 485 1 079 1 536 968
Source: UNCTAD, FDI/TNC database based on the Bank of Mauritius, unpublished.

World Investment Directory Volume X Africa 2008
430
Table 6. FDI flows in the host economy, by geographical origin, 1995-2006
(Millions of Rupees)
Region / economy 1990 1991 1992 1993 1994 1995 1996 1997 1998 1999 2000 2001 2002 2003 2004 2005 2006
Total world 609 297 230 271 360 325 658 1 164 292 1 243 7 265 936 979 1 966 1 796 2 807 7 222Developed countries 155 144 108 47 75 138 42 73 167 452 7 222 302 422 368 1 319 1 643 5 302
Europe 154 144 62 47 74 138 42 73 167 452 7 219 299 393 331 801 1 568 5 139European Union 109 139 42 39 73 126 42 73 164 447 7 214 25 393 329 759 1 420 4 555
France 75 57 25 35 39 17 17 34 48 33 7 214 25 232 157 492 427 523Germany 27 23 4 - 10 80 6 1 - 9 - - 4 - 95 46 177Luxembourg - 17 - - - - - - 66 - - - - - 29 369 34United Kingdom 7 42 13 4 24 29 19 38 50 405 - - 157 172 143 578 3 821
Other developed Europe 45 5 20 8 1 12 - - 3 5 5 274 - 2 42 148 584Switzerland 45 5 20 8 1 12 - - 3 5 5 274 - 2 42 148 584
North America 1 - 46 - 1 - - - - - 3 3 29 37 518 75 163United States 1 - 46 - 1 - - - - - 3 3 29 37 518 75 163
Developing economies 339 109 114 192 173 187 614 1 070 111 772 42 600 413 1 488 201 934 537Africa 55 20 8 10 51 - - 964 - 575 31 600 333 1 196 24 156 164
Reunion 53 13 5 10 49 - - - - - 30 - - 174 5 130 126South Africa 2 7 3 - 2 - - 964 - 575 1 600 333 1 022 19 26 38
Latin America and the Caribbean 15 16 - - 16 - - - - - - - - - 13 4 13Panama 15 16 - - 16 - - - - - - - - - 13 4 13
Asia 269 73 106 182 106 187 614 106 111 197 11 - 80 292 164 774 360West Asia - - - - - - - 19 39 156 11 - 8 45 10 9 114
United Arab Emirates - - - - - - - 19 39 156 11 - 8 45 10 9 114South, East and South-East Asia 269 73 106 182 106 187 614 87 72 41 - - 72 247 154 765 246
China 17 11 3 3 1 - - - - - - - 18 33 - 38 6Hong Kong, China 55 36 31 40 4 19 - - - - - - 9 - 4 7 30India 78 1 - 8 35 157 43 69 55 1 - - 2 143 150 670 160Malaysia 10 25 57 129 60 11 27 - - 25 - - 30 70 - - -Pakistan - - - - - - 25 18 17 15 - - - - - 50 50Singapore 18 - 14 2 6 - 519 - - - - - 13 1 - - -Taiwan Province of China 91 - 1 - - - - - - - - - - - - - -
Unspecified 115 44 8 32 112 - 2 21 14 19 1 34 144 110 276 230 1 383 Source: UNCTAD, FDI/TNC database based on the Bank of Mauritius, unpublished.
Table 8. FDI flows abroad, by industry, 1995-2006
(Millions of Rupees)
Sector / industry 1990 1991 1992 1993 1994 1995 1996 1997 1998 1999 2000 2001 2002 2003 2004 2005 2006
Total 8 170 674 587 19 63 48 67 329 162 333 83 278 1 156 970 1 942 1 134Secondary 5 5 - 15 9 14 24 13 25 10 13 - 245 41 101 258 335Tertiary - 165 613 443 - - 3 - 144 76 248 47 - 577 422 967 391
Hotels and restaurants - 165 - - - - 3 - 30 8 68 - - 137 422 967 391Finance - - 613 443 - - - - 114 68 180 47 - 440 - - -
Financial Intermediation - - 613 443 - - - - 114 68 180 47 - 440 - - -Monetary intermediation - - 613 443 - - - - 114 68 180 47 - 440 - - -
Unspecified 3 - 61 129 10 49 21 54 160 76 72 36 33 538 447 717 408 Source: UNCTAD, FDI/TNC database based on the Bank of Mauritius, unpublished.

Mauritius
431
Table 9. FDI flows abroad, by geographical destination, 1995-2006 (Millions of Rupees)
Region / economy 1990 1991 1992 1993 1994 1995 1996 1997 1998 1999 2000 2001 2002 2003 2004 2005 2006
Total world 8 170 674 587 19 63 48 67 329 162 333 83 278 1 156 970 1 942 1 134Developed countries 3 - 5 3 8 4 3 - 27 5 180 - - - 20 58 2
Europe 3 - 2 3 3 4 3 - 21 - 180 - - - 10 58 2European Union 3 - 2 3 3 4 3 - 5 - 180 - - - 10 58 2
France 3 - 2 3 3 4 3 - 5 - 180 - - - 10 58 2Other developed Europe - - - - - - - - 16 - - - - - - - -
Switzerland - - - - - - - - 16 - - - - - - - -North America - - 3 - 5 - - - 6 5 - - - - 10 - -
United States - - 3 - 5 - - - 6 5 - - - - 10 - -Developing economies 5 170 613 471 8 59 24 59 224 157 70 67 241 1 154 898 1 650 876
Africa 5 170 613 21 7 56 21 59 76 157 70 67 241 1 154 565 841 767Comoros - 165 - - - 49 18 26 - - - - - - - - -Kenya - - - 1 2 - - - - - - - - - - - -Madagascar 5 5 - 20 4 5 - 13 19 57 2 2 238 47 195 195 291Mozambique - - - - - - - - 5 81 - 58 - 523 253 532 270Reunion - - 613 - - - - - 17 10 - 6 3 7 36 24 5Seychelles - - - - - - - - 30 9 68 - - 570 75 89 187South Africa - - - - 1 2 3 20 5 - - 1 - 7 6 1 14
Asia - - - 450 1 3 3 - 148 - - - - - 333 809 109India - - - 450 1 3 3 - 148 - - - - - - 1 2Maldives - - - - - - - - - - - - - - 333 808 107
Unspecified - - 56 113 3 - 21 8 78 - 83 16 37 2 52 234 256 Source: UNCTAD, FDI/TNC database based on the Bank of Mauritius, unpublished.
Table 12. FDI stocks in the host economy, by geographical origin, 1995-2006
(Millions of dollars) Economy 1994 1995 1996 1997 1998 1999 2000 2001 2002 2003 2004 2005 2006
Australia - - - - - - - - 0.1 - - - -Brazil - - - - - - - 0.9 0.9 1.0 2.0 2.1 -Canada - - - - - - - - - 9 10 34 -China - - - - - - - - - 13 13 27 -Denmark - - - - - - - - - - 140 270 273Germany 17 13 14 9 17 18 19 20 34 59 79 52 -India - - - 21 - - - - - - - - -Latvia - - - - - - - - - 0.2 0.4 - -Malaysia 27 56 62 45 102 309 325 346 457 558 619 660 -Singapore - - - - - 2 076 2 840 2 041 3 121 3 520 5 633 - -South Africa - - - - - - - 546 307 618 1 442 544 4 863United Kingdom 56 147 314 352 253 519 349 - - - - - -United States - 11 10 11 148 119 97 124 - 10 205 432 692
Source: UNCTAD, FDI / TNC database. Note: Data is based on the information reported by the economies listed above.
Table 15. FDI stocks abroad, by geographical destination, 1995-2006 (Millions of dollars)
Economy 1994 1995 1996 1997 1998 1999 2000 2001 2002 2003 2004 2005 2006
Brazil - - - - - - 0.3 - - - - - -Bulgaria - - - - - - - - - 0.1 - 0.2 - - -Croatia - - - - - - - - - - - 0.2 0.3Denmark - - - - - - - - - - 30.7 21.0 -Israel - - - - - - 0.4 0.3 0.3 0.2 0.2 0.1 -Kazakhstan - - - - - - 0.2 0.2 3.1 0.2 1.7 1.5 3.2Latvia - - - - - - 0.5 0.7 1.0 1.1 2.7 0.5 -Lithuania - - - - - 0.5 - - - 0.6 0.6 0.6 0.6Madagascar - - - - - - - - 35.9 52.5 71.4 40.0 311.4Malawi - - - - - - 15.1 18.7 13.3 18.1 23.0 - -Portugal - - - - - - - 7.5 6.9 2.0 - - -Korea, Republic of - - - 0.5 0.5 0.5 0.5 0.5 0.6 2.3 3.0 4.2 6.6Saudi Arabia - - - - - - - - - - - 1.0 -Slovenia - - - - - - 0.5 0.1 0.1 - - - -South Africa - - - - - - - 125.8 264.9 296.1 206.0 200.0 197.4Uganda - - - - - 18.7 34.5 50.3 58.3 65.6 - - -United Rep. of Tanzania - - - - 144.1 89.0 175.8 171.4 - - - - -Viet Nam - 135.9 185.8 202.5 271.8 363.4 408.2 493.1 532.5 - - - -Zambia - - - - - - 2.4 4.2 - - - - - Source: UNCTAD, FDI / TNC database. Note: Data is based on the information reported by the economies listed above.

World Investment Directory Volume X Africa 2008
432
Table 21. The number of foreign affiliates of home-based transnational corporations, by geographical location abroad, 1994-2005
Economy 1994 1995 1996 1997 1998 1999 2000 2001 2002 2003 2004 2005
India .. .. 12 9 19 11 29 44 49 48 .. ..
United States .. .. .. .. .. .. .. 1 1 1 .. ..
Source : UNCTAD, FDI/TNC database. Note: Data are based on information reported by the economies listed above.
Table 23. The number of affiliates of foreign TNCs in the host economy, by geographical origin, 1994-2005
Economy 1994 1995 1996 1997 1998 1999 2000 2001 2002 2003 2004 2005
Germany 5 5 4 4 6 8 8 11 8 7 8 10
United States 4 4 7 7 10 16 18 22 31 37 38 ..
Source : UNCTAD, FDI/TNC database. Note: Data are based on information reported by the economies listed above.
Tables 28, 43, 58, 63, 68 and 83. Assets, sales, exports, imports, research and development expenditure and royalty payments of affiliates of
Mauritius TNCs in India, 1994-2005
(Thousands of employees and millions of dollars)
Table no./Variable 1994 1995 1996 1997 1998 1999 2000 2001 2002 2003 2004 2005
28. Assets .. .. 709 662 791 1 509 2 554 3 520 3 945 4 432 .. ..
43. Sales .. .. 545 506 522 1 008 1 414 2 016 2 006 2 609 .. ..
58. Exports .. .. 129 89 189 199 342 505 384 594 .. ..
63. Imports .. .. 64 83 112 85 183 494 383 489 .. ..
68. R&D expenditure .. .. 0.1 0.0 0.7 0.7 3.4 1.2 6.4 6.4 .. ..
83. Royalty payments .. .. 0.2 0.1 0.3 0.9 2.0 0.4 0.7 0.9 .. ..
Source : UNCTAD, FDI/TNC database. Note: Data are based on information reported by India.
Table 30. Assets of affiliates of foreign TNCs in the host economy, by geographical origin, 1994-2005
(Millions of dollars)
Economy 1994 1995 1996 1997 1998 1999 2000 2001 2002 2003 2004 2005
Germany .. .. .. .. 60 100 186 176 .. .. .. ..
United States 93 129 304 211 621 1 096 1 311 1 555 2 655 4 508 3494 a ..
Source : UNCTAD, FDI/TNC database. Note: Data are based on information reported by the economies listed above.a Data refer to majority-owned affiliates only.
Table 35. Employment of affiliates of foreign TNCs in the host economy, by geographical origin, 1994-2005
(Thousands of employees)
Economy 1994 1995 1996 1997 1998 1999 2000 2001 2002 2003 2004 2005
Germany 1.0 1.0 1.0 .. .. .. .. .. .. .. .. ..
United States 0.1 .. .. .. .. 0.2 .. .. .. .. 4.3 ..
Source : UNCTAD, FDI/TNC database. Note: Data are based on information reported by the economies listed above.
Tables 40 and 50. Wages and salaries and value added of affiliates of United States TNCs in Mauritius, 1994-2005
(Millions of dollars)
Table no./Variable 1994 1995 1996 1997 1998 1999 2000 2001 2002 2003 2004 2005
40. Wages and salaries .. .. 1 1 1 2 .. .. .. .. 38 ..
50. Value added a .. .. 18 15 14 -2 .. .. .. .. 38 ..
Source : UNCTAD, FDI/TNC database. Note: Data are based on information reported by the United States.a Data refer to majority-owned affiliates only.
Table 45. Sales of affiliates of foreign TNCs in the host economy, by geographical origin, 1994-2005
(Millions of dollars)
Economy 1994 1995 1996 1997 1998 1999 2000 2001 2002 2003 2004 2005
Germany .. .. .. .. 56.8 106.5 92.1 89.5 94.1 .. .. 80.4
United States .. 91.0 101.0 116.0 .. 131.0 446.0 381.0 249.0 401.0 395.0 ..
Source : UNCTAD, FDI/TNC database. Note: Data are based on information reported by the United States.

Mauritius
433
Table 86. Largest home-based TNCs, 2007
(Billions of dollars) Company Industry Sales
A. Industrial
Shell Mauritius Petroleum expl./ref./distr. 0.194 Ciel Textile Clothing and textiles 0.154 Compagnie Mauricienne de Textile Clothing and textiles 0.141 British American Tobacco Food products, beverages and tobacco 0.098
a
Caltex Oil Petroleum expl./ref./distr. 0.085 a
B. Tertiary
Air Mauritius Air Transport 0.493 Rogers Group Diversified group 0.251 Ireland Blyth Diversified group 0.250 Groupe Mon Loisir Diversified group 0.250 Ciel Group Diversified group 0.213 Mauritius Telecom Telecommunications 0.191 Food and Allied Group of Companies Diversified group 0.182 New Mauritius Hotels Leisure 0.163
a
Currimjee Group Diversified group 0.135 a
Sun Resorts Leisure 0.111 State Investment Corporation Diversified group 0.085
a
C. Finance and Insurance Assets
British American Investment Company Insurance 0.162
Source: Jeune Afrique Hors-serie No. 14, 2007. a 2004.
World Investment Directory Volume X Africa 2008
434
Table 87. Largest affiliates of home-based TNCs, 2007
(Millions of dollars and number) Company Name Host Economy Industry Sales Employees
A. Industrial
United Phosphorus Ltd England Chemicals and chemical products 405.45 1000China Hewlett-Packard Co., Ltd. China Machinery and equipment 376.9 6500Taco Kunststofftechnik Gmbh Germany Motor vehicles and trailers 54.518 300Dexcel-Pharma Ltd England Chemicals and chemical products 33.39 20Lear Corporation Changchun Automotive Interior Systems
Co., Ltd. China Wood and wood products 33.238 250Rohm And Haas Shanghai Chemical Industry Co.,Ltd. China Chemicals and chemical products 27.544 150Floreal Madagascar S A Madagascar Textiles and clothing 7 4100Cognizant Technology Solutions Asia Pacific Pte. Ltd. Singapore Computer and related activities 2.743 60S B & T (Uk) Ltd England Computer and related activities 2.58 2Advanced Interconnect Technologies Ii, Inc United States Computer and related activities 2 16Covansys Software Technology (Shanghai) Co., Ltd. China Computer and related activities 1.398 70Glendale Industrial Services Ltd England Petroleum 0.496 4Mocambique Farms Lda Mozambique Food products, beverages and tobacco .. 2500Boss & Co.Ltd England Machinery and equipment .. 500Harbin New Holland Tractors Co., Ltd. China Machinery and equipment .. 250Metalform (Wuxi) Precision Engineering Co., Ltd. China Machinery and equipment .. 120
B. Tertiary
Adani Global Pte Ltd Singapore Wholesale trade 673.76 12Adani Global Fze United Arab Emirates Wholesale trade 352.92 21Essar Gulf F Z E United Arab Emirates Wholesale trade 41.095 3500Asia T.V. Ltd England Telecommunications 34.061 64Hi-Level Technology Limited Hong Kong Wholesale trade 30.936 10Igtl Solutions (S) Pte Ltd Singapore Wholesale trade 21.378 25Arista Tubes Ltd England Rubber and plastic products 20.355 186Anti-Friction Components Ltd England Wholesale trade 15.938 90Garment Trims & Accessories United Arab Emirates Rubber and plastic products 14 150Consolidated Power Projects Australia Pty Ltd Australia Construction 9.019 25Essel Propack Uk Ltd England Rubber and plastic products 7.586 48Ait International Limited Hong Kong Wholesale trade 4.438 13Rentworks India Private Limited India Other business activities 4.144 35United Phosphorus Limited Hong Kong Wholesale trade 3.455 2Igtl Solutions (Uk) Ltd England Other business activities 3.05 14Bonair Paris France Wholesale trade 2.458 6Iroko Securities Ltd England Research and development 2.31 7
C. Finance and Insurance Assets Employees
Banque Sbm Madagascar Sa Madagascar Finance .. 102Acap Advisers Ltd England Finance .. ..State Bank Of Mauritius Limited India Finance .. ..State Bank Of Mauritius Limited India Finance .. 50British American Insurance Co. (K) Ltd Kenya Insurance .. 148
Source: Who Owns Whom database (https://solutions.dnb.com/wow), retrieved January 2008.

Mauritius
435
Table 88. Largest affiliates of foreign TNCs in the host economy, 2007
(Millions of dollars and number) Company Home Economy Industry Sales Employees
A. Industry
Asian Paints (Mauritius) Ltd India Chemicals and chemical products .. 24Blue Track Ltd France Textiles and clothing .. .. Bwsc Mauritius Japan Electricity, gas and water .. .. Nestle's Products (Mauritius) Ltd Switzerland Food products, beverages and tobacco .. .. B. Tertiary Stoneridge Asia Holdings Ltd United States Holding 170 ..Courts (Mauritius) Ltd United Kingdom Wholesale trade 51 ..International Motors Company Limited France Wholesale trade 11 ..Holiday Villages Management Services (Mauritius) France Hotels and Restaurants 8 ..Pricewaterhousecoopers United States Other services .. 200Nakufreight (Mauritius) Limited Switzerland Supporting transport activities .. 20Mast Industries (Mauritius) Ltd United States Wholesale trade .. 10All Africa Airways France Supporting transport activities .. ..Basf Styrenics Holding Company Germany Public administration .. ..C M T V Mauritius Ltd France Other services .. ..Central Business Equipment Co. Ltd. United States Other business activities .. ..Chamarel Marine Services France Telecommunications .. ..Club Mediterranee Albion Resort France Hotels and Restaurants .. ..Coasia International Corp Taiwan Other business activities .. ..Egl, Inc United Kingdom Water Transport .. ..Kvaerner Process Mauritius Norway Other services .. ..Lara Networks (Mauritius) Llc United States Other services .. ..Micro Jewels Ltd United Kingdom Public administration .. ..Moga Holding Ltd Egypt Telecommunications .. ..
C. Finance and insurance Assets Employees
Standard Chartered Bank Mauritius Limited United Kingdom Finance 25 ..Barclays Leasing Company Ltd United Kingdom Finance .. ..Hsbc Private Equity (Asia) Limited United Kingdom Finance .. ..Hsbc Trustee(Mauritius) Limited Netherlands Finance .. ..Standard Chartered Private Equity (Mauritius) Limited United Kingdom Finance .. .. Source: Who Owns Whom database (https://solutions.dnb.com/wow), retrieved January 2008.

World Investment Directory Volume X Africa 2008
436
C. Legal frameworks for transnational corporations
In Mauritius, several national, bilateral and multilateral legal instruments to regulate the activities of transnational corporations and foreign direct investors exist. The key instruments in the country include:
I. National framework
The Trade Marks Act No. 18, November 1868. Source: WIPO (http://www.wipo.org).
Patents: Patents Act, May 1875, as amended by the Patents (Amendment) Act No. 16, July 1975, the Patents (Amendment) Act No. 29, October 1983 and the Information Technology (Miscellaneous Provisions) Act No. 18, December 1998. Source: WIPO (http://www.wipo.org).
Trade Marks Regulations (Govt. Notice No. 22), February 1889, and Trade Marks (Fees) Source: WIPO (http://www.wipo.org).
Trade Marks (Appeals) Rules (Govt. Notice No. 3), March 1956. Source: WIPO (http://www.wipo.org).
The Trade Marks (Amendment) Act No. 35, July 1970. Source: WIPO (http://www.wipo.org).
The Fair Trading Act No. 26, December 1979, as last amended by the Fair Trading (Amendment) Act No. 33, November 1988. Source: WIPO (http://www.wipo.org).
Patents (Fees) Regulations (Govt. Notice No. 33), February 1980. Source: WIPO (http://www.wipo.org).
Appellations of Origin / Geographical Indications / Indications of Source: The Commodities (Indications of Origin) Regulations 1981 (Govternment Notice No. 170) of 1981. Geographical Indications Bill of 2000, not yet in force. Source: WIPO (http://www.wipo.org).
The Consumer Trade Practices Regulations (Govt. Notice No. 171) of 1981. Layout-Designs (Topographics) of Integrated Circuits: Layout-Designs (Topographies) of Integrated Circuits Bill of 2000, not yet in force. Source: WIPO (http://www.wipo.org).
The Mauritius Export Development and Investment Authority Act No. 23 of 16 September 1983. Source: Legal Supplement to the Government Gazette of Mauritius, No. 96 of 24 September 1983, p. 209.
Patent (Inspection Fees) Regulations (Govt. Notice No. 164), November 1983. Source: WIPO (http://www.wipo.org).
The Companies Act, 1984; effective on 1 March 1985. Amends the Companies Act of 1913. As amended by the MOBAA-Mauritius, offshore Business Activities Act, 1992. Source: Extracts in Mauritius - Your Profit Centre. Mauritius Export Development and Investment Authority.
Regulations (Govt. Notice No. 43), February 1985. Source: WIPO (http://www.wipo.org).

Mauritius
437
The Trade Marks (Amendment) Act No. 15, March 1985. Source: WIPO (http://www.wipo.org).
Patent (Fees) (Amendment) Regulations (Govt. Notice No. 13), February 1986. Source: WIPO (http://www.wipo.org).
The Copyright Act No. 8 of 8 April 1986. Source: Legal Supplement to the Government Gazette of Mauritius, No. 27 of 14 April 1986. As amended by The Copyright (Amendment) Act No. 45 of 20 December 1988. Source: Legal Supplement to the Government Gazette of Mauritius, No. 5 of 5 May 1990.
The Mauritius Export Development and Investment Authority (Amendment) Bill, No. 32 of 16 August 1986. Source: Legal Supplement to the Government Gazette of Mauritius, No. 60 of 16 August 1986, p. 321.
The Copyright Act No. 8 to make Better Provision for the Protection of Authors’ Rights in Relation to their Works, April 1986. The Copyright (Amendment) Act No. 45, December 1988. Source: WIPO (http://www.wipo.org).
The Export Processing Zone Act 57 of 1990. Repeals Export Processing Zones Act No. 51, of 8 December 1970 as amended. Source: International Bureau of Fiscal Documentation ATS, suppl. No. 91/92, July 1994.
The Offshore Companies Scheme. Mauritius Offshore Business Activities Act of 1992 (MOBAA). Source:International Bureau of Fiscal Documentation ATS, supplementary No. 91/92, July 1994.
The Trade Marks (Amendment) Act No. 15, May 1993. Source: WIPO (http://www.wipo.org).
The Industrial Expansion Act 1993. Source: Mauritius -Mauritius Export Development and Investment Authority, 1993.
Mauritius International Companies Act of 1994. Source: http://www.webspawner.com/users/palpicolo/index.html.
Copyright Act 1997. Source: The Government of Mauritius.
Telecommunications Act 1998. Source: The Government of Mauritius.
Patents (Bill of 2000). Source: WIPO (http://www.wipo.org).
Electronic Transaction Act 2000. Source: The Government of Mauritius.
The Investment Promotion Act (2000) establishing the Board of Investment with following regulations: Investment Promotion (Integrated Resort Schemes) Regulations 2002 Investment Promotion (Permanent Residence Schemes) Regulations 2002 Investment Promotion (SAPES) Regulations 2002 Investment Promotion (Amendment of Schedule) Regulations 2002
Source: Board of Investment, website: http://www.boimauritius.com

World Investment Directory Volume X Africa 2008
438
Patents, Industrial Designs and Trademarks Bill of 2000, not yet in force. Source: WIPO (http://www.wipo.org).
Information and Communications Technologies Act 2001. Source: The Government of Mauritius.
The Trust Act (2001). Source: The Government of Mauritius.
The Companies Act 2001, which replaced The Companies Act 1984 Source: http://www.fscmauritius.org
The Financial Services Development Act 2001, which replaced MOBAA Act (1992) and provide for the establishment of two bodies namely the Financial Services Commission and the Financial Services Promotion Agency. Source: http://www.fscmauritius.org
The Business Registration Act (2002). Source: The Government of Mauritius.
The Patents, Industrial Design and Trade Marks Act (2002). Source: The Government of Mauritius.
The lay-out designs (topographies) of Integrated Circuits Act (2002). Source: The Government of Mauritius.
The Competition Act (2003). Source: The Government of Mauritius.
The Computer Misuse and Cybercrime Act (2003). Source: The Government of Mauritius.
The Genetically Modified Organisms Act 2004. Source: The Government of Mauritius.
The Data Protection Act 2004. Source: The Government of Mauritius.
The Tourism Act 2004. Source: The Government of Mauritius.
The Banking Act 2004. Source: The Government of Mauritius.
The Utility Regulatory Authority Act 2004. Source: The Government of Mauritius.
The Public Private Partnership Act 2004. The Financial Reporting Act 2004.
The Maritime Zones Act 2005. Source: The Government of Mauritius.
The Insurance Act 2005. Source: The Government of Mauritius.

Mauritius
439
The Securities Act 2005. Source: The Government of Mauritius.
The Mauritius Industrial Development Authority (MIDA) is now replaced with a new organization know as Enterprise Mauritius: a collaborative partnership between industry and government that aims to help businesses in Mauritius expand into regional and international markets, and at the same time develop their internal capability to meet the challenges of international competition (www.enterprisemauritius.biz).
II. International Framework
A. Mauritius is a party to the following multilateral and regional instruments:
Paris Convention for the Protection of Industrial Property of 20 March 1883, as amended and revised.
Convention on the Settlement of Investment Disputes Between States and Nationals of Other States of 18 March 1965. Entered into force on 14 October 1966.
Convention Establishing the Multilateral Investment Guarantee Agency of 11 October 1985. Entered into force on 12 April 1988.
Fourth ACP-EEC Convention signed at Lomé on 15 December 1989, Official Journal L 229, 17/08/1991 p. 0003 – 0280.
Southern Africa Development Community (SADC), signed on 17 August, 1992.Source: http://www.sadc.int/about_sadc/history.php.
Treaty Establishing the Market for Eastern and Southern Africa (COMESA), 1993.
The Agreement on Trade-Related Aspects of Intellectual Property Rights, signed on 15 April 1994; in force on 1 January 1995.
The General Agreement on Trade in Services, signed on 15 April 1994; in force on 1 January 1995. The Fourth Protocol to the General Agreement on Trade in Services of 15 February 1997. The Fifth Protocol to the General Agreement on Trade in Services of 12 December 1997.
Partnership Agreement Between the Members of the African, Caribbean and Pacific Group of States of the one Part, and the European Community and Its Member States, of the Other Part, Signed in Cotonou, Benin on 23 June 2000.
Indian Ocean Commission (IOC). Source: http://coi.intent.mu.
Indian Ocean Rim Association for Regional Cooperation (IOR-ARC). Source: http://coi.intent.mu.
B. Bilateral treaties
1. Bilateral investment treaties for the protection and promotion of investments: Germany 1971, France 1973, United Kingdom 1986, China 1996, Indonesia 1997, Mozambique 1997, Pakistan 1997, Portugal 1997, India 1998, South Africa 1998, Switzerland 1998, Czech Republic 1999, Nepal 1999, Romania 2000, Singapore 2000, Swaziland 2000, Zimbabwe 2000, Benin 2001, Burundi 2001, Cameroon 2001, Chad 2001, Comoros 2001, Ghana 2001, Guinea 2001, Mauritania 2001, Rwanda 2001, Senegal 2002,

World Investment Directory Volume X Africa 2008
440
Sweden 2004, Madagascar 2004, Barbados 2004, Botswana 2005 and Belgium Luxembourg Economic Union 2005.
2. Bilateral treaties for the avoidance of double taxation: Denmark 1954, Norway 1955, Germany 1978, France 1980, United Kingdom 1981, India 1982, Italy 1990, Malaysia 1992, Sweden 1992, Zimbabwe 1992, China 1994, Madagascar 1994, Pakistan 1994, Swaziland 1994, Belgium 1995, Botswana 1995, Luxembourg 1995, Namibia 1995, Russian Federation 1995, Singapore 1995, Indonesia 1996, South Africa 1996, Sri Lanka 1996, Kuwait 1997, Lesotho 1997, Mozambique 1997, Thailand 1997, Indonesia 1998, Oman 1998, Nepal 1999, Cyprus 2000, Rwanda 2001, Croatia 2002, Senegal 2002, Uganda 2003, Barbados 2004, Seychelles 2005, United Arab Emirates 2006.
C. Other treaties:
Trade and investment framework agreement with the United States of America (2006).
Investment agreement for the COMESA Common Investment Area (2007).

Mauritius
441
D. Sources of information
Official
Central Bank of Mauritius (www.bom.intnet.mu). Ministry of Industry and Industrial Technology (www.worldinformation.com).
Secondary
Board of Investment Mauritius (2004). Invest in Mauritius (www.boimauritius.com).
Development Policy Research Unit (2000). "What are the major trends and determinants of foreign direct investment in SADC countries?", DPRU Policy Brief, No.00/P2.
Economist Intelligence Unit (EIU) (various years). Country Profile: Mauritius (London: EIU Ltd.).
______________ (various years). Country Report: Mauritius (London: EIU Ltd.).
Government of Mauritius (2000). The Present State of the Economy (Port Louis: Government of Mauritius).
India Business World (2002). "FDI bucks global trend to hit new high of $3.7 B". (www.helplinelaw.com).
International Monetary Fund (IMF) (2006). IMF's Sub-Saharan Africa Regional Economic Outlook, March 10, 2006. (Washington D.C.: IMF).
Mauritius Government Tourist Office (2002). Handbook of Statistical Data on Tourism (annual), (Port Louis: Government of Mauritius).
Ministry of Agriculture (1999). Food Technology and Natural Resources: The Sugar Action Plan 2000-2005
(Port Louis: Government of Mauritius).
Ministry of Economic Development (various years). Financial Services and Corporate Affairs, Economic
Indicators, (Port Louis: Government of Mauritius).
Ministry of Economic Development (various years). Financial Services and Corporate Affairs:ncb.intnet.mu/medrc.htm .
Ministry of Industry and Industrial Technology(2002). Industry Focus, EPZDA and MEDIA, (Port Louis: Government of Mauritius).
Mauritius Industrial Development Authority (MIDA) (2004). "Position Mauritius as a world class export hub" (www.neb.intnet.mu/mida/)
Soderbom, M. and F. Teal (2004). "Size and Efficiency in Africa Manufacturing firms: Evidence from Firm-Level Panel Data." Journal of Development Economics, 73. pp 369 - 394.
United Nations Conference on Trade and Development (UNCTAD) (2001). Investment Policy Review:
Mauritius (Geneva: UNCTAD/ITE/IPC/Misc.1).
___________(2005a). Investor-Disputes Arising from Investment Treaties: A Review. UNCTAD Series of International Investment Policies for Development (UNCTAD/ITE/IIT/2005/4).
____________(2005b). A Survey of Support by Investment Promotion Agencies to Linkages. Advisory Studies No. 18 (UNCTAD/ITE/IPC/2005/12).

World Investment Directory Volume X Africa 2008
442
United States Trade Representative (2006). 2006 Comprehensive Report on U.S. Trade and Investment
Policy Toward Sub-Saharan Africa and Implementation of the Africa Growth and Opportunity Act:
The Sixth of Eight Annual Reports, May 2006. (Washington D.C.: US Government).
World Bank/International Finance Corporation (2007). Doing Business 2008 Mauritius (Washington D.C.: The World Bank Group).
World Trade Organization (WTO) (2001). Trade Policy Review Body: Review of Mauritius (Geneva: WTO).

Morocco
443
Morocco
A. Definitions and sources of data
In Morocco, the industrial investments law (Law No. 17-82) defines elements of foreign direct investment (FDI). In this law, an "industrial company" is a company using capital goods for the manufacture of finished or semi-finished products and within an investment programme including production equipment for a minimum value of 100,000 dirhams, excluding tax. The Foreign Exchange Office collects data on FDI through foreign currency transactions. Foreign participation is determined according to the percentage of foreign share capital holdings in an investment statistics. Data are collected on both flows and stocks by industrial and geographical breakdown. The International Monetary Fund also provides FDI data on the country in its balance-of-payment statistics.
Resident or non-resident, foreign nationals are entitled to invest freely in Morocco. No investment operation in Morocco requires prior authorization. Before 1996, Morocco offered foreign investors a package of investment incentives through various investment codes in different areas of business such as exports, tourism, industrial, mining, maritime, handicraft and real estate investments. A new Investment Charter, promulgated by Decree No.1-95-213 of 8 November 1995 has replaced those codes. As of January 1996, the new Charter sets up a framework in which the main objectives are the promotion and development of investments in Morocco in the next ten years. It also codified several regulations, some of which have been implemented through the inclusion in the Corporate Tax Law in 1996. Further, the Charter establishes that benefits for investors under previous laws will be maintained until expiration of their terms and of the conditions for which they had been granted.
Morocco has abundant natural resources. It is the world’s largest exporter of raw and processed phosphate products, including phosphoric acid and fertilizers. Other minerals including silver, zinc, copper and cobalt are extracted. Manufacturing is dominated by the clothing and textiles industry while there are small but growing electrical and mechanical industries.
Morocco signed to the Convention on the Settlement of Investment Disputes between State and Nationals of other States on 11 October 1965 and continued to make its economy attractive to foreign investors by reforming investment laws, liberalizing trade and prices, reducing red tape, updating the financial system, privatizing some state firms and offering concessions in telecommunications, power generation and water management. It has also been a government policy to strengthen the fiscal position by cutting the public wage bill, trimming subsidies and widening and deepening the tax net. Under the privatization and liberalization programme, the telecommunications sector has been opened to competition and is expanding rapidly with new services and new platforms. Morocco is increasingly integrated in the regional and international economic systems through its membership in integration schemes such as the Arab Maghreb Union, and the Association Accord with the European Union. Morocco is a member of the World Trade Organization.
World Investment Directory Volume X Africa 2008
444
B. Statistics on FDI and the operations of TNCs
Table 1. Summary of FDI
(Millions of dollars)
Variable Inward Outward
1. FDI flows, 2003-2006 (annual average) 2 335.9 173.5
2. FDI flows as a percentage of GFCF, 2003-2006 (annual average) 19.1 1.4
3. FDI stocks, 2006 29 939 1 350
4. FDI stocks as a percentage of GDP, 2006 52.3 2.4
Source: Based on tables 3a and 4a and UNCTAD, FDI/TNC database.

Morocco
445
Table 3a. FDI flows, by type of investment, 1980-2006
(Millions of dollars)
Inward investment Outward investment
Reinvested Reinvested
Year Equity earnings Other Total Equity earnings Other Total
1980 .. 3.8 85.6 89.4 .. .. - ..1981 .. 4.8 53.8 58.6 .. .. - ..1982 .. 2.7 76.9 79.5 .. .. - ..1983 .. 3.0 43.2 46.1 .. .. - ..1984 .. 6.1 40.9 47.0 .. .. - ..1985 .. 3.2 16.8 20.0 .. .. - 0.61986 .. 4.2 - 3.6 0.6 .. .. - 1.31987 .. 13.4 46.2 59.6 .. .. - 8.01988 .. 6.9 77.7 84.5 .. .. - 14.21989 .. 13.1 154.0 167.1 .. .. - 1.61990 0.0 10.8 154.3 165.0 .. .. - 13.01991 272.2 39.7 5.5 317.0 22.7 .. - 23.01992 270.8 105.5 46.1 424.0 32.4 .. - 32.01993 431.1 16.2 44.1 491.0 23.1 .. - 23.01994 191.9 24.7 334.4 551.0 23.9 .. - 24.01995 330.1 4.7 0.0 332.0 11.8 2.8 - 12.01996 338.3 19.0 0.0 322.0 27.3 3.0 - 28.01997 1 095.8 4.4 107.0 1 207.2 8.8 - - 8.81998 361.1 15.7 83.5 460.3 24.5 - - 24.51999 922.1 4.2 712.4 1 638.7 22.3 - - 22.32000 249.2 10.1 211.3 470.6 58.7 1.0 - 59.72001 2 730.9 3.0 140.9 2 874.8 100.3 - - 100.32002 454.2 0.3 79.3 533.8 53.7 - - 53.72003 2 340.8 8.1 80.2 2 429.1 19.9 - - 19.92004 940.9 0.0 128.9 1 069.8 21.3 10.5 - 31.82005 1 778.7 331.4 836.3 2 946.4 174.1 - - 174.12006 2 705.8 0.0 192.4 2 898.2 468.0 - - 468.0
Source: UNCTAD, FDI/TNC database (www.unctad.org/statistics). Notes: Data on Inflows are from the IMF for 1980-1989 and the Office des Changes thereafter. Outflow data are proxy data based on investments reported by the following economies: Belgium and Luxembourg, 1985-1986; Belgium and Luxembourg and France, 1987-1988; Belgium and Luxembourg. France and Tunisia, 1989.
Table 3b. FDI flows, by type of investment, 1997-2006
(Millions of dirhams)
Inward investment Outward investment
Reinvested Reinvested
Year Equity earnings Other Total Equity earnings Other Total
1997 10 418.4 41.4 1 017.6 11 477.4 83.8 - - 83.81998 2 891.2 150.8 802.1 3 844.1 195.6 - - 195.61999 6 423.8 41.3 7 069.1 13 534.2 177.1 - - 177.12000 2 132.5 107.5 2 243.6 4 483.6 611.6 10.2 0.0 621.82001 30 102.4 33.9 1 591.9 31 728.2 1 097.0 - - 1 097.02002 4 421.4 3.7 872.4 5 297.5 312.2 - - 312.22003 21 314.5 77.3 767.8 22 159.6 116.9 - - 116.92004 6 790.0 0.0 1 143.0 7 933.0 179.3 93.8 0.0 273.12005 7 449.1 588.7 6 624.8 14 662.6 661.5 0.0 - 9.2 652.32006 22 996.5 507.3 -1 959.5 21 544.3 3 913.0 0.0 - 1.1 3 911.9
Source: UNCTAD, FDI/TNC database based on the Office des Changes, unpublished.

World Investment Directory Volume X Africa 2008
446
Table 4a. FDI stocks, by type of investment, 1980-2006
(Millions of dollars)
Inward investment Outward investment
Equity & Equity &
Reinvested Reinvested Reinvested Reinvested
Year earnings earnings Other Total earnings earnings Other Total
1980 - - - 1 779.8 - - - 116.21981 - - - 1 838.4 - - - 116.21982 - - - 1 918.0 - - - 116.21983 - - - 1 964.1 - - - 116.21984 - - - 2 011.1 - - - 116.21985 - - - 2 031.0 - - - 116.71986 - - - 2 031.6 - - - 118.01987 - - - 2 091.2 - - - 126.01988 - - - 2 175.7 - - - 140.21989 - - - 2 342.8 - - - 141.81990 - - - 2 507.8 - - - 154.81991 - - - 2 824.8 - - - 177.81992 - - - 3 248.8 - - - 209.81993 - - - 3 739.8 - - - 232.81994 - - - 4 290.8 - - - 256.81995 - - - 4 622.8 - - - 268.81996 - - - 4 944.8 - - - 296.81997 - - - 6 152.0 - - - 305.61998 - - - 6 612.3 - - - 330.11999 - - - 8 251.0 - - - 352.42000 - - - 8 721.6 - - - 412.12001 - - - 11 596.4 - - - 512.42002 11 141.4 - 988.8 12 130.2 426.6 - 26.6 453.32003 16 037.3 - 1 068.9 17 106.1 519.6 - 40.7 560.22004 18 675.5 - 1 207.6 19 883.1 490.1 - 185.4 675.52005 19 016.9 - 1 734.6 20 751.5 534.7 - 130.9 665.62006 28 213.5 - 1 725.2 29 938.7 1 024.7 - 324.8 1 349.5
Source: UNCTAD, FDI/TNC database (www.unctad.org/statistics). Notes: Data on inward stock prior to 2002 are estimated by subtracting inflows from the stock of 2002. After 2002 data are based on the Office des Changes. Data on outward stockprior to 2002 are estimated by accumulating outflows since 1977. After 2002 data are based on the Office des Changes.
Table 4b. FDI stocks, by type of investment, 2002-2006
(Millions of dirhams)
Inward investment Outward investment
Equity & Equity &
Reinvested Reinvested Reinvested Reinvested
Year earnings earnings Other Total earnings earnings Other Total
2002 113 274.2 - 10 053.2 123 327.4 4 337.5 - 270.9 4 608.42003 140 324.4 - 9 352.7 149 677.1 4 546.2 - 355.8 4 902.02004 153 469.5 - 9 923.9 163 393.4 4 027.2 - 1 523.9 5 551.12005 175 895.2 - 16 044.1 191 939.3 4 946.0 - 1 210.7 6 156.72006 238 590.6 - 14 589.2 253 179.8 8 665.6 - 2 746.8 11 412.4
Source: UNCTAD, FDI/TNC database based on the Office des Changes, unpublished.

Morocco
447
Table 5. FDI flows in the host economy, by industry, 1996-2006
(Millions of dirhams)
Sector / industry 1996 1997 1998 1999 2000 2001 2002 2003 2004 2005 2006
Total 2 850 11 499 4 418 16 069 4 998 32 486 5 876 23 257 9 485 26 708 26 070Primary 235 6 402 432 412 100 71 229 267 379 388 125
Agriculture, hunting, forestry and fishing 9 29 86 20 26 70 46 149 42 11 24Agriculture and hunting 9 19 38 20 14 34 22 24 29 6 24Forestry and Fishing - 10 48 - 12 35 24 124 13 4 -
Mining, quarrying and petroleum 227 6 374 346 392 74 1 183 118 337 377 100Mining and quarrying 96 2 772 182 333 72 1 183 106 336 - -Petroleum 131 3 601 163 59 2 0 0 12 1 - -
Secondary 1 377 1 381 1 882 3 520 911 2 264 1 176 18 791 1 796 2 735 8 973Tertiary 1 124 3 630 2 046 12 010 3 819 30 058 4 387 4 095 7 218 23 554 16 861
Construction 78 210 29 127 75 118 15 66 106 160 34Trade 139 171 250 108 658 1 114 251 484 612 441 1 047Transport, storage and communications 52 514 182 10 324 1 433 26 737 849 819 2 192 18 714 7 912
Transport and storage 44 495 173 324 202 360 423 200 1 474 3 402 7 884 Supporting and auxilary transport activities 17 476 163 294 187 332 409 186 1 431 3 081 7 828Post and communications 9 19 10 10 001 1 231 26 377 426 619 718 15 311 27
Telecommunications 9 19 10 10 001 1 231 26 377 426 619 718 15 311 27Finance 436 2 229 912 677 859 315 78 219 1 721 1 399 3 067
Financial Intermediation 436 2 229 912 677 859 218 78 56 1 556 254 1 611Monetary intermediation 392 1 905 749 490 696 166 64 56 1 525 44 1 464Other financial intermediation 44 324 163 186 164 53 14 0 31 210 147
Other financial intermediation n.e.c. 44 324 163 186 164 53 14 0 31 210 147Insurance and Pension Funding - - - - 0 97 - 162 166 1 145 1 456
Business activities 392 305 451 471 594 819 1 844 1 686 2 110 2 426 4 117Real estate 392 305 442 451 575 811 1 825 1 685 2 040 2 422 4 117Research and development - - 10 20 19 8 19 1 70 4 -
Other services 26 200 221 304 199 955 1 350 821 478 415 685Unspecified 113 86 58 127 169 93 84 104 92 31 112
Source: UNCTAD, FDI/TNC database based on the Office des Changes, unpublished. Note: Data refer to gross investments and may not be comparable to those presented in table 3.

World Investment Directory Volume X Africa 2008
448
Table 6. FDI flows in the host economy, by geographical origin, 1996-2006
(Millions of dirhams)
Region / economy 1996 1997 1998 1999 2000 2001 2002 2003 2004 2005 2006
Total world 2 850 11 499 4 418 16 069 4 998 32 486 5 876 23 257 9 485 26 708 26 070Developed countries 2 336 10 470 3 486 15 560 4 655 32 044 4 943 22 586 8 198 24 740 23 149
Europe 2 249 6 726 3 179 14 550 4 335 31 326 4 545 22 109 7 734 24 502 22 228European Union 2 214 6 650 3 006 14 295 4 205 31 017 4 300 21 808 7 051 23 743 21 303
Austria - - - - - - - - 1 0 3Belgium / Luxembourg 70 29 134 98 172 103 261 190 346 426 2 605Cyprus - - - - - - - 12 16 31 8Denmark - - - - 4 1 3 0 2 1 3France 915 1 448 1 614 3 657 1 624 27 650 2 252 2 889 4 745 19 843 8 646Germany 70 600 48 69 193 257 493 145 475 856 940Hungary - - - - - - - - 0 1 279Ireland - - - - - - - - 10 7 40Italy 44 29 58 118 202 109 69 107 266 210 335Netherlands 218 257 288 3 157 76 199 239 74 125 260 227Portugal 645 10 134 4 961 857 1 422 237 35 21 60 50Spain 148 476 490 2 030 564 939 390 18 095 477 1 442 7 191Sweden - 3 601 - 20 24 52 1 16 113 155 46United Kingdom 105 200 240 186 490 287 356 244 455 452 931
Other developed Europe 35 76 173 255 130 309 245 302 683 759 925Iceland - - - - 0 0 0 26 3 - -Norway - - 48 - 11 - 5 15 3 1 19Switzerland 35 76 125 255 119 309 240 260 676 758 906
North America 87 2 982 307 1 010 308 710 390 477 461 235 896Canada - 10 58 - 11 10 10 5 13 8 33United States 87 2 972 250 1 010 297 699 380 471 448 226 864
Other developed countries - 762 - - 11 9 9 0 4 4 25Japan - 762 - - 11 9 9 0 4 4 25
Developing economies 375 876 749 412 304 437 904 623 1 197 1 932 2 847Africa 139 248 182 69 27 162 76 190 67 45 150
North Africa 139 248 182 20 27 162 76 179 66 43 134Algeria - - - - 20 75 23 1 25 1 1Egypt - - - - 1 11 1 0 13 10 85Libyan Arab Jamahiriya 139 248 182 - 3 6 - 26 24 4 8Tunisia - - - 20 3 70 52 152 5 28 40
Other Africa - - - 49 - - - 10 0 2 16Gabon - - - - - - - 10 - 2 -Mali - - - - - - - - - - 16Mauritania - - - - - - - - 0 0 1South Africa - - - 49 - - - - - - -
Latin America and the Caribbean - - - - 1 - 71 - 3 32 -Chile - - - - - - 2 - 3 27 -Panama - - - - 1 - 69 - - 5 -
Asia 235 629 567 343 276 275 757 433 1 127 1 856 2 697West Asia 235 267 192 196 248 275 750 432 1 012 1 542 2 418
Bahrain 17 - - - 0 13 - - 83 0 35Iraq - - 19 - 6 22 7 7 210 137 71Jordan 9 76 - - - - 1 1 - 5 55Kuwait 9 10 19 78 33 131 431 17 18 223 1 012Lebanon - - - - 0 11 11 9 13 17 66Qatar - - - - - 1 6 0 - 26 50Saudi Arabia 183 76 86 108 145 87 172 163 354 362 330Syrian Arab Republic - - - 10 - 0 1 - 1 25 14Turkey - - - - - 0 3 11 3 20 12United Arab Emirates 17 105 67 - 64 9 118 222 331 728 774
South, East and South-East Asia - 362 375 147 27 1 6 2 116 314 279China - - - - - - - 0 15 1 -Hong Kong, China - - - - - - - - - - 13India - 76 48 147 - 1 6 - 1 184 20Indonesia - - - - - - - - - - 20Korea, Republic of - 286 327 - 27 0 0 2 0 - -Pakistan - - - - - - - - 100 129 226
Unspecified 139 152 182 98 39 5 29 48 90 35 74 Source: UNCTAD, FDI/TNC database based on the Office des Changes, unpublished. Note: Data refer to gross investments and may not be comparable to those presented in table 3.

Morocco
449
Table 11. FDI stocks in the host economy, by industry, 2002-2006
(Millions of dirhams)
Sector / industry 2002 2003 2004 2005 2006
Total 123 327 149 677 163 393 191 939 253 180Primary 8 450 11 057 9 009 10 441 9 339
Agriculture, hunting, forestry and fishing 1 217 1 262 1 328 1 336 1 363Agriculture and hunting 420 397 431 434 463Forestry and Fishing 797 865 897 902 901
Fishing, operation of fish hatcheries and fish farms 797 865 897 902 901Mining, quarrying and petroleum 7 233 9 795 7 681 9 105 7 976
Secondary 27 858 47 832 54 540 58 915 77 546Coke, petroleum products and nuclear fuel 3 063 1 278 4 152 4 595 7 971Non-metallic mineral products 5 018 7 342 8 316 9 408 14 767
Manufacture of non-metallic mineral products n.e.c. 5 018 7 342 8 316 9 408 14 767Tertiary 75 125 78 070 86 462 108 842 151 253
Construction 2 458 2 351 2 504 2 494 2 505Trade 4 005 3 962 4 516 4 048 4 684Transport, storage and communications 43 515 43 318 47 036 65 801 89 703
Transport and storage 4 503 4 468 5 821 8 593 17 466 Supporting and auxilary transport activities 4 103 4 101 5 414 7 934 16 805
Activities of travel agencies and tour operators 4 103 4 101 5 414 7 934 16 805Post and communications 39 012 38 851 41 215 57 208 72 237
Telecommunications 39 012 38 851 41 215 57 208 72 237Finance 8 264 9 614 10 702 12 411 24 273
Financial Intermediation 8 050 9 140 10 252 11 985 22 899Insurance and Pension Funding 214 475 450 426 1 374
Business activities 13 670 14 544 16 777 18 765 23 894Real estate 10 618 11 670 13 745 15 489 20 451Other business activities 3 052 2 875 3 032 3 276 3 443
Business activities n.e.c. 2 943 2 767 2 868 3 109 3 262Other business activities n.e.c 2 943 2 767 2 868 3 109 3 262
Other services 3 213 4 280 4 927 5 323 6 193Unspecified 11 895 12 718 13 383 13 742 15 042
Source: UNCTAD, FDI/TNC database based on the Office des Changes, unpublished.

World Investment Directory Volume X Africa 2008
450
Table 12. FDI stocks in the host economy, by geographical origin, 2004-2006
(Millions of dirhams)
Region / economy 2004 2005 2006
Total world 163 393 191 939 253 180 Developed countries 143 564 170 008 225 960
Europe 132 244 158 509 213 608 European Union 125 789 152 029 204 585
Belgium / Luxembourg 1 817 1 770 3 940 France 68 830 89 232 125 108 Germany 2 480 3 516 4 545 Italy 1 462 1 695 2 035 Netherlands 5 110 5 307 5 428 Portugal 7 296 7 350 7 351 Spain 31 893 33 890 44 381 Sweden 3 111 5 067 6 930 United Kingdom 3 790 4 203 4 867
Other developed Europe 6 456 6 480 9 023 Switzerland 6 456 6 480 9 023
North America 10 285 10 462 11 312 United States 10 285 10 462 11 312
Other developed countries 1 035 1 036 1 040 Japan 1 035 1 036 1 040
Developing economies 13 263 15 582 18 662 Africa 1 940 2 010 1 985
Libyan Arab Jamahiriya 1 576 1 635 1 568 Tunisia 364 374 417
Asia 11 323 13 573 16 678 West Asia 10 236 12 052 14 894
Iraq 235 393 461 Kuwait 1 487 1 681 2 933 Saudi Arabia 5 077 5 550 6 278 United Arab Emirates 3 437 4 429 5 223
South, East and South-East Asia 1 087 1 520 1 784 India 299 554 562 Korea, Republic of 662 660 655 Pakistan 126 306 566
Unspecified 6 567 6 350 8 558
Source: UNCTAD, FDI/TNC database based on the Office des Changes, unpublished.
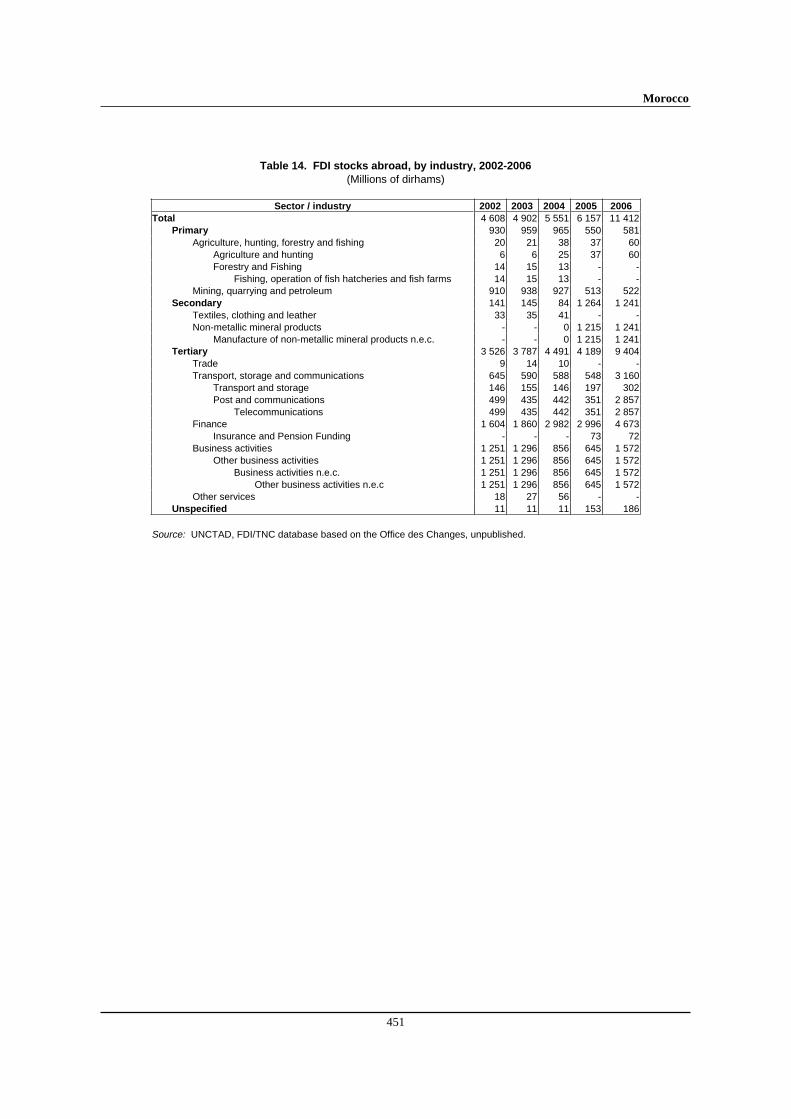
Morocco
451
Table 14. FDI stocks abroad, by industry, 2002-2006
(Millions of dirhams)
Sector / industry 2002 2003 2004 2005 2006
Total 4 608 4 902 5 551 6 157 11 412Primary 930 959 965 550 581
Agriculture, hunting, forestry and fishing 20 21 38 37 60Agriculture and hunting 6 6 25 37 60Forestry and Fishing 14 15 13 - -
Fishing, operation of fish hatcheries and fish farms 14 15 13 - -Mining, quarrying and petroleum 910 938 927 513 522
Secondary 141 145 84 1 264 1 241Textiles, clothing and leather 33 35 41 - -Non-metallic mineral products - - 0 1 215 1 241
Manufacture of non-metallic mineral products n.e.c. - - 0 1 215 1 241Tertiary 3 526 3 787 4 491 4 189 9 404
Trade 9 14 10 - -Transport, storage and communications 645 590 588 548 3 160
Transport and storage 146 155 146 197 302Post and communications 499 435 442 351 2 857
Telecommunications 499 435 442 351 2 857Finance 1 604 1 860 2 982 2 996 4 673
Insurance and Pension Funding - - - 73 72Business activities 1 251 1 296 856 645 1 572
Other business activities 1 251 1 296 856 645 1 572Business activities n.e.c. 1 251 1 296 856 645 1 572
Other business activities n.e.c 1 251 1 296 856 645 1 572Other services 18 27 56 - -
Unspecified 11 11 11 153 186 Source: UNCTAD, FDI/TNC database based on the Office des Changes, unpublished.

World Investment Directory Volume X Africa 2008
452
Table 15. FDI stocks abroad, by geographical destination, 2002-2006
(Millions of dirhams)
Region / economy 2002 2003 2004 2005 2006
Total world 4 608 4 902 5 551 6 157 11 412 Developed countries 3 206 3 549 3 139 2 819 4 033
Europe 2 652 2 948 2 488 2 444 3 688 European Union 2 652 2 948 2 481 2 437 3 681
Belgium 325 338 335 339 358 France 1 782 2 023 1 933 1 409 2 505 Germany 382 397 4 1 1 Italy 5 5 5 5 12 Spain 159 186 197 636 681 United Kingdom - - 6 48 125
Other developed Europe - - 7 7 7 Switzerland - - 7 7 7
North America 554 601 651 374 345 Canada 399 431 412 18 17 United States 155 170 238 357 328
Developing economies 1 209 1 172 1 155 2 288 4 872 Africa 848 813 793 1 941 4 517
North Africa 6 24 18 1 232 1 267 Algeria 0 9 10 3 5 Egypt - 7 0 1 222 1 233 Tunisia 6 7 8 7 30
Other Africa 842 789 775 709 3 250 Burkina Faso - - - - 2 451 Cameroon - - - - 3 Central African Republic 23 24 24 23 24 Congo - - 17 17 17 Côte d'Ivoire 9 11 8 2 2 Gabon 96 85 26 25 25 Guinea 85 89 91 88 90 Mali 66 69 71 69 102 Mauritania 462 403 407 355 310 Senegal 101 110 132 130 227
Latin America and the Caribbean 5 5 5 1 1 Brazil 5 5 5 1 1
Asia 356 354 357 347 354 West Asia 10 9 11 1 1
United Arab Emirates 10 9 11 1 1 South, East and South-East Asia 346 346 346 346 353
India 346 346 346 346 353 Unspecified
a 193 181 1 257 1 050 2 508
Source: UNCTAD, FDI/TNC database based on the Office des Changes, unpublished.a includes Morocco's outward FDI stock in the offshore center of Tangiers, Morocco.

Morocco
453
Tables 21, 28, 33, 38, 43 and 48. Number, assets, employees, wages ans salaries, sales and value added of affiliates of Moroccan TNCs in the United States, 1993-2004
(Number, thousands of employees and millions of dollars)
Table no./Variable 1992 1993 1994 1995 1996 1997 1998 1999 2000 2001 2002 2003 2004 2005
21. Number 6 6 6 6 5 5 5 5 4 4 3 1 .. ..28. Assets 68 89 86 84 28 48 49 50 60 61 .. .. .. ..33. Employees 0.1 .. .. .. .. .. .. .. .. .. .. .. .. ..38. Wages and Salaries 3 .. .. .. .. 1 1 1 1 1 .. .. .. ..43. Sales .. .. .. .. 3 9 10 11 11 12 .. .. .. ..48. Value added 9 13 7 11 1 29 29 29 29 30 .. .. .. ..Source: UNCTAD, FDI/TNC database. Note: Data are based on information reported by the United States.
Table 23. The number of affiliates of foreign TNCs in the host economy, by geographical origin, 1994-2005
Economy 1992 1993 1994 1995 1996 1997 1998 1999 2000 2001 2002 2003 2004 2005
Germany 42 37 33 35 39 39 40 43 40 39 22 23 27 30Italy .. 16 .. 23 .. 26 .. 33 .. .. .. .. .. ..Republic of Korea .. .. .. .. 5 6 7 7 8 8 6 6 5 6United States 15 14 18 18 19 22 22 22 22 21 21 22 21 ..Source: UNCTAD, FDI/TNC database. Note: Data are based on information reported by the economies listed above.
Table 30. Assets of affiliates of foreign TNCs in the host economy, by geographical origin, 1994-2005
(Millions of dollars) Economy 1992 1993 1994 1995 1996 1997 1998 1999 2000 2001 2002 2003 2004 2005
Germany 186 174 194 349 322 279 418 1 206 1 396 441 .. .. .. ..United States 281 .. .. 430 499 .. .. .. .. .. .. .. 715 ..United States a 146 158 316 385 451 424 416 543 544 482 575 629 647 ..Source: UNCTAD, FDI/TNC database. Note: Data are based on information reported by the economies listed above.a Data refer to majority-owned affiliates only.
Table 35. Employment of affiliates of foreign TNCs in the host economy, by geographical origin, 1994-2005
(Thousands of employees) Economy 1992 1993 1994 1995 1996 1997 1998 1999 2000 2001 2002 2003 2004 2005
Belgium .. .. .. .. .. .. .. .. .. 0.3 0.2 0.3 .. ..Germany 7.0 6.0 6.0 6.0 6.0 6.0 7.0 7.0 6.0 6.0 5.0 5.0 6.0 7.0Italy .. 7.1 .. 7.9 .. 8.1 .. 9.4 .. .. .. .. .. ..Portugal .. .. .. .. .. .. .. 0.7 .. 0.5 0.5 .. .. ..Switzerland .. 3.0 3.6 3.3 3.6 4.1 3.7 3.5 3.5 3.2 3.3 3.3 3.3 3.3United States 2.3 2.3 3.0 3.1 4.1 4.2 3.2 5.2 5.7 5.5 6.0 6.8 7.5 ..Source: UNCTAD, FDI/TNC database. Note: Data are based on information reported by the economies listed above.
Tables 40 . Wages and salaries of affiliates of United States TNCs in Morocco, 1994-2005
(Millions of dollars) Economy 1992 1993 1994 1995 1996 1997 1998 1999 2000 2001 2002 2003 2004 2005
United States .. 34 44 52 65 69 53 64 78 69 78 78 105 ..Source: UNCTAD, FDI/TNC database. Note: Data are based on information reported by the United States.a Data refer to majority-owned affiliates only.

World Investment Directory Volume X Africa 2008
454
Table 45. Sales of affiliates of foreign TNCs in the host economy, by geographical origin, 1994-2005
(Millions of dollars) Economy 1992 1993 1994 1995 1996 1997 1998 1999 2000 2001 2002 2003 2004 2005
Belgium .. .. .. .. 143.3 143.2 141.1 143.8 40.2 149.4 170.3 207.7 .. ..France .. .. .. 1 050 1 103 1 132 1 139 1 163 1 482 .. 1 499 .. .. ..Germany 256.1 241.9 308.1 279.1 332.3 288.3 511.5 532.7 644.9 536.9 564.7 677.2 869.2 562.9Italy .. 248.6 .. 345.8 .. 341.8 .. 472.1 .. .. .. .. .. ..Portugal a .. .. .. .. .. 42.4 42.4 44.0 45.4 58.9 11.4 9.8 United States 605 .. .. 683 896 994 942 1 038 1 211 1 303 1 311 1 452 1 146 ..Source: UNCTAD, FDI/TNC database. Note: Data are based on information reported by the economies listed above. a Data refer to majority-owned affiliates only.
Table 50. Value added a of affiliates of foreign TNCs in the host economy, by geographical origin, 1994-2005
(Millions of dollars) Economy 1992 1993 1994 1995 1996 1997 1998 1999 2000 2001 2002 2003 2004 2005
Portugal .. .. .. .. .. .. .. .. .. 24.7 9.0 2.7 .. ..United States .. .. 129.0 142.0 163.0 136.0 156.0 111.0 193.0 196.0 207.0 243.0 229.0 ..Source: UNCTAD, FDI/TNC database. Note: Data are based on information reported by the economies listed above. a Data refer to majority-owned affiliates only.

Morocco
455
Table 86. Largest home-based TNCs, 2007
(Billions of dollars) Company Industry Sales
A. Industrial
Sté Anonyme Marocaine de l'Industry du Raffinage Petroleum expl./ref./distr. 2.75Office Chérifien des Phosphates Mining 2.37
a
Office National de l'Éléctricité Electricity/gas/water 1.46a
Maroc Phosphore Chemical and chemical products 1.34a
Régie des Tabacs Food products, beverages and tobacco 1.22Shell Maroc Electricity/gas/water 0.86
a
Société ationale de Sidérurgie Metal and metal products 0.51Cie Sucriére Marocaine de Raffinage Agro-Industry 0.49
Lesieur Cristal Food products, beverages and tobacco 0.38Centrale Laitiére Food products, beverages and tobacco 0.36Lafarge Ciments Construction materials 0.33Sté Promotion Indus. Automobile au Maroc Automobile 0.25Société Marocaine de Carburants-ZIZ Petroleum expl./ref./distr. 0.21Cimenets du Maroc Building materials 0.21Indus. Marocaines Modernes Chemical and chemical products 0.20
a
Huileries du Souss Food products, beverages and tobacco 0.20a
Salam Gaz Electricity/gas/water 0.20Renault Maroc Automobile 0.19
a
Afriquia Gaz Electricity/gas/water 0.18Groupe Managem Mining 0.18Maghreb Steel Metal and metal products 0.17
a
Holcim Building Materials 0.17
B. Tertiary
Groupe Ona Diversified group 2.77Maroc Télécom Telecommunication 2.18
Royal Air Maroc Air transport 0.94Lyonnaise Eaux Casablanca Water 0.50Marjane Holding Retail trade 0.48Médi Télécom Telecommunication 0.47Office National de l'Eau Potable Electricity/gas/water 0.33
a
Office National des Chemins Fer du Maroc Transportation 0.31Holding CY Makro Maroc Retail trade 0.29Office d'Exploitation des Ports Ports management 0.27
a
Groupe Optorg Retail trade 0.26Douja Promotion Real Estate 0.23Cie Marocaine de Navigation Maritime transportation 0.22
a
Office National des Aeroports Airport management 0.17Grope CFAO Maroc Diversified group 0.14Groupe ACIMA Retail trade 0.14Barid al Maghrib Posts 0.14
C. Finance and insurance Assets
RMA Wataniya Insurance 0.30Société Centrale de Réassurance Insurance 0.24AXA Assurance Maroc Insurance 0.23Wafa Assurance Insurance 0.17Cie Nord-Africaine International d'Assurances Insurance 0.12Es Saada Assurances Insurance 0.09
Sources: Jeune Afrique Hors-serie No. 14, 2007. a 2004.
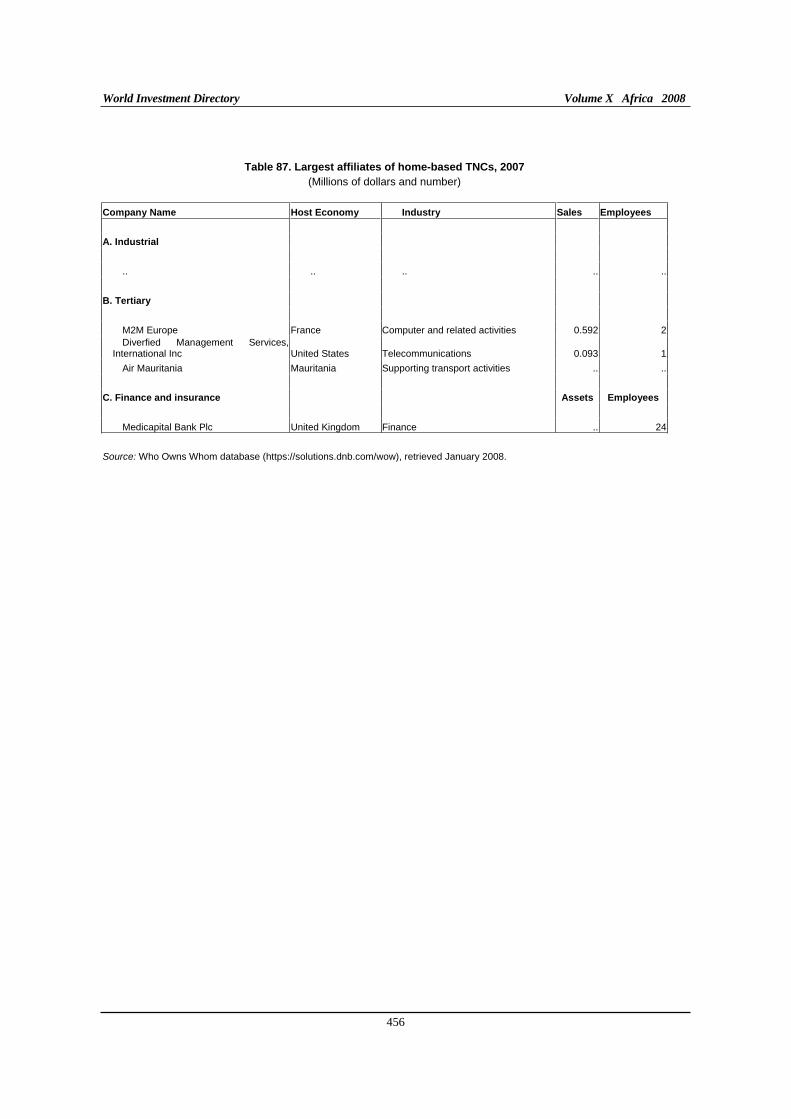
World Investment Directory Volume X Africa 2008
456
Table 87. Largest affiliates of home-based TNCs, 2007
(Millions of dollars and number)
Company Name Host Economy Industry Sales Employees
A. Industrial
.. .. .. .. ..
B. Tertiary
M2M Europe France Computer and related activities 0.592 2Diverfied Management Services,
International Inc United States Telecommunications 0.093 1
Air Mauritania Mauritania Supporting transport activities .. ..
C. Finance and insurance Assets Employees
Medicapital Bank Plc United Kingdom Finance .. 24
Source: Who Owns Whom database (https://solutions.dnb.com/wow), retrieved January 2008.

Morocco
457
Table 88. Largest affiliates of foreign TNCs in the host economy, 2007
(Millions of dollars and number)
Company Home economy Industry Sales Employees
A. Industrial
Air Liquide Maroc Sa France Chemicals and chemical products 9 438 240
Nexans Maroc Sa France Electrical and electronic equipments 160 520
Unilever Bestfoods Maghreb Sa United Kingdom Chemicals and chemical products 131 300
St Microelectronics Maroc Sa Netherlands Electrical and electronic equipments 117 4345
Nestle Maroc S A Switzerland Food products, beverages and tobacco 99 450
Compagnie Marocaine Des Cartons Et Papiers Sa United States Wood and wood products 88 1335
Valeo Cabelec Sa France Machinery and equipment 85 1300
Societe Marocaine De Cooperation Pharmaceutique Sa France Chemicals and chemical products 83 574
Valeo Bouznika France Electrical and electronic equipments 77 1270
Asment Temara Sa Portugal Non-metallic mineral products 77 243
Alcatel Maroc S A France Electrical and electronic equipments 61 575
Akzo Nobel Coating Sa Netherlands Chemicals and chemical products 60 615
Fromagerie Bel Maroc France Food products, beverages and tobacco 58 1894
Savola Morocco Saudi Arabia Food products, beverages and tobacco 30 105
Bayer Maghreb Sa Germany Chemicals and chemical products 28 100
Societe De Derives Du Sucre Sa France Food products, beverages and tobacco 24 200
Compagnie Industrielle Des Fibres Sa France Textiles and clothing 23 400
Colgate Palmolive Maroc Sa United States Machinery and equipment 22 208
B. Tertiary
Renault Maroc Sa France Wholesale trade 200 232
Telyco Maroc Sa Spain Wholesale trade 106 20
Scania Maroc Sa Sweden Wholesale trade 34 103
Bymaro Sa France Construction 31 3500
Wafasalaf Sa France Wholesale trade 30 70
Kraft Food Maroc Sa United States Wholesale trade 21 164
Societe Africaine De Vernis Et Laques Sa Netherlands Wholesale trade 20 110
Ibm Maroc Sa United States Wholesale trade 17 100
Gonvarri Industrial Maroc Sarl Spain Wholesale trade 16 70
Societe Pharmaceutique Du Detroit Sa France Wholesale trade 14 70Societe D'Importation Et Representation De Materiel Electrique Sa France Wholesale trade 13 71
Group 4 Falck Maroc Sa United Kingdom Other business activities 13 1899
Thomson Multimedia Maroc Sa India Wholesale trade 12 41
Nouvelle Societe Magideutz Sa Germany Wholesale trade 11 40
Alcatel Telecom Maroc Sa France Telecommunications 11 153
Bull Maroc S A France Wholesale trade 10 50
Maersk Logistics Maroc Sa Denmark Supporting transport activities 9 65
Crouzet Maroc Sa France Public administration 7 600
C. Finance and insurance Assets Employees
Societe Generale Marocaine Des Banques Sa France Finance 184.537 2000
Banque Marocaine Pour Le Commerce Et L' Industrie France Finance 181.85 1300
Source: Who Owns Whom database (https://solutions.dnb.com/wow), retrieved January 2008.

World Investment Directory Volume X Africa 2008
458
C. Legal frameworks for transnational corporations
Morocco is quite open to FDI. It has adopted a number of national, bilateral and multilateral legal instruments to regulate the activities of transnational corporations and foreign direct investors. Among the key legal instruments operational in the country are:
I. National framework
Moroccan Law of 1916 Chapter Three: Patents of Invention. Source: Abu-Ghazaleh Intellectual Property/Arab Worldhttp://www.agip.com
Dahir promulgating Law No. 1-73-408 of 13 August 1973. Source: Bulletin Officiel No. 3940 of 4 May 1988.
Dahir promulgating Law No. 1-73-409 of 13 August 1973. The Handicraft Investment Code. Source: Bulletin Officiel No. 3940 of 4 May 1988.
Law No. 1-76-385 of 17 December 1976 on The Moroccan Center for the Promotion of Exports. Source:Bulletin Officiel No. 3350 of 12 January 1977.
Dahir portant loi n°1-77-339 du 25 chaoual 1397 (9 octobre 1977) approuvant le code des douanes ainsi que des impôts indirects relevant de l'administration des douanes et impôts indirects, tel qu'il a été modifie et complété par la suite et par la loi n°02-99 promulguée par e dahir n° 1-00-222 du 2 rabii I 1421 (5 juin 2000).
Source : Bulletin officiel n°3389 Bis du 13/10/1977. Bulletin officiel n°4804 du 15/06/2000.
Law No. 1-83-134 of 3 June 1983 on the Investment Code. Source: Bulletin Official of 15 June 1983.
Dahir No. 1-83-134 promulgating Law No. 20-82. The Tourism Investment Code. Source: Bulletin Official No. 3685 of 15 June 1983.
Dahir No. 1-83-107- Promulgating Law No. 21-82 . The Maritime Investment Code. Source: Bulletin Officiel No. 3775 of 6 March 1985.
Dahir No. 1-85-100 promulgating Law No. 15-85. The Real Estate Investment Code. Source: Bulletin Officiel No. 3799 of 21 August 1985.
Loi n°24-86 instituant l'impôt sur les sociétés du 31 décembre 1986.
Source : Bulletin officielle n°3873 du 21 janvier 1987.
Law No. 24-86 of 31 December 1986 introducing the Company Tax. Source: Bulletin Officiel of 21 January 1987.
Dahir No. 1-86-1 promulgating Law No. 1-84. The Mining Investment Code. Source: Bulletin Officiel No. 3875 of 4 February 1987.
Circular No. 1504 of 1 March 1988 concerning Foreign Investment Source: Office des Changes (Office of Exchange Control), Rabat.
Dahir promulgating Law No. 01-88. Source: Bulletin Officiel No. 3940 of 4 May 1988.
Dahir No. 1-88-14 of 4 May 1988 promulgating Law No. 02-88

Morocco
459
Source: Bulletin Officiel No. 3940 of 4 May 1988.
Dahir No. 1-88-17 promulgating Law No. 05-88. Source: Bulletin Official No. 3940 of 4 May 1988.
Dahir No. 1-88-18 promulgating Law No. 06-88. Source: Bulletin Officiel No. 3940 of 4 May 1988 and Decree No. 2-88-484. Source: Bulletin Officiel No. 3955 of 17 August 1988.
Dahir No. 1-88-19 promulgating Law No. 07-88. Source: Bulletin Officiel No. 3940 of 4 May 1988.
Dahir No. 1-88-20 promulgating Law No. 08-88. Source: Bulletin Officiel No. 3940 of 4 May 1988.
Dahir No. 01-88- promulgating the Finance Law for 1989, further amending Law No. 1-73-408 of 13 August 1973. Source: Bulletin Officiel No. 3975 of 4 January 1989 and in Investment Codes of North Africa: Morocco, by E. de Brauw (English translation).
Law No. 39-89 authorizing the transfer of public enterprises to the private sector, promulgated by Dahir No. 1-90-01 of 11 April 1990. Source: World Bank, Technical Paper No. 186, "Divestiture of State Enterprises". An overview of the legal framework.
Dahir n°1-90-01 du 15 ramadan 1410 (11 avril 1990) portant promulgation de la loi n°39-89 autorisant le transfert d'entreprises publiques au secteur privé.
Source : Bulletin officiel n°4042 du 22 ramadan 1410 (18 avril 1990).
Decree No. 2-90-402 taken pursuant to article 5 of law No. 39-89, authorizing the transfer of public enterprises to the private sector of 16 October 1990. Source: World Bank, Technical Paper No. 186, "Divestiture of State Enterprises". An overview of the legal framework.
Decree No. 2-90-403 on the powers of the minister charged with implementing the transfer public enterprises to the private sector of 16 October 1990. Source: World Bank, Technical Paper No. 186, "Divestiture of State Enterprises". An overview of the legal framework.
Decree No. 2-90-577 issued in application of article 7 of law No. 39-89 of 16 October 1990. Source: World Bank, Technical Paper No. 186, "Divestiture of State Enterprises". An overview of the legal framework.
Decree No. 2-90-578 setting the Working Conditions of the Transfer Commission provided for article 2 of law No. 39-89, authorizing the transfer of public enterprises to the private sector of 16 October 1990. Source: World Bank, Technical Paper No. 186, "Divestiture of State Enterprises". An overview of the legal framework.
Dahir No. 1-91-131 of 26 February 1992 promulgating Law No. 58-90 on Off-shore Financial Centres and Off-shore Zone of Tangier. Source: Bulletin Officiel of 26 February 1992.
Circulaire n°1589 du 15 Septembre 1992 (17 Rabii I 1413 ) relative au Régime de convertibilité en faveur des investissements étrangers.
Source : office des changes.
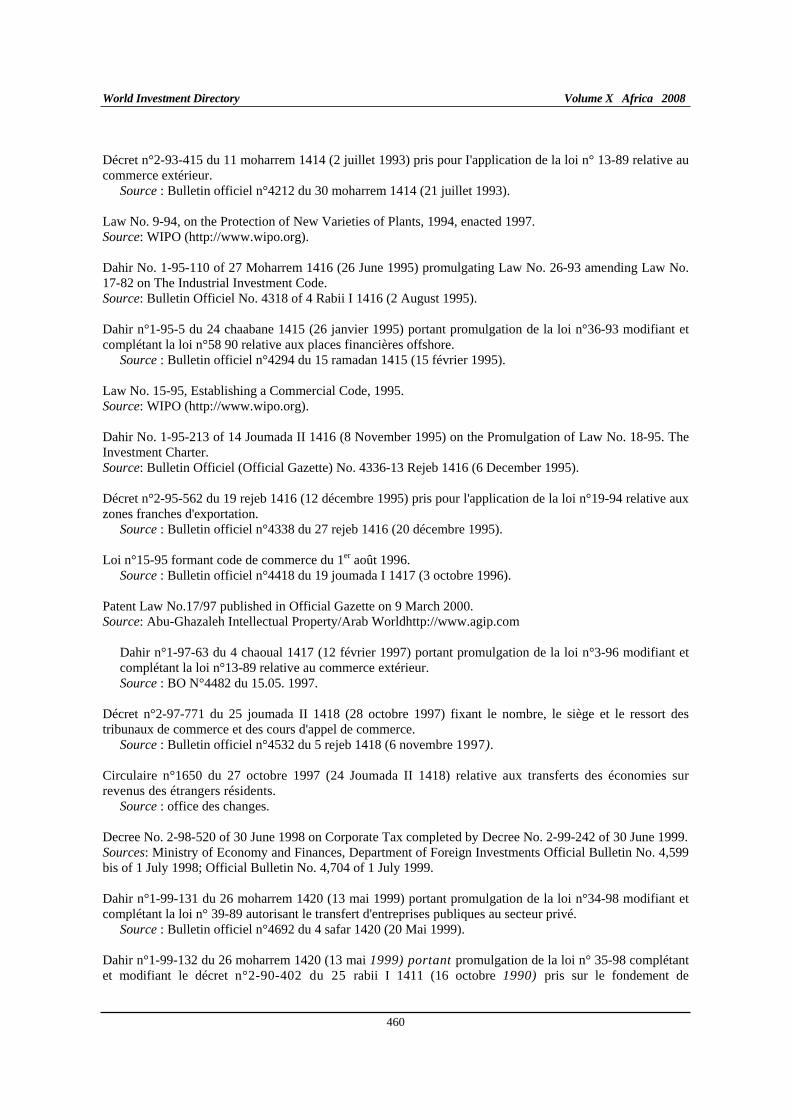
World Investment Directory Volume X Africa 2008
460
Décret n°2-93-415 du 11 moharrem 1414 (2 juillet 1993) pris pour I'application de la loi n° 13-89 relative au commerce extérieur.
Source : Bulletin officiel n°4212 du 30 moharrem 1414 (21 juillet 1993).
Law No. 9-94, on the Protection of New Varieties of Plants, 1994, enacted 1997. Source: WIPO (http://www.wipo.org).
Dahir No. 1-95-110 of 27 Moharrem 1416 (26 June 1995) promulgating Law No. 26-93 amending Law No. 17-82 on The Industrial Investment Code. Source: Bulletin Officiel No. 4318 of 4 Rabii I 1416 (2 August 1995).
Dahir n°1-95-5 du 24 chaabane 1415 (26 janvier 1995) portant promulgation de la loi n°36-93 modifiant et complétant la loi n°58 90 relative aux places financières offshore.
Source : Bulletin officiel n°4294 du 15 ramadan 1415 (15 février 1995).
Law No. 15-95, Establishing a Commercial Code, 1995. Source: WIPO (http://www.wipo.org).
Dahir No. 1-95-213 of 14 Joumada II 1416 (8 November 1995) on the Promulgation of Law No. 18-95. The Investment Charter. Source: Bulletin Officiel (Official Gazette) No. 4336-13 Rejeb 1416 (6 December 1995).
Décret n°2-95-562 du 19 rejeb 1416 (12 décembre 1995) pris pour l'application de la loi n°19-94 relative aux zones franches d'exportation.
Source : Bulletin officiel n°4338 du 27 rejeb 1416 (20 décembre 1995).
Loi n°15-95 formant code de commerce du 1er août 1996. Source : Bulletin officiel n°4418 du 19 joumada I 1417 (3 octobre 1996).
Patent Law No.17/97 published in Official Gazette on 9 March 2000. Source: Abu-Ghazaleh Intellectual Property/Arab Worldhttp://www.agip.com
Dahir n°1-97-63 du 4 chaoual 1417 (12 février 1997) portant promulgation de la loi n°3-96 modifiant et complétant la loi n°13-89 relative au commerce extérieur. Source : BO N°4482 du 15.05. 1997.
Décret n°2-97-771 du 25 joumada II 1418 (28 octobre 1997) fixant le nombre, le siège et le ressort des tribunaux de commerce et des cours d'appel de commerce.
Source : Bulletin officiel n°4532 du 5 rejeb 1418 (6 novembre 1997).
Circulaire n°1650 du 27 octobre 1997 (24 Joumada II 1418) relative aux transferts des économies sur revenus des étrangers résidents.
Source : office des changes.
Decree No. 2-98-520 of 30 June 1998 on Corporate Tax completed by Decree No. 2-99-242 of 30 June 1999. Sources: Ministry of Economy and Finances, Department of Foreign Investments Official Bulletin No. 4,599 bis of 1 July 1998; Official Bulletin No. 4,704 of 1 July 1999.
Dahir n°1-99-131 du 26 moharrem 1420 (13 mai 1999) portant promulgation de la loi n°34-98 modifiant et complétant la loi n° 39-89 autorisant le transfert d'entreprises publiques au secteur privé.
Source : Bulletin officiel n°4692 du 4 safar 1420 (20 Mai 1999).
Dahir n°1-99-132 du 26 moharrem 1420 (13 mai 1999) portant promulgation de la loi n° 35-98 complétant et modifiant le décret n°2-90-402 du 25 rabii I 1411 (16 octobre 1990) pris sur le fondement de

Morocco
461
l'habilitation prévue par l'article 5 de la loi n°39-89 autorisant le transfert d'entreprises publiques au secteur privé.
Source : Bulletin officiel n°4692 du 4 safar 1420 (20 mai 1999).
Décret n°2-99-125 du 27 moharrem 1420 (14 mai 1999) complétant le décret n°2-90-577 du 25 rabii 11411 (16 octobre 1990) pris pour l'application de l'article 7 de la loi n°39-89 autorisant le transfert d'entreprises publiques au secteur privé.
Source : Bulletin officiel n° 4692 du 4 safar 1420 (20 Mai 1999).
Decree No. 1.00.20 issued on 9 Dhul-Qada 1420 (15 February 2000) Of executing Law No. 2-00 related to copyrights and the neighboring rights. Source: Abu-Ghazaleh Intellectual Property/Arab Worldhttp://www.agip.com
Dahir n°1-00-19 du 9 kaada 1420 (15 février 2000) portant promulgation de la loi n°17-97 relative à la protection de la propriété industrielle.
Source : Bulletin officiel n°4778 du 9 hija 1420 (16 mars 2000).
Decree No. 1.00.19 issued on 9 Dhul-Qada 1420 (February 15, 2000) Of executing Law No. 17.97 related to Industrial Property Protection. Source: Abu-Ghazaleh Intellectual Property/Arab Worldhttp://www.agip.com
Copyright Law (Thaheer Sherief No. 1.00.20 dated 15 February, 2000) published in Official Gazette on May 18, 2000. Source: Abu-Ghazaleh Intellectual Property/Arab Worldhttp://www.agip.com
Dahir n°1-00-225 du 2 rabii I 1421 (5 juin 2000) portant promulgation de la loi n°06–99 sur la liberté des prix et de la concurrence.
Source : Bulletin officiel n°4810 du 3 rabii I 1421 (6 juillet 2000).
Dahir n°1-00-20 du 9 kaada 1420 (15 février 2000) portant promulgation de la loi n°2-00 relative aux droits d'auteur et droits voisins.
Source : Bulletin officiel n°4810 du 3 rabii 11 1421 (6 juillet 2000).
Décret n°2-00-280 du 17 rabii 1 1421 (20 juin 2000) modifiant et complétant le décret n°2-97-771 du 25 joumada II 1418 (28 octobre 1997) fixant le nombre, le siège et le ressort des tribunaux de commerce et des cours d'appel de commerce. Source : Bulletin officiel n°4810 du 3 rabii II 1421 (6 juillet 2000).
Law No. 2-00 for copyright and neighbouring rights. Source: Abu-Ghazaleh Intellectual Property/Arab Worldhttp://www.agip.com.
Décret n°2-00-895 du 6 Kaada 1421 (31 janvier 2001) pris pour l'application des articles 17 et 19 de la loi cadre n°18-95 formant charte de l'investissement.
Source : Bulletin officiel n°4874 du 21 Kaada 1421 (15 février 2001).
Article 5 de la loi de finances 2001 : exonérations fiscales au profit d'investisseurs réalisant un montant d'investissement dépassant 200 millions de dirhams, octroyées dans le cadre d'une convention a conclure avec l'Etat.
Lettre royale au Premier Ministre relatif à la gestion déconcentrée de l'investissement. Source : Bulletin officiel n°4970 du 3 Kaada 1422 (17 janvier 2002).
Décret n°2-02-9 du 6 joumada I 1423 (17 juillet 2002) modifiant et complétant le décret n°2-77-862 du 25 chaoual 1397 (9 octobre 1977) pris pour l'application du code des douanes et impôts indirects.
Source : Bulletin officiel n°5030 du 6 joumada II 1423 (15 août 2002).
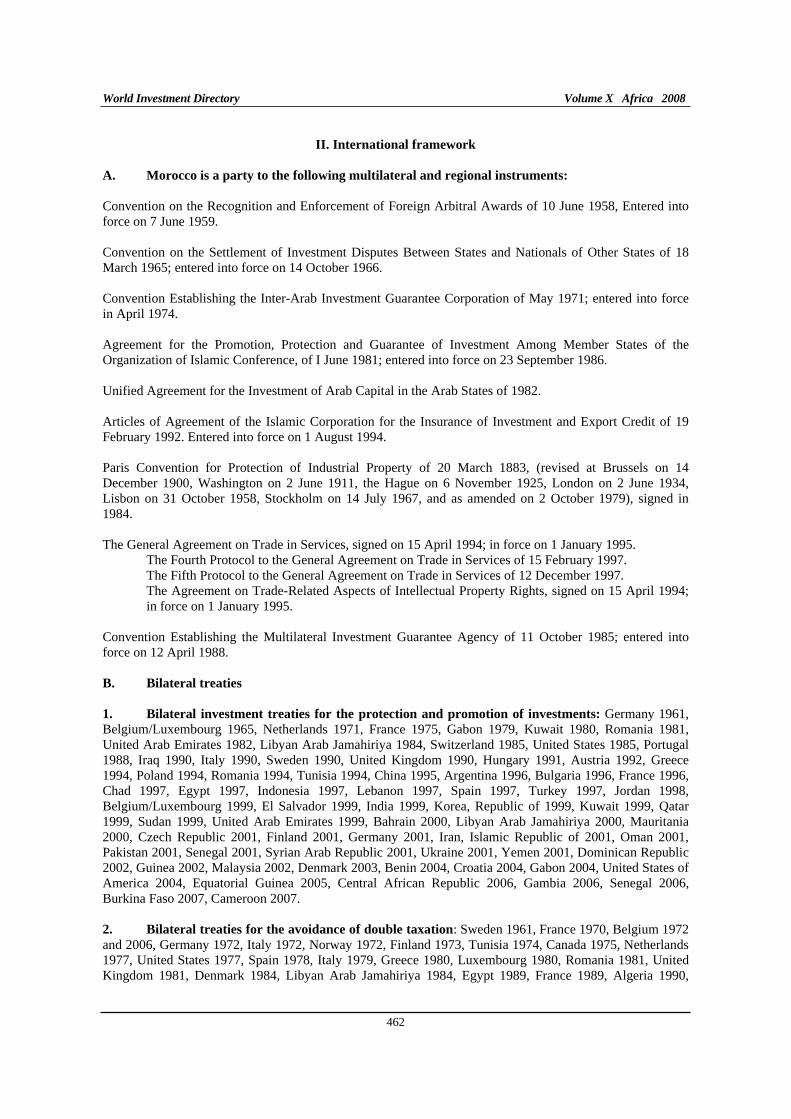
World Investment Directory Volume X Africa 2008
462
II. International framework
A. Morocco is a party to the following multilateral and regional instruments:
Convention on the Recognition and Enforcement of Foreign Arbitral Awards of 10 June 1958, Entered into force on 7 June 1959.
Convention on the Settlement of Investment Disputes Between States and Nationals of Other States of 18 March 1965; entered into force on 14 October 1966.
Convention Establishing the Inter-Arab Investment Guarantee Corporation of May 1971; entered into force in April 1974.
Agreement for the Promotion, Protection and Guarantee of Investment Among Member States of the Organization of Islamic Conference, of I June 1981; entered into force on 23 September 1986.
Unified Agreement for the Investment of Arab Capital in the Arab States of 1982.
Articles of Agreement of the Islamic Corporation for the Insurance of Investment and Export Credit of 19 February 1992. Entered into force on 1 August 1994.
Paris Convention for Protection of Industrial Property of 20 March 1883, (revised at Brussels on 14 December 1900, Washington on 2 June 1911, the Hague on 6 November 1925, London on 2 June 1934, Lisbon on 31 October 1958, Stockholm on 14 July 1967, and as amended on 2 October 1979), signed in 1984.
The General Agreement on Trade in Services, signed on 15 April 1994; in force on 1 January 1995. The Fourth Protocol to the General Agreement on Trade in Services of 15 February 1997. The Fifth Protocol to the General Agreement on Trade in Services of 12 December 1997. The Agreement on Trade-Related Aspects of Intellectual Property Rights, signed on 15 April 1994; in force on 1 January 1995.
Convention Establishing the Multilateral Investment Guarantee Agency of 11 October 1985; entered into force on 12 April 1988.
B. Bilateral treaties
1. Bilateral investment treaties for the protection and promotion of investments: Germany 1961, Belgium/Luxembourg 1965, Netherlands 1971, France 1975, Gabon 1979, Kuwait 1980, Romania 1981, United Arab Emirates 1982, Libyan Arab Jamahiriya 1984, Switzerland 1985, United States 1985, Portugal 1988, Iraq 1990, Italy 1990, Sweden 1990, United Kingdom 1990, Hungary 1991, Austria 1992, Greece 1994, Poland 1994, Romania 1994, Tunisia 1994, China 1995, Argentina 1996, Bulgaria 1996, France 1996, Chad 1997, Egypt 1997, Indonesia 1997, Lebanon 1997, Spain 1997, Turkey 1997, Jordan 1998, Belgium/Luxembourg 1999, El Salvador 1999, India 1999, Korea, Republic of 1999, Kuwait 1999, Qatar 1999, Sudan 1999, United Arab Emirates 1999, Bahrain 2000, Libyan Arab Jamahiriya 2000, Mauritania 2000, Czech Republic 2001, Finland 2001, Germany 2001, Iran, Islamic Republic of 2001, Oman 2001, Pakistan 2001, Senegal 2001, Syrian Arab Republic 2001, Ukraine 2001, Yemen 2001, Dominican Republic 2002, Guinea 2002, Malaysia 2002, Denmark 2003, Benin 2004, Croatia 2004, Gabon 2004, United States of America 2004, Equatorial Guinea 2005, Central African Republic 2006, Gambia 2006, Senegal 2006, Burkina Faso 2007, Cameroon 2007.
2. Bilateral treaties for the avoidance of double taxation: Sweden 1961, France 1970, Belgium 1972 and 2006, Germany 1972, Italy 1972, Norway 1972, Finland 1973, Tunisia 1974, Canada 1975, Netherlands 1977, United States 1977, Spain 1978, Italy 1979, Greece 1980, Luxembourg 1980, Romania 1981, United Kingdom 1981, Denmark 1984, Libyan Arab Jamahiriya 1984, Egypt 1989, France 1989, Algeria 1990,

Morocco
463
Hungary 1991, Switzerland 1993, Poland 1994, Bulgaria 1996, Portugal 1997, Russian Federation 1997, India 1998, Korea, Republic of 1999, United Arab Emirates 1999, Bahrain 2000, Spain 2000, Finland 2001 and 2006, China 2002, Senegal 2002, Austria 2002, Lebanon 2002, Senegal 2002, Turkey 2004, Jordan 2005, Syrian Arab Republic 2005, Côte d'Ivoire 2006, Pakistan 2006, Qatar 2006, Yemen 2006.
C. Other treaties:
Euro-Mediterranean Agreement establishing association with the European Communities and their member states (1976 and 1996).
Free trade agreement with the European Free Trade Association (EFTA) states (1997).
Free trade agreement with the United States of America (2004).
Free Trade Agreement with Turkey (2004).

World Investment Directory Volume X Africa 2008
464
D. Sources of information
Official
The Ministry of Finance: ( www.Mfie.Gov.Ma). Banque Marocaine Du Commerce Extérieur (www.Bmcebank.Ma). Office des Changes (Foreign Exchange Office).
Secondary
Azam, Jean-Paul and Christian Morisson (1994). The political feasibility of adjustment in Cote d'Ivoire and
Morocco (Paris: Development, OECD).
Bank al-Maghrib (2001). Rapport Annuel, Rabat (available in English)
Banque Marocaine du commerce extérieur (2002). Annual Report: Le Maroc en chiffres, Rabat.
Economist Intelligence Unit (EIU) (various years). Country Profile: Morocco (London: EIU Ltd.).
___________ (various years). Country Report: Morocco (London: EIU Ltd.).
Fitzgerald, Sara, L. (2003). Moving ahead with Morocco (Washington D.C.: The heritage foundation).
Gray, Clive (1997). "Pourquoi le Maroc n'appartient t-il pas aux pays en developpement a croissance rapide?", mimeo.
Haddad, Mona and Ann Harrison (1993). "Are there positive spillovers from direct foreign investment: evidence from panel data for Morocco?". Journal of Development Economics, Vol. 42(1), pp. 51-74.
Horton, Brendan (1990). Morocco: Analysis and reform of economic policy (Washington D.C.: World Bank).
Ministère de l’économie national (2002). Bulletin Mensuel de Statistique, Rabat.
Soderbom, M. and F. Teal (2004). "Size and Efficiency in Africa Manufacturing firms: Evidence from Firm-Level Panel Data." Journal of Development Economics, 73. pp 369 - 394.
The Moroccan American Business Council Ltd. (MABC) (1999). 1999 Investment climate statement for
Morocco (Rabat: Economic section, Embassy of the United States ).
The United States Agency for International Development (USAID) (2000). "Promoting increased productive investment in the Moroccan economy", (Rabat: USAID).
___________(2005a). Investor-Disputes Arising from Investment Treaties: A Review. UNCTAD Series of International Investment Policies for Development (UNCTAD/ITE/IIT/2005/4).
___________(2005b). A Survey of Support by Investment Promotion Agencies to Linkages. Advisory Studies No. 18 (UNCTAD/ITE/IPC/2005/12).
United States Commercial Service (2006). Doing Business in Morocco: A country Commercial Guide for
US Companies. (Washington D.C.: US Government).
World Bank (1993). "The Kingdom of Morocco: developing private industry in Morocco", Report No. 11557-MOR. (Washington D.C.: World Bank), January.
World Bank/International Finance Corporation (2007). Doing Business 2008 Morocco (Washington D.C.: The World Bank Group).

Mozambique
465
Mozambique
A. Definitions and sources of data
In Mozambique, foreign direct investment (FDI) is defined as any form of foreign capital contribution, valuables in monetary terms which constitutes own equity capital or resources at the own account and risk of foreign investor brought from external sources and to be used in an investment project for carrying out an economic activity, through a company registered in Mozambique and operating in Mozambican territory (Law of Investment – Law No. 3/93). The data on FDI are collected by Bank of Mozambique and the Centro de Promocao de Investmentos (CPI). The International Monetary Fund also reports the country's FDI flow data in its balance-of-payments statistics.
The Law 4/84 and the Direct Investment Order of January 1987 set the basic framework for foreign investment. In June 1993, a new investment code was approved, simplifying procedures for investment proposals and streamlining the decision process. The country adopted a separate code for petroleum and mining industries. The CPI offers a comprehensive service in support of foreign investors wishing to invest anywhere in the country. It acts as a one-stop shop. Companies established under the Investment Code must get authorization from the CPI and register their investment at the Ministry of Finance and the Bank of Mozambique. Regulations governing business operations include labour and tax laws and investment incentives such as the ability to remit profits. The CPI has increasingly tried to co-ordinate sectoral efforts to clarify the investment environment, stressing the country's position as a "gateway to Southern Africa". Additionally, the CPI processes and offers privileged access to a range of sectoral activities, providing exemptions from import and export duties and income, and from profit and sales taxes with the exception of a reasonable royalty on turnover.
As a means of boosting private sector activities and FDI, Mozambique has made significant efforts to upgrade its infrastructure. The massive effort in the Maputo corridor is an important project given the close economic ties between Mozambique and South Africa and the potential benefits of improved bilateral transport links. It is hoped that the combination of better road, rail and port services will serve as a catalyst for secondary development along the whole corridor. In the telecommunications sector, some services have been upgraded.
Mozambique signed to the Convention on the Settlement of Investment Disputes between State and Nationals of other States on 4 April 1995 and other market access-enhancing measures to improve its attractiveness to FDI. Since the end of the civil war in 1992, it has forged good relations with the United States, Japan and most European countries. Mozambican foreign policy is now largely focused on South Africa, other members of the Southern African Development Community, the Common Market for Eastern and Southern Africa, the African Union, New Partnership for Africa's Development, western donors and Portugal. Mozambique is eligible for trade and investment initiatives including the United States' market access initiative for African - the African Growth and Opportunity Act, the European Union's (EU) Everything But Arms initiative, and the Cotonou agreement for renegotiating the partnership links between the African, Caribbean and Pacific countries with the EU under the Lomé Convention. Mozambique is a member of the World Trade Organization.
.
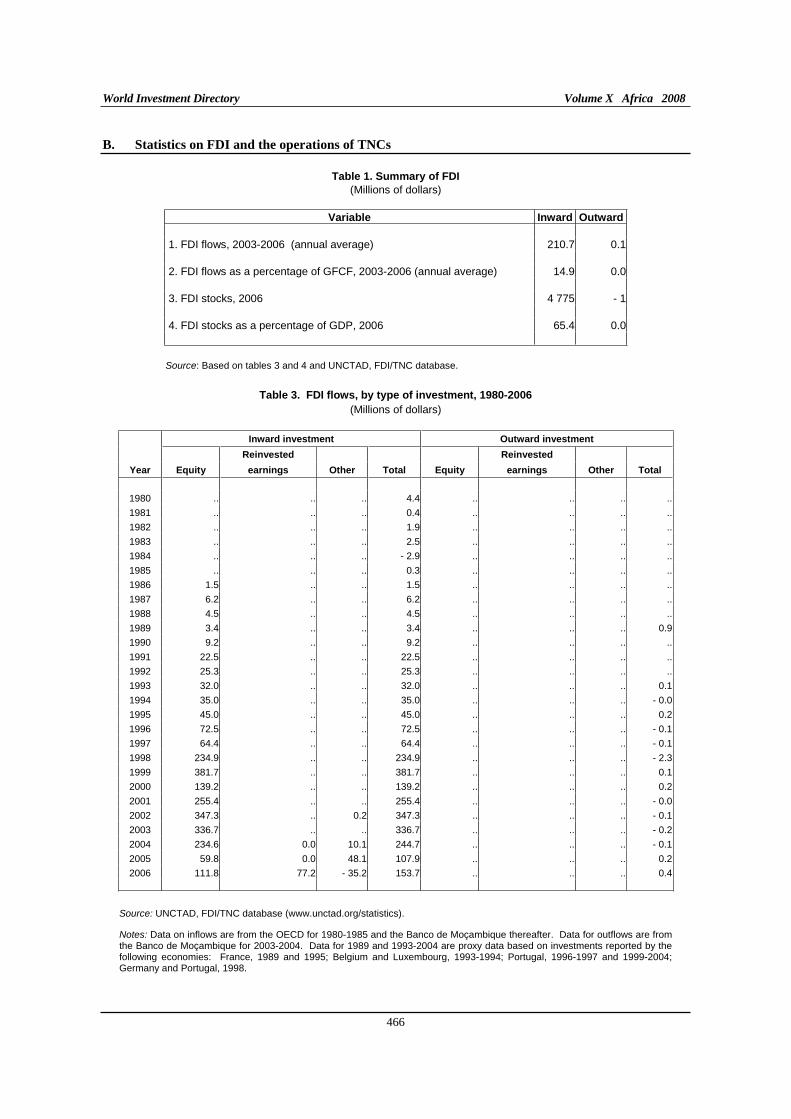
World Investment Directory Volume X Africa 2008
466
B. Statistics on FDI and the operations of TNCs
Table 1. Summary of FDI
(Millions of dollars)
Variable Inward Outward
1. FDI flows, 2003-2006 (annual average) 210.7 0.1
2. FDI flows as a percentage of GFCF, 2003-2006 (annual average) 14.9 0.0
3. FDI stocks, 2006 4 775 - 1
4. FDI stocks as a percentage of GDP, 2006 65.4 0.0
Source: Based on tables 3 and 4 and UNCTAD, FDI/TNC database.
Table 3. FDI flows, by type of investment, 1980-2006
(Millions of dollars)
Inward investment Outward investment
Reinvested Reinvested
Year Equity earnings Other Total Equity earnings Other Total
1980 .. .. .. 4.4 .. .. .. ..
1981 .. .. .. 0.4 .. .. .. ..
1982 .. .. .. 1.9 .. .. .. ..
1983 .. .. .. 2.5 .. .. .. ..
1984 .. .. .. - 2.9 .. .. .. ..
1985 .. .. .. 0.3 .. .. .. ..
1986 1.5 .. .. 1.5 .. .. .. ..
1987 6.2 .. .. 6.2 .. .. .. ..
1988 4.5 .. .. 4.5 .. .. .. ..
1989 3.4 .. .. 3.4 .. .. .. 0.9
1990 9.2 .. .. 9.2 .. .. .. ..
1991 22.5 .. .. 22.5 .. .. .. ..
1992 25.3 .. .. 25.3 .. .. .. ..
1993 32.0 .. .. 32.0 .. .. .. 0.1
1994 35.0 .. .. 35.0 .. .. .. - 0.0
1995 45.0 .. .. 45.0 .. .. .. 0.2
1996 72.5 .. .. 72.5 .. .. .. - 0.1
1997 64.4 .. .. 64.4 .. .. .. - 0.1
1998 234.9 .. .. 234.9 .. .. .. - 2.3
1999 381.7 .. .. 381.7 .. .. .. 0.1
2000 139.2 .. .. 139.2 .. .. .. 0.2
2001 255.4 .. .. 255.4 .. .. .. - 0.0
2002 347.3 .. 0.2 347.3 .. .. .. - 0.1
2003 336.7 .. .. 336.7 .. .. .. - 0.2
2004 234.6 0.0 10.1 244.7 .. .. .. - 0.1
2005 59.8 0.0 48.1 107.9 .. .. .. 0.2
2006 111.8 77.2 - 35.2 153.7 .. .. .. 0.4 Source: UNCTAD, FDI/TNC database (www.unctad.org/statistics).
Notes: Data on inflows are from the OECD for 1980-1985 and the Banco de Moçambique thereafter. Data for outflows are from the Banco de Moçambique for 2003-2004. Data for 1989 and 1993-2004 are proxy data based on investments reported by the following economies: France, 1989 and 1995; Belgium and Luxembourg, 1993-1994; Portugal, 1996-1997 and 1999-2004; Germany and Portugal, 1998.

Mozambique
467
Table 4. FDI stocks, by type of investment, 1980-2006
(Millions of dollars)
Inward investment Outward investment
Equity & Equity &
Reinvested Reinvested Reinvested Reinvested
Year earnings earnings Other Total earnings earnings Other Total
1980 .. .. .. 854.5 .. .. .. ..1981 .. .. .. 854.9 .. .. .. ..1982 .. .. .. 856.8 .. .. .. ..1983 .. .. .. 859.3 .. .. .. ..1984 .. .. .. 856.4 .. .. .. ..1985 .. .. .. 856.7 .. .. .. -1986 .. .. .. 858.2 .. .. .. 1.01987 .. .. .. 864.4 .. .. .. 2.01988 .. .. .. 868.9 .. .. .. 3.01989 .. .. .. 872.3 .. .. .. 0.91990 .. .. .. 881.5 .. .. .. 0.91991 .. .. .. 904.0 .. .. .. 0.91992 .. .. .. 929.3 .. .. .. 0.91993 .. .. .. 961.3 .. .. .. 1.01994 .. .. .. 996.3 .. .. .. 1.01995 .. .. .. 1 041.3 .. .. .. 1.21996 .. .. .. 1 113.8 .. .. .. 1.01997 1 178.2 .. .. 1 178.2 .. .. .. 1.01998 1 413.1 .. .. 1 413.1 .. .. .. - 1.41999 1 794.9 .. .. 1 794.9 .. .. .. - 1.22000 1 934.1 .. .. 1 934.1 .. .. .. - 1.02001 2 189.5 .. .. 2 189.5 .. .. .. - 1.02002 3 573.1 .. .. 3 573.1 .. .. .. - 1.12003 4 126.2 .. .. 4 126.2 .. .. .. - 1.32004 4 360.7 .. 10.1 4 370.9 .. .. .. - 1.32005 4 420.5 .. 200.5 4 621.0 .. .. .. - 1.12006 4 609.5 .. 165.2 4 774.8 .. .. .. - 0.7
Source: UNCTAD, FDI/TNC database (www.unctad.org/statistics). Notes: Data on inward stock prior to 1997 are estimated by accumulating inflows since 1970. From 1997 onwards, data are from the Banco de Moçambique. Data for outward stock are estimated by accumulating inflows since 1989.
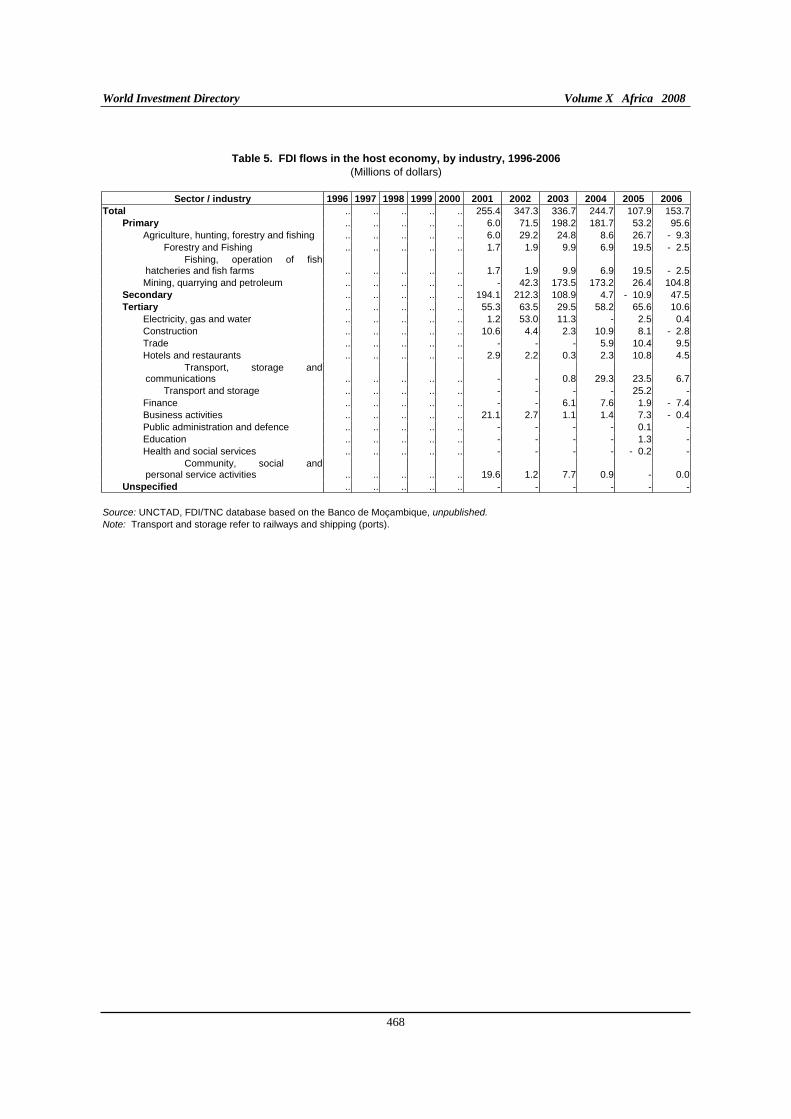
World Investment Directory Volume X Africa 2008
468
Table 5. FDI flows in the host economy, by industry, 1996-2006
(Millions of dollars)
Sector / industry 1996 1997 1998 1999 2000 2001 2002 2003 2004 2005 2006
Total .. .. .. .. .. 255.4 347.3 336.7 244.7 107.9 153.7Primary .. .. .. .. .. 6.0 71.5 198.2 181.7 53.2 95.6
Agriculture, hunting, forestry and fishing .. .. .. .. .. 6.0 29.2 24.8 8.6 26.7 - 9.3Forestry and Fishing .. .. .. .. .. 1.7 1.9 9.9 6.9 19.5 - 2.5
Fishing, operation of fish hatcheries and fish farms .. .. .. .. .. 1.7 1.9 9.9 6.9 19.5 - 2.5Mining, quarrying and petroleum .. .. .. .. .. - 42.3 173.5 173.2 26.4 104.8
Secondary .. .. .. .. .. 194.1 212.3 108.9 4.7 - 10.9 47.5Tertiary .. .. .. .. .. 55.3 63.5 29.5 58.2 65.6 10.6
Electricity, gas and water .. .. .. .. .. 1.2 53.0 11.3 - 2.5 0.4Construction .. .. .. .. .. 10.6 4.4 2.3 10.9 8.1 - 2.8Trade .. .. .. .. .. - - - 5.9 10.4 9.5Hotels and restaurants .. .. .. .. .. 2.9 2.2 0.3 2.3 10.8 4.5
Transport, storage and communications .. .. .. .. .. - - 0.8 29.3 23.5 6.7
Transport and storage .. .. .. .. .. - - - - 25.2 -Finance .. .. .. .. .. - - 6.1 7.6 1.9 - 7.4Business activities .. .. .. .. .. 21.1 2.7 1.1 1.4 7.3 - 0.4Public administration and defence .. .. .. .. .. - - - - 0.1 -Education .. .. .. .. .. - - - - 1.3 -Health and social services .. .. .. .. .. - - - - - 0.2 -
Community, social and personal service activities .. .. .. .. .. 19.6 1.2 7.7 0.9 - 0.0
Unspecified .. .. .. .. .. - - - - - - Source: UNCTAD, FDI/TNC database based on the Banco de Moçambique, unpublished. Note: Transport and storage refer to railways and shipping (ports).

Mozambique
469
Table 6. FDI flows in the host economy, by geographical origin, 1996-2006
(Millions of dollars)
Region / economy 1996 1997 1998 1999 2000 2001 2002 2003 2004 2005 2006
Total world .. .. .. .. .. .. .. .. 244.7 107.9 153.7Developed countries .. .. .. .. .. .. .. .. 24.8 53.2 2.5
Europe .. .. .. .. .. .. .. .. 24.8 54.7 1.7European Union .. .. .. .. .. .. .. .. 24.6 50.8 1.9
Austria .. .. .. .. .. .. .. .. - 0.2 0.0France .. .. .. .. .. .. .. .. 1.3 19.1 - 1.4Netherlands .. .. .. .. .. .. .. .. 0.1 - 4.0Portugal .. .. .. .. .. .. .. .. 13.0 20.3 - 13.5Spain .. .. .. .. .. .. .. .. 0.0 0.6 -United Kingdom .. .. .. .. .. .. .. .. 10.1 10.7 12.7
Other developed Europe .. .. .. .. .. .. .. .. 0.2 3.9 - 0.2Norway .. .. .. .. .. .. .. .. 0.0 0.0 0.0Switzerland .. .. .. .. .. .. .. .. 0.2 3.9 - 0.3
North America .. .. .. .. .. .. .. .. 0.1 - 1.6 2.0United States .. .. .. .. .. .. .. .. 0.1 - 1.6 2.0
Other developed countries .. .. .. .. .. .. .. .. - - - 1.1Japan .. .. .. .. .. .. .. .. - - - 1.1
Developing economies .. .. .. .. .. .. .. .. 209.7 44.9 158.9Africa .. .. .. .. .. .. .. .. 86.6 25.4 146.2
Malawi .. .. .. .. .. .. .. .. - 2.1 0.4Mauritius .. .. .. .. .. .. .. .. 79.6 8.0 30.0Reunion .. .. .. .. .. .. .. .. 2.8 1.3 - 0.0South Africa .. .. .. .. .. .. .. .. 4.1 12.2 113.8Swaziland .. .. .. .. .. .. .. .. - 1.3 2.1Zimbabwe .. .. .. .. .. .. .. .. - 0.6 - 0.1
Latin America and the Caribbean .. .. .. .. .. .. .. .. 122.8 6.9 12.5South America .. .. .. .. .. .. .. .. 122.8 - 6.5
Brazil .. .. .. .. .. .. .. .. 122.8 - 6.5Caribbean and other America .. .. .. .. .. .. .. .. - 6.9 6.0
Bahamas .. .. .. .. .. .. .. .. - 5.6 5.6British Virgin Islands .. .. .. .. .. .. .. .. - 1.3 0.4
Asia .. .. .. .. .. .. .. .. 0.3 12.6 0.2West Asia .. .. .. .. .. .. .. .. 0.3 - -
United Arab Emirates .. .. .. .. .. .. .. .. 0.3 - -South, East and South-East Asia .. .. .. .. .. .. .. .. 0.1 12.6 0.2
India .. .. .. .. .. .. .. .. 0.1 12.6 -Singapore .. .. .. .. .. .. .. .. - - 0.2
Unspecified .. .. .. .. .. .. .. .. 10.1 9.8 - 7.6
Source: UNCTAD, FDI/TNC database based on the Banco de Moçambique, unpublished.

World Investment Directory Volume X Africa 2008
470
Table 9. FDI flows abroad, by geographical destination, 1996-2006
(Millions of dollars) Economy 1992 1993 1994 1995 1996 1997 1998 1999 2000 2001 2002 2003 2004 2005 2006
Brazil - - - - - - - - - - - - - 0.1 0.0Bulgaria - - - - - - - - - - - - - 0.1 -France - - - - - - - - - - 0.9 - - - - -Germany - - - - - - - 1.1 - - - - - - - -Portugal - - - - - 0.1 - 0.1 - 0.1 0.1 0.2 - 0.0 - 0.1 - 0.2 - 0.1 - 0.2 - 0.8
Source: UNCTAD, FDI / TNC database. Note: Data is based on the information reported by the economies listed above.
Table 12. FDI stocks in the host economy, by geographical origin, 1996-2006
(Millions of dollars) Economy 1992 1993 1994 1995 1996 1997 1998 1999 2000 2001 2002 2003 2004 2005 2006
Brazil - - - - - - - - - - - 0.1 - - -China - - - - - - - - - - - 2.4 5.6 14.7 -Denmark - - - - - - - - - - - - - 0.2 - 0.2Malaysia - - - - - 0.5 1.3 5.2 9.1 9.1 9.1 9.1 9.1 9.3 -Portugal - - - - 84.8 107.2 458.5 452.1 421.5 403.6 415.3 430.7 475.4 - -South Africa - - - - - - - - - 339.5 798.1 763.7 780.8 724.7 764.8United Kingdom 22.7 20.7 12.5 32.6 11.9 - - - - - - - - - -United States - - 1.0 2.0 3.0 4.0 5.0 1.0 3.0 8.0 12.0 13.0 - - 7.0
Source: UNCTAD, FDI / TNC database. Note: Data is based on the information reported by the economies listed above.
Table 15. FDI stocks abroad, by geographical destination, 1996-2006
(Millions of dollars) Economy 1992 1993 1994 1995 1996 1997 1998 1999 2000 2001 2002 2003 2004 2005 2006
Malawi - - - - - - - - 3.9 2.6 0.7 0.6 5.4 - -Portugal - - - - 0.4 0.4 0.5 1.0 0.9 0.9 1.0 1.3 1.4 - -
Source: UNCTAD, FDI / TNC database. Note: Data is based on the information reported by the economies listed above.

Mozambique
471
Table 23. The number of affiliates of foreign TNCs in the host economy, by geographical origin, 1993-2004
Economy 1991 1992 1993 1994 1995 1996 1997 1998 1999 2000 2001 2002 2003 2004
Italy 1 .. 1 .. 1 .. 2 .. .. .. .. .. .. ..United States .. .. .. 1 1 1 1 1 2 2 3 3 2 1
Source: UNCTAD, FDI/TNC database. Note: Data are based on information reported by the economies listed above.
Tables 30, 40 and 50. Assets, wages and salaries and value added of affiliates of United States TNCs in
Mozambique, 1993-2004
(Millions of dollars)
Table no./Variable 1991 1992 1993 1994 1995 1996 1997 1998 1999 2000 2001 2002 2003 2004
30. Assets .. .. .. .. 8 8 .. 11 .. .. 53 54 .. ..40. Wages and salaries .. .. .. .. .. .. .. .. .. .. 4 4 .. ..50. Value added a .. .. .. 3 3 3 2 2 .. .. .. .. .. ..
Source: UNCTAD, FDI/TNC database. Note: Data are based on information reported by the United States. a Data refer to majority-owned affiliates only. Table 35. Employment of affiliates of foreign TNCs in the host economy, by geographical origin, 1993-2004
(Thousands of employees)
Economy 1991 1992 1993 1994 1995 1996 1997 1998 1999 2000 2001 2002 2003 2004
Italy 0.8 .. 0.8 .. 0.8 .. 1.1 .. .. .. .. .. .. ..United States .. .. .. 0.1 0.1 0.1 .. .. .. .. 0.6 0.6 .. ..
Source: UNCTAD, FDI/TNC database. Note: Data are based on information reported by the economies listed above.
Table 45. Sales of affiliates of foreign TNCs in the host economy, by geographical origin, 1993-2004
(Millions of dollars)
Economy 1991 1992 1993 1994 1995 1996 1997 1998 1999 2000 2001 2002 2003 2004
Italy 4.0 .. 3.2 .. 3.7 .. 15.3 .. .. .. .. .. .. ..United States .. .. .. .. 14.0 16.0 .. 20.0 .. .. 92.0 81.0 .. ..
Source: UNCTAD, FDI/TNC database. Note: Data are based on information reported by the economies listed above.
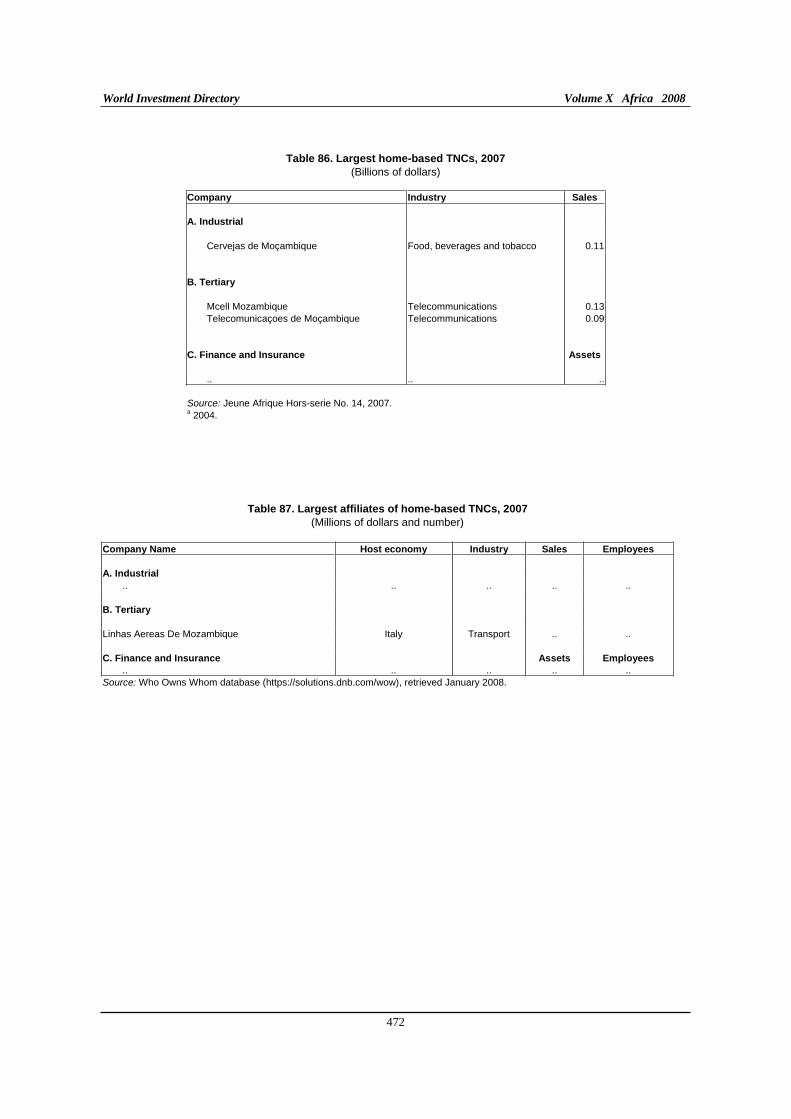
World Investment Directory Volume X Africa 2008
472
Table 86. Largest home-based TNCs, 2007
(Billions of dollars)
Company Industry Sales
A. Industrial
Cervejas de Moçambique Food, beverages and tobacco 0.11
B. Tertiary
Mcell Mozambique Telecommunications 0.13 Telecomunicaçoes de Moçambique Telecommunications 0.09
C. Finance and Insurance Assets
.. .. ..
Source: Jeune Afrique Hors-serie No. 14, 2007. a 2004.
Table 87. Largest affiliates of home-based TNCs, 2007
(Millions of dollars and number)
Company Name Host economy Industry Sales Employees
A. Industrial
.. .. .. .. .. B. Tertiary Linhas Aereas De Mozambique Italy Transport .. .. C. Finance and Insurance Assets Employees
.. .. .. .. .. Source: Who Owns Whom database (https://solutions.dnb.com/wow), retrieved January 2008.

Mozambique
473
Table 88. Largest affiliates of foreign TNCs in the host economy, 2007
(Millions of dollars and number)
Company Home economy Industry Sales Employees
A. Industrial
Cimentos De Mocambique Sarl Portugal Non-metallic mineral products 1 773.8 5Electricidade De Mocambique E P France Electricity, gas and water 170.0 3 176Mocambique Leaf Tobacco Importacao E Exportacao Limitada United States Food, beverages and tobacco 50.0 ..Companhia Industrial Do Monapo Lda Portugal Food, beverages and tobacco 14.4 150Cimbetao - Cimpor Betao Mozambique Sarl Portugal Non-metallic mineral products 9.0 22Entreposto Frigorifico De Pesca De Mozambique Lda Japan Forestry and fishing 7.4 10Exploracoes Mineiras De Mocambique Limitada United Kingdom Mining and quarrying 2.9 50Colgate Palmolive Mocambique L D A United States Chemicals & chemical products 5.0 ..Cervejas De Mocambique Sarl United Kingdom Food, beverages and tobacco .. ..Sasol Petroleum Temane Limitada South Africa Petroleum .. ..Parmalat Mocambique Produtos Alimentares Lda Italy Food, beverages and tobacco .. 140Parmalat Sarl Central Leteira De Maputo Italy Food, beverages and tobacco .. 120Mocambique Farms Lda Mauritius Food, beverages and tobacco .. 106Steeladale Mocambique Lda South Africa Machinery and equipment .. 36E C L Servicos Ltda Canada Machinery and equipment .. 30
B. Tertiary
Siemens Limitada Germany Wholesale trade .. 21Abb Tecnel Lda Switzerland Other services .. 60Hotel Tivoli Hostelaria E Servicos Lda Portugal Hotels and Restaurants 446.8 30J L M Industries Lda South Africa Distributive trade 32.0 ..Opca-Obras Publicas E Cimentos Armados SA Portugal Construction 9.3 500Teixeria Duarte Engenharia E Construccoes (Mocambique) Lda Portugal Construction 8.0 ..Soares Da Costa Mocambique S A R L Bahamas Research and development 6.4 300Ferromocambique Comercio E Industria De Fernando Pinho Teixeira Limitada Portugal Wholesale trade 6.4 17Soares Da Costa Mocambique Sarl Bahamas Construction 6.0 200Engil Mocambique Lda Portugal Construction 4.0 700Sociedade Mocambicana Do Acumulador Tudor SARL Portugal Wholesale trade 3.5 180Sociedade Geral De Empreitadas Lda Spain Construction 2.0 570Aquatec Lda Portugal Wholesale trade 1.1 22Enop - Engenharia E Obras Publicas Lda Portugal Research and development 1.0 60Macaloe Lda Portugal Public administration 0.8 150
C. Finance and Insurance Assets Employees
Banco Internacional De Mocambique S A R L Portugal Finance 26.9 528Impar - Companhia De Seguros De Mocambique SARL Portugal Insurance .. 125
Source: Who Owns Whom database (https://solutions.dnb.com/wow), retrieved January 2008.

World Investment Directory Volume X Africa 2008
474
C. Legal frameworks for transnational corporations
I. National Framework
Mozambique has adopted a number of national, bilateral and multilateral legal instruments to regulate the activities of transnational corporations and foreign direct investors. The main legal instruments applicable in the country include:
Petroleum Law (Law no. 3/81, of 3 October 1982).
Mining Law (Law no. 2/86, of 16 May 1986; with changes approved by Law no. 5/94, of 13 September 1994).
Law no. 15/91, of 3 August 1991, establishing norms for restructuring, transformation and re-dimensioning of the state enterprise sector, including privatisation, sale of enterprises, establishments and shareholdings of the state.
Decree no. 27/91, of 21 November, establishing an Inter-ministerial Commission for Enterprise Restructuring of 21 November 1991. Source: World Bank, Technical Paper no. 186, “Divestiture of State Enterprise”. An overview of the legal framework.
Law of Investment (Law no. 3/93, of 24 June 1993) and Regulations of the Law on Investment (Decree no. 14/93, of 21 June; with changes approved by Decree no. 36/95, of 8 August 1995).
Code of Fiscal Benefits for Investments in Mozambique (Decree no. 12/93, of 21 July 1993; with changes approved by Decree no. 37/95, of 8 August 1995).
Exchange Law (Law no. 3/96, of 4 January 1996) and Regulation of the Exchange Law (Notice no. 5/GGBM/96).
Land Law (Law no. 19/97, of 1 October 1997) and Regulations on Land Law (Decree no. 66/98, of 8 December 1998).
Environmental Framework Law (Law no. 20/97, of 1 October 1997).
Labour Law (Law no. 8/98, of 20 July 1998).
Constitution of the Mozambican Stock Exchange (Decree no. 49/98, of 22 September 1998) and Securities Trading Regulations (Decree no. 49/98, of 22 September 1998).
VAT Code (Decree no. 51/98, of 29 September 1998).
Arbitration Law (Law no. 11/99, of 8 July 1999).
Financial Institutions Law (Law no. 15/99, of 1 November 1999).
Industrial Property Code (Decree no. 18/99, of 4 May 1999).
Regulations on the Employment of Foreign Nationals (Decree no. 25/99, of 24 May 1999).
Regulations on Industrial Free Zones (Decree no. 62/99, of 21 September 1999).

Mozambique
475
Special Investment Regime for the Hotel and Tourism Industry (Decree no. 73/99, of 12 October 1999); Special Investment Regime for the Sugar Industry (Decree no. 74/99, of 12 October 1999) and Special Fiscal and Customs Regime for the Zambezi River Valley (Decree no. 16/98, of 16 April 1998).
Labour Regime in the Industrial Free Zones (Decree no. 75/99, of 12 October 1999).
II. International Framework
A. Mozambique is a party to the following multilateral and regional instruments:
The international treaties and convention are part of the effort by the government of Mozambique to improve its competitiveness to investments. Through the years, the government has been party to the following treaties:
Bern Convention for the Protection of Literary and Artistic Works of September 9, 1886 (approved by Resolution no. 13/97, of 13 June).
Madrid Agreement Concerning the International Registration of Marks of April 14, 1891 (approved by Resolution no. 20/97, of 12 August).
Convention on the Recognition and Enforcement of Foreign Arbitral Awards of June 10, 1958.
Convention on the Settlement of Investment Disputes Between States and Nationals of Other States of 18 March 1965. Entered into force on 14 October 1966. Source: World Bank, Depository of the Original Convention. The convention was published under document ICSID/2.
Agreement for the Promotion, Protection and Guarantee of Investment among Member States of Organisation of Islamic Conference of 1 June 1981; entered into force on 23 September 1986. Sources: Depository of the Agreement, Organisation of Islamic Conference, 1981. Also in UNCTAD, Division on Investment, Enterprise Development and Technology, International Investment Instruments: A
Compendium (Geneva: United Nations, 1996).
Agency and Commentary on the Convention (Washington D.C., MIGA, 1985), pp. 365-403.
Paris Convention for the Protection of Industrial Property of 20 March 1883 (revised at Brussels on 14 December 1900, Washington on 2 June 1911, The Hague on 6 November 1925, London on 2 June 1934, Lisbon on 31 October 1958, Stockholm on 14 July 1967, and as amended on 2 October 1979), signed in 1963. Sources: World Intellectual Property Organisation: Depository of the original convention and revisions and United Nations, Treaty Series, vol. 828, p. 107 (Lisbon Revision); vol. 828, p. 305 (Stockholm Revision). Convention Establishing Multilateral Investment Guarantee Agency of 11 October 1985. Entered into force on 12 April 1988. Source: Multilateral Investment Guarantee Agency. Convention Establishing the Multilateral Investment Guarantee. Charter on a Regime of Multinational Industrial Enterprises (MIEs) in the Preferential Trade Area for Eastern and Southern African States (PTA), signed on 21 November 1990, entered into force August 1995. Source: Preferential Trade Area for Eastern ans Southern African States: Report of the Sixteenth Meeting of the Council of Ministers, 17-19 november, 1990, Mbabane, Swaziland (PTA/CM/XVI/2)
Articles of Agreement of the Islamic Corporation for the Insurance of Investment and Export Credit of 19 February 1992; entered into force on August 1994.
World Investment Directory Volume X Africa 2008
476
Sources: Islamic Development Bank, “Articles of Agreement of Islamic Corporation for the Insurance of Investment and Export Credit” (LD133/A: C1/R1/MH, C: 2212/RI) (Jeddah: Islamic Development Bank, 1992).
Treaty Establishing the Common Market for Eastern and Southern Africa (COMESA) of 5 November 1993, entered into force on 8 December 1994. Sources: International Legal Materials, vol. 33, no. 5 of September 1994.
Marrakesh Agreement Establishing the World Trade Organisation of 15 April 1994. Entered into force on 1 January 1995. Agreement on Trade-Related Investment Measures. General Agreement on Trade in Services. Agreement on Trade Related Aspects of Intellectual Property Rights.
Partnership Agreement between the Members of the African, Caribbean and Pacific Group of States of the One Part, and the European Community and Its Member States, of the Other Part, signed in Cotonou, Benin on 23 June 2000. Source: African, Caribbean and the Pacific States and the European Community (2000). “Partnership Agreement Between the Members of the African, Caribbean and Pacific Group of States of the One Part, and the European Community and Its Member States, of the Other Part”, Official Journal of the European
Communities, L 317, 15 December 2000, p. 3; available also on the Internet (http://www.acpsec.org/gb/cotonou/accord1.htm).
B. Bilateral treaties
1. Bilateral investment treaties for the protection and promotion of investments: Zimbabwe 1990, Portugal 1996, Mauritius 1997, South Africa 1997, Algeria 1998, Egypt 1998, Indonesia 1998, Italy 1998, United States of America 1998, China 2001, Cuba 2001, Netherlands 2001, Sweden 2001, Denmark 2002, France 2002, Germany 2002, Switzerland 2002, United Arab Emirates 2003, Finland 2004, United Kingdom 2004, Belgium 2006,
2. Bilateral treaties for the avoidance of double taxation: Portugal 1991, Mauritius 1997, United Arab Emirates 2003.
C. Other treaties:
Trade and investment framework agreement with the United States of America (2005)

Mozambique
477
D. Sources of information
Official
Banco de Moçambique (www.bancomoc.mz).
Centro de Promoção de Investimentos (www.cpi.co.mz).
Secondary
Biggs, T., J. Nasir and R. Fisman (1999). Structure and Performance of Manufacture in Mozambique
(Washington D.C.: World Bank, August).
BusinessMap (2000). "Mozambique: powered by mega-investments", in SADC Investor Survey – Complex
Terrain (Johannesburg: Business Map), pp 35-38.
Cook, Lisa D. (2000). “Mozambique: optimism, growth and investment”, in World Economic Forum, TheAfrica Competitiveness Report, 2000/2001 (New York: Oxford University Press), pp. 66-69.
Economist Intelligence Unit (EIU) (various years). Country Profile: Mozambique (London: EIU Ltd.).
____________ (various years). Country Report: Mozambique (London: EIU Ltd.).
Emery, James J., Melvin T. Spence, Louis T. Wells and Timothy S. Buehrer (2000). “Cutting red tape: lessons from a case-based approach to improving the investment climate in Mozambique”, Administrative Barriers to Investment: Reducing Red Tape in Africa, Occasional Paper no. 14, (Washington D.C.: Foreign Investment Advisory Service (FIAS)), pp. 95-173.
Ernst & Young Africa Group (1999). Mozambique – Investment profile,http://mbendi.co.za/ernsty/mozambique/investment.html.
Foreign Investment Advisory Service (FIAS) (1996). “Review of foreign investment legislation and recommendations for development of the Mozambican Investment Promotion Centre (CPI)” (Washington D.C.: FIAS), July, mimeo.
Franco, Antonio (2000). “Mozambique”, in World Economic Forum, The Africa Competitiveness Report,
2000/2001 (New York: Oxford University Press), pp. 170-175.
International Monetary Fund (IMF) (2006). IMF's Sub-Saharan Africa Regional Economic Outlook, March 10, 2006. (Washington D.C.: IMF).
Investimentos, Comercio e turismo de Portugal (ICEP) (1997). Como investir em Mocambique, Vols I and II – Anexos (Lisbon: ICEP).
KPMG, Uniao comercial de Bancos Mozambique (UCBM) (2000). Investing in Mozambique, An overview
of the Mozambican investment climate (Maputo: KMPG, UCBM).
Mosse, Marcelo (ed.) (1999). CPI investir (Maputo: CPI).
Rushmere, M. (1999). “Insider knowledge – the multinationals’ key to Southern Africa”, Multinational Business (London), Spring (1), pp. 19-28.
SADC (2000). "Official SADC trade, industry and investment review". The millennium issue by southern African Marketing Co (Pty) Ltd. in association with Southern African Development Community, Mozambique.
World Investment Directory Volume X Africa 2008
478
Soderbom, M. and F. Teal (2004). "Size and Efficiency in Africa Manufacturing firms: Evidence from Firm-Level Panel Data." Journal of Development Economics, 73. pp 369 - 394.
Trade Information Centre (2000). "Mozambique: investment climate, openness to foreign investment”, http://infoserv2.ita.doc.gov/afweb.nsf, 10 November 2000.
United Nations Conference on Trade and Development (UNCTAD) (2001). An investment guide to
Mozambique: Opportunities and conditions (Geneva: UNCTAD).
___________(2005a). Investor-Disputes Arising from Investment Treaties: A Review. UNCTAD Series of International Investment Policies for Development (UNCTAD/ITE/IIT/2005/4).
___________(2005b). A Survey of Support by Investment Promotion Agencies to Linkages. Advisory Studies No. 18 (UNCTAD/ITE/IPC/2005/12).
___________(2005c). FDI in least developed countries at a glance: 2005/2006
(UNCTAD/ITE/IIA/2005/17).
United States Commercial Service (2006). Doing Business in Mozambique: A country Commercial Guide
for US Companies. (Washington D.C.: US Government).
United States Trade Representative (2006). 2006 Comprehensive Report on U.S. Trade and Investment
Policy Toward Sub-Saharan Africa and Implementation of the Africa Growth and Opportunity Act:
The Sixth of Eight Annual Reports, May 2006. (Washington D.C.: US Government).
US Embassy in Maputo (2000). "Country commercial guide: Mozambique 1999" (Washington, D.C: US Department of State) http://www.state.gov/www/about_state/ business/ com_guides/2000/africa/mozambique_CCG2000.pdf.
World Bank (1995). “Mozambique: impediments to industrial sector recovery”, Report No. 13752-Moz., 22 August .
World Bank/International Finance Corporation (2007). Doing Business 2008 Mozambique (Washington D.C.: The World Bank Group).

Namibia
479
Namibia
A. Definitions and sources of data
Foreign direct investment (FDI) in Namibia is defined as any proposed investment by a foreign national of assets with not less than 10% of the total share capital of a venture or that the foreign national holds a management interest in the day-to-day running of the business concern (Foreign Investment Act, 1990). The Central Bank of Namibia provides FDI data in its database and the International Monetary Fund reports data in its balance-of-payment statistics.
The Foreign Investment Act outlines the legal framework in which investors can operate in Namibia and provides the basic guarantees for an enabling environment conducive to the private sector. It makes provision for the unhindered conduct of business activities by foreign nationals and establishes "a level playing field" with foreign investors assured of equal legal status and tax treatment with locally owned or domiciled businesses. The Act also guarantees the availability of foreign currency for the transfer of profits and proceeds of sale as well as recourse to international arbitration in the case of disputes, while investors may also be eligible for the Certificate of Status Investment.
Foreign nationals may invest and engage in any business activity in any sector in Namibia. Although the Government regards it as preferable to involve Namibians as participants in a new venture, it is not a requirement. There is no obligatory minimum equity stake for nationals. Similarly, no foreign investor is obliged to offer participation in any proposed venture to the Government. Exceptions may be made in cases where licenses or other authorization for the grant of rights over natural resources are required; however, in the case of mineral licenses, the Mines and Minerals Act, 1992 specifies that a Government interest may be acquired only as a result of negotiations for a non-obligatory mineral agreement, entered into solely at the behest of the investor. The Act also provides guarantees against expropriation, except in the few circumstances provided for in the Constitution, and in the unlikely event of expropriation, the Act stipulates that just and prompt compensation has to be paid in freely convertible currency. A part of the Act was the provision for establishment of an Investment Center, as a division in the Ministry of Trade and Industry. This came into existence in 1991 as a one-stop investment advisory and information agency, and liaises with other Government and official bodies to end bureaucratic blocks.
Namibia has created Export Processing Zone (EPZ) regimes that offer tax and duty-free environment for foreign investors. The EPZs have two tailor-made banking accounts, EPZ Customer Foreign Currency Account and the EPZ non-resident account to address the operational and foreign exchange requirements of investors. The Ministry of Trade and Industry provides generous tax incentives for potential foreign investors in the EPZs. Manufacturing companies enjoy a 10% tax rebate for the first ten years of operation, a special 20% write-off of special building allowance, tax exemption for export promotion activities and a 25% tax-free deduction for production line wages and training.
Namibia signed to the Convention on the Settlement of Investment Disputes between State and Nationals of other States on 16 October, 1998 and offers an excellent market access for foreign investors. It is a member of the Rand Common Monetary Area. Namibia serves as a springboard to the regional markets of the Southern African Customs Union and the Southern African Development Community. It is a member of the Common Market for Eastern and Southern Africa, New Partnership for Africa's Development and the African Union. In 1990 Namibia signed a bilateral agreement with the Overseas Private Investment Corporation of the United States, whose purpose is to promote economic growth in developing countries by encouraging United States' private investment. Moreover, Namibia is a member of the World Trade Organization and benefits from the United States’ Africa Growth and Opportunity Act, and the Cotonou agreement for renegotiating the partnership links between African, Caribbean, Pacific countries with the European Union under the Lomé Convention.

World Investment Directory Volume X Africa 2008
480
B. Statistics on FDI and the operations of TNCs
Table 1. Summary of FDI
(Millions of dollars)
Variable Inward Outward
1. FDI flows, 2003-2006 (annual average) 262.4 - 14.2
2. FDI flows as a percentage of GFCF, 2003-2006 (annual average) 17.6 - 1.0
3. FDI stocks, 2006 2 768 56
4. FDI stocks as a percentage of GDP, 2006 43.8 0.9
Source: Based on tables 3a and 4a and UNCTAD, FDI/TNC database.

Namibia
481
Table 3a. FDI flows, by type of investment, 1985-2006
(Millions of dollars)
Inward investment Outward investment
Reinvested Reinvested
Year Equity earnings Other Total Equity earnings Other Total
1985 .. .. .. 16.4 .. .. .. ..1986 .. .. .. 9.0 .. .. .. ..1987 .. .. .. - 0.2 .. .. .. ..1988 .. .. .. - 1.5 .. .. .. ..1989 .. .. .. - 0.5 .. .. .. ..1990 36.3 - 43.5 36.8 29.6 0.1 - 0.2 1.5 1.41991 28.4 22.7 69.3 120.5 0.3 2.1 1.4 3.81992 12.2 66.9 39.2 118.3 - 3.4 1.9 1.3 - 0.21993 17.8 25.1 12.4 55.3 1.2 - 1.0 1.2 1.31994 27.1 51.2 19.7 98.0 - 0.7 - 4.8 1.1 - 4.51995 31.1 98.9 23.0 153.0 - 0.3 - 1.5 1.0 - 0.71996 73.9 79.2 - 24.4 128.8 0.0 - 3.0 0.9 - 2.11997 77.6 13.7 - 7.5 83.8 0.0 - 0.2 0.8 0.61998 72.7 - 19.5 24.1 77.2 0.0 - 0.5 0.7 0.21999 27.8 10.3 - 18.5 19.6 - 2.1 0.3 1.0 - 0.82000 88.4 108.5 - 8.6 188.2 1.2 - 0.4 2.0 2.82001 351.1 105.8 - 91.5 365.4 0.1 - 2.0 - 10.9 - 12.82002 135.5 14.4 31.9 181.7 - 1.0 - 1.0 - 3.4 - 5.42003 111.4 - 72.1 109.5 148.7 - 1.2 - 1.6 - 7.5 - 10.42004 129.9 76.0 20.0 225.8 - 1.2 - 2.1 - 18.8 - 21.92005 184.8 202.6 - 39.4 348.0 - 1.5 2.1 - 13.2 - 12.62006 376.0 150.5 - 199.3 327.2 - 5.6 - 1.0 - 5.3 - 11.8
Source: UNCTAD, FDI/TNC database (www.unctad.org/statistics). Notes: Inflows are bassed on OECD for 1985 and 1987-1989, estimate for 1986 and the Bank of Namibia for 1990-2006. Data on outflows are based on information provided by the Bank of Namibia.
Table 3b. FDI flows, by type of investment, 1990-2006
(Millions of Namibian dollars)
Inward investment Outward investment
Reinvested Reinvested
Year Equity earnings Other Total Equity earnings Other Total
1990 93.9 - 112.6 95.2 76.5 0.3 - 0.6 3.8 3.51991 78.5 62.8 191.3 332.7 0.7 5.9 3.8 10.41992 34.8 190.7 111.7 337.2 - 9.7 5.3 3.8 - 0.51993 58.1 82.1 40.4 180.7 3.8 - 3.2 3.8 4.51994 96.2 181.6 70.1 347.9 - 2.5 - 17.2 3.8 - 15.81995 112.9 358.6 83.5 554.9 - 1.0 - 5.5 3.8 - 2.71996 317.6 340.4 - 104.7 553.3 - - 12.7 3.8 - 8.81997 357.7 63.0 - 34.7 386.0 - - 1.1 3.8 2.71998 402.0 - 108.0 133.3 427.3 - - 2.8 3.8 1.01999 170.0 63.0 - 113.0 120.0 - 13.0 2.0 6.0 - 4.02000 607.0 745.0 - 59.0 1 294.0 8.0 - 3.0 14.0 18.02001 3 021.0 910.0 - 787.0 3 144.0 1.0 - 17.0 - 94.0 - 110.02002 1 425.0 151.0 335.0 1 912.0 - 10.0 - 11.0 - 36.0 - 57.02003 842.4 - 545.7 828.5 1 125.2 - 9.3 - 12.4 - 56.7 - 78.92004 838.9 490.9 129.1 1 458.9 - 7.9 - 13.7 - 121.7 - 141.32005 1 174.9 1 288.2 - 250.3 2 213.0 - 9.6 13.3 - 84.1 - 80.42006 2 546.3 1 019.0 -1 349.5 2 216.0 - 37.9 - 6.7 - 35.6 - 80.2
Source: UNCTAD, FDI/TNC database (www.unctad.org/statistics) based on Bank of Namibia, unpublished.

World Investment Directory Volume X Africa 2008
482
Table 4a. FDI stocks, by type of investment, 1984-2006
(Millions of dollars)
Inward investment Outward investment
Equity & Equity &
Reinvested Reinvested Reinvested Reinvested
Year earnings earnings Other Total earnings earnings Other Total
1984 .. .. .. 1 934.6 .. .. .. ..1985 .. .. .. 1 951.0 .. .. .. ..1986 .. .. .. 1 960.0 .. .. .. ..1987 .. .. .. 1 959.8 .. .. .. ..1988 .. .. .. 1 958.3 .. .. .. ..1989 .. .. .. 1 957.8 .. .. .. 64.31990 .. .. .. 2 046.8 .. .. .. 79.61991 .. .. .. 2 114.8 .. .. .. 98.11992 .. .. .. 2 141.8 .. .. .. 81.61993 .. .. .. 1 490.8 .. .. .. 79.21994 .. .. .. 1 601.2 .. .. .. 15.81995 .. .. .. 1 707.7 .. .. .. 14.81996 .. .. .. 1 492.2 .. .. .. 13.01997 .. .. .. 1 582.7 .. .. .. 14.21998 1 270.1 - 168.0 1 438.1 4.5 - 17.2 21.61999 1 330.0 - 184.7 1 514.7 5.9 - 36.1 42.02000 1 095.5 - 169.1 1 264.5 7.5 - 37.0 44.52001 670.1 - 80.8 750.9 9.0 - 6.0 15.02002 1 347.4 - 410.1 1 757.4 13.5 - 12.5 26.02003 2 435.4 - 568.1 3 003.5 58.7 - 24.3 83.02004 3 308.2 - 738.6 4 046.9 75.2 - 23.7 99.02005 2 247.9 - 192.4 2 440.3 66.9 - 1.4 68.32006 2 381.0 - 404.0 2 767.5 5.4 - 1.8 56.5
Source: UNCTAD, FDI/TNC database (www.unctad.org/statistics). Notes: Data on inward stock prior to 1989 are estimated by subtracting inflows from the stock of 1989. 1989 data is based on the IMF. 1990-2006 data are based on the Bank of Namibia. Data on outflows are based on information provided by the Bank of Namibia. 1989 data is based on the IMF.
Table 4b. FDI stocks, by type of investment, 1990-2005
(Millions of Namibia dollars) Inward investment Outward investment
Equity & Equity &
Reinvested Reinvested Reinvested Reinvested
Year earnings earnings Other Total earnings earnings Other Total
1990 .. .. .. 5 245.0 .. .. .. 204.01991 .. .. .. 5 801.0 .. .. .. 269.01992 .. .. .. 6 539.0 .. .. .. 249.01993 .. .. .. 5 065.0 .. .. .. 269.01994 .. .. .. 5 674.0 .. .. .. 56.01995 .. .. .. 6 229.0 .. .. .. 54.01996 .. .. .. 6 897.0 .. .. .. 61.01997 .. .. .. 7 704.0 .. .. .. 69.01998 7 475.6 - 988.6 8 464.2 26.3 - 101.1 127.41999 8 173.9 - 1 135.2 9 309.1 36.1 - 222.1 258.22000 8 368.4 - 1 291.5 9 659.9 57.2 - 283.0 340.22001 7 737.5 - 933.1 8 670.6 104.2 - 69.5 173.72002 12 071.9 - 3 674.2 15 746.1 121.1 - 112.1 233.12003 15 893.4 - 3 707.2 19 600.6 383.0 - 158.5 541.52004 18 963.8 - 4 234.1 23 197.9 431.2 - 136.1 567.32005 14 294.4 - 1 223.6 15 518.0 425.6 - 8.7 434.4
Source: UNCTAD, FDI/TNC database (www.unctad.org/statistics) based on Bank of Namibia, unpublished.

Namibia
483
Table 6. FDI flows in the host economy, by geographical origin, 1991-2001
(Millions of Namibia dollars)
Region / economy 1990 1991 1992 1993 1994 1995 1996 1997 1998 1999 2000 2001
Total world .. 333 327 189 195 201 .. .. .. .. .. ..Developed countries .. 117 114 66 68 70 .. .. .. .. .. ..
Europe .. 117 114 66 68 70 .. .. .. .. .. ..European Union .. .. .. .. .. .. .. .. .. .. .. ..
Spain .. .. .. .. .. .. .. .. .. .. .. ..United Kingdom .. .. .. .. .. .. .. .. .. .. .. ..
Other developed Europe .. .. .. .. .. .. .. .. .. .. .. ..Switzerland .. .. .. .. .. .. .. .. .. .. .. ..
Developing economies .. 216 213 123 127 131 .. .. .. .. .. ..Africa .. 216 213 123 127 131 .. .. .. .. .. ..
South Africa .. 216 213 123 127 131 .. .. .. .. .. ..
Source: Bank of Namibia, unpublished
Table 9. FDI flows abroad, by geographical destination, 1991-2001
(Millions of Namibia dollars)
Region / economy 1990 1991 1992 1993 1994 1995 1996 1997 1998 1999 2000 2001
Total world .. 18 - 5 29 - 21 17 .. .. .. .. .. ..Developed countries .. 4 - 1 7 - 5 4 .. .. .. .. .. ..
Europe .. 4 - 1 7 - 5 4 .. .. .. .. .. ..Developing economies .. 14 - 4 22 - 16 13 .. .. .. .. .. ..
Africa .. 14 - 4 22 - 16 13 .. .. .. .. .. ..South Africa .. 14 - 4 22 - 16 13 .. .. .. .. .. ..
Source: Bank of Namibia, unpublished
Table 11. FDI stocks in the host economy, by industry, 1994-2006
(Millions of Namibia dollars)
Sector / industry 1990 1991 1992 1993 1994 1995 1996 1997 1998 1999 2000 2001 2002 2003 2004 2005 2006
Total 5 245 5 801 6 539 5 628 6 066 - 6 897 7 704 .. .. 9 660 8 671 15 746 19 601 23 198 15 518 19 416
Primary 4 166 4 697 5 342 4 346 4 648 - 2 595 2 898 .. .. 3 634 3 262 5 924 7 374 8 727 5 838 7 304
Agriculture, hunting, forestry and fishing - - - - - - 223 250 .. .. 313 281 510 635 752 503 629
Mining, quarrying and petroleum - - - - - - 2 371 2 649 .. .. 3 321 2 981 5 413 6 739 7 975 5 335 6 675
Mining and quarrying - - - - - - 2 371 2 649 .. .. 3 321 2 981 5 413 6 739 7 975 5 335 6 675
Secondary 153 206 218 240 320 - 485 542 .. .. 679 610 1 107 1 378 1 631 1 091 1 365
Tertiary 926 898 979 1 042 1 098 - 3 817 4 264 .. .. 5 347 4 799 8 715 10 849 12 840 8 589 10 747
Construction - - - - - - 10 11 .. .. 14 12 22 27 32 22 27
Trade - - - - - - 872 975 .. .. 1 222 1 097 1 992 2 480 2 935 1 963 2 456
Hotels and restaurants - - - - - - .. .. .. .. .. .. .. .. .. .. ..
Transport, storage and communications - - - - - - 3 4 .. .. 5 4 8 10 12 8 10
Finance - - - - - - 2 932 3 275 .. .. 4 106 3 686 6 694 8 332 9 861 6 597 8 254
Source: Bank of Namibia, unpublished Notes: Except for 1994 and 2005, data are estimated as follows: the percentage shares of each sector in 2005 were applied to the total levels of stock in each of the years. Trade includes hotels and restaurants Finance includes business activities. Data are not available for 1995, 1988 and 1999.

World Investment Directory Volume X Africa 2008
484
Table 12. FDI stocks in the host economy, by geographical origin, 1995-2006
(Millions of dollars) Economy 1992 1993 1994 1995 1996 1997 1998 1999 2000 2001 2002 2003 2004 2005 2006
Canada - - 10.0 12.5 - 15.4 11.8 15.9 - 11.3 11.4 13.9 15.8 - -China - - - - - - - - - - - 0.7 2.2 2.4 -Denmark - - - - - - - - - - - - 1.1 0.9 1.1Germany - - - 5.6 9.0 5.6 6.6 6.0 44.7 42.3 - - - - -Iceland - - 1.5 0.1 0.3 0.6 - 0.0 - 0.3 1.0 1.0 1.4 1.8 2.0 2.0 1.7Malaysia - - 2.0 11.0 19.0 13.4 20.2 20.5 20.5 20.5 20.5 90.5 90.5 91.0 -New Zealand - - - 0.7 0.8 0.6 0.6 0.5 0.9 - - - - - -Portugal - - - - 0.2 0.2 0.4 0.4 0.3 0.3 0.4 0.5 - - -South Africa - - - - - - - - - 115.9 126.7 173.3 149.2 131.9 125.1United Kingdom 39.3 3.0 65.6 - - - - - - - - - - - -United States - - 1.0 1.0 1.0 2.0 2.0 - - - - - - - -
Source: UNCTAD, FDI / TNC database. Note: Data is based on the information reported by the economies listed above.
Table 15. FDI stocks abroad, by geographical destination, 1995-2006
(Millions of dollars) Economy 1992 1993 1994 1995 1996 1997 1998 1999 2000 2001 2002 2003 2004 2005 2006
Portugal - - - - - - - 0.0 0.0 0.0 0.0 0.2 - - -South Africa - - - - - - - - - 3.3 5.2 3.3 3.9 3.5 3.2United States - 1.0 - - 2.0 2.0 3.0 4.0 - - - - - - -
Source: UNCTAD, FDI / TNC database. Note: Data is based on the information reported by the economies listed above.

Namibia
485
Tables 21. The Number of foreign affiliates of Namibian TNCs in the United States, 1993-2004
Economy 1990 1991 1992 1993 1994 1995 1996 1997 1998 1999 2000 2001 2002 2003 2004
United States .. 1 1 1 1 1 .. .. .. .. .. .. .. .. ..Source: UNCTAD, FDI/TNC database. Note: Data are based on information reported by the United States.
Table 23. The number of affiliates of foreign TNCs in the host economy, by geographical origin, 1993-2004
Economy 1990 1991 1992 1993 1994 1995 1996 1997 1998 1999 2000 2001 2002 2003 2004
Germany .. .. 1 1 1 1 1 .. .. .. .. .. .. .. ..United States 1 1 1 1 4 3 3 3 3 2 2 2 2 2 2Source: UNCTAD, FDI/TNC database. Note: Data are based on information reported by the economies listed above.
Table 30. Assets of affiliates of foreign TNCs in the host economy, by geographical origin, 1993-2004
(Millions of dollars)
Economy 1990 1991 1992 1993 1994 1995 1996 1997 1998 1999 2000 2001 2002 2003 2004
Germany .. .. .. .. .. .. .. .. .. .. 93.1 88.1 .. .. ..United States .. .. .. .. 63.0 43.0 37.0 47.0 39.0 .. .. .. .. .. ..Source: UNCTAD, FDI/TNC database. Note: Data are based on information reported by the economies listed above.
Table 35. Employment of affiliates of foreign TNCs in the host economy, by geographical origin, 1993-2004
(Thousands of employees)
Economy 1990 1991 1992 1993 1994 1995 1996 1997 1998 1999 2000 2001 2002 2003 2004
Germany .. .. .. .. .. 1.0 .. .. .. .. .. .. .. .. ..United States .. .. .. .. 0.4 0.1 .. .. .. .. .. .. .. .. ..Source: UNCTAD, FDI/TNC database. Note: Data are based on information reported by the economies listed above.
Tables 40 and 50. Wages and salaries and value added of affiliates of United States TNCs in Namibia, 1993-2004
(Millions of dollars)
Table no./Variable 1990 1991 1992 1993 1994 1995 1996 1997 1998 1999 2000 2001 2002 2003 2004
40. Wages and salaries .. 1 1 .. 6 3 3 2 .. .. .. .. .. .. ..50. Value added a .. .. .. .. 13 12 13 10 5 .. .. .. .. .. ..Source : UNCTAD, FDI/TNC database. Note: Data are based on information reported by the United States. a Data refer to majority-owned affiliates only.
Table 45. Sales of affiliates of foreign TNCs in the host economy, by geographical origin, 1993-2004
(Millions of dollars)
Economy 1990 1991 1992 1993 1994 1995 1996 1997 1998 1999 2000 2001 2002 2003 2004
Germany .. .. .. .. .. .. .. 57.7 .. .. .. .. .. .. ..United States .. .. .. .. 81.0 63.0 67.0 71.0 .. .. .. .. .. .. ..Source: UNCTAD, FDI/TNC database. Note: Data are based on information reported by the economies listed above.

World Investment Directory Volume X Africa 2008
486
Table 86. Largest home-based TNCs, 2007
(Billions of dollars) Company Industry Sales
A. Industrial
Namibia Breweries Consumer goods/brewers 0.15 Namibian Power Corporation Electricity/gas/water 0.14
B. Tertiary
Telecom Namibia Telecommunication 0.17 C. Finance and Insurance Assets
.. .. ..
Source: Jeune Afrique Hors-serie No. 14, 2007.
Table 87. Largest affiliates of home-based TNCs, 2007
(Millions of dollars and number) Company Host Economy Industry Sales Employees
A. Industrial
.. .. .. .. ..
B. Tertiary
Tfd Network Africa (Pty) Ltd South Africa Land transport 8418.74 540Nictus Meubels (Pty) Ltd South Africa Distributive trade .. 600Allied Investment Corporation Ltd South Africa Public administration .. ..Avtex Investment Company (Pty) Ltd South Africa Public administration .. ..Grinaker-Lta Properties (Pty) Ltd South Africa Public administration .. ..Kruben Holdings (Pty) Ltd South Africa Public administration .. ..Mf Wholesale (Pty) Ltd South Africa Public administration .. ..Oreon Place (Pty) Ltd South Africa Public administration .. ..
C. Finance and Insurance Assets Employees
.. .. .. .. .. Source: Who Owns Whom database (https://solutions.dnb.com/wow), retrieved January 2008.

Namibia
487
Table 88. Largest affiliates of foreign TNCs in the host economy, 2007
(Millions of dollars and number)
Company Home economy Industry Sales Employees
A. Industrial
Caterplus Namibia (Pty) Ltd South Africa Food, beverages and tobacco .. ..Igl Pty Ltd United Kingdom Chemicals & chemical products 463 ..Schweppes Namibia United Kingdom Food, beverages and tobacco .. ..Springer Schokoladen Fabrik Netherlands Food, beverages and tobacco .. 700Bokomo Namibia South Africa Food, beverages and tobacco .. 126Namzinc Pty Ltd South Africa Mining and quarrying .. 100Mondipak Namibia United Kingdom Wood and wood products .. 69
B. Tertiary
Waltons Stationery Company South Africa Wholesale trade .. ..Rosh Pinah Zinc Corporation Pty Ltd South Africa Public administration 951 570Hertz Rent A Car South Africa Automotive trade and repair .. 1 450Distillers Corp (Namibia) United Kingdom Wholesale trade .. 106Abb Pty Ltd Switzerland Public administration .. 52Barloworld Coatings Namibia Pty Ltd South Africa Public administration .. 50Murray & Robertz Construction South Africa Construction .. 46Freshmark Namibia (Pty) Ltd South Africa Distributive trade .. 43P G Glass Namibia (Pty) Ltd South Africa Distributive trade .. 25Shoprite Namibia (Pty) Ltd South Africa Distributive trade .. 20Alexander Forbes Financial Service Namibia
(Pty) South Africa Public administration .. ..Atlas Copco Namibia Pty Ltd South Africa Public administration .. ..Basil Read Civils Namibia Pty Ltd South Africa Public administration .. ..Bonanza Holding (Pty) Ltd South Africa Public administration .. ..Bp Namibia (Pty) Ltd United Kingdom Distributive trade .. ..Dimension (Pty) Ltd South Africa Public administration .. ..Dimension Data (Namibia) (Pty) Ltd United Kingdom Public administration .. ..Game Discount World Namibia (Pty) Ltd South Africa Distributive trade .. ..Investec Asset Management Namibia (Pty) Ltd South Africa Public administration .. ..Itc Namibia South Africa Public administration .. ..
C. Finance and Insurance Assets Employees
Standard Bank Namibia South Africa Finance 2 569 ..Mutual Federal Insurance Company Of
Botswana Ltd South Africa Insurance .. 120Old Mutual Properties Namibia United Kingdom Insurance .. ..
Source: Who Owns Whom database (https://solutions.dnb.com/wow), retrieved January 2008.

World Investment Directory Volume X Africa 2008
488
C. Legal frameworks for transnational corporations
In Namibia, a number of national, bilateral and multilateral legal instruments exist to regulate the activities of transnational corporations and foreign direct investors. The key instruments applicable in the country include:
I. National framework
Mining Ordinance, 1888; Mining Ordinance, 1889; Mining Ordinance, 1905; Mining Ordinance, 1909; Mining legislation, 1954. Source: Chronology Of Namibian History, From Pre-historical Times to Independent Namibia, Klaus Dierks, 18 September 2003, (http://www.klausdierks.com/Chronology/index_acts.htm).
The Patent Rules of 1917, as amended by Government Notices Nos. 884 of 1919, 1255 of 1919, 2040 of 1920, 474 of 1933, 314 of 1934, 1237 of 1934 and 99 of 1942. Source: WIPO (http://www.wipo.org).
Patents, Designs, Trade Marks & Copyright Proclamation No. 17 of 1923. Act No. 9 of 1916 to consolidate and amend the Laws relating to the granting of letters patent for inventions and for the registration of patents, designs, trade marks and copyright: Chapter I – Patents. Source: WIPO (http://www.wipo.org).
Patents, Designs, Trade Marks & Copyright Proclamation No. 17 of 1923. Source: WIPO (http://www.wipo.org).
Merchant shipping Act, 1951 (Act No. 57 of 1951). Source: Government Gazette 7 December 2001 No.2657 (http://www.mfmr.gov.na/policy/policies.htm).
National Transport Corporation Act, 1987. Source: Chronology Of Namibian History, From Pre-historical Times to Independent Namibia, Klaus Dierks, 18 September 2003, (http://www.klausdierks.com/Chronology/index_acts.htm).
Bank of Namibia Act, 1990. Act No. 8 of 1990. Source: Republic of Namibia. Foreign Investment Act. Official Publication by the Investment Center. Private Bag 13340, Windhoek, Namibia.
Foreign Investment Act, 1990. Act No. 27 of 19 December 1990. Effective: 7 July 1992. Source: Official Gazette No. 19/1992 of 7 July 1992. As amended by Act No. 24, 1993. Foreign Investment Amendment Act. Source: Republic of Namibia. Foreign Investment Act. Official Publication by the Investment Center. Private Bag 13340, Windhoek, Namibia.
Fisheries Act, effective 1 October 1992. Source: Government Gazette 7 December 2001 No.2657 (http://www.mfmr.gov.na/policy/policies.htm).
Policy Statement on the Granting of Rights of Exploitation to Utilise Marine Resources and on the Allocation of Fishing Quotas of 8 July 1993. Source: Government Gazette 7 December 2001 No.2657 (http://www.mfmr.gov.na/policy/policies.htm).
Copyright: Copyright and Neighboring Rights Act No. 6, April 1994. Source: WIPO (http://www.wipo.org).
Special Incentives for Manufacturers and Exporters. Ministry of Trade and Industry-September 1995.

Namibia
489
Source: Official Publication. Republic of Namibia Ministry of Trade and Industry. Investment Centre. Private Bag 13340, Windhoek, Namibia.
Export Processing Zone (EPZ) Amendment Bill,1996. Source: Chronology Of Namibian History, From Pre-historical Times to Independent Namibia, Klaus Dierks, 18 September 2003, (http://www.klausdierks.com/Chronology/index_acts.htm).
Namibia's Export Processing Zone Programme. Source: Official Publication. Republic of Namibia Ministry of Trade and Industry. Investment Centre. Private Bag 13340, Windhoek, Namibia.
National Transportation Services Holding Company Act No. 28 of 1998. Source: Chronology Of Namibian History, From Pre-historical Times to Independent Namibia, Klaus Dierks, 18 September 2003, (http://www.klausdierks.com/Chronology/index_acts.htm).
Electricity Act No.2 of 2000. Source: Chronology Of Namibian History, From Pre-historical Times to Independent Namibia, Klaus Dierks, 18 September 2003, (http://www.klausdierks.com/Chronology/index_acts.htm).
Act No. 27 of 2000), Marine Resources Act 2000. Source: Government Gazette 7 December 2001 No.2657 (http://www.mfmr.gov.na/policy/policies.htm).
No. 241 2001 Regulations Relating To the Exploitation Of Marine Resources.Source: Government Gazette 27 December 2000 No.2458 (http://www.mfmr.gov.na/policy/policies.htm).
II. International Framework
A. Namibia is a party to the following multilateral and regional instruments:
Convention on the Settlement of Investment Disputes between States and Nationals of other States of 1965. Entered into force on 14 October 1966.
Convention Establishing the Multilateral Investment Guarantee Agency of 1985, entered into force on 12 April 1988.
Fourth ACP - EEC Convention (Lome IV) of 1989, entered into force on 1st March 1990. Southern Africa Development Community (SADC), signed on 17 August, 1992.Source: http://www.sadc.int/about_sadc/history.php.
Marrakesh Agreement Establishing the World Trade Organisation of 15 April 1994. Entered into force on 1 January 1995. Agreement on Trade-Related Investment Measures. General Agreement on Trade in Services. Agreement on Trade Related Aspects of Intellectual Property Rights.
Partnership Agreement between the Members of The African, Caribbean and Pacific Group of States, of the one part and the European Community and its member states, of the other part signed in Cotonou, Benin on 23 June 2000.

World Investment Directory Volume X Africa 2008
490
B. Bilateral treaties
1. Bilateral investment treaties for the protection and promotion of investments: Germany 1994, Malaysia 1994, Switzerland 1994, Cuba 1997, France 1998, Finland 2002, Netherlands 2002, Austria 2003, Spain 2003, Vietnam 2003, Italy 2004, China 2005.
2. Bilateral treaties for the avoidance of double taxation: South Africa 1959, United Kingdom 1962, Germany 1993, Sweden 1993, Mauritius 1995, Portugal 1995, Malaysia 1998.

Namibia
491
D. Sources of Information
Official
Bank of Namibia (www.bon.com.na).
Ministry of Trade and Industry (www.op.gov.na)
Namibia Investment Center (www.op.gov.na).
B. Secondary
Century House Information (CHI) (1995). "Namibia: An Objective Study of Investment Conditions" (Windhoek: CHI).
Chemonics International, Inc (2003). Namibia AGOA strategy development (Gaborone: USAID).
Coopers and Lybrand (1995). Doing Business in Namibia (Windhoek: Namibia).
Economist Intelligence Unit (EIU) (various years). Country Profile: Namibia (London: EIU Ltd.).
________________ (various years). Country Report: Namibia (London: EIU Ltd.).
Hansohn Dirk (2003). "Economic aspects of NEPAD in Namibia; contribution to the conference organized by the Hanns Seidel Foundation", (Windhoek: NEPRU).
International Monetary Fund (IMF) (2006). IMF's Sub-Saharan Africa Regional Economic Outlook, March 10, 2006. (Washington D.C.: IMF).
John, Christian (2003). "FDI fund: smiling schools of Namibia project" mimeo: article for publication.
Kaatunga, Esau (undated). "Fiscal policy and private investment in Namibia", mimeo (www.sun.ac.za/internet/academic/economy/economics/conference/papers/kaakunga.pdf).
Makola, Mosima (2003). "The attraction of the foreign direct investment (FDI) by the African countries", mimeo.
Mwilima, Ntwala (2003). "The myth of FDI", mimeo.
Morisset, Jacques (2001). Foreign direct investment in Africa: policies also matter (Paris: OECD).
Namibia Economist (2002). "Namibia seeking FDI investment", (www.economist.com.na/2002/20sep/09-20-09.htm).
Namibia Institute for Democracy (NID) (2000). Ethics and good governance in Namibia (Windhoek: NID).
Soderbom, M. and F. Teal (2004). "Size and Efficiency in Africa Manufacturing firms: Evidence from Firm-Level Panel Data." Journal of Development Economics, 73. pp 369 - 394.
The Namibian Economic Policy Research Unit (NEPRU) (2003). "The SACU-USA free trade agreement: what is in it for Namibia"; NEPRU policy brief, # 06, December.
United Nations Conference on Trade and Development (UNCTAD) (2005a). Investor-Disputes Arising
from Investment Treaties: A Review. UNCTAD Series of International Investment Policies for Development (UNCTAD/ITE/IIT/2005/4).

World Investment Directory Volume X Africa 2008
492
_____________(2005b). A Survey of Support by Investment Promotion Agencies to Linkages. Advisory Studies No. 18 (UNCTAD/ITE/IPC/2005/12).
United States Agency for International Development (USAID) (2003). Namibia in the second decade of
independence: successes and challenges (Windhoek: Namibia).
United States Commercial Service (2006). Doing Business in Namibia: A country Commercial Guide for US
Companies. (Washington D.C.: US Government).
United States Trade Representative (2006). 2006 Comprehensive Report on U.S. Trade and Investment
Policy Toward Sub-Saharan Africa and Implementation of the Africa Growth and Opportunity Act:
The Sixth of Eight Annual Reports, May 2006. (Washington D.C.: US Government).
World Bank/International Finance Corporation (2007). Doing Business 2008 Namibia (Washington D.C.: The World Bank Group).
Yeyati, Eduargo et al. (2002). The FTAA and the location of FDI (Washington D.C.: PECC Trade Forum).

Niger
493
Niger
A. Definitions and sources of data
The Investment Code of 1989 of the Government of the Republic of Niger does not give an explicit definition of foreign direct investment (FDI). In the code, investment is denoted as the supply to Niger of capital of any nature, and the reinvestment of funds originating from previously effected investments intended for use in creation of new enterprises; the extension, diversification, modification or modernization of existing units; the supply of capital to a newly created business or the extension, diversification, reconversion, or modernization of an existing unit; the participation consistent with the supply of capital or benefits to all enterprises established in Niger in exchange for grants of business title or the right given to participate in the benefits and the products of a liquidation; investment in the country for at least ten years who have funds available for investment and have obtained the required permission to investment in the country. Data on FDI inflows to Niger were gathered from the Banque Centrale des Etats de l'Afrique de l'Ouest (BCEAO). The International Monetary Fund also provides FDI data on the country in its balance-of-payment statistics.
The investment code guarantees equal treatment to foreign investors regardless of nationality. Total foreign ownership of businesses is permitted in all sectors except those few restricted for national security purposes, such as arms and munitions and private security forces, which require special arrangements. Residents and non-residents may hold foreign exchange accounts with the approval of BCEAO. Payments and transfers to countries other than France, Monaco, members of the Central African Economic and Monetary Community, members of the West African Economic and Monetary Union (WAEMU), and Comoros are subject to quantitative limits and approval in some cases. Real estate purchases by non-residents must be declared to the Government before purchase.
Niger signed to the Convention on the Settlement of Investment Disputes between State and Nationals of other States on 23 August 1965 and has membership in integration schemes which provide it with wide access to regional and international markets. It is a member of WAEMU, Economic Community of West African States, Union Economique et Monétaire Ouest-Africaine, Franc Zone, World Trade Organization and is party to the Cotonou agreement for renegotiating the African, Caribbean and Pacific countries' preferential trade and aid links with the EU under the Lomé Convention, Comité permanent inter-Etats de Lutte Contre la Sécheresse dans le Sahel, the Africa Union, New Partnership for Africa's Development and is eligible for the Everything But Arms initiative by the European Union and the United States' market access initiative for African countries - the African Growth and Opportunity Act.

World Investment Directory Volume X Africa 2008
494
B. Statistics on FDI and the operations of TNCs
Table 1. Summary of FDI
(Millions of dollars)
Variable Inward Outward
1. FDI flows, 2003-2006 (annual average) 20.5 1.1
2. FDI flows as a percentage of GFCF, 2003-2006 (annual average) 4.2 0.2
3. FDI stocks, 2006 120 116
4. FDI stocks as a percentage of GDP, 2006 3.4 3.3
Source: Based on tables 3a and 4a and UNCTAD, FDI/TNC database.

Niger
495
Table 3a. FDI flows, by type of investment, 1980-2006
(Millions of dollars)
Inward investment Outward investment
Reinvested Reinvested
Year Equity earnings Other Total Equity earnings Other Total
1980 2.4 17.2 29.6 49.1 1.0 .. - 5.2 - 4.21981 .. - 3.5 - 2.6 - 6.1 .. .. - 0.6 - 0.61982 18.6 0.7 8.9 28.2 .. .. 3.3 3.31983 1.1 1.2 - 1.2 1.2 2.8 .. - 1.0 1.81984 1.8 - 0.0 - 0.3 1.5 2.8 .. - 2.5 0.31985 - 0.2 0.5 - 9.7 - 9.4 2.1 .. - 0.2 1.91986 - 0.5 17.1 17.6 .. 0.1 29.3 29.41987 - 4.9 9.9 14.8 .. .. 10.2 10.21988 - 1.3 5.6 6.9 .. .. 4.7 4.71989 - - 0.5 1.2 0.8 .. .. 1.6 1.61990 - - 40.8 40.8 .. .. 0.0 0.01991 - - 25.2 40.4 15.2 .. .. 2.6 2.61992 - 4.3 52.1 56.4 .. .. 40.7 40.71993 - - 19.5 - 14.9 - 34.4 .. .. 5.8 5.81994 - - 4.2 - 7.1 - 11.3 - 9.8 - 11.6 - 1.81995 - - 0.5 7.6 14.4 - - 7.2 7.11996 3.7 3.8 2.4 2.3 - - - 7.51997 13.9 2.0 2.2 16.6 - - - 1.61998 1.2 - 2.5 0.4 - 1.2 - - - 0.21999 3.3 - 3.3 0.3 0.3 0.4 0.0 - 0.6 - 0.22000 - 0.8 1.5 7.7 8.4 0.7 - 0.6 - 0.7 - 0.62001 19.8 - 3.4 6.5 22.9 1.0 0.0 - 4.6 - 3.62002 2.3 - 0.1 2.4 2.4 0.5 0.0 - 2.2 - 1.72003 4.9 4.1 2.4 11.5 3.8 0.0 - 3.8 0.02004 12.8 6.4 0.6 19.7 2.3 - 0.0 4.8 7.12005 6.1 2.8 21.3 30.3 0.9 0.0 - 5.3 - 4.42006 .. .. .. 20.5 .. .. .. 1.6
Source: UNCTAD, FDI/TNC database (www.unctad.org/statistics). Notes: Data on inflows are from the IMF for 1980-1994, the Banque Centrale de l'Afrique de l'Ouest (BCEAO) for 1995-2005 and estimate for 2006. Data on outflows are from the IMF for 1980-1998, the BCEAO for 1999-2005 and estimate for 2006.
Table 3b. FDI flows, by type of investment, 1999-2005
(Millions of Franc de la Communauté financière africaine)
Inward investment Outward investment
Reinvested Reinvested
Year Equity earnings Other Total Equity earnings Other Total
1999 2 004 - 2 049 215 170 250 0.01 - 397 - 1472000 - 565 1 077 5 495 6 007 487 - 397 - 532 - 4422001 14 498 - 2 463 4 748 16 783 725 0.01 - 3 381 - 2 6562002 1 604 - 100 1 704 1 676 315 0.01 - 1 513 - 1 1982003 2 856 2 389 1 422 6 667 2 222 0.01 - 2 220 22004 6 746 3 366 303 10 415 1 209 - 25 2 554 3 7382005 3 241 1 497 11 241 15 979 489 0.01 - 2 821 - 2 332
Source: UNCTAD, FDI/TNC database based on the Banque Centrale de l'Afrique de l'Ouest (BCEAO), unpublished.

World Investment Directory Volume X Africa 2008
496
Table 4a. FDI stocks, by type of investment, 1980-2006
(Millions of dollars)
Inward investment Outward investment
Equity & Equity &
Reinvested Reinvested Reinvested Reinvested
Year earnings earnings Other Total earnings earnings Other Total
1980 .. .. .. 190.1 .. .. .. 1.81981 .. .. .. 184.0 .. .. .. 1.21982 .. .. .. 212.2 .. .. .. 4.51983 .. .. .. 213.4 .. .. .. 6.21984 .. .. .. 214.9 .. .. .. 6.51985 .. .. .. 205.5 .. .. .. 8.41986 .. .. .. 223.1 .. .. .. 37.81987 .. .. .. 237.9 .. .. .. 48.01988 .. .. .. 244.8 .. .. .. 52.71989 .. .. .. 245.6 .. .. .. 54.31990 .. .. .. 286.4 .. .. .. 54.31991 .. .. .. 301.6 .. .. .. 56.91992 .. .. .. 358.0 .. .. .. 97.61993 .. .. .. 323.6 .. .. .. 103.41994 .. .. .. 312.3 .. .. .. 101.61995 .. .. .. 326.8 .. .. .. 108.71996 .. .. .. 329.1 .. .. .. 116.21997 .. .. .. 345.7 .. .. .. 117.81998 .. .. .. 344.5 .. .. .. 118.01999 37.4 .. 1.1 38.5 2.7 .. - 0.8 117.72000 37.2 .. 8.2 45.4 3.2 .. - 2.2 117.12001 54.3 .. 7.1 61.5 3.7 .. - 5.4 113.52002 60.9 .. 9.1 70.0 4.6 .. - 8.5 111.82003 74.6 .. 4.3 78.8 9.6 .. - 14.3 111.82004 110.4 .. 4.8 115.2 9.5 .. - 1.3 118.82005 76.3 .. 23.7 100.0 7.6 .. - 5.7 114.42006 .. .. .. 120.5 .. .. .. 116.0
Source: UNCTAD, FDI/TNC database (www.unctad.org/statistics). Notes: Data on inward stock prior to 1999 are estimated by accumulating inflows since 1970. 1999-2005 are based on the Banque Centrale de l'Afrique de l'Ouest (BCEAO). 2006 is estimated by adding flows to the 2005 stock. Outward stock data are estimated by accumulating inflows since 1974.
Table 4b. FDI stocks, by type of investment, 1999-2005
(Millions of Franc de la Communauté financière africaine)
Inward investment Outward investment
Equity & Equity &
Reinvested Reinvested Reinvested Reinvested
Year earnings earnings Other Total earnings earnings Other Total
1999 24 424 .. 699 25 123 1 779 .. - 554 1 2252000 26 249 .. 5 772 32 021 2 266 .. - 1 573 6932001 40 443 .. 5 303 45 746 2 747 .. - 4 031 - 1 2842002 38 077 .. 5 683 43 760 2 865 .. - 5 293 - 2 4282003 38 723 .. 2 213 40 936 5 011 .. - 7 417 - 2 4062004 53 158 .. 2 300 55 458 4 588 .. - 646 3 9422005 42 422 .. 13 162 55 584 4 236 .. - 3 171 1 065
Source: UNCTAD, FDI/TNC database based on the Banque Centrale de l'Afrique de l'Ouest (BCEAO), unpublished.

Niger
497
Table 6. FDI flows in the host economy, by geographical origin, 1995-2006
(Millions of dollars) Economy 1995 1996 1997 1998 1999 2000 2001 2002 2003 2004 2005 2006
Belgium/Luxembourg - - - - - 0.9 - - - - - -China - - - - - - - - - 1.5 5.8 -France - 10.3 - 3.4 2.2 2.1 27.6 1.8 5.6 4.5 - 8.7 - 5.0 - 5.0Germany - - - - - - - - 0.9 - - - -Japan - - - - - - - - - - 0.6 - 0.1Sweden - - - - 0.8 - 3.9 - - - - - -United States - - 5.0 - 4.0 - 5.0 - 2.0 - 1.0 - 1.0 - 1.0 - 1.0 - - 3.0 - 1.0
Source: UNCTAD, FDI / TNC database. Note: Data are based on information reported by the economies listed above.
Table 9. FDI flows abroad, by geographical destination, 1995-2006
(Millions of dollars) Economy 1995 1996 1997 1998 1999 2000 2001 2002 2003 2004 2005 2006
Belgium/Luxembourg - - - - - 9.2 - - - - - -France 1.3 1.3 - 4.5 - 2.1 0.9 - 49.2 - 1.1 - 1.2 2.5 3.8
Source: UNCTAD, FDI / TNC database. Note: Data are based on information reported by the economies listed above.
Table 12. FDI stocks in the host economy, by geographical origin, 1995-2006
(Millions of dollars) Economy 1995 1996 1997 1998 1999 2000 2001 2002 2003 2004 2005 2006
China - - - - - - - - 12.5 14.0 20.4 -United States 6.0 1.0 - 3.0 - 8.0 - 10.0 - 12.0 - 14.0 - 15.0 - 16.0 - 29.0 - 32.0 - 33.0
Source: UNCTAD, FDI / TNC database. Note: Data are based on information reported by the economies listed above. Tables 23, 30, 45 and 50. The number, assets, sales and value added of foreign affiliates of United States'
TNCs in Niger, 1995-2006
(Number and millions of dollars)
Table no./Variable 1995 1996 1997 1998 1999 2000 2001 2002 2003 2004 2005 2006
23. Number 2 2 2 2 2 2 2 2 2 1 .. ..30. Assets 16.0 18.0 19.0 19.0 .. .. .. .. .. .. .. ..45. Sales 13.0 14.0 15.0 13.0 .. .. .. .. .. .. .. ..50. Value added a .. .. .. 1.0 .. .. .. .. .. .. .. ..
Source: UNCTAD, FDI/TNC database. Note: Data are based on information reported by the United States. a Majority-owned affiliates only.

World Investment Directory Volume X Africa 2008
498
Table 86. Largest home-based TNCs, 2007
(Billions of dollars) Company Industry Sales
A. Industrial
Sté Nigérienne de Produits Pétroliers Petroleum expl./ref./distr. 0.14 Compagnie Miniére d'Akouta Mining 0.09 a
B. Tertiary .. .. .. C. Finance and insurance Assets
.. .. ..
Source: Jeune Afrique Hors-serie No. 14, 2007.a 2004.
Table 87. Largest affiliates of home-based TNCs, 2007
(Millions of dollars and number) Company Name Host Economy Industry Sales Employees
A. Industrial
.. .. .. .. .. B. Tertiary Industrielle et Commerciale du Sahel France Wholesale trade .. .. C. Finance and insurance Assets Employees
.. .. .. .. .. Source: Who Owns Whom database (https://solutions.dnb.com/wow), retrieved January 2008.

Niger
499
Table 88. Largest affiliates of foreign TNCs in the host economy, 2007
(Millions of dollars and number) Company Home Economy Industry Sales Employees
A. Industrial
Edocement Ltd Norway Mining and quarrying .. ..
B. Tertiary Total Niger S A France Wholesale trade 248.1 55DHL Express Germany Air transport 41.6 ..Société Maersk Niger Sa Denmark Supporting transport activities 0.9 4Centralpharm France Automotive trade and repair .. ..Impresit Bakolori Plc Italy Other services .. ..Ashaka Cem Plc Nigeria Other services .. ..Niger Afrique Sa Netherlands Wholesale trade .. ..Société Nigerienne De Cimenterie Norway Wholesale trade .. ..
C. Finance and insurance Assets Employees
.. .. .. .. .. Source: Who Owns Whom database (https://solutions.dnb.com/wow), retrieved January 2008.

World Investment Directory Volume X Africa 2008
500
C. Legal frameworks for transnational corporations
In Niger, there are a large number of legal instruments for regulating the activities of transnational corporations and foreign direct investors. The following key instruments are applicable in the country:
I. National framework
The General Tax Code (Code General ties Imp6ts) Articles 1-31, as amended by Finance Law 1976 and Finance Law 1993. Source: FIDAfrica, Fiscalite Africame, 1994.
The Investment Code, Decree No. 89-19 of 8 December 1989. Repeals Investment Code of 1974. Source:Official copy, Ministry of Industry of Niger, 1990.
Ordinance No. 93-027, March 1993 on Protection of Copyright, Neighboring Rights and Expressions of Folklore. Source: WIPO (http://www.wipo.org).
Privatisation, Oct 2006 Source: www.eiu.com, EIU Country report Main report May 2006.
II. International Framework
A. Niger is a party to the following multilateral and regional instruments:
Convention on the Recognition and Enforcement of Foreign Arbitral Awards of 1958, which entered into force on 7th June 1959.
Convention on the Settlement of Investment Disputes between States and Nationals of other States of 1965. Entered into force on 14 October 1966.
Patents: Bangui Agreement, March 1977 (Annex I), as last amended in February 1999. Source: WIPO (http://www.wipo.org).
Industrial Designs: Bangui Agreement, March 1977 (Annexes II and IV), as last amended in February 1999. Source: WIPO (http://www.wipo.org).
Trade Marks: Bangui Agreement, March 1977 (Annex III), as last amended in February 1999. Source: WIPO (http://www.wipo.org).
Convention Establishing the Multilateral Investment Guarantee Agency of 1985, entered into force on 12 April 1988.
Agreement for the Promotion, Protection and Guarantee of Investment Among Member States of the Organization of Islamic Conference, of I June 1981; entered into force on 23 September 1986.
Fourth ACP - EEC Convention (Lome IV) of 1989, entered into force on 1st March 1990.
Revised Treaty of the Economic Community of West African States (ECOWAS) 1993.
Niger
501
Articles of Agreement of the Islamic Corporation for the Insurance of Investment and Export Credit of 19 February 1992. Entered into force on 1 August 1994.
Paris Convention for the Protection of Industrial Property of 1883 (Revised at Brussels in 1900, Washington in 1911, The Hague in 1925, London in 1934, Lisbon in 1958 and Stockholm in 1967, and as amended in 1979). Signed in 1994.
Marrakesh Agreement Establishing the World Trade Organisation of 15 April 1994. Entered into force on 1 January 1995. Agreement on Trade-Related Investment Measures. General Agreement on Trade in Services. Agreement on Trade Related Aspects of Intellectual Property Rights.
Partnership Agreement between the Members of The African, Caribbean and Pacific Group of States, of the one part and the European Community and its member states, of the other part signed in Cotonou, Benin on 23 June 2000.
B. Bilateral treaties
1. Bilateral investment treaties for the protection and promotion of investments: Switzerland 1962, Germany 1964, Tunisia 1992, Algeria 1998, Egypt 1998.
2. Bilateral treaties for the avoidance of double taxation: France 1965.

World Investment Directory Volume X Africa 2008
502
D. Sources of information
Official
Banque Centrale des Etats de l'Afrique de l'Ouest (BCEAO) (www.bceao.int).
Secondary
Bennell, Paul (1997). "Foreign direct investment in Africa: rhetoric and reality", SAIS Review (Summer/Fall), pp. 127-139.
Bennell, Paul (1997). "Privatization in Sub-Saharan Africa: progress and prospects during the 1990s", World
Development, vol. 25, no. 11, pp. 1785-1803.
Economist Intelligence Unit (EIU) (various years). Country Profile: Niger (London: EIU Ltd.).
______________ (various years). Country Report: Niger (London: EIU Ltd..
International Finance Corporation (IFC) (1997). "Foreign direct investment", IFC: Lessons of Experience Series No. 5, (Washington, D.C.: World Bank).
International Monetary Fund (IMF) (2006). IMF's Sub-Saharan Africa Regional Economic Outlook, March 10, 2006. (Washington D.C.: IMF).
Kandiero, Tonia and Chitiga Magaret (2003) "Trade openness and foreign direct investment in Africa", paper presented for Economic Society of Southern Africa, 2003 Annual Conference, Cape Town, South Africa.
Morriset, Jacques (2001). Foreign direct investment in Africa: policies also matter (Paris: OECD).
Morisset, Jacques and Andrew-Johnson, Kelly (2002) The effectiveness of promotion agencies at attracting
foreign direct investment (Washington D.C.: FIAS).
Multilateral Investment Guarantee Agency (MIGA) (2001). PrivatizationLink Information – Niger
(Washington D.C.: MIGA).
Soderbom, M. and F. Teal (2004). "Size and Efficiency in Africa Manufacturing firms: Evidence from Firm-Level Panel Data." Journal of Development Economics, 73. pp 369 - 394.
United Nations Conference on Trade and Development (UNCTAD) (1995). Foreign Direct Investment in
Africa (Geneva: United Nations, United Nations publication, Sales No. E.95.II.A.6).
_____________(2000). Capital Flows and Growth in Africa (Geneva: UNCTAD/GDS/MDPB/7), July.
_____________(2002). FDI in the Least Developed Countries at a Glance (Geneva: UNCTAD/ITE/IIA/6).
_____________(2003). FDI in Landlocked Developing Countries at a Glance 2002 (Geneva: UNCTAD/ITE/IIA/2003/5).
_____________(2005a). Investor-Disputes Arising from Investment Treaties: A Review. UNCTAD Series of International Investment Policies for Development (UNCTAD/ITE/IIT/2005/4).
_____________(2005b). A Survey of Support by Investment Promotion Agencies to Linkages. Advisory Studies No. 18 (UNCTAD/ITE/IPC/2005/12).

Niger
503
_______________(2005c). FDI in least developed countries at a glance: 2005/2006
(UNCTAD/ITE/IIA/2005/17).
United States Trade Representative (2006). 2006 Comprehensive Report on U.S. Trade and Investment
Policy Toward Sub-Saharan Africa and Implementation of the Africa Growth and Opportunity Act: The Sixth of Eight Annual Reports, May 2006. (Washington D.C.: US Government).
World Bank/International Finance Corporation (2007). Doing Business 2008 Niger (Washington D.C.: The World Bank Group).


Nigeria
505
Nigeria
A. Definitions and sources of data
In the Federal Republic of Nigeria, foreign direct investment (FDI) is defined as investment undertaken by an enterprise that is either wholly or partly foreign-owned. The Investment Code that created the Nigerian Investment Promotion Commission (Decree No. 16 of 16 January 1995) and the Foreign Exchange (Monitoring and Miscellaneous Provision) also enacted in 1995 gives full legal backing for FDI in the country. Data on FDI were collected by the Central Bank of Nigeria and were based on company surveys. Enterprises covered by the surveys are those in which foreigners hold at least 75% of total equity. The data encompass foreign share capital, unremitted profits, liabilities to head offices and other foreign liabilities. The International Monetary Fund (IMF) also provides data on FDI in the country in its balance-of-payment statistics.
Nigerian Government promotes FDI into the country. Particularly, the government implemented IMF monitored-liberalization of its economy, welcomes foreign investors in the manufacturing sector, offers incentives for ownership of equity in all industries, except for petroleum and key industries such as military equipment, created some Export Processing Zones and participates in regional integration schemes. The incentives that are available to investors include tax relief and legislative provisions for repatriation of foreign capital investment at any time of capital appreciation of investment. No import or export licenses are required and up to 100% foreign ownership of enterprises is allowed in many industies. Also, concessions are available for local raw material development, local value-added, labor-intensive or export-oriented activities that involve significant training. Nigeria's investment law has provisions for capital assets depreciation allowance, and provides against nationalization, expropriation and compulsory purchase of company assets. Disputes between investors and entities of the Government of the Federal Republic of Nigeria, which cannot be amicably settled, may be submitted by an aggrieved party to arbitration under Nigeria's Arbitration and Conciliation Decree 1988 or in the framework of any bilateral or multilateral agreement on investment protection to which the Government and the investor's country are parties or by other national or international machinery for the settlement of investment disputes as agreed to by the parties. Nigeria's general legal environment, which is based on English common law further upholds the sanctity of contracts and the rule of law.
In line with its economic reforms, starting from the 1980s, Nigeria undertook a far-reaching privatization programme. Public enterprises in several sectors have been privatized and most of the remaining ones are up for sale. Nigeria has equally established Export Processing Free Zones' Scheme (EPFZS). This scheme allows interested persons to set up industries and businesses in demarcated zones known as Export Processing Zones (EPZs), with the aim of exporting the goods and services manufactured or produced in the zones. The scheme is to diversify the export base of the country by accelerating export business with attendant incentives. It includes industrial production, offshore banking, insurance and re-insurance, international stock, commodities and mercantile exchanges, commercial industrial research, agriculture and agro-allied industry, mineral processing, international tourist resort development and operations. Provisions had been put in place to cut off the bureaucracy in investment approval, by allowing the Nigerian Export Processing Zones Authority (NEPZA) to administer, manage, control and coordinate the quick approvals for participating foreign investors. These include issuing application forms and approval, company registration and construction licensing.
Nigeria’s natural resource balance is dominated by petroleum and to a much smaller extent, natural gas. The country has sizeable coal reserves but production is substantially lower than the proven potential. Known oil reserves could last for another 35 years of output. But, diversification of the economy has led to de-emphasizing the role of oil production and exports in the country's economy.

World Investment Directory Volume X Africa 2008
506
Much needed focus has thus been devoted to other sectors like solid minerals, tourism, telecommunication, commerce and industry.
As a way of boosting size of market for manufactured good and other processed items, Nigeria joined some African regional integration schemes. Nigeria also signed to the Convention on the Settlement of Investment Disputes between State and Nationals of other States on 13 July 1965 and is a member of the Economic Community of West African States (ECOWAS), the African Union (AU) and New Partnership for Africa's Development. ECOWAS has as its aim to establish a customs union and a common market to promote the free movement of goods and people in West Africa. AU treaty included plans to create an African Economic Community, under the Lagos Plan of Action drawn up in 1980. In 2000, Nigeria and five other countries, The Gambia, Ghana, Guinea, Liberia and Sierra Leone, signed an agreement to create a second monetary union in the region. Nigeria is eligible for the African Growth and Opportunity Act, by the United States and the Cotonou Agreement for renegotiating the trade partnership links between African, Caribbean and Pacific countries with the European Union. It is also a member of the Multilateral Investment Guarantee Agency and the World Trade Organization.

Nigeria
507
B. Statistics on FDI and the operations of TNCs
Table 1. Summary of FDI
(Millions of dollars)
Variable Inward Outward
1. FDI flows, 2003-2006 (annual average) 3 286.8 213.9
2. FDI flows as a percentage of GFCF, 2003-2006 (annual average) 53.7 3.5
3. FDI stocks, 2006 40 251 5 254
4. FDI stocks as a percentage of GDP, 2006 34.9 4.6
Source: Based on tables 3 and 4 and UNCTAD, FDI/TNC database.
Table 3. FDI flows, by type of investment, 1980-2006
(Millions of dollars)
Inward investment Outward investment
Reinvested Reinvested
Year Equity earnings Other Total Equity earnings Other Total
1980 .. .. - 738.9 - 738.9 .. .. .. 3.01981 .. .. 542.3 542.3 .. .. .. 7.01982 .. .. 430.6 430.6 .. .. .. - 29.01983 .. .. 364.4 364.4 .. .. .. ..1984 .. .. 189.2 189.2 .. .. .. ..1985 .. .. 485.6 485.6 .. .. .. 0.41986 .. .. 193.2 193.2 .. .. .. 14.41987 .. .. 610.6 610.6 .. .. .. - 10.11988 .. .. 378.7 378.7 .. .. .. 3.91989 .. .. 1 884.3 1 884.3 .. .. .. 797.71990 65.9 475.8 460.8 1 002.5 1.6 56.6 356.4 414.61991 68.2 565.8 489.9 1 123.9 0.6 30.9 380.0 411.51992 94.4 570.2 492.1 1 156.7 1.2 50.3 208.6 260.11993 230.6 890.7 756.8 1 878.1 3.4 97.5 431.8 532.71994 319.6 979.9 987.9 2 287.4 - 128.5 199.7 328.21995 154.3 537.9 578.8 1 271.1 0.0 87.5 104.2 191.81996 10.5 984.7 1 195.5 2 190.7 0.4 55.6 541.2 597.21997 8.1 491.9 1 142.5 1 642.5 0.2 35.4 67.4 103.01998 91.5 478.8 639.8 1 210.1 34.4 50.2 74.2 158.81999 5.2 412.0 760.5 1 177.7 1.1 48.0 123.7 172.82000 1.6 432.7 875.4 1 309.7 0.2 40.0 128.8 168.92001 4.1 1 088.3 185.0 1 277.4 4.6 50.0 39.3 93.92002 7.8 1 704.4 328.0 2 040.2 1.4 77.8 93.0 172.22003 10.2 1 873.2 288.0 2 171.4 0.1 68.3 98.9 167.32004 18.9 1 707.6 400.7 2 127.1 0.1 99.8 160.8 260.82005 30.2 2 732.1 641.0 3 403.3 0.1 70.1 129.9 200.12006 48.3 4 371.3 1 025.7 5 445.3 0.3 85.0 142.3 227.6
Source: UNCTAD, FDI/TNC database (www.unctad.org/statistics). Notes: Inflows are based on information from the IMF for 1980-1989 and the Central Bank of Nigeria thereafter. Outflow data for 1980-1982 and 1985-1989 are proxy data based on investments reported by the following economies: United States for 1980-1982; .Belgium and Luxembourg for 1985; Belgium and Luxembourg, France and the United States for 1986-1988. After 1989, data are from the Central Bank of Nigeria. Data for 2005 and 2006 are preliminary.

World Investment Directory Volume X Africa 2008
508
Table 4. FDI stocks, by type of investment, 1980-2006
(Millions of dollars)
Inward investment Outward investment
Reinvested Reinvested
Year Equity earnings Other Total Equity earnings Other Total
1980 .. .. .. 2 457.3 .. .. .. 8.01981 .. .. .. 2 999.6 .. .. .. 15.01982 .. .. .. 3 430.2 .. .. .. - 14.01983 .. .. .. 3 794.7 .. .. .. - 14.01984 .. .. .. 3 983.8 .. .. .. - 14.01985 .. .. .. 4 469.4 .. .. .. - 13.61986 .. .. .. 4 662.6 .. .. .. 0.81987 .. .. .. 5 273.2 .. .. .. - 9.31988 .. .. .. 5 651.9 .. .. .. - 5.41989 .. .. .. 7 536.1 .. .. .. 792.41990 .. .. .. 8 538.6 .. .. .. 1 207.01991 .. .. .. 9 662.5 .. .. .. 1 618.51992 .. .. .. 10 819.2 .. .. .. 1 878.61993 .. .. .. 12 697.3 .. .. .. 2 411.31994 .. .. .. 14 984.7 .. .. .. 2 739.51995 .. .. .. 16 255.8 .. .. .. 2 931.21996 .. .. .. 18 446.4 .. .. .. 3 528.41997 .. .. .. 20 088.9 .. .. .. 3 631.41998 .. .. .. 21 299.0 .. .. .. 3 790.21999 .. .. .. 22 476.7 .. .. .. 3 963.02000 .. .. .. 23 786.4 .. .. .. 4 132.02001 .. .. .. 25 063.8 .. .. .. 4 225.82002 .. .. .. 27 104.0 .. .. .. 4 398.02003 .. .. .. 29 275.4 .. .. .. 4 565.32004 .. .. .. 31 402.5 .. .. .. 4 826.12005 .. .. .. 34 805.8 .. .. .. 5 026.22006 .. .. .. 40 251.2 .. .. .. 5 253.8
Source: UNCTAD, FDI/TNC database (www.unctad.org/statistics). Notes: Data on inward stock are estimated by accumulating inflows since 1970. Data on outward stock are estimated by accumulating inflows since 1978.

Nigeria
509
Table 5. FDI flows in the host economy, by industry, 1994-2005
(Millions of dollars)
Sector / industry 1990 1991 1992 1993 1994 1995 1996 1997 1998 1999 2000 2001 2002 2003 2004 2005
Total 1 003 1 124 1 157 1 878 2 287 1 271 2 191 1 642 1 210 1 178 1 310 1 277 2 040 2 171 2 127 3 403Primary 543 558 479 835 850 475 2 109 1 548 788 1 134 1 148 1 233 1 966 2 067 1 977 2 675
Petroleum 543 558 479 835 850 475 2 109 1 548 788 1 134 1 148 1 233 1 966 2 067 1 977 2 675Unspecified 460 566 678 1 043 1 437 796 81 94 422 44 162 44 74 105 150 728
Source: UNCTAD, FDI/TNC database based on the Central Bank of Nigeria, unpublished. Note: Petroleum refer to petroleum-related industries and "Unspecified" refers to all other industries that are not petroleum related.
Table 6. FDI flows in the host economy, by geographical origin, 1994-2005
(Millions of dollars)
Region / economy 1990 1991 1992 1993 1994 1995 1996 1997 1998 1999 2000 2001 2002 2003 2004 2005
Total world 1 651 764 742 - 356 2 558 259 457 1 482 .. .. .. .. .. .. ..Developed countries 1 234 394 661 - 232 2 454 215 436 965 .. .. .. .. .. .. ..
Europe 488 276 101 - 116 2 135 189 135 931 .. .. .. .. .. .. ..European Union 350 198 64 - 58 238 84 65 825 .. .. .. .. .. .. ..
United Kingdom 350 198 64 - 58 238 84 65 825 .. .. .. .. .. .. ..North America 747 118 559 - 116 319 25 301 34 .. .. .. .. .. .. ..
United States 747 118 559 - 116 319 25 301 34 .. .. .. .. .. .. ..Developing economies - - - - 105 36 30 12 18 .. .. .. .. .. .. ..
Asia - - - - 105 36 30 12 18 .. .. .. .. .. .. ..Unspecified 416 370 82 - 19 68 15 9 499 .. .. .. .. .. .. ..
Source: UNCTAD, FDI/TNC database based on the Central Bank of Nigeria, unpublished.
Table 8. FDI flows abroad, by industry, 1994-2005
(Millions of dollars)
Sector / industry 1990 1991 1992 1993 1994 1995 1996 1997 1998 1999 2000 2001 2002 2003 2004 2005
Total 415 412 260 533 328 192 597 103 159 173 169 94 172 167 261 199Primary 57 28 60 96 149 88 555 55 50 148 40 80 166 164 260 198
Petroleum 57 28 60 96 149 88 555 55 50 148 40 80 166 164 260 198Unspecified 358 384 200 437 179 104 42 48 109 24 129 14 6 4 1 1
Source: UNCTAD, FDI/TNC database based on the Central Bank of Nigeria, unpublished. Note: Petroleum refer to petroleum-related industries and "Unspecified" refers to all other industries that are not petroleum related.
Table 9. FDI flows abroad, by geographical destination, 1994-2005
(Millions of dollars)
Region / economy 1990 1991 1992 1993 1994 1995 1996 1997 1998 1999 2000 2001 2002 2003 2004 2005
Total world 1 824 447 221 - 178 334 134 195 382 .. .. .. .. .. .. ..Developed countries 1 333 322 190 - 129 329 116 187 261 .. .. .. .. .. .. ..
Europe 532 100 26 - 77 240 78 58 187 .. .. .. .. .. .. ..European Union 466 63 21 - 6 91 30 55 178 .. .. .. .. .. .. ..
United Kingdom 466 63 21 - 6 91 30 55 178 .. .. .. .. .. .. ..North America 801 222 164 - 52 89 38 129 74 .. .. .. .. .. .. ..
United States 801 222 164 - 52 89 38 129 74 .. .. .. .. .. .. ..Developing economies - - - - 41 5 18 7 0 .. .. .. .. .. .. ..
Asia - - - - 41 5 18 7 0 .. .. .. .. .. .. ..Unspecified 491 125 31 - 8 0 0 1 121 .. .. .. .. .. .. ..
Source: UNCTAD, FDI/TNC database based on the Central Bank of Nigeria, unpublished.

World Investment Directory Volume X Africa 2008
510
Table 11. FDI stocks in the host economy, by industry, 1994-2005
(Millions of dollars)
Sector / industry 1990 1991 1992 1993 1994 1995 1996 1997 1998 1999 2000 2001 2002 2003 2004 2005
Total 1 003 2 126 3 283 5 161 7 449 8 720 10 910 12 553 13 763 14 941 16 250 17 528 19 568 21 739 23 866 27 270
Primary 543 1 100 1 579 2 414 3 264 3 739 5 848 7 397 8 185 9 319 10 466 11 700 13 666 15 732 17 709 20 384
Petroleum 543 1 100 1 579 2 414 3 264 3 739 5 848 7 397 8 185 9 319 10 466 11 700 13 666 15 732 17 709 20 384
Unspecified 460 1 026 1 704 2 747 4 185 4 981 5 062 5 156 5 578 5 622 5 784 5 828 5 902 6 007 6 157 6 885
Source: UNCTAD, FDI/TNC database based on the Central Bank of Nigeria, unpublished.
Note: Petroleum refer to petroleum-related industries and "Unspecified" refers to all other industries that are not petroleum related.
Table 14. FDI stocks abroad, by industry, 1994-2005
(Millions of dollars)
Sector / industry 1990 1991 1992 1993 1994 1995 1996 1997 1998 1999 2000 2001 2002 2003 2004 2005
Total 415 826 1 086 1 619 1 947 2 139 2 736 2 839 2 998 3 171 3 340 3 433 3 606 3 773 4 034 4 233
Primary 57 85 145 240 390 477 1 032 1 087 1 137 1 286 1 326 1 406 1 571 1 735 1 994 2 192
Petroleum 57 85 145 240 390 477 1 032 1 087 1 137 1 286 1 326 1 406 1 571 1 735 1 994 2 192
Unspecified 358 742 942 1 379 1 558 1 662 1 704 1 752 1 861 1 885 2 014 2 028 2 034 2 038 2 039 2 041
Source: UNCTAD, FDI/TNC database based on the Central Bank of Nigeria, unpublished.
Note: Petroleum refer to petroleum-related industries and "Unspecified" refers to all other industries that are not petroleum related.
Table 15. FDI stocks abroad, by geographical destination, 1994-2005
(Millions of dollars)
Reporting countries 1990 1991 1992 1993 1994 1995 1996 1997 1998 1999 2000 2001 2002 2003 2004 2005
Brazil .. .. 0.0 - - - - - - - - - - - - -
Bulgaria .. .. - - - - - - - 0.0 0.0 0.0 0.0 0.0 0.0 0.4
France .. .. 35.7 2.2 46.6 58.9 71.4 75.6 105.0 121.6 141.4 100.5 130.0 142.7 475.4 94.4
Indonesia .. .. 0.6 - 0.6 0.6 0.6 - - - - - - - - -
Portugal .. .. - - - - - - - - - 0.2 0.2 0.2 - -
Korea, Rep. of .. .. - - - - - - 0.0 1.1 3.8 9.7 11.9 15.8 19.6 23.3
United States .. .. 5.0 - - 10.0 13.0 - - - - 39.0 42.0 63.0 - -
Source: UNCTAD. FDI / TNC database.
Note: Data is based on the information reported by the economies listed above.

Nigeria
511
Table 21. The number of foreign affiliates of home-based transnational corporations, by geographical location abroad, 1994-2005
Economy 1990 1991 1992 1993 1994 1995 1996 1997 1998 1999 2000 2001 2002 2003 2004 2005
Armenia .. .. .. .. .. .. .. .. .. 1 .. .. .. .. .. ..Indonesia .. .. 2 .. 2 2 2 .. .. .. .. .. .. .. .. ..United States 1 1 1 1 1 2 2 .. .. .. .. .. .. .. .. ..Source: UNCTAD, FDI/TNC database. Note: Data are based on information reported by the economies listed above.
Table 23. The number of affiliates of foreign TNCs in the host economy, by geographical origin, 1994-2005Economy 1990 1991 1992 1993 1994 1995 1996 1997 1998 1999 2000 2001 2002 2003 2004 2005
Germany 37 35 37 25 24 20 15 14 15 13 16 17 16 14 14 13India .. .. .. .. .. .. 18 .. .. .. .. .. .. .. .. ..Italy .. 8 .. 6 .. 6 .. 5 .. .. .. .. .. .. .. ..Republic of Korea .. .. .. .. .. .. 4 5 5 5 5 6 6 6 6 6United States 44 46 45 44 52 51 52 55 57 48 48 58 61 64 64 ..Source: UNCTAD, FDI/TNC database. Note: Data are based on information reported by the economies listed above.
Tables 28 and 43. Assets and sales of foreign affiliates of Nigerian TNCs in the United States, 1994-2005 (Millions of dollars)
Table no./Variable 1990 1991 1992 1993 1994 1995 1996 1997 1998 1999 2000 2001 2002 2003 2004 2005
28. Assets .. .. .. 6 5 7 7 1 1 1 .. .. .. .. 3 ..43. Sales .. .. .. .. .. 3 3 .. .. .. .. .. .. .. .. ..Source: UNCTAD, FDI/TNC database. Note: Data are based on information reported by the United States.
Table 30. Assets of affiliates of foreign TNCs in the host economy, by geographical origin, 1994-2005
(Millions of dollars) Economy 1990 1991 1992 1993 1994 1995 1996 1997 1998 1999 2000 2001 2002 2003 2004 2005
Germany 468.5 593.7 309.8 289.6 387 209 257 335 359 1 909 1 861 1 851 .. .. .. ..United States a 3138.0 2744.0 3155.0 3672.0 4 096 4 579 5 750 6 380 8 519 7 292 8 425 8 775 9 232 12 307 15 629 ..Source: UNCTAD, FDI/TNC database. Note: Data are based on information reported by the economies listed above. a Majority-owned affiliates only.
Table 35. Employment of affiliates of foreign TNCs in the host economy, by geographical origin, 1994-2005 (Thousands of employees)
Economy 1990 1991 1992 1993 1994 1995 1996 1997 1998 1999 2000 2001 2002 2003 2004 2005
Belgium .. .. .. .. .. .. .. .. .. .. .. 0.6 1.3 0.9 .. ..Germany 13.0 13.0 13.0 12.0 19.0 20.0 21.0 27.0 30.0 27.0 28.0 30.0 24.0 20.0 20.0 22.0Italy .. 2.7 .. 2.4 .. 2.4 .. 2.3 .. .. .. .. .. .. .. ..Switzerland .. .. .. 5.4 4.5 5.3 8.0 7.8 6.0 5.5 6.8 3.9 6.3 6.4 5.8 6.0United States 7.6 10.1 8.8 9.0 8.4 8.8 9.3 9.8 9.4 9.7 9.9 9.7 9.2 8.7 .. ..Source: UNCTAD, FDI/TNC database. Note: Data are based on information reported by the economies listed above. Tables 40, 50, 60, 65 and 85. Wages and salaries, value added, exports, imports and royalty payments of affiliates of
United States TNCs in Nigeria, 1994-2005 (Millions of dollars)
Table no./Variable 1990 1991 1992 1993 1994 1995 1996 1997 1998 1999 2000 2001 2002 2003 2004 2005
40. Wages and salaries 59 69 96 114 149 122 144 155 169 181 228 211 200 232 276 a ..50. Value added a .. .. .. .. 1738 2024 2977 2951 1822 2838 4882 4254 3671 5012 5883 ..60. Exports 66 42 48 36 116 46 132 130 176 53 84 .. .. .. .. ..65. Imports 2221 1964 1402 1452 1527 823 1023 .. .. .. .. .. .. .. .. ..85. Royalty payments a .. .. .. .. 1 .. .. .. .. 3 .. .. .. .. .. ..Source: UNCTAD, FDI/TNC database. Note: Data are based on information reported by the United States. a Majority-owned affiliates only.
Table 45. Sales of affiliates of foreign TNCs in the host economy, by geographical origin, 1994-2005
(Millions of dollars) Economy 1990 1991 1992 1993 1994 1995 1996 1997 1998 1999 2000 2001 2002 2003 2004 2005
Germany 309.5 421.8 448.2 423.4 246 209 266 346 455 426 461 537 471 451 497 482Italy .. 1034.4 .. 688.3 .. 619 .. 731 .. .. .. .. .. .. .. ..United States 3128.0 2943.0 3029.0 3057.0 3 223 3 255 4 353 4 595 3 407 4 318 6 220 5 961 5 391 6 716 .. ..Source: UNCTAD, FDI/TNC database. Note: Data are based on information reported by the economies listed above.
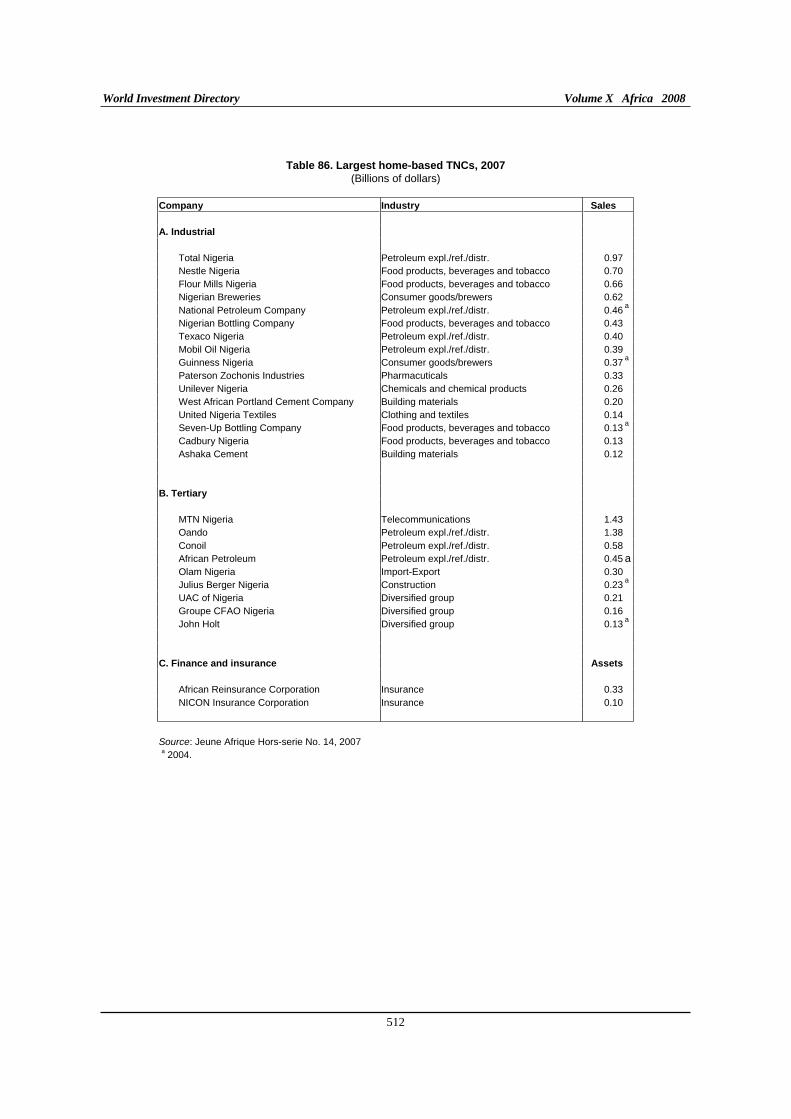
World Investment Directory Volume X Africa 2008
512
Table 86. Largest home-based TNCs, 2007
(Billions of dollars) Company Industry Sales
A. Industrial
Total Nigeria Petroleum expl./ref./distr. 0.97 Nestle Nigeria Food products, beverages and tobacco 0.70 Flour Mills Nigeria Food products, beverages and tobacco 0.66 Nigerian Breweries Consumer goods/brewers 0.62 National Petroleum Company Petroleum expl./ref./distr. 0.46
a
Nigerian Bottling Company Food products, beverages and tobacco 0.43 Texaco Nigeria Petroleum expl./ref./distr. 0.40 Mobil Oil Nigeria Petroleum expl./ref./distr. 0.39 Guinness Nigeria Consumer goods/brewers 0.37
a
Paterson Zochonis Industries Pharmacuticals 0.33 Unilever Nigeria Chemicals and chemical products 0.26 West African Portland Cement Company Building materials 0.20 United Nigeria Textiles Clothing and textiles 0.14 Seven-Up Bottling Company Food products, beverages and tobacco 0.13
a
Cadbury Nigeria Food products, beverages and tobacco 0.13 Ashaka Cement Building materials 0.12
B. Tertiary
MTN Nigeria Telecommunications 1.43 Oando Petroleum expl./ref./distr. 1.38 Conoil Petroleum expl./ref./distr. 0.58 African Petroleum Petroleum expl./ref./distr. 0.45 aOlam Nigeria Import-Export 0.30 Julius Berger Nigeria Construction 0.23
a
UAC of Nigeria Diversified group 0.21 Groupe CFAO Nigeria Diversified group 0.16 John Holt Diversified group 0.13
a
C. Finance and insurance Assets
African Reinsurance Corporation Insurance 0.33 NICON Insurance Corporation Insurance 0.10
Source: Jeune Afrique Hors-serie No. 14, 2007a 2004.

Nigeria
513
Table 87. Largest affiliates of home-based TNCs, 2007
(Millions of dollars and number) Company Name Host Economy Industry Sales Employees
A. Industrial
.. .. .. .. .. B. Tertiary
Energo Management Group D.O.O. Serbia & Montenegro Research and development 1.77 3Kuramo Usa Inc United States Research and development 0.06 1The Wattle Company Limited Zimbabwe Forestry and fishing .. 3000Ashaka Cem Plc Niger Other services .. ..Summit Oil And Gas Worldwide Ltd. Bahamas Holding .. ..Wg Nigeria Holdings Limited Cayman Islands Holding .. ..
C. Finance and insurance Assets Employees
FBN Bank (Uk) Ltd England Finance .. 31 Source: Who Owns Whom database (https://solutions.dnb.com/wow), retrieved January 2008.

World Investment Directory Volume X Africa 2008
514
Table 88. Largest affiliates of foreign TNCs in the host economy, 2007
(Millions of dollars and number) Company Home Economy Industry Sales Employees
A. Industrial
Nigerian Breweries Plc Switzerland Food, beverages and tobacco 412.5 2 939Nestlé Nigeria Plc Switzerland Food, beverages and tobacco 261.0 1 202Unilever Nigeria Plc Netherlands Chemicals and chemical products 214.3 1 931Ashakacem Plc France Non-metallic mineral products 171.2 1 861Glaxosmithkline Consumer Nigeria Plc United Kingdom Chemicals and chemical products 51.5 489Cement Company Of Northern Nigeria Plc Norway Non-metallic mineral products 45.0 297Air Liquide Nigeria Plc France Chemicals and chemical products 9.1 200Boc Gases Nigeria Plc United Kingdom Chemicals and chemical products 8.5 140Mobil Producing Nigeria Unlimited United States Chemicals and chemical products .. 1 927Paterson Zochonis Industries Plc United Kingdom Chemicals and chemical products .. 4 983Thermocool Engineering Company Ltd United Kingdom Machinery and equipment .. 966Elf Petroleum Nigeria Limited France Petroleum .. 814Nampak Nigeria Plc United States Wood and wood products .. 350Crittall-Hope Nigeria Ltd United Kingdom Metal and metal products .. 235Halliburton Energy Services Nigeria Ltd United States Petroleum .. 223Nigerian Agip Exploration Ltd Italy Petroleum .. 200Halliburton Energy Services Nigeria Ltd United Kingdom Petroleum .. 184Reckitt Benckiser Nigeria Limited United Kingdom Chemicals and chemical products .. 170Giwarite Ltd Belgium Manufacture of petroleum .. 140Haco Ltd United Kingdom Chemicals and chemical products .. 133
B. Tertiary
Vee Networks Ltd Kuwait Telecommunications 290.5 1 523CFAO Nigeria Plc France Holding 92.6 1 161John Holt Plc United Kingdom Wholesale trade 66.9 ..Longman Nigeria Plc United Kingdom Publishing, printing 7.9 320Btc Nigeria Limited Germany Wholesale trade 0.2 30Daewoo Nigeria Ltd Rep. Of Korea Construction .. 6 000Volkswagen Of Nigeria Ltd Germany Wholesale trade .. 1 238Panalpina World Transport (Nigeria) Ltd Switzerland Air transport .. 1 000Trevi Foundations Nigeria Limited Italy Construction .. 800Siemens Ltd Germany Wholesale trade .. 700Nigerian Westminster Dredging & Marine Ltd Netherlands Construction .. 410Globestar Engineering Company Nigeria Ltd Luxembourg Construction .. 400Ppc Limited Netherlands Research and development .. 330Sgs Inspection Service Nigeria Ltd Switzerland Other business activities .. 321Michelin (Nigeria) Ltd France Rubber and plastic products .. 300Swiss Nigerian Chemical Company Ltd Switzerland Public administration .. 290Dizengoff West Africa (Nigeria) Ltd United Kingdom Wholesale trade .. 263Embassy Of The United States Of America United States Public administration .. 250Araromi Rubber Estates Ltd France Forestry and fishing .. 200Abb Ng Ltd Switzerland Other business activities .. 180
C. Finance and insurance Assets Employees
First Stockbrokers Ltd India Finance .. 8Soji Commodities WA Ltd United Kingdom Finance .. ..
Source: Who Owns Whom database (https://solutions.dnb.com/wow), retrieved January 2008.

Nigeria
515
C. Legal frameworks for transnational corporations
In Nigeria, a number of legal instruments, national, bilateral and multilateral are geared toward regulating the activities of transnational corporations and foreign direct investors. In the country, the following key instruments are applicable:
I. National framework
Petroleum Profits Tax Ordinance No. 15 of 1959, effective: 1 January 1958. Source: International Center for Settlement of Investment Disputes, Release 2, issued October 1981, p. 151 (OS).
Trade Marks Act No. 29 of 1965, in force since June 1967. Source: WIPO (http://www.wipo.org).
Petroleum Profits Tax (Amendment) Decree No. t of 5 January 1967, effective: 5 January 1967. Source: International Center for Settlement of Investment Disputes, Release 2, issued October 1981, p. 189 (OS).
Trade Marks Act of 1965 (Commencement) Order, L.N. 60 of 1967. Source: WIPO (http://www.wipo.org).
Trade Marks Regulations of 1967, L.N. 70 of 1967. Source: WIPO (http://www.wipo.org).
Industrial Designs: Patents and Designs Decree No. 60 of 1970. Source: WIPO (http://www.wipo.org).
Patents: Patents and Designs Decree No. 60 of 1970, (F) IP 1973, 147; PI 1973, 151. Source: WIPO (http://www.wipo.org).
Patents and Designs (Convention Countries) Order of 1971, L.N. 95 of 1971. Source: WIPO (http://www.wipo.org).
Industrial Development (Income Tax Relief) Decree No. 22 of 3 May 1971, effective: 1 April 1970. Source: International Center for Settlement of Investment Disputes, Release 2, issued October 1981, p. 71 (OS).
Patents and Designs (Additional Transitional and Saving Provisions) Order of 1972, L.N. 74 of 1972 (F) IP 1973, 158; PI 1973, 163. Source: WIPO (http://www.wipo.org).
Industrial Development (Income Tax Relief) (Amendment) Decree No. 42 of 31 October 1972, effective: 31 October 1972.
Petroleum Profit Tax (Amendment) Decree No. 15 of 13 April 1973, effective: 20 March 1971. Source: International Center for Settlement of Investment Disputes, Release 2, issued October 1981, p. 193 (OS).
Nigerian Tourist Board Decree No. 54 of 8 November 1976, effective: upon notification in the Gazette. Source: International Center for Settlement of Investment Disputes, Release 2, issued October 1989, p. 213 (OS).
World Investment Directory Volume X Africa 2008
516
Petroleum Profit Tax (Amendment') Decree No. 55 of 28 July 1977, effective: l October 1974, resp. I December 1974, resp. I April 1975 (percentage of assessable tax for accounting period) (OS). Source: International Center for Settlement of Investment Disputes, Release 2, issued October 1981, p. 199 (OS).
Petroleum Protit 'Fax (Amendment) Decree No. 4 of 9 February 1979, effective: 1 April 1975. Source: International Center for Settlement of Investment Disputes, Release 2, issued October 1981, p. 201 (OS)
Companies Income Tax Decree No. 28 of 12 July 1979, effective: I April 1977. Source: International Center for Settlement of Investment Disputes, Release 2, issued October 1981, p. 91 (OS).
Petroleum Profit Tax (Amendment) No. 2 Decree No. 24 of 26 June 1979, effective: 1 April 1977. Source: International Center for Settlement of Investment Disputes, Release 2, issued October 1981, p. 203 (OS).
Industrial Promotion Decree No. 40 of 3 August 1979, effective: 3 August 1979. Source: Federal Republic of Nigeria, Official Gazette No. 37, vol. 66 of 9 August 1979, part A, p. 325 (OS), and International Center for Settlement of Investment Disputes, Release 2, issued October 1981, p. 65 (os).
National Office of Industrial Property Decree No. 70, September 1979 Sections 1 to 9: (F) IP/PI, January 1981. Source: WIPO (http://www.wipo.org).
Petroleum Profits Tax (Amendment No. 3) Decree No. 95 of-2 8 September 1979, effective: 1 April 1977 (sec. 3, 4,5); 1 January 1978. Source: International Center for Settlement of Investment Disputes, Release 2, issued October 1981, p. 207 (Other sections).
Guidelines on the granting of business permits and expatriate quota to companies and other organizations. Source: Business Department, Federal Ministry of Internal Affairs, Federal Secretariat Complex, Lagos, January 1985 (OS).
Export (Incentives and Miscellaneous Provisions) Decree No. 18 of l I July 1986, effective: I 1 July 1986. Source: Supplement to Official Gazette No. 36, vol. 73 of 24 july 1986, p. A105 (OS).
Decree No. 25 on Privatisation and Commercialization of 5 July 1988. Source: World Bank, Technical Paper No. 186. "Divestiture of State Enterprises". An overview of the legal framework.
Copyright Decree No. 47, December 1988 (Codified as chapter 68, Laws of the Federation of Nigeria, 1990). Source: WIPO (http://www.wipo.org).
Decree No. 54 of 30 December 1989 entitled "Nigerian Enterprises Promotion Decree 1989". Repeals Nigerian Enterprises Promotion Decree 1977 and Nigerian Enterprises Promotion (Amendment) Decree No. 27 of 5 July 1976. Source: Official Gazette No. 76 of 31 December 1989. Repealed by Nigerian Enterprises Promotion.
Decree Repeal of December 1994; effective on 1 January 1995. Sources: Official Gazette No. I of January 1995. Also in International Bureau of Fiscal Documentation ATS, supplement No. 94, March 1995.

Nigeria
517
Companies and Allied Matters Decree 1990. Repeals Companies Act of 1968 and Companies (Special Provisions) Decree No. 19 of 13 April 1973. Source: Official Gazette No. 2 of 9 January 1990.
Nigeria Export Processing Zones Decree 1991. Source: International Bureau of Fiscal Documentation ATS, Suppl. No. 94, March 1995.
Copyright (Amendment) Decree No. 98, December 1992. Source: WIPO (http://www.wipo.org).
Nigerian Investment Promotion Commission Decree 1995. Decree No. 16 of 15 July 1995; entered into force on 16 July 1995. Repeals the Industrial Development Co-ordination Commitee Decree No. 36 of 1989. Source: Supplement to the Official Gazette of the Federal Republic of Nigeria-Extraordinary No. 14, vol. 82 of 21st July 1995.
Foreign Exchange (Monitoring and Miscellaneous Provisions) Decree 1995. Decree No. 17 of 15 July 1995; entered into force on 16 July 1995. Repeals Decree No. 7 of 1984, Decree No. 18 of 1985 and Decree No. 23 of 1986. Modifies Cap. 35 of Bill of Exchange Act, Central Bank of Nigeria Decree 1991 and the Banks and Other Financial Institutions Decree 1991. Source: Supplement to the Official Gazette of the Federal Republic of Nigeria-Extraordinary No. 14, vol. 82 of 21st July 1995.
Petroleum (Amendment) Decree 23 of 1996. Source: Laws of the Federation of Nigeria (http://www.nigeria-law.org).
Finance (Miscellaneous Taxation Provisions) Decree No. 30 1996. Source: Laws of the Federation of Nigeria (http://www.nigeria-law.org).
Finance (Miscellaneous Taxation Provisions) (No. 2) Decree No. 31 1996. Source: Laws of the Federation of Nigeria (http://www.nigeria-law.org).
Finance (Miscellaneous Taxation Provisions) (No. 3) Decree No. 32 1996. Source: Laws of the Federation of Nigeria (http://www.nigeria-law.org).
Minerals and Mining Decree No 34 of 1999. Source: Laws of the Federation of Nigeria (http://www.nigeria-law.org).
Investments and Securities Decree No 45 of 1999. Source: Laws of the Federation of Nigeria (http://www.nigeria-law.org).
Trade Disputes (Essential Services Deregulation, Proscription and Prohibition from Participation in Trade Union Activities) (Repeal) Decree 12. Source: Laws of the Federation of Nigeria (http://www.nigeria-law.org).
Finance (Miscellaneous Taxation Provisions) decree No. 18 1998. Source: Laws of the Federation of Nigeria (http://www.nigeria-law.org).
Finance (Miscellaneous Taxation Provisions) (No. 2) Decree No. 19 1998. Source: Laws of the Federation of Nigeria (http://www.nigeria-law.org).
Customs, Excise Tariff, etc. (Consolidation) (Amendment) Decree 20 of 1998. Source: Laws of the Federation of Nigeria (http://www.nigeria-law.org).

World Investment Directory Volume X Africa 2008
518
Taxes and Levies (Approved list for collection) Decree 21 of 1998. Source: Laws of the Federation of Nigeria (http://www.nigeria-law.org).
Petroleum (Amendment) Decree 22 of 1998. Source: Laws of the Federation of Nigeria (http://www.nigeria-law.org).
Petroleum Control (Repeal) Decree 23 of 1998. Source: Laws of the Federation of Nigeria (http://www.nigeria-law.org).
Nigerian Mining Corporation (Amendment) Decree 25 of 1998. Source: Laws of the Federation of Nigeria (http://www.nigeria-law.org).
Nigerian Coal Corporation (Amendment) Decree 26 of 1998. Source: Laws of the Federation of Nigeria (http://www.nigeria-law.org).
National Steel Raw Materials Exploration Agency (Amendment) Decree 27 of 1998. Source: Laws of the Federation of Nigeria (http://www.nigeria-law.org).
Electricity (Amendment) Decree 28 of 1998. Source: Laws of the Federation of Nigeria (http://www.nigeria-law.org).
Wireless Telegraphy (Amendment) Decree 31 of 1998. Source: Laws of the Federation of Nigeria (http://www.nigeria-law.org).
Nigerian Investment Promotion Commission (Amendment) Decree 32 of 1998. Source: Laws of the Federation of Nigeria (http://www.nigeria-law.org).
Central Bank of Nigeria (Amendment) Decree 37 of 1998. Source: Laws of the Federation of Nigeria (http://www.nigeria-law.org).
Banks and other Financial Institutions (Amendment) Decree 38 of 1998. Source: Laws of the Federation of Nigeria (http://www.nigeria-law.org).
Banks and Other Financial Institutions (Amendment) Decree 40 of 1998. Source: Laws of the Federation of Nigeria (http://www.nigeria-law.org).
Central Bank of Nigeria (Amendment) Decree 41 of 1998. Source: Laws of the Federation of Nigeria (http://www.nigeria-law.org).
Copyright (Amendment) Decree No. 42, May 1999. Source: WIPO (http://www.wipo.org).
Guidelines for Management of External Reserves Through Partnership Arrangement Between Local and Foreign Banks, June 2006. Source: www.viewswire.com Nigeria regulations Aug 23rd 2006.
Liberalisation of the Foreign Exchange System, Feb 2006. Source: www.viewswire.com Nigeria regulations May 24th 2006

Nigeria
519
II. International Framework
A. Nigeria is a party to the following multilateral and regional instruments:
Convention on the Recognition and Enforcement of Foreign Arbitral Awards of 1958, which entered into force on 7th June 1959.
Convention on the Settlement of Investment Disputes between States and Nationals of other States of 1965. Entered into force on 14 October 1966.
Agreement for the Promotion, Protection and Guarantee of Investment Among Member States of the Organization of Islamic Conference of 1 June 1981; entered into force on 23 September 1986.
Convention Establishing the Multilateral Investment Guarantee Agency of 1985, entered into force on 12 April 1988.
Articles of Agreement of the Islamic Corporation for the Insurance of Investment Export Credit of 19 February 1992; entered into force on I August 1994.
Revised Treaty of the Economic Community of West African States (ECOWAS) 1993.
Paris Convention for the Protection of Industrial Property of 1883 (Revised at Brussels in 1900, Washington in 1911, The Hague in 1925, London in 1934, Lisbon in 1958 and Stockholm in 1967, and as amended in 1979). Signed in 1994.
Marrakesh Agreement Establishing the World Trade Organisation of 15 April 1994. Entered into force on 1 January 1995. Agreement on Trade-Related Investment Measures. General Agreement on Trade in Services. Agreement on Trade Related Aspects of Intellectual Property Rights.
B. Bilateral treaties
1. Bilateral investment treaties for the protection and promotion of investments: France 1990, Italy 1990, United Kingdom 1990, Netherlands 1992, Taiwan Province of China 1994, Turkey 1996, Bulgaria 1998, Romania 1998, Korea, Republic of 1998, Egypt 2000, Germany 2000, China 2001, Switzerland 2001, Jamaica 2002, Serbia and Montenegro 2002, Spain 2002, Sweden 2002, Uganda 2003, Finland 2005.
2. Bilateral treaties for the avoidance of double taxation: Denmark 1954, Norway 1955, United Kingdom 1987, Belgium 1989, Czech Republic 1989, Pakistan 1989, Slovakia 1989, France 1990, Netherlands 1991, Canada 1992, Romania 1992, Philippines 1997, Poland 1999, Sweden 2004, Korea, Republic of 2006.
C. Other treaties:
Agreement with the government of the United States of America concerning the development of trade and investment relations (2000).

World Investment Directory Volume X Africa 2008
520
D. Sources of information
Official
Central Bank of Nigeria (www.cenbank.org).
Nigerian Investment Promotion Commission (www.nipc-nigeria.org).
Secondary
African Development Bank (1998). African Development Report 1998 (Oxford: Oxford University Press).
Albaladejo, Manuel (2003). Industrial realities in Nigeria: from bad to worse (London: Queen Elizabeth House).
Bala, Julius (2003). "The challenge and opportunities of the investment environment in Nigeria", paper presented at the international meeting for promotion of investment to Africa; organized by the Ministry of foreign affairs of Japan, February 26.
Bennell, Paul (1997a). "Foreign direct investment in Africa: rhetoric and reality", SAIS Review (Summer/Fall); pp. 127-139.
____________(1997b). "Privatization in Sub-Saharan Africa: progress and prospects during the 1990s", World Development, vol. 25, no. 11, pp. 1785-1803.
Boocock, Colin N. (2002). Lesson from FDI in mining in Sub-Saharan Africa (Paris: OECD), February.
Central Bank of Nigeria (CBN) (2001). Annual Report and Statement of Accounts 2001 (Abuja: CBN).
Economist Intelligence Unit (EIU) (various years). Country Profile: Nigeria (London: EIU Ltd.).
____________(various years). Country Report: Nigeria (London: EIU Ltd.).
International Monetary Fund (IMF) (2001/2002). Staff Country Report, Nigeria: Statistical Appendix,
August 2001 and 2002 Article IV Consultation (Washington D.C: IMF).
____________(2006). IMF's Sub-Saharan Africa Regional Economic Outlook, March 10, 2006. (Washington D.C.: IMF).
International Finance Corporation (IFC) (1997). Foreign direct investment, IFC: lessons of experience series
No. 5 (Washington, D.C.: World Bank).
Ogunleye, Eric Kehinde (2008) "Exchange rate volatility and foreign direct investment inflows in selected Sub-Saharan African Countries" (PhD Thesis, University of Ibadan).
Pigato, Miria (1999). "Foreign direct investment in Africa: old tales and new evidence" (Washington D.C.: World Bank) Mimeo.
Rashid, Faruqee (1994). Nigeria: Ownership Abandoned, Adjustment in Africa: Lessons from Country Case
Studies (Washington D.C.: World Bank), March.
Ruffer, Tim, S. Jones and S. Akroyd (2002). "Development Box Proposals and Their Potential Effect on Developing Countries." Mimeo, (London: U.K. Department for International Development).
Soderbom, M. and F. Teal (2004). "Size and Efficiency in Africa Manufacturing firms: Evidence from Firm-Level Panel Data." Journal of Development Economics, 73. pp 369 - 394.

Nigeria
521
United Nations Conference on Trade and Development (UNCTAD), "Foreign Direct Investment in Africa", 1995; (Geneva: United Nations, Sales No. E.95.II.A.6).
______________(2000). Capital Flows and Growth in Africa (Geneva: UNCTAD/GDS/MDPB/7), July.
______________(2005a). Investor-Disputes Arising from Investment Treaties: A Review. UNCTAD Series of International Investment Policies for Development (UNCTAD/ITE/IIT/2005/4).
______________(2005b). A Survey of Support by Investment Promotion Agencies to Linkages. Advisory Studies No. 18 (UNCTAD/ITE/IPC/2005/12).
United States Trade Representative (2006). 2006 Comprehensive Report on U.S. Trade and Investment
Policy Toward Sub-Saharan Africa and Implementation of the Africa Growth and Opportunity Act: The Sixth of Eight Annual Reports, May 2006. (Washington D.C.: US Government).
World Bank (2002). Global Economic Prospects and the Developing Countries 2003: Investing to Unlock
Opportunities (Washington D.C.: World Bank).
World Bank/International Finance Corporation (2007). Doing Business 2008 Nigeria (Washington D.C.: The World Bank Group).
World Economic Forum (2000/2001). Africa competitiveness report (New York: Oxford University Press).


Rwanda
523
Rwanda
A. Definitions and sources of data
The Rwanda National Assembly approved an investment code in 1998 (Law No. 14/98 of 18/12/1998) that defines all foreign investment in the country, including foreign direct investment (FDI). In this code, foreign investment is defined as any investment by a non-national with a minimum in fixed assets of $100,000. FDI data were collected by the National Bank of Rwanda. The International Monetary Fund also provides data on FDI in Rwanda in its balance-of-payments statistics.
The Government of Rwanda pursues a liberal economic policy. The balance of natural resource reserves includes cassiterite, columbo-tantalite (coltan), wolfram, gold and sapphires which are mined in small quantities. Cassiterite is the largest mineral deposit. Rwanda also has considerable tourist potential. The country’s main attractions are the North-western Birunga volcanoes and wildlife. The forests in the South-west of the country are suitable for hiking and bird watching. Lake Kivu is equally a main tourist destination, particularly the beautiful lakeside town of Kibuye. Rwanda produces fine highland Arabica coffee and tea. Kigali has several good quality hotels.
Rwanda signed to the Convention on the Settlement of Investment Disputes between State and Nationals of other States on 21 April 1978 and is active in the regional integration schemes in Africa. It is host to the sub-regional development center of the Economic Commission for Africa. Rwanda is also eligible for some trade and investment initiatives, including under the African Union, New Partnership for Africa's Development, the Community Investment Code of the Economic Community of the Great Lakes Countries, the Cotonou Agreement for renegotiating the trade partnership treaty between the African, Caribbean and Pacific countries with the European Union, the Economic Community of Central African States, and the Common Market for Eastern and Southern Africa. The country belongs to multilateral agreements including the Convention establishing the Multilateral Investment Guarantee Agency, the Paris Convention for protecting Industrial Property and the World Trade Organization.

World Investment Directory Volume X Africa 2008
524
B. Statistics on FDI and the operations of TNCs
Table 1. Summary of FDI (Millions of dollars)
Variable Inward Outward
1. FDI flows, 2003-2006 (annual average) 9.5 -
2. FDI flows as a percentage of GFCF, 2003-2006 (annual average) 2.3 -
3. FDI stocks, 2006 297 3
4. FDI stocks as a percentage of GDP, 2006 12.4 0.1
Source: Based on tables 3 and 4 and UNCTAD, FDI/TNC database.
Table 3. FDI flows, by type of investment, 1980-2006 (Millions of dollars)
Inward investment Outward investment
Reinvested Reinvested Year Equity earnings Other Total Equity earnings Other Total
1980 6.3 8.7 2.7 16.4 - - - -1981 2.0 9.1 8.2 18.0 - - - -1982 0.7 9.0 11.0 20.7 - - - -1983 1.1 7.6 2.2 11.1 - - - -1984 2.7 6.8 5.6 15.1 - - - -1985 1.1 6.7 6.8 14.6 - - - 0.01986 1.9 8.0 7.7 17.6 - - - 0.51987 2.4 8.5 6.7 17.6 - - - - 0.01988 3.8 8.8 8.5 21.1 - - - 1.31989 0.6 7.6 7.3 15.5 - - - 0.31990 0.2 5.4 1.9 7.7 - - - 0.01991 0.0 3.6 0.9 4.6 - - - - 0.21992 - - 2.2 5.5 - - - - 0.21993 - - 5.9 5.8 - - - 0.01994 - - .. 0.0 - - - - 0.51995 - - 2.2 2.0 - - - - 0.21996 - - 2.2 2.2 - - - 1.31997 - - - 2.6 - - - 1.11998 - - - 7.1 - - - -1999 - - - 1.7 - - - -2000 - - - 8.1 - - - -2001 16.2 1.9 0.5 18.5 - - - -2002 1.3 0.2 - 1.5 - - - -2003 1.8 0.8 - 2.6 - - - -2004 7.9 3.0 - 10.9 - - - -2005 9.2 5.1 - 14.3 - - - -2006 7.6 7.8 0.1 15.5 - - - -
Source: UNCTAD, FDI/TNC database (www.unctad.org/statistics). Notes: Inflows are based on information from the IMF for 1980-1989 and the Banque Nationale du Rwanda thereafter. 2001-2006 data are according to the survey conducted by the National Bank of Rwanda (NBR) and Rwanda Investment and Export Promotion Agency (RIEPA) in April 2007. Outflow data are proxy data based on investments reported by the following economies: Belgium and Luxembourg for 1985-1992 and 1994-1997 and Belgium and Luxembourg and France for 1993.

Rwanda
525
Table 4. FDI stocks, by type of investment, 1980-2006
(Millions of dollars)
Inward investment Outward investment
Equity & Equity &
Reinvested Reinvested Reinvested Reinvested
Year earnings earnings Other Total earnings earnings Other Total
1980 .. .. .. 54.0 .. .. .. ..
1981 .. .. .. 72.0 .. .. .. ..
1982 .. .. .. 92.7 .. .. .. ..
1983 .. .. .. 103.8 .. .. .. ..
1984 .. .. .. 118.9 .. .. .. ..
1985 .. .. .. 133.5 .. .. .. 0.0
1986 .. .. .. 151.1 .. .. .. 0.5
1987 .. .. .. 168.6 .. .. .. 0.5
1988 .. .. .. 189.7 .. .. .. 1.8
1989 .. .. .. 205.2 .. .. .. 2.0
1990 .. .. .. 212.9 .. .. .. 2.0
1991 .. .. .. 217.5 .. .. .. 1.8
1992 .. .. .. 223.0 .. .. .. 1.6
1993 .. .. .. 228.8 .. .. .. 1.7
1994 .. .. .. 228.8 .. .. .. 1.2
1995 .. .. .. 230.8 .. .. .. 0.9
1996 .. .. .. 233.0 .. .. .. 2.2
1997 .. .. .. 235.6 .. .. .. 3.4
1998 .. .. .. 242.7 .. .. .. 3.4
1999 .. .. .. 244.4 .. .. .. 3.4
2000 .. .. .. 252.5 .. .. .. 3.4
2001 .. .. .. 271.1 .. .. .. 3.4
2002 .. .. .. 272.6 .. .. .. 3.4
2003 .. .. .. 275.2 .. .. .. 3.4
2004 .. .. .. 286.1 .. .. .. 3.4
2005 .. .. .. 300.4 .. .. .. 3.4
2006 .. .. .. 315.9 .. .. .. 3.4
Source: UNCTAD, FDI/TNC database (www.unctad.org/statistics). Notes: Data on inward stock are estimated by accumulating inflows since 1970. Data on outward stock are estimated by accumulating inflows since 1985.

World Investment Directory Volume X Africa 2008
526
Table 6. FDI flows in the host economy, by geographical origin, 1995-2006 (Millions of dollars)
Reporting countries 1995 1996 1997 1998 1999 2000 2001 2002 2003 2004 2005 2006
Belgium/Luxembourg 2.7 - - - - 0.9 0.9 - - - - -
China - - - - - - - - - - 1.4 -
Germany - 0.7 0.6 - - - - - 2.3 1.2 - 1.2 -
Source: UNCTAD. FDI / TNC database. Note: Data is based on the information reported by the economies listed above.
Table 9. FDI flows abroad, by geographical destination, 1995-2006
(Millions of dollars)
Reporting country 1995 1996 1997 1998 1999 2000 2001 2002 2003 2004 2005 2006
Belgium/Luxembourg - 1.3 1.1 - - - - - - - - -
Source: UNCTAD. FDI / TNC database.Note: Data is based on the information reported by Belgium/Luxembourg.
Table 12. FDI stocks in the host economy, by geographical origin, 1995-2006 (Millions of dollars)
Reporting country 1995 1996 1997 1998 1999 2000 2001 2002 2003 2004 2005 2006
China - - - - - - - - 3.3 3.3 4.7 -
Source: UNCTAD. FDI / TNC database. Note: Data is based on the information reported by China.
Table 15. FDI stocks abroad, by geographical destination, 1995-2006
(Millions of dollars)
Reporting country 1995 1996 1997 1998 1999 2000 2001 2002 2003 2004 2005 2006
Estonia - - - - - - - - 0.002 0.002 - -
Source: UNCTAD. FDI / TNC database.Note: Data is based on the information reported by Estonia.
Tables 30, 45 and 50. Assets, sales and value added of foreign affiliates of United States' TNCs in Rwanda, 1995-2006
(Number and millions of dollars) Table no./Variable 1995 1996 1997 1998 1999 2000 2001 2002 2003 2004 2005 2006
30. Assets .. .. .. .. .. .. .. .. .. 1 .. ..
45. Sales .. .. .. .. .. .. .. .. .. 3 .. ..
50. Value added a .. .. .. .. .. .. .. .. .. 1 .. .. Source: UNCTAD, FDI/TNC database. Note: Data are based on information reported by the United States. a Data refer to majority-owned affiliates only.
Table 35. Employment of foreign affiliates of Belgian TNCs in Rwanda, 1995-2006
(Thousands of employees) Economy 1995 1996 1997 1998 1999 2000 2001 2002 2003 2004 2005 2006
Belgium .. .. .. .. .. .. 0.8 0.4 0.4 .. .. .. Source: UNCTAD, FDI/TNC database. Note: Data are based on information reported by Belgium.

Rwanda
527
Table 88. Largest affiliates of foreign TNCs in the host economy, 2007
(Millions of dollars and number) Company Name Home economy Industry Sales Employees
A. Industrial
Brasseries Et Limonaderies Du Rwanda SA Switzerland Food, beverages and tobacco 34.4 539
Rwandex Sa Switzerland Food, beverages and tobacco .. ..
B. Tertiary
Arab Contractors (Rewanda) Ltd Egypt Construction .. 45
Maersk Rwanda Limited Denmark Public administration .. ..
C. Finace and Insurance Assets Employees
.. .. .. .. ..
Source: Who Owns Whom database (https://solutions.dnb.com/wow), retrieved January 2008.

World Investment Directory Volume X Africa 2008
528
C. Legal frameworks for transnational corporations
In the effort to improve the effectiveness of regulation of transnational corporations and foreign investment in the country, the government of Rwanda had adopted the following national, bilateral and multilateral legal instruments.
I. National framework
Patents: Loi de février 1963, relative aux brevets. Arrêté ministériel no 5/10/67 de mai 1967 portant mesures d’exécution de la Loi du 25 février 1963 sur les brevets.Source: WIPO (http://www.wipo.org).
Trade Marks: Loi de février 1963 relative aux marques de fabrique et de commerce. Arrêté ministériel no 10/63 de mai 1963 portant mesures d’exécution de la Loi du 25 février 1963 sur les marques de fabrique et de commerce. Arrêté ministériel no 3/10/67 de mai 1967 portant mesures d’exécution de la Loi de février 1963 sur les marques de fabrique et de commerce. Source: WIPO (http://www.wipo.org).
Industrial Designs: Loi de février 1963 sur les dessins et modèles industriels. Arrêté ministériel no 4/10/67 de mai 1967 portant mesures d’exécution de la Loi de février 1963 sur les dessins et modèles industriels. Source: WIPO (http://www.wipo.org).
Copyright: Loi no 27/1983 de novembre 1983 régissant le droit d’auteur. Source: WIPO (http://www.wipo.org).
Investment Law. Law 21/1987 of 5 August 1987, as amended by Law No. 07/90 of 31 January 1990. Source: Official Journal of the Republic of Rwanda, No. 3, 1 February 1990.
The Rwandan Investment Code (Law No. 14/98 of 18/12/1998), December 1998. Source: US Mission to Rwanda (http://www.usembkigali.net/rwanda/investment_climate.htm).
II. International Framework
A. Rwanda is a party to the following multilateral and regional instruments:
Convention on the Settlement of Investment Disputes between States and Nationals of other States of 1965. Entered into force on 14 October 1966.
Community Investment Code of the Economic Community of the Great Lakes Countries of 31 January 1982; entered into force on: 4 October 1987.
Treaty for the Establishment of the Economic Community of Central African States of 18 October 1983; entered into force in December 1984.
Convention Establishing the Multilateral Investment Guarantee Agency of 1985, entered into force on 12 April 1988.

Rwanda
529
Fourth ACP - EEC Convention (Lome IV) of 1989, entered into force on 1st March 1990.
Charter on a Regime of Multinational Industrial Enterprises (MIEs) in the Preferential Trade Area for Eastern and Southern African States (PTA), signed on 21 November 1990, entered into force August 1995. Source: Preferential Trade Area for Eastern ans Southern African States: Report of the Sixteenth Meeting of the Council of Ministers, 17-19 november, 1990, Mbabane, Swaziland (PTA/CM/XVI/2)
Southern Africa Development Community (SADC), signed on 17 August, 1992.Source: http://www.sadc.int/about_sadc/history.php.
Paris Convention for the Protection of Industrial Property of 1883 (Revised at Brussels in 1900, Washington in 1911, The Hague in 1925, London in 1934, Lisbon in 1958 and Stockholm in 1967, and as amended in 1979). Signed in 1994.
Marrakesh Agreement Establishing the World Trade Organisation of 15 April 1994. Entered into force on 1 January 1995. Agreement on Trade-Related Investment Measures. General Agreement on Trade in Services. Agreement on Trade Related Aspects of Intellectual Property Rights.
Treaty for the Establishment of the East African Community, 30 November 1999.
Partnership Agreement between the Members of The African, Caribbean and Pacific Group of States, of the one part and the European Community and its member states, of the other part signed in Cotonou, Benin on 23 June 2000.
B. Bilateral treaties
1. Bilateral investment treaties for the protection and promotion of investments: Switzerland 1963, Germany 1967, Belgium / Luxembourg 1983.
2. Bilateral treaties for the avoidance of double taxation: …
C. Other treaties:
Trade and investment framework agreement with the United States of America (2006).
Investment agreement for the COMESA Common Investment Area (2007).

World Investment Directory Volume X Africa 2008
530
D. Sources of information
Official
National Bank of Rwanda (www.bct.gov.tn).
Secondary
Bennell, Paul (1997). "Foreign direct investment in Africa: rhetoric and reality", SAIS Review (Summer/Fall), pp. 127-139.
Bennell, Paul (1997). "Privatization in Sub-Saharan Africa: progress and prospects during the 1990s", World
Development, vol. 25, no. 11, pp. 1785-1803.
Broll, U. (2003). "Foreign direct investment, credible policy: the role of risk sharing". International trade
journal, vol. XVII, No. 2., pp. 165 – 176.
Economist Intelligence Unit (EIU) (various years).Country Profile: Rwanda (London: EIU Ltd.).
______________(various years).Country Report: Rwanda (London: EIU Ltd.).
International Finance Corporation (IFC) (1997). Foreign direct investment, IFC: lessons of experience series No. 5 (Washington D.C.: World Bank).
International Monetary Fund (IMF) (2006). IMF's Sub-Saharan Africa Regional Economic Outlook, March 10, 2006. (Washington D.C.: IMF).
Kirby, Robin (2003). Foreign exchange controls: foreign exchange management, pp. 23 – 27; FIAS: South Asia FDI Roundtable (Washington D.C.: FIAS) (http://www.fias.net/Conferences/030403%20Kirby.pdf).
Soderbom, M. and F. Teal (2004). "Size and Efficiency in Africa Manufacturing firms: Evidence from Firm-Level Panel Data." Journal of Development Economics, 73. pp 369 - 394.
United Nations Conference on Trade and Development (UNCTAD) (1995). Foreign Direct Investment in
Africa (Geneva: United Nations, United Nations publication, Sales No. E.95.II.A.6).
______________(2000). Capital Flows and Growth in Africa (Geneva: UNCTAD/GDS/MDPB/7).
______________(2003). FDI in Landlocked Developing Countries at a Glance (Geneva: UNCTAD/ITE/IIA/2003/5).
_____________ (2005a). Investor-Disputes Arising from Investment Treaties: A Review. UNCTAD Series of International Investment Policies for Development (UNCTAD/ITE/IIT/2005/4).
______________(2005b). A Survey of Support by Investment Promotion Agencies to Linkages. Advisory Studies No. 18 (UNCTAD/ITE/IPC/2005/12).
______________(2005c). FDI in least developed countries at a glance: 2005/2006
(UNCTAD/ITE/IIA/2005/17).
United States Trade Representative (2006). 2006 Comprehensive Report on U.S. Trade and Investment Policy Toward sub-Saharan Africa and Implementation of the Africa Growth and Opportunity Act:
The Sixth of Eight Annual Reports, May 2006. (Washington D.C.: US Government).
World Bank (2002). Global Economic Prospects and the Developing Countries 2003: Investing to Unlock
Opportunities (Washington D.C.: World Bank).
World Bank/International Finance Corporation (2007). Doing Business 2008 Rwanda (Washington D.C.: The World Bank Group).

São Tomé and Principe
531
São Tomé and Principe
A. Definitions and sources of data
The Investment Code of São Tomé and Principe (Lei no. 13/92) of 1995 does not contain a specific definition of foreign direct investment (FDI). The Government of São Tomé and Principe does not provide data on FDI. Data on the annual FDI were mainly from the International Monetary Fund (IMF) and the Organization for Economic Co-operation and Development.
The prospect of oil resources being developed has greatly increased western strategic interest in São Tomé and Principe, particularly from the United States. São Tomé and Principe in the Gulf of Guinea is considered as an attractive location to the Middle East for United States companies. After independence, São Tomé and Principe developed close links with several countries, particularly Cuba, Germany, China and Angola. As the former colonial power, Portugal has an influence, while France and Brazil have also become important partners. The decision to recognize Taiwan Province of China in 1997 has resulted in significant FDI inflows.
São Tomé and Principe signed to the Convention on the Settlement of Investment Disputes between State and Nationals of other States on 1 October 1999 and is a member of the African Union, New Partnership for Africa's Development, the Cotonou Agreement for renegotiating the African, Caribbean and Pacific trade links with the European Union and was a founding member of the Communaute Economique des Etats de l'Afrique Centrale, in 1983. It is also a member the community of Francophone countries and Organization de la Francophonie. Given the size of the country, international representation on the islands is limited. Portugal, France, Nigeria, Angola, Cape Verde and Gabon maintain Diplomatic representation in São Tomé and Principe. Of the United Nations' agencies, only the United Nation Development Programme and World Health Organization have full representation. The main offices for other United Nations' agencies, IMF and World Bank responsible for São Tomé are in Gabon or Angola. São Tomé and Principe has an observer status at the World Trade Organization.

World Investment Directory Volume X Africa 2008
532
B. Statistics on FDI and the operations of TNCs
Table 1. Summary of FDI
(Millions of dollars)
Variable Inward Outward
1. FDI flows, 2003-2006 (annual average) - 0.4 -
2. FDI flows as a percentage of GFCF, 2003-2006 (annual average) - 1.9 -
3. FDI stocks, 2006 16 -
4. FDI stocks as a percentage of GDP, 2006 20.6 -
Source: Based on tables 3 and 4 and UNCTAD, FDI/TNC database.
Table 3. FDI flows, by type of investment, 1987-2006
(Millions of dollars)
Inward investment Outward investment
Reinvested Reinvested
Year Equity earnings Other Total Equity earnings Other Total
1987 .. .. .. 0.2 .. .. .. -1988 .. .. .. 0.2 .. .. .. -1989 .. .. .. - 0.1 .. .. .. -1990 .. .. .. - .. .. .. -1991 .. .. .. - .. .. .. -1992 .. .. .. - .. .. .. -1993 .. .. .. - 0.5 .. .. .. -1994 .. .. .. - .. .. .. -1995 .. .. .. 0.0 .. .. .. -1996 .. .. .. 0.3 .. .. .. -1997 .. .. .. 0.1 .. .. .. -1998 4.2 .. .. 4.2 .. .. .. -1999 3.0 .. .. 3.0 .. .. .. -2000 3.8 .. .. 3.8 .. .. .. -2001 3.5 .. .. 3.5 .. .. .. -2002 3.0 .. .. 3.0 .. .. .. -2003 .. .. .. 0.9 .. .. .. -2004 .. .. .. - 1.6 .. .. .. -2005 - - - - 0.6 - - - -2006 - - - - 0.4 - - - -
Source: UNCTAD, FDI/TNC database (www.unctad.org/statistics). Data are based on OECD for 1987, 1989, 1993, 1995-1997 and 2003-2005, IMF on the basis of net direct investment for 1988, IMF for 1998-2002, and estimate for 2006.

São Tomé and Principe
533
Table 4. FDI stocks, by type of investment, 1980-2006
(Millions of dollars)
Inward investment Outward investment
Reinvested Reinvested
Year Equity earnings Other Total Equity earnings Other Total
1980 .. .. .. .. .. .. .. ..
1981 .. .. .. .. .. .. .. ..
1982 .. .. .. .. .. .. .. ..
1983 .. .. .. .. .. .. .. ..
1984 .. .. .. .. .. .. .. ..
1985 .. .. .. .. .. .. .. ..
1986 .. .. .. .. .. .. .. ..
1987 .. .. .. 0.2 .. .. .. ..
1988 .. .. .. 0.4 .. .. .. ..
1989 .. .. .. 0.4 .. .. .. ..
1990 .. .. .. 0.4 .. .. .. ..
1991 .. .. .. 0.4 .. .. .. ..
1992 .. .. .. 0.4 .. .. .. ..
1993 .. .. .. - 0.1 .. .. .. ..
1994 .. .. .. - 0.1 .. .. .. ..
1995 .. .. .. - 0.1 .. .. .. ..
1996 .. .. .. 0.3 .. .. .. ..
1997 .. .. .. 0.4 .. .. .. ..
1998 .. .. .. 4.6 .. .. .. ..
1999 .. .. .. 7.6 .. .. .. ..
2000 .. .. .. 11.4 .. .. .. ..
2001 .. .. .. 14.9 .. .. .. ..
2002 .. .. .. 18.0 .. .. .. ..
2003 .. .. .. 18.8 .. .. .. ..
2004 .. .. .. 17.3 .. .. .. ..
2005 .. .. .. 16.7 .. .. .. ..
2006 .. .. .. 16.2 .. .. .. ..
Source: UNCTAD, FDI/TNC database (www.unctad.org/statistics).
Note: Data are estimated by accumulating flows since 1987.

World Investment Directory Volume X Africa 2008
534
Table 6. FDI flows in the host economy, by geographical origin, 1996-2006
(Millions of dollars) Reporting countries 1992 1993 1994 1995 1996 1997 1998 1999 2000 2001 2002 2003 2004 2005 2006
Germany - - - - 0.7 - 0.6 - - - - - - - -Portugal - - - - - 1.1 0.6 0.6 0.1 0.7 0.9 0.3 - 2.4 2.7 0.9 0.9
Source: UNCTAD. FDI / TNC database. Note: Data is based on the information reported by the economies listed above.
Table 9. FDI flows abroad, by geographical destination, 1996-2006
(Millions of dollars) Reporting country 1992 1993 1994 1995 1996 1997 1998 1999 2000 2001 2002 2003 2004 2005 2006
Portugal - - - - 0.0 - - - 0.0 0.5 - 0.6 - 0.0 0.2 0.6
Source: UNCTAD. FDI / TNC database.Note: Data is based on the information reported by Portugal.
Table 12. FDI stocks in the host economy, by geographical origin, 1996-2006
(Millions of dollars) Reporting country 1992 1993 1994 1995 1996 1997 1998 1999 2000 2001 2002 2003 2004 2005 2006
Portugal - - - - 2.0 1.4 3.5 3.0 2.8 2.6 6.3 16.4 4.1 - -
Source: UNCTAD. FDI / TNC database.Note: Data is based on the information reported by Portugal.
Table 15. FDI stocks abroad, by geographical destination, 1996-2006
(Millions of dollars) Reporting countries 1992 1993 1994 1995 1996 1997 1998 1999 2000 2001 2002 2003 2004 2005 2006
Czech Republic - - - - - - 10.5 - - - - - - - -Portugal - - - - 0.2 - - - - 0.9 - - - - -
Source: UNCTAD. FDI / TNC database. Note: Data is based on the information reported by the economies listed above.
Tables 23. The numberof affiliates of United States TNCs in São Tomé and Principe, 1996-2006
Reporting country 1992 1993 1994 1995 1996 1997 1998 1999 2000 2001 2002 2003 2004 2005 2006
United States .. .. .. .. .. .. .. .. .. .. .. .. 2 .. ..
Source: UNCTAD, FDI/TNC database.
Note: Data are based on information reported by the United States.

São Tomé and Principe
535
Table 88. Largest affiliates of foreign TNCs in the host economy, 2007
(Millions of dollars and number)
Company Home economy Industry Sales Employees
A. Industrial
.. .. .. .. .. B. Tertiary Companhia Sao Tomense de Telecomunicacoes Portugal Telecommunication 11 89 C. Finance and Insurance Assets Employees
.. .. .. .. ..
Source: Who Owns Whom database (https://solutions.dnb.com/wow), retrieved January 2008.

World Investment Directory Volume X Africa 2008
536
C. Legal frameworks for transnational corporations
In São Tomé and Principe, instruments to regulate the activities of transnational corporations and foreign direct investors include, among others, the following:
I. National framework
II. International Framework
A. São Tomé and Principe is a party to the following multilateral and regional instruments:
Convention on the Recognition and Enforcement of Foreign Arbitral Awards of 1958, which entered into force on 7 June 1959.
Convention on the Settlement of Investment Disputes between States and Nationals of other States of 1965. Entered into force on 14 October 1966
Convention Establishing the Multilateral Investment Guarantee Agency of 1985, entered into force on 12 April 1988.
Fourth ACP - EEC Convention (Lome IV) of 1989, entered into force on 1st March 1990.
Charter on a Regime of Multinational Industrial Enterprises (MIEs) in the Preferential Trade Area for Eastern and Southern African States (PTA), signed on 21 November 1990, entered into force August 1995. Source: Preferential Trade Area for Eastern ans Southern African States: Report of the Sixteenth Meeting of the Council of Ministers, 17-19 november, 1990, Mbabane, Swaziland (PTA/CM/XVI/2)
Southern Africa Development Community (SADC), signed on 17 August, 1992.Source: http://www.sadc.int/about_sadc/history.php.
Treaty Establishing the Market for Eastern and Southern Africa (COMESA), 1993.
Paris Convention for the Protection of Industrial Property of 1883 (Revised at Brussels in 1900, Washington in 1911, The Hague in 1925, London in 1934, Lisbon in 1958 and Stockholm in 1967, and as amended in 1979). Signed in 1994.
Marrakesh Agreement Establishing the World Trade Organisation of 15 April 1994. Entered into force on 1 January 1995. Agreement on Trade-Related Investment Measures. General Agreement on Trade in Services. Agreement on Trade Related Aspects of Intellectual Property Rights.
Treaty for the Establishment of the East African Community, 30 November 1999.
Partnership Agreement between the Members of The African, Caribbean and Pacific Group of States, of the one part and the European Community and its member states, of the other part signed in Cotonou, Benin on 23 June 2000.
B. Bilateral treaties
1. Bilateral investment treaties for the protection and promotion of investments: Portugal 1997.
2. Bilateral treaties for the avoidance of double taxation: ..

São Tomé and Principe
537
D. Sources of information
Official
...
Secondary
African Energy Week (2004). "The definitive gathering for Africa's energy decision makers" (Abuja: Africa Energy).
Economist Intelligence Unit (EIU) (various years). Country Profile: Sao Tome and Principe
(London: EIU Ltd.).
_____________(various years). Country Report: Sao Tome and Principe (London: EIU Ltd.).
Foreign Investment Advisory Service (FIAS) (2000). "Providing advice on FDI in small island economies: the need for a differentiated approach?", FIAS/PREM seminars, 17 October 2000.
International Monetary Fund (IMF) (2006). IMF's Sub-Saharan Africa Regional Economic
Outlook, March 10, 2006. (Washington D.C.: IMF).
The Government of Sao Tome and Principe (2001). "Country presentation: Sao Tome and Principe", presented at the Third United Nations Conference on the Least Developed Countries (Paris: UNCTAD).
United Nations Conference on Trade and Development (UNCTAD) (2002). FDI in Least
Developed Countries at a Glance (Geneva: UNCTAD) (www.unctad.org/en/subsites/dite/LDCs/pdfs/Countries/capeverde.pdf).
_____________(2005a). Investor-Disputes Arising from Investment Treaties: A Review.UNCTAD Series of International Investment Policies for Development (UNCTAD/ITE/IIT/2005/4).
_____________(2005b). A Survey of Support by Investment Promotion Agencies to Linkages.
Advisory Studies No. 18 (UNCTAD/ITE/IPC/2005/12).
_____________(2005c). FDI in least developed countries at a glance: 2005/2006
(UNCTAD/ITE/IIA/2005/17).
United States Trade Representative (2006). 2006 Comprehensive Report on U.S. Trade and
Investment Policy Toward Sub-Saharan Africa and Implementation of the Africa Growth and Opportunity Act: The Sixth of Eight Annual Reports, May 2006. (Washington D.C.: US Government).
World Bank/International Finance Corporation (2007). Doing Business 2008 Sao Tome and
Principe (Washington D.C.: The World Bank Group).


Senegal
539
Senegal
A. Definitions and sources of data
Foreign direct investment (FDI) in Senegal is defined to meet certain minimum criteria. It comprises an invested capital of at least 5 million FCFA or its equivalent in United States dollars, must provide employment for at least three Senegalese nationals and must keep regular accounts in the standard Senegalese format (Loi no. 87-25 du 18 aout 1987, portant Code des Investissements). The Banque Centrale des Etats de l'Afrique de l'Ouest (BCEAO) provided FDI data in Senegal. The International Monetary Fund also provides FDI data on Senegal in its balance-of-payment statistics.
The Senegalese Investment Code provides equitable treatment of foreign firms and grants special incentives to companies willing to locate outside the Dakar region. Also, the code offers tax holidays and tax-free export processing zones; no barriers to ownership of businesses by foreigners and exonerates foreign investment from the Minimum Personal Income Tax and the Business License Tax.
Senegal created a one-stop window ("Guichet Unique") at the Ministry of Finance to reduce delays in assessing and approving private investment programs. Applications for authorization are processed within a one-month period, and absent of objections in that period, projects are considered approved.
Senegal is eligible for a wide market access. It is a member of the Economic Community of West African States, the West African Economic and Monetary Union, New Partnership for Africa's Development and the African Union. Further, Senegal benefits from the United States' market access initiative - the Africa Growth and Opportunity Act and the Cotonou agreement for renegotiating the trade links between the African, Caribbean and Pacific countries with the European Union, under the Lomé Convention. It is also a member of the World Trade Organization.
Senegal signed to the Convention on the Settlement of Investment Disputes between State and Nationals of other States on 26 September 1966 and is involved in several international investment related organizations. Senegal established an investment arbitration center in 1998, which is administered by the Dakar Chamber of Commerce. It has bilateral investment treaties with Australia, Denmark, Finland, France, Italy, Japan, the Netherlands, Romania, Republic of Korea, Spain, Switzerland and the United States. Senegal has also concluded tax treaties with France, Mali and the French-speaking African states of the "Organisation Commune Africaine et Malgache".
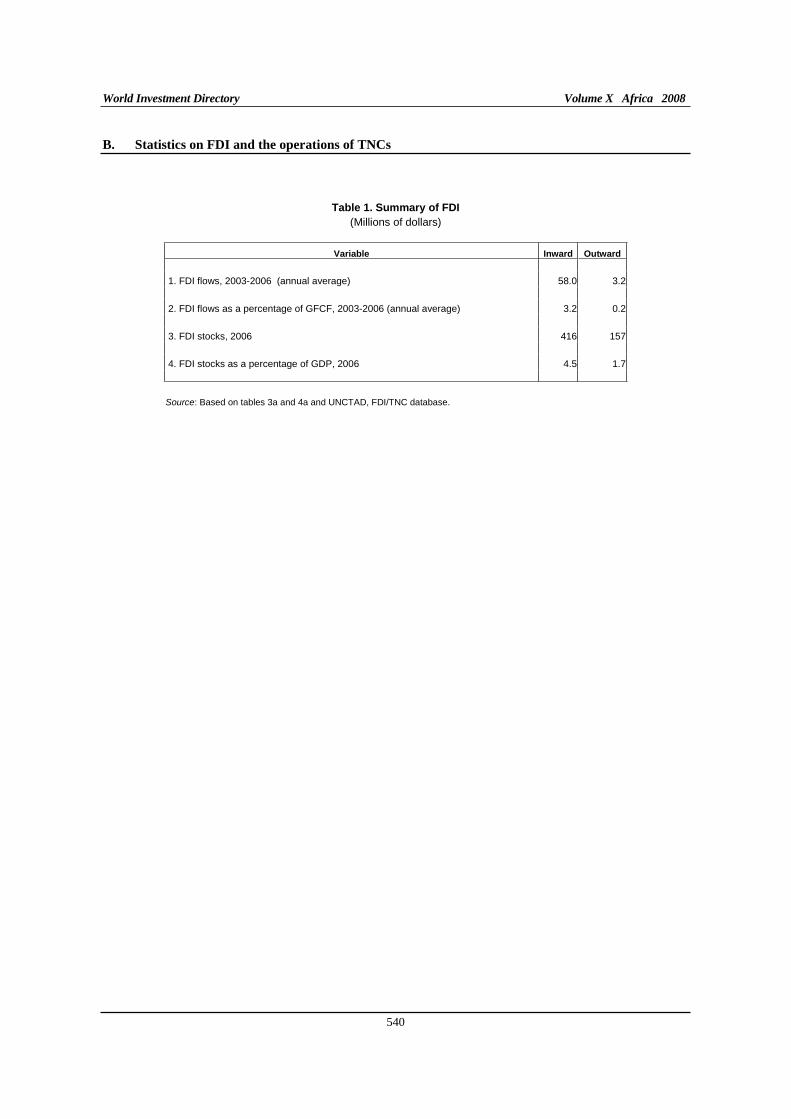
World Investment Directory Volume X Africa 2008
540
B. Statistics on FDI and the operations of TNCs
Table 1. Summary of FDI
(Millions of dollars)
Variable Inward Outward
1. FDI flows, 2003-2006 (annual average) 58.0 3.2
2. FDI flows as a percentage of GFCF, 2003-2006 (annual average) 3.2 0.2
3. FDI stocks, 2006 416 157
4. FDI stocks as a percentage of GDP, 2006 4.5 1.7
Source: Based on tables 3a and 4a and UNCTAD, FDI/TNC database.

Senegal
541
Table 3a. FDI flows, by type of investment, 1980-2006
(Millions of dollars)
Inward investment Outward investment
Reinvested Reinvested
Year Equity earnings Other Total Equity earnings Other Total
1980 - 6.8 8.0 13.3 14.5 0.2 .. 1.3 1.61981 4.7 8.7 20.9 34.4 - 2.5 .. 17.3 14.81982 - 0.3 11.6 16.8 28.1 3.1 0.1 14.8 18.01983 0.4 5.5 - 40.5 - 34.7 2.8 .. - 4.4 - 1.61984 1.3 8.0 19.8 29.1 1.1 .. 0.7 1.91985 4.5 5.0 - 25.3 - 18.9 - 0.1 .. 3.3 3.11986 1.2 3.5 - 13.1 - 3.8 1.9 .. - 6.6 - 4.71987 3.4 5.3 - 12.6 - 2.1 0.6 .. - 2.5 - 1.91988 1.7 12.0 1.3 1.2 1.3 .. 12.4 13.81989 2.8 14.3 9.7 18.2 8.9 .. - 0.3 8.61990 5.4 43.4 8.0 56.9 3.2 .. - 12.7 - 9.51991 4.0 - 10.4 - 1.2 - 7.4 - 8.9 .. - 10.2 - 19.11992 2.1 - 12.8 32.1 21.5 12.1 .. 39.3 51.41993 2.4 - 2.0 - 1.2 - 0.7 - 0.1 .. 0.4 0.41994 - 0.4 19.1 48.3 66.8 5.9 .. 11.5 17.51995 - 0.2 14.3 17.6 35.1 - 12.5 .. 9.2 - 3.41996 1.0 0.3 7.1 5.5 - 0.2 1.0 2.2 2.01997 156.7 4.4 15.3 176.8 0.5 0.4 - 1.3 - 0.91998 63.8 6.2 0.9 60.3 7.3 0.2 3.0 10.31999 124.4 21.5 7.4 153.2 8.1 0.1 2.9 11.12000 16.2 23.6 23.1 62.9 1.0 - 0.0 - 0.4 0.62001 - 28.7 35.2 25.4 31.9 - 0.2 - 0.0 - 7.3 - 7.02002 43.7 41.6 - 7.3 78.1 33.4 - 0.0 0.6 34.02003 72.6 - 8.5 - 11.5 52.5 - 5.6 2.9 5.4 2.72004 90.2 - 10.2 - 3.0 77.0 1.8 5.4 5.9 13.12005 96.1 - 55.0 3.5 44.6 2.6 0.1 - 10.4 - 7.72006 .. .. .. 58.0 .. .. .. 4.8
Source: UNCTAD, FDI/TNC database (www.unctad.org/statistics). Notes: Data on inflows are from the IMF for 1980-1984, the Banque Centrale de l'Afrique de l'Ouest (BCEAO) for 1985-2005 and estimate for 2006. Outflow data are from the IMF for 1980-1989, the BCEAO for 1990-2005 and estimate for 2006.
Table 3b. FDI flows, by type of investment, 1999-2005
(Millions of Franc de la Communauté financière africaine)
Inward investment Outward investment
Reinvested Reinvested
Year Equity earnings Other Total Equity earnings Other Total
1999 76 583 13 240 4 531 94 354 4 965 77 1 765 6 8072000 11 534 16 834 16 442 44 810 713 - 0.01 - 251 4622001 - 21 043 25 837 18 621 23 415 - 177 - 0.01 - 5 337 - 5 1602002 30 442 29 027 - 5 067 54 402 23 271 - 0.01 438 23 7092003 42 178 - 4 963 - 6 705 30 510 - 3 279 1 695 3 129 1 5452004 47 667 - 5 371 - 1 603 40 693 951 2 836 3 114 6 9012005 50 683 - 29 021 1 857 23 519 1 350 56 - 5 479 - 4 073
Source: UNCTAD, FDI/TNC database based on the Banque Centrale de l'Afrique de l'Ouest (BCEAO), unpublished.

World Investment Directory Volume X Africa 2008
542
Table 4a. FDI stocks, by type of investment, 1980-2006
(Millions of dollars)
Inward investment Outward investment
Equity &
Reinvested Reinvested
Year Equity earnings Other Total earnings Other Total
1980 .. .. .. 149.9 .. .. 4.9 1981 .. .. .. 184.3 .. .. 19.7 1982 .. .. .. 212.4 .. .. 37.6 1983 .. .. .. 177.7 .. .. 36.0 1984 .. .. .. 206.8 .. .. 37.9 1985 .. .. .. 187.9 .. .. 41.0 1986 .. .. .. 184.1 .. .. 36.3 1987 .. .. .. 182.0 .. .. 34.5 1988 .. .. .. 183.2 .. .. 48.2 1989 .. .. .. 201.4 .. .. 56.8 1990 .. .. .. 258.3 .. .. 47.3 1991 .. .. .. 250.9 .. .. 28.1 1992 .. .. .. 272.4 .. .. 79.5 1993 .. .. .. 271.7 .. .. 79.9 1994 .. .. .. 338.5 .. .. 97.3 1995 .. .. .. 373.6 .. .. 93.9 1996 .. .. .. 379.0 .. .. 95.9 1997 .. .. .. 555.9 .. .. 95.0 1998 .. .. .. 616.2 .. .. 105.4 1999 302.0 1.0 27.4 329.4 20.3 - 2.0 116.4 2000 254.7 2.0 39.9 294.6 20.6 1.2 117.1 2001 155.3 3.0 38.9 194.3 16.4 - 21.6 110.0 2002 196.6 4.0 45.0 241.6 55.7 - 0.5 144.0 2003 296.6 5.0 49.9 346.6 55.6 19.9 146.7 2004 362.5 6.0 78.7 441.2 61.9 16.6 159.8 2005 272.6 7.0 85.6 358.2 52.2 5.9 152.0 2006 .. .. .. 416.2 .. .. 156.8
Source: UNCTAD, FDI/TNC database (www.unctad.org/statistics). Notes: Data on inward stock prior to 1999 are estimated by accumulating inflows since 1970. 1999-2005 are based on the Banque Centrale de l'Afrique de l'Ouest (BCEAO). 2006 is estimated by adding flows to the 2005 stock. Outward stock data are estimated by accumulating inflows since 1974.
Table 4b. FDI stocks, by type of investment, 1999-2005
(Millions of Franc de la Communauté financière africaine)
Inward investment Outward investment
Equity & Equity &
Reinvested Reinvested Reinvested Reinvested
Year earnings earnings Other Total earnings earnings Other Total
1999 197 193 .. 17 918 215 111 13 282 .. - 1 335 11 9472000 179 556 .. 28 111 207 667 14 552 .. 866 15 4182001 115 598 .. 28 986 144 584 12 235 .. - 16 107 - 3 8722002 122 980 .. 28 152 151 132 34 831 .. - 343 34 4882003 154 056 .. 25 942 179 998 28 885 .. 10 332 39 2172004 174 578 .. 37 883 212 461 29 833 .. 7 979 37 8122005 151 600 .. 47 585 199 175 29 039 .. 3 301 32 410
Source: UNCTAD, FDI/TNC database based on the Banque Centrale de l'Afrique de l'Ouest (BCEAO), unpublished.

Senegal
543
Table 6. FDI flows in the host economy, by geographical origin, 1995-2006
(Millions of dollars) Economy 1995 1996 1997 1998 1999 2000 2001 2002 2003 2004 2005 2006
Belgium - - - - - - - 0.9 - - - -Belgium/Luxembourg - 1.3 - - 1.1 1.8 0.9 0.9 - - - -China - - - - - - - - 0.7 - - -Denmark - - - - - - - - - - 1.3 - 0.3France 31.5 26.9 128.1 23.3 94.8 20.3 28.6 35.8 65.5 13.7 52.2 22.6Germany 0.7 - - 0.6 - - - 6.6 1.1 8.7 - 6.2 - 12.5Portugal - 0.2 0.0 0.2 1.5 1.3 0.7 0.0 0.1 0.1 - -United States 4.0 6.0 8.0 5.0 9.0 - 3.0 1.0 - 11.0 - 4.0 - 13.0 - 60.0
Source: UNCTAD, FDI / TNC database. Note: Data are based on information reported by the economies listed above.
Table 9. FDI flows abroad, by geographical destination, 1995-2006
(Millions of dollars) Economy 1995 1996 1997 1998 1999 2000 2001 2002 2003 2004 2005 2006
France 15.8 7.7 10.1 4.4 2.1 5.5 - 0.9 5.6 33.9 28.6 12.4 43.9Germany - - - - - - 2.7 - - 1.2 - -Portugal - - 0.0 - - 0.0 - - 0.1 - - - -
Source: UNCTAD, FDI / TNC database. Note: Data are based on information reported by the economies listed above.
Table 12. FDI stocks in the host economy, by geographical origin, 1995-2006
(Millions of dollars) Economy 1995 1996 1997 1998 1999 2000 2001 2002 2003 2004 2005 2006
Canada - - - - - - - - - 13.3 - -China - - - - - - - - 2.5 2.6 2.4 -Denmark - - - - - - - - - 5.5 4.6 5.7Morocco - - - - - - - 10.0 12.5 16.1 14.1 26.8Portugal - 0.0 0.0 0.6 2.0 2.9 3.4 1.7 2.6 - - -Korea, Republic of 0.4 0.4 0.5 0.5 0.5 0.5 0.5 0.5 0.5 0.5 0.5 -United States 36.0 50.0 58.0 67.0 67.0 30.0 33.0 39.0 38.0 38.0 25.0 - 33.0
Source: UNCTAD, FDI / TNC database. Note: Data are based on information reported by the economies listed above.
Table 15. FDI stocks abroad, by geographical destination, 1995-2006
(Millions of dollars) Economy 1995 1996 1997 1998 1999 2000 2001 2002 2003 2004 2005 2006
France 53.5 58.9 55.9 64.2 57.3 58.6 51.1 45.1 113.7 130.8 97.9 -Portugal - - - - 0.0 0.0 0.0 0.1 0.2 - - -
Source: UNCTAD, FDI / TNC database. Note: Data are based on information reported by the economies listed above.
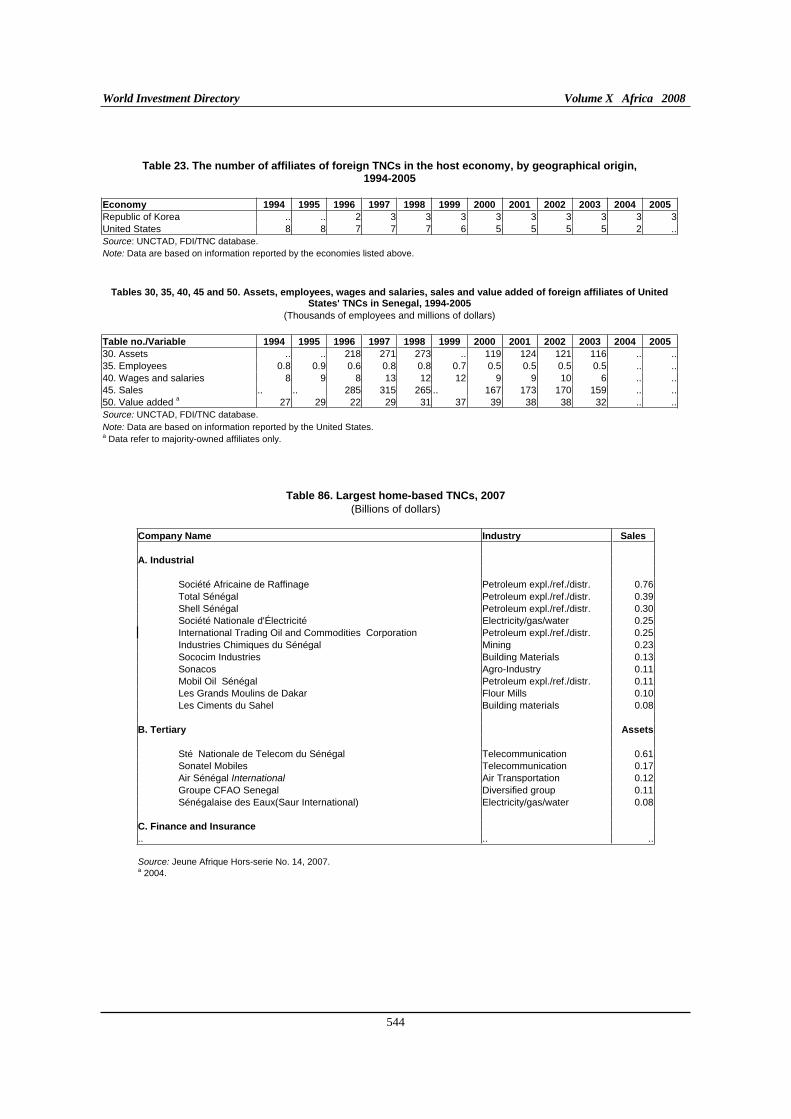
World Investment Directory Volume X Africa 2008
544
Table 23. The number of affiliates of foreign TNCs in the host economy, by geographical origin, 1994-2005
Economy 1994 1995 1996 1997 1998 1999 2000 2001 2002 2003 2004 2005
Republic of Korea .. .. 2 3 3 3 3 3 3 3 3 3United States 8 8 7 7 7 6 5 5 5 5 2 ..Source: UNCTAD, FDI/TNC database. Note: Data are based on information reported by the economies listed above.
Tables 30, 35, 40, 45 and 50. Assets, employees, wages and salaries, sales and value added of foreign affiliates of United States' TNCs in Senegal, 1994-2005
(Thousands of employees and millions of dollars)
Table no./Variable 1994 1995 1996 1997 1998 1999 2000 2001 2002 2003 2004 2005
30. Assets .. .. 218 271 273 .. 119 124 121 116 .. ..35. Employees 0.8 0.9 0.6 0.8 0.8 0.7 0.5 0.5 0.5 0.5 .. ..40. Wages and salaries 8 9 8 13 12 12 9 9 10 6 .. ..45. Sales .. .. 285 315 265 .. 167 173 170 159 .. ..50. Value added a 27 29 22 29 31 37 39 38 38 32 .. ..Source: UNCTAD, FDI/TNC database. Note: Data are based on information reported by the United States. a Data refer to majority-owned affiliates only.
Table 86. Largest home-based TNCs, 2007
(Billions of dollars) Company Name Industry Sales
A. Industrial
Société Africaine de Raffinage Petroleum expl./ref./distr. 0.76Total Sénégal Petroleum expl./ref./distr. 0.39Shell Sénégal Petroleum expl./ref./distr. 0.30Société Nationale d'Électricité Electricity/gas/water 0.25International Trading Oil and Commodities Corporation Petroleum expl./ref./distr. 0.25Industries Chimiques du Sénégal Mining 0.23Sococim Industries Building Materials 0.13Sonacos Agro-Industry 0.11Mobil Oil Sénégal Petroleum expl./ref./distr. 0.11Les Grands Moulins de Dakar Flour Mills 0.10Les Ciments du Sahel Building materials 0.08
B. Tertiary Assets
Sté Nationale de Telecom du Sénégal Telecommunication 0.61Sonatel Mobiles Telecommunication 0.17Air Sénégal International Air Transportation 0.12Groupe CFAO Senegal Diversified group 0.11Sénégalaise des Eaux(Saur International) Electricity/gas/water 0.08
C. Finance and Insurance
.. .. ..
Source: Jeune Afrique Hors-serie No. 14, 2007.a 2004.

Senegal
545
Table 87. Largest foreign affiliates of home-based TNCs, 2007
(Millions of dollars and number)
Company Name Host economy Industry Sales Employees
A. Industrial
.. .. .. .. ..
B. Tertiary
Associates Business Machines Guinee SA Guinea Wholesale trade 2 10a
C. Finance and Insurance Assets Employees
.. .. .. .. ..
Source: Who Owns Whom database (https://solutions.dnb.com/wow), retrieved January 2008. a 2003.
Table 88. Largest affiliates of foreign TNCs in the host economy, 2007
(Millions of dollars and number) Company Home economy Industry Sales Employees
A. Industrial
Laboratoire Canonne Valdafrique S A France Chemicals and chemical products .. 74Nord Electricite S A France Electricity, gas and water .. 54Les Specialistes De L' Energie Sa France Electricity, gas and water .. 9
B. Tertiary
Total Senegal Sa France Distributive trade 2 120 196Shell Senegal Sa United Kingdom Wholesale trade 1 607 161Scac Delmas Vieljeux Senegal France Wholesale trade 289 1 100Compagnie Francaise De L Afrique Occidentale Du
Senegal Sa France Wholesale trade 262 158Cfao Technologies Senegal France Telecommunications 75 88Equant Integration Service France Computer and related activities .. 30Dakar Catering Sa France Distributive trade .. 215Saga Senegal Sa France Supporting transport activities .. 202Laborex S A France Wholesale trade .. 122Société Africaine De Sondage Injections Et Forages France Construction .. 90Société Tropicale De Distribution De Produits
Pharmaceutiques France Wholesale trade .. 80A B B Herlicq S A India Construction .. 79Société De Developement De La Industrie, Du Tourisme
Et De L'Habitat S A France Wholesale trade .. 50Mccann-Erickson Senegal United States Research and development .. 40Getma Senegal France Supporting transport activities .. 28Areva T&D France Other services .. ..Bt Senegal Limited United Kingdom Telecommunications .. ..Egl, Inc United Kingdom Water Transport .. ..Geodis Senegal France Wholesale trade .. ..
C. Finance and Insurance Assets Employees
Société Generale De Banques Au Senegal France Finance .. ..Agf Senegal Assurances Germany Insurance .. ..Agf Senegal Assurances Vie Germany Insurance .. ..Cabinet Pierre Michaux Fidafrica United States Petroleum .. ..
Source: Who Owns Whom database (https://solutions.dnb.com/wow), retrieved January 2008.

World Investment Directory Volume X Africa 2008
546
C. Legal frameworks for transnational corporations
In Senegal, many national, bilateral and multilateral legal instruments exist to regulate the activities of the transnational corporations and foreign direct investors. The key applicable legal instruments include the following:
I. National framework
Law No. 73-52, December 1973. Source: WIPO (http://www.wipo.org).
Law No. 74-06 of 22 April 1974 establishing the Industrial Free Zone of Dakar. Source: Journal Officiel de la Republique du Senegal No. 4356 of 18 May 1974, p. 740.
Decree No. 75-543 of 20 May 1975 Regulating the Operation of the "Comite d'Agrement" of the Industrial Free Zone of Dakar. Source: International Center for Settlement of Investment Disputes (ICSID), Laws of the World, Release 88-1, August 1988, p. 55.
Law No. 84-64 setting the modalities for the liquidation of public establishments, national companies and joint ventures, 16 August 1984 Source: World Bank, Technical Paper No. 186, "Divestiture of State Enterprises". An overview of the legal framework.
Law No. 86-05 of 24 January 1986 which Amends Law No. 73-52 of 4 December 1973 on Copyright. Source: World Intellectual Property Organisation. Copyright Laws and Treaties, No. 1, January 1989
Presidential order No. 86-1370/MEF/DGT/DP establishing a special commission on the disengagement of the state, 8 November 1986. Source: World Bank, Technical Paper No. 186, "Divestiture of State Enterprises". An overview of the legal framework.
Law No. 87/23 on the privatisation of enterprises, 18 August 1987. Source: World Bank, Technical Paper No. 186, "Divestiture of State Enterprises". An overview of the legal framework.
Law No. 87-24 of 18 August 1987 setting forth the Investment Code, repeals the Investment Code of 1981 and the special provisions relating to small and medium-sized enterprises of Law No. 81-51 of 10 July 1981. Source: Journal Officiel de la Republique du Senegal (Official Journal) No. 5190 of 29 August 1987.
Decree No. 87-1476 on the organisation and operations of the special commission for monitoring the disengagement of the state, 27 November 1987. Source: World Bank, Technical Paper No. 186, "Divestiture of State Enterprises". An overview of the legal framework.
Decree No. 87-1581 of 30 December 1987 Creating a Special Section within the Ministry of Economy and Finance for the Implementation of Law No. 87-25 of 18 August 1987. Source: Journal Officiel de la Republique du Senegal No. 5222 of 5 March 1988, p. 145.
Decrees No. 88-194 and 88-197 of 18 February 1988, and Decree No. 88-256 of 11 March 1988, Implementing Art. 20, 19 and 16 of Law No. 87-25 of 18 August 1987. Source: Journal Officiel de la Republique du Senegal No. 5226 of 26 March 1988, pp. 184-185, and No. 5230 of 23 April, 1988, p. 265.

Senegal
547
Arrete No. 2089 M.E.F. of 19 February 1988 Implementing Art. 5 of Decree No. 87-1581 of 30 December 1987. Source: Journal Officiel de la Republique du senegal No. 5230 of 23 April 1988, p. 268.
Decree No. 88-232 organising the procedure for the public offering of shares held by the state, 4 March 1988. Source: World Bank, Technical Paper No. 186, "Divestiture of State Enterprises". An overview of the legal framework.
Decree No. 88-233 setting the conditions for tenders for the divestiture of shares held by the state in public enterprises to be privatised, 4 March 1988. Source: World Bank, Technical Paper No. 186, "Divestiture of State Enterprises". An overview of the legal framework.
Law No. 89-31 of 12 October 1989. Source: Journal Officiel de la Republique du Senegal No. 5314 of 21 October 1989, p. 409.
Law No. 89-32 of 12 October 1989. Source: Journal Officiel de la Republique du Senegal No. 5314 of 21 October 1989, p. 410.
Regulations Concerning the Establishment of Companies in the Industrial Free Zone of Dakar. Source: International Center for Settlement of Investment Disputes (ICSID), Laws of the World, p. 57.
Code des investissements Loi n°2004-06 du 6 février 2004 Source: http://www.droit-afrique.com/images/textes/Senegal/Senegal%20-20Code%20des%20investissements.pdf.
II. International Framework
A. Senegal is a party to the following multilateral and regional instruments:
Convention on the Recognition and Enforcement of Foreign Arbitral Awards of 1958, which entered into force on 7th June 1959.
Convention on the Settlement of Investment Disputes between States and Nationals of other States of 1965. Entered into force on 14 October 1966.
Patents: Bangui Agreement, March 1977 (Annex I), as last amended in February 1999. Source: WIPO (http://www.wipo.org).
Industrial Designs: Bangui Agreement, March 1977 (Annexes II and IV), as last amended in February 1999. Source: WIPO (http://www.wipo.org).
Trade Marks: Bangui Agreement, March 1977 (Annex III), as last amended in February 1999. Source: WIPO (http://www.wipo.org).
Agreement for the Promotion, Protection and Guarantee of Investment Among Member States of the Organization of Islamic Conference, of I June 1981; entered into force on 23 September 1986.
Convention Establishing the Multilateral Investment Guarantee Agency of 1985, entered into force on 12 April 1988.
Articles of Agreement of the Islamic Corporation for the Insurance of Investment and Export Credit of 19 February 1992. Entered into force on 1 August 1994.

World Investment Directory Volume X Africa 2008
548
Revised Treaty of the Economic Community of West African States. ECOWAS 1993.
Paris Convention for the Protection of Industrial Property of 1883 (Revised at Brussels in 1900, Washington in 1911, The Hague in 1925, London in 1934, Lisbon in 1958 and Stockholm in 1967, and as amended in 1979). Signed in 1994.
Marrakesh Agreement Establishing the World Trade Organisation of 15 April 1994. Entered into force on 1 January 1995. Agreement on Trade-Related Investment Measures. General Agreement on Trade in Services. Agreement on Trade Related Aspects of Intellectual Property Rights.
B. Bilateral treaties
1. Bilateral investment treaties for the protection and promotion of investments: Switzerland 1962, Germany 1964, Sweden 1967, France 1974, Syrian Arab Republic 1975, Netherlands 1979, Romania 1980, United Kingdom 1980, United States of America 1983, Korea, Republic of 1984, Tunisia 1984, Argentina 1993, Taiwan Province of China 1997, Egypt 1998, Qatar 1998, South Africa 1998, Malaysia 1999, Italy 2000, Mauritius 2002, Mali 2005, Morocco 2006.
2. Bilateral treaties for the avoidance of double taxation: Mauritania 1971, France 1974, Tunisia 1984, Belgium 1987, Norway 1994, Qatar 1998, Taiwan Province of China 1999, Canada 2001, Egypt 2001, Lebanon 2002, Mauritius 2002, Morocco 2002.

Senegal
549
D. Sources of Information
Official
Banque Centrale des Etats de l'Afrique de l’Ouest (www.bceao.int).
Secondary
Bayliss, K. (2002). Privatization and poverty: the distribution impact of utility privatisation (London: Public Services International Research Unit).
Bennell, Paul (1997). "Foreign direct investment in Africa: rhetoric and reality", SAIS Review (Summer/Fall); pp. 127-139.
___________(1997). "Privatization in Sub-Saharan Africa: progress and prospects during the 1990s", World
Development, vol. 25, no. 11, pp. 1785-1803.
Dembele, Demba, Moussa (2003) Debt and destruction in Senegal: a study of twenty years of IMF and
World Bank policies (Washington D.C.: World Development Movement).
Economist Intelligence Unit (EIU) (various years). Country Profile: Senegal (London: EIU Ltd.).
____________(various years). Country Report: Senegal (London: EIU Ltd.).
International Monetary Fund (IMF) (2006). IMF's Sub-Saharan Africa Regional Economic Outlook, March 10, 2006. (Washington D.C.: IMF).
Marino, Andrea (2000). "The impact of FDI on developing countries' growth: trade policy matters". (National Institute of Statistics, Italy).
Multilateral Investment Guarantee Agency (MIGA) (2002). Annual Report 2002 (Washington D.C.: MIGA).
Pigeau, F. (2002). Senegalise chicken debated at the WTO: subsidized imports ruin the industry
(Liberation).
Soderbom, M. and F. Teal (2004). "Size and Efficiency in Africa Manufacturing firms: Evidence from Firm-Level Panel Data." Journal of Development Economics, 73. pp 369 - 394.
Sow, Abdoul, Souleye (2003). "Senegal: difficulties to be overcome" (Social Watch/149).
United Nations Conference on Trade and Development (UNCTAD) (2005a). Investor-Disputes Arising
from Investment Treaties: A Review. UNCTAD Series of International Investment Policies for Development (UNCTAD/ITE/IIT/2005/4).
_____________(2005b). A Survey of Support by Investment Promotion Agencies to Linkages. Advisory Studies No. 18 (UNCTAD/ITE/IPC/2005/12).
_____________(2005c). FDI in least developed countries at a glance: 2005/2006
(UNCTAD/ITE/IIA/2005/17).
United States Trade Representative (2006). 2006 Comprehensive Report on U.S. Trade and Investment
Policy Toward Sub-Saharan Africa and Implementation of the Africa Growth and Opportunity Act:
The Sixth of Eight Annual Reports, May 2006. (Washington D.C.: US Government).
World Bank (2002). Global Economic Prospects and the Developing Countries 2003: Investing to Unlock
Opportunities (Washington D.C.: World Bank).

World Investment Directory Volume X Africa 2008
550
_____________(2005). Une evaluation du Climat des Investissement; Senegal. Mars, 2005. Rapport No xx - Sen.
World Bank/International Finance Corporation (2007). Doing Business 2008 Senegal (Washington D.C.: The World Bank Group).
Zeiger, L. and P. Michelini (1989). "Untapped mineral resources of West Africa offer opportunities for trade and investment in the 1990s", Business America, 110(24), December, pp 28-31.

Seychelles
551
Seychelles
A. Definitions and sources of data
Foreign direct investment (FDI) in the Seychelles is defined by the standards adopted by the International Monetary Fund (IMF). This definition includes investments by a non-resident entity in the Seychelles where the direct investor acquires a long-term interest in an enterprise with a significant degree of influence on the management of the enterprise. An acquisition of 10% or more of the ordinary shares or voting power of a resident enterprise by a non-resident individual enterprise is considered to be FDI. The Central Bank of Seychelles collects data on FDI for compiling balance-of-payment (BOP) statistics. The data collection is based on a combination of company surveys and transactions of foreign currency. The data are highly aggregated. The IMF also provides data on FDI in the country in its BOP statistics.
The Government of the Seychelles only restricts foreign control or ownership of immobile property such as land. Such acquisition by foreign investors requires government approval. Also, due to a foreign exchange shortage in the Seychelles, certain transfers (example, remittance of dividends, transfer of management fees and proceeds for sale of assets) are subject to the approval of the Central Bank. As part of its effort to increase FDI in the economy, the Government had created the Seychelles International Business Authority to ease development of the offshore sector. The Seychelles international trade zone was also established to boost foreign investment. Seychelles committed to the Organization for Economic Co-operation and Development's requirements for ending harmful tax competition.
The services sector, including transport, communications, commerce and tourism, dominates the Seychelles economy. Some privatization schemes in the 1990s reduced the role of the state in the economy, particularly in telecommunications and tourism industries. To advance the strategy of low-volume-high-value tourism, the Government has encouraged investment in luxury facilities by offering a range of incentives including, exemptions from taxes and labour regulations for investors.
As part of the effort to deepen its participation in the global economy, Seychelles signed to the Convention on Settlement of Investment Disputes between State and Nationals of other States on 16 February 1978 and is a member of regional integration and co-operation arrangements, such as the Indian Ocean Commission, initiative to form the Indian Ocean Rim Association for Regional Co-operation, the Common Market for Eastern and Southern Africa and the Southern African Development Community. Seychelles is also a member of the African Union, New Partnership for Africa's Development and a signatory to the Cotonou Agreement for renegotiating the trade links between the African, Caribbean and Pacific countries with the European Union, under the Lomé Convention and has an observer status at the World Trade Organization. It is an eligible member of the United States market access initiative for African countries - the African Growth and Opportunity Act.

World Investment Directory Volume X Africa 2008
552
B. Statistics on FDI and the operations of TNCs
Table 1. Summary of FDI
(Millions of dollars)
Variable Inward Outward
1. FDI flows, 2003-2006 (annual average) 82.0 7.8
2. FDI flows as a percentage of GFCF, 2003-2006 (annual average) 105.7 10.1
3. FDI stocks, 2006 906 169
4. FDI stocks as a percentage of GDP, 2006 121.0 22.6
Source: Based on tables 3 and 4 and UNCTAD, FDI/TNC database.

Seychelles
553
Table 3. FDI flows, by type of investment, 1980-2006
(Millions of dollars)
Inward investment Outward investment
Reinvested Reinvested
Year Equity earnings Other Total Equity earnings Other Total
1980 .. .. .. 9.5 .. .. .. 3.8
1981 .. .. .. 10.1 .. .. .. 7.2
1982 .. .. .. 10.0 .. .. .. 4.9
1983 .. .. .. 9.1 .. .. .. 3.2
1984 .. .. .. 9.8 .. .. .. 3.9
1985 .. .. .. 11.7 .. .. .. 10.6
1986 .. .. .. 14.2 .. .. .. 5.8
1987 .. .. .. 19.4 .. .. .. 5.4
1988 .. .. .. 23.2 .. .. .. 4.3
1989 17.8 .. .. 22.4 .. .. .. 0.9
1990 0.3 - - 0.3 0.6 0.6 - 1.1
1991 17.7 3.8 - 21.5 0.5 0.5 - 0.9
1992 - 1.5 3.1 - 1.6 0.7 0.7 - 1.4
1993 11.7 4.0 3.1 18.8 0.5 0.5 - 1.0
1994 9.0 6.1 15.7 30.8 6.7 6.7 - 13.3
1995 15.7 11.6 18.5 45.8 8.5 8.5 - 16.9
1996 17.6 6.6 4.6 28.8 6.2 6.2 - 12.5
1997 49.3 4.0 0.1 53.4 4.9 4.9 - 9.9
1998 49.4 3.8 0.0 53.2 1.5 1.5 - 3.0
1999 51.5 3.7 0.0 55.2 4.5 4.5 - 9.0
2000 20.0 4.4 0.0 24.3 4.2 3.5 - 7.7
2001 56.6 8.1 0.0 64.7 6.0 2.6 - 8.5
2002 37.5 10.1 0.0 47.6 6.7 2.0 - 8.7
2003 33.6 9.0 15.7 58.4 5.3 2.9 - 8.1
2004 32.0 6.0 0.0 38.0 5.2 2.4 - 7.6
2005 74.6 10.9 0.4 85.9 5.1 2.3 - 7.4
2006 127.8 16.9 0.9 145.6 5.3 2.7 - 8.0
Source: UNCTAD, FDI/TNC database (www.unctad.org/statistics). Data are based on IMF for 1980-1989 and the Central Bank of Seychelles thereafter.

World Investment Directory Volume X Africa 2008
554
Table 4. FDI stocks, by type of investment, 1980-2006
(Millions of dollars)
Inward investment Outward investment
Reinvested Reinvested
Year Equity earnings Other Total Equity earnings Other Total
1980 .. .. .. 82.8 .. .. .. 16.5
1981 .. .. .. 92.9 .. .. .. 23.7
1982 .. .. .. 102.9 .. .. .. 28.6
1983 .. .. .. 112.0 .. .. .. 31.9
1984 .. .. .. 121.8 .. .. .. 35.8
1985 .. .. .. 133.4 .. .. .. 46.4
1986 .. .. .. 147.6 .. .. .. 52.1
1987 .. .. .. 167.0 .. .. .. 57.5
1988 .. .. .. 190.2 .. .. .. 61.8
1989 .. .. .. 212.7 .. .. .. 62.7
1990 .. .. .. 212.9 .. .. .. 63.9
1991 .. .. .. 237.8 .. .. .. 65.6
1992 .. .. .. 230.7 .. .. .. 64.5
1993 .. .. .. 249.1 .. .. .. 65.4
1994 .. .. .. 294.9 .. .. .. 82.8
1995 .. .. .. 346.2 .. .. .. 101.2
1996 .. .. .. 365.8 .. .. .. 111.0
1997 .. .. .. 408.9 .. .. .. 117.9
1998 .. .. .. 435.7 .. .. .. 113.7
1999 .. .. .. 497.5 .. .. .. 124.4
2000 .. .. .. 448.1 .. .. .. 113.6
2001 .. .. .. 554.3 .. .. .. 132.5
2002 .. .. .. 682.5 .. .. .. 160.2
2003 .. .. .. 684.7 .. .. .. 155.3
2004 .. .. .. 722.7 .. .. .. 162.9
2005 .. .. .. 808.5 .. .. .. 170.3
2006 .. .. .. 906.0 .. .. .. 169.3
Source: UNCTAD, FDI/TNC database (www.unctad.org/statistics). Data prior to 1990 are estimated by subtracting inflows from the stock of 1990. 1990-2006 are based on the Central Bank of Seychelles.

Seychelles
555
Table 6. FDI flows in the host economy, by geographical origin, 1995-2006
(Millions of dollars)
Reporting countries 1992 1993 1994 1995 1996 1997 1998 1999 2000 2001 2002 2003 2004 2005 2006
Belgium - - - - - - - - - - - - 2.3 - 0.0 -
China - - - - - - - - - - - - - 0.1 -
Czech Republic - - - - - - - - 2.6 - - - 0.0 - - -
Denmark - - - - - - - - - - - - - - 0.2 -
Germany - - - 1.4 6.0 0.6 0.6 - - - - - - - -
Japan - - - - - - - - - - - - - 5.1 -
Kazakhstan - - - - - - - - - - - - - 1.0 - 1.1 -
Malaysia - - - - - 0.4 - - - - - - - - -
Mauritius - - - - - - 1.3 0.4 2.6 - - 20.4 2.7 3.0 5.9
United States - - - - - - - - - - 20.0 - - - -
Source: UNCTAD. FDI / TNC database.
Note: Data is based on the information reported by the economies listed above.
Table 9. FDI flows abroad, by geographical destination, 1995-2006
(Millions of dollars)
Reporting countries 1992 1993 1994 1995 1996 1997 1998 1999 2000 2001 2002 2003 2004 2005 2006
Brazil - - - - - - - - - - 0.1 0.2 0.9 0.1 -
Bulgaria - - - - - - - - - 0.0 0.0 0.3 1.5 1.8 2.0
Cyprus - - - - - - - - - - 0.1 0.1 0.0 0.1 -
Czech Republic - - - - - - - 0.6 0.3 - 0.5 - - 45.7 - 12.8 - 16.8
Denmark - - - - - - - - - - - - - 2.8 1.8
Estonia - - - - - - - - - - - - - 0.5 - 0.1
France - - - - - - - - 0.9 0.9 - - - - -
Kazakhstan - - - - - - 0.3 0.8 0.9 0.0 0.3 0.0 1.1 8.3 1.3
Kyrgyzstan - - - - - 0.1 0.3 0.6 - - - - - - -
Latvia - - - - - - - - - - 0.3 - - - 0.2 -
Lithuania - - - - - 0.0 - 0.0 0.0 - 0.0 0.1 0.1 - 0.2 1.6 0.2 - 1.7
Malaysia - - - - - - 0.9 - - - - - - - -
Portugal - - - - - - - 0.1 - - - - - - -
Source: UNCTAD. FDI / TNC database.
Note: Data is based on the information reported by the economies listed above.

World Investment Directory Volume X Africa 2008
556
Table 12. FDI stocks in the host economy, by geographical origin, 1995-2006
(Millions of dollars) Reporting countries 1992 1993 1994 1995 1996 1997 1998 1999 2000 2001 2002 2003 2004 2005 2006
China - - - - - - - - - - - 0.4 0.4 4.2 -Czech Republic - - - - - - 45.0 - - - - - - - -Denmark - - - - - - - - - - - - 0.5 0.2 0.5Kazakhstan - - - - - - - - - - - - 1.2 0.0 0.0Malaysia - - - - - 0.3 0.3 0.3 0.3 0.3 0.3 0.3 0.3 0.3 -United States - - - - - - - - - - 4.0 - - - -
Source: UNCTAD, FDI/TNC database. Note: Data is based on the information reported by the economies listed above.
Table 15. FDI stocks abroad, by geographical destination, 1995-2006
(Millions of dollars) Reporting countries 1992 1993 1994 1995 1996 1997 1998 1999 2000 2001 2002 2003 2004 2005 2006
Brazil - - - - - - - - 0.1 - - - - - -Bulgaria - - - - - - - - 0.1 0.2 0.1 0.3 1.8 3.6 6.1Croatia - - - - - - - - - - 0.2 0.2 0.2 0.2 0.3Czech Republic - - - - - - 0.1 1.0 3.0 2.8 2.2 18.4 81.7 29.1 -Denmark - - - - - - - - - - - - 12.6 13.4 17.0Estonia - - - - - - - 0.1 1.4 0.1 0.1 0.2 0.1 0.5 0.7Kazakhstan - - - - - - 0.3 1.1 1.2 0.2 0.6 0.6 1.7 9.3 4.1Latvia - - - - - - - - - - 0.3 0.3 - 0.2 -Lithuania - - - - 0.1 0.1 0.1 0.1 0.1 0.2 0.1 0.0 1.7 1.5 0.1Portugal - - - - - - - 0.1 0.1 0.1 0.1 0.1 - - -Macedonia, TFYR - - - - - - - - 0.0 0.1 0.1 - 0.2 2.8 - 0.0 -United Republic of Tanzania - - - - - - 1.7 - - - - - - - -
Source: UNCTAD, FDI/TNC database. Note: Data is based on the information reported by the economies listed above.
Table 23. The number of affiliates of United States TNCs in Seychelles, 1995-2006
Reporting country 1992 1993 1994 1995 1996 1997 1998 1999 2000 2001 2002 2003 2004 2005 2006
United States .. .. .. .. .. .. .. .. 1 1 1 1 1 .. ..
Source: UNCTAD, FDI/TNC database. Note: Data are based on information reported by the United States.
Tables 35 and 45. Employees and Sales of foreign affiliates of Czech Republic TNCs in Seychelles, 1995-2006
(Thousands of employees and millions of dollars)
Table no./Variable 1992 1993 1994 1995 1996 1997 1998 1999 2000 2001 2002 2003 2004 2005 2006
35. Employment .. .. .. .. .. .. .. .. .. .. .. .. 1.7 1.5 ..45. Sales .. .. .. .. .. .. .. .. .. .. .. .. 154.4 217.6 ..
Source: UNCTAD, FDI/TNC database.
Note: Data are based on information reported by the Czech Republic.

Seychelles
557
Table 86. Largest home-based TNCs, 2007 (Billions of dollars and number)
Company Industry Sales Employees
A. Industrial
.. .. .. .. B. Tertiary
Air Seychelles Air Transportation 0.13 a ..
C. Finance and insurance Assets Employees
.. .. .. ..Source: Jeune Afrique Hors-serie No. 14, 2007. a 2004.
Table 87. Largest affiliates of home-based TNCs, 2007 (Millions of dollars and number)
Company Name Host Economy Industry Sales Employees
A. Industrial
Fendon Audio Technology Ltd United Kingdom Electrical & electronic equipments .. 1Q Glazing Ltd. United Kingdom Machinery and equipment .. 6
B. Tertiary
Atrium Computers Ltd United Kingdom Education 6.53 1064 Business Ltd United Kingdom Other business activities 1.60 ..Hodsdon & Bancroft, Lda Portugal Distributive trade 1.04 12Pivotal Developments Ltd United Kingdom Computer and related activities 0.92 ..Base4Business Ltd United Kingdom Other business activities 0.64 ..Consulco (Uk) Ltd United Kingdom Research and development 0.07 3Business & Professional Management Ltd United Kingdom Research and development 0.07 ..Temple Systems Ltd United Kingdom Computer and related activities 0.05 ..Sti Management Ltd United Kingdom Real estate 0.05 ..Malvern Court Management Ltd United Kingdom Health and social services 0.05 3F.T.Z. Ltd United Kingdom Real estate 0.03 ..Frameco Ltd United Kingdom Distributive trade 0.02 ..Bestlead Ltd.(Korea) Rep. of Korea Research and development .. 316Telewise Group Limited Hong Kong Telecommunications .. 10Temple Technologies Ltd United Kingdom Computer and related activities .. 2
C. Finance and insurance Assets Employees
Gatnom Capital & Finance Ltd United Kingdom Finance .. ..Private Funding & Securities Ltd United Kingdom Finance .. ..
Source: Who Owns Whom database (https://solutions.dnb.com/wow), retrieved January 2008.
Table 88. Largest affiliates of foreign TNCs in the host economy, 2007 (Millions of dollars and number)
Company Home Economy Industry Sales Employees
A. Industrial
Indian Ocean Tuna Limited United States Food, beverages and tobacco 28.5 .. B. Tertiary
Skychef Ltd France Distributive trade 6.1 150Cable And Wireless Seychelles Ltd United Kingdom Telecommunications 0.001 ..Laxmanbhai & Co (Pty) Ltd Kenya Construction 200Ocra ( Seychelles ) Ltd United Kingdom Research and development 51Bodco Limited Switzerland Wholesale trade 26A Cement Company ( Seycelles ) Ltd Switzerland Wholesale trade 12
C. Finance and insurance Assets Employees
.. .. .. .. ..Source: Who Owns Whom database (https://solutions.dnb.com/wow), retrieved January 2008.
World Investment Directory Volume X Africa 2008
558
C. Legal frameworks for transnational corporations
Seychelles has adopted a number of national, bilateral and multilateral legal instruments for regulating the activities of transnational corporations and foreign direct investors. Some of the principal instruments that apply in the country include the following:
I. National framework
Companies Law 1942. Source: Country Profile Of Seychelles (http://www.iornet.org/newiornet/cp/seychelles10.htm).
Income Tax Ordinance, Chapter 104; effective on I January 1948. Source: The Laws of Seychelles, 1971, Revised edition, vol. 3, p. 417.
Hotels Ordinance No. 27 of 1960, Chapter 247, of 14 November 1960; effective on 1 January 1961. Source:Supplement to Seychelles Gazette, 14 November 1960.
The Industrial Development Ordinance, Chapter 248, of 24 November 1967; effective on 1 March 1968. Source: Supplement to Seychelles Gazette of 4 December 1967.
Industrial Court Ordinance 1971.Source: Seychelles Government Gazette, 1971-03-22.
The Industrial Development Regulation (Amendment), 5.1. 69 of 8 July 1971; effective on 8 July 1971. Source: Supplement to Seychelles Gazette, 12 July 1971.
Hotels Ordinance (Amendment) No. 22 of 1971; effective on 1 January 1972. Source: Supplement to Seychelles Gazette, 27 December 1971.
The Companies Ordinance, No. 4 of 10 March 1972; effective on 27 March 1972. Source: Supplement to Seychelles Gazette, 27 March 1972.
Petroleum Mining Ordinance No. 3 of 6 April 1976. Source: Supplement to Seychelles Gazette, 7 April 1976.
Trademark Decree, No. 18 of 1977; effective on 4 January 1978. Source: Supplement to Seychelles Gazette, 16 August 1977.
Immigration Decree of 23 April 1979; effective on 30 April 1979. Source: Supplement to Seychelles Gazette, 30 April 1979.
Petroleum Mining (Pollution Control) Amendment Act, of 30 January 1980; effective on 31 January 1980. Source: Supplement to Seychelles Gazette, 31 January 1980.
Trade Licenses Act, No. 2 of 1981; effective on 3 March 1981. Source: Supplement to Seychelles Gazette, 3 March 1981.
Copyright Act., No. 25 of 14 February 1984; effective on 1 April 1984. Source: Supplement to Seychelles Gazette, 27 February 1984.
The Income Tax (Amendment ) Act No. 12 of 24 August 1984; effective on I January 1984. Source: Supplement to Seychelles Gazette of 31 August 1984. Business Tax Act, No. 10 of 31 December 1987. Source. Supplement to Seychelles Gazette, 1 January 1988.

Seychelles
559
Employment Act, No. 7 of 1 September 1990: effective on 16 November 1990. Source: Supplement to Seychelles Gazette, 15 October 1990.
Immigration (Amendment) Bill of 7 December 1990. Source: Supplement to Seychelles Gazette, 10 December 1990.
Merchant Shipping Act (1992) Source: Country Profile Of Seychelles (http://www.iornet.org/newiornet/cp/seychelles11.htm).
International Business Companies Act 1994. Source: Country Profile Of Seychelles (http://www.iornet.org/newiornet/cp/seychelles10.htm).
Investment Promotion Act, 1994 (No. 21 of 1994)source: Official Gazette, Supplement, 1994-12-27, pp. 143-150.
International Business Companies Act, Act 24 of 23 December 1994. Source: Republic of Seychelles. "Seychelles's Commercial Legislation", vol. II, edition 1995, Ministry of Finance and Communications, p. B-5 to B-57.
International Trusts Act, Act 26 of 23 December 1994. Source: Republic of Seychelles. "Seychelles's Commercial Legislation", vol. II, edition 1995, Ministry of Finance and Communications, p. C-4 to C- 29.
Seychelles International Business Authority Act, Act 27 of 1994. Source: Republic of Seychelles, "Seychelles's Commercial Legislation", vol. 11, edition 1995, Ministry of Finance and Communications, p. A-1 to A-6.
Investment Promotion Act (IPA), 1994, effective January 1995. Source: (http://www.afdb.org).
Investment Promotion (Concessions and Incentives) Regulations, 1995 (S.I. No. 1 of 1995)Source: Official Gazette, Supplement, 1995-01-09, pp. 1-8
International Trade Zone Act, Act 8 of June 1995. Source: Republic of Seychelles, "Seychelles's Commercial Legislation", vol. II, edition 1995, Ministry of Finance and Communications, p. D-2 to D-10.
S.I. 88 of 1995 International Trust Act, 1994 Regulation. International Trust (Fees) Regulations, 1995 of 18 August 1995. Source: Republic of Seychelles, "Seychelles's Commercial Legislation", vol. 11, edition 1995, Ministry of Finance and Communications, p. C-30.
S.I. of 1995 International Trade Zone Regulations of 8 November 1995. Source: Republic of Seychelles. "Seychelles's Commercial Legislation", vol. 11, edition 1995, Ministry of Finance and Communications, p. E-1 to E-7.
Foreign Earnings (Regulation) Act, 1996, effective 1 January 1997. Source: (http://www.afdb.org).
International Trade Zone (Employment) Regulations, 1997 (S.I. 13 of 1997).Source: Official Gazette, Supplement, p. 429-461.
Investment Code of Seychelles Act 13 of 2005. Source: http://www.sib.gov.sc/download/Investment%20Code%20of%20Seychelles.pdf.

World Investment Directory Volume X Africa 2008
560
II. International Framework
A. Seychelles is a party to the following multilateral and regional instruments:
Convention on the Settlement of Investment Disputes between States and Nationals of other States of 1965. Entered into force on 14 October 1966.
Convention Establishing the Multilateral Investment Guarantee Agency of 1985, entered into force on 12 April 1988.
Fourth ACP - EEC Convention (Lome IV) of 1989, entered into force on 1st March 1990.
Southern Africa Development Community (SADC), signed on 17 August, 1992.Source: http://www.sadc.int/about_sadc/history.php.
Treaty Establishing the Market for Eastern and Southern Africa (COMESA), 1993.
Paris Convention for the Protection of Industrial Property of 1883 (Revised at Brussels in 1900, Washington in 1911, The Hague in 1925, London in 1934, Lisbon in 1958 and Stockholm in 1967, and as amended in 1979). Signed in 1994.
Partnership Agreement between the Members of The African, Caribbean and Pacific Group of States, of the one part and the European Community and its member states, of the other part signed in Cotonou, Benin on 23 June 2000.
B. Bilateral treaties
1. Bilateral investment treaties for the protection and promotion of investments: Cyprus 1998, Egypt 2002.
2. Bilateral treaties for the avoidance of double taxation: Norway 1955, Switzerland 1963, Japan 1970, South Africa 1998, China 1999, Indonesia 1999, Thailand 2001, Malaysia 2003, Oman 2003, Mauritius 2005, Viet Nam 2005, United Arab Emirates 2006.
C. Other treaties:
Investment agreement for the COMESA Common Investment Area (2007).

Seychelles
561
D. Sources of information
Official
Central Bank of Seychelles (www.cbs.sc).
Secondary
African Development Bank (1998). African Development Report 1998 (London: Oxford University Press).
Bennell, Paul (1997a). "Foreign direct investment in Africa: rhetoric and reality", SAIS Review (Summer/Fall); pp. 127-139.
___________ (1997b). "Privatization in Sub-Saharan Africa: progress and prospects during the 1990s", World Development, vol. 25, no. 11, pp. 1785-1803.
Economist Intelligence Unit (EIU) (various years).Country Profile: Seychelles (London: EIU Ltd.).
_____________(various years).Country Report: Seychelles (London: EIU Ltd.).
International Finance Corporation (IFC) (1997). Foreign direct investment, IFC: lessons of experience series No. 5, (Washington, D.C.: World Bank).
International Monetary Fund (IMF) (2006). IMF's Sub-Saharan Africa Regional Economic Outlook, March 10, 2006. (Washington D.C.: IMF).
Makila, Mosima (2003). "The attraction of the foreign direct investment (FDI) by the African countries"; paper presented at the biennial ESSA conference, 17 – 19 September 2003, Sommerset West, Cape Town.
Maubouche, R. and N. Hadjitarkhani (1980). Seychelles Economic Memorandum (Washington, D.C.: World Bank).
Soderbom, M. and F. Teal (2004). "Size and Efficiency in Africa Manufacturing firms: Evidence from Firm-Level Panel Data." Journal of Development Economics, 73. pp 369 - 394.
United Nations Conference on Trade and Development (UNCTAD) (1995). Foreign Direct Investment in
Africa, (Geneva: United Nations, United Nations publication, Sales No. E.95.II.A.6).
_____________(2000). Capital Flows and Growth in Africa (Geneva: UNCTAD/GDS/MDPB/7), July.
___________ _(2005a). Investor-Disputes Arising from Investment Treaties: A Review. UNCTAD Series of International Investment Policies for Development (UNCTAD/ITE/IIT/2005/4).
_____________(2005b). A Survey of Support by Investment Promotion Agencies to Linkages. Advisory Studies No. 18 (UNCTAD/ITE/IPC/2005/12).
United States Trade Representative (2006). 2006 Comprehensive Report on U.S. Trade and Investment
Policy Toward Sub-Saharan Africa and Implementation of the Africa Growth and Opportunity Act:
The Sixth of Eight Annual Reports, May 2006. (Washington D.C.: US Government).
World Bank/International Finance Corporation (2007). Doing Business 2008 Seychelles (Washington D.C.: The World Bank Group).

Sierra Leone
563
Sierra Leone
A. Definitions and sources of data
The Bank of Sierra Leone and the International Monetary Fund (IMF) collect foreign direct investment (FDI) data in Sierra Leone. The data provided by the Bank of Sierra Leone are based on the guidelines of the IMF 4th edition balance-of-payment (BOP) manual. Efforts are under way in Sierra Leone for adopting the guidelines of the 5th edition BOP manual for compiling statistics for BOP and international investment positions. FDI in the country is concentrated in the country's extractive industries.
The Government of Sierra Leone is working to revive the interest of private investment in the country, after recent major civil conflicts. As a result, the Government in 1994 established the Sierra Leone Export Development and Investment Corporation and enacted the Income Tax Amendment Act of 1994. Other legislation that are supposed to ease private sector activities and investment are also in place. These include the Tourism Act 1990, Mines and Minerals Decree 1998, and the Fisheries Management and Development Decree 1994. These Acts revise the legal framework and regulate the activities and procedures of the private sector.
Sierra Leone signed to the Convention on the Settlement of Investment Disputes between State and Nationals of other States on 27 September 1965, made effort to integrate into the global production system and has a wide export market access. It is a member of the Mano River Union (MRU). The main aim of the MRU is economic and trade cooperation, through:
eliminating obstacles to the movement of people and goods. a common policy for developing fishing and forestry. a common programme for developing transport, communications and energy. promoting good relations between the member states. a common investment policy. a common monetary policy. common policies on health, arts, sport, culture and international trade.
Sierra Leone also belongs to the Economic Community of West African States, the African Union, the New Partnership for Africa's Development and the Multilateral Investment Guarantee Agency. Its trade policies are harmonized with the countries of the wider world while its membership of the organizations provides non-commercial risk coverage for foreign investors in the country. The country is also eligible for the generalized system of preferences for the least developed countries, the Everything But Arms initiative by the European Union, the Cotonou Agreement for renegotiating the African, Caribbean and Pacific countries' partnership treaty with the EU, the United States' market access initiative for African countries - the African Growth and Opportunity Act and a member of the World Trade Organization.

World Investment Directory Volume X Africa 2008
564
B. Statistics on FDI and the operations of TNCs
Table 1. Summary of FDI
(Millions of dollars)
Variable Inward Outward
1. FDI flows, 2003-2006 (annual average) 42.8 - 0.9
2. FDI flows as a percentage of GFCF, 2003-2006 (annual average) 20.0 - 0.4
3. FDI stocks, 2006 343 -
4. FDI stocks as a percentage of GDP, 2006 24.1 0.0
Source: Based on tables 3 and 4 and UNCTAD, FDI/TNC database.
Table 3. FDI flows, by type of investment, 1980-2006
(Millions of dollars)
Inward investment Outward investment
Reinvested Reinvested
Year Equity earnings Other Total Equity earnings Other Total
1980 - 5.8 0.1 - 13.0 - 18.7 .. .. .. ..1981 7.5 - .. 7.5 .. .. .. ..1982 1.5 20.6 - 17.4 4.7 .. .. .. ..1983 0.2 5.6 - 4.1 1.7 .. .. .. ..1984 - 7.1 - 1.2 5.9 .. .. .. ..1985 - - 27.2 - 3.8 - 31.0 .. .. .. ..1986 - 0.0 - 133.9 - 6.4 - 140.3 .. .. .. ..1987 - 1.9 39.8 1.4 39.4 .. .. .. ..1988 - - 20.4 - 2.7 - 23.1 .. .. .. - 0.21989 - 21.1 1.3 22.4 .. .. .. - 0.11990 - 32.5 - 0.0 32.4 .. .. .. 0.11991 - 11.4 - 3.9 7.5 .. .. .. -1992 - - 5.4 - 0.2 - 5.6 .. .. .. 0.31993 - - 7.4 - 0.0 - 7.5 .. .. .. 0.11994 - - 3.2 0.3 - 2.9 .. .. .. 0.21995 - 4.3 3.0 7.3 .. .. .. 0.61996 - 0.7 - 0.1 0.7 .. .. .. -1997 - 1.9 - 0.1 1.8 .. .. .. -1998 - 0.1 0.0 0.1 .. .. .. -1999 - 1.5 - 1.0 0.5 .. .. .. 0.12000 - 1.4 37.6 38.9 .. .. .. -2001 .. 0.4 9.4 9.8 .. .. .. -2002 6.8 1.6 2.1 10.4 .. .. .. -2003 13.0 3.1 - 7.5 8.6 .. .. .. 1.12004 24.5 9.3 27.4 61.2 .. .. .. -2005 28.5 24.7 5.3 58.6 .. .. .. - 7.52006 - - - 42.8 .. .. .. 2.7
Source: UNCTAD, FDI/TNC database (www.unctad.org/statistics). Note: Data on inflows are from IMF for 1980-1989 and the Bank of Sierra Leone for 1990-2005. 2006 is estimated. Data for outflows in 2005 are from IMF and the rest are proxy data based on investments reported by the following economies: 1988 France. 1989 Belgium and Luxembourg and France. 1990 and 1992 Belgium and Luxembourg. 1993-1995 China. 1999 Czech Republic. 2003 Romania. 2006 Sweden.
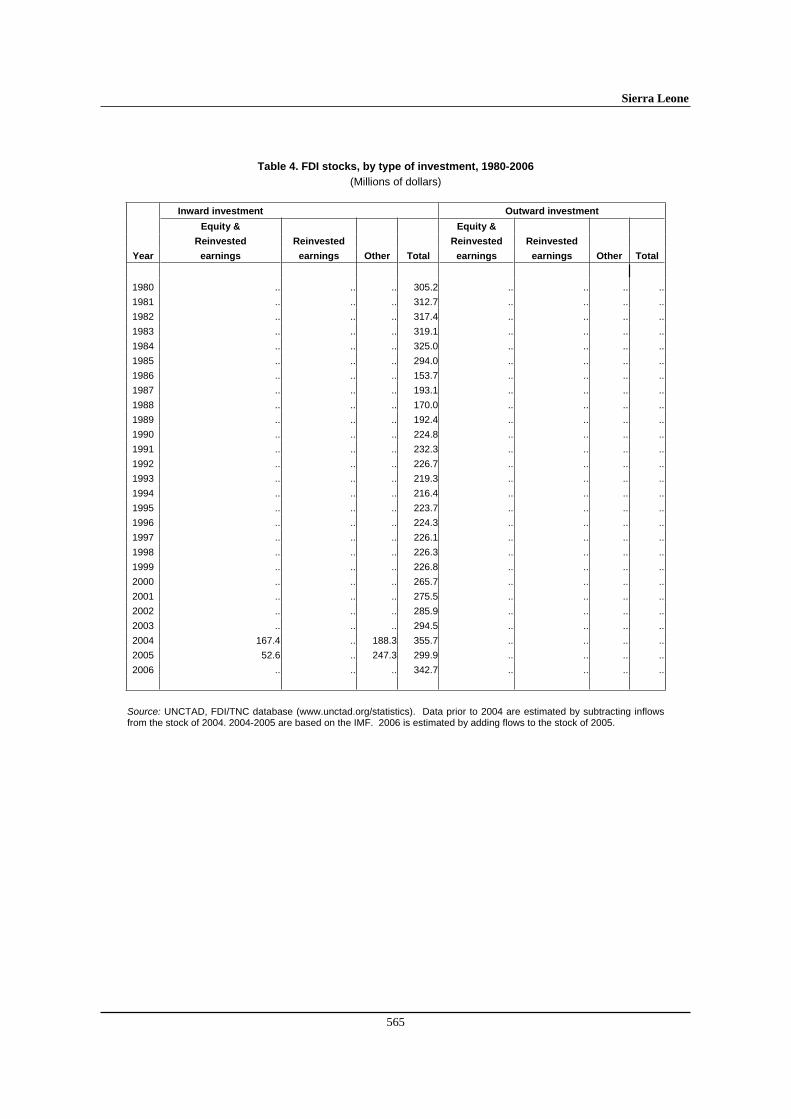
Sierra Leone
565
Table 4. FDI stocks, by type of investment, 1980-2006
(Millions of dollars)
Inward investment Outward investment
Equity & Equity &
Reinvested Reinvested Reinvested Reinvested
Year earnings earnings Other Total earnings earnings Other Total
1980 .. .. .. 305.2 .. .. .. ..
1981 .. .. .. 312.7 .. .. .. ..
1982 .. .. .. 317.4 .. .. .. ..
1983 .. .. .. 319.1 .. .. .. ..
1984 .. .. .. 325.0 .. .. .. ..
1985 .. .. .. 294.0 .. .. .. ..
1986 .. .. .. 153.7 .. .. .. ..
1987 .. .. .. 193.1 .. .. .. ..
1988 .. .. .. 170.0 .. .. .. ..
1989 .. .. .. 192.4 .. .. .. ..
1990 .. .. .. 224.8 .. .. .. ..
1991 .. .. .. 232.3 .. .. .. ..
1992 .. .. .. 226.7 .. .. .. ..
1993 .. .. .. 219.3 .. .. .. ..
1994 .. .. .. 216.4 .. .. .. ..
1995 .. .. .. 223.7 .. .. .. ..
1996 .. .. .. 224.3 .. .. .. ..
1997 .. .. .. 226.1 .. .. .. ..
1998 .. .. .. 226.3 .. .. .. ..
1999 .. .. .. 226.8 .. .. .. ..
2000 .. .. .. 265.7 .. .. .. ..
2001 .. .. .. 275.5 .. .. .. ..
2002 .. .. .. 285.9 .. .. .. ..
2003 .. .. .. 294.5 .. .. .. ..
2004 167.4 .. 188.3 355.7 .. .. .. ..
2005 52.6 .. 247.3 299.9 .. .. .. ..
2006 .. .. .. 342.7 .. .. .. ..
Source: UNCTAD, FDI/TNC database (www.unctad.org/statistics). Data prior to 2004 are estimated by subtracting inflows from the stock of 2004. 2004-2005 are based on the IMF. 2006 is estimated by adding flows to the stock of 2005.

World Investment Directory Volume X Africa 2008
566
Table 6. FDI flows in the host economy, by geographical origin, 1995-2006 (Millions of dollars)
Reporting countries 1992 1993 1994 1995 1996 1997 1998 1999 2000 2001 2002 2003 2004 2005 2006
Belgium/Luxembourg - - - .. .. .. - - 2.8 - - - - - -China - - - .. .. .. - - - - - - 5.9 0.5 -Czech Republic - - - .. .. .. - - - - - 0.2 - - -Denmark - - - .. .. .. - - - - - - - - 0.3 0.7Germany 1.3 - - .. .. .. - - - - - 1.9 - - - -Sweden 0.2 0.0 0.1 .. .. .. - 0.8 - 0.9 0.1 0.4 0.2 - - 29.6 - 13.9United States - - - .. .. .. - 1.0 1.0 4.0 1.0 1.0 2.0 - 2.0 - 1.0 - Source: UNCTAD, FDI / TNC database. Note: Data is based on the information reported by the economies listed above.
Table 9. FDI flows abroad, by geographical destination, 1995-2006 (Millions of dollars)
Reporting countries 1992 1993 1994 1995 1996 1997 1998 1999 2000 2001 2002 2003 2004 2005 2006
China - 0.1 0.2 0.6 .. .. .. - .. .. .. - .. .. ..Czech Republic - - - - .. .. .. 0.1 .. .. .. - .. .. ..Korea, Republic of - - - - .. .. .. 0.1 .. .. .. - .. .. ..Romania - - - - .. .. .. - .. .. .. 1.1 .. .. .. Source: UNCTAD, FDI / TNC database. Note: Data is based on the information reported by the economies listed above.
Table 12. FDI stocks in the host economy, by geographical origin, 1995-2006 (Millions of dollars)
Reporting countries 1992 1993 1994 1995 1996 1997 1998 1999 2000 2001 2002 2003 2004 2005 2006
China - - - .. .. - - - - - - - 5.7 18.5 -Czech Republic - - - .. .. - - - - - - 3.2 - - -Denmark - - - .. .. - - - - - - - 1.5 0.5 0.7United Kingdom 1.5 - 3.1 .. .. - - - - - - - - - -United States - - 4.0 .. .. 32.0 2.0 6.0 10.0 11.0 12.0 15.0 13.0 3.0 3.0 Source: UNCTAD, FDI / TNC database. Note: Data is based on the information reported by the economies listed above.
Table 15. FDI stocks abroad, by geographical destination, 1995-2006 (Millions of dollars)
Reporting countries 1992 1993 1994 1995 1996 1997 1998 1999 2000 2001 2002 2003 2004 2005 2006
Korea, Republic of - - - - - - - 0.1 0.1 0.1 0.1 0.1 0.1 0.1 0.1 Source: UNCTAD, FDI / TNC database. Note: Data is based on the information reported by the Republic of Korea.
Tables 23, 30, 35, 40, 45 and 50. The number, assets, employees, wages and salaries, sales and value added of foreign affiliates of United States' TNCs in Sierra Leone, 1995-2006
(Number, thousands of employees and millions of dollars)
Table no./Variable 1992 1993 1994 1995 1996 1997 1998 1999 2000 2001 2002 2003 2004 2005 2006
23. Number 3 2 2 2 2 2 2 1 .. .. .. 1 1 .. ..30. Assets 180 164 .. .. .. .. .. .. 8 9 9 .. .. .. ..35. Employees .. 2.2 .. 0.1 0.1 0.1 0.1 .. 0.2 0.2 0.2 .. .. .. ..40. Wages and Salaries .. 6.0 .. 1.0 1.0 1.0 .. .. 2.0 2.0 2.0 .. .. .. ..45. Sales 108.0 81.0 .. 9.0 11.0 11.0 9.0 .. 7.0 7.0 7.0 .. .. .. ..50. Value added a .. .. .. 7.0 8.0 9.0 7.0 .. 1.0 1.0 1.0 .. .. .. ..
Source: UNCTAD, FDI/TNC database. Note: Data are based on information reported by the United States. a Data refer to majority-owned affiliates only.

Sierra Leone
567
Table 88. Largest affiliates of foreign TNCs in the host economy, 2007
(Millions of dollars and number)
Company Home economy Industry Sales Employees
A. Industrial
.. .. .. .. ..
B. Tertiary
Marz Chemicals (Sl) Ltd United Kingdom Wholesale trade .. 20
Interwest Trading Ltd United Arab Emirates Supporting transport activities .. 5
Bt (Sl) Limited United Kingdom Telecommunications .. ..
Maersk Sierra Leone Ltd Denmark Other services .. ..
Peterson Zochonis Sierra Leone Ltd United Kingdom Public administration .. ..
Sierra Leone Plastics Ltd United Kingdom Public administration .. ..
C. Finance and Insurance Assets Employees
Standard Chartered Bank Sierra Leone Ltd United Kingdom Finance .. ..
Source: Who Owns Whom database (https://solutions.dnb.com/wow), retrieved January 2008.

World Investment Directory Volume X Africa 2008
568
C. Legal frameworks for transnational corporations
Sierra Leone has adopted and signed on to a number of national, bilateral and multilateral legal instruments to enable an efficient regulation of transnational corporations and foreign direct investors. The following key instruments are applicable in the country:
I. National framework
Trade Marks: Merchandise Marks Act No. 7, Chapter 245, of 1889, 12 of 1889, 2 of 1908, 32 of 1908, 39 of 1908, 24 of 1955, as amended by the Laws (Adaptation) Act No. 29 of 1972. Source: WIPO (http://www.wipo.org).
Merchandise Marks Act No. 7, chapter 245, of 1889, 2 of 1908, 32 of 1908, 39 of 1908, 24 of 1955, as amended by the Laws (Adaptation) Act No. 29 of 1972. Source: WIPO (http://www.wipo.org).
Trade Marks Act No. 17, Chapter 244, of 1913, Sec. 30 of No. 12 of 1924, 10 of 1940, as amended by the Laws (Adaptation) Act No. 29 of 1972. Source: WIPO (http://www.wipo.org).
Trade Marks (Certificate of Registration) Order, O. in C. No. 1 of 1915, as last amended by the Laws (Adaptation) Act No. 29 of 1972. Source: WIPO (http://www.wipo.org).
Patents: Patents Act No. 21, Chapter 247, of 1924, 10 of 1932, 31 of 1932, 9 of 1957, as amended by the Laws (Adaptation) Act No. 29 of 1972. Source: WIPO (http://www.wipo.org).
Diamond Industry Profit Tax Ordinance No. 23 of 1935; effective on 25 November 1935. Source: The Laws of Sierra Leone, cap. 200, vol. IV, Revised Edition 1961, p. 2097.
Industrial Designs: United Kingdom Designs (Protection) Act No. 17 of 1936, as amended by the Laws (Adaptation) Act No. 29 of 1972. Source: WIPO (http://www.wipo.org).
Companies Act No. 18 of 1937, as amended by Act No. 6 of 1978. Source: The Laws of Sierra Leone, cap. 249, vol. V, Revised Edition 1960, p. 2676.
Diamond Protection Act No. 28 of 1956; effective on 22 November 1956. Source: The Laws of Sierra Leone, cap. 199, vol. IV, Revised Edition 1961, p. 2094.
Mining (Mineral Oil) Regulation No. 8 of 1958. Source: Sierra Leone Gazette, No. 3 of 14 January 1960.
Copyright Act No. 28 of 1965; effective: 6 August 1965. Source: Sierra Leone Gazette, No. 62 of 12 August 1965 (Supplement).
Tourist and Hotel Development Act No. 61, effective on 14 January 1965. As amended by Development of Tourism Act, 1990. Source: Sierra Leone Gazette, No. 4 of 14 January 1965.

Sierra Leone
569
Non-Citizens (Interest in Land) Act No. 30 of 1966. Source: Sierra Leone Gazette, No. 27 of 22 September 1966
Non-Citizens (Interest in Land) Amendment Decree No. 7 of 1968 (N.I.C.); effective on 8 February 1968. Source: Legislation of Sierra Leone 1968, Chronological Index of Acts and Public Notices of 1968, p. A15.
Non-Citizens (Trade and Business) Act No. 9 of 1969; effective on 21 August 1969. Source: Legislation of Sierra Leone 1969, Chronological Index of Acts and Public Notices of 1969, p. A35.
Non-Citizens (Trade and Business) Amendments Act No. 5 and 6 of 1970, effective on 20 March and 24 September 1970, respectively. Source: Legislation of Sierra Leone 1970, Chronological Index of Acts and Public Notices of 1970, pp. A9 and A93.
Non Citizens (Trade and Business) Order 1971. Source: Sierra Leone Gazette, No. 10 of 12 February 1972
Regulations of Wages and Industrial Relations Act No. 18 of 1971; effective on 15 December 1971. Source:Sierra Leone Gazette, No. 76 of 10 December 1971.
Business Registration Act No. 17 of 1972. Source: Legislation of Sierra Leone 1972, Chronological Index of Acts and Public Notices of 1972, p. A67.
Patent Fees, Design and Trade Mark Fees, December 1979. Source: WIPO (http://www.wipo.org).
Patent Fees, Design Fees and Trade Mark Fees, December 1979. Source: WIPO (http://www.wipo.org).
Patent Fees, Design Fees and Trade Mark Fees, December 1979. Source: WIPO (http://www.wipo.org).
Development of Industries Act No. 6 of 23 September 1983; effective on 17 November 1983. Repealed by Development of Industries (Repeal) Decree 1993 Source: Sierra Leone Gazette of 17 November 1993.
Business Registration (Amendment) Act No. 13 of 1983. Source: Sierra Leone Gazette, No. 76 of 22 December 1983.
Supplemented by Mines and Minerals Decree, 1994. Source: Ministry of Industry and Mines, 1994.
Appellations of Origin / Geographical Indications / Indications of Source: Source: WIPO (http://www.wipo.org).
II. International Framework
A. Sierra Leone is a party to the following multilateral and regional instruments:
Convention on the Settlement of Investment Disputes between States and Nationals of other States of 1965. Entered into force on 14 October 1966.

World Investment Directory Volume X Africa 2008
570
Convention Establishing the Inter-Arab Investment Guarantee Corporation of May 1971; entered into force in April 1974.
Agreement for the Promotion, Protection and Guarantee of Investment Among Member States of the Organization of Islamic Conference, of I June 1981; entered into force on 23 September 1986.
Unified Agreement for the Investment of Arab Capital in the Arab States of 1982.
Convention Establishing the Multilateral Investment Guarantee Agency of 1985, entered into force on 12 April 1988.
Fourth ACP - EEC Convention (Lome IV) of 1989, entered into force on 1st March 1990.
Articles of Agreement of the Islamic Corporation for the Insurance of Investment and Export Credit of 19 February 1992. Entered into force on 1 August 1994.
Revised Treaty of the Economic Community of West African States (ECOWAS) 1993.
Paris Convention for the Protection of Industrial Property of 1883 (Revised at Brussels in 1900, Washington in 1911, The Hague in 1925, London in 1934, Lisbon in 1958 and Stockholm in 1967, and as amended in 1979). Signed in 1994.
Marrakesh Agreement Establishing the World Trade Organisation of 15 April 1994. Entered into force on 1 January 1995. Agreement on Trade-Related Investment Measures. General Agreement on Trade in Services. Agreement on Trade Related Aspects of Intellectual Property Rights.
Partnership Agreement between the Members of The African, Caribbean and Pacific Group of States, of the one part and the European Community and its member states, of the other part signed in Cotonou, Benin on 23 June 2000.
B. Bilateral treaties
1. Bilateral investment treaties for the protection and promotion of investments: Germany 1965, United Kingdom 2000, China 2001.
2. Bilateral treaties for the avoidance of double taxation: United Kingdom 1947, Denmark 1954, Norway 1955, India 1956.

Sierra Leone
571
D. Sources of Information
Official
Bank of Sierra Leone (www.bankofsierraleone.org).
Sierra Leone Export Development and Investment Corporation (www.slis.cx).
Secondary
Collier, Paul and Anke, Hoeffler (1995). "War, peace and private portfolio", in World Development, vol. 23, no 2, pp. 233-41.
Cooper, Neil (2002). "The role of demilitarisation in promoting democracy and prosperity in Africa", Chapter 6 in Brauer and Dunne (2000).
Economist Intelligence Unit (various years). Country Profile: Sierra Leone (London: EIU Ltd.).
____________(various years). Country Report: Sierra Leone (London: EIU Ltd.).
International Monetary Fund (IMF) (2003). "Sierra Leone: joint staff assessment of the poverty reduction strategy paper preparation status report", IMF Country Reports Nos. 03/182-3, June 2003.
____________(2006). IMF's Sub-Saharan Africa Regional Economic Outlook, March 10, 2006. (Washington D.C.: IMF).
Sierra Leone Export Development and Investment Corporation, "Trade and investment opportunities in Sierra Leone" (www.slis.cx), undated.
Soderbom, M. and F. Teal (2004). "Size and Efficiency in Africa Manufacturing firms: Evidence from Firm-Level Panel Data." Journal of Development Economics, 73. pp 369 - 394.
United Nations Commission on science and technology for development (UNCSTD) (2002). Panel on linking foreign direct investment (FDI) technology development for capacity building, and strategic competitiveness: The Sierra Leone situation: Colombo, Sri Lanka, 15 – 17 October (www.unctad.org/stdev/un/sierraleone.doc).
United Nations Conference on Trade and Development (UNCTAD) (2002). FDI in the Least Developed Countries at a Glance (Geneva: UNCTAD/ITE/IIA/6).
____________(2005a). Investor-Disputes Arising from Investment Treaties: A Review. UNCTAD Series of International Investment Policies for Development (UNCTAD/ITE/IIT/2005/4).
____________(2005b). A Survey of Support by Investment Promotion Agencies to Linkages. Advisory Studies No. 18 (UNCTAD/ITE/IPC/2005/12).
____________(2005c). FDI in least developed countries at a glance: 2005/2006
(UNCTAD/ITE/IIA/2005/17).
United States Trade Representative (2006). 2006 Comprehensive Report on U.S. Trade and Investment
Policy Toward Sub-Saharan Africa and Implementation of the Africa Growth and Opportunity Act:
The Sixth of Eight Annual Reports, May 2006. (Washington D.C.: US Government).
World Bank/International Finance Corporation (2007). Doing Business 2008 Sierra Leone (Washington D.C.: The World Bank Group).


Somalia
573
Somalia
A. Definitions and sources of data
In Somalia, Foreign Investment Law No. 19 of 1987 governs all foreign investment in the country, including foreign direct investment (FDI). In this law, foreign investment includes convertible currency specified by the Central Bank of Somalia and transferred to Somalia; machinery, equipment, spare parts, installations and current production inputs, whose importation is permitted under the prevailing import legislation; patent rights, trade marks and licenses registered in Somalia, provided they are for the activities to be pursued under the approved investment; foreign currency spent on studies and technical documentation, prepared in line with the approved investment and; profits reinvested from foreign investment approved in accordance with this law. The International Monetary Fund provides data on FDI in Somalia in its balance-of-payment statistics. The Mining Code, law No. 7 of 1984, governs mining activities.
The foreign investment law provides several incentives, such as exemption from taxes and customs duties for foreign investors. It aims at channeling FDI inflows to certain industries of the national economy, particularly agriculture, industry, fishing and forestry. The Committee on Foreign Investment which was set up to centralize investment matters in one authority and facilitate the investment approval process in conjunction with the State Planning Commission is responsible for authorizing investment projects. There are no restrictions on profit transfer and repatriation of invested capital is allowed on approval by the Committee on Foreign Investment.
Infrastructure is improving in the country. Small private companies linked to overseas satellite operators provide telecommunications in major towns. Three telecommunication companies, serve Mogadishu. Four firms serve Hargeisa, offering cellular phones and direct international calls at cheap rates. A local internet service provider operates in Mogadishu. In 2005, Somalia’s largest mobile-phone operator, Telsom Mobile, started to upgrade its system. The country's energy provision is also being upgraded. In Somaliland, an agreement to upgrade the Hargeisa power infrastructure has started and the management of oil storage facilities at Berbera was put in the hands of Total Red Sea, a local subsidiary of a French oil company, TotalFinaElf. The Danish Government also gave a grant of $3 million to finance renovation of the power plant at Bossasso.
There has been some exploration of Somalia's mineral resources. A British firm, Rovagold, was permitted to prospect for oil off the Somaliland coast in collaboration with two Chinese firms in 2001. A technical evaluation agreement was also signed by the Transitional National Assembly and TotalFinaElf for the company to determine the oil reserves. Most of Somalia's proven reserves lie off the Somaliland coast and an agreement on drilling and extraction exist between the Seminal Copenhagen Group and the Somaliland Government. Commercially exploitable deposits of gold, silver, tungsten, manganese, titanium, chromium and nickel were discovered at Jezira, Mogadishu in 1989 but were not developed. Local non-metallic mineral deposits were used in a cement factory and a gypsum plant at Berbera before the civil war, but both plants are defunct.
Somalia signed to the Convention on the Settlement of Investment Disputes between State and Nationals of other States on 27 September 1965 and is a member of several regional integration schemes such as the African Union, New Partnership for Africa's Development, the Inter-governmental Authority on Development and the League of Arab States. Somalia is also eligible for the generalized system of preferential market access schemes and the Cotonou Agreement for renegotiating the African, Caribbean and Pacific, European Union (ACP-EU) partnership agreement. The Cotonou Agreement builds on the achievements of the former Lomé Conventions, as the basis of cooperation between the EU and ACP countries.

World Investment Directory Volume X Africa 2008
574
B. Statistics on FDI and the operations of TNCs
Table 1. Summary of FDI
(Millions of dollars)
Variable Inward Outward
1. FDI flows, 2003-2006 (annual average) 28.6 -
2. FDI flows as a percentage of GFCF, 2003-2006 (annual average) 6.4 -
3. FDI stocks, 2006 118 -
4. FDI stocks as a percentage of GDP, 2006 5.1 0.0
Source: Based on tables 3 and 4 and UNCTAD, FDI/TNC database.
Table 3. FDI flows, by type of investment, 1980-2006
(Millions of dollars)
Inward investment Outward investment
Reinvested Reinvested
Year Equity earnings Other Total Equity earnings Other Total
1980 .. .. .. - 0.0 .. .. .. ..1981 .. .. .. 0.1 .. .. .. ..1982 .. .. - 0.8 - 0.8 .. .. .. ..1983 .. .. - 8.2 - 8.2 .. .. .. ..1984 .. .. - 14.9 - 14.9 .. .. .. ..1985 .. .. - 0.7 - 0.7 .. .. .. ..1986 .. .. .. 3.1 .. .. .. ..1987 .. .. .. 64.3 .. .. .. ..1988 .. .. .. - 43.4 .. .. .. ..1989 .. .. .. - 41.2 .. .. .. ..1990 .. .. .. 5.6 .. .. .. ..1991 .. .. .. - 0.2 .. .. .. ..1992 .. .. .. - 0.1 .. .. .. ..1993 .. .. .. 2.0 .. .. .. ..1994 .. .. .. 1.0 .. .. .. ..1995 .. .. .. 1.0 .. .. .. ..1996 .. .. .. 1.3 .. .. .. ..1997 .. .. .. 1.1 .. .. .. ..1998 .. .. .. 0.0 .. .. .. ..1999 .. .. .. - 0.8 .. .. .. ..2000 .. .. .. 0.3 .. .. .. ..2001 .. .. .. 0.0 .. .. .. ..2002 .. .. .. 0.1 .. .. .. ..2003 .. .. .. - 0.9 .. .. .. ..2004 .. .. .. - 4.8 .. .. .. ..2005 .. .. .. 24.0 .. .. .. ..2006 .. .. .. 96.0 .. .. .. ..
Source: UNCTAD, FDI/TNC database (www.unctad.org/statistics). Data are based on OECD for 1980-1981, 1986-1992 and 1998-2004, IMF for 1982-1985, World Bank for 1993-1997 and estimate for 2005-2006. . Data are based on OECD for 1980-1981, 1986-1992 and 1998-2004, IMF for 1982-1985, World Bank for 1993-1997 and estimate for 2005-2006.

Somalia
575
Table 4. FDI stocks, by type of investment, 1980-2006
(Millions of dollars)
Inward investment Outward investment
Reinvested Reinvested
Year Equity earnings Other Total Equity earnings Other Total
1980 .. .. .. 34.1 .. .. .. ..
1981 .. .. .. 34.2 .. .. .. ..
1982 .. .. .. 33.4 .. .. .. ..
1983 .. .. .. 25.2 .. .. .. ..
1984 .. .. .. 10.2 .. .. .. ..
1985 .. .. .. 9.5 .. .. .. ..
1986 .. .. .. 12.6 .. .. .. ..
1987 .. .. .. 76.9 .. .. .. ..
1988 .. .. .. 33.5 .. .. .. ..
1989 .. .. .. - 7.6 .. .. .. ..
1990 .. .. .. - 2.0 .. .. .. ..
1991 .. .. .. - 2.2 .. .. .. ..
1992 .. .. .. - 2.3 .. .. .. ..
1993 .. .. .. - 0.2 .. .. .. ..
1994 .. .. .. 0.8 .. .. .. ..
1995 .. .. .. 1.8 .. .. .. ..
1996 .. .. .. 3.1 .. .. .. ..
1997 .. .. .. 4.2 .. .. .. ..
1998 .. .. .. 4.2 .. .. .. ..
1999 .. .. .. 3.4 .. .. .. ..
2000 .. .. .. 3.7 .. .. .. ..
2001 .. .. .. 3.7 .. .. .. ..
2002 .. .. .. 3.8 .. .. .. ..
2003 .. .. .. 3.0 .. .. .. ..
2004 .. .. .. - 1.8 .. .. .. ..
2005 .. .. .. 22.2 .. .. .. ..
2006 .. .. .. 118.2 .. .. .. ..
Source: UNCTAD, FDI/TNC database (www.unctad.org/statistics).
Note: Data are estimated by accumulating inflows since 1970.

World Investment Directory Volume X Africa 2008
576
Table 6. FDI flows in the host economy, by geographical origin, 1992 - 2006
(Millions of dollars) Reporting country 1992 1993 1994 1995 1996 1997 1998 1999 2000 2001 2002 2003 2004 2005 2006
United States - - - - - - - 29.0 - - - - - - -
Source: UNCTAD, FDI / TNC database.Note: Data is based on the information reported by the United States.
Table 9. FDI flows abroad, by geographical destination, 1992 - 2006
(Millions of dollars) Reporting countries 1992 1993 1994 1995 1996 1997 1998 1999 2000 2001 2002 2003 2004 2005 2006
Estonia - - - - - - - - - - - - 0.03 - -
Source: UNCTAD, FDI / TNC database.Note: Data is based on the information reported by Estonia.
Table 12. FDI stocks in the host economy, by geographical origin, 1992 - 2006
(Millions of dollars) Reporting countries 1992 1993 1994 1995 1996 1997 1998 1999 2000 2001 2002 2003 2004 2005 2006
United States - - - 1.0 - 1.0 - 1.0 - 1.0 - 29.0 29.0 29.0 29.0 29.0 29.0 29.0 29.0
Source: UNCTAD, FDI / TNC database.Note: Data is based on the information reported by the United States.
Table 15. FDI stocks abroad, by geographical destination, 1995-2006
(Millions of dollars) Reporting countries 1992 1993 1994 1995 1996 1997 1998 1999 2000 2001 2002 2003 2004 2005 2006
Bulgaria - - - - - - - - 0.003 - - - - - -Estonia - - - - - - - - - - - - 0.04 0.03 0.03
Source: UNCTAD, FDI / TNC database. Note: Data is based on the information reported by the economies listed above. Tables 23 and 30. The number and assets of foreign affiliates of the United States TNCs in Somalia, 1995-2006
(Number and millions of dollars)
Table no./Variable 1992 1993 1994 1995 1996 1997 1998 1999 2000 2001 2002 2003 2004 2005 2006
23. Number 5 2 1 1 1 1 1 .. .. .. .. .. .. .. ..30. Assets 18 8 5 5 6 6 .. .. 8 8 9 10 .. .. ..
Source: UNCTAD, FDI/TNC database. Note: Data are based on the information reported by the United States.

Somalia
577
Table 86. Largest home-based TNCs, 2007
(Billions of dollars) Company Industry Sales
A. Industrial
.. .. .. B. Tertiary Somali Airlines Transportation and storage .. C. Finance and insurance Assets
.. .. .. Source: Jeune Afrique Hors-serie No. 14, 2007
Table 87. Largest affiliates of home-based TNCs, 2007
(Millions of dollars and number) Company Name Host economy Industry Sales Employees
A. Industrial
.. .. .. .. .. B. Tertiary
Somali Airlines Italy Transport and storage .. .. C. Finance and insurance Assets Employees
.. .. .. .. Source: Who Owns Whom database (https://solutions.dnb.com/wow), retrieved January 2008.
Table 88. Largest affiliates of foreign TNCs in the host economy, 2007
(Millions of dollars and number) Company Home economy Industry Sales Employees
A. Industrial
German Agro Action Office Germany Agriculture .. 20
B. Tertiary
.. .. .. .. ..
C. Finance and Insurance Assets Employees
.. .. .. .. ..
Source: Who Owns Whom database (https://solutions.dnb.com/wow), retrieved January 2008.

World Investment Directory Volume X Africa 2008
578
C. Legal frameworks for transnational corporations
A number of regulatory national, bilateral and multilateral legal instrument apply in Somalia to regulate the activities of transnational corporations and foreign direct investors. In the absence of new instruments, the following are supposed to guide investment activities in the country:
I. National framework
Ordinance No. 1 of 22 January 1955, concerning Patents on Industrial Design; effective on 1 January 1955. Source: Faafin Rasmiah (Official Gazette), Supplement No. 2 to No. 1 of 25 January 1955, p. 67.
Ordinance No. 3 of 22 January 1955, concerning Trademarks; effective on I January 1955. Source: Faafn Rasmiah (Official Gazette), Supplement No. 2 to No. l of 25 January 1955, p. 97.
Legislative Decree No. 5 of 5 November 1966, concerning the body of Laws on Direct Taxation (Income Tax); effective: 1 January 1967. Source: Faafin Rasmiah (Official Gazette), Supplement No. 3 to No. 12 of 14 December 1966, p. 2.
Law No. 65 of 18 October 1972, enacting the Labour Code. Effective 21 October 1972. Source: Faafn Rasmiah (Official Gazette) No. 10, 25 October 1972, p. 1, 114.
The Civil Code (Chapter 2), containing Company Regulations, of 2 June 1973; effective on 1 July 1973. Source: Faafin Rasmiah (Official Gazette) No_ 6, 2 June 1973, p. 570.
Law No. 7 of 9 January 1984, regarding the Mining Code; effective on 9 January 1984. Source: Faafin Rasmiah (Official Gazette) No. 2, 28 January 1984, p. 73.
Decree No. 22 of 9 January 1984, concerning the Mining Regulations. Effective 9 January 1984. Source:Faafn Rasmiah (Official Gazette) No. 2, 28 January 1984, p. 74.
Law No. 19 of 10 July 1986. on Tariff Reduction within the Preferential Trade Area. Effective 15 September 1986. Source: Faafin Rasmiah (Official Gazette) No. 8, 1 August 1986, p. 540.
The Foreign Investment Law No. 19 of 9 May 1987; effective on 1 September 1987. Source: Faafin Rasmiah (Official Gazette) No. 9, 1 September 1987, p. 761.
II. International Framework
A. Somalia is a party to the following multilateral and regional instruments:
Agreement on Arab Economic Unity of 3 June 1957; entered into force on 30 April 1964.
Convention on the Settlement of Investment Disputes between States and Nationals of other States of 1965. Entered into force on 14 October 1966.
Agreement for the Promotion, Protection and Guarantee of Investment Among Member States of the Organization of Islamic Conference, of 1 June 1981; entered into force on 23 September 1986.
Charter on a Regime of Multinational Industrial Enterprises (MIEs) in the Preferential Trade Area for Eastern and Southern African States (PTA), signed on 21 November 1990, entered into force August 1995.
Somalia
579
Source: Preferential Trade Area for Eastern ans Southern African States: Report of the Sixteenth Meeting of the Council of Ministers, 17-19 november, 1990, Mbabane, Swaziland (PTA/CM/XVI/2)
Articles of Agreement of the Islamic Corporation for the Insurance of Investment and Export Credit of 19 February 1992. Entered into force on l August 1994.
Treaty Establishing the Market for Eastern and Southern Africa (COMESA), 1993.
B. Bilateral treaties
1. Bilateral investment treaties for the protection and promotion of investments: Germany 1981.
2. Bilateral treaties for the avoidance of double taxation: …

World Investment Directory Volume X Africa 2008
580
D. Sources of information
Official
..
Secondary
Drysdale, J. (1994). Whatever Happened to Somalia? (London: Haan).
Economist Intelligence Unit (EIU) (various years). Country Profile: Somalia (London: EIU Ltd.).
____________(various years). Country Report: Somalia (London: EIU Ltd.).
Fogarassy, H. (1999). Mission Improbable: The World Community on a UN Compound in Somalia (New York: Lexington Books).
International Monetary Fund (IMF) (2006). IMF's Sub-Saharan Africa Regional Economic Outlook, March 10, 2006. (Washington D.C.: IMF).
Lewis, I. M. (1993). Understanding Somalia: Guide to Culture, History and Social Institutions, 2nd edition (London: Haan).
Mohamed O. S. (1994). Somalia: The Missed Opportunities (Washington D.C.: US Institute of Peace Press).
Soderbom, M. and F. Teal (2004). "Size and Efficiency in Africa Manufacturing firms: Evidence from Firm-Level Panel Data." Journal of Development Economics, 73. pp 369 - 394.
United Nations (1990). "Somalia: Second UN Conference on the Least Developed Countries" (Geneva: United Nations), April.
United Nations Conference on Trade and Development (UNCTAD) (2005a). Investor-Disputes Arising
from Investment Treaties: A Review. UNCTAD Series of International Investment Policies for Development (UNCTAD/ITE/IIT/2005/4).
___________(2005b). A Survey of Support by Investment Promotion Agencies to Linkages. Advisory Studies No. 18 (UNCTAD/ITE/IPC/2005/12).
___________(2005c). FDI in least developed countries at a glance: 2005/2006
(UNCTAD/ITE/IIA/2005/17).
United States Trade Representative (2006). 2006 Comprehensive Report on U.S. Trade and Investment
Policy Toward Sub-Saharan Africa and Implementation of the Africa Growth and Opportunity Act:
The Sixth of Eight Annual Reports, May 2006. (Washington D.C.: US Government).

South Africa
581
South Africa
A. Definitions and sources of data
Foreign direct investment (FDI) in South Africa is defined as investment by foreigners/South African residents in undertakings in South Africa/abroad in which they have individually or collectively, in the case of affiliated organizations or persons, at least 10% of the voting rights. In compiling South Africa's balance-of-payment, the principle followed is that an effective voice is only possible if the investment involves control in the organization. In all cases, the ownership of 25% or more of total issued voting stock or comparable ownership or voting rights is regarded as involving control. Data on the geographic location of the origin of inward stock, and inward and outward flows and on the sectoral distribution of FDI flows are calculated on foreign liabilities and assets values reported by the Reserve Bank of South Africa. The International Monetary Fund also provides data on FDI in the country in its balance-of-payment statistics.
The Government of South Africa is eager to attract FDI and has put policies in place to achieve this goal. The Government does not require approval for investment and foreign investors in most cases are subject to the same laws as domestic investors. Non-residents may invest directly through a resident company, branch or partnership. The 1973 Companies Act permits the establishment of a private or public limited-liability company. Most foreign firms setting up South African subsidiaries are private companies. The Close Corporation Act of 1984 (Act 69) created a third legal form for corporations, which is well suited to small businesses.
The rights of foreign owners are not legally restricted except in banking and there is no limit to the foreign ownership of investments. Foreigners are free to acquire freehold title to land anywhere in the country. Certain industrial sites offer land for long-term lease only. In many parts of the country land rights are separated from mineral rights. Firms should investigate title deeds which are public documents in local registries to check the ownership of mineral rights. These rights are the focus of a new policy that calls for transferring ownership of all domestic mineral rights to the state. The Department of Trade and Industry has recently completed a process of restructuring and started programs such as the skills support program for investors. The new investment promotion agency, Trade and Investment of South Africa, is now operational.
South Africa has been revising its competition laws in recent years. An important statute that took effect in 1999 established new standards to reduce market dominance, curb restrictive practices and more closely regulate mergers. Foreign businesses can expect the business-operating environment to become increasingly competitive. The legal system is an unusual mixture of English law and the Dutch-Roman law. The Roman-Dutch law tends to predominate in matters of property, succession and the law of sale and lease. To avoid unpleasant surprises, investors have to consult counsel on matters on establishment or expansion of business in South Africa. Acquisitions and takeovers are subject to the provisions of chapter 13 of the reconstituted 1973 Companies Act, whether the company making the take-over bid is foreign or local. The amended law contains strict provisions governing disclosure and take-over procedures. Under Competition Act 89 of 1998, parties must notify the Competition Commission within seven days of a proposed merger that qualifies as an intermediate or as a larger merger, as defined by law. Antitrust rules empower the government to prohibit mergers deemed contrary to the public interest.
South Africa has double taxation treaty agreements with several foreign countries. These include Botswana, Denmark, Finland, France, Germany, Israel, the Republic of Korea, Lesotho, Malawi, Namibia, the Netherlands, Romania, Swaziland, Sweden, Switzerland, Tanzania, Uganda, the United
World Investment Directory Volume X Africa 2008
582
Kingdom, Zambia and Zimbabwe. The treaty with the United Kingdom extends also to Grenada, Mauritius, the Seychelles and Sierra Leone. Limited sea and air transport agreements exist with Belgium, Brazil, Greece, Ireland, Italy, Japan, Norway, Portugal, the Republic of China and Spain. Comprehensive agreements have been ratified in South Africa with Belgium, Hungary and Poland. Comprehensive agreements have been signed but not ratified with Austria, Canada, Italy, Lesotho, China and the Russian Federation. Comprehensive agreements have been negotiated, or renegotiated but not signed, with Botswana, Croatia, the Czech Republic, Malaysia, Malta, Mauritius, Namibia, Norway, Singapore, Slovakia, Thailand, Turkey and Uganda. Comprehensive agreements are being negotiated or renegotiated but have not been finalized with Argentina, India, Japan, Luxembourg, Portugal, Tunisia, the United States and Zimbabwe. In terms of these agreements, the foreign resident undertaking will only be taxable in South Africa if it conducts business in South Africa through a permanent establishment. The Government provides export subsidy that is payable under the General Export Incentive Scheme.
South Africa is party to international conventions for protecting intellectual property. Patents, trademarks, copyrights and industrial designs, and models are all legally recognized in South Africa which was one of the first signatories to the Trademarks Laws Treaty at the World Intellectual Property Organization in 1994. The current legal regime ensures compliance with the Trade-Related Aspects of Intellectual Property agreement (TRIPs) of the World Trade Organization to which South Africa is a member.
Most African countries seek close relationship with South Africa as an outlet and source of materials products. South Africa, on the other hand, had intensified their effort to integrate into the global economy, starting with the region. The country has warm relations with almost all the countries of the world. South Africa engages its African neighbours at the political and commercial level, both bilaterally and is a big-time player in regional bodies such as the African Union, Southern African Customs Union and the Southern African Development Community. The Government won the approval of the African Union conference in Lusaka to present Millennium Africa Plan which was later renamed the New Partnership for Africa's Development. South Africa also has strong ties with the United States and is eligible for the United States' market access for African countries - African Growth and Opportunity Act.

South Africa
583
B. Statistics on FDI and the operations of TNCs
Table 1. Summary of FDI
(Millions of dollars)
Variable Inward Outward
1. FDI flows, 2003-2006 (annual average) 1 912.1 2 392.7
2. FDI flows as a percentage of GFCF, 2003-2006 (annual average) 5.1 6.4
3. FDI stocks, 2006 87 765 50 826
4. FDI stocks as a percentage of GDP, 2006 34.4 19.9
Source: Based on tables 3a and 4a and UNCTAD, FDI/TNC database.

World Investment Directory Volume X Africa 2008
584
Table 3a. FDI flows, by type of investment, 1980-2006 (Millions of dollars)
Inward investment Outward investment
Reinvested Reinvested
Year Equity earnings Other Total Equity earnings Other Total 1980 .. .. .. - 10.3 .. .. .. 755.01981 .. .. .. 65.0 .. .. .. 643.91982 .. .. .. 329.7 .. .. .. - 5.51983 .. .. .. 70.9 .. .. .. 156.21984 .. .. .. 419.5 .. .. .. 193.11985 82.0 .. - 534.7 - 448.0 27.8 .. 19.5 51.21986 13.3 .. - 63.8 - 49.9 73.7 .. - 2.7 70.51987 - 17.5 .. - 174.2 - 190.1 11.5 .. 100.6 110.01988 108.7 .. 49.7 161.5 50.0 .. 14.6 68.21989 102.1 .. - 303.3 - 206.7 126.9 .. 35.8 168.21990 67.6 .. - 146.1 - 78.4 39.0 .. - 11.6 27.41991 16.3 .. 231.8 248.1 146.7 .. 61.2 207.91992 33.3 .. - 29.8 3.5 360.9 .. 1 576.3 1 937.21993 2.8 .. 7.3 10.1 72.9 .. 225.3 298.21994 5.1 .. 374.7 379.8 1 368.6 .. - 132.4 1 236.21995 289.5 .. 951.8 1 241.3 2 306.3 .. 191.3 2 497.71996 570.2 .. 247.9 818.1 1 278.5 .. - 234.6 1 043.91997 3 601.2 .. 216.0 3 817.2 2 205.8 .. 145.0 2 350.81998 506.9 .. 54.2 561.1 1 697.5 .. 81.5 1 779.01999 1 075.7 .. 426.6 1 503.2 833.5 .. 746.6 1 581.02000 841.8 .. 46.1 887.3 - 165.5 .. 436.3 270.62001 6 561.8 .. 226.9 6 783.9 -4 111.1 .. 930.9 -3 177.92002 457.6 .. 299.1 1 569.2 163.2 .. - 562.1 - 398.02003 554.5 .. 179.1 733.7 796.9 .. - 231.7 565.12004 245.7 .. 553.5 798.0 1 413.7 .. - 61.6 1 350.12005 6 326.8 - 317.0 6 643.8 674.8 - 255.1 930.32006 -1 512.7 - 985.6 - 527.1 2 733.9 - 3 991.3 6 725.2
Source: UNCTAD, FDI/TNC database (www.unctad.org/statistics) based on the South African Reserve Bank, unpublished.
Table 3b. FDI flows, by type of investment, 1980-2006 (Millions of Rand)
Inward investment Outward investment
Reinvested Reinvested
Year Equity earnings Other Total Equity earnings Other Total 1980 .. .. .. - 8.0 .. .. .. 588.01981 .. .. .. 57.0 .. .. .. 565.01982 .. .. .. 358.0 .. .. .. - 6.01983 .. .. .. 79.0 .. .. .. 174.01984 .. .. .. 619.1 .. .. .. 285.01985 .. .. .. - 998.1 .. .. .. 114.11986 .. .. .. - 113.9 .. .. .. 161.01987 .. .. .. - 387.0 .. .. .. 223.91988 .. .. .. 367.0 .. .. .. 155.01989 .. .. .. - 542.0 .. .. .. 441.11990 .. .. .. - 202.9 .. .. .. 70.91991 .. .. .. 685.0 .. .. .. 574.01992 .. .. .. 10.0 .. .. .. 5 524.11993 .. .. .. 33.0 .. .. .. 974.11994 .. .. .. 1 348.2 .. .. .. 4 388.11995 .. .. .. 4 502.2 .. .. .. 9 059.11996 .. .. .. 3 514.9 .. .. .. 4 485.11997 16 592.0 .. 995.0 17 587.0 10 163.0 .. 668.0 10 831.01998 2 804.0 .. 300.0 3 104.0 9 390.0 .. 451.0 9 841.01999 6 576.0 .. 2 608.0 9 184.0 5 095.0 .. 4 564.0 9 659.02000 5 838.0 .. 320.0 6 158.0 -1 148.0 .. 3 026.0 1 878.02001 56 452.0 .. 1 952.0 58 404.0 -35 368.0 .. 8 009.0 -27 359.02002 4 812.0 .. 3 146.0 16 540.0 1 716.0 .. -5 911.0 -4 195.02003 4 195.0 .. 1 355.0 5 550.0 6 028.0 .. -1 753.0 4 275.02004 1 585.0 .. 3 570.0 5 155.0 9 118.0 .. - 397.0 8 721.02005 40 253.0 .. - 483.0 42 270.0 4 293.0 .. 1 623.0 5 916.02006 -10 985.0 .. 8 796.0 -3 567.0 18 480.0 .. 26 681.0 45 511.0
Source: UNCTAD, FDI/TNC database (www.unctad.org/statistics) based on the South African Reserve Bank, unpublished.

South Africa
585
Table 4a. FDI stocks, by type of investment, 1980-2006 (Millions of dollars)
Inward investment Outward investment
Equity & Equity & Reinvested Reinvested Reinvested Reinvested
Year earnings Equity earnings Other Total earnings Equity earnings Other Total 1980 13 137.4 .. .. 3 322.1 16 459.5 4 148.0 .. .. 1 393.4 5 541.41981 11 551.2 .. .. 3 271.1 14 822.3 4 761.7 .. .. 1 297.6 6 059.31982 10 965.8 .. .. 4 012.7 14 978.4 6 328.5 .. .. 1 008.9 7 337.41983 10 112.2 .. .. 3 933.7 14 045.9 6 659.8 .. .. 861.3 7 521.11984 6 963.7 .. .. 4 032.1 10 995.8 7 820.9 .. .. 698.1 8 519.11985 5 744.4 .. .. 3 138.8 8 883.2 8 224.4 .. .. 665.1 8 889.51986 6 843.6 .. .. 2 944.5 9 788.1 10 190.5 .. .. 705.5 10 896.01987 7 067.6 .. .. 2 959.2 10 026.8 12 718.9 .. .. 718.5 13 437.41988 5 775.9 .. .. 1 968.7 7 744.6 11 549.6 .. .. 501.5 12 051.11989 6 477.3 .. .. 1 540.5 8 017.9 12 573.3 .. .. 505.4 13 078.61990 7 724.8 .. .. 1 482.4 9 207.2 14 516.0 .. .. 488.4 15 004.41991 8 505.6 .. .. 1 701.9 10 207.5 15 607.5 .. .. 492.9 16 100.41992 9 091.9 .. .. 1 565.6 10 657.5 16 746.8 .. .. 1 040.4 17 787.31993 8 751.0 .. .. 1 938.5 10 689.5 16 659.7 .. .. 1 292.4 17 952.11994 9 908.5 .. .. 2 701.7 12 610.2 17 030.7 .. .. 2 066.9 19 097.61995 11 841.7 .. .. 3 163.6 15 005.4 21 093.3 .. .. 2 194.2 23 287.51996 10 594.9 .. .. 2 637.0 13 231.9 22 893.6 .. .. 1 448.2 24 341.81997 13 637.9 .. .. 3 094.6 16 732.5 22 131.9 .. .. 1 113.3 23 245.11998 12 744.8 .. .. 2 926.8 15 671.7 26 283.1 .. .. 566.7 26 849.91999 48 468.4 .. .. 3 309.0 51 777.4 31 935.6 .. .. 1 057.7 32 993.42000 40 288.6 24 058.8 16 229.8 3 162.4 43 451.0 31 078.2 9 415.3 21 662.8 1 247.0 32 325.22001 27 665.8 17 730.3 9 935.5 2 903.2 30 569.0 16 321.4 5 735.8 10 585.7 1 258.6 17 580.02002 25 973.3 18 379.7 7 593.5 4 630.8 30 604.1 20 033.8 6 686.3 13 347.5 1 946.6 21 980.42003 40 787.8 26 874.7 13 913.1 6 080.9 46 868.7 25 169.9 9 276.4 15 893.5 2 014.9 27 184.82004 56 513.1 33 767.3 22 745.8 7 937.7 64 450.8 36 304.8 13 822.9 22 481.9 2 778.0 39 082.82005 71 460.9 35 960.0 35 500.9 7 525.1 78 985.9 34 980.2 13 218.8 21 761.4 2 725.7 37 705.92006 79 450.9 35 119.5 44 331.4 8 314.1 87 765.0 44 280.8 17 603.9 26 676.9 6 544.8 50 825.5 Source: UNCTAD, FDI/TNC database (www.unctad.org/statistics) based on the South African Reserve Bank, unpublished.
Table 4b. FDI stocks, by type of investment, 1980-2006 (Millions of Rand)
Inward investment Outward investment
Equity & Equity & Reinvested Reinvested Reinvested Reinvested
Year earnings Equity earnings Other Total earnings Equity earnings Other Total
1980 9 796.0 .. .. 2 477.1 12 273.1 3 093.0 .. .. 1 039.0 4 132.01981 11 057.0 .. .. 3 131.1 14 188.1 4 558.0 .. .. 1 242.1 5 800.11982 11 781.0 .. .. 4 311.0 16 092.0 6 799.0 .. .. 1 083.9 7 882.91983 12 293.0 .. .. 4 782.0 17 075.0 8 096.0 .. .. 1 047.0 9 143.01984 13 825.0 .. .. 8 005.0 21 830.0 15 527.0 .. .. 1 386.0 16 913.01985 14 718.0 .. .. 8 041.9 22 759.9 21 072.0 .. .. 1 704.0 22 776.01986 14 998.0 .. .. 6 453.0 21 451.0 22 333.0 .. .. 1 546.0 23 879.01987 13 623.0 .. .. 5 703.9 19 326.9 24 516.0 .. .. 1 385.0 25 901.01988 13 739.0 .. .. 4 683.0 18 422.0 27 473.0 .. .. 1 192.9 28 665.91989 16 507.0 .. .. 3 925.9 20 432.9 32 042.0 .. .. 1 287.9 33 329.91990 19 802.0 .. .. 3 800.0 23 602.0 37 211.0 .. .. 1 252.0 38 463.01991 23 335.0 .. .. 4 669.1 28 004.1 42 819.0 .. .. 1 352.2 44 171.21992 27 770.0 .. .. 4 781.9 32 551.9 51 151.0 .. .. 3 177.9 54 328.91993 29 745.0 .. .. 6 589.0 36 334.0 56 627.0 .. .. 4 392.9 61 019.91994 35 124.0 .. .. 9 577.1 44 701.1 60 371.0 .. .. 7 326.9 67 697.91995 43 218.0 .. .. 11 546.1 54 764.1 76 983.0 .. .. 8 008.0 84 991.01996 49 625.0 .. .. 12 351.1 61 976.1 107 230.0 .. .. 6 782.9 114 012.91997 66 397.0 .. .. 15 066.0 81 463.0 107 750.0 .. .. 5 420.0 113 170.01998 74 706.0 .. .. 17 156.0 91 862.0 154 063.0 .. .. 3 322.0 157 385.01999 298 267.0 .. .. 20 363.0 318 630.0 196 527.0 .. .. 6 509.0 203 036.02000 304 924.0 182 089.0 122 835.0 23 935.0 328 859.0 235 215.0 71 260.0 163 955.0 9 438.0 244 653.02001 335 489.0 215 006.0 120 483.0 35 206.0 370 695.0 197 922.0 69 555.0 128 367.0 15 262.0 213 184.02002 224 409.0 158 801.0 65 608.0 40 010.0 264 419.0 173 092.0 57 770.0 115 322.0 16 819.0 189 911.02003 270 831.0 178 448.0 92 383.0 40 377.0 311 208.0 167 128.0 61 595.0 105 533.0 13 379.0 180 507.02004 318 169.0 190 110.0 128 059.0 44 689.0 362 858.0 204 396.0 77 823.0 126 573.0 15 640.0 220 036.02005 451 990.0 227 447.0 224 543.0 47 596.0 499 586.0 221 250.0 83 609.0 137 641.0 17 240.0 238 490.02006 553 773.0 244 783.0 308 990.0 57 949.0 611 722.0 308 637.0 122 699.0 185 938.0 45 617.0 354 254.0
Source: UNCTAD, FDI/TNC database based on the South African Reserve Bank, unpublished.
World Investment Directory Volume X Africa 2008
586
Table 6. FDI flows in the host economy, by geographical origin, 1993-2006
(Millions of Rand)
Region / economy 1990 1991 1992 1993 1994 1995 1996 1997 1998 1999 2000 2001 2002 2003 2004 2005 2006Total world 1 331 3 172 1 764 2 436 6 862 .. .. .. .. .. .. .. .. .. .. .. ..
Developed countries 1 130 3 082 1 793 1 973 6 702 .. .. .. .. .. .. .. .. .. .. .. ..Europe - - - 1 047 5 374 .. .. .. .. .. .. .. .. .. .. .. ..
European Union - - - 815 4 321 .. .. .. .. .. .. .. .. .. .. .. ..Austria - - - - 10 .. .. .. .. .. .. .. .. .. .. .. ..Belgium - - - - - 1 .. .. .. .. .. .. .. .. .. .. .. ..France - - - - 1 031 .. .. .. .. .. .. .. .. .. .. .. ..Germany - - - - 907 .. .. .. .. .. .. .. .. .. .. .. ..Italy - - - - 26 .. .. .. .. .. .. .. .. .. .. .. ..Luxembourg - - - - - 79 .. .. .. .. .. .. .. .. .. .. .. ..Netherlands - - - - 1 754 .. .. .. .. .. .. .. .. .. .. .. ..United Kingdom - - - - 673 .. .. .. .. .. .. .. .. .. .. .. ..
Other developed Europe - - - - 1 053 .. .. .. .. .. .. .. .. .. .. .. ..Liechtenstein - - - - 102 .. .. .. .. .. .. .. .. .. .. .. ..Switzerland - - - - 560 .. .. .. .. .. .. .. .. .. .. .. ..
North America - - - 825 1 104 .. .. .. .. .. .. .. .. .. .. .. ..United States - - - - 1 104 .. .. .. .. .. .. .. .. .. .. .. ..
Other developed countries - - - - 224 .. .. .. .. .. .. .. .. .. .. .. ..Australia - - - - 132 .. .. .. .. .. .. .. .. .. .. .. ..Japan - - - - 92 .. .. .. .. .. .. .. .. .. .. .. ..
Developing economies 201 90 - 29 463 164 .. .. .. .. .. .. .. .. .. .. .. ..Africa - - - 26 8 .. .. .. .. .. .. .. .. .. .. .. ..
Botswana - - - - - 25 .. .. .. .. .. .. .. .. .. .. .. ..Swaziland - - - - 3 .. .. .. .. .. .. .. .. .. .. .. ..
Latin America and the Caribbean - - - 4 326 .. .. .. .. .. .. .. .. .. .. .. ..Asia - - - 433 - 170 .. .. .. .. .. .. .. .. .. .. .. ..
Hong Kong, China - - - - - 195 .. .. .. .. .. .. .. .. .. .. .. ..Taiwan Province of China - - - - 28 .. .. .. .. .. .. .. .. .. .. .. ..
Unspecified - - - - - 4 .. .. .. .. .. .. .. .. .. .. .. ..
Source: UNCTAD, FDI/TNC database based on the South African Reserve Bank, unpublished.
Table 11. FDI stocks in the host economy, by industry, 1996-2006 (Millions of Rand)
Sector / industry 1994 1995 1996 1997 1998 1999 2000 2001 2002 2003 2004 2005 2006
Total 36 024 .. 61 976 81 463 91 862 318 630 328 859 370 695 255 837 303 545 355 088 489 317 611 722Primary 2 274 .. 3 239 4 029 7 656 114 501 91 997 124 716 81 272 103 593 112 358 169 005 251 249
Agriculture, hunting, forestry and fishing 315 .. 356 387 387 406 457 653 655 500 719 734 888
Mining, quarrying and petroleum 1 959 .. 2 883 3 642 7 269 114 095 91 540 124 063 80 617 103 093 111 639 168 271 250 361
Mining and quarrying 1 959 .. 2 883 3 642 7 269 114 095 91 540 124 063 80 617 103 093 111 639 168 271 250 361Secondary 14 884 .. 24 867 34 688 40 429 79 486 86 783 89 443 67 248 75 427 111 354 136 028 165 432Tertiary 18 866 .. 33 870 42 746 43 777 124 643 150 079 156 536 107 317 124 525 131 376 184 284 195 041
Electricity, gas and water - .. - - - - - 30 30 28 28 28 29Construction 562 .. 158 209 304 506 314 1 761 1 858 1 938 1 986 1 977 1 983Trade 6 696 .. 7 335 8 007 8 237 10 596 11 895 15 141 13 312 13 425 14 517 14 722 16 172Hotels and restaurants - .. .. .. .. .. .. .. .. .. .. .. ..Transport, storage and
communications 467 .. 534 5 373 5 779 8 411 8 521 8 825 10 131 22 043 14 112 9 449 13 809Finance 11 097 .. 25 743 29 057 29 357 104 992 129 162 130 562 81 634 86 733 100 215 157 590 162 521Community, social and
personal service activities 44 .. 100 100 100 138 187 217 352 358 518 518 527
Source: South African Reserve Bank, Quarterly Bulletin, various issues. Note: Trade includes hotels and restaurants. Finance includes business activities.

South Africa
587
Table 12. FDI stocks in the host economy, by geographical origin, 1996-2006 (Millions of Rand)
Region / economy 1990 1991 1992 1993 1994 1995 1996 1997 1998 1999 2000 2001 2002 2003 2004 2005 2006
Total world 23 602 28 004 32 552 36 334 44 701 54 764 61 976 81 463 91 862 318 630 328 859 370 695 255 837 303 545 355 088 489 317 611 722
Developed countries 22 845 27 088 31 364 34 885 43 051 52 638 58 856 74 960 81 620 308 001 317 545 355 467 238 968 284 372 341 809 479 322 588 806
Europe 19 739 23 584 26 952 29 014 35 201 43 735 47 442 61 070 65 659 288 042 292 632 332 336 211 208 245 823 301 045 436 338 535 607
European Union 0 0 0 0 .. .. .. .. .. .. 279 018 324 217 203 633 238 272 285 410 411 420 515 927
Austria .. .. .. .. .. .. .. .. .. .. 260 96 86 147 136 623 647
Belgium .. .. .. .. .. .. .. .. .. .. 922 875 545 782 937 1 691 1 336
France .. .. .. .. .. .. .. .. .. .. 2 531 3 094 3 644 4 069 6 515 7 699 9 157
Germany .. .. .. .. .. .. .. .. .. .. 19 090 22 397 22 045 22 858 25 755 29 903 34 121
Greece - - - - - - - - - - - 1 072 1 078 1 083 2 867 1 325 1 331
Ireland - - - - - - - - - - - 157 93 218 158 1 218 1 220
Italy .. .. .. .. .. .. .. .. .. .. 1 517 1 408 1 416 1 979 2 062 1 215 2 909
Luxembourg .. .. .. .. .. .. .. .. .. .. 766 2 487 2 964 1 840 1 943 2 170 1 883
Netherlands .. .. .. .. .. .. .. .. .. .. 11 006 10 728 12 752 16 066 16 211 14 120 22 106
Sweden - - - - - - - - - - - 640 842 819 854 997 960
United Kingdom .. .. .. .. .. .. .. .. .. .. 242 926 281 263 158 168 188 411 227 972 350 459 440 257
Other developed
Europe .. .. .. .. .. .. .. .. .. .. 10 699 6 976 6 328 6 249 6 604 10 854 12 761
Liechtenstein .. .. .. .. .. .. .. .. .. .. 436 196 325 147 206 218 498
Switzerland .. .. .. .. .. .. .. .. .. .. 10 263 6 780 6 003 6 102 6 398 10 636 12 263
North America 2 901 3 274 4 082 5 592 7 404 8 404 10 824 13 391 15 452 19 052 22 832 20 991 24 175 30 993 32 838 32 268 37 510
Canada - - - - - - - - - - - 2 069 292 1 472 1 622 129 132
United States .. .. .. .. .. .. .. .. .. .. 19 625 18 922 23 883 29 521 31 216 32 139 37 378
Other developed countries 205 230 330 279 446 499 590 499 509 907 2 081 2 140 3 585 7 556 7 926 10 716 15 689
Australia .. .. .. .. .. .. .. .. .. .. 538 148 142 420 528 811 948
Japan .. .. .. .. .. .. .. .. .. .. 1 533 1 984 3 435 7 127 7 382 9 887 14 725
Developing economies 757 915 1 187 1 443 1 649 1 939 2 974 6 374 10 115 10 515 10 920 15 228 16 869 19 066 13 279 9 994 22 805
Africa 471 575 623 699 775 559 612 908 794 1 769 2 279 5 049 5 468 4 659 4 167 3 989 4 074
Botswana .. .. .. .. .. .. .. .. .. .. 79 758 693 172 211 203 182
Lesotho .. .. .. .. .. .. .. .. .. .. 19 52 70 74 74 75 75
Mauritius - - - - - - - - - - - 1 525 2 289 1 966 1 160 1 265 1 376
Namibia - - - - - - - - - - - 40 45 22 22 22 22
Swaziland .. .. .. .. .. .. .. .. .. .. 172 531 151 156 335 119 122
Zimbabwe - - - - - - - - - - - 2 090 2 134 2 138 2 138 2 138 2 138
Latin America and the
Caribbean .. .. .. .. .. .. .. .. .. .. 20 1 423 964 1 054 1 294 1 549 13 658
Bahamas .. .. .. .. .. .. .. .. .. .. 20 - - - - - -
Bermuda - - - - - - - - - - - 302 383 390 627 752 3 417
Asia 286 340 564 744 874 1 380 2 362 5 466 9 321 8 746 8 621 8 756 10 437 13 353 7 818 4 456 5 073
West Asia - - - - - - - - - - - 1 227 2 233 2 042 3 489 - 546 - 991
Saudi Arabia - - - - - - - - - - - 1 227 2 233 2 042 3 489 - 546 - 991
South, East and South-
East Asia .. .. .. .. .. .. .. .. .. .. 7 471 6 939 7 612 10 631 3 600 3 601 3 892
China - - - - - - - - - - - 169 219 209 319 340 486
Hong Kong, China .. .. .. .. .. .. .. .. .. .. 242 28 28 37 36 36 36
Malaysia .. .. .. .. .. .. .. .. .. .. 6 816 6 458 7 066 10 043 2 371 2 348 2 407
Singapore - - - - - - - - - - - 22 28 42 238 234 318
Taiwan Province of
China .. .. .. .. .. .. .. .. .. .. 413 262 271 300 636 643 645
Unspecified .. 1 1 6 1 187 146 129 127 114 394 - - 107 - 1 111
Source: South African Reserve Bank, Quarterly Bulletin, various issues.

World Investment Directory Volume X Africa 2008
588
Table 13. FDI stocks in the host economy, by industry and geographical origin, 2001
(Millions of Rand)
Sector/industry / Region/economy To
tal
wo
rld
De
ve
lop
ed
co
un
trie
s
Eur
opea
n U
nion
No
rth
Am
eric
a
Oth
er
dev
elo
ped
co
unt
ries
Aus
tra
lia
De
ve
lop
ing
eco
no
mie
s
Afr
ica
Asi
a
Total 370 695 354 906 325 009 22 414 156 156 15 789 5 049 10 740
Primary 124 716 121 571 120 389 1 101 .. - 3 145 701 2 444
Agriculture, hunting, forestry and fishing 653 600 521 20 .. - 53 19 34
Mining, quarrying and petroleum 124 063 120 971 119 868 1 081 .. - 3 092 682 2 410
Mining and quarrying 124 063 120 971 119 868 1 081 .. - 3 092 682 2 410
Secondary 89 443 83 815 71 061 10 459 121 121 5 628 1 857 3 771
Tertiary 156 536 149 520 133 559 10 854 35 35 7 016 2 491 4 525
Electricity, gas and water 30 30 30 - - - - - -
Construction 1 761 1 701 1 615 55 - - 60 60 -
Trade 15 141 11 445 9 520 1 547 26 26 3 696 2 322 1 374
Transport, storage and communications 8 825 5 741 3 284 2 428 - 1 - 1 3 084 7 3 077
Finance 130 562 130 386 118 933 6 788 10 10 176 102 74Community, social and personal service
activities 217 217 177 36 - - .. - -
Unspecified - - - - - - - - -
Source: South Africa Reserve Bank, Sixth Census of foreign transactions, supplement to quarterly bulletin.Notes: North America includes Latin America. Asia includes Japan. Australia includes New Zealand and the Pacific. Trade includes hotels and restaurants. Finance includes business activities.

South Africa
589
Table 15. FDI stocks abroad, by geographical destination, 1996-2006
(Millions of Rand)
Region / economy 1996 1997 1998 1999 2000 2001 2002 2003 2004 2005 2006
Total world 114 013 113 170 157 385 203 036 244 653 213 184 189 911 180 507 216 660 232 925 354 254
Developed countries 109 022 106 081 146 446 191 790 230 652 191 957 170 870 159 743 188 328 211 032 268 039
Europe 103 085 99 170 138 842 176 621 208 937 177 628 142 819 137 356 165 503 189 121 238 768
European Union - - - - 135 594 175 084 141 330 135 151 162 906 186 578 234 246
Austria - - - - - 17 598 27 036 11 183 16 728 18 036 22 262
Belgium - - - - - 15 716 18 141 23 080 16 459 10 247 12 964
France - - - - - 526 553 536 609 697 753
Germany - - - - - 61 241 47 798 43 704 51 066 4 324 5 099
Ireland - - - - - 3 619 77 80 432 432 440
Luxembourg - - - - 58 308 7 354 5 607 6 559 4 314 74 839 106 433
Netherlands - - - - - 8 634 6 091 5 925 8 300 7 141 6 485
United Kingdom - - - - 77 286 60 396 36 027 44 084 64 998 70 862 79 810
Other developed Europe - - - - 48 717 576 232 237 354 467 2 316
Switzerland - - - - 48 717 576 232 237 354 467 2 316
North America 5 338 5 507 6 466 10 937 16 474 10 142 20 878 14 996 15 369 14 498 21 821
Canada - - - - - 49 64 60 60 82 84
United States - - - - 11 215 10 093 20 814 14 936 15 309 14 416 21 737
Other developed countries 599 1 404 1 138 4 232 5 241 4 187 7 173 7 391 7 456 7 413 7 450
Australia - - - - - 3 853 6 793 6 804 6 804 6 806 6 807
Japan - - - - - 331 377 584 649 604 640
Developing economies 4 983 7 080 10 939 11 243 13 936 21 227 19 011 20 733 28 211 21 774 86 082
Africa 4 482 6 147 9 386 9 971 12 265 14 722 13 340 15 837 23 601 19 083 59 118
Botswana - - - - - 511 307 551 619 572 859
Lesotho - - - - - 188 162 204 256 227 239
Mauritius - - - - - 6 625 2 649 4 106 8 116 3 440 33 893
Mozambique - - - - - 4 117 6 896 5 071 4 396 4 584 5 331
Namibia - - - - - 1 405 1 095 1 151 840 834 872
Swaziland - - - - - 153 232 937 841 423 810
Zambia - - - - - 89 146 415 412 586 413
Zimbabwe - - - - - 587 603 2 033 645 671 1 253Latin America and the
Caribbean - - - - - 2 267 1 747 1 970 2 085 1 806 1 834
Bermuda - - - - - 30 30 35 37 37 37
Asia 501 933 1 553 1 272 1 671 4 238 3 924 2 926 2 525 885 25 130
Hong Kong, China - - - - - 3 457 3 489 2 504 2 198 624 868
Singapore - - - - - 442 174 195 100 26 27
Unspecified 8 9 - 3 65 - 30 31 121 119 133
Source: South African Reserve Bank, Quarterly Bulletin, various issues.

World Investment Directory Volume X Africa 2008
590
Table 21. The number of foreign affiliates of home-based TNCs, by geographical location abroad, 1995-2006
Economy 1990 1991 1992 1993 1994 1995 1996 1997 1998 1999 2000 2001 2002 2003 2004 2005 2006
Finland .. .. .. .. .. 2 2 1 .. .. .. .. .. .. .. .. ..
Germany 9 8 8 9 9 11 11 11 11 20 17 20 15 12 11 13 ..Ireland .. .. .. .. .. .. .. .. 3 .. 2 3 6 .. .. .. ..Italy .. .. .. 1 .. 2 .. 2 .. .. .. .. .. .. .. .. ..Poland .. .. .. .. .. .. .. 1 1 1 2 2 .. .. .. .. ..Sweden a .. .. .. .. .. .. .. 4 .. 4 11 8 .. 12 9 9 ..United States 26 22 18 20 22 26 31 19 20 18 22 26 20 17 .. .. ..
Source: UNCTAD, FDI/TNC database. Note: Data are based on information reported by the economies listed above. a Majority-owned affiliates.
Table 23. The number of affiliates of foreign TNCs in the host economy, by geographical origin, 1995-2006
Economy 1990 1991 1992 1993 1994 1995 1996 1997 1998 1999 2000 2001 2002 2003 2004 2005 2006
Germany 302 315 333 304 294 315 317 334 338 360 387 381 224 313 364 309 ..Italy .. 3 .. 2 .. 3 .. 7 .. .. .. .. .. .. .. .. ..Republic of Korea .. .. .. .. .. .. 10 12 13 16 19 19 21 22 22 29 ..United States 106 104 104 108 129 140 151 160 169 191 197 200 204 196 202 .. ..Source: UNCTAD, FDI/TNC database. Note: Data are based on information reported by the economies listed above.
Table 28. Assets of foreign affiliates of home-based TNCs, by geographical location abroad, 1995-2006 (Millions of dollars)
Economy 1990 1991 1992 1993 1994 1995 1996 1997 1998 1999 2000 2001 2002 2003 2004 2005 2006
Germany 267.7 329.8 247.8 231.7 193.7 279 129 112 120 301 93 1 234 .. .. .. .. ..
United States 4585.0 3937.0 3391.0 3167.0 4371.0 7 040 8 261 8 157 8 483 3 692 10 449 6 160 .. .. .. .. ..Source: UNCTAD, FDI/TNC database. Note: Data are based on information reported by the economies listed above.
Table 30. Assets of affiliates of foreign TNCs in the host economy, by geographical origin, 1995-2006 (Millions of dollars)
Economy 1990 1991 1992 1993 1994 1995 1996 1997 1998 1999 2000 2001 2002 2003 2004 2005 2006
Austria a .. .. .. .. .. .. .. .. .. .. 10 .. .. .. .. .. ..
Germany 3882 4024 4089 4055 4584 5720 4952 5245 5021 5425 5769 4759 .. .. .. .. ..United States 2674 2703 2928 2925 3901 5819 5940 12923 13646 15532 17855 14912 14046 18203 22111 .. ..
Source: UNCTAD, FDI/TNC database. Note: Data are based on information reported by the economies listed above. a Majority-owned affiliates.
Table 33. Employment of foreign affiliates of home-based TNCs, by geographical location abroad, 1995-2006 (Thousands of employees)
Economy 1990 1991 1992 1993 1994 1995 1996 1997 1998 1999 2000 2001 2002 2003 2004 2005 2006
Germany 2.0 3.0 2.0 2.0 2.0 1.0 1.0 1.0 1.0 2.0 2.0 2.0 4.0 3.0 3.0 3.0 ..Ireland .. .. .. .. .. .. .. .. 0.04 .. 0.1 0.02 0.05 .. .. .. ..Italy .. .. .. 0.4 .. 0.6 .. 0.5 .. .. .. .. .. .. .. .. ..Sweden .. .. .. .. .. .. .. 0.1 .. 0.1 0.3 0.3 .. 0.3 0.3 0.3 ..United States 14.5 12.9 13.4 13.1 12.9 18.6 20.6 20.4 18.3 8.5 9.4 9.8 .. .. .. 8.3 ..Source: UNCTAD, FDI/TNC database. Note: Data are based on information reported by the economies listed above.
Table 35. Employment of affiliates of foreign TNCs in the host economy, by geographical origin, 1995-2006 (Thousands of employees)
Economy 1990 1991 1992 1993 1994 1995 1996 1997 1998 1999 2000 2001 2002 2003 2004 2005 2006
Austria .. .. .. .. .. .. .. .. .. .. .. .. 0.5 .. .. .. ..Belgium .. .. .. .. .. .. .. .. .. .. .. 0.8 1.1 3.1 .. .. ..Finland a .. .. .. .. .. .. .. .. .. 2.1 1.7 1.0 2.4 2.1 2.2 1.9 1.5
Germany 53.0 50.0 52.0 49.0 52.0 56.0 56.0 56.0 51.0 69.0 65.0 66.0 54.0 70.0 73.0 70.0 ..Italy .. 1.5 .. 0.8 .. 0.1 .. 0.4 .. .. .. .. .. .. .. .. ..Sweden a 1.6 .. .. 1.1 .. .. 2.8 3.1 3.5 3.5 .. 7.0 13.0 .. .. .. ..Switzerland .. .. .. 20.7 21.6 25.6 25.3 31.2 20.4 20.9 19.7 21.3 25.9 28.1 29.1 29.6 ..United States 40.6 39.7 39.0 38.2 47.8 53.4 54.3 103.7 115.3 137.8 139.0 138.0 116.0 116.7 112.6 .. ..Source: UNCTAD, FDI/TNC database. Note: Data are based on information reported by the economies listed above. a Majority-owned affiliates.

South Africa
591
Tables 38, 48, 58, 63 and 73. Wages and salaries, value added, exports, imports and employment in research and development (R&D) of foreign affiliates of South African TNCs in the United States, 1995-2006
(Millions of dollars and thousands of employees) Table no./Variable 1990 1991 1992 1993 1994 1995 1996 1997 1998 1999 2000 2001 2002 2003 2004 2005 2006
38. Wages and salaries 597.0 571.0 557.0 597.0 639.0 924 1 098 1 182 1 126 575 627 727 741 a 703 a 684 a 684 ..
48. Value added .. .. 877.0 897.0 1012.0 1 867 2 011 2 218 2 027 874 1 045 971 926 a 864 a 1032 a 990 a ..58. Exports .. .. .. .. 501.0 395 552 .. .. .. 484 535 .. .. .. .. ..63. Imports .. .. 661.0 699.0 .. 519 .. .. .. .. 239 .. .. 280 329 313 ..73. Employment in R&D .. .. 0.4 0.3 0.3 0.6 0.7 0.5 0.6 0.1 0.2 0.2 .. .. .. .. ..Source: UNCTAD, FDI/TNC database. Note: Data are based on information reported by the United States.
Tables 40. 50, 60 and 65. Wages and salaries, value added, exports and imports of affiliates of United States TNCs in South Africa, 1995-2006
(Millions of dollars) Table no./Variable 1990 1991 1992 1993 1994 1995 1996 1997 1998 1999 2000 2001 2002 2003 2004 2005 2006
40. Wages and salaries 492.0 521.0 645.0 588.0 674.0 1 032 1 014 1 780 1 911 2 598 2 798 2 597 2 174 2 231 2 856 .. ..50. Value added a .. .. .. .. 908.0 1 097 1 322 1 449 1 638 1 687 2 311 1 949 2 187 2 721 4 149 .. ..
60. Exports a 242.0 313.0 262.0 269.0 321.0 331 464 645 543 909 782 1 423 1 373 .. .. .. ..65. Imports a 59.0 17.0 19.0 25.0 14.0 35 27 30 38 72 81 .. .. .. .. .. ..Source: UNCTAD, FDI/TNC database. Note: Data are based on information reported by the United States. a Majority-owned affiliates only.
Table 43. Sales of foreign affiliates of home-based TNCs, by geographical location abroad, 1995-2006 (Millions of dollars)
Economy 1990 1991 1992 1993 1994 1995 1996 1997 1998 1999 2000 2001 2002 2003 2004 2005 2006
Austria a .. .. .. .. .. 7.9 7.6 .. .. .. .. .. .. .. .. .. ..Germany 309.5 421.8 .. 241.9 246.5 209 266 173 170 320 184 537 1 223 1 467 1 614 1 287 ..Italy .. .. .. 186.1 .. 185.5 .. 152.1 .. .. .. .. .. .. .. .. ..United States 5151.0 3903.0 3910.0 4399.0 5643.0 9 400 10 016 10 243 11 560 3 475 4 852 5 152 .. .. .. .. ..
Source: UNCTAD, FDI/TNC database. Note: Data are based on information reported by the economies listed above. a Majority-owned affiliates only.
Table 45. Sales of affiliates of foreign TNCs in the host economy, by geographical origin, 1990-2006
(Millions of dollars) Economy 1990 1991 1992 1993 1994 1995 1996 1997 1998 1999 2000 2001 2002 2003 2004 2005 2006
Austria .. .. .. .. .. .. .. .. 35.6 51.1 58.0 54.6 72.5 97.1 .. .. ..Belgium .. .. .. .. .. .. 71.7 124.0 138.9 126.8 297.4 128.0 134.6 387.1 .. .. ..France .. .. .. .. .. 228.7 257.7 388.9 309.1 467.7 362.1 .. 446.1 .. .. .. ..
Germany 6003.5 6447.6 6979.8 6713.8 7271.4 9 420 8 174 9 515 8 695 9 163 8 937 8 948 9 223 13 543 17 259 12 544 ..Finland a .. .. .. .. .. .. .. .. .. 138.2 115.0 77.0 374.6 279.9 370.0 165.6 184.1Italy .. 91.1 .. 9.8 .. 9.8 .. 21.0 .. .. .. .. .. .. .. .. ..Portugal a .. .. .. .. .. .. .. 9.7 3.4 3.5 .. .. 50.8 54.6 .. .. ..United States 4159.0 4269.0 4290.0 4216.0 5050.0 6 819 7 364 11 543 12 163 13 805 17 243 16 053 16 225 18 773 23 657 .. ..Source: UNCTAD, FDI/TNC database. Note: Data are based on information reported by the economies listed above. a Majority-owned affiliates only.
Table 78. Royalty receipts of foreign affiliates of South African TNCs in Germany, 1995-2006 (Millions of dollars)
Economy 1990 1991 1992 1993 1994 1995 1996 1997 1998 1999 2000 2001 2002 2003 2004 2005 2006
Germany .. .. .. .. .. .. .. 9.8 4.0 3.2 .. 14.3 33.9 14.7 16.1 8.7 6.3Source: UNCTAD, FDI/TNC database. Note: Data are based on information reported by Germany.
Tables 80 and 85. Royalty receipts and payments of affiliates of German TNCs in South Africa, 1995-2006 (Millions of dollars)
Economy 1990 1991 1992 1993 1994 1995 1996 1997 1998 1999 2000 2001 2002 2003 2004 2005 2006
80. Royalty receipts .. .. .. .. .. .. .. 1.2 0.6 1.1 .. 0.9 0.9 .. 1.2 1.2 2.585. Royalty payments .. .. .. .. 16.6 29.3 31.2 27.7 18.8 23.4 .. 24.2 30.1 67.7 78.2 83.3 95.3
Source: UNCTAD, FDI/TNC database. Note: Data are based on information reported by Germany.

World Investment Directory Volume X Africa 2008
592
Table 86. Largest home-based TNCs, 2007
(Billions of dollars)
Company Industry Sales
A. Industrial
SASOL Chemicals and chemical products 10.9Imperial Holdings Automobile 6.7De Beers Consoldated Mines Mining 6.5ESKOM Electricity/gas/water 5.8SAPPI Paper and paper products 5.0Mittal Steel South Africa Metal and metal products 3.8SAB Miller South Africa Food products, beverages and tobacco 3.8Anglo Platinum Corporation Mining 3.7
Ashanti Goldfields Co. Mining 2.7Tiger Brands Agro-Industry 2.4Impala Platinum Holdings Mining 2.0Super Group Automobile 1.9Gold Fields Mining 1.9
B. Tertiary
The Bidvest group Retail trade 9.9Metro Cash and Carry Retail trade 9.1 aTELKOM Telecommunications 7.6Barloworld Diversified Group 6.2Pick 'N' Pay Stores Holdings Retail trade 5.8Vodacom Telecommunication 5.4Shoprite Holdings Retail trade 4.8MTN Group Telecommunication 4.3Massmart Holdings Retail trade 4.2Transnet Transportation 4.2South African Airways Air transportation 3.1
Metro Cash & Carry Distributive trade 9 081.0a
Steinhoff International Holdings Furnishing 3.0Datatec Computer and related activities 3.0
Edgars Consoldated Stores Retail trade 2.6Naspers Media 2.5Nampak Paper and packaging 2.5
C. Finance and insurance Assets
Old Mutual Insurance 12.7SANLAM Insurance 10.0Liberty Group Insurance 3.6
a
Kumba Resources Financial services 1.9Santam Insurance 1.8Mutual and Federal Insurance Insurance 1.3Momentum Life Assurers Insurance 1.2
a
Alexander Forbes Financial services 0.8
Source: Jeune Afrique Hors-serie No. 14, 2007.a 2004.

South Africa
593
Table 88. Largest affiliates of foreign TNCs in the host economy, 2007
(Millions of dollars and number) Company Home Economy Industry Sales Employees
A. Industrial
Billiton Aluminium Sa Ltd Australia Metal and metal products 6 084 1 017Carson Midrand Manufacturing Pty Ltd France Chemicals and chemical products 2 069 ..Trw Occupant Restraints South Africa Inc United States Other manufacturing 1 722 422Highveld Steel And Vanadium Corporation Ltd United Kingdom Metal and metal products 1 067 3 842Arvinmeritor Investments Sa (Pty) Ltd United States Motor vehicles and trailers 1 048 420Distell Ltd United Kingdom Food, beverages and tobacco 1 045 4 400Heraeus Chemicals Sa (Pty) Ltd Germany Chemicals and chemical products 944 45Afrox Ltd United Kingdom Chemicals and chemical products 896 ..Johnson Matthey (Pty) Ltd United Kingdom Metal and metal products 786 800Metso Minerals (Johannesburg) (Pty) Ltd Finland Machinery and equipment 658 1 200Metso Minerals Sa (Pty) Ltd Finland Machinery and equipment 649 1 200Siemens Telecommunications (Pty) Ltd Germany Electrical and electronic equipments 612 ..Everite Ltd United States Non-metallic mineral products 558 800Behr South Africa (Pty) Ltd Germany Machinery and equipment 455 ..Plessey Tellumat South Africa Ltd United Kingdom Electrical and electronic equipments 297 369Abb South Africa (Pty) Ltd Switzerland Electrical and electronic equipments 295 ..
B. Tertiary
Ibm South Africa (Pty) Ltd United States Computer and related activities .. ..Shell South Africa Marketing (Pty) Ltd United Kingdom Wholesale trade .. 3 000Ford Motor Company Of Southern Africa
(Manufacturing) (Pty) United States Distributive trade .. 4 000Tfd Network Africa (Pty) Ltd Namibia Land transport .. 540Mol South Africa (Pty) Ltd Japan Water Transport .. 160Imperial Cargo (Pty) Ltd Lesotho Land transport 6 773 ..Carrier South Africa (Pty) Ltd United States Wholesale trade 4 569 ..Anglo American Corporation Of South Africa Ltd United Kingdom Holding 4 389 ..Mondi Limited Ltd United Kingdom Public administration 4 389 ..Mondi Packaging South Africa (Pty) Ltd United Kingdom Public administration 4 332 ..Honeywell Southern Africa (Pty) Ltd United States Wholesale trade 4 123 365Alfa Laval (Pty) Ltd Sweden Wholesale trade 2 435 38Kimberly Clark Of South Africa (Pty) Ltd United States Wholesale trade 2 371 ..Sabsa Holdings (Pty) Ltd United Kingdom Public administration 2 331 ..Anglogold Ashanti Health (Pty) Ltd Malta Public administration 2 296 ..Expo Liquor Ltd United Kingdom Wholesale trade 1 910 ..Kellogg Company Of South Africa (Pty) Ltd United States Wholesale trade 1 517 ..Distell Group Ltd United Kingdom Wholesale trade 855 ..Liebherr-Africa (Pty) Ltd Switzerland Construction 848 250Ciba Specialty Chemicals (Pty) Ltd Switzerland Wholesale trade 832 23
C. Finance and insurance Assets Employees
Hsbc Bank Plc (Incorporated In The United
Kingdom) United Kingdom Finance 5 138 200S A Eagle Risk Financing Ltd Switzerland Insurance 273 100Pinnacle Micro (Pty) Ltd Germany Finance 104 350Crawford And Company (Sa) (Pty) Ltd United States Insurance 6 ..Old Mutual Life Assurance Company (South
Africa) Ltd United Kingdom Insurance .. ..South African Eagle Insurance Company Ltd Switzerland Insurance .. 1 000Aon Consulting South Africa (Pty) Ltd United States Insurance .. 250Bmw Financial Services South Africa (Pty) Ltd Germany Finance .. 150J P Morgan Equities Ltd United States Finance .. 90
Source: Who Owns Whom database (https://solutions.dnb.com/wow), retrieved January 2008.

World Investment Directory Volume X Africa 2008
594
C. Legal frameworks for transnational corporations
In South Africa, a large number of national, bilateral and multilateral legal instruments exist to regulate the activities of transnational corporations and foreign direct investors. The key instruments applicable in the country include:
I. National framework
Industrial Development Act No. 22 of 15 May 1940; effective 20 May 1940. Source: "Trade and Industry", Statutes of the Republic of South Africa (classified and annotated looseleaf edition 1910 to present) p. 151.
Merchandise Marks Act No. 17 of 1941 as amended by the Merchandise Marks Amendment Act No. 55 of 1967. Source: WIPO (http://www.wipo.org).
Export Credit and Foreign Investments Re-Insurance Act No. 78 of 24 June 1957; effective 12 July 1957. Source: "Trade and Industry", Statutes of the Republic of South Africa (classified and annotated looseleaf edition 1910 to present) p. 351.
Business Names Act No. 27 of 1960, as amended by the Business Names Amendment Act No. 84 of 1972, and the Business Names Amendment Act No. 31 of 1979. Source: WIPO (http://www.wipo.org).
Income Tax Act No. 58 of 25 May 1962: effective I July 1962. Source: "Trade and Industry", Statutes of the Republic of South Africa (;classified and annotated looseleaf edition, 1910 to present), "Income Tax". p. 101.
Amendment, No. R.1615, of Schedule 1 of the Regulations proclaimed in terms of the Trade Marks Act No. 62 of 1963, August 1984. Source: WIPO (http://www.wipo.org).
Trade Marks Act of 1963, Regulations, No. R. 2313, December 1971. Source: WIPO (http://www.wipo.org).
Atomic Energy Act No. 90 of 1967 (as amended) (Sections 21 and 21A: Patents). Source: WIPO (http://www.wipo.org).
Proclamation by the Acting State President of the Republic of South Africa No. R. 360 of 1967 (commencement of the Designs Act). Source: WIPO (http://www.wipo.org).
Designs Regulations No. R. 361 of 1968, as amended by Designs Amending Regulations No. R. 3755 of 1969. Source: WIPO (http://www.wipo.org).
Companies Act No. 61 of 19 June 1973; effective I January 1975. "Companies", p. 489. Source: "Trade and Industry", Statutes of the Republic of South Africa (classified and annotated looseleaf edition, 1910 to present).
Amendments, Nos R.1110 and R.1613 of the Regulations published by virtue of the Patents Patents Act No. 57 of 1978, as amended by the Patents Amendment Act No. 14 of 1979. Source: WIPO (http://www.wipo.org).

South Africa
595
Copyright Act No. 98 of 1978, as amended by the respective Copyright Amendments Acts, No. 56 of 1980, No. 66 of 1983, No. 52 of 1984, No. 39 of 1986, No. 13 of 1988, No. 61 of 1989 and No. 1125 of 1992. Source: WIPO (http://www.wipo.org).
Patents Regulations of 1978, effective January 1979. Source: WIPO (http://www.wipo.org).
Maintenance and Promotion of Competition Act No. 96 of 21 June 1979; effective 1 January 1980. Source: "Trade and Industry", Statutes of the Republic of South Africa (classified and annotated looseleaf edition, 1910 to present), "Trade and Industry", p. 695.
Financial Institution (Investment Funds) Act No. 39 of 20 March 1984; effective 11 April 1984. Source: "Trade and Industry", Statutes of the Republic of South Africa (classified and annotated looseleaf edition, 1910 to present), "Banking and Currency", p. 621.
Close Corporations Act No. 69 of 19 June 1984; effective 1 January 1985. Source: "Trade and Industry", Statutes o1 the Republic of South Africa (classified and annotated looseleaf edition, 1910 to present), p. 1,201.
Diamonds Act No. 56 of 11 June 1986; effective 1 October 1986. Source: "Trade and Industry", Statutes of the Republic of South Africa (classified and annotated looseleaf edition, 1910 to present), "Mining and Minerals", p. 155.
Temporary Removal of Restriction on Economic Activities Act No. 87 of 3 September 1986; effective 10 September 1986. Source: "Trade and Industry", Statutes of the Republic of 'South Africa (classified an,4 annotated looseleaf edition, 1910 to present), p. 913.
Amendment of regulation under section 95 of the Diamonds Act 1986. Source: Government Communication Information Services
Temporary Removal of Restriction on Economic Activities Amendment Act No. 67 of 29 June 1988; effective on 29 June 1988. Source: "Trade and Industry", Statutes of the Republic of South Africa (classified and annotated looseleaf edition, 1910 to present), p. 922.
Trade Marks Act No. 194 of 1993, assented to December 1993. Source: WIPO (http://www.wipo.org).
Designs Act [No. 195 of 1993]. Source: South Africa Government: Legislation (http://www.gov.za/acts/95index.html).
Maritime Zones Act [No. 15 of 1994]. Source: South Africa Government: Legislation (http://www.gov.za/acts/94index.html).
Taxation Laws Amendment Act [No. 20 of 1994]. Source: South Africa Government: Legislation (http://www.gov.za/acts/94index.html).
Income Tax Act [No. 21 of 1994]. Source: South Africa Government: Legislation (http://www.gov.za/acts/94index.html).
Mutual Banks Amendment Act [No. 25 of 1994]. Source: South Africa Government: Legislation (http://www.gov.za/acts/94index.html). Banks Amendment Act [No. 26 of 1994]. Source: South Africa Government: Legislation (http://www.gov.za/acts/94index.html).

World Investment Directory Volume X Africa 2008
596
Electricity Amendment Act [No. 46 of 1994]. Source: South Africa Government: Legislation (http://www.gov.za/acts/94index.html).
Mineral and Energy Laws Amendment Act [No. 47 of 1994]. Source: South Africa Government: Legislation (http://www.gov.za/acts/94index.html).
Insurance Amendment Act [No. 54 of 1996]. Source: South Africa Government: Legislation (http://www.gov.za/acts/96index.html).
Telecommunications Act [No. 103 of 1996]. Source: South Africa Government: Legislation (http://www.gov.za/acts/96index.html).
Tourism Amendment Act [No. 105 of 1996]. Source: South Africa Government: Legislation (http://www.gov.za/acts/96index.html).
Intellectual Property Laws Rationalisation Act [No. 107 of 1996]. Source: South Africa Government: Legislation (http://www.gov.za/acts/96index.html).
Financial Institution (Investment Funds) Amendment Act No. 22 of 1997; effective July 1997. Source: Government Communication Information Services
Close Corporations Amendment Act [No. 26 of 1997] - 18 July. Source: South Africa Government: Legislation (http://www.gov.za/acts/97index.html).
Insurance Amendment Act [No. 31 of 1997] - 5 September 1997. Source: South Africa Government: Legislation (http://www.gov.za/acts/97index.html).
Intellectual Property Laws Amendment Act [No.38 of 1997] - 1 October. Source: South Africa Government: Legislation (http://www.gov.za/acts/97index.html).
Taxation Laws Amendment Act [No. 30 of 1998]. Source: South Africa Government: Legislation (http://www.gov.za/acts/98index.html).
Companies Third Amendment Act [No. 125 of 1998]. Source: South Africa Government: Legislation (http://www.gov.za/acts/98index.html).
Maintenance and Promotion of Competition Amendment Act No. 35 of 1999; effective on April 1999. Source: Government Communication Information Services
Tourism Amendment Act [No. 8 of 2000]. Source: South Africa Government: Legislation (http://www.gov.za/acts/00index.html).
Taxation Laws Amendment Act [No. 30 of 2000]. Source: South Africa Government: Legislation (http://www.gov.za/acts/00index.html).
Banks Amendment Act [No. 36 of 2000]. Source: South Africa Government: Legislation (http://www.gov.za/acts/00index.html).
Tourism Second Amendment Act [No. 70 of 2000]. Source: South Africa Government: Legislation (http://www.gov.za/acts/00index.html).
Industrial development zone programme (Gazette 21803, Regulation Gazette 6936), 1 December 2000. Source: South Africa Government: Regulations (http://www.gov.za/regulations/index.html).
South Africa
597
Companies Amendment Act No. 35 of 2001; effective December 2001. Source: Government Communication Information Services
Industrial Development Amendment Act [No. 49 of 2001]. Source: South Africa Government: Legislation (http://www.gov.za/acts/95index.html).
Merchandise Marks Amendment Act no 50 of 2001. Source: Government Communication Information Services.
Regulations relating to representative offices of foreign banking institutions, (Gazette 22939, Regulation Gazette 7227), 13 December 2001. Source: South Africa Government: Regulations (http://www.gov.za/regulations/index.html).
Performers' Protection Amendment Act [No. 8 of 2002]. Source: South Africa Government: Legislation (http://www.gov.za/acts/02index.html).
Copyright Amendment Act [No. 9 of 2002]. Source: South Africa Government: Legislation (http://www.gov.za/acts/02index.html).
Mineral and Petroleum Resources Development Act [No. 28 of 2002]. Source: South Africa Government: Legislation (http://www.gov.za/acts/02index.html).
Export Credit and Foreign Investment Re-Insurance Amendment Act No. 34 of 2002, effective October 2002. Source: Government Communication Information Services.
Corporate Laws Amendment Act [No. 39 of 2002]. Source: South Africa Government: Legislation (http://www.gov.za/acts/02index.html).
Finance Act [No. 48 of 2002]. Source: South Africa Government: Legislation (http://www.gov.za/acts/02index.html).
Patents Amendment Act [No. 58 of 2002]. Source: South Africa Government: Legislation (http://www.gov.za/acts/02index.html).
Revenue Laws Amendment Act [No. 74 of 2002]. Source: South Africa Government: Legislation (http://www.gov.za/acts/02index.html).
Gas Regulator Levies Act [No. 75 of 2002]. Source: South Africa Government: Legislation (http://www.gov.za/acts/02index.html).
Exchange Control Amnesty and Amendment of Taxation Laws Act [No. 12 of 2003]. Source: South Africa Government: Legislation (http://www.gov.za/acts/index.html).
Insurance Amendment Act [No. 17 of 2003]. Source: South Africa Government Web-site: Legislation (http://www.gov.za/acts/index.html).
Banks Amendment Act [No. 19 of 2003]. Source: South Africa Government Web-site: Legislation (http://www.gov.za/acts/index.html).
Exchange control regulations: Appointment of an authorised dealer in foreign exchange (Gazette 24967, Regulation Gazette 7590), 7 March 2003. Source: South Africa Government: Regulations (http://www.gov.za/regulations/index.html).
World Investment Directory Volume X Africa 2008
598
Exchange control regulations: Cancellation of appointment of authorised dealers in foreign exchange (Gazette 24967, Regulation Gazette 7590), 7 March 2003. Source: South Africa Government: Regulations (http://www.gov.za/regulations/index.html).
Exchange control regulations: Cancellation of appointment of authorised dealers in foreign exchange (Gazette 24697, Regulation Gazette 7627), 11 April 2003. Source: South Africa Government: Regulations (http://www.gov.za/regulations/index.html).
Exchange control regulations: Cancellation and appointment of an authorised dealer in foreign exchange (Gazette 24697, Regulation Gazette 7627), 11 April 2003. Source: South Africa Government: Regulations (http://www.gov.za/regulations/index.html).
Income Tax Act: Strategic Industrial Project (Gazette 25137, Regulation Gazette 7701), 4 July 2003. Source: South Africa Government: Regulations (http://www.gov.za/regulations/index.html).
Telecommunications Act: Regulations (Gazette 25519, Regulation Gazette 7783), 1 October 2003. Source: South Africa Government: Regulations (http://www.gov.za/regulations/index.html).
Telecommunications Act: Regulations: Applications for Value Added Network Service (VANS) licences (Gazette 25519, Regulation Gazette 7783), 1 October 2003. Source: South Africa Government: Regulations (http://www.gov.za/regulations/index.html).
Telecommunications Act: Regulations: Applications for Private Telecommunication Network (PTN) licences (Gazette 25519, Regulation Gazette 7783), 1 October 2003. Source: South Africa Government: Regulations (http://www.gov.za/regulations/index.html).
Exchange Control Regulations: Appointment of authorised dealer in foreign exchange (Gazette 25527, Regulation Gazette 7784), 10 October 2003. Source: South Africa Government: Regulations (http://www.gov.za/regulations/index.html).
Private Security Industry Regulation Act: Exemption: De Beers Consolidated Mines Limited (Gazette 25565, Regulation Gazette 7791), 17 October 2003. Source: South Africa Government: Regulations (http://www.gov.za/regulations/index.html).
Broad-based Black Economic Empowerment Act No. 53 of 2003. Source: http://www.thedti.gov.za/bee/BEEAct-2003-2004.pdf.
Petroleum Pipelines Act No. 60, 2003. Source: http://www.info.gov.za/gazette/acts/2003/a60-03.pdf.
Taxation Laws Amendment Act No 16, 2004. Source: http://www.info.gov.za/gazette/acts/2004/a16-04.pdf.
Companies Amendment Act No 20, 2004. Source: http://www.info.gov.za/gazette/acts/2004/a20-04.pdf.

South Africa
599
II. International Framework
A. South Africa is a party to the following bi-lateral, multilateral, unilateral and regional
instruments:
Convention on the Recognition and Enforcement of Foreign Arbitral Awards of 1958, which entered into force on 7th June 1959.
Convention Establishing the Multilateral Investment Guarantee Agency of 1985, entered into force on 12 April 1988.
Southern Africa Development Community (SADC), signed on 17 August, 1992.Source: http://www.sadc.int/about_sadc/history.php.
Paris Convention for the Protection of Industrial Property of 1883 (Revised at Brussels in 1900, Washington in 1911, The Hague in 1925, London in 1934, Lisbon in 1958 and Stockholm in 1967, and as amended in 1979). Signed in 1994.
Marrakesh Agreement Establishing the World Trade Organisation of 15 April 1994. Entered into force on 1 January 1995. Agreement on Trade-Related Investment Measures. General Agreement on Trade in Services. Agreement on Trade Related Aspects of Intellectual Property Rights.
Trade, Development & Cooperation Agreement between South Africa and the European Union that became effective 1 January 2000.
African Growth and Opportunity Act (AGOA) that was signed on 18 May 2000 between the United States and sub-Sahara African countries
Partnership Agreement between the Members of The African, Caribbean and Pacific Group of States, of the one part and the European Community and its member states, of the other part signed in Cotonou, Benin on 23 June 2000.
B. Bilateral treaties
1. Bilateral investment treaties for the protection and promotion of investments: United Kingdom 1994, Canada 1995, Cuba 1995, France 1995, Germany 1995, Korea, Republic of 1995, Netherlands 1995, Switzerland 1995, Austria 1996, Denmark 1996, China 1997, Iran, Islamic Republic of 1997, Italy 1997, Mozambique 1997, Argentina 1998, Belgium / Luxembourg 1998, Chile 1998, Czech Republic 1998, Egypt 1998, Finland 1998, Ghana 1998, Greece 1998, Mauritius 1998, Russian Federation 1998, Senegal 1998, Spain 1998, Sweden 1998, Algeria 2000, Brunei Darussalam 2000, Turkey 2000, Uganda 2000, Tunisia 2002, Libya 2002, Qatar 2003, Yemen 2003, Canada 2004, Israel 2004, Congo, Democratic Republic of 2004, Equatorial Guinea 2004, Angola 2005, Congo 2005, Madagascar 2006, .
2. Bilateral treaties for the avoidance of double taxation: United States 1947, Sweden 1955, Zambia 1956, Ireland 1958, Lesotho 1959, Namibia 1959, Tanzania, United Republic of 1959 and 2005, Uganda 1959, Sweden 1961 and 1995, Zimbabwe 1965, Switzerland 1967, United Kingdom 1968 and 1978, Malawi 1971, Netherlands 1971, Swaziland 1972 and 2004, Spain 1973, Botswana 1977, Israel 1978, China 1980 and 2000, Taiwan Province of China 1980 and 1994, France 1993, Poland 1993, Romania 1993, Hungary 1994, Mauritius 1994, Belgium 1995, Canada 1995, Denmark 1995, Finland 1995, Italy 1995, Korea, Republic of 1995, Lesotho 1995, Austria 1996, Croatia 1996, Czech Republic 1996, Mauritius 1996, Norway 1996, Thailand 1996, Ireland 1997, Japan 1997, Malta 1997, United States of America 1997, Germany 1998 and 2003, Netherlands 1998, Seychelles 1998, Slovakia 1998, Australia 1999, Tunisia 1999, New Zealand 2002, Rwanda 2002, Belarus 2002, Oman 2003, Belarus 2003, Botswana 2003, Ukraine 2003,
World Investment Directory Volume X Africa 2008
600
Bulgaria 2004, Ethiopia 2004, Ghana 2004, Kuwait 2004, Congo, Democratic Republic of 2005, Gabon 2005, Malaysia 2005, Netherlands 2005, Turkey 2005, .
C. Other treaties:
Agreement on Trade, Development and Cooperation with the European Community and Its Member States (1994 and 1999).
Arrangement on trade and investment cooperation with Canada (1998).
Agreement with the United States of American government concerning the development of trade and investment relations (1999).

South Africa
601
D. Sources of information
Official
Reserve Bank of South Africa (www.resbank.co.za).
Secondary
African Development Bank (1998). African Development Report 1998 (London: Oxford University Press).
Biekpe, N. (2000). The 21st century is Africa's century. Creating investor interest in the continent: Eye on
Africa.
Bennell, Paul (1997a). "Foreign direct investment in Africa: rhetoric and reality" (Washington D.C.: SAIS Review) (Summer/Fall), pp. 127-139.
____________(1997b). "Privatization in sub-saharan Africa: progress and prospects during the 1990s", World Development, vol. 25, no. 11, pp. 1785-1803.
Business Map (1998). South African Investment Report 1998 (Johannesburg: Business Map SA).
___________(2000). "South Africa – an anchor under strain", in SADC investor survey: complex terrain
(Johannesburg: Businessmap).
Dunne, N. (1999). "US in S. Africa trade and investment pact", Financial Times, 19 February.
Economist Intelligence Unit (EIU) (various years). Country Profile: South Africa (London: EIU Ltd.).
____________(various years). Country Report: South Africa (London: EIU Ltd.).
International Monetary Fund (IMF) (2006). IMF's Sub-Saharan Africa Regional Economic Outlook, March 10, 2006. (Washington D.C.: IMF).
Hein Marais (1998). South Africa: Limits to Change? (Toronto).
International Finance Corporation (IFC) (1997). "Foreign direct investment", IFC: lessons of experience series No. 5. (Washington, D.C.: World Bank).
Ogunleye, Eric Kehinde (2008) "Exchange rate volatility and foreign direct investment inflows in selected Sub-Saharan African Countries" (PhD Thesis, University of Ibadan).
Peter Fallon and Luis Pereira da Silva (1994). South Africa: Economic Performance and Policies(Washington D.C.: World Bank), April.
United Nations Conference on Trade and Development (UNCTAD) (1995). Foreign Direct Investment in
Africa (Geneva: United Nations (United Nations publication, Sales No. E.95.II.A.6).
____________(2005a). Investor-Disputes Arising from Investment Treaties: A Review. UNCTAD Series of International Investment Policies for Development (UNCTAD/ITE/IIT/2005/4).
____________(2005b). A Survey of Support by Investment Promotion Agencies to Linkages. Advisory Studies No. 18 (UNCTAD/ITE/IPC/2005/12).
____________(2005c). FDI in least developed countries at a glance: 2005/2006
(UNCTAD/ITE/IIA/2005/17).

World Investment Directory Volume X Africa 2008
602
United States Commercial Service (2006). Doing Business in South Africa: A country Commercial Guide
for US Companies. (Washington D.C.: US Government).
United States Trade Representative (2006). 2006 Comprehensive Report on U.S. Trade and Investment
Policy Toward Sub-Saharan Africa and Implementation of the Africa Growth and Opportunity Act: The Sixth of Eight Annual Reports, May 2006. (Washington D.C.: US Government).
World Bank (2001). Global development finance (Washington D.C.: World Bank).
______________(2000). Business in Africa: missed opportunities? Edited version of World Bank chapter in Can Africa claim the 21st century? (Washington D.C.: World Bank).
______________(2005). South Africa: an assessment of the investment climate. June, 2005.
World Bank/International Finance Corporation (2007). Doing Business 2008 South Africa (Washington D.C.: The World Bank Group).
Sudan
603
Sudan
A. Definitions and sources of data
In Sudan, the Encouragement of Investment Act of 1990 (1990 Act No. 64) defines foreign direct investment (FDI) as "invested capital" in the form of foreign exchange transferred through one of the banks, registered with the Bank of Sudan and used in the establishment, operation, modernization, rehabilitation or expansion of the project; the local exchange which is discharged with on the approval of the bodies concerned to meet obligations in foreign exchange due for payment to the investor, where it is used to establish, operate, modernize, rehabilitate or expand a project; machinery, equipment, apparatuses, materials and other requirements, imported or local means of transport for the establishment operation, modernization, rehabilitation or expansion of the project in line with the provisions of section 23 (4)(g); intangible rights, used in the projects, such as patents, studies, and otherwise, provided that such rights shall be registered in accordance with the provisions of the law pertaining to each and owned by the investor or he is licensed to use the same by the person who owns the same; profits realized by the project, including those liable to transfer abroad, if used to complete or augment the capital of the project, or invested in any other project.
The Bank of Sudan collects data on FDI in the country. Data were also provided by the International Monetary Fund and the Organization for Economic Co-operation and Development. In 1974, the Government of Sudan implemented the Development and Promotion of Industrial Investment to attract investors with concessions such as tax incentives of up to 15 years. The policy was extended in May 1980 into the Encouragement of Investment Act which provides customs tax and other benefits to the investors with the agricultural, petroleum and mining industries.
To support growth, reduce the drain on public finances and fund infrastructure development projects that remain beyond the reach of its own resources, the Government of Sudan has sought to draw local and foreign capital into areas of the economy that were previously reserved for the state and has committed to privatizing State-owned enterprises. The divestment programme began in the early 1990s with the passage of the Privatization of State Corporations Act in 1992 which earmarked 190 public corporations for sale. Although public corporations were sold during Phase 1 (1993-95), the privatization programme failed to build momentum and the planned high-profile sale of several key assets, including the National Electricity Company and Sudan Airways, is yet to be completed. Other smaller sales have taken place in recent years such as the divestment of the Atbara cement factory and privatization of the Sudan Duty-Free Zone Company and the Bridges and Road Corporation.
Foreigners have played a leading role in developing Sudan’s oil industry, funding the building of upstream resources, constructing industry infrastructure including the export pipeline and downstream facilities such as the new al-Jeili refinery. As the success of these projects has become apparent, the Government has sought private partners to boost investment in other sectors with the same level of success. This includes the power sector where the country’s first build-operate-transfer power plant came on line in 2004. In the early 1980s, the United States' firm Chevron discovered large deposits of oil in fields near Bentiu in Unity state and Melut in Blue Nile. In March 1997, Arakis signed a consortium agreement with the China National Petroleum Corporation (CNPC), the Malaysian State-owned oil company, Petronas, and the Sudanese State-owned firm, SudaPet, forming the Greater Nile Petroleum Operating Company (GNPOC).

World Investment Directory Volume X Africa 2008
604
The Sudanese Government signed to the Convention on the Settlement of Investment Disputes between State and Nationals of other States on 15 March 1967 and had traditionally participated in the regional integration schemes at the sub-regional and regional levels. At the end of 2005, the country belonged to several bodies such as the Intergovernmental Authority on Development, League of Arab States, Common Market for Eastern and Southern African countries, African Union and the New Partnership for Africa's Development. Sudan is party to the Cotonou Agreement for renegotiating the trade links between the African, Caribbean and Pacific countries with the European Union, under the Lomé Convention and has an observer status at the World Trade Organization.
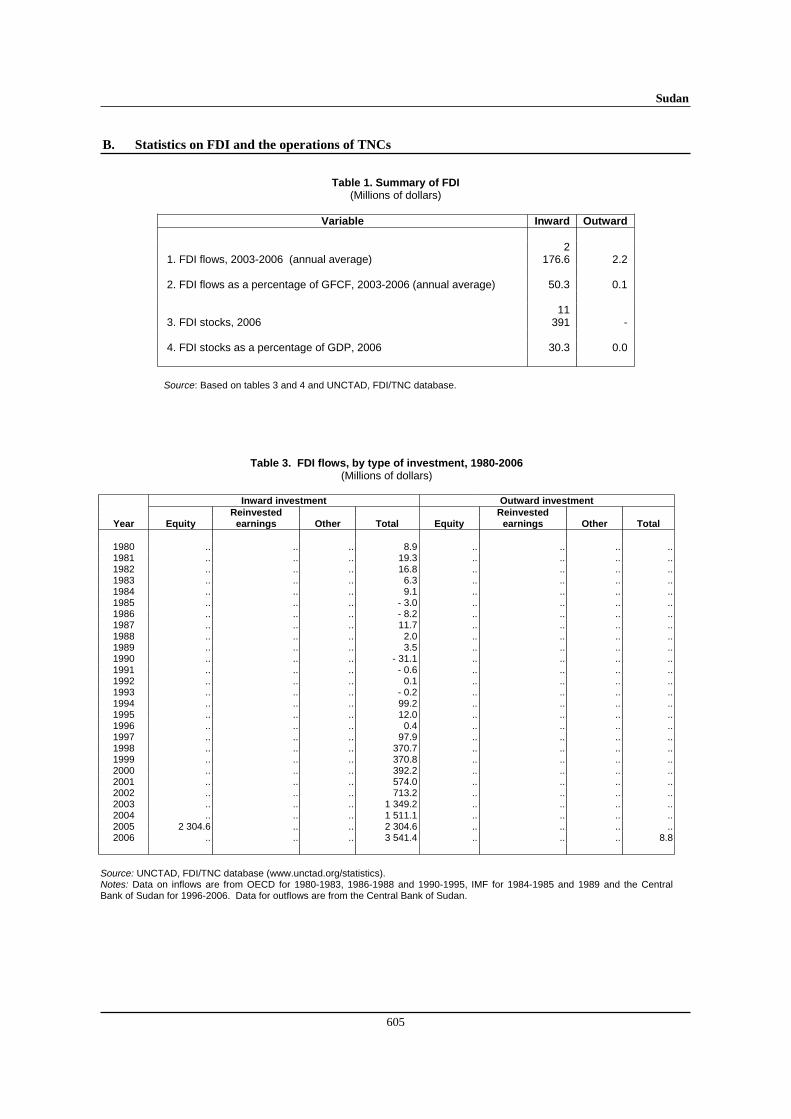
Sudan
605
B. Statistics on FDI and the operations of TNCs
Table 1. Summary of FDI (Millions of dollars)
Variable Inward Outward
1. FDI flows, 2003-2006 (annual average) 2
176.6 2.2
2. FDI flows as a percentage of GFCF, 2003-2006 (annual average) 50.3 0.1
3. FDI stocks, 2006 11 391 -
4. FDI stocks as a percentage of GDP, 2006 30.3 0.0
Source: Based on tables 3 and 4 and UNCTAD, FDI/TNC database.
Table 3. FDI flows, by type of investment, 1980-2006 (Millions of dollars)
Inward investment Outward investment
Reinvested Reinvested Year Equity earnings Other Total Equity earnings Other Total
1980 .. .. .. 8.9 .. .. .. ..1981 .. .. .. 19.3 .. .. .. ..1982 .. .. .. 16.8 .. .. .. ..1983 .. .. .. 6.3 .. .. .. ..1984 .. .. .. 9.1 .. .. .. ..1985 .. .. .. - 3.0 .. .. .. ..1986 .. .. .. - 8.2 .. .. .. ..1987 .. .. .. 11.7 .. .. .. ..1988 .. .. .. 2.0 .. .. .. ..1989 .. .. .. 3.5 .. .. .. ..1990 .. .. .. - 31.1 .. .. .. ..1991 .. .. .. - 0.6 .. .. .. ..1992 .. .. .. 0.1 .. .. .. ..1993 .. .. .. - 0.2 .. .. .. ..1994 .. .. .. 99.2 .. .. .. ..1995 .. .. .. 12.0 .. .. .. ..1996 .. .. .. 0.4 .. .. .. ..1997 .. .. .. 97.9 .. .. .. ..1998 .. .. .. 370.7 .. .. .. ..1999 .. .. .. 370.8 .. .. .. ..2000 .. .. .. 392.2 .. .. .. ..2001 .. .. .. 574.0 .. .. .. ..2002 .. .. .. 713.2 .. .. .. ..2003 .. .. .. 1 349.2 .. .. .. ..2004 .. .. .. 1 511.1 .. .. .. ..2005 2 304.6 .. .. 2 304.6 .. .. .. ..2006 .. .. .. 3 541.4 .. .. .. 8.8
Source: UNCTAD, FDI/TNC database (www.unctad.org/statistics). Notes: Data on inflows are from OECD for 1980-1983, 1986-1988 and 1990-1995, IMF for 1984-1985 and 1989 and the Central Bank of Sudan for 1996-2006. Data for outflows are from the Central Bank of Sudan.
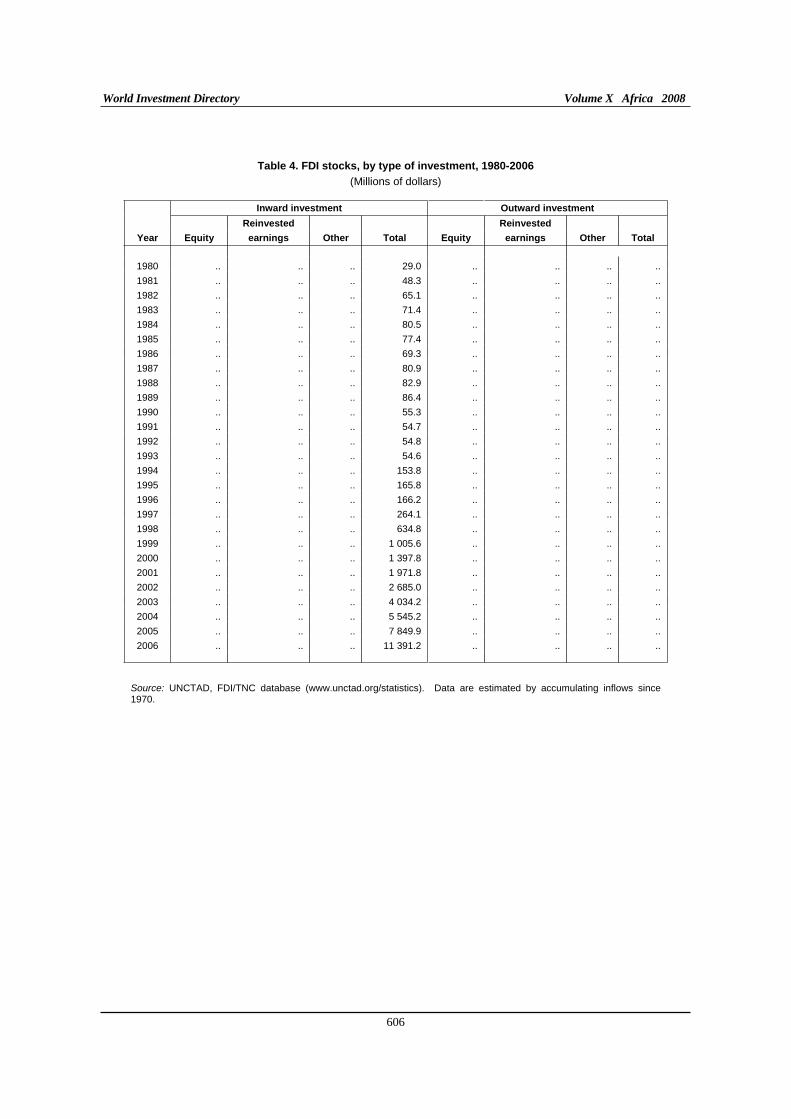
World Investment Directory Volume X Africa 2008
606
Table 4. FDI stocks, by type of investment, 1980-2006
(Millions of dollars)
Inward investment Outward investment
Reinvested Reinvested
Year Equity earnings Other Total Equity earnings Other Total
1980 .. .. .. 29.0 .. .. .. ..
1981 .. .. .. 48.3 .. .. .. ..
1982 .. .. .. 65.1 .. .. .. ..
1983 .. .. .. 71.4 .. .. .. ..
1984 .. .. .. 80.5 .. .. .. ..
1985 .. .. .. 77.4 .. .. .. ..
1986 .. .. .. 69.3 .. .. .. ..
1987 .. .. .. 80.9 .. .. .. ..
1988 .. .. .. 82.9 .. .. .. ..
1989 .. .. .. 86.4 .. .. .. ..
1990 .. .. .. 55.3 .. .. .. ..
1991 .. .. .. 54.7 .. .. .. ..
1992 .. .. .. 54.8 .. .. .. ..
1993 .. .. .. 54.6 .. .. .. ..
1994 .. .. .. 153.8 .. .. .. ..
1995 .. .. .. 165.8 .. .. .. ..
1996 .. .. .. 166.2 .. .. .. ..
1997 .. .. .. 264.1 .. .. .. ..
1998 .. .. .. 634.8 .. .. .. ..
1999 .. .. .. 1 005.6 .. .. .. ..
2000 .. .. .. 1 397.8 .. .. .. ..
2001 .. .. .. 1 971.8 .. .. .. ..
2002 .. .. .. 2 685.0 .. .. .. ..
2003 .. .. .. 4 034.2 .. .. .. ..
2004 .. .. .. 5 545.2 .. .. .. ..
2005 .. .. .. 7 849.9 .. .. .. ..
2006 .. .. .. 11 391.2 .. .. .. ..
Source: UNCTAD, FDI/TNC database (www.unctad.org/statistics). Data are estimated by accumulating inflows since 1970.
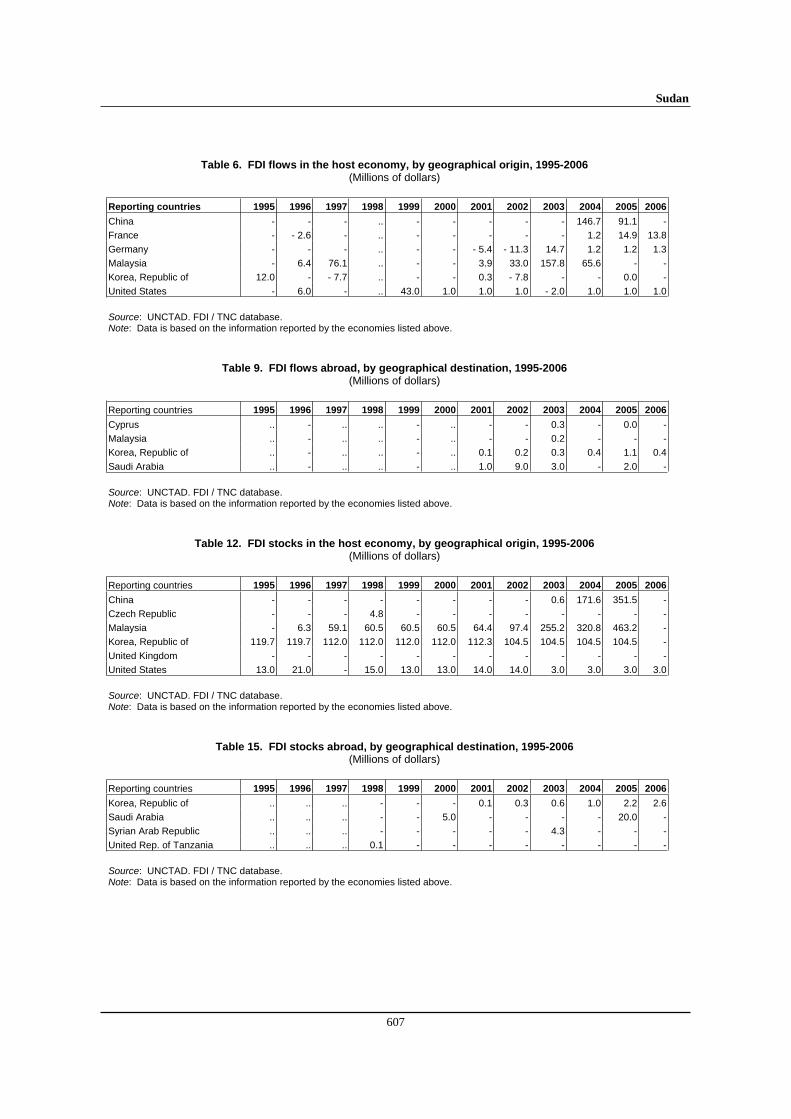
Sudan
607
Table 6. FDI flows in the host economy, by geographical origin, 1995-2006 (Millions of dollars)
Reporting countries 1995 1996 1997 1998 1999 2000 2001 2002 2003 2004 2005 2006
China - - - .. - - - - - 146.7 91.1 -
France - - 2.6 - .. - - - - - 1.2 14.9 13.8
Germany - - - .. - - - 5.4 - 11.3 14.7 1.2 1.2 1.3
Malaysia - 6.4 76.1 .. - - 3.9 33.0 157.8 65.6 - -
Korea, Republic of 12.0 - - 7.7 .. - - 0.3 - 7.8 - - 0.0 -
United States - 6.0 - .. 43.0 1.0 1.0 1.0 - 2.0 1.0 1.0 1.0
Source: UNCTAD. FDI / TNC database. Note: Data is based on the information reported by the economies listed above.
Table 9. FDI flows abroad, by geographical destination, 1995-2006 (Millions of dollars)
Reporting countries 1995 1996 1997 1998 1999 2000 2001 2002 2003 2004 2005 2006
Cyprus .. - .. .. - .. - - 0.3 - 0.0 -
Malaysia .. - .. .. - .. - - 0.2 - - -
Korea, Republic of .. - .. .. - .. 0.1 0.2 0.3 0.4 1.1 0.4
Saudi Arabia .. - .. .. - .. 1.0 9.0 3.0 - 2.0 -
Source: UNCTAD. FDI / TNC database. Note: Data is based on the information reported by the economies listed above.
Table 12. FDI stocks in the host economy, by geographical origin, 1995-2006 (Millions of dollars)
Reporting countries 1995 1996 1997 1998 1999 2000 2001 2002 2003 2004 2005 2006
China - - - - - - - - 0.6 171.6 351.5 -
Czech Republic - - - 4.8 - - - - - - - -
Malaysia - 6.3 59.1 60.5 60.5 60.5 64.4 97.4 255.2 320.8 463.2 -
Korea, Republic of 119.7 119.7 112.0 112.0 112.0 112.0 112.3 104.5 104.5 104.5 104.5 -
United Kingdom - - - - - - - - - - - -
United States 13.0 21.0 - 15.0 13.0 13.0 14.0 14.0 3.0 3.0 3.0 3.0
Source: UNCTAD. FDI / TNC database. Note: Data is based on the information reported by the economies listed above.
Table 15. FDI stocks abroad, by geographical destination, 1995-2006 (Millions of dollars)
Reporting countries 1995 1996 1997 1998 1999 2000 2001 2002 2003 2004 2005 2006
Korea, Republic of .. .. .. - - - 0.1 0.3 0.6 1.0 2.2 2.6
Saudi Arabia .. .. .. - - 5.0 - - - - 20.0 -
Syrian Arab Republic .. .. .. - - - - - 4.3 - - -
United Rep. of Tanzania .. .. .. 0.1 - - - - - - - -
Source: UNCTAD. FDI / TNC database. Note: Data is based on the information reported by the economies listed above.

World Investment Directory Volume X Africa 2008
608
Table 23. The number of affiliates of foreign TNCs in the host economy, by geographical origin, 1994-2005
Economy 1994 1995 1996 1997 1998 1999 2000 2001 2002 2003 2004 2005
Italy .. 2 .. 2 .. .. .. .. .. .. .. ..
Republic of Korea .. .. 6 6 6 6 6 7 6 6 6 7
United States 2 2 2 1 1 1 1 1 1 .. .. ..
Source: UNCTAD, FDI/TNC database.
Note: Data are based on information reported by the economies listed above.
Table 35. Employment of affiliates of foreign TNCs in the host economy, by geographical origin, 1994-2005
(Thousands of employees)
Economy 1994 1995 1996 1997 1998 1999 2000 2001 2002 2003 2004 2005
Italy .. 0.3 .. 0.3 .. .. .. .. .. .. .. ..
United States 0.1 0.1 0.1 0.1 0.1 .. .. .. .. .. .. ..
Source: UNCTAD, FDI/TNC database.
Note: Data are based on information reported by the economies listed above.
Tables 30 and 50. Assets and value added of affiliates of United States TNCs in Sudan , 1994-2005
(Millions of dollars)
Table no./Variable 1994 1995 1996 1997 1998 1999 2000 2001 2002 2003 2004 2005
30. Assets .. .. .. .. .. .. .. .. .. 4 .. ..
50. Value added a .. -1 2 2 3 .. .. .. .. .. .. ..
Source: UNCTAD, FDI/TNC database.
Note: Data are based on information reported by the United States.a Data refer to majority-owned affiliates only.
Table 45. Sales of affiliates of foreign TNCs in the host economy, by geographical origin, 1994-2005
(Millions of dollars)
Economy 1994 1995 1996 1997 1998 1999 2000 2001 2002 2003 2004 2005
Italy .. 92.3 .. 88.3 .. .. .. .. .. .. .. ..
United States .. .. .. .. .. .. .. .. .. 2.0 .. ..
Source: UNCTAD, FDI/TNC database. Note: Data are based on information reported by the economies listed above.

Sudan
609
Table 86. Largest home-based TNCs, 2007 (Billions of dollars)
Company Industry Sales
A. Industrial
.. .. .. B. Tertiary Sudanese Telecom Company Telecommunications 0.5
a
C. Finance and Insurance Assets
.. .. .. Source: Jeune Afrique Hors-serie No. 14, 2007.a 2004.
Table 87. Largest affiliates of home-based TNCs, 2007
(Millions of dollars and number)
Company Name Host Economy Industry Sales Employees
A. Industrial
.. .. .. .. .. B. Tertiary Silver Crest Enterprises Limited United Kingdom Holding .. ..
C. Finance and insurance Assets Employees
.. .. .. .. ..
Source: Who Owns Whom database (https://solutions.dnb.com/wow), retrieved January 2008.
Table 88. Largest affiliates of foreign TNCs in the host economy, 2007
(Millions of dollars and number) Company Home economy Industry Sales Employees
A. Industrial
Savola Edible Oils (Sudan) Ltd Saudi Arabia Food products, beverages and tobacco .. 4 500
Sudanese Liquid Air Limited France Chemicals and chemical products .. 1 000Sudapak Corporation Limited Pakistan Petroleum .. 100China Petroleum Engineering and Construction Group Corp Sudan Branch China Petroleum .. 20
B. Tertiary
Shell Company Of Sudan Ltd United Kingdom Wholesale trade .. ..Daihatsu Motors Ltd Saudi Arabia Wholesale trade .. 6 000Sdv Transintra Sudan Ltd France Supporting transport activities .. 75Sudanese Mobile Telephone Company Limited Kuwait Telecommunications .. 50Yasarya International Trading United States Distributive trade .. 5
C. Finance and Insurance Assets Employees
Saudi Sudanese Bank Saudi Arabia Finance .. 300 a
Source: Who Owns Whom database (https://solutions.dnb.com/wow), retrieved January 2008. a 2003.

World Investment Directory Volume X Africa 2008
610
C. Legal frameworks for transnational corporations
Sudan has adopted a number of national, bilateral and multilateral legal instruments to regulated the activities of transnational corporations and foreign direct investors. The key instruments that apply in the country include the following:
I. National framework
Companies Act of 1925. Source: International Bureau of Fiscal Documentation, suppl. No. 75, March 1990.
Registration of Business Names Act, 1931 Source: International Bureau of Fiscal Documentation, suppl. No. 75, March 1990.
Bank of Sudan Act (1959) Source: Bank of Sudan (http://www.bankofsudan.org/english/circule.htm).
Trade Marks: Law No. 8 of 1969. Source: WIPO (http://www.wipo.org).
Patents: Law No. 58 of 1971. Source: WIPO (http://www.wipo.org).
Act for Licensing Commercial Agents of 1972. Source: International Bureau of Fiscal Documentation, suppl. No. 75, March 1990.
Mining and Quarries Law, 1972 Source: Embassy of the Sudan in South Africa (http://www.sudani.co.za)
Petroleum Resources Act, 1972; amended in 1975. Source: MBendi Information for Africa (http://www.mbendi.co.za/indy/oilg/govo/af/su/p0005.htm).
Petroleum Resources Regulations, 1973. Source: MBendi Information for Africa (http://www.mbendi.co.za/indy/oilg/govo/af/su/p0005.htm).
Manpower Act, 1974 (Regulation for employment of aliens). Source: Official Gazette No. 1163 of 15 July 1974.
Copyright Law No. 49, May 1974, as amended. Source: WIPO (http://www.wipo.org).
Income Tax Act, 1986, as amended in various years. Source: Economics File Number 14, Main Aspects of the Tax Laws and Regulations in Sudan, Prepared by the Taxation Chamber of the Ministry of Finance and Economy of the Republic of Sudan, Edited with an Introduction, by Sean Gabb, An occasional paper published by The Sudan Foundation: http://www.sufo.demon.co.uk/econ014.htm.
Banking Regulation Act (1991). Source: Bank of Sudan (http://www.bankofsudan.org/english/circule.htm).
Policy Measures for the Rectification of the Sudanese Economy. Adopted by the Joint Meeting of the Revolutionary Command Council and the Council of Ministers of 2 February 1992. Source: Information Bulletin of the PEE. French Embassy in Khartoum of 14 September 1992

Sudan
611
Copyright and Related Rights Law, December 1996. Source: WIPO (http://www.wipo.org).
Investment Act, 1999, repealing the 1996 Investment Law and its amendments. Source: Sudan Home (http://sudanhome.com/info/investact.htm). Amended 2000, Source: Sudan Investment Authority (http://www.sudaninvest.org).
Provisional Decree, The value Added Act, 1999 Source: Republic of the Sudan Chamber of Commerce (http://www.sudatax.com/eng/vat/laws/index.htm).
Circulars Issued by The Bank of Sudan: Regulation Organization Dealing in Foreign Currency1999, circular No 9/2002 dated 11/6/2002 (Import Regulations); Regulation Organization Dealing in Foreign Currency1999, circular No10/2002 dated 17/6/2002 (Regulation Organization daily in Foreign Exchange Accounts Restricted With Local currency); Regulation Organization Dealing in Foreign Currency1999, circular No 11/2002 dated 17/6/2002 (Regulation Organization Exchange Bureaus2000); Regulation Organization Dealing in Foreign Currency1999,circular No 12/2002 dated 17/6/2002 (Utilization of Resources of Foreign Currency dealing room); Regulation Organization Dealing in Foreign Currency1999,circular No 13/2002 dated 20/6/2002(Conditions Determining and issuing License for the Exchange Bureau); Regulation Organization Dealing in Foreign Currency1999,circular No 142002 dated 26/6/2002(Exchange Bureaus FUNDS Uses); Regulation Organization Dealing in Foreign Currency1999,circular No 15/2002 dated 26/6/2002 (Utilization of Resources of Foreign Currency dealing room).
Value Added Tax Regulation (2000) Source: Sudan Chamber of Commerce (http://www.sudatax.com/eng/vat/laws/index.htm).
Communications Law, 2001. Source: Arab Communication Consult: (http://www.arabcomconsult.com/sudan2002/telecom.htm).
II. International Framework
A. Sudan is a party to the following multilateral and regional instruments:
Convention on the Settlement of Investment Disputes between States and Nationals of other States of 1965. Entered into force on 14 October 1966.
Convention Establishing the Inter-Arab Investment Guarantee Corporation of May 1971; entered into force in April 1974.
Agreement for the Promotion, Protection and Guarantee of Investment Among Member States of the Organization of Islamic Conference, of 1 June 1981; entered into force on 23 September 1986. Unified Agreement for the Investment of Arab Capital in the Arab States of 1982.
Convention Establishing the Multilateral Investment Guarantee Agency of 1985, entered into force on 12 April 1988.
Fourth ACP - EEC Convention (Lome IV) of 1989, entered into force on 1st March 1990.
Charter on a Regime of Multinational Industrial Enterprises (MIEs) in the Preferential Trade Area for Eastern and Southern African States (PTA), signed on 21 November 1990, entered into force August 1995. Source: Preferential Trade Area for Eastern ans Southern African States: Report of the Sixteenth Meeting of the Council of Ministers, 17-19 november, 1990, Mbabane, Swaziland (PTA/CM/XVI/2)

World Investment Directory Volume X Africa 2008
612
Articles of Agreement of the Islamic Corporation for the Insurance of Investment and Export Credit of 19 February 1992. Entered into force on 1 August 1994.
Paris Convention for the Protection of Industrial Property of 1883 (Revised at Brussels in 1900, Washington in 1911, The Hague in 1925, London in 1934, Lisbon in 1958 and Stockholm in 1967, and as amended in 1979). Signed in 1994.
Partnership Agreement between the Members of The African, Caribbean and Pacific Group of States, of the one part and the European Community and its member states, of the other part signed in Cotonou, Benin on 23 June 2000.
B. Bilateral treaties
1. Bilateral investment treaties for the protection and promotion of investments: Germany 1963, Netherlands 1970, Switzerland 1974, Egypt 1977, France 1978, Romania 1978, Libyan Arab Jamahiriya 1990, China 1997, Indonesia 1998, Malaysia 1998, Qatar 1998, Iran, Islamic Republic of 1999, Morocco 1999, Oman 1999, Turkey 1999, Yemen 1999, Bahrain 2000, Djibouti 2000, Ethiopia 2000, Jordan 2000, Syrian Arab Republic 2000, Algeria 2001, Egypt 2001, Kuwait 2001, United Arab Emirates 2001, Viet Nam 2001, Bulgaria 2002, Chad 2002, Switzerland 2002, India 2003, Netherlands 2003, Tunisia 2003, Lebanon 2004, Belgium and Luxembourg 2005, Italy 2005.
2. Bilateral treaties for the avoidance of double taxation: Egypt 1970, United Kingdom 1975, Malaysia 1993, China 1997, Qatar 1998, Syrian Arab Republic 2001, Turkey 2001, United Arab Emirates 2001, Oman 2003, Tunisia 2003, Korea, Republic of 2004, Lebanon 2004, Bahrain 2006.
C. Other treaties:
Investment agreement for the COMESA Common Investment Area (2007).

Sudan
613
D. Sources of information
Official
Bank of Sudan (www.bankofsudan.org).
Secondary
African Development Bank (ADB) (1998). "Study on the identification of rehabilitation needs of selected industrial sub-sectors" (Khartoum).
Alfaro, Laura et al. (2002). "FDI and economic growth: the role of local financial market".
Arab Communication Consult (ACC) (2002). Sudan Report (Beirut: ACC).
Burr, J. Millard and Robert, O., Collins (1995). Requiem for the Sudan (Colaroda: Westview).
Craig, G. M. (ed) (undated). The Agriculture of the Sudan, (London: Oxford University Press).
Economist Intelligence Unit (various years). Country Profile: Sudan (London: EIU Ltd.).
___________(various years). Country Report: Sudan (London: EIU Ltd.).
Soderbom, M. and F. Teal (2004). "Size and Efficiency in Africa Manufacturing firms: Evidence from Firm-Level Panel Data." Journal of Development Economics, 73. pp 369 - 394.
United Nations Conference on Trade and Development (UNCTAD) (2002). FDI in Least Developed
Countries at a Glance (Geneva: UNCTAD) (www.unctad.org/en/subsites/dite/LDCs/ pdfs/Countries/Sudan.pdf).
____________(2005a). Investor-Disputes Arising from Investment Treaties: A Review. UNCTAD Series of International Investment Policies for Development (UNCTAD/ITE/IIT/2005/4).
____________(2005b). A Survey of Support by Investment Promotion Agencies to Linkages. Advisory Studies No. 18 (UNCTAD/ITE/IPC/2005/12).
____________(2005c). FDI in least developed countries at a glance: 2005/2006
(UNCTAD/ITE/IIA/2005/17).
United Nations Industrial Development Organization (UNIDO) (1999). "Republic of Sudan, integrated programme for capacity building to enhance industrial competitiveness and sustainability in Sudan (with emphasis on SMEs and Agro-Industries)" (UNIDO: Vienna).
____________(2001). Industry and sustainable development in Sudan: achievement and prospects (UNIDO: Vienna).
Woodward, Peter (1990). Sudan, 1898-1989, (London: Rienner).
Woodward, Peter (ed) (1992). Sudan since Nimeiri, (London: Croom Helm).
World Bank/International Finance Corporation (2007). Doing Business 2008 Sudan (Washington D.C.: The World Bank Group).


Swaziland
615
Swaziland
A. Definitions and sources of data
The Companies Act and the Registration of Business Act of 1993 govern establishment and operation of foreign direct investment (FDI) in Swaziland. But these Acts do no provide specific definitions of FDI. Data on FDI in the country were gathered from the Central Bank of Swaziland. The International Monetary Fund also provides data on FDI in Swaziland in its balance-of-payment statistics. The Government of Swaziland established the Swaziland Industrial Development Company Limited (SIDC) to promote and protect FDI. SIDC functions as the investment center. The Act provides incentives for foreign companies operating in the country. FDI projects have to receive the approval of the Ministry of Commerce and Industry.
The main incentives granted to foreign investors in Swaziland are fiscal in nature. The use of foreign currency is controlled. Capital repatriation, remittances of dividends and royalties are subject to the approval of the Central Bank of Swaziland. Some opportunities remain untapped in many sectors. In an attempt to make Swaziland the preferred destination for FDI, continuous improvements to create an enabling environment have been fruitful. Some of these achievements to date, among many, include centralizing vital business processes such as business registration, trading licenses, work permits, factory shells identification, all under the Swaziland Investment Promotion Authority. The business environment and infrastructure in Swaziland also lends itself to a wide and varied range of businesses. In particular, manufacturing and agriculture are most suited to a Swaziland environment mainly because of the preferential entry to markets of the United States and European Union countries.
The Companies Act legislation distinguishes between partnerships, foreign companies, public and private companies. Public and private companies are limited by their share capital. Public companies have the word "Limited" after their name whereas private companies have the words "Proprietary Limited". The most common type of investment is through private companies. The Articles of Association of such companies include the following clauses:
• a restriction of the right to transfer shares • membership limited to a maximum of 50, excluding employees of the company • any offer for subscriptions of any shares or debentures to the public is not allowed. Instead of
operating through a subsidiary, a foreign company may operate through a branch in Swaziland and is classified as an external company. It is obligatory to register with the Registrar of Companies; and companies must comply with the provisions of the Companies Act.
Swaziland prohibits nationalization of foreign-owned property and foreign firms receive national treatment. The economy depends largely on export production run by foreign majority-owned firms in such industries as wood pulp, sugar and soft drink concentrate. Residents and non-residents may hold foreign exchange accounts, but residents face quantitative limits. Payments and transfers are subject to controls but are not usually restricted. Except for equity investments by non-residents, the Central Bank of Swaziland must approve all inward capital transfers. Most other capital transactions that require documentation are controlled, prohibited or face quantitative limits.
World Investment Directory Volume X Africa 2008
616
Swaziland has concluded double taxation agreements with many countries. The most significant are with South Africa and the United Kingdom. The agreements concern dividends, interest, royalties and fees. The Government had traditionally participated in the regional integration schemes at the sub-regional and regional levels. Swaziland signed to the Convention on the Settlement of Investment Disputes between State and Nationals of other States on 3 November 1970. It is eligible for the Cotonou Agreement for renegotiating the African, Caribbean and Pacific countries' partnership treaty with the EU and belonged to the African Union, the New Partnership for Africa's Development, South African Development Community, Southern African Customs Union and is eligible for the United States' market access initiative for African countries - the African Growth and Opportunity Act, the Everything But Arms initiative and the generalized system of preferences. It is also a member of the World Trade Organization.

Swaziland
617
B. Statistics on FDI and the operations of TNCs
Table 1. Summary of FDI (Millions of dollars)
Variable Inward Outward
1. FDI flows, 2003-2006 (annual average) - 0.9 - 1.7
2. FDI flows as a percentage of GFCF, 2003-2006 (annual average) - 0.2 - 0.4
3. FDI stocks, 2006 748 69
4. FDI stocks as a percentage of GDP, 2006 28.4 2.6
Source: Based on tables 3 and 4 and UNCTAD, FDI/TNC database.
Table 3. FDI flows, by type of investment, 1980-2006 (Millions of dollars)
Inward investment Outward investment
Reinvested Reinvested Year Equity earnings Other Total Equity earnings Other Total
1980 1.7 3.3 21.4 26.5 - 0.5 8.5 9.01981 2.5 12.3 22.3 37.1 - 1.6 1.0 5.9 5.41982 2.4 13.5 - 29.5 - 13.6 - 0.8 0.6 - 2.6 - 2.91983 0.9 - 1.5 - 5.0 - 5.7 - 0.7 0.8 - 0.2 - 0.11984 0.1 3.6 1.3 5.0 1.5 1.8 1.7 5.01985 - 0.6 8.4 3.9 11.7 - 1.5 3.2 1.0 2.71986 1.9 21.2 7.0 34.2 - 0.0 3.3 1.4 1.51987 5.3 45.8 6.3 57.5 4.9 3.5 4.3 9.31988 13.6 9.4 33.8 56.9 2.4 4.6 3.8 6.31989 19.4 50.2 2.9 72.5 2.8 1.6 11.0 13.81990 - 0.2 32.8 - 3.0 28.5 0.0 4.4 3.2 3.11991 15.0 27.4 43.0 85.4 0.2 9.3 15.5 15.71992 15.1 28.3 40.9 84.4 - 0.7 30.1 3.8 3.11993 8.8 61.6 1.5 71.9 - 0.9 19.1 9.7 8.71994 10.3 57.7 - 4.7 63.3 0.9 6.5 57.4 58.31995 31.6 - 1.1 13.0 43.5 3.4 1.6 26.6 30.01996 27.1 - 8.0 2.7 21.8 4.3 4.7 - 15.4 - 11.11997 4.2 - 25.0 5.8 - 15.1 6.6 1.1 3.4 10.01998 9.3 73.0 26.5 108.8 - 0.8 0.9 - 22.2 - 23.01999 1.4 34.4 62.4 98.3 - 1.4 0.8 - 13.8 13.22000 - 21.9 64.5 48.1 90.7 0.7 0.7 - 17.0 17.12001 37.4 1.3 - 9.4 29.3 - 0.0 0.6 - 18.3 - 17.72002 - 9.4 73.5 28.0 92.1 - 0.4 0.9 - 0.2 - 0.62003 - 3.8 - 25.7 - 31.4 - 60.9 - 0.4 0.7 16.7 16.42004 - 4.8 37.1 38.3 70.6 - 0.0 - - 1.4 - 1.42005 6.6 - 26.8 - 29.4 - 49.6 0.1 - - 24.4 - 24.32006 0.9 34.6 0.9 36.3 - 0.3 - 2.7 2.4
Source: UNCTAD, FDI/TNC database (www.unctad.org/statistics). Notes: IMF for 1980-1985 and the Central Bank of Swaziland, unpublished, thereafter.

World Investment Directory Volume X Africa 2008
618
Table 4. FDI stocks, by type of investment, 1980-2006 (Millions of dollars)
Inward investment Outward investment
Equity & Equity & Reinvested Reinvested Reinvested Reinvested
Year earnings earnings Other Total earnings earnings Other Total
1980 .. .. .. 243.4 .. .. .. 19.01981 .. .. .. 280.5 .. .. .. 24.41982 .. .. .. 228.7 .. .. .. 18.31983 .. .. .. 199.0 .. .. .. 15.31984 .. .. .. 126.5 .. .. .. 11.81985 .. .. .. 104.2 .. .. .. 8.81986 47.9 - 37.2 157.6 6.3 - 7.8 13.91987 59.7 - 48.8 241.3 6.9 - 13.4 20.41988 61.5 - 71.8 249.3 7.9 - 14.5 22.41989 77.7 - 70.4 308.1 10.3 - 25.1 35.31990 268.8 - 66.6 335.7 10.2 - 28.1 38.31991 293.8 - 105.5 399.1 9.8 - 41.8 51.61992 304.6 - 133.1 437.3 8.1 - 41.1 49.21993 341.4 - 121.1 462.2 6.4 - 46.3 52.61994 395.4 - 111.4 506.1 6.9 - 101.8 108.61995 414.4 - 121.1 535.4 10.2 - 125.4 135.51996 340.4 - 96.8 437.6 11.9 - 83.5 95.51997 307.8 - 98.6 406.6 5.2 - 77.2 82.41998 333.3 - 148.3 480.8 5.0 - 85.0 89.91999 44.0 - 54.3 557.9 1.4 - 13.8 88.42000 14.8 - 105.4 536.9 0.7 - 17.0 87.32001 196.1 - 305.1 355.8 1.9 - 57.4 42.12002 125.3 - 376.1 611.7 1.2 - 46.7 58.42003 186.8 - 451.0 726.6 1.3 - 81.8 94.72004 233.3 - 584.1 790.8 1.5 - 94.4 110.02005 249.4 - 531.4 785.0 1.6 - 71.4 73.52006 225.6 - 544.0 747.6 1.2 - 69.8 69.0
Source: UNCTAD, FDI/TNC database (www.unctad.org/statistics). Notes: 1980 is estimated by subtracting flows from the stock of 1981. 1981-1985 are based on the IMF. 1986-2006 data are based on the Central Bank of Swaziland, unpublished.

Swaziland
619
Table 6. FDI flows in the host economy, by geographical origin, 1995-2006
(Millions of dollars) Reporting countries 1995 1996 1997 1998 1999 2000 2001 2002 2003 2004 2005 2006
Belgium/Luxembourg - - - - 1.1 - 12.0 - .. .. - - -
Cyprus - - - - - - - .. .. - 0.0 -
Denmark - - - - - - - .. .. - - 2.5 -
Germany - 0.7 - - - - - - .. .. - - -
Korea, Republic of - - 0.2 - 0.0 - - - .. .. - - -
United States - - - - 28.0 24.0 21.0 - 10.0 .. .. 11.0 13.0 - 14.0
Source: UNCTAD, FDI / TNC database.
Note: Data is based on the information reported by the economies listed above.
Table 9. FDI flows abroad, by geographical destination, 1995-2006
(Millions of dollars) Reporting countries 1995 1996 1997 1998 1999 2000 2001 2002 2003 2004 2005 2006
Australia .. .. .. .. - - - 0.1 - - - -
Mozambique .. .. .. .. - - - - - - 1.3 2.1
Portugal .. .. .. .. - - - - 0.1 - - -
United Rep. of Tanzania .. .. .. .. 8.1 1.2 2.8 - - - - -
United States .. .. .. .. - - - - - - 3.0 1.0 2.0
Source: UNCTAD, FDI / TNC database.
Note: Data is based on the information reported by the economies listed above.
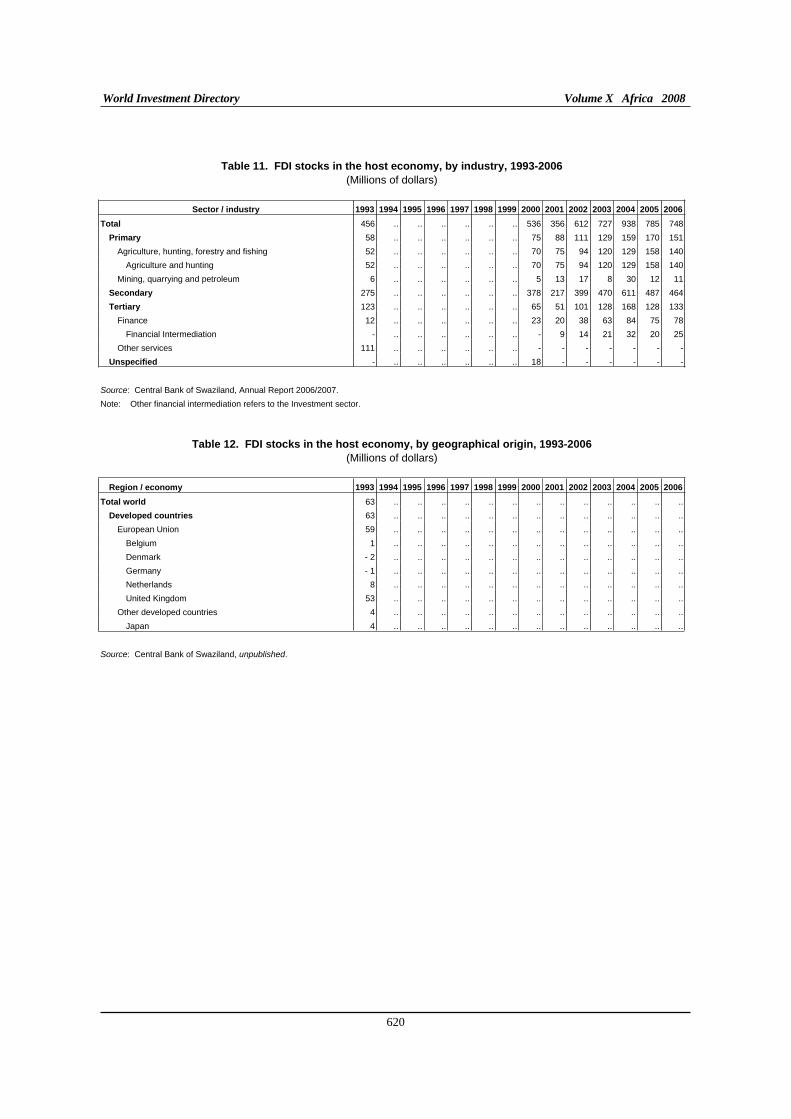
World Investment Directory Volume X Africa 2008
620
Table 11. FDI stocks in the host economy, by industry, 1993-2006
(Millions of dollars)
Sector / industry 1993 1994 1995 1996 1997 1998 1999 2000 2001 2002 2003 2004 2005 2006
Total 456 .. .. .. .. .. .. 536 356 612 727 938 785 748
Primary 58 .. .. .. .. .. .. 75 88 111 129 159 170 151
Agriculture, hunting, forestry and fishing 52 .. .. .. .. .. .. 70 75 94 120 129 158 140
Agriculture and hunting 52 .. .. .. .. .. .. 70 75 94 120 129 158 140
Mining, quarrying and petroleum 6 .. .. .. .. .. .. 5 13 17 8 30 12 11
Secondary 275 .. .. .. .. .. .. 378 217 399 470 611 487 464
Tertiary 123 .. .. .. .. .. .. 65 51 101 128 168 128 133
Finance 12 .. .. .. .. .. .. 23 20 38 63 84 75 78
Financial Intermediation - .. .. .. .. .. .. - 9 14 21 32 20 25
Other services 111 .. .. .. .. .. .. - - - - - - -
Unspecified - .. .. .. .. .. .. 18 - - - - - -
Source: Central Bank of Swaziland, Annual Report 2006/2007.
Note: Other financial intermediation refers to the Investment sector.
Table 12. FDI stocks in the host economy, by geographical origin, 1993-2006
(Millions of dollars)
Region / economy 1993 1994 1995 1996 1997 1998 1999 2000 2001 2002 2003 2004 2005 2006
Total world 63 .. .. .. .. .. .. .. .. .. .. .. .. ..
Developed countries 63 .. .. .. .. .. .. .. .. .. .. .. .. ..
European Union 59 .. .. .. .. .. .. .. .. .. .. .. .. ..
Belgium 1 .. .. .. .. .. .. .. .. .. .. .. .. ..
Denmark - 2 .. .. .. .. .. .. .. .. .. .. .. .. ..
Germany - 1 .. .. .. .. .. .. .. .. .. .. .. .. ..
Netherlands 8 .. .. .. .. .. .. .. .. .. .. .. .. ..
United Kingdom 53 .. .. .. .. .. .. .. .. .. .. .. .. ..
Other developed countries 4 .. .. .. .. .. .. .. .. .. .. .. .. ..
Japan 4 .. .. .. .. .. .. .. .. .. .. .. .. ..
Source: Central Bank of Swaziland, unpublished.

Swaziland
621
Table 14. FDI stocks abroad, by industry, 1993-2006
(Millions of dollars)
Sector / industry 1993 1994 1995 1996 1997 1998 1999 2000 2001 2002 2003 2004 2005 2006
Total 94 .. .. .. .. .. .. .. .. .. .. .. .. ..
Primary 3 .. .. .. .. .. .. .. .. .. .. .. .. ..
Agriculture, hunting, forestry and fishing 1 .. .. .. .. .. .. .. .. .. .. .. .. ..
Mining, quarrying and petroleum 2 .. .. .. .. .. .. .. .. .. .. .. .. ..
Secondary 76 .. .. .. .. .. .. .. .. .. .. .. .. ..
Tertiary 16 .. .. .. .. .. .. .. .. .. .. .. .. ..
Other services 16 .. .. .. .. .. .. .. .. .. .. .. .. ..
Source: Central Bank of Swaziland, unpublished.
Table 15. FDI stocks abroad, by geographical destination, 1993-2006
(Millions of dollars)
Reporting countries 1993 1994 1995 1996 1997 1998 1999 2000 2001 2002 2003 2004 2005 2006
Portugal .. .. .. .. .. - - - - - 0.1 - - -
South Africa .. .. .. .. .. - - 22.7 43.8 17.5 23.5 59.5 18.8 17.5
United Rep. of Tanzania .. .. .. .. .. 0.2 - - - - - - - -
United States .. .. .. .. .. - - - - - - - 3.0 - 2.0 -
Source: UNCTAD, FDI / TNC database.
Note: Data is based on the information reported by the economies listed above.
Table 23. The number of affiliates of foreign TNCs in the host economy, by geographical origin, 1993-2006
Economy 1993 1994 1995 1996 1997 1998 1999 2000 2001 2002 2003 2004 2005 2006
Republic of Korea .. .. .. 3 3 3 3 3 3 3 3 3 3 ..
United States .. 2 2 2 2 2 2 2 2 2 2 2 .. ..
Source: UNCTAD, FDI/TNC database.
Note: Data are based on information reported by the economies listed above.
Tables 35, 40 and 50. Employment, wages and salaries and value added of affiliates of United States TNCs in Swaziland, 1993-2006
(Thousands of employees and millions of dollars)
Table no./Variable 1993 1994 1995 1996 1997 1998 1999 2000 2001 2002 2003 2004 2005 2006
35. Employees 0.1 0.1 0.1 0.1 0.1 0.1 .. .. .. .. .. .. .. ..
40. Wages and salaries 1.0 2.0 2.0 2.0 2.0 3.0 .. .. .. .. .. .. .. ..
50. Value added a .. 81.0 82.0 40.0 52.0 88.0 .. .. .. .. .. .. .. ..
Source: UNCTAD, FDI/TNC database.
Note: Data are based on information reported by the United States. a Data refer to majority-owned affiliates only.

World Investment Directory Volume X Africa 2008
622
Table 88. Largest affiliates of foreign TNCs in the host economy, 2007
(Millions of dollars and number)
Company Home Economy Industry Sales Employees
A. Industrial
Ubombo Sugar Ltd South Africa Food, beverages and tobacco 906.2 2 500
Steel & Wire International South Africa Machinery and equipment .. 15
B. Tertiary
Swazispa Holdings Ltd South Africa Hotels and Restaurants 818.2 441
Usutu Pulp Co Ltd South Africa Wood and wood products .. 2 500
United Plantations Swaziland Pty Ltd South Africa Agriculture and hunting .. 250
Castrol Swaziland (Pty) Ltd United Kingdom Public administration .. ..
Handigas (Swaziland) (Pty) Ltd Germany Public administration .. ..
Home & Hospital Dispensaries (Pty) Ltd Germany Public administration .. ..
C. Finance and insurance Assets Employees
.. .. .. .. .. Source: Who Owns Whom database (https://solutions.dnb.com/wow), retrieved January 2008.

Swaziland
623
C. Legal frameworks for transnational corporations
In Swaziland, a number of national, bilateral and multilateral legal instruments exist to regulate the activities of transnational corporations and foreign direct investors. The key instruments in the country include the following:
I. National framework
Companies Act of 1912. Source: Globe Africa: Swaziland Investment Policy (http://www.globeafrica.com/Swazi/swazi2.htm).
Registration of United Kingdom Trade Marks Rules No. 72 of 1936. Source: WIPO (http://www.wipo.org).
Patents, Designs and Trade Marks Act No. 72 of 1936, as amended by L. 5/1969 (no longer applicable to Trademarks). Source: WIPO (http://www.wipo.org).
Merchandise Marks Regulations No. 24 of 1937. Source: WIPO (http://www.wipo.org).
Merchandise Marks Act No. 24 of 1937. Source: WIPO (http://www.wipo.org).
Industrial Conciliation and Settlement (Amendment) Act 1967. No. 6.Source:Government Gazette, 1967-08-25, Supplement
Trade Marks Act of 1981. Source: WIPO (http://www.wipo.org).
Employment (Amendment) Act 1985. No. 4.Source: Government Gazette, 1985-02-01, N. 336, p. S17-S18
Trade Marks Regulations (Legal Notice No. 47) of 1989. Source: WIPO (http://www.wipo.org).
Trade Marks Act (Date of Commencement) Notice No. 101 of 1994. Source: WIPO (http://www.wipo.org).
The Employment (Amendment) Act, 1997 (No. 5 of 1997).Source: Government Gazette Extraordinary, 1997-09-05, Vol. XXXV, No. 291, pp. S1-S4.
Swaziland Investment Promotion Act, 1998 (No. 1 of 1998).Source: Swaziland Government Gazette, 1998-02-13, Vol. 36, No. 330, pp. S1-S12
Income Tax Act of 2000. Source: SADC Review: http://www.sadcreview.com).
Industrial Relations Act 2000. Source: SADC Review: http://www.sadcreview.com).
Competition Act, 2002. Source: http://www.tralac.org/pdf/Swaziland's_competition_bill_august_2003.doc

World Investment Directory Volume X Africa 2008
624
The Industrial Relations (Amendment) Act, 2005 (Act No. 3 of 2005).Source: Government Gazette Extraordinary, 2005-09-01, Vol. XLIII, No. 86
II. International Framework
A. Swaziland is a party to the following multilateral and regional instruments:
Convention on the Settlement of Investment Disputes between States and Nationals of other States of 1965. Entered into force on 14 October 1966.
Convention Establishing the Multilateral Investment Guarantee Agency of 1985, entered into force on 12 April 1988.
Fourth ACP - EEC Convention (Lome IV) of 1989, entered into force on 1st March 1990.
Southern Africa Development Community (SADC), signed on 17 August, 1992.Source: http://www.sadc.int/about_sadc/history.php.
Treaty Establishing the Market for Eastern and Southern Africa (COMESA), 1993.
Paris Convention for the Protection of Industrial Property of 1883 (Revised at Brussels in 1900, Washington in 1911, The Hague in 1925, London in 1934, Lisbon in 1958 and Stockholm in 1967, and as amended in 1979). Signed in 1994.
Marrakesh Agreement Establishing the World Trade Organisation of 15 April 1994. Entered into force on 1 January 1995. Agreement on Trade-Related Investment Measures. General Agreement on Trade in Services. Agreement on Trade Related Aspects of Intellectual Property Rights.
Partnership Agreement between the Members of The African, Caribbean and Pacific Group of States, of the one part and the European Community and its member states, of the other part signed in Cotonou, Benin on 23 June 2000.
B. Bilateral treaties
1. Bilateral investment treaties for the protection and promotion of investments: United Kingdom 1968, South Africa 1972, Sweden 1972, Germany 1990, United Kingdom 1995, Mauritius 1994, Taiwan, Province of China 1998, Egypt 2000, Mauritius 2000.
2. Bilateral treaties for the avoidance of double taxation: United Kingdom 1968, South Africa 1972, Sweden 1972, Mauritius 1994.
C. Other treaties:
Investment agreement for the COMESA Common Investment Area (2007).

Swaziland
625
D. Sources of information
Official
Central Bank of Swaziland (www.centralbank.sz).
Swaziland Industrial Development Company (www.sidc.co.sz).
Secondary
BusinessMap (2000). "The other challenge" of FDI, in SADC Investor Survey – Complex Terrain
(Johannesburg: Business Map), pp 123 - 134.
Crush, J. (1987). The Struggle for Swazi Labour 1890-1920 (Kingston: McGill-Queen’s University Press).
Economist Intelligence Unit (EIU) (various years). Country Profile: Swaziland (London: EIU Ltd.).
_____________(various years). Country Report: Swaziland (London: EIU Ltd.).
Ernst & Young (2002). "Doing Business in Swaziland" (Mbabane: Ernst & Young).
Hussey, R & H (2001). Jumbo Tourist Guide-Swaziland (London: Africa Book Centre).
International Monetary Fund (IMF) (2006). IMF's Sub-Saharan Africa Regional Economic Outlook, March 10, 2006. (Washington D.C.: IMF).
Ruffer, Tim, S. Jones and S. Akroyd (2002). "Development Box Proposals and Their Potential Effect on Developing Countries." Mimeo, (London: U.K. Department for International Development).
Soderbom, M. and F. Teal (2004). "Size and Efficiency in Africa Manufacturing firms: Evidence from Firm-Level Panel Data." Journal of Development Economics, 73. pp 369 - 394.
Standard Bank Group (1999). "FDI in SADC financial services: follow the leaders", mimeo. (http://www.treasury.gov.za/documents/fiscu/summits/1999/finance.pdf).
Turco, M. (1994). Visitors’ Guide to Swaziland (Johannesburg: Southern Book Publishers).
United Nations Conference on Trade and Development (UNCTAD) (2003). FDI in Landlocked Developing
Countries at a Glance 2002 (Geneva: UNCTAD/ITE/IIA/2003/5).
_____________(2005a). Investor-Disputes Arising from Investment Treaties: A Review. UNCTAD Series of International Investment Policies for Development (UNCTAD/ITE/IIT/2005/4).
_____________(2005b). A Survey of Support by Investment Promotion Agencies to Linkages. Advisory Studies No. 18 (UNCTAD/ITE/IPC/2005/12).
United States Trade Representative (2006). 2006 Comprehensive Report on U.S. Trade and Investment
Policy Toward Sub-Saharan Africa and Implementation of the Africa Growth and Opportunity Act: The Sixth of Eight Annual Reports, May 2006. (Washington D.C.: US Government).
Whiteside, A. W. (ed.) (1989). Industrialization and Investment Incentives in Southern Africa (London: Pietermaritzburg, University of Natal Press), pp. 16-244.
World Bank (2002). Global Economic Prospects and the Developing Countries 2003: Investing to Unlock
Opportunities (Washington D.C.: World Bank).

World Investment Directory Volume X Africa 2008
626
World Economic Forum (2000/2001). Africa competitiveness report (New York: Oxford University Press).
World Bank/International Finance Corporation (2007). Doing Business 2008 Swaziland (Washington D.C.: The World Bank Group).
Togo
627
Togo
A. Definitions and sources of data
The data on foreign direct investment (FDI) in Togo were collected by the Banque Centrale des Etats de l'Afrique de l'Ouest (BCEAO). The Bank receives data on outflows by addressing questionnaires to national companies investing abroad. The information is supplemented by the Direction de l'Economie of the Ministere de l'Economie et des Finances which receives FDI related data from national enterprises abroad through the authorization procedure. In Togo, FDI is defined in line with the 4th and 5th editions of the balance-of-payments (BOP) manual published by the International Monetary Fund (IMF). The IMF also reports FDI data in Togo in its BOP statistics.
Togo’s economy is organized around three main activities: agriculture, phosphate mining, and trade and transport. Togo has been an important trans-shipment centre because of the deep-water port at Lomé and its good road links to neighbouring countries of the Economic Community for West African States (ECOWAS). There is also a small but dynamic export-processing zone in Togo. The Government of Togo started privatizing publicly-owned enterprises, with FDI options, in 1983. In 2001, a consortium led by the United States-based Sterling Merchant Finance, was appointed to privatize Togo Télécom. As in most African countries, the expansion of mobile telecommunications has been more rapid than that of fixed line telecoms. Some companies such as Togocel, a subsidiary of Togo Télécom, Telecel Holding International and Orascom (Egypt) which acquired Telecel in 2000, operate mobile telecommunication services in Togo. Domestic power production and distribution are the responsibility of Togo Electricité, formerly known as Compagnie d’énergie électrique du Togo. In September 2000, a joint venture between Elyo, a subsidiary of the French firm, Suez-Lyonnaise des eaux, and a Canadian firm, Hydro-Québec International, was awarded a 20-year concession to manage Togo Electricité.
The Government of Togo signed to the Convention on the Settlement of Investment Disputes between State and Nationals of other States on 24 January 1966 and had traditionally participated in integration schemes, at the sub-regional and regional levels. As of the end of the 2003, the country belonged to several of the existing bodies, such as the ECOWAS, African Union and New Partnership for Africa's Development. Togo is party to the Cotonou Agreement for renegotiating the trade link between the African, Caribbean and Pacific countries with the European Union (EU), and Everything But Arms initiative, also by the EU. It is a member of the World Trade Organization.

World Investment Directory Volume X Africa 2008
628
B. Statistics on FDI and the operations of TNCs
Table 1. Summary of FDI (Millions of dollars)
Variable Inward Outward
1. FDI flows, 2003-2006 (annual average) 56.7 - 13.5
2. FDI flows as a percentage of GFCF, 2003-2006 (annual average) 13.2 - 3.1
3. FDI stocks, 2006 771 17
4. FDI stocks as a percentage of GDP, 2006 34.9 0.8
Source: Based on tables 3a and 4a and UNCTAD, FDI/TNC database.
Table 3a. FDI flows, by type of investment, 1980-2006 (Millions of dollars)
Inward investment Outward investment
Reinvested Reinvested Year Equity earnings Other Total Equity earnings Other Total
1980 1.3 - 14.7 56.1 42.7 - - - -1981 5.5 - 19.7 24.4 10.2 - - - -1982 1.4 - 6.0 20.7 16.1 - - - -1983 0.9 - 8.1 8.6 1.4 - - - -1984 0.9 - 1.0 - 9.9 - 9.9 - - - -1985 1.9 3.7 10.6 16.3 - - - -1986 3.1 3.8 - 0.8 6.1 - - - -1987 3.3 0.7 3.1 7.2 - - - -1988 9.4 - 1.4 4.9 13.0 - - - -1989 5.1 0.7 3.3 9.2 - - - -1990 10.2 4.8 3.3 22.7 .. .. .. 4.61991 5.5 0.0 1.0 5.7 .. .. .. 5.11992 .. .. .. - 13.1 .. .. .. 12.61993 11.6 - 12.3 - 11.2 - 7.0 .. .. .. 4.91994 4.7 0.0 10.7 15.5 .. .. .. 0.11995 23.0 0.0 3.2 32.1 .. .. - 5.8 5.61996 20.0 1.0 - 3.7 14.5 0.1 4.5 - 1.8 12.91997 8.9 10.3 1.8 18.5 1.8 4.0 - 3.4 4.41998 15.4 13.9 0.9 19.5 1.5 11.9 - 2.8 22.41999 20.8 - 3.7 14.6 31.7 - 3.6 0.6 5.9 2.92000 19.2 8.4 14.4 41.5 - 2.9 2.1 1.2 0.42001 25.8 17.6 20.2 63.6 - 0.0 - 0.0 - 7.3 - 7.32002 22.7 9.6 21.0 53.4 3.1 - 0.0 - 0.8 2.42003 31.1 3.3 - 0.7 33.7 0.2 0.2 - 6.7 - 6.32004 21.7 16.1 21.6 59.4 1.1 - 0.0 - 13.6 - 12.62005 26.4 25.9 24.7 77.0 0.5 0.8 - 16.1 - 14.92006 .. .. .. 56.7 .. .. .. - 20.3
Source: UNCTAD, FDI/TNC database (www.unctad.org/statistics). Notes: Data on inflows are from the IMF for 1980-1989, the Banque Centrale de l'Afrique de l'Ouest (BCEAO) for 1990-2005 and estimate for 2006. Outflow data are from the BCEAO for 1990-2005 and estimate for 2006.
Table 3b. FDI flows, by type of investment, 1999-2005 (Millions of Franc de la Communauté financière africaine)
Inward investment Outward investment
Reinvested Reinvested Year Equity earnings Other Total Equity earnings Other Total
1999 12 795 - 2 306 9 018 19 507 - 2 217 340 3 654 1 7772000 13 639 5 967 10 241 29 527 - 2 030 1 476 874 3202001 18 928 12 880 14 802 46 610 - 0.01 - 0.01 - 5 316 - 5 3162002 15 831 6 704 14 659 37 194 2 174 - 0.01 - 525 1 6492003 18 095 1 932 - 421 19 606 94 95 - 3 871 - 3 6822004 11 444 8 516 11 398 31 358 556 - 0.01 - 7 200 - 6 6442005 13 935 13 664 13 012 40 611 245 406 - 8 495 - 7 844
Source: UNCTAD, FDI/TNC database based on the Banque Centrale de l'Afrique de l'Ouest (BCEAO), unpublished.

Togo
629
Table 4a. FDI stocks, by type of investment, 1980-2006 (Millions of dollars)
Inward investment Outward investment
Equity & Equity & Reinvested Reinvested Reinvested Reinvested
Year earnings earnings Other Total earnings earnings Other Total
1980 .. .. .. 175.8 - - - -1981 .. .. .. 186.0 - - - -1982 .. .. .. 202.1 - - - -1983 .. .. .. 203.5 - - - -1984 .. .. .. 193.6 - - - -1985 .. .. .. 209.9 - - - -1986 .. .. .. 216.0 - - - -1987 .. .. .. 223.1 - - - -1988 .. .. .. 236.1 - - - -1989 .. .. .. 245.3 - - - -1990 .. .. .. 268.0 .. .. .. 4.61991 .. .. .. 273.6 .. .. .. 9.71992 .. .. .. 260.5 .. .. .. 22.31993 .. .. .. 253.6 .. .. .. 27.21994 .. .. .. 269.1 .. .. .. 27.31995 .. .. .. 301.2 .. .. .. 32.91996 .. .. .. 315.6 .. .. .. 45.81997 .. .. .. 334.1 .. .. .. 50.21998 .. .. .. 353.6 .. .. .. 72.61999 45.2 .. 2.3 385.3 5.3 .. - 15.4 75.52000 62.3 .. 24.5 426.8 3.8 .. - 13.7 75.92001 99.0 .. 42.1 490.4 2.5 .. - 15.1 68.72002 150.3 .. 73.3 543.7 6.7 .. - 18.8 71.12003 .. .. .. 577.5 .. .. .. 64.72004 157.0 .. 29.7 636.8 14.0 .. - 19.8 52.22005 188.8 .. 49.1 713.8 13.8 .. - 36.4 37.32006 .. .. .. 770.5 .. .. .. 17.0 Source: UNCTAD, FDI/TNC database (www.unctad.org/statistics). Notes: Data on inward stock are estimated by accumulating inflows since 1970. Outward stock data are estimated by accumulating inflows since 1990.
Table 4b. FDI stocks, by type of investment, 1999-2005 (Millions of Franc de la Communauté financière africaine)
Inward investment Outward investment
Equity & Equity & Reinvested Reinvested Reinvested Reinvested
Year earnings earnings Other Total earnings earnings Other Total
1999 29 509 .. 1 493 31 002 3 493 .. - 10 057 - 6 5642000 43 942 .. 17 282 61 224 2 657 .. - 9 643 - 6 9862001 73 653 .. 31 365 105 018 1 843 .. - 11 264 - 9 4212002 93 988 .. 45 868 139 856 4 202 .. - 11 789 - 7 5872003 .. .. .. 68 759 .. .. .. 1 4432004 75 595 .. 14 310 89 905 6 741 .. - 9 558 - 2 8172005 104 953 .. 27 322 132 275 7 671 .. - 20 265 - 12 594 Source: UNCTAD, FDI/TNC database based on the Banque Centrale de l'Afrique de l'Ouest (BCEAO), unpublished.

World Investment Directory Volume X Africa 2008
630
Table 6. FDI flows in the host economy, by geographical origin, 1995-2006 (Millions of dollars)
Economy 1995 1996 1997 1998 1999 2000 2001 2002 2003 2004 2005 2006
Belgium/Luxembourg - 2.6 - - - 0.9 - - - - - -China - - - - - - - - 0.0 1.9 0.3 -Denmark - - - - - - - - - - - 0.3 -France 2.6 1.3 4.5 6.7 5.3 2.8 - 3.6 10.4 15.8 16.1 105.7 126.7Germany - 0.7 - 1.2 - - - 0.9 - 0.9 - - - -United States - 2.0 1.0 1.0 1.0 1.0 1.0 1.0 - - 10.0 3.0 - 12.0 Source: UNCTAD, FDI / TNC database. Note: Data are based on information reported by the economies listed above.
Table 9. FDI flows abroad, by geographical destination, 1995-2006 (Millions of dollars)
Economy 1995 1996 1997 1998 1999 2000 2001 2002 2003 2004 2005 2006
China 0.7 - - - - - - - - - - -France - 1.3 1.1 - - - 3.7 3.6 - 3.4 - 1.2 - 2.5 Source: UNCTAD, FDI / TNC database. Note: Data are based on information reported by the economies listed above.
Table 12. FDI stocks in the host economy, by geographical origin, 1995-2006 (Millions of dollars)
Economy 1995 1996 1997 1998 1999 2000 2001 2002 2003 2004 2005 2006
China - - - - - - - - 4.7 6.2 4.8 -Denmark - - - - - - - - - 0.7 0.8 1.2United States 8.0 8.0 9.0 10.0 6.0 7.0 7.0 8.0 3.0 13.0 15.0 3.0 Source: UNCTAD, FDI / TNC database. Note: Data are based on information reported by the economies listed above.
Tables 23, 30, 35, 40, 45 and 50. Number, assets, employment, wages and salaries, sales and value added of affiliates of United States TNCs in Togo, 1995-2006
(Number, thousands of employees and millions of dollars) Table no./Variable 1995 1996 1997 1998 1999 2000 2001 2002 2003 2004 2005 2006
23. Number 3 3 3 3 2 2 2 2 2 3 .. ..30. Assets 21 23 23 24 .. .. .. .. .. 60 .. ..35. Employees 0.1 0.1 0.1 0.1 .. .. .. .. .. 0.2 .. ..40. Wages and salaries .. .. .. .. .. .. .. .. .. 2 .. ..45. Sales 23 25 27 23 .. .. .. .. .. 75 .. ..50. Value added a 8 9 9 8 .. .. .. .. .. 21 .. ..Source: UNCTAD, FDI/TNC database. Note: Data are based on information reported by the United States. a Majority-owned affiliates only.

Togo
631
Table 87. Largest foreign affiliates of home-based TNCs, 2007
(Millions of dollars and number) Company Host economy Industry Sales Employees
A. Industrial
Société Camerounaise De Transformation De L' Aluminium SA Cameroon Metal and metal products .. 152
B. Tertiary
.. .. .. .. ..
C. Finance and Insurance Assets Employees
Ecobank Ghana Ltd Ghana Insurance .. 235
Ecobank Côte d'Ivoire Sa Côte d'Ivoire Finance .. 80
Source: Who Owns Whom database (https://solutions.dnb.com/wow), retrieved January 2008.
Table 88. Largest affiliates of foreign TNCs in the host economy, 2007
(Millions of dollars and number)
Company Home economy Industry Sales Employees
A. Industrial
Togolaise Des Gaz Industriels France Petroleum 1 18a
B. Tertiary
Compagnie Francaise De L'Afrique De L'Ouest France Wholesale trade 116.55 99
Togo Et Shell SA United Kingdom Wholesale trade 25.2 96
Togo Representation India Wholesale trade 25
Embassy Of The United States Of America United States Public administration .. 20
Saga Togo France Supporting transport activities .. 20
Bt Togo United Kingdom Telecommunications .. ..
Lome Catering France Air transport .. ..
Maersk Togo SA Denmark Supporting transport activities .. ..
Nouvelles Frontieres Togo Germany Public administration .. ..
Uac - Togo SA Netherlands Wholesale trade .. ..
C. Finance and Insurance Assets Employees
Agf Togo Assurances Germany Insurance .. ..
Source: Who Owns Whom database (https://solutions.dnb.com/wow), retrieved January 2008. a 2006.
World Investment Directory Volume X Africa 2008
632
C. Legal frameworks for transnational corporations
Togo has adopted national, bilateral and national legal instruments for regulating the activities of the transnational corporations and foreign direct investors. The key instruments applicable in the country include:
I. National framework
Patents: Bangui Agreement, March 1977 (Annex I), as last amended in February 1999. Source: WIPO (http://www.wipo.org).
General Code of Direct and Indirect Taxes (CGI) - Law No. 83-22 of 30 December 1983 together with Finance Law for 1988. Source: FIDAFRICA-Fiscalite Africaine, 1988.
Law No. 89-14 of 18 September 1989 and Decree No. 90-40 Adopted in application of Law No. 89-14 of 18 September 1989 Governing the Status of Export Processing Zones. Source: Official publication by: Ministry of Industry and State Companies -Republique Togolaise- SAZOF Societe d'Administration des Zones Franches -LOME- TOGO.
Investment Code of 31 October 1989, repeals Investment Code- Law No. 85/02 and 85/03 of 29 January 1985 and Decree 87-02 of 17 February 1987 on the Implementation of the Investment Code. Source: Official publication by: Ministry of Industry and State Companies -Republique Togolaise- SAZOF Societe d'Administration des Zones Franches -LOME- TOGO.
Loi No. 91-12 portant protection du droit d’auteur, du folklore et des droits voisins, juin 1991. Law No. 91-12 on the Protection of Copyright, Folklore and Neighbouring Rights, June 1991. Source: WIPO (http://www.wipo.org).
II. International Framework
A. Togo is a party to the following multilateral and regional instruments:
Convention on the Settlement of Investment Disputes between States and Nationals of other States of 1965. Entered into force on 14 October 1966.
Industrial Designs: Bangui Agreement, March 1977 (Annexes II and IV), as last amended in February 1999. Source: WIPO (http://www.wipo.org).
Trade Marks: Bangui Agreement, March 1977 (Annex III), as last amended in February 1999. Source: WIPO (http://www.wipo.org).
Bangui Agreement, March 1977. Source: WIPO (http://www.wipo.org).
Convention Establishing the Multilateral Investment Guarantee Agency of 1985, entered into force on 12 April 1988.
Fourth ACP - EEC Convention (Lome IV) of 1989, entered into force on 1st March 1990.
Revised Treaty of the Economic Community of West African States (ECOWAS) 1993.

Togo
633
Marrakesh Agreement Establishing the World Trade Organisation of 15 April 1994. Entered into force on 1 January 1995. Agreement on Trade-Related Investment Measures. General Agreement on Trade in Services. Agreement on Trade Related Aspects of Intellectual Property Rights.
Paris Convention for the Protection of Industrial Property of 1883 (Revised at Brussels in 1900, Washington in 1911, The Hague in 1925, London in 1934, Lisbon in 1958 and Stockholm in 1967, and as amended in 1979). Signed in 1994.
Partnership Agreement between the Members of The African, Caribbean and Pacific Group of States, of the one part and the European Community and its member states, of the other part signed in Cotonou, Benin on 23 June 2000.
B. Bilateral treaties
1. Bilateral investment treaties for the protection and promotion of investments: Germany 1961, Switzerland 1964, Tunisia 1987.
2. Bilateral treaties for the avoidance of double taxation: France 1971, Tunisia 1987.

World Investment Directory Volume X Africa 2008
634
D. Sources of information
Official
Banque Centrale des Etats de l'Afrique de l'Ouest (www.bceao.int).
Ministere de l'Economie et des Finances (www.finances.gouv.sn).
Secondary
Buss Mathias (2003). "Democracy and FDI" , HWWA discussion paper 220 (Hamburg: HWWA).
Chan, S. (ed.), (1995). "Foreign direct investment in a changing global political economy", International
Political Economy Series (New York: St. Martin's Press).
Economist Intelligence Unit (EIU) (various years). Country Profile: Togo (London: EIU Ltd.).
____________ (various years). Country Report: Togo (London: EIU Ltd.).
International Monetary Fund (IMF) (2006). IMF's Sub-Saharan Africa Regional Economic Outlook,March 10, 2006. (Washington D.C.: IMF).
Gogue Tchboure Aime and Evlo Kodjo (2002). "Explaining African economic growth performance" : Togo case study, Mimeo.
Harrison, A., (1994). "The role of multinationals in economic development: The benefits of FDI", Columbia Journal of World Business, 29(4), Winter, pp 6-11.
Kandiero Tonia and Chitiga Margaret (2003). "Trade openness and foreign direct investment in Africa", paper prepared for the economic society of Southern Africa 2003, Annual Conference, Cape Town, South Africa.
McMillan, Magaret, S. and Harrison, Ann, E. (2002). "Does direct foreign investment affect domestic firms credit constraints?" (www.csae.ox.ac.uk/conferences/2000-OiA/pdfpapers/mcmillan.PDF).
Saravanmuttoo, Neil (1999). Foreign direct investment and poverty reduction in developing countries
(Ottawa: Turncourse Solutions).
United Nations Conference on Trade and Development (UNCTAD) (2002). FDI in Least Developed
Countries at a Glance (Geneva: UNCTAD) (www.unctad.org/en/subsites/dite/LDCs/ pdfs/Countries/benin.pdf).
____________(2005a). Investor-Disputes Arising from Investment Treaties: A Review. UNCTAD Series of International Investment Policies for Development (UNCTAD/ITE/IIT/2005/4).
____________(2005b). A Survey of Support by Investment Promotion Agencies to Linkages. Advisory Studies No. 18 (UNCTAD/ITE/IPC/2005/12).
____________(2005c). FDI in least developed countries at a glance: 2005/2006
(UNCTAD/ITE/IIA/2005/17).
United Nations Development Programme (UNDP) (1995). Conjonture economique du Togo (Lome: UNDP).

Togo
635
____________(2001). Plan Cadre d'assistance des Nations Unies au Togo, 2002 – 2006 (Lome: UNDP).
United States Trade Representative (2006). 2006 Comprehensive Report on U.S. Trade and Investment
Policy Toward Sub-Saharan Africa and Implementation of the Africa Growth and Opportunity
Act: The Sixth of Eight Annual Reports, May 2006. (Washington D.C.: US Government).
World Bank (2002). Global Economic Prospects and the Developing Countries 2003: Investing to
Unlock Opportunities (Washington D.C.: World Bank).
World Bank/International Finance Corporation (2007). Doing Business 2008 Togo (Washington D.C.: The World Bank Group).


Tunisia
637
Tunisia
A. Definitions and sources of data
Foreign direct investment (FDI) in Tunisia is defined as foreign money brought into an investment project, undertaken in partnership with a Tunisian shareholder or financed fully by foreign investor, (Investment Encouragement Code, Law No. 93-120). The Central Bank of Tunisia collects data for compiling balance-of-payments statistics based on transactions of foreign currency transactions. Several other government agencies collect additional data on investments in certain sectors according to their field of responsibility. The Agricultural Investment Promotion Agency collects data on agricultural investment; the Export Promotion Center gathers data on investment in trade sector; the Tunisian National Tourism Office on investment in the tourism sector; and the Industry Promotion Agency on industry investment. These data are based on company surveys. The Foreign Investment Promotion Agency started its activity in 1995 to give more effectiveness to promoting FDI in Tunisia.
The Government of Tunisia has been keen to encourage foreign investors to set up manufacturing plants in the country to serve the European market by offering attractive incentives to export-oriented investments. Exporting companies can import all capital goods and production inputs custom duty-free. They are also fully exempt from income tax for the first ten years of activity followed by a 50% reduction in income tax. Foreign investors can hold up to 100% of the project capital without prior authorization, except for exporting service industries which are subject to authorization if the foreign participation exceeds 50% of the capital (Investment Encouragement Code, Law No. 93-120).
The Tunisian tax rate on profits is about the same as that of other Mediterranean countries. The projects in industry, tourism and industry-related services which are set up in regional development areas, receive an investment grant of 7% of the project cost, a state participation in the infrastructural expenses and a five-year full payment of the employers contribution to social security schemes. Export-oriented projects are also fully exempt from income tax for the first ten years of activity and benefit from a 50% reduction on income tax for an additional ten years. Bureaucratic formalities have also been streamlined into one office, the "guichet unique" in Tunisia.
From 1995, privatization was sped up and by 2005 the government had disposed of large businesses. About 160 public enterprises had been fully or partially privatized or been shut down and their assets sold off, with FDI options. Foreign investors benefit from the off-shore status of wholly exporting companies: this applies to factories which can be set up anywhere in Tunisia, or within a free zone. Two free trade zones are set up in Tunisia, one in Bizerta and the other in Zarzis. The incentives offered by these free trade zones strengthen the interest already shown by foreign investors in Tunisia.
Oil has played a large role in attracting FDI to Tunisia and exploration remains buoyant. The law on exploration activities was revised in early 2000 to give the government greater flexibility in fixing terms with operators, taking into account exploration costs, field size and changing world oil and gas prices. This cleared the way for an expansion of petroleum activities. About 43 exploration permits were in operation in 2002. The British Gas investment in the Miskar gasfield in the early 1990s is still Tunisia's largest single foreign investment.
Non-energy foreign investment did not rise much until 1998, despite many initiatives to encourage it. But, since 1998, the main focus of FDI has been on manufacturing. After the cement sector, the textiles industry has attracted the most foreign investment, followed by shoes and leather, vehicle parts, electronics, pharmaceuticals, food, and computer software. The tourism sector is also
World Investment Directory Volume X Africa 2008
638
growing in importance. The main investors are European companies from France, the United Kingdom, Germany and Italy, but there are others from the United States and Libyan Arab Jamahiriya.
Tunisia has good infrastructure, a reasonably well-trained and adaptable workforce, enjoys proximity to Europe and is working on its integration into the world economy. Tunisia signed to the Convention on the Settlement of Investment Disputes between State and Nationals of other States on 5 May 1965 and provides free access for industrial goods to European markets through its Association Agreement with the European Union (EU), and reduced customs duties for exports to the United States, Canada, Switzerland, Australia and Japan. It is the first country of the southern shore of the Mediterranean to have signed an association agreement with the EU. This agreement, signed on 17 July 1995 extends cooperation to culture, education, economy, scientific research and political and social dialogue. It provides for the gradual establishment, over a period of 12 years, of a free-trade zone for industrial products. Another agreement on agricultural trade with the EU came into force on 1 January 2001. The agreement raised Tunisia’s annual quota for duty-free exports to the EU and fixed other quotas for other agricultural items. In return, Tunisia agreed to remove import duties on European wheat and vegetable oil imports over five years.
Tunisia also signed free-trade agreements with Egypt, Morocco, Jordan and Libyan Arab Jamahiriya. In 2001, Tunisia signed a declaration with Egypt, Morocco and Jordan calling for a free-trade zone among the Arab states of the Mediterranean which is to become a precursor to the proposed Arab free-trade area. At the end of 2005, Tunisia belonged to the Arab Maghreb Union, African Union, New Partnership for Africa's Development and World Trade Organization. Tunisia also supports the “Eizenstat plan” to develop trade links between the United States and Tunisia, Morocco, Algeria and Egypt. Out of all pending initiatives, only the EU partnership has so far become a reality.

Tunisia
639
B. Statistics on FDI and the operations of TNCs
Table 1. Summary of FDI
(Millions of dollars)
Variable Inward Outward
1. FDI flows, 2003-2006 (annual average) 1 329.3 13.8 2. FDI flows as a percentage of GFCF, 2003-2006 (annual average) 20.9 0.2 3. FDI stocks, 2006 21 779 88 4. FDI stocks as a percentage of GDP, 2006 71.0 0.3 Source: Based on tables 3a and 4a and UNCTAD, FDI/TNC database.

World Investment Directory Volume X Africa 2008
640
Table 3a. FDI flows, by type of investment, 1980-2006 (Millions of dollars)
Inward investment Outward investment
Reinvested Reinvested Year Equity earnings Other Total Equity earnings Other Total
1980 244.0 .. 2.5 246.5 - .. .. ..1981 316.7 .. 10.5 327.2 2.0 .. .. 1.41982 356.5 .. 14.2 370.7 1.7 .. .. 3.91983 206.6 .. 2.6 209.2 - 1.5 .. .. 0.41984 139.8 .. 1.7 141.5 - 1.3 .. .. 0.51985 138.6 .. 0.3 138.9 - 6.0 .. .. 1.21986 85.8 .. 0.1 85.9 1.3 .. .. 2.41987 99.1 .. 3.7 102.8 1.2 .. .. 2.81988 74.2 .. 2.0 76.2 1.2 .. .. 0.51989 87.6 .. 4.2 91.8 4.2 .. .. 4.81990 83.9 .. 4.8 88.7 0.3 .. .. 0.31991 168.2 .. 4.6 172.8 3.8 .. .. 3.81992 404.1 .. 179.5 583.6 4.7 .. .. 4.71993 654.4 .. 1.8 656.2 1.8 .. .. 1.81994 530.9 .. 35.5 566.4 7.7 .. .. 7.71995 317.7 .. 59.8 377.5 3.4 .. .. 3.41996 282.3 .. 68.8 351.1 2.4 .. .. 2.41997 359.8 .. 5.5 365.3 9.2 .. .. 9.21998 665.8 .. 2.3 668.1 1.8 .. .. 1.81999 363.9 .. 4.0 367.9 2.5 .. .. 2.52000 778.0 .. 0.8 778.8 1.7 .. .. 0.42001 483.7 .. 2.7 486.4 0.3 .. .. 5.82002 818.2 .. 3.2 821.3 2.3 .. .. 6.52003 581.4 .. 2.5 583.9 5.4 .. .. 5.42004 637.7 .. 1.2 638.9 4.2 .. .. 4.22005 781.5 .. 0.9 782.4 12.6 .. .. 12.62006 3 310.5 .. 1.4 3 311.8 33.1 .. .. 33.1
Source: UNCTAD, FDI/TNC database (www.unctad.org/statistics) based on the Banque Centrale de Tunisie, unpublished.
Table 3b. FDI flows, by type of investment, 2004-2006
(Millions of Dinars)
Inward investment Outward investment
Reinvested Reinvested Year Equity earnings Other Total Equity earnings Other Total
2004 794.4 .. 1.5 795.9 5.2 .. .. 5.22005 1 014.5 .. 1.2 1 015.7 16.4 .. .. 16.42006 4 401.1 .. 1.8 4 402.9 44.0 .. .. 44.0
Source: UNCTAD, FDI/TNC database (www.unctad.org/statistics) based on the Banque Centrale de Tunisie, unpublished.

Tunisia
641
Table 4a. FDI stocks, by type of investment, 1980-2006
(Millions of dollars)
Inward investment Outward investment
Reinvested Reinvested
Year Equity earnings Other Total Equity earnings Other Total
1980 .. .. .. 3 340.6 .. .. .. 5.8
1981 .. .. .. 3 345.6 .. .. .. 6.6
1982 .. .. .. 3 603.7 .. .. .. 8.5
1983 .. .. .. 3 691.0 .. .. .. 7.5
1984 .. .. .. 3 589.4 .. .. .. 5.8
1985 .. .. .. 4 917.0 .. .. .. 6.1
1986 .. .. .. 4 909.2 .. .. .. 7.2
1987 .. .. .. 6 218.5 .. .. .. 10.3
1988 .. .. .. 5 947.0 .. .. .. 8.4
1989 .. .. .. 5 888.1 .. .. .. 12.6
1990 .. .. .. 7 614.8 .. .. .. 15.3
1991 .. .. .. 8 067.4 .. .. .. 19.6
1992 .. .. .. 8 447.9 .. .. .. 23.4
1993 .. .. .. 8 724.5 .. .. .. 22.5
1994 .. .. .. 9 918.0 .. .. .. 30.7
1995 .. .. .. 10 967.0 .. .. .. 30.1
1996 .. .. .. 11 180.6 .. .. .. 28.6
1997 .. .. .. 10 629.0 .. .. .. 32.4
1998 .. .. .. 12 237.1 .. .. .. 34.2
1999 .. .. .. 11 431.5 .. .. .. 33.3
2000 .. .. .. 11 545.0 .. .. .. 33.4
2001 .. .. .. 11 519.6 .. .. .. 31.9
2002 .. .. .. 13 860.7 .. .. .. 36.6
2003 .. .. .. 16 239.0 .. .. .. 42.8
2004 .. .. .. 17 780.0 .. .. .. 47.0
2005 .. .. .. 16 924.0 .. .. .. 53.0
2006 .. .. .. 21 779.0 .. .. .. 88.0
Source: UNCTAD, FDI/TNC database (www.unctad.org/statistics) based on the Banque Centrale de Tunisie, unpublished.
Table 4b. FDI stocks, by type of investment, 2001-2006
(Millions of Dinars)
Inward investment Outward investment
Reinvested Reinvested
Year Equity earnings Other Total Equity earnings Other Total
2001 .. .. .. 16 914.2 .. .. .. 46.9
2002 .. .. .. 18 491.5 .. .. .. 48.8
2003 .. .. .. 19 609.0 .. .. .. 51.7
2004 .. .. .. 21 140.4 .. .. .. 56.2
2005 .. .. .. 23 073.5 .. .. .. 71.7
2006 .. .. .. 28 249.7 .. .. .. 114.7
Source: UNCTAD, FDI/TNC database (www.unctad.org/statistics) based on the Banque Centrale de Tunisie, unpublished.

World Investment Directory Volume X Africa 2008
642
Table 5. FDI flows in the host economy, by industry, 1995-2006 (Millions of Dinars)
Sector / industry 1995 1996 1997 1998 1999 2000 2001 2002 2003 2004 2005 2006
Total .. .. .. .. 437 1 068 700 1 167 752 796 1 016 4 403Primary .. .. .. .. 198 327 336 438 320 284 393 954
Agriculture, hunting, forestry and fishing .. .. .. .. 3 4 9 11 4 10 7 14Mining, quarrying and petroleum .. .. .. .. 195 323 327 428 316 274 386 940
Secondary .. .. .. .. 198 688 251 255 283 312 327 347Food, beverages and tobacco .. .. .. .. 13 30 18 26 28 13 14 18
Food products and beverages .. .. .. .. 13 30 18 26 28 13 14 18Textiles, clothing and leather .. .. .. .. 101 107 97 74 70 76 74 119
Leather and leather products .. .. .. .. 14 13 17 10 10 7 13 48Chemicals and chemical products .. .. .. .. 7 120 7 13 11 18 11 36Non-metallic mineral products .. .. .. .. 13 376 25 44 69 89 63 47Electrical and electronic equipment .. .. .. .. 58 36 75 76 77 82 142 94Other manufacturing .. .. .. .. 6 20 29 24 28 34 23 35
Tertiary .. .. .. .. 41 53 113 474 149 200 296 3 101Hotels and restaurants .. .. .. .. 37 42 97 22 19 22 17 18Transport, storage and communications .. .. .. .. - - - 333 105 121 99 3 056
Post and communications .. .. .. .. - - - 333 105 121 99 3 056Telecommunications .. .. .. .. - - - 333 105 121 99 3 056
Finance .. .. .. .. - - - 103 10 38 120 22Other services .. .. .. .. - - - 16 16 19 60 5
Source: Foreign Investment Promotion Agency. Note: Mining, quarrying and petroleum refer to energy. Food products and beverages refer to agri-business. Manufacture of cement,lime and plaster refers to building materials. Chemicals and chemical products include rubber. Electrical and electronic equipment refer to mechanics and electric.Hotels and restaurants refer to tourism and real estate.

Tunisia
643
Table 6. FDI flows in the host economy, by geographical origin, 1995-2006 (Millions of Dinars)
Region / economy 1995 1996 1997 1998 1999 2000 2001 2002 2003 2004 2005 2006
Total world .. .. 403 760 437 1 068 700 1 167 752 796 1 016 4 403Developed countries .. .. 387 704 357 991 596 921 674 684 812 1 199
Europe .. .. 258 621 267 797 433 805 593 568 653 1 057European Union .. .. 253 611 256 785 399 788 586 566 623 1 036
Austria .. .. 3 0.2 0.3 0.1 2 0.2 55 43 48 99Belgium .. .. 9 9 16 10 11 11 11 6 14 19France .. .. 39 50 77 86 136 177 80 134 97 153Germany .. .. 27 28 34 21 47 62 16 20 15 20Hungary .. .. 1 19 5 - - - - - - -Italy .. .. 102 48 68 163 84 86 89 125 114 132Luxembourg .. .. - 1 2 2 13 6 14 1 10 6Netherlands .. .. 7 9 10 132 20 26 25 26 32 126Poland .. .. - - 0.1 - - - 0.1 - - -Portugal .. .. - 241 - 311 11 9 35 33 24 12Spain .. .. - 168 1 7 13 26 32 13 112 24Sweden .. .. - 0.1 2 1 7 9 6 8 9 173United Kingdom .. .. 64 35 26 43 49 365 218 154 147 270
Other developed Europe .. .. 5 9 11 12 34 17 6 2 30 21Gibraltar .. .. - - - - - - - - - 2Switzerland .. .. 5 8 9 8 11 12 6 2 5 16
North America .. .. 117 76 67 144 132 100 68 106 147 138Canada .. .. 41 24 11 21 29 29 14 19 57 57United States .. .. 76 52 56 123 103 71 54 87 90 81
Other developed countries .. .. 11 7 23 50 32 15 12 10 11 5Australia .. .. 11 7 8 3 0.3 8 9 - 11 1Japan .. .. - - 15 46 31 8 3 10 - 4
Developing economies .. .. 16 55 80 73 104 246 78 112 204 3 204Africa .. .. - 6 10 15 73 11 7 44 87 17
North Africa .. .. - 6 10 15 73 11 7 44 87 16Algeria .. .. - 0.3 - 1 1 1 1 3 5 1Egypt .. .. - - 0.1 - - 1 - 32 24 8Libyan Arab Jamahiriya .. .. - 6 10 14 72 9 5 8 8 4Morocco .. .. - 0.2 - 0.4 0.2 1 1 1 49 3
Latin America and the Caribbean .. .. 4 2 1 10 0.2 0.2 0.1 1 0.2 32Bahamas .. .. - - - 0.1 - - - - - 32
Asia .. .. 12 47 69 48 31 235 71 68 117 3 155West Asia .. .. 12 36 51 45 27 214 63 65 113 3 054
Jordan .. .. - - 0.4 - 1 0.4 0.2 0.4 - 0.2Kuwait .. .. 4 9 18 22 17 184 58 63 61 38Lebanon .. .. - - - 0.3 1 1 - - - -Saudi Arabia .. .. 8 22 27 20 8 27 1 0.4 38 0.3Syrian Arab Republic .. .. - - 0.1 1 0.3 1 0.3 - 0.3 -Turkey .. .. - 5 5 3 0.3 2 3 1 - 1United Arab Emirates .. .. - - - - 0.2 - - - 13 3 015
South, East and South-East Asia .. .. - 11 18 3 4 21 8 2 4 101
China .. .. - - - - 0.2 0.3 1 0.3 2 99Malaysia .. .. - 11 18 2 4 20 - - - -Singapore .. .. - - - - - - 7 2 2 2
South-East Europe and the CIS .. .. - 1 0.3 4 - - 0.4 0.2 - -South-East Europe .. .. - 1 0.3 4 - - 0.4 0.2 - -
Source: Foreign Investment Promotion Agency.

World Investment Directory Volume X Africa 2008
644
Table 7. FDI flows in the host economy, by industry and geographical origin, 2006
(Millions of Dinars)
Region/economy / Industry To
tal
Pri
ma
ry
Agr
icul
ture
, hu
ntin
g,
fore
stry
and
fis
hin
g
Min
ing,
qua
rryi
ng
and
pe
tro
leum
Sec
on
da
ry
Te
rtia
ry
Ho
tels
and
re
stau
rant
s
Total world 4 402.9 954.5 14.2 940.3 347.3 3 101.1 18.3
Developed countries 1 199.0 841.7 12.9 828.8 305.8 51.5 4.7
Europe 1 056.8 707.7 11.9 695.8 298.5 50.6 4.7
European Union 1 036.3 704.6 11.4 693.2 289.9 41.8 4.7
Austria 98.7 98.3 0.1 98.2 0.4 - -
Belgium 19.0 - - - 18.7 0.3 0.1
France 153.1 21.2 9.1 12.1 112.5 19.4 2.5
Germany 20.2 0.1 0.1 - 19.7 0.4 -
Italy 131.5 63.4 1.8 61.6 62.4 5.7 -
Luxembourg 6.4 - - - 3.7 2.7 2.1
Netherlands 126.4 99.1 0.1 99.0 27.3 - -
Portugal 11.9 - - - 11.9 - -
Spain 23.6 0.2 0.2 - 23.4 - -
Sweden 172.7 172.7 - 171.6 1.1 - -
United Kingdom 270.4 248.6 - 248.6 8.5 13.3 -
Other developed Europe 20.5 3.1 0.5 2.6 8.6 8.8 -
Switzerland 16.2 - - - 7.4 8.8 -
North America 137.5 133.0 1.0 132.0 3.6 0.9 -
Canada 56.5 56.3 - 56.3 - 0.2 -
United States 81.0 76.7 1.0 75.7 3.6 0.7 -
Other developed countries 4.7 1.0 - 1.0 3.7 - -
Australia 1.0 1.0 - 1.0 - - -
Japan 3.7 - - - 3.7 - -
Developing economies 3 203.9 112.8 1.3 111.5 41.5 3 049.6 13.6
Africa 16.7 2.3 1.1 1.2 6.4 8.0 -
North Africa 16.2 2.3 1.1 1.2 5.9 8.0 -
Egypt 8.0 - - - - 8.0 -
Libyan Arab Jamahiriya 4.3 0.4 0.4 - 3.9 - -
Latin America and the Caribbean 32.1 - - - 32.1 - -
Bahamas 32.1 - - - 32.1 - -
Asia 3 155.1 110.5 0.2 110.3 3.0 3 041.6 13.6
West Asia 3 054.4 13.2 0.2 13.0 1.6 3 039.6 11.6
Kuwait 38.1 3.8 - 3.8 - 34.3 11.6
Turkey 0.8 - - - 0.8 - -
United Arab Emirates 3 014.5 9.2 - 9.2 - 3 005.3 -
South, East and South-East Asia 100.7 97.3 - 97.3 1.4 2.0 2.0
China 98.5 97.3 - 97.3 1.2 - -
Singapore 2.0 - - - - 2.0 2.0
Source: Foreign Investment Promotion Agency.
Notes: Mining, quarrying and petroleum refer to energy. Hotels and restaurants refer to tourism and real estate.

Tunisia
645
Table 9a. FDI flows abroad, by geographical destination, 1995-2006 (Millions of Dinars)
Region / economy 2005 2005 2005 2005 2005 2005 2005 2005 2005 2005 2005 2006
Total world .. .. .. .. .. .. .. .. .. 16.4 16.4 44.0Developed countries .. .. .. .. .. .. .. .. .. 7.6 7.6 11.7
Europe .. .. .. .. .. .. .. .. .. 7.6 7.6 11.6European Union .. .. .. .. .. .. .. .. .. 7.6 7.6 11.6
France .. .. .. .. .. .. .. .. .. 2.5 2.5 1.4United Kingdom .. .. .. .. .. .. .. .. .. 5.0 5.0 9.9
North America .. .. .. .. .. .. .. .. .. 0.1 0.1 0.2United States .. .. .. .. .. .. .. .. .. 0.1 0.1 0.0
Developing economies .. .. .. .. .. .. .. .. .. 8.8 8.8 32.3Africa .. .. .. .. .. .. .. .. .. 8.4 8.4 31.6
North Africa .. .. .. .. .. .. .. .. .. 8.1 8.1 31.3Libyan Arab Jamahiriya .. .. .. .. .. .. .. .. .. 0.6 0.6 6.3Morocco .. .. .. .. .. .. .. .. .. 0.2 0.2 0.4
Other Africa .. .. .. .. .. .. .. .. .. 0.3 0.3 0.3Asia .. .. .. .. .. .. .. .. .. 0.4 0.4 0.7
West Asia .. .. .. .. .. .. .. .. .. 0.4 0.4 0.7United Arab Emirates .. .. .. .. .. .. .. .. .. 0.1 0.1 0.1
Source: Foreign Investment Promotion Agency.
Table 9b. FDI flows abroad, by geographical destination, 1995-2006
(Millions of dollars)
Reporting countries 1995 1996 1997 1998 1999 2000 2001 2002 2003 2004 2005 2006
Algeria - - - 0.3 0.1 3.6 0.3 - - - - -Australia - - - - - - 1.2 - - - - -Belgium/Luxembourg 1.4 - - 1.1 - - 1.8 - - - - -Czech Republic - - - - - - - - - 0.8 - 0.9 -France 2.6 3.8 - - 3.2 - 3.6 10.4 24.8 23.6 3.7 7.5Germany - - 10.6 9.2 - 1.7 - - 6.3 - 7.5 1.1 8.7 - 8.7 2.5Kazakhstan - - 0.4 0.4 - - - 0.3 - - 0.0 - 0.1 0.0Morocco - - - - 2.0 0.3 6.2 4.8 15.9 0.5 3.1 4.5Romania - - - - - - - - - 1.2 - 1.2 -Sweden - - - - 0.2 - - 1.2 - - - - - -
Source: UNCTAD, FDI/TNC database. Note: Data are based on information reported by the economies listed above.
Table 12b. FDI stocks in the host economy, by geographical origin, 1995-2006 (Millions of dollars)
Reporting countries 1995 1996 1997 1998 1999 2000 2001 2002 2003 2004 2005 2006
Bulgaria - - - - 0.7 0.6 - - - 0.0 0.0 -Canada - - - - 37.4 50.7 - - - - - -China - - - - - - - - 1.6 1.3 2.2 -Denmark - - - - - - - - - 2.9 1.9 1.9Germany 81.6 80.4 88.7 119.5 176.8 159.1 195.6 213.9 213.4 125.3 122.7 -Morocco - - - - - - - 0.6 0.8 1.0 0.7 3.5Portugal - 0.1 0.8 226.5 191.9 379.7 359.7 157.9 179.3 - - -Switzerland - - - - - 27.3 21.8 17.3 16.0 26.0 27.2 23.3United Kingdom 3.1 25.5 29.8 33.3 33.9 - - - - - - -United States 70.0 89.0 149.0 150.0 92.0 47.0 32.0 99.0 115.0 214.0 253.0 240.0
Source: UNCTAD, FDI/TNC database. Note: Data are based on information reported by the economies listed above.
Table 15b. FDI stocks abroad, by geographical destination, 1995-2006 (Millions of dollars)
Reporting countries 1995 1996 1997 1998 1999 2000 2001 2002 2003 2004 2005 2006
Bulgaria - - - - 0.0 0.0 0.0 0.2 0.2 0.5 - 0.2 0.1Czech Republic - - - - - - - 0.0 - 0.0 0.9 - 0.0 -Kazakhstan - - 0.4 0.8 0.8 - 0.3 0.3 0.3 0.3 - 0.1 - 0.1Morocco - - - - - - - - - 44.3 40.4 49.3Slovenia 0.3 0.1 0.1 - - - - - - - - -United States - - - 4.0 - - 1.0 1.0 - - 4.0 - - - 1.0
Source: UNCTAD, FDI/TNC database. Note: Data are based on information reported by the economies listed above.

World Investment Directory Volume X Africa 2008
646
Table 12a. FDI stocks in the host economy, by geographical origin, 1994-2005 (Millions of Dinars)
Region / economy 1994 1995 1996 1997 1998 1999 2000 2001 2002 2003 2004 2005
Total world 150 .. .. .. .. .. .. .. .. .. .. ..Developed countries 114 .. .. .. .. .. .. .. .. .. .. ..
Europe 111 .. .. .. .. .. .. .. .. .. .. ..European Union 106 .. .. .. .. .. .. .. .. .. .. ..
Belgium 1 .. .. .. .. .. .. .. .. .. .. ..Finland 7 .. .. .. .. .. .. .. .. .. .. ..France 35 .. .. .. .. .. .. .. .. .. .. ..Germany 6 .. .. .. .. .. .. .. .. .. .. ..Hungary 1 .. .. .. .. .. .. .. .. .. .. ..Italy 46 .. .. .. .. .. .. .. .. .. .. ..Portugal 1 .. .. .. .. .. .. .. .. .. .. ..Sweden 8 .. .. .. .. .. .. .. .. .. .. ..
Other developed Europe 5 .. .. .. .. .. .. .. .. .. .. ..Norway 3 .. .. .. .. .. .. .. .. .. .. ..Switzerland 2 .. .. .. .. .. .. .. .. .. .. ..
North America 1 .. .. .. .. .. .. .. .. .. .. ..United States 1 .. .. .. .. .. .. .. .. .. .. ..
Other developed countries 2 .. .. .. .. .. .. .. .. .. .. ..Australia 2 .. .. .. .. .. .. .. .. .. .. ..
Developing economies 33 .. .. .. .. .. .. .. .. .. .. ..Asia 33 .. .. .. .. .. .. .. .. .. .. ..
West Asia 33 .. .. .. .. .. .. .. .. .. .. ..Kuwait 3 .. .. .. .. .. .. .. .. .. .. ..Saudi Arabia 15 .. .. .. .. .. .. .. .. .. .. ..Syrian Arab Republic 1 .. .. .. .. .. .. .. .. .. .. ..United Arab Emirates 15 .. .. .. .. .. .. .. .. .. .. ..
South-East Europe and the CIS 3 .. .. .. .. .. .. .. .. .. .. ..CIS 3 .. .. .. .. .. .. .. .. .. .. ..
Russian Federation 1 .. .. .. .. .. .. .. .. .. .. ..Ukraine 2 .. .. .. .. .. .. .. .. .. .. ..
Source: Foreign Investment Promotion Agency.
Table 15a. FDI stocks abroad, by geographical destination, 1994-2006 (Millions of Dinars)
Region / economy 1994 1995 1996 1997 1998 1999 2000 2001 2002 2003 2004 2005
Total world 271 .. .. .. .. .. .. .. .. .. .. ..Developing economies 271 .. .. .. .. .. .. .. .. .. .. ..
Latin America and the Caribbean 63 .. .. .. .. .. .. .. .. .. .. ..South and Central America 63 .. .. .. .. .. .. .. .. .. .. ..
Argentina 21 .. .. .. .. .. .. .. .. .. .. ..Mexico 41 .. .. .. .. .. .. .. .. .. .. ..
Asia 208 .. .. .. .. .. .. .. .. .. .. ..South, East and South-East Asia 208 .. .. .. .. .. .. .. .. .. .. ..
China 57 .. .. .. .. .. .. .. .. .. .. ..Hong Kong, China 18 .. .. .. .. .. .. .. .. .. .. ..Indonesia 44 .. .. .. .. .. .. .. .. .. .. ..Malaysia 27 .. .. .. .. .. .. .. .. .. .. ..Singapore 50 .. .. .. .. .. .. .. .. .. .. ..Thailand 14 .. .. .. .. .. .. .. .. .. .. ..
Source: Foreign Investment Promotion Agency.
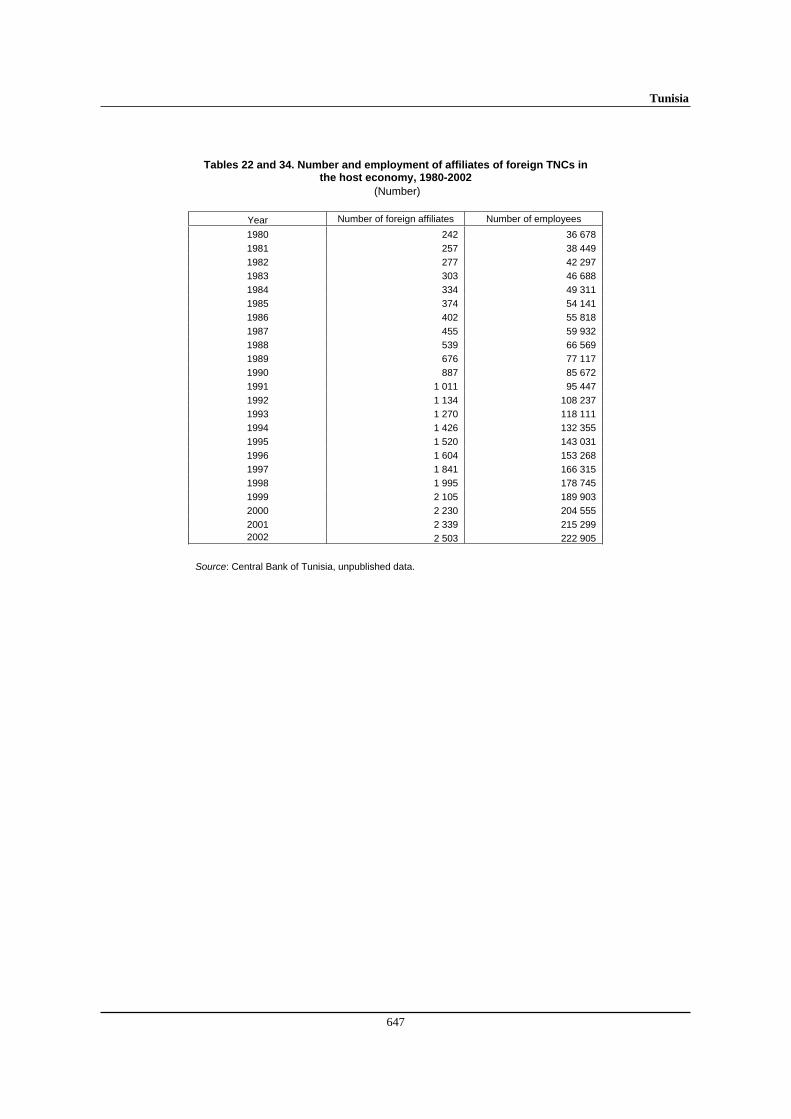
Tunisia
647
Tables 22 and 34. Number and employment of affiliates of foreign TNCs in the host economy, 1980-2002
(Number)
Year Number of foreign affiliates Number of employees
1980 242 36 678
1981 257 38 449
1982 277 42 297
1983 303 46 688
1984 334 49 311
1985 374 54 141
1986 402 55 818
1987 455 59 932
1988 539 66 569
1989 676 77 117
1990 887 85 672
1991 1 011 95 447
1992 1 134 108 237
1993 1 270 118 111
1994 1 426 132 355
1995 1 520 143 031
1996 1 604 153 268
1997 1 841 166 315
1998 1 995 178 745
1999 2 105 189 903
2000 2 230 204 555
2001 2 339 215 299 2002 2 503 222 905
Source: Central Bank of Tunisia, unpublished data.

World Investment Directory Volume X Africa 2008
648
Table 23. The number of affiliates of foreign TNCs in the host economy, by geographical origin, 1994-2005
Economy 1994 1995 1996 1997 1998 1999 2000 2001 2002 2003 2004 2005
Germany 57 62 64 63 66 55 59 56 25 18 19 21
Italy .. 27 .. 26 .. .. .. .. .. .. .. ..
Republic of Korea .. .. 2 2 2 2 2 2 2 2 2 2
United States 20 20 19 23 19 14 12 11 10 11 16 ..
Source: UNCTAD, FDI/TNC database.
Note: Data are based on information reported by the economies listed above.
Table 30. Assets of affiliates of foreign TNCs in the host economy, by geographical origin, 1994-2005
(Millions of dollars) Economy 1994 1995 1996 1997 1998 1999 2000 2001 2002 2003 2004 2005
Germany 193.7 279.0 257.3 279.0 298.9 301.4 372.2 352.5 .. .. .. ..
United States .. 302.0 292.0 491.0 371.0 390.0 292.0 268.0 259.0 604.0 763.0 ..
Source: UNCTAD, FDI/TNC database.
Note: Data are based on information reported by the economies listed above.
Table 35. Employment of affiliates of foreign TNCs in the host economy, by geographical origin, 1994-2005
(Thousands of employees) Economy 1994 1995 1996 1997 1998 1999 2000 2001 2002 2003 2004 2005
Belgium .. .. .. .. .. .. .. 2.6 2.8 2.4 .. ..
Germany 11.0 11.0 13.0 15.0 14.0 12.0 15.0 15.0 8.0 7.0 10.0 13.0
Italy .. 2.6 .. 2.8 .. .. .. .. .. .. .. ..
Switzerland .. .. .. .. .. .. 1.4 1.4 1.8 1.9 2.4 2.6
United States 0.8 0.7 0.7 0.8 0.5 .. .. .. .. 3.1 6.1 ..
Source: UNCTAD, FDI/TNC database.
Note: Data are based on information reported by the economies listed above. Tables 40 and 50. Wages and salaries and value added of affiliates of United States TNCs in Tunisia, 1994-2005
(Millions of dollars) Table no./Variable 1994 1995 1996 1997 1998 1999 2000 2001 2002 2003 2004 2005
40. Wages and salaries 18 19 17 19 16 14 13 12 11 17 27 ..
50. Value added 109 84 71 82 63 169 95 94 107 159 112 ..
Source : UNCTAD, FDI/TNC database.
Note: Data are based on information reported by the United States and refer to majority-owned affiliates only.
Table 45. Sales of affiliates of foreign TNCs in the host economy, by geographical origin, 1994-2005
(Millions of dollars) Economy 1994 1995 1996 1997 1998 1999 2000 2001 2002 2003 2004 2005
Germany 246.5 279.1 332.3 288.3 341.0 319.6 368.5 357.9 282.3 338.6 372.5 241.2
Italy .. 235.1 .. 242.7 .. .. .. .. .. .. .. ..
United States .. 352.0 333.0 353.0 310.0 310 a 333 a 295 a 271 a 467.0 643.0 ..
Source: UNCTAD, FDI/TNC database.
Note: Data are based on information reported by the economies listed above. a Data refer to majority-owned affiliates only.

Tunisia
649
Table 86. Largest home-based TNCs, 2007 (Billions of dollars)
Company Industry Sales
A. Industrial
Sté Tunisienne des Industries de Raffinage Petroleum expl./ref./distr. 1.287Sté Tunisienne de l'Electricité et du Gaz Electricity/gas/water 0.843Groupe Chimique Tunisien Chemicals and chemical products 0.720Sté National de Distributions Petroles Agil Petroleum expl./ref./distr. 0.676Ent. Tunisienne d'Activités Pétroliéres Petroleum expl./ref./distr. 0.310
a
Groupe Abdennadher Food products, beverages and tobacco 0.180a
Régie National desTabacs et des Allumettes Food products, beverages and tobacco 0.119Société Frigorifique Brasserie de Tunis Food products, beverages and tobacco 0.105Société de Nutrition Animale Agro-Industry 0.101
a
Sté Tunisienne des Indus. Pneumatiques Rubber and rubber products 0.084 B. Tertiary Assets
Tunisie Telecom Telecommunications 0.885Société Tunisienne de l'Air Air Transport 0.659Groupe TTS Leisure 0.587
a
Nouvelair Tunisie Air Transport 0.205Compagnie Tunisienne de Navigation Maritime transportation 0.170Office de l'Aviation Civil et des Aeroports Air Transport 0.154SNMVT-Monoprix Diversified 0.132La Poste Tunisienne Posts 0.097Sté National des Chemins de Fer Tunisiens Transportation 0.097Tunisie Leasing Business services 0.094
a
C. Finance and Insurance
Sté Tunisienne d'Assurances et de Reasssurances Insurance 0.153
Source: Jeune Afrique Hors-serie No. 14, 2007. a 2004.
Table 87. Largest foreign affiliates of home-based TNCs, 2007 (Millions of dollars and number)
Company Host Economy Industry Sales Employees
A. Industrial
Coficab Portugal - Companhia De Fios E Cabos, Lda Portugal Electrical and electronic equipment 56.6 209
Gepa Elektronische Bauelemente Vertriebsges. Mbh Germany Electrical and electronic equipment 2.4 3 a
B. Tertiary
Think Tank Business Solutions Ag Germany Computer and related activities 1.9 10
Sarl Mecaways France Wholesale trade 1.1 9Vital Center International Espagne S.A. Spain Health and social services 0.5 7Piccadilly Associates Ltd United Kingdom Other business activities 0.1 Doru Basim Sanayi Ve Ticaret A S Turkey Other services .. 70
Simdex Ehf Iceland Computer and related activities .. 6
Larkstone Construction Ltd United Kingdom Construction .. ..Mandatum Ltd. United Kingdom Public administration .. ..Maritime Petroservice Contractors Ltd Scotland Other business activities .. ..Sinebrychoff Uk Ltd. United Kingdom Public administration .. ..
C. Finance and Insurance .. .. .. .. ..
Source: Who Owns Whom database (https://solutions.dnb.com/wow), retrieved January 2008. a 2004.
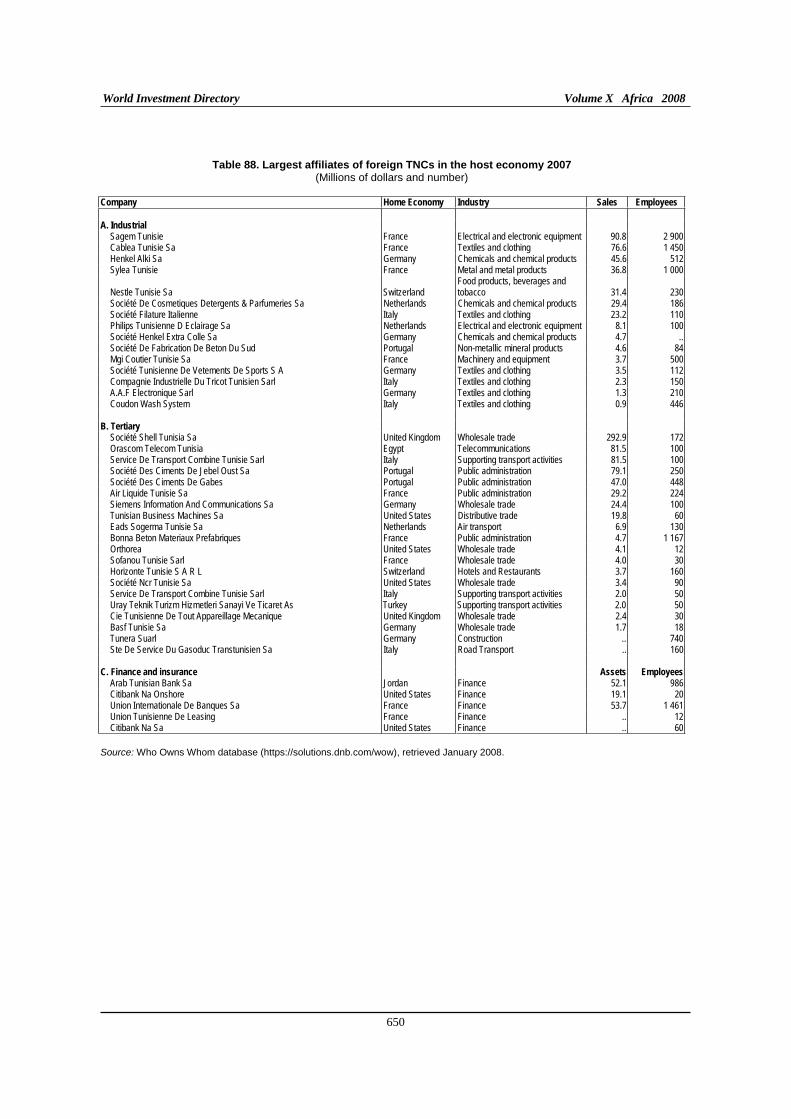
World Investment Directory Volume X Africa 2008
650
Table 88. Largest affiliates of foreign TNCs in the host economy 2007 (Millions of dollars and number)
Company Home Economy Industry Sales Employees
A. Industrial
Sagem Tunisie France Electrical and electronic equipment 90.8 2 900Cablea Tunisie Sa France Textiles and clothing 76.6 1 450Henkel Alki Sa Germany Chemicals and chemical products 45.6 512Sylea Tunisie France Metal and metal products 36.8 1 000
Nestle Tunisie Sa Switzerland Food products, beverages and tobacco 31.4 230
Société De Cosmetiques Detergents & Parfumeries Sa Netherlands Chemicals and chemical products 29.4 186Société Filature Italienne Italy Textiles and clothing 23.2 110Philips Tunisienne D Eclairage Sa Netherlands Electrical and electronic equipment 8.1 100Société Henkel Extra Colle Sa Germany Chemicals and chemical products 4.7 ..Société De Fabrication De Beton Du Sud Portugal Non-metallic mineral products 4.6 84Mgi Coutier Tunisie Sa France Machinery and equipment 3.7 500Société Tunisienne De Vetements De Sports S A Germany Textiles and clothing 3.5 112Compagnie Industrielle Du Tricot Tunisien Sarl Italy Textiles and clothing 2.3 150A.A.F Electronique Sarl Germany Textiles and clothing 1.3 210Coudon Wash System Italy Textiles and clothing 0.9 446
B. Tertiary
Société Shell Tunisia Sa United Kingdom Wholesale trade 292.9 172Orascom Telecom Tunisia Egypt Telecommunications 81.5 100Service De Transport Combine Tunisie Sarl Italy Supporting transport activities 81.5 100Société Des Ciments De Jebel Oust Sa Portugal Public administration 79.1 250Société Des Ciments De Gabes Portugal Public administration 47.0 448Air Liquide Tunisie Sa France Public administration 29.2 224Siemens Information And Communications Sa Germany Wholesale trade 24.4 100Tunisian Business Machines Sa United States Distributive trade 19.8 60Eads Sogerma Tunisie Sa Netherlands Air transport 6.9 130Bonna Beton Materiaux Prefabriques France Public administration 4.7 1 167Orthorea United States Wholesale trade 4.1 12Sofanou Tunisie Sarl France Wholesale trade 4.0 30Horizonte Tunisie S A R L Switzerland Hotels and Restaurants 3.7 160Société Ncr Tunisie Sa United States Wholesale trade 3.4 90Service De Transport Combine Tunisie Sarl Italy Supporting transport activities 2.0 50Uray Teknik Turizm Hizmetleri Sanayi Ve Ticaret As Turkey Supporting transport activities 2.0 50Cie Tunisienne De Tout Appareillage Mecanique United Kingdom Wholesale trade 2.4 30Basf Tunisie Sa Germany Wholesale trade 1.7 18Tunera Suarl Germany Construction .. 740Ste De Service Du Gasoduc Transtunisien Sa Italy Road Transport .. 160
C. Finance and insurance Assets Employees
Arab Tunisian Bank Sa Jordan Finance 52.1 986Citibank Na Onshore United States Finance 19.1 20Union Internationale De Banques Sa France Finance 53.7 1 461Union Tunisienne De Leasing France Finance .. 12Citibank Na Sa United States Finance .. 60
Source: Who Owns Whom database (https://solutions.dnb.com/wow), retrieved January 2008.

Tunisia
651
C. Legal frameworks for transnational corporations
In Tunisia, several national, bilateral and multilateral legal instruments regulate the activities of the transnational corporations and foreign direct investors. The key instruments applicable in the country include the following:
I. National framework
Trademarks Law dated 4/6/1889 on Trademarks and Trade Names. Source: Abu-Ghazaleh Intellectual Property, (http://www.agip.com).
Law No. 87-47 on Restructuring of Public Entreprises of 2 August 1987. Source: World Bank, Techiaical Paper No. 186, "Divestiture of State Entreprises". An overview of the Legal Framework.
Law No. 89-47 on Public Shareholding and Public Entreprises of 1 February 1989. Source: World Bank, Techinical Paper No. 186, "Divestiture of State Entreprises". An overview of the Legal Framework.
Decree No. 89-376 specifying the fist of entreprises considered to be Public given the nature of their activities and the structure of their capital of 11 March 1989. Source: World Bank, Techinical Paper No. 186, "Divestiture of State Entreprises". An overview of the Legal Framework
Decree No. 89-377 specifying the Composition and the Workings of the Commission for the Improvement and Restructuring of Entreprises with Public Shareholding of 15 March 1989. Source: World Bank, Techinical Paper No. 186, "Divestiture of State Entreprises". An overview of the Legal Framework
Taxation of Business Income Law No. 89-114 of 30 December 1989. Source: Journal Officiel de la Republique Tunisienne (Official Gazette) of 2 January 1990.
Law No. 92-81 of 3 August 1992 on Free Zones as amended by Law No. 94-14 of 31 January 1994. Source: Republique Tunisienne, "Incitations aux Investissements", Dispositions legates et reglementaires, Ministere du Plan, Aout 1994.
Loi no 93-42 du 26 avril 1993 portant promulgation du code de l'arbitrage. Source: Journal officiel, 1993-05-04, No 33, pp. 580-587.
Law No. 93-120 of 27 December 1993 promulgating the Investment Encouragement Code. Repeals Law No. 69-35 of 26 June 1969 concerning the Investment Code, Law No. 87-51 of 2 August 1987 concerning the Industrial Investment Code, Law No. 90-21 of March 1990 concerning the Tourist Investment Code, Law No. 89-100 concerning Encouragement of Investments in Services, Law No. 90-17 of 26 February 1990 concerning the Promotion of Investment in Real Estate Property, Law No. 88-18 of 2 April 1988 concerning the Agriculture and Fisheries Investment Code and Law No. 85-48 of 25 April 1985 concerning Encouragement of the Research of Production and Commercialization of Renewable Energies. Source: Journal Officiel de la Republique Tunisienne (Official Gazette) of 8 February 1994.
Implementation Decrees No. 93-2542 of 27 December 1993, No. 94-489 of 21 February 1994, No. 94-492 of 28 February 1994, No. 94-493 of 28 February 1994, No. 94-539 of 10 March 1994, No. 94-1191 of 30 May 1994, No. 94-1192 of 30 May 1994. Source: Republique Tunisienne, "Incitations aux Investissements", Dispositions legales et reglementaires, Ministere du Plan, Aodt 1994.

World Investment Directory Volume X Africa 2008
652
Implementation Decree No. 94-426 of 14 February 1994. Source: Arab Law Quarterly, Vol. 11, No 3 (1996), pp. 311-5.
Law No. (36) of 1994 issued on February 24, 1994 in respect of Literary & Artistic Property. Source: Abu-Ghazaleh Intellectual Property, (http://www.agip.com).
Law No. 94-41 of 7 March 1994 on foreign trade. Source: Republique Tunisienne, "Incitations aux Investissements", Dispositions legales et reglementaires, Ministere du Plan, Aout 1994.
Law No. 94-42 of 7 March 1994 on the activities of international trading companies. Source: Republique Tunisienne, "Incitations aux Investissements", Dispositions legales et reglementaires, Ministere du Plan, Aout 1994.
Law No. 84 for 2000 dated August 24, 2000, in respect of patents of inventions. Source: Abu-Ghazaleh Intellectual Property, (http://www.agip.com).
Protection of Integrated Circuits, Law No. 20 of 2001. Source: Abu-Ghazaleh Intellectual Property, (http://www.agip.com).
Protection of Industrial Drawings and Designs, Law No. 21 of 2001. Source: Abu-Ghazaleh Intellectual Property, (http://www.agip.com).
Protection of Designs and Industrial Models, Law No. 21 of 2001. Source: Abu-Ghazaleh Intellectual Property, (http://www.agip.com).
Trademark Law No. 36, 17/4/2001. Source: Abu-Ghazaleh Intellectual Property, (http://www.agip.com).
II. International framework
A. Tunisia is a party to the following multilateral and regional instruments:
Agreement on Arab Economic Unity of 3 June 1957; entered into force on 30 April 1964. Together with Agreement on Investment and Free Movement of Arab Capital Among Arab Countries of 29 August 1970 and the Unified Agreement for the Investment of Arab Capital in the Arab States of 26 November 1980.
Convention on the Recognition and Enforcement of Foreign Arbitral Awards of 10 June 1958, Entered into force on 7 June 1959.
Convention on the Settlement of Investment Disputes Between States and Nationals of Other States of 18 March 1965; entered into force on 14 October 1966.
Convention Establishing the Inter-Arab Investment Guarantee Corporation of May 1971; entered into force in April 1974.
Agreement for the Promotion, Protection and Guarantee of Investment Among Member States of the Organization of Islamic Conference, of I June 1981; entered into force on 23 September 1986.
Unified Agreement for the Investment of Arab Capital in the Arab States of 1982.
Paris Convention for Protection of Industrial Property of 20 March 1883, (revised at Brussels on 14 December 1900, Washington on 2 June 1911, the Hague on 6 November 1925, London on 2 June 1934,

Tunisia
653
Lisbon on 31 October 1958, Stockholm on 14 July 1967, and as amended on 2 October 1979), signed in 1984.
Convention Establishing the Multilateral Investment Guarantee Agency of 11 October 1985; entered into force on 12 April 1988.
Articles of Agreement of the Islamic Corporation for the Insurance of Investment and Export Credit of 19 February 1992. Entered into force on 1 August 1994.
Marrakesh Agreement Establishing the World Trade Organisation of 15 April 1994. Entered into force on 1 January 1995. Agreement on Trade-Related Investment Measures. General Agreement on Trade in Services. Agreement on Trade Related Aspects of Intellectual Property Rights.
B. Bilateral treaties
1. Bilateral investment treaties for the protection and promotion of investments: Switzerland 1961, Germany 1963, Netherlands 1963, Belgium/Luxembourg 1964, Kuwait 1973, Korea, Republic of 1975, Senegal 1984, Sweden 1984, Italy 1985, Mali 1986, Mauritania 1986, Romania 1987, Togo 1987, United Kingdom 1989, Egypt 1989, Guinea 1990, United States 1990, Oman 1991, Spain 1991, Turkey 1991, Argentina 1992, Greece 1992, Indonesia 1992, Niger 1992, Portugal 1992, Albania 1993, Burkina Faso 1993, Poland 1993, Morocco 1994, Austria 1995, Côte d'Ivoire 1995, Jordan 1995, Romania 1995, Denmark 1996, Pakistan 1996, United Arab Emirates 1996, Qatar 1996, Belgium/Luxembourg 1997, Czech Republic 1997, France 1997, Chile 1998, Lebanon 1998, Netherlands 1998, Bulgaria 2000, Ethiopia 2000, Malta 2000, Finland 2001, Iran, Islamic Republic of 2001, Syrian Arab Republic 2001, Portugal 2002, Hungary 2003, China 2004, Congo 2005, Libyan, Arab Jamahiriya 2005, Algeria 2006.
2. Bilateral treaties for the avoidance of double taxation: France 1973, Morocco 1974, Belgium 1975, Germany 1975, Austria 1977, Norway 1978, Italy 1979, Denmark 1981, Sweden 1981, Canada 1982, Spain 1982, United Kingdom 1982, Senegal 1984, Algeria 1985, United States 1985 and 1989, Turkey 1986, Romania 1987, Togo 1987, Korea, Republic of 1988, Saudi Arabia 1988, Egypt 1989, United States 1989, Czech Republic 1990, Slovakia 1990, Greece 1992, Hungary 1992, Indonesia 1992, Poland 1993, Switzerland 1994, Netherlands 1995, Luxembourg 1996, Pakistan 1996, United Arab Emirates 1996, Oman 1997, Lebanon 1998, Syrian Arab Republic 1998, Yemen 1998, Cameroon 1999, Côte d'Ivoire 1999, Portugal 1999, South Africa 1999, China 2002, Burkina Faso 2003, Ethiopia 2003, Sudan 2003, Belgium 2004.
C. Other treaties:
Euro-Mediterranean Agreement establishing association with the European Communities and their member states (1976 and 1995).
Free Trade Agreement with the European Free Trade Association (EFTA) states (2004).
Free Trade Agreement with Turkey (2004).

World Investment Directory Volume X Africa 2008
654
D. Sources of information
Official
Central Bank of Tunisia (www.bct.gov.tn).
Institut national de la statistique (www.ins.nat.tn).
Ministry of Commerce and Ministry of Industry (www.ministeres.tn).
Secondary
AME Info (2004). "How to boost foreign direct investment", Business Features and Arabies Trends,February 11.
Anderson, Lisa (1992). The state and social transformation in Tunisia and Libya, 1830-198, (Princeton University Press).
Azzam, Henry, T. (1999). "Foreign direct investment inflow to Arab countries on the decline", Jordan times,December 9.
Economist Intelligence Unit (EIU) (various years). Country Profile: Tunisia (London: EIU Ltd.).
_____________(various years). Country Report: Tunisia (London: EIU Ltd.).
International Monetary Fund (IMF) (2002a). Tunisia 2002 Article IV Consultation, 2002 (Washington D.C.: IMF).
_____________(2002b).Tunisia: Financial System Stability Assessment, 2002 (Washington D.C.: MF).
Morrisson, Christian and Bechir Talbi (1996). Long-term growth in Tunisia (Paris: OECD).
Salem, Norma (1984). Habib Bourguiba and the creation of Tunisia (London: Croom Helm).
Spencer, Claire (1993). The Maghreb in the 1990s: political and economic developments in Algeria,
Morocco and Tunisia (Brassey’s).
United Nations Conference on Trade and Development (UNCTAD) (2005a). Investor-Disputes Arising
from Investment Treaties: A Review. UNCTAD Series of International Investment Policies for Development (UNCTAD/ITE/IIT/2005/4).
______________(2005b). A Survey of Support by Investment Promotion Agencies to Linkages. Advisory Studies No. 18 (UNCTAD/ITE/IPC/2005/12).
World Bank (1995). Republic of Tunisia: Towards the 21st Century, 2 vols, Report No. 14375 TUN (Washington D.C.: World Bank).
_______________(1996). Tunisia’s Global Integration and Sustainable Development: Strategic Choices for
the 21st Century, Middle East and North Africa Economic Studies (Washington D.C.: World Bank).
World Bank/International Finance Corporation (2007). Doing Business 2008 Tunisia (Washington D.C.: The World Bank Group).

Uganda
655
Uganda
A. Definitions and sources of data
The Bank of Uganda provided the data on foreign direct investment (FDI) in the country. According to the Bank, FDI reflects the aim of a lasting interest by a resident entity in one economy (direct investor) in an entity resident in another economy (the direct entity). It comprises of three components; new equity investment, re-invested earnings and inter-company loans. The International Monetary Fund also provides FDI data on Uganda in its balance-of-payments statistics.
A new Investment Code that was introduced in 1991, in conjunction with previous implementation of a structural adjustment programme in 1987, brought a substantive change to the then foreign investment policies in Uganda. The code introduced general investment incentives, guaranteed profit repatriation and provided protection against expropriation of assets. It also created the Uganda Investment Authority (UIA) which acts under the supervision of the Ministry of Finance and Economic Planning, as a one-stop-shop to process investment proposals, offer assistance and advice to potential investors.
The UIA licenses all foreign investments with a required minimum threshold of $100,000, if the application is in line with the Investment Code, and the envisaged activity is not unlawful or contrary of the interests of Uganda. Licensed investors are eligible for duty and tax exemptions. Investment licensing goes hand in hand with the granting of certificate of incentives, given that the investment meets the required threshold value and contributes to the objectives specified in the Investment Code. Investments in priority areas, in contrast to the ones in non-priority areas, are eligible for incentives of tax holidays. Foreign investors are exempted from corporate tax, withholding tax and taxes on dividends for a period of between 3 to 6 years. A harmonized commodity code was established for tax exemption for importing plants and machinery. Investor interest in Uganda remains high and is particularly strong from continental Europe and South Africa. Foreign investors range from small agricultural and agro-processing companies to TNCs. The South African companies are engaged in telecommunication business. The areas that the UIA has promoted more aggressively are horticulture, food processing, textiles and packaging.
Uganda is pursuing a network of international relations as a means of attracting FDI. Uganda, Kenya and United Republic of Tanzania recognized the advantages of cooperation and launched a new initiative in 1996, leading to a new East African Community treaty in 1999. Uganda signed to the Convention on the Settlement of Investment Disputes between State and National of other States on June 7 1966 and is a member of the African Union, New Partnership for Africa's Development and Common Market for Eastern. Uganda is also party to the African, Caribbean and Pacific countries partnership agreement, the Cotonou Agreement for renegotiating the preferential trade and aid links with the European Union (EU) and is eligible for the EU's Everything But Arms initiative and the United States' market access initiative for sub-Saharan Africa - the African Growth and Opportunity Act. Uganda has also acceded to the World Trade Organization and Multilateral Investment Guarantee Agency.

World Investment Directory Volume X Africa 2008
656
B. Statistics on FDI and the operations of TNCs
Table 1. Summary of FDI (Millions of dollars)
Variable Inward Outward
1. FDI flows, 2003-2006 (annual average) 247.0 -
2. FDI flows as a percentage of GFCF, 2003-2006 (annual average) 13.4 -
3. FDI stocks, 2006 2 362 -
4. FDI stocks as a percentage of GDP, 2006 25.0 0.0
Source: Based on tables 3 and 4 and UNCTAD, FDI/TNC database.
Table 3. FDI flows, by type of investment, 1980-2006 (Millions of dollars)
Inward investment Outward investment
Reinvested Reinvested Year Equity earnings Other Total Equity earnings Other Total
1980 .. .. .. 4.0 .. .. .. ..1981 .. .. .. .. .. .. .. ..1982 .. .. .. 2.0 .. .. .. ..1983 .. .. .. .. .. .. .. ..1984 .. .. .. .. .. .. .. ..1985 .. .. .. - 4.0 .. .. .. ..1986 .. .. .. .. .. .. .. ..1987 .. .. .. .. .. .. .. ..1988 .. .. .. 4.7 .. .. .. ..1989 .. .. .. - 1.8 .. .. .. ..1990 .. .. .. - 5.9 .. .. .. ..1991 1.0 .. .. 1.0 .. .. .. ..1992 3.0 .. .. 3.0 .. .. .. ..1993 49.6 5.0 0.0 54.6 .. .. .. ..1994 78.2 10.0 0.0 88.2 .. .. .. ..1995 89.5 35.0 0.0 124.5 .. .. .. ..1996 30.0 10.0 - 40.0 .. .. .. ..1997 110.8 8.6 22.1 141.5 .. .. .. ..1998 68.0 15.8 48.8 132.6 .. .. .. ..1999 71.9 16.7 51.6 140.2 .. .. .. ..2000 105.1 16.6 59.2 180.8 .. .. .. ..2001 86.5 42.1 22.9 151.5 .. .. .. ..2002 99.6 42.1 42.9 184.6 .. .. .. ..2003 102.1 51.9 48.2 202.2 .. .. .. ..2004 126.6 60.2 35.4 222.2 .. .. .. ..2005 155.1 70.3 31.6 257.1 .. .. .. ..2006 184.3 83.4 39.1 306.7 .. .. .. ..
Source: UNCTAD, FDI/TNC database (www.unctad.org/statistics). Notes: OECD for 1980, 1982, 1985 and 1988-1990 and the Bank of Uganda, unpublished, thereafter.

Uganda
657
Table 4. FDI stocks, by type of investment, 1980-2006 (Millions of dollars)
Inward investment Outward investment
Equity & Equity & Reinvested Reinvested Reinvested Reinvested
Year earnings earnings Other Total earnings earnings Other Total
1980 .. .. .. 10.9 .. .. .. ..1981 .. .. .. 10.9 .. .. .. ..1982 .. .. .. 12.9 .. .. .. ..1983 .. .. .. 12.9 .. .. .. ..1984 .. .. .. 12.9 .. .. .. ..1985 .. .. .. 8.9 .. .. .. ..1986 .. .. .. 8.9 .. .. .. ..1987 .. .. .. 8.9 .. .. .. ..1988 .. .. .. 13.6 .. .. .. ..1989 .. .. .. 11.9 .. .. .. ..1990 .. .. .. 6.0 .. .. .. ..1991 .. .. .. 7.0 .. .. .. ..1992 .. .. .. 10.0 .. .. .. ..1993 .. .. .. 64.5 .. .. .. ..1994 .. .. .. 152.7 .. .. .. ..1995 .. .. .. 277.2 .. .. .. ..1996 .. .. .. 317.2 .. .. .. ..1997 .. .. .. 458.7 .. .. .. ..1998 .. .. .. 591.3 .. .. .. ..1999 451.3 .. 215.6 666.9 .. .. .. ..2000 539.9 .. 267.2 807.1 .. .. .. ..2001 700.3 .. 262.0 962.3 .. .. .. ..2002 887.1 .. 297.4 1 184.5 .. .. .. ..2003 1 112.5 .. 329.1 1 441.6 .. .. .. ..2004 1 380.2 .. 368.1 1 748.3 .. .. .. ..2005 1 607.7 .. 401.3 2 009.0 .. .. .. ..2006 1 915.4 .. 446.2 2 361.7 .. .. .. ..
Source: UNCTAD, FDI/TNC database (www.unctad.org/statistics). Notes: Data prior to 1999 are estimated accumulating inflows since 1970. 1999-2006 are based on the Bank of Uganda, unpublished.
Table 5. FDI flows in the host economy, by industry, fiscal year 1992/1993 to 2001/2002 (Millions of dollars)
Sector/industry 1992 / 1993
1993 / 1994
1994 / 1995
1995 / 1996
1996 / 1997
1997 / 1998
1998 / 1999
1999 / 2000
2000 / 2001
2001 / 2002
Total 43.5 87.4 110.0 115.6 163.0 190.0 230.0 267.8 227.6 230.7Primary 1.9 3.9 4.9 5.1 7.2 8.4 10.2 11.8 10.0 10.2
Agriculture, hunting, forestry and fishing 0.0 0.0 0.0 0.0 0.1 0.1 0.1 0.1 0.1 0.1Mining, quarrying and petroleum 1.9 3.8 4.8 5.1 7.1 8.3 10.1 11.7 10.0 10.1
Secondary 24.1 48.3 60.8 63.9 90.1 105.0 127.2 148.0 125.8 127.5Tertiary 17.5 35.1 44.2 46.5 65.5 76.3 92.4 107.6 91.4 92.7
Electricity, gas and water 0.5 1.0 1.2 1.3 1.8 2.1 2.6 3.0 2.6 2.6Construction 0.6 1.3 1.6 1.7 2.4 2.8 3.4 4.0 3.4 3.4Wholesale trade, retail and catering,
accomodation and tourism 5.6 11.2 14.1 14.9 21.0 24.4 29.6 34.4 29.3 29.7Transport, storage and communications 5.0 10.1 12.7 13.4 18.9 22.0 26.6 31.0 26.3 26.7Finance and business activities, excluding real
estate 5.1 10.3 13.0 13.7 19.2 22.4 27.2 31.6 26.9 27.2Real estate 0.2 0.4 0.4 0.5 0.7 0.8 0.9 1.1 0.9 0.9Community, social and personal service activities 0.4 0.8 1.0 1.1 1.5 1.7 2.1 2.5 2.1 2.1
Unspecified 0.1 0.1 0.1 0.1 0.2 0.2 0.3 0.3 0.3 0.3 Source: Bank of Uganda, Private Capital Flows Survey 2001 Report, 19 July 2002 (fiscal year). Note: Data represent equity investment and are based on a survey of 326 companies.

World Investment Directory Volume X Africa 2008
658
Table 6a. FDI flows in the host economy, by geographical origin, fiscal year 1992/1993 to 2001/2002
(Millions of dollars)
Region/economy 1992 / 1993
1993 / 1994
1994 / 1995
1995 / 1996
1996 / 1997
1997 / 1998
1998 / 1999
1999 / 2000
2000 / 2001
2001 / 2002
Total World 43.5 87.4 110.0 115.6 163.0 190.0 230.0 267.8 227.6 230.7
Unspecified 5.2 10.5 13.2 13.9 19.6 22.8 27.6 32.2 27.3 27.7
Developed countries 26.0 52.2 65.7 69.1 97.4 113.5 137.4 160.0 136.0 137.8
Europe 13.7 27.5 34.6 36.4 51.3 59.8 72.4 84.3 71.6 72.6
European Union 13.7 27.5 34.6 36.4 51.3 59.8 72.4 84.3 71.6 72.6
Belgium 0.6 1.2 1.5 1.6 2.2 2.6 3.1 3.6 3.1 3.1
France 0.6 1.1 1.4 1.5 2.1 2.5 3.0 3.5 3.0 3.0
Netherlands 1.6 3.1 4.0 4.2 5.9 6.8 8.3 9.6 8.2 8.3
Sweden 0.8 1.5 1.9 2.0 2.8 3.3 4.0 4.7 4.0 4.0
United Kingdom 10.2 20.5 25.8 27.2 38.3 44.6 54.0 62.9 53.5 54.2
North America 3.2 6.3 8.0 8.4 11.8 13.8 16.6 19.4 16.5 16.7
Canada 2.1 4.2 5.3 5.6 7.9 9.2 11.1 12.9 11.0 11.1
United States 1.0 2.1 2.7 2.8 3.9 4.6 5.5 6.5 5.5 5.6
Other developed countries 9.2 18.4 23.1 24.3 34.3 40.0 48.4 56.3 47.9 48.5
Bermuda 9.2 18.4 23.1 24.3 34.3 40.0 48.4 56.3 47.9 48.5
Developing economies 12.3 24.7 31.1 32.7 46.0 53.7 65.0 75.6 64.3 65.2
Africa 10.9 21.8 27.5 28.9 40.7 47.5 57.5 66.9 56.9 57.6
Kenya 4.2 8.4 10.6 11.1 15.7 18.3 22.2 25.8 21.9 22.2
Mauritius 1.6 3.2 4.0 4.2 5.9 6.9 8.3 9.7 8.2 8.3
South Africa 5.1 10.3 12.9 13.6 19.1 22.3 27.0 31.5 26.7 27.1
Asia 1.4 2.9 3.6 3.8 5.3 6.2 7.5 8.7 7.4 7.5
India 0.7 1.4 1.8 1.9 2.7 3.1 3.8 4.4 3.7 3.8
Singapore 0.7 1.4 1.8 1.9 2.7 3.1 3.8 4.4 3.7 3.8
Source: Bank of Uganda, Private Capital Flows Survey 2001 Report, 19 July 2002 (fiscal year).
Note: Data represent equity investment and are based on a survey of 326 companies.
Table 6b. FDI flows in the host economy, by geographical origin, 1995-2006
(Millions of dollars) Reporting countries 1995 1996 1997 1998 1999 2000 2001 2002 2003 2004 2005 2006
Belgium/Luxembourg - - - - - 1.8 - - - - - -
China - - - - - - - - 1.0 0.2 0.2 -
Denmark - - - - - - - - - - - 0.3 - 0.8
France - 1.3 1.1 - - 4.3 5.5 0.9 0.9 - 1.2 2.5 1.3
Germany 1.4 - 2.7 8.1 - 2.3 - - - - 1.9 - 10.2 - 5.0 - 1.2 -
Israel - - - - - - - - 0.2 0.1 - -
Japan - - - - - - - - - - 2.3 -
Portugal - - - 0.0 - 0.1 - 0.4 - 0.2 - 0.1 - 0.2 - - - -
Sweden - - - - 4.1 - 1.0 - - - - -
United States - - - - 8.0 - 5.0 - 1.0 2.0 - - 5.0 1.0 -
Source: UNCTAD. FDI / TNC database.
Note: Data is based on the information reported by the economies listed above.
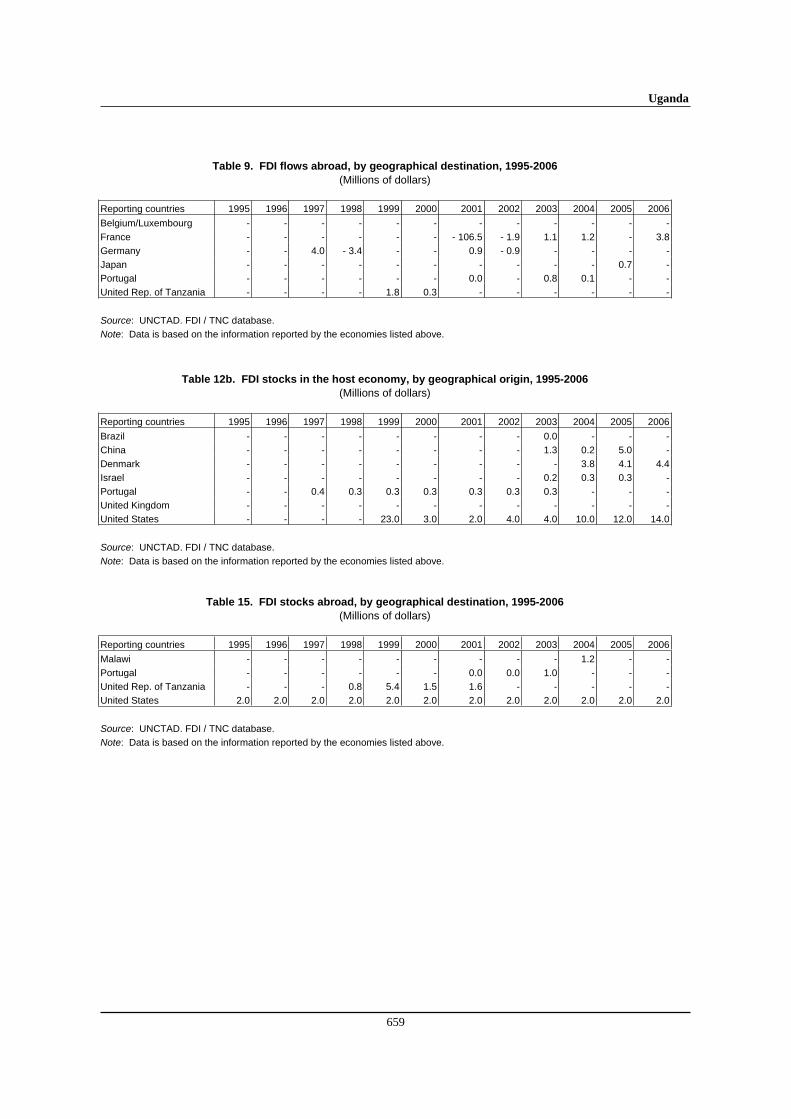
Uganda
659
Table 9. FDI flows abroad, by geographical destination, 1995-2006
(Millions of dollars)
Reporting countries 1995 1996 1997 1998 1999 2000 2001 2002 2003 2004 2005 2006
Belgium/Luxembourg - - - - - - - - - - - -
France - - - - - - - 106.5 - 1.9 1.1 1.2 - 3.8
Germany - - 4.0 - 3.4 - - 0.9 - 0.9 - - - -
Japan - - - - - - - - - - 0.7 -
Portugal - - - - - - 0.0 - 0.8 0.1 - -
United Rep. of Tanzania - - - - 1.8 0.3 - - - - - -
Source: UNCTAD. FDI / TNC database.
Note: Data is based on the information reported by the economies listed above.
Table 12b. FDI stocks in the host economy, by geographical origin, 1995-2006
(Millions of dollars)
Reporting countries 1995 1996 1997 1998 1999 2000 2001 2002 2003 2004 2005 2006
Brazil - - - - - - - - 0.0 - - -
China - - - - - - - - 1.3 0.2 5.0 -
Denmark - - - - - - - - - 3.8 4.1 4.4
Israel - - - - - - - - 0.2 0.3 0.3 -
Portugal - - 0.4 0.3 0.3 0.3 0.3 0.3 0.3 - - -
United Kingdom - - - - - - - - - - - -
United States - - - - 23.0 3.0 2.0 4.0 4.0 10.0 12.0 14.0
Source: UNCTAD. FDI / TNC database.
Note: Data is based on the information reported by the economies listed above.
Table 15. FDI stocks abroad, by geographical destination, 1995-2006
(Millions of dollars)
Reporting countries 1995 1996 1997 1998 1999 2000 2001 2002 2003 2004 2005 2006
Malawi - - - - - - - - - 1.2 - -
Portugal - - - - - - 0.0 0.0 1.0 - - -
United Rep. of Tanzania - - - 0.8 5.4 1.5 1.6 - - - - -
United States 2.0 2.0 2.0 2.0 2.0 2.0 2.0 2.0 2.0 2.0 2.0 2.0
Source: UNCTAD. FDI / TNC database.
Note: Data is based on the information reported by the economies listed above.

World Investment Directory Volume X Africa 2008
660
Table 11. FDI stocks in the host economy, by industry, 1995-2006
(Millions of dollars)
Sector / industry 1995 1996 1997 1998 1999 2000 2001 2002 2003 2004 2005 2006
Total .. .. .. .. .. 540 642 753 724 .. .. ..
Primary .. .. .. .. .. 26 - 3 0 5 .. .. ..
Agriculture, hunting, forestry and fishing .. .. .. .. .. 24 - 3 0 5 .. .. ..
Mining, quarrying and petroleum .. .. .. .. .. 2 - - - .. .. ..
Mining and quarrying .. .. .. .. .. 2 - - - .. .. ..
Secondary .. .. .. .. .. 194 205 271 193 .. .. ..
Tertiary .. .. .. .. .. 305 398 434 468 .. .. ..
Electricity, gas and water .. .. .. .. .. 9 - - - .. .. ..
Construction .. .. .. .. .. 13 6 12 15 .. .. ..
Trade .. .. .. .. .. 89 155 155 153 .. .. ..
Transport, storage and communications .. .. .. .. .. 94 96 92 99 .. .. ..
Transport and storage .. .. .. .. .. 94 96 92 99 .. .. ..
Finance .. .. .. .. .. 96 139 172 200 .. .. ..
Community, social and personal service activities .. .. .. .. .. 4 2 3 1 .. .. ..
Unspecified .. .. .. .. .. 14 41 49 58 .. .. ..
Source: Bank of Uganda, unpublished.
Table 12a. FDI stocks in the host economy, by geographical origin, 1995-2006
(Millions of dollars)
Region / economy 1995 1996 1997 1998 1999 2000 2001 2002 2003 2004 2005 2006
Total world .. .. .. .. 667 807 9621
165 1
359 .. .. ..
Developed countries .. .. .. .. 391 490 562 676 786 .. .. ..
Europe .. .. .. .. 198 266 320 360 395 .. .. ..
European Union .. .. .. .. 198 266 320 360 395 .. .. ..
Belgium .. .. .. .. - 20 21 21 21 .. .. ..
France .. .. .. .. - 19 21 21 21 .. .. ..
Netherlands .. .. .. .. 18 35 43 54 63 .. .. ..
Sweden .. .. .. .. 10 15 21 27 33 .. .. ..
United Kingdom .. .. .. .. 170 176 214 237 258 .. .. ..
North America .. .. .. .. 53 54 44 113 184 .. .. ..
Canada .. .. .. .. 35 36 46 54 61 .. .. ..
United States .. .. .. .. 18 18 - 2 59 123 .. .. ..
Other developed countries .. .. .. .. 140 170 198 203 206 .. .. ..
Bermuda .. .. .. .. 140 170 198 203 206 .. .. ..
Developing economies .. .. .. .. 183 234 269 275 282 .. .. ..
Africa .. .. .. .. 159 209 241 245 249 .. .. ..
Kenya .. .. .. .. 67 75 66 63 61 .. .. ..
Mauritius .. .. .. .. 19 35 50 58 66 .. .. ..
South Africa .. .. .. .. 74 100 124 124 123 .. .. ..
Asia .. .. .. .. 23 25 28 30 32 .. .. ..
India .. .. .. .. 12 12 13 16 18 .. .. ..
Singapore .. .. .. .. 12 13 14 14 14 .. .. ..
Unspecified .. .. .. .. 93 84 132 214 291 .. .. ..
Source: Bank of Uganda, unpublished.
Note: Totals are not comparable to those shown in table 11 due to double counting in the case of joint ventures.

Uganda
661
Table 23. The number of affiliates of foreign TNCs in the host economy, by geographical origin, 1993-2004
Economy 1993 1994 1995 1996 1997 1998 1999 2000 2001 2002 2003 2004
Italy .. .. .. .. 1 .. .. .. .. .. .. ..
United States 2 1 1 1 1 1 2 2 1 1 1 1
Source: UNCTAD, FDI/TNC database.
Note: Data are based on information reported by the economies listed above.
Tables 40 and 50. Wages and salaries and value added of affiliates of United States TNCs in Uganda, 1993-2004
(Millions of dollars)
Table no./Variable 1993 1994 1995 1996 1997 1998 1999 2000 2001 2002 2003 2004
40. Wages and salaries 1.0 1.0 1.0 1.0 1.0 1.0 .. .. .. .. .. ..
50. Value added a .. 4.0 10.0 32.0 34.0 32.0 .. .. .. .. .. ..
Source: UNCTAD, FDI/TNC database.
Note: Data are based on information reported by the United States. a Data refer to majority-owned affiliates only.
Table 35. Employment of affiliates of foreign TNCs in the host economy, by geographical origin, 1993-2004
(Thousands of employees)
Economy 1993 1994 1995 1996 1997 1998 1999 2000 2001 2002 2003 2004
Italy 0.1 .. 0.1 .. 0.1 .. .. .. .. .. .. ..
United States 0.1 0.1 0.1 .. 0.1 0.1 .. .. .. .. .. ..
Source: UNCTAD, FDI/TNC database.
Note: Data are based on information reported by the economies listed above.
Table 45. Sales of affiliates of foreign TNCs in the host economy, by geographical origin, 1993-2004
(Millions of dollars)
Economy 1993 1994 1995 1996 1997 1998 1999 2000 2001 2002 2003 2004
Italy 13.2 .. 12.8 .. 12.2 .. .. .. .. .. .. ..
Source: UNCTAD, FDI/TNC database.
Note: Data are based on information reported by Italy.

World Investment Directory Volume X Africa 2008
662
Table 86. Largest home-based TNCs, 2007 (Billions of dollars)
Company Industry Sales
A. Industrial .. .. .. B. Tertiary MTN Uganda Telecommunications 0.14 C. Finance and Insurance Assets
.. .. ..
Source: Jeune Afrique Hors-serie No. 14, 2007.a 2004.
Table 87. Largest foreign affiliates of home-based TNCs, 2007 (Millions of dollars and number)
Company Host economy Industry Sales Employees
A. Industrial
.. .. .. .. .. B. Tertiary
.. .. .. .. ..
C. Finance and Insurance Assets Employees
East African Development Bank Kenya Finance .. .. Source: Who Owns Whom database (https://solutions.dnb.com/wow), retrieved January 2008.
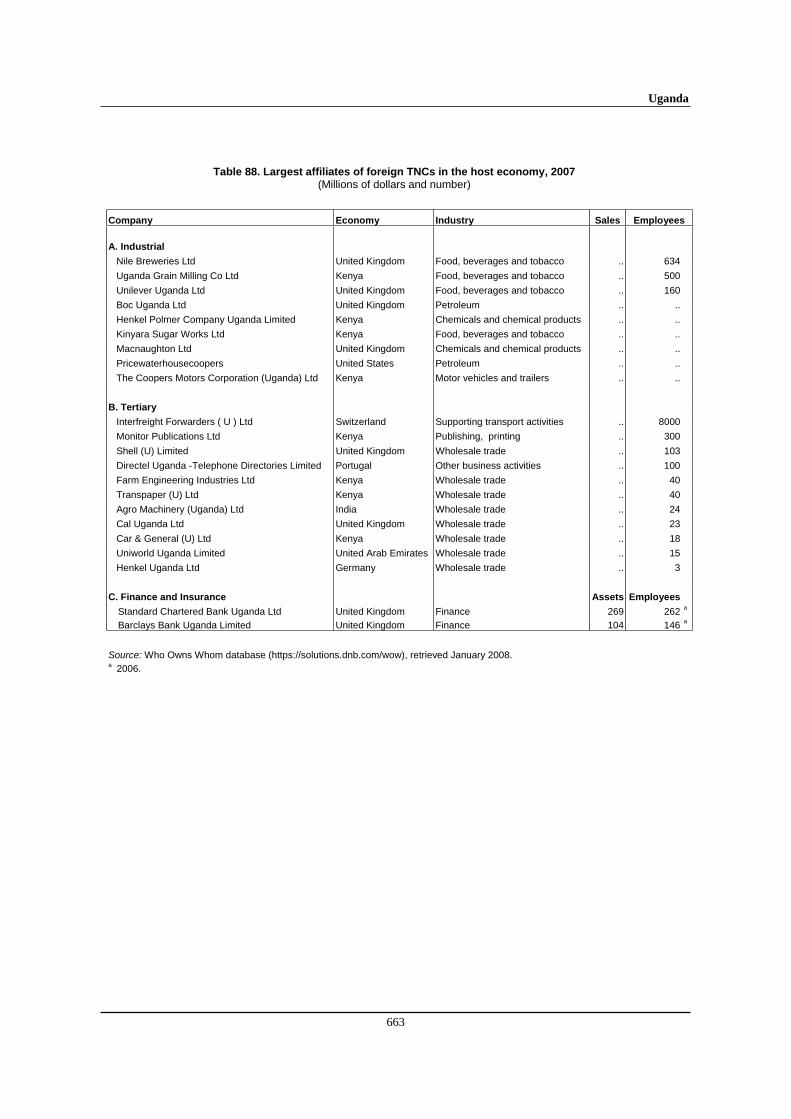
Uganda
663
Table 88. Largest affiliates of foreign TNCs in the host economy, 2007 (Millions of dollars and number)
Company Economy Industry Sales Employees
A. Industrial
Nile Breweries Ltd United Kingdom Food, beverages and tobacco .. 634
Uganda Grain Milling Co Ltd Kenya Food, beverages and tobacco .. 500
Unilever Uganda Ltd United Kingdom Food, beverages and tobacco .. 160
Boc Uganda Ltd United Kingdom Petroleum .. ..
Henkel Polmer Company Uganda Limited Kenya Chemicals and chemical products .. ..
Kinyara Sugar Works Ltd Kenya Food, beverages and tobacco .. ..
Macnaughton Ltd United Kingdom Chemicals and chemical products .. ..
Pricewaterhousecoopers United States Petroleum .. ..
The Coopers Motors Corporation (Uganda) Ltd Kenya Motor vehicles and trailers .. ..
B. Tertiary
Interfreight Forwarders ( U ) Ltd Switzerland Supporting transport activities .. 8000
Monitor Publications Ltd Kenya Publishing, printing .. 300
Shell (U) Limited United Kingdom Wholesale trade .. 103
Directel Uganda -Telephone Directories Limited Portugal Other business activities .. 100
Farm Engineering Industries Ltd Kenya Wholesale trade .. 40
Transpaper (U) Ltd Kenya Wholesale trade .. 40
Agro Machinery (Uganda) Ltd India Wholesale trade .. 24
Cal Uganda Ltd United Kingdom Wholesale trade .. 23
Car & General (U) Ltd Kenya Wholesale trade .. 18
Uniworld Uganda Limited United Arab Emirates Wholesale trade .. 15
Henkel Uganda Ltd Germany Wholesale trade .. 3
C. Finance and Insurance Assets Employees
Standard Chartered Bank Uganda Ltd United Kingdom Finance 269 262 a
Barclays Bank Uganda Limited United Kingdom Finance 104 146 a
Source: Who Owns Whom database (https://solutions.dnb.com/wow), retrieved January 2008.a 2006.

World Investment Directory Volume X Africa 2008
664
C. Legal frameworks for transnational corporations
Uganda has adopted a number of national, bilateral and multilateral legal instruments to regulate the activities of transnational corporations and foreign direct investors. The key among the applicable instruments in the country include the following:
I. National framework
The United Kingdom Designs (Protection) Act, cap. 84 (Ord. 6, June 1937, L.N.261 of 1962). Source: The Government of Uganda.
The Trade Marks Act, cap. 83 (Ord. 14 of 1952, L.Ns. 281 of 1952, 161 of 1962, 261 of 1962, Act 3 of 1965), January 1933, amended by Act 3 of 1965, (see in brackets above). Source: The Government of Uganda.
Copyright Act (cap. 81), July 1964. Source: The Government of Uganda.
Companies Act, 1964. Source: The Government of Uganda.
Trade Marks (Amendment) Rules, S.I. 1982 No. 142 of 1982, as last amended by Trade Marks (Amendment) Rule, SI No. 11/89 of 1988. Source: The Government of Uganda.
The Investment Code (1991), enacted into Law by the Parliament on 25 January 1991, repeals the Foreign Investment Promotion Act of 1964, the Foreign Investments (Protection) Regulations, 1965 and the Foreign Investment Decree of 1977. Source: The Government of Uganda.
The Patents Statute No. 10, December 1991, amended by the Patents Act No.7 of 2002. Source: The Government of Uganda.
Public Enterprises Reform and Divestiture (PERD) Statute No 9 of 1993; amended by The Public Enterprises Reform and Divestiture Act No.1 of 2000. Source: The Government of Uganda.
Schedule to the Patents Act: The Patents Rules No. 22, December 1993. Source: The Government of Uganda.
National Enterprise Corporation Statute 1995 (No. 1 of 1995).Source: Official Gazette, Statute Supplements, 1995-04-29, Vol. 88, No. 18, pp. 1-15
Income Tax Act 1997, amended by the Income Tax Act No. 10 of 2000 Source: The Government of Uganda.
The Employment Act, 2006 (Act No. 6).Source: Uganda Gazette - Acts Supplement No. 5, 2006-06-08, Vol. XCVIX, No. 36, pp. 1- 74
II. International Framework
A. Uganda is a party to the following multilateral and regional instruments:
Convention on the Recognition and Enforcement of Foreign Arbitral Awards of 1958, which entered into force on 7th June 1959.

Uganda
665
Convention on the Settlement of Investment Disputes between States and Nationals of other States of 1965. Entered into force on 14 October 1966.
Convention Establishing the Multilateral Investment Guarantee Agency of 1985, entered into force on 12 April 1988.
Fourth ACP - EEC Convention (Lome IV) of 1989, entered into force on 1st March 1990.
Charter on a Regime of Multinational Industrial Enterprises (MIEs) in the Preferential Trade Area for Eastern and Southern African States (PTA), signed on 21 November 1990, entered into force August 1995. Source: Preferential Trade Area for Eastern ans Southern African States: Report of the Sixteenth Meeting of the Council of Ministers, 17-19 november, 1990, Mbabane, Swaziland (PTA/CM/XVI/2)
Treaty Establishing the Market for Eastern and Southern Africa (COMESA), 1993.
Marrakesh Agreement Establishing the World Trade Organisation of 15 April 1994. Entered into force on 1 January 1995. Agreement on Trade-Related Investment Measures. General Agreement on Trade in Services. Agreement on Trade Related Aspects of Intellectual Property Rights.
Paris Convention for the Protection of Industrial Property of 1883 (Revised at Brussels in 1900, Washington in 1911, The Hague in 1925, London in 1934, Lisbon in 1958 and Stockholm in 1967, and as amended in 1979). Signed in 1994.
Treaty for the Establishment of the East African Community, 30 November 1999.
Banjul Protocol as last amended in November 1999, effective November 2000.
Partnership Agreement between the Members of The African, Caribbean and Pacific Group of States, of the one part and the European Community and its member states, of the other part signed in Cotonou, Benin on 23 June 2000.
B. Bilateral treaties
Bilateral treaties with its major partners were part of the effort made by the Ugandan government to reduce difficulties facing foreign investors operating in the economy. The focus of these treaties was to protect and promote investment, at the same time that it helps to reduce the chances of double taxation on return from investments. The existing bilateral treaties with various countries include:
1. Bilateral investment treaties for the protection and promotion of investments: Germany 1966, Netherlands 1970, Switzerland 1971, Egypt 1995, Italy 1997, United Kingdom 1998, Netherlands 2000, South Africa 2000, Denmark 2001, Eritrea 2001, Cuba 2002, France 2002, Nigeria 2003, Zimbabwe 2003, China 2004.
2. Bilateral treaties for the avoidance of double taxation: South Africa 1959, Zambia 1968, United Kingdom 1992, Kenya 1999, Norway 1999, Tanzania 1999, Denmark 2000, Italy 2000, Netherlands 2000, Mauritius 2003, India 2004.
C. Other treaties:
Investment agreement for the COMESA Common Investment Area (2007).

World Investment Directory Volume X Africa 2008
666
D. Sources of information
Official
Bank of Uganda (www.bou.or.ug).Ministry of Finance Planning and Economic Development (www.finance.go.ug).
Secondary
Arne Bigsten and Steve Kayizzi-Mugerwa (1999). Crisis, Adjustment and Growth in Uganda: A Study of Adaptation in an African Economy (Studies in the African Economies) (London: St Martins).
Bank of Uganda (2001). Private Capital Flows Survey 2001 Report (Kampala: Bank of Uganda).
Economist Intelligence Unit (EIU) (various years). Country Profile: Uganda (London: EIU Ltd.).
____________(various years). Country Report: Uganda (London: EIU Ltd.).
Holger B Hansen and Michael Twaddle (eds) (1998). Developing Uganda (Dayton: Ohio University Press).
International Monetary Fund (IMF) (2006). IMF's Sub-Saharan Africa Regional Economic Outlook, March 10, 2006. (Washington D.C.: IMF).
Mahmood Mamdani (1991). "Uganda: contradictions in the IMF programme and perspective", in theInternational Monetary Fund and the South: The Social Impact of Crisis and Adjustment (London: Zed Books).
Soderbom, M. and F. Teal (2004). "Size and Efficiency in Africa Manufacturing firms: Evidence from Firm-Level Panel Data." Journal of Development Economics, 73. pp 369 - 394.
Yoweri Museveni (1997). Sowing the Mustard Seed (London: Macmillan).
United Nations Conference on Trade and Development (UNCTAD) (1999). Investment policy review of Uganda (Geneva: UNCTAD – E.99.II.D.20).
___________(2001). An investment guide to Uganda: Opportunities and conditions (Geneva : UNCTAD/ITE/IIT/Misc.30).
___________ (2005a). Investor-Disputes Arising from Investment Treaties: A Review. UNCTAD Series of International Investment Policies for Development (UNCTAD/ITE/IIT/2005/4).
____________(2005b). A Survey of Support by Investment Promotion Agencies to Linkages. Advisory Studies No. 18 (UNCTAD/ITE/IPC/2005/12).
____________(2005c). FDI in least developed countries at a glance: 2005/2006(UNCTAD/ITE/IIA/2005/17).
United States Commercial Service (2006). Doing Business in Uganda: A country Commercial Guide for US Companies. (Washington D.C.: US Government).
United States Trade Representative (2006). 2006 Comprehensive Report on U.S. Trade and Investment Policy Toward Sub-Saharan Africa and Implementation of the Africa Growth and Opportunity Act: The Sixth of Eight Annual Reports, May 2006. (Washington D.C.: US Government).
Uzoigwe, G. N. (ed.) (1982). Uganda: Dilemma of Nationhood (New York: Nok).
World Bank (2004). Competing in the Global Economy: An Investment Climate Assessment for Uganda.August, 2004.
World Bank/International Finance Corporation (2007). Doing Business 2008 Uganda (Washington D.C.: The World Bank Group).

United Republic of Tanzania
667
United Republic of Tanzania
A. Definitions and sources of data
The National Investment (Promotion and Protection) Act, passed in April 1990, defines foreign investment as contribution of foreign capital by a foreign national (i.e. a person who is not a citizen of the United Republic or a company or other body corporated outside the United Republic). Foreign capital is defined to include plant, machinery, buildings, spare parts, raw material, and other business assets obtained by the expenditure of foreign convertible currency or negotiable instruments in foreign convertible currency, retained earnings and unremitted dividends. The Act provides the foundation for Investment Promotion Center of the United Republic of Tanzania which is in charge of the implementation of the national investment policy. The work of the center applies to all matters on promotion, coordination, regulation and monitoring of local and foreign investment in the country.
Investment in United Republic of Tanzania, domestic and foreign, is classified according to four different categories: the first category with priority for private investment; the second category comprises activities which are reserved for the public sector; the third group of businesses is reserved for local entrepreneurs; and in the fourth category, a minimum investment of at least £250,000 is required from foreign investors. The Act offers three incentives for potential investors: tax holidays, permission to retain a certain foreign exchange earnings in external account and access to land. Foreign investors are guaranteed to have ownership rights and the right to transfer foreign exchange currency. Data on FDI are collected by the Bank of Tanzania and reported to the International Monetary Fund (IMF). Such data are compiled from exchange control approval forms in the capital account of the balance-of-payments (BOP). Data on reinvested earnings are not collected, nor are data by the country of origin or industry; rather, the data are consolidated and categorized according to the standard BOP format. The IMF also reports FDI data in Tanzania in its BOP statistics.
Considerable progress has been made in privatization of state assets and liberalization of the economy. As a result, most of the public enterprises are going up for privatization. For example, the Government has already privatized the Dar-es-Salaam Airport Handling Company (Dahco), which provides ground-handling facilities at the Dar-es-Salaam and Kilimanjaro airports. Following the removal of Air Tanzania Corporation's (ATC) monopoly on domestic flights, carriers has grown in recent years. The ATC itself is being privatized as part of the transport reform programme. In 2002, South African Airways took a 49% stake in the company. The Government is selling its remaining shares in Tanzania Telecommunications Company Limited to international and local investors. Tanzania possesses significant deposits of a range of minerals including nickel, iron and coal, gold, diamonds and various gemstones. Except for gold, these are largely unexploited, although some coal is mined in the south-west of the country, and large soda ash deposits in Lake Natron are used for producing caustic soda. Gold and diamonds together accounted for about 63% of mineral exports, with gemstones contributing 36%.
Tanzania signed to the Convention on the Settlement of Investment Disputes between State and Nationals of other States on 10 January 1992 and is a member to some economic cooperation and regional integration schemes such as the African Union, East African Community, the Southern African Development Community and is an eligible member of the United States' market access initiative for African countries - the Africa Growth and Opportunity Act and Cotonou Agreement for renegotiating the trade and aid links between the African, Caribbean and Pacific countries with the European Union. Tanzania is also a member of the World Trade Organization and the Multilateral Investment Guarantee Agency.

World Investment Directory Volume X Africa 2008
668
B. Statistics on FDI and the operations of TNCs
Table 1. Summary of FDI (Millions of dollars)
Variable Inward Outward
1. FDI flows, 2003-2006 (annual average) 365.8 0.5
2. FDI flows as a percentage of GFCF, 2003-2006 (annual average) 14.3 0.0
3. FDI stocks, 2006 6 109 -
4. FDI stocks as a percentage of GDP, 2006 47.8 0.0
Source: Based on tables 3 and 4 and UNCTAD, FDI/TNC database.
Table 3. FDI flows, by type of investment, 1980-2006 (Millions of dollars)
Inward investment Outward investment
Reinvested Reinvested Year Equity earnings Other Total Equity earnings Other Total
1980 - - - 4.6 .. .. .. ..1981 - - - 18.9 .. .. .. ..1982 - - - 17.3 .. .. .. ..1983 - - - 1.5 .. .. .. ..1984 - - - - 8.4 .. .. .. ..1985 - - - 14.5 .. .. .. ..1986 - - - - 7.5 .. .. .. ..1987 - - - - 0.5 .. .. .. ..1988 - - - 3.8 .. .. .. ..1989 - - - 5.8 .. .. .. ..1990 - - - 0.0 .. .. .. ..1991 - - - 0.0 .. .. .. ..1992 12.2 - - 12.0 .. .. .. ..1993 20.5 - - 20.0 .. .. .. ..1994 50.0 - - 50.0 .. .. .. 1.01995 119.9 - - 150.0 .. .. .. -1996 150.1 - - 148.5 .. .. .. - 1.31997 157.9 - - 157.8 .. .. .. 5.81998 172.3 - - 172.2 .. .. .. - 4.41999 167.6 0.6 328.4 496.6 .. .. .. -2000 85.0 0.7 175.9 216.0 .. .. .. -2001 170.2 - 0.6 121.1 388.8 .. .. .. 0.82002 34.1 0.1 63.9 387.6 .. .. .. 0.22003 121.1 2.1 87.2 308.2 .. .. .. 2.32004 110.8 0.1 82.7 330.6 .. .. .. -2005 184.7 3.7 109.0 447.6 .. .. .. -2006 272.2 7.0 97.8 376.9 .. .. .. - 0.1
Source: UNCTAD, FDI/TNC database (www.unctad.org/statistics). Note: Data on inflows are based on OECD for 1980-1989 and the Bank of Tanzania thereafter. Data on outflows are proxy data based on investments reported by the following economies: 1994 Belgium and Luxembourg and China. 1996 Belgium and Luxembourg. 1997 France and Germany. 1998 Germany. 2001 Australia and Germany. 2002 Sweden. 2003 Germany. 2006 Bulgaria and Sweden.

United Republic of Tanzania
669
Table 4. FDI stocks, by type of investment, 1980-2006 (Millions of dollars)
Inward investment Outward investment
Equity & Equity & Reinvested Reinvested Reinvested Reinvested
Year earnings earnings Other Total earnings earnings Other Total
1980 - .. - 342.3 .. .. .. ..1981 - .. - 361.2 .. .. .. ..1982 - .. - 378.5 .. .. .. ..1983 - .. - 380.1 .. .. .. ..1984 - .. - 371.6 .. .. .. ..1985 - .. - 386.1 .. .. .. ..1986 - .. - 378.7 .. .. .. ..1987 - .. - 378.2 .. .. .. ..1988 - .. - 381.9 .. .. .. ..1989 - .. - 387.8 .. .. .. ..1990 - .. - 387.8 .. .. .. ..1991 - .. - 387.8 .. .. .. ..1992 - .. - 399.8 .. .. .. ..1993 - .. - 419.8 .. .. .. ..1994 - .. - 469.8 .. .. .. ..1995 573.2 .. 44.3 619.8 .. .. .. ..1996 618.9 .. 57.7 681.4 .. .. .. ..1997 661.2 .. 91.6 760.0 .. .. .. ..1998 1 246.7 .. 468.0 1 714.7 .. .. .. ..1999 1 236.2 .. 752.9 1 989.0 .. .. .. ..2000 1 834.9 .. 946.0 2 777.8 .. .. .. ..2001 1 921.3 .. 1 038.4 2 959.7 .. .. .. ..2002 2 434.2 .. 808.4 3 242.7 .. .. .. ..2003 2 992.4 .. 1 146.2 4 138.6 .. .. .. ..2004 3 475.6 .. 1 282.9 4 758.5 .. .. .. ..2005 3 712.5 .. 1 429.3 5 141.8 .. .. .. ..2006 4 492.1 .. 1 616.5 6 108.7 .. .. .. ..
Source: UNCTAD, FDI/TNC database (www.unctad.org/statistics). Note: Data on inward stock prior to 1995 are estimated by subtracting inflows from the stock of 1995. Data for 1995-2006 are based onthe Bank of Tanzania.
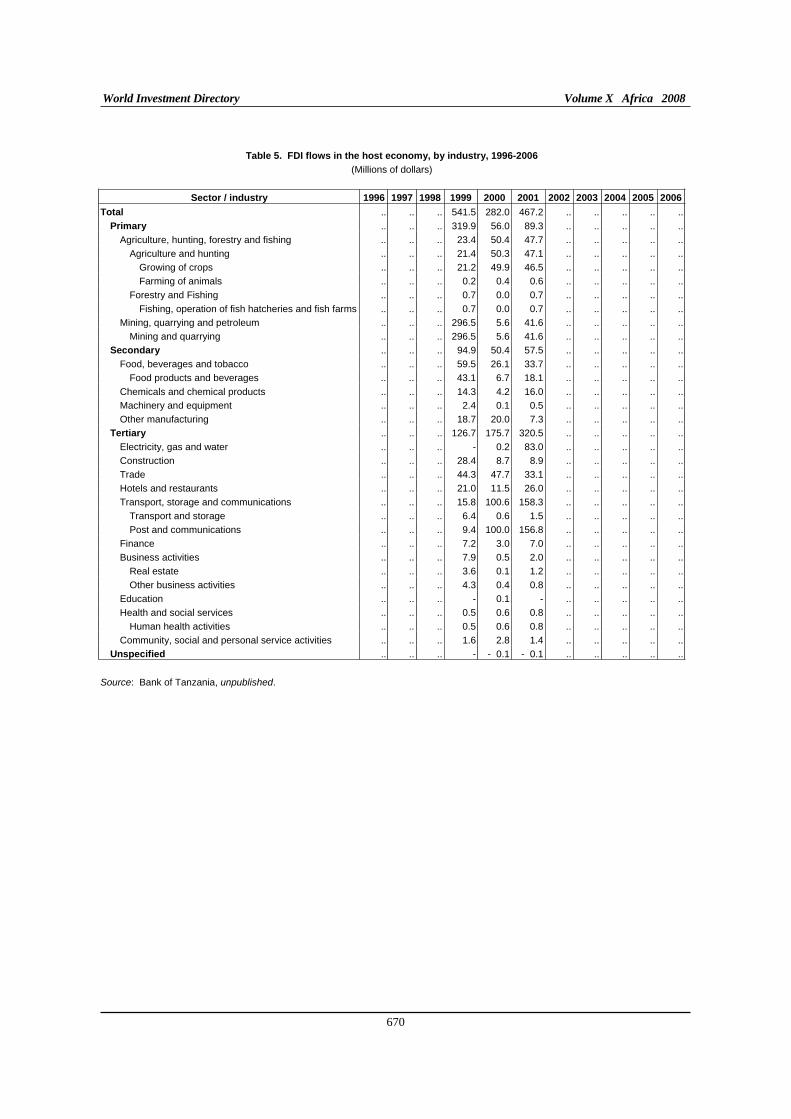
World Investment Directory Volume X Africa 2008
670
Table 5. FDI flows in the host economy, by industry, 1996-2006
(Millions of dollars)
Sector / industry 1996 1997 1998 1999 2000 2001 2002 2003 2004 2005 2006
Total .. .. .. 541.5 282.0 467.2 .. .. .. .. ..
Primary .. .. .. 319.9 56.0 89.3 .. .. .. .. ..
Agriculture, hunting, forestry and fishing .. .. .. 23.4 50.4 47.7 .. .. .. .. ..
Agriculture and hunting .. .. .. 21.4 50.3 47.1 .. .. .. .. ..
Growing of crops .. .. .. 21.2 49.9 46.5 .. .. .. .. ..
Farming of animals .. .. .. 0.2 0.4 0.6 .. .. .. .. ..
Forestry and Fishing .. .. .. 0.7 0.0 0.7 .. .. .. .. ..
Fishing, operation of fish hatcheries and fish farms .. .. .. 0.7 0.0 0.7 .. .. .. .. ..
Mining, quarrying and petroleum .. .. .. 296.5 5.6 41.6 .. .. .. .. ..
Mining and quarrying .. .. .. 296.5 5.6 41.6 .. .. .. .. ..
Secondary .. .. .. 94.9 50.4 57.5 .. .. .. .. ..
Food, beverages and tobacco .. .. .. 59.5 26.1 33.7 .. .. .. .. ..
Food products and beverages .. .. .. 43.1 6.7 18.1 .. .. .. .. ..
Chemicals and chemical products .. .. .. 14.3 4.2 16.0 .. .. .. .. ..
Machinery and equipment .. .. .. 2.4 0.1 0.5 .. .. .. .. ..
Other manufacturing .. .. .. 18.7 20.0 7.3 .. .. .. .. ..
Tertiary .. .. .. 126.7 175.7 320.5 .. .. .. .. ..
Electricity, gas and water .. .. .. - 0.2 83.0 .. .. .. .. ..
Construction .. .. .. 28.4 8.7 8.9 .. .. .. .. ..
Trade .. .. .. 44.3 47.7 33.1 .. .. .. .. ..
Hotels and restaurants .. .. .. 21.0 11.5 26.0 .. .. .. .. ..
Transport, storage and communications .. .. .. 15.8 100.6 158.3 .. .. .. .. ..
Transport and storage .. .. .. 6.4 0.6 1.5 .. .. .. .. ..
Post and communications .. .. .. 9.4 100.0 156.8 .. .. .. .. ..
Finance .. .. .. 7.2 3.0 7.0 .. .. .. .. ..
Business activities .. .. .. 7.9 0.5 2.0 .. .. .. .. ..
Real estate .. .. .. 3.6 0.1 1.2 .. .. .. .. ..
Other business activities .. .. .. 4.3 0.4 0.8 .. .. .. .. ..
Education .. .. .. - 0.1 - .. .. .. .. ..
Health and social services .. .. .. 0.5 0.6 0.8 .. .. .. .. ..
Human health activities .. .. .. 0.5 0.6 0.8 .. .. .. .. ..
Community, social and personal service activities .. .. .. 1.6 2.8 1.4 .. .. .. .. ..
Unspecified .. .. .. - - 0.1 - 0.1 .. .. .. .. ..
Source: Bank of Tanzania, unpublished.

United Republic of Tanzania
671
Table 6. FDI flows in the host economy, by geographical origin, 1996-2006 (Millions of dollars)
Region / economy 1996 1997 1998 1999 2000 2001 2002 2003 2004 2005 2006
Total world .. .. ..1
058.3 282.0 467.0 .. .. .. .. ..
Developed countries .. .. .. 441.6 128.1 245.4 .. .. .. .. ..
Europe .. .. .. 91.2 65.4 187.1 .. .. .. .. ..
European Union .. .. .. 76.5 32.9 157.0 .. .. .. .. ..France .. .. .. 13.2 2.3 2.2 .. .. .. .. ..Luxembourg .. .. .. 0.6 - 0.1 5.7 .. .. .. .. ..Netherlands .. .. .. 8.9 1.6 58.5 .. .. .. .. ..Sweden .. .. .. 3.5 4.1 5.4 .. .. .. .. ..United Kingdom .. .. .. 50.3 25.0 82.8 .. .. .. .. ..
Other developed Europe .. .. .. 14.7 32.5 30.1 .. .. .. .. ..Isle of Man .. .. .. 0.1 - 1.6 .. .. .. .. ..Norway .. .. .. 5.6 1.7 4.7 .. .. .. .. ..Switzerland .. .. .. 9.0 30.8 23.8 .. .. .. .. ..
North America .. .. .. 188.4 27.8 49.3 .. .. .. .. ..Canada .. .. .. 155.8 - 21.5 .. .. .. .. ..United States .. .. .. 32.6 27.8 27.8 .. .. .. .. ..
Other developed countries .. .. .. 138.1 4.0 3.9 .. .. .. .. ..Australia .. .. .. 138.1 4.0 3.9 .. .. .. .. ..
Developing economies .. .. .. 324.6 151.1 211.5 .. .. .. .. ..
Africa .. .. .. 298.2 145.0 201.4 .. .. .. .. ..Ghana .. .. .. 164.3 - 1.5 .. .. .. .. ..Kenya .. .. .. 35.4 6.5 14.2 .. .. .. .. ..Mauritius .. .. .. 30.6 4.6 3.7 .. .. .. .. ..
South Africa .. .. .. 53.3 132.4 179.3 .. .. .. .. ..Swaziland .. .. .. 8.1 1.2 2.8 .. .. .. .. ..Uganda .. .. .. 1.8 0.3 - .. .. .. .. ..
Latin America and the Caribbean .. .. .. 14.1 - - .. .. .. .. ..Panama .. .. .. 14.1 - - .. .. .. .. ..
Asia .. .. .. 12.3 6.1 10.1 .. .. .. .. ..West Asia .. .. .. 10.9 2.7 5.0 .. .. .. .. ..
Kuwait .. .. .. - 2.7 2.7 .. .. .. .. ..Lebanon .. .. .. 10.9 - 1.0 .. .. .. .. ..Oman .. .. .. - - 1.3 .. .. .. .. ..
South, East and South-East Asia .. .. .. 1.4 3.4 5.1 .. .. .. .. ..China .. .. .. 0.9 1.9 1.8 .. .. .. .. ..India .. .. .. 0.5 1.5 1.9 .. .. .. .. ..Taiwan Province of China .. .. .. - - 1.4 .. .. .. .. ..
Unspecified .. .. .. 292.1 2.8 10.1 .. .. .. .. .. Source: Bank of Tanzania, unpublished.

World Investment Directory Volume X Africa 2008
672
Table 9. FDI flows abroad, by geographical destination, 1995 - 2006(Millions of dollars)
Reporting countries 1995 1996 1997 1998 1999 2000 2001 2002 2003 2004 2005 2006
Australia - - - - - - - 1.0 - - - - -
Belgium/Luxembourg - - 1.3 - - - - - - - - - -
Bulgaria - 0.0 - - - - - - - 0.0 - 0.1
China - - - - - - - - - - - -
Germany - - 2.9 - 2.3 - - 1.8 - 1.1 - - 1.3
Sweden - - - - - - - 0.2 - - - - 0.2 Source: UNCTAD. FDI / TNC database.
Note: Data is based on the information reported by the economies listed above.
Table 15. FDI stocks abroad, by geographical destination, 1995 - 2006(Millions of dollars)
Reporting countries 1995 1996 1997 1998 1999 2000 2001 2002 2003 2004 2005 2006
Bulgaria - - - - - - 0.0 - - 0.0 - 0.0 0.1
Malawi - - - - - 0.6 - - - 0.6 - - Source: UNCTAD. FDI / TNC database.
Note: Data is based on the information reported by the economies listed above.

United Republic of Tanzania
673
Table 11. FDI stocks in the host economy, by industry, 1996-2006
(Millions of dollars)
Sector / industry 1996 1997 1998 1999 2000 2001 2002 2003 2004 2005 2006
Total .. .. 3 386 2 419 3 038 3 777 .. .. .. .. ..
Primary .. .. 1 347 972 1 087 1 309 .. .. .. .. ..
Agriculture, hunting, forestry and fishing .. .. 211 154 273 252 .. .. .. .. ..
Agriculture and hunting .. .. - 141 233 225 .. .. .. .. ..
Growing of crops .. .. - 141 223 217 .. .. .. .. ..
Farming of animals .. .. - 0 10 9 .. .. .. .. ..
Forestry and Fishing .. .. - 8 3 4 .. .. .. .. ..
Fishing, operation of fish hatcheries and fish farms .. .. - 8 3 4 .. .. .. .. ..
Mining, quarrying and petroleum .. .. 1 136 818 814 1 057 .. .. .. .. ..
Mining and quarrying .. .. 1 136 818 814 1 057 .. .. .. .. ..
Secondary .. .. 814 502 1 032 1 265 .. .. .. .. ..
Food, beverages and tobacco .. .. - 302 424 524 .. .. .. .. ..
Food products and beverages .. .. - 169 299 413 .. .. .. .. ..
Chemicals and chemical products .. .. - 32 154 163 .. .. .. .. ..
Machinery and equipment .. .. - 17 3 4 .. .. .. .. ..
Other manufacturing .. .. - 151 450 574 .. .. .. .. ..
Tertiary .. .. 1 123 945 920 1 202 .. .. .. .. ..
Electricity, gas and water .. .. 71 37 37 127 .. .. .. .. ..
Construction .. .. 186 137 79 101 .. .. .. .. ..
Trade .. .. 503 166 103 93 .. .. .. .. ..
Hotels and restaurants .. .. - 352 275 307 .. .. .. .. ..
Transport, storage and communications .. .. 96 50 145 285 .. .. .. .. ..
Transport and storage .. .. - 23 53 46 .. .. .. .. ..
Post and communications .. .. - 27 92 239 .. .. .. .. ..
Finance .. .. 133 173 177 180 .. .. .. .. ..
Business activities .. .. 133 25 42 45 .. .. .. .. ..
Real estate .. .. - 3 20 21 .. .. .. .. ..
Other business activities .. .. - 22 22 25 .. .. .. .. ..
Education .. .. - 0 1 1 .. .. .. .. ..
Health and social services .. .. - 1 54 54 .. .. .. .. ..
Human health activities .. .. - 1 54 54 .. .. .. .. ..
Community, social and personal service activities .. .. 3 4 7 8 .. .. .. .. ..
Unspecified .. .. 102 - 0 0 1 .. .. .. .. ..
Source: Bank of Tanzania, unpublished.

World Investment Directory Volume X Africa 2008
674
Table 12. FDI stocks in the host economy, by geographical origin, 1998-2001 (Millions of dollars)
Region / economy 1998 1999 2000 2001 Region / economy 1998 1999 2000 2001
Total world 3 353 2 419 3 038 3 777 Ghana 543 419 150 175Developed countries 2 073 1 487 1 847 2 162 Kenya 110 56 114 276
Europe 1 395 945 1 000 1 305 Malawi 11 - - -European Union 1 257 878 841 1 163 Mauritius 144 89 176 171
Austria 1 - - - Seychelles 2 - - -Belgium 2 - - - South Africa 66 140 529 749Cyprus 0.1 - - - Swaziland 0 - - -Denmark 49 48 36 36 Uganda 1 5 2 2Finland 0.3 - - - Zambia 9 - - -France 62 47 21 34 Zimbabwe 1 - - -
Germany 72 51 22 53Latin America and the
Caribbean 66 - - -Greece 2 - - - Central America 1 - - -Ireland 3 - - - Panama 1 - - -Italy 139 58 58 64 Caribbean and other America 65 - - -Luxembourg 17 27 49 80 Bahamas 2 - - -Netherlands 218 117 47 105 Bermuda 61 - - -Sweden 50 34 25 30 Dominica 0.1 - - -United Kingdom 642 495 569 615 US Virgin Islands 2 - - -
Other developed Europe 138 67 159 142 Asia 129 68 124 128Gibraltar 0.1 - - - West Asia 12 3 18 17Liechtenstein 1 - - - Kuwait 4 - - -Isle of Man 13 - - - Lebanon 0.1 - - -Norway 65 37 32 26 Qatar 0.1 - - -Switzerland 58 30 128 116 Saudi Arabia 4 - - -
North America 448 346 589 605 United Arab Emirates 5 3 18 17
Canada 198 184 407 431South, East and South-East
Asia 116 65 106 111United States 250 162 182 174 China 20 11 23 24
Other developed countries 231 181 234 222 India 10 6 11 15Australia 218 178 43 50 Korea, Republic of 2 - - -Japan 13 4 191 172 Malaysia 83 49 72 72
Developing economies 1 200 805 1 113 1 514 Pakistan 1 - - -Africa 924 738 989 1 386 Singapore 0.2 - - -
North Africa 7 - - - Sri Lanka 0.1 - - -Egypt 3 - - - Thailand 1 - - -Libyan Arab Jamahiriya 5 - - - South-East Europe and the CIS 2 2 17 14Sudan 0.1 - - - Russian Federation 1 2 17 14
Other Africa 886 709 970 1 373 Yugoslavia (former) 0.4 - - -Côte d'Ivoire 1 - - - Unspecified 77 124 61 87
Source: Bank of Tanzania, unpublished.

United Republic of Tanzania
675
Tables 22 and 34. The number and employees of affiliates of foreign TNCs in the host economy, by industry, 1990-2000
(Number of affiliates and thousands of employees)
Sector/industry Number Employees
Total 492 80.554
Primary 73 30.646
Agriculture, hunting, forestry and fishing 60 29.766
Mining, quarrying and petroleum 13 0.88
Secondary 238 32.039
Food, beverages and tobacco 75 10.091
Textiles, clothing and leather 14 4.038
Wood and wood products 12 0.78
Publishing, printing and reproduction of recorded media 3 0.283
Coke, petroleum products and nuclear fuel 1 0.11
Chemicals and chemical products 13 1.626
Rubber and plastic products 23 3.268
Non-metallic mineral products 5 0.492
Metal and metal products 18 2.175
Machinery and equipment 4 0.138
Electrical and electronic equipment 10 0.886
Motor vehicles and other transport equipment 6 0.792
Other manufacturing 54 7.36
Tertiary 181 17.869
Electricity, gas and water 2 0.11
Construction 29 2.989
Trade 1 0.017
Hotels and restaurants 38 4.066
Transport, storage and communications 41 3.842
Finance 19 0.807
Business activities 23 4.38
Education 3 0.162
Health and social services 2 0.016
Community, social and personal service activities 3 0.153
Other services 20 1.327
Source: Tanzania Investment Centre, unpublished data.Note: The data refer to the number of projects and number of employees in projects approved during the period September 1990 until June 2000.

World Investment Directory Volume X Africa 2008
676
Table 23a. The number of affiliates of foreign TNCs in the host economy, by geographical origin, 1990-2000
Region/economy 1990-2000 Region/economy 1990-2000
Total world 603 Rwanda 2
Developed countries 316 Sierra Leone 1
Europe 242 Somalia 2
European Union 220 South Africa 32
Austria 5 Uganda 5
Belgium 2 United Republic of Tanzania 1
Cyprus 1 Zimbabwe 4
Denmark 2 Latin America and the Caribbean 3
Finland 2 Central America 1
France 9 Panama 1
Germany 23 Caribbean and other America 2
Greece 7 Bahamas 1
Ireland 2 Virgin Islands 1
Italy 13 Asia 142
Netherlands 19 West Asia 32
Portugal 1 Iran, Islamic Republic of 2
Spain 4 Kuwait 2
Sweden 9 Lebanon 17
United Kingdom 121 Oman 4
Other developed Europe 22 Saudi Arabia 2
Isle of Man 2 United Arab Emirates 1
Norway 6 Yemen 3
Switzerland 14 Unspecified West Asia 1
North America 58 South, East and South-East Asia 110
Canada 26 Bangladesh 1
United States 32 China 28
Other developed countries 16 Hong Kong, China 5
Australia 7 India 38
Israel 2 Indonesia 1
Japan 6 Malaysia 2
New Zealand 1 Pakistan 14
Developing economies 274 Philippines 1
Africa 129 Korea, Republic of 11
North Africa 4 Singapore 5
Egypt 2 Sri Lanka 3
Libyan Arab Jamahiriya 2 Thailand 1
Other Africa 125 South-East Europe and the CIS 10
Ethiopia 3 South-East Europe 3
Ghana 3 Bulgaria 2
Kenya 62 TFYR of Macedonia 1
Mauritania 3 CIS 7
Mauritius 6 Russian Federation 7
Mozambique 1 Unspecified 3
Source: Tanzania Investment Centre, unpublished data.Notes: The data refer to the number of projects approved during the period September 1990 until June 2000. Figures are not comparable to those in Table 22 due to double-counting in the case of joint ventures.

United Republic of Tanzania
677
Table 23b. The number of affiliates of foreign TNCs in the host economy, by geographical origin, 1994-2005
Economy 1994 1995 1996 1997 1998 1999 2000 2001 2002 2003 2004 2005
Germany 5 9 11 11 9 6 7 7 3 .. .. ..
Italy .. 2 .. 2 .. .. .. .. .. .. .. ..
Republic of Korea .. .. 1 4 4 5 5 5 5 5 7 8
United States 6 4 5 5 5 4 4 4 5 5 2 ..
Source: UNCTAD, FDI/TNC database.
Note: Data are based on information reported by the economies listed above.
Tables 30, 40 and 50. Assets, wages and salaries and value added of affiliates of United States TNCs in the United Republic of Tanzania, 1994-2005
(Millions of dollars)
Table no./Variable 1994 1995 1996 1997 1998 1999 2000 2001 2002 2003 2004 2005
30. Assets .. 35.0 158.0 167.0 175.0 86.0 105.0 68.0 90.0 93.0 .. ..
40. Wages and salaries 2.0 2.0 9.0 9.0 6.0 .. 4.0 4.0 5.0 6.0 .. ..
50. Value added a 4.0 .. 75.0 72.0 64.0 .. .. 2.0 6.0 5.0 .. ..
Source: UNCTAD, FDI/TNC database.
Note: Data are based on information reported by the United States. a Data refer to majority-owned affiliates only.
Table 35. Employment of affiliates of foreign TNCs in the host economy, by geographical origin, 1994-2005
(Thousands of employees)
Economy 1994 1995 1996 1997 1998 1999 2000 2001 2002 2003 2004 2005
Italy .. 0.9 .. 0.9 .. .. .. .. .. .. .. ..
Sweden a .. .. 1.4 0.2 .. .. .. .. .. .. .. ..
United States 1.0 0.8 1.9 1.8 1.5 .. 0.7 0.7 0.9 0.9 .. ..
Source: UNCTAD, FDI/TNC database.
Note: Data are based on information reported by the economies listed above.a Data refer to majority-owned affiliates only.
Table 45. Sales of affiliates of foreign TNCs in the host economy, by geographical origin, 1994-2005
(Millions of dollars)
Economy 1994 1995 1996 1997 1998 1999 2000 2001 2002 2003 2004 2005
Italy .. 49.4 .. 47.2 .. .. .. .. .. .. .. ..
United States 88.0 21.0 77.0 85.0 75.0 .. 48.0 45.0 89.0 99.0 .. ..
Source: UNCTAD, FDI/TNC database.
Note: Data are based on information reported by the economies listed above.

World Investment Directory Volume X Africa 2008
678
Table 86. The largest home-based TNCs, 2007 (Billions of dollars)
Company Industry Sales
A. Industrial
Tanzania Breweries Consumer goods/brewers 0.22 a
B. Tertiary
Vodacom Tanzania Telecommunications 0.21 .. .. ..
C. Finance and Insurance Assets
.. .. .. Source: Jeune Afrique Hors-serie No. 14, 2007.a 2004.
Table 87. Largest affiliates of home-based TNCs, 2007
(Millions of dollars and number)
Company Name Host Economy Industry Sales Employees
A. Industrial
.. .. .. .. .. B. Tertiary
Radhe-Shyam Enterprises Ltd United Kingdom Wholesale trade .. ..
C. Finance and insurance Assets Employees
.. .. .. .. .. Source: Who Owns Whom database (https://solutions.dnb.com/wow), retrieved January 2008.

United Republic of Tanzania
679
Table 88. Largest affiliates of foreign TNCs in the host economy, 2007
(Millions of dollars and number)
Company Home economy Industry Sales Employees
A. Industrial
Unilever Tea Tanzania Ltd United Kingdom Food, beverages and tobacco 14.4 5 500
Body Care Ltd United States Chemicals and chemical products .. 1 000
City Water Services Ltd United Kingdom Electricity, gas and water .. 750
Karibu Textile Mills Limited Mauritius Textiles and clothing .. 250
Kibo Breweries Ltd Kenya Food, beverages and tobacco .. 250
Matsushita Electric Company (E A) Ltd Japan Electrical and electronic equipments .. 184
Brooke Bond Tanzania Ltd United Kingdom Food, beverages and tobacco .. 150
Treadsetters Tyres (T) Ltd Kenya Rubber and plastic products .. 125
Sadolin Paints Tanzania Limited Oman Chemicals and chemical products .. 65
Tri Clover Industries ( T ) Limited Kenya Chemicals and chemical products .. 65
Geita Gold Mine (T) Ltd Ghana Mining and quarrying .. 20
B. Tertiary
Regional Air Services Kenya Air transport 2.2 31
Tri Telecommunications Ltd Malaysia Telecommunications .. 215
D T Dobie & Company (Tanzania) Ltd France Wholesale trade .. 150
Mic Tanzania Ltd Luxembourg Wholesale trade .. 150
Pricewaterhousecoopers United States Other services .. 150
T P C Ltd Mauritius Agriculture and hunting .. 120
Gailley & Roberts (T) Ltd United Kingdom Wholesale trade .. 60
Rentokil Initial Tanzania Ltd United Kingdom Other business activities .. 45
Desbro Tanzania Ltd Kenya Wholesale trade .. 30
Service And Computer Industries Ltd Kenya Wholesale trade .. 30
Alliance Ginneries Ltd Kenya Agriculture and hunting .. 7
Glaxo Wellcome Tanzania Ltd United Kingdom Wholesale trade .. 4
C. Finance and Insurance Asset Employees
Citibank Tanzania Ltd United States Finance 13.4 104
Barclays Bank (T) Ltd United Kingdom Finance 2.1 42
Standard Chartered Bank Tanzania Ltd United Kingdom Finance 14.1 224
National Bank Of Commerce Limited South Africa Finance .. 470
Aon Tanzania Limited United States Insurance .. 20
Source: Who Owns Whom database (https://solutions.dnb.com/wow), retrieved January 2008.

World Investment Directory Volume X Africa 2008
680
C. Legal frameworks for transnational corporations
The United Republic of Tanzania has adopted quite a number of national, bilateral and multilateral legal instruments to regulate the activities of transnational corporations and foreign direct investors. The following key instruments are applicable in the country:
I. National framework
Patents Rules (Schedule to Decree No. 11 of 1930, as amended by Decree No. 27 of 1937, s.5) (in The Laws of Zanzibar). Source: WIPO (http://www.wipo.org).
Zanzibar: Patents Decree, cap. 157 (11 of 1930, cap. 90, 1934, 27 of 1935, s.5, 11 of 1958) (in The Laws of Zanzibar). Source: WIPO (http://www.wipo.org).
Zanzibar Trade Marks Decree, cap. 159 (15 of 1930, cap. 89, 1934, G.N. 47 of 1955, 123 of 1955, 74 of 1956) (in The Laws of Zanzibar); Source: WIPO (http://www.wipo.org).
Zanzibar Trade Marks Rules (G.N. 52 of 1932, 47 of 1955) (in The Laws of Zanzibar). Source: WIPO (http://www.wipo.org).
Tanzania (Protection) Ordinance of 1936, cap. 219, Ord. 1936 No. 2 (F) PI 1938, 46; In the process of drafting new Industrial Designs Legislation for 2002. Source: WIPO (http://www.wipo.org).
Zanzibar: United Kingdom Designs (Protection) Decree, cap. 158 (27 of 1937) (in The Laws of Zanzibar). Source: WIPO (http://www.wipo.org).
Severance Allowance Act: Cap 487 (No. 57 of 1962) (under review). Source: Tanzania Investment Centre, http://www.tic.co.tz
Business Licensing Act (No. 25 of 1972) (under review). Source: Tanzania Investment Centre, http://www.tic.co.tz
Income Tax Act, 1973. Source: Tanzania Investment Centre, http://www.tic.co.tz
Income Tax Act No. 33 of 22 November 1973. Source: Tanzania Investment Centre, http://www.tic.co.tz
The Standards Act of 1975. Source: WIPO (http://www.wipo.org).
Customs Tariff Act 1976. Source: Tanzania Investment Centre, http://www.tic.co.tz
Sales Tax Act, 1976. Source: Tanzania Investment Centre, http://www.tic.co.tz
Customs Tariff (Amendment) Act (No. 1 of 1976). Source: Tanzania Investment Centre, http://www.tic.co.tz
Constitution of the United Republic of Tanzania, 1977. Source: Tanzania Investment Centre, http://www.tic.co.tz

United Republic of Tanzania
681
Exploration and Production Act, 1980. Source: Tanzania Investment Centre, http://www.tic.co.tz.
Petroleum (Exploration and Production) Act, 1980 (Act No.27 of 1980). Source: Tanzania Investment Centre, http://www.tic.co.tz.
National Environment Act, 1983 (Act No.19 of 1983). Source: Tanzania Investment Centre, http://www.tic.co.tz
Tanzania Trade and Service Marks Act No. 12 of 1986. Source: WIPO (http://www.wipo.org).
Zanzibar Investment Promotion Act, 1986 (Act No.3 of 1986). Source: Tanzania Investment Centre, http://www.tic.co.tz.
The Tanzania Commission for Science and Technology Act of 1986. Source: WIPO (http://www.wipo.org).
The Patents Act No. 1 of 1987 as amended by Acts Nos. 13 and 18 of 1991. Source: WIPO (http://www.wipo.org).
Trade and Services Marks Act, 1987 (Act No.2 of 1987). Source: Tanzania Investment Centre, http://www.tic.co.tz
Banking and Financial Institutions Act 1991 (No. 12 of 1991). Source: Tanzania Investment Centre, http://www.tic.co.tz
Foreign Exchange Act, 1992 (No. 1 of 1992). Source: Tanzania Investment Centre, http://www.tic.co.tz.
Public Corporations Act, 1992 (Act No.2 of 1992). Source: Tanzania Investment Centre, http://www.tic.co.tz
Capital Markets and Securities Act, 1994 (No. 5 of 1994). Source: Tanzania Investment Centre, http://www.tic.co.tz
The Patents Regulations G.N. 190 of 1994. Source: WIPO (http://www.wipo.org).
Immigration Act, 1995 (No. 7 of 1995). Source: Tanzania Investment Centre, http://www.tic.co.tz
Bank of Tanzania (BOT) Act 1995. Source: Tanzania Investment Centre, http://www.tic.co.tz
Value Added Tax Act, 1997 (No. 24 of 1997).Source: Tanzania Investment Centre, http://www.tic.co.tz
Tanzania Investment Act, 1997 (No. 26 of 1997). Source: Tanzania Investment Centre, http://www.tic.co.tz.
Financial Laws (Miscellaneous Amendments) Act, 1997 (Act No. 27 of 1997). Source: Tanzania Investment Centre, http://www.tic.co.tz
Mining Act, 1998 (No. 5 of 1998). Source: Tanzania Investment Centre, http://www.tic.co.tz

World Investment Directory Volume X Africa 2008
682
The Land Act, 1999 (No. 4 of 1999). Source: Tanzania Investment Centre, http://www.tic.co.tz
The Village Land Act, 1999 (No. 5 of 1999).Source: Tanzania Investment Centre, http://www.tic.co.tz
Copyright and Neighbouring Rights Act No. 7 of December 1999. Source: WIPO (http://www.wipo.org).
The copyright and Neighbouring Rights Act, 1999. Source: Government of Tanzania.
Tanzania Trade and Service Marks Regulations G.N. 40 of March 2000. Source: WIPO (http://www.wipo.org).
Copyright and Neighbouring Rights Regulations G.N. No. 214 A, June 2000. Source: WIPO (http://www.wipo.org).
The Sugar Industry Act, 2001. Intended to regulate the sugar industry. Source: Government of Tanzania.
Companies Act, 2002. Source: Government of Tanzania.
The Gaming Act, 2003. This law regulates the Gaming business. Source: Government of Tanzania.
Special Economic Zones Act, 2006 (Act No. 2/06). Source: http://www.parliament.go.tz/bunge/PAMS_LS.asp?Menu=3&page=2&fqry=&docyear=All
Business Names (Registration) Ordinance, Cap. 213. Source: Tanzania Investment Centre, http://www.tic.co.tz
Arbitration Ordinance, Cap. 15. Source: Tanzania Investment Centre, http://www.tic.co.tz
Law of Contract Ordinance, Cap 433. Source: Tanzania Investment Centre, http://www.tic.co.tz
Employment Ordinance Act: Cap 366 (under review). Source: Tanzania Investment Centre, http://www.tic.co.tz
Security of Employment Act: Cap 574, No. 62 (under review). Source: Tanzania Investment Centre, http://www.tic.co.tz
Workmen’s Compensation Ordinance: Cap 263 (under review). Source: Tanzania Investment Centre, http://www.tic.co.tz
II. International Framework
A. The United Republic of Tanzania is a party to the following multilateral and regional
instruments:
Convention on the Recognition and Enforcement of Foreign Arbitral Awards of 1958, which entered into force on 7th June 1959.

United Republic of Tanzania
683
Convention on the Settlement of Investment Disputes between States and Nationals of other States of 1965. Entered into force on 14 October 1966
Convention Establishing the Multilateral Investment Guarantee Agency of 1985, entered into force on 12 April 1988.
Fourth ACP - EEC Convention (Lome IV) of 1989, entered into force on 1st March 1990.
Charter on a Regime of Multinational Industrial Enterprises (MIEs) in the Preferential Trade Area for Eastern and Southern African States (PTA), signed on 21 November 1990, entered into force August 1995. Source: Preferential Trade Area for Eastern ans Southern African States: Report of the Sixteenth Meeting of the Council of Ministers, 17-19 november, 1990, Mbabane, Swaziland (PTA/CM/XVI/2)
Southern Africa Development Community (SADC), signed on 17 August, 1992.Source: http://www.sadc.int/about_sadc/history.php.
Treaty Establishing the Market for Eastern and Southern Africa (COMESA), 1993.
Paris Convention for the Protection of Industrial Property of 1883 (Revised at Brussels in 1900, Washington in 1911, The Hague in 1925, London in 1934, Lisbon in 1958 and Stockholm in 1967, and as amended in 1979). Signed in 1994.
Marrakesh Agreement Establishing the World Trade Organisation of 15 April 1994. Entered into force on 1 January 1995. Agreement on Trade-Related Investment Measures. General Agreement on Trade in Services. Agreement on Trade Related Aspects of Intellectual Property Rights.
Treaty for the Establishment of the East African Community, 30 November 1999.
Partnership Agreement between the Members of The African, Caribbean and Pacific Group of States, of the one part and the European Community and its member states, of the other part signed in Cotonou, Benin on 23 June 2000.
B. Bilateral treaties
1. Bilateral investment treaties for the protection and promotion of investments: Germany 1965, Switzerland 1965, Netherlands 1970, United Kingdom 1994, Egypt 1997, Korea, Republic of 1998, Denmark 1999, Sweden 1999, Finland 2001, Italy 2001, Netherlands 2001, Zimbabwe 2004, Switzerland 2004.
2. Bilateral treaties for the avoidance of double taxation: South Africa 1959, Zambia 1968, Italy 1973, Denmark 1976, Finland 1976, Norway 1976, Sweden 1976, India 1979, Canada 1995.

World Investment Directory Volume X Africa 2008
684
D. Sources of information
Official
Bank of Tanzania (www.bot-tz.org).
Secondary
Business Map (2000). "Tanzania – virgin territory", in SADC Investor Survey – Complex Terrain
(Johannesburg: Business Map) pp. 39-40.
Economist Intelligence Unit (EIU) Ltd., (various years). Country Profile: Tanzania (London: EIU).
_____________(various years). Country Report: Tanzania (London: EIU).
Hyden, G. (ed.) (1980). Beyond Ujamaa in Tanzania: Underdevelopment and an Uncaptured Peasantry
(London: Heinemann).
International Monetary Fund (IMF) (2006). IMF's Sub-Saharan Africa Regional Economic Outlook, March 10, 2006. (Washington D.C.: IMF).
Kahma, C., T. L. Maliyamkono and S. Wells (1986). The Challenge for Tanzania's Economy (London: Heinemann).
Mans, D. (1994). Tanzania: resolute action, in I Husain and R Faruqee (eds), Adjustment in Africa: Lessons from Country Case Studies (Washington, D.C.: World Bank).
Ogunleye, Eric Kehinde (2008) "Exchange rate volatility and foreign direct investment inflows in selected Sub-Saharan African Countries" (PhD Thesis, University of Ibadan).
Sarris, A. H. and R. van den Brink (1993). Economic Policy and Household Welfare during Crisis and
Adjustment in Tanzania (New York: New York University Press).
Tanzania: National Investment (Promotion and Protection) Act No. 10, 1990 (www.ipanet.net).
Soderbom, M. and F. Teal (2004). "Size and Efficiency in Africa Manufacturing firms: Evidence from Firm-Level Panel Data." Journal of Development Economics, 73. pp 369 - 394.
United Nations Conference on Trade and Development (UNCTAD) (2002a). FDI in Least Developed
Countries at a Glance (Geneva: UNCTAD) (www.unctad.org/en/subsites/dite/LDCs/ pdfs/Countries/Tanzania.pdf).
_____________(2002b). Investment Policy Review: Tanzania (Geneva: UNCTAD/ITE/IPC/Misc.9).
_____________(2005a). Investor-Disputes Arising from Investment Treaties: A Review. UNCTAD Series of International Investment Policies for Development (UNCTAD/ITE/IIT/2005/4).
_____________(2005b). A Survey of Support by Investment Promotion Agencies to Linkages. Advisory Studies No. 18 (UNCTAD/ITE/IPC/2005/12).
_____________(2005c). FDI in least developed countries at a glance: 2005/2006
(UNCTAD/ITE/IIA/2005/17).
United States Trade Representative (2006). 2006 Comprehensive Report on U.S. Trade and Investment
Policy Toward Sub-Saharan Africa and Implementation of the Africa Growth and Opportunity Act:
The Sixth of Eight Annual Reports, May 2006. (Washington D.C.: US Government).
World Bank (2004). Improving Enterprise Performance and Growth in Tanzania. November 2004.
World Bank/International Finance Corporation (2007). Doing Business 2008 Tanzania (Washington D.C.: The World Bank Group).

Zambia
685
Zambia
A. Definitions and sources of data
In Zambia, the Investment Act of 1993 (Act No. 39 of 26 August 1993) defines investment generally. The act does not distinguish between foreign direct investment (FDI) and the other types of investment. The Act defines investment as "the contribution of capital, in cash or in kind, by an investor to a new business enterprise, to the expansion or rehabilitation of an existing enterprise or purchase of an existing enterprise from the state". The Bank of Zambia collects data on FDI in Zambia. The International Monetary Fund also provides FDI data in its balance-of-payments statistics. The institution responsible for promoting and facilitating investment in the country is the Zambian Investment Center. The center was established under the Investment Act of 1991, which was replaced by the Investment Act of 1993. The center is designed to be a one-stop agency. All foreign investments have to be approved by the center.
Zambia's natural resource balance includes copper and some deposits of cobalt, both of which are open to foreign investors. Since the early 1920s copper has been mined commercially. Alongside these base metals, precious and semi-precious gems (emeralds, amethyst, aquamarine, tourmaline, among others) have been mined in around four hundred operations. Zambia is also privatizing a large part of its State-owned enterprises without much restriction on foreign participation. The Government plans to break the State-owned Zambia Electricity Supply Company (Zesco) into separate energy generation, distribution and transmission utilities, and place them all under private management. Other privatization plans include the state telecoms company, Zambia Telecom (Zamtel), the Zambia National Commercial Bank (Zanaco) and the Kafue Textiles and Nitrogen Chemicals, Zambia. The Government has also begun liberalizing energy and transport sectors.
Zambia signed to the Convention on the Settlement of Investment Disputes between State and Nationals of other States on 17 June 1970 and aims at furthering its integration into the global economy and so has joined many market access schemes. It is a member of the Southern Africa Development Community, Common Market for Eastern and Southern Africa, the African Union and New Partnership for Africa's Development. It is also eligible for the Cotonou Agreement for renegotiating the partnership agreement between the European Union and the African, Caribbean and Pacific countries, and the United States' market access arrangement for African countries - the African Growth and Opportunity Act. Zambia is a member of the World Trade Organization.

World Investment Directory Volume X Africa 2008
686
B. Statistics on FDI and the operations of TNCs
Table 1. Summary of FDI (Millions of dollars)
Variable Inward Outward
1. FDI flows, 2003-2006 (annual average) 316.6 -
2. FDI flows as a percentage of GFCF, 2003-2006 (annual average) 20.8 -
3. FDI stocks, 2006 3 780 -
4. FDI stocks as a percentage of GDP, 2006 34.5 0.0
Source: Based on tables 3 and 4 and UNCTAD, FDI/TNC database.
Table 3. FDI flows, by type of investment, 1980-2006 (Millions of dollars)
Inward investment Outward investment
Reinvested Reinvested Year Equity earnings Other Total Equity earnings Other Total
1980 - 61.8 - 61.8 .. .. .. ..1981 - - 38.4 - - 38.4 .. .. .. ..1982 - 39.0 - 39.0 .. .. .. ..1983 - 25.7 - 25.7 .. .. .. ..1984 - 17.2 - 17.2 .. .. .. ..1985 - 51.5 - 51.5 .. .. .. ..1986 - 28.3 - 28.3 .. .. .. ..1987 - 74.5 - 74.5 .. .. .. ..1988 - 93.3 - 93.3 .. .. .. ..1989 - 15.2 135.1 163.6 .. .. .. ..1990 - 102.5 88.0 202.8 .. .. .. ..1991 - 20.4 3.2 34.3 .. .. .. ..1992 - - - 45.0 .. .. .. ..1993 - - - 314.4 .. .. .. ..1994 - - - 40.0 .. .. .. ..1995 - - - 97.0 .. .. .. ..1996 - - - 117.1 .. .. .. ..1997 197.4 - 10.0 207.4 .. .. .. ..1998 198.0 - - 198.0 .. .. .. ..1999 162.0 - - 162.8 .. .. .. ..2000 121.7 - - 121.7 .. .. .. ..2001 .. .. .. 71.7 .. .. .. ..2002 .. .. .. 82.0 .. .. .. ..2003 .. .. .. 172.0 .. .. .. ..2004 .. .. .. 364.0 .. .. .. ..2005 .. .. .. 380.0 .. .. .. ..2006 .. .. .. 350.4 .. .. .. ..
Source: UNCTAD, FDI/TNC database (www.unctad.org/statistics). Note: Data for inflows are based on information provided by the IMF for 1980-1989, Zambia Investment Center for 1990-1991 and 1993-2006, and World Bank for 1992.

Zambia
687
Table 4. FDI stocks, by type of investment, 1980-2006
(Millions of dollars)
Inward investment Outward investment
Reinvested Reinvested
Year Equity earnings Other Total Equity earnings Other Total
1980 .. .. .. 364.4 .. .. .. ..
1981 .. .. .. 326.0 .. .. .. ..
1982 .. .. .. 365.0 .. .. .. ..
1983 .. .. .. 390.7 .. .. .. ..
1984 .. .. .. 407.9 .. .. .. ..
1985 .. .. .. 459.4 .. .. .. ..
1986 .. .. .. 487.7 .. .. .. ..
1987 .. .. .. 562.2 .. .. .. ..
1988 .. .. .. 655.5 .. .. .. ..
1989 .. .. .. 819.1 .. .. .. ..
1990 .. .. .. 1 021.9 .. .. .. ..
1991 .. .. .. 1 056.2 .. .. .. ..
1992 .. .. .. 1 101.2 .. .. .. ..
1993 .. .. .. 1 415.6 .. .. .. ..
1994 .. .. .. 1 455.6 .. .. .. ..
1995 .. .. .. 1 552.6 .. .. .. ..
1996 .. .. .. 1 669.7 .. .. .. ..
1997 .. .. .. 1 877.1 .. .. .. ..
1998 .. .. .. 2 075.1 .. .. .. ..
1999 .. .. .. 2 237.9 .. .. .. ..
2000 .. .. .. 2 359.6 .. .. .. ..
2001 .. .. .. 2 431.3 .. .. .. ..
2002 .. .. .. 2 513.3 .. .. .. ..
2003 .. .. .. 2 685.3 .. .. .. ..
2004 .. .. .. 3 049.3 .. .. .. ..
2005 .. .. .. 3 429.3 .. .. .. ..
2006 .. .. .. 3 779.7 .. .. .. ..
Source: UNCTAD, FDI/TNC database (www.unctad.org/statistics). Data are estimated by accumulating inflows since 1970.

World Investment Directory Volume X Africa 2008
688
Table 5. FDI flows in the host economy, by industry, 1993-2004 (Millions of dollars)
Sector / industry 1993 1994 1995 1996 1997 1998 1999 2000 2001 2002 2003 2004
Total 314 159 194 .. .. .. .. .. .. .. .. ..Primary 89 72 53 .. .. .. .. .. .. .. .. ..
Agriculture, hunting, forestry and fishing 78 54 51 .. .. .. .. .. .. .. .. ..Mining, quarrying and petroleum 11 18 1 .. .. .. .. .. .. .. .. ..
Secondary 133 60 100 .. .. .. .. .. .. .. .. ..Tertiary 93 27 42 .. .. .. .. .. .. .. .. ..
Construction 10 2 4 .. .. .. .. .. .. .. .. ..Transport, storage and communications 75 19 13 .. .. .. .. .. .. .. .. ..Transport and storage 75 19 13 .. .. .. .. .. .. .. .. .. Supporting and auxiliary transport activities 16 7 6 .. .. .. .. .. .. .. .. ..Other services 8 6 25 .. .. .. .. .. .. .. .. ..
Source: Zambia Investment Center, unpublished.
Table 11. FDI stocks in the host economy, by industry, 1993-2004 (Millions of dollars)
Sector / industry 1993 1994 1995 1996 1997 1998 1999 2000 2001 2002 2003 2004
Total .. .. .. .. .. .. .. 851 1 085 .. .. ..Primary .. .. .. .. .. .. .. 288 367 .. .. ..
Agriculture, hunting, forestry and fishing .. .. .. .. .. .. .. 58 127 .. .. ..Mining, quarrying and petroleum .. .. .. .. .. .. .. 231 241 .. .. ..Mining and quarrying .. .. .. .. .. .. .. 231 241 .. .. ..
Secondary .. .. .. .. .. .. .. 87 144 .. .. ..Tertiary .. .. .. .. .. .. .. 442 560 .. .. ..
Electricity, gas and water .. .. .. .. .. .. .. 123 109 .. .. ..Construction .. .. .. .. .. .. .. 2 2 .. .. ..Trade .. .. .. .. .. .. .. 76 110 .. .. ..Hotels and restaurants .. .. .. .. .. .. .. 19 45 .. .. ..Transport, storage and communications .. .. .. .. .. .. .. 12 15 .. .. ..Finance .. .. .. .. .. .. .. 211 280 .. .. ..
Unspecified .. .. .. .. .. .. .. 33 14 .. .. .. Source: Zambia Investment Center, unpublished.

Zambia
689
Table 6. FDI flows in the host economy, by geographical origin, 1993-2004(Millions of dollars)
Economy 1993 1994 1995 1996 1997 1998 1999 2000 2001 2002 2003 2004
France .. .. 0.4 .. 0.3 .. .. .. .. .. .. ..Germany .. .. .. 2.6 .. .. .. .. -2.7 9.4 .. 11.2Sweden .. .. .. .. .. .. .. .. .. .. 0.9 14.4United States 11.0 1.0 2.0 3.0 .. .. 6.0 5.0 2.0 -5.0 -4.0 -8.0
Source: UNCTAD, FDI/TNC database. Note: Data are based on information reported by the economies listed above.
Table 9. FDI flows abroad, by geographical destination, 1993-2004(Millions of dollars)
Economy 1993 1994 1995 1996 1997 1998 1999 2000 2001 2002 2003 2004
China 0.03 .. .. .. .. .. .. .. .. .. .. ..United States .. .. .. .. .. .. .. -1.0 .. .. .. ..
Source: UNCTAD, FDI/TNC database. Note: Data are based on information reported by the economies listed above.
Table 12. FDI stocks in the host economy, by geographical origin, 1993-2004(Millions of dollars)
Region / economy 1993 1994 1995 1996 1997 1998 1999 2000 2001 2002 2003 2004
Total world .. .. .. .. .. .. .. 851 1 085 .. .. ..Developed countries .. .. .. .. .. .. .. 664 857 .. .. ..
European Union .. .. .. .. .. .. .. 528 710 .. .. ..France .. .. .. .. .. .. .. 16 28 .. .. ..Luxembourg .. .. .. .. .. .. .. 42 44 .. .. ..Netherlands .. .. .. .. .. .. .. 225 231 .. .. ..United Kingdom .. .. .. .. .. .. .. 246 407 .. .. ..Other developed Europe .. .. .. .. .. .. .. 32 23 .. .. ..
Switzerland .. .. .. .. .. .. .. 32 23 .. .. ..North America .. .. .. .. .. .. .. 61 79 .. .. ..
Canada .. .. .. .. .. .. .. 43 53 .. .. ..United States .. .. .. .. .. .. .. 18 26 .. .. ..
Other developed countries .. .. .. .. .. .. .. 29 21 .. .. ..Australia .. .. .. .. .. .. .. 29 21 .. .. ..
Developing economies .. .. .. .. .. .. .. 180 220 .. .. ..Africa .. .. .. .. .. .. .. 134 143 .. .. ..
Mauritius .. .. .. .. .. .. .. 2 4 .. .. ..South Africa .. .. .. .. .. .. .. 104 111 .. .. ..Zimbabwe .. .. .. .. .. .. .. 27 28 .. .. ..
Latin America and the Caribbean .. .. .. .. .. .. .. 6 25 .. .. ..Panama .. .. .. .. .. .. .. 1 20 .. .. ..Turks and Caicos .. .. .. .. .. .. .. 6 5 .. .. ..
Asia .. .. .. .. .. .. .. 39 51 .. .. ..China .. .. .. .. .. .. .. 37 48 .. .. ..India .. .. .. .. .. .. .. 3 4 .. .. ..
Unspecified .. .. .. .. .. .. .. 7 8 .. .. ..
Source: Zambia Investment Center, unpublished.
Table 15. FDI stock abroad, by geographical destination, 1993-2004(Millions of dollars)
Economy 1993 1994 1995 1996 1997 1998 1999 2000 2001 2002 2003 2004
United Rep. of Tanzania .. .. .. .. .. 8.7 .. .. .. .. .. ..United States .. .. .. .. .. .. .. -1.0 .. .. .. ..Source: UNCTAD, FDI/TNC database.
Note: Data are based on information reported by the economies listed above.
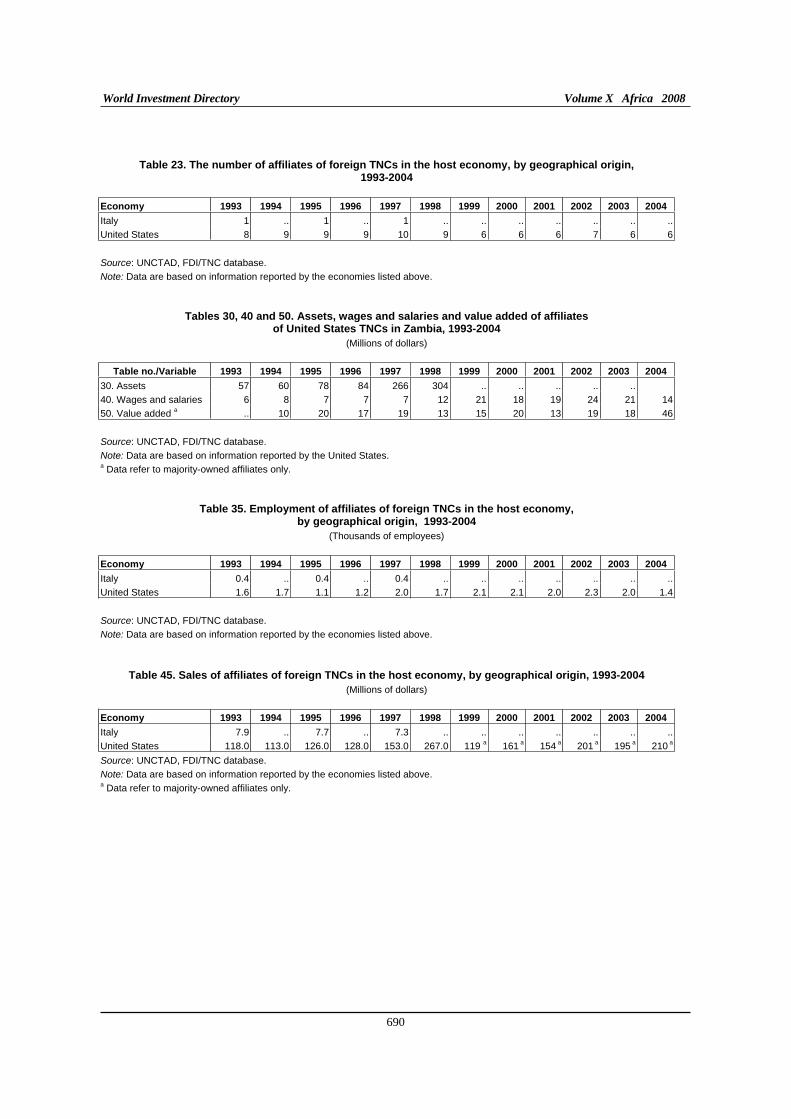
World Investment Directory Volume X Africa 2008
690
Table 23. The number of affiliates of foreign TNCs in the host economy, by geographical origin, 1993-2004
Economy 1993 1994 1995 1996 1997 1998 1999 2000 2001 2002 2003 2004
Italy 1 .. 1 .. 1 .. .. .. .. .. .. ..
United States 8 9 9 9 10 9 6 6 6 7 6 6
Source: UNCTAD, FDI/TNC database.
Note: Data are based on information reported by the economies listed above.
Tables 30, 40 and 50. Assets, wages and salaries and value added of affiliates of United States TNCs in Zambia, 1993-2004
(Millions of dollars)
Table no./Variable 1993 1994 1995 1996 1997 1998 1999 2000 2001 2002 2003 2004
30. Assets 57 60 78 84 266 304 .. .. .. .. ..
40. Wages and salaries 6 8 7 7 7 12 21 18 19 24 21 14
50. Value added a .. 10 20 17 19 13 15 20 13 19 18 46
Source: UNCTAD, FDI/TNC database.
Note: Data are based on information reported by the United States. a Data refer to majority-owned affiliates only.
Table 35. Employment of affiliates of foreign TNCs in the host economy,
by geographical origin, 1993-2004
(Thousands of employees)
Economy 1993 1994 1995 1996 1997 1998 1999 2000 2001 2002 2003 2004
Italy 0.4 .. 0.4 .. 0.4 .. .. .. .. .. .. ..
United States 1.6 1.7 1.1 1.2 2.0 1.7 2.1 2.1 2.0 2.3 2.0 1.4
Source: UNCTAD, FDI/TNC database.
Note: Data are based on information reported by the economies listed above.
Table 45. Sales of affiliates of foreign TNCs in the host economy, by geographical origin, 1993-2004
(Millions of dollars)
Economy 1993 1994 1995 1996 1997 1998 1999 2000 2001 2002 2003 2004
Italy 7.9 .. 7.7 .. 7.3 .. .. .. .. .. .. ..
United States 118.0 113.0 126.0 128.0 153.0 267.0 119 a 161 a 154 a 201 a 195 a 210 a
Source: UNCTAD, FDI/TNC database.
Note: Data are based on information reported by the economies listed above.a Data refer to majority-owned affiliates only.

Zambia
691
Table 86. Largest home-based TNCs, 2007 (Billions of dollars)
Company Industry Sales
A. Industrial
BP Zambia Petroleum exploration/refining/distribution 0.250 Zambian Breweries Consumer goods/brewers 0.168 Zambia Sugar Food products, beverages and tobacco 0.142 Zesco Electricity/gas/water 0.087
a
Chilanga Cement Building materials 0.085 B. Tertiary
.. .. .. C. Finance and Insurance Assets
.. .. ..
Source: Jeune Afrique Hors-serie No. 14, 2007.a 2004.
Table 87. Largest foreign affiliates of home-based TNCs, 2007 (Millions of dollars and number)
Company Host economy Industry Sales Employees
A. Industrial
.. .. .. .. .. B. Tertiary
.. .. .. .. .. C. Finance and Insurance Assets Employees
Africa Inter-Continental Insurance Services Ltd United Kingdom Insurance 0.407 3
Source: Who Owns Whom database (https://solutions.dnb.com/wow), retrieved January 2008.

World Investment Directory Volume X Africa 2008
692
Table 88. Largest affiliates of foreign TNCs in the host economy, 2007
(Millions of dollars and number)
Company Home economy Industry Sales Employees
A. Industrial
Northern Breweries South Africa Food, beverages and tobacco 3 717 ..
Mopani Copper Mines Plc Switzerland Mining and quarrying 820 8 200
Metal Fabricators Of Zambia Plc United States Metal and metal products 70 ..
Dunavant Zambia Ltd United States Textiles and clothing 20 900
National Breweries P L C United Kingdom Food, beverages and tobacco 14.1 400
Colgate Palmolive (Zambia) Ltd United States Other manufacturing 6.4 150
Barloworld Plascon South Africa Chemicals and chemical products 0.4 50
National Milling Corporation Limited United States Food, beverages and tobacco .. 400
Reckitt And Colman ( Zambia ) Ltd United Kingdom Chemicals and chemical products .. 200
Cheetah Zambia Ltd Netherlands Food, beverages and tobacco .. 50
Exide Zambia Ltd United Kingdom Motor vehicles and trailers .. 45
Austral Services Ltd United Kingdom Rubber and plastic products .. 8
B. Tertiary
Tata Zambia Limited India Wholesale trade 15 000 70
Philips Electrical Zambia Ltd Netherlands Wholesale trade 3 500 135
Caltex Oil Zambia Ltd United States Wholesale trade 104 60
Amiran Ltd United Kingdom Wholesale trade 26 50
CFAO Zambia Limited France Wholesale trade 26 100
Mpongwe Development Company United Kingdom Agriculture 16 4 000
Chibuluma Mines Plc South Africa Wholesale trade 11 550
Crown Cork Company (Zambia) Ltd United States Other business activities 2.2 70
Norconsult Z Ltd Norway Research and development 1.2 15
Commins Diesel Services Zambia Ltd United Kingdom Wholesale trade 1 165
Khal Amazi Ltd United Kingdom Agriculture and hunting 0.001 1 000
Consolidated Contractors Company (Kuwait) Kuwait Construction .. ..
Sandvik Mining & Construction Zambia Limited Sweden Wholesale trade .. ..
Sandvik Tamrock Zambia Ltd Sweden Wholesale trade .. ..
Securicor (Zambia) Ltd United Kingdom Other business activities .. 2 300
Galaun Holdings Ltd India Holding .. 2 000
Celtel Zambia Ltd United Kingdom Telecommunications .. 350
Dimon Zambia Limited United States Agriculture and hunting .. 350
Tredcor Zambia Limited Mauritius Wholesale trade .. 170
Data Care Ltd United Kingdom Wholesale trade .. 20
C. Finance and Insurance Assets Employees
Barclays Bank Of Zambia Limited United Kingdom Finance .. 1 000
Standard Chartered Bank Zambia Ltd United Kingdom Finance 154 500 a
Citibank Zambia Limited United States Finance 92 85 a
Aon Zambia Ltd. United States Insurance .. ..
Source: Who Owns Whom database (https://solutions.dnb.com/wow), retrieved January 2008. a 2006.

Zambia
693
C. Legal frameworks for transnational corporations
Zambia has adopted quite a number of national, bilateral and multilateral legal instruments, as well as acceded to many international agreements to regulate the activities of transnational corporations and foreign direct investors. Among the instruments applicable in the country are:
I. National framework
Companies Act No. 18 of 20 October 1921. Source: Laws of Zambia, chapter 686, vol. )III, 1973 edition.
The Registration of Business Names Act, Cap. 687, Nos. 29 of 193l, 13 of 1932, 2 of 1938, 19 of 1954, 24 of 1955, Government Notices Nos. 279 of 1964, 497 of 1964, Statutory Instrument No. 5 of 1965. Source: WIPO (http://www.wipo.org).
Registration of Business Names Act No. 29 of 1931; effective on 1 January 1932. Source: Laws of Zambia, chapter 687, vol )UII, 1973 edition.
The Trade Marks Act, Cap. 693, Federal Acts Nos. 14 of 1957, 37 of 1960, 2 of 1962, Government Notices Nos. 186 of 1964, 497 of 1964, Statutory Instrument No. 175 of 1965, as amended by The Trade Marks (Amendment) Act No. 17 of 1980. Source: WIPO (http://www.wipo.org).
The Protection of Names, Uniforms and Badges Act, Cap. 540, Nos. 38 of 1957, 19 of 1959, Government Notice No. 497 of 1964. Source: WIPO (http://www.wipo.org).
The Merchandise Marks Act, Cap. 694 of 1957. Source: WIPO (http://www.wipo.org).
The Trade Marks Regulations, Federal Government Notices Nos. 260 of 1957, 57 of 1960, 11 of 1961, 267 of 1962, Act 57 of 1964, Government Notices Nos. 497 of 1964 and Statutory Instruments Nos. 223 of 1965, 307 of 1965, as amended by The Trade Marks (Amendment) Regulations of 1981 and 1990 (S.I. No. 148 of 1990) (fees). Source: WIPO (http://www.wipo.org).
The Trade Marks Act, Cap. 401 of the Laws of Zambia, April 1958, as amended up to 1994. Source: WIPO (http://www.wipo.org).
The Merchandise Marks Act, Cap. 694, Notices Nos. 153 of 1964, 497 of 1964, Statutory Instrument No. 175 of 1965, Act No. 23 of 1965. Source: WIPO (http://www.wipo.org).
The Merchandise Marks (Section 7 Suspension) Notice, Government Notices Nos. 154 of 1964, 497 of 1964, Statutory Instrument No. 47 of 1965. Source: WIPO (http://www.wipo.org).
The Trade Marks Office (Establishment) Order of 1968, Statutory Instrument No. 326 of 1968. Source: WIPO (http://www.wipo.org).
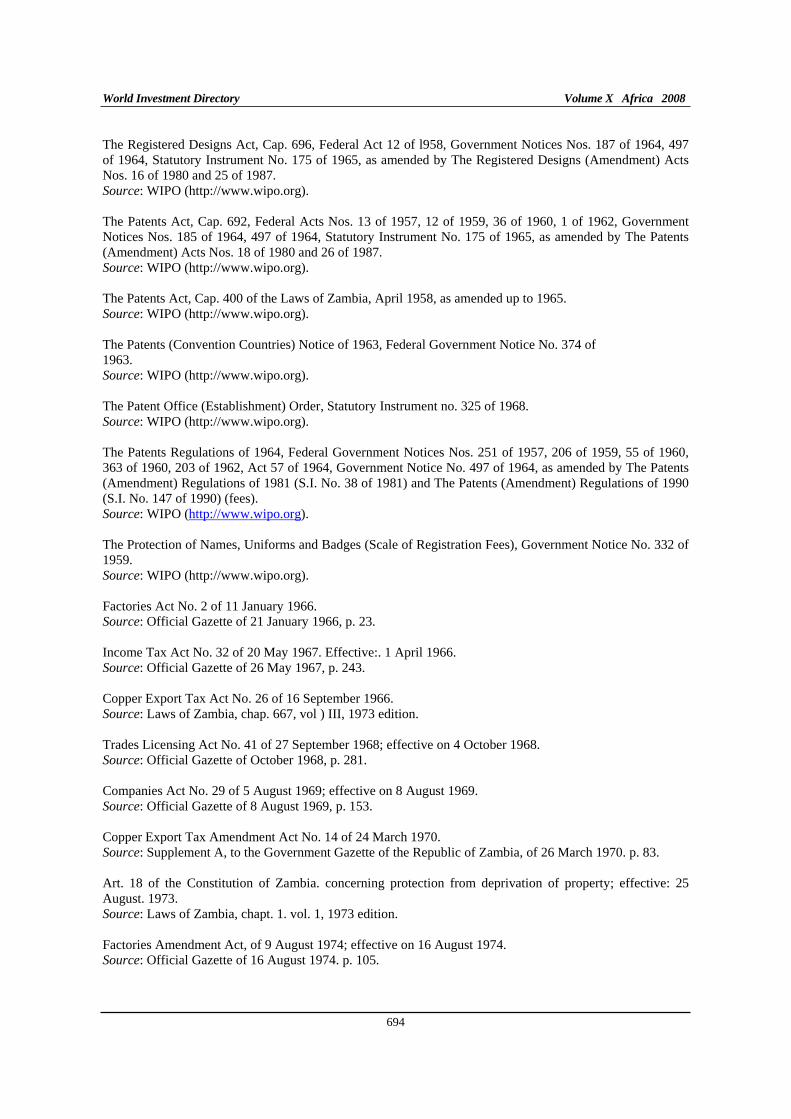
World Investment Directory Volume X Africa 2008
694
The Registered Designs Act, Cap. 696, Federal Act 12 of l958, Government Notices Nos. 187 of 1964, 497 of 1964, Statutory Instrument No. 175 of 1965, as amended by The Registered Designs (Amendment) Acts Nos. 16 of 1980 and 25 of 1987. Source: WIPO (http://www.wipo.org).
The Patents Act, Cap. 692, Federal Acts Nos. 13 of 1957, 12 of 1959, 36 of 1960, 1 of 1962, Government Notices Nos. 185 of 1964, 497 of 1964, Statutory Instrument No. 175 of 1965, as amended by The Patents (Amendment) Acts Nos. 18 of 1980 and 26 of 1987. Source: WIPO (http://www.wipo.org).
The Patents Act, Cap. 400 of the Laws of Zambia, April 1958, as amended up to 1965. Source: WIPO (http://www.wipo.org).
The Patents (Convention Countries) Notice of 1963, Federal Government Notice No. 374 of 1963. Source: WIPO (http://www.wipo.org).
The Patent Office (Establishment) Order, Statutory Instrument no. 325 of 1968. Source: WIPO (http://www.wipo.org).
The Patents Regulations of 1964, Federal Government Notices Nos. 251 of 1957, 206 of 1959, 55 of 1960, 363 of 1960, 203 of 1962, Act 57 of 1964, Government Notice No. 497 of 1964, as amended by The Patents (Amendment) Regulations of 1981 (S.I. No. 38 of 1981) and The Patents (Amendment) Regulations of 1990 (S.I. No. 147 of 1990) (fees). Source: WIPO (http://www.wipo.org).
The Protection of Names, Uniforms and Badges (Scale of Registration Fees), Government Notice No. 332 of 1959. Source: WIPO (http://www.wipo.org).
Factories Act No. 2 of 11 January 1966. Source: Official Gazette of 21 January 1966, p. 23.
Income Tax Act No. 32 of 20 May 1967. Effective:. 1 April 1966. Source: Official Gazette of 26 May 1967, p. 243.
Copper Export Tax Act No. 26 of 16 September 1966. Source: Laws of Zambia, chap. 667, vol ) III, 1973 edition.
Trades Licensing Act No. 41 of 27 September 1968; effective on 4 October 1968. Source: Official Gazette of October 1968, p. 281.
Companies Act No. 29 of 5 August 1969; effective on 8 August 1969. Source: Official Gazette of 8 August 1969, p. 153.
Copper Export Tax Amendment Act No. 14 of 24 March 1970. Source: Supplement A, to the Government Gazette of the Republic of Zambia, of 26 March 1970. p. 83.
Art. 18 of the Constitution of Zambia. concerning protection from deprivation of property; effective: 25 August. 1973. Source: Laws of Zambia, chapt. 1. vol. 1, 1973 edition.
Factories Amendment Act, of 9 August 1974; effective on 16 August 1974. Source: Official Gazette of 16 August 1974. p. 105.
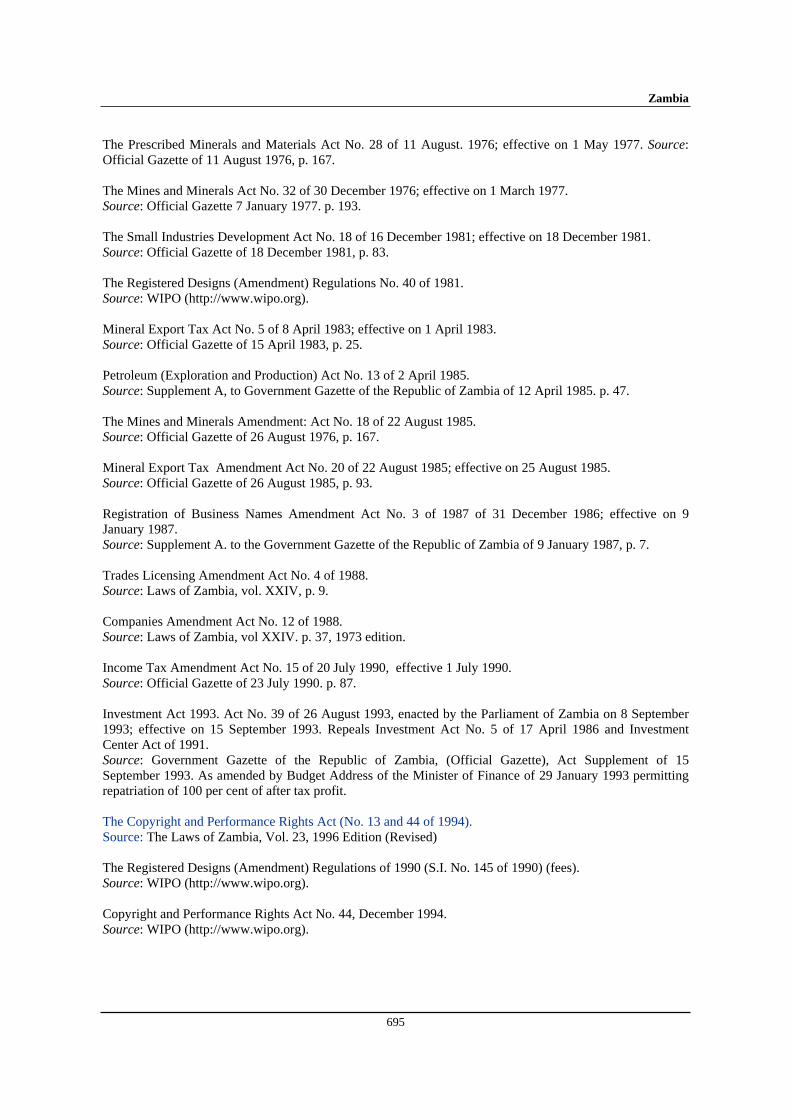
Zambia
695
The Prescribed Minerals and Materials Act No. 28 of 11 August. 1976; effective on 1 May 1977. Source:Official Gazette of 11 August 1976, p. 167.
The Mines and Minerals Act No. 32 of 30 December 1976; effective on 1 March 1977. Source: Official Gazette 7 January 1977. p. 193.
The Small Industries Development Act No. 18 of 16 December 1981; effective on 18 December 1981. Source: Official Gazette of 18 December 1981, p. 83.
The Registered Designs (Amendment) Regulations No. 40 of 1981. Source: WIPO (http://www.wipo.org).
Mineral Export Tax Act No. 5 of 8 April 1983; effective on 1 April 1983. Source: Official Gazette of 15 April 1983, p. 25.
Petroleum (Exploration and Production) Act No. 13 of 2 April 1985. Source: Supplement A, to Government Gazette of the Republic of Zambia of 12 April 1985. p. 47.
The Mines and Minerals Amendment: Act No. 18 of 22 August 1985. Source: Official Gazette of 26 August 1976, p. 167.
Mineral Export Tax Amendment Act No. 20 of 22 August 1985; effective on 25 August 1985. Source: Official Gazette of 26 August 1985, p. 93.
Registration of Business Names Amendment Act No. 3 of 1987 of 31 December 1986; effective on 9 January 1987. Source: Supplement A. to the Government Gazette of the Republic of Zambia of 9 January 1987, p. 7.
Trades Licensing Amendment Act No. 4 of 1988. Source: Laws of Zambia, vol. XXIV, p. 9.
Companies Amendment Act No. 12 of 1988. Source: Laws of Zambia, vol XXIV. p. 37, 1973 edition.
Income Tax Amendment Act No. 15 of 20 July 1990, effective 1 July 1990. Source: Official Gazette of 23 July 1990. p. 87.
Investment Act 1993. Act No. 39 of 26 August 1993, enacted by the Parliament of Zambia on 8 September 1993; effective on 15 September 1993. Repeals Investment Act No. 5 of 17 April 1986 and Investment Center Act of 1991. Source: Government Gazette of the Republic of Zambia, (Official Gazette), Act Supplement of 15 September 1993. As amended by Budget Address of the Minister of Finance of 29 January 1993 permitting repatriation of 100 per cent of after tax profit.
The Copyright and Performance Rights Act (No. 13 and 44 of 1994). Source: The Laws of Zambia, Vol. 23, 1996 Edition (Revised)
The Registered Designs (Amendment) Regulations of 1990 (S.I. No. 145 of 1990) (fees). Source: WIPO (http://www.wipo.org).
Copyright and Performance Rights Act No. 44, December 1994. Source: WIPO (http://www.wipo.org).
World Investment Directory Volume X Africa 2008
696
II. International Framework
A. Zambia is a party to the following multilateral and regional instruments:
Convention on the Recognition and Enforcement of Foreign Arbitral Awards of 1958, which entered into force on 7th June 1959.
Convention on the Settlement of Investment Disputes between States and Nationals of other States of 1965. Entered into force on 14 October 1966.
Convention Establishing the Multilateral Investment Guarantee Agency of 1985, entered into force on 12 April 1988.
Fourth ACP - EEC Convention (Lome IV) of 1989, entered into force on 1st March 1990.
Charter on a Regime of Multinational Industrial Enterprises (MIEs) in the Preferential Trade Area for Eastern and Southern African States (PTA), signed on 21 November 1990, entered into force August 1995. Source: Preferential Trade Area for Eastern ans Southern African States: Report of the Sixteenth Meeting of the Council of Ministers, 17-19 november, 1990, Mbabane, Swaziland (PTA/CM/XVI/2).
Southern Africa Development Community (SADC), signed on 17 August, 1992.Source: http://www.sadc.int/about_sadc/history.php.
Treaty Establishing the Market for Eastern and Southern Africa (COMESA), 1993.
Paris Convention for the Protection of Industrial Property of 1883 (Revised at Brussels in 1900, Washington in 1911, The Hague in 1925, London in 1934, Lisbon in 1958 and Stockholm in 1967, and as amended in 1979). Signed in 1994.
Marrakesh Agreement Establishing the World Trade Organisation of 15 April 1994. Entered into force on 1 January 1995. Agreement on Trade-Related Investment Measures. General Agreement on Trade in Services. Agreement on Trade Related Aspects of Intellectual Property Rights.
Partnership Agreement between the Members of The African, Caribbean and Pacific Group of States, of the one part and the European Community and its member states, of the other part signed in Cotonou, Benin on 23 June 2000.
B. Bilateral treaties
1. Bilateral investment treaties for the protection and promotion of investments: Germany 1966, Switzerland 1994, China 1996, Croatia 2000, Cuba 2000, Egypt 2000, Belgium / Luxembourg 2001, Ghana 2001, France 2002, Italy 2003, Netherlands 2003, Finland 2005.
2. Bilateral treaties for the avoidance of double taxation: South Africa 1956, Switzerland 1961, France 1963, Kenya 1968, Tanzania, United Republic of 1968, Uganda 1968, Japan 1970, Ireland 1971, Norway 1971, Italy 1972, United Kingdom 1972, Denmark 1973, Germany 1973, Sweden 1974, Netherlands 1977, Finland 1978, India 1981, Canada 1984, Poland 1995.
C. Other treaties:
Investment agreement for the COMESA Common Investment Area (2007).

Zambia
697
D. Sources of information
Official
Bank of Zambia (www.boz.zm).Zambia Investment Centre (ZIC) (www.zic.org.zm).
Secondary
Bennell, Paul (1997a). "Foreign direct investment in Africa: rhetoric and reality", SAIS Review (Summer/Fall), pp. 127-139.
____________ (1997b). "Privatization in Sub-Saharan Africa: progress and prospects during the 1990s", World Development, vol. 25, no. 11, pp. 1785-1803.
Business Map (2000). “Zambia – life after privatisation”, in SADC Investor Survey-Complex Terrain
(Johannesburg: Business Map), pp. 25-27.
Broll, U. (2003). "Foreign direct investment, credible policy: the role of risk sharing". International trade
journal, vol. XVII, No. 2., pp. 165 – 176.
Dahl, J. (2002). "Incentives for foreign direct investments – the case of SADC in the 1990s" (Namibia: NEPRU, Working paper).
Economist Intelligence Unit (EIU) (various years). Country Profile: Zambia (London: EIU Ltd.).
_____________(various years). Country Report: Zambia (London: EIU Ltd.).
International Finance Corporation (IFC) (1997). "Foreign direct investment", IFC: Lessons of Experience Series No. 5, (Washington, D.C.: World Bank).
International Monetary Fund (IMF) (2006). IMF's Sub-Saharan Africa Regional Economic Outlook, March 10, 2006. (Washington D.C.: IMF).
Ogunleye, Eric Kehinde (2008) "Exchange rate volatility and foreign direct investment inflows in selected Sub-Saharan African Countries" (PhD Thesis, University of Ibadan).
Ruffer, Tim, S. Jones and S. Akroyd (2002). "Development box proposals and their potential effect on developing countries." Mimeo, (London: U.K. Department for International Development).
Soderbom, M. and F. Teal (2004). "Size and Efficiency in Africa Manufacturing firms: Evidence from Firm-Level Panel Data." Journal of Development Economics, 73. pp 369 - 394.
United Nations Conference on Trade and Development (UNCTAD) (1995). "Foreign Direct Investment in Africa" (Geneva: United Nations, United Nations publication, Sales No. E.95.II.A.6).
_____________(2000). Capital Flows and Growth in Africa (Geneva: UNCTAD/GDS/MDPB/7), July.
_____________(2003). FDI in Landlocked Developing Countries at a Glance 2002 (Geneva: UNCTAD/ITE/IIA/2003/5).
_____________(2005a). Investor-Disputes Arising from Investment Treaties: A Review. UNCTAD Series of International Investment Policies for Development (UNCTAD/ITE/IIT/2005/4).
_____________(2005b). A Survey of Support by Investment Promotion Agencies to Linkages. Advisory Studies No. 18 (UNCTAD/ITE/IPC/2005/12).

World Investment Directory Volume X Africa 2008
698
_____________(2005c). FDI in least developed countries at a glance: 2005/2006
(UNCTAD/ITE/IIA/2005/17).
United States Trade Representative (2006). 2006 Comprehensive Report on U.S. Trade and Investment
Policy Toward Sub-Saharan Africa and Implementation of the Africa Growth and Opportunity Act: The Sixth of Eight Annual Reports, May 2006. (Washington D.C.: US Government).
Willem Dirk te Velde and Oliver Morrissey (2002). "Foreign ownership and wages: evidence from five African countries (Cameroon, Ghana, Kenya, Zambia and Zimbabwe) (Nothingham: Center for Research in Economic Development and International Trade, University of Nothingham; Research paper No. 01/19).
World Bank (2004). An Assessment of the Investment Climate in Zambia. November 2004.
World Bank/International Finance Corporation (2007). Doing Business 2008 Zambia (Washington D.C.: The World Bank Group).

Zimbabwe
699
Zimbabwe
A. Definitions and Sources of data
In Zimbabwe, foreign direct investment (FDI) is defined in the general concept of foreign investment. In this definition a foreign investor is any company at least 25% of whose shares are owned by non-Zimbabwe; or any partnership at least 25% of whose is owned by non-Zimbabwe; or as defined under Exchange Control Regulations (Zimbabwe: the promotion of investment: policy and regulations (1989)). Permissible foreign shareholding includes shareholding for manufacturing, mining, quarrying, mineral exploitation and infrastructure development for tourism; service sectors such as management consultancy and construction. Data on FDI has been obtained from the Bank of Zimbabwe.
The Acts of the Zimbabwe Investment Center contain rules guiding such investment issues as capital flows and repatriation of dividends and profits. The Government allows 100% repatriation of original invested capital and the remitting of 100% dividends after tax. There are no restrictions on sourcing funds either locally or internationally. The Zimbabwe Investment Center is a Government agency, charged with the responsibility to encourage, promote and facilitate investment in the essential sectors of the Zimbabwean economy.
Zimbabwe provides significant protection and security to investors. The government has signed Bilateral International Protection Agreements with China, Germany, India, Italy, the Netherlands, Switzerland and the United Kingdom. It is also signatory to the Overseas Private Investment Corporation, the Multilateral Investment Guarantee Agency, the International Convention for the Settlement of Investment Disputes and the United Nations Convention on International Trade Law.
Zimbabwe signed to the Convention on the Settlement of Investment Disputes between State and Nationals of other States on 25 March 1991 and has access to world markets because of its membership in certain organizations. It is a member of the Southern African Development Community, the Common Market for East and Southern Africa, the Africa Union, New Partnership for Africa's Development and the World Trade Organization. Zimbabwe is signatory to the Cotonou Agreement for renegotiating the African, Caribbean and Pacific countries trade and aid links with the European Union - the Lomé Convention.

World Investment Directory Volume X Africa 2008
700
B. Statistics on FDI and the operations of TNCs
Table 1. Summary of FDI (Millions of dollars)
Variable Inward Outward
1. FDI flows, 2003-2006 (annual average) 38.8 0.3 2. FDI flows as a percentage of GFCF, 2003-2006 (annual average) 43.2 0.4 3. FDI stocks, 2006 1 423 242 4. FDI stocks as a percentage of GDP, 2006 25.7 4.4 Source: Based on tables 3 and 4 and UNCTAD, FDI/TNC database.
Table 3. FDI flows, by type of investment, 1980-2006 (Millions of dollars)
Inward investment Outward investment
Reinvested Reinvested Year Equity earnings Other Total Equity earnings Other Total
1980 23.4 .. - 21.9 1.6 .. - - -1981 8.6 .. - 5.1 3.6 .. - - -1982 14.5 .. - 15.3 0.8 .. - - -1983 4.7 - 6.8 .. 2.1 .. - - 6.71984 7.9 - 10.4 .. 2.5 .. - - 1.91985 4.3 - - 1.4 2.9 .. - - 1.41986 7.5 - - 0.1 7.5 .. - - 0.11987 - 30.5 - - 30.5 .. - - 29.81988 - 18.1 - - 18.5 - 22.2 - - 22.81989 - 10.2 - - 10.2 .. - - 0.01990 - 12.2 - - 12.2 .. - - 17.31991 2.8 - - 2.8 .. - - 11.81992 15.0 - - 19.0 .. - - 4.41993 28.0 - - 38.0 .. - - 6.71994 34.7 - - 41.0 4.7 - - 13.01995 - - - 117.7 - - - 13.41996 - - - 80.9 - - - 51.01997 - - - 135.1 - - - 28.21998 - - - 444.3 - - - 8.61999 - - - 59.0 - - - 9.02000 - - - 23.2 - - - 7.52001 - - - 3.8 - - - 4.12002 - - - 25.9 - - - 3.22003 - - - 3.8 - - - 0.22004 - - - 8.7 - - - 0.02005 - - - 102.8 - - - 1.12006 - - - 40.0 - - - 0.0
Source: UNCTAD, FDI/TNC database (www.unctad.org/statistics), based on the Reserve Bank of Zimbabwe, unpublished.

Zimbabwe
701
Table 4. FDI stocks, by type of investment, 1980-2006 (Millions of dollars)
Inward investment Outward investment
Reinvested Reinvested
Year Equity earnings Other Total Equity earnings Other Total
1980 .. .. .. 186.3 .. .. .. ..1981 .. .. .. 189.9 .. .. .. ..1982 .. .. .. 190.7 .. .. .. ..1983 .. .. .. 192.8 .. .. .. 6.71984 .. .. .. 195.3 .. .. .. 8.61985 .. .. .. 198.2 .. .. .. 10.01986 .. .. .. 205.7 .. .. .. 10.11987 .. .. .. 236.2 .. .. .. 39.91988 .. .. .. 254.7 .. .. .. 62.71989 .. .. .. 264.9 .. .. .. 62.71990 .. .. .. 277.1 .. .. .. 80.01991 .. .. .. 279.9 .. .. .. 91.81992 .. .. .. 298.9 .. .. .. 96.21993 .. .. .. 336.9 .. .. .. 102.91994 .. .. .. 377.9 .. .. .. 115.91995 .. .. .. 495.6 .. .. .. 129.31996 .. .. .. 576.5 .. .. .. 180.31997 .. .. .. 711.6 .. .. .. 208.51998 .. .. .. 1 155.9 .. .. .. 217.11999 .. .. .. 1 214.9 .. .. .. 226.12000 .. .. .. 1 238.1 .. .. .. 233.62001 .. .. .. 1 241.9 .. .. .. 237.72002 .. .. .. 1 267.8 .. .. .. 240.92003 .. .. .. 1 271.6 .. .. .. 241.12004 .. .. .. 1 280.3 .. .. .. 241.12005 .. .. .. 1 383.1 .. .. .. 242.22006 .. .. .. 1 423.1 .. .. .. 242.2
Source: UNCTAD, FDI/TNC database (www.unctad.org/statistics). Note: Data on inward stock are estimated by accumulating inflows since 1970. Data on outward stock are estimated by accumulating outflows since 1983.
Table 5. Approved FDI flows in the host economy, by industry, 1993-1995 (Millions of Zimbabwe dollars)
Sector / industry 1993 1994 1995
Total 1 323.9 3 265.3 2 037.3Primary 529.7 1 985.8 653.0
Agriculture, hunting, forestry and fishing 22.9 17.2 221.8Agriculture and hunting 22.9 17.2 221.8
Mining, quarrying and petroleum 506.8 1 968.6 431.2Secondary 269.1 884.1 693.7Tertiary 525.1 395.4 690.6
Construction - - 1.9Trade 525.1 395.4 513.9Transport, storage and communications - - 174.8
Transport and storage - - 174.8 Supporting and auxilary transport activities - - 174.8
Activities of travel agencies and tour operators - - 174.8 Source: Zimbabwe Investment Centre, unpublished data. Note: Data are on an approval basis.
World Investment Directory Volume X Africa 2008
702
Table 6. Approved FDI flows in the host economy, by geographical origin, 1993-1995
(Millions of Zimbabwe dollars)
Region / economy 1993 1994 1995 Region / economy 1993 1994 1995
Total world 1 324.0 3 265.3 2 037.3 Côte d'Ivoire 5.0 - -
Developed countries 739.7 2 685.4 1 264.7 Ethiopia - 0.5 -
Europe 530.7 738.0 1 070.2 Ghana - - 9.6
European Union 519.6 438.3 1 028.0 Kenya - 0.7 -
Austria 2.4 3.2 3.3 Malawi 0.0 1.4 -
Belgium 11.9 1.3 2.8 Mauritius 21.5 19.8 16.9
Cyprus - - 0.9 Namibia - 1.5 1.1
Czech Republic - 3.8 - Nigeria - 1.0 2.9
Denmark - 22.2 185.4 Senegal - - 0.6
Finland - - 2.6 Somalia - - 0.8
France 2.0 0.6 100.2 South Africa 16.4 154.2 356.2
Germany 9.1 288.0 48.6 Swaziland - 1.2 -
Greece - 0.8 - Tanzania, United Republic of - - 2.2
Ireland 0.9 6.1 4.0 Uganda - - 0.3
Italy - 18.6 3.4 Zambia 0.1 - 3.0
Luxembourg - 22.8 163.5 Latin America and the Caribbean 0.5 25.5 0.2
Malta - 9.5 - Central America - 2.7 -
Netherlands 43.0 56.9 92.5 Panama - 2.7 -
Portugal 0.2 3.3 34.9 Caribbean and other America 0.5 22.8 0.2
Spain - - 222.3 Bahamas - 0.1 -
Sweden 0.0 1.2 1.6 British Virgin Islands - 22.7 -
United Kingdom 450.1 - 162.0 Cayman Islands - - 0.2
Other developed Europe 11.1 299.7 42.2 Asia 496.3 342.7 91.8
Liechtenstein 4.6 48.7 18.4 West Asia - 6.9 16.3
Isle of Man 0.7 0.6 - Lebanon - 5.3 10.0
Norway - 3.7 0.6 Saudi Arabia - - 5.7
Switzerland 5.2 201.5 6.3South, East and South-East
Asia 496.3 335.8 75.5
North America 193.6 13.2 118.0 Afghanistan - 0.4 -
Canada 54.6 13.2 - Bangladesh - 0.9 -
United States 139.0 - 118.0 China 6.9 320.6 20.6
Other developed countries 15.4 1 934.2 76.5 Hong Kong, China 488.0 6.7 -
Australia 15.1 1 891.7 46.4 India - 2.9 1.9
Bermuda 0.5 - - Korea, Republic of - 3.0 8.8
Israel 0.3 41.0 0.2 Malaysia - 0.6 27.0
Japan - 1.1 27.1 Pakistan 0.4 0.4 4.8
New Zealand - 0.4 2.8 Singapore 1.0 - 1.2
Developing economies 539.8 561.1 491.6 Taiwan Province of China - 0.3 11.2
Africa 43.0 192.9 399.6 South-East Europe and the CIS 44.5 18.8 281.0
North Africa - 0.5 - South-East Europe 8.6 - 8.0
Egypt - 0.5 - Bulgaria 6.3 - 1.0
Other Africa 43.0 192.4 399.6 Croatia - - 0.3
Angola - 5.4 - Yugoslavia (former) 2.3 - 6.7
Botswana - 1.7 6.0 CIS 35.9 18.8 273.0
Burkina Faso - 5.0 - Russian Federation 35.9 18.8 273.0
Source: Zimbabwe Investment Centre, unpublished data.
Note: Data are on an approval basis.

Zimbabwe
703
Table 9. FDI flows abroad, by geographical destination, 1993-2004
(Millions of dollars)
Economy 1993 1994 1995 1996 1997 1998 1999 2000 2001 2002 2003 2004
Belgium / Luxembourg .. -0.2 2.7 .. .. .. .. .. .. .. .. ..
China .. .. .. .. .. .. 0.2 0.6 .. .. .. ..
Germany .. .. .. .. .. 1.1 .. .. 0.9 .. .. ..
United States .. .. .. -3.0 3.0 .. .. -2.0 2.0 .. .. ..
Source: UNCTAD, FDI/TNC database.
Note: Data are based on information reported by the economies listed above.
Table 12. FDI stock in the host economy, by geographical origin, 1993-2004
(Millions of dollars)
Economy 1993 1994 1995 1996 1997 1998 1999 2000 2001 2002 2003 2004
Canada 12.1 17.8 14.6 16.8 21.7 24.2 12.5 18.0 17.0 17.1 20.9 ..
Germany 9.3 6.5 4.2 4.5 5.6 9.6 12.1 15.8 16.7 13.6 .. ..
Malaysia .. 0.4 0.4 0.4 0.3 0.3 0.3 0.3 0.3 0.3 .. ..
South Africa .. .. .. .. .. .. .. .. 48.4 69.8 306.2 ..
United Kingdom 367.3 517.2 406.1 339.6 317.5 189.6 276.4 194.0 240.8 99.9 85.7 ..
United States 127.0 117.0 100.0 169.0 130.0 99.0 77.0 93.0 117.0 146.0 146.0 150.0
Source: UNCTAD, FDI/TNC database.
Note: Data are based on information reported by the economies listed above.
Table 15. FDI stock abroad, by geographical destination, 1993-2004
(Millions of dollars)
Economy 1993 1994 1995 1996 1997 1998 1999 2000 2001 2002 2003 2004
Brazil .. .. 0.0 .. .. .. .. .. .. .. .. ..
South Africa .. .. .. .. .. .. .. .. 172.3 247.0 322.0 ..
United Rep. of Tanzania .. .. .. .. .. 0.5 .. .. .. .. .. ..
United States .. .. .. -3.0 .. .. .. -2.0 .. .. .. ..
Source: UNCTAD, FDI/TNC database.
Note: Data are based on information reported by the economies listed above.

World Investment Directory Volume X Africa 2008
704
Table 23. The number of affiliates of foreign TNCs in the host economy, by geographical origin, 1993-2004
Economy 1993 1994 1995 1996 1997 1998 1999 2000 2001 2002 2003 2004
Germany 6 6 5 7 8 9 9 9 10 4 .. ..
United States 22 23 24 23 24 23 17 17 17 17 12 8
Source: UNCTAD, FDI/TNC database.
Note: Data are based on information reported by the economies listed above.
Tables 30. Assets of affiliates of foreign TNCs in the host economy, by geographical origin, 1993-2004 (Millions of dollars)
Economy 1993 1994 1995 1996 1997 1998 1999 2000 2001 2002 2003 2004
Germany .. .. .. .. .. 60 .. 93 88 .. .. ..
United States 329 .. 416 430 543 532 455 484 554 550 456 349
Source: UNCTAD, FDI/TNC database.
Note: Data are based on information reported by the economies listed above.
Table 35. Employment of affiliates of foreign TNCs in the host economy, by geographical origin, 1993-2004
(Thousands of employees)
Economy 1993 1994 1995 1996 1997 1998 1999 2000 2001 2002 2003 2004
Germany 1.0 1.0 1.0 1.0 1.0 2.0 1.0 1.0 1.0 1.0 .. ..
Sweden a 0.3 .. .. 1.0 0.2 1.4 .. .. .. .. .. ..
United States 7.0 7.4 9.1 9.2 10.3 9.9 8.6 7.6 6.3 6.2 4.5 2.9
Source: UNCTAD, FDI/TNC database.
Note: Data are based on information reported by the economies listed above. a Data refer to majority-owned affiliates only.
Table 45. Sales of affiliates of foreign TNCs in the host economy, by geographical origin, 1993-2004 (Millions of dollars)
Economy 1993 1994 1995 1996 1997 1998 1999 2000 2001 2002 2003 2004
Germany .. .. .. .. .. 57 .. .. 89 .. .. ..
United States 596 .. 798 846 1 102 881 824 957 1 173 1 053 1 052 ..
Source: UNCTAD, FDI/TNC database.
Note: Data are based on information reported by the economies listed above.
Tables 40 and 50. Wages and salaries and value added of affiliates of United States TNCs in Zimbabwe, 1993-
2004 (Number, thousands of employees and millions of dollars)
Table no./ Variable 1993 1994 1995 1996 1997 1998 1999 2000 2001 2002 2003 2004
40. Wages and salaries 26 36 44 41 39 41 40 45 47 56 69 26
50. Value addeda .. 120 137 156 172 153 117 132 169 156 191 46
Source: UNCTAD, FDI/TNC database.
Note: Data are based on information reported by the United States. a Data refer to majority-owned affiliates only.

Zimbabwe
705
Table 87. Largest foreign affiliates of home-based TNCs, 2007
(Millions of dollars and number) Company Host economy Industry Sales Employees
A. Industrial
.. .. .. .. ..
B. Tertiary
Case Tarsus Ltd Zambia Wholesale trade .. 10
The Cold Chain ( Pvt ) Limited Malawi Wholesale trade .. 2
St Cellular Sa Burundi Telecommunications .. ..
C. Finance and Insurance Assets Employees
.. .. .. .. ..
Source: Who Owns Whom database (https://solutions.dnb.com/wow), retrieved January 2008.
Table 88. Largest affiliates of foreign TNCs in the host economy, 2007 (Millions of dollars and number)
Company Name Home economy Industry Sales Employees
A. Industrial
Kuzocm Co Russian Federation Machinery and equipment .. 2 000Olivine Industries (Pvt) Ltd United States Food, beverages and tobacco .. 1 900Hunyani Paper & Packaging (1997) (Pvt) Ltd Georgia Wood and wood products .. 1 445Unilever South East Africa United Kingdom Chemicals and chemical products .. 430BOC Zimbabwe United Kingdom Manufacture of petroleum .. 370Circle Cement Ltd France Non-metallic mineral products .. 200Nestle Zimbabwe (Pvt) Ltd Switzerland Food, beverages and tobacco .. 182Cluff Mining Zimbabwe Ltd United Kingdom Mining and quarrying .. 4Hertz Corporation United States Automobile Trade and repair .. ..
B. Tertiary
Zimbabwe Bata Shoe Company Limited Netherlands Wholesale trade .. 3 200The Wattle Company Limited Nigeria Forestry and Fishing .. 3 000Zimbabwe Leaf Tobacco Company (Private) United States Other business activities .. 350Abb (Private) Ltd Switzerland Electricity, gas and water .. ..Allied Manufacturing Industries (Private) Limited France Other business activities .. ..Atlas Copco Zimbabwe (Private) Ltd Sweden Other business activities .. ..Bp + Shell Marketing Services (Pte) Limited United Kingdom Other business activities .. ..Casalee-Transtobac (Pvt) Ltd United States Other business activities .. ..Chegutu Canners (Pvt) Ltd. United States Other business activities .. ..Chep Australia Other business activities .. ..Coats Zimbabwe (Private) Ltd United Kingdom Other business activities .. ..Costain (Africa) Ltd United Kingdom Other business activities .. ..Croda Chemicals (Zimbabwe) Pvt Ltd United Kingdom Other business activities .. ..Egl, Inc United Kingdom Other business activities .. ..Energo (Pvt) Ltd Serbia and Montenegro Research and Development .. ..Glaxosmithkline (Private) Ltd United Kingdom Other business activities .. ..Gypsum Industries (Private) Ltd France Other business activities .. ..Handigas (Pvt) Ltd United Kingdom Other business activities .. ..Industrial Gases (Pvt) Ltd United Kingdom Other business activities .. ..Kuehne + Nagel Zimbabwe Pvt Ltd Switzerland Other business activities .. ..
C. Finance and Insurance Assets Employees
Standard Chartered Bank United Kingdom Finance 294 850 a
Efacec Southern Africa (Pvt) Ltd Portugal Finance .. 4Aon Zimbabwe (Private) Limited United States Insurance
Source: Who Owns Whom database (https://solutions.dnb.com/wow), retrieved January 2008. a 2002.

World Investment Directory Volume X Africa 2008
706
C. Legal frameworks for transnational corporations
The principal national, bilateral and multilateral legal instruments adopted by Zimbabwe to regulate of the activities of transnational corporations and foreign direct investors in the country include the following:
I. National framework
Base Minerals Export Control Act 4/1949, Cap 21:01 of 30th May 1949.Source: http://faolex.fao.org/docs/texts/zim60550.doc.
Companies Act (No. 47 of 1951)(Chapter 24), as consolidated at March 2000. Source: www.ilo.org.
The Companies Act, chapter 190. Effective: 29 February 1952. Source: Revised edition of the Statute Law of Zimbabwe/Rhodesia, 1974, chapter 190, p. 53.
Mines and Minerals Act, chap. 165; effective on 11 August 1961. Source: Revised edition of the Statute Law of Zimbabwe/Rhodesia, 1974, chapter 165, p. 4.99.
Exchange Control Act [Cap 22:05] of 1, June 1965. Source: http://www.sadccitizen.net/regiondocs/12000208.pdf
Finance Act. No. 30 of 1965. Effective: 5 July 1965. Source: The Statute Law of Zimbabwe/Rhodesia, Act. No. 30, 1965, p. 215.
Integrated Circuits Layout-Designs Act, Chapter 26:07 of January 1967. Source: WIPO (http://www.wipo.org).
Copyright Act Chapter 26:01, January 1967. Copyright and Neighboring Rights Act Chapter 26:05, not yet in force, will replace Copyright Act Chapter 26:01. Source: WIPO (http://www.wipo.org).
Income Tax, chapter 181; effective on 1 April 1967. Source: The Statute Law of Zimbabwe/Rhodesia, 1979, chapter 181, p. l.
Industrial Designs Act Chapter 26:02, January 1967. Source: WIPO (http://www.wipo.org).
Armorial Bearings, Names, Uniforms and Badges Act Chapter 10:01, November 1971. Source: WIPO (http://www.wipo.org).
Geographical Indications Act Chapter 26:06. Source: WIPO (http://www.wipo.org).
Patents Act, chap. 202. Effective: 1 February 1972. Source: Statute Law of Zimbabwe/Rhodesia, 1971. Act No. 26, p. 515.
The Industrial Design Regulations No. 211 of 1972. Source: WIPO (http://www.wipo.org).

Zimbabwe
707
Trademarks Act Chapter 26:04, January 1975. Source: WIPO (http://www.wipo.org).
Merchandise Marks Act Chapter 14:13, January 1975. Source: WIPO (http://www.wipo.org).
Trademarks Act, cap. 203; effective on 1 January 1975. Source: Statute Law of Zimbabwe/Rhodesia, Act No. 2, 1974, p. 3. II. International framework
Intellectual Property Tribunal Act, Chapter 26:08, put in place as a specialist court for the enforcement of intellectual property rights. Source: WIPO (http://www.wipo.org).
Mining (Management and Safety) Regulation, S.1. 61 of 1981. Source: Supplement to the Zimbabwean Government Gazette of 13 February 1981.
Companies (Amendment ) Act. 1981 Source: The Statute Law of Zimbabwe, Act No. 20, 1981, p. 151.
Copyright Order, S.I. No. 126 of 1982; effective on 26 February 1982. Source: Supplement to the Zimbabwean Government Gazette of 26 February 1982.
Patent Amendment Act, 1983; effective on 25 April 1984. Source: Statute Law of Zimbabwe/Rhodesia, Act No. 41, 1983, p. 277. As amended by Statutory
Companies Regulation, Statutory Instruction (S.I.) 178 of 1984. Effective: 22 June 1984. Source: Supplement to the Zimbabwean Government Gazette of 22 June 1984.
Development Corporation Act No. 37 of 1984. Source: International Bureau of Fiscal Documentation ATS, Act No. 37, p. 313.
Labour Relations Act of 16 December 1985; effective on 25 January 1985. Source: The Zimbabwean Government Gazette of 25 January 1986.
Amendment: Mines and Minerals Act, 1987. Source: Revised edition of the Statute Law of Zimbabwe/Rhodesia, Act. No. 26, 1987.
Amendment: Finance Act, 1987. Effective: 1 April 1988. Source: The Statute Law of Zimbabwe/Rhodesia, Act No. 17, 1987, p. 365.
The Promotion of Investment: Policy and Regulations, April 1989. Effective: 9 May 1989. Sources: Government of Zimbabwe, Zimbabwe Investment Center, Ministry of Finance, Economic Planning and development, Harare, April 1989. Investment Laws of the World; vol 10, Zimbabwe, June 1990.
Zimbabwe Investment Centre Act, 1992 (No. 16 of 1992).Source: www.ilo.org.
Ministry of Finance Measures of April 1993; effective on 1 May 1993 on unrestricted remittance of after tax profits. Source: Quarterly Economic and Statistical Review, vol. 14, No. 1 and 2 of March /June 1993.
Private Business Corporations Act (No. 15 of 1993)(Chapter 24), 1996 Revision. Source: www.ilo.org.
World Investment Directory Volume X Africa 2008
708
The Zimbabwe Export Processing Zones Act 1994. Source: International Bureau of Fiscal Documentation ATS, suppl. No. 94, March 1995.
Arbitration (International Investment Disputes Act) No. 16 of 1995. Source: Official Gazette, Acts, pp. 193-222 (Printed separately).
Instrument No. 128 of 1996 – Table of Fees. Source: WIPO (http://www.wipo.org).
Arbitration Act, 1996 (No. 6 of 1996). Source: Official Gazette, Acts, pp. 59-80.
Export Processing Zones (General) Regulations, 1997 (S.I. 60 of 1997).Source: Government Gazette, Supplement, 1997-02-28, pp. 217-222.
Private Business Corporations Regulations, 1997 (S.I. No. 101 of 1997). Source: Official Gazette, Supplement, 1997-05-02, pp. 587-608.
Export Processing Zones (Employment) Rules, 1998 (S.I. No. 372 of 1998). Source: Government Gazette, Supplement, 1998-12-11, pp. 2473-2488.
Industrial Designs Amendment Bill 2000, passed by Parliament, awaiting Presidential assent. Source: WIPO (http://www.wipo.org).
Patents Amendment Bill, 2001, before Parliament for debate. Source: WIPO (http://www.wipo.org).
Brands Act 22[Cap 19:03] Amendment of 2001, with effect from the 10th September, 2002. Source: http://faolex.fao.org/docs/texts/zim60552.doc.
Trade Marks Amendment Act No. 10 of 2001, not yet in force. Source: WIPO (http://www.wipo.org).
Capital Gains Act Tax [23:01]. Source: Compiled by Calvin Maduna, Researcher, tralac, February 2003.
Companies and Associations Trustees Act [Cap 24:04]. Source: Compiled by Calvin Maduna, Researcher, tralac, February 2003.
Procurement Act [Cap 22:14]. Source: Compiled by Calvin Maduna, Researcher, tralac, February 2003.
Zimbabwe Investment Centre Act No 16 of 1992 [Cap24:16]. Source: Official Gazette, Acts, 19 p. ( Printed separately).
II. International Framework
A. Zimbabwe is a party to the following multilateral and regional instruments:
Convention on the Recognition and Enforcement of Foreign Arbitral Awards of 1958, which entered into force on 7th June 1959.
Convention on the Settlement of Investment Disputes between States and Nationals of other States of 1965. Entered into force on 14 October 1966.

Zimbabwe
709
Convention Establishing the Multilateral Investment Guarantee Agency of 1985, entered into force on 12 April 1988.
Fourth ACP - EEC Convention (Lome IV) of 1989, entered into force on 1st March 1990.
Charter on a Regime of Multinational Industrial Enterprises (MIEs) in the Preferential Trade Area for Eastern and Southern African States (PTA), signed on 21 November 1990, entered into force August 1995. Source: Preferential Trade Area for Eastern ans Southern African States: Report of the Sixteenth Meeting of the Council of Ministers, 17-19 november, 1990, Mbabane, Swaziland (PTA/CM/XVI/2).
Southern Africa Development Community (SADC), signed on 17 August, 1992.Source: http://www.sadc.int/about_sadc/history.php.
Paris Convention for the Protection of Industrial Property of 1883 (Revised at Brussels in 1900, Washington in 1911, The Hague in 1925, London in 1934, Lisbon in 1958 and Stockholm in 1967, and as amended in 1979). Signed in 1994.
Marrakesh Agreement Establishing the World Trade Organisation of 15 April 1994. Entered into force on 1 January 1995. Agreement on Trade-Related Investment Measures. General Agreement on Trade in Services.
Agreement on Trade Related Aspects of Intellectual Property Rights.
Partnership Agreement between the Members of The African, Caribbean and Pacific Group of States, of the one part and the European Community and its member states, of the other part signed in Cotonou, Benin on 23 June 2000.
B. Bilateral treaties
1. Bilateral investment treaties for the protection and promotion of investments: Mozambique 1990, Malaysia 1994, Portugal 1994, Germany 1995, United Kingdom 1995, China 1996, Denmark 1996, Iran, Islamic Republic of 1996, Netherlands 1996, Switzerland 1996, Serbia and Montenegro 1996, Sweden 1997, Czech Republic 1999, Egypt 1999, India 1999, Indonesia 1999, Iran, Islamic Republic of 1999, Italy 1999, Jamaica 1999, Austria 2000, Croatia 2000, Mauritius 2000, Singapore 2000, Thailand 2000, France 2001, Belgium and Luxembourg 2003, Botswana 2003, Ghana 2003, Malawi 2003, Tanzania 2003, Uganda 2003.
2. Bilateral treaties for the avoidance of double taxation: Switzerland 1961, South Africa 1965, United Kingdom 1982, Bulgaria 1988, Germany 1988, Netherlands 1989, Norway 1989, Sweden 1989, Canada 1992, Mauritius 1992, France 1993, Poland 1993, Malaysia 1994, Serbia and Montenegro 1996.
C. Other treaties:
Investment agreement for the COMESA Common Investment Area (2007).

World Investment Directory Volume X Africa 2008
710
D. Sources of Information
Official
Reserve Bank of Zimbabwe (www.rbz.co.zw). Zimbabwe Investment Centre (www.zic.co.zw).
Secondary
BusinessMap (2000). "Zimbabwe – investment anorexia", in SADC Investor Survey – Complex Terrain(Johannesburg: Business Map), pp 22-24.
Economist Intelligence Unit (EIU) (various years). Country Profile: Zimbabwe (London: EIU Ltd.).
_____________ (various years). Country Report: Zimbabwe (London: EIU Ltd.).
International Monetary Fund (IMF) (2006). IMF's Sub-Saharan Africa Regional Economic Outlook, March 10, 2006. (Washington D.C.: IMF).
Ramchandran, V., Shah, M. K., (1998), "Firm performance and foreign ownership in Africa: evidence from Zimbabwe, Ghana and Kenya", Regional Program on Enterprise Development, RPED Paper No. 81(Washington D. C.: World Bank).
Ruffer, Tim, S. Jones and S. Akroyd (2002). "Development box proposals and their potential effect on developing countries." Mimeo (London: U.K. Department for International Development).
United Nations Conference on Trade and Development (UNCTAD) (2003). FDI in Landlocked Developing Countries at a Glance (Geneva: UNCTAD/ITE/IIA/2003/5).
_____________(2005a). Investor-Disputes Arising from Investment Treaties: A Review. UNCTAD Series of International Investment Policies for Development (UNCTAD/ITE/IIT/2005/4).
_____________(2005b). A Survey of Support by Investment Promotion Agencies to Linkages. Advisory Studies No. 18 (UNCTAD/ITE/IPC/2005/12).
_____________(2005c). FDI in least developed countries at a glance: 2005/2006(UNCTAD/ITE/IIA/2005/17).
United States Commercial Service (2004). Doing Business in Zimbabwe: A country Commercial Guide for US Companies. (Washington D.C.: US Government).
United States Trade Representative (2006). 2006 Comprehensive Report on U.S. Trade and Investment Policy Toward Sub-Saharan Africa and Implementation of the Africa Growth and Opportunity Act: The Sixth of Eight Annual Reports, May 2006. (Washington D.C.: US Government).
Willem Dirk te Velde and Oliver Morrissey (2002). "Foreign ownership and wages: evidence from five African countries (Cameroon, Ghana, Kenya, Zambia and Zimbabwe) (Nothingham: Center for Research in Economic Development and International Trade, University of Nothingham; Research paper No. 01/19).
World Bank/International Finance Corporation (2007). Doing Business 2008 Zimbabwe (Washington D.C.: The World Bank Group).

Selected recent UNCTAD publications on TNCs and FDI
711
Selected recent UNCTAD publications on TNCs and FDI (For more information, please visit http://www.unctad.org/Templates/Page.asp?intItemID=1717&lang=1)
A. Serial publications
World Investment Reports(For more information visit www.unctad.org/wir)
World Investment Report 2007. Transnational Corporations, Extractive Industries and Development. Sales No. E.07.II.D.9. $80. http://www.unctad.org/en/docs//wir2007_en.pdf.
World Investment Report 2007. Transnational Corporations, Extractive Industries and Development. An
Overview. 48 p. http://www.unctad. org/en/docs/wir2007overview_en.pdf.
World Investment Report 2006. FDI from Developing and Transition Economies: Implications for
Development. Sales No. E.06.II.D.11. $80. http://www.unctad.org/en/docs//wir2006_en.pdf.
World Investment Report 2006. FDI from Developing and Transition Economies: Implications for
Development. An Overview. 50 p. http://www.unctad. org/en/docs/wir2006overview_en.pdf.
World Investment Report 2005. Transnational Corporations and the Internationalization of R&D. Sales No. E.05.II.D.10. $75. http://www.unctad.org/en/docs//wir2005_en.pdf.
World Investment Report 2005. Transnational Corporations and the Internationalization of R&D. An
Overview. 50 p. http://www.unctad.org/en/docs/wir2005overview_en.pdf.
World Investment Report 2004. The Shift Towards Services. Sales No. E.04.II.D.36. $75. http://www.unctad.org/en/docs//wir2004_en.pdf.
World Investment Report 2004. The Shift Towards Services. An Overview. 62 p. http://www.unctad.org/en/docs/wir2004overview_en.pdf.
World Investment Report 2003. FDI Policies for Development: National and International Perspectives.
Sales No. E.03.II.D.8. $49. http://www.unctad.org/en/docs//wir2003_en.pdf.
World Investment Report 2003. FDI Polices for Development: National and International Perspectives. An
Overview. 66 p. http://www.unctad.org/en/docs/wir2003overview_en.pdf.
World Investment Report 2002: Transnational Corporations and Export Competitiveness. 352 p. Sales No. E.02.II.D.4. $49. http://www.unctad.org/en/docs//wir2002_en.pdf.
World Investment Report 2002: Transnational Corporations and Export Competitiveness. An Overview. 66 p. http://www.unctad.org/en/docs/wir2002overview_en.pdf.
World Investment Report 2001: Promoting Linkages. 356 p. Sales No. E.01.II.D.12 $49. http://www.unctad.org/wir/contents/wir01content.en.htm.
World Investment Report 2001: Promoting Linkages. An Overview. 67 p.http://www.unctad.org/wir/contents/wir01content.en.htm.
Ten Years of World Investment Reports: The Challenges Ahead. Proceedings of an UNCTAD special event on
future challenges in the area of FDI. UNCTAD/ITE/Misc.45. http://www.unctad.org/wir.

World Investment Directory Volume X Africa 2008
712
World Investment Report 2000: Cross-border Mergers and Acquisitions and Development.368 p. Sales No. E.99.II.D.20. $49. http://www.unctad.org/wir/contents/wir00content.en.htm.
World Investment Report 2000: Cross-border Mergers and Acquisitions and Development. An Overview. 75 p. http://www.unctad.org/wir/contents/wir00content.en.htm.
World Investment Directories (For more information visit http://www.unctad.org/Templates/Page.asp?intItemID= 3204&lang=1)
World Investment Directory 2004: Latin America and the Caribbean. Volume IX. 599 p. Sales No. E.03.II.D.12. $25.
World Investment Directory 2003: Central and Eastern Europe. Vol. VIII. 397 p. Sales No. E.03.II.D.24. $80.
Investment Policy Reviews (For more information visit http://www.unctad.org/Templates/Startpage.asp?intItemID=2554)
Investment Policy Review – Algeria. 110 p. UNCTAD/ITE/IPC/2003/9.
Investment Policy Review – Kenya. 126 p. Sales No. E.05.II.D.21. $25.
Investment Policy Review – Benin. 147 p. Sales No. F.04.II.D.43. $25.
Investment Policy Review – Sri Lanka. 89 p. UNCTAD/ITE/IPC/2003/8.
Investment Policy Review – Nepal. 89 p. Sales No. E.03.II.D.17. $20.
Investment Policy Review – Lesotho. 105 p. Sales No. E.03.II.D.18. $15/18.
Investment Policy Review – Ghana. 103 p. Sales No. E.02.II.D.20. $20.
Investment Policy Review – United Republic of Tanzania. 109 p. Sales No. E.02.II.D.6 $20.
Investment Policy Review – Botswana. 107 p. Sales No. E.01.II.D.I. $22.
Investment Policy Review – Ecuador. 136 p. Sales No. E.01.II D.31. $25.
Investment and Innovation Policy Review – Ethiopia. 130 p. UNCTAD/ITE/IPC/Misc.4.
Investment Policy Review – Mauritius. 92 p. Sales No. E.01.II.D.11. $22.
Investment Policy Review – Peru. 109 p. Sales No. E.00.II.D.7. $22.
Investment Policy Review – Egypt. 119 p. Sales No. E.99.II.D.20. $19.
Investment Policy Review – Uganda. 71 p. Sales No. E.99.II.D.24. $15.
Investment Policy Review – Uzbekistan.. 65 p. UNCTAD/ITE/IIP/Misc. 13.
Selected recent UNCTAD publications on TNCs and FDI
713
International Investment Instruments (For more information visit http://www.unctad.org/iia)
International Investment Instruments: A Compendium. Vol. XIV. Sales No. E.05.II.D.8. 326 p. $60.
International Investment Instruments: A Compendium. Vol. XIII. Sales No. E.05.II.D.7. 358 p. $60.
International Investment Instruments: A Compendium. Vol. XII. Sales No. E.04.II.D.10. 364 p. $60.
International Investment Instruments: A Compendium. Vol. XI. 345 p. Sales No. E.04.II.D.9. $60. http://www.unctad.org/en/docs//dite4volxi_en.pdf.
International Investment Instruments: A Compendium. Vol. X. 353 p. Sales No. E.02.II.D.21. $60.
http://www.unctad.org/en/docs/psdited3v9.en.pdf.
International Investment Instruments: A Compendium. Vol. IX. 353 p. Sales No. E.02.II.D.16. $60.
http://www.unctad.org/en/docs/psdited3v9.en.pdf.
International Investment Instruments: A Compendium. Vol. VIII. 335 p. Sales No. E.02.II.D.15. $60.
http://www.unctad.org/en/docs/psdited3v8.en.pdf.
International Investment Instruments: A Compendium. Vol. VII. 339 p. Sales No. E.02.II.D.14. $60.
http://www.unctad.org/en/docs/psdited3v7.en.pdf.
International Investment Instruments: A Compendium. Vol. VI. 568 p. Sales No. E.01.II.D.34. $60.
http://www.unctad.org/en/docs/ps1dited2v6_p1.en.pdf (part one).
International Investment Instruments: A Compendium. Vol. V. 505 p. Sales No. E.00.II.D.14. $55.
International Investment Instruments: A Compendium. Vol. IV. 319 p. Sales No. E.00.II.D.13. $55.
LDC Investment Guides (For more information visit http://www.unctad.org/Templates/Page.asp?intItemID=2705&lang=14)
An Investment Guide to Kenya: Opportunities and Conditions. 92 p. UNCTAD/ITE/IIA/2005/2.
An Investment Guide to the United Republic of Tanzania: Opportunities and Conditions. 82 p. UNCTAD/ITE/IIA/2005/3.
An Investment Guide to the East African Community: Opportunities and Conditions. 109 p. UNCTAD/ITE/IIA2005/4.
An Investment Guide to Mauritania: Opportunities and Conditions. 80 p. UNCTAD/ITE/IIA/2004/4.
Guide de l’investissement au Mali: Opportunités et Conditions. 76 p. UNCTAD/ITE/IIA/2004/1.
An Investment Guide to Cambodia: Opportunities and Conditions. 89 p. UNCTAD/ITE/IIA/2003/6.
http://www.unctad.org/en/docs//iteiia20036_en.pdf.
An Investment Guide to Nepal: Opportunities and Conditions. 97 p. UNCTAD/ITE/IIA/2003/2.
http://www.unctad.org/en/docs/iteiia20032_en.pdf.
An Investment Guide to Mozambique: Opportunities and Conditions. 109 p. UNCTAD/ITE/IIA/4.
http://www.unctad.org/en/docs/poiteiiad4.en.pdf.

World Investment Directory Volume X Africa 2008
714
An Investment Guide to Uganda: Opportunities and Conditions. 89 p. UNCTAD/ITE/IIA/2004/3.
An Investment Guide to Bangladesh: Opportunities and Conditions. 66 p. UNCTAD/ITE/IIT/Misc.29.
http://www.unctad.org/en/docs/poiteiitm29.en.pdf.
An Investment Guide to Ethiopia: Opportunities and Conditions. 90 p. UNCTAD/ITE/IIA/2004/2.
Issues in International Investment Agreements (Fore more information visit http://www.unctad.org/iia)
Investor–State Dispute Settlement and Impact on Investment Rulemaking. 120 p. UNCTAD/ITE/IIA/2007/3.
Preserving Flexibility in IIAs: The Use of Reservations. 104 p. Sales no.: E.06.II.D.14.
International Investment Arrangements: Trends and Emerging Issues. 110 p. Sales no.: E.06.II.D.3.
Investor–State Disputes Arising from Investment Treaties: A Review. 106 p. Sales No. E.06.II.D.1 $15
South–South Cooperation in Investment Arrangements. 108 p. Sales No. E.05.II.D.26 $15.
The REIO Exception in MFN Treatment Clauses. 92 p. Sales No. E.05.II.D.1. $15.
International Investment Agreements in Services. 119 p. Sales No. E.05.II.D.15. $15.
State Contracts. 84 p. Sales No. E.05.II.D.5. $15.
Competition. 112 p. E.04.II.D.44. $ 15.
Key Terms and Concepts in IIAs: a Glossary. 232 p. Sales No. E.04.II.D.31. $15.
Incentives. 108 p. Sales No. E.04.II.D.6. $15.
Transparency. 118 p. Sales No. E.04.II.D.7. $15.
Dispute Settlement: State-State. 101 p. Sales No. E.03.II.D.6. $15.
Dispute Settlement: Investor–State. 125 p. Sales No. E.03.II.D.5. $15.
Transfer of Technology. 138 p. Sales No. E.01.II.D.33. $18.
Illicit Payments. 108 p. Sales No. E.01.II.D.20. $13.
Home Country Measures. 96 p. Sales No.E.01.II.D.19. $12.
Host Country Operational Measures. 109 p. Sales No E.01.II.D.18. $15.
Social Responsibility. 91 p. Sales No. E.01.II.D.4. $15.
Environment. 105 p. Sales No. E.01.II.D.3. $15.
Transfer of Funds. 68 p. Sales No. E.00.II.D.27. $12.
Employment. 69 p. Sales No. E.00.II.D.15. $12.
Taxation. 111 p. Sales No. E.00.II.D.5. $12.

Selected recent UNCTAD publications on TNCs and FDI
715
International Investment Agreements: Flexibility for Development. 185 p. Sales No. E.00.II.D.6. $12.
Taking of Property. 83 p. Sales No. E.00.II.D.4. $12.
B. ASIT Advisory Studies (Formerly Current Studies, Series B)
No. 17. The World of Investment Promotion at a Glance: A Survey of Investment Promotion Practices.UNCTAD/ITE/IPC/3.
No. 16. Tax Incentives and Foreign Direct Investment: A Global Survey. 180 p. Sales No. E.01.II.D.5. $23.
Summary available from http://www.unctad.org/asit/resumé.htm.
C. Individual Studies
Globalization of R&D and Developing Countries.. 242 p. Sales No. E.06.II.D.2. $35.
Prospects for Foreign Direct Investment and the Strategies of Transnational Corporations, 2005-2008. 74 p. Sales No. E.05.II.D.32. $18.
World Economic Situation and Prospects 2005. 136 p. Sales No. E. 05.II.C.2. $15. (Joint publication with the United Nations Department of Economic and Social Affairs.)
Foreign Direct Investment and Performance Requirements: New Evidence from Selected Countries. 318 p.
Sales No. E.03.II.D.32. $35.http://www.unctad.org/en/docs//iteiia20037_en.pdf.
FDI in Land-Locked Developing Countries at a Glance. 112 p. UNCTAD/ITE/IIA/2003/5.
FDI in Least Developed Countries at a Glance: 2002. 136 p. UNCTAD/ITE/IIA/6. http://www.unctad.org/en/docs//iteiia6_en.pdf.
The Tradability of Consulting Services. 189 p. UNCTAD/ITE/IPC/Misc.8. http://www.unctad.org/en/docs/poiteipcm8.en.pdf.
Foreign Direct Investment in Africa: Performance and Potential. 89 p. UNCTAD/ITE/IIT/Misc.15. Free of
charge. Also available from http://www.unctad.org/en/docs/poiteiitm15.pdf.
TNC-SME Linkages for Development: Issues–Experiences–Best Practices. Proceedings of the Special Round
Table on TNCs, SMEs and Development, UNCTAD X, 15 February 2000, Bangkok, Thailand.113 p. UNCTAD/ITE/TEB1. Free of charge.
Measures of the Transnationalization of Economic Activity. 93 p. Sales No. E.01.II.D.2. $20.
The Competitiveness Challenge: Transnational Corporations and Industrial Restructuring in Developing
Countries. 283p. Sales No. E.00.II.D.35. $42.
FDI Determinants and TNC Strategies: The Case of Brazil. 195 p. Sales No. E.00.II.D.2. $35. Summary
available from http://www.unctad.org/en/pub/psiteiitd14.en.htm.

World Investment Directory Volume X Africa 2008
716
Studies on FDI and Development
TNCs and the Removal of Textiles and Clothing Quotas. 78 p. Sales No. E.05.II.D.20.
Measures of Restrictions on FDI in Services in Developing Countries. 56 p. Sales No. E.06.II.D.13.
The Universe of the Largest Transnational Corporations, 70 p. Sales No. E.07.II.D.6.
FDI in Tourism: The Development Dimension, 186 p. Sales No. E.07.II.D.17.
Elimination of TRIMs: The Experience of Selected Developing Countries. 172 p. Sales No. E.07.II.D.18
D. Journals
Transnational Corporations Journal (formerly The CTC Reporter). Published three times a year. Annual subscription price: $45; individual issues $20. http://www.unctad.org/en/subsites/dite/1_itncs/1_tncs.htm.
United Nations publications may be obtained from bookstores and distributors throughout the world. Please
consult your bookstore or write:
For Africa, Asia and Europe to:
Sales Section
United Nations Office at Geneva
Palais des Nations
CH-1211 Geneva 10
Switzerland
Tel: (41-22) 917-1234
Fax: (41-22) 917-0123
E-mail: [email protected]
For Asia and the Pacific, the Caribbean, Latin America and North America to:
Sales Section
Room DC2-0853
United Nations Secretariat
New York, NY 10017
United States
Tel: (1-212) 963-8302 or (800) 253-9646
Fax: (1-212) 963-3489
E-mail: [email protected]
All prices are quoted in United States dollars.
For further information on the work of the Division on Investment, Technology and Enterprise Development,
UNCTAD, please address inquiries to:
United Nations Conference on Trade and Development
Division on Investment, Technology and Enterprise Development
Palais des Nations, Room E-10054
CH-1211 Geneva 10, Switzerland
Telephone: (41-22) 907-5651
Telefax: (41-22) 907-0498
http://www.unctad.org

Questionnaire
World Investment Directory: Volume X Africa 2008
Sales No. E.08.II.D.3
In order to improve the quality and relevance of the work of the UNCTAD Division on Investment, Technology and Enterprise Development, it would be useful to receive the views of readers on this publication. It would therefore be greatly appreciated if you could complete the following questionnaire and return it to:
Readership Survey UNCTAD Division on Investment, Technology and Enterprise Development
United Nations Office at Geneva Palais des Nations, Room E-9123 CH-1211 Geneva 10, Switzerland
Fax: 41-22-917-0194
1. Name and address of respondent (optional):
2. Which of the following best describes your area of work?
Government Public enterprise Private enterprise Academic or research institution International organization Media Not-for-profit organization Other (specify) __________
3. In which country do you work? _________________________
4. What is your assessment of the contents of this publication?
Excellent Adequate Good Poor
5. How useful is this publication to your work?
Very useful Somewhat useful Irrelevant
6. Please indicate the three things you liked best about this publication:

World Investment Directory Volume X Africa 2008
718
7. Please indicate the three things you liked least about this publication:
8. If you have read other publications of the UNCTAD Division on Investment, Enterprise Development and Technology, what is your overall assessment of them?
Consistently good Usually good, but with some exceptions Generally mediocre Poor
9. On average, how useful are those publications to you in your work?
Very useful Somewhat useful Irrelevant
10. Are you a regular recipient of Transnational Corporations (formerly The CTC
Reporter), UNCTAD-DITE’s tri-annual refereed journal?
Yes No
If not, please check here if you would like to receive a sample copy sent to the name and address you have given above: