Word problems - Structural effects and defects in folksonomy and linked data approaches to web...
133
i
Transcript of Word problems - Structural effects and defects in folksonomy and linked data approaches to web...
i

ii
i
Word Problems
Structural effects and defects in folksonomy and
linked data approaches to web document classification.
Dominic Fripp
A dissertation submitted to the University of the West of England, Bristol in accordance with the
requirements of the degree of MSc in Information & Library Management.
Bristol Institute Of Technology May 2010.

ii
iii
Abstract
The size of the World Wide Web is growing at an incredible pace and many documents online have
little or no structure. Current search and retrieval paradigms focus on sophisticated keyword analysis
on text. An alternative approach is the annotation of documents with descriptive metadata
generated by web users. A further possibility is the automatic annotation of documents using
processes that exploit the semantic web.
This research investigates and compares these two different approaches to web document
classification: Folksonomies and Linked data. The theoretical background of each approach is
discussed in relation to a classification checklist. Three test document groups from Wikipedia are
classified using the techniques and the results analysed.
The two approaches were found to be qualitatively and quantitatively distinct. Folksonomies show
dispersed classification with vague boundaries but exhibit some level of self-organisation that
approaches power law distribution. The relationship between the statistical and semantic properties
of the tags was investigated but no firm conclusions were drawn. There was a suggestion that in co-
occurring tags, there is a linear relationship between pair frequency and semantic distance.
The linked data approach exhibits faceted classification properties and has a highly visual capability
which can be utilised for web navigation.

iv

v
Acknowledgements
Many thanks to Tom Tague of Open Calais for the introduction to Semantic Proxy, Kingsley Idehen
for his invaluable insights into the world of linked data and to Paul Matthews for all the advice and
guidance.

vi

vii
Author’s declaration
I declare that the work in this dissertation was carried out in accordance with the Regulations of
the University of the West of England, Bristol. The work is original except where indicated by
special reference in the text and no part of the dissertation has been submitted for any other
degree.
Any views expressed in the dissertation are those of the author and in no way represent those
of the University.
The dissertation has not been presented to any other University for examination either in the
United Kingdom or overseas.
SIGNED: ............................................................. DATE: ..........................

viii
ix
Table of Contents
Introduction 1
Background 2
The origins and structure of the research 3
Conceptual Considerations 4
Research process 4
A note on Notation 5
Summary 6
Literature Review 7
Introducing Classification 8
Defining Classification 8
Faceted classification 9
Library origins 9
Current usage 10
A checklist for classification 11
Visualisation 13
Folksonomy 15
Polythetic taxonomies 16
Structure in folksonomies 20
Co-occurrence 20
The problem of homonymy and synonymy 20
x
Flatness 21
The Long Tail 22
Power Laws 22
Structural interpretations of power laws 22
Summary 24
Ontologies and linked data 25
A definition of ontology 25
RDF and URI 26
A problem with linked data 28
Summary 29
Research Design 30
Research aims restated 31
Ethical considerations 32
Research instruments for tags 33
Fetching tags 33
Displaying tag hierarchy visually 34
Research tools that use linked data 35
Thomson Reuters Semantic Proxy 35
Visualising metadata using Thinkpedia 37
Keyword generation 38
Document word count 38
Analysing Data 39
Similarity 39
Statistical similarity 39
xi
Semantic similarity 40
Design walkthrough 42
Document tags obtained from Delicious 42
Keyword analysis 43
Document word count 43
Semantic Proxy document analysis 44
Thinkpedia map 45
Similarity measurement 46
Findings 47
Collection and analysis of test document clusters 48
Tags as subject headings 48
Classification checklist re-examined 50
Analysing the idea plane 51
Differentiation and mutual exclusivity 51
Relevance 51
Homogeneity 54
Analysing the verbal plane 57
Context and currency 57
Analysing the notational plane 59
Synonymy and homonymy 59
Scalability 60
Similarity 61
Comparison of tag frequency and tag semantic distance 64
Interpretation 67
Long Tail 69
xii
Visualisation of Tag Density in document clusters 69
Power Law Distribution 71
Zipf’s Law 71
80/20 Rule 72
Evidence of power law 73
Conclusion 74
The classification checklist revisited 75
Similarity revisited 76
Structural properties revisited 77
Properties of co-occurrence 77
The long tail 77
Faceted or diffuse classification 78
Visualising the structures 78
Summary 79
References 81
Bibliography 86
Appendices 90
Appendix 1 – 20 document concept maps 90
Appendix 2 – Software research tools 111
Appendix 3 - A notational convention for tags and concepts 114
Word Count: 17, 131
xiii
List of Illustrations
Literature Review
Figure 1.1 (table) – A comparison between three different domains 10
Figure 1.2 – Hierarchical Relationship e.g. Taxonomy 13
Figure 1.3 – Associative relationship e.g. Thesaurus 13
Figure 1.4 – Faceted (multiple hierarchies) 14
Figure 1.5 – Folksonomy (flat and unconnected structure) 15
Figure 1.6 – A top down taxonomy 16
Figure 1.7 – Class relation is logical “part-of” 16
Figure 1.8 – The blurred boundaries of a polythetic taxonomy 18
Figure 1.9 (table) – The classification checklist for folksonomies 24
Figure 1.10 - Ontology (multi-relational structure) 25
Figure 1.11 – Workflow for machine processing text into RDF 27
Figure 1.12 – Calais finds and extracts entities, facts and events 27
Figure 1.13 (table) – The classification checklist for linked data 29
Research Design
Figure 2.1 - Tag cloud for all text in Research Design Section 35
Figure 2.2- Document ontology map for UWE entry in Wikipedia 37
Figure 2.3 – hyponym taxonomy in WordNet 40
Figure 2.4 – Wordnet flexes its homonymic muscles and carves up Turkey 41
Figure 2.5 – Wordle cloud for Delicious tags on Tosca document 42
Figure 2.6 – Wordle cloud of top ten highest frequency words from Tosca document 43
Figure 2.7 – Thinkpedia concept map for http://en.wikipedia.org/wiki/Tosca 45
Findings
Figure 3.1 - Document Cluster EB1 48
Figure 3.2 - Document Cluster GH2 48
Figure 3.3 - Document Cluster IS3 49
xiv
Figure 3.4 (table) – Classification Checklist 50
Figure 3.5 – Relationship between class extraction and document size 52
Figure 3.6 – Relationship between instance extraction and document size 53
Figure 3.7 – Concept map of GH2-20 54
Figure 3.8 - Comparison of Class Occurrence in EB1, GH2 and IS3 55
Figure 3.9 – Tag class occurrence compared to Semantic Proxy class occurrence 56
Figure 3.10 – Top 5 Tag cloud for EB1 cluster 57
Figure 3.11 – Top 5 Tag cloud for GH2 cluster 57
Figure 3.12 – Top 5 Tag cloud for GH2 cluster 57
Figure 3.13 – Top 5 Tag cloud for GH2 cluster 58
Figure 3.14 – Top 5 Tag cloud for GH2 cluster 58
Figure 3.15 – Top 5 Tag cloud for GH2 cluster 58
Figure 3.16 - Similarity Comparison EB1 61
Figure 3.17 - Similarity comparison GH2 61
Figure 3.18 - Similarity comparison IS3 62
Figure 3.19 - Tag Pair semantic relation EB1 64
Figure 3.20 – Network map of co-occurring tags of biology and evolution 64
Figure 3.21 - Semantic distance between co-occurring tags in the GH2 cluster 65
Figure 3.22 - Network map of co-occurring tags of greek and history 65
Figure 3.23 - Semantic Distance of co-occurring Tags for IS3 cluster 66
Figure 3.24 - Network map of co-occurring tags of information and science 66
Figure 3.25 - Tag distribution in document clusters EB1, GH2, IS3 69
Figure 3.26 – Tag density for EB1 cluster 70
Figure 3.27 – Tag density for GH2 cluster 70
Figure 3.28 – Tag density for IS3 cluster 70
Figure 3.29 - Term frequency (1st/2nd) compared to Zipf's Law 71
Figure 3.30 - 80 /20 Rule on document clusters 72
Figure 3.31 - Logarithmic Tag Frequency distribution 73
xv
Conclusion
Figure 4.1 – Checklist successes, failures and inconclusives 80
Appendix 1
Figure 7.1 : EB1-1 - http://en.wikipedia.org/wiki/Apoptosis 91
Figure 7.2 : EB1-2 - http://en.wikipedia.org/wiki/Archaeopteryx 92
Figure 7.3 : EB1-4 - http://en.wikipedia.org/wiki/Bat 93
Figure 7.4 : EB1-8 – http://en.wikipedia.org/wiki/David_Attenborough 94
Figure 7.5 : EB1-11 - http://en.wikipedia.org/wiki/Ernst_Haeckel 95
Figure 7.6 : EB1-17 – http://en.wikipedia.org/wiki/Genetic_algorithm 96
Figure 7.7 : GH2-1 – http://en.wikipedia.org/wiki/Diogenes_of_Sinope 97
Figure 7.8 : GH2-2 – http://en.wikipedia.org/wiki/Ancient_Greece 98
Figure 7.9 : GH2-6 – http://en.wikipedia.org/wiki/Antikythera_mechanism 99
Figure 7.10 : GH2-8 - http://en.wikipedia.org/wiki/Plato 100
Figure 7.11 : GH2-10 – http://en.wikipedia.org/wiki/Alexander_the_Great 101
Figure 7.12 : GH2-15 – http://en.wikipedia.org/wiki/Battle_of_Thermopylae 102
Figure 7.13 : GH2-17 - http://en.wikipedia.org/wiki/Epicurus 103
Figure 7.14 : GH2-20 - http://en.wikipedia.org/wiki/Dionysus 104
Figure 7.15 : IS3-2 - http://en.wikipedia.org/wiki/Nutrition 105
Figure 7.16 : IS3-8 – http://en.wikipedia.org/wiki/Double-slit_experiment 106
Figure 7.17 : IS3-15 - http://en.wikipedia.org/wiki/Akhenaten 107
Figure 7.18 : IS3-17 – http://en.wikipedia.org/wiki/Nuclear_weapon 108
Figure 7.19 : IS3-19 – http://en.wikipedia.org/wiki/Leonhard_Euler 109
Figure 7.20 : IS3-20 – http://en.wikipedia.org/wiki/Salvia_divinorum 110
Appendix 3
Figure 9.1 – The difference between a symbol that represents an object and a 115
{symbol} that represents a [concept]

1
Introduction
2
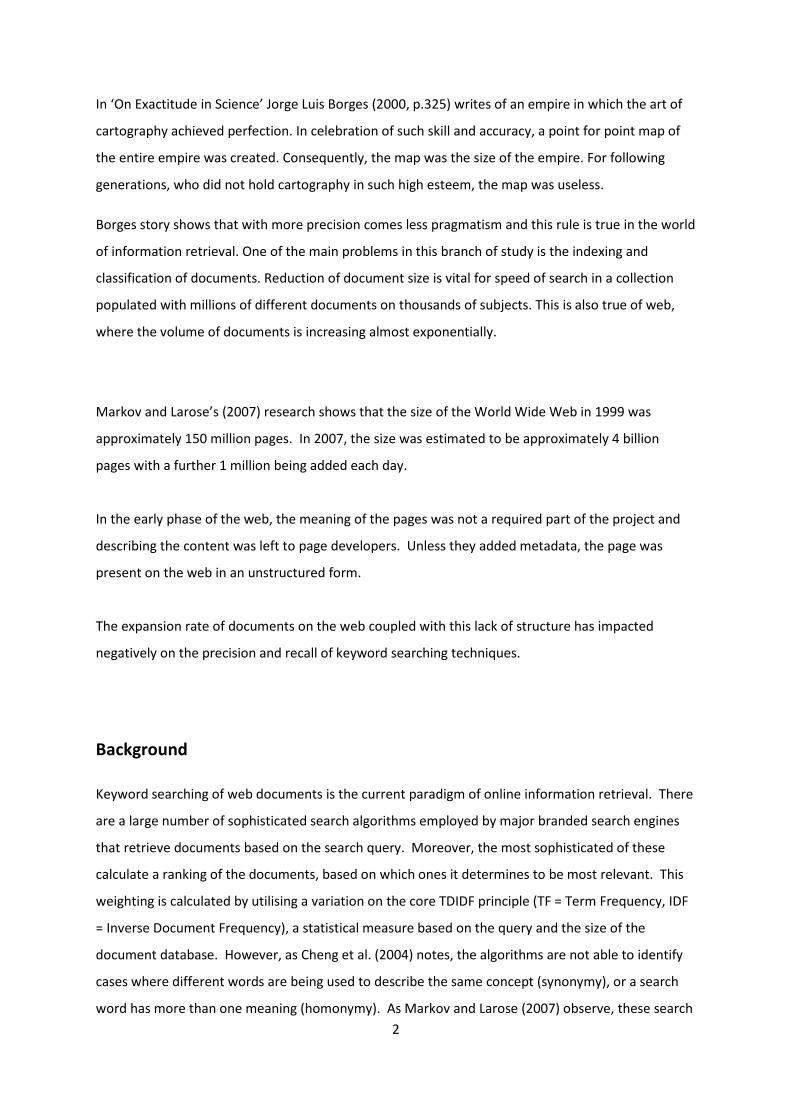
In ‘On Exactitude in Science’ Jorge Luis Borges (2000, p.325) writes of an empire in which the art of
cartography achieved perfection. In celebration of such skill and accuracy, a point for point map of
the entire empire was created. Consequently, the map was the size of the empire. For following
generations, who did not hold cartography in such high esteem, the map was useless.
Borges story shows that with more precision comes less pragmatism and this rule is true in the world
of information retrieval. One of the main problems in this branch of study is the indexing and
classification of documents. Reduction of document size is vital for speed of search in a collection
populated with millions of different documents on thousands of subjects. This is also true of web,
where the volume of documents is increasing almost exponentially.
Markov and Larose’s (2007) research shows that the size of the World Wide Web in 1999 was
approximately 150 million pages. In 2007, the size was estimated to be approximately 4 billion
pages with a further 1 million being added each day.
In the early phase of the web, the meaning of the pages was not a required part of the project and
describing the content was left to page developers. Unless they added metadata, the page was
present on the web in an unstructured form.
The expansion rate of documents on the web coupled with this lack of structure has impacted
negatively on the precision and recall of keyword searching techniques.
Background
Keyword searching of web documents is the current paradigm of online information retrieval. There
are a large number of sophisticated search algorithms employed by major branded search engines
that retrieve documents based on the search query. Moreover, the most sophisticated of these
calculate a ranking of the documents, based on which ones it determines to be most relevant. This
weighting is calculated by utilising a variation on the core TDIDF principle (TF = Term Frequency, IDF
= Inverse Document Frequency), a statistical measure based on the query and the size of the
document database. However, as Cheng et al. (2004) notes, the algorithms are not able to identify
cases where different words are being used to describe the same concept (synonymy), or a search
word has more than one meaning (homonymy). As Markov and Larose (2007) observe, these search
3
techniques are not concerned with the syntax or the meaning of the words. In essence, the
document is treated as a bag of words where the order has no specific value. In the last few years,
major search engine companies have deployed various strategies to improve recall and relevancy.
Similarity clustering is a technique that utilizes the user’s document selection to improve the
relevancy of the next search. Lux (2008) notes that link analysis is more successful than the simple
term weighting of TFIDF because it looks at the links contained within a document and uses those as
a guide to relevancy by assuming that linked documents are on a similar topic. This small scale
networking of the web drives search models like Page Rank (Lux, 2008).
If metadata could be added to each new web document (a process known as annotation) and added
to all the documents that were already on the web then the potential for the document to be
retrieved would increase. In such an information environment, search engines need not guess as
each document could effectively speak for its own content. To keep pace with the volume of
documents, and for classification to be cost effective, it can be argued that there is a need for these
systems and techniques to be automated. The lesson to draw from Borges cartographers map
parable is deciding what kind of metadata and to what end will it be used.
Specific languages have been developed to help with the discovery and retrieval of web documents.
Dublin Core is a simplified cataloguing language which sets out fifteen main access points to a
document, one of which is related to subject keywords which are equivalent to subject headings in
print classification.
Although designed for easy interoperability between different knowledge domains, metadata
languages like Dublin Core have their heritage in the highly structured document world of print. It is
more likely that most of the documents on the web do not fit this notion of authorship. In addition,
the manual annotation of documents is very expensive (Nagypal, 2005). Even the most structured of
document domains have no formalized access points such as Author or Title. Cooperative document
environments such as Wikipedia challenge the notion of authorship as any user can make a content
contribution. In such an environment user tagging can provide valuable information about what a
document is about.
4
The origins and structure of the research
The major motivation for undertaking the research was the lack of connectivity to the library
environment in the literature. Whilst it is understandable that research in the field of information
retrieval would be dominated by studies from computer scientists, the concept of classification is
built into the foundations of library science. With the World Wide Web exerting a burgeoning
influence on information research methods, finding the right information has never been more
important, but never more difficult.
Conceptual Considerations
On the assumption that these technical approaches are beyond a large proportion of library
professionals (including the author), the following design criteria were decided:
1) The research should require no prior specialised knowledge. Any particular knowledge
essential to the mechanics of the research is included within the design.
2) The research should only make use of tools that were freely available on the Web. A list of
software and where to find it is included in Appendix II.
3) The entire project should be reproducible with access to one computer and the internet.
Research process
This research aims to investigate specific aspects of two different approaches to the problem of web
document classification. The first is the co-operative tagging environments of user generated
metadata known as Folksonomies. The second is an automatic annotation process that uses
machine readable languages such as RDF and open information networks known as linked data.
5
Initially, the literature review will examine basic properties of classification and argue that concepts
advanced by Ranganathan in the twentieth century have much in common with the modern concept
of classification on the web, particularly to the topic of domain modeling. This initial argument
attempts to explain both the processes in terms of basic classification concepts
Having identified some core notions of classification, a consideration of folksonomies and linked
data tool (Semantic Proxy) will be made, based on the formulation of a classification checklist and a
series of research questions. The checklist predicts the different properties of each approach based
on the core notions already discussed. Three document test groups will be used, based on
Wikipedia documents clustered around the following tags in the Delicious bookmarking site.
(1) Evolutionary biology (referred to as EB1 in the text)
(2) Greek history (referred to as GH2 in the text)
(3) Information Science (referred to IS3 in the text)
The research design looks at the function of the instruments used and the motivation for using
them. The principles supporting data analysis are examined, including a focus on measuring
statistical and semantic similarity. In order to highlight any related weaknesses in the methodology,
the section concludes with a design walkthrough.
The findings will look for statistical and semantic similarities in the classificatory output of the two
approaches. These results will be compared to a keyword indexing of the documents. There will
also be an investigation into what other structural features in the linked data and Folksonomy
metadata can be identified. These structures are then visualized to assess their suitability as a web
navigation aid.
A note on Notation
In the text, all words that denote tags are bracketed by { }. All concepts or classes mentioned within
the text as such are bracketed with [ ]. The need for this notation is discussed in Appendix III.
6
Summary
The aims of this research can be summarised as follows.
Research questions
1) Formulate a classification checklist against which the two methods can be evaluated
and compared.
2) How similar are the two approaches?
a) What is the statistical similarity of the metadata?
b) What is the semantic similarity of the metadata?
c) How different are these approaches from a conventional keyword
representation of documents?
3) Do metadata tags show any inherent structure?
a) What are the properties of co-occurring tags?
b) Does Folksonomy metadata exhibit a long tail?
c) Are the classifications faceted or diffuse?
d) How can the structures be visualized?

7
Literature Review
8
Introducing Classification
Classification lies at the heart of any attempt to organise. Whether it is books on the library shelf,
food along supermarket aisles or genetic sequences in a database, the online world of today
presents fresh challenges for classification schemes. The sheer wealth of data and documents now
available on the World Wide Web are there in unstructured form. The notion of structure in this
example relates to the presence of structural and/or descriptive metadata.
The traditional notion of classification in the library environment arose from concentration on
printed materials and their arrangement within a physical space. However, in the world of digital
documents, there is no shelf (Shirky, 2005). Classification relies on a more descriptive element
(Broughton, 2006), i.e. the subject allocation (Langridge, 1992) that will aid information retrieval.
Recent approaches to document classification employ syntactic rather than statistical approaches to
enable subject analysis. Some techniques have emerged from the burgeoning semantic web project:
the drive to make all web data machine readable. Others have arisen from the boom in web based
social networking. Both of these approaches seem far removed from the classification principles
upon which Ranganathan created his colon classification scheme. However, when some of the
conceptual foundations are considered, there are clear parallels between the classification
programme that Ranganathan laid out and the realm of domain modelling: a core principle in the
design of taxonomies, thesauri, and ontologies.
Defining Classification
To make this relationship more explicit, consider three definitions of classification from Schwarz
(2005):
1. Classifying as a verb is synonymous with domain modelling: the act of grouping together similar or
related concepts and arranging the resulting groups in a logical way.
9
2. Classification as a noun is the resulting domain model.
3. A second meaning of classifying as a verb is used in relation to instances. Instances are classified
according to an existing domain model in order to organize them, for example classifying individual
books in a library according to the Dewey Decimal Classification System.
A common example in the literature, (Broughton, (2006), Denton (2003) and Morville & Rosenfeld
(2006) have examples) is classifying wine. Taking that as the domain, the concepts that best
describe wine can be allocated and used as a way of grouping similar properties together. Four
properties that a wine is commonly described by are grape, region, price, year. Instances of wine
are the bottles themselves, which are organized according to the concept schedule. As new
instances of wine occur, the schedule can be extended to ensure that these wines also fall within the
scope of the domain.
Faceted classification
The type of classification scheme being utilized in the wine example is a faceted system. As Denton
(2003) observes, these schemes are used a great deal on large websites to help group products or
services. Anyone familiar with eBay, Amazon, or price comparison websites, is accustomed to
choosing instances from a selection of properties and browsing the results. It is useful to keep these
kinds of examples in mind, as the library equivalent uses vocabulary that makes the whole scheme
sound very different.
Library origins
The chief exponent of this type of scheme in the library context was Ranganathan. In Ranganathan’s
terminology, concepts can be read as facets. It is said that the inspiration for his colon classification
scheme was the toy Meccano (Beghtol, 2008). The implication was that complex objects could be
built up from a finite set of variables, or facets.
Equivalently, for the purposes of classification, Ranganathan argued that any subject, no matter how
complex, could be built from the same set of basic components. His universal system was
10
PMEST (Personality, Matter, Energy, Space, Time): a five facet arrangement that focused on the
concepts inherent in the subject matter of documents, rather than the allocation of a single place on
a pre-existing branch of an enumerative structure such as Dewey Decimal Classification (DDC). His
schema was designed to cope with any conceivable document (Ranganathan, 1960).
Current usage
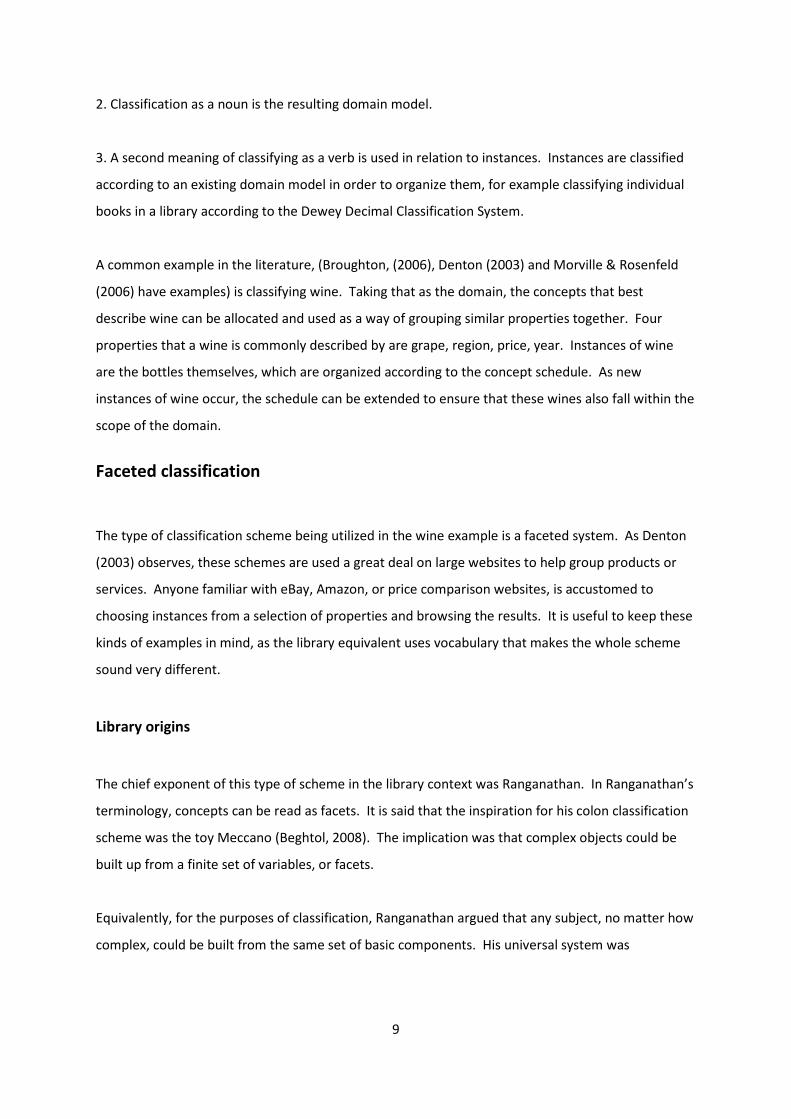
An example can show how these different approaches relate to one another. The FAST (Faceted
Application of Subject Terminology) schema (O’Neill et al., 2001) leverages Library Of Congress (LoC)
subject headings data from bibliographic records and adds them as searchable metadata. Taking
this example, with Ranganathan’s PMEST and the wine domain, the following correlation can be
determined:
FAST facets Ranganathan facets Wine concepts
Topic Personality Grape
Geographical Space Region
Period Time Year
Form Matter Price
Figure 1.1 – A comparison between three different domains
Although the comparison is not perfect, it shows a conceptual similarity to the three approaches and
an attempt to fulfil the criteria of Schwarz’s point 1 regarding domain modelling. Another way of
talking about the number of variables in each domain is to talk of its dimensionality. The PMEST
formula has five dimensions: five degrees of freedom that can change for any description. In the
wine example above, the dimensionality is four.
11
A checklist for classification
In his writings, Ranganathan (via Langridge, 1994) outlined a three step approach to document
classification that can be added to Schwarz’s definitions.
Based on the work of the Classification Research Group, Spiteri (1998) has expanded upon each of
these statements. The subdivisions clarify some of the operative processes and criteria through
which the act of classification can be understood. Crucially, it forms a checklist to which the
Folksonomy and linked data classification processes can be compared.
Idea plane - Subject analysis in one’s own words, including form of knowledge, topic, and
any lesser forms that apply.
(a) Differentiation: use characteristics of division (i.e., facets) that will distinguish clearly
among component parts.
(b) Relevance: reflect the purpose, subject, and scope of the classification system.
(e) Homogeneity: each facet must represent only one characteristic of division.
(f) Mutual Exclusivity: the contents of any two facets cannot overlap.
Verbal plane - Examination of the schedules to find the necessary concepts.
(a) Context: the meaning of an individual term is given its context based upon its position
in the classification system.
(b) Currency: terminology used in a classification system should reflect current usage in the
subject field
12
Notational plane - Construction of notation for the subject according to the scheme’s rules.
(a) Synonym: each subject can be represented by only one unique class number
(b) Homonym: each class number can represent only one unique subject.
(c) Hospitality: notation should allow for the addition of new subjects, facets, and foci, at
any point in the classification system
Spiteri’s expansion includes many more criteria than shown here. The criteria for inclusion are
based on the relevancy to forthcoming discussion.
Step 1 is the analytical part (performed by person or computer) to Step 3’s synthetic. The analytico-
synthetic (Ranganathan, 1960) is the decon / recon-structive process of facet analysis. Step 2 is the
medium over which this process can take place. The PMEST formula occupies this space in that it
provides the vocabulary by which the classification can be expressed. For wine, Zinfandel, Merlot
and French would be examples of the vocabulary that would be used. In the user generated tag
ecology of the web, English would be a typical domain vocabulary. Step 3 describes the logical
consistency of how the classification is presented. Hospitality is best described as scalability in
modern thinking about the World Wide Web. Scalability is the ability of a system to cope with its
own expansion in size or performance. Interoperability can be understood as a subset issue of
scalability because the ability for systems to work together is an essential part of increasing
performance.
Spiteri’s conclusion is that the language of the classification criteria could be simplified further to
keep classification more accessible and comprehensible. In keeping with this, the steps can be
reduced to the following, more fundamental elements:
1. Document analysis for topics (subjects).
2. Relating topics (subjects) to domain concepts.
3. Expressing the concepts using domain notation.
13
term
broader term
Related term
narrower term
prefered term
Figure 1.2
Hierarchical Relationship
e.g. Taxonomy
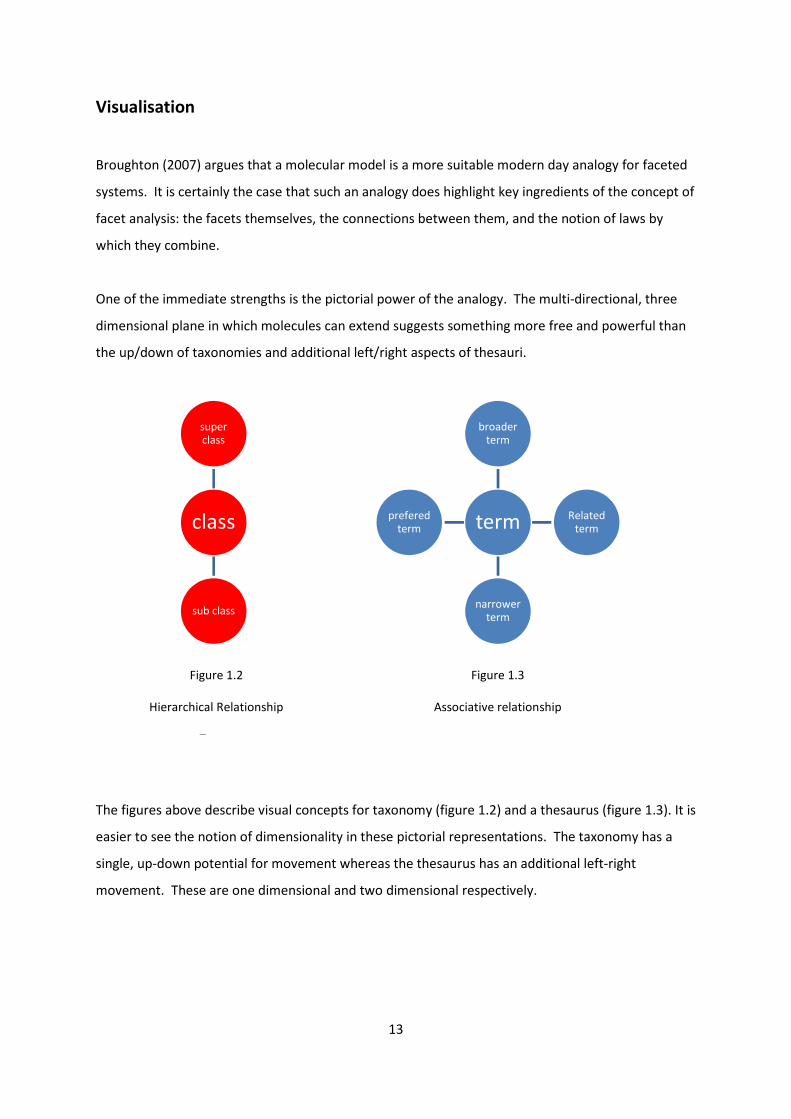
Visualisation
Broughton (2007) argues that a molecular model is a more suitable modern day analogy for faceted
systems. It is certainly the case that such an analogy does highlight key ingredients of the concept of
facet analysis: the facets themselves, the connections between them, and the notion of laws by
which they combine.
One of the immediate strengths is the pictorial power of the analogy. The multi-directional, three
dimensional plane in which molecules can extend suggests something more free and powerful than
the up/down of taxonomies and additional left/right aspects of thesauri.
The figures above describe visual concepts for taxonomy (figure 1.2) and a thesaurus (figure 1.3). It is
easier to see the notion of dimensionality in these pictorial representations. The taxonomy has a
single, up-down potential for movement whereas the thesaurus has an additional left-right
movement. These are one dimensional and two dimensional respectively.
Figure 1.3
Associative relationship
class
super class
Related term
sub class
prefered term
14
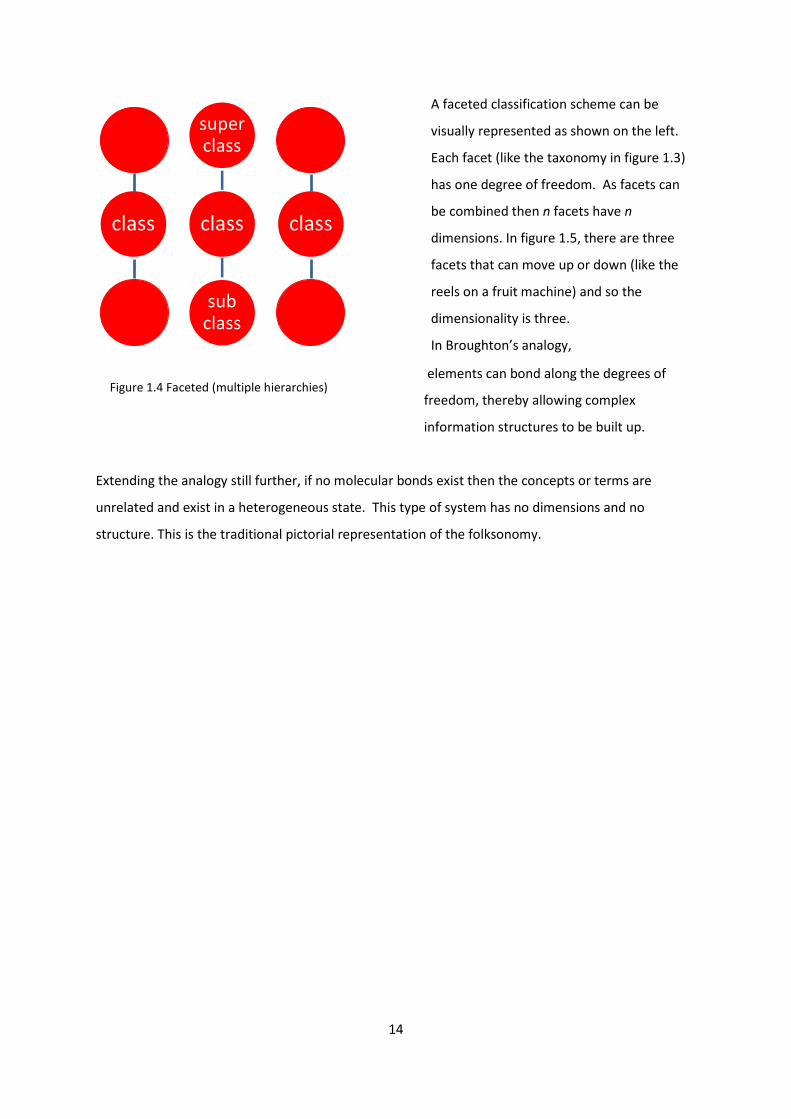
Figure 1.4 Faceted (multiple hierarchies)
class
super class
class
sub class
class
A faceted classification scheme can be
visually represented as shown on the left.
Each facet (like the taxonomy in figure 1.3)
has one degree of freedom. As facets can
be combined then n facets have n
dimensions. In figure 1.5, there are three
facets that can move up or down (like the
reels on a fruit machine) and so the
dimensionality is three.
In Broughton’s analogy,
elements can bond along the degrees of
freedom, thereby allowing complex
information structures to be built up.
Extending the analogy still further, if no molecular bonds exist then the concepts or terms are
unrelated and exist in a heterogeneous state. This type of system has no dimensions and no
structure. This is the traditional pictorial representation of the folksonomy.
15
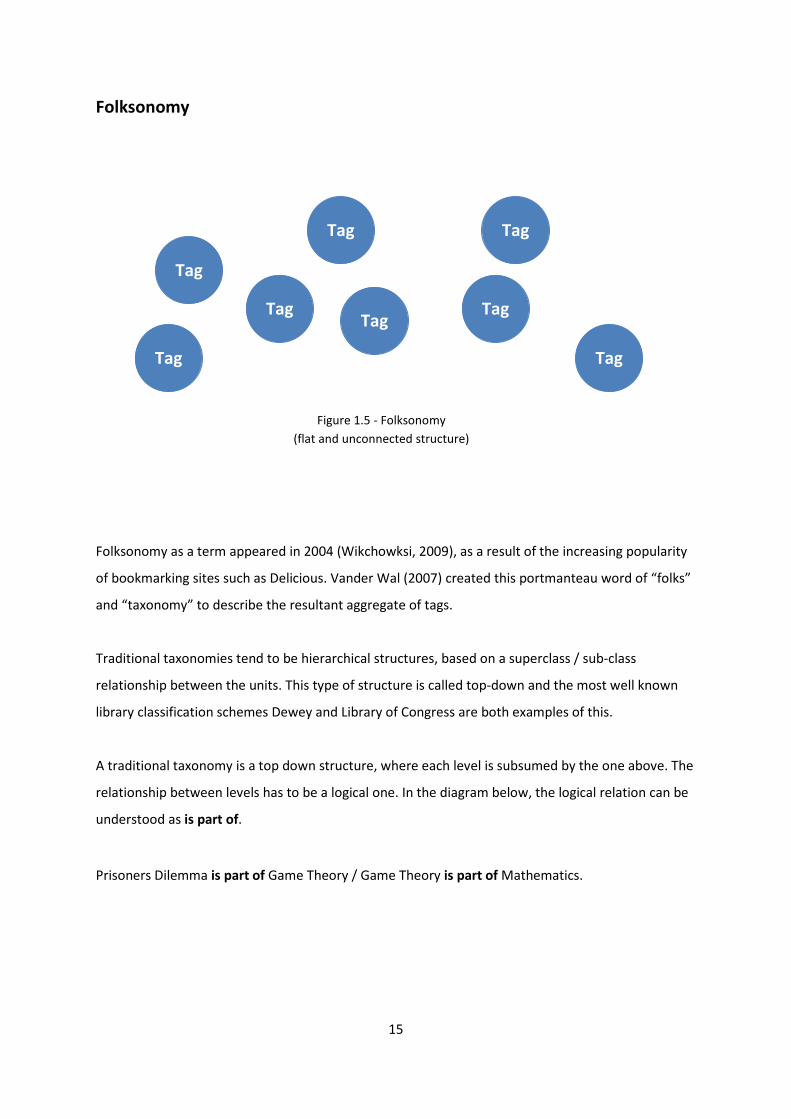
Folksonomy
Folksonomy as a term appeared in 2004 (Wikchowksi, 2009), as a result of the increasing popularity
of bookmarking sites such as Delicious. Vander Wal (2007) created this portmanteau word of “folks”
and “taxonomy” to describe the resultant aggregate of tags.
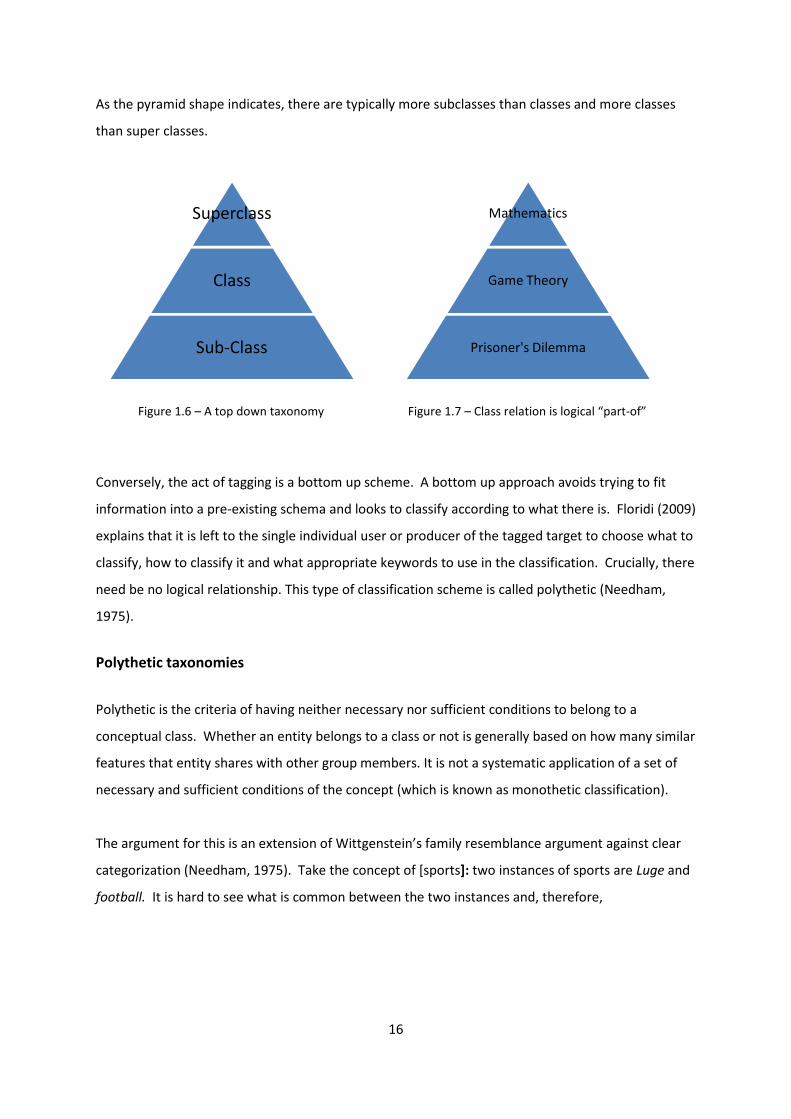
Traditional taxonomies tend to be hierarchical structures, based on a superclass / sub-class
relationship between the units. This type of structure is called top-down and the most well known
library classification schemes Dewey and Library of Congress are both examples of this.
A traditional taxonomy is a top down structure, where each level is subsumed by the one above. The
relationship between levels has to be a logical one. In the diagram below, the logical relation can be
understood as is part of.
Prisoners Dilemma is part of Game Theory / Game Theory is part of Mathematics.
Tag
Tag
Tag
Tag
Tag Tag
Tag
Tag
Figure 1.5 - Folksonomy
(flat and unconnected structure)
16
As the pyramid shape indicates, there are typically more subclasses than classes and more classes
than super classes.
Conversely, the act of tagging is a bottom up scheme. A bottom up approach avoids trying to fit
information into a pre-existing schema and looks to classify according to what there is. Floridi (2009)
explains that it is left to the single individual user or producer of the tagged target to choose what to
classify, how to classify it and what appropriate keywords to use in the classification. Crucially, there
need be no logical relationship. This type of classification scheme is called polythetic (Needham,
1975).
Polythetic taxonomies
Polythetic is the criteria of having neither necessary nor sufficient conditions to belong to a
conceptual class. Whether an entity belongs to a class or not is generally based on how many similar
features that entity shares with other group members. It is not a systematic application of a set of
necessary and sufficient conditions of the concept (which is known as monothetic classification).
The argument for this is an extension of Wittgenstein’s family resemblance argument against clear
categorization (Needham, 1975). Take the concept of [sports]: two instances of sports are Luge and
football. It is hard to see what is common between the two instances and, therefore,
Superclass
Class
Sub-Class
Mathematics
Game Theory
Prisoner's Dilemma
Figure 1.6 – A top down taxonomy Figure 1.7 – Class relation is logical “part-of”
17
hard to understand the necessary and sufficient criteria by which they both belong to the class (i.e.
are subsumed by) [sports]. Yet it does not seem controversial to refer to both instances as [sports].
The polythetic view is that in a class such as [sports], the number of criteria for belonging is so vast
that there is no reason to believe that all properties would be distributed equally and evenly. As a
result, the class of [sports] would exhibit blurred boundaries.
Beckner (1968, p.22) sets out three criteria to explain how this type of associative classification
schema might work.
1. Each entity possesses a large (but unspecified) number of properties of the class.
2. Each property of the class is possessed by large numbers of these entities.
3. No property of the class is possessed by all of the entities.
Statement 3 is the key, and once this is accepted, then, reductio ad absurdum, the logical necessity
of the relationship between class and sub-class disappears. Sutcliffe (from Gyllenberg and Koski,
1996) argues if that were the case, i.e. there are no necessary conditions for what belongs to a
class, then it makes no logical sense to talk in terms such as class and concept. This argument seems
to miss the point in that there clearly is a problem with the overall concept of classification if it can
support both definitions, but dismissing one of the definitions is only side-stepping the problem. If
Beckner’s polythetic taxonomy is to work then two questions suggest themselves: what constitutes
large? What number of properties is too few to belong to the class? Unfortunately these questions
themselves are subject to the problem of vagueness.
The problem of blurred edges has its origins in Sorites paradox (Hyde, 2005) and the vagueness of
predicates is often blamed. Sorensen (2006) describes vagueness as any concept that exhibits
borderline cases. One perspective is that borderline statements lack a truth-value and are not
classifiable in the traditional sense. Another is that such cases can only be understood if there exists
a range of logical outcomes with values between 0 and 1. As with many philosophical arguments,
neither is conclusive.
any classification technique based
demand) depends on a set of criteria independent of necessary and sufficient conditions.
regards to classification protocols using many valued and fuzzy logic, such work is explored in Zhang
and Song (2006).
The statistical distribution of properties is an imp
classification techniques. Such techniques can also work in the analysis of tags, provided the corpus
is large. Shirky’s mantra - here comes everybody
enterprise is that the numbers count.
more subjective the value of the tags.
folksonomies is this subjectivity and how it necessarily hinders the quest for
system of tags. However, the more people involved in the tagging enterprise, the more aggregated
the folksonomy becomes. The input of many, in theory, produces so many tags that a consensus is
formed. It is true that there is no gua
but it is almost certain that the example she gives, of an image of a black horse being tagged white
horse, would be at the margins of the overall tag spectrum for any entity.
Figure 1.8 – The blurred boundaries of a
polythetic taxonomy
18
Vagueness does give a fresh insight into the
motivation for the principles in the
Ranganathan and CRG clas
checklist. Each part of the recipe seeks to
eliminate vagueness from the classification
process, whether it is the eradication of
homonyms or the correct order for
notation.
Although there is philosophical debate
around these ideas, it is suf
posit the existence of an alternative means
of classification from the traditional
hierarchical design. It could be argued that
any classification technique based on a statistical clustering method (as Beckner’s recipe seems to
ends on a set of criteria independent of necessary and sufficient conditions.
regards to classification protocols using many valued and fuzzy logic, such work is explored in Zhang
The statistical distribution of properties is an important interpretation for the clustering
classification techniques. Such techniques can also work in the analysis of tags, provided the corpus
here comes everybody - indicates that the value in any crowd sourcing
at the numbers count. The likely reason for this is that the fewer the numbers, the
more subjective the value of the tags. Peterson (2006) claims that the central weakness of
folksonomies is this subjectivity and how it necessarily hinders the quest for consistency within a
However, the more people involved in the tagging enterprise, the more aggregated
The input of many, in theory, produces so many tags that a consensus is
It is true that there is no guarantee to Peterson that this consensus does not carry errors
but it is almost certain that the example she gives, of an image of a black horse being tagged white
horse, would be at the margins of the overall tag spectrum for any entity.
The blurred boundaries of a
polythetic taxonomy
Vagueness does give a fresh insight into the
motivation for the principles in the
Ranganathan and CRG classification
checklist. Each part of the recipe seeks to
eliminate vagueness from the classification
process, whether it is the eradication of
homonyms or the correct order for
Although there is philosophical debate
around these ideas, it is sufficient here to
posit the existence of an alternative means
of classification from the traditional
It could be argued that
a statistical clustering method (as Beckner’s recipe seems to
ends on a set of criteria independent of necessary and sufficient conditions. With
regards to classification protocols using many valued and fuzzy logic, such work is explored in Zhang
ortant interpretation for the clustering
classification techniques. Such techniques can also work in the analysis of tags, provided the corpus
indicates that the value in any crowd sourcing
The likely reason for this is that the fewer the numbers, the
Peterson (2006) claims that the central weakness of
consistency within a
However, the more people involved in the tagging enterprise, the more aggregated
The input of many, in theory, produces so many tags that a consensus is
rantee to Peterson that this consensus does not carry errors
but it is almost certain that the example she gives, of an image of a black horse being tagged white
19
Although the complaints by Peterson are valid, they miss the mark because tags aren’t supposed to
be the same as controlled vocabularies and to look at what they’re not is to miss what they are.
Gruber (2005) alludes to the comparison being like comparing an apple and an orange: both are
different examples of a broader descriptive enterprise.
Smith (2008) notes that websites such as LibraryThing are mixing some bottom-up and top-down
structure. Echoing suggestions by Gruber (2005), the TagMash system allows the user community to
weight tags (and thereby increase relevancy) and choose a preferred term from a controlled list of
synonym equivalences. Often, communities are allowed to like / dislike items, creating a self
organised hierarchy for the tags and arriving at a loose but democratically sanctioned controlled
vocabulary.
Tagging is fast paced and ephemeral, which gives it a descriptive advantage over “brittle” (Floridi,
2009) ontologies. Tag language, in this respect is diachronic, i.e. able to change over time. This
change occurs because, arguably, tags represent natural language use (Wichowski, 2009) and
therefore be better suited to natural language search enquiries. Floridi notes that tagging is fully
scalable and that a single tag is adding value as soon as it is created. An example of this would be
tagging documents in an enterprise environment. Specialist fields require specialist vocabularies,
but tags can make an additional semantic layer to aid document retrieval (Smith, 2008). As such,
tagging potentially offers any controlled vocabulary additional granularity. In the example of the
enterprise example given by Holgate (2004), tagging would help assist with the time consuming
process of identifying and classifying key concepts.
Floridi (2009) argues that ontologies have a low degree of resilience. Tagging, when mistaken, does
not cause too much trouble, but ontology is brittle. Ontologies also suffer from a limited degree of
modularity. Every bottom-up tag helps immediately, but systematic, top-down, exhaustive and
reliable descriptions of entities are useless without a large economy of scale.
20
Structure in folksonomies
Co-occurrence
Lalwani and Huhns (2009) formulated and tested three hypotheses that they claim reveals implicit
class-sub class structure in folksonomies. All three make a statement about the properties of co-
occurrence: the phenomenon that some tags appear with other tags more frequently than others.
The threshold of co-occurrence is set by the cardinality, or number of elements in the set (Kunen,
1980).
Lalwani and Huhns found that two of their hypotheses held for their data. The relationship
between co-occurring tags was often a class/sub-class pair. A method to measure this is discussed in
the research design.
Delicious gives a list of tags that co-occur with any given tag. This indicates that whilst it is
theoretically possible for a folksonomy to be completely flat, the reality is that, given a large
community of users, some tags will be more popular than others and some will occur more
frequently than others. From the data Delicious can provide, it is possible investigate these
hypotheses for the Delicious folksonomy.
The problem of homonymy and polysemy
Perhaps the biggest problem that folksonomies face is that of homonymy and polysemy. Without a
set of semantic rules, words such as tank are of indeterminate meaning. Keyword search approaches
will always encounter this problem. Controlled vocabularies, such as a thesaurus tackle this problem
by suggesting preferred terms to avoid confusion.
As tags do not exist in isolation, it is possible that the meaning of bank could be determined by
looking at what other tags are present. A content of a document tagged {bank} can be better
21
assessed by looking at the tags that appear alongside {bank}. For instance, only one further tag
would need to appear (either {finance} or {river}) for {bank} to be disambiguated.
It could be argued that the following tag sequence {film, movie, cinema} are three tags with the
same meaning. Shirky (2005) is adamant that the power of folksonomies is that the three tags are
not equivalent and the value of tags is in their potential to mimic the diversity of language, as
Wichowski mentions.
Flatness
Liu and Gruen (2008) concluded that for the (untrained) human driven ontology development they
measured, the subjects tended to use classes at a common object or instance level. For example,
the class was labelled {chair} rather than {furniture} and sub classes (a specification such as
{armchair}) rarely added. The consequence of this was that the ontologies designed were quite flat.
It could be argued that this flatness is the untrained factor. Speller (2007) refers to this as basic level
variation. Two users, when confronted with a picture of a particular garden bird will tag according to
the depth of their knowledge. Someone with no specialist knowledge may tag {bird} whereas an
ornithologist will tag {robin}.
This is not to say that complex relationships cannot be established between the tags, but that
without the input of some expert domain knowledge, the overall structure tends to remain quite
flat.
Markines et al (2009) propose that the tagging process can be converted into a triple if one takes the
process to involve the subject (tagger) predicate (tagging) object (document). In principle,
folksonomy information converted to this format can be processed like any other triple. By
encoding the subject into the information, there is a potential drawback with regard to privacy. This
will be considered in the research design.
22
The Long Tail
The term “Long Tail” was coined by Anderson (2006). In economic terms, it is the proportion of the
market of items that sells very little individually, but when taken as a whole, sells as much if not
more, than the best selling part of the market.
The music top 40 chart is a good example of this. These are the best sellers of the week, where most
consumer attention is focused and represents a large volume of the overall weekly sales. However,
it is only a small proportion of the total number of titles that will have sold. There could, conceivably,
be 40,000 different titles that had sold at least one unit that week. The top 40 is only 0.1% of that
spectrum. The power of the long tail is in adding all these small sales over a large range of titles
together. Taken en masse, it can amount to a significant proportion of the market value.
Power Laws
An archetype of this type of distribution is often referred to as the “80/20” law, or the Pareto
Principle (which was formulated specifically in terms of economic wealth and ownership). Burrell
(1985) has noted that this heuristic best explains how much of a library’s stock the majority of library
users consult. A corollary of this rule for information seeking behaviour is described by Mann
(1986). Based on the work of Zipf (1965), Mann postulates the principle of least effort: that an
information seeker will stop at the earliest available point at which the information requirement is
thought to have been met. That is to say that an information search is rarely continued to find more
relevant or more accurate information.
If tagging follows a similar pattern of human behaviour then the flatness and density patterns of the
folksonomy could be predicted. This is because the principle of least effort implies that taggers will
apply the same tags that have been previously applied. This could explain the presence of a power
law such as 80/20 since the principle creates a few high frequency tags.
Structural interpretation of power laws
The long tail, in this context, is made up by the tags which only appear once or twice. As such,
within the folksonomy of delicious, they are bookmark tags that have been applied by one
23
person only. Shirky (2005) would argue that the more interesting associations and classifications are
being made in this part of the tagging schema. There is no doubt that this is true in the sense that as
single tags applied by single authors, they represent a purely subjective judgment and the notion of
preferred terms has entirely disappeared. One of the problems with this diffuse vocabulary is that it
limits the document findability as there is no correspondence between search terms and tags. Using
Shirky’s example, {movie} people may not want to hang out with {film} people but a {film} student
might be interested in documents tagged by {movie} people. Morville (2005) highlights the paradox
of such tagging behaviour, perhaps better termed anti-social networking.
This natural language problem is highlighted indirectly by the work of Zipf (1965). His law of natural
language frequency states that while only a few words are used very often, many or most are used
rarely. His law suggests that a second item occurs approximately 1/2 as often as the first and the
third item 1/3 as often as the first, and so on. As tagging comes from natural language, it is possible
to expect that, given no other ordering principle, the tag frequency might fit a similar pattern.
Although power laws seem mathematically simple and easy to spot, Clauset et al (2009) set out a
rigorous set of statistical tests to help verify whether data really is obeying a power law. It is
important to bring such mathematical rigour since the visualization of a long tail often appears to be
a good fit yet may not necessarily be obeying a power law.
Bollen and Halpin (2009) conclude that whether there are tag suggestions or not, the tag frequencies
follow a power law. Social bookmarking sites such as Delicious use a tag suggestion interface to help
users with their bookmarking. Their analysis shows that the distribution was formed more clearly
when the interface was not used. This recent result indicates that a natural language folksonomy
can be predicated to aggregate in this way in spite of vocabulary controls, not because of them.
24
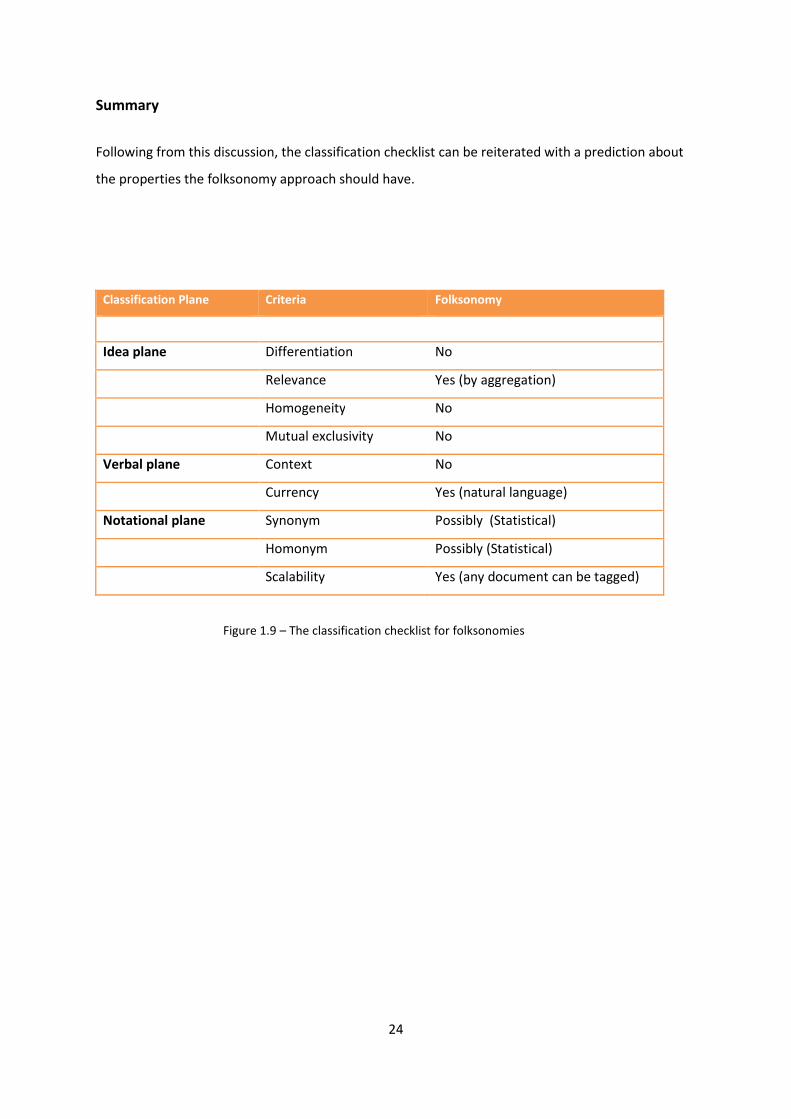
Summary
Following from this discussion, the classification checklist can be reiterated with a prediction about
the properties the folksonomy approach should have.
Classification Plane Criteria Folksonomy
Idea plane Differentiation No
Relevance Yes (by aggregation)
Homogeneity No
Mutual exclusivity No
Verbal plane Context No
Currency Yes (natural language)
Notational plane Synonym Possibly (Statistical)
Homonym Possibly (Statistical)
Scalability Yes (any document can be tagged)
Figure 1.9 – The classification checklist for folksonomies
25
Ontologies and Linked Data
A definition of ontology
There are plenty of definitions of ontology in the literature. Noy and McGuiness (2001, p.1) state
that an ontology defines a common vocabulary for researchers who need to share information in a
domain.
Legg (2007, p. 407) adds a further ingredient: “A formal ontology is a machine-readable theory of the
most fundamental concepts or “categories” required in order to understand information pertaining
to any knowledge domain.”
The readability is a key platform in the semantic web project. Tim Berners-Lee has argued that most
information on the Web is designed for human consumption and that the Semantic Web approach
develops languages for expressing information in machine processable form (Berners-Lee, 1998).
There are many documents on the web that can be read by humans. The semantic layer in which
they operate resides in the interaction between the language of the document and the reader.
Floridi (2009) notes that since semantic content in the Semantic Web is generated by humans,
ontologised by humans, and ultimately consumed by humans, promoting the notion of a machine
intelligible web should come with a caveat.
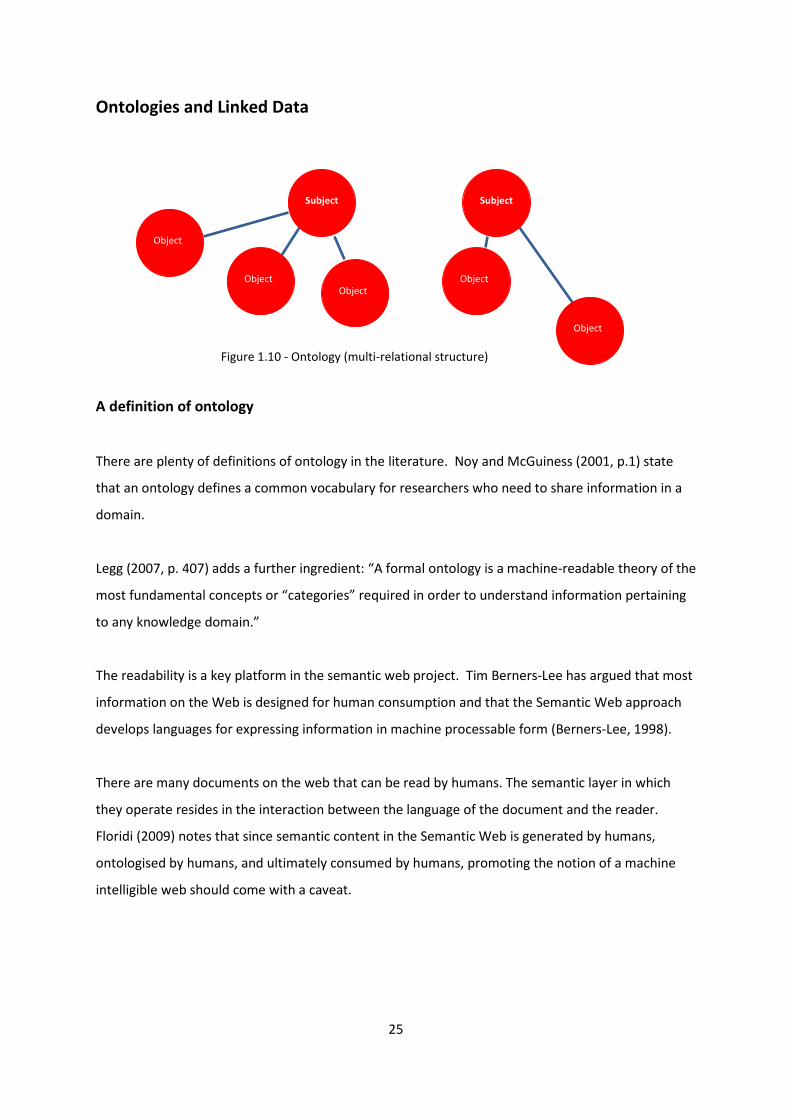
Figure 1.10 - Ontology (multi-relational structure)
Object
Subject
Object
Object
Object
Subject
Object
26
The problem seems to revolve around the use of the word semantic - especially as its use may
conjure up the image of computers reading and understanding documents in the same way that
humans would. This is a philosophically dangerous area and, according to many thinkers, implies a
type of artificial intelligence that has already been discredited.
Floridi’s objection to this implied artificial intelligence (and the problematic consequences thereof)
can be avoided if the limit of machine comprehension is taken to mean the navigation of a
document using clearly defined concepts in clearly defined machine languages. Avoidance of the
phrase “semantic web” is advisable to avert any unnecessary process implications. The literature
considered below focuses on part of the Semantic Web project: linked data.
RDF and URI
In the linked data environment, concepts are powered by RDF triples and URIs. RDF (Resource
Description Framework) triples are tripartite expressions of relationships between different concepts
based on a subject-predicate-object construction. URIs (Uniform Resource Identifiers) provide a
fixed description of the subjects and objects. Within the whole ontology of the linked data cloud,
the identifiers should be unique to ensure consistency over the whole domain (as per the
prescription of Ranganathan’s notational plane).
The power of linked data is the exposure of the data (anchored to URIs) to other resources that, in
turn, can link to other data. This intermeshing of different data sets creates hyperdata (Idehen,
2009): a direct data correlation to hypertext.
Linked data is also able to deal with the information retrieval problems of polysemy and homonymy.
Polysemy is not an issue providing all equivalent concepts point to the same URI. Thus synonym
rings are infinitely extendable so long as the information target is the predefined entity indicator.
For example, if film is the URI then the following are conceptually equivalent if anchored to the same
URI. Film = cinema = movies = flicks = featurepresentation = fiml = cine = and any other possible
equivalence that can be defined.
Homonymy is handled in much the same way. Bank can be defined by its target URI. The relational
properties by which bank can be defined should distinguish between the side of a
27
river and a financial institution. In the design walkthrough in the following design section, Semantic
Proxy differentiates between Tosca the opera and Tosca the character by examining the context of
use based on suitable triples and URIs.
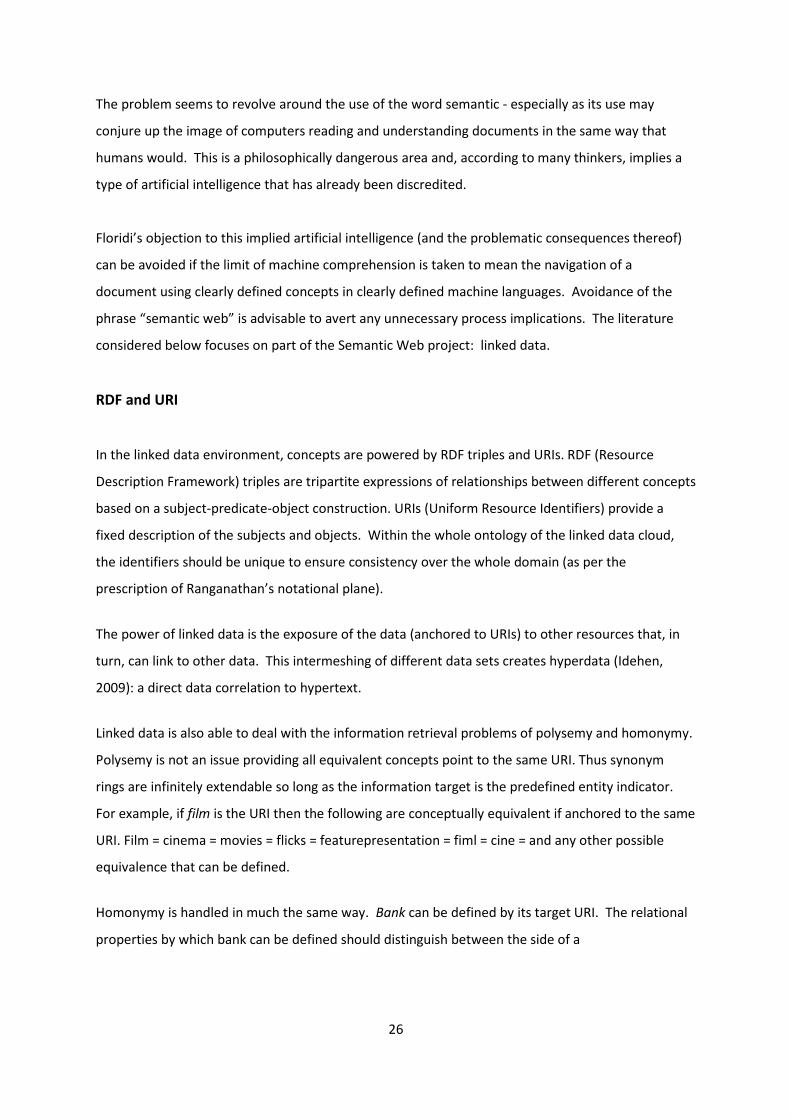
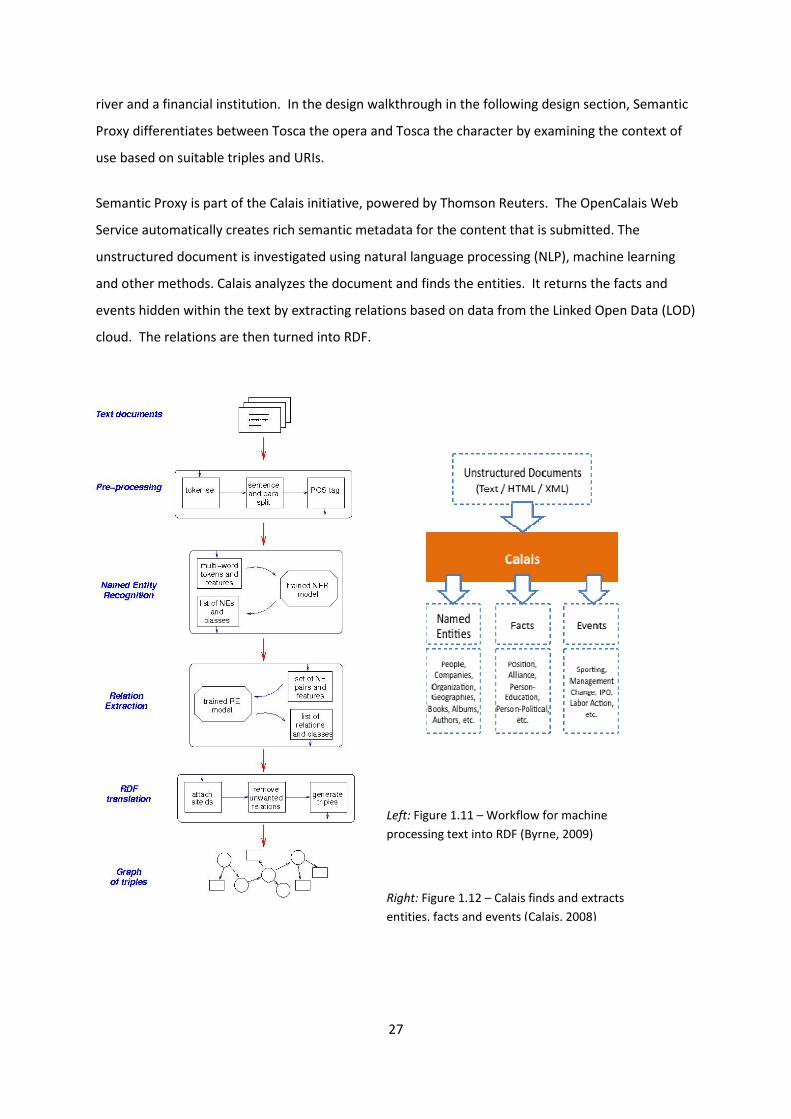
Semantic Proxy is part of the Calais initiative, powered by Thomson Reuters. The OpenCalais Web
Service automatically creates rich semantic metadata for the content that is submitted. The
unstructured document is investigated using natural language processing (NLP), machine learning
and other methods. Calais analyzes the document and finds the entities. It returns the facts and
events hidden within the text by extracting relations based on data from the Linked Open Data (LOD)
cloud. The relations are then turned into RDF.
Left: Figure 1.11 – Workflow for machine
processing text into RDF (Byrne, 2009)
Right: Figure 1.12 – Calais finds and extracts
entities, facts and events (Calais, 2008)
28
The two images on the left (Byrne, 2009) and the right (Calais, 2008) show the same process in
parallel for converting text into RDF.
The metadata output of Calais can be built into maps that link documents to entities, facts and
events. These links can improve site navigation, and provide contextual detail on the document
content. It is worth noting that these named entities, facts and events can be compared to the
facets of Ranganathan’s PMEST formulation but on a grander scale.
If this kind of output seems far removed from the type of metadata generated by tagging then
Semantic Proxy solves this by providing social tag metadata. This is to enable organisation of the
document based on topic, rather than the entities extracted.
This is a considerable simplification of the linked data cloud, and the processes employed to extract
RDF, but it is sufficient as background in order to explain what Semantic Proxy is doing to a
document and how it arrives at its output. The importance of datasets in the task of classification is
the creation of triples, each one with the potential to connect objects to the structural and
descriptive metadata of the identifiers. From these building blocks, databases can build a large
ontology that will be consistent as the data is interrelated.
A problem with linked data
Byrne (2009) notes that this is no simple task since the arrangement of data within a database is not
necessarily one which lends itself to the creation of RDF. One of the main problems is the legitimacy
and coherency of the data itself. Kelly (2010) has identified a weakness with the datasets (specifically
DBPedia, which is the open database of information contained in Wikipedia) in terms of its capacity
to answer a human entered query.
When one occurs, it is simple enough to discard an inconsistent tag (even if Peterson (2006) does
not believe so) but ontologies are more complex structures with many interlocking pieces. Kelly’s
example highlights how easy it can be to uncover a problem. The conversation in the linked data
community shows how it is not so easy to correct.
Although the implication is that results from the LOD cloud should be treated with caution, the aim
of this research is not to answer specific queries such as Kelly's but to investigate whether
29
the LOD cloud can provide adequate classification of web documents. Currently, the Semantic Web
is work in progress and its capabilities and achievements subject to some hyperbole. This tendency
is identified particularly in criticisms by Floridi (2009) and Kelly (2010).
The reliability of the LOD cloud will only and can only be as good as the data that is made available
to it. For improvements in performance, particularly in the classification process, there need only be
access to the correct schedules. Knowledge architecture such as DDC and LoC is already coherently
structured. If such frameworks were available for relational query, then it would be feasible to
predict the automated subject allocation based on the machine reading of documents. Work in this
area is being conducted by Green and Panzer (2009) and Wang (2009).
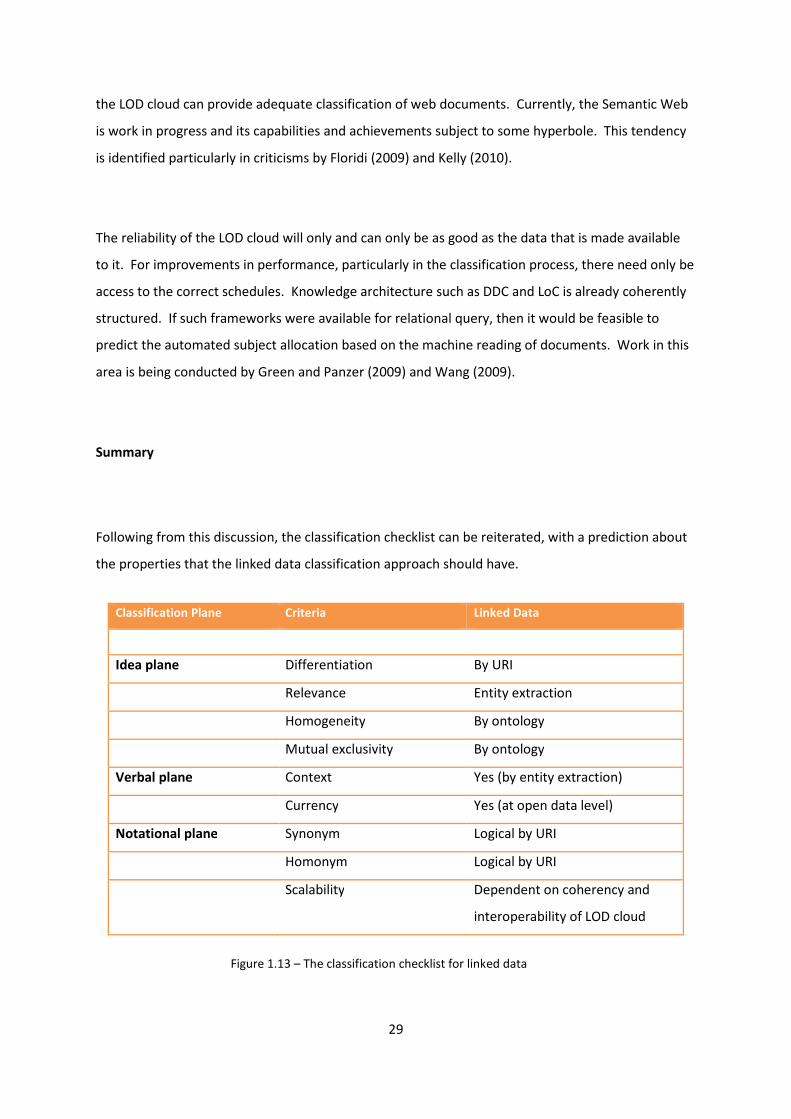
Summary
Following from this discussion, the classification checklist can be reiterated, with a prediction about
the properties that the linked data classification approach should have.
Classification Plane Criteria Linked Data
Idea plane Differentiation By URI
Relevance Entity extraction
Homogeneity By ontology
Mutual exclusivity By ontology
Verbal plane Context Yes (by entity extraction)
Currency Yes (at open data level)
Notational plane Synonym Logical by URI
Homonym Logical by URI
Scalability Dependent on coherency and
interoperability of LOD cloud
Figure 1.13 – The classification checklist for linked data

30
Research Design
31
The following chapter looks at the process of selecting the research methods used for the study. An
assessment of the needs of the research aims is made, followed by a critical consideration of what
research methods are appropriate. A selection of methods is examined from research literature to
assess strengths and weaknesses of the approaches. Ethical issues are also evaluated.
The chapter continues with a discussion of why the research tools used were chosen and how these
instruments provided data for analysis.
There follows an evaluation of different data analysis methods and a discussion of what techniques
would be most suitable.
Finally, there is a detailed design walkthrough with step by step analysis to highlight any other issues
not covered in the preceding discussion.
Research aims restated
1) Formulate a classification checklist against which the two methods can be evaluated and
compared.
2) How similar are the two approaches?
a) What is the statistical similarity of the metadata?
b) What is the semantic similarity of the metadata?
c) How different are these approaches from a conventional keyword
representation of documents?
3) Do metadata tags show any inherent structure?
a) What are the properties of co-occurring tags?
b) Does Folksonomy metadata exhibit a long tail?
c) Are the classifications faceted or diffuse?
d) How can the structures be visualised?
32
Ethical Considerations
The nature of tagging is closely connected with the idea of social networking and, hence, online
identity. Social bookmarking has been a web phenomenon in the past ten years and sites such as
Delicious are dependent on participation from web users.
Due to the nature of the online tagging environment, user data is freely available from the
bookmarking websites such as Delicious, Technocrati and Bibsonomy. This raises an ethical question
of using data without consent. This area is not considered at all in the literature reviewed so far. It
would be reasonable to hypothesise that the very nature of a tag means that it is available for use
without need to obtain prior consent. The issue of consent is considered in Denscombe (2007) and
Hewson (2003) but only in the context that information obtained online is data that is identifiable as
personal and traceable back to a data source. This is not necessarily the case in online social
networking, where it is assumed that information is contributed freely. The terms and conditions
made available on Delicious indicate that the tags, once created, are available for public scrutiny.
Equally, there is a concomitant privacy statement that makes a user aware of the protection of their
personal information from other service users (although not the service provider).
The conclusion is that user generated metadata is an ethical grey area. It is likely that there is no
discussion of the issue because, ultimately, tags are processed in research anonymously. The
technical process of collecting tags from social bookmark sites can be automated using a
combination of RSS feeds and Yahoo Pipes modules. This is the approach taken by Oldenburg et al
(2008). A pipe has been designed that extracts only tag information and removes any user specific
data to ensure anonymity.
Equivalently, this research is only interested in the tags as they relate to the documents and to other
tags, not to the users who created them in the first place. This does not have to be the case.
Markines et al (2009) has proposed that tagging data can be converted into a machine readable
form by turning the relationship into the RDF triple format that identifies the subject, the entity and
the tag. Encoding the subject in this way does have ethical ramifications if the subject has not
consented to be included.
Exposing personal data in this way manifests itself on the semantic web as FOAF (Friend Of A
Friend.) This is a machine readable ontology built from relationships between people that point to
URI’s such as personal blogs, email addresses and any other personal information. The ethical
33
impact of these developments is beyond the scope of this research but could provide an interesting
objective for further research.
Research Instruments that use tags
Fetching tags
There is an inherent ethical responsibility in collecting tags because they are user generated.
Delicious is a social bookmarking site and the bookmarking of service users can be explored. In the
context of the research, the demographics of the users themselves are not important: only the tags
themselves are. The tags are collected in a manner that completely devolves them from the
individual.
This research uses three sample document groups from Wikipedia. They were collected via Delicious
by taking the first twenty documents with ten tags or more containing the following tags:
EB1 – Evolution, Biology, Wikipedia (20 documents)
GH2 – Greek, History, Wikipedia (20 documents)
LS3 - Information, Science, Wikipedia (20 documents)
The inclusion of the Wikipedia tag was to assist with the document collection. Delicious allows the
bookmarking of any web page with any single term tag. One of the initial opportunities to test the
classificatory powers of its folksonomy was to measure if the three tag strings returned only
Wikipedia documents on the topics suggested by the first two tags. This process appears to favour
Delicious as a classifier, but the resulting harvest of documents would highlight any weaknesses in
the folksonomy, particularly if a non-Wikipedia document was collected. This would validate
Peterson’s (2006) criticism of folksonomies.
In all but one case, the tags investigated were only those that had been placed on the collected
documents by Delicious users. The exception was the analysis of co-occurring tags. The data was
extracted by first ascertaining the total number of times the base term appeared in the folksonomy.
The co-occurrence frequency of the tag pair was then determined.
34
Displaying tag hierarchy visually
Hearst and Rosner (2008) weigh up two sides of opinion about tag clouds – firstly, that it is an
innovative and informative way of analysing data and secondly, that they are a triumph of form over
function.
On the plus side, a tag cloud is a good way of representing quantity as size and, in tag population
terms, importance.
On the debit side, most tag cloud programs do not cluster terms semantically. This would help in
comparing the frequency of similar concepts in a document. As with Ranganthan’s Meccano or
Broughton’s molecular analogy, a visual representation can show relationships between entities, in
addition to any statistical metric.
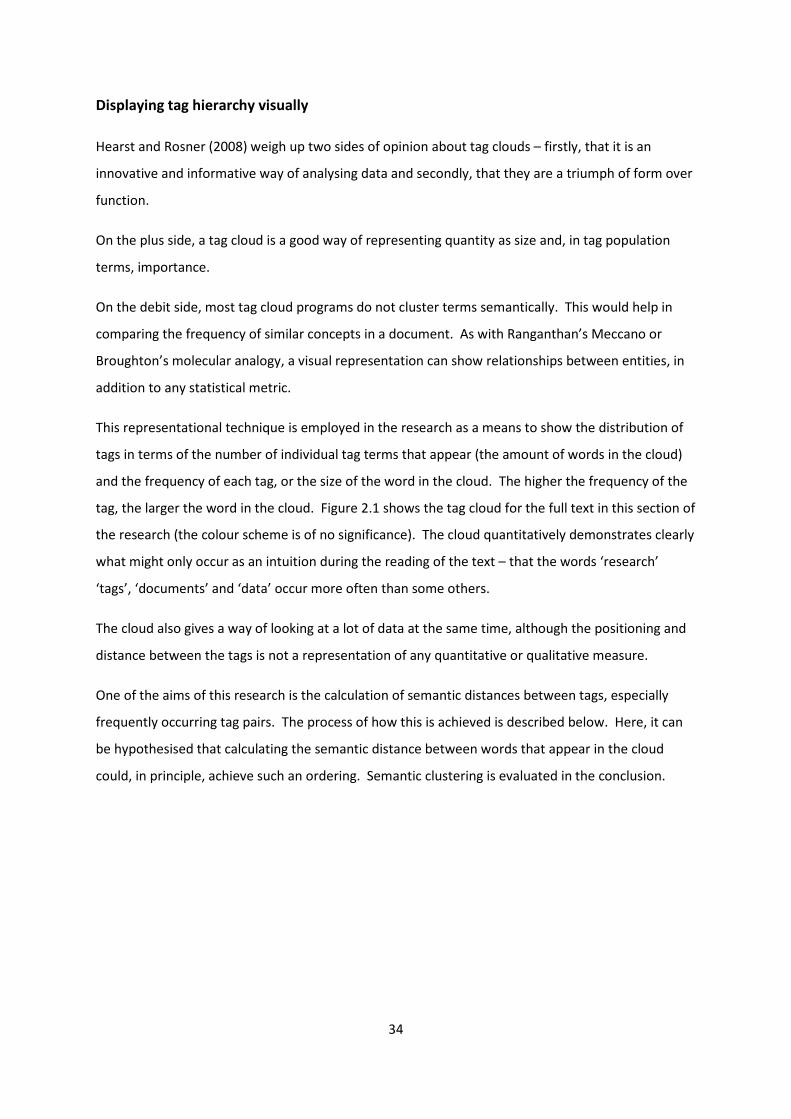
This representational technique is employed in the research as a means to show the distribution of
tags in terms of the number of individual tag terms that appear (the amount of words in the cloud)
and the frequency of each tag, or the size of the word in the cloud. The higher the frequency of the
tag, the larger the word in the cloud. Figure 2.1 shows the tag cloud for the full text in this section of
the research (the colour scheme is of no significance). The cloud quantitatively demonstrates clearly
what might only occur as an intuition during the reading of the text – that the words ‘research’
‘tags’, ‘documents’ and ‘data’ occur more often than some others.
The cloud also gives a way of looking at a lot of data at the same time, although the positioning and
distance between the tags is not a representation of any quantitative or qualitative measure.
One of the aims of this research is the calculation of semantic distances between tags, especially
frequently occurring tag pairs. The process of how this is achieved is described below. Here, it can
be hypothesised that calculating the semantic distance between words that appear in the cloud
could, in principle, achieve such an ordering. Semantic clustering is evaluated in the conclusion.
35
Wordle is used in the research for its eye catching qualities, font range and ability to display words at
angles. The essential factor of the tag count, i.e. the weighting is conferred by the size of each word
within the tag cloud.
The weaknesses of Wordle are visible in the example above. The lack of stemming is evident in the
appearance of terms such as ‘tag’ and ‘tags’. A further anomaly is the appearance of ‘research’ and
‘Research’, an occurrence that highlights the severe semantic index limitations of this particular
visual strategy.
Figure 2.1 Tag cloud for all text in Research Design Section
Image generated using Wordle (http://www.wordle.net/)
36
Research tools that use linked data
Thomson Reuters Semantic Proxy
Calais is a project by Thomson Reuters designed to help realise Berners-Lee’s vision of a machine
readable web and is part of the linked data community. Its Semantic Proxy venture aims to translate
the content of any URL on the web to its semantic representation in RDF, HTML or Microformats
(Calais, 2008). Primarily designed to be used by machines, Semantic Proxy does provide the
information in a way that humans can understand too. This makes it the ideal tool to reveal the
processes of entity extraction using linked data. In addition, Semantic Proxy aims to emulate human
metadata creation by adding social tags to any document it processes.
The Calais service is, by its own admission, tailored towards the online media and enterprise
markets. This explains some of the choice of facets, or entities that it extracts from a document.
This angle also explains the inclusion of a top category in the results. Online news environments such
as those provided by the BBC and Yahoo feature such broad classes as ‘Entertainment’. However,
the list of facets should be as scalable as the open data sets permit and it can be argued that
appropriate facets to the library and information environments could be included when the
concomitant datasets are made available for inquiry.
The process by which it works has direct parallels with the three step document classification
program outlined in the literature review. Firstly, Semantic Proxy analyses the document for entities
that belong to particular classes as defined by the supporting ontology. Secondly, based on the
frequency of the appearance of these entities and the words around them, the software makes a
calculation of relevancy of the instance to the concept and the document overall. Thirdly, the
instances are expressed in terms of their related classes available through the ontology. Semantic
Proxy can identify all of the following and more:
Person, Company, Medical condition, Position, Natural feature, Social tag, Province or state,
Organization, City, Continent, Facility, Country
By sorting the entities into facets such as these, Semantic Proxy creates a type of semantic index, a
portable ontology of the document as determined through entity extraction via the LOD cloud. Web
documents can be fed into the program via their URL. Semantic Proxy analyses and presents a
detailed report on the entities it has identified and extracted from the document, plus a set of social
tags it hypothesises as being relevant to the document. It is these tags that are compared to the
Delicious tags in the similarity analysis in the findings.
37
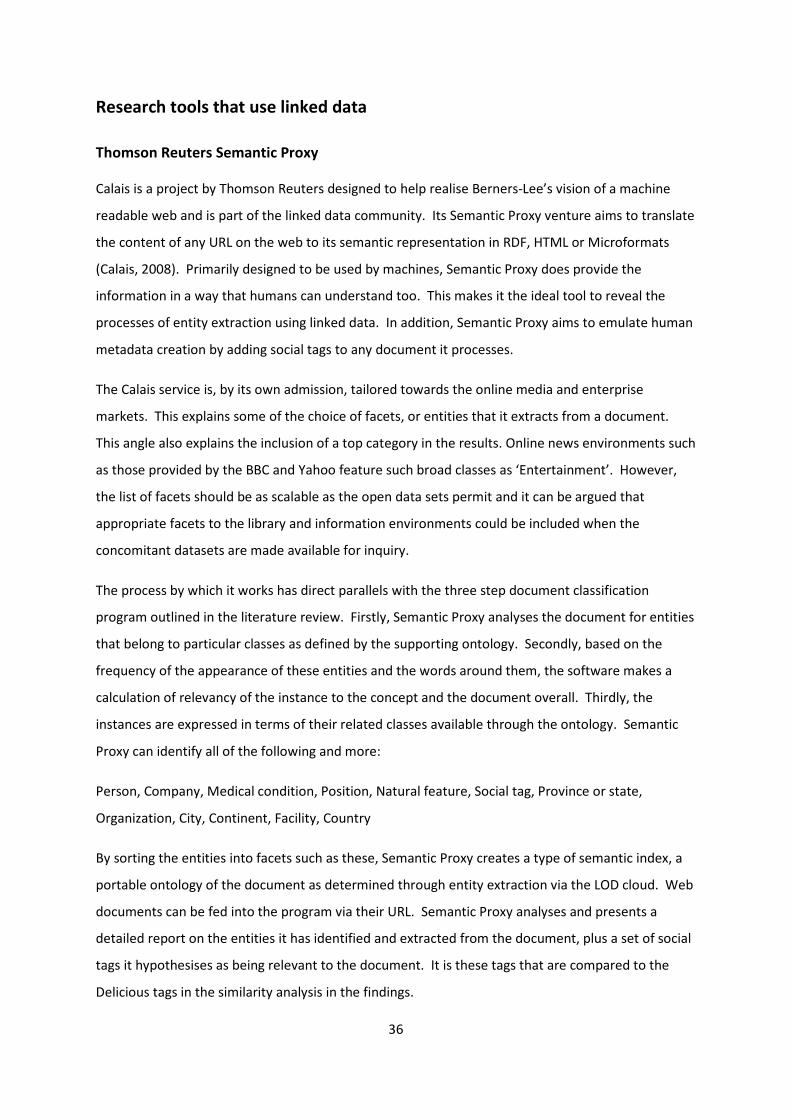
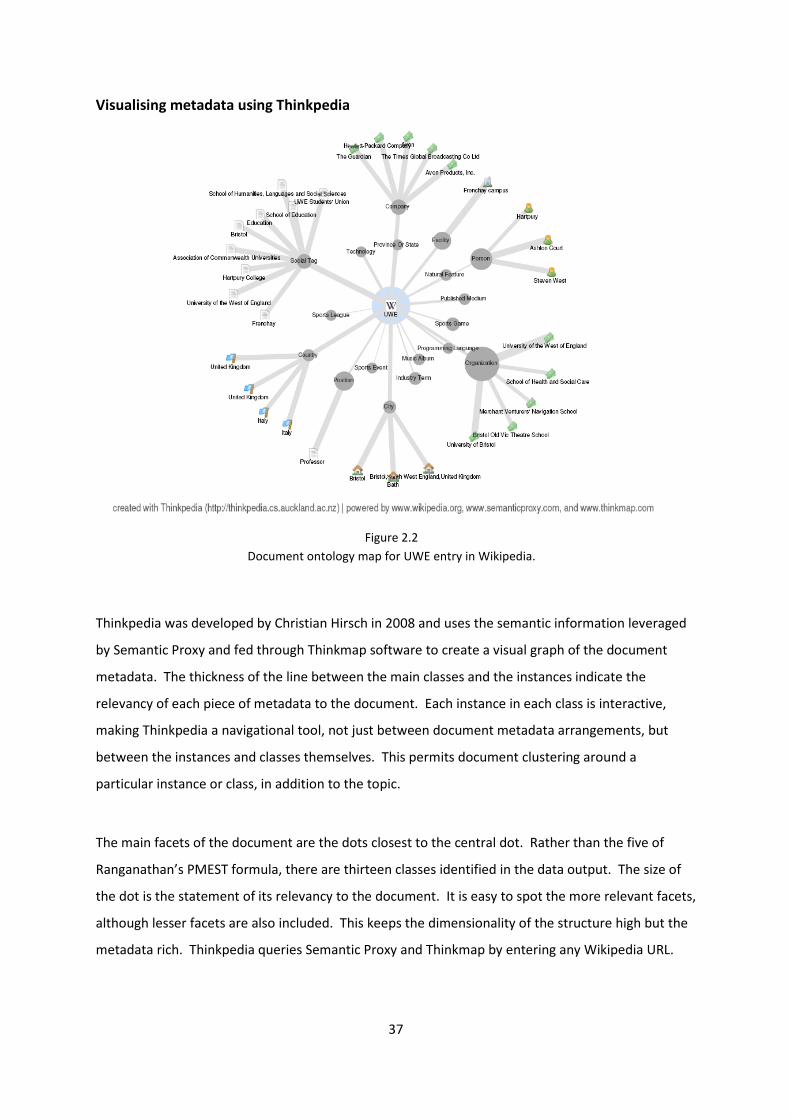
Figure 2.2
Document ontology map for UWE entry in Wikipedia.
Visualising metadata using Thinkpedia
Thinkpedia was developed by Christian Hirsch in 2008 and uses the semantic information leveraged
by Semantic Proxy and fed through Thinkmap software to create a visual graph of the document
metadata. The thickness of the line between the main classes and the instances indicate the
relevancy of each piece of metadata to the document. Each instance in each class is interactive,
making Thinkpedia a navigational tool, not just between document metadata arrangements, but
between the instances and classes themselves. This permits document clustering around a
particular instance or class, in addition to the topic.
The main facets of the document are the dots closest to the central dot. Rather than the five of
Ranganathan’s PMEST formula, there are thirteen classes identified in the data output. The size of
the dot is the statement of its relevancy to the document. It is easy to spot the more relevant facets,
although lesser facets are also included. This keeps the dimensionality of the structure high but the
metadata rich. Thinkpedia queries Semantic Proxy and Thinkmap by entering any Wikipedia URL.

38
Keyword generation
A list of the top ten keywords for each document is calculated for each document using Tag Crowd
(http://tagcrowd.com/) and used as a bench mark for the two other processes.
The reasoning is that if there is a high similarity between a simple term frequency analysis of the
document and the analysis by human generated tags and linked data, then it can be argued that the
metadata the techniques generate do not add much value to a document in terms of search and
retrieval.
Conversely, a low correlation of similarity suggests that the processes under investigation provide
more content richness than a simple statistical assessment of the words in each document.
Tag Crowd has a stemming option and provides a list of the 100 most frequently occurring words in
English.
Document word count
Polaris word count software was used to calculate the size of each Wikipedia document. The
software worked from an input of the document URL.
It was not ascertained in the course of the research if the word count included the words within the
navigation bar that appears to the left of the screen when viewing Wikipedia entries.
39
Analysing the data
Similarity
One of the research questions makes explicit the need to compare two sets of classification data and
establish how similar they are. Similarity is, therefore, the main feature of the analysis and requires
formalisation here. What is tacit in the research aim is to find a criterion for similarity to be judged.
For similarity to be measured, it has to be quantified. Lin (1998) outlines three underlying intuitions
he feels are present in our perceptions of similarity.
Intuition 1: The similarity between A and B is related to their commonality. The more commonality
they share, the more similar they are.
Intuition 2: The similarity between A and B is related to the difference between them. The more
differences they have, the less similar they are.
Intuition 3: The maximum similarity between A and B is reached when A and B are identical, no
matter how much commonality they share.
Although the statements seem trivial, they are important for the task of formalising the concept of
similarity in the two senses that are required for the research.
Statistical similarity
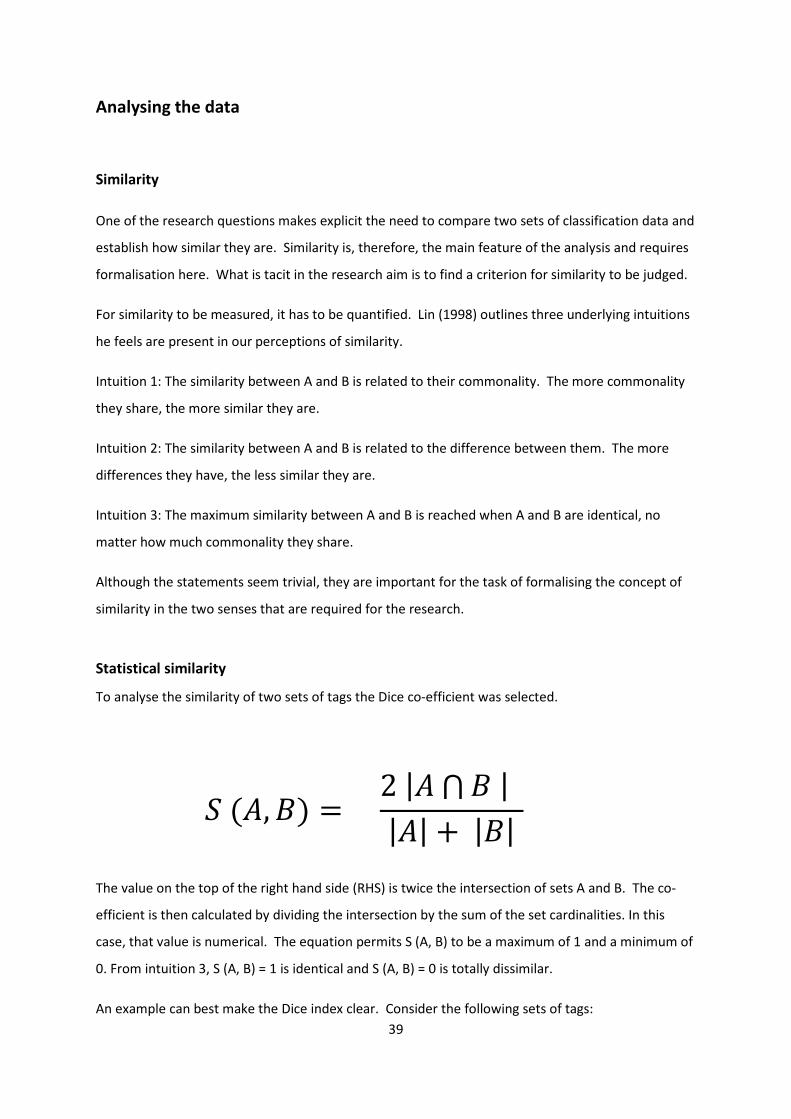
To analyse the similarity of two sets of tags the Dice co-efficient was selected.
� ��, �� � 2 |��� |
|�| � |�|
The value on the top of the right hand side (RHS) is twice the intersection of sets A and B. The co-
efficient is then calculated by dividing the intersection by the sum of the set cardinalities. In this
case, that value is numerical. The equation permits S (A, B) to be a maximum of 1 and a minimum of
0. From intuition 3, S (A, B) = 1 is identical and S (A, B) = 0 is totally dissimilar.
An example can best make the Dice index clear. Consider the following sets of tags:
40
A = {history, architecture, Greece, mythology, Turkey} – cardinality = 5
B = {ruins, greek, history, politics, turkey} – cardinality = 5
The intersection of A and B is 3, i.e. {history, history}, {Greece, greek}, {turkey, Turkey}
Greece and Greek are taken to be a similar tag pair, on the stemming principle of indexing.
The Dice coefficient for A and B, S (A, B) = 2 x (3) / (5+5) = 0.6
Semantic similarity
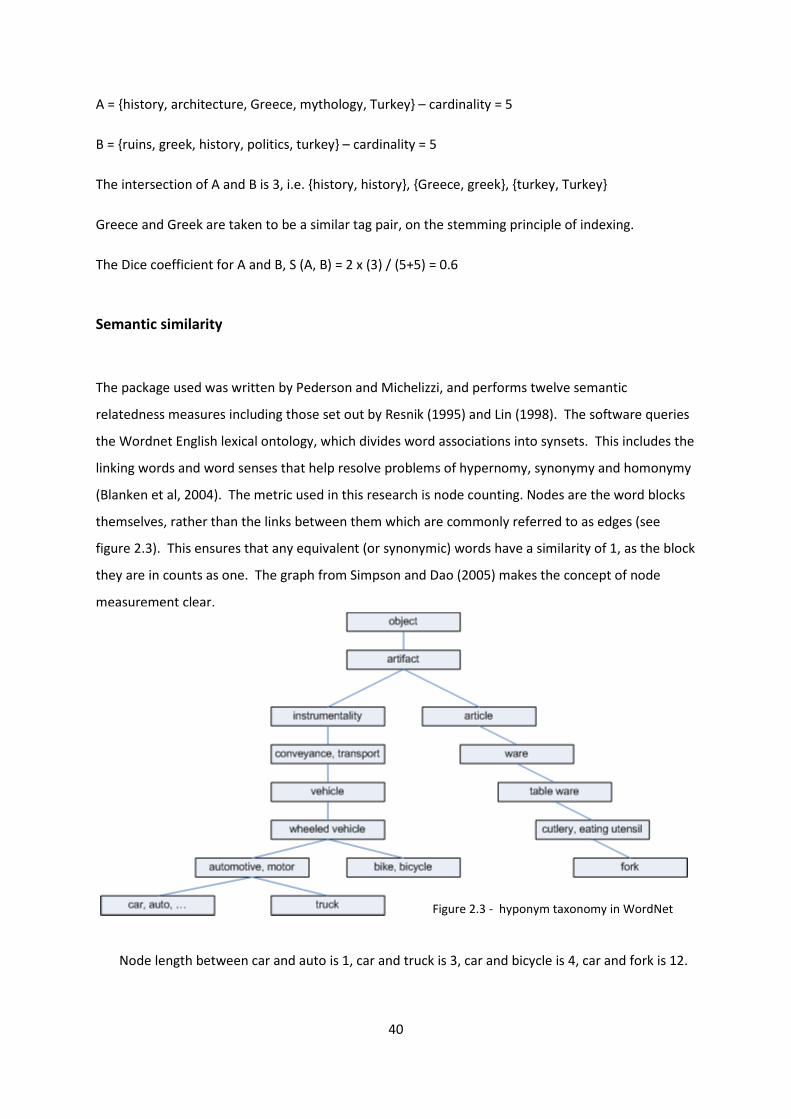
The package used was written by Pederson and Michelizzi, and performs twelve semantic
relatedness measures including those set out by Resnik (1995) and Lin (1998). The software queries
the Wordnet English lexical ontology, which divides word associations into synsets. This includes the
linking words and word senses that help resolve problems of hypernomy, synonymy and homonymy
(Blanken et al, 2004). The metric used in this research is node counting. Nodes are the word blocks
themselves, rather than the links between them which are commonly referred to as edges (see
figure 2.3). This ensures that any equivalent (or synonymic) words have a similarity of 1, as the block
they are in counts as one. The graph from Simpson and Dao (2005) makes the concept of node
measurement clear.
Figure 2.3 - hyponym taxonomy in WordNet
Node length between car and auto is 1, car and truck is 3, car and bicycle is 4, car and fork is 12.
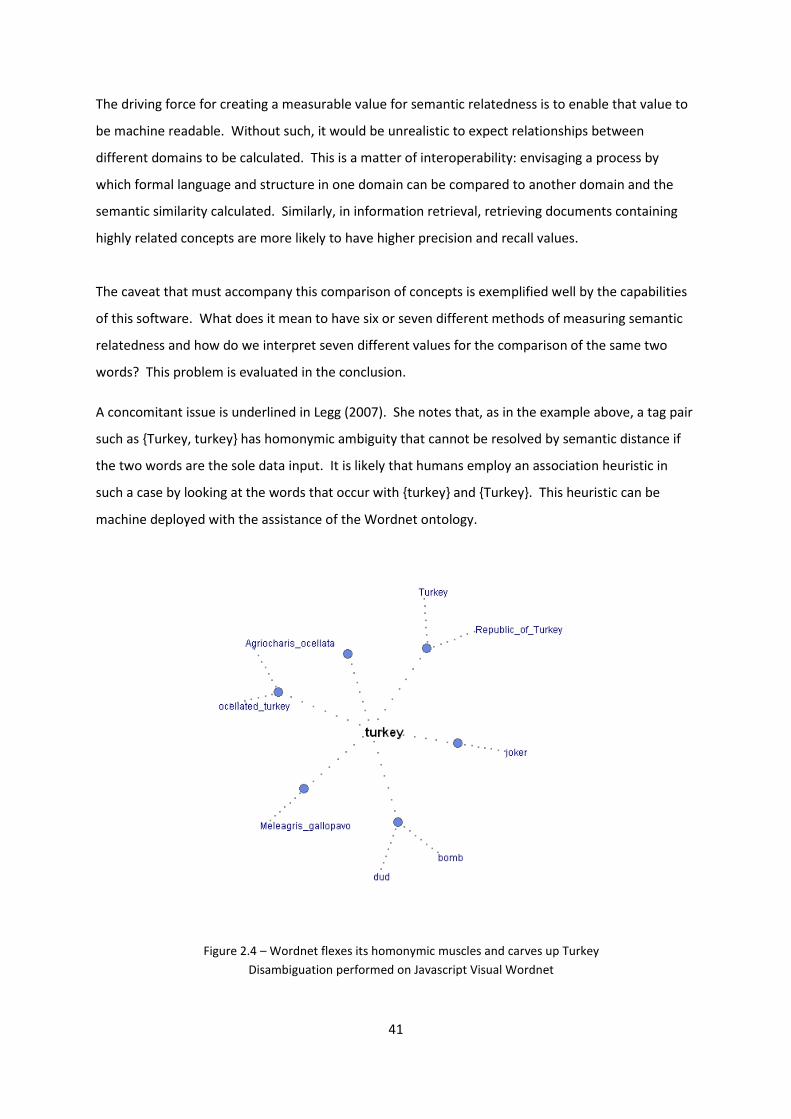
41
The driving force for creating a measurable value for semantic relatedness is to enable that value to
be machine readable. Without such, it would be unrealistic to expect relationships between
different domains to be calculated. This is a matter of interoperability: envisaging a process by
which formal language and structure in one domain can be compared to another domain and the
semantic similarity calculated. Similarly, in information retrieval, retrieving documents containing
highly related concepts are more likely to have higher precision and recall values.
The caveat that must accompany this comparison of concepts is exemplified well by the capabilities
of this software. What does it mean to have six or seven different methods of measuring semantic
relatedness and how do we interpret seven different values for the comparison of the same two
words? This problem is evaluated in the conclusion.
A concomitant issue is underlined in Legg (2007). She notes that, as in the example above, a tag pair
such as {Turkey, turkey} has homonymic ambiguity that cannot be resolved by semantic distance if
the two words are the sole data input. It is likely that humans employ an association heuristic in
such a case by looking at the words that occur with {turkey} and {Turkey}. This heuristic can be
machine deployed with the assistance of the Wordnet ontology.
Figure 2.4 – Wordnet flexes its homonymic muscles and carves up Turkey
Disambiguation performed on Javascript Visual Wordnet
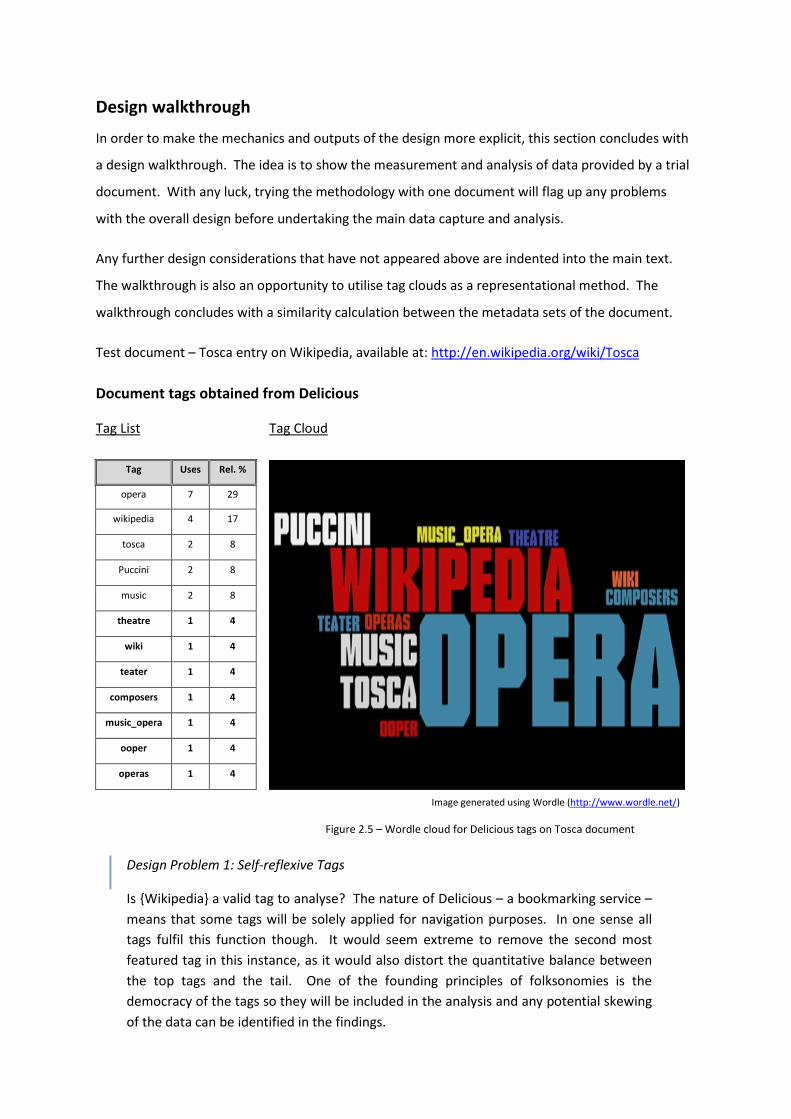
42
Design walkthrough
In order to make the mechanics and outputs of the design more explicit, this section concludes with
a design walkthrough. The idea is to show the measurement and analysis of data provided by a trial
document. With any luck, trying the methodology with one document will flag up any problems
with the overall design before undertaking the main data capture and analysis.
Any further design considerations that have not appeared above are indented into the main text.
The walkthrough is also an opportunity to utilise tag clouds as a representational method. The
walkthrough concludes with a similarity calculation between the metadata sets of the document.
Test document – Tosca entry on Wikipedia, available at: http://en.wikipedia.org/wiki/Tosca
Document tags obtained from Delicious
Tag List Tag Cloud
Tag Uses Rel. %
opera 7 29
wikipedia 4 17
tosca 2 8
Puccini 2 8
music 2 8
theatre 1 4
wiki 1 4
teater 1 4
composers 1 4
music_opera 1 4
ooper 1 4
operas 1 4
Image generated using Wordle (http://www.wordle.net/)
Design Problem 1: Self-reflexive Tags
Is {Wikipedia} a valid tag to analyse? The nature of Delicious – a bookmarking service –
means that some tags will be solely applied for navigation purposes. In one sense all
tags fulfil this function though. It would seem extreme to remove the second most
featured tag in this instance, as it would also distort the quantitative balance between
the top tags and the tail. One of the founding principles of folksonomies is the
democracy of the tags so they will be included in the analysis and any potential skewing
of the data can be identified in the findings.
Figure 2.5 – Wordle cloud for Delicious tags on Tosca document
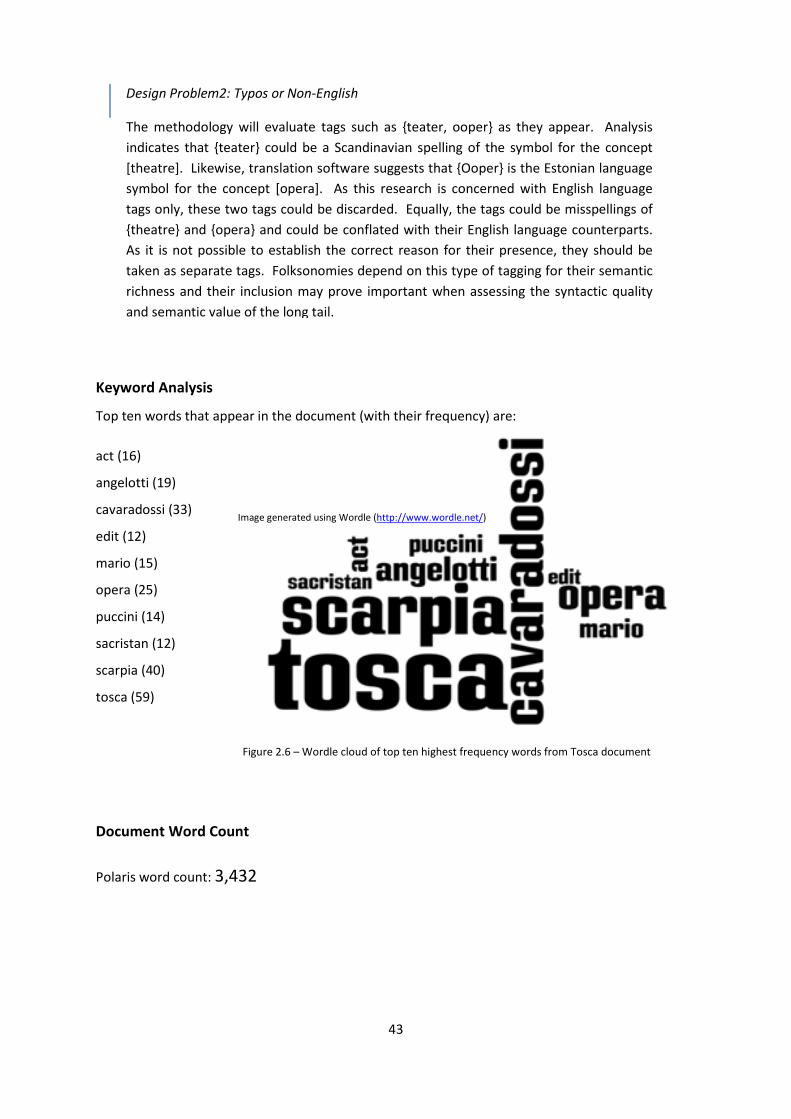
43
Keyword Analysis
Top ten words that appear in the document (with their frequency) are:
act (16)
angelotti (19)
cavaradossi (33)
edit (12)
mario (15)
opera (25)
puccini (14)
sacristan (12)
scarpia (40)
tosca (59)
Document Word Count
Polaris word count: 3,432
Design Problem2: Typos or Non-English
The methodology will evaluate tags such as {teater, ooper} as they appear. Analysis
indicates that {teater} could be a Scandinavian spelling of the symbol for the concept
[theatre]. Likewise, translation software suggests that {Ooper} is the Estonian language
symbol for the concept [opera]. As this research is concerned with English language
tags only, these two tags could be discarded. Equally, the tags could be misspellings of
{theatre} and {opera} and could be conflated with their English language counterparts.
As it is not possible to establish the correct reason for their presence, they should be
taken as separate tags. Folksonomies depend on this type of tagging for their semantic
richness and their inclusion may prove important when assessing the syntactic quality
and semantic value of the long tail.
Image generated using Wordle (http://www.wordle.net/)
Figure 2.6 – Wordle cloud of top ten highest frequency words from Tosca document
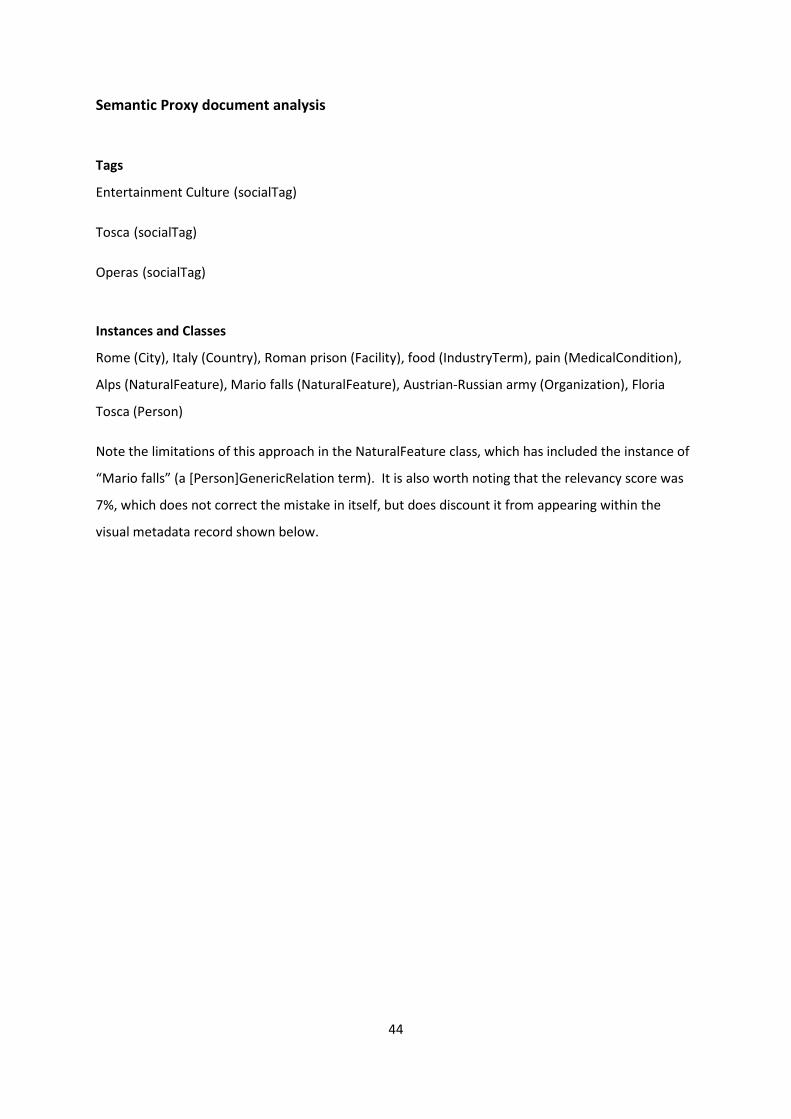
44
Semantic Proxy document analysis
Tags
Entertainment Culture (socialTag)
Tosca (socialTag)
Operas (socialTag)
Instances and Classes
Rome (City), Italy (Country), Roman prison (Facility), food (IndustryTerm), pain (MedicalCondition),
Alps (NaturalFeature), Mario falls (NaturalFeature), Austrian-Russian army (Organization), Floria
Tosca (Person)
Note the limitations of this approach in the NaturalFeature class, which has included the instance of
“Mario falls” (a [Person]GenericRelation term). It is also worth noting that the relevancy score was
7%, which does not correct the mistake in itself, but does discount it from appearing within the
visual metadata record shown below.
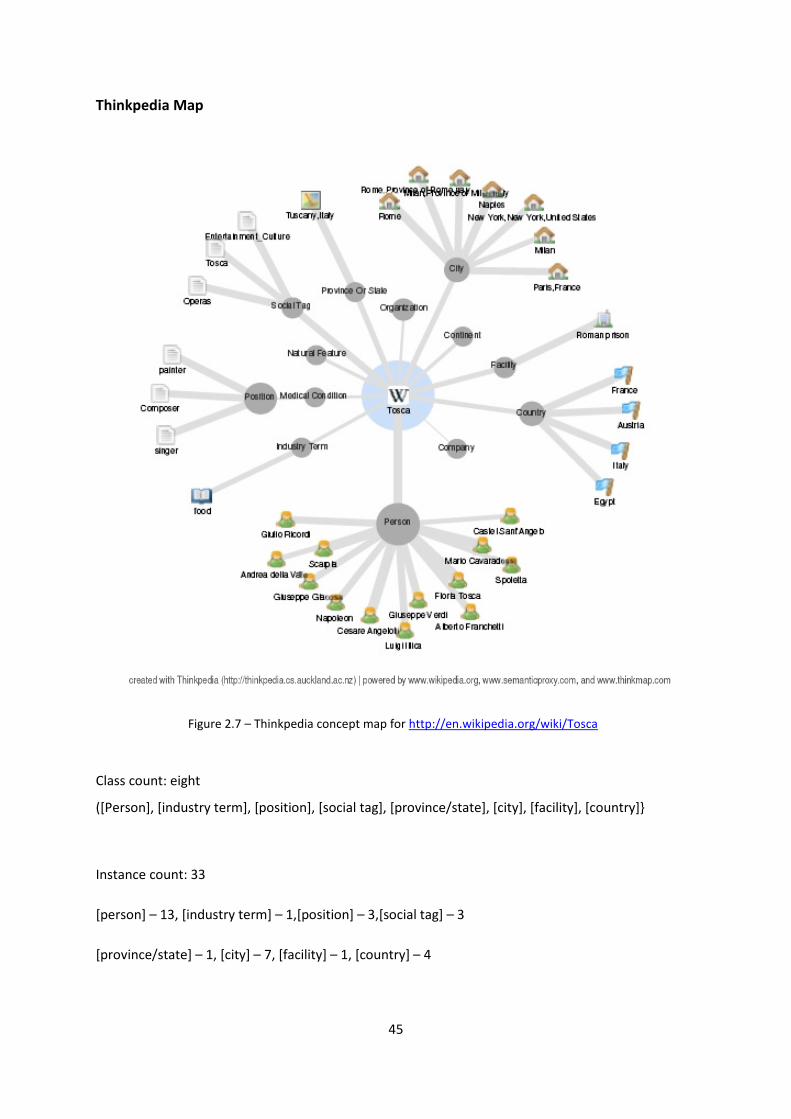
45
Thinkpedia Map
Class count: eight
([Person], [industry term], [position], [social tag], [province/state], [city], [facility], [country]}
Instance count: 33
[person] – 13, [industry term] – 1,[position] – 3,[social tag] – 3
[province/state] – 1, [city] – 7, [facility] – 1, [country] – 4
Figure 2.7 – Thinkpedia concept map for http://en.wikipedia.org/wiki/Tosca
46
Similarity measurement
Social Tags: {operas}, {Tosca}, {Entertainment_Culture}
Delicious Tags: {opera}, {wikipedia}, {tosca}, {Puccini}, {music}, {theatre}, {wiki}, {teater},
{composers}, {music_opera}, {ooper}, {operas}
Keywords: act, angelotti, cavaradossi, edit, mario , opera, puccini, sacristan, scarpia, tosca
Tags common to Social tags and Delicious tags = 2 i.e. {operas, Tosca}
S (Delicious tags, Social tags) = 2 x (2) / (3 + 12) = 4 / 15 = 0.27
S (Delicious tags, keywords) = 2 x (1) / (12 + 10) = 2 / 22 = 0.09
S (Social tags, keywords) = 2 x (1) / (3 + 10) = 2 / 13 = 0.15
Result: Social tags and Delicious tags most similar for this document.

47
Findings
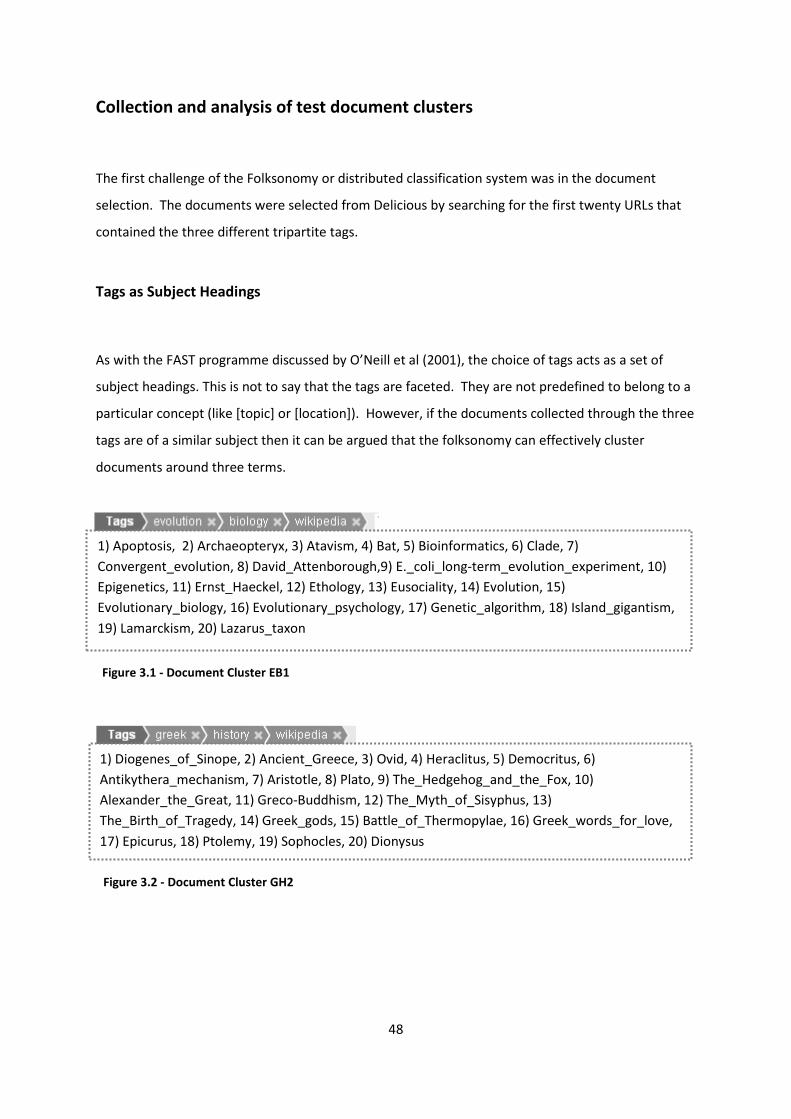
48
Figure 3.1 - Document Cluster EB1
Figure 3.2 - Document Cluster GH2
Collection and analysis of test document clusters
The first challenge of the Folksonomy or distributed classification system was in the document
selection. The documents were selected from Delicious by searching for the first twenty URLs that
contained the three different tripartite tags.
Tags as Subject Headings
As with the FAST programme discussed by O’Neill et al (2001), the choice of tags acts as a set of
subject headings. This is not to say that the tags are faceted. They are not predefined to belong to a
particular concept (like [topic] or [location]). However, if the documents collected through the three
tags are of a similar subject then it can be argued that the folksonomy can effectively cluster
documents around three terms.
1) Diogenes_of_Sinope, 2) Ancient_Greece, 3) Ovid, 4) Heraclitus, 5) Democritus, 6)
Antikythera_mechanism, 7) Aristotle, 8) Plato, 9) The_Hedgehog_and_the_Fox, 10)
Alexander_the_Great, 11) Greco-Buddhism, 12) The_Myth_of_Sisyphus, 13)
The_Birth_of_Tragedy, 14) Greek_gods, 15) Battle_of_Thermopylae, 16) Greek_words_for_love,
17) Epicurus, 18) Ptolemy, 19) Sophocles, 20) Dionysus
1) Apoptosis, 2) Archaeopteryx, 3) Atavism, 4) Bat, 5) Bioinformatics, 6) Clade, 7)
Convergent_evolution, 8) David_Attenborough,9) E._coli_long-term_evolution_experiment, 10)
Epigenetics, 11) Ernst_Haeckel, 12) Ethology, 13) Eusociality, 14) Evolution, 15)
Evolutionary_biology, 16) Evolutionary_psychology, 17) Genetic_algorithm, 18) Island_gigantism,
19) Lamarckism, 20) Lazarus_taxon
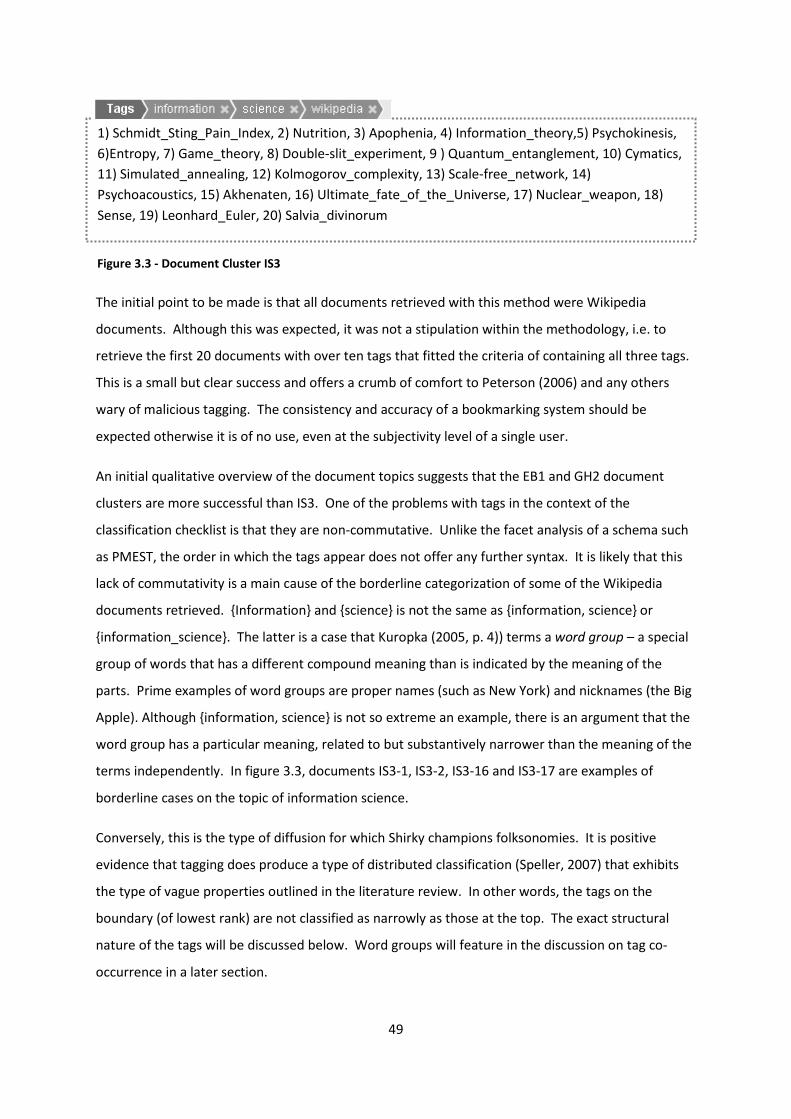
49
1) Schmidt_Sting_Pain_Index, 2) Nutrition, 3) Apophenia, 4) Information_theory,5) Psychokinesis,
6)Entropy, 7) Game_theory, 8) Double-slit_experiment, 9 ) Quantum_entanglement, 10) Cymatics,
11) Simulated_annealing, 12) Kolmogorov_complexity, 13) Scale-free_network, 14)
Psychoacoustics, 15) Akhenaten, 16) Ultimate_fate_of_the_Universe, 17) Nuclear_weapon, 18)
Sense, 19) Leonhard_Euler, 20) Salvia_divinorum
Figure 3.3 - Document Cluster IS3
The initial point to be made is that all documents retrieved with this method were Wikipedia
documents. Although this was expected, it was not a stipulation within the methodology, i.e. to
retrieve the first 20 documents with over ten tags that fitted the criteria of containing all three tags.
This is a small but clear success and offers a crumb of comfort to Peterson (2006) and any others
wary of malicious tagging. The consistency and accuracy of a bookmarking system should be
expected otherwise it is of no use, even at the subjectivity level of a single user.
An initial qualitative overview of the document topics suggests that the EB1 and GH2 document
clusters are more successful than IS3. One of the problems with tags in the context of the
classification checklist is that they are non-commutative. Unlike the facet analysis of a schema such
as PMEST, the order in which the tags appear does not offer any further syntax. It is likely that this
lack of commutativity is a main cause of the borderline categorization of some of the Wikipedia
documents retrieved. {Information} and {science} is not the same as {information, science} or
{information_science}. The latter is a case that Kuropka (2005, p. 4)) terms a word group – a special
group of words that has a different compound meaning than is indicated by the meaning of the
parts. Prime examples of word groups are proper names (such as New York) and nicknames (the Big
Apple). Although {information, science} is not so extreme an example, there is an argument that the
word group has a particular meaning, related to but substantively narrower than the meaning of the
terms independently. In figure 3.3, documents IS3-1, IS3-2, IS3-16 and IS3-17 are examples of
borderline cases on the topic of information science.
Conversely, this is the type of diffusion for which Shirky champions folksonomies. It is positive
evidence that tagging does produce a type of distributed classification (Speller, 2007) that exhibits
the type of vague properties outlined in the literature review. In other words, the tags on the
boundary (of lowest rank) are not classified as narrowly as those at the top. The exact structural
nature of the tags will be discussed below. Word groups will feature in the discussion on tag co-
occurrence in a later section.
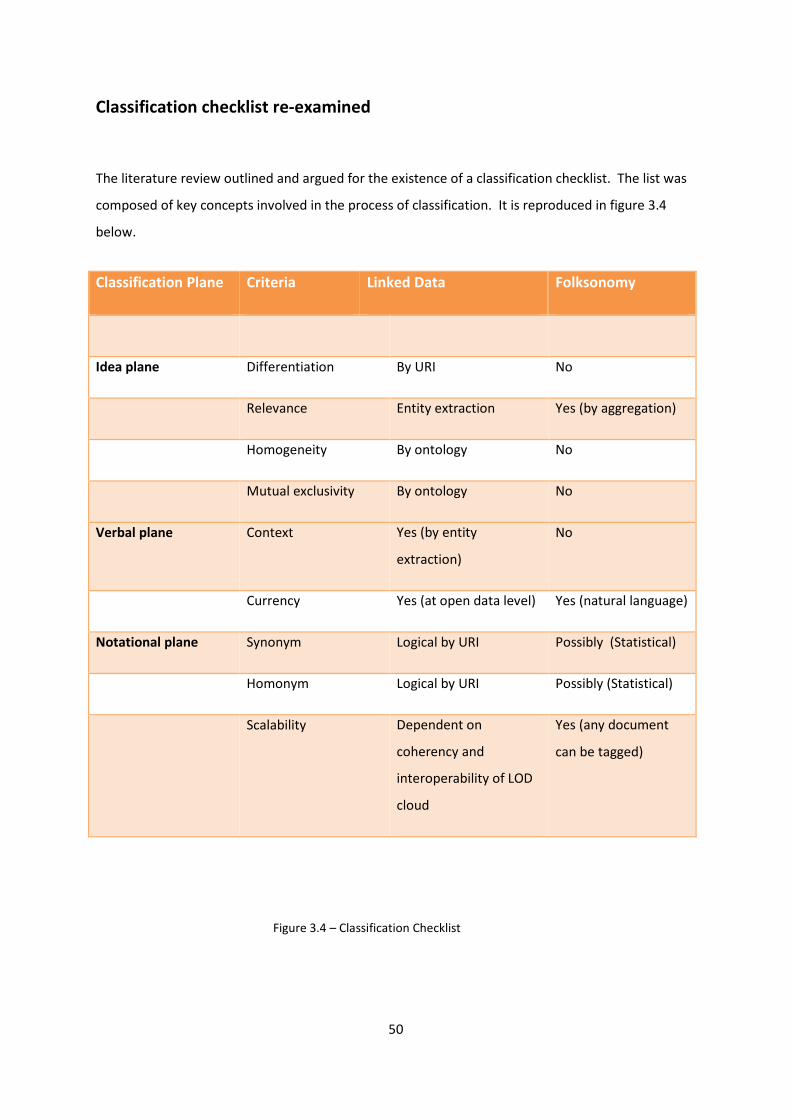
50
Classification checklist re-examined
The literature review outlined and argued for the existence of a classification checklist. The list was
composed of key concepts involved in the process of classification. It is reproduced in figure 3.4
below.
Classification Plane Criteria Linked Data Folksonomy
Idea plane Differentiation By URI No
Relevance Entity extraction Yes (by aggregation)
Homogeneity By ontology No
Mutual exclusivity By ontology No
Verbal plane Context Yes (by entity
extraction)
No
Currency Yes (at open data level) Yes (natural language)
Notational plane Synonym Logical by URI Possibly (Statistical)
Homonym Logical by URI Possibly (Statistical)
Scalability Dependent on
coherency and
interoperability of LOD
cloud
Yes (any document
can be tagged)
Figure 3.4 – Classification Checklist
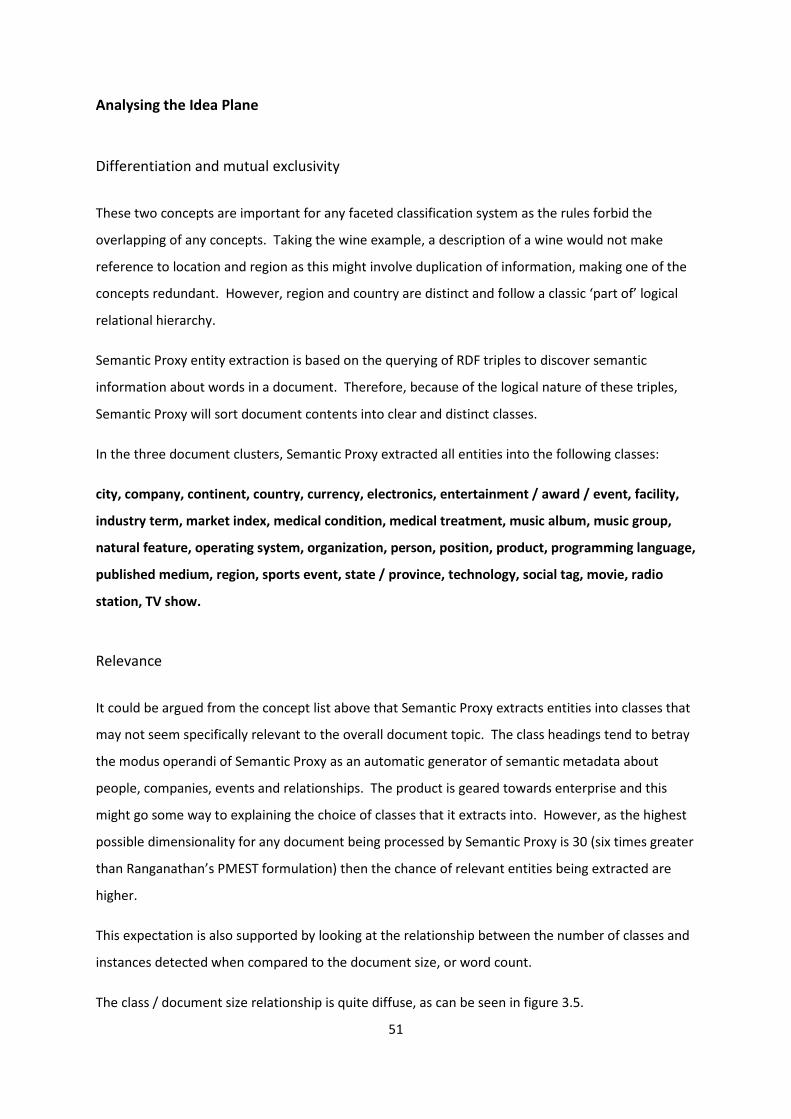
51
Analysing the Idea Plane
Differentiation and mutual exclusivity
These two concepts are important for any faceted classification system as the rules forbid the
overlapping of any concepts. Taking the wine example, a description of a wine would not make
reference to location and region as this might involve duplication of information, making one of the
concepts redundant. However, region and country are distinct and follow a classic ‘part of’ logical
relational hierarchy.
Semantic Proxy entity extraction is based on the querying of RDF triples to discover semantic
information about words in a document. Therefore, because of the logical nature of these triples,
Semantic Proxy will sort document contents into clear and distinct classes.
In the three document clusters, Semantic Proxy extracted all entities into the following classes:
city, company, continent, country, currency, electronics, entertainment / award / event, facility,
industry term, market index, medical condition, medical treatment, music album, music group,
natural feature, operating system, organization, person, position, product, programming language,
published medium, region, sports event, state / province, technology, social tag, movie, radio
station, TV show.
Relevance
It could be argued from the concept list above that Semantic Proxy extracts entities into classes that
may not seem specifically relevant to the overall document topic. The class headings tend to betray
the modus operandi of Semantic Proxy as an automatic generator of semantic metadata about
people, companies, events and relationships. The product is geared towards enterprise and this
might go some way to explaining the choice of classes that it extracts into. However, as the highest
possible dimensionality for any document being processed by Semantic Proxy is 30 (six times greater
than Ranganathan’s PMEST formulation) then the chance of relevant entities being extracted are
higher.
This expectation is also supported by looking at the relationship between the number of classes and
instances detected when compared to the document size, or word count.
The class / document size relationship is quite diffuse, as can be seen in figure 3.5.
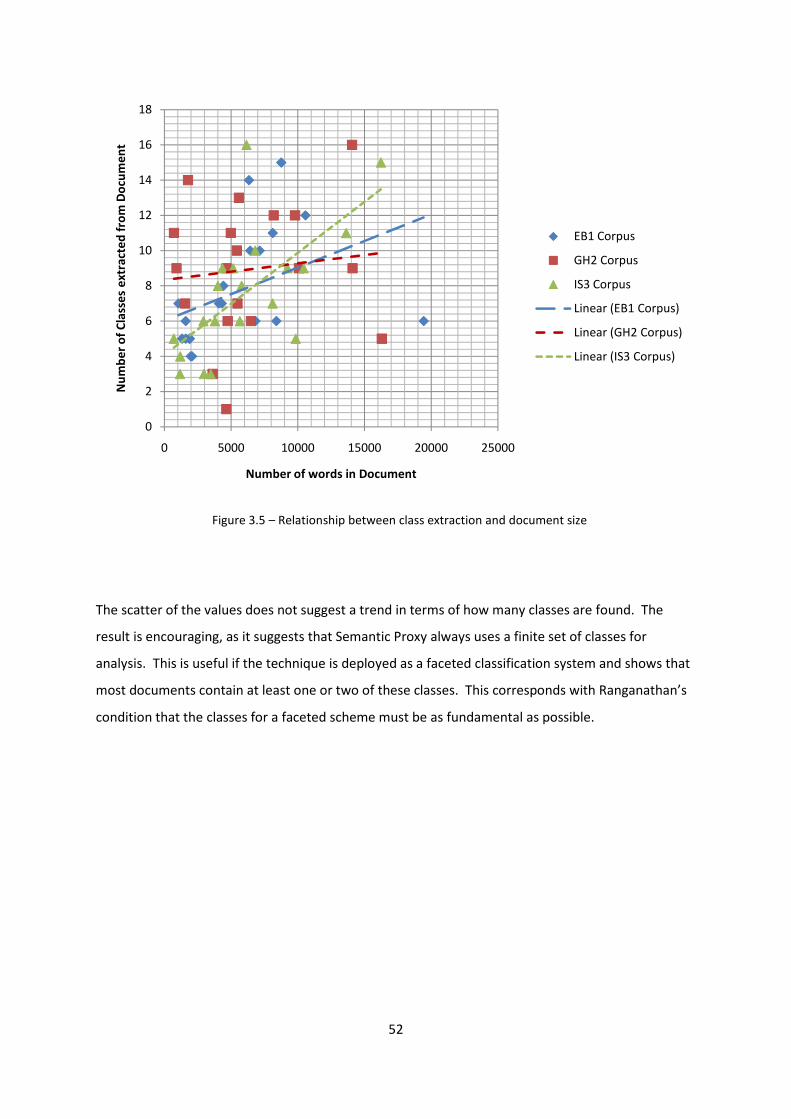
52
The scatter of the values does not suggest a trend in terms of how many classes are found. The
result is encouraging, as it suggests that Semantic Proxy always uses a finite set of classes for
analysis. This is useful if the technique is deployed as a faceted classification system and shows that
most documents contain at least one or two of these classes. This corresponds with Ranganathan’s
condition that the classes for a faceted scheme must be as fundamental as possible.
0
2
4
6
8
10
12
14
16
18
0 5000 10000 15000 20000 25000
Nu
mb
er
of
Cla
sse
s e
xtr
act
ed
fro
m D
ocu
me
nt
Number of words in Document
EB1 Corpus
GH2 Corpus
IS3 Corpus
Linear (EB1 Corpus)
Linear (GH2 Corpus)
Linear (IS3 Corpus)
Figure 3.5 – Relationship between class extraction and document size
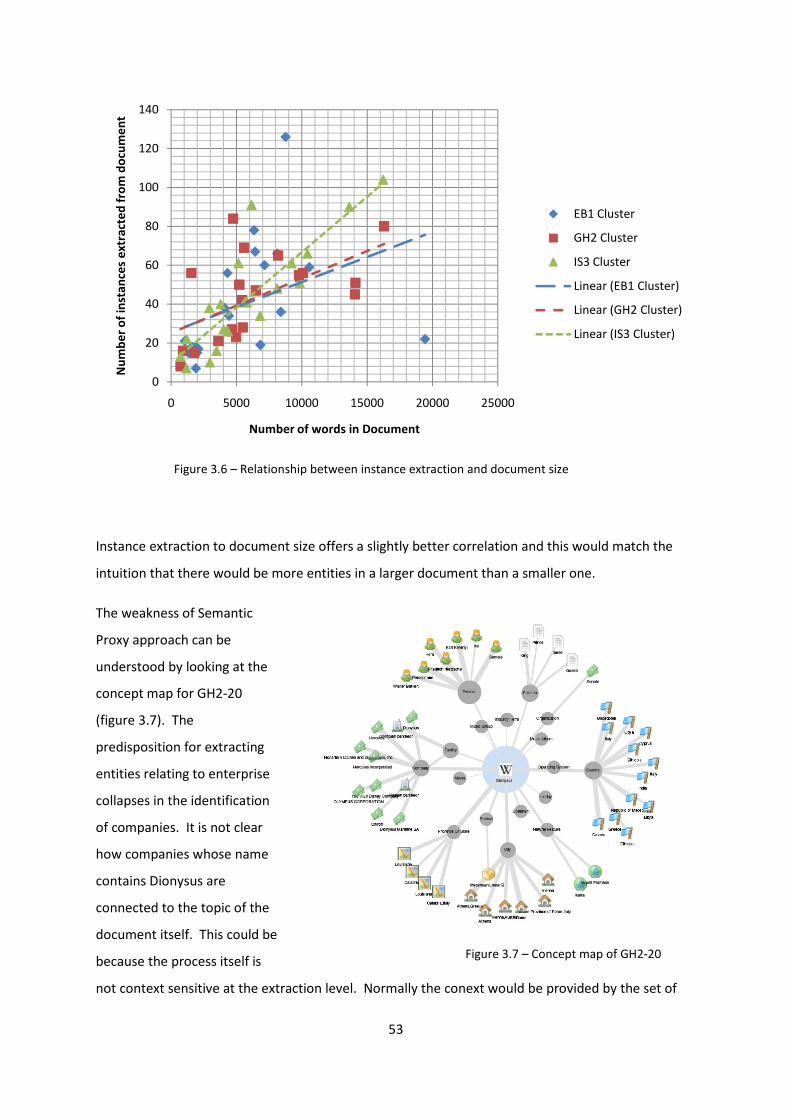
53
Instance extraction to document size offers a slightly better correlation and this would match the
intuition that there would be more entities in a larger document than a smaller one.
The weakness of Semantic
Proxy approach can be
understood by looking at the
concept map for GH2-20
(figure 3.7). The
predisposition for extracting
entities relating to enterprise
collapses in the identification
of companies. It is not clear
how companies whose name
contains Dionysus are
connected to the topic of the
document itself. This could be
because the process itself is
not context sensitive at the extraction level. Normally the conext would be provided by the set of
0
20
40
60
80
100
120
140
0 5000 10000 15000 20000 25000
Nu
mb
er
of
inst
an
ces
ex
tra
cte
d f
rom
do
cum
en
t
Number of words in Document
EB1 Cluster
GH2 Cluster
IS3 Cluster
Linear (EB1 Cluster)
Linear (GH2 Cluster)
Linear (IS3 Cluster)
Figure 3.7 – Concept map of GH2-20
Figure 3.6 – Relationship between instance extraction and document size
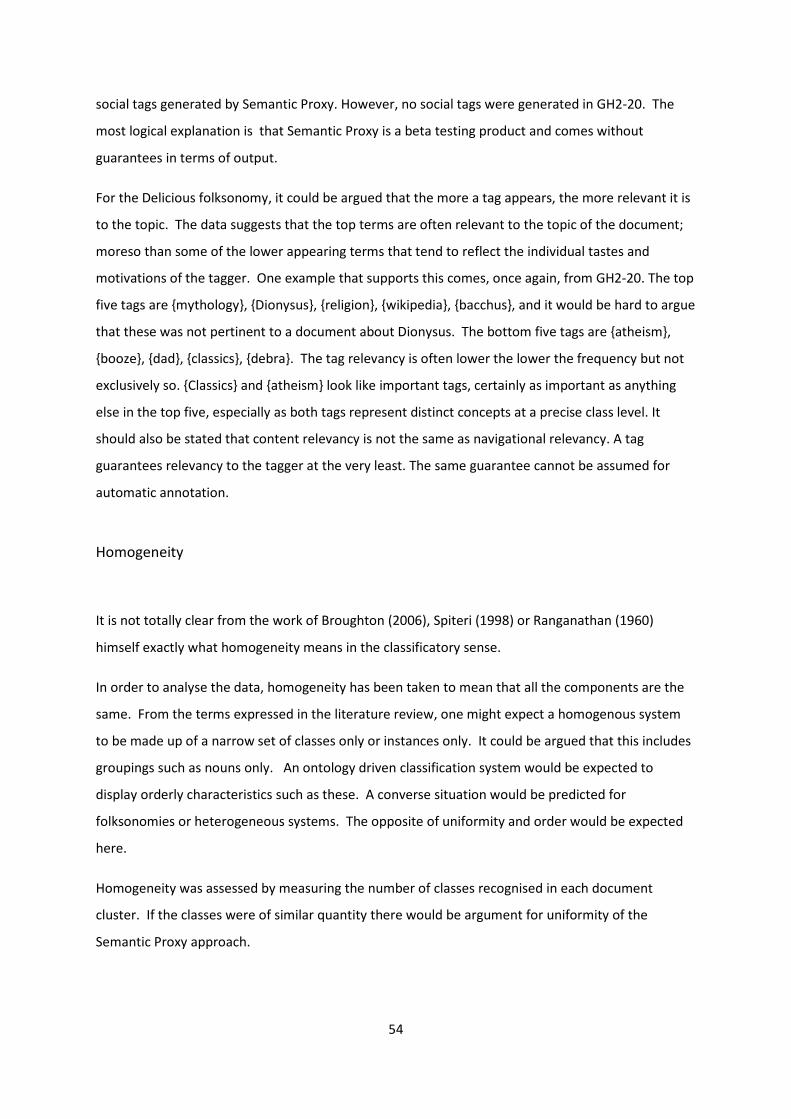
54
social tags generated by Semantic Proxy. However, no social tags were generated in GH2-20. The
most logical explanation is that Semantic Proxy is a beta testing product and comes without
guarantees in terms of output.
For the Delicious folksonomy, it could be argued that the more a tag appears, the more relevant it is
to the topic. The data suggests that the top terms are often relevant to the topic of the document;
moreso than some of the lower appearing terms that tend to reflect the individual tastes and
motivations of the tagger. One example that supports this comes, once again, from GH2-20. The top
five tags are {mythology}, {Dionysus}, {religion}, {wikipedia}, {bacchus}, and it would be hard to argue
that these was not pertinent to a document about Dionysus. The bottom five tags are {atheism},
{booze}, {dad}, {classics}, {debra}. The tag relevancy is often lower the lower the frequency but not
exclusively so. {Classics} and {atheism} look like important tags, certainly as important as anything
else in the top five, especially as both tags represent distinct concepts at a precise class level. It
should also be stated that content relevancy is not the same as navigational relevancy. A tag
guarantees relevancy to the tagger at the very least. The same guarantee cannot be assumed for
automatic annotation.
Homogeneity
It is not totally clear from the work of Broughton (2006), Spiteri (1998) or Ranganathan (1960)
himself exactly what homogeneity means in the classificatory sense.
In order to analyse the data, homogeneity has been taken to mean that all the components are the
same. From the terms expressed in the literature review, one might expect a homogenous system
to be made up of a narrow set of classes only or instances only. It could be argued that this includes
groupings such as nouns only. An ontology driven classification system would be expected to
display orderly characteristics such as these. A converse situation would be predicted for
folksonomies or heterogeneous systems. The opposite of uniformity and order would be expected
here.
Homogeneity was assessed by measuring the number of classes recognised in each document
cluster. If the classes were of similar quantity there would be argument for uniformity of the
Semantic Proxy approach.
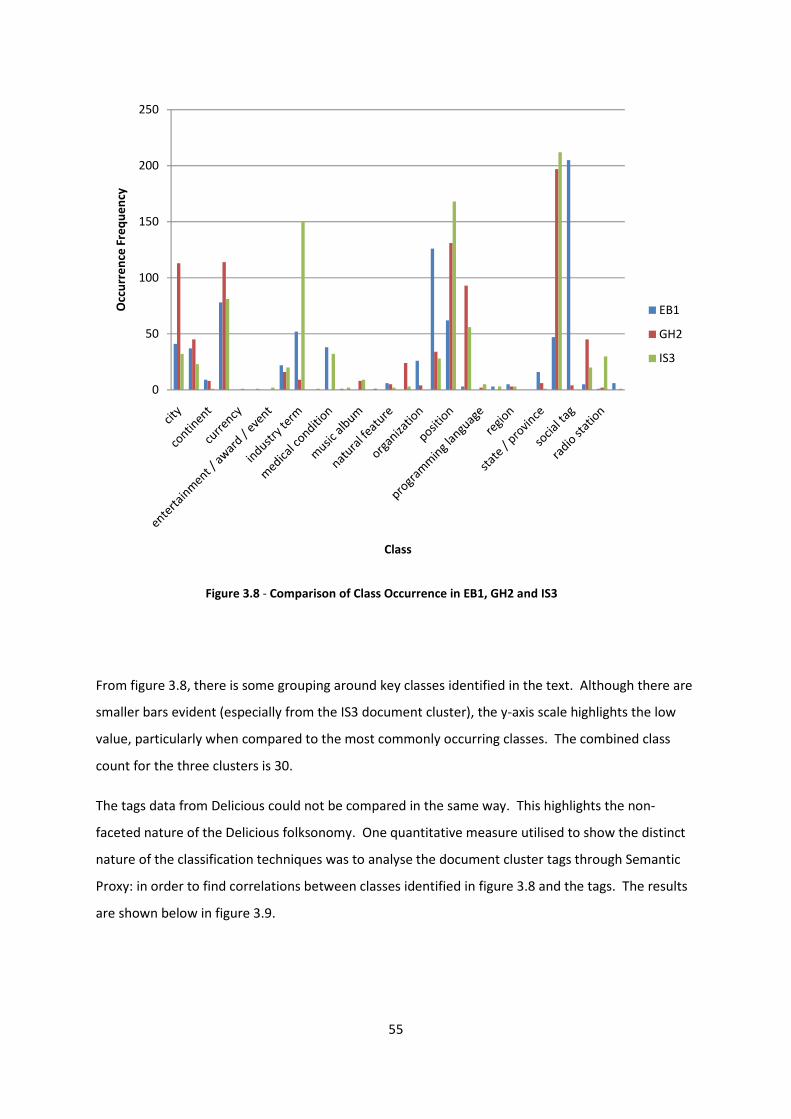
55
From figure 3.8, there is some grouping around key classes identified in the text. Although there are
smaller bars evident (especially from the IS3 document cluster), the y-axis scale highlights the low
value, particularly when compared to the most commonly occurring classes. The combined class
count for the three clusters is 30.
The tags data from Delicious could not be compared in the same way. This highlights the non-
faceted nature of the Delicious folksonomy. One quantitative measure utilised to show the distinct
nature of the classification techniques was to analyse the document cluster tags through Semantic
Proxy: in order to find correlations between classes identified in figure 3.8 and the tags. The results
are shown below in figure 3.9.
0
50
100
150
200
250O
ccu
rre
nce
Fre
qu
en
cy
Class
EB1
GH2
IS3
Figure 3.8 - Comparison of Class Occurrence in EB1, GH2 and IS3
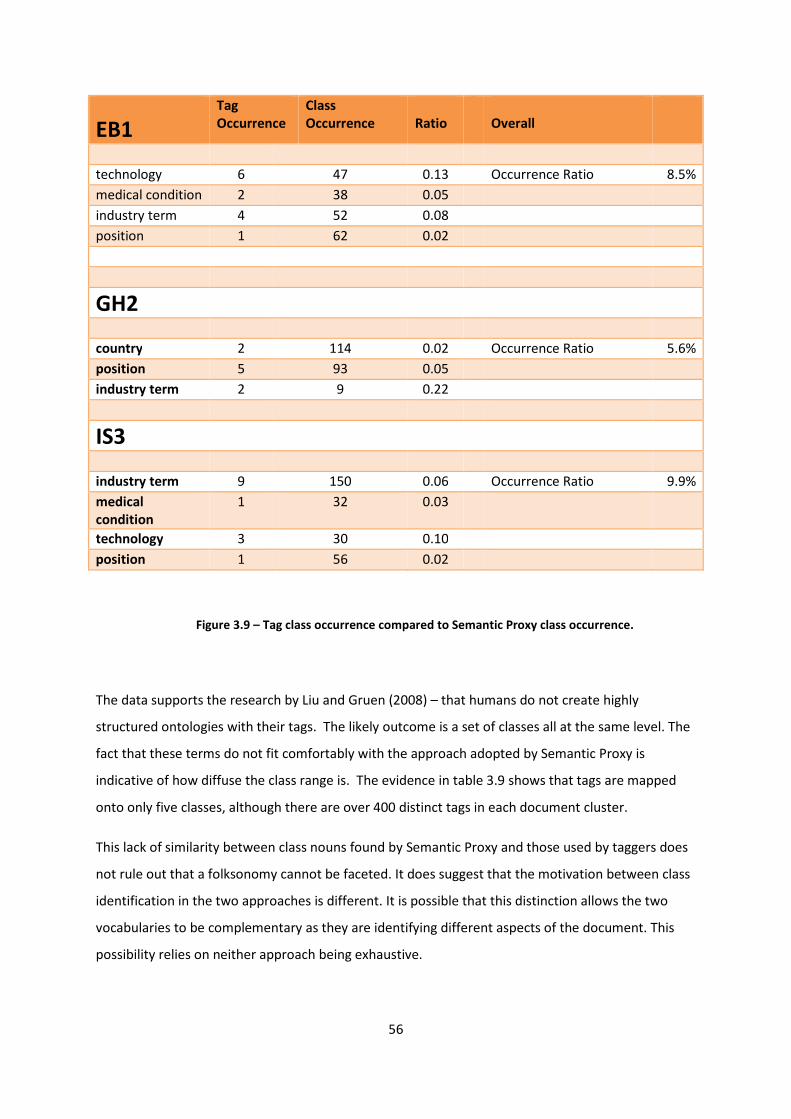
56
EB1
Tag
Occurrence
Class
Occurrence
Ratio
Overall
technology 6 47 0.13 Occurrence Ratio 8.5%
medical condition 2 38 0.05
industry term 4 52 0.08
position 1 62 0.02
GH2
country 2 114 0.02 Occurrence Ratio 5.6%
position 5 93 0.05
industry term 2 9 0.22
IS3
industry term 9 150 0.06 Occurrence Ratio 9.9%
medical
condition
1 32 0.03
technology 3 30 0.10
position 1 56 0.02
The data supports the research by Liu and Gruen (2008) – that humans do not create highly
structured ontologies with their tags. The likely outcome is a set of classes all at the same level. The
fact that these terms do not fit comfortably with the approach adopted by Semantic Proxy is
indicative of how diffuse the class range is. The evidence in table 3.9 shows that tags are mapped
onto only five classes, although there are over 400 distinct tags in each document cluster.
This lack of similarity between class nouns found by Semantic Proxy and those used by taggers does
not rule out that a folksonomy cannot be faceted. It does suggest that the motivation between class
identification in the two approaches is different. It is possible that this distinction allows the two
vocabularies to be complementary as they are identifying different aspects of the document. This
possibility relies on neither approach being exhaustive.
Figure 3.9 – Tag class occurrence compared to Semantic Proxy class occurrence.
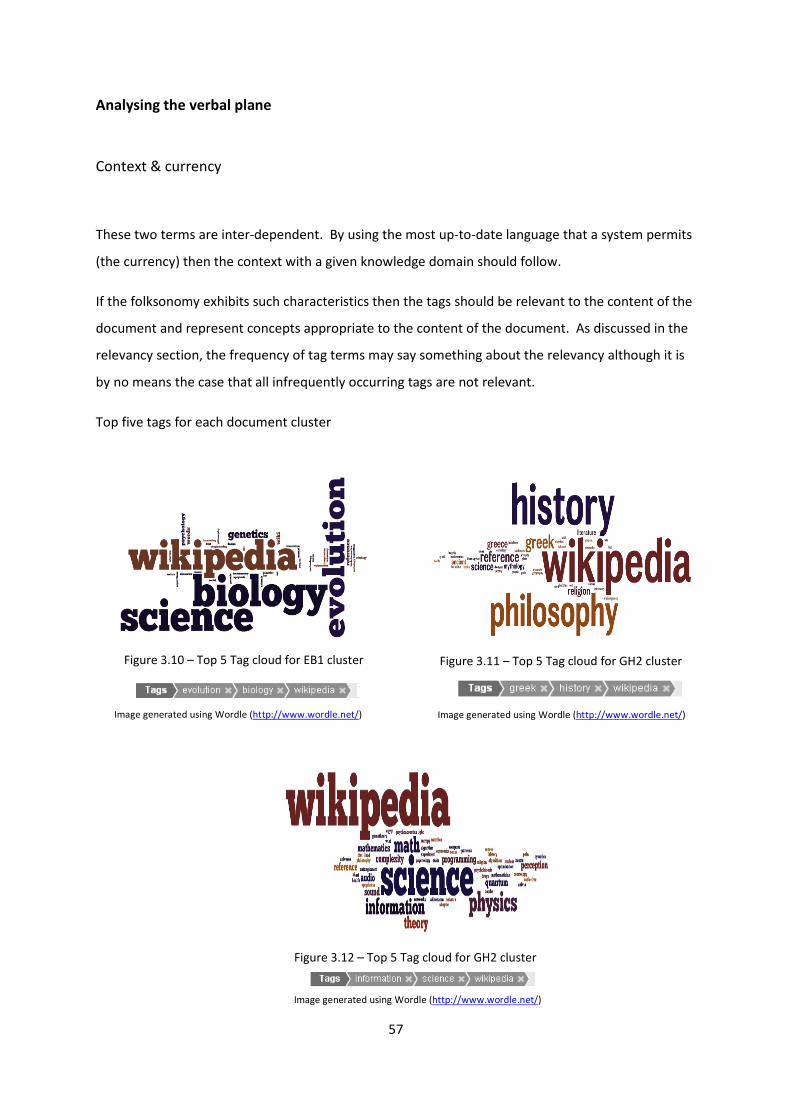
57
Image generated using Wordle (http://www.wordle.net/) Image generated using Wordle (http://www.wordle.net/)
Image generated using Wordle (http://www.wordle.net/)
Analysing the verbal plane
Context & currency
These two terms are inter-dependent. By using the most up-to-date language that a system permits
(the currency) then the context with a given knowledge domain should follow.
If the folksonomy exhibits such characteristics then the tags should be relevant to the content of the
document and represent concepts appropriate to the content of the document. As discussed in the
relevancy section, the frequency of tag terms may say something about the relevancy although it is
by no means the case that all infrequently occurring tags are not relevant.
Top five tags for each document cluster
Figure 3.10 – Top 5 Tag cloud for EB1 cluster Figure 3.11 – Top 5 Tag cloud for GH2 cluster
Figure 3.12 – Top 5 Tag cloud for GH2 cluster
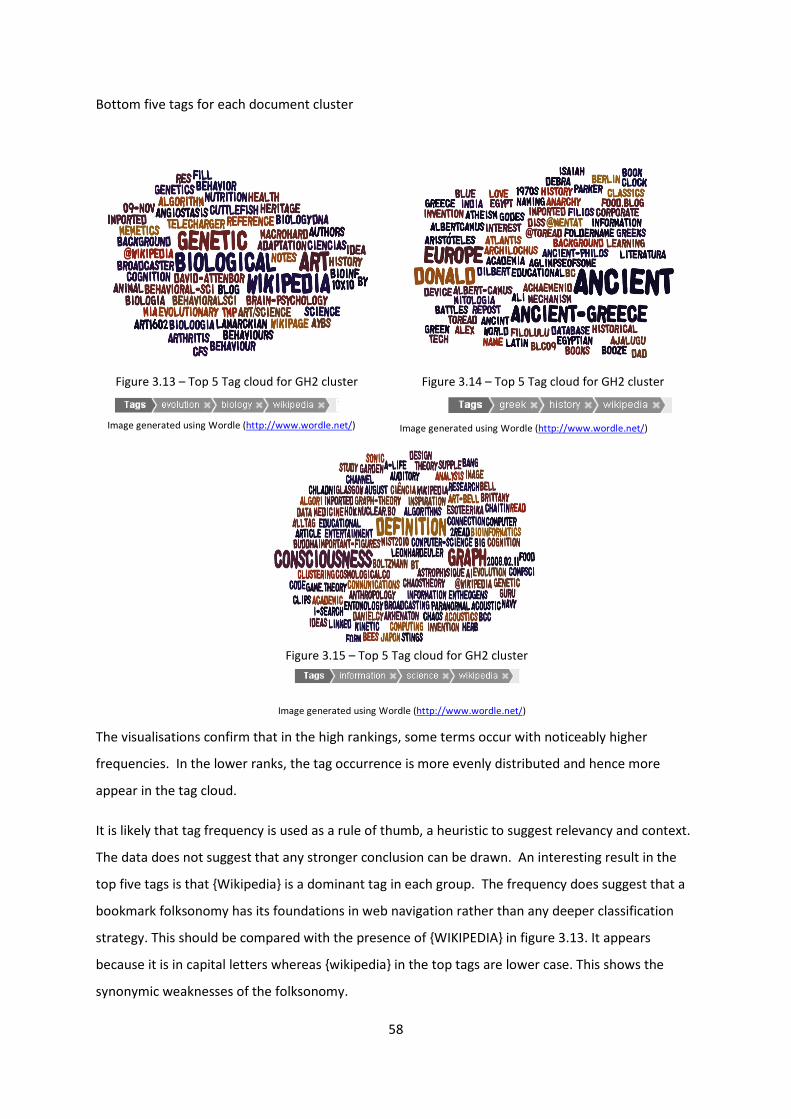
58
Image generated using Wordle (http://www.wordle.net/) Image generated using Wordle (http://www.wordle.net/)
Image generated using Wordle (http://www.wordle.net/)
Bottom five tags for each document cluster
The visualisations confirm that in the high rankings, some terms occur with noticeably higher
frequencies. In the lower ranks, the tag occurrence is more evenly distributed and hence more
appear in the tag cloud.
It is likely that tag frequency is used as a rule of thumb, a heuristic to suggest relevancy and context.
The data does not suggest that any stronger conclusion can be drawn. An interesting result in the
top five tags is that {Wikipedia} is a dominant tag in each group. The frequency does suggest that a
bookmark folksonomy has its foundations in web navigation rather than any deeper classification
strategy. This should be compared with the presence of {WIKIPEDIA} in figure 3.13. It appears
because it is in capital letters whereas {wikipedia} in the top tags are lower case. This shows the
synonymic weaknesses of the folksonomy.
Figure 3.13 – Top 5 Tag cloud for GH2 cluster Figure 3.14 – Top 5 Tag cloud for GH2 cluster
Figure 3.15 – Top 5 Tag cloud for GH2 cluster
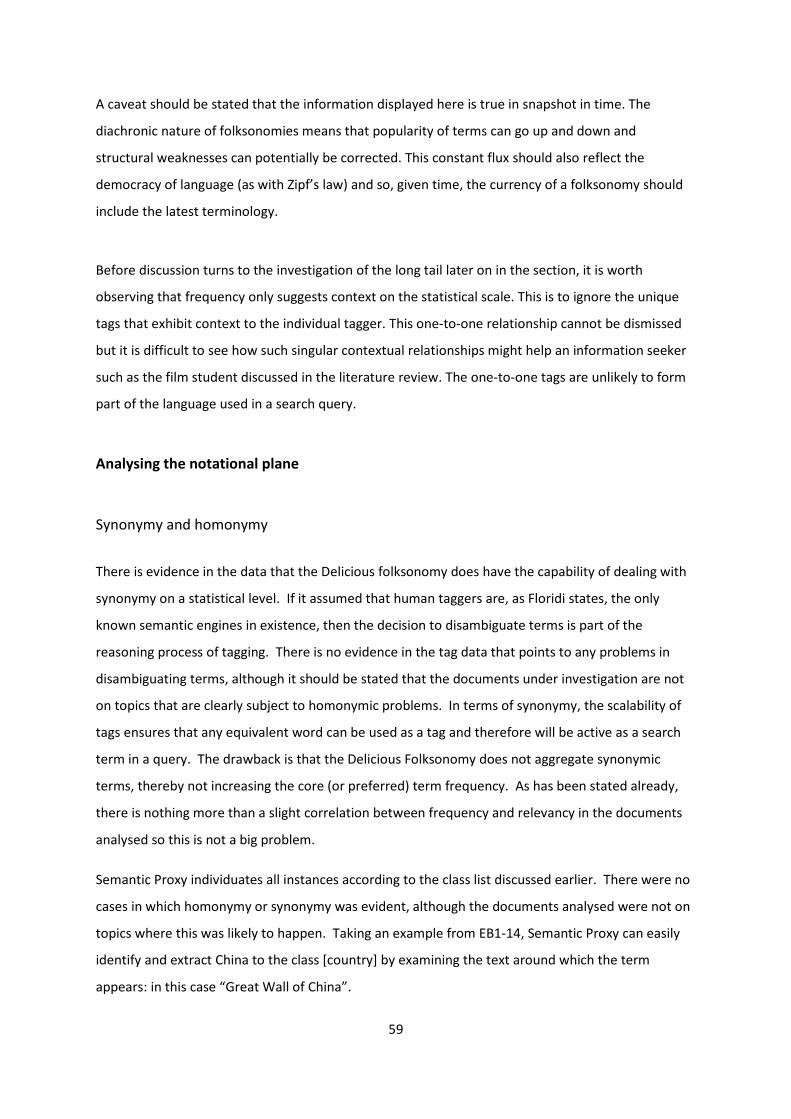
59
A caveat should be stated that the information displayed here is true in snapshot in time. The
diachronic nature of folksonomies means that popularity of terms can go up and down and
structural weaknesses can potentially be corrected. This constant flux should also reflect the
democracy of language (as with Zipf’s law) and so, given time, the currency of a folksonomy should
include the latest terminology.
Before discussion turns to the investigation of the long tail later on in the section, it is worth
observing that frequency only suggests context on the statistical scale. This is to ignore the unique
tags that exhibit context to the individual tagger. This one-to-one relationship cannot be dismissed
but it is difficult to see how such singular contextual relationships might help an information seeker
such as the film student discussed in the literature review. The one-to-one tags are unlikely to form
part of the language used in a search query.
Analysing the notational plane
Synonymy and homonymy
There is evidence in the data that the Delicious folksonomy does have the capability of dealing with
synonymy on a statistical level. If it assumed that human taggers are, as Floridi states, the only
known semantic engines in existence, then the decision to disambiguate terms is part of the
reasoning process of tagging. There is no evidence in the tag data that points to any problems in
disambiguating terms, although it should be stated that the documents under investigation are not
on topics that are clearly subject to homonymic problems. In terms of synonymy, the scalability of
tags ensures that any equivalent word can be used as a tag and therefore will be active as a search
term in a query. The drawback is that the Delicious Folksonomy does not aggregate synonymic
terms, thereby not increasing the core (or preferred) term frequency. As has been stated already,
there is nothing more than a slight correlation between frequency and relevancy in the documents
analysed so this is not a big problem.
Semantic Proxy individuates all instances according to the class list discussed earlier. There were no
cases in which homonymy or synonymy was evident, although the documents analysed were not on
topics where this was likely to happen. Taking an example from EB1-14, Semantic Proxy can easily
identify and extract China to the class [country] by examining the text around which the term
appears: in this case “Great Wall of China”.
60
Scalability
The prediction is that folksonomies are scalable because of what Floridi describes as the instant
value that they can convey to any document to which they might be attached. Thus what is
considered one of the main weaknesses of Folksonomies - their heterogeneous nature, discussed
above – is a major strength in terms of scalability. The sheer range of different tags presented in
figures 3.13, 3.14 and 3.15 indicate the diversity of the tag ecology. This diversity is helped by the
fact that the top ranked tags for any document appear more frequently. This phenomenon is
explored in further detail in the power law distribution findings.
For the Semantic Proxy, scalability is limited by the number of subject-object-association
relationships that lie within the document text. From the data regarding class and instance
occurrence as compared to document size, there are encouraging results that point towards the
scalability of Semantic Proxy. Although it is clear that the amount of instances is generally
proportional to the amount of words, the amount of classes is consistent and carefully limited. The
drawback is the relevance of the entities extracted from the document. Although the amount of
classes is manageable, they might not always be appropriately linked to the subject matter.
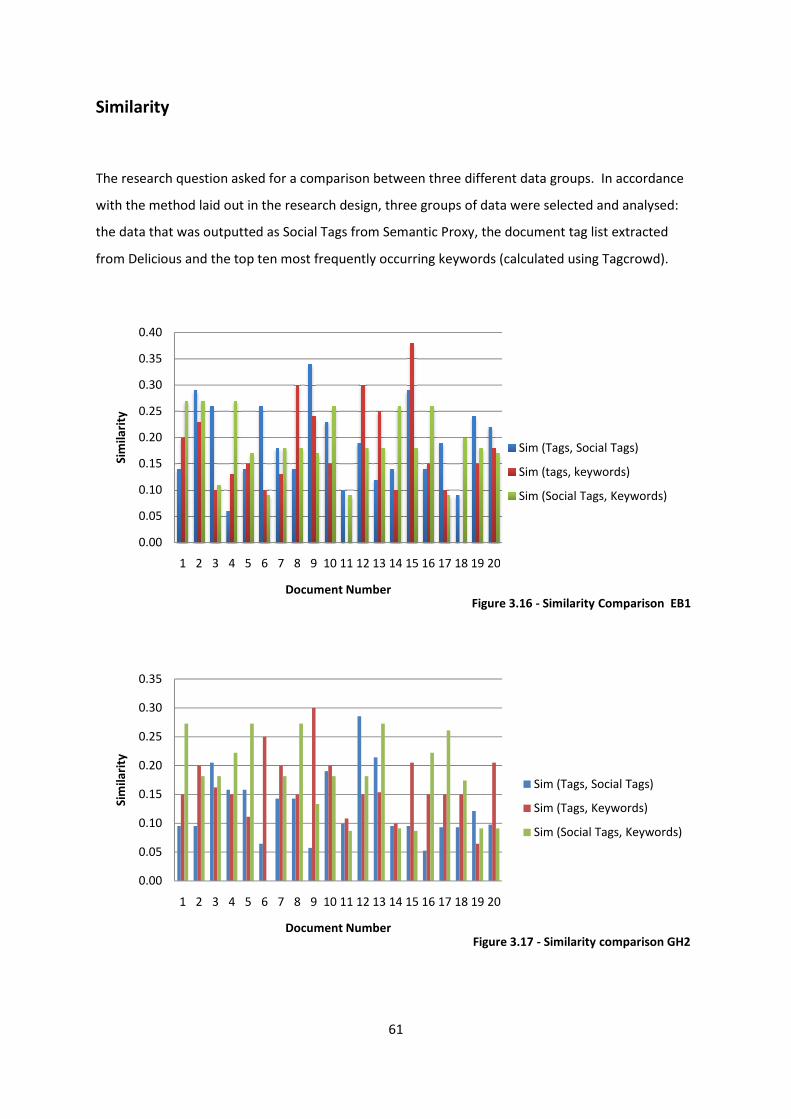
Similarity
The research question asked for a comparison between three different data groups.
with the method laid out in the research design, three groups of data were selected and analysed:
the data that was outputted as Social Tags from Semantic Proxy, the document tag list extracted
from Delicious and the top ten most frequently
0.00
0.05
0.10
0.15
0.20
0.25
0.30
0.35
0.40
1 2 3 4 5 6 7
Sim
ila
rity
Document Number
0.00
0.05
0.10
0.15
0.20
0.25
0.30
0.35
1 2 3 4 5 6 7
Sim
ila
rity
Document Number
61
The research question asked for a comparison between three different data groups.
with the method laid out in the research design, three groups of data were selected and analysed:
the data that was outputted as Social Tags from Semantic Proxy, the document tag list extracted
from Delicious and the top ten most frequently occurring keywords (calculated using Tagcrowd).
8 9 10 11 12 13 14 15 16 17 18 19 20
Document NumberFigure 3.16 - Similarity Comparison EB1
Sim (Tags, Social Tags)
Sim (tags, keywords)
Sim (Social Tags, Keywords)
8 9 10 11 12 13 14 15 16 17 18 19 20
Document NumberFigure 3.17 - Similarity comparison GH2
Sim (Tags, Social Tags)
Sim (Tags, Keywords)
Sim (Social Tags, Keywords)
The research question asked for a comparison between three different data groups. In accordance
with the method laid out in the research design, three groups of data were selected and analysed:
the data that was outputted as Social Tags from Semantic Proxy, the document tag list extracted
occurring keywords (calculated using Tagcrowd).
Similarity Comparison EB1
Sim (Tags, Social Tags)
Sim (tags, keywords)
Sim (Social Tags, Keywords)
Similarity comparison GH2
Sim (Tags, Social Tags)
Sim (Tags, Keywords)
Sim (Social Tags, Keywords)
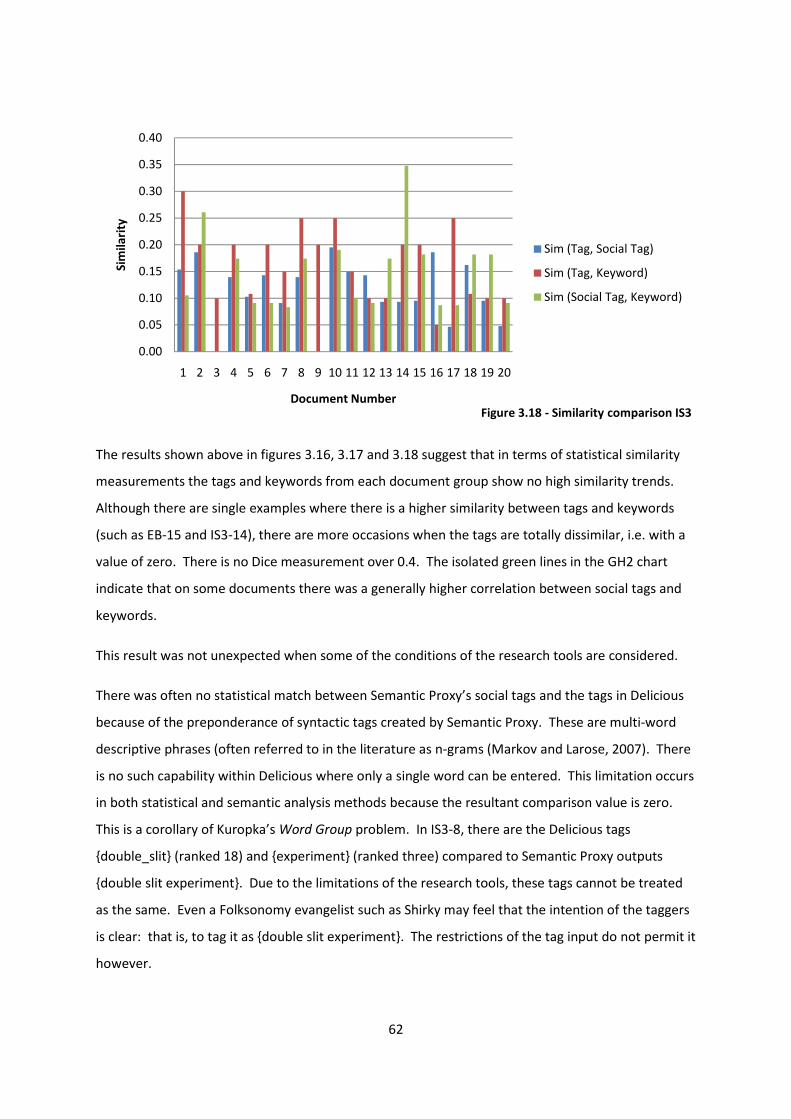
62
The results shown above in figures 3.16, 3.17 and 3.18 suggest that in terms of statistical similarity
measurements the tags and keywords from each document group show no high similarity trends.
Although there are single examples where there is a higher similarity between tags and keywords
(such as EB-15 and IS3-14), there are more occasions when the tags are totally dissimilar, i.e. with a
value of zero. There is no Dice measurement over 0.4. The isolated green lines in the GH2 chart
indicate that on some documents there was a generally higher correlation between social tags and
keywords.
This result was not unexpected when some of the conditions of the research tools are considered.
There was often no statistical match between Semantic Proxy’s social tags and the tags in Delicious
because of the preponderance of syntactic tags created by Semantic Proxy. These are multi-word
descriptive phrases (often referred to in the literature as n-grams (Markov and Larose, 2007). There
is no such capability within Delicious where only a single word can be entered. This limitation occurs
in both statistical and semantic analysis methods because the resultant comparison value is zero.
This is a corollary of Kuropka’s Word Group problem. In IS3-8, there are the Delicious tags
{double_slit} (ranked 18) and {experiment} (ranked three) compared to Semantic Proxy outputs
{double slit experiment}. Due to the limitations of the research tools, these tags cannot be treated
as the same. Even a Folksonomy evangelist such as Shirky may feel that the intention of the taggers
is clear: that is, to tag it as {double slit experiment}. The restrictions of the tag input do not permit it
however.
0.00
0.05
0.10
0.15
0.20
0.25
0.30
0.35
0.40
1 2 3 4 5 6 7 8 9 10 11 12 13 14 15 16 17 18 19 20
Sim
ila
rity
Document NumberFigure 3.18 - Similarity comparison IS3
Sim (Tag, Social Tag)
Sim (Tag, Keyword)
Sim (Social Tag, Keyword)
63
The semantic comparison is redundant since the software cannot handle anything other than single
words, typically nouns and some verbs. It cannot handle adjectives or tag noise (tags in figures 3.
like @toread, @mentat and BLC09 are examples of noise). This non measurability has implications
for the tag co-occurrence analysis outlined below. This section contains a more detailed
consideration of the n-gram / Word Group problem.
The discrepancies between Semantic Proxy social tags and Delicious tags also highlight the problem
of folksonomy flatness. Taking the results of GH2-19 as an example, the social tags are specific
names, entities extracted from the text {Esmene}, {Creone}. The tags added by users maintain
general terms such as {person} and {people}. This is the same effect as predicted by Speller (2007).
However, this lack of specialist knowledge is not reflected in all the tags. The technical language
present in many of the IS3 social tags is reflected in the content of the user tags.
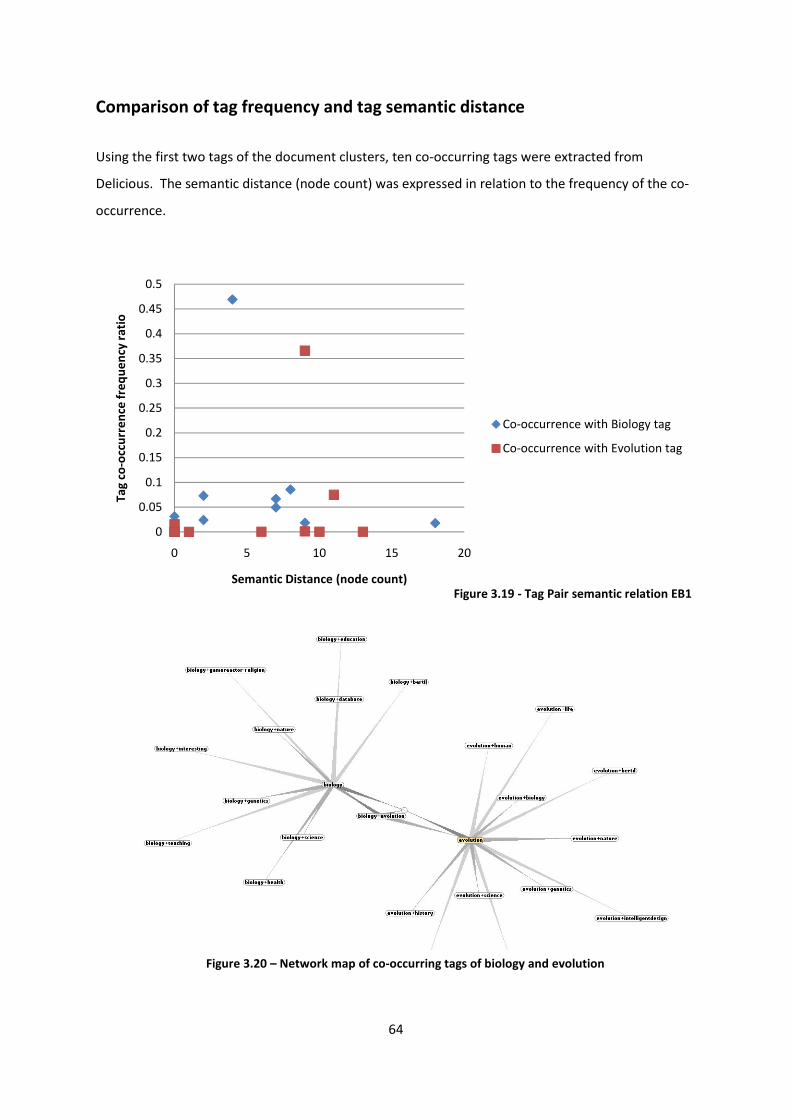
64
Comparison of tag frequency and tag semantic distance
Using the first two tags of the document clusters, ten co-occurring tags were extracted from
Delicious. The semantic distance (node count) was expressed in relation to the frequency of the co-
occurrence.
0
0.05
0.1
0.15
0.2
0.25
0.3
0.35
0.4
0.45
0.5
0 5 10 15 20
Ta
g c
o-o
ccu
rre
nce
fre
qu
en
cy r
ati
o
Semantic Distance (node count)Figure 3.19 - Tag Pair semantic relation EB1
Co-occurrence with Biology tag
Co-occurrence with Evolution tag
Figure 3.20 – Network map of co-occurring tags of biology and evolution
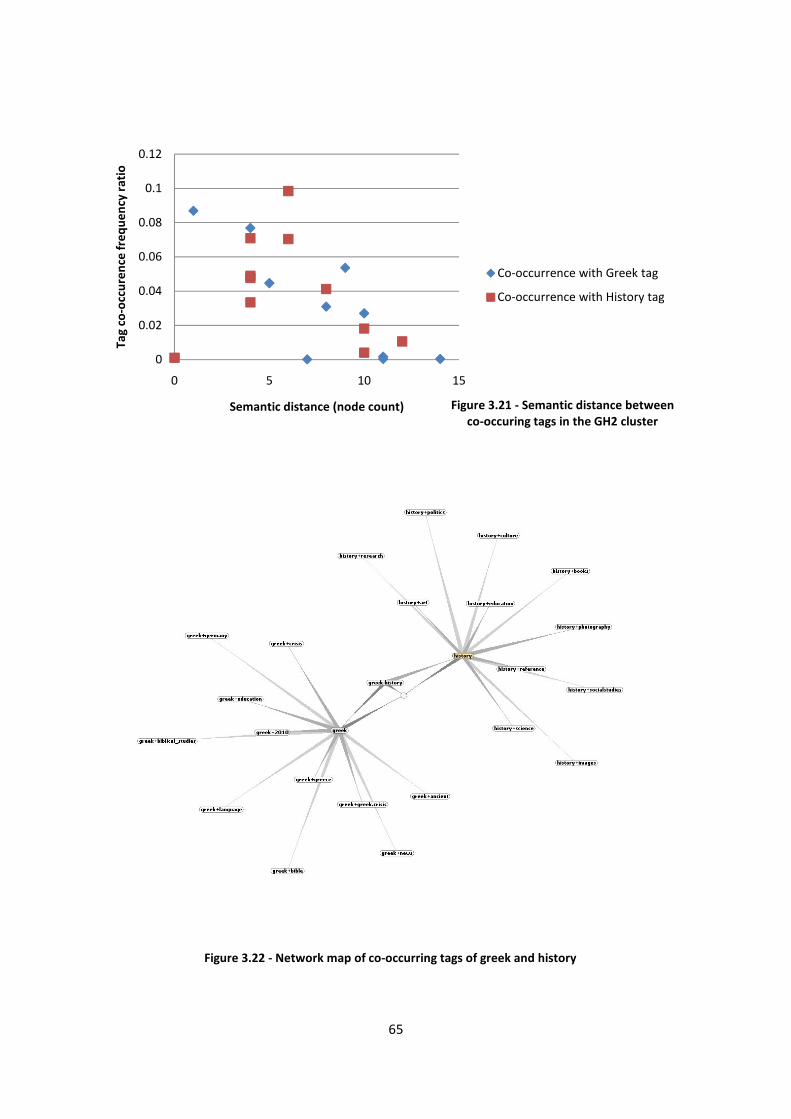
65
0
0.02
0.04
0.06
0.08
0.1
0.12
0 5 10 15
Ta
g c
o-o
ccu
ren
ce f
req
ue
ncy
ra
tio
Semantic distance (node count) Figure 3.21 - Semantic distance between
co-occuring tags in the GH2 cluster
Co-occurrence with Greek tag
Co-occurrence with History tag
Figure 3.22 - Network map of co-occurring tags of greek and history
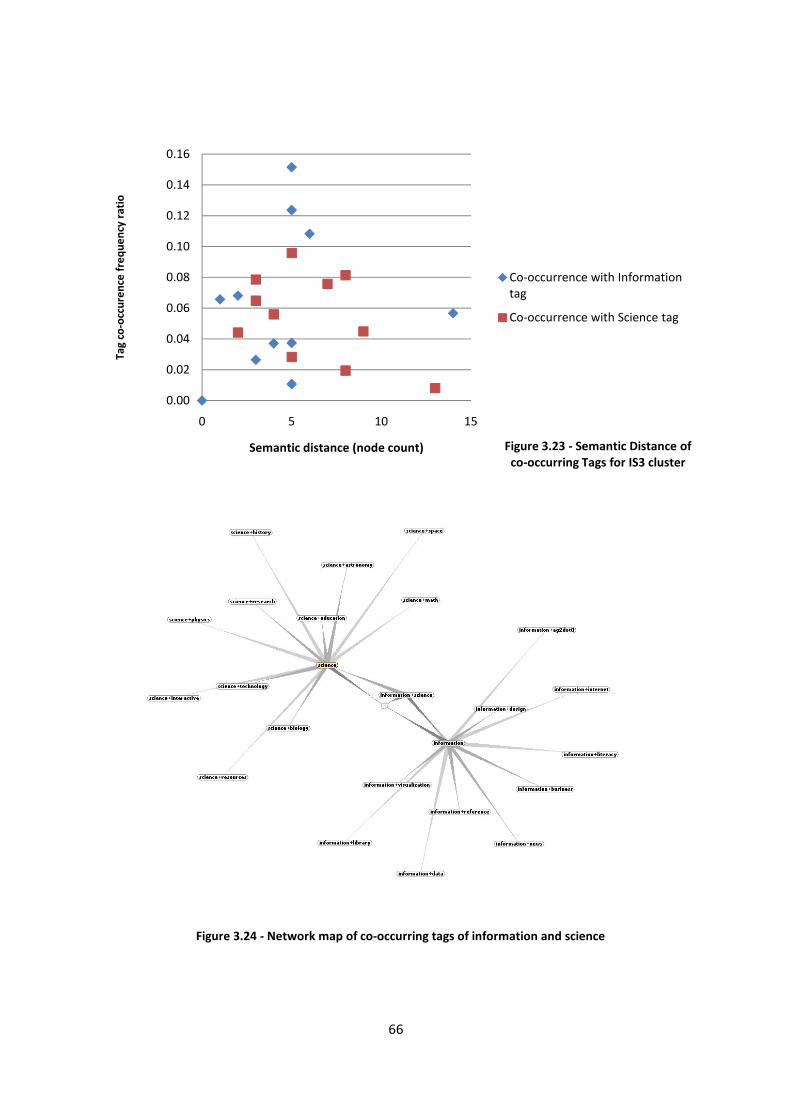
66
0.00
0.02
0.04
0.06
0.08
0.10
0.12
0.14
0.16
0 5 10 15
Ta
g c
o-o
ccu
ren
ce f
req
ue
ncy
ra
tio
Semantic distance (node count) Figure 3.23 - Semantic Distance of
co-occurring Tags for IS3 cluster
Co-occurrence with Information
tag
Co-occurrence with Science tag
Figure 3.24 - Network map of co-occurring tags of information and science
67
All verbs that appeared in the tag pairs were converted into nouns so that the similarity
measurement would work. The majority of synsets defined on Wordnet are nouns (ten times more
defined than verbs (Wordnet, 2010). Due to the limitation of “is-a” hierarchies, Wordnet
predominately works with "noun-noun", and "verb-verb" parts of speech (Simpson and Dao, 2005).
Therefore tags were stemmed or reformulated to ensure that a successful measurement could be
taken.
Compound nouns like "travel agent" will be treated as two single words via tokenization. With the
techniques available, further tokenization beyond n=1 cannot be performed. In this way it is
possible to anticipate certain problems with some data. This, in general is one of the main problems
with the type of measurement being performed.
All semantic measurements that returned a nil value (impossible under the terms of node counting)
are represented by any point on the y-axis.
Interpretation
Lawali and Huns (2009) predict that commonly occurring terms are semantically close. This is not
particularly borne out by the data analysed here. Closely related tags (i.e. those that share a node
count of 2 or 3) occur more in GH2 and IS3 than EB1.
GH2 data set is the least scattered result and hints at a broader hypothesis: semantic distance is
inversely proportional to co-occurrence frequency. Therefore, tag classes are more closely related
the more that they occur together.
Although this is an appealing conclusion, an important caveat must be stressed. The problems with
taking any measurements at all indicate that any results provided by this technique should be
treated with caution. The lack of precision, coupled with the enforced changes to the terms
measured, creates an artificial environment where the results are altered to fit the method.
Each cluster shows results on the axes, indicating a bad result where either the semantic distance
could not be calculated (zero value) and/or the co-occurrence frequency was negligible (approaching
zero).
Kuropka’s (2005) thesis concerning the uselessness of co-occurring terms is not overturned or
supplanted in this analysis. The idea of the co-occurrence and semantic relatedness is appealing in
that it provides a stable metric for deciding how semantically similar terms are based on a (machine
readable) statistical measurement. Unfortunately, this is not supported by the data.

68
In the light of discussion in the research design about clustering tag clouds around semantic
distance, it must be concluded that unless a technique is capable of handling the semantic value of
any tag, the capability is going to be limited. However, this isn’t to say that it would have some
success with certain terms. An application of this in social networking is considered in the
conclusion.
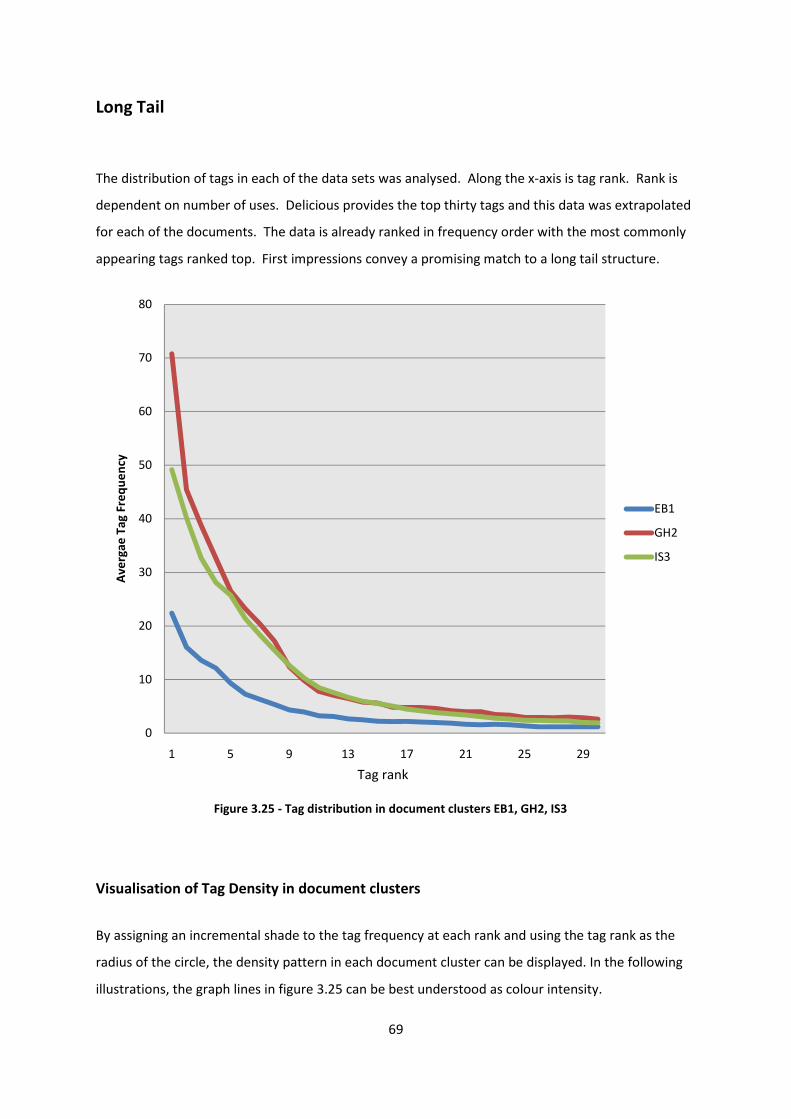
69
Long Tail
The distribution of tags in each of the data sets was analysed. Along the x-axis is tag rank. Rank is
dependent on number of uses. Delicious provides the top thirty tags and this data was extrapolated
for each of the documents. The data is already ranked in frequency order with the most commonly
appearing tags ranked top. First impressions convey a promising match to a long tail structure.
Visualisation of Tag Density in document clusters
By assigning an incremental shade to the tag frequency at each rank and using the tag rank as the
radius of the circle, the density pattern in each document cluster can be displayed. In the following
illustrations, the graph lines in figure 3.25 can be best understood as colour intensity.
0
10
20
30
40
50
60
70
80
1 5 9 13 17 21 25 29
Av
erg
ae
Ta
g F
req
ue
ncy
EB1
GH2
IS3
Figure 3.25 - Tag distribution in document clusters EB1, GH2, IS3
Tag rank
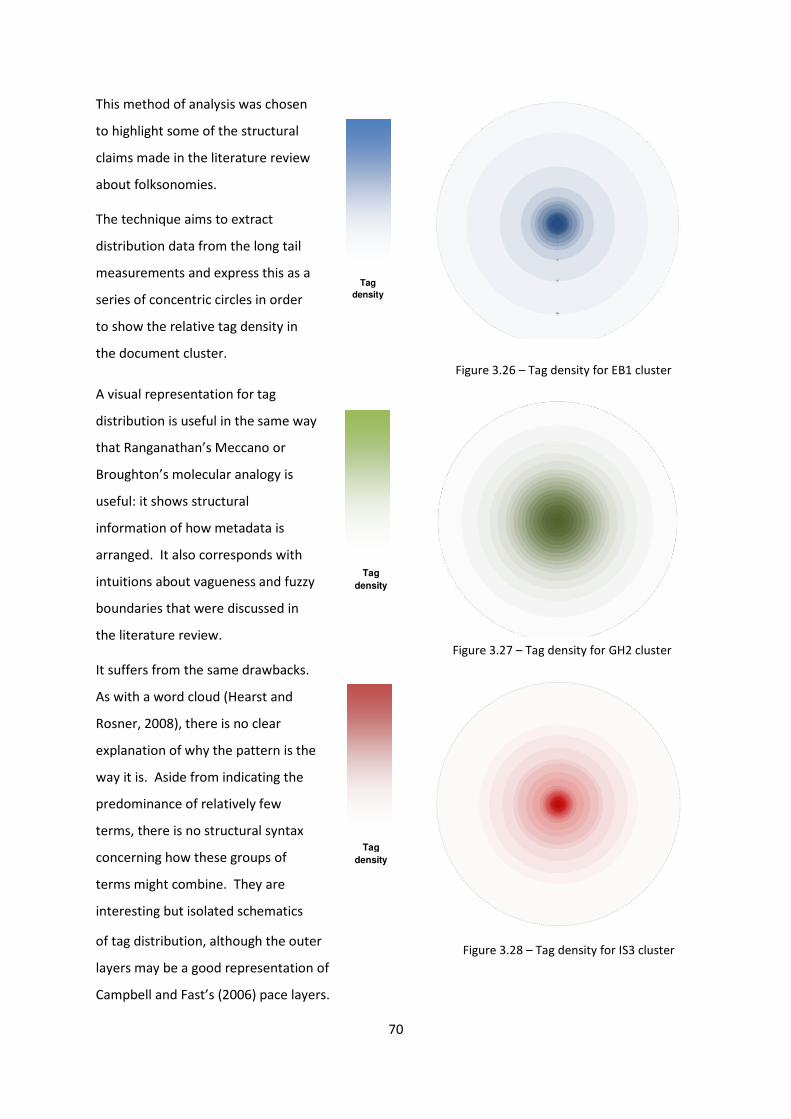
70
This method of analysis was chosen
to highlight some of the structural
claims made in the literature review
about folksonomies.
The technique aims to extract
distribution data from the long tail
measurements and express this as a
series of concentric circles in order
to show the relative tag density in
the document cluster.
A visual representation for tag
distribution is useful in the same way
that Ranganathan’s Meccano or
Broughton’s molecular analogy is
useful: it shows structural
information of how metadata is
arranged. It also corresponds with
intuitions about vagueness and fuzzy
boundaries that were discussed in
the literature review.
It suffers from the same drawbacks.
As with a word cloud (Hearst and
Rosner, 2008), there is no clear
explanation of why the pattern is the
way it is. Aside from indicating the
predominance of relatively few
terms, there is no structural syntax
concerning how these groups of
terms might combine. They are
interesting but isolated schematics
of tag distribution, although the outer
layers may be a good representation of
Campbell and Fast’s (2006) pace layers.
Tag
density
Tag
density
Tag
density
Figure 3.26 – Tag density for EB1 cluster
Figure 3.27 – Tag density for GH2 cluster
Figure 3.28 – Tag density for IS3 cluster
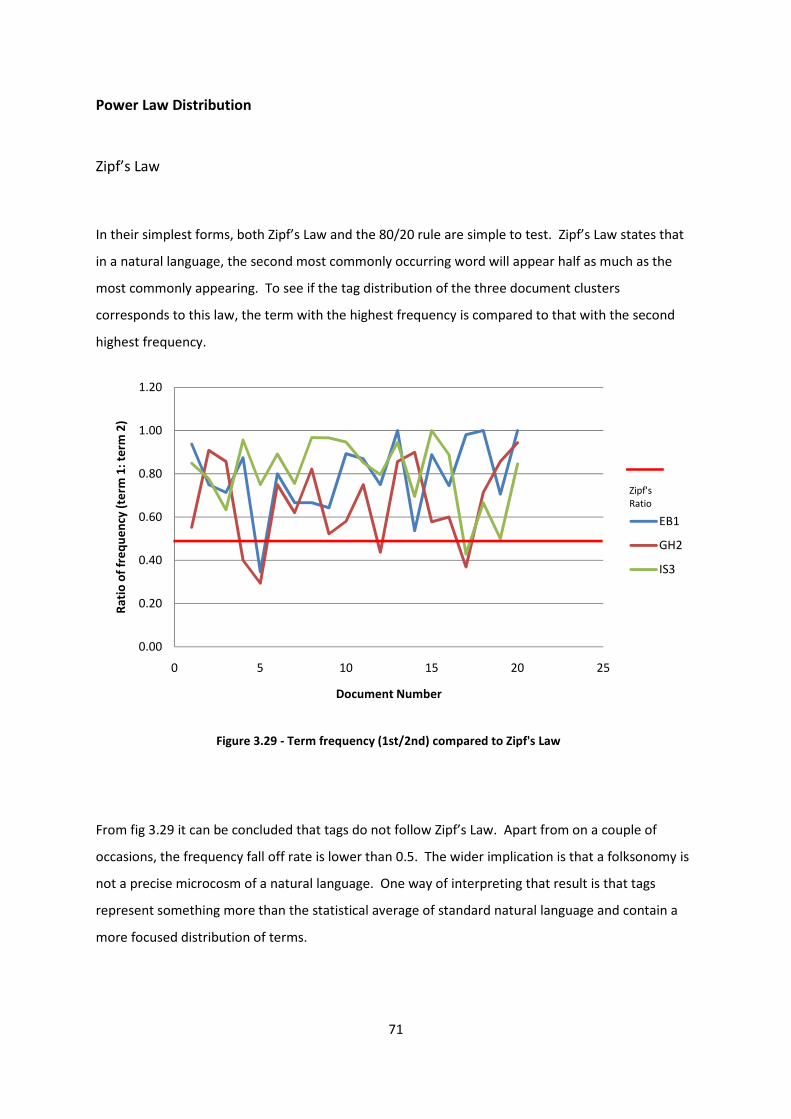
71
Power Law Distribution
Zipf’s Law
In their simplest forms, both Zipf’s Law and the 80/20 rule are simple to test. Zipf’s Law states that
in a natural language, the second most commonly occurring word will appear half as much as the
most commonly appearing. To see if the tag distribution of the three document clusters
corresponds to this law, the term with the highest frequency is compared to that with the second
highest frequency.
From fig 3.29 it can be concluded that tags do not follow Zipf’s Law. Apart from on a couple of
occasions, the frequency fall off rate is lower than 0.5. The wider implication is that a folksonomy is
not a precise microcosm of a natural language. One way of interpreting that result is that tags
represent something more than the statistical average of standard natural language and contain a
more focused distribution of terms.
0.00
0.20
0.40
0.60
0.80
1.00
1.20
0 5 10 15 20 25
Ra
tio
of
fre
qu
en
cy (
term
1:
term
2)
Document Number
EB1
GH2
IS3
Zipf's
Ratio
Figure 3.29 - Term frequency (1st/2nd) compared to Zipf's Law
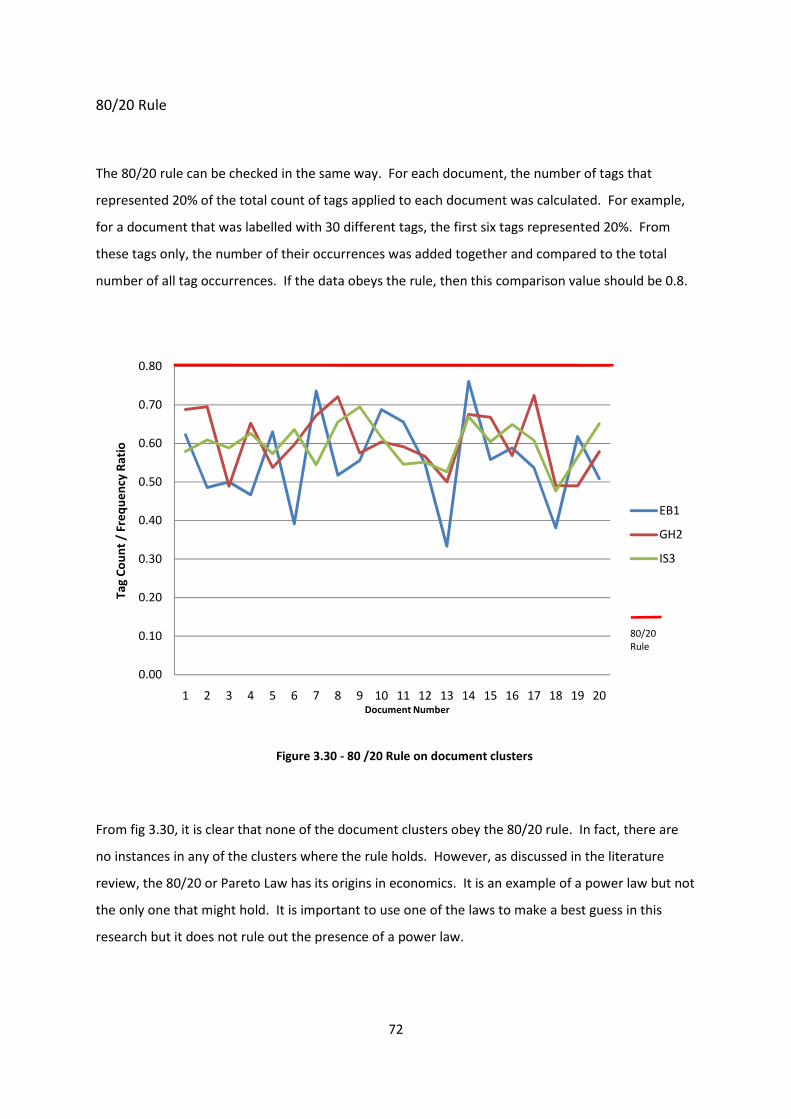
72
80/20 Rule
The 80/20 rule can be checked in the same way. For each document, the number of tags that
represented 20% of the total count of tags applied to each document was calculated. For example,
for a document that was labelled with 30 different tags, the first six tags represented 20%. From
these tags only, the number of their occurrences was added together and compared to the total
number of all tag occurrences. If the data obeys the rule, then this comparison value should be 0.8.
From fig 3.30, it is clear that none of the document clusters obey the 80/20 rule. In fact, there are
no instances in any of the clusters where the rule holds. However, as discussed in the literature
review, the 80/20 or Pareto Law has its origins in economics. It is an example of a power law but not
the only one that might hold. It is important to use one of the laws to make a best guess in this
research but it does not rule out the presence of a power law.
0.00
0.10
0.20
0.30
0.40
0.50
0.60
0.70
0.80
1 2 3 4 5 6 7 8 9 10 11 12 13 14 15 16 17 18 19 20
Ta
g C
ou
nt
/ F
req
ue
ncy
Ra
tio
EB1
GH2
IS3
80/20
Rule
Document Number
Figure 3.30 - 80 /20 Rule on document clusters
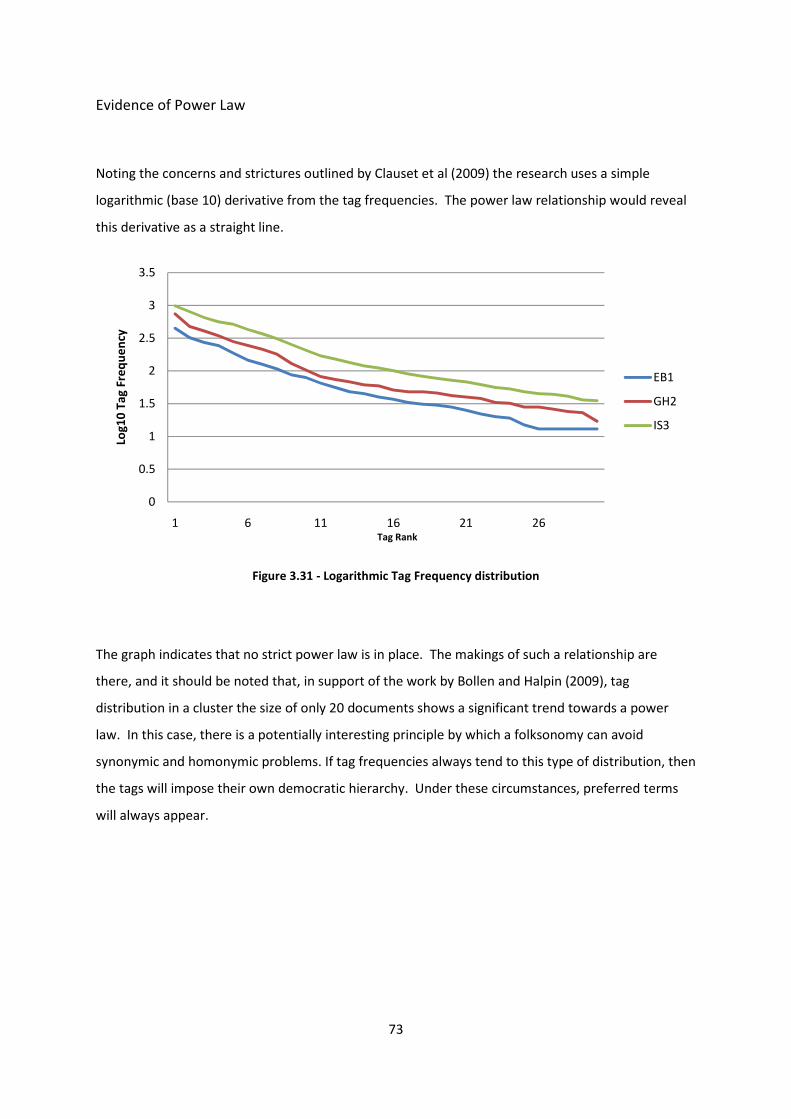
73
Evidence of Power Law
Noting the concerns and strictures outlined by Clauset et al (2009) the research uses a simple
logarithmic (base 10) derivative from the tag frequencies. The power law relationship would reveal
this derivative as a straight line.
Figure 3.31 - Logarithmic Tag Frequency distribution
The graph indicates that no strict power law is in place. The makings of such a relationship are
there, and it should be noted that, in support of the work by Bollen and Halpin (2009), tag
distribution in a cluster the size of only 20 documents shows a significant trend towards a power
law. In this case, there is a potentially interesting principle by which a folksonomy can avoid
synonymic and homonymic problems. If tag frequencies always tend to this type of distribution, then
the tags will impose their own democratic hierarchy. Under these circumstances, preferred terms
will always appear.
0
0.5
1
1.5
2
2.5
3
3.5
1 6 11 16 21 26
Log
10
Ta
g F
req
ue
ncy
EB1
GH2
IS3
Tag Rank

74
Conclusion
75
This concluding chapter will revisit the research questions. The strengths and weaknesses of the
answers will be assessed from a theoretical and practical perspective. Opportunities for further
study will be suggested.
The classification checklist revisited
The aim of proposing the checklist was twofold. Firstly, it was an important object on which to hang
a great deal of the theoretical discussion. Secondly, it was conjectured that the processes could be
investigated within the research design.
One of the major problems with this approach was the selectivity issue. It is one thing to argue that
modern classification techniques share something of the original prescribed method of classification;
it is another thing altogether to assert the similarities in a precise language.
Terms such as homogeneity and currency (as Spiteri (1998) herself notes) are more likely to cloud
thinking on the subject than clarify it. This research has set out to demystify some of the more
arcane terminology of classification that arose from Ranganathan’s thinking over sixty years ago and
which, according to Beghtol (2008), wasn’t properly understood by his most brilliant
contemporaries.
Further (and necessarily deeper) research into the history and evolution of the terminology used by
Ranganathan and then the CRG may have helped explain the peculiarities of some of the
terminology. Unfortunately, this would also distance the project from the core reason for
introducing the terminology in the first place: that of showing that the key concepts were alive and
well in the thinking of modern practices.
In terms of the classification concepts that were selected (i.e. the ones that made the most sense)
the selection bias was towards faceted classification. It is demonstrated in the findings that the
Delicious folksonomy is not a good fit for many of the processes described. Although this is a valid
conclusion of the research and a prediction from the literature review, it says more about what a
folksonomy isn’t and therefore lacks penetration as a research tool.
A summary of what was discussed in the findings about the checklist is as follows:
The folksonomy functions successfully as a clustering classification strategy, showing only a small
proportion of borderline cases in the initial document harvest.
76
Semantic Proxy behaves like a faceted classification scheme, creating a total dimensionality of all
documents of 30. The number of instances that the software detects and extracts is in proportional
agreement with the number of words that the document contains. Semantic Proxy doesn’t add
classes in the same way but limits the number (in the same way that PMEST keeps the descriptive
variables limited to five). The drawback is an artificial classification of some instances, often into the
classes [company names] and [positions]. It is hypothesised that this is due to the way that open
data is queried in the LOD cloud and that many of the RDF relations and URIs have an enterprise and
news flavour. The implication is that classification is always a subjective process, despite first
appearances.
Similarity revisited
The similarity measurement part of the research design should be classified as an honourable failure.
Much of the research into ontology development with tags including work by Markines et al (2009),
Mase (2009), Nagypal (2005) and Van Damme et al (2007), all argue that tags can augment and go
some way to constructing new ontologies. This is true, particularly in the approach seeded by
Gruber (2007) concerning this amalgamation, neologised as folksontologies. The core idea is that
tags and taggers become tripled, between themselves, the tag they create and the target of the tag.
This work is cutting edge, in the sense that utilising distributed classification supports the thesis that
typical ontology design is time consuming and expensive.
This area of practical research is beyond the technical capabilities of this work, although the findings
do pick up on some potential problem areas that such research has to consider. The major hurdle is
the difficulty in calculating semantic similarity and, if obtained, interpreting the results. As
demonstrated by the software used, there are many possible similarity measures and this research
concludes that the metric to pick is the one that best suits the purpose.
Despite the difficulties involved in the process, the research did make some findings.
Statistically and semantically, there is no better and sustained similarity between any two tag
outputs. One reason for the low scores is the presence of n-grams (or word groups) in the Semantic
Proxy output. This is a problem since neither Delicious tags nor keywords appear in any larger size
than a 1-gram. The research tools are not able to compare tags of varying syntax.
77
Structural properties revisited
This part of the research was more successful than the previous. Although routed in quantitative
analysis, it was also an opportunity to explore the visual properties of both classification techniques.
The major drawback of the research design is that the structural properties of the techniques are
taken in isolation. This is always a danger if, as the research predicts, the two techniques have
completely different structural properties.
Properties of co-occurrence
In light of the research by Lawlani and Huhns (2009) and the problems identified by Kuropka (2005),
the main objective was to investigate whether there was a clear relationship between tag co-
occurrence frequency in the Delicious folksonomy and the semantic similarity of the tags. From the
data analysed, it was concluded that no such relationship exists. Parts of the data did show that
frequently co-occurring tags do exhibit a close class / sub-class relationship (a semantic distance
between one and four), particularly in the GH2 and IS3 document clusters. Further to this, GH2 did
exhibit a more focused set of results that hinted at, in that document cluster at least, a proportional
and linear relationship between semantic distance and tag pair frequency.
This is an important result for the idea of semantic clustering. An example from Twitter can make its
potential clear. To aggregate tweets on a similar topic, users can include a hash tag (#), which gives
the tweet machine readable metadata. This is important in finding content according to topic and
extends the parameters of keyword searching on the social network by creating information streams
around categorisations. Once a user is locked onto a topic in this way, they might want to look for
similar topic streams. This could be solved by aggregating different hash tags and measuring the
semantic distance. Semantically close hash tags are likely to be on a similar topic and of potential
interest to the user on the social network. The possibility of reorganising social network information
in this way is a possible, topical, and interesting area for further study.
The long tail
The research concluded that, according to even the small (but dispersed) data samples used, tags on
documents are organised into a long tail structure. Two specific power law paradigms were applied -
Zipf’s Law and the 80/20 (Pareto’s) Rule – but found not to apply to the data. Although there was a
suggestion that the data was close to being organised according to a power law, the strict conditions
78
set out by Clauset et al (2009) prohibit any suggestion of such without further rigorous mathematical
analysis.
Faceted or diffuse classification
The focus on faceted classification is due to its predominance on the web. The research aim was to
make this explicit in the literature review and draw on common examples from the web to back up
the claim. What was lacking from the research design was a clearer focus on how the concept maps
generated in Thinkpedia are an extension of online retail paradigms such as those on eBay and
Amazon. The linked maps of classes and instances gives a new means of document navigation that
exploits the same principle as hyperlinks in web documents. The mimicking of hyperlinks between
semantically similar information spaces is exploited by Mase (2009) with topic maps.
Visualising the structures
Appendix 1 contains the 20 most ‘interesting’ concept maps from the sixty documents available. The
selection criteria were maps that featured the most classes and instances. The output of Thinkpedia
is compelling in viewing faceted classification as a molecular system, as Broughton (2007) proposes.
The other elements of the molecular metaphor such as the notion of bonds as syntax are also
present. In terms of Broughton’s final analogy, it seems correct to state that the RDF triples, and the
associations provide the rules by which the bonds occur. To temper the success of the analogy it
should be qualified that Semantic Proxy did produce some generic relation errors and did not
produce social tags for some documents. This is wholly permissible from software at beta testing
stage.
It is worth adding here that the concentric ring graphs for the tag distribution in a document cluster
also helps explain key concepts, such as the pace layering of Campbell and Fast (2006) and the
philosophically complex idea of vague boundaries. The qualification, as with the faceted concept
maps, is that visualisation is a useful explanatory device, and although grounded in the data, does
not give any fresh quantitative insight.
79
Summary
1. The classification checklist
The research found that a checklist was a useful lens under which the two classification
techniques could be scrutinised. The strategy was successful in helping draw theoretical
strands of classification together to make some predictions about what features each
technique would display.
The main drawback was the issue of selectivity. Only a small portion of the possible
properties of classification were explored. The checklist was a weak lens for examining the
folksonomy and is better suited to faceted schemes.
2. Similarity
This was a difficult concept to define and measure. Due to the large populace of competing
metrics in the field, it was a complex task to choose the best way of measuring similarities
between document tags. The measurements suggested that there was no pattern of
similarity between social tags, tags and keywords that indicated one approach was better
than the other. The research design was not able to provide a suitable measurement for n-
grams (or word groups).
3. Structure
Analysis on co-occurring pairs suggested that there is a correlation between frequency and
semantic distance on some pairs. There was not enough evidence to suggest the correlation
was a rule.
Graphical interpretations on tag frequency and density suggested that the tags in the
Delicious folksonomy obeyed a power law distribution. It was established that neither Zipf’s
nor Pareto’s law held for the data studied. Further rigorous mathematical analysis would be
required to discover whether there was a genuine underlying power law.
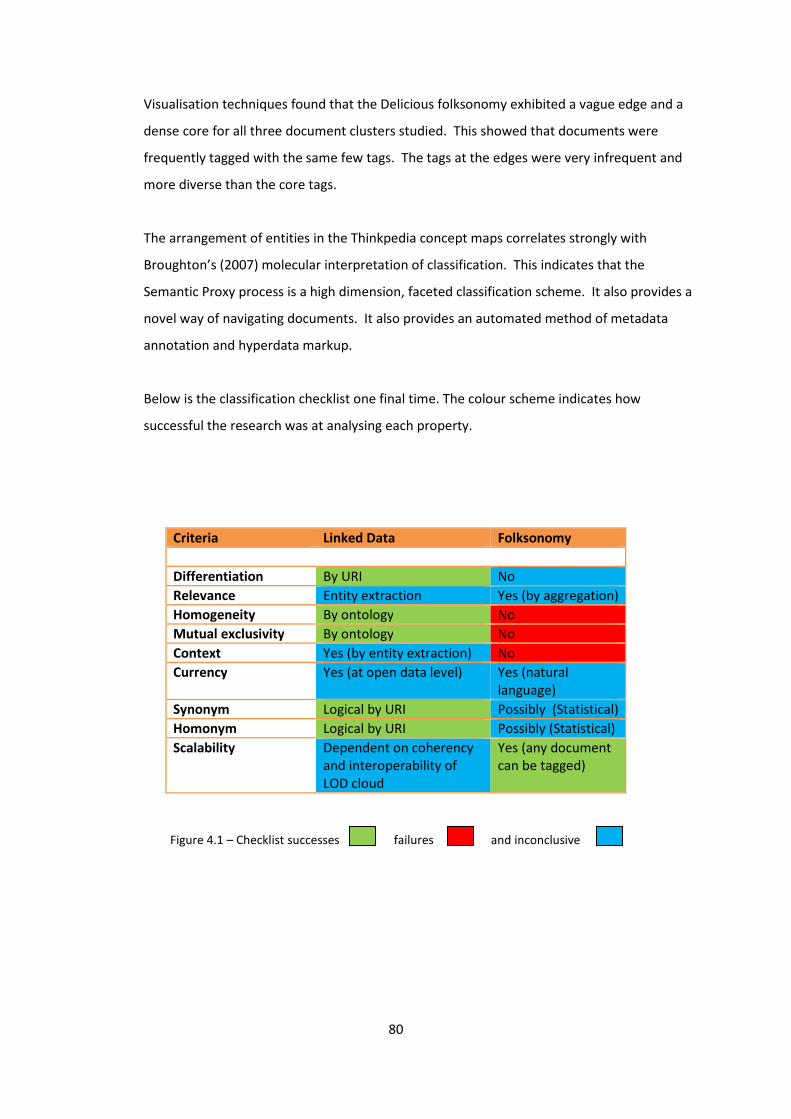
80
Visualisation techniques found that the Delicious folksonomy exhibited a vague edge and a
dense core for all three document clusters studied. This showed that documents were
frequently tagged with the same few tags. The tags at the edges were very infrequent and
more diverse than the core tags.
The arrangement of entities in the Thinkpedia concept maps correlates strongly with
Broughton’s (2007) molecular interpretation of classification. This indicates that the
Semantic Proxy process is a high dimension, faceted classification scheme. It also provides a
novel way of navigating documents. It also provides an automated method of metadata
annotation and hyperdata markup.
Below is the classification checklist one final time. The colour scheme indicates how
successful the research was at analysing each property.
Criteria Linked Data Folksonomy
Differentiation By URI No
Relevance Entity extraction Yes (by aggregation)
Homogeneity By ontology No
Mutual exclusivity By ontology No
Context Yes (by entity extraction) No
Currency Yes (at open data level) Yes (natural
language)
Synonym Logical by URI Possibly (Statistical)
Homonym Logical by URI Possibly (Statistical)
Scalability Dependent on coherency
and interoperability of
LOD cloud
Yes (any document
can be tagged)
Figure 4.1 – Checklist successes failures and inconclusive

81
References
82
Anderson, C. (2006) The long tail : how endless choice is creating unlimited demand, London:
Random House Business Books.
Beckner, M. (1968) The biological way of thought. Berkeley, Calif.: University of California Press.
Beghtol, C. (2008) From the Universe of Knowledge to the Universe of Concepts: The Structural
Revolution in Classification for Information Retrieval. Axiomathes [online]. 18(2), pp.131-144.
Available from: www.springerlink.com/index/ww5x352j7786u052.pdf [Accessed 01/01/10]
Berners-Lee, T. (1998) Semantic Web Road map, [online], available:
http://www.w3.org/DesignIssues/Semantic.html [Accessed 01/01/10]
Blanken, H. (2003) Intelligent search on XML data : applications, languages, models,
implementations, and benchmarks, Lecture notes in computer science. Berlin: Springer.
Bollen, D. and Halpin, H. (2009) The role of tag suggestions in folksonomies. Proceedings of the 20th
ACM conference on Hypertext and hypermedia [online]. Torino, Italy, 1557988: ACM, pp.359-360.
Available from: http://portal.acm.org/citation.cfm?id=1557914.1557988 [Accessed 01/01/10]
Borges, J. L. (2000) Collected fictions, London: Penguin.
Broughton, V. (2006) The need for a faceted methods of information retrieval. Aslib Proceedings
[online]. 58(1-2), pp.49-72. Available from: http://dx.doi.org/10.1108/00012530610648671
[Accessed 01/01/10]
Broughton, V. (2007) 'Meccano, molecules, and the organization of knowledge - The continuing
contribution of S.R. Ranganathan [online]. Available from:
http://www.iskouk.org/presentations/VandaBroughtonNov2007.ppt [Accessed 01/01/10]
Burrell, Q. (1985) The 80/20 Rule: Library Lore or Statistical Law? Journal of Documentation, 41(1),
pp.24-39.
Byrne, K. (2009) 'Putting Hybrid Cultural Data on the Semantic Web', Journal of Digital Information
[online] 10(6). Available from http://journals.tdl.org/jodi/article/viewArticle/700/579 [Accessed
01/04/10]
Calais (2008) The Core: The OpenCalais Web Service [online]. Available from:
http://www.opencalais.com/about [Accessed 01/01/10]
Cheng, C. K., Pan, X. S. and Kurfess, F. (2004) Ontology-based semantic classification of unstructured
documents. Adaptive Multimedia Retrieval, 3094, pp.120-131.
Clauset, A., Shalizi, C. and Newman, M. E. J. (2009) Power-law distributions in empirical data. Version
2. arXiv.org [online]. Available from http://arxiv.org/abs/0706.1062 [Accessed 01/04/10]
Denscombe, M. (2007) The good research guide : for small-scale social research projects, Open up
study skills. 3rd ed., Maidenhead: Open University Press.
Floridi, L. (2009) 'Web 2.0 vs. the Semantic Web: A Philosophical Assessment', Episteme, 6(1), pp.25-
37. Also available from: www.philosophyofinformation.net/publications/pdf/w2vsw.pdf [Accessed
01/01/10]
83
Green, R. and Panzer, M. (2009) The Ontological Character of Classes in the Dewey Decimal
Classification. 11th International Conference of the International Society for Knowledge Organization
(ISKO), Sapienza University of Rome. Pre-print [online]. Available from:
www.nationaltreasures.nla.gov.au/lis/stndrds/grps/acoc/documents/EPC132-37.1.doc [Accessed
01/04/10]
Gruber, T. (2007) Ontology of folksonomy: A mash-up of apples and oranges, International Journal
on Semantic Web and Information Systems, 3, pp.1-11. Available from:
www.tomgruber.org/writing/ontology-of-folksonomy.htm [Accessed 01/01/10]
Gyllenberg, M. and Koski, T. (1996) Numerical taxonomy and the principle of maximum entropy.
Journal of Classification, 13(2), pp.213-229.
Hearst, M. A., and Rosner, D. (2008) Tag Clouds: Data Analysis Tool or Social Signaller in Proceedings
of the 41st Annual Hawaii International Conference on System Sciences (HICSS 2008) [online].
Available from: http://doi.ieeecomputersociety.org/10.1109/HICSS.2008.422 [Accessed 01/01/10]
Hewson, C. (2003) Internet research methods : a practical guide for the social and behavioural
sciences, New technologies for social research, London Thousand Oaks, Calif.: Sage Publications.
Holgate, L. (2004) Creating and using taxonomies to enhance enterprise search. Econtent [online].
July 2004, pp.10-11. Available from: www.highbeam.com/doc/1G1-120096762.html [Accessed
01/01/10]
Hyde, D. (2005) Sorites Paradox. The Stanford Encyclopedia of Philosophy [online]. Available from:
http://plato.stanford.edu/entries/sorites-paradox/ [Accessed 01/01/10]
Idehen, K. (2009) 5 Very Important Things to Note about HTTP based Linked Data. Kingsley Idehen's
Blog Data Space [online]. Available from: http://bit.ly/6xVYhy [Accessed 01/01/10]
Kelly, B. (2010) Response To My Linked Data Challenge. UK Web Focus [online]. Available from:
http://ukwebfocus.wordpress.com/2010/02/19/response-to-my-linked-data-challenge/ [Accessed
01/04/10]
Kunen, K. (1980) Set theory: an introduction to independence proofs. Studies in logic and the
foundations of mathematics. Amsterdam ; New York: North-Holland Pub.
Kuropka, D. (2005) Uselessness of simple co-occurrence measures for IF&IR–a linguistic point of view
[online]. Available from: www.kuropka.net/files/Co-Occurrence.pdf [Accessed 01/01/10]
Langridge, D. W. (1992) Classification : its kinds, elements, systems and applications, Topics in library
and information studies, London: Bowker-Saur.
Legg, C. (2007) Ontologies on the semantic Web. Annual Review of Information Science and
Technology, 41, pp.407-451. Available from: http://bit.ly/cYSPV8 [Accessed 01/01/10]
Lin, D. (1998) An Information-Theoretic Definition of Similarity [online]. Available from:
http://webdocs.cs.ualberta.ca/~lindek/papers/sim.pdf [Accessed 01/01/10]
84
Lux, M., Granitzer, M. and Kern, R. (2007) Aspects of broad folksonomies. Proceedings of the 18th
International Conference on Database and Expert Systems Applications (DEXA 2007), pp.283-287.
IEEE Computer SocietyAvailable from: http://doi.ieeecomputersociety.org/10.1109/DEXA.2007.80
[Accessed 01/01/10]
Mann, T. (1986) A guide to library research methods. Oxford: Oxford University Press.
Markines, B., Cattuto, C., Menczer, F., Benz, D., Hotho, A. and Stumme, G. (2009) Evaluating
Similarity Measures for Emergent Semantics of Social Tagging. 18th International World Wide Web
Conference, Madrid, Spain, Available from: http://www2009.org/proceedings/pdf/p641.pdf
[Accessed 01/01/10]
Markov, Z. and Larose, D. T. (2007) Data mining the Web : uncovering patterns in Web content,
structure, and usage, Wiley series on methods and applications in data mining, Hoboken, N.J.: Wiley.
Mase, M., Yamada, S. and Nitta, K. (2009) Extracting Topic Maps from Web Pages in Chawla, S.,
Washio, T., Minato, S. I., Tsumoto, S., Onoda, T., Yamada, S. and Inokuchi, A., eds., New Frontiers in
Applied Data Mining, Berlin: Springer-Verlag Berlin, pp.169-180. Available from:
http://www.springerlink.com/content/1pk0721332375648/ [Accessed 01/01/10]
Morville, P. (2005) Ambient findability: what we find changes who we become, O'Reilly Media, Inc.
Morville, P. and Rosenfeld, L. (2007) Information architecture for the World Wide Web, 3rd ed.,
Sebastopol, CA: O'Reilly.
Nagypal, G. (2005) Improving information retrieval effectiveness by using domain knowledge stored
in ontologies. On the Move to Meaningful Internet Systems 2005: Otm 2005 Workshops,
Proceedings, 3762, pp.780-789. Available from: http://bit.ly/d2HqIn [Accessed 01/01/10]
Needham, R. (1975) 'Polythetic Classification: Convergence and Consequences', Man [online]. 10(3),
pp.349-369. Available from: www.jstor.org/stable/2799807 [Accessed 01/01/10]
Noy, F. and McGuinness, D. (2001) Ontology Development I0I: A Guide to Creation Your First
Ontology [online]. Available from: http://www-ksl.stanford.edu/people/dlm/papers/ontology-
tutorial-noy-mcguinness.pdf [Accessed 01/01/10]
O'Neill, E. T., Childress, E., Dean, R., Kammerer, K., Vizine-Goetz, D. (2001) FAST: Faceted
Application of Subject Terminology [online]. Available from:
http://www.oclc.org/research/activities/fast/dc-fast.doc [Accessed 01/01/10]
Ranganathan, S. R., Palmer, B. I. and Association of Assistant Librarians. (1960) Elements of library
classification : based on lectures delivered at the University of Bombay in December 1944, and in the
schools of librarianship in Great Britain in December 1956, 2nd ed., London: Association of Assistant
Librarians.
Resnik, P. (1995) Using information content to evaluate semantic similarity in a taxonomy.
Proceedings of the Fourteenth International Joint Conference on Artificial Intelligence, Vols 1 and 2,
pp.448-453.
85
Schwarz, K. (2005) Domain model enhanced search - A comparison of taxonomy, thesaurus and
ontology, unpublished thesis University of Utrecht [online]. Available from:
http://homepages.cwi.nl/~media/publications/masterthesis_kat_domainmodel_2005.pdf [Accessed
01/01/10]
Shirky, C. (2005) Ontology is Overrated: Categories, Links, and Tags. Writings [online]. Available
from: http://www.shirky.com/writings/ontology_overrated.html [Accessed 01/01/10]
Simpson, T. and Dao, T. (2005) WordNet-based semantic similarity measurement [online]. Available
from: http://www.codeproject.com/KB/string/semanticsimilaritywordnet.aspx [Accessed 01/01/10]
Smith, G. (2008) Tagging: emerging trends. Bulletin [online]. 34(6). Available from:
http://www.asis.org/Bulletin/Aug-08/AugSep08_Smith.pdf [Accessed 01/01/10]
Sorensen, R. (2006) ‘Vagueness’ The Stanford Encyclopedia of Philosophy [online]. Available from:
http://plato.stanford.edu/entries/vagueness/ [Accessed 01/01/10]
Sowa, J.F. (2000a) Ontology, Metadata, and Semiotics [online]. Available from:
http://www.jfsowa.com/ontology/ontometa.htm [Accessed 01/01/10]
Spiteri, L. (1998) 'A simplified model for facet analysis: Ranganathan 101', Canadian Journal of
Information and Library Science-Revue Canadienne Des Sciences De L Information Et De
Bibliotheconomie, 23(1-2), pp.1-30.
Van Damme, C., Hepp, M. and Siorpaes, K. (2007) Folksontology: An integrated approach for turning
folksonomies into ontologies, Bridging the Gap between Semantic Web and Web 2.0 (SemNet 2007)
[online]. pp.57–70. Available from: http://www.kde.cs.uni-
kassel.de/ws/eswc2007/proc/FolksOntology.pdf [Accessed 01/01/10]
Vander Wal, T. (2007) 'Folksonomy' vanderwal.net [online]. Available from:
http://vanderwal.net/folksonomy.html [Accessed 01/01/10]
Wang, J. (2009) An Extensive Study on Automated Dewey Decimal Classification. Journal of the
American Society for Information Science and Technology. [online] 60(11), pp.2269-2286. Available
from: http://www3.interscience.wiley.com/journal/122499033/abstract [Accessed 01/01/10]
Wordnet (2010) Wordnet: A lexical database for English [online] Available from:
http://wordnet.princeton.edu/ [Accessed 01/01/10]
Zhang, H. and Song, H. T. (2006) Fuzzy related classification approach based on semantic
measurement for web document. IEEE Computer Soc [online]. pp.615-619. Available from:
http://doi.ieeecomputersociety.org/10.1109/ICDMW.2006.83 [Accessed 01/01/10]
Zipf, G. K. (1965) Human behavior and the principle of least effort : an introduction to human
ecology, New York ; London: Hafner.

86
Bibliography
87
Al-Khalifa, H. S. and Davis, H. C. (2006) Folksonomies versus automatic keyword extraction: an
empirical study [online]. Available from: http://eprints.ecs.soton.ac.uk/13155/ [Accessed 01/01/10]
Au Yeung, C. M., Gibbins, N. and Shadbolt, N. (2008) Web Search Disambiguation by Collaborative
Tagging. In: Workshop on Exploring Semantic Annotations in Information Retrieval at ECIR'08, 30
March 2008, Glasgow, UK [online]. pp. 48-61. Available from: http://eprints.ecs.soton.ac.uk/15393/
[Accessed 01/01/10]
Aunger, R. (2002) The electric meme : a new theory of how we think, New York, N.Y. ; London: Free
Press.
Bailey, K. D. (1994) Typologies and taxonomies : an introduction to classification techniques,
Quantitative applications in the social sciences. Thousand Oaks, Calif. ; London: Sage.
Broughton, V. (2004) Essential classification, US ed., New York: Neal-Schuman.
Charu, C. A. (2004) On Using Partial Supervision for Text Categorization, IEEE Transactions on
Knowledge and Data Engineering [online]. 16(2), pp.245-255. Available from:
10.1109/TKDE.2004.1269601 [Accessed 01/01/10]
Chowdhury, G. G. (2004) Introduction to modern information retrieval, 2nd ed., London: Facet.
Chowdhury, G. G. and Chowdhury, S. (2001) Information sources and searching on the World Wide
Web, London: Library Association Pub.
Crestani, F., Lalmas, M. and Van Rijsbergen, C. J. (1998) Information retrieval: uncertainty and logics:
advanced models for the representation and retrieval of information, The Kluwer international series
on information retrieval. Boston, [Mass.] : Kluwer Academic.
Cyganiak, R. a. J., Anja (2009) About the Linking Open Data dataset cloud [online], available:
http://richard.cyganiak.de/2007/10/lod/ [Accessed 01/01/10]
Everitt, B. S., Landau, S. and Leese, M. (2001) Cluster analysis, 4th ed., London: Arnold.
Garshol, L. M. (2004) Metadata? Thesauri? Taxonomies? Topic Maps! [online], available:
http://www.ontopia.net/topicmaps/materials/tm-vs-thesauri.html [Accessed 01/01/10]
Golder, S. A. and Huberman, B. A. (2006) Usage patterns of collaborative tagging systems. Journal of
Information Science [online]. 32(2), pp.198-208. Available from:
http://jis.sagepub.com/cgi/content/short/32/2/198 [Accessed 01/01/10]
Golub, K. (2006) Automated subject classification of textual Web pages, based on a controlled
vocabulary: Challenges and recommendations. New Review of Hypermedia and Multimedia [online].
12(1), pp.11 - 27.
Available from: http://www.informaworld.com/smpp/content~content=a749307104~jumptype=rss
[Accessed 01/01/10]
88
Gómez-Pérez, A. and Benjamins, R. (2002) Knowledge engineering and knowledge management:
ontologies and the semantic web : 13th international conference, EKAW 2002, Sigüenza, Spain,
October 1-4, 2002 : proceedings, Lecture notes in computer science. Berlin ; New York: Springer.
Haase, K. (2004) Context for semantic metadata. In Proceedings of the 12th annual ACM
international conference on Multimedia, New York, NY, USA, ACM [online]. pp. 204-211. Available
from: http://portal.acm.org/citation.cfm?id=1027527.1027574 [Accessed 01/01/10]
Hatala, M. and Richards, G. (2003) Value-added metatagging: Ontology and rule based methods for
smarter metadata, translated by Schroeder, M. and Wagner, G., Sanibel, Florida: Springer-Verlag
Berlin, pp.65-80. Online version available from: http://www.sfu.ca/~mhatala/pubs/RuleML03-
hatala-richards.pdf [Accessed 01/01/10]
Haynes, D. (2004) Metadata for information management and retrieval, London: Facet.
Huang, A. W.-C. and Chuang, T.-R. (2009) Social tagging, online communication, and Peircean
semiotics: a conceptual framework. Journal of Information Science [online]. 35(3), pp.340-357.
Available from: jis.sagepub.com/cgi/rapidpdf/0165551508099606v1 [Accessed 01/01/10]
Iglesias, E. and Hye, S. S. (2008) Topic maps and the ILS: an undelivered promise. Library Hi Tech
[online]. 26(1), pp.12-18. Available from: www.emeraldinsight.com/0737-8831.htm [Accessed
01/01/10]
Isaac, A., Wang, S., Zinn, C., Matthezing, H., van der Meij, L. and Schlobach, S. (2009) Evaluating
Thesaurus Alignments for Semantic Interoperability in the Library Domain, Intelligent Systems, IEEE
[online]. 24(2), pp.76-86. Available from:
www.computer.org/portal/web/csdl/doi/10.1109/MIS.2009.26 [Accessed 01/01/10]
Jacob, E. (2004) Library Trends: Classification and categorization: a difference that makes a
difference. Library Trends [online]. 52(3), pp.515–540. Available from:
http://citeseerx.ist.psu.edu/viewdoc/download?doi=10.1.1.125.255 [Accessed 01/01/10]
Jesse, E. and Sergei, N. (2008) Abstract Calculating Concept Similarity Heuristics For Ontology
Learning from Text [online]. Available from:
http://jesseenglish.com/downloads/ConceptSimilarity.pdf [Accessed 01/01/10]
Kotsiantis, S. B., Zaharakis, I. D. and Pintelas, P. E. (2006) Machine learning: a review of classification
and combining techniques. Artificial Intelligence Review, 26(3), pp.159-190.
McIlraith, S. A., Plexousakis, D. and Van Harmelen, F. (2004) The Semantic Web, ISWC 2004 : Third
International Semantic Web Conference, Hiroshima, Japan, November 7-11, 2004 : proceedings,
Lecture notes in computer science,, Berlin ; New York: Springer.
Pepper, S. (2004) The TAO of Topic Maps - Finding the Way in the Age of Infoglut [online]. Available
from: http://www.ontopia.net/topicmaps/materials/tao.html [Accessed 01/01/10]
89
Pong, J. Y.-H., Kwok, R. C.-W., Lau, R. Y.-K., Hao, J.-X. and Wong, P. C.-C. (2008) A comparative study
of two automatic document classification methods in a library setting. Journal of Information Science
[online]. 34(2), pp.213-230. Available from: jis.sagepub.com/cgi/content/short/34/2/213 [Accessed
01/01/10]
Resnik, P. (1999) Semantic similarity in a taxonomy: An information-based measure and its
application to problems of ambiguity in natural language. Journal of Artificial Intelligence Research
[online]. 11, pp.95-130. Available from: http://
citeseerx.ist.psu.edu/viewdoc/summary?doi=10.1.1.50.3785 [Accessed 01/01/10]
Salonen, J. (2007) Self-organising map based tag clouds - creating spatially meaningful
representations of tagging data. Proceedings of OPAALS Conference 2007 [online]. pp.188-192.
Available from: http://matriisi.ee.tut.fi/hypermedia/julkaisut/2007-salonen-som-clouds.pdf
[Accessed 01/01/2010]
Salton, G. (1968) Automatic information organization and retrieval, McGraw-Hill computer science
series, New York,: McGraw-Hill.
Shin, S., Jeong, D. and Baik, D. K. (2009) Translating Topic Maps to RDF/RDF Schema for The
Semantic Web. Journal of Research and Practice in Information Technology [online]. 41(3), pp.223-
238. Available from: www.jrpit.acs.org.au/jrpit/JRPITVolumes/JRPIT41/JRPIT41.3.223.pdf [Accessed
01/01/2010]
Sinclair, J. and Cardew-Hall, M. (2008) The folksonomy tag cloud: when is it useful? Journal of
Information Science [online]. 34(1), pp.15-29. Available from:
http://jis.sagepub.com/cgi/content/short/34/1/15 [Accessed 01/01/2010]
Sowa, J. F. (2000b) Knowledge representation: logical, philosophical, and computational foundations,
Pacific Grove: Brooks/Cole.
Taylor, A. G. (2004) The organization of information, Library and information science text, 2nd ed.,
Englewood, Colo.: Libraries Unlimited.
Wang, P., Hu, J., Zeng, H. J. and Chen, Z. (2009) Using Wikipedia knowledge to improve text
classification. Knowledge and Information Systems [online]. 19(3), pp.265-281. Available from:
www.springerlink.com/index/26l87nxu72024625.pdf [Accessed 01/01/2010]
Warren, P. (2006) Knowledge management and the Semantic Web: From scenario to technology.
Ieee Intelligent Systems [online]. 21(1), pp.53-59. Available from:
www.ieeexplore.ieee.org/iel5/9670/33480/01588802.pdf [Accessed 01/01/2010]
90
Appendix I
20 document concept maps
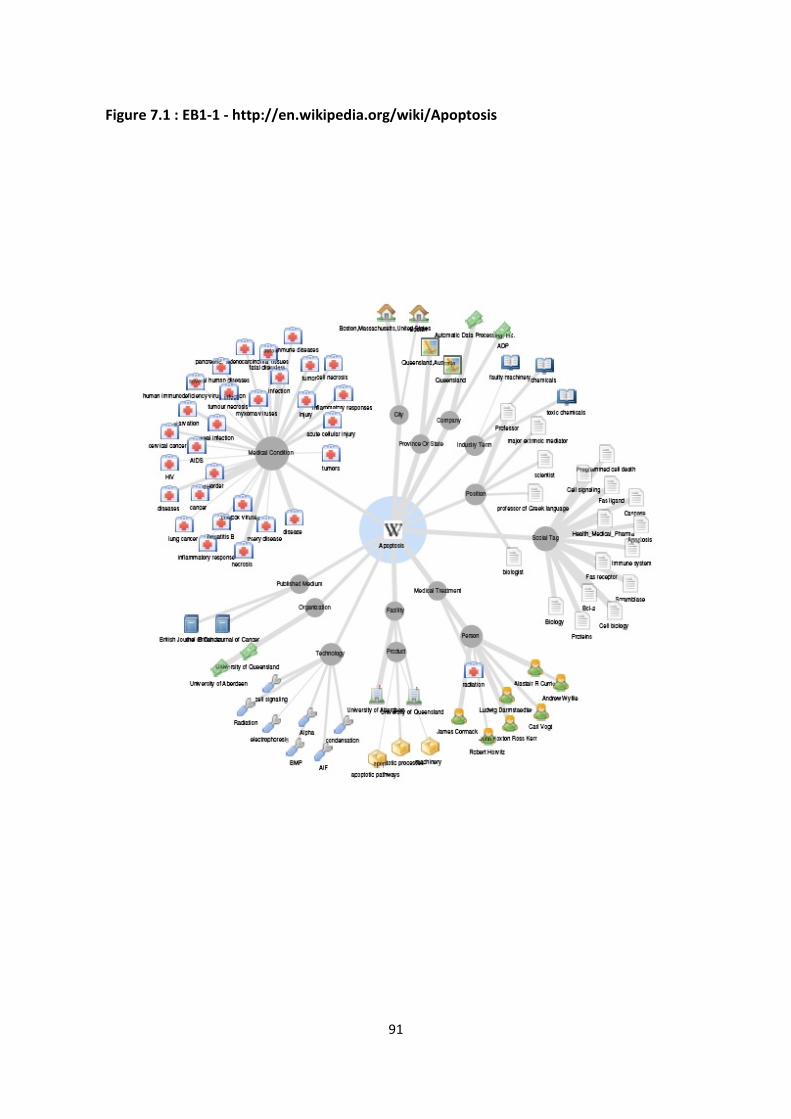
91
Figure 7.1 : EB1-1 - http://en.wikipedia.org/wiki/Apoptosis
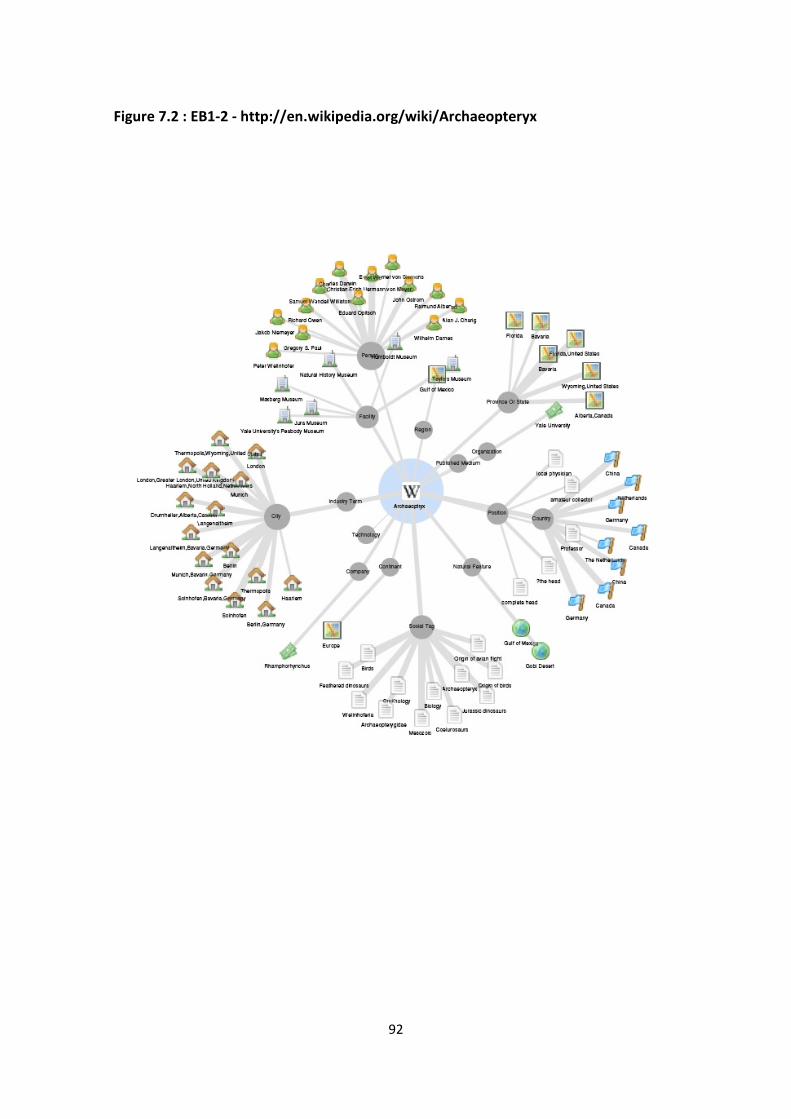
92
Figure 7.2 : EB1-2 - http://en.wikipedia.org/wiki/Archaeopteryx
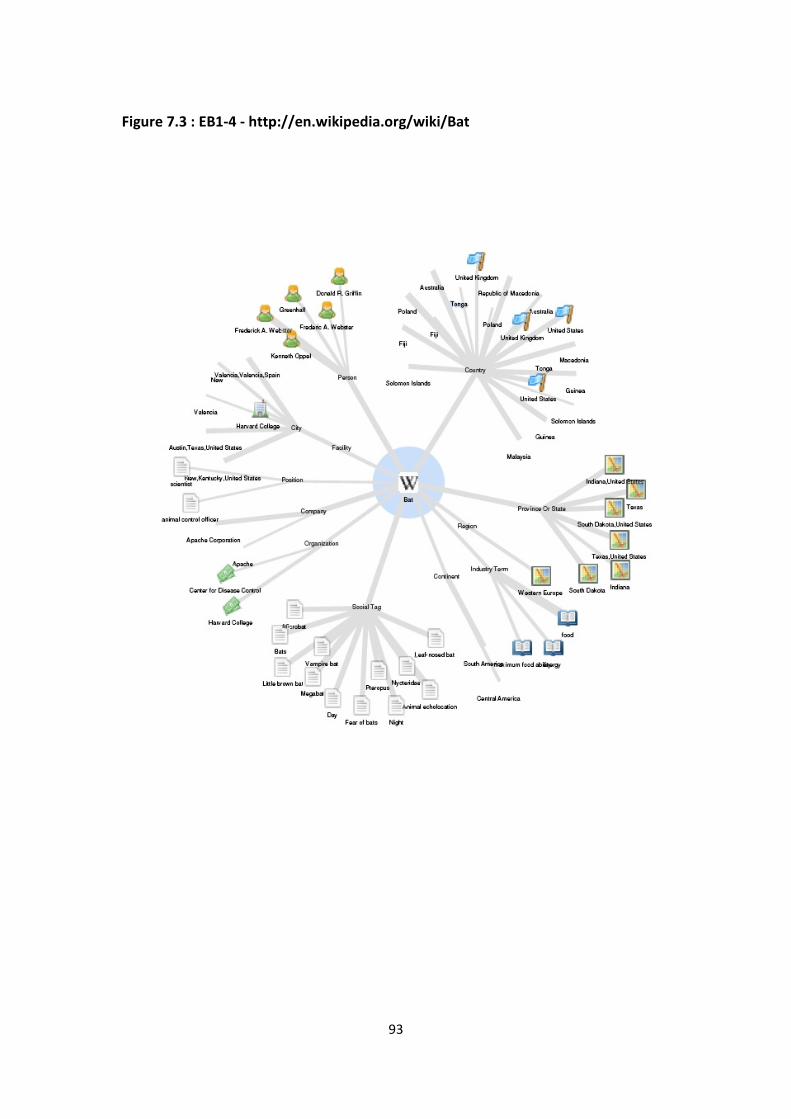
93
Figure 7.3 : EB1-4 - http://en.wikipedia.org/wiki/Bat
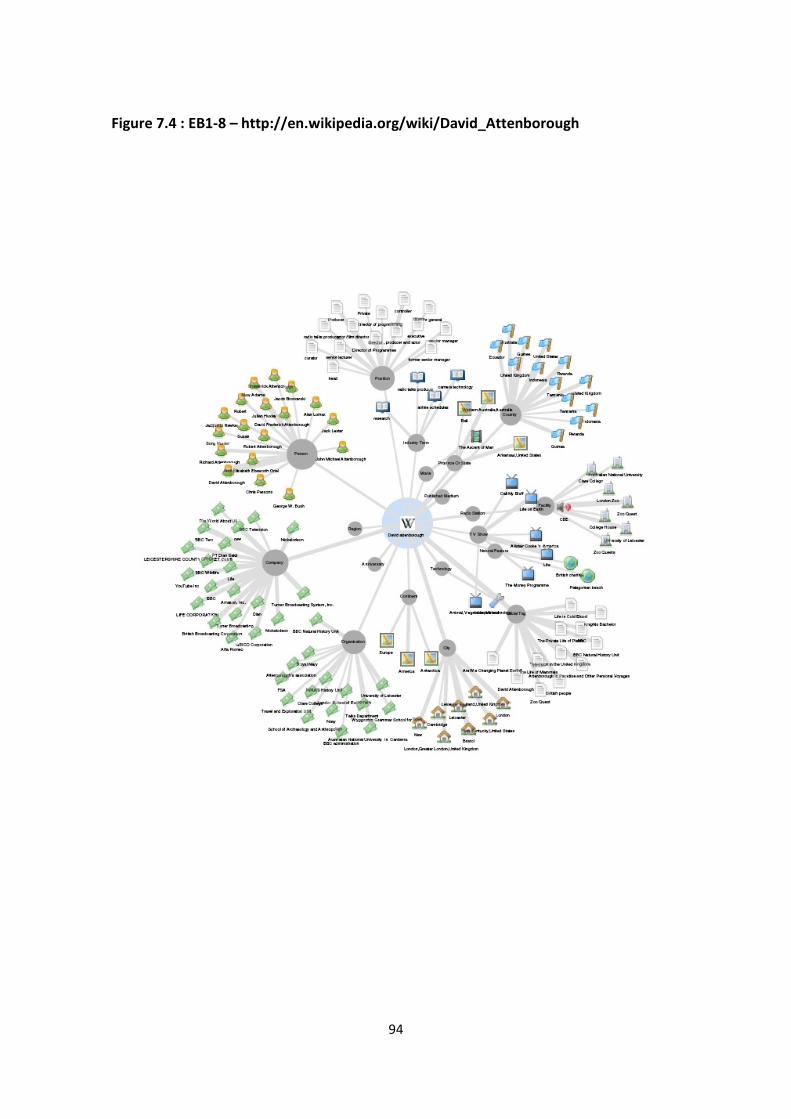
94
Figure 7.4 : EB1-8 – http://en.wikipedia.org/wiki/David_Attenborough
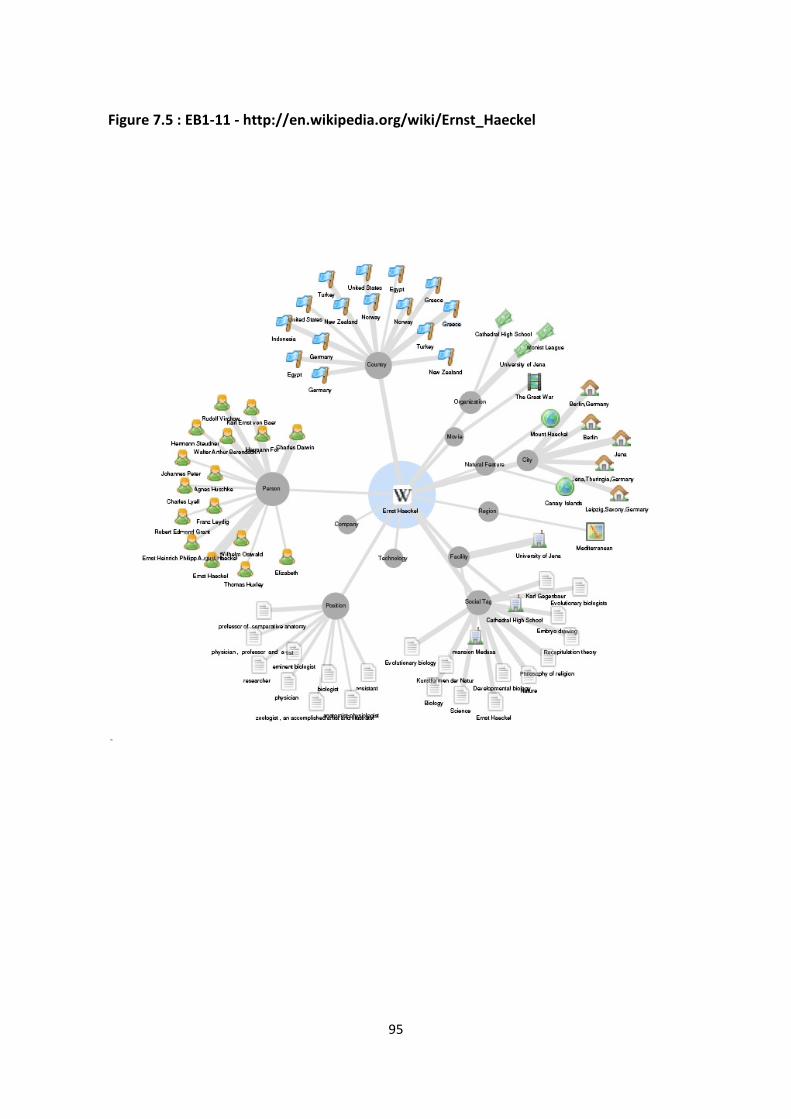
95
Figure 7.5 : EB1-11 - http://en.wikipedia.org/wiki/Ernst_Haeckel
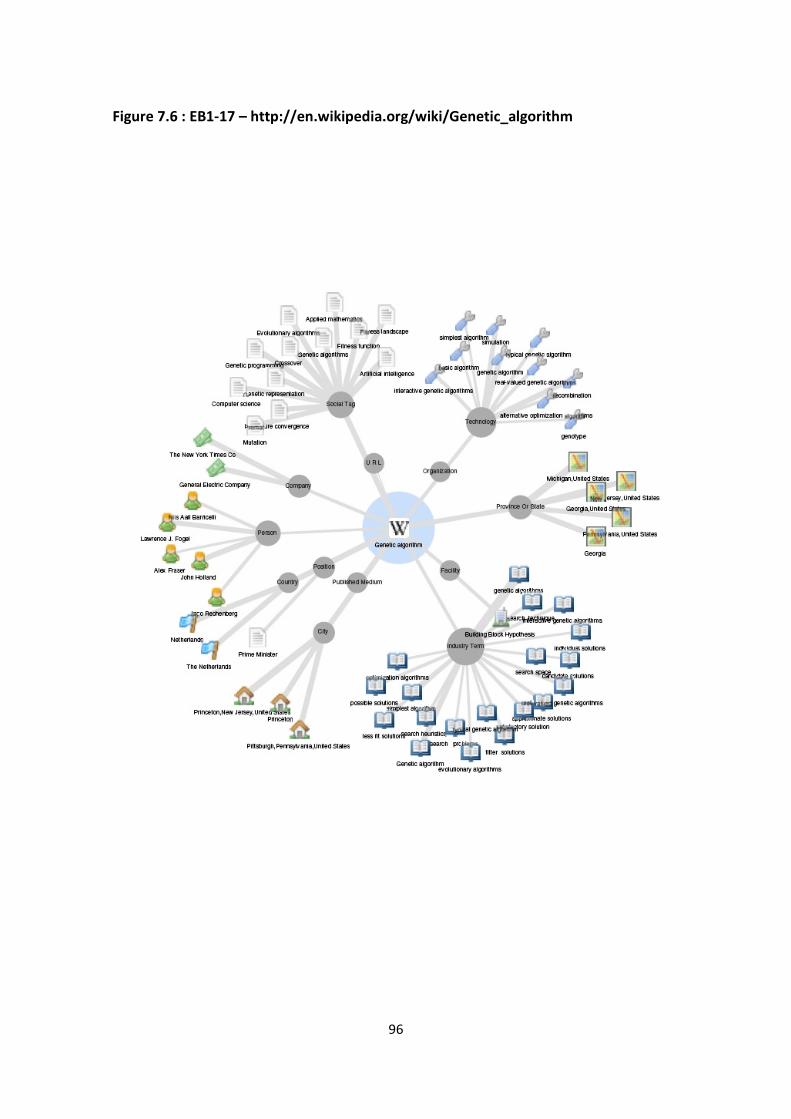
96
Figure 7.6 : EB1-17 – http://en.wikipedia.org/wiki/Genetic_algorithm
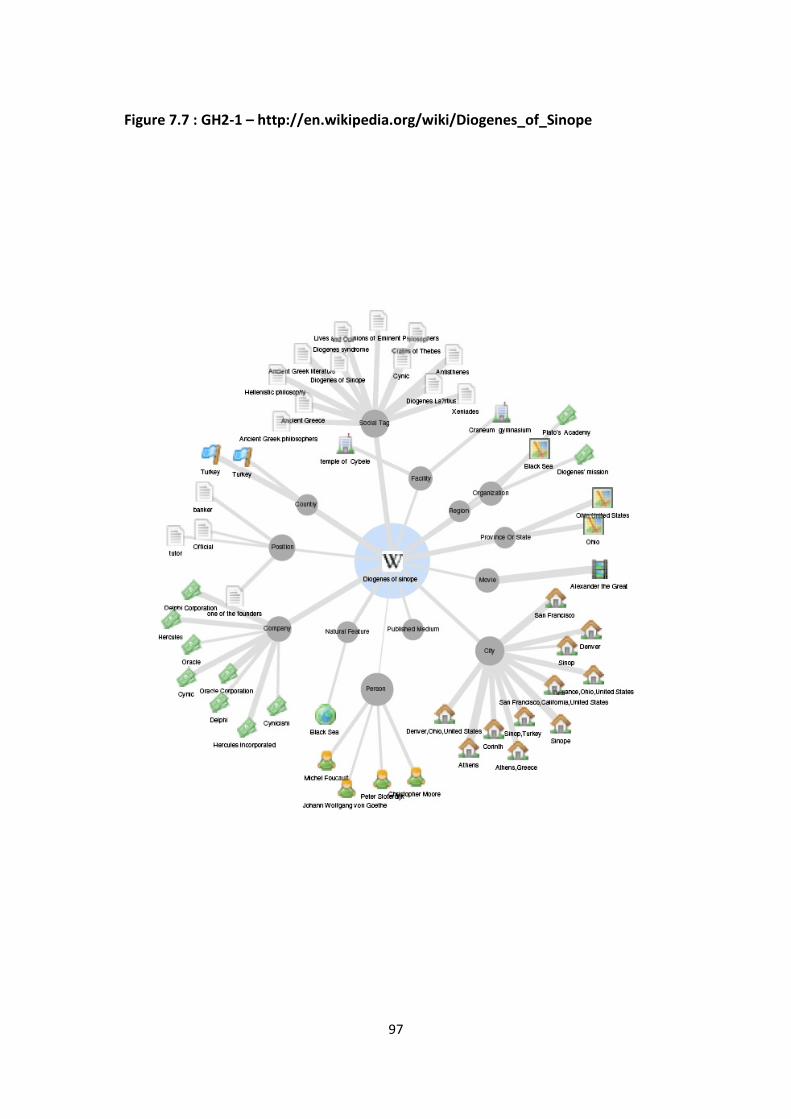
97
Figure 7.7 : GH2-1 – http://en.wikipedia.org/wiki/Diogenes_of_Sinope
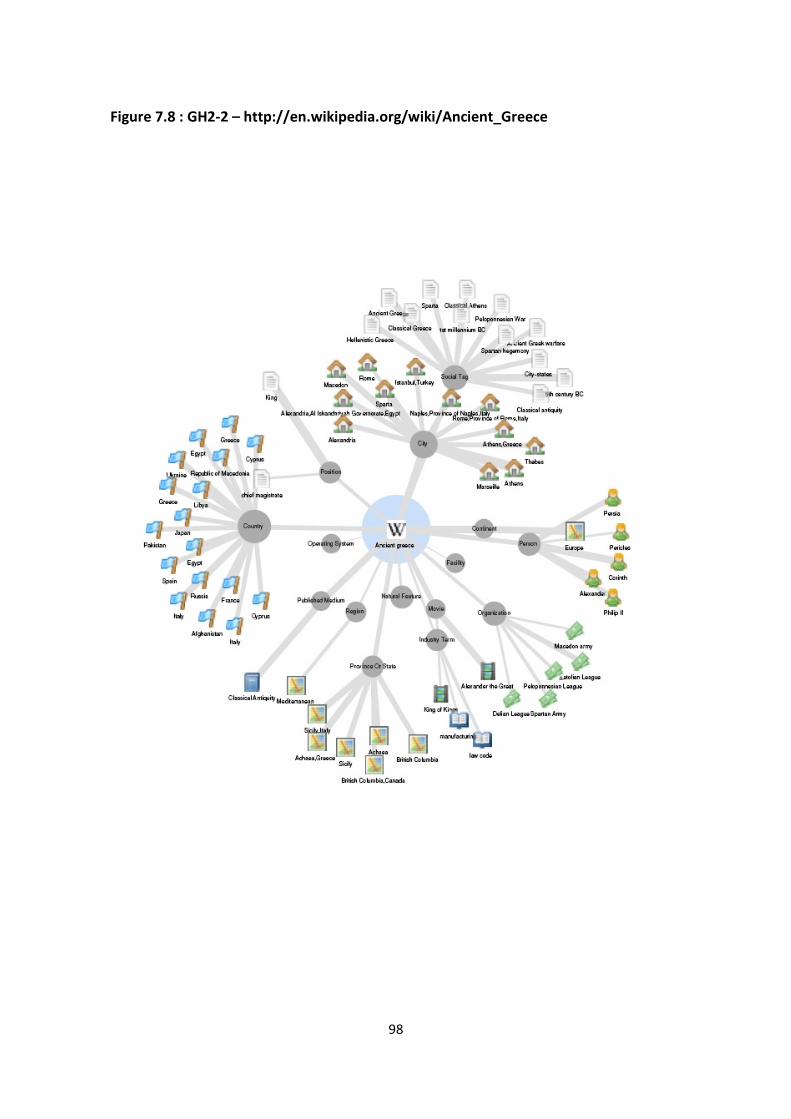
98
Figure 7.8 : GH2-2 – http://en.wikipedia.org/wiki/Ancient_Greece
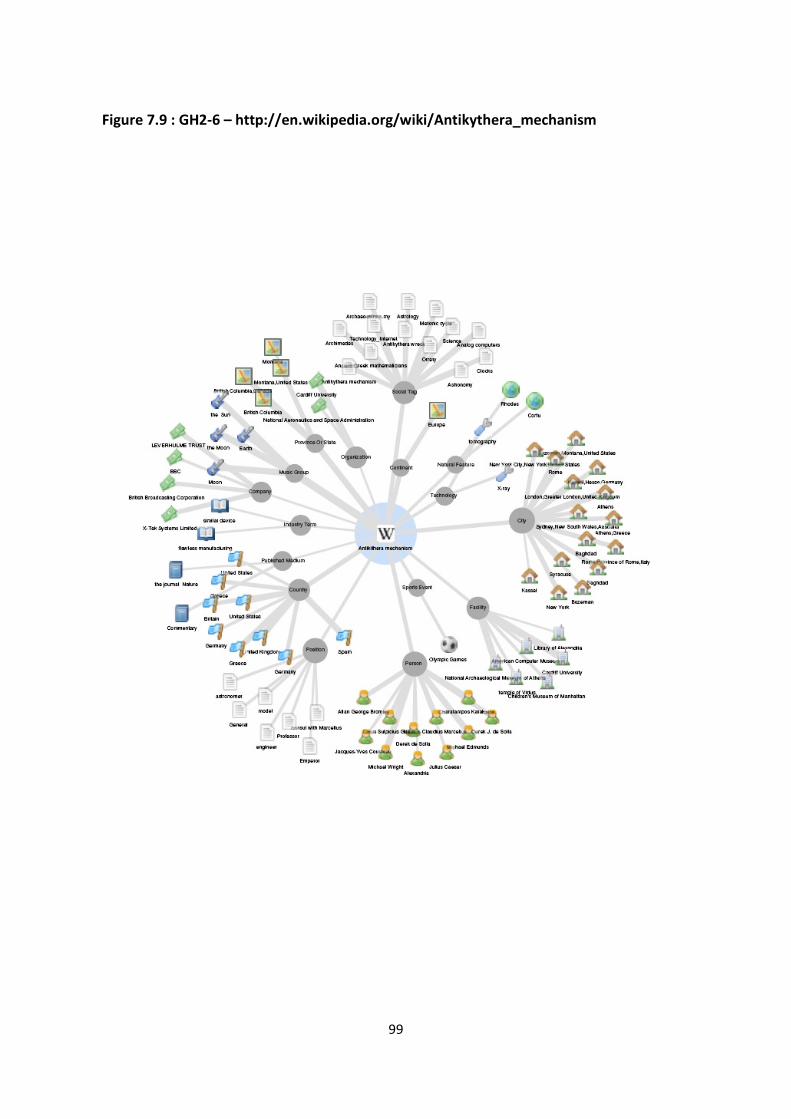
99
Figure 7.9 : GH2-6 – http://en.wikipedia.org/wiki/Antikythera_mechanism
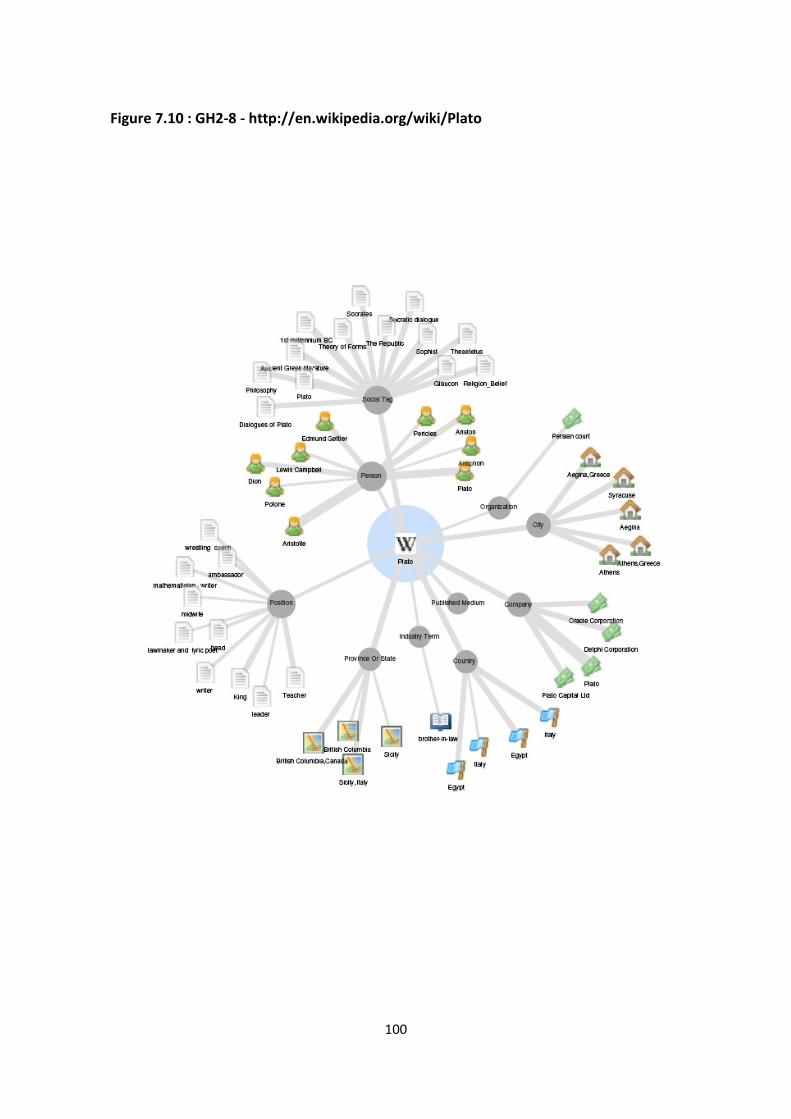
100
Figure 7.10 : GH2-8 - http://en.wikipedia.org/wiki/Plato
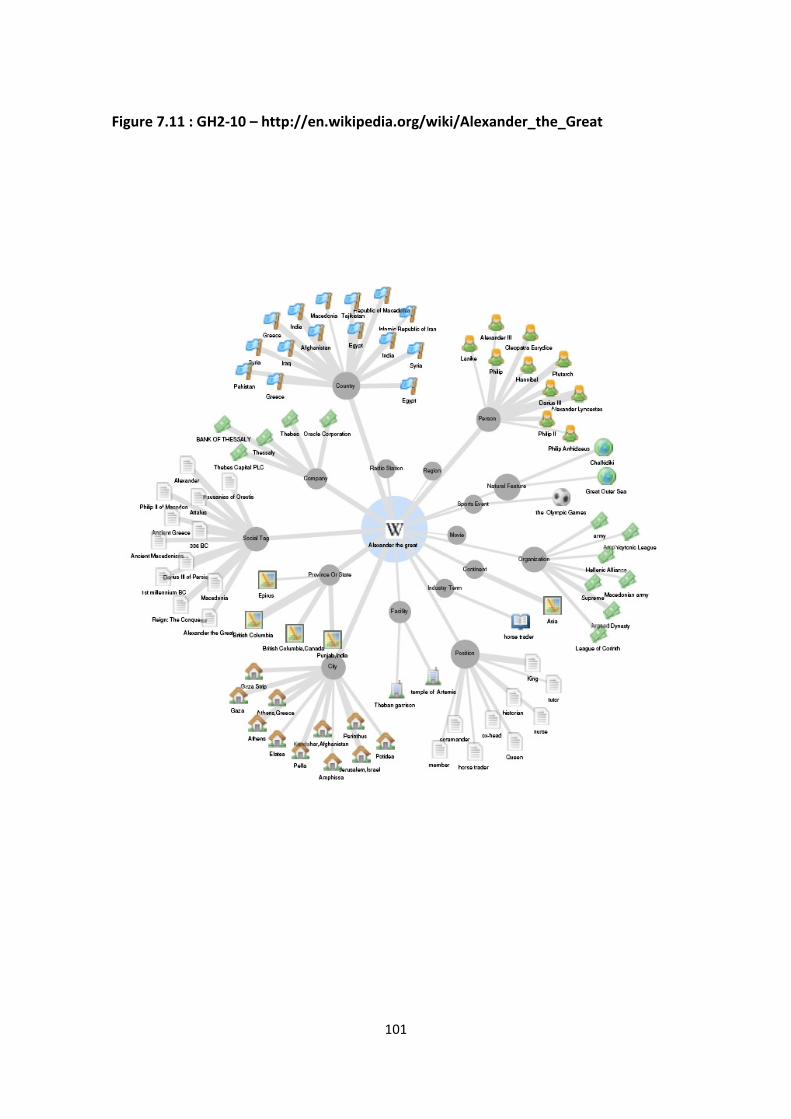
101
Figure 7.11 : GH2-10 – http://en.wikipedia.org/wiki/Alexander_the_Great
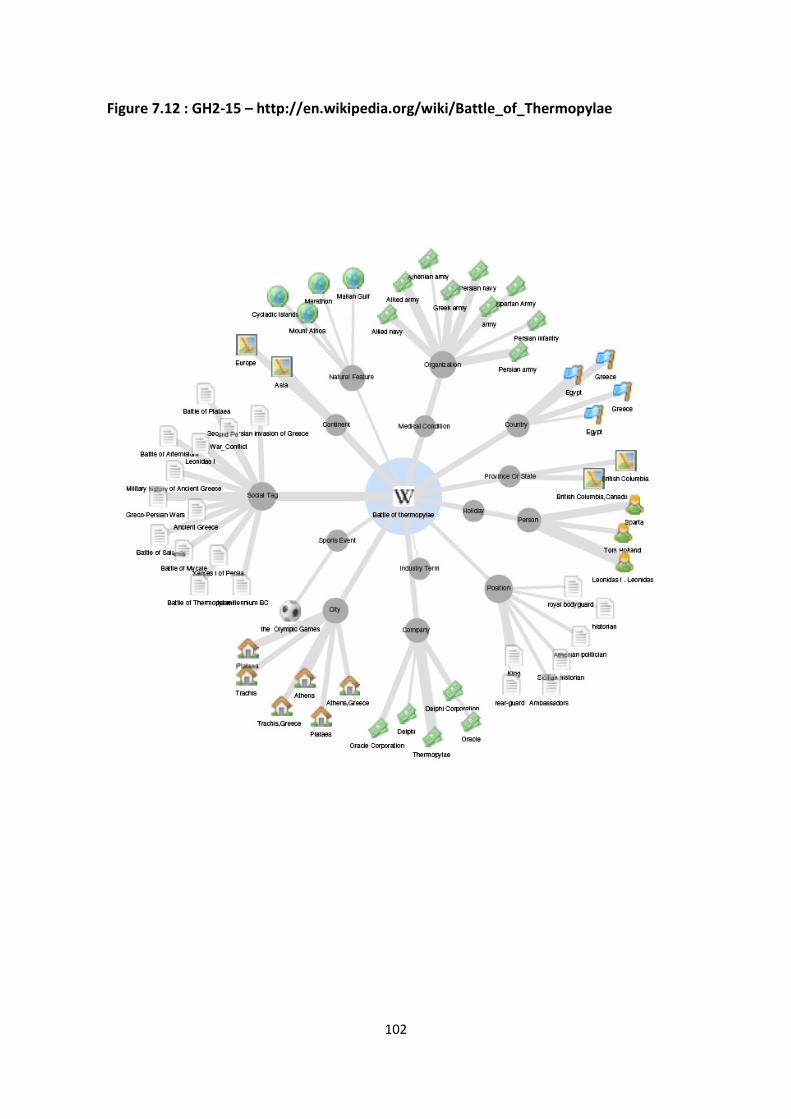
102
Figure 7.12 : GH2-15 – http://en.wikipedia.org/wiki/Battle_of_Thermopylae
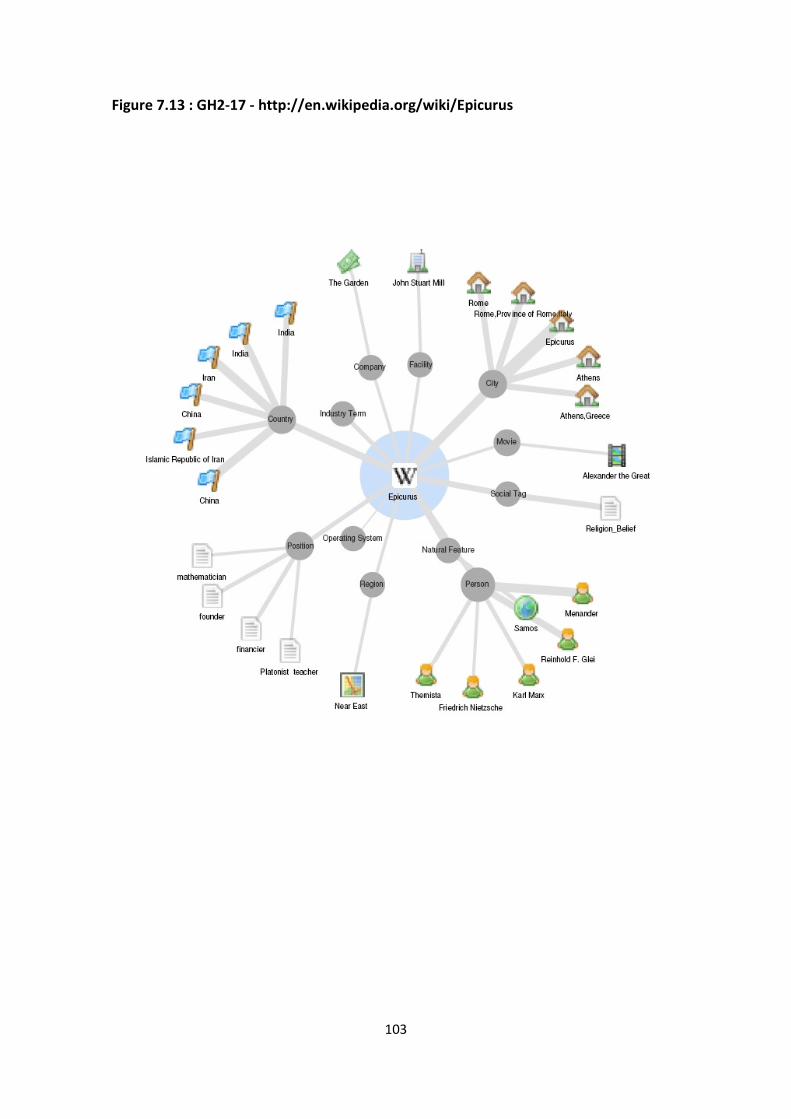
103
Figure 7.13 : GH2-17 - http://en.wikipedia.org/wiki/Epicurus
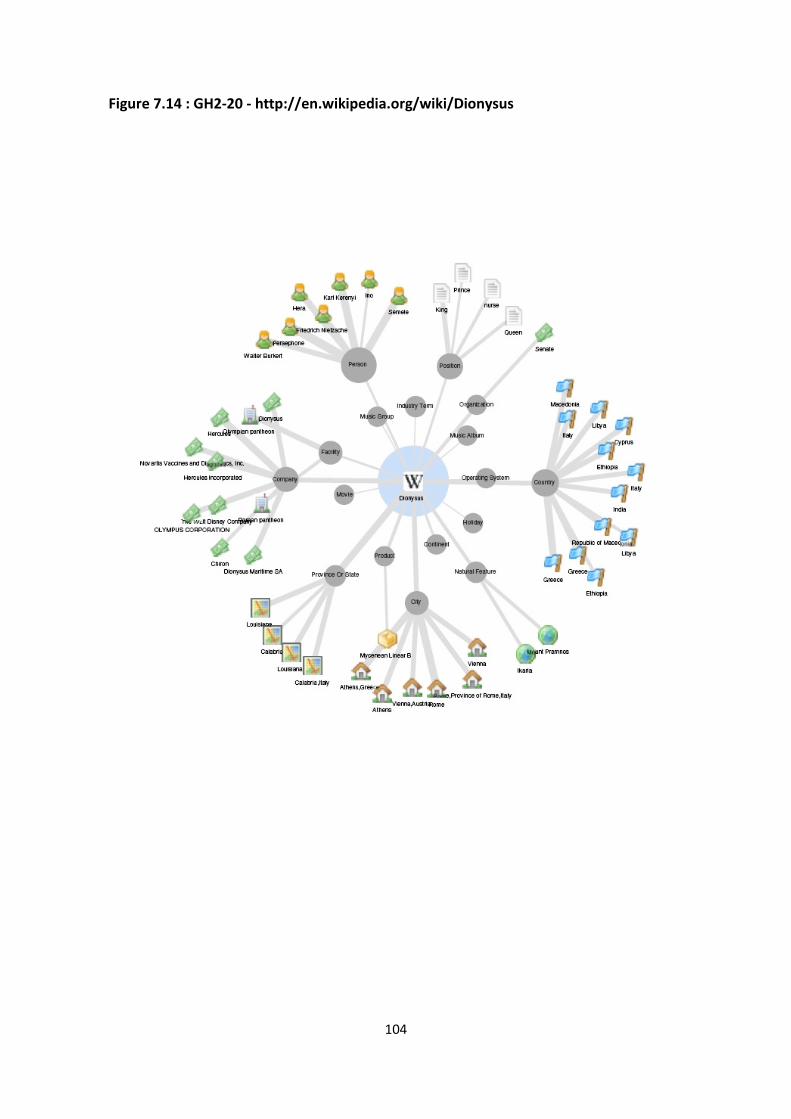
104
Figure 7.14 : GH2-20 - http://en.wikipedia.org/wiki/Dionysus
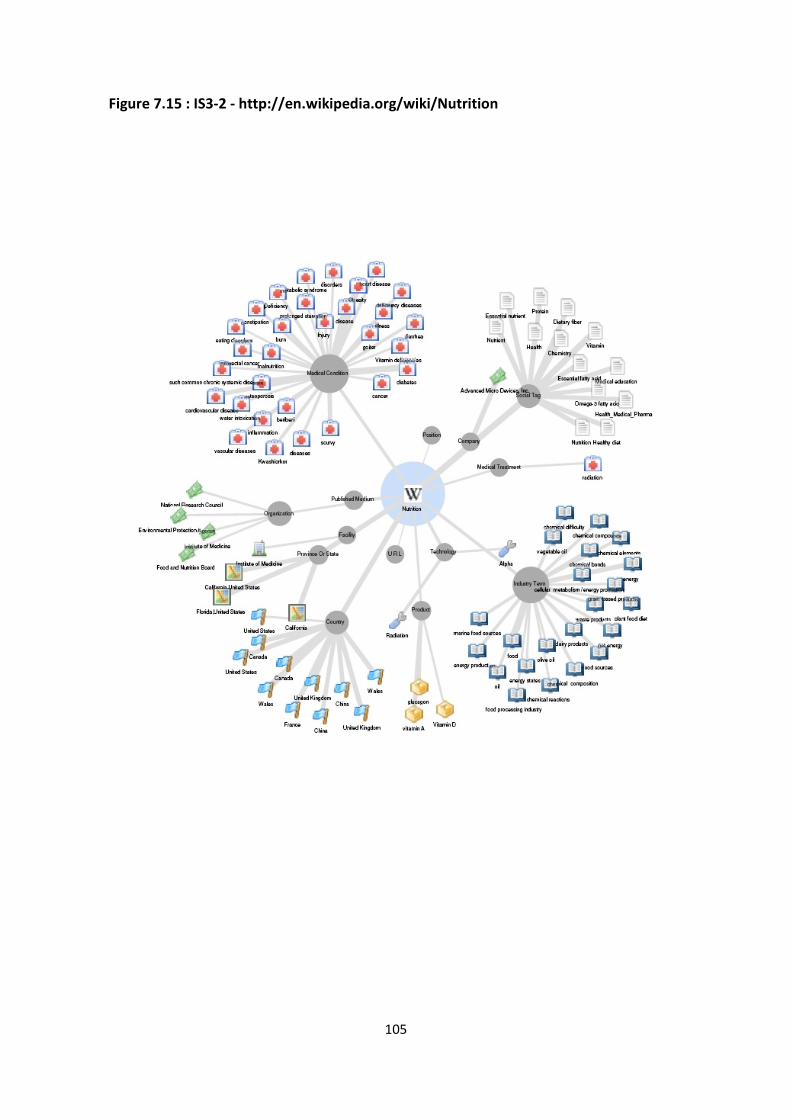
105
Figure 7.15 : IS3-2 - http://en.wikipedia.org/wiki/Nutrition
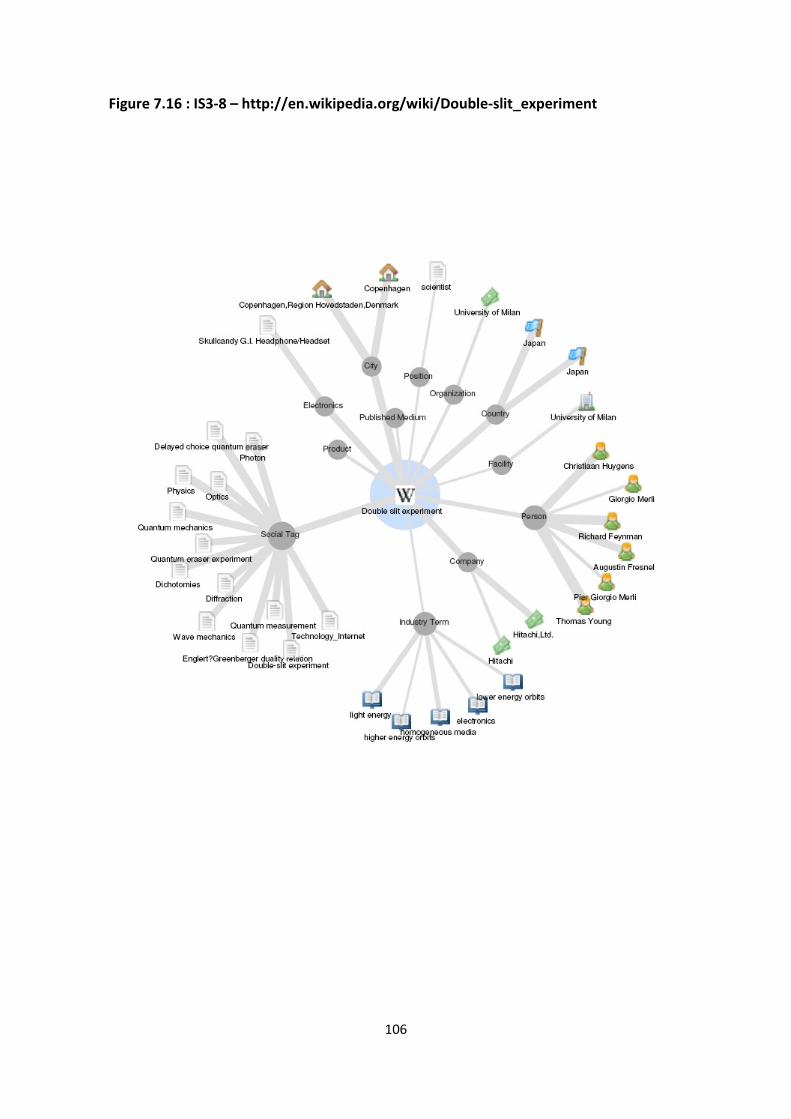
106
Figure 7.16 : IS3-8 – http://en.wikipedia.org/wiki/Double-slit_experiment
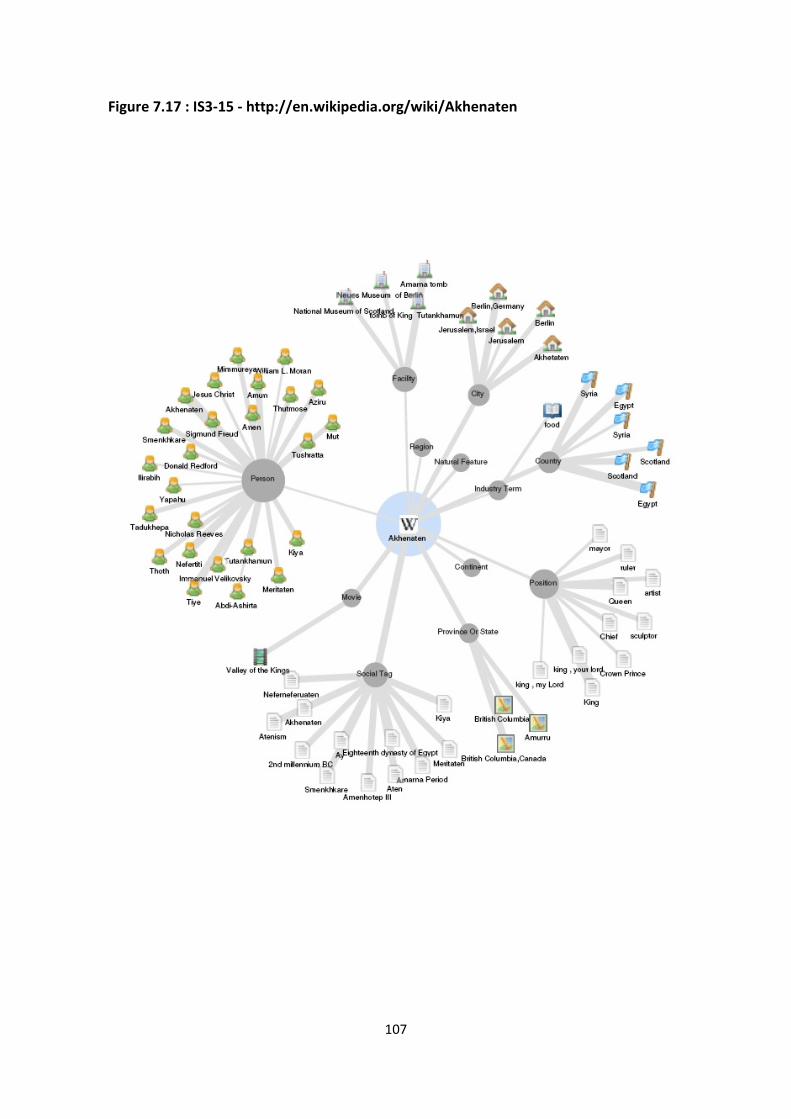
107
Figure 7.17 : IS3-15 - http://en.wikipedia.org/wiki/Akhenaten
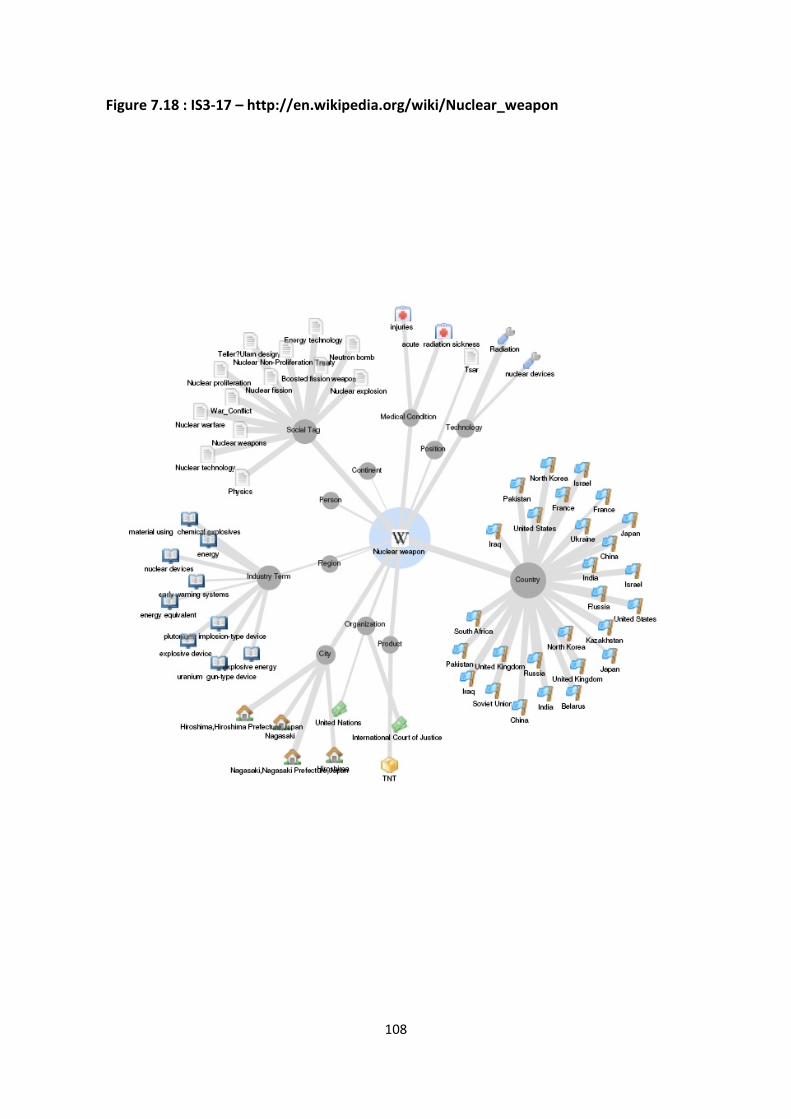
108
Figure 7.18 : IS3-17 – http://en.wikipedia.org/wiki/Nuclear_weapon
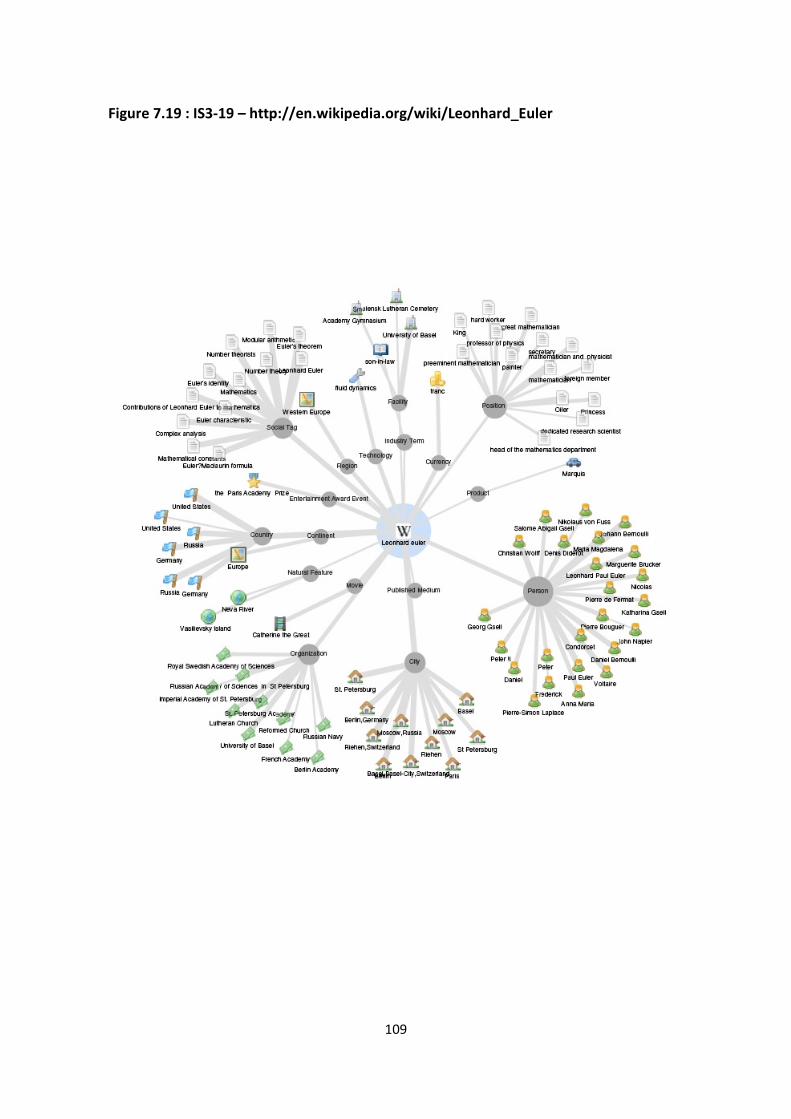
109
Figure 7.19 : IS3-19 – http://en.wikipedia.org/wiki/Leonhard_Euler
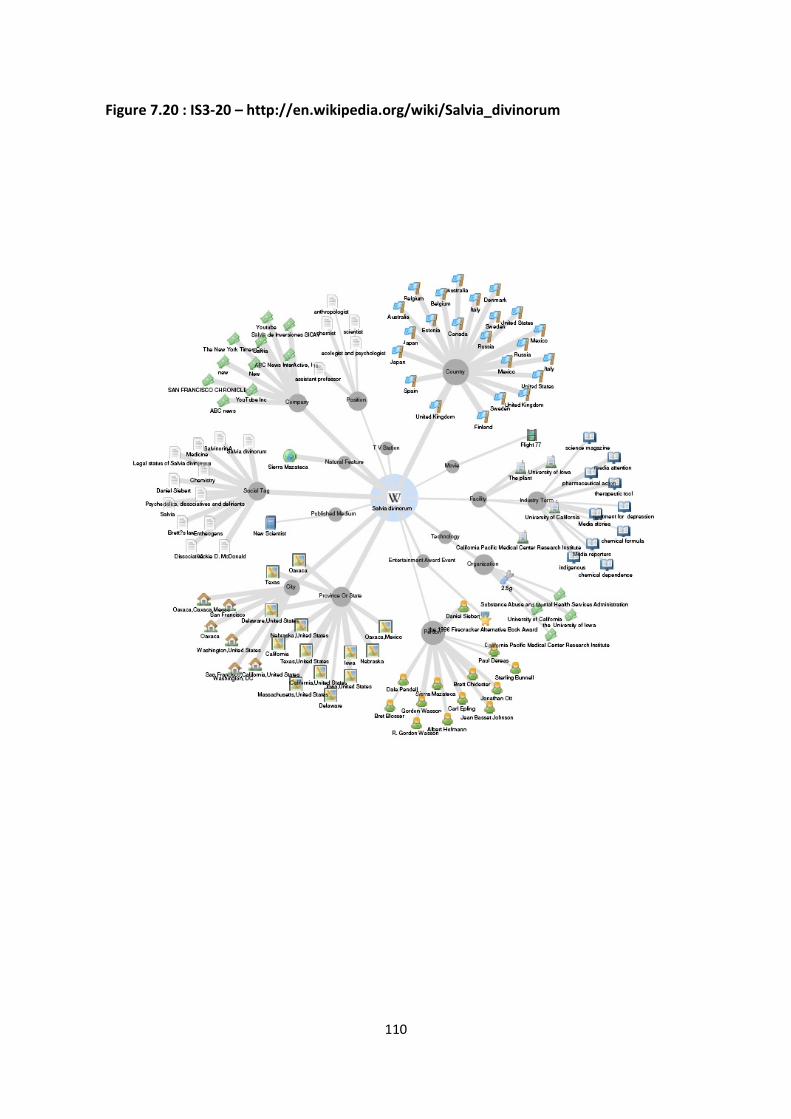
110
Figure 7.20 : IS3-20 – http://en.wikipedia.org/wiki/Salvia_divinorum

111
Appendix II
Software research tools
112
All software and tools used in the research are available to use free of charge (at the time of writing)
from the World Wide Web.
Delicious – Social bookmarking website. All the bookmarks, notes, and tags for any webpage can be
revealed by entering its URL at http://delicious.com/url/
Google Translate is a web based translation service available from http://translate.google.co.uk/#
Ontopia (version 5.0.2) – Java based software tools for building, maintaining, and deploying Topic
Maps-based applications. Available from: http://www.ontopia.net/download/freedownload.html
Protégé – Ontology builder used to expose the main class fields and class relations in the DBpedia
database. Available from: http://protege.stanford.edu/
Semantic Proxy – part of the Thomson Reuters Calais initiative. Currently at Beta testing stage.
Available from: www.semanticproxy.com
Thinkpedia – Thinkpedia is developed by Christian Hirsch, PhD student at the University of Auckland,
under the supervision of John Hosking and John Grundy. Requires Java. Available from:
www.thinkpedia.cs.auckland.ac.nz
Thinkmap - is available from: http://www.thinkmap.com/ - requires Java. Trial version allows three
tries before purchase. Standard Edition download with a limited term license for research and
development purposes only is available through application only.
Wikipedia – a “web-based, collaborative, multilingual encyclopaedia project.” English language
version available from: http://en.wikipedia.org/wiki/Main_Page
Wordle - tool for generating “word clouds” from text. The clouds give greater prominence to words
that appear more frequently in the source text. Available from: http://www.wordle.net/
Wordnet 3.0 – Wordnet is a large lexical database of English developed under the direction of
George A. Miller. Nouns, verbs, adjectives and adverbs are grouped into sets of cognitive synonyms
(synsets), each expressing a distinct concept. Synsets are interlinked by means of conceptual-
semantic and lexical relations. Version 3.0 is online and available from:
http://wordnetweb.princeton.edu/perl/webwn
Javascript Visual Wordnet – a visual realisation of the Wordnet lexical database, particularly clear at
showing disambiguation of terms. Less powerful than Thinkmap but available free of charge under
Creative Commons license. Available from: http://kylescholz.com/projects/wordnet/

113
Polaris Word Count – calculates keyword frequency and overall web page word count from a URL.
Available to download from: http://www.polariscomputing.com/plcount.htm
Semantic Similarity - created by Ted Pedersen and Jason Michelizzi. Eleven semantic measures
available on the Wordnet dictionary. Available from: http://marimba.d.umn.edu/cgi-
bin/similarity/similarity.cgi

114
Appendix III
A notational convention for tags and concepts
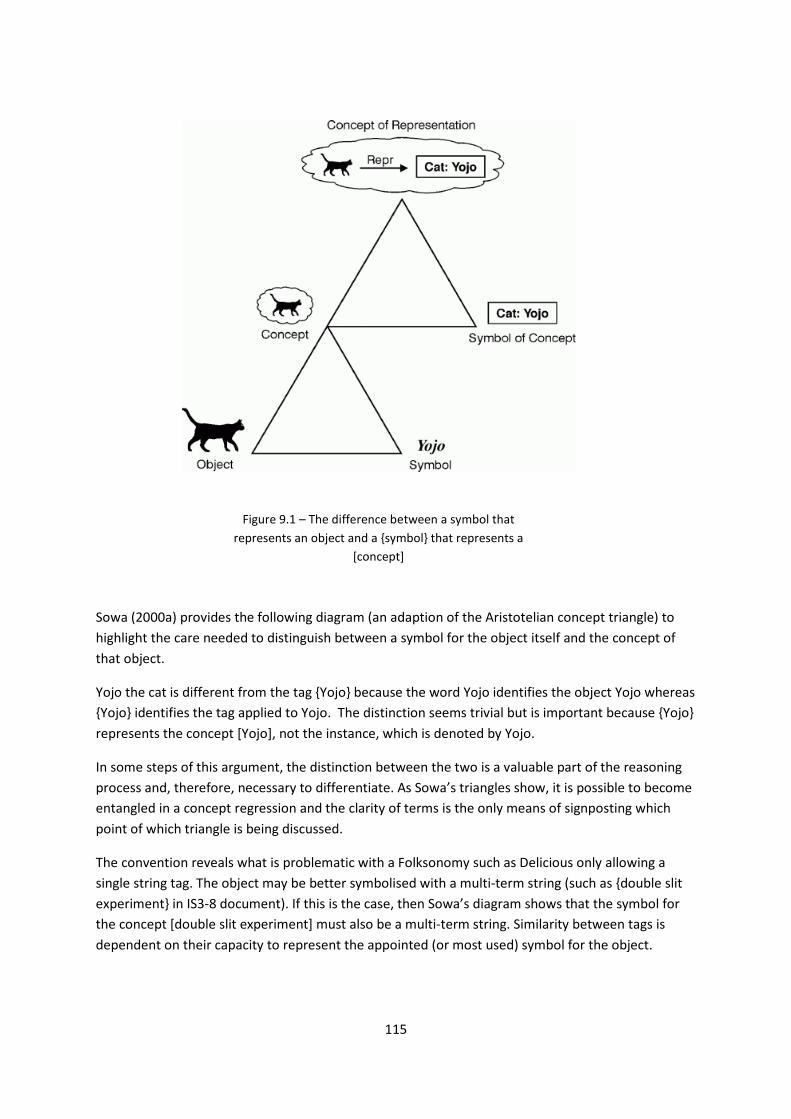
115
Sowa (2000a) provides the following diagram (an adaption of the Aristotelian concept triangle) to
highlight the care needed to distinguish between a symbol for the object itself and the concept of
that object.
Yojo the cat is different from the tag {Yojo} because the word Yojo identifies the object Yojo whereas
{Yojo} identifies the tag applied to Yojo. The distinction seems trivial but is important because {Yojo}
represents the concept [Yojo], not the instance, which is denoted by Yojo.
In some steps of this argument, the distinction between the two is a valuable part of the reasoning
process and, therefore, necessary to differentiate. As Sowa’s triangles show, it is possible to become
entangled in a concept regression and the clarity of terms is the only means of signposting which
point of which triangle is being discussed.
The convention reveals what is problematic with a Folksonomy such as Delicious only allowing a
single string tag. The object may be better symbolised with a multi-term string (such as {double slit
experiment} in IS3-8 document). If this is the case, then Sowa’s diagram shows that the symbol for
the concept [double slit experiment] must also be a multi-term string. Similarity between tags is
dependent on their capacity to represent the appointed (or most used) symbol for the object.
Figure 9.1 – The difference between a symbol that
represents an object and a {symbol} that represents a
[concept]

116