Woody vegetation increase in Alpine areas: a proposal for a classification and validation scheme
25
This article was downloaded by:[Maggi, M.] On: 8 February 2007 Access Details: [subscription number 770411390] Publisher: Taylor & Francis Informa Ltd Registered in England and Wales Registered Number: 1072954 Registered office: Mortimer House, 37-41 Mortimer Street, London W1T 3JH, UK International Journal of Remote Sensing Publication details, including instructions for authors and subscription information: http://www.informaworld.com/smpp/title~content=t713722504 Woody vegetation increase in Alpine areas: a proposal for a classification and validation scheme To link to this article: DOI: 10.1080/01431160600851785 URL: http://dx.doi.org/10.1080/01431160600851785 Full terms and conditions of use: http://www.informaworld.com/terms-and-conditions-of-access.pdf This article maybe used for research, teaching and private study purposes. Any substantial or systematic reproduction, re-distribution, re-selling, loan or sub-licensing, systematic supply or distribution in any form to anyone is expressly forbidden. The publisher does not give any warranty express or implied or make any representation that the contents will be complete or accurate or up to date. The accuracy of any instructions, formulae and drug doses should be independently verified with primary sources. The publisher shall not be liable for any loss, actions, claims, proceedings, demand or costs or damages whatsoever or howsoever caused arising directly or indirectly in connection with or arising out of the use of this material. © Taylor and Francis 2007
-
Upload
independent -
Category
Documents
-
view
1 -
download
0
Transcript of Woody vegetation increase in Alpine areas: a proposal for a classification and validation scheme

This article was downloaded by:[Maggi, M.]On: 8 February 2007Access Details: [subscription number 770411390]Publisher: Taylor & FrancisInforma Ltd Registered in England and Wales Registered Number: 1072954Registered office: Mortimer House, 37-41 Mortimer Street, London W1T 3JH, UK
International Journal of RemoteSensingPublication details, including instructions for authors and subscription information:http://www.informaworld.com/smpp/title~content=t713722504
Woody vegetation increase in Alpine areas: a proposalfor a classification and validation scheme
To link to this article: DOI: 10.1080/01431160600851785URL: http://dx.doi.org/10.1080/01431160600851785
Full terms and conditions of use: http://www.informaworld.com/terms-and-conditions-of-access.pdfThis article maybe used for research, teaching and private study purposes. Any substantial or systematic reproduction,re-distribution, re-selling, loan or sub-licensing, systematic supply or distribution in any form to anyone is expresslyforbidden.The publisher does not give any warranty express or implied or make any representation that the contents will becomplete or accurate or up to date. The accuracy of any instructions, formulae and drug doses should beindependently verified with primary sources. The publisher shall not be liable for any loss, actions, claims, proceedings,demand or costs or damages whatsoever or howsoever caused arising directly or indirectly in connection with orarising out of the use of this material.© Taylor and Francis 2007
Dow
nloaded By: [Maggi, M
.] At: 20:55 8 February 2007
Woody vegetation increase in Alpine areas: a proposal for aclassification and validation scheme
M. MAGGI*, C. ESTREGUIL and P. SOILLE
European Commission – Joint Research Centre, Institute for Environment and
Sustainability, Via Fermi 1, 21020 Ispra (VA), Italy
(Received 22 November 2004; in final form 24 June 2005 )
This paper presents a change detection analysis based on a region growing
segmentation approach which combines both spectral and spatial information.
The test site is a French Alpine protected area, which like many other mountain
areas is characterised by a general increase of forest and woody vegetation due to
the abandonment of traditional land use practices. Two Landsat images of the
years 1984 and 2000 were used and a classification scheme nomenclature based
on four vegetation change classes, implying a gradual modification of land cover,
was adopted. The accuracy of the change map was assessed both during two
visits on the field and using a bi-temporal aerial photographic coverage. A
sampling scheme specifically conceived for change detection products was
adopted. Error matrices and accuracy indices to assess commission and omission
errors of the change maps were generated.
The proposed change detection methodology circumvents limitations which
are intrinsic to traditional classification procedures based only on spectral
information. On the basis of the accuracy assessment, overall accuracy was 90.1%
and the increase of woody vegetation turned out to be the vegetation change class
better estimated, with user and producer accuracies of, respectively, 62.3% and
70%. However, confusion between the no change and the other vegetation change
classes was noticed, due to standard problems encountered in change studies.
Advantages and drawbacks of the use of multitemporal aerial photographs as the
validation data set are also discussed.
1. Introduction
The abandonment of traditional land use practices has become an important force
driving landscape changes in many mountainous areas since the middle of the 19th
century. Indeed, more and more steep slopes and unfavourably situated areas have
been abandoned. A reduction in rural population has lead to a decline of both
agricultural activities and grazing animals. When fields, meadows, or pastures are
abandoned, the natural vegetation takes over and woody vegetation begins to
appear, causing a progressive increase of forest cover. Such a change in land use
leads to significant alterations in diversity, appearance and functioning of the
landscape. This issue is of great concern to local planning agencies and protected
area managers for potential consequences on tourism (Hunziker and Kienast 1999,
Hochtl et al. 2005), loss of biodiversity (Burel and Baudry 1995, MacDonald et al.
*Corresponding author. Present address: Via Stradella 13, 20129 Milano, Italy.Email: [email protected]
International Journal of Remote Sensing
Vol. 28, No. 1, 10 January 2007, 143–166
International Journal of Remote SensingISSN 0143-1161 print/ISSN 1366-5901 online # 2007 Taylor & Francis
http://www.tandf.co.uk/journalsDOI: 10.1080/01431160600851785
Dow
nloaded By: [Maggi, M
.] At: 20:55 8 February 2007
2000), cultural landscapes (Meyer and Turner 1994), and traditional land use
practices (Tappeiner et al. 1998). In addition, recent studies demonstrate the
responsibility of forest regrowth for the ‘missing sink’ in the global carbon budget
(Foody et al. 1996, Houghton et al. 1999, Caspersen et al. 2000).
In the context of nature protection, the estimation of land cover changes and
particularly the increase of woody vegetation occurring within a protected area
contribute to the creation of a simple but effective indicator of its conservation
status (Cernusca et al. 1999). Furthermore, the spatial estimate of land cover change
serves as a benchmark state of the environment against which benefits of local,
national, and international policies can be assessed.
This study aims to provide managers of protected areas with a methodology to
estimate land cover changes, and in particular woody vegetation increases, from
Landsat imagery. The test site which has been chosen for this study is the National
Park of Mercantour in the French Alps. This area, as many other Alpine areas, is
experiencing a general increase of the surface occupied by forests and woody
vegetation due to a decline of both agricultural activities and grazing animals.
Remote sensing is the only option to monitor such a large area in a timely and cost
efficient manner (Song et al. 2002), and to understand the general trends which are
active within the region.
To assess land cover changes affecting the National Park of Mercantour, two
Landsat images were used, acquired respectively on 23 July 1984 and 27 July 2000.
The change detection approach which was developed combines spectral and spatial
information. In a previous work (Maggi et al. 2004), this approach proved to work
better than a maximum likelihood pixel-based classifier that had a tendency to
overestimate changes. However, the results while promising were not quantitatively
validated; this study thus serves to fully test the new method and further proposes a
validation scheme. An initial spectral analysis allows us to define a set of pixels
(seeds) whose change class is known with a high confidence level. The procedure
then iteratively looks for neighbouring pixels in the spatial domain having similar
spectral signatures on the basis of a seeded region growing approach. Such a
combined methodology, originally conceived for one-band images (Adams and
Bischof 1994), is applied here for the first time to multispectral and multitemporal
data in the context of natural resources assessment.
To reinforce the link to protected areas and forest management on the ground,
this study paid attention to two other issues: the first related to the use of an
appropriate classification nomenclature for vegetation dynamics and management
purposes; the second dealing with the accuracy assessment of the map produced and
its reliability for the final users.
Although the focus of the study is on the increase of woody vegetation, the
nomenclature scheme we adopted is based on four vegetation change classes:
‘Increase of woody vegetation’, ‘Increase of herbaceous biomass’, ‘From vegetation
to mineral ground’, and ‘Decrease of woody vegetation’. The change classes
proposed are coherent with the short time period (1984–2000) of this study, which
does not allow the detection of abrupt changes in forest cover in a region where
afforestation programmes or large cuttings are not carried out. The types of
vegetation changes also justify our preference of a change detection combined
analysis approach (Singh 1989, Coppin et al. 2004, Lu et al. 2004) over a
conventional post-classification comparison method, since the latter only indicates
complete changes in class membership (Foody and Boyd 1999). Our change classes
144 M. Maggi et al.
Dow
nloaded By: [Maggi, M
.] At: 20:55 8 February 2007
imply gradual modification of land cover (e.g. variations in the amount of the
woody vegetation), as opposed to post-classification change detection methods
which are insensitive to these more gradual or subtle variations in class properties.
To assess the accuracy of our change map, we adopted a sampling scheme
particularly aimed at increasing the sampling effort for change classes, which are
rare. As a test data set, a bi-temporal aerial photographic coverage was used.
Following a visual photo interpretation, error matrices were generated which
provided the starting point for a series of descriptive statistical techniques.
Advantages and drawbacks of the use of multitemporal aerial photographs as
validation data set were finally discussed.
2. Literature review
Applications of remotely sensed data for land cover change detection, and
particularly forest cover over time, have been reported by many investigators.
State-of-the-art of change detection techniques is discussed in depth by Singh (1989),
Mas (1999), Coppin et al. (2004), and Lu et al. (2004). Furthermore readers can refer
to Coppin and Bauer (1996) and Rogan et al. (2002) for reviews specifically
addressing forest change detection.
This section reviews literature on the three main issues which are addressed in this
paper: image analysis methods based on spectral and spatial information,
nomenclature schemes for forest change studies, and validation procedures for
change detection products.
Most digital change detection methods applied to forest ecosystems are based on
per-pixel classifiers and use only spectral information (Luque 2000, Sader et al.
2001, Woodcock et al. 2001, Rogan et al. 2002, Wilson and Sader 2002). The major
drawback of these approaches is the fact that a pixel is classified depending only on
its spectral response, without considering the signal of its neighbouring pixels. The
result is often noisy (Woodcock et al. 2001, Wilson and Sader 2002, Maggi et al.
2004) and lacks spatial consistency (Soille 1996). To circumvent these limitations
spatial information should also be considered. Methodologies which emphasise the
use of spatial information belong to the category of segmentation techniques
(Haralick and Shapiro 1985, Woodcock and Harvard 1992, Pal and Pal 1993, Soille
1996, Pekkarinen 2002). Segmentation can be either edge-based or region-based.
Edge-based image segmentation methods use gradient operators which enhance
boundaries between homogeneous groups of pixels. Region-based segmentation
methods proceed the opposite way: first they locate homogeneous regions on the
image; then they recursively grow these regions using some spatial and spectral
criteria until all pixels of the image are assigned to a region. In this case, boundaries
are created when regions meet. Region-based segmentation techniques include
region growing, region merging, and region splitting approaches. The use of
segmentation techniques for change detection, and in particular for forest change
detection, is still limited. Even more limited is the progress in such approaches for
analysing multispectral remote sensing data (Kartikeyan et al. 1998). This paper
aims at making progress in such a field of research.
Regarding nomenclature, studies focusing on the detection of forest changes
usually adopt coarse change classes such as forest change/forest no-change (Sader
et al. 2001, Woodcock et al. 2001) or cuttings/partial cuttings/no-change (Wilson
and Sader 2002). Rogan et al. (2002) examine five vegetation change classes (no-
change/vegetation increase/vegetation decrease/change in non-vegetated regions/
Woody vegetation increase 145
Dow
nloaded By: [Maggi, M
.] At: 20:55 8 February 2007
recharge of reservoirs). Lowell (2001) detects decreases and increases of woody
vegetation. Coppin and Bauer (1994) propose a change detection methodology built
on four basic change categories (canopy depletion, recent storm damage, canopy
increment, and no-change) that meet predefined operational and scientific criteria.
Another perspective to study forest changes with remote sensing data is classifying
successional vegetation stages: this involves detecting more subtle vegetation
differences than does the mapping of abrupt forest changes. Either a multitemporal
(Hall et al. 1991a, Foody et al. 1996, Helmer et al. 2000, Song et al. 2002) or a
monotemporal (Fiorella and Ripple 1993) approach is adopted in this case.
Concerning the accuracy of change maps, a variety of factors influence the
accuracy of land cover change products, namely the classification scheme employed,
the classification and rectification errors, the remote sensor system characteristics,
the environmental conditions, and the change detection algorithm (Biging et al.
1999, Khorram et al. 1999). The error assessment process itself can be a source of
error and confusion (Congalton and Green 1993). It follows that the estimation of
accuracy of a change product is a difficult and challenging task (Congalton and
Green 1999, Foody 2002). Difficulties also arise from the impossibility of field
verification for past time periods or from the limited availability of reliable historical
data set.
Most of the change detection studies adopt the error matrix-based accuracy
assessment method developed for single-date remotely sensed data. These studies
use the error matrix to evaluate the accuracy of either the single classifications
(Luque 2000, Mertens and Lambin 2000) or the final land cover change map
(Coppin and Bauer 1994, Foody et al. 1996, Sader et al. 2001, Woodcock et al. 2001,
Rogan et al. 2002, Wilson and Sader 2002). Morisette and Khorram (2000) propose
using accuracy assessment curves to analyse the reliability of change detection
results. Lowell (2001) developed an area-based accuracy assessment method for
change map analysis. Liu and Zhou (2004) propose a rule-based method to separate
cases of real land use change and possible classification error, to be used when ideal
ground data are not available. Khorram et al. (1999), in a monograph specifically
devoted to accuracy assessment of change detection products, state that sampling
techniques designed for single coverages (Congalton 1991, Janssen and van der Wel
1994, Stehman and Czaplewski 1998, Stehman 1999) do not provide an adequate
framework for determining also the accuracy of a change detection product. The
main reason he advances for the differences in sampling strategy between a one-
point-in-time (OPIT) and a change thematic map is that, in the latter, change
categories usually represent a small portion of the original map and differently from
a OPIT map, a change map often has many classes with low or rare frequencies of
occurrence. The relative scarcity of change pixels in the change map and the
likelihood that they are concentrated in relatively few areas imply that these pixels
can be considered rare events that would only occasionally be detected using
traditional sampling techniques, unless the sampling intensity is high. To circumvent
this limitation, different sampling schemes for the change and no-change classes
should be adopted, in order to increase the sampling effort for rare classes. This was
also addressed in this paper.
3. Study area
The study area entirely corresponds to the French National Park of the Mercantour,
created in 1979 and mostly situated in the departement (district) of Alpes Maritimes
146 M. Maggi et al.
Dow
nloaded By: [Maggi, M
.] At: 20:55 8 February 2007
at the border between Italy and France. Its climate, which is both Mediterranean
and Alpine, together with the geological composition of crystalline and sedimentary
rocks, is responsible for the high diversity of its flora including a high number of
endemic species. Altitudes range from 400 m to 3143 m above sea level (a.s.l.) and
landscapes are extremely contrasted.
The Park is composed of a core area covering 68,500 ha and of a peripheral buffer
zone of 146,500 ha. The former mostly corresponds to a Natura2000 site proposed
in the framework of the European Habitat Directive (Council Directive 92/43/EEC),
while the latter constitutes an area where both conservation and local development
objectives are pursued.
The Park territory is mainly covered by pastures and meadows (44%), followed by
forests (40%), European larch (Larix decidua Mill.) being the most widespread
species (55% of Park forests). Broadleaves cover only a very small part of the
Mercantour’s territory (less than 10%) and dominate the altitudinal range between
600 and 1100 m a.s.l.. Conifers prevail between 1100 and 1700 m a.s.l.: Scots pines
(Pinus sylvestris L.) on southern slopes are the equivalent of fir (Abies alba Mill.)
and spruce (Picea excelsa Link) forests on northern slopes. The latter have often
been replaced by man with larch stands which can be devoted both to wood
production and pastoral activities. Larch is the dominant species at the subalpine
level, between 1700 and 2200 m a.s.l., where it constitutes transitional silvo-pastoral
formations (pre-bois) (Laurent 1988). The preservation of these traditional
landscapes which are mostly located in the central zone and which depend on
human intervention is one of the prime objectives of the Mercantour Park owing to
their high historical, cultural, and aesthetic values (Motta and Dotta 1995).
Forest gives place to grasslands, heaths, and rocks above 2200 m a.s.l. on north-
western sided slopes and above 2500 m a.s.l. on south-eastern exposed sites
(Biancheri and Claudin 2002). However, the position of the timberline does not
correspond anymore to a natural limit but is the result of historical human
interventions.
In the last decades, the surface occupied by forests and in particular larch forest
stands within the National Park of Mercantour and in the Maritime Alps has
increased owing to a decline of agricultural and pastoral activities (Sandoz et al.
1998). When human intervention ceases, larch stands are exposed to natural
dynamics: shrubs invade, new young larches settle, the herbaceous component
progressively diminishes, and other arboreal species such as pines, firs, and spruces
invade and become dominant, making larch formations disappear. A diachronic
analysis demonstrated that the time interval which is necessary in order for the
aforementioned process to be complete is between 50 and 75 years (Sandoz et al.
1998). Few decades, or even 10–15 years, are considered sufficient for the
development of dense woody pioneer formations 4–5 m high (Guidi and Piussi
1993). The process generates important modifications of landscape structure and
functioning (Didier 2001).
In such a context the monitoring of the increase of forest and woody vegetation is
mandatory for park managers to adopt appropriate conservation measures. At the
moment, the National Park of Mercantour is pursuing a policy to both encourage
pastoral activities in the most favourable areas and to develop ungulate populations
which have an important role in the maintenance of the larch silvo-pastoral
formations. Attention is also paid to vulnerable areas where intense pastoral
activities are carried out and erosion processes are active.
Woody vegetation increase 147
Dow
nloaded By: [Maggi, M
.] At: 20:55 8 February 2007
4. Available data
Two Landsat images (scene 195/29), covering the entire study area, were used to
assess land cover changes. The earlier image was acquired by the Thematic Mapper
(TM) sensor on 23 July 1984 and the later image by the Enhanced Thematic Mapper
(ETM) sensor on 27 July 2000. This image was available at the European
Commission-Joint Research Centre within the IMAGE2000 database facility (http://
image2000.jrc.it/). It is an orthorectified product resampled to a Lambert Conic
Conformal projection. The mean square error of the rectification is 12 m and the
pixel size of the rectified image is 25 m.
A multitemporal aerial photography coverage was also available. The set
consisted of 50 colour infrared aerial photographs (APs) having a nominal scale
of 1 : 17,000 acquired in 1984 and located over those areas of the Park where major
changes were detected or more critical areas were observed and a check was
considered necessary. A full coverage of digital orthophotos acquired in 1999 and
2000 having a spatial resolution of 0.5 m was available.
Other geographic information, available for the study area, consisted of a 50 m
cell digital elevation model (DEM) and a forestry map produced by the Inventaire
Forestier National (IFN) in 1996 at a scale of 1 : 100,000. The latter contains
information on both forest categories and management schemes.
5. Methods
5.1 Pre-processing
In order to refer the multitemporal remote sensing data set to a common geometry,
the TM image acquired in 1984 was orthorectified to the same projection and spatial
resolution as the 2000 ETM image. Ground control points (GCPs) were selected on
the already orthorectified Landsat ETM image, which was assumed as the
geographic reference, and we applied a nearest-neighbour resampling algorithm.
The RMS error was lower than 1 pixel, the pixel size being 25 m625 m. However, a
residual mis-registration was noticed in the south-eastern part of the Park probably
due to the presence of cloud coverage on the TM image which prevented from
localising an appropriate number of GCPs in this area.
A second pre-processing step was represented by radiometric normalisation, a
process recommended for change detection studies especially when the objective is to
identify types of land cover changes (Hall et al. 1991b, Coppin and Bauer 1996). In
this context, a radiometric rectification technique was performed to compensate for
sensor calibration, atmospheric, and illumination differences between images (Hall
et al. 1991b). The radiometric rectification algorithm identifies radiometric control
sets, i.e. sets of scene landscape elements with a mean reflectance which is expected to
change little over time. The average digital count of these radiometric control sets or
pseudo-invariant features (PIFs) (Song et al. 2001) are used to calculate linear
transforms, relating digital number values between images. In this work, the 1984 TM
image was used as reference image and two types of PIFs were selected: high mountain
lakes and rocks, corresponding to dark and bright radiometric control sets. Then a
linear transformation was derived for each band, transforming the individual means
of the PIFs in the 2000 image to those of the 1984 image.
In rugged or mountainous areas, topographic normalisation is usually recom-
mended in order to remove all topographically induced illumination effects (Teillet
1986, Colby 1991, Meyer et al. 1993). The most common method to correct
148 M. Maggi et al.
Dow
nloaded By: [Maggi, M
.] At: 20:55 8 February 2007
topography effects is the one based on the use of the Minnaert constant k, which
accounts for the vegetation as being non-Lambertian. Results of the methodology
are controversial. Some authors found the Minnaert methodology very efficient
(Colby 1991, Ekstrand 1996, Dorren et al. 2003), some others demonstrated the
methodology is of limited use (Tokola et al. 2001, Bishop et al. 2003), others
concluded that it fails to improve mapping accuracy (Carpenter et al. 1999). In the
framework of this study it was decided not to perform topographic correction and to
take into account effects of topography during the collection of training sets, i.e. for
the same land cover change class, training sets having different exposures were
visually selected. This was possible due to the selection of two images of the same
time, 23 and 27 of July, acquired in similar observation conditions. Indeed the forest
landscape pattern, especially in mountainous regions, is usually highly influenced by
sun angle.
As a final pre-processing step, we applied a differencing algorithm to each of the six
Landsat band pairs. Image differencing is defined by some authors as a change
enhancement technique to be distinguished from change classification algorithms
(Rogan and Chen 2004). The former include, among others, vegetation indices
(Wilson and Sader 2002, Sader et al. 2001, Lyon et al. 1998), principal components
analysis (Lunetta and Elvidge 1998), multitemporal Kauth Thomas transformation
(Rogan et al. 2002, Collins and Woodcock 1996), and change vector analysis (Lambin
and Strahler 1994). We selected the normalised band difference as the basis for further
change detection analysis since it represents an output map of immediate and simple
interpretation. More precisely we applied a standardised version (equation (1))
(Coppin and Bauer 1994), in order to minimise confusion among change values that
are numerically equal, but that are describing different change events:
Normalised difference of band i~bandi{00{bandi{84ð Þbandi{00zbandi{84ð Þ ð1Þ
5.2 Classification scheme
On the basis of knowledge available for the study area, i.e. bibliographic material
(GEO Mediterranee 2001, Laurent 1988), and visual inspection of satellite images,
nine change classes from the year 1984 to the year 2000 were identified:
N growth of shrubs on pastures or meadows;
N settling of conifers (pines and larches) on shrubs;
N increase of larch (or other conifers) canopy cover;
N increase of herbaceous biomass;
N from vegetation to bare soil;
N enlargement of river beds;
N clearings for new roads;
N from spruce forest to meadows (cuttings);
N snow in 1984 and rock in 2000.
Training sets for each of these classes plus the no-change class were identified by
visual analysis of the satellite images. If possible, for each class, training sets on
different exposures were selected. In fact, since topographic correction was not
applied to the images, identical targets occurring in different terrain morphologies
may have different reflectance values.
Woody vegetation increase 149
Dow
nloaded By: [Maggi, M
.] At: 20:55 8 February 2007
A separability analysis based on the Jeffries Matusita distance (Richards 1993)
was then performed on the normalised band difference and some change classes, if
ecologically coherent, were merged to obtain a greater separability.
The number of classes was then reduced by defining the following change classes:
N increase of woody vegetation (including the previous first three change classes);
N increase of herbaceous biomass;
N from vegetation to mineral ground (including the classes from vegetation to
bare soil, enlargement of river beds, clearings for new roads);
N decrease of woody vegetation;
N snow in 1984 and rock in 2000.
This last class has a limited meaning in the context of this study although it proves
useful for global warming studies when assessed systematically over many years.
5.3 Change detection
A hybrid change detection approach combining spectral and spatial information
was developed to identify changes on the normalised band difference.
Initially, training sets were identified to characterise the desired output classes.
Subsequently, pixels corresponding to changes with a high confidence level were
defined as pixels deviating in each band difference by a maximum of 1 standarddeviation from the mean of the training sets. This approach is sometimes referred to
as the box-classification (Richards 1993). The resulting pixels were considered as the
labelled seed pixels. However, since only one label can be considered for each seed
pixel, those coming from overlapping boxes were eliminated. For the no-change
class, seeds were obtained by considering all pixels of the multichannel difference
image which fall around the principal mode of the intensity difference distribution
function. The mode is naturally located near the zero value. By fitting a Gaussian
distribution around the tip of this mode, we found that a reasonable threshold value,for determining no change seed pixels with a high confidence, is about 0.125 (on the
normalised difference values ranging from 21 to 1).
Finally, a mask for the clouds and their shadows, which are only present in the
year 2000, was obtained by first detecting clouds shadows which appear in all
channels with a negative band difference. Clouds were then estimated by identifying
all those pixels having a positive difference and a shadow in their NE direction along
a line segment of 3 km, to avoid possible confusions with other classes. This was
achieved by performing a combination of directional dilations (Soille and Talbot
2001) and morphological reconstruction procedures (Soille 2003). Pixels labelled asclouds and shadows were masked out from further analysis.
To detect change classes, we applied a region growing technique based on theseeded region growing technique proposed by Adams and Bischof (1994). In this
approach, the seeds are progressively grown in the original image, i.e. in the
normalised difference image rather than its gradient, as it would be required by a
watershed-based segmentation (Vincent and Soille 1991). At each iteration, all those
pixels that border the growing regions are examined. Only those pixels having the
smallest Euclidean distance with respect to the seed core pixel of the region they
border are appended to that region. Therefore the proposed region growing process
is no longer controlled by a distance measurement between the pixels neighbouringthe grown region and the grown region itself, as in its original version; it is here
based on distance measurements between the pixels bordering the grown region and
150 M. Maggi et al.
Dow
nloaded By: [Maggi, M
.] At: 20:55 8 February 2007
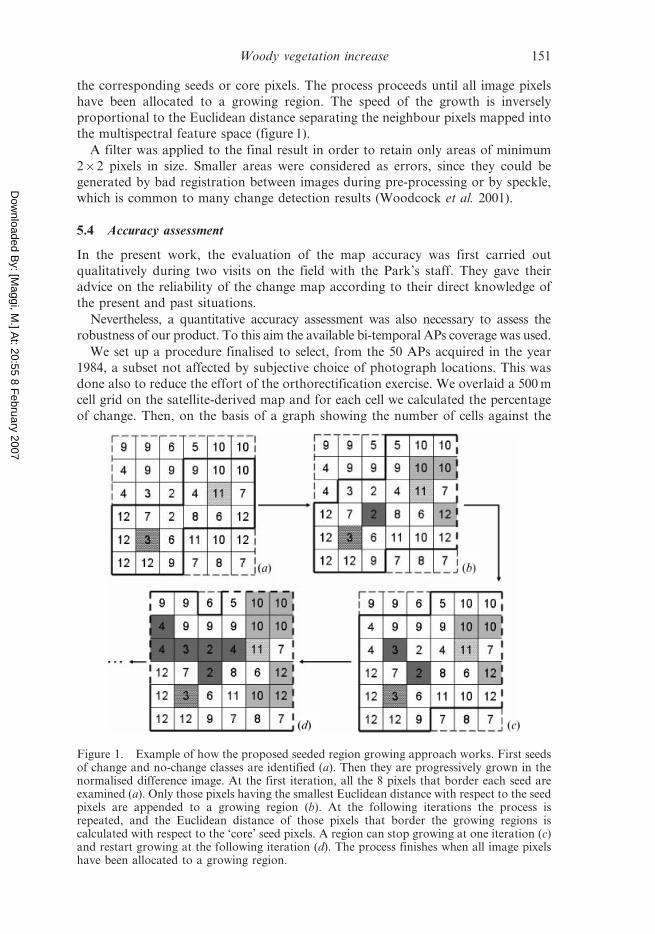
the corresponding seeds or core pixels. The process proceeds until all image pixels
have been allocated to a growing region. The speed of the growth is inversely
proportional to the Euclidean distance separating the neighbour pixels mapped into
the multispectral feature space (figure 1).
A filter was applied to the final result in order to retain only areas of minimum
262 pixels in size. Smaller areas were considered as errors, since they could be
generated by bad registration between images during pre-processing or by speckle,
which is common to many change detection results (Woodcock et al. 2001).
5.4 Accuracy assessment
In the present work, the evaluation of the map accuracy was first carried out
qualitatively during two visits on the field with the Park’s staff. They gave their
advice on the reliability of the change map according to their direct knowledge of
the present and past situations.
Nevertheless, a quantitative accuracy assessment was also necessary to assess the
robustness of our product. To this aim the available bi-temporal APs coverage was used.
We set up a procedure finalised to select, from the 50 APs acquired in the year
1984, a subset not affected by subjective choice of photograph locations. This was
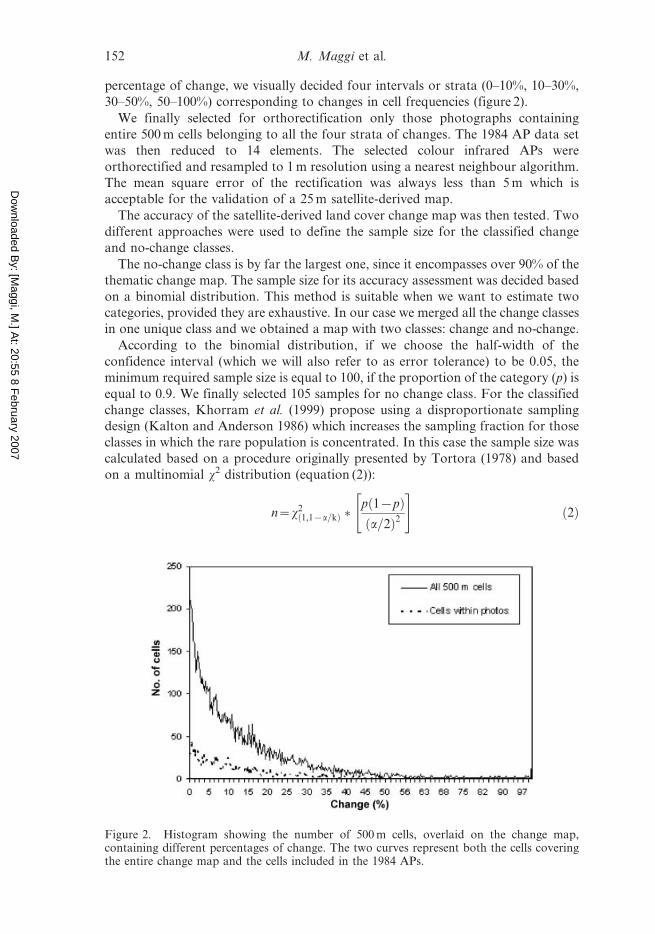
done also to reduce the effort of the orthorectification exercise. We overlaid a 500 m
cell grid on the satellite-derived map and for each cell we calculated the percentage
of change. Then, on the basis of a graph showing the number of cells against the
Figure 1. Example of how the proposed seeded region growing approach works. First seedsof change and no-change classes are identified (a). Then they are progressively grown in thenormalised difference image. At the first iteration, all the 8 pixels that border each seed areexamined (a). Only those pixels having the smallest Euclidean distance with respect to the seedpixels are appended to a growing region (b). At the following iterations the process isrepeated, and the Euclidean distance of those pixels that border the growing regions iscalculated with respect to the ‘core’ seed pixels. A region can stop growing at one iteration (c)and restart growing at the following iteration (d). The process finishes when all image pixelshave been allocated to a growing region.
Woody vegetation increase 151
Dow
nloaded By: [Maggi, M
.] At: 20:55 8 February 2007
percentage of change, we visually decided four intervals or strata (0–10%, 10–30%,
30–50%, 50–100%) corresponding to changes in cell frequencies (figure 2).
We finally selected for orthorectification only those photographs containing
entire 500 m cells belonging to all the four strata of changes. The 1984 AP data set
was then reduced to 14 elements. The selected colour infrared APs were
orthorectified and resampled to 1 m resolution using a nearest neighbour algorithm.
The mean square error of the rectification was always less than 5 m which is
acceptable for the validation of a 25 m satellite-derived map.
The accuracy of the satellite-derived land cover change map was then tested. Two
different approaches were used to define the sample size for the classified change
and no-change classes.
The no-change class is by far the largest one, since it encompasses over 90% of the
thematic change map. The sample size for its accuracy assessment was decided based
on a binomial distribution. This method is suitable when we want to estimate two
categories, provided they are exhaustive. In our case we merged all the change classes
in one unique class and we obtained a map with two classes: change and no-change.
According to the binomial distribution, if we choose the half-width of the
confidence interval (which we will also refer to as error tolerance) to be 0.05, the
minimum required sample size is equal to 100, if the proportion of the category (p) is
equal to 0.9. We finally selected 105 samples for no change class. For the classified
change classes, Khorram et al. (1999) propose using a disproportionate sampling
design (Kalton and Anderson 1986) which increases the sampling fraction for those
classes in which the rare population is concentrated. In this case the sample size was
calculated based on a procedure originally presented by Tortora (1978) and based
on a multinomial x2 distribution (equation (2)):
n~x21,1{a=kð Þ �
p 1{pð Þa=2ð Þ2
" #ð2Þ
Figure 2. Histogram showing the number of 500 m cells, overlaid on the change map,containing different percentages of change. The two curves represent both the cells coveringthe entire change map and the cells included in the 1984 APs.
152 M. Maggi et al.
Dow
nloaded By: [Maggi, M
.] At: 20:55 8 February 2007
where a denotes the desired confidence interval, p the proportion of the stratum and
k the number of change categories.
For k55, p50.5, a50.1, the total number of samples for the change stratum is
541, i.e. 108 for each change class. A confidence interval equal to 0.1 is large for
those classes having a probability of occurrence smaller than 1%, but the choice was
the result of a compromise between the error tolerance and the cost of the validation
exercise.
In order to distribute the sampling effort among the different change classes
according to the varying likelihoods of change, samples were re-allocated in such a
way that change classes with a higher likelihood of occurrence contain a higher
number of sampling pixels. Dimensions of testing samples are as follows: 154 for
‘Increase of woody vegetation’, 120 for ‘Increase of herbaceous biomass’, 95 for
‘Decrease of woody vegetation’, 120 for ‘From vegetation to mineral ground’ and 50
for ‘Snow–rocks’ class.
A stratified random sampling was then adopted in order to locate the required
number of samples within each change category. Strata corresponded to classified
change classes. Given the registration error in image processing, sample units
consisted of polygons of 262 pixels in size in order to ensure that the sampled plot
truly encompasses the designated sample selection point on the map (Biging et al.
1999).
Once the required samples were located on thematic satellite maps, each polygon
was checked on both the 1984 and 2000 aerial photographs. An error matrix was
finally formulated. However, for a stratified random sample based on the mapped
land cover classes as strata, accuracy parameters should be estimated considering
both the sample and population size of each stratum (Stehman and Czaplewsky
1998). Therefore each entry of the error matrix was weighted according both to the
total number of samples taken within the corresponding land cover class and the
proportion of each class within the map. Finally, the following accuracy statistics
were derived: overall accuracy (the proportion of correctly allocated pixels), kappa
(k) coefficient (the measure of correctly allocated pixels adjusted for chance
agreement) along with both the user’s (the percentage of a class on the thematic map
which really corresponds to that class) and producer’s (how often a class is
recognised as that class) accuracies for each class (Janssen and van der Wel 1994).
The user’s and producer’s accuracies are complementary of, respectively, the
commission and omission errors (Congalton 1991).
6. Results and discussion
According to the map derived from the satellite sensor data, 8.4% of the entire
Park’s territory has experienced land cover changes between 1984 and 2000. The
increase of woody vegetation class is the predominant change class corresponding to
50.5% of the changed areas. The remaining change areas are: ‘From vegetation to
mineral ground’ (17.6%), ‘Increase of herbaceous biomass’ (15.5%), ‘Decrease of
woody vegetation’ (8.4%), and ‘Snow–rock’ (8%) classes.
The estimated increase of woody vegetation (4.2%) over the study period 1984–
2000 is coherent with figures given by IFN for the two departements (districts)
(Alpes-Maritimes and Alpes-de-Haute-Provence) that encompass the Mercantour
National Park. Indeed, according to IFN (http://www.ifn.fr/), between 1984
and 1996, an increase of forest area between 4% and 8% occurred in this part of
France.
Woody vegetation increase 153
Dow
nloaded By: [Maggi, M
.] At: 20:55 8 February 2007
Visits on the field gave the opportunity to qualitatively evaluate the correctness
of change classes in some sectors of the Park, both to document them from a
physiognomic point of view and to assess their relevance from a Park’s manage-
ment perspective. In particular, the ‘Increase of woody vegetation’ resulted to be the
most correctly classified change class. It corresponded to different situations, such
as:
N increase of shrubby vegetation on herbaceous ground where agricultural or
pastoral activities have ceased;
N increase of tree density, i.e. increase of canopy cover. Especially larches can
grow by 30–40 cm a year, i.e. up to about 6 m in 16 years (1984–2000);
N few cases where new trees have appeared, such as larches and Scots pines on
southern exposed slopes;
N changes in species composition due to natural succession or to a progressive
replacement of larch with fir and spruce. In fact while larch was favoured in the
past in the framework of reforestation programs, the ONF (Office National
des Forets) today tends to favour the replacement of larches with firs.
The ‘Increase of herbaceous biomass’ class encompasses such an increase on the
ground for three main reasons:
N abandonment of pastoral activities;
N different land use (in 2000 meadows were pastured or mowed later than in
1984);
N changes in phenology due to different precipitation regimes in 1984 and 2000.
The ‘From vegetation to mineral ground’ change class was explained on the ground
as resulting from:
N active erosion;
N enlargements of the river bed between 1984 and 2000 due to a flood event
occurred in 1994 and due to the presence of mining activities;
N new urban infrastructures in the valley bottoms or new ski resorts on slopes;
N areas where recent fire-events have occurred and regenerations are not yet
present;
N decreases of herbaceous biomass due to different land uses (in 2000 meadows
were pastured or mowed earlier than in 1984);
N changes in phenology due to different precipitation regimes in 1984 and 2000.
Both the ‘Increase of herbaceous biomass’ and the ‘From vegetation to mineral
ground’ classes were ranked by the Park’s staff as too heterogeneous for
management purposes, since they include both temporary and permanent changes.
Finally, ground observations allowed us to confirm that the ‘Decrease of woody
vegetation’ class corresponded to areas where cuttings or fires had occurred and
regeneration was already present in 2000. This class is the one presenting the highest
percentage of critical cases including a high percentage of overestimation errors
located above the timberline. For this reason, all pixels belonging to this class and
located above the timberline were masked out.
Availability of ancillary data, such as contours and dates of fires, could be of
some help to solve part of the aforementioned heterogeneity problem. Images
acquired at the end of August, when all meadows are pastured, could help to
separate permanent land cover changes from temporary land use changes. Finally,
154 M. Maggi et al.
Dow
nloaded By: [Maggi, M
.] At: 20:55 8 February 2007
precipitation data and snow duration could be useful to identify phenological
changes. In fact, even if images have been acquired at the same time of the year,
there could be important variations in rainfall from one year to another and soil
moisture and vegetation can be different. These differences can be a significant cause
of error in change detection studies (Mas 1999, Gallego 2004).
Observations made on the field are coherent with results from the quantitative
validation carried out using APs. The map’s overall accuracy is 90.1% (table 1)
which is a very good result. However, the high overall accuracy’s value is influenced
by the high number of correctly classified pixels in the ‘No change’ class which
represents almost 92% of the entire map. This is reflected by the low k coefficient’s
value (0.46).
The highest user’s and producer’s accuracy pertain to the ‘Snow–rock’ class
(100%) because of its high spectral separability with respect to all the others change
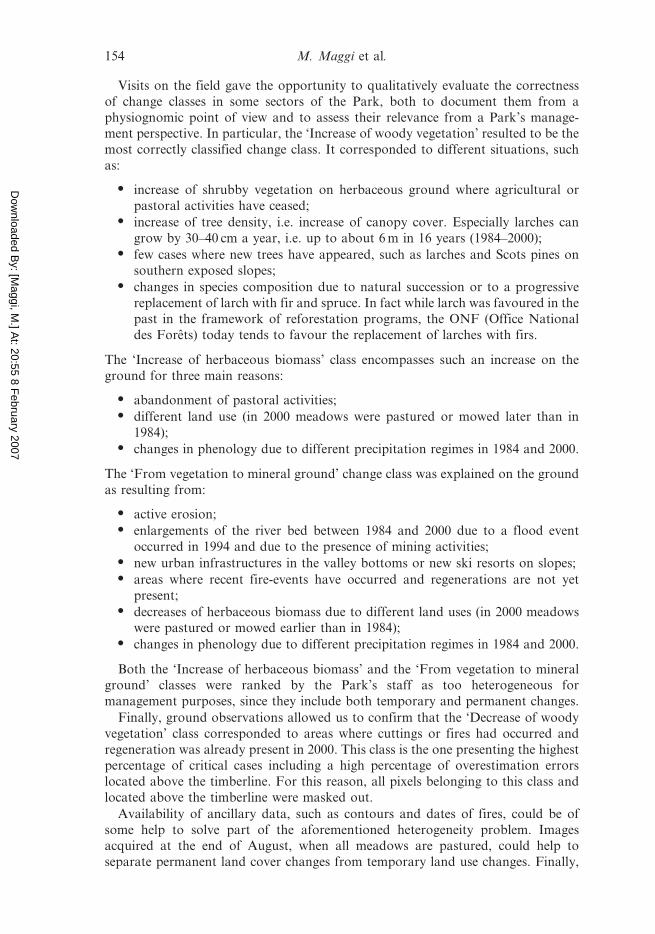
classes. The ‘Increase of woody vegetation’ is the vegetation change class with the
highest user’s and producer’s accuracies of, respectively, 62.3% and 70% (figure 3)
This result was considered of importance since we were mostly interested in looking
at changes related to the increase of forest.
The ‘Increase of woody vegetation’ is also the class with the second highest kcoefficient’s value (0.61), after the snow–rock class (1.0).
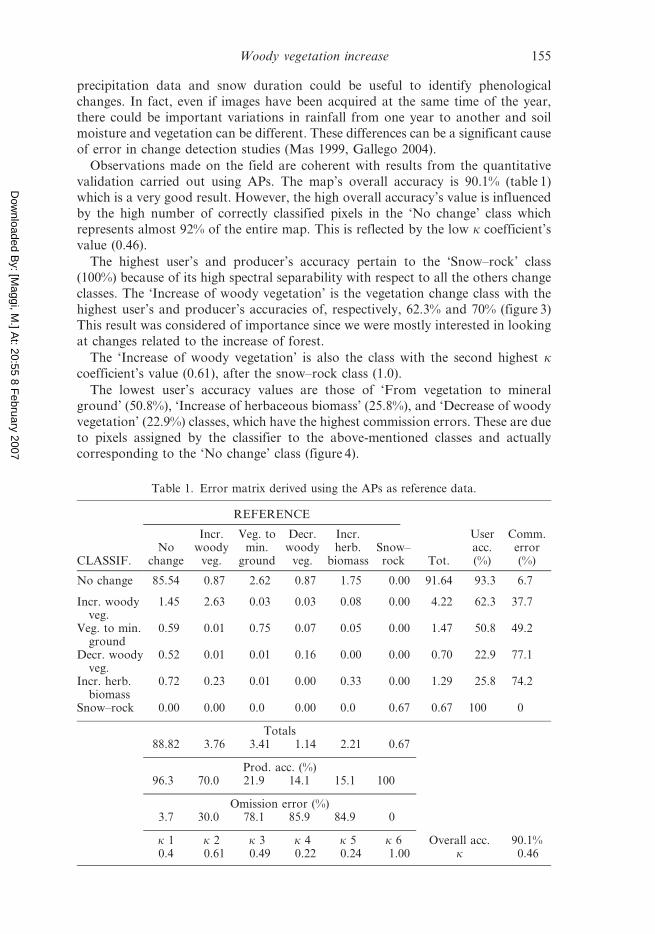
The lowest user’s accuracy values are those of ‘From vegetation to mineral
ground’ (50.8%), ‘Increase of herbaceous biomass’ (25.8%), and ‘Decrease of woody
vegetation’ (22.9%) classes, which have the highest commission errors. These are due
to pixels assigned by the classifier to the above-mentioned classes and actually
corresponding to the ‘No change’ class (figure 4).
Table 1. Error matrix derived using the APs as reference data.
CLASSIF.
REFERENCE
Tot.
Useracc.(%)
Comm.error(%)
Nochange
Incr.woody
veg.
Veg. tomin.
ground
Decr.woody
veg.
Incr.herb.
biomassSnow–rock
No change 85.54 0.87 2.62 0.87 1.75 0.00 91.64 93.3 6.7
Incr. woodyveg.
1.45 2.63 0.03 0.03 0.08 0.00 4.22 62.3 37.7
Veg. to min.ground
0.59 0.01 0.75 0.07 0.05 0.00 1.47 50.8 49.2
Decr. woodyveg.
0.52 0.01 0.01 0.16 0.00 0.00 0.70 22.9 77.1
Incr. herb.biomass
0.72 0.23 0.01 0.00 0.33 0.00 1.29 25.8 74.2
Snow–rock 0.00 0.00 0.0 0.00 0.0 0.67 0.67 100 0
Totals88.82 3.76 3.41 1.14 2.21 0.67
Prod. acc. (%)96.3 70.0 21.9 14.1 15.1 100
Omission error (%)3.7 30.0 78.1 85.9 84.9 0
k 1 k 2 k 3 k 4 k 5 k 6 Overall acc. 90.1%0.4 0.61 0.49 0.22 0.24 1.00 k 0.46
Woody vegetation increase 155
Dow
nloaded By: [Maggi, M
.] At: 20:55 8 February 2007
The ‘Increase of herbaceous biomass’ was also partly mislabelled as increase of woody
vegetation in the reference data, due to the spectral similarity of these two classes.
Producer’s accuracy shows the same behaviour as the user’s accuracy. The worse
results are those of the ‘From vegetation to mineral ground’ (21.9%), ‘Increase ofherbaceous biomass’ (15.1%) and ‘Decrease of woody vegetation’ (14.1%).
Therefore these classes have high omission errors.
(a) (b)
(c) (d)
(e) ( f )
Figure 3. Example of correct estimation of the class ‘Increase of woody vegetation’.Changed pixels estimated using satellite data have grey tones in (a). The same area has beenlocalised also on the normalised difference image (b), the 1984 AP (c), the 1984 TM Landsatimage (d), the orthophoto of year 2000 (e), and the 2000 ETM Landsat image (f) (scale1 : 3000).
156 M. Maggi et al.
Dow
nloaded By: [Maggi, M
.] At: 20:55 8 February 2007
In order to verify the contribution to the observed errors of thresholds applied
within the classification process, we decided to run the region growing algorithm
selecting as seeds all those pixels deviating in each band difference by a maximum of
0.5, 0.75 and 1.5 times the standard deviation from the mean of the training sets.
Error matrices were generated for each classification process. However, obtained
overall accuracies and overall k coefficients were lower, proving that a threshold of 1
standard deviation gives the best results and should not be responsible for the
observed errors (table 2).
Errors can be explained as a function of the moderate spectral separability
between the ‘No change’ and the poorly accurate change classes. Indeed the Jeffrey–
(a) (b)
(c) (d)
(e) ( f )
Figure 4. The region growing algorithm in some cases tends to overestimate changed areas.The example refers to the ‘From vegetation to mineral ground’ class. Changed pixelsestimated using satellite data have grey tones in (a). Plates from (b) to (f) represent the samearea as it appears, respectively, on the normalised difference image (b), the 1984 AP (c), the1984 TM Landsat image (d), the orthophoto acquired in 2000 (e), and the 2000 ETM Landsatimage (f) (scale 1 : 5000).
Woody vegetation increase 157
Dow
nloaded By: [Maggi, M
.] At: 20:55 8 February 2007
Matusita distance varies from 1.61 for the ‘No change’–‘From vegetation to mineral
ground’ pair, to 1.88 for the ‘No change’–‘Increase of herbaceous biomass’ pair.
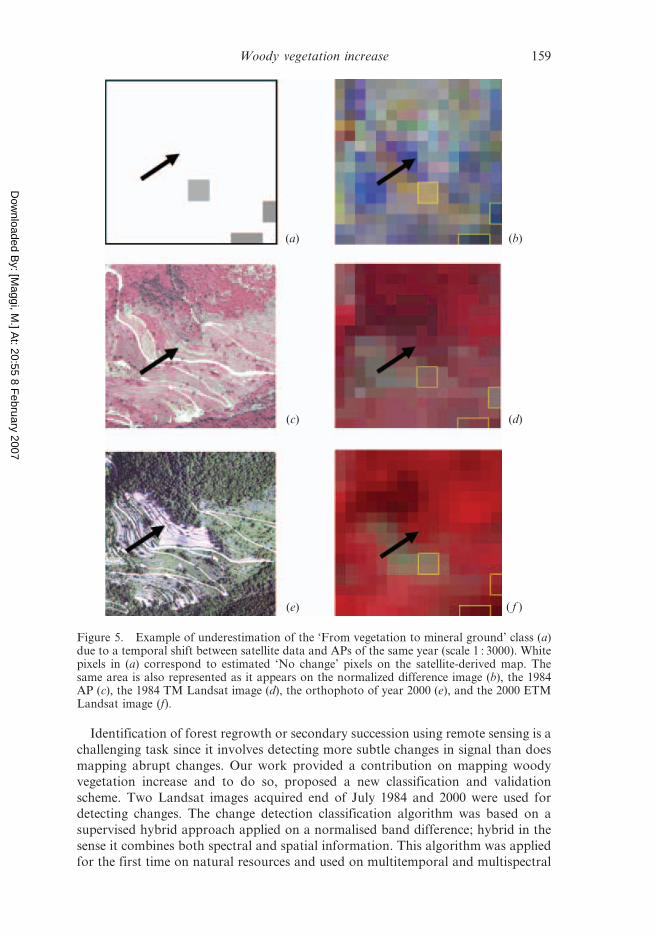
An additional cause of errors in the change map is represented by the temporal
shift between satellite images and aerial photographs of the same year. Therefore
some areas which have been classified on the map as an increase of herbaceous
biomass are assigned to the ‘No change’ class in the error matrix since aerial
photographs were probably acquired when hay was already mowed, i.e. later in the
season. The reverse situation contributes to omission errors, as shown in figure 5.
Examining the spatial pattern of errors we also discovered that a cause of errors
may be due to a residual mis-registration at the local level resulting in distinctive
areas of changes with an elongated shape. These areas are mostly localised in the
south-eastern part of the Park probably due to the acknowledged poorer
registration of images in this area. This is a problem inherent to any change
detection methodology which somewhat degrades area assessment of change events
(Coppin and Bauer 1994, Verbyla and Boles 2000).
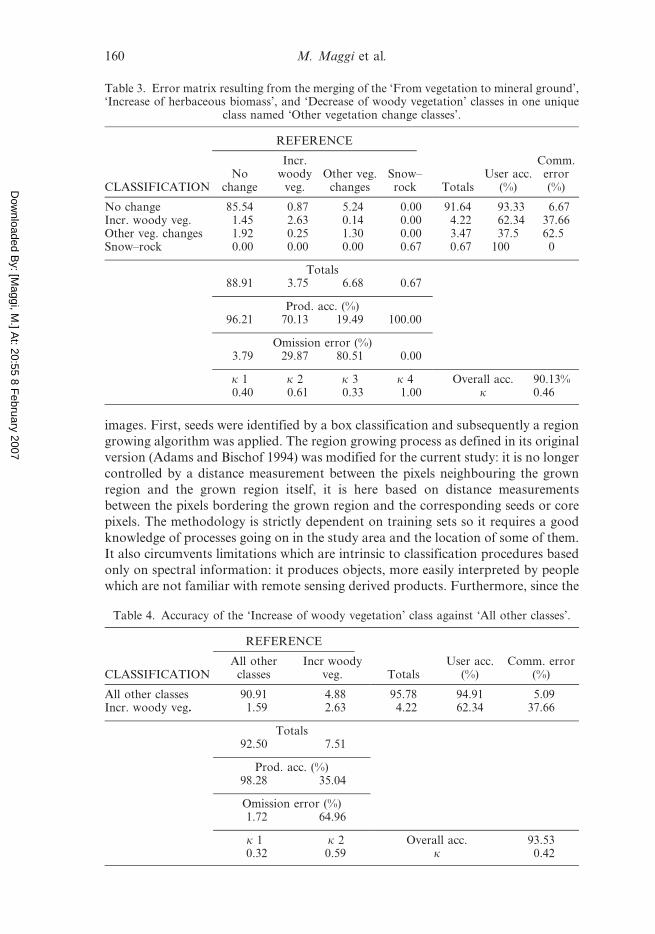
As a consequence of the above discussed accuracy assessment, we merged the
‘From vegetation to mineral ground’, ‘Increase of herbaceous biomass’, and
‘Decrease of woody vegetation’ classes into one unique class named ‘Other
vegetation changes’. In this case we notice that the change map’s accuracy and the kcoefficient are almost constant (table 3). Moreover the high commission (62.5%) and
omission (80.5%) errors of the new change class still confirm the confusion between
the merged classes and all other classes.
We also assessed the accuracy of the ‘Increase of woody vegetation’ class against
all the other classes that were merged in one unique class (table 4). The latter had
low commission and omission errors due to the influence of the ‘No change’ and
‘Snow–rock’ classes. The overall accuracy slightly increases (93.5%) and the kcoefficient is almost constant (0.42); however, the omission error of the ‘Increase of
woody vegetation’ class increases up to 35%.
7. Conclusions
Alpine sites are affected by a general increase of woody vegetation due to a decline
of both agricultural and pastoral activities. This issue is of great concern to the
Park’s managers for its consequences on biodiversity, cultural landscapes, and
tourism. Moreover, mapping of forest regrowth is critical to understand the roles of
terrestrial ecosystems in global carbon budgets and global climate change (Sader
et al. 1989, Foody et al. 1996, Song et al. 2002). Therefore monitoring of the forest
cover increase, especially in marginal areas such as mountain regions, is deemed
necessary. The aim of this study was to provide managers of protected areas with a
methodology to estimate woody vegetation increase from Landsat imagery. As a
pilot area we selected the National Park of Mercantour, located in the French Alps.
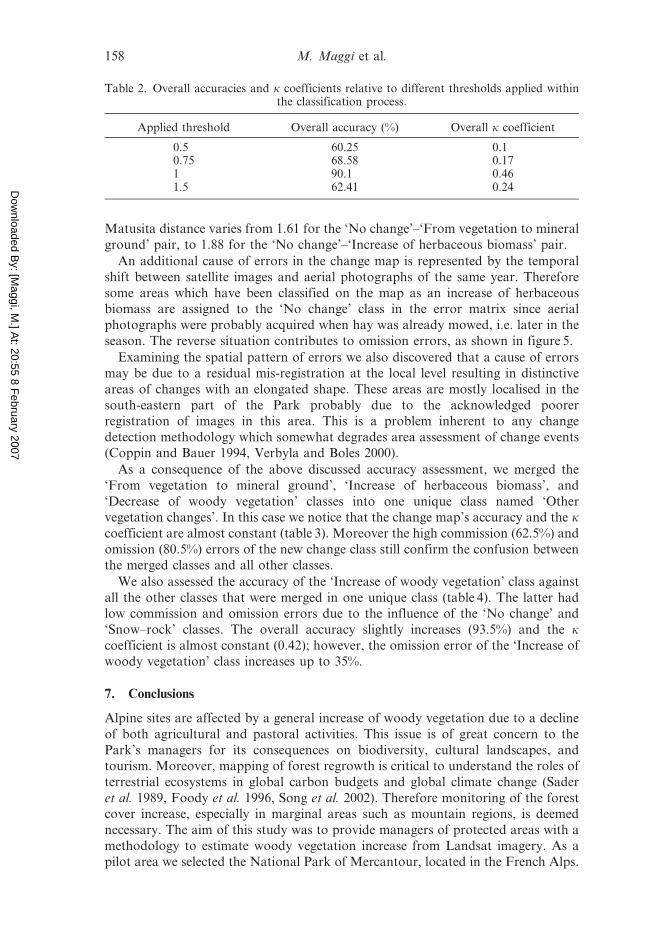
Table 2. Overall accuracies and k coefficients relative to different thresholds applied withinthe classification process.
Applied threshold Overall accuracy (%) Overall k coefficient
0.5 60.25 0.10.75 68.58 0.171 90.1 0.461.5 62.41 0.24
158 M. Maggi et al.
Dow
nloaded By: [Maggi, M
.] At: 20:55 8 February 2007
Identification of forest regrowth or secondary succession using remote sensing is a
challenging task since it involves detecting more subtle changes in signal than does
mapping abrupt changes. Our work provided a contribution on mapping woody
vegetation increase and to do so, proposed a new classification and validation
scheme. Two Landsat images acquired end of July 1984 and 2000 were used for
detecting changes. The change detection classification algorithm was based on a
supervised hybrid approach applied on a normalised band difference; hybrid in the
sense it combines both spectral and spatial information. This algorithm was applied
for the first time on natural resources and used on multitemporal and multispectral
(a) (b)
(c) (d)
(e) ( f )
Figure 5. Example of underestimation of the ‘From vegetation to mineral ground’ class (a)due to a temporal shift between satellite data and APs of the same year (scale 1 : 3000). Whitepixels in (a) correspond to estimated ‘No change’ pixels on the satellite-derived map. Thesame area is also represented as it appears on the normalized difference image (b), the 1984AP (c), the 1984 TM Landsat image (d), the orthophoto of year 2000 (e), and the 2000 ETMLandsat image (f).
Woody vegetation increase 159
Dow
nloaded By: [Maggi, M
.] At: 20:55 8 February 2007
images. First, seeds were identified by a box classification and subsequently a region
growing algorithm was applied. The region growing process as defined in its original
version (Adams and Bischof 1994) was modified for the current study: it is no longer
controlled by a distance measurement between the pixels neighbouring the grown
region and the grown region itself, it is here based on distance measurements
between the pixels bordering the grown region and the corresponding seeds or core
pixels. The methodology is strictly dependent on training sets so it requires a good
knowledge of processes going on in the study area and the location of some of them.
It also circumvents limitations which are intrinsic to classification procedures based
only on spectral information: it produces objects, more easily interpreted by people
which are not familiar with remote sensing derived products. Furthermore, since the
Table 3. Error matrix resulting from the merging of the ‘From vegetation to mineral ground’,‘Increase of herbaceous biomass’, and ‘Decrease of woody vegetation’ classes in one unique
class named ‘Other vegetation change classes’.
CLASSIFICATION
REFERENCE
TotalsUser acc.
(%)
Comm.error(%)
Nochange
Incr.woody
veg.Other veg.
changesSnow–rock
No change 85.54 0.87 5.24 0.00 91.64 93.33 6.67Incr. woody veg. 1.45 2.63 0.14 0.00 4.22 62.34 37.66Other veg. changes 1.92 0.25 1.30 0.00 3.47 37.5 62.5Snow–rock 0.00 0.00 0.00 0.67 0.67 100 0
Totals88.91 3.75 6.68 0.67
Prod. acc. (%)96.21 70.13 19.49 100.00
Omission error (%)3.79 29.87 80.51 0.00
k 1 k 2 k 3 k 4 Overall acc. 90.13%0.40 0.61 0.33 1.00 k 0.46
Table 4. Accuracy of the ‘Increase of woody vegetation’ class against ‘All other classes’.
CLASSIFICATION
REFERENCE
TotalsUser acc.
(%)Comm. error
(%)All other
classesIncr woody
veg.
All other classes 90.91 4.88 95.78 94.91 5.09Incr. woody veg. 1.59 2.63 4.22 62.34 37.66
Totals92.50 7.51
Prod. acc. (%)98.28 35.04
Omission error (%)1.72 64.96
k 1 k 2 Overall acc. 93.530.32 0.59 k 0.42
160 M. Maggi et al.
Dow
nloaded By: [Maggi, M
.] At: 20:55 8 February 2007
methodology is based on a combined spectral–temporal analysis, it does not require
deriving the land cover maps for two dates, reducing in this way the classification
efforts.
Although the study focus was on increase of woody vegetation, the classification
nomenclature scheme was based on four vegetation change classes plus the ‘No
change’ and ‘Snow–rock’ classes. We adopted coarse change classes in terms of the
level of detail extracted from the imagery. Both the visits on the field and the APs
demonstrated the heterogeneous nature of change classes. This characteristic can be
explained if we consider that all change classes mostly correspond to modifications
of land cover rather than a conversion of land cover type (Riebsame et al. 1994,
Skole 1994, Foody and Boyd 1999). However, the ‘Increase of herbaceous biomass’
and the ‘From vegetation to mineral ground’ classes were considered by the Park’s
staff as too heterogeneous for management purposes, since they include both
temporary and permanent changes. To distinguish the two types of changes, satellite
sensor data should be integrated with ancillary information.
To assess the accuracy of the change map we used a bi-temporal aerial
photographic coverage and we adopted a sampling scheme specifically conceived for
change detection products which increases the sampling fraction for rare classes.
Error matrices and accuracy indices were generated which allowed us to assess
commission and omission errors of our change maps. Since we adopted a combined
spectral–temporal change detection approach, dimensions of our error matrices
were smaller than those of error matrices generated for post-classification change
detection products. Indeed the latter have a dimension of n26n2, where n is the
number of classes of single date classifications at time 1 and time 2. The smaller
number of change classes in our approach greatly reduces the efforts of the
validation exercise. However, there are some drawbacks which are implicit in using
aerial photographs for the accuracy assessment of our satellite derived map. First,
their finer resolution with respect to the satellite sensor data implies a subjective
generalisation process of the same target area during visual interpretation. Second,
visual analysis of areas selected for the accuracy assessment which fall at the
boundary of two classes or which experienced slight changes, imply a subjective
interpretation. Finally, as we verified during our accuracy assessment, the temporal
shift between satellite images and aerial photographs of the same year can generate
omission or commission errors within agricultural land use classes.
The accuracy assessment shows that the ‘Increase of woody vegetation’ is the
vegetation change class which has been better estimated and since we were mostly
interested in looking to changes related to the increase of forests we consider this
result of importance. However, confusion between the ‘No change’ and the other
vegetation change classes was reported. Errors are due to different reasons, namely:
non-sufficient spectral separability, temporal shift between satellite images and
validation data set, and residual mis-registration. Since the change detection
methodology is supervised, we expect that these problems can be greatly reduced in
future work by improving the training extraction. To render the latter more
objective and robust, an automatic identification of training sets on APs and their
classification according to ranges of woody vegetation increase could be investigated
in the future. It should also be interesting to assess the influence of a topographic
correction of images on the results.
To conclude, we believe that the change map derived by applying the hybrid
approach to Landsat images can be used to stratify the protected area, thus
Woody vegetation increase 161
Dow
nloaded By: [Maggi, M
.] At: 20:55 8 February 2007
facilitating the identification of critical sites to be accurately visited on the ground.
The proposed methodology is suitable for the analysis of medium resolution
imagery where the vegetation structure is not visible. For higher spatial resolutions,
such as those of SPOT5 multispectral, the method could be adapted by generating
texture channels so that difference in texture will aid the change detection. For very
high-resolution imagery such as IKONOS, the method is not applicable since the
shape of trees, the effects of shadow and view angle disturb texture measurements
too much.
The methodological approach, including the classifier and the validation scheme,
was tested for the issue of increase of woody vegetation in mountain regions; it is
currently applied to other protected areas, located in the Italian Alps, characterised
by landscape processes similar to the ones observed in the National Park of
Mercantour. The method is therefore directly relevant to the European Alpine
biogeographic region in which altitude-related conditions dominate the development
of vegetation and where land abandonment is a general trend. As future
development, the application of the method in flat areas will be straightforward
since technical problems related to topography effects will not be encountered.
However, in flat areas, anthropogenic forces (infrastructure building, agricultural
and silvicultural practices) influence in a different way woody vegetation dynamics.
Overall, we believe that such an approach is worth testing for monitoring vegetation
dynamics in European protected areas and outside Europe in general for different
types of vegetation dynamics.
Finally, this work is of interest for the biodiversity community, since it addresses
vegetation dynamics and focuses at the ecosystem level. It does not address directly
the habitat and species levels. The definition of habitat relies more on phytosocio-
logical/floristic criteria and their identification cannot be directly achieved using Earth
Observation or aerial photographs (Estreguil et al. 2003). Vegetation is, however,
considered the best indicator of environmental conditions of a habitat.
Acknowledgments
This study was supported by a grant for training through research of the European
Commission.
The Landsat TM image of 23/07/1984 was kindly provided by Jean Bernard-
Brunet of CEMAGREF-Grenoble; the digital orthophotos and the DEM by the
National Park of Mercantour. The Landsat ETM + image is an IMAGE2000 (EC)
product (http://image2000.jrc.it/). All the staff of the National Park of Mercantour,
who contributed to the field validation, are gratefully acknowledged. The authors
also wish to thank Frederic Achard, Jacek Kozak, Michel Deshayes, and Samuel
Djavidnia for their comments and suggestions.
ReferencesADAMS, R. and BISCHOF, L., 1994, Seeded region growing. IEEE Transactions on Pattern
Analysis and Machine Intelligence, 16, pp. 641–647.
BIANCHERI, J.-Y. and CLAUDIN, J. (Eds), 2002, Atlas du Parc National du Mercantour (Nice,
France: Ministere de l’Ecologie et du Developpement Durable).
BIGING, G.S., COLBY, D.R. and CONGALTON, R.G., 1999, Sampling systems for change
detection accuracy assessment. In Remote Sensing Change Detection: Environmental
Monitoring Methods and Applications, R.S. Lunetta and C.D. Elvidge (Eds), pp.
281–308 (London: Taylor and Francis).
162 M. Maggi et al.
Dow
nloaded By: [Maggi, M
.] At: 20:55 8 February 2007
BISHOP, M.P., SHRODER, JR, J.F. and COLBY, J.D., 2003, Remote sensing and geomorpho-
metry for studying relief production in high mountains. Geomorphology, 55, pp.
345–361.
BUREL, F. and BAUDRY, J., 1995, Species biodiversity in changing agricultural landscapes: a
case study in the Pays d’Auge, France. Agricultural Ecosystems and Environment, 55,
pp. 193–200.
CARPENTER, G.A., GOPAL, S., MACoMBER, S., MARTENS, S. and WOODCOCK, C.E., 1999, A
neural network method for mixture estimation for vegetation mapping. Remote
Sensing of Environment, 70, pp. 138–152.
CASPERSEN, J.P., PACALA, S.W., JENKINS, J.C., HURTT, G.C., MOORCROFT, P.R. and
BIRDSEY, R.A., 2000, Contributions of land-use history to carbon accumulation in
U.S. forests. Science, 290, pp. 1148–1151.
CERNUSCA, A., TAPPEINER, U. and BAYFIELD, N., 1999, Land-use Changes in European
Mountain Ecosystems—ECOMONT (Berlin: Blackwell Wissenschafts–Verlag).
COLBY, J.D., 1991, Topographic normalisation in rugged terrain. Photogrammetric
Engineering and Remote Sensing, 57, pp. 531–537.
COLLINS, J.B. and WOODCOCK, C.E., 1996, An assessment of several linear change detection
techniques for mapping forest mortality using multitemporal Landsat TM data.
Remote Sensing of Environment, 77, pp. 66–77.
CONGALTON, R., 1991, A review of assessing the accuracy of classification of remotely sensed
data. Remote Sensing of Environment, 37, pp. 35–46.
CONGALTON, R. and GREEN, K., 1993, A practical look at the source of confusion in error
matrix generation. Photogrammetric Engineering and Remote Sensing, 59, pp.
641–644.
CONGALTON, R. and GREEN, K., 1999, Assessing the Accuracy of Remotely Sensed Data:
Principles and Practices (Boca Raton, FL: Lewis Publishers).
COPPIN, P.R. and BAUER, M.E., 1994, Processing of multitemporal Landsat TM imagery to
optimise extraction of forest cover change features. IEEE Transactions on Geoscience
and Remote Sensing, 32, pp. 918–927.
COPPIN, P.R. and BAUER, M.E., 1996, Digital change detection in forest ecosystems with
remote sensing imagery. Remote Sensing Reviews, 13, pp. 207–234.
COPPIN, P., JONCKHEERE, I., NACKAERTS, K. and MUYS, B., 2004, Digital change detection
methods in ecosystem monitoring: a review. International Journal of Remote Sensing,
25, pp. 1565–1596.
DIDIER, L., 2001, Invasion patterns of European larch and Swiss stone pine in subalpine
pastures in the French Alps. Forest Ecology and Management, 145, pp. 67–77.
DORREN, L.K.A., MAIER, B. and SEIJMONSBERGEN, A.C., 2003, Improved Landsat-based
forest mapping in steep mountainous terrain using object-based classification. Forest
Ecology and Management, 183, pp. 31–46.
ESTREGUIL, C.M., DESHAYES, M., LAMB, A., RICHMAN, A. and SELL, E., 2003, Indicators
for Biodiversity and Nature Protection—A Contribution—User Needs and
Information Gaps at Local and European Levels—The Remotely Sensed
Contribution for their Implementation. JRC European Commission publication
reference EUR 20861.
EKSTRAND, S., 1996, Landsat TM-based forest damage assessment: correction for
topographic effects. Photogrammetric Engineering and Remote Sensing, 62, pp.
151–161.
FIORELLA, M. and RIPPLE, W.J., 1993, Determining successional stage of temperate
coniferous forests with Landsat satellite data. Photogrammetric Engineering and
Remote Sensing, 59, pp. 239–246.
FOODY, G.M., PALUBINSKAS, G., LUCAS, R.M., CURRAN, P.J. and HONZAK, M., 1996,
Identifying terrestrial carbon sinks: classification of successional stages in regenerat-
ing tropical forest from Landsat TM data. Remote Sensing of Environment, 55, pp.
205–216.
Woody vegetation increase 163
Dow
nloaded By: [Maggi, M
.] At: 20:55 8 February 2007
FOODY, G.M. and BOYD, D.S., 1999, Detection of partial land cover changes associated with
the migration of inter-class transitional zones. International Journal of Remote
Sensing, 20, pp. 2723–2740.
FOODY, G.M., 2002, Status of land cover classification accuracy assessment. Remote Sensing
of Environment, 80, pp. 185–201.
GALLEGO, F.J., 2004, Remote sensing and land cover data estimation. International Journal of
Remote Sensing, 25, pp. 3019–3047.
GEOMEDITERRANEE 2001, Cartographie de l’occupation du sol et des evolutions 1986–1998
du Parc National du Mercantour et de sa zone d’influence, 7 pp.
GUIDI, M. and PIUSSI, P., 1993, The influence of old rural land-management practices on the
natural regeneration of woodland on abandoned farmland in the Prealps of Friuli,
Italy. In Ecological Effects of Afforestation. Studies in the History and Ecology of
Afforestation in Western Europe, C. Watkins (Ed.), pp. 57–67 (Wallingford, UK: CAB
International).
HALL, F.G., BOTKIN, D.B., STREBEL, D.E., WOODS, D.E. and GOETZ, S.J., 1991a, Large scale
patterns of forest succession as determined by remote sensing. Ecology, 72, pp.
628–640.
HALL, F.G., STREBEL, D.E., NICKESON, J.E. and GOETZ, S.J., 1991b, Radiometric
rectification: toward a common radiometric response among multidate, multisensor
images. Remote Sensing of Environment, 35, pp. 11–27.
HARALICK, R.M. and SHAPIRO, L., 1985, Image segmentation techniques. Computer Vision,
Graphics and Image Processing, 29, pp. 100–132.
HELMER, E.H., BROWN, S. and COHEN, W.B., 2000, Mapping montane tropical forest
successional stage and land use with multi-date Landsat imagery. International
Journal of Remote Sensing, 21, pp. 2163–2183.
HOCHTL, F., LEHRINGER, S. and KONOLD, W., 2005, ‘Wilderness’: what it means when it
becomes a reality—a case study from the southwestern Alps. Landscape and Urban
Planning, 70, pp. 85–95.
HOUGHTON, R.A., HACKLER, J.L. and LAWRENCE, K.T., 1999, The U.S. carbon budget:
contributions from land-use change. Science, 285, pp. 574–578.
HUNZIKER, M. and KIENAST, F., 1999, Potential impacts of changing agricultural activities on
scenic beauty—a prototypical technique for automated rapid assessment. Landscape
Ecology, 14, pp. 161–176.
JANSSEN, L.L.F. and VAN DER WEL F.J.M., 1994, Accuracy assessment of satellite derived
land-cover data: a review. Photogrammetric Engineering and Remote Sensing, 60, pp.
419–426.
KALTON, G. and ANDERSON, D.W., 1986, Sampling rare populations. Journal of the Royal
Statistical Society, 149 (Series A), pp. 65–82.
KARTIKEYAN, B., SARKAR, A. and MAJUMDER, K.L., 1998, A segmentation approach to
classification of remote sensing imagery. International Journal of Remote Sensing, 19,
pp. 1695–1709.
KHORRAM, S. (Ed.), BIGING, G.S., CHRISMAN, N., COLBY, D.R., CONGALTON, R.G.,
DOBSON, J.E., FERGUSON, R.L., GOODCHILD, M.F., JENSEN, J.R. and MACe, T.H.,
1999, Accuracy Assessment of Remote Sensing-derived Change Detection, Monograph,
American Society of Photogrammetry and Remote Sensing (ASPRS) (Maryland:
Bethesda).
LAMBIN, E.F. and STRAHLER, A.H., 1994, Change vector analysis in multitemporal space: a
tool to detect and categorise land-cover change processes using high temporal
resolution satellite data. Remote Sensing of Environment, 48, pp. 231–244.
LAURENT, J.-L., 1988, Paysages & Vegetation (Editions Serre/Parc National du Mercantour).
LIU, H. and ZHOU, Q., 2004, Accuracy analysis of remote sensing change detection by rule-
based rationality evaluation with post-classification comparison. International Journal
of Remote Sensing, 25, pp. 1037–1050.
164 M. Maggi et al.
Dow
nloaded By: [Maggi, M
.] At: 20:55 8 February 2007
LOWELL, K., 2001, An area-based accuracy assessment methodology for digital change maps.
International Journal of Remote Sensing, 22, pp. 3571–3596.
LU, D., MAUSEL, P., BRONDIZIO, E. and MORAN, E., 2004, Change detection techniques.
International Journal of Remote Sensing, 22, pp. 1565–1596.
LUNETTA, R.S. and ELVIDGE, C.D., 1998, Remote Sensing Change Detection: Environmental
Monitoring Methods and Applications (Chelsea, MI: Ann Arbor Press), 318 pp.
LUQUE, S.S., 2000, Evaluating temporal changes using Multi-Spectral Scanner and Thematic
Mapper data on the landscape of a natural reserve: the New Jersey Pine Barrens, a
case study. International Journal of Remote Sensing, 21, pp. 2589–2611.
LYON, J.G., YUAN, D., LUNETTA, R.S. and ELVIDGE, C.D., 1998, A change detection
experiment using vegetation indices. Photogrammetric Engineering and Remote
Sensing, 64, pp. 143–150.
MACDONALD, D., CRABTREE, J.R., WIESINGER, G., DAX, T., STAMOU, N., FLEURY, P.,
GUTIERREZ LAZPITA, J. and GIBON, A., 2000, Agricultural abandonment in mountain
areas of Europe: environmental consequences and policy response. Journal of
Environmental Management, 59, pp. 47–69.
MAGGI, M., SOILLE, P., DESHAYES, M. and ESTREGUIL, C., 2004, Detection of vegetation
changes in an Alpine protected area. In Second International Workshop on the Analysis
of MultiTemporal Remote Sensing Images, 16–18 July 2003, Ispra (VA), Italy, pp.
249–258 (Singapore: World Scientific Publishing Ltd).
MAS, J.F., 1999, Monitoring land-cover changes: a comparison of change detection
techniques. International Journal of Remote Sensing, 20, pp. 139–152.
MERTENS, B. and LAMBIN, E.F., 2000, Land cover change trajectories in southern Cameroon.
Annals of the Association of American geographers, 90, pp. 467–494.
MEYER, P., ITTEN, K.I., KELLENBERGER, T., SANDMEIER, S. and SANDMEIER, R., 1993,
Radiometric corrections of topographically induced effects on Landsat TM data in an
alpine environment. ISPRS Journal of Photogrammetry and Remote Sensing, 48, pp.
17–28.
MEYER, W.B. and TURNER, B.L. (Eds), 1994, Changes in Land Use and Land Cover: a Global
Perspective (Cambridge: Cambridge University Press).
MORISETTE, J.T. and KHORRAM, S., 2000, Accuracy-assessment curves for satellite-based
change detection. Photogrammetric Engineering and Remote Sensing, 66, pp. 875–880.
MOTTA, R. and DOTTA, A., 1995, Les Melezins des Alpes Occidentales: un paysage a
defendre. Revue Forestiere Francaise, XLVII, pp. 329–342.
PAL, N.R. and PAL, S.K., 1993, A review on image segmentation techniques. Pattern
Recognition, 26, pp. 1277–1294.
PEKKARINEN, A., 2002, A method for the segmentation of very high spatial resolution images
of forested landscapes. International Journal of Remote Sensing, 23, pp. 2817–2836.
RICHARDS, J.A., 1993, Remote Sensing Digital Image Analysis—An Introduction, 2nd edn
(Berlin: Springer-Verlag).
RIEBSAME, W.E., MEYER, W.B. and TURNER II B.L., 1994, Modelling land use and cover as
part of global environmental change. Climatic Change, 28, pp. 45–64.
ROGAN, J., FRANKLIN, J. and ROBERTS, D.A., 2002, A comparison of methods for monitoring
multitemporal vegetation change using Thematic Mapper imagery. Remote Sensing of
Environment, 80, pp. 143–156.
ROGAN, J. and CHEN, D.M., 2004, Remote sensing technology for mapping and monitoring
land-cover and land-use change. Progress in Planning, 61, pp. 301–325.
SADER, S.A., WAIDE, R.B., LAWRENCE, W.T. and JOICE, A.T., 1989, Tropical forest biomass
and successional age class relationship to a vegetation index derived from Landsat
TM data. Remote Sensing of Environment, 28, pp. 143–156.
SADER, S.A., HAYES, D.J., HEPINSTALL, J.A., COAN, M. and SOZA, C., 2001, Forest change
monitoring of a remote biosphere reserve. International Journal of Remote Sensing, 22,
pp. 1937–1950.
Woody vegetation increase 165
Dow
nloaded By: [Maggi, M
.] At: 20:55 8 February 2007
SANDOZ, H., BARBERO, M. and SOLICHON, J-M., 1998, Evolution et devenir des melezins dans
les Alpes-maritimes (Alpes du Sud—France) suite au declin des activites anthro-
pozoogenes en haute montagne. Ecologie, 29, pp. 23–36.
SINGH, A., 1989, Digital change detection using remotely sensed data. International Journal of
Remote Sensing, 10, pp. 989–1003.
SKOLE, D.L., 1994, Data on global land-cover change: acquisition, assessment and analysis.
In Changes in Land Use and Land Cover: A Global Perspective, W.B. Meyer and B.L.
Turner II (Eds), pp. 437–471 (Cambridge: Cambridge University Press).
SOILLE, P., 1996, Morphological partitioning of multispectral images. Journal of Electronic
Imaging, 5, pp. 252–265.
SOILLE, P. and TALBOT, H., 2001, Directional morphological filtering. IEEE Transactions on
Pattern Analysis and Machine Intelligence, 23, pp. 1313–1329.
SOILLE, P., 2003, Morphological Image Analysis: Principles and Applications (Heidelberg, New
York: Springer-Verlag).
SONG, C., WOODCOCK, C.E., SETO, K.C., LENNEY, M.P. and MACoMBER, S.A., 2001,
Classification and change detection using Landsat TM data: when and how to correct
atmospheric effects? Remote Sensing of Environment, 75, pp. 230–244.
SONG, C., WOODCOCK, C.E. and LI, X., 2002, The spectral/temporal manifestation of forest
succession in optical imagery. The potential of multitemporal imagery. Remote
Sensing of Environment, 82, pp. 285–302.
STEHMAN, S.V. and CZAPLEWSKI, R.L., 1998, Design and analysis for thematic map accuracy
assessment: fundamental principles. Remote Sensing of Environment, 64, pp. 331–344.
STEHMAN, S.V., 1999, Basic probability sampling designs for thematic map accuracy
assessment. International Journal of Remote Sensing, 20, pp. 2423–2441.
TAPPENEIR, U., TASSER, E. and TAPPENEIR, G., 1998, Modelling vegetation patterns using
natural and anthropogenic influence factors: preliminary experience with a GIS based
model applied to an Alpine area. Ecological Modelling, 113, pp. 225–237.
TEILLET, P.M., 1986, Image correction for radiometric effects in remote sensing. International
Journal of Remote Sensing, 7, pp. 1637–1651.
TOKOLA, T., SARKEALA, J. and VAN DER LINDEN M., 2001, Use of topographic correction in
Landsat TM-based forest interpretation in Nepal. International Journal of Remote
Sensing, 22, pp. 551–563.
TORTORA, R., 1978, A note on sample size estimation for multinomial populations. The
American Statisticians, 32, pp. 100–102.
VERBYLA, D.L. and BOLES, S.H., 2000, Bias in land cover change estimates due to
misregistration. International Journal of Remote Sensing, 21, pp. 3553–3560.
VINCENT, L. and SOILLE, P., 1991, Watersheds in digital spaces: an efficient algorithm based
on immersion simulations. IEEE Transactions on Pattern Analysis and Machine
Intelligence, 13, pp. 583–598.
WILSON, E.H. and SADER, S., 2002, Detection of forest harvest type using multiple dates of
Landsat TM imagery. Remote Sensing of Environment, 80, pp. 385–396.
WOODCOCK, C. and HARVARD, V.J., 1992, Nested-hierarchical scene models and image
segmentation. International Journal of Remote Sensing, 13, pp. 3167–3187.
WOODCOCK, C.E., MACoMBER, S.A., PAX-LENNEY, M. and COHEN, W.B., 2001, Monitoring
large areas for forest change using Landsat. Generalisation across space, time and
Landsat sensors. Remote Sensing of Environment, 78, pp. 194–203.
166 Woody vegetation increase