Wood is good report-Final.indd - Centre for Science and ...
48
BUT IS INDIA DOING ENOUGH TO MEET ITS PRESENT AND FUTURE NEEDS? A status report by Centre for Science and Environment
-
Upload
khangminh22 -
Category
Documents
-
view
6 -
download
0
Transcript of Wood is good report-Final.indd - Centre for Science and ...

BUT IS INDIA DOING ENOUGH TO MEET ITS PRESENT AND FUTURE NEEDS?A status report by Centre for Science and Environment


A status report by Centre for Science and Environment
BUT IS INDIA DOING ENOUGH TO MEET ITS PRESENT AND FUTURE NEEDS?
WOODIS
GOOD

Research Director: Chandra Bhushan
Authors: Soujanya Shrivastava and Ajay Kumar Saxena
Editor: Arif Ayaz Parrey
Cover, Design & Infographics: Raj Kumar Singh
Layout: Abhishek Vaishnav
Production: Rakesh Srivastava and Gundhar Das
This document has been produced with the financial contribution of Bread for the World—Protestant Development Service. The views expressed herein are not necessarily the official opinion of the donor.
© 2017 Centre for Science and Environment
Material from this publication can be used, but with acknowledgement.
Citation: Soujanya Shrivastava and Ajay Kumar Saxena 2017. Wood is Good: But, is India doing enough to meet its present and future needs? Centre for Science and Environment, New Delhi
Published by: Centre for Science and Environment 41, Tughlakabad Institutional AreaNew Delhi 110 062 Phone: 91-11-40616000 Fax: 91-11-29955879 E-mail: [email protected]: www.cseindia.org
Printed at Multi Colour Services

CONTENTSWood balance of India ..................................................................... 6
Wood production in India .............................................................. 14
Wood consumption in India .......................................................... 22
Wood across borders of India ....................................................... 28
Wood knots ..................................................................................... 38
References ...................................................................................... 44
66
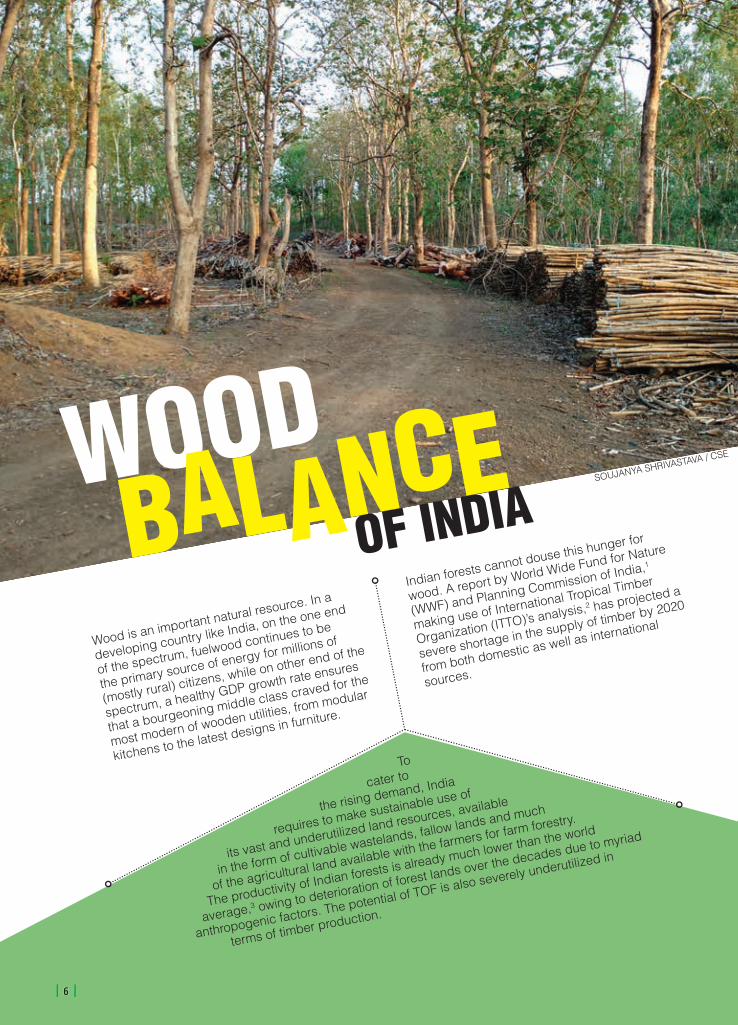
WOODOF INDIABALANCE
Wood is an important natural resource. In a
developing country like India, on the one end
of the spectrum, fuelwood continues to be
the primary source of energy for millions of
(mostly rural) citizens, while on other end of the
spectrum, a healthy GDP growth rate ensures
that a bourgeoning middle class craved for the
most modern of wooden utilities, from modular
kitchens to the latest designs in furniture.
To
cater to
the rising demand, India
requires to make sustainable use of
its vast and underutilized land resources, available
in the form of cultivable wastelands, fallow lands and much
of the agricultural land available with the farmers for farm forestry.
The productivity of Indian forests is already much lower than the world
average,3 owing to deterioration of forest lands over the decades due to myriad
anthropogenic factors. The potential of TOF is also severely underutilized in
terms of timber production.
Indian forests cannot douse this hunger for
wood. A report by World Wide Fund for Nature
(WWF) and Planning Commission of India,1
making use of International Tropical Timber
Organization (ITTO)’s analysis,2 has projected a
severe shortage in the supply of timber by 2020
from both domestic as well as international
sources.
SOUJANYA SHRIVASTAVA / CSE
7
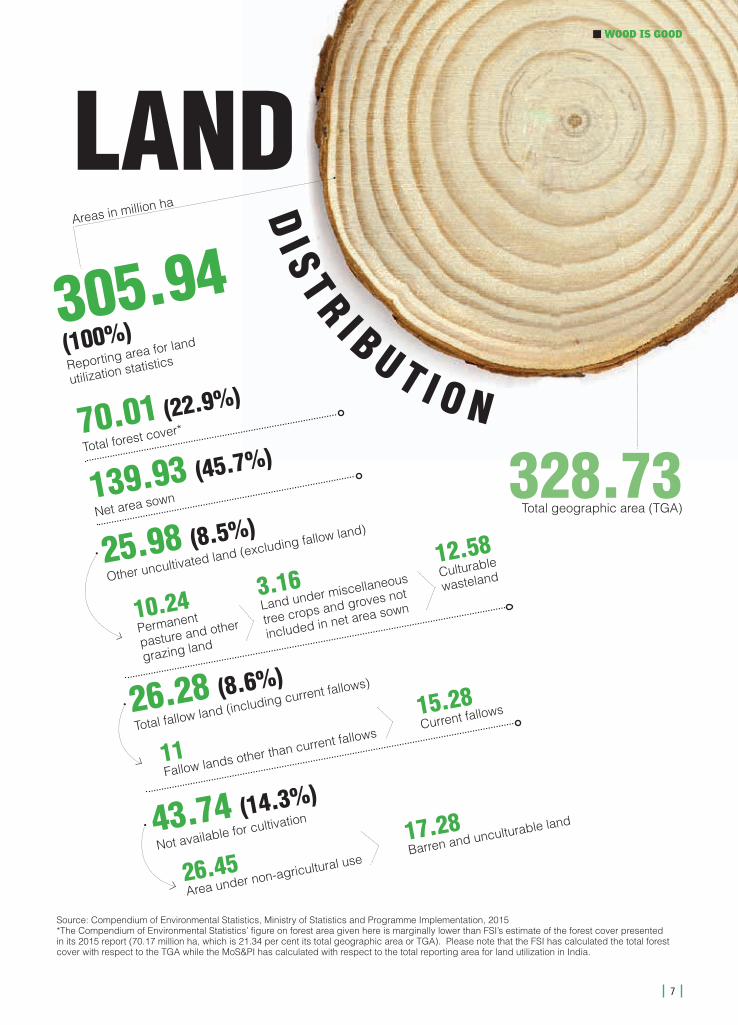
LANDAreas in million ha D
I S T R I B U T I O N
328.73Total geographic area (TGA)
305.94 (100%)Reporting area for land
utilization statistics
70.01 (22.9%)
Total forest cover*
139.93 (45.7%)
Net area sown
25.98 (8.5%)
Other uncultivated land (excluding fallow land)
26.28 (8.6%)
Total fallow land (including current fallows)
43.74 (14.3%)
Not available for cultivation
11Fallow lands other than current fallows
15.28Current fallows
26.45Area under non-agricultural use
17.28Barren and unculturable land
10.24Permanent
pasture and other
grazing land
3.16Land under miscellaneous
tree crops and groves not
included in net area sown
12.58Culturable
wasteland
Source: Compendium of Environmental Statistics, Ministry of Statistics and Programme Implementation, 2015*The Compendium of Environmental Statistics’ figure on forest area given here is marginally lower than FSI’s estimate of the forest cover presented in its 2015 report (70.17 million ha, which is 21.34 per cent its total geographic area or TGA). Please note that the FSI has calculated the total forest cover with respect to the TGA while the MoS&PI has calculated with respect to the total reporting area for land utilization in India.
WOOD IS GOOD

8
TOTAL WOOD AND BAMBOO BALANCEFlow diagram of annual timber availability and consumption in India
A V A I L A B I L I T YIn million cum
C O N S U M P T I O NIn million cum
3.175Natural forests
48Construction, furniture and agricultural implements
8.47Plywood and panel
12.52Paper and paperboard
44.34Trees outside
forests
5.38Bamboo
18.01Imports
70.9 68.9
Auctions
Wood markets-
individuals traders and merchant associations
Ports

WOOD IS GOOD
9
WOOD PRODUCTION
Annual estimated wood production in India (In million cum)
The growing stock of TOF has remained almost static across recent decades, so it can be assumed that timber production from TOF has also remained static or grown marginally—considering a marginal growth of 25 million cum in the 2015 assessment over the 2011 assessment (TOF growing stock in 2015 was 1,573 million cum).4 & 5
Timber production from TOF is almost 14 times that from forests nearly two-thirds of which come from Forest Development Corporations (FDCs). In addition, we have 5.38 million cum of annual bamboo production, which is also used as a substitute for timber and in the cottage industry.6
According to the FAO’s 2015 report on Global Forest Assessment, the total wood extracted in India in 2011 was 434.77 million cum, out of which the fuelwood volume was 385.25 million cum or 231.15 million tonnes.7
1.205Estimated
production of timber from
forests (excluding FDCs)a
1.97Timber production from Forest Development Corporations (FDCs)b
44.34Annual production of timber from TOFc
5.38Bamboo production in Indiad
18.01Imports (All timber and allied products in 2015)e
385.25Fuelwood productionf
456.15Total wood production
70.9Total timber production (excluding fuelwood)
Sources: a) ISFR, FSI, 2011 (b) Puzzle of Forest Productivity, CSE, 2016 (c) FSRI, (ICFRE), 2010 (d) National Bamboo Mission, (e) International Trade Centre/UN COMTRADE, 2016 (f) Global Forest Resources Assessment,(FAO), 2015
10
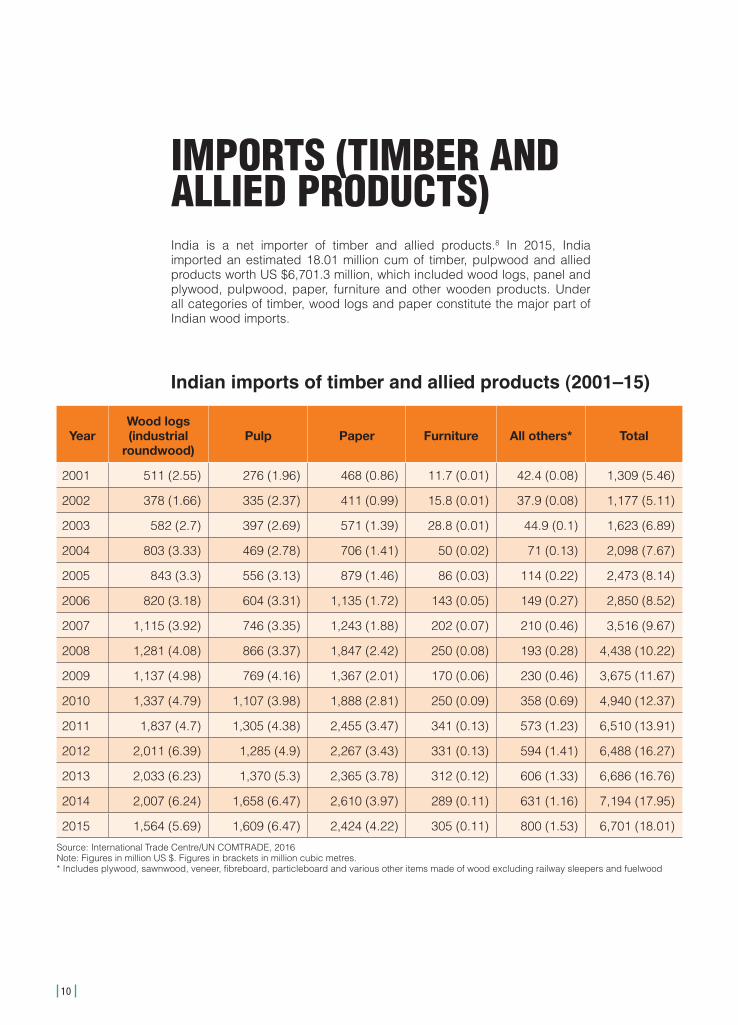
YearWood logs (industrial
roundwood)Pulp Paper Furniture All others* Total
2001 511 (2.55) 276 (1.96) 468 (0.86) 11.7 (0.01) 42.4 (0.08) 1,309 (5.46)
2002 378 (1.66) 335 (2.37) 411 (0.99) 15.8 (0.01) 37.9 (0.08) 1,177 (5.11)
2003 582 (2.7) 397 (2.69) 571 (1.39) 28.8 (0.01) 44.9 (0.1) 1,623 (6.89)
2004 803 (3.33) 469 (2.78) 706 (1.41) 50 (0.02) 71 (0.13) 2,098 (7.67)
2005 843 (3.3) 556 (3.13) 879 (1.46) 86 (0.03) 114 (0.22) 2,473 (8.14)
2006 820 (3.18) 604 (3.31) 1,135 (1.72) 143 (0.05) 149 (0.27) 2,850 (8.52)
2007 1,115 (3.92) 746 (3.35) 1,243 (1.88) 202 (0.07) 210 (0.46) 3,516 (9.67)
2008 1,281 (4.08) 866 (3.37) 1,847 (2.42) 250 (0.08) 193 (0.28) 4,438 (10.22)
2009 1,137 (4.98) 769 (4.16) 1,367 (2.01) 170 (0.06) 230 (0.46) 3,675 (11.67)
2010 1,337 (4.79) 1,107 (3.98) 1,888 (2.81) 250 (0.09) 358 (0.69) 4,940 (12.37)
2011 1,837 (4.7) 1,305 (4.38) 2,455 (3.47) 341 (0.13) 573 (1.23) 6,510 (13.91)
2012 2,011 (6.39) 1,285 (4.9) 2,267 (3.43) 331 (0.13) 594 (1.41) 6,488 (16.27)
2013 2,033 (6.23) 1,370 (5.3) 2,365 (3.78) 312 (0.12) 606 (1.33) 6,686 (16.76)
2014 2,007 (6.24) 1,658 (6.47) 2,610 (3.97) 289 (0.11) 631 (1.16) 7,194 (17.95)
2015 1,564 (5.69) 1,609 (6.47) 2,424 (4.22) 305 (0.11) 800 (1.53) 6,701 (18.01)
Source: International Trade Centre/UN COMTRADE, 2016Note: Figures in million US $. Figures in brackets in million cubic metres.* Includes plywood, sawnwood, veneer, fibreboard, particleboard and various other items made of wood excluding railway sleepers and fuelwood
IMPORTS (TIMBER AND ALLIED PRODUCTS)India is a net importer of timber and allied products.8 In 2015, India imported an estimated 18.01 million cum of timber, pulpwood and allied products worth US $6,701.3 million, which included wood logs, panel and plywood, pulpwood, paper, furniture and other wooden products. Under all categories of timber, wood logs and paper constitute the major part of Indian wood imports.
Indian imports of timber and allied products (2001–15)

WOOD IS GOOD
11
Annual estimated wood consumption in India (In million cum)
WOOD CONSUMPTIONIn its 2011 assessment, FSI has provided the estimates of consumption of timber in only three sectors (in non-fuelwood categories)—housing, furniture and agricultural implements.9
Adding all categories, the total estimated wood consumption (excluding fuelwood) in India comes to about 69 million cum per year. This may be a gross underestimation, considering that a large share of wood markets, especially panel and plywood, and furniture markets, are fairly unorganized, and no official estimates are available for the same.
Fuelwood alone amounts to approximately 90 per cent total wood production in India.10 It is still the dominant energy source in rural India, which indicates the paucity of alternatives in the countryside.
48Construction, furniture and
agricultural implements (RWE)a
8.47Plywood and panelb
12.52Paper, paperboard and newsprintc
333Fuelwoodd
402Total annual wood consumption
69Total annual timber consumption
Sources: (a) & (d) ISFR, FSI, 2011 (b) Association of Furniture Manufacturer & Traders, 2016 (c) CPPRI, 2016

12
YearWood logs (industrial
roundwood)Pulp Paper Furniture All others* Total
2001 1.09 (0.03) 1.87 (0.01) 183 (0.33) 34.56 (0.02) 29.16 (0.04) 250 (0.4)
2002 2.13 (0.01) 0.24 (0.003) 248 (0.45) 43.8 (0.02) 40.44 (0.06) 334 (0.5)
2003 2.92 (0.01) 0.71 (0.001) 241 (0.41) 81 (0.04) 46.78 (0.07) 372 (0.5)
2004 1.64 (0.004) 1.19 (0.003) 307 (0.5) 165 (0.07) 81 (0.1) 556 (0.7)
2005 2.19 (0.01) 1.28 (0.004) 418 (0.66) 206 (0.09) 97 (0.13) 724 (0.9)
2006 4.36 (0.02) 1.08 (0.003) 435 (0.65) 248 (0.11) 116 (0.09) 804 (0.9)
2007 2.15 (0.02) 2.78 (0.01) 449 (0.62) 319 (0.16) 147 (0.14) 921 (0.9)
2008 2.98 (0.01) 1.71 (0.01) 573 (0.78) 301 (0.13) 174 (0.19) 1,052 (1.1)
2009 1.76 (0.03) 1.71 (0.004) 538 (0.73) 225 (0.07) 145 (0.34) 911 (1.2)
2010 1.62 (0.004) 1.06 (0.004) 784 (0.19) 311 (0.1) 162 (0.1) 1,260 (0.4)
2011 2.54 (0.01) 1.02 (0.0005) 907 (1.39) 372 (0.14) 218 (0.2) 1,501 (1.7)
2012 1.92 (0.02) 2.83 (0.01) 930 (1.15) 432 (0.27) 256 (0.22) 1,623 (1.7)
2013 2.11 (0.01) 0.16 (0.0002) 1,1340 (1.34) 494 (0.16) 348 (0.27) 1,985 (1.8)
2014 4.70 (0.01) 4.71 (0.01) 1,116 (1.36) 467 (0.14) 349 (0.28) 1,941 (1.8)
2015 82 (2.17) 10.93 (0.02) 1,128 (1.41) 467 (0.13) 344 (0.22) 2,032 (3.9)
Source: International Trade Centre/UN COMTRADE, 2016Note: Figures in million US $. Figures in brackets in million cubic metres.* Includes plywood, sawnwood, veneer, fibreboard, particleboard and various other items made of wood excluding railway sleepers and fuelwood
EXPORTS (TIMBER AND ALLIED PRODUCTS)Paper and paperboard, and furniture are the categories in which India exports most of its timber products. Indian exports of wood logs from 2001 to 2015 have been extremely low in comparison with its imports under the same category, except in 2015, when India imported over two million cum of confiscated Red Sanders wood worth $80 million.
Indian exports of timber and allied products (2001–15)
WOOD IS GOOD
13
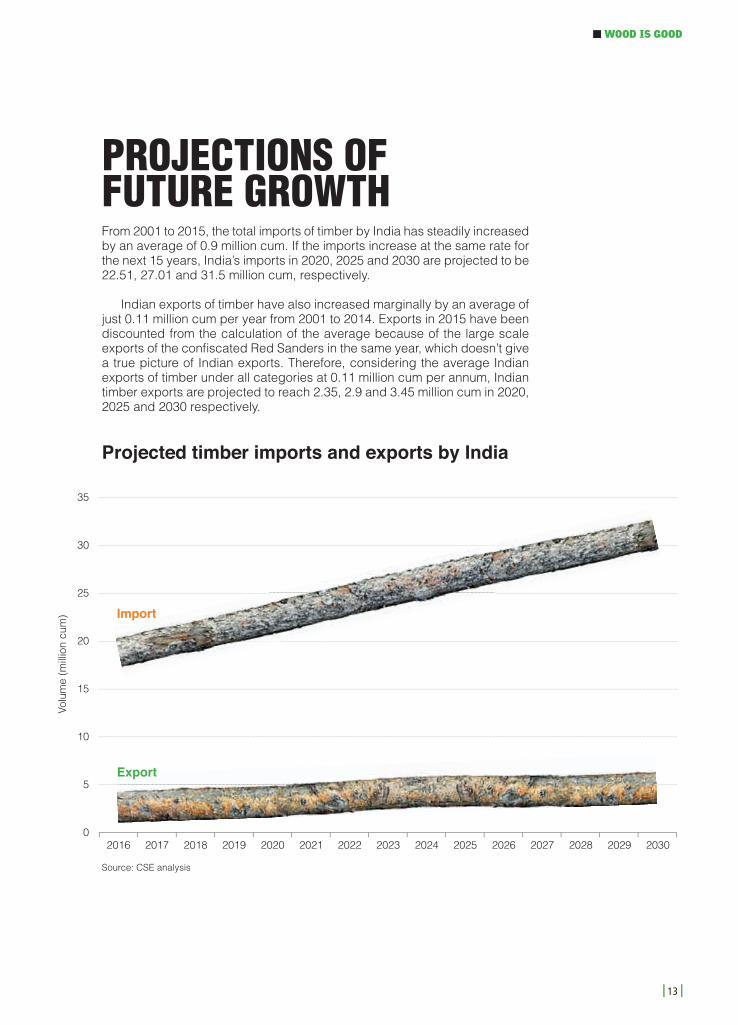
PROJECTIONS OF FUTURE GROWTHFrom 2001 to 2015, the total imports of timber by India has steadily increased by an average of 0.9 million cum. If the imports increase at the same rate for the next 15 years, India’s imports in 2020, 2025 and 2030 are projected to be 22.51, 27.01 and 31.5 million cum, respectively.
Indian exports of timber have also increased marginally by an average of just 0.11 million cum per year from 2001 to 2014. Exports in 2015 have been discounted from the calculation of the average because of the large scale exports of the confi scated Red Sanders in the same year, which doesn’t give a true picture of Indian exports. Therefore, considering the average Indian exports of timber under all categories at 0.11 million cum per annum, Indian timber exports are projected to reach 2.35, 2.9 and 3.45 million cum in 2020, 2025 and 2030 respectively.
Source: CSE analysis
Projected timber imports and exports by India
Volu
me
(mill
ion
cum
)
2016 2017 2018 2019 2020 2021 2022 2023 2024 2025 2026 2027 2028 2029 2030
35
30
25
20
15
10
5
0
Import
Export

14
WOODIN INDIAPRODUCTION
KUMAR SAMBHAV SHRIVASTAVA / CSE

WOOD IS GOOD
15
TIMBER PRODUCTION FROM FORESTS Indian forests are vulnerable to fires, illegal grazing and overexploitation. Changing land use patterns are nibbling away at their already fragile edges. A 1996 Supreme Court judgment banning felling may have been necessary, but led to further decline in forest productivity.1 At only 0.045 cum per hectare a year, the productivity of Indian forests is paltry compared to the world average of 2.1 cum per year.2&3 To make matters worse, India only has 0.06 ha per capita forest area, while the world average is 0.6 ha.4
The average annual production of timber by Forest Development Corporations (FDCs) is 1.97 million cum, and makes up a significant part of the total from forests (3.175 million cum). FDCs have not been able to fulfil the dream of raising the productivity of Indian forests. At 0.77 cum per ha, their annual productivity does not compare with that of TOF (3.06 cum per ha).5
Wood production from state FDCs
Andhra Pradesh
Chhattisgarh
Gujarat
Haryana
Himachal Pradesh
Jammu and Kashmir
Karnataka
Kerala
Madhya Pradesh
Maharashtra
Odisha
Punjab
Tamil Nadu
Tripura
Uttar Pradesh
Uttarakhand
West Bengal
Source: Puzzle of Forest Productivity, Centre for Science and Environment, 2016
Average volume of wood produced/harvested (in cum per year)
T O T A L P R O D U C T I O N
1,969,854
234,942
8,40053,360
153,00050,000
152,22842,336
90,00032,60038,000
52,650328,951
2,300320,000
217,380153,000
40,707

16
TIMBER PRODUCTION FROM TOF
State-wise annual production of timber from forests and TOF
A. States/UT
B. Recorded
Forest Area (Sq
Km)
C. Volume of Growing Stock (million cum)
D. Annual Production of timber
from Forests (thousand
cum)
E. Annual production of timber from
TOF (thousand cum)
F. Total Annual Timber
production (thousand
cum) (D + E)In Forests In TOF Total
Andhra Pradesh + Telangana
64,162 206 102 307 138 2,360 2,498
Arunachal Pradesh
51,407 413 89 502 64 810 874
Assam 26,832 144 33 177 25 810 835
Bihar 6,493 29 37 67 7 2,180 2,187
Chhattisgarh 59,772 363 82 445 397 2,060 2,457
Delhi 102 - - - - 0 0
Goa 1,225 9 4 13 - 20 20
Gujarat 21,647 52 113 165 99 4,920 5,019
Haryana 1,559 5 15 21 108 1,900 2,008
Himachal Pradesh 37,033 318 21 339 231 670 901
Jammu and Kashmir 20,230 237 147 384 55 840 895
Jharkhand 23,605 123 61 184 13 1,510 1,523
Karnataka 38,284 297 87 384 49 2,090 2,139
Kerala 11,309 155 49 204 68 1,010 1,078
Madhya Pradesh 94,689 277 92 369 397 2,680 3,077
Maharashtra 61,579 227 156 383 203 3,530 3,733
WOOD IS GOOD
17
A. States/UT
B. Recorded
Forest Area (Sq
Km)
C. Volume of Growing Stock (million cum)
D. Annual Production of timber
from Forests (thousand
cum)
E. Annual production of timber from
TOF (thousand cum)
F. Total Annual Timber
production (thousand
cum) (D + E)In Forests In TOF Total
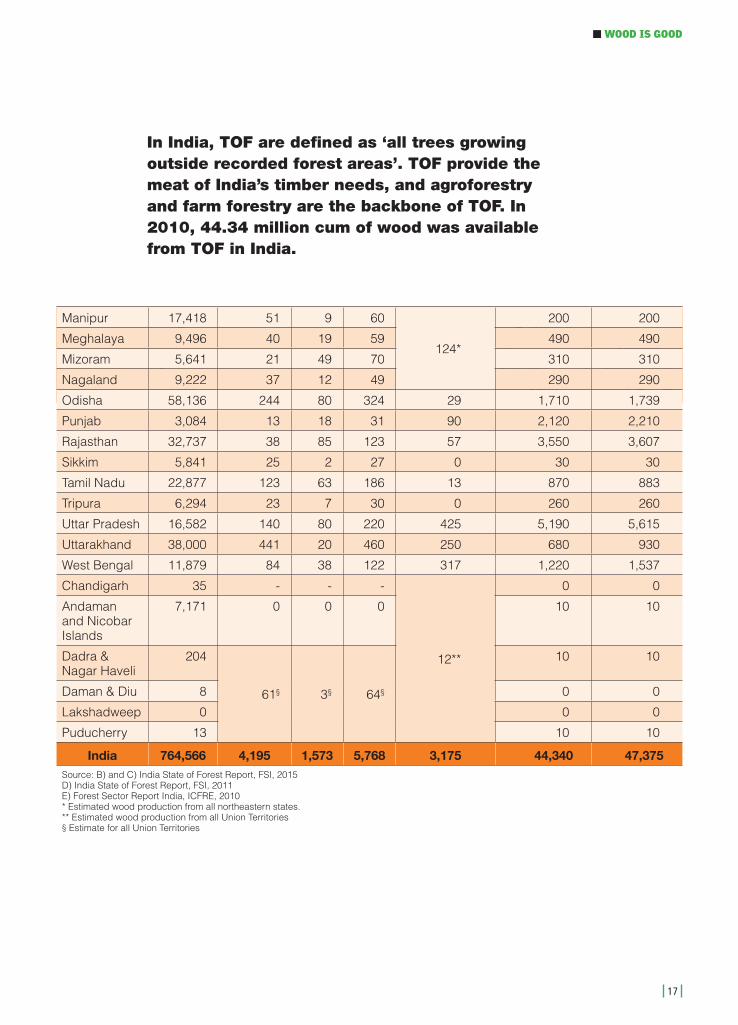
Manipur 17,418 51 9 60
124*
200 200
Meghalaya 9,496 40 19 59 490 490
Mizoram 5,641 21 49 70 310 310
Nagaland 9,222 37 12 49 290 290
Odisha 58,136 244 80 324 29 1,710 1,739
Punjab 3,084 13 18 31 90 2,120 2,210
Rajasthan 32,737 38 85 123 57 3,550 3,607
Sikkim 5,841 25 2 27 0 30 30
Tamil Nadu 22,877 123 63 186 13 870 883
Tripura 6,294 23 7 30 0 260 260
Uttar Pradesh 16,582 140 80 220 425 5,190 5,615
Uttarakhand 38,000 441 20 460 250 680 930
West Bengal 11,879 84 38 122 317 1,220 1,537
Chandigarh 35 - - -
12**
0 0
Andaman and Nicobar Islands
7,171 0 0 0 10 10
Dadra & Nagar Haveli
204
61§ 3§ 64§
10 10
Daman & Diu 8 0 0
Lakshadweep 0 0 0
Puducherry 13 10 10
India 764,566 4,195 1,573 5,768 3,175 44,340 47,375Source: B) and C) India State of Forest Report, FSI, 2015 D) India State of Forest Report, FSI, 2011 E) Forest Sector Report India, ICFRE, 2010 * Estimated wood production from all northeastern states.** Estimated wood production from all Union Territories§ Estimate for all Union Territories
In India, TOF are defined as ‘all trees growing outside recorded forest areas’. TOF provide the meat of India’s timber needs, and agroforestry and farm forestry are the backbone of TOF. In 2010, 44.34 million cum of wood was available from TOF in India.

18
AGROFORESTRY AND FARM FORESTRYAs per a 2013 estimate by FSI, the total tree cover under agroforestry systems is 111,554 km2, i.e., 3.39 per cent of the TGA of India.6 In terms of volume, the major species under agroforestry systems in India are Mangifera indica, followed by Azadirachta indica, Borassus flabelliformis, Madhuca latifolia and Cocos nucifera.7 In terms of geographical spread, the major species of trees are Teak and Eucalyptus, Poplar, Casuarina and Leucaena leucocephala.8
The agroforestry sector has been fulfilling most of the wood as well as fuelwood demands in India (Plywood: 80 per cent, Paper: 60 per cent).9
Over the decades, market saturation, farmers not being paid remunerative prices by the paper mills, and legal restrictions on the transport and sale of wood have doused the initial enthusiasm.10 &11 If farm forestry is to be revived to feed the growing timber hunger of Indian industry, dishonest middlemen need to be weeded out and the legal processes involved in the growing, sale and transport of wood need to be smoothened.
Species-wise volume of trees under agro-forestry systems in India
Species-wise number of stems under agroforestry system in India (number in thousand)
Species
Total volume
(in million cum)
Percentage
Diameter class (cm)
Percentage10–30 30–50 50 + Total
Mangifera indica 149 13.3 255,815 60,917 28,323 345,055 9.2
Azadirachta indica 76 6.8 176,671 27,952 3,844 208,467 5.6
Borassus flabelliformis 64 5.7 18,551 74,411 1,276 94,238 2.5
Madhuca longifolia 64 5.7 6,573 6,467 11,546 24,586 0.7
Cocos nucifera 60 5.3 168,423 43,238 101 211,762 5.7
Rest of the species 711 63.2 2,526,692 267,703 52,867 2,847,262 76
Total 1,124 100 3,152,725 480,688 97,957 3,731,370 100Source: India State of Forest Report, FSI, 2013
Species-wise volume of trees and number of stems under agroforestry systems in India

WOOD IS GOOD
19
Agroforestry areas in India (in million ha)
Agroforestry area as per CAFRI & BHUVAN LISS III (13.75 mha)
Agroforestry area as per Forest Survey of India, 2013 (11.15 mha)
J&K0.090.27
Himachal Pradesh0.030.23
Uttarakhand0.070.2
Uttar Pradesh1.860.71
Bihar0.760.46
Sikkim0.0070.04
Arunachal Pradesh0.020.26
Nagaland0.0020.1Manipur0.0020.1Mizoram0.0020.1
Tripura0.0020.1Meghalaya0.0020.1Assam0.0020.1
West Bengal0.380.4
Jharkhand0.340.29
Odisha0.570.51
Chhattishgarh0.600.45
Andhra Pradesh + Telangana1.17 0.82
Tamil Nadu0.650.46
Kerala0.690.38
Goa0.690.34
Maharashtra1.611.18
Gujarat0.811.16
Madhya Pradesh1.176.67
Rajasthan1.550.84
Delhi0.0050.005
Punjab0.410.16Haryana0.0090.13
Karnataka0.930.61
Source: Chavan et al (2015), CAFRI, Jhansi, Indian Council of Agricultural Research.
20
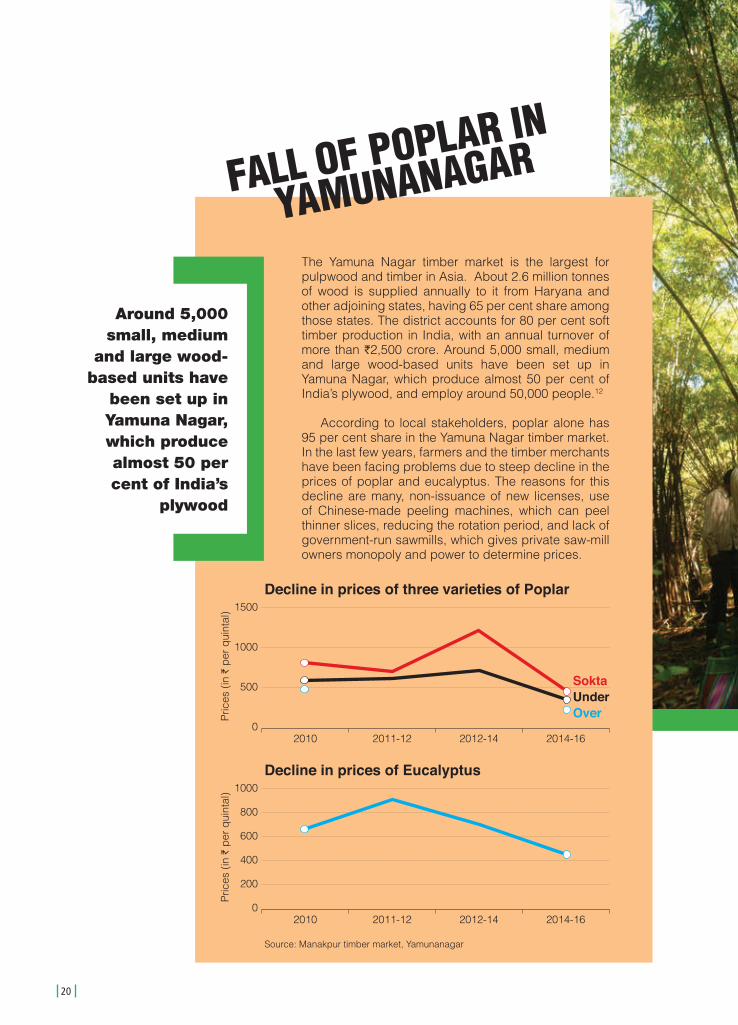
The Yamuna Nagar timber market is the largest for pulpwood and timber in Asia. About 2.6 million tonnes of wood is supplied annually to it from Haryana and other adjoining states, having 65 per cent share among those states. The district accounts for 80 per cent soft timber production in India, with an annual turnover of more than I2,500 crore. Around 5,000 small, medium and large wood-based units have been set up in Yamuna Nagar, which produce almost 50 per cent of India’s plywood, and employ around 50,000 people.12
According to local stakeholders, poplar alone has 95 per cent share in the Yamuna Nagar timber market. In the last few years, farmers and the timber merchants have been facing problems due to steep decline in the prices of poplar and eucalyptus. The reasons for this decline are many, non-issuance of new licenses, use of Chinese-made peeling machines, which can peel thinner slices, reducing the rotation period, and lack of government-run sawmills, which gives private saw-mill owners monopoly and power to determine prices.
Around 5,000 small, medium
and large wood-based units have
been set up in Yamuna Nagar, which produce almost 50 per cent of India’s
plywood
FALL OF POPLAR IN
YAMUNANAGAR
Source: Manakpur timber market, Yamunanagar
Decline in prices of three varieties of Poplar
Pric
es (
in I
per
qui
ntal
)
2010 2011-12 2012-14 2014-16
1500
1000
500
0
Decline in prices of Eucalyptus
Pric
es (
in I
per
qui
ntal
)
2010 2011-12 2012-14 2014-16
1000
800
600
400
200
0
SoktaUnderOver

WOOD IS GOOD
21
Bamboo is a valuable forest resource with immense potential as it grows fast and supports local economies. India has great potential to bend it like bamboo, but is held back by problems, including those in its value chains, regulatory and legislative barriers to cultivation and harvesting of bamboo, difficulties in its procurement, lack of technical knowledge among the primary users of bamboo, and insufficient market linkages. In addition, different regulatory bodies do not seem to have a unified view on whether bamboo is a ‘tree’ or a ‘minor forest produce’. Better definitions, and smoother laws, can help India spread a prosperous canvas over its flourishing tall bamboo.
BAMBOO
B A M B O O F A C T S
23,297Number of culms in India
79%Green sound
15.4%Bamboo growing on private landsc
16%Dry sound
5%Decayeda
3.23MTAnnual productionb
5.38MILLION CUMin volume (density 600 kg/m3)
KU
MA
R S
AM
BH
AV S
HR
IVA
STA
VA /
CS
E
Source: (a) ISFR, FSI, 2011 (b) National Bamboo Mission (c) A. Baksy, 2013, Centre for Civil Society, New Delhi

22
WOODIN INDIA
FUELWOODCONSUMPTION
Almost nine-tenths of all wood produced in India is consumed as fuelwood.1 Wood is a major
source of energy for cooking in Indian households, mainly in rural areas, and meets around
60 per cent of all domestic energy needs of the country.2
The annual consumption of fuelwood in India is 332.95 million cum (216.42 million
tonnes) (per capita about 17.7 kg in rural and 6.3 kg in urban areas). About 853.87 million
Indians make use of this source of energy. Out of this, about 200 million people source
nearly 90.4 million cum (58.75 million tonnes) of fuelwood from forests alone.3
In recent years, the number of people dependent on fuelwood has been increasing at
a rate slower than the rate of population growth.4 This provides a golden opportunity to the
government to promote alternative sources of energy in the rural landscape.
RAMAKANT DEY / CSE

WOOD IS GOOD
23
State/ Union Territory Total fuelwood (million tonnes)
Fuelwood from forests (million tonnes)
Fuelwood from TOF (million tonnes)
Andhra Pradesh + Telangana 24.3 3 21.3
Arunachal Pradesh 0.4 0.3 0.1
Assam 11.4 2.5 8.9
Bihar 11.5 0.5 11
Chhattisgarh 4.4 1.4 3
Gujarat 9.7 2.2 7.5
Haryana 1.5 0 1.5
Himachal Pradesh 1.2 1.2 0.1
Jammu and Kashmir 1.4 1 0.4
Jharkhand 4.8 2.9 2
Karnataka 21 5.8 15.2
Kerala 14.5 2.2 12.4
Madhya Pradesh 13.7 7.2 6.5
Maharashtra 9.5 4.5 5
Odisha 8.9 3 5.9
Punjab 3.4 0 3.3
Rajasthan 18.8 3.7 15.1
Tamil Nadu 12.4 2.6 9.8
Uttar Pradesh 19.1 1.3 17.8
Uttarakhand 2.6 2.1 0.4
West Bengal 14.2 6.4 7.8
Northeastern states 5.3 3.8 1.5
Union Territories 2.6 1.3 1.4
Total 216.4 58.8 157.7
Percentage 100 27 73Source: India State of Forest Report, FSI, 2011
State-wise annual fuelwood consumption
Declining dependence of Indian population on forests
Source: India Forestry Outlook Study by FAO, 2009
Pro
duc
tion
(bill
ion)
Dep
end
ency
(%
)
2016 2017 2018 2019 2020 2021 2022
1.6
1.4
1.2
1.0
0.8
0.6
0.4
0.2
0.0
44
42
40
38
36
34
32
30
Dependency
Production

24
TIMBERCurrently, the best estimates of state-wise wood consumption under non-fuelwood category are available only for three industrial sectors: housing, furniture and agricultural implements. The combined annual consumption of timber in the three categories, is 33.61 million cum, the roundwood equivalent (RWE) of which is 48 million cum.5 These calculations are made assuming a wood lifespan of 20 years in construction, 15 years in household furniture, 10 years in commercial furniture, and five years in agricultural implements.6
State/ Union Territory
House construction Furniture Agricultural
implements Total Percentage
Andhra Pradesh 23.4 3.2 2.1 28.6 6.8
Arunachal Pradesh 0.7 0.1 0 0.8 0.2
Assam 7.7 2.8 0.5 11 2.6
Bihar 9.2 3.0 0.3 12.5 3
Chhattisgarh 12.0 0.9 0.9 13.8 3.3
Gujarat 27.5 2.4 0.3 30.2 7.2
Haryana 5.9 1.5 0.5 7.9 1.9
Himachal Pradesh 5.7 0.5 0.1 6.3 1.5
Jammu and Kashmir 5.3 1.1 0.1 6.4 1.5
Jharkhand 4.9 0.9 0.3 6.1 1.5
Karnataka 17.9 1.9 2.6 22.5 5.3
Kerala 15.2 3.3 NA 18.5 4.4
Madhya Pradesh 26.3 1.8 1.8 29.8 7.1
Maharashtra 55.6 4.6 5.1 65.3 15.5
Odisha 7.1 1.3 0.4 8.8 2.1
Punjab 9.2 3.4 0.8 13.4 3.2
Rajasthan 10.4 1.6 0.7 12.6 3.0
Tamil Nadu 18.5 2.5 0.2 21.1 5.0
Uttar Pradesh 42 15.1 4.3 61.4 14.6
Uttarakhand 4.8 0.5 0.1 5.4 1.3
West Bengal 14.6 4.1 0.5 19.2 4.6
Northeastern states 5 1.1 0.0 6.1 1.5
Union Territories 11.6 0.9 0.0 12.6 3.0
Total 340.2 58.5 21.6 420.3 100Source: India State of Forest Report, FSI, 2011*Figures in this table do not represent annual consumption
Consumption of timber under three major categories*
WOOD IS GOOD
25
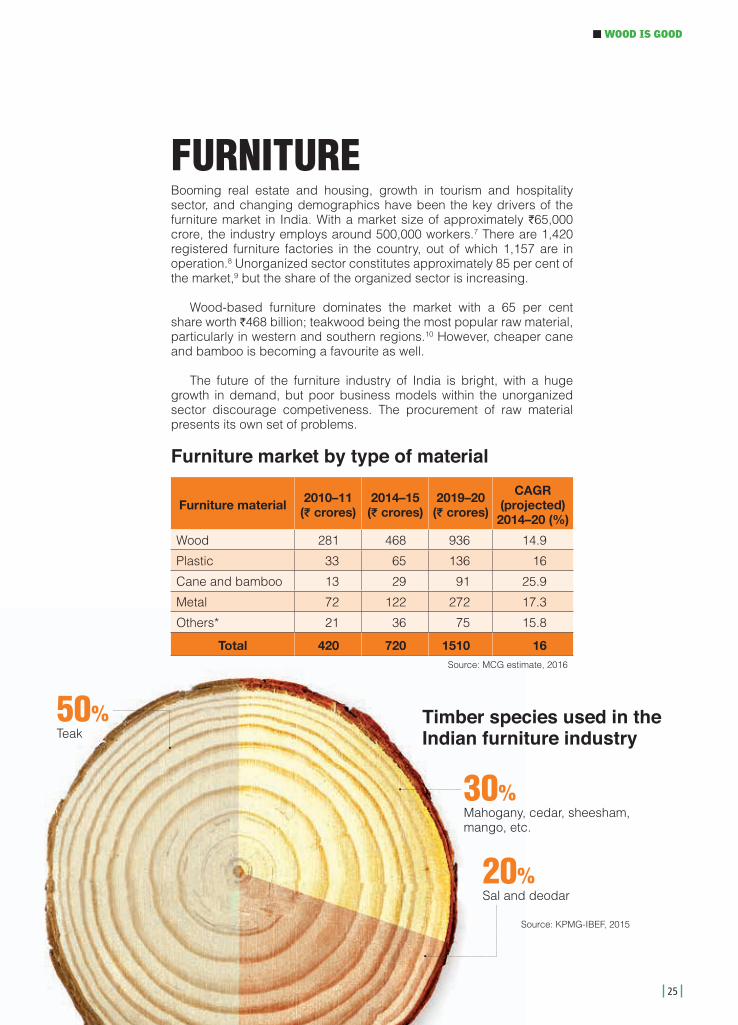
FURNITUREBooming real estate and housing, growth in tourism and hospitality sector, and changing demographics have been the key drivers of the furniture market in India. With a market size of approximately I65,000 crore, the industry employs around 500,000 workers.7 There are 1,420 registered furniture factories in the country, out of which 1,157 are in operation.8 Unorganized sector constitutes approximately 85 per cent of the market,9 but the share of the organized sector is increasing.
Wood-based furniture dominates the market with a 65 per cent share worth I468 billion; teakwood being the most popular raw material, particularly in western and southern regions.10 However, cheaper cane and bamboo is becoming a favourite as well.
The future of the furniture industry of India is bright, with a huge growth in demand, but poor business models within the unorganized sector discourage competiveness. The procurement of raw material presents its own set of problems.
Furniture material 2010–11 (K crores)
2014–15 (K crores)
2019–20 (K crores)
CAGR (projected)
2014–20 (%)
Wood 281 468 936 14.9
Plastic 33 65 136 16
Cane and bamboo 13 29 91 25.9
Metal 72 122 272 17.3
Others* 21 36 75 15.8
Total 420 720 1510 16Source: MCG estimate, 2016
Furniture market by type of material
Timber species used in the Indian furniture industry
30%Mahogany, cedar, sheesham, mango, etc.
20%Sal and deodar
50%Teak
Source: KPMG-IBEF, 2015

26
PLYWOOD AND PANEL
PAPER AND PULP
The Indian plywood and panel market is largely unorganized. The organized sector is estimated to be worth I4,500 crore (US$ 672 million), the total market being worth I15,000 crore (US$ 2.24 billion).11 Two companies—Century Plyboards and Greenply Industries—dominate the organized sector, together constituting around 50 per cent of the market share.12 Other key players in the market are National Plywood Industries Ltd, Kitply Industries Ltd, Sarda Plywood Industries Ltd and Mayur Plywood.
Most of the manufactured plywood and panel ends up in the furniture, modular kitchen, and wood flooring markets. There has been a boom in these markets in the last 15–20 years due to growth in the real estate sector.13
With the rise in demand steadying at around 8 per cent, India is considered the fastest growing paper market in the world.14 The annual per capita consumption of paper is projected to increase to 17 kg by 2020, from the current per capita consumption of 13.2 kg.15
Indian paper industry is fragmented, consisting of 813 small, medium and large paper mills having capacities ranging from 10 to 1,500 tonnes per day (tpd). Of them, only 31 are reported to be using wood-based raw material, the rest use agricultural by-products and recycled waste paper and fibre.16 Large integrated papermills
have a production share of around 26 per cent. The industry produces 14.99 million tonnes of paper annually, which is 3.7 per cent world’s production, and consumes 29.64 million tonnes of wood-, agriculture- and recycled fibre-based raw material.17
The paper industry has strong backward linkages and has established a system for sourcing 60 per cent of the raw material from agroforestry and social forestry. Yet, availability of quality raw material remains a challenge because India is a fibre-deficient country. There is not enough land for captive pulpwood plantations, and gestation periods are long. Some of these issues can be resolved by making use of cultivable wastelands (12.65 million ha) and total fallow lands (24.58 million ha), which can provide much more than what the industry seeks, if proper supply channels for wood are established between the industry and the farm and agroforesters.18
SUNITA NARAIN / CSE

WOOD IS GOOD
27
Type of mills
No. of mills
Raw material
Consumption (million tonnes)
Production (million tonnes)
Wood-based (large integrated)
31 Wood pulp 8.7
Writing/ printing grade 2.67
3.54Packaging grade 0.85
Newsprint grade 0.02
Agro-based (medium-scale)
135Bagasse 5.8
Writing/ printing Grade 0.54
1.61Packaging grade 1.07
Wheat straw 2.6 Newsprint grade 0
Recycled fi bre-based (medium- and small-scale)
647 Waste paper 12.5
Writing/ printing Grade 2
9.84Packaging grade 6.37
Newsprint grade 1.47
Total 813 29.6 14.99Source: CPPRI, 2016
Varieties of paper made from different raw materials
Growth of the paper industry, 2010–15
Source: CPPRI, 2016
2010-11 2011-12 2012-13 2013-14 2014-15
Pro
du
ctio
n (
MM
T)
Cap
acit
y (M
MT
)
10.11 10.9
13.3214.24 14.99
12.713.55 13.9
17.04
19.72
28
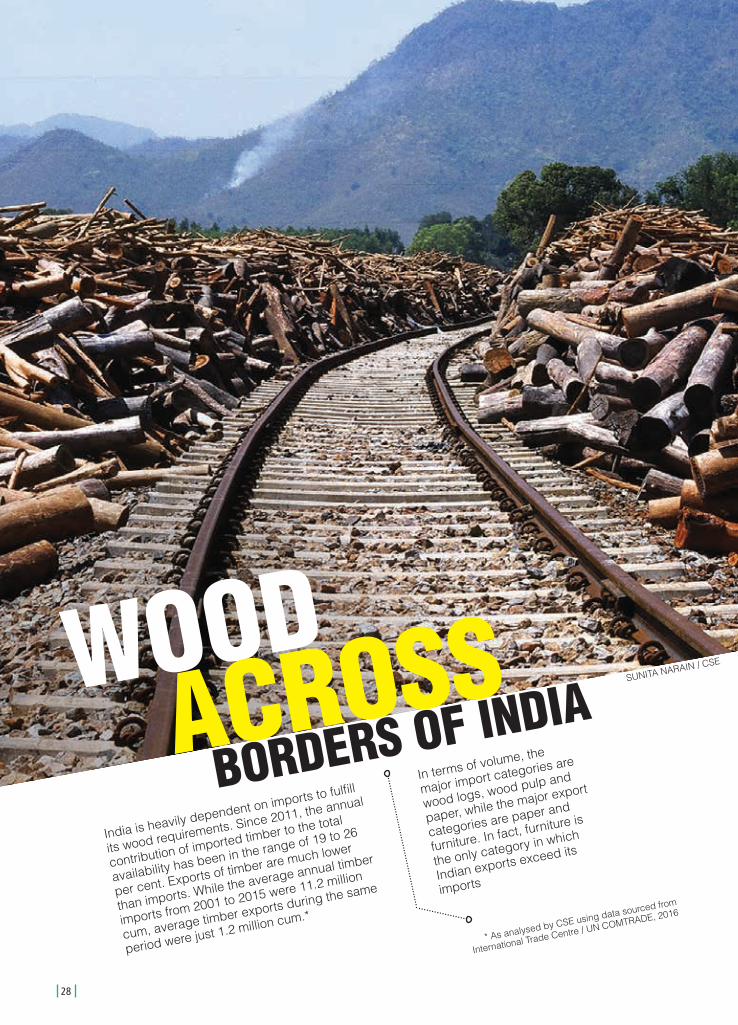
WOODBORDERS OF INDIAACROSS
India is heavily dependent on imports to fulfill
its wood requirements. Since 2011, the annual
contribution of imported timber to the total
availability has been in the range of 19 to 26
per cent. Exports of timber are much lower
than imports. While the average annual timber
imports from 2001 to 2015 were 11.2 million
cum, average timber exports during the same
period were just 1.2 million cum.*
In terms of volume, the
major import categories are
wood logs, wood pulp and
paper, while the major export
categories are paper and
furniture. In fact, furniture is
the only category in which
Indian exports exceed its
imports
* As analysed by CSE using data sourced from
International Trade Centre / UN COMTRADE, 2016
SUNITA NARAIN / CSE

WOOD IS GOOD
29
Composition of timber imports and exports in 2015
TimberPer cent imports Per cent exports
By value By quantity By value By quantity
Plywood (HS Code: 4412) 1 0.5 0.8 1.4
Wood logs (Industrial roundwood) (HS Code: 4403) 29.6 37.8 0.7 12.8*
Sawn wood (HS Code: 4407) 2.0 1.1 1.4 1.5
Veneer (HS Code: 4408) 0.9 0.8 1.3 1.3
Fibreboard (HS Code: 4411) 1.2 1.4 0.7 1.1
Particleboard (HS Code: 4410) 0.8 1.0 0.2 0.3
Wood pulp (HS Code: 47) 21.6 34.8 0.2 0.4
Paper and paperboard (HS Code: 48) 36.7 21.2 57.8 64.6
Wooden furniture (HS Code: 94; sub-codes: 9401 and 9403) 4.5 0.6 25.6 8.9
All others (except fuelwood and railway sleepers) (HS Codes: 4418, 4421, 4409, 4415, 4402, 4413, 4416, 4417, 4405, 4420, 4419, 4414 and 4404)
1.6 0.9 11.3 7.7
Source: International Trade Centre/UN COMTRADE; CSE Analysis, 2016*High percentage of wood logs is an aberration here as in 2015 India exported huge volumes of confiscated Red Sanders wood, inflating the total and average of wood log export figures from 2001 to 2015.
In 2015, India imported an approximate 18.01 million cum (or 12.16 million tonnes) of timber and allied products worth US$ 6,701 million, and the import graph is steadily climbing over the past decade.
India imported an average of 11.24 million cum of timber and allied products from 2001 to 2015.
Import status of forest products at the national level
Import and export of timber by India from 2001 to 2015
2001
8000
7000
6000
5000
4000
3000
2000
1000
0
2003
Valu
e (in
mill
ion
US
D)
Qua
ntity
(in
mill
ion
cum
)
2005 2007 2009 2011 2013 2015
14
18
16
20
12
10
8
6
4
2
0
Source: International Trade Center/UN COMTRADE, 2016
Imports (Value)
Exports (Value)
Imports (Quantity)
Exports (Quantity)

30
WOOD LOGIndia and China dominate the trade in tropical roundwood. Imports declined in 2015 due to the ban on felling of tropical forests and wood log export by Myanmar.1
Imports of wood logs (industrial roundwood) from 2001 to 2015
2001
5000
4000
3000
2000
1000
0
2003
ValueValu
e (in
mill
ion
US
D)
Qua
ntity
(in
mill
ion
cum
)
Quantity
2005 2007 2009 2011 2013 2015
7.0
6.0
5.0
4.0
3.0
2.0
1.0
0.0
Source: International Trade Center/UN COMTRADE, 2016
The spike in 2015 is a result of the export of confiscated stocks of Red Sanders wood, worth US$ 81.2 million.Exports of wood logs (industrial roundwood) from 2001 to 2015
Source: International Trade Center/UN COMTRADE, 2016
Value
Quantity
2001 2003 2005 2007 2009 2011 2013 2015
908070605040302010
0
2.500
2.000
1.500
1.000
0.500
0.000
Valu
e (in
mill
ion
US
D)
Qua
ntity
(in
mill
ion
cum
)
Malaysia 512 33%
New Zealand 206 13%
Côte d'Ivoire453%
Papua New Guinea1027%
Congo 39 3%
Ghana 65 4%
Ecuador 64 4%
Costa Rica 584%
Solomon Islands694%
Cameroon443%
Value (million $) Percent imports in 2015
Source: International Trade Center/UN COMTRADE, 2016
Top ten countries exporting wood logs to India in 2015

WOOD IS GOOD
31
WOOD PULPImports of wood pulp from 2001 to 2015
2001
1800
1600
1400
1200
1000
800
600
400
200
0
2003
Value
Valu
e (in
mill
ion
US
D)
Qua
ntity
(in
mill
ion
cum
)
Quantity
2005 2007 2009 2011 2013 2015
7.0
6.0
5.0
4.0
3.0
2.0
1.0
0.0
Source: International Trade Center/UN COMTRADE, 2016
Exports of wood pulp from 2001 to 2015
2001
12
10
8
6
4
2
0
2003
Value
Valu
e (in
mill
ion
US
D)
Qua
ntity
(in
mill
ion
cum
)
Quantity
2005 2007 2009 2011 2013 2015
0.03
0.02
0.01
0.00
Source: International Trade Center/UN COMTRADE, 2016
Top ten countries exporting wood pulp to India in 2015
Source: International Trade Center/UN COMTRADE, 2016
Chile 73 5%
Saudi Arabia 32 2%
Sri Lanka342%
Canada 1439%
United Kingdom 58 4% United Arab
Emirates745%
South Africa1489%
United States of America48830%
Indonesia1016%
Sweden1197%
Value (million $) Percent imports in 2015

32
PAPER AND PAPERBOARD
Italy 112 5%
Finland 101 4%
Germany 106 4%
Sweden 123 5%Canada
174 7%
United States of America23110%
Russian Federation1797%
China 340 14%
Republic of Korea 252 10%
Indonesia 125 5%
Top ten countries exporting paper and paperboard to India in 2015
Source: International Trade Center/UN COMTRADE, 2016
Value (million $) Percent imports in 2015
Imports of paper and paperboard from 2001 to 2015
2001
3000
2500
2000
1500
1000
500
0
2003
Value
Valu
e (in
mill
ion
US
D)
Qua
ntity
(in
mill
ion
cum
)
2005 2007 2009 2011 2013 2015
4.5
4.0
3.5
3.0
2.5
2.0
1.5
1.0
0.5
0.0
Source: International Trade Center/UN COMTRADE, 2016
Quantity
Exports of paper and paperboard from 2001 to 2015
2001
1200
1000
800
600
400
200
0
2003
Value
Valu
e (in
mill
ion
US
D)
Qua
ntity
(in
mill
ion
cum
)2005 2007 2009 2011 2013 2015
1.6
1.4
1.2
1.0
0.8
0.6
0.4
0.2
0.0
Source: International Trade Center/UN COMTRADE, 2016
Quantity

WOOD IS GOOD
33
WOODEN FURNITUREChina and Malaysia are the major exporters of low-cost wooden furniture to India. Around 58 per cent imported furniture is from China.
Imports of wooden furniture from 2001 to 2015
2001
400
300
200
100
0
2003
Value
Valu
e (in
mill
ion
US
D)
Qua
ntity
(in
mill
ion
cum
)
2005 2007 2009 2011 2013 2015
0.14
0.12
0.10
0.08
0.06
0.04
0.02
0.00
Source: International Trade Center/UN COMTRADE, 2016
Quantity
Exports of wooden furniture from 2001 to 2015
2001
600
500
400
300
200
100
0
2003
Value
Valu
e (in
mill
ion
US
D)
Qua
ntity
(in
mill
ion
cum
)
2005 2007 2009 2011 2013 2015
0.30
0.25
0.20
0.15
0.10
0.05
0.00
Source: International Trade Center/UN COMTRADE, 2016
Major export destinations for Indian wooden furniture are USA, Germany, France and UK.
Quantity
Top ten countries importing wooden furniture from India in 2015
Source: International Trade Center/UN COMTRADE, 2016
Value (million $) Percent imports in 2015
United States of America 279 41%
China91%
Canada 17 3%
Australia233%
Netherlands243%
Germany 62 9%
United Arab Emirates244%
Italy81%
United Kingdom 538%
France406%

34
PLYWOOD AND PANEL
SAWNWOOD
Exports of plywood and panel from 2001 to 2015
2001
60
50
40
30
20
10
0
2003
Valu
e (in
mill
ion
US
D)
Qua
ntity
(in
mill
ion
cum
)2005 2007 2009 2011 2013 2015
Source: International Trade Center/UN COMTRADE, 2016
QuantityValue
0.10
0.08
0.06
0.04
0.02
0.00
Imports of plywood and panel from 2001 to 2015
2001
450
400
350
300
250
200
150
100
50
0
1.000.900.800.700.600.500.400.300.200.100.00
2003
Value
Valu
e (in
mill
ion
US
D)
Qua
ntity
(in
mill
ion
cum
)
Quantity
2005 2007 2009 2011 2013 2015
Source: International Trade Center/UN COMTRADE, 2016
Imports of sawnwood from 2007 to 2015
300
250
200
150
100
50
0
Valu
e (in
mill
ion
US
D)
Qua
ntity
(in
mill
ion
cum
)
2007 2008 2009 2010 2011 2012 2013 2014 2015
Source: International Trade Center/UN COMTRADE, 2016
Quantity
Value
0.500.450.400.350.300.250.200.150.100.050.00

WOOD IS GOOD
35
Exports of sawnwood from 2007 to 2015
40.0
30.0
20.0
10.0
0.00
0.06
0.04
0.02
0.00
Valu
e (in
mill
ion
US
D)
Qua
ntity
(in
mill
ion
cum
)
2007 2008 2009 2010 2011 2012 2013 2014 2015
Source: International Trade Center/UN COMTRADE, 2016
Quantity
Value
OTHER WOOD
Qua
ntity
(in
mill
ion
cum
)
Imports of all other wood (except fuelwood and railway sleepers) from 2001 to 2015
2001
160
140
120
100
80
60
40
20
0
2003
Valu
e (in
mill
ion
US
D)
2005 2007 2009 2011 2013 2015
Source: International Trade Center/UN COMTRADE, 2016
0.500.450.400.350.300.250.200.150.100.050.00
Quantity
Value
Exports of all other wood (except fuelwood and railway sleepers) from 2001 to 2015
2001 2003 2005 2007 2009 2011 2013 2015
Source: International Trade Center/UN COMTRADE, 2016
Qua
ntity
(in
mill
ion
cum
)
Valu
e (in
mill
ion
US
D)
0.30
0.25
0.20
0.12
0.10
0.05
0.00
300
250
200
150
100
50
0
Quantity
Value

36
ILLEGAL TRADE—INDIA IN THE BAD BOYS’ CLUBIndia has a 9.4 per cent share in illegal timber trade and is placed after China and Vietnam in this notorious list; together with the EU, Thailand and US, they make up 84 per cent of illegal imports of timber. China imports illegal timber from all tropical forest regions and Russia while the major source of illegal timber for India is Southeast Asia. Huge domestic markets and poor regulatory frameworks are considered the main culprits for this contraband trade.2
As India’s timber market continues to grow rapidly, the country needs to introduce a better regulatory framework which includes stringent measures to control illegalities in its wood imports.
Legal and illegal timber trade of roundwood and sawn wood in 2014 (In million US$)
Illegal
6,331Illegal
9.4
Illegal
597
Total
15,077Total
14.7
Total
2,213
Exported from all regions in the world
India’s share (in per cent)
Imported by India
Source: IUFRO, 2016 and International Trade Centre/UNCOMTRADE, 2016

WOOD IS GOOD
37
Global trade flows of roundwood and sawn wood at a high risk of illegality, 2014 (In million US$)
Importing countries
Source regions exporting illegal timber Total illegal timber
imports from all regions
Percentage on total illegal
import from all source regions
Russian Federation
South America
Congo basin
South east Asia Oceania
China 619.9 78.6 302 1730.6 564.7 3295.7 52.1
Vietnam - 0.8 18.3 748.2 767.3 12.1
India - 10.2 1.4 509.3 75.5 596.5 9.4
EU 239.4 55.2 113.7 45.6 - 453.9 7.2
Thailand - - - 101.4 - 101.4 1.6
USA - 75.6 12.6 - - 88.2 1.4
South Korea 9.4 - - - 13 22.4 0.4
Japan - - 0.7 14.4 - 15.1 0.2
Malaysia - - - 12.1 - 12.1 0.2
Australia - - - - 1.1 1.1 0
Others 396.9 166.7 72.7 309.7 30.9 976.9 15.4
Total illegal export from all source regions
1265.6 387.1 521.4 3471.3 685.2 6330.6 100
Percentage on total illegal export from all source regions
20 6.1 8.2 54.8 10.8 100
Source: IUFRO, 2016
KUMAR SAMBHAV SHRIVASTAVA / CSE
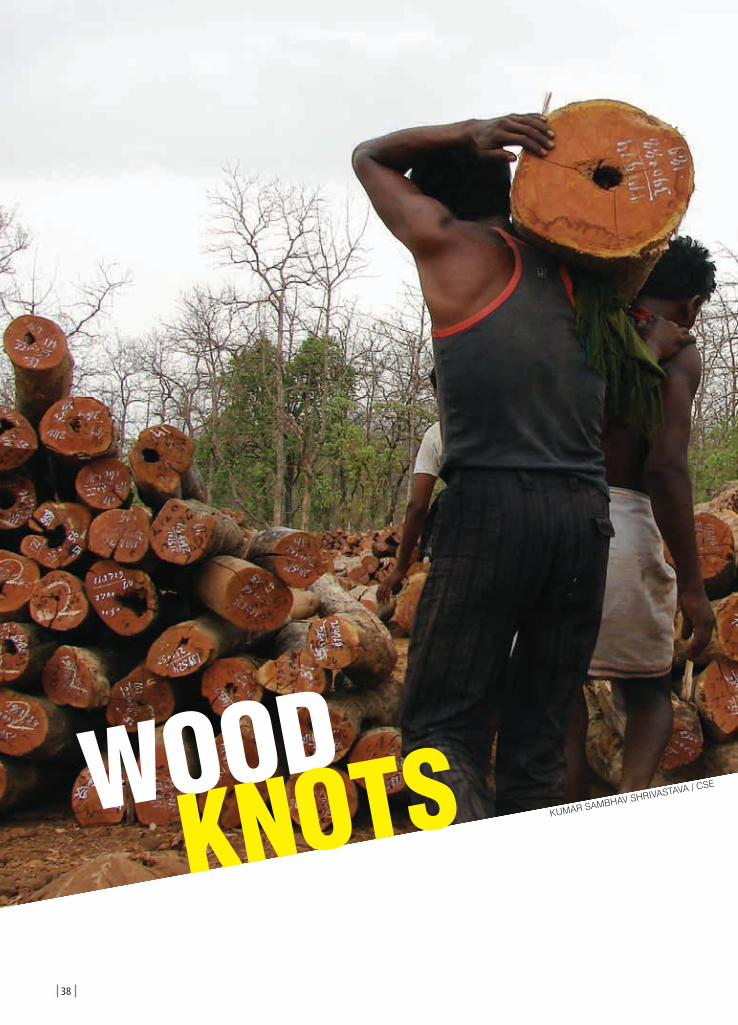
38
WOODKNOTS KUMAR SAMBHAV SHRIVASTAVA / CSE

WOOD IS GOOD
39
TROY IMPORTED A WOODEN HORSE
RED TAPE WOUND OVER WOOD
STICK TO THE PRODUCERS OF WOOD
India’s timber imports comprise 19 to 26 per cent of total annual timber availability and have been growing at a rate of 9.3 per cent since 2001*. Imports are bound to rise in the future as well, as there is no indication that domestic production of timber is keeping up with the pace of increasing demand.
There is a unanimous perception of shortage in supply in the timber and pulpwood-based industries, causing them to make an outcry for captive plantations on forestlands.
Despite being more than capable of producing all the wood that it requires, owing to its rich soils and availability of vast land resources, the gap between the policies and their implementation is large. The growing dependence on imports also means more illegal trade, and a question mark on the nation’s integrity.
India has been living under a regulatory regime that makes growing timber on private lands, farms and forests a very difficult task. Moreover, huge costs involved in transporting local timber are as much a culprit in this as any. Due to the non-availability of wood and high transportation costs, mills are increasingly exploring other options to source wood at cheaper rates, including importing logs or wood chips, jeopardizing the local wood economy and foregoing the immense wood production potential of Indian lands.
The lack of adequately-sized timber markets for farmers and price support mechanisms are also limiting growth in this sector. Farmers are finding it difficult to adopt timber-based agroforestry and farm forestry because the returns are low and the points of sale are far off.
Plywood industry’s monopoly over the market in many regions has constrained farmers, making them feel that they have been deprived of equity in the wood trade, to a point where they are made to feel as if they are not the owners of their produce.
* CSE analysis

40
Mr Umakant Sahu, a local farmer with a large landholding of over 160 acres (~65 hectares) planted 60,000 eucalyptus saplings in 2011 on 33 acres (13.35 ha) of his land, in his small native village of Doarra in Jhansi district of UP. He adopted agro-forestry with a hope that it will give him good returns on his investment, and now over 60 per cent of his eucalyptus tree crop is ready for harvesting. However, due to lack of any markets for his tree crop in the region, he is clueless about its future.
He is aware that the current price for eucalyptus is around I500 per quintal (100 kg), therefore, he turned down offers of many middlemen from unknown markets who had approached him, and offered rates as low as Rs 3 to 4 per kg. In a timber market like Yamuna Nagar, he could have sold his tree crop for around I5.5–5.7 per kg. He goes on to say that markets are heavily inclined in favour of bigger players and factory-owners, and the middlemen, and the farmers are barely able to recover their costs of production.
Still, Mr Sahu is optimistic that agroforestry and farm forestry can expand, if markets where farmers can sell their produce are close at hand. By his calculations, a farmer who has 5 acres land, will be able to plant around a 1,000 trees with a space of 10 feet between a tree and the next. If the average weight attained by a mature tree (after a five–six year’s rotation cycle) reaches 150 kg, the farmer will be able to earn approximately I6 lakh from the total produce.
AGROFORESTRY MARKET–FARM DISCONNECT IN BUNDELKHAND (UP) AND MP
SO
UJA
NYA
S
HR
IVA
STA
VA /
CS
E
WOOD IS GOOD
41
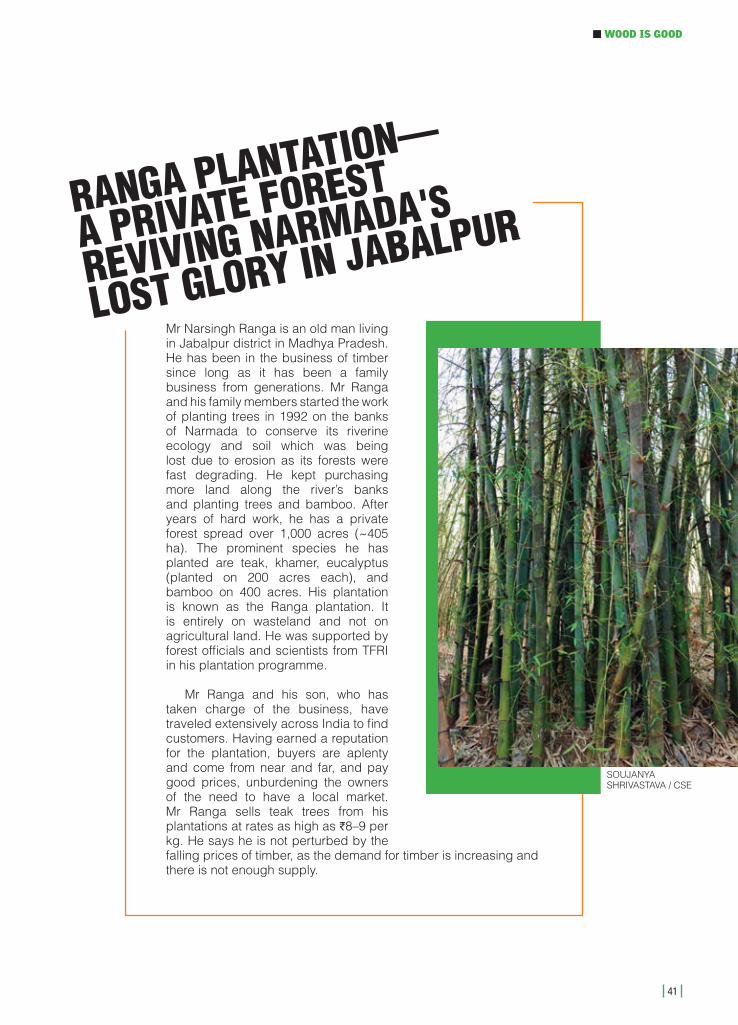
Mr Narsingh Ranga is an old man living in Jabalpur district in Madhya Pradesh. He has been in the business of timber since long as it has been a family business from generations. Mr Ranga and his family members started the work of planting trees in 1992 on the banks of Narmada to conserve its riverine ecology and soil which was being lost due to erosion as its forests were fast degrading. He kept purchasing more land along the river’s banks and planting trees and bamboo. After years of hard work, he has a private forest spread over 1,000 acres (~405 ha). The prominent species he has planted are teak, khamer, eucalyptus (planted on 200 acres each), and bamboo on 400 acres. His plantation is known as the Ranga plantation. It is entirely on wasteland and not on agricultural land. He was supported by forest officials and scientists from TFRI in his plantation programme.
Mr Ranga and his son, who has taken charge of the business, have traveled extensively across India to find customers. Having earned a reputation for the plantation, buyers are aplenty and come from near and far, and pay good prices, unburdening the owners of the need to have a local market. Mr Ranga sells teak trees from his plantations at rates as high as I8–9 per kg. He says he is not perturbed by the falling prices of timber, as the demand for timber is increasing and there is not enough supply.
RANGA PLANTATION—
A PRIVATE FOREST
REVIVING NARMADA'S
LOST GLORY IN JABALPUR
SOUJANYA SHRIVASTAVA / CSE

42
IF A TREE FALLS IN THE FOREST…Despite a quarter of the country’s geographical area being under forests, wood availability from them is extremely low. Most of the domestic wood production in the country is from resources outside forests. Therefore, it is important to realize the potential of TOF and promote it.
Wastelands are also a contentious problem in India, as some of them are not really ‘waste’ lands but are ‘wasted’ lands, thanks to the apathy of administration and policy, both at the regional as well as Central level. In the absence of suitable plantation technology and paucity of investments, precious land is being degraded and lost.
Even the growing stock from the land under TOF is not being utilized up to anywhere its real potential. Forests can further add to wood production, if appropriate silvicultural systems are applied with sustainable forest management framework. An analysis by CSE shows that more than 98 million cum of wood can be produced from available lands in India. This will easily meet the domestic wood demand in the country, rendering the current monumental wood imports from outside unnecessary.
Wood Production Sources Area (million ha)Annual Production Capacity (million
cum)
Assumed or average annual wood
productivity (cum per ha per year)
Natural Forests* 68.89 3.12 0.045
FDCs 1.28 15.02 11.74
Agroforestry + Farm Forestry 13.50 41.31 3.06
Cultivable Wasteland 12.58 12.58 1
Total Fallow Land 26.28 26.28 1
Total 98.31Source: CSE analysis *Natural forest cover, excluding forest land leased by FDCs.
Wood production capacity in India

WOOD IS GOOD
43
This report relies heavily on secondary sources for data on timber, fuelwood, bamboo, and imported wood. The data varies from one source to another, as do the timelines.
A large chunk of the total production of timber and fuelwood is not recorded due to illegal felling of trees.1 There is lack of data on illegal tree felling and consequent loss of revenue. The revenue generated from seizure of illegal material is also not properly recorded by state forest departments. In addition, a significant amount of timber extraction still goes unrecorded.2
Moreover, the markets for wood-based industries, such as plywood and panel, and furniture, are highly unorganized, providing insufficient information on supply and consumption of wood within these sectors. Due to such gaps in the available information, the figures of production and consumption of wood in India are frequently under-reported.
To avoid confusion and to bring consistency in terms of information and data, the following information has been adopted and certain assumptions are made in this report:1. As per ICFRE, TOF has been adopted. TOF is considered a larger subset and it
includes agroforestry and farm forestry.2. Therefore, all wood, including bamboo and excluding fuelwood, is considered
‘timber’ in this report, and not NTFP. 3. ‘Orchards’ are considered to be under agroforestry in this report.
There are certain assumptions/clarifications in the analysis of wood production capacity in India:1. Average productivity of pulpwood plantations of 5 FDCs is 11.74 cum/ha/year, which is
desirable for all FDCs.
2. Total area under natural forest (excluding FDC areas) which is producing nearly 3.12 million cum per year is assumed to continue producing at least this much of timber in future.
3. The annual timber production capacity from agroforestry and farm forestry is calculated to be 41.31 million cum assuming timber productivity of around 3.06 million cum of TOFs. It is assumed that some of the area under TOF is overlapped by the cultivable wasteland and total fallow land, hence the remaining TOF area is producing the rest of the timber i.e. 3.03 million cum.
The productivity of the cultivable wastelands and total fallow lands in India is assumed to be on a lower side with 1 cum per ha. If suitable reclamation technology and land use practices are applied, these unused lands can produce much more timber than this estimate.
TO NOT MISS THE FOREST FOR THE TREE
44
REFERENCESWOOD BALANCE OF INDIA1. T. R. Manoharan, 2011. Supply determinants of timber trade in India. WWF Report.2. M. K. Muthoo, 2004. Review of the Indian Timber Market, Pre-project report (PPD 49/02 (M), International Tropical Timber Organisation , 108p.3. FAO, 2009. India Forestry Outlook Study, Ministry of Environment and Forests, Government of India, Working Paper No. APFSOS II/WP/2009/06.4. FSI (Forest Survey of India), 2011. India State of Forest Report 2011.5. FSI (Forest Survey of India), 2015. India State of Forest Report 2015.6. National Bamboo Mission (http://nbm.nic.in/ap_roadmap.html, accessed on 20 April, 2017)7. FAO, 2015. Global Forest Resource Assessment – Desk Assessment. Food and Agricultural Organization8. Manmohan Yadav, 2016. Handbook on Forest Certification. The Energy and Resources Institute (TERI).9. FSI (Forest Survey of India), 2011. India State of Forest Report 2011.10. Chandra Bhushan and Ajay Kumar Saxena, 2016. Fumbling with Forests: Why we should not handover forests to the Private Sector, Centre for Science and Environment, New Delhi
WOOD PRODUCTION IN INDIA1. Shruti Agarwal and Ajay Kumar Saxena, 2017. The Puzzle of Forest Productivity: Are Forest Development Corporations Solving it right?, Centre for Science and Environment, New Delhi.2. FSI (Forest Survey of India), 2011. India State of Forest Report 2011.3. FAO, 2009. India Forestry Outlook Study, Ministry of Environment and Forests, Government of India, Working Paper No. APFSOS II/WP/2009/06.4. ITTO, 2004. Review of the Indian Timber Market, (Pre-Project Report prepared by Maharaj Muthoo), PPR 68/04 (M ), International Tropical Timber Organization.5. Shruti Agarwal and Ajay Kumar Saxena, 2017. The Puzzle of Forest Productivity: Are Forest Development Corporations Solving it right?, Centre for Science and Environment, New Delhi.6. FSI (Forest Survey of India), 2013. India State of Forest Report 2013.7. Ibid8. S. B. Chavan, A. Keerthika, S. K. Dhyani, A. K. Handa, R. Newaj, & K. Rajarajan, 2015. National Agroforestry Policy in India: a low hanging fruit. Current Science, 108(10), 1826.9. R. K. Jain (Ed), 2016. Compendium of Census Survey of Indian Paper Industry. Central Paper and Pulp Research Institute (CPPRI), Saharanpur.10. Sushil Saigal, & Dinesh Kashyap, 2002. The second green revolution: Analysis of farm forestry experience in western tarai region of Uttar Pradesh and coastal Andhra Pradesh. Ecotech Services Private Limited, New Delhi, 180.11. N. C. Saxena, 1992. Farm forestry and land-use in India: some policy issues. Ambio, 420-425.12. Arvind Bijalwan, 2016. Indian Institute of Forest Management Bhopal through personal communication.
WOOD CONSUMPTION IN INDIA1. Chandra Bhushan, Ajay Kumar Saxena, 2016. Fumbling with Forests: Why we should not handover forests to the Private Sector, Centre for Science and Environment, New Delhi.
WOOD IS GOOD
45
2. Forest Sector Report India, 2010. Indian Council for Forestry Research and Education, Ministry of Environment and Forests, Government of India.3. FSI (Forest Survey of India), 2011. India State of Forest Report 2011.4. FAO, 2009. India Forestry Outlook Study, Ministry of Environment and Forests, Government of India, Working Paper No. APFSOS II/WP/2009/06.5. FSI (Forest Survey of India), 2011. India State of Forest Report 2011.6. Ibid7. Woodnews, 2016, Vol. 26, No.1, May-June Edition, PDA Trade Media, Association of Furniture Manufacturers and Traders. ISSN No 0971-67348. Ibid9. KPMG-IBEF, 2015. Furniture – Market and Opportunities. India Brand Equity Foundation, Confederation of Indian Industry.10. Madras Consultancy Group, 2016. The Furniture Market in India to 2019-20: An in-depth industry analysis.11. Stewart &Mackertich, 2014. Century Plyboards (India) Ltd. – Visit Note.12. Ibid.13. KPMG-IBEF, 2015. Furniture – Market and Opportunities. India Brand Equity Foundation, Confederation of Indian Industry.14. R. K. Jain (Ed), 2016. Compendium of Census Survey of Indian Paper Industry. Central Paper and Pulp Research Institute (CPPRI), Saharanpur.15. Ibid16. Ibid17. Ibid18. Ibid
WOOD ACROSS BORDERS OF INDIA1. Down to Earth, ‘Myanmar will import timber to save its own forests’ 06 July 2016, http://www. downtoearth.org.in/news/myanmar-will-import-timber-to-save-its-own-forests-547702. Daniela Kleinschmit, Stephanie Mansourian, Christoph Wildburger & Andre Purret (eds.), 2016. Illegal Logging and Related Timber Trade – Dimensions, Drivers, Impacts and Responses. A Global Scientific Rapid Response Assessment Report.IUFRO World Series Volume 35. Vienna. 148 p.
WOOD KNOTS1. H. Gundimeda, P. Sukhdev, R.K. Sinha, & S. Sanyal, 2007. Natural resource accounting for Indian states—illustrating the case of forest resources. Ecological Economics, 61(4), 635-649.2. Ibid


48
Centre for Science and Environment41, Tughlakabad Institutional Area, New Delhi 110 062, India
Ph: +91-11-40616000 Fax: +91-11-29955879E-mail: [email protected] Website: www.cseindia.org