
Women's Status and Child Survival in West Java, Indonesia
57
Articles Women’s Status and Child Survival in West Java, Indonesia Improved education and an increase in the age at first marriage are key elements for improving the status of women in West Java By Widayatun* Women have more limited opportunities than men in most economic and social activities. 1/ It has been asserted that aspects of women’s status or position in society are closely related to the demographic events of fertility, mortality and migration. For instance, evidence from a variety of studies * The author of this article is a staff member of the Centre for Population and Manpower Studies Indonesia, Institute of Sciences (PPT-LIPI), Widya Graha LIPI, Jln. Gatot Subroto 10, Jakarta Selatan. The article is based on a paper prepared in partial fulfilment of re- quirements for a master’s degree in demography, Graduate Program in Demography, Na- tional Centre for Development Studies, Australia National University. The author acknow- ledges with gratitude the helpful comments on earlier drafts of that paper made by Lor- raine Corner, Philip Guest and Philip Morgan. Asia-Pacific Population Journal, Vol. 6, No. 1 3
-
Upload
khangminh22 -
Category
Documents
-
view
4 -
download
0
Transcript of Women's Status and Child Survival in West Java, Indonesia
Articles
Women’s Status and Child
Survival in West Java,
Indonesia
Improved education and an increasein the age at first marriage are key
elements for improving the status ofwomen in West Java
By Widayatun*
Women have more limited opportunities than men in most economicand social activities.1/ It has been asserted that aspects of women’s status orposition in society are closely related to the demographic events of fertility,mortality and migration. For instance, evidence from a variety of studies
* The author of this article is a staff member of the Centre for Population and ManpowerStudies Indonesia, Institute of Sciences (PPT-LIPI), Widya Graha LIPI, Jln. Gatot Subroto10, Jakarta Selatan. The article is based on a paper prepared in partial fulfilment of re-quirements for a master’s degree in demography, Graduate Program in Demography, Na-tional Centre for Development Studies, Australia National University. The author acknow-ledges with gratitude the helpful comments on earlier drafts of that paper made by Lor-raine Corner, Philip Guest and Philip Morgan.
Asia-Pacific Population Journal, Vol. 6, No. 1 3
demonstrates a positive relationship between women’s education and oc-cupation on one hand, and child survival on the other.2/ This phenomenon,therefore, leads to the conclusion that women’s limited opportunities interms of education and occupation can result in lower child survival.
Certain difficulties are involved in studying the relationship betweendemographic events and women’s status. A major obstacle is the absence ofan unambiguous operational definition of the “status” of women. Commonmeasures in defining women’s status are indicators that relate to the educa-tion, health status and labour force participation of women. Although educa-tion and occupation can affect child survival, few studies on mortality dif-ferentials in Indonesia have explicitly discussed women’s status and itsrelationship to infant and child mortality. Hence, this study examines thatrelationship in the province of West Java.
West Java is divided into 20 regencies and four municipalities. There isa marked diversity of ethnicity and culture among the population of theprovince. The majority of the population are Sundanese, who comprise thesecond largest ethnic and linguistic group (after the Javanese) in Indonesia.The core of the Sundanese territory is made up of the highland regencies ofSukabumi, Cianjur, Bandung, Sumedang, Garut, Tasikmalaya and Ciamis.The second major ethnic group in the province, the Javanese, live closer tothe border between West Java and Central Java, especially in the regenciesof Indramayu and Cirebon, while the Batavians, who are natives of Jakarta(also known as Betawi), are strongly represented in Tangerang, Bogor andBekasi regencies, and the Bantenese are concentrated in parts of Serang
3/regency.
West Java is fertile and quite rich in natural resources, but infant andchild mortality in the province is high compared with other provinces inJava. According to the 1980 Indonesian census, the infant mortality rate(IMR) in East Java, Central Java, Yogyakarta and Jakarta was 99, 96, 60 and80 per thousand live births, respectively, while the IMR in West Java wasabout 129 per thousand live births. Infant and child mortality rates tend tobe highest in the northern regencies of West Java, such as Karawang, Bekasiand Indramayu, and the western regencies, such as Tangerang and Bogor.4/These regencies are relatively close to Jakarta, where modern healthfacilities and services are readily available. Therefore, it is surprising thatsuch areas have high infant and child mortality.
Differences in ethnicity and culture in West Java may be related todifferences in the status of women. A study found that Betawi women, whoadhere more strictly to the tenents of the Muslim religion than the other
4 Asia-Pacific Population Journal, Vol. 6, No. 1
ethnic groups in Jakarta, had lower status in terms of education, employ-ment and marriage compared with Betawi men, other women in Jakarta andalso in other areas of Indonesia.5/
Previous studies undertaken in West Java suggest that various aspectsof women’s status, such as women’s education and women’s occupation areclosely related to child survival.6/ As the West Javan population comprisesseveral geographically concentrated ethnic groups with different cultureswhich appear to be related to differences in the status of women, and asinfant and child mortality varies markedly among the regencies, this studywill attempt to identify geographical patterns in the status of women in theregencies and municipalities of West Java and to examine the relationshipbetween the status of women and infant and child mortality in the province.
The concept of women’s status
Women’s status is a concept with ambiguous operational definitions.Theoretical definitions consider women’s access to material and socialresources. It is thus a multidimensional phenomenon comprising several dif-ferent and perhaps interdependent variables. In addition, an individualwoman’s status may vary according to the particular social milieu: she mayhave different levels of status in different contexts. For example, a womanmay have high status within the household but low status outside the home,or vice-versa.
Women’s status can be conceptualized on two levels: at the micro level,women’s status within the household; and at the macro level, women’s statusin society.7/ The latter has at least two dimensions: status vis-a-vis men andvis-a-vis other women. This study examines status both within the householdand within society.
There is little agreement regarding how, and to what degree, the con-ventional indicators of women’s status reflect the overall position of womenin the household, in the community and in society at large. The literaturesuggests that indicators of women’s status within the household shouldreflect women’s position relative to that of men in terms of the authority tomake decisions about their productive and economic activities, as well asdecisions that affect their lives which are not stereotyped as “feminine” inareas such as moving or not moving, family size and paying for child care.8/Thus, desirable indicators of women’s status in the household should reflectthe position of women relative to men with respect to social resources suchas knowledge, rights and power, and material resources such as income,land, food and wealth.
Asia-Pacific Population Journal, Vol. 6, No. 1 5
The conventional indicators of women’s status within the householdused in studying the relationship between women’s status and demographicpatterns are education and occupation.
Education may increase communication between marriage partners,and enables women to be decision-makers as well as to implement decisionsregarding their lives. 9/ Further, the significance of the independence ofwomen in the household is supported by evidence that the greater theresources a woman brings into marriage in comparison with those of herhusband, including her education and income, the more significant her rolewithin the family.10/
The selection of indicators of women’s status in society can be predi-cated on the notions that:
the higher women’s ability is to control important events intheir lives (such as age at marriage, marriage, etc.), the highertheir status; and (ii) the more women that have the same lifeoptions as men in the same age group and social class withrespect to food, education and training, occupations,remuneration and occupational advancement, migration, use oftime, leisure, land and property ownership, and life expectancy,the higher is their status.11/
Education and income are also often used to measure women’s statusin society. Women’s access to social resources can be measured by their fullparticipation in education, while women’s access to material resources is in-dicated by their occupation and economic activity.
Educational attainment and occupation are important contributors towomen’s status vis-a-vis men. Education delays marriage for women and in-creases the opportunity for paid employment in modern sectors, which canliberate women by giving them economic independence and thus raisingtheir status relative to that of their husbands. Income and modern employ-ment provide women with status, social recognition and opportunities forother forms of social and economic participation.12/
The status of women vis-a-vis others can be measured by their relativeeducational levels. In addition to providing specific knowledge, educationfor women also induces changes in beliefs and values by encouraging recep-tivity to new ideas, competitiveness and self-confidence.13/ Education forwomen may also release them from gruelling agricultural work and freethem from purely home-making roles that restrict their sphere of influenceto the home.14/
6 Asia-Pacific Population Journal, Vol. 6, No. 1
Women’s status and child survival
If it were assumed in an extreme case that men have total control overwomen in the household, women would lack authority to make decisionsregarding child health and lack resources to implement such decisions. Insuch an unlikely case, women’s status vis-a-vis men both in the householdand within society would be associated with infant and child mortality. Al-though women’s status relative to men is one of the immediate determinantsof child survival because the household is the primary locus where decisionsaffecting the allocation of resources between generations and access toprimary health care are made, women’s status relative to education and oc-cupation may also be associated with child health via their allocation of timefor child care.
Relative equality in decision-making and control over resources in rela-tion to child health (mortality) between men and women may depend partlyon their relative levels of education and income. One linkage betweenwomen’s education and chid health is that education gives women thepower and confidence to make decisions.15/ Further, women’s income is themost important aspect of their freedom in decision-making, life options andcontrol over resources.16/ (However, while control and the distribution ofcontrol are subjects that merit further discussion, such an examination isbeyond the scope of this article.)
Women’s status vis-a-vis men may affect infant and child mortality inseveral ways. First, women who have more egalitarian relationships indecision-making are generally more likely to have higher levels of contracep-tive use than those who usually defer to their husband.17/ Higher levels ofcontraceptive use will improve birth spacing, leading to higher birth-weightbabies, which is an important determinant of healthy infants.18/ Second,more egalitarian decision-making and control over resources may enablewomen to initiate decisions about health care use and health care expendi-tures. Women’s autonomy and access to the use of their own income andassets will influence their options to purchase and consume food as well asmake health-care expenditures. It also influences their ability to seek paidchild-care substitutes.19/
Women’s status on a broader level, that is, their status vis-a-vis otherwomen in the community, could be expected to be associated with infantand child mortality through women’s education and income. Women’seducation may reduce infant and child mortality in several ways. First, bettereducated women are more likely to know about and use birth controlmethods than less educated women, leading to increased birth spacing and
Asia-Pacific Population Journal, Vol. 6, No. 1 7
healthier infants.20/ Second, better educated women tend to have higherbirth-weight babies than less educated women. The link between educationand the birth weight of offspring may occur as a result of educated mothers’better care and more adequate food during pregnancy, and because they aremore likely to reject taboos concerning the consumption of protein-richfoods.21/ Third, a link between maternal education and hygienic practicesensures better prospects of survival for the children of educated mothers.Educated mothers are more likely to detect in good time when theirchildren are ill, to seek appropriate treatment and understand and followthe medical advice given.22/
Women’s entry to the labour force may have both negative and positiveeffects on infant and child mortality. The negative effects may result fromthe reduced time available for child nurturing, although place of work, fami-ly size and the existence of extended family may ameliorate such effects.Women in the labour force spend less time on child-rearing compared withmothers who do not participate in the labour force. Lack of maternal timedevoted to chid-rearing might be expected to have a direct impact on infantand child mortality through the loss of specific elements in a desirable child-care regimen, and an indirect impact through degradation of maternalhealth. The positive effects may result from increases in household incomeand improvements in mothers’ knowledge of child care through the greatercontact of working mothers with modern ideas.23/
Data and indicators of women’s status
The data used in this article are from the 1980 Indonesian census.Infant and child mortality rates at the regency level are derived fromSoemantri et al. 24/ and Ismail. 25/ Both studies applied the Trussell techni-que26/ to the 1980 census data to obtain estimates of infant and childhoodmortality, respectively.
Indirect estimation of infant and child mortality requires informationon the number of children ever born who are still living and the number ofchildren ever born who have died.
A number of problems are associated with these data. The first isselective omission of children who have died. The underreporting of deadchildren will lead to an underestimation of infant and child mortality. Thesecond is misreporting of still births. Sometimes, still births are reported aslive births who died later, resulting in an overestimation of mortality.27/ Thethird problem arises because the information on children ever born and sur-viving is obtained only from mothers who were alive at the time of the cen-
8 Asia-Pacific Population Journal, Vol. 6, No. 1
sus. Accordingly, the estimates will be biased if the mortality rate of childrenwhose mothers have died is different from that of those whose mothers arestill alive.28/
In measuring women’s status, this study analyzes the status of womenamong regencies; limiting the target population to males and females 15-49may reduce the effect of differences in age structure among the regencies.29/Such differences in age structure could affect measures of women’s status.For example, a regency with a large proportion of women in the youngerages would tend to have lower female literacy, thus implying a higher statusof women. In addition, the study focuses on this age group because malesand females 15-49 comprise the child-bearing age group in which the roleand status of men and women are more closely related to infant and childdeaths.
While recognizing their serious limitations, census data at the regionallevel do provide the basis for developing a number of theoretically relevantindicators. The indicators used in this study are as follows:
W1 =
W2 =
W3 =
W4 =
W5 =
W6 =
W7 =
W8 =
W9 =
the proportion of couples where the wife’s age is greaterthan the husband’s;
the proportion of couples where the wife’s education isgreater than the husband’s;
the ratio of women to men who are literate;
the ratio of women to men who have completed juniorhigh school;
the ratio of women to men in the labour force;
the ratio of women to men working in the non-agricul-tural sectors;
the proportion of married women who are working;
the proportion of women with education greater thanprimary level;
the proportion of women aged 15-24 who are single;
W10 = the proportion of women aged 15-49 working in thenon-agricultural sectors;
W11 = the proportion of women working in the non-agricul-tural sectors, and not working as unpaid family workersin the sales or service sectors;
Asia-Pacific Population Journal, Vol. 6, No. 1 9
W12 = the proportion of women in the labour force (aged15-49) working in the non-agricultural sectors; and
W13 = the proportion of women in the labour-force working inthe non-agricultural sectors and not working as unpaidfamily workers in the sales or service sectors.
These variables are calculated at the regency level. Junior high schoolwas chosen to measure educational attainment because universal primaryeducation in Indonesia has resulted in limited variation in primary schoolenrolment between the sexes. Completed junior high school is defined asgraduating from junior high school by obtaining a certificate, regardless ofwhether the school is public or private. Literacy is measured as being able toread and write in roman characters. Working is defined as performing aneconomic activity for at least one hour per day during the previous week.
Wl and W2 are indicators of women’s status within the household.They have been obtained from the 5 per cent 1980 sample of the Indonesiancensus after matching the characteristics of husbands and wives. It is as-sumed that the greater the education and age differential between spouses,the greater the differential in status. Where a woman has higher educationthan her husband, she is likely to have more access to knowledge and agreater decision-making role within the household. Traditionally, marriageto younger partners has been an option open to men only. However, cross-culturally, the experience has been that the greater the economic emancipa-tion of women, the more women have the option of marrying men youngerthan themselves.30/
W3 and W6 determine the status of women vis-a-vis men at the societylevel (that is, within the regency). The relative inequality between men andwomen (the “gender gap”) in terms of social and material resources isreflected by their education and occupations. These variables have beenmeasured as a ratio: values close to 0 indicates that the gender gap is large,and values close to 1 indicate that it is small.
Women’s status vis-a-vis other women is indicated by their educationalattainment, participation in employment and age at marriage (W7 to W13).The degree of women’s access to social resources in society compared withother women is reflected by their educational attainment and age at mar-riage, while the degree of their access to material resources is reflected intheir participation in the labour force. (However, there are limits to the in-dicator lower age at marriage as a reflection of lower female status; later inlife, a woman who never married may not have a higher status than a womanwho got married at an early age.)
10 Asia-Pacific Population Journal, Vol. 6, No. 1
The indicators W7 and W8 are quite straightforward, but a brief ex-planation is required for W9, Wl0, W11, W12 and W13. Indicator W9 is anindirect measure of age at first marriage: a higher proportion of womenaged 15-24 in a regency who are single indicates that age at first marriage isrelatively high. It might be expected that working in the non-agricultural sec-tors (and not working as unpaid family workers) would have liberating ef-fects upon women by enabling them to earn money of their own and toobtain knowledge, thus raising their status.
Wl0 is the proportion of women working in the non-agricultural sec-tors to all women aged 15-49, while W11 excludes from this group thoseworking as unpaid family workers in sales or services. W12 is the proportionof women in the labour force working in the non-agricultural sectors, whileW13 excludes from this group those working as unpaid family workers insales and services. (It should be mentioned that indicators W10-W13 reflecta common assumption about the status of women in agricultural employ-ment being low; however, this may not necessarily be the case. Thus, moreresearch would be needed in this matter.)
Analytic strategy
Infant and child mortality are measured at the regency level. Cluster.analysis31/ was used to identify geographical patterns of women’s status and
highlight natural groupings of the women’s status variables among the 20regencies and four municipalities. All indicators of women’s status werestandardized to ensure similarity of levels of measurement. Euclidean dis-tances were computed between pairs of regencies across the 13 indicators.The smaller the Euclidean distance, the greater the similarities among theregencies.
Pearson’s correlations were computed to examine the relationship be-tween indicators of women’s status and infant and child mortality. Multipleregression was also carried out to examine the relationship between in-dicators of women’s status and infant and child mortality, after controllingfor economic development.
Geographical patterns of women’s status
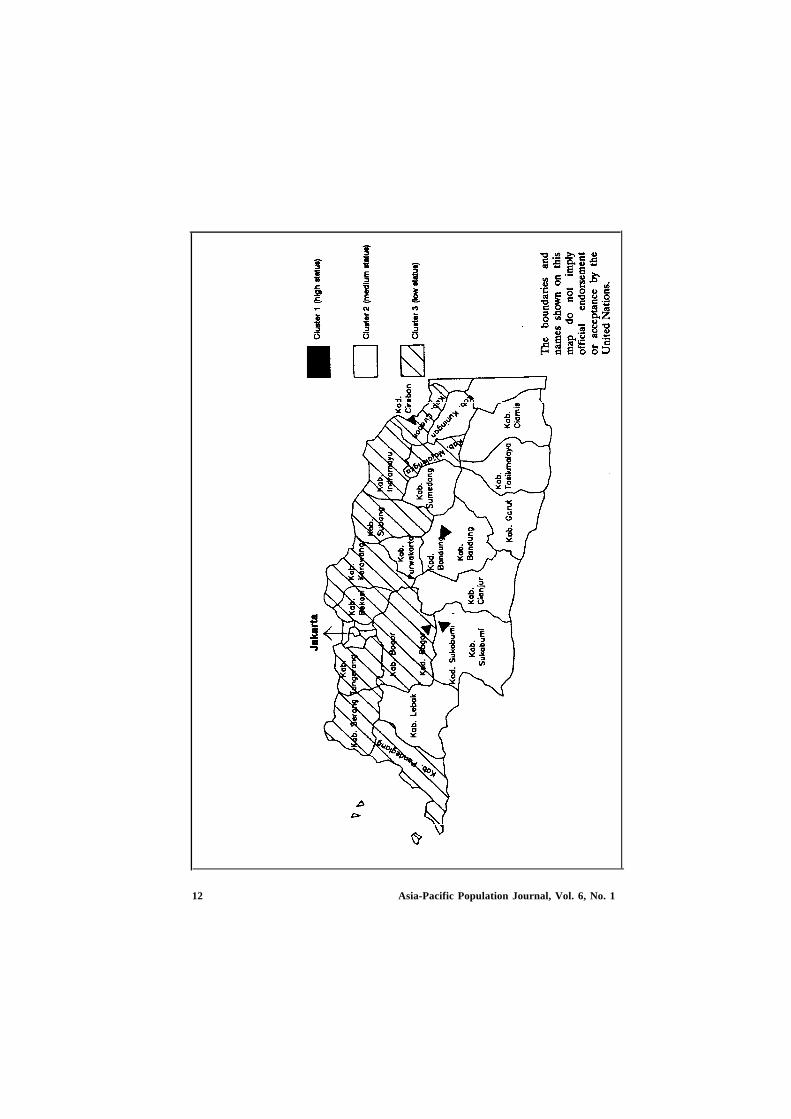
Based on the dendrogram obtained from the complete-linkage cluster-ing method, women’s status in the 20 regencies and four municipalities ofWest Java was classified into three clusters (see figure). The first comprisedfour municipalities: Bogor, Sukabumi, Bandung and Cirebon. The second
Asia-Pacific Population Journal, Vol. 6, No. 1 11
12 Asia-Pacific Population Journal, Vol. 6, No. 1
comprised 10 regencies in the central and southern highlands of West Java(the south coast). The third cluster lies in the northern lowlands (the northcoast), consisting of 10 regencies from the regency of Cirebon in the east toPandeglang in the west.
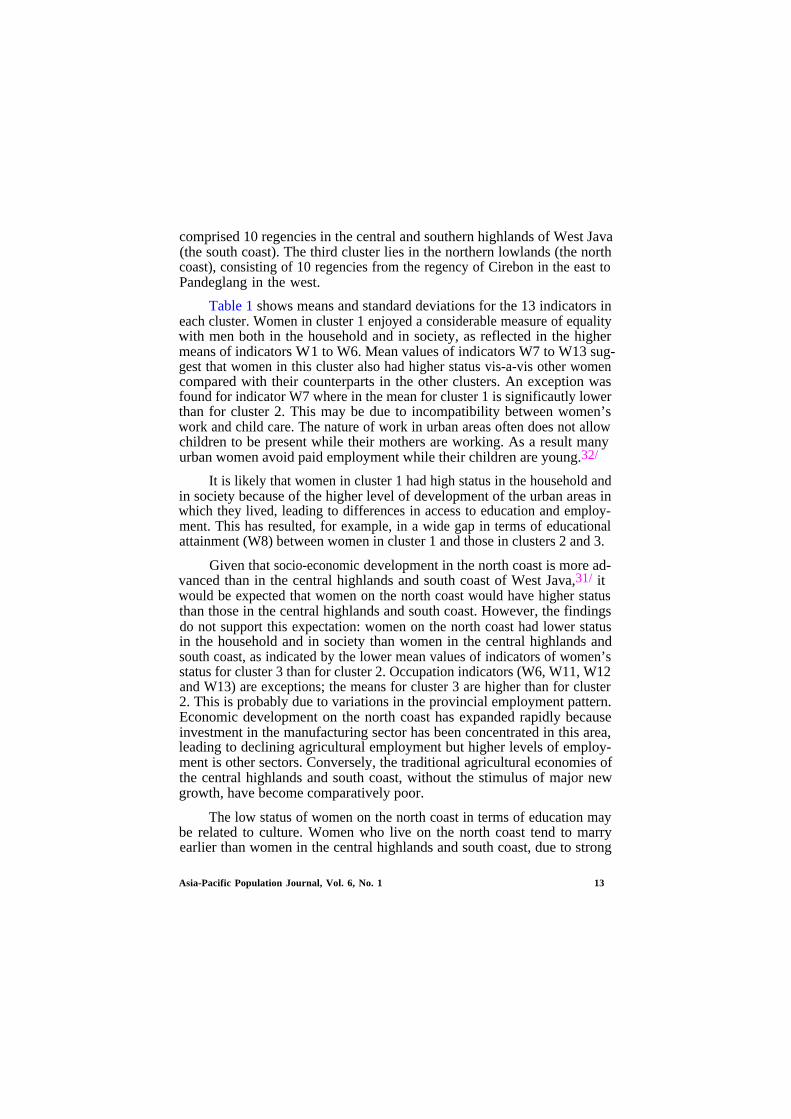
Table 1 shows means and standard deviations for the 13 indicators ineach cluster. Women in cluster 1 enjoyed a considerable measure of equalitywith men both in the household and in society, as reflected in the highermeans of indicators W1 to W6. Mean values of indicators W7 to W13 sug-gest that women in this cluster also had higher status vis-a-vis other womencompared with their counterparts in the other clusters. An exception wasfound for indicator W7 where in the mean for cluster 1 is significautly lowerthan for cluster 2. This may be due to incompatibility between women’swork and child care. The nature of work in urban areas often does not allowchildren to be present while their mothers are working. As a result manyurban women avoid paid employment while their children are young.32/
It is likely that women in cluster 1 had high status in the household andin society because of the higher level of development of the urban areas inwhich they lived, leading to differences in access to education and employ-ment. This has resulted, for example, in a wide gap in terms of educationalattainment (W8) between women in cluster 1 and those in clusters 2 and 3.
Given that socio-economic development in the north coast is more ad-vanced than in the central highlands and south coast of West Java,31/ itwould be expected that women on the north coast would have higher statusthan those in the central highlands and south coast. However, the findingsdo not support this expectation: women on the north coast had lower statusin the household and in society than women in the central highlands andsouth coast, as indicated by the lower mean values of indicators of women’sstatus for cluster 3 than for cluster 2. Occupation indicators (W6, W11, W12and W13) are exceptions; the means for cluster 3 are higher than for cluster2. This is probably due to variations in the provincial employment pattern.Economic development on the north coast has expanded rapidly becauseinvestment in the manufacturing sector has been concentrated in this area,leading to declining agricultural employment but higher levels of employ-ment is other sectors. Conversely, the traditional agricultural economies ofthe central highlands and south coast, without the stimulus of major newgrowth, have become comparatively poor.
The low status of women on the north coast in terms of education maybe related to culture. Women who live on the north coast tend to marryearlier than women in the central highlands and south coast, due to strong
Asia-Pacific Population Journal, Vol. 6, No. 1 13
Table 1: Mean and standard deviation of indicator ofwomen’s status by cluster
Cluster 1 Cluster 2 Cluster 3 Total
Proportion of couples wherewife’s age is greater thanhusband’s (W1)
Mean 0.04Standard 0.01
Proportion of couples wherewife’s education is greaterthan husband’s (W2)
Mean 0.14Standard 0.04
Ratio of women to men who areliterate (W3)
Mean 0.92Standard 0.02
Ratio of women to men completingjunior high school (W4)
Mean 0.67Standard 0.04
Ratio of women to men in thelabour force (W5)
Mean 0.31Standard 0.01
Ratio of women to men working inthe non-agricultural sector (W6)
Mean 1.01Standard 0.01
Proportion of married women whoare working (W7)
Mean 0.14Standard 0.02
0.030.01
0.150.02
0.870.04
0.540.04
0.270.06
0.770.09
0.180.05
0.010.00
0.100.00
0.700.09
0.470.06
0.200.03
0.970.07
0.120.03
0.030.01
0.130.02
0.800.06
0.530.05
0.250.04
0.890.08
0.150.04
14 Asia-Pacific Population Journal, Vol. 6, No. 1
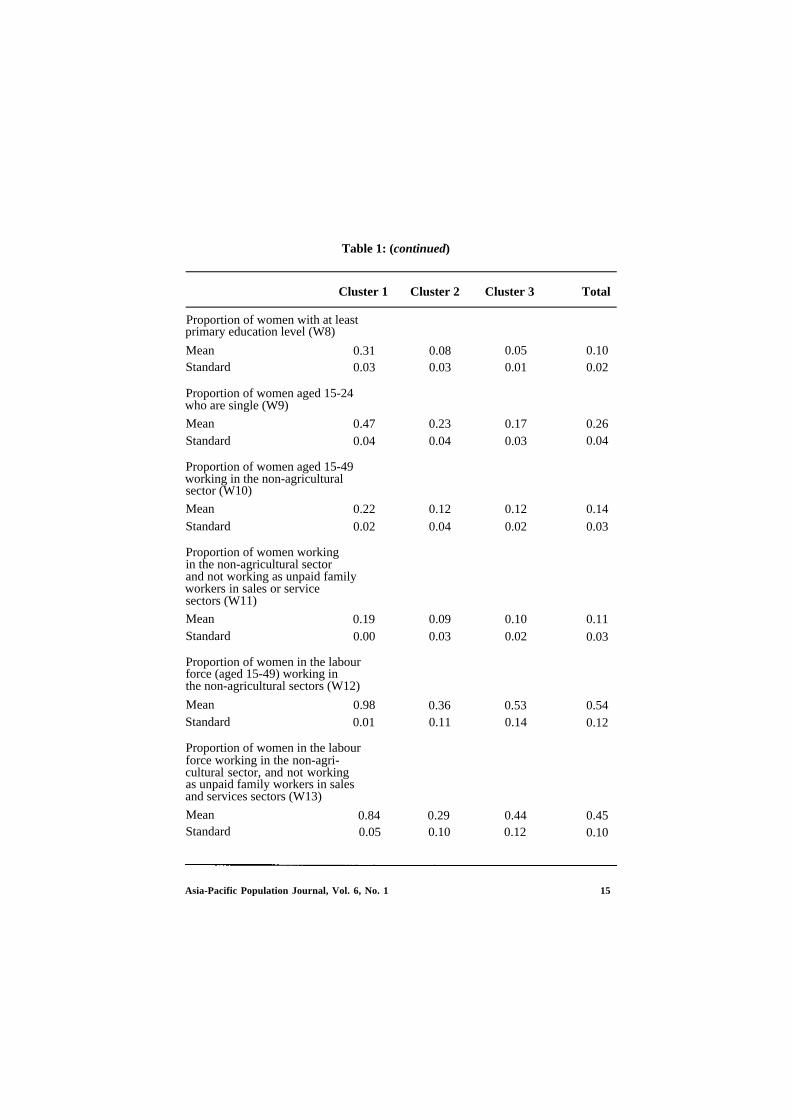
Table 1: (continued)
Cluster 1 Cluster 2 Cluster 3 Total
Proportion of women with at leastprimary education level (W8)
MeanStandard
Proportion of women aged 15-24who are single (W9)
MeanStandard
Proportion of women aged 15-49working in the non-agriculturalsector (W10)
MeanStandard
Proportion of women workingin the non-agricultural sectorand not working as unpaid familyworkers in sales or servicesectors (W11)
MeanStandard
Proportion of women in the labourforce (aged 15-49) working inthe non-agricultural sectors (W12)
MeanStandard
Proportion of women in the labourforce working in the non-agri-cultural sector, and not workingas unpaid family workers in salesand services sectors (W13)
MeanStandard
0.31 0.080.03 0.03
0.470.04
0.220.02
0.190.00
0.980.01
0.230.04
0.120.04
0.090.03
0.360.11
0.84 0.290.05 0.10 0.12
0.050.01
0.170.03
0.120.02
0.100.02
0.530.14
0.44
0.100.02
0.260.04
0.140.03
0.110.03
0.540.12
0.450.10
Asia-Pacific Population Journal, Vol. 6, No. 1 15
cultural supports for early marriage. For example, in some villages in theregency of Indramayu a ceremony called jaringan, in which young men andwomen could choose their marriage partners, which was traditionally con-ducted once a month, was reported to be occurring almost every day in1986.34/ The rural population believes that females should marry betweenthe ages of 15 and 19 years. Those who do not are called perawan tua (oldmaids), a pejorative term that is embarrassing not only for the woman, butalso for her family.35/ The incidence of divorce in the north coast has alsobeen high, partly because of a perception that more frequently divorcedwomen are more attractive to men. Thus, it is a common occurrence thatmight almost be described as a custom, that young couples, especially inrural areas marry during the harvest time and fall into debt and divorce inthe slack season.36/ Such customs encourage women to marry early, resultingin low educational levels.
In general, there is a wide gap between men and women in terms ofeducation and occupation in West Java, as reflected in the low female-to-male ratios of these indicators. The highest mean for an education indicator(W4) is only 0.67 and the lowest is 0.47 for clusters 1 and 3, respectively. Forthe occupation indicator (W5) the figures were 0.31 and 0.20, respectively.
Women’s status and child survival in West Java
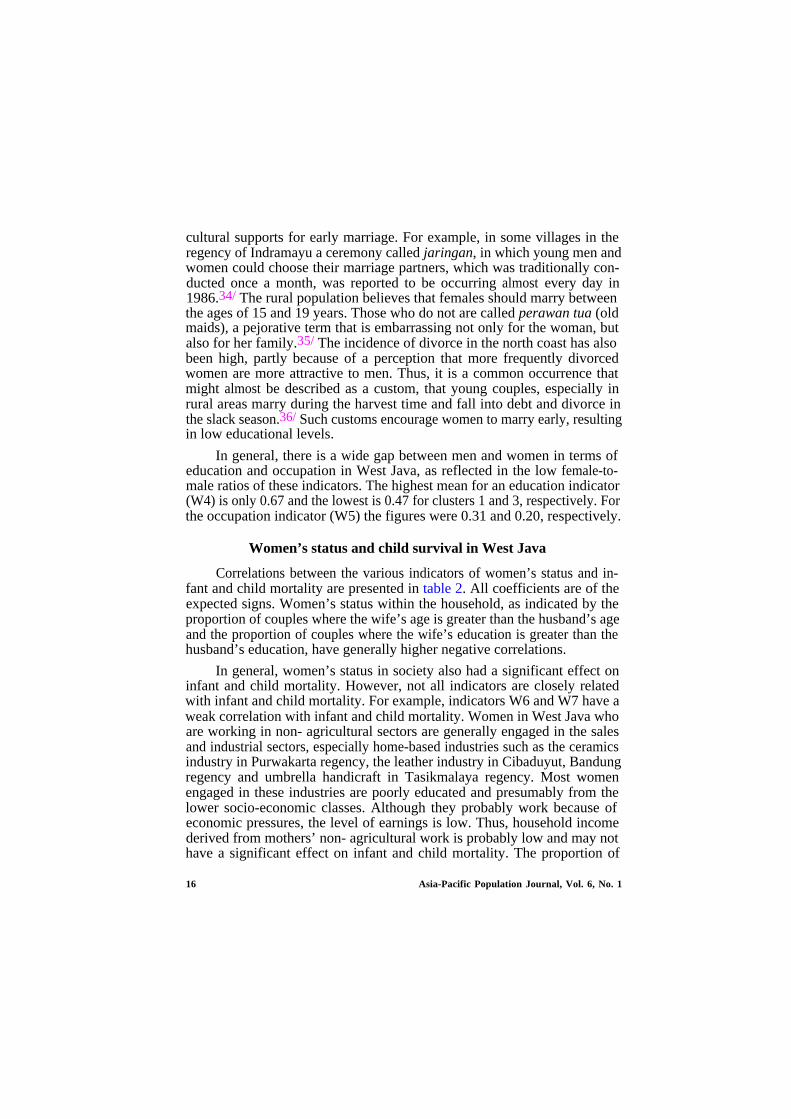
Correlations between the various indicators of women’s status and in-fant and child mortality are presented in table 2. All coefficients are of theexpected signs. Women’s status within the household, as indicated by theproportion of couples where the wife’s age is greater than the husband’s ageand the proportion of couples where the wife’s education is greater than thehusband’s education, have generally higher negative correlations.
In general, women’s status in society also had a significant effect oninfant and child mortality. However, not all indicators are closely relatedwith infant and child mortality. For example, indicators W6 and W7 have aweak correlation with infant and child mortality. Women in West Java whoare working in non- agricultural sectors are generally engaged in the salesand industrial sectors, especially home-based industries such as the ceramicsindustry in Purwakarta regency, the leather industry in Cibaduyut, Bandungregency and umbrella handicraft in Tasikmalaya regency. Most womenengaged in these industries are poorly educated and presumably from thelower socio-economic classes. Although they probably work because ofeconomic pressures, the level of earnings is low. Thus, household incomederived from mothers’ non- agricultural work is probably low and may nothave a significant effect on infant and child mortality. The proportion of
16 Asia-Pacific Population Journal, Vol. 6, No. 1
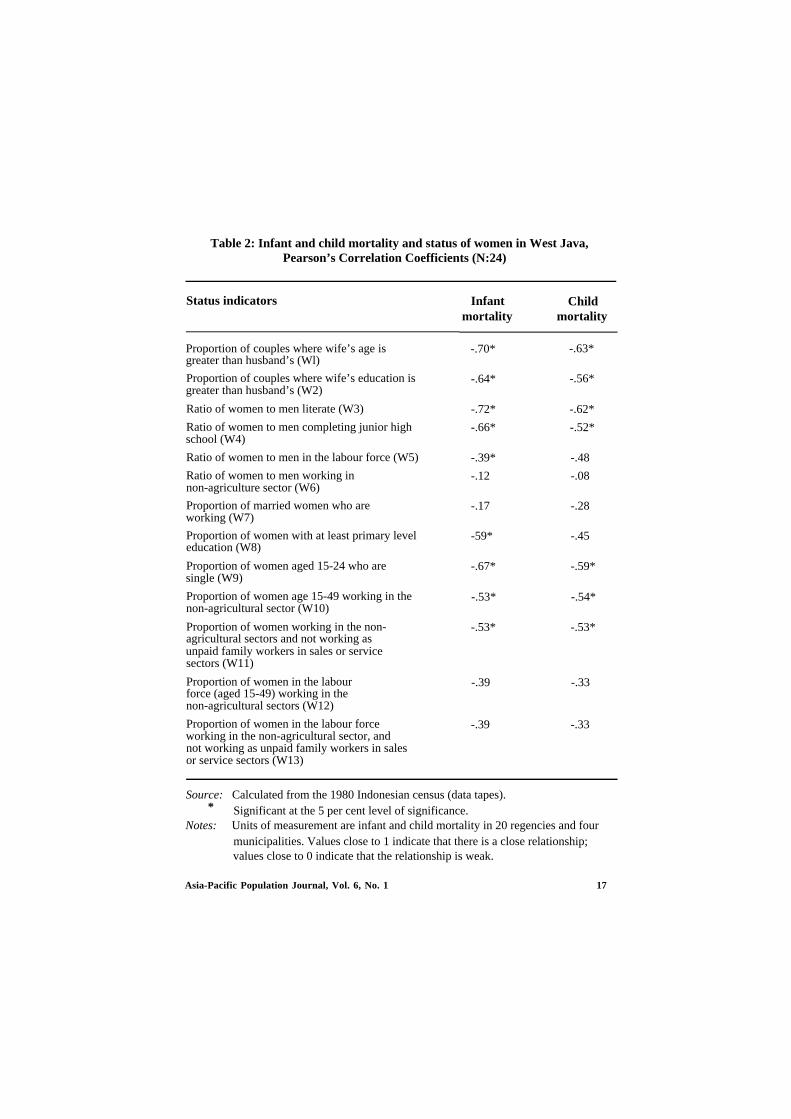
Table 2: Infant and child mortality and status of women in West Java,Pearson’s Correlation Coefficients (N:24)
Status indicators
Proportion of couples where wife’s age isgreater than husband’s (Wl)
Proportion of couples where wife’s education isgreater than husband’s (W2)
Ratio of women to men literate (W3)
Ratio of women to men completing junior highschool (W4)
Ratio of women to men in the labour force (W5)
Ratio of women to men working innon-agriculture sector (W6)
Proportion of married women who areworking (W7)
Proportion of women with at least primary leveleducation (W8)
Proportion of women aged 15-24 who aresingle (W9)
Proportion of women age 15-49 working in thenon-agricultural sector (W10)
Proportion of women working in the non-agricultural sectors and not working asunpaid family workers in sales or servicesectors (W11)
Proportion of women in the labourforce (aged 15-49) working in thenon-agricultural sectors (W12)
Proportion of women in the labour forceworking in the non-agricultural sector, andnot working as unpaid family workers in salesor service sectors (W13)
Infantmortality
Childmortality
-.70*
-.64*
-.72*
-.66*
-.39* -.48
-.12 -.08
-.17 -.28
-59* -.45
-.67* -.59*
-.53* -.54*
-.53* -.53*
-.39 -.33
-.39 -.33
-.63*
-.56*
-.62*
-.52*
Source: Calculated from the 1980 Indonesian census (data tapes).* Significant at the 5 per cent level of significance.
Notes: Units of measurement are infant and child mortality in 20 regencies and fourmunicipalities. Values close to 1 indicate that there is a close relationship;values close to 0 indicate that the relationship is weak.
Asia-Pacific Population Journal, Vol. 6, No. 1 17
married women who were working (W7) also had no significant effect oninfant and child mortality.
All other indicators of the status of women vis-vis others had sig-nificant effects on infant and child mortality. The highest correlation forthese indicators was found in the proportion of women aged 15-24 who weresingle (W9). The higher this proportion (that is, the higher the age at firstmarriage), the lower were the infant and child mortality rates. (However, itcould be that this relationship in not due to women’s status, but to the exist-ence of an extended family, for example.)
Table 3 shows infant and child mortality rates by women’s statuscluster. The infant and child mortality rates tended to be high in the 10regencies in the north and west coast of West Java, where the status ofwomen was relatively low. By contrast, in the municipalities where the statusof women was relatively high, infant and child mortality rates tended to belower. The exception was Bogor municipality, where the infant and childmortality rates were higher than the avarage rates for cluster 2, apparentlycontradicting the argument that higher status of women is associated withlower infant and child mortality. In addition to exhibiting a generally highstatus of women, Bogor is relatively close to the national capital city wheremodern facilities are readily available. It was therefore unexpected that this
With one exception, in the municipalities of West Java, where the status ofwomen is relatively high, the infant and child mortality rates tend to be lower.
18 Asia-Pacific Population Journal, Vol. 6, No. 1
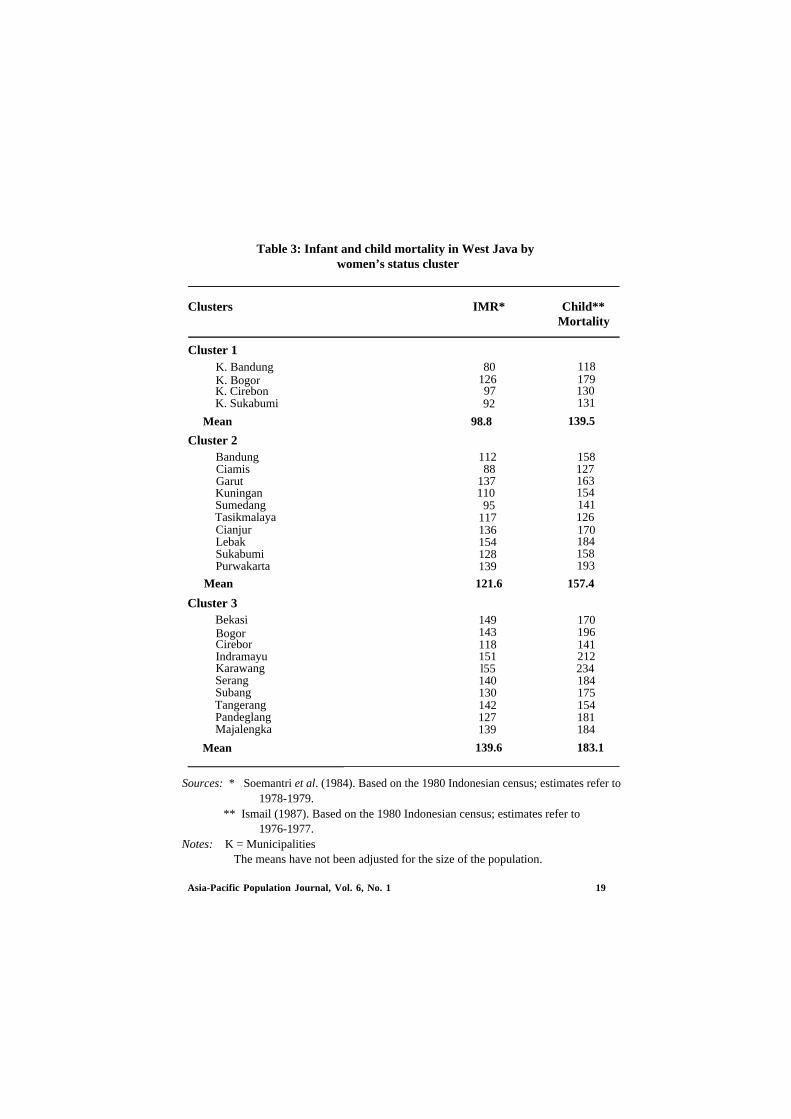
Table 3: Infant and child mortality in West Java bywomen’s status cluster
Clusters IMR* Child**Mortality
Cluster 1K. BandungK. BogorK. CirebonK. Sukabumi
Mean
Cluster 2BandungCiamisGarutKuninganSumedangTasikmalayaCianjurLebakSukabumiPurwakarta
Cluster 3BekasiBogorCireborIndramayuKarawangSerangSubangTangerangPandeglangMajalengka
Mean
80126 179
92
98.8
112 15888 127
137110
95117136 170154128139
Mean 121.6
149 170143 196118 141151 212l55 234140 184130 175142 154127 181139 184
139.6 183.1
118
97 130131
139.5
163154141126
184158193
157.4
Sources: * Soemantri et al. (1984). Based on the 1980 Indonesian census; estimates refer to1978-1979.
** Ismail (1987). Based on the 1980 Indonesian census; estimates refer to1976-1977.
Notes: K = MunicipalitiesThe means have not been adjusted for the size of the population.
Asia-Pacific Population Journal, Vol. 6, No. 1 19
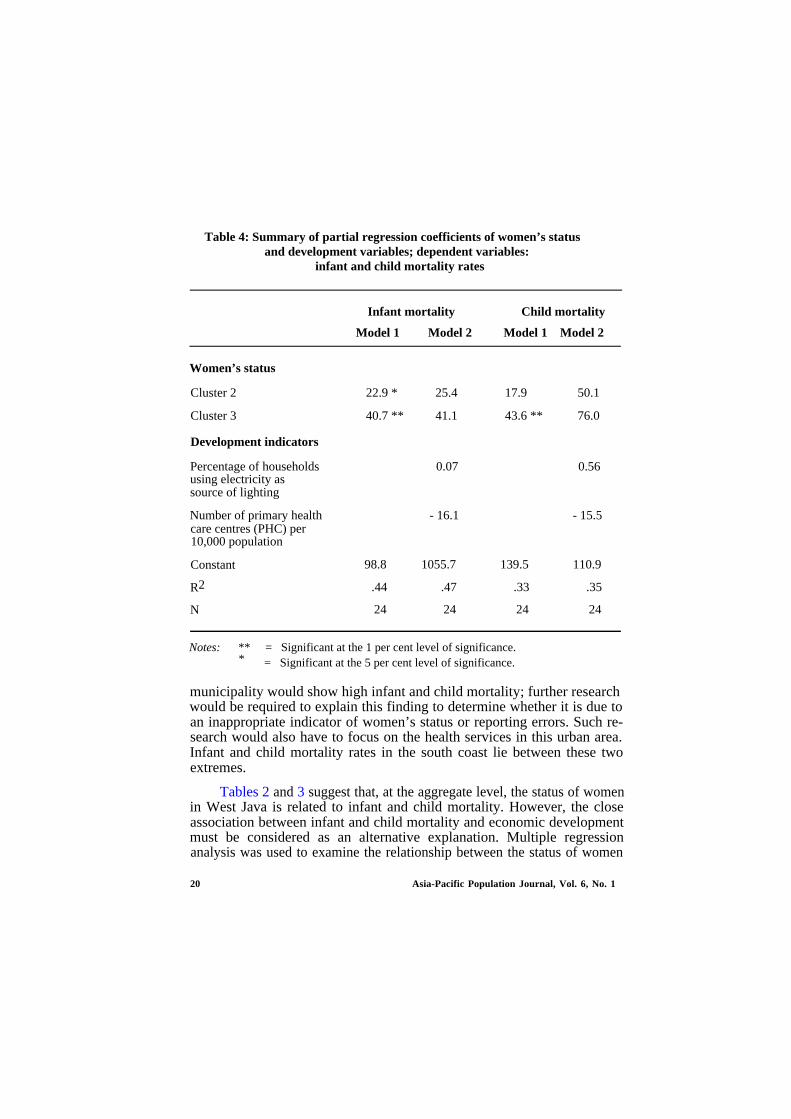
Table 4: Summary of partial regression coefficients of women’s statusand development variables; dependent variables:
infant and child mortality rates
Infant mortality Child mortality
Model 1 Model 2 Model 1 Model 2
Women’s status
Cluster 2 22.9 * 25.4 17.9 50.1
Cluster 3 40.7 ** 41.1 43.6 ** 76.0
Development indicators
Percentage of households 0.07 0.56using electricity assource of lighting
Number of primary health - 16.1 - 15.5care centres (PHC) per10,000 population
Constant
R2
N
98.8 1055.7 139.5 110.9
.44 .47 .33 .35
24 24 24 24
Notes: ** = Significant at the 1 per cent level of significance.* = Significant at the 5 per cent level of significance.
municipality would show high infant and child mortality; further researchwould be required to explain this finding to determine whether it is due toan inappropriate indicator of women’s status or reporting errors. Such re-search would also have to focus on the health services in this urban area.Infant and child mortality rates in the south coast lie between these twoextremes.
Tables 2 and 3 suggest that, at the aggregate level, the status of womenin West Java is related to infant and child mortality. However, the closeassociation between infant and child mortality and economic developmentmust be considered as an alternative explanation. Multiple regressionanalysis was used to examine the relationship between the status of women
20 Asia-Pacific Population Journal, Vol. 6, No. 1
and infant and child mortality after controlling for economic development.Due to data limitations, the development measures were limited to only afew dimensions and thus do not provide a holistic measure of economic andsocial development. The indicators used were the percentage of householdsusing electricity as the main source of lighting and the number of primaryhealth care centres (PHC) per 10,000 population.
Table 4 summarises the paritial regression coefficients. Model 1 of theregression shows that infant and child mortality vary by women’s statuscluster. Infant mortality for women in status cluster 2 is 22.9 deaths perthousand live births higher than for women in status cluster 1, whereas thefigure for women in status cluster 3 is 40.7 deaths per thousand live birthshigher than for women in status cluster 1. Child mortality for women instatus cluster 2 was 17.9 per thousand live births higher than for cluster 1,while the figure for cluster 3 was 43.6 deaths per thousand live births higherthan for cluster 1. Model 2 of the regression shows that, even after control-ling for economic development, differences in infant and child mortalityamong the clusters remain. Thus, independently of the level of development,the status of women in West Java plays an important role in explainingvariations in infant and child mortality among regencies.37/
Conclusion
A major difficulty in studying the demographic impact of women’sstatus is the absence of an unambiguous definition of the status of women.Women’s status can be conceptualized on two levels: status within thehousehold and status in society. Education and occupation are often used tomeasure women’s status within the household and in society. Women’s ac-cess to social resources in the household and in society can be measured bytheir educational levels, while their access to material resources can be indi-cated by their occupation and economic activity. In the former, educationand occupation enable a woman to be a decision maker as well as to imple-ment the decisions because she has control over resources within thehousehold. In the latter example, education and occupation provide womenwith opportunities for paid employment in the modern sectors and thisprovides economic independence, thus raising their status.
Women’s status both in the household and in society may affect infantand child mortality through birth spacing and health care. Women who havehigher status either in the household or in society are more likely to have ahigher level of contraceptive use leading to higher levels of birth spacing,which is an important determinant of healthy infants. They are also morelikely to seek more appropriate treatment when their children are ill.
Asia-Pacific Population Journal, Vol. 6, No. 1 21
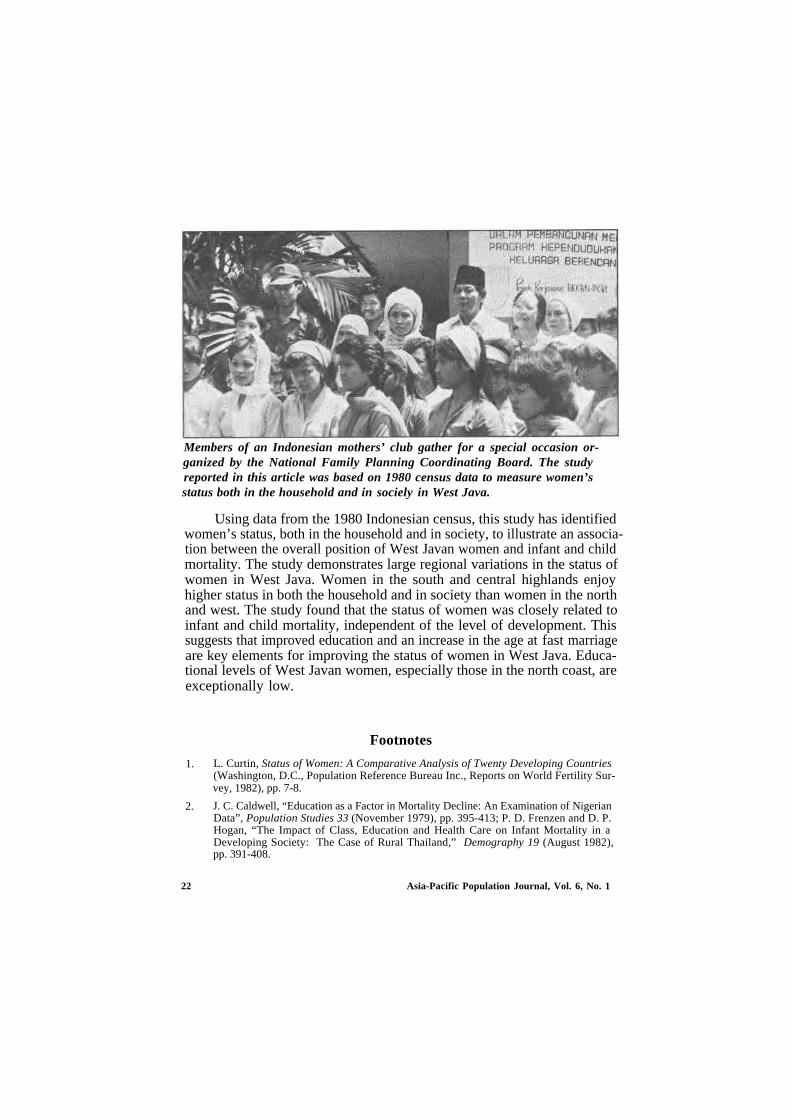
Members of an Indonesian mothers’ club gather for a special occasion or-ganized by the National Family Planning Coordinating Board. The studyreported in this article was based on 1980 census data to measure women’sstatus both in the household and in sociely in West Java.
Using data from the 1980 Indonesian census, this study has identifiedwomen’s status, both in the household and in society, to illustrate an associa-tion between the overall position of West Javan women and infant and childmortality. The study demonstrates large regional variations in the status ofwomen in West Java. Women in the south and central highlands enjoyhigher status in both the household and in society than women in the northand west. The study found that the status of women was closely related toinfant and child mortality, independent of the level of development. Thissuggests that improved education and an increase in the age at fast marriageare key elements for improving the status of women in West Java. Educa-tional levels of West Javan women, especially those in the north coast, areexceptionally low.
Footnotes
1.
2.
L. Curtin, Status of Women: A Comparative Analysis of Twenty Developing Countries(Washington, D.C., Population Reference Bureau Inc., Reports on World Fertility Sur-vey, 1982), pp. 7-8.
J. C. Caldwell, “Education as a Factor in Mortality Decline: An Examination of NigerianData”, Population Studies 33 (November 1979), pp. 395-413; P. D. Frenzen and D. P.Hogan, “The Impact of Class, Education and Health Care on Infant Mortality in aDeveloping Society: The Case of Rural Thailand,” Demography 19 (August 1982),pp. 391-408.
22 Asia-Pacific Population Journal, Vol. 6, No. 1
3.
4.
5.
6.
7.
8.
9.
10.
11.
12.
13.
14.
15.
16.
17.
18.
19.
G. Hugo, Population Mobility in West Java (Yogyakarta, Gadjah Mada University, 1981),pp. 28-29.
Soemantri, Soeharsono, Cholis Bachroen and Siti Aisah, Variasi Angka Kematian BayiMenurut Daerah di Pulau Java (Regional Differences in Infant and Child MortalityRates in Java) (Surabaya: Pusat Penelitian dan Pengembangan Pelayanan KesehatanDepartement Kesehatan R.I., 1984), pp. 7- 10.
Y. S. Al Haddar, “The Position of Betawi Women: Native People of Jakarta”, (master’sthesis, Australian National University, 1982), p. 22.
Budiarto and Sunaryo, “Kematian Bayi dan Anak di Jawa Barat (Infant and Child Mor-tality in West Java),” in Analisa Kependudukan Berdasarkan Data Sensus Penduduk 1980Buku I (Jawa) (Jakarta, Central Bureau of Statistics, 1985), pp. 55-85, esp. pp. 66-69; L.Ismail, “An Areal Analysis of Infant and Child Mortality in West Java,” (master’s thesis,Australian National University, 1987) pp. 64-68.
C. Safilious-Rothschild, “Female Power, Autonomy and Demographic Change in ThirdWorld,” in Women’s Roles and Population Trends in the Third World, R Anker, M.Buvinic and Y. H. Youssef (eds.), (London, Croom Helm, 1982), pp. 117-132, esp. 129.
Ibid., pp. 128-129.
Curtin, op. cit., p. 7.
R. Dixon, Rural Women at Work: Strategies for Development in South Asia (Baltimore,The Johns Hopkins University Press, 1978) p. 15.
Safilious-Rothschild, op. cit., pp. 117-132, esp. 118.
L. Cornor, “Integration of Women’s Concerns into Human Resources Development,” inBackground to an Integrated Plan of Action on Human Resources Development forESCAP Region, (Bangkok, United Nations, ESCAP, 1988), pp. 194-229, esp. 208.
Curtin, op. cit., p. 7.
United Nations, Socio-Economic Differentials in Child Mortality in Developing Countries(New York, United Nations, 1984), p. 21.
H. Ware, “Effects of Maternal Education, Women’s Roles and Child Care on Child Mor-tality,” Population and Development Review Supplement to vol. 10 (March 1984),pp. 191-214, esp. 194.
R. L. Blumberg, “Fairy Tales and Facts: Economy, Family, Fertility and the Female,” inWomen and World Development with Annotated Bibliography, I. Tinker, M. B. Bramsonand M. Buvinic (eds.), (New York, Praegar, 1976), pp. 12-21, esp. 19.
T. Dyson and M. Moore, “On Kinship Structure, Female Autonomy and DemographicBehavior in India,” Population and Development Review (March 1983), pp. 35-60),esp. 54.
H. Ware, Women, Demography and Development (Canberra, Australian National Univer-sity, 1981), 88; S. H. Cochrane, Fertiliy and Education: What Do We Really Know (Bal-timore, The John Hopkins University Press, World Bank Paper 26, 1979) p. 33.
B. M. Popkin and R. M. Doan, “Women Roles, Time Allocation and Health,” in WhatWe Know About Health Transition: The Cultural, Social and Behavioural Determinants ofHealth, J. C. Caldwell, S. Findley, P. Cladwell, G. Santow, W. Coaford, J. Braid and D. P.Freeman (eds.), (Canberra, Health Transition Centre, Australian National University,Health Transition Series No. 2, vol. 2, 1989) pp. 683-706, esp. 695.
Asia-Pacific Population Journal, Vol. 6, No. 1 23
20.
21.
22.
23.
24.
25.
26.
27.
28.
29.
30.
31.
32.
33.
34.
35.
36.
37.
Ware, Women, Demography and Development, op. cit., p. 80.
Ware, “Effects of Maternal Education, Women’s Roles and Child Care on Child Mor-tality,” op. cit., p. 195.
Caldwell, op. cit., p. 409.
United Nations, Socio-Economic Differentials in Child Mortality in Developing Countries,op. cit., pp. 154-155.
Soemantri, Soeharsono, Cholis Bachroen and Siti Aisah, op. cit, p. 8.
Ismail, op. cit., p. 48.
United Nations, Manual X: Indirect Techniques for Demographic Estimation (New York,United Nations, 1983), pp. 74-81.
G. Santow, “Fertilitas dan Mortalitas Anak (Fertility and Child Mortality),” in PedomanAnalisa Data Sensus Indonesia 1971-1980, P. McDonald (ed.), (Canberra, TheAustralian Vice-Chancellors’ Committee, Australian University International Develop-ment Program, 1983), pp. 211- 261, esp. 213.
United Nations, Manual X: Indirect Techniques for Demogaphic Estimation, op. cit.,pp. 73-74.
There were no significant differences in the age structure. of the population aged 15-49years among regencies, so that age standardization was not required.
Safilious-Rothschild, op. cit., p. 130.
M. S. Aldenderfer and R. K. Blashfield, Cluster Analysis (California, Sage Publications,1986).
Y. Raharjo and V. Hull, “Employment Patterns of Educated Women in IndonesianCities,” in Women in the Urban and Industrial Workforce Southeast and East Asia, GavinW. Jones (ed.), (Canberra, Australian National University, Development Studies CentreMonograph No. 33,1984), pp. 101-132, esp. 121.
J. Hardjono and H. Hill, “West Java: Population and Regional Diversity,” in Unity andDiversity Regional Economic Development in Indonesia Since 1970, H. Hill (ed.) (Sin-gapore, Oxford University Press, 1989), pp. 254-282, esp. 257.
Sudarti, Meiwita B. Iskandar, Solita Sarwono, Anwar Hasan and Djoko Hartono, Persep-si Masyarkat Tentand Sehat-Sakit dan Posyandu: Survei Keluarga Berencana, Kesehatandi Kabupaten Indramayu, Jawa Barat, 1986 (Societal Perceptions of Health and Illnessand Integrated Posts: Research Report of the Family Planning, Health Survey in In-dramayu Regency, West Java, 1986), (Jakarta, Survei Kesehatan Masyarakat UniversitasIndonesia, 1988), p. 24.
H. Nurdin, Hal-Ikhwal Penduduk Propinsi Jawa Barat (The Population of West Java),(Jakarta, Lambaga Demografi Fakultas Ekonomi Universitas Indonesia, 1976), p. 39.
P. McDonald and E. Abdulrachaman, Marriage and Divorce in West Jawa (Jakarta,Demographic Institute Faculty of Economic University of Indonesia, 1974), p. 105.
The differences in infant and child mortality by cluster disappear if the percentage ofpopulation urban is used as an indicator of development. However, as some of the unitsof analysis are based on levels of urbanization (the municipalities), this indicator was notincluded in the regressions. Differences in infant and child mortality among the 20regencies (kabupaten) remain after controlling for the percentage population urban.
24 Asia-Pacific Population Journal, Vol. 6, No. 1
The KAP-Gap in Nepal:Reasons for Non-use ofContraception Among
Couples with an UnmetNeed for Family Planning
If contraceptive use is to be increased, thefamily planning programme will have to balance
its emphasis on and its provision of temporary andpermanent methods of contraception
By Ashoke Shrestha, John Stoeckel andJayanti Man Tuladhar*
Fertility and family planning surveys conducted in developing countriesaround the world have consistently reported an inverse relationship betweenfertility preferences and the practice of contraception. These surveys havealso shown, however, that substantial proportions of women stating that they
* The authors of this article are Ashoke Shrestha, New Era, Kathmandu, Nepal; John Stoeck-el, the Population Council, Bangkok, Thailand, Jayanti Man Tuladhar, Planning, Researchand Evaluation Section, Nepal FP/MCH Project, Kathmandu. This study was conducted byNew Era, under a Population Council subcontract with the Demographic and Health Sur-veys Project, IRD, Westinghouse.
Asia-Pacific Population Journal, Vol. 6, No. 1 25
do not want any more children are not practising contraception. Theseproportions generally range from 25 to 50 per cent, and reach even higherlevels in Africa.1/ This discrepancy between women’s stated preference tohave no more children and their non-use of contraception is euphemisticallyreferred to as the “KAP-Gap”.
Results from previous survey research which report the existence of aKAP-Gap provide little insight into the reasons for a “Gap” betweenknowledge, attitudes and practice (KAP). An analysis of World FertilitySurvey (WFS) findings from 18 less developed countries provides propor-tions of currently married women of reproductive age who did not want anymore children and who were not practising family planning. However, dataon reasons for not practising were not collected by WFS and no furtheranalysis was possible beyond describing the social and demographic charac-teristics of non-users.2/
The Contraceptive Prevalence Surveys (CPS) collected information onreasons related to contraception for non-use of family planning. However,the categories of reasons utilized were far too general to provide anythingmore than a cursory understanding of why women were not using con-traception. Among 11 countries these categories included: “no knowledge ortoo expensive”, “having had or fearing side-effects”, “religious reasons” and“husband opposes”.3/
As with most developing countries, Nepal is also characterized by thepresence of a “KAP-Gap”. A survey conducted in 1986 indicated that,among currently married fecund women of reproductive age, the proportionwho either want no more children or who want to delay their next birth was59 per cent.4/ However, the proportion of women who were currently usingcontraception was only 15 per cent.5/ This raises the fundamental questionof why prevalence rates are so low, and more specifically, what are thereasons for non-use of contraception among those women who either do notwant any more children or want to delay the birth of their next child.
The objective of the present study is to move beyond previous researchon the KAP-Gap by conducting an in-depth investigation which would iden-tify the reasons for non-use of family planning among women in Nepal whowant to space or limit the birth of their children. The term “spacers” refersto those women who are fecund, not currently pregnant, have knowledge offamily planning, desire additional children some time in the future and arenot currently using contraception. The term “limiters” refers to those womenwho are fecund, not currently pregnant, have knowledge of family planning,desire no additional children and are not currently using contraception.
26 Asia-Pacific Population Journal, Vol. 6, No. 1
Methodology
The study was conducted in two phases. In the first phase, 16 focusgroup sessions were conducted among females identified as having anunmet need for family planning, i.e. who wanted to space or limit the birthof their children. The information obtained from these discussions was usedto design questions for inclusion in the second phase, a nationally repre-sentative sample survey.
The focus groups revealed a broad spectrum of reasons for non-use ofcontraception. A total of 40 reasons were identified: 20 were physiologicalor health related, 12 were socio-economically and culturally related andeight were related to the national family planning programme. From thetotal, 22 of the most frequently given reasons were selected and incor-porated into the in-depth questionnaire as specific closed-ended questions.
The sample design utilized in the study was a multi-stage stratifieddesign applied to rural and urban areas where at each stage of selection(district, panchayat, or village wards) the sample was drawn on the basis ofthe probability proportional to the size (PPS) of the particular units. In thefinal stage, a complete listing of households was prepared for each villageward selected and approximately 40 households were selected with a sys-tematic random sampling procedure. Interviews were conducted in 3,432rural households and 1,277 urban households. From the rural and urbanhouseholds, 4,009 women and 1,268 women, respectively, were identified aseligible, i.e. they wanted to either space or limit the birth of their children.
All spacers and limiters were administered the in-depth questionnairewhich focused primarily upon reasons for non-use of contraceptives. Thequestionnaire initially used an open-ended question to solicit spontaneousreasons for non-use, followed by questions which asked the respondent toidentify the contraceptive method to which the reasons referred. In addi-tion, the respondent was asked to identify the reason that was the mostimportant for their non-use of contraceptives and the method to which thisreferred.
This series of questions was followed by closed-ended questions whichprobed for any additional reasons the respondent had for non-use. Thereasons for non-use referred to in these questions were identified from theresults of the focus groups.
Asia-Pacific Population Journal, Vol. 6, No. 1 27
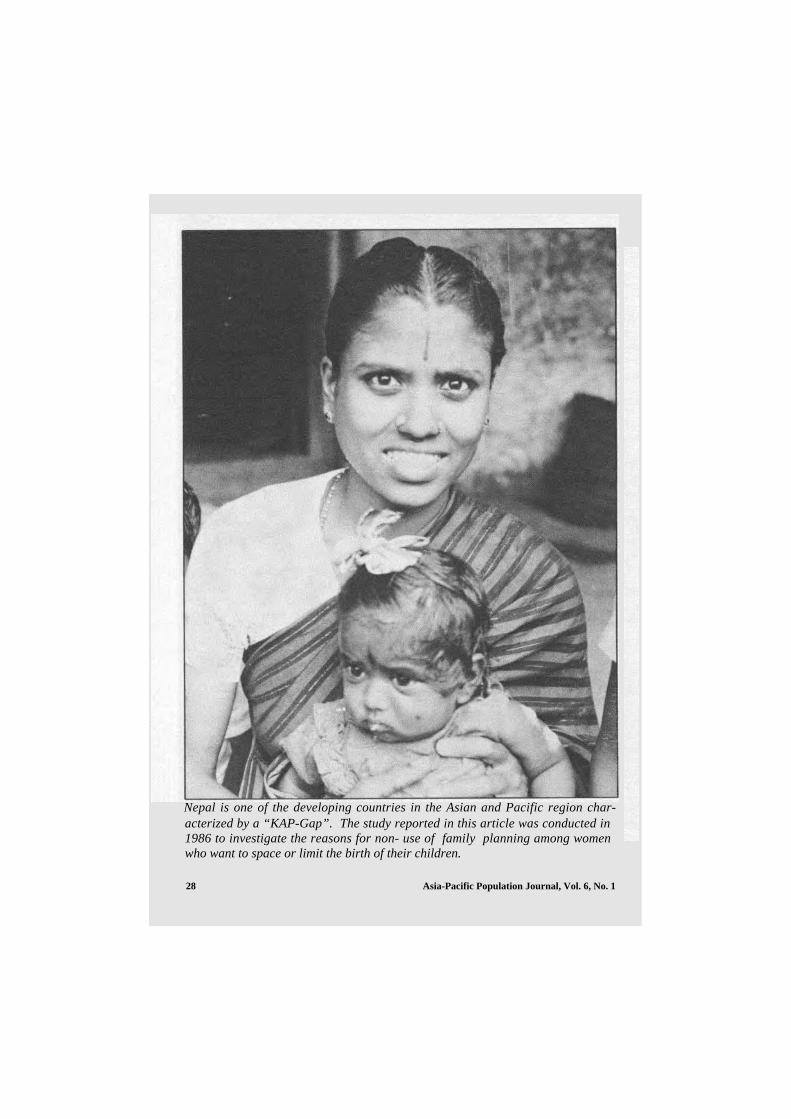
Nepal is one of the developing countries in the Asian and Pacific region char-acterized by a “KAP-Gap”. The study reported in this article was conducted in1986 to investigate the reasons for non- use of family planning among womenwho want to space or limit the birth of their children.
28 Asia-Pacific Population Journal, Vol. 6, No. 1
Results
The unmet demand population
The unmet demand population accounted for almost one-third of thetotal sample of 5,152 women. This proportion was obtained by screeningfrom the original sample women who had any one of six possible charac-teristics. The following table presents the proportions of women who werefound with these characteristics:
Characteristics Number Percentage of allwomen interviewed
(N = 5,152)
Pregnant at time of interview
No knowledge of a modern familyplanning method
Currently using a modern familyplanning method
Consider themselves to be infecund
Undecided about whether to haveanother child
Desire the next child as soon as possible
Sub-total
Spacers and limiters
Total
Reasons for non-use of family planning
570
319
1,182 22.9
615
89
747 14.5
3,522 68.4
1,630 31.6
5,152 100.0
11.1
6.2
11.9
1.7
The analysis of the reasons for the non-use of family planning ispresented in two parts. The first analyzes the response of spacers andlimiters to each of the closed-ended questions on reasons for non-usedeveloped from the reasons identified through the focus group sessions. Thesecond part analyzes the responses to the open-ended question on reasonsfor non-use, focusing upon the reason given by respondents as their mostimportant ones for not practising a specific method of contraception.
Asia-Pacific Population Journal, Vol. 6, No. 1 29
Tab
le l:
Pro
port
ions
of
spac
ers
and
lim
iter
s no
t us
ing
sele
cted
con
trac
epti
vem
etho
ds b
y th
eir
reas
ons
for
non-
use
of t
hese
met
hods
Rea
sons
for
non
-use
of f
amily
pla
nnin
g
Con
trac
epti
ve m
etho
ds n
ot u
sed
Dep
o,
Lap
aros
copy
V
asec
tom
y
All
othe
r
Tot
alP
ills
D
epo+
Lap
aros
copy
a
nd o
ther
s,
Vas
ecto
my
and
com
bina
tion
spi
lls
excl
udin
g
la
paro
scop
y
o
f m
etho
ds
%
Nva
sect
omy
Spac
ers
Cau
ses
head
ache
,
49.
8
14.
7
1
3.1
3
.2
5
.3
6.1
7.8
1
00
374
wea
knes
s or
nau
sea
Cau
ses
wei
ght l
oss
47
.5
15.
8
2
0.4
1
.0
5
.6
5.6
4.1
1
00
196
Insu
ffic
ient
mon
ey f
or
21.
2
12.
5
3
0.8
2
.3
13.
0
11
.5
8.7
10
0
208
nutr
itiou
s fo
ods
Cur
rent
ly in
poo
r he
alth
45.
5
19.
5
1
8.2
-
1.2
3.9
11.
7
100
7
7C
ause
s he
avy
blee
ding
5
8.3
2
7.9
6.
9
-
-
-
6.9
10
0
144
Hus
band
dis
appr
oves
22.8
1
4.9
19.
3
7.9
0.9
2.
6
31
.6*
100
1
14L
imit
ers
Cau
ses
head
ache
,
15.
1
6.
5
2
6.8
6
.5
9
.3
2
6.2
9.
6
1
00
602
wea
knes
s or
nau
sea
Insu
ffic
ient
mon
ey f
or
3.5
2.1
47.
7
4.4
1
0.8
26.5
5
.1
100
43
4nu
triti
ous
food
s
Cau
ses
wei
ght l
oss
24
.0
8
.4
3
7.6
5
.1
9
.9
1
0.5
4.
5
1
00
334
Cur
rent
ly in
poo
r he
alth
9
.4
2
.9
5
2.5
8
.2
13.
1
10
.2
3.7
10
0
244
Cau
ses
heav
y bl
eedi
ng
45.
9
22.
0
2
4.8
-
-
-
7.3
100
2
18H
usba
nd d
isap
prov
es
6
.4
0
.6
6
6.7
8
.2
5
.3
5.3
7.
5
1
00
171
* N
ote:
Inc
lude
s 13
.2 p
er c
ent w
ho r
efer
red
to c
ondo
ms.
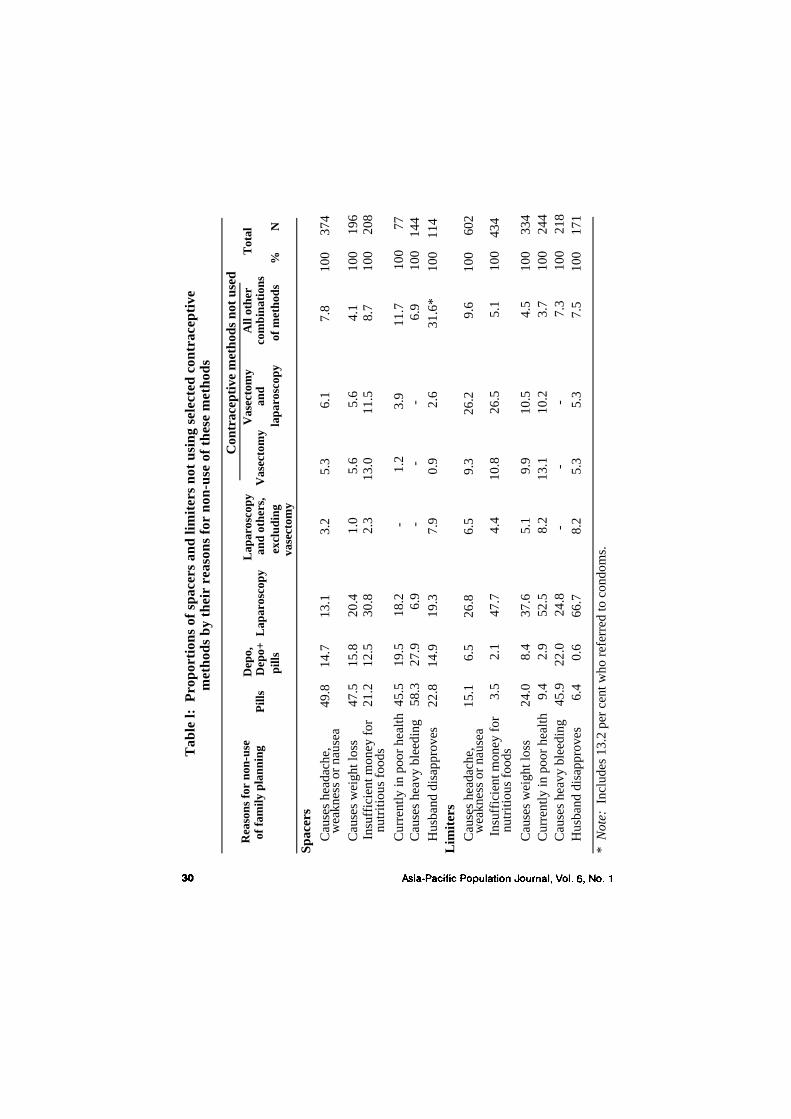
This order of presentation, i.e. results from the closed-ended questionsfollowed by results from the open-ended question, was intended to proceedfrom the general to the more specific. The format results provide the rangeof all possible reasons given for non-use and the distribution of methods towhich these reasons refer. The latter results provide an identification of thedistribution of the most important reasons for non-use of specific methods,and those reasons to which programmatic efforts of change should bedirected.
Closed-ended questions
Table 1 presents the proportions of spacers and limiters who are notusing selected contraceptive methods by their reasons for non-use of thesemethods. About three-fifths of the spacers who indicated they were notusing contraception because it “causes heavy bleeding” were referring to oralpills; and almost half who were not using contraception because they were“currently in poor health” or believed it “causes headache, weakness ornausea” or “weight loss” also referred to oral pills.
“Currently in poor health” and “causes heavy bleeding” were reasonsgiven for not using Depo-Provera by approximately 30 per cent and 20 percent of the spacers, respectively, while “insufficient money to purchasenutritious foods” was given as a reason for not using laparoscopy by almostone-third of the spacers. The finding that spacers gave reasons for not usinglaparoscopy may well indicate their lack of knowledge that female steriliza-tion is a permanent method of contraception.
In general, the reasons given by limiters for not using contraceptionrefer to female sterilization or a combination of female and male steriliza-tion. Among limiters who indicated they were not using contraception be-cause it “causes headache, weakness or nausea”, one-quarter were referringto laparoscopy, and another quarter had in mind laparoscopy and/or vasec-tomy.
Almost half of the limiters not using contraception because of “insuffi-cient money to purchase nutritious foods” were referring to laparoscopy andanother 27 per cent were referring to both laparoscopy and vasectomy. Fur-ther, over one-half and two-thirds of the limiters, respectively, who indicatedthey were not using contraception because they were “currently in poorhealth” or that their “husbands disapproved” were referring to laparoscopy.However, although about 40 per cent of the limiters who were not usingcontraception because it “caused weight loss” were referring to laparoscopy,almost a quarter indicated they were not using oral pills for this reason.
Asia-Pacific Population Journal, Vol. 6, No. 1 31
Similarily, of those limiters who were not practising family planning “be-cause contraception 'causes heavy bleeding' ”, 46 per cent indicated theywere not using oral pills while another 25 per cent were not using laparos-copy for this reason.
Open-ended question
This analysis focuses upon the responses of spacers and limiters to anopen-ended question asking their reason(s) for not practising family plan-ning. In contrast to the previous analysis, this investigation utilized only thereason identified by spacers and limiters as the most important of all reasonsfor their non-use, and assesses the distribution of these reasons for eachcontraceptive method to which the reason refers.
Reasons for non-use of oral pills. As may be seen in table 2, amongspacers the most important reasons for not using oral contraceptive pills arethat they “cause headache, weakness, or nausea” or “affect breast-feedingand dry breast-milk”. Over one-third of spacers gave the former reason andover one-fifth gave the latter reason. Proportions who gave any of theremaining reasons as most important for non-use were all under 11 percent.
Slightly over two-fifths of limiters gave “causes headache, weakness ornausea” as their most important reason for not using pills. Three additionalreasons account for another 40 per cent of the limiters’ reasons for notusing pills, i.e. almost 17 per cent were not using them because theybelieved they cause heavy bleeding, slightly over 12 per cent because theywere “unavailable” and slightly over 12 per cent because they “affectedbreast-feeding”.
Limiters’ reasons for non-use of laparoscopy and vasectomy. As may beseen in table 3, almost half of the limiters indicated that their most impor-tant reason for not undergoing laparoscopy was that it causes weakness andthey could not work. The remaining health reasons account for almostanother third of all reasons. Slightly over 16 per cent said laparoscopycaused severe stomach pain, and slightly less than 8 per cent said it causedphysical discomfort (other than stomach pain), and that they (the limiters)were currently in too poor health to have the operation.
Almost two-thirds of limiters indicated the most important reason fortheir husbands’ non-use of vasectomy was that it would cause weakness andthey would be unable to work. About 16 per cent indicated that their hus-bands were not vasectomized because either their religion or family disap-proved.
32 Asia-Pacific Population Journal, Vol. 6, No. 1
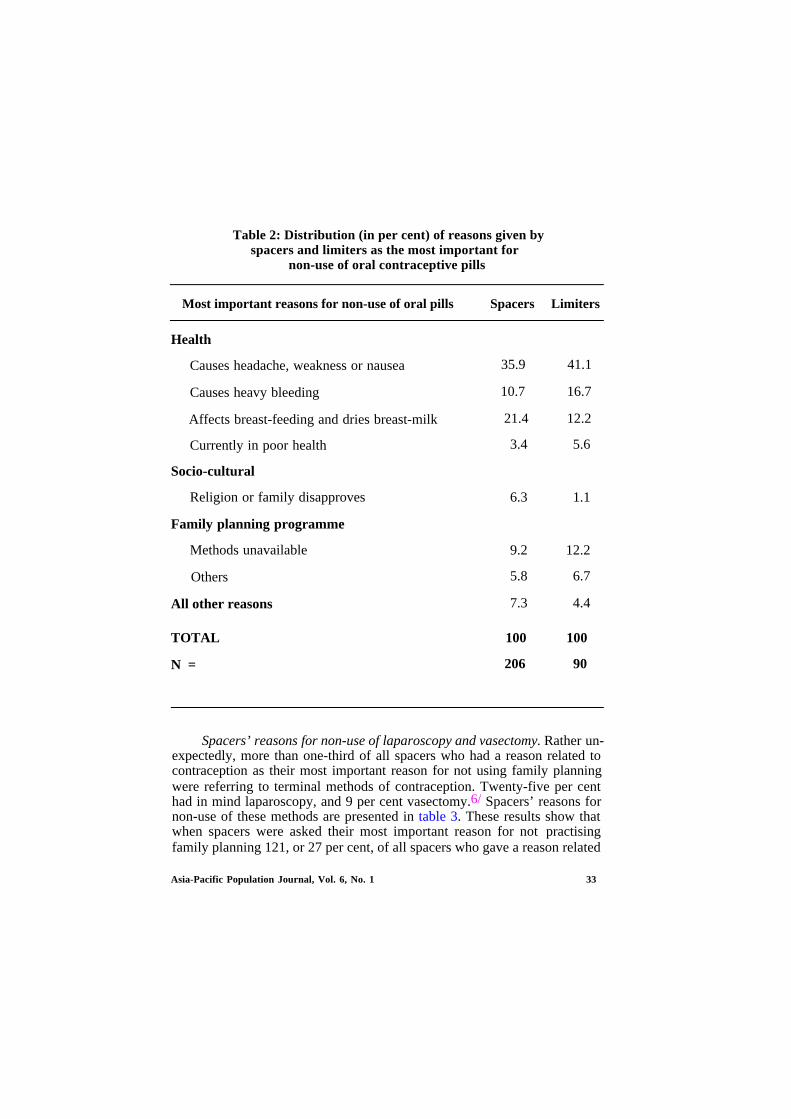
Table 2: Distribution (in per cent) of reasons given byspacers and limiters as the most important for
non-use of oral contraceptive pills
Most important reasons for non-use of oral pills Spacers Limiters
Health
Causes headache, weakness or nausea
Causes heavy bleeding
Affects breast-feeding and dries breast-milk
Currently in poor health
Socio-cultural
Religion or family disapproves
Family planning programme
Methods unavailable
Others
All other reasons
TOTAL
N =
35.9 41.1
10.7 16.7
21.4 12.2
3.4 5.6
6.3 1.1
9.2 12.2
5.8 6.7
7.3 4.4
100
206
100
90
Spacers’ reasons for non-use of laparoscopy and vasectomy. Rather un-expectedly, more than one-third of all spacers who had a reason related tocontraception as their most important reason for not using family planningwere referring to terminal methods of contraception. Twenty-five per centhad in mind laparoscopy, and 9 per cent vasectomy.6/ Spacers’ reasons fornon-use of these methods are presented in table 3. These results show thatwhen spacers were asked their most important reason for not practisingfamily planning 121, or 27 per cent, of all spacers who gave a reason related
Asia-Pacific Population Journal, Vol. 6, No. 1 33
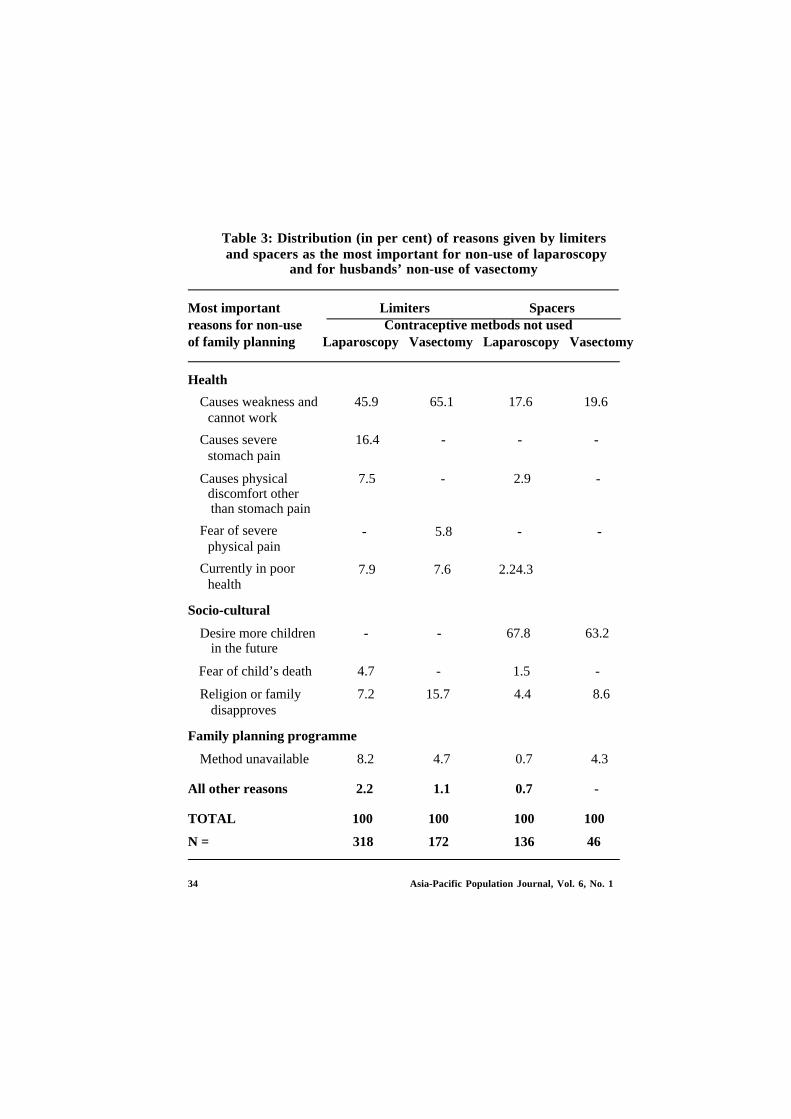
Table 3: Distribution (in per cent) of reasons given by limitersand spacers as the most important for non-use of laparoscopy
and for husbands’ non-use of vasectomy
Most important Limiters Spacersreasons for non-use Contraceptive metbods not usedof family planning Laparoscopy Vasectomy Laparoscopy Vasectomy
Health
Causes weakness andcannot work
Causes severestomach pain
Causes physicaldiscomfort otherthan stomach pain
Fear of severephysical pain
Currently in poorhealth
Socio-cultural
Desire more childrenin the future
Fear of child’s death
Religion or familydisapproves
45.9 65.1 17.6 19.6
16.4 - - -
7.5 - 2.9 -
- 5.8 - -
7.9 7.6 2.24.3
- - 67.8 63.2
4.7 -
7.2 15.7
1.5 -
4.4 8.6
4.3
100
46
Family planning programme
Method unavailable 8.2
All other reasons 2.2
TOTAL 100
N = 318
4.7 0.7
1.1 0.7 -
100 100
172 136
34 Asia-Pacific Population Journal, Vol. 6, No. 1
to contraception responded that they were not practising contraception be-cause they still desired more children. Their response suggests that thewomen who comprise this group are unaware that births can be delayed orspaced by temporary methods of contraception.
The residual group of women, i.e. those who gave reasons other than adesire for more children for not using laparoscopy or vasectomy, illustratean additional problem. That is, they would appear to be unaware thatlaparoscopy and vasectomy are permanent methods of contraception. Thisgroup of women, however, make up a much lower proportion, i.e. 13 percent of all spacers giving a reason related to contraception.
Conclusions
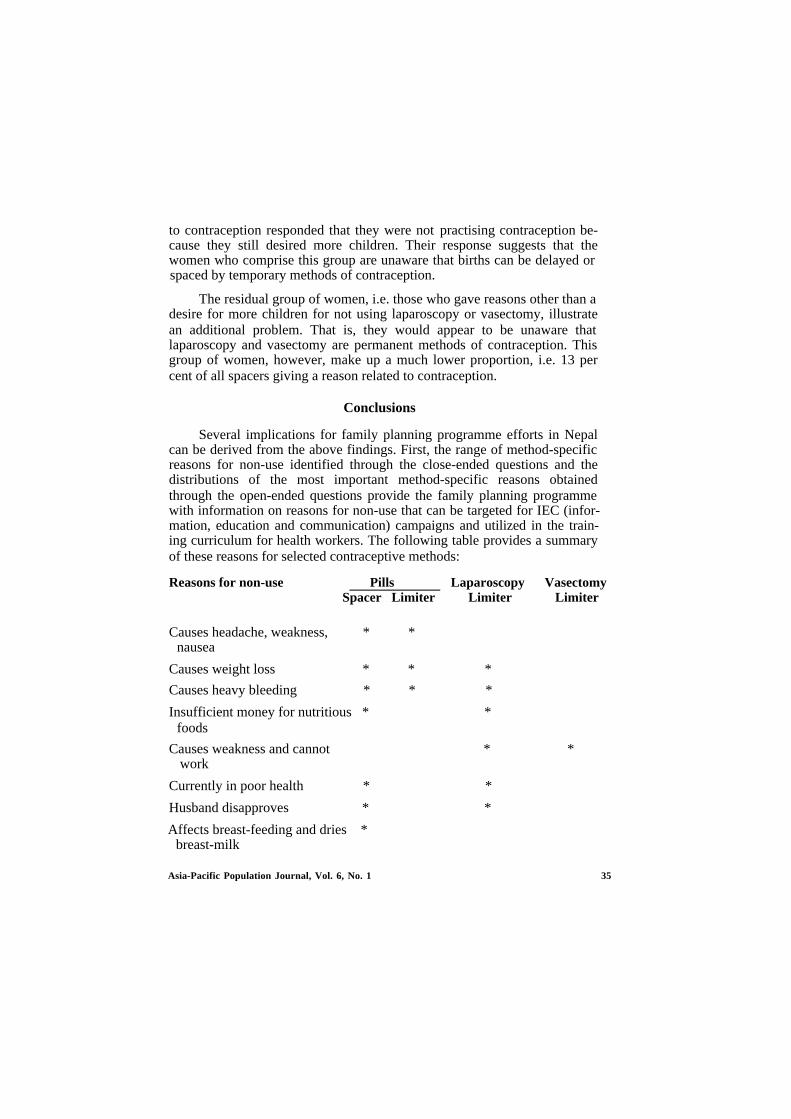
Several implications for family planning programme efforts in Nepalcan be derived from the above findings. First, the range of method-specificreasons for non-use identified through the close-ended questions and thedistributions of the most important method-specific reasons obtainedthrough the open-ended questions provide the family planning programmewith information on reasons for non-use that can be targeted for IEC (infor-mation, education and communication) campaigns and utilized in the train-ing curriculum for health workers. The following table provides a summaryof these reasons for selected contraceptive methods:
Reasons for non-use Pills Laparoscopy VasectomySpacer Limiter Limiter Limiter
Causes headache, weakness, * *nausea
Causes weight loss * * *
Causes heavy bleeding * * *
Insufficient money for nutritious * *foods
Causes weakness and cannot * *work
Currently in poor health * *
Husband disapproves * *
Affects breast-feeding and dries *breast-milk
Asia-Pacific Population Journal, Vol. 6, No. 1 35
The challenge which remains for the family planning programme is todevelop an IEC strategy which would effectively address these reasons fornon-use and reduce the KAP-Gap by persuading substantial proportions ofthe unmet-demand population to practise contraception. The apparentmethod-specific nature of the reasons for non-use strongly suggests that amethod-specific IEC strategy to reduce the KAP-Gap would be thepreferred approach for the family planning programme to follow.
An additional challenge for the programme will be to effectively in-tegrate the information on method-specific reasons into the training cur-riculum for health workers. The objective of this training would be tofamiliarize health workers with potential reasons for non-use and the ex-planations which they could utilize to respond to these reasons from bothprospective and current contraceptive acceptors. This should contribute tothe workers’ effectiveness in alleviating fears and concerns regardingselected methods of contraception during both their motivational and fol-low-up activities.
Second, two of the reasons identified for non-use suggest that the con-duct of family planning programmes in areas where nutrition and/or sup-plemental feeding programmes are operating could contribute to an in-crease in contraceptive use. These reasons, “insufficient money for nutritiousfoods” and “causes weakness and cannot work”, each refer to costs incurredfor food, the former directly and the latter indirectly. From the latterreason, it could be inferred that the inability to work results in lost wages,one impact of which is to reduce the money available to purchase foods.Therefore, if appropriate foods were provided through selected program-mes, a constraint to the practice of contraception may be removed.
Although this conclusion is necessarily hypothetical, further investiga-tions should be conducted to assess whether family planning programmesconducted in areas concurrently with food programmes (e.g. CARE feedingprogrammes) result in higher levels of contraceptive prevalence than areaswhere there is no food programme.
This also suggests the testing of the impact upon contraceptive use of aprogrammatic intervention characterized by the integration of family plan-ning with supplemental feeding programmes. It is obvious that, if a test ofthis intervention found a positive impact upon contraceptive use, then theeffectiveness of the family planning programme would be enhanced throughprogramme policies advocating integration with food programmes.
36 Asia-Pacific Population Journal, Vol. 6, No. 1
Third, health reasons were clearly the most important reasons given bythe unmet demand population for non-use of contraception. Unexpectedly,family planning programme reasons, e.g. problems with availability of andaccessibility to methods, and problems resulting from improper treatment offamily planning clients by clinic staff or field workers, were relatively unim-portant.
An explanation for the apparent unimportance of these family plan-ning programme reasons is that the majority of the unmet demand popula-tion has not attempted to obtain contraception and also has not been con-tacted by service providers. Therefore, they have not been confronted withthe problems of availability of and accessibility to methods and impropertreatment by programme staff. This explanation is supported by the surveydata which found that less than one-tenth of the rural and less than one-third of the urban unmet demand population had ever used a modernmethod of contraception. Furthermore, only 15 per cent of the rural and 18per cent of the urban unmet demand population had ever been visited by afamily planning worker; and only 4 per cent and 16 per cent of the urbanand rural unmet demand populations, respectively, had ever visited a clinic,health post or hospital for family planning services.
As increasing numbers of the unmet demand population attempt toacquire contraceptives, problems of availability and accessibility will nodoubt arise.7/ Similarly, as contacts between prospective clients and familyplanning clinic and field staff increase, problems associated with how clientsare treated by staff may also emerge as important.8/ However, the resultsfrom this study indicate that there are a whole host of other reasons,primarily related to health, which are much more important in accountingfor why the unmet demand population is not practising contraception. Untilthese problems can be solved, it is highly unlikely that any major increase incontraceptive use will occur.
The solution to these problems requires a superior IEC programmeeffort complemented by service providers (both clinic and field workers)who are effective in their motivational and follow-up activities. This wouldinclude increased contacts between the service providers and clients whichnecessarily increases the availability of and accessibility to contraception forthe clients. That is, for contraceptive methods to become more available andaccessible, increased contacts with clients are required. This would providethe family planning workers with the opportunity to conduct motivationalactivities aimed at alleviating health concerns regarding contraception.Therefore, the solution to the problems reflected by health reasons for non-
Asia-Pacific Population Journal, Vol. 6, No. 1 37
use is interrelated with the solution to more contact with family planningworkers and to the problems of availability and accessibility.
Finally, the survey results indicate that the unmet demand population,which comprises 32 per cent of currently married fecund women ofreproductive age, was divided almost equally between spacers and limiters.If contraceptive use is to be increased, the family planning programme willhave to be responsive to the contraceptive needs of each of these groups.This obviously means that the family planning programme would have tobalance its emphasis on and its provision of both temporary and permanentmethods of contraception. The current contraceptive mix in Nepal, withsterilization accounting for 86 per cent of current users, would indicate thatthis balance has not been achieved. This is not meant to imply that theprogramme should not be active in attempting to increase the number oflimiters from spacers. What is being suggested, however, is that the existingunmet demand needs to be met with an appropriate balance of permanentand temporary methods if contraceptive use is to increase in the country.
1.
2.
3.
4.
5.
6.
7.
8.
Footnotes
Richard M. Cornelius, “Toward An Understanding of the KAP GAP”, a paperpresented at the Population Association of America Meeting, San Francisco, April 1986,p. 7.
Charles Westoff and Ann Pebley, “Alternative Measure for Unmet Need for FamilyPlanning in Developing Countries”, International Family Planning Perspectives, vol. 7,No. 4, pp. 126-135.
Leo Morris, G. Lewis, D. Powell, J. Anderson, A. Way, J. Cushing and G. Lawless,Contraceptive Prevalence Surveys: A New Source of Family Planning Data, PopulationReports, Series M, No. 5 (May-June) Population Information Program, Johns HopkinsUniversity.
His Majecty’s Government of Nepal (HMG) Ministry of Health, Family Planning andMCH Project, Planning, Research and Evaluation Section, Nepal Fertility and FamilyPlanning Survey Report, 1986, p, 93.
Ministry of Health, Family Planning and MCH Project and Westinghouse Health Sys-tems, Nepal Contraceptive Prevalence Survey, Report 1981, Kathmandu, Nepal, 1983,p. 124.
Proportions are calculated by dividing the number of spacers who gave a reason for notpractising laparascopy and vasectomy, respectively, by all spacers who gave a reason fornon-use related to contraception.
J. M. Tuladhar, “Effect of Family Planning Availability and Accessibility on Contracep-tive Use in Nepal”, Studies in Family Planning, vol. 18, No. 1 (Jan./Feb.) 1987, pp. 49-53.
S. R. Schuler, et al., “Barriers to Effective Family Planning in Nepal”, Studies in FamilyPlanning, vol. 16, No. 5 (Sept./Oct.), 1985, pp. 260-270.
38 Asia-Pacific Population Journal, Vol. 6, No. 1
Impact of a Self-relianceProgramme on FamilyPlanning Activities in
Bangladesh
High quality counselling andeducation programmes at all levelsshould be initiated to remove many
misconceptions that surroundfamily planning methods
By M. Nurul Islam, M. Mujibur Rahman,M. Kabir and S.A. Mallick*
Despite the long history of the family planning programme inBangladesh, the contraceptive prevalence level remains low and consequent-ly the rate of population growth has remained persistently high. Several fac-tors can be attributed to low contraceptive prevalence. The most importantfactors are low levels of socio-economic development, the lower status of
* The authors of this article are M. Nurul Islam, Department of Statistics, University ofDhaka; M. Mujibur Rahman, Department of Statistics, University of Chittagong; M. Kabir,Department of Statistics, University of Jahangirnagar; and S.A. Mallick, Department ofStatistics, University of Dhaka, Bangladesh. The study was funded by the PopulationDevelopment and Evaluation Unit, Planning Commission, Government of Bangladesh.
Asia-Pacific Population Journal, Vol. 6, No. 1 39
women, the strong preference for sons, the high level of infant and childmortality and limited access to health and family planning facilities.1/
Several authors have argued that Bangladeshi couples are not likely toadopt contraception until they experience improvements in their socio-economic condition. In order to improve the socio-economic conditions ofthe rural masses, various development programmes have been undertakenby different agencies. The Swanirvar (self-reliance) Programme is one suchdevelopment programme.
The Swanirvar Programme has been designed to improve the socio-economic conditions of the rural poor in Bangladesh. In 1979, theprogramme started in 10 upazillas (an administrative region lower than thedistrict level) and a year later, it was expanded to another 65 upazillas.Besides these, during the period 1983-1985, an additional 62 upazillas werebrought under this programme. As of 1989, the programme had been inoperation in 138 upazillas with 10,000 villages covering all geographicalregions of Bangladesh.
The main thrust of the Swanirvar Programme is on income-generatingactivities. A bank credit scheme has been introduced in collaboration withthe Bangladesh Bank. Under this scheme, credit facilities are provided tothe landless and disadvantaged groups of people in the selected Swanirvarupazillas. The amount of loan provided to a family usually ranges from Tk.500 to Tk. 5,000 (approximately $US16 to $160).
Besides the loan scheme, motivation for family planning is an impor-tant aspect of the programme. The other components of the programmeinclude eradication of illiteracy, pisiculture, poultry and cattle raising, plan-tation and increased agricultural output.
The involvement of the community members in development activitiesis also an important strategy of the Swanirvar philosophy. The idea ofwomen’s involvement in income-generating activities was included as a basiccomponent in the programme on the assumption that their participationwould change their reproductive behaviour and that the opportunity to workoutside their homes would result in changing opinions on marital timing andwould give them a greater say in decision making in the family with theultimate desire of achieving a small family through acceptance of familyplanning.
The main purpose of this article is to examine the effectiveness offamily planning activities through the Swanirvar Programme. Specifically, theobjectives are:
40 Asia-Pacific Population Journal, Vol. 6, No. 1
To assess the fertility behaviour of the currently married womenand child mortality for both programme and non-programme areas; To examine the existing knowledge and use of contraception of the
currently married women for both the areas; and To identify the variables influencing the current use of contracep-
tion.
Data and methodology
The study was conducted in the Swanirvar-supported project areas.Since the primary objective of the study is to determine the impact of theproject on fertility and family planning behaviour of the programmebeneficiaries, a post-test control group design was adopted. In order to drawsamples, a three-stage sample design was adopted. Those upazillas in whichthe Swanirvar Programme was active were the primary sampling units(PSUs), the unions were the intermediate sampling units (ISUs) and thevillages were the ultimate sampling units (USUs). In each stage sampleswere drawn randomly. A total of 24 upazillas were selected from a list of 130Swanirvar upazillas from which 2,390 currently married women were inter-viewed. Similarly, five upazillas were selected adjacent to the programmeupazillas and these upazillas were treated as non-programme upazillas. Atotal of 1,000 currently married women were chosen for interview.
Since the self-reliance programme is in operation only in a limitednumber of areas (in about 10 per cent of the total villages), homogeneitywith regard to many of the characteristics of the non-programme area isexpected in the context of Bangladesh. Thus, a smaller size of the com-parison area was thought to be fairly representative in order to permit com-parison between the programme and non-programme areas.
Results
Demographic and socio-economic characteristics
The demographic characteristics such as age and family size of therespondents both in the programme and non-programme areas were con-sidered. The distribution of females by marital status showed the prevalenceof early marriage in both areas. On average, the proportion of unmarriedfemales was higher in the programme area than in the non-programme area.The singulate mean age at marriage (SMAM) calculated from the propor-tion never married for females was almost two years higher in theprogramme area than in of the non-programme area (19.7 years compared
Asia-Pacific Population Journal, Vol. 6, No. 1 41
with 17.5 years). The majority of the respondents live in families consistingof more than four members. The average family size appeared to be slightlyhigher in non-programme area (5.7) as compared with the programme area(5.3).
As may be observed from table 1, a little over 24 per cent of respon-dents in the programme area had no education compared with 54.8 per centin the non-programme area. This large difference can clearly be attributedto the literacy programme undertaken by the Swanirvar Programme.
The vast majority of the respondents, namely 86.8 and 94.9 per cent inthe programme and non-programme areas, respectively, were housewives.More than 6 per cent of the respondents in the programme area were inbusiness and 2.3 per cent were engaged in cottage industries. The percent-age of respondents in these two occupational groups for the non-programmearea was negligible.
As expected, about 75 per cent of respondents in the programme areawere related to members of different organizations. In the non-programmearea, the percentage of membership was only about 12. Among the respon-dents in the programme area who had membership in an organization, about59 per cent of them belonged to the Swanirvar category.
Fertility and mortality
In the absence of information on current births, children ever born(CEB) data were used to provide the levels of fertility by using indirectmeans.
Despite the small difference in the level of fertility in terms of CEB inthe two areas (table 2), continued child-bearing, even at the end of the con-ventional reproductive age span among the women of both areas, is quitenoticeable from the addition of, on average, one child as the women passthrough the age groups 30-34 to 35-39 and nearly another child from age35-39 to 40-44.
As can be noted from the table, the mean number of children living inthe programme and non-programme areas are 2.87 and 2.85, respectively,thus showing virtually no difference. The comparison by age group revealsthat the means are consistently higher in the non-programme area comparedwith the programme area. This is expected because the average CEB wasalso high in the non-programme area.
The age-specific fertility rates and the implied total fertility rates(TFRs) derived through the use of the Gompertz relational model are
42 Asia-Pacific Population Journal, Vol. 6, No. 1
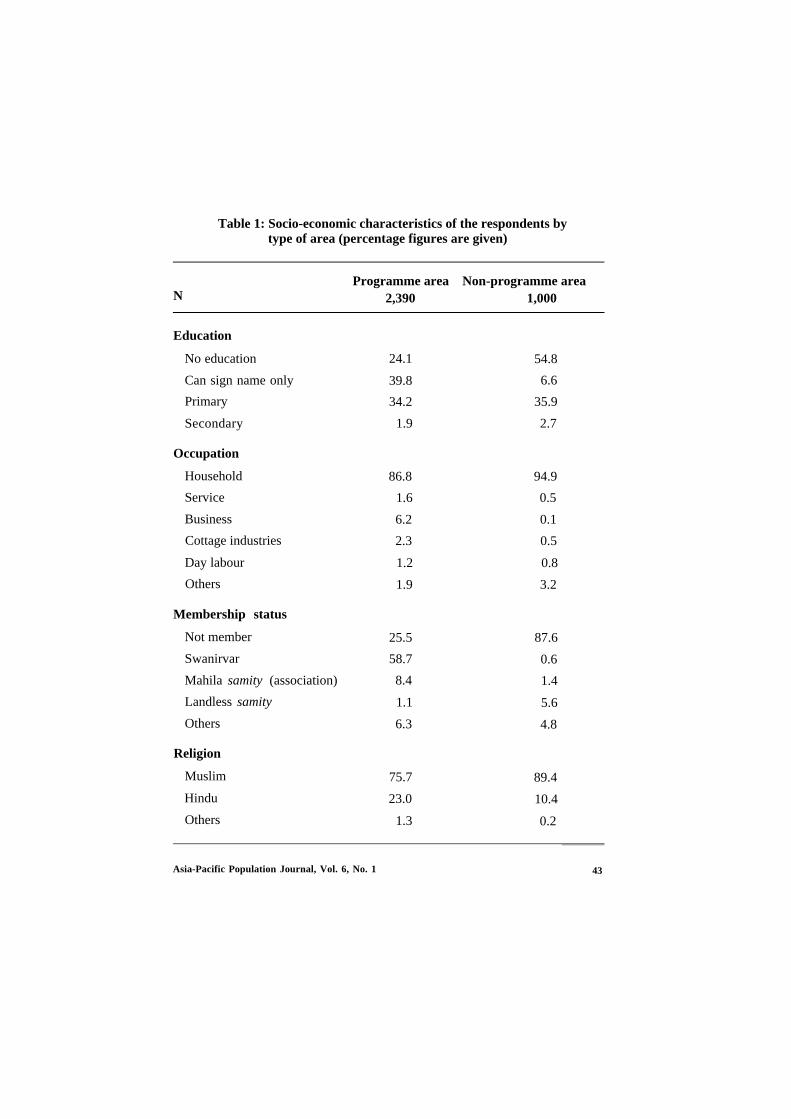
Table 1: Socio-economic characteristics of the respondents bytype of area (percentage figures are given)
NProgramme area Non-programme area
2,390 1,000
Education
No education
Can sign name only
Primary
Secondary
Occupation
Household
Service
Business
Cottage industries
Day labour
Others
Membership status
Not member
Swanirvar
Mahila samity (association)
Landless samity
Others
Religion
Muslim
Hindu
Others
24.1 54.8
39.8 6.6
34.2 35.9
1.9 2.7
86.8 94.9
1.6 0.5
6.2 0.1
2.3 0.5
1.2 0.8
1.9 3.2
25.5 87.6
58.7 0.6
8.4 1.4
1.1 5.6
6.3 4.8
75.7 89.4
23.0 10.4
1.3 0.2
Asia-Pacific Population Journal, Vol. 6, No. 1 43
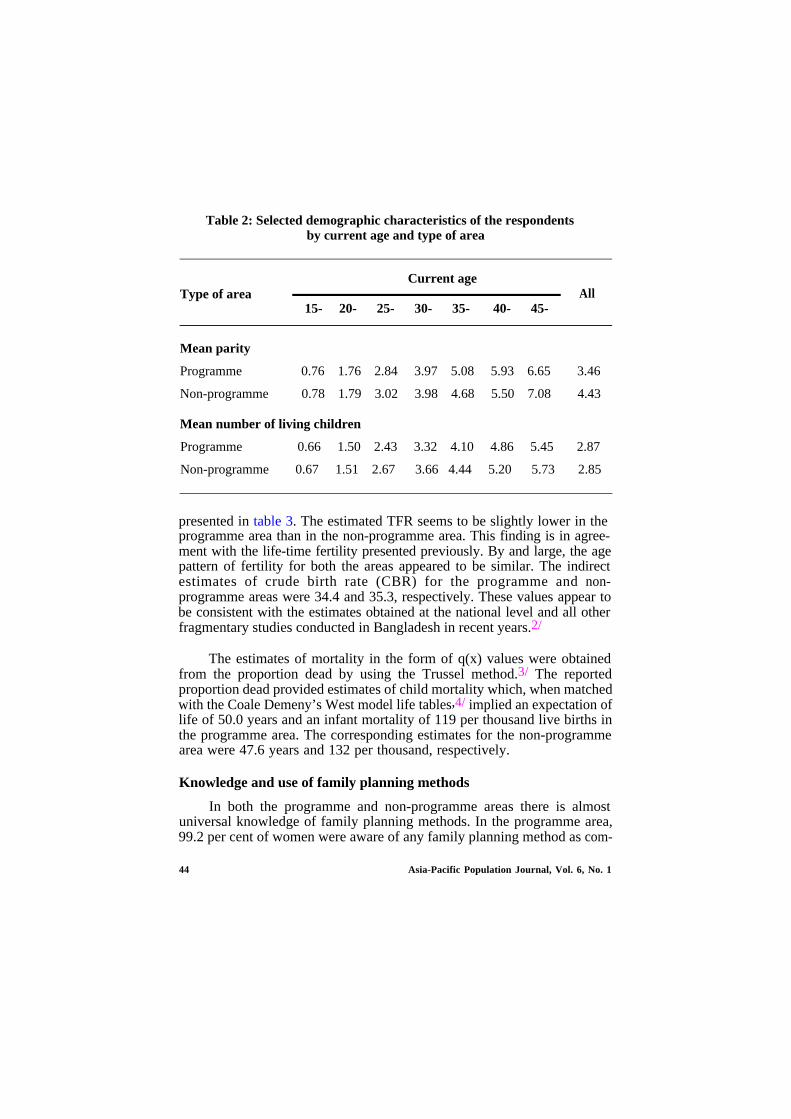
Table 2: Selected demographic characteristics of the respondentsby current age and type of area
Type of areaCurrent age
All15- 20- 25- 30- 35- 40- 45-
Mean parity
Programme
Non-programme
0.76 1.76 2.84 3.97 5.08 5.93 6.65 3.46
0.78 1.79 3.02 3.98 4.68 5.50 7.08 4.43
Mean number of living children
Programme 0.66 1.50 2.43 3.32 4.10 4.86 5.45 2.87
Non-programme 0.67 1.51 2.67 3.66 4.44 5.20 5.73 2.85
presented in table 3. The estimated TFR seems to be slightly lower in theprogramme area than in the non-programme area. This finding is in agree-ment with the life-time fertility presented previously. By and large, the agepattern of fertility for both the areas appeared to be similar. The indirectestimates of crude birth rate (CBR) for the programme and non-programme areas were 34.4 and 35.3, respectively. These values appear tobe consistent with the estimates obtained at the national level and all otherfragmentary studies conducted in Bangladesh in recent years.2/
The estimates of mortality in the form of q(x) values were obtainedfrom the proportion dead by using the Trussel method.3/ The reportedproportion dead provided estimates of child mortality which, when matchedwith the Coale Demeny’s West model life tables,4/ implied an expectation oflife of 50.0 years and an infant mortality of 119 per thousand live births inthe programme area. The corresponding estimates for the non-programmearea were 47.6 years and 132 per thousand, respectively.
Knowledge and use of family planning methods
In both the programme and non-programme areas there is almostuniversal knowledge of family planning methods. In the programme area,99.2 per cent of women were aware of any family planning method as com-
44 Asia-Pacific Population Journal, Vol. 6, No. 1
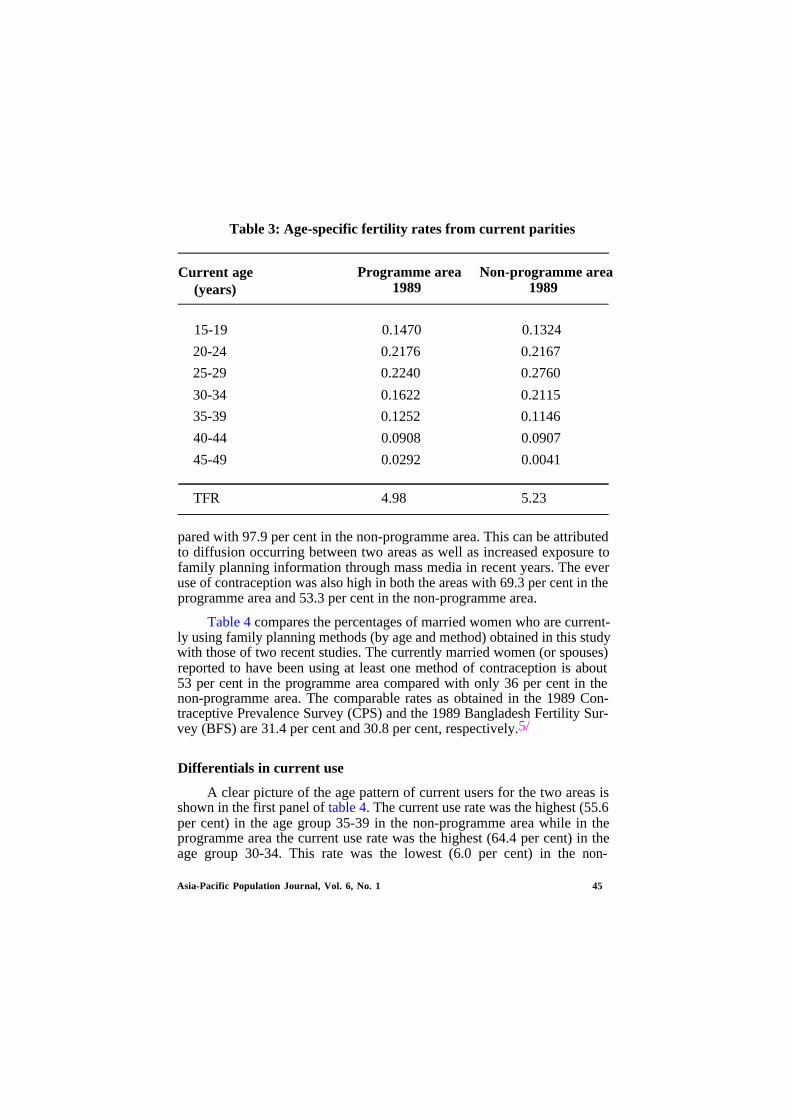
Table 3: Age-specific fertility rates from current parities
Current age(years)
Programme area Non-programme area1989 1989
15-19 0.1470 0.1324
20-24 0.2176 0.2167
25-29 0.2240 0.2760
30-34 0.1622 0.2115
35-39 0.1252 0.1146
40-44 0.0908 0.0907
45-49 0.0292 0.0041
TFR 4.98 5.23
pared with 97.9 per cent in the non-programme area. This can be attributedto diffusion occurring between two areas as well as increased exposure tofamily planning information through mass media in recent years. The everuse of contraception was also high in both the areas with 69.3 per cent in theprogramme area and 53.3 per cent in the non-programme area.
Table 4 compares the percentages of married women who are current-ly using family planning methods (by age and method) obtained in this studywith those of two recent studies. The currently married women (or spouses)reported to have been using at least one method of contraception is about53 per cent in the programme area compared with only 36 per cent in thenon-programme area. The comparable rates as obtained in the 1989 Con-traceptive Prevalence Survey (CPS) and the 1989 Bangladesh Fertility Sur-vey (BFS) are 31.4 per cent and 30.8 per cent, respectively.5/
Differentials in current use
A clear picture of the age pattern of current users for the two areas isshown in the first panel of table 4. The current use rate was the highest (55.6per cent) in the age group 35-39 in the non-programme area while in theprogramme area the current use rate was the highest (64.4 per cent) in theage group 30-34. This rate was the lowest (6.0 per cent) in the non-
Asia-Pacific Population Journal, Vol. 6, No. 1 45
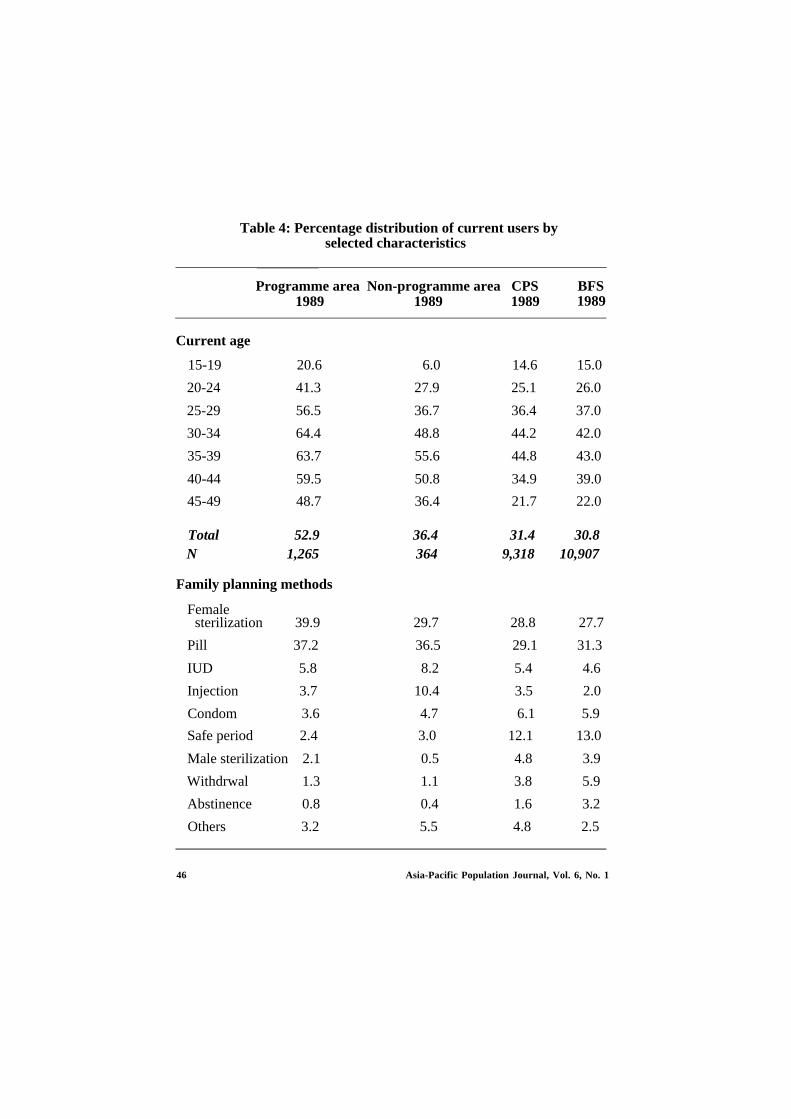
Table 4: Percentage distribution of current users byselected characteristics
Programme area Non-programme area CPS1989 1989 1989
BFS1989
Current age
15-19 20.6 6.0 14.6 15.0
20-24 41.3 27.9 25.1 26.0
25-29 56.5 36.7 36.4 37.0
30-34 64.4 48.8 44.2 42.0
35-39 63.7 55.6 44.8 43.0
40-44 59.5 50.8 34.9 39.0
45-49 48.7 36.4 21.7 22.0
Total 52.9 36.4 31.4 30.8N 1,265 364 9,318 10,907
Family planning methods
Femalesterilization 39.9 29.7 28.8 27.7
Pill 37.2 36.5 29.1 31.3
IUD 5.8 8.2 5.4 4.6
Injection 3.7 10.4 3.5 2.0
Condom 3.6 4.7 6.1 5.9
Safe period 2.4 3.0 12.1 13.0
Male sterilization 2.1 0.5 4.8 3.9
Withdrwal 1.3 1.1 3.8 5.9
Abstinence 0.8 0.4 1.6 3.2
Others 3.2 5.5 4.8 2.5
46 Asia-Pacific Population Journal, Vol. 6, No. 1
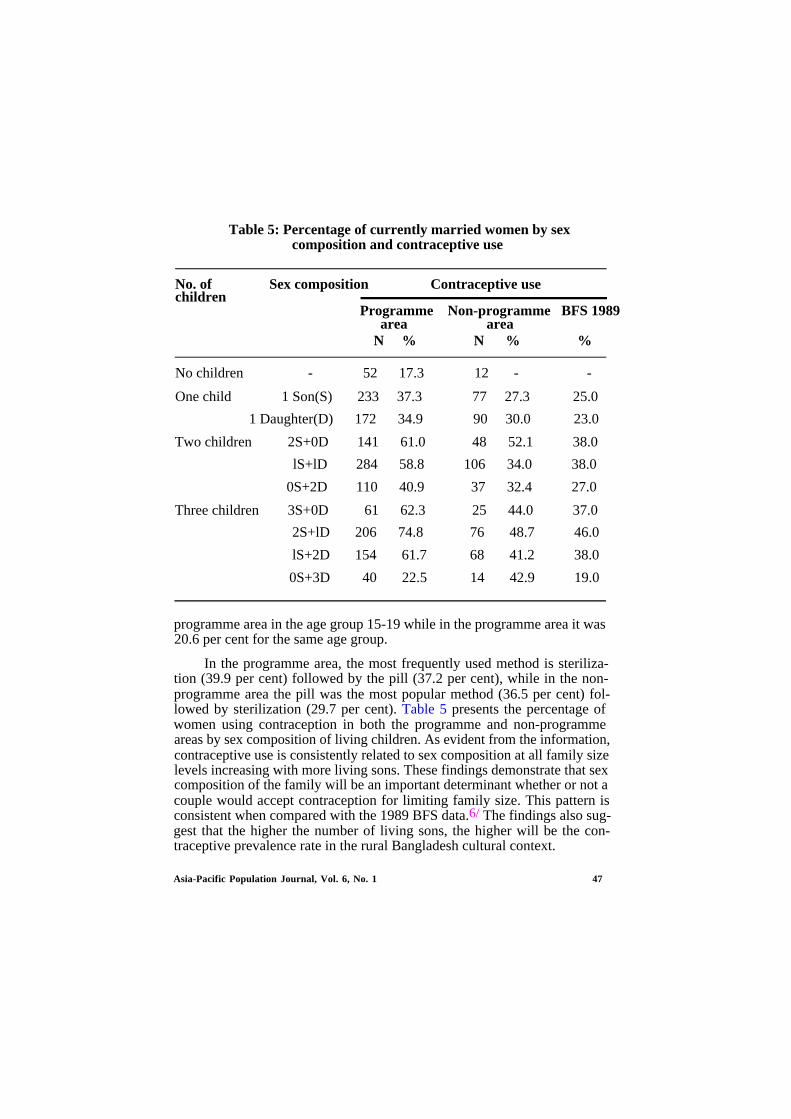
Table 5: Percentage of currently married women by sexcomposition and contraceptive use
No. of Sex compositionchildren
Contraceptive use
Programme Non-programme BFS 1989area area
N % N % %
No children - 52 17.3 12 - -
One child 1 Son(S) 233 37.3 77 27.3 25.0
1 Daughter(D) 172 34.9 90 30.0 23.0
Two children 2S+0D 141 61.0 48 52.1 38.0
lS+lD 284 58.8 106 34.0 38.0
0S+2D 110 40.9 37 32.4 27.0
Three children 3S+0D 61 62.3 25 44.0 37.0
2S+lD 206 74.8 76 48.7 46.0
lS+2D 154 61.7 68 41.2 38.0
0S+3D 40 22.5 14 42.9 19.0
programme area in the age group 15-19 while in the programme area it was20.6 per cent for the same age group.
In the programme area, the most frequently used method is steriliza-tion (39.9 per cent) followed by the pill (37.2 per cent), while in the non-programme area the pill was the most popular method (36.5 per cent) fol-lowed by sterilization (29.7 per cent). Table 5 presents the percentage ofwomen using contraception in both the programme and non-programmeareas by sex composition of living children. As evident from the information,contraceptive use is consistently related to sex composition at all family sizelevels increasing with more living sons. These findings demonstrate that sexcomposition of the family will be an important determinant whether or not acouple would accept contraception for limiting family size. This pattern isconsistent when compared with the 1989 BFS data.6/ The findings also sug-gest that the higher the number of living sons, the higher will be the con-traceptive prevalence rate in the rural Bangladesh cultural context.
Asia-Pacific Population Journal, Vol. 6, No. 1 47
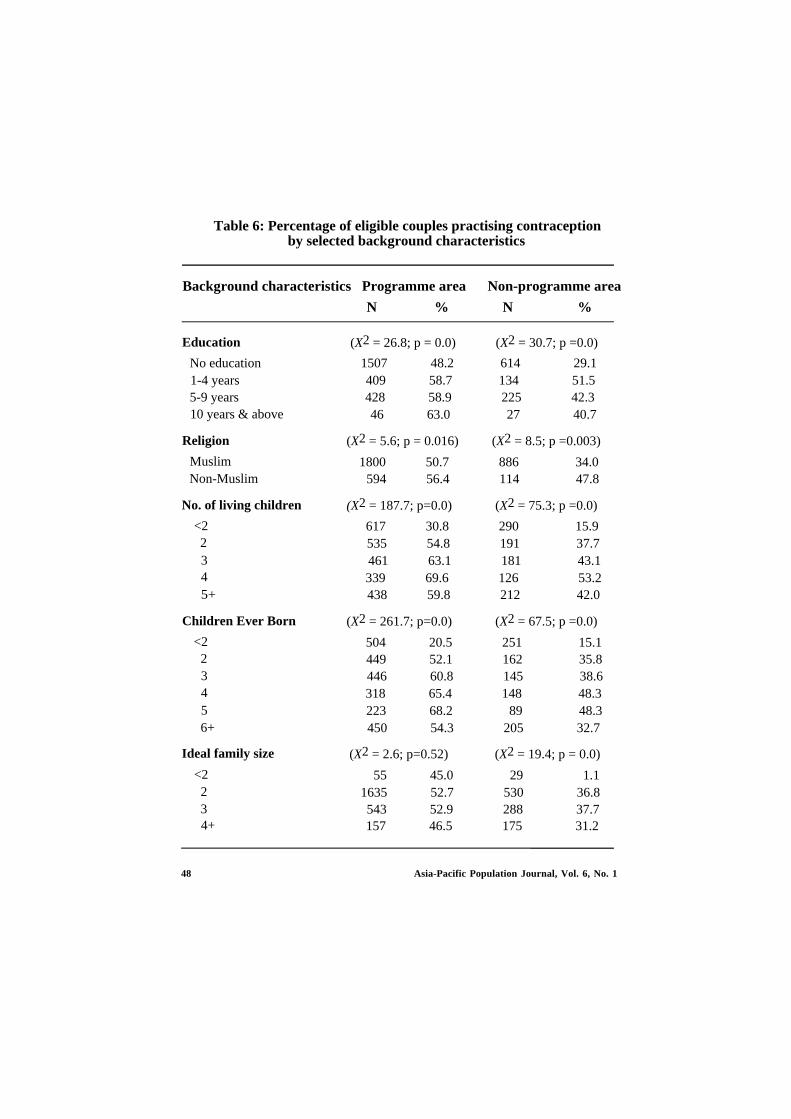
Table 6: Percentage of eligible couples practising contraceptionby selected background characteristics
Background characteristics Programme area Non-programme area
N % N %
Education
No education 1507 48.2 614 29.11-4 years 409 58.7 134 51.55-9 years 428 58.9 225 42.310 years & above
Religion
MuslimNon-Muslim
No. of living children
<22345+
Children Ever Born
<223456+
Ideal family size
<2234+
(X2 = 26.8; p = 0.0) (X2 = 30.7; p =0.0)
46 63.0 27 40.7
(X2 = 5.6; p = 0.016) (X2 = 8.5; p =0.003)
1800 50.7 886 34.0594 56.4 114 47.8
(X2 = 187.7; p=0.0) (X2 = 75.3; p =0.0)
617 30.8 290 15.9535 54.8 191 37.7461 63.1 181 43.1339 69.6 126 53.2438 59.8 212 42.0
(X2 = 261.7; p=0.0) (X2 = 67.5; p =0.0)
504 20.5 251 15.1449 52.1 162 35.8446 60.8 145 38.6318 65.4 148 48.3223 68.2 89 48.3450 54.3 205 32.7
(X2 = 2.6; p=0.52) (X2 = 19.4; p = 0.0)
55 45.0 29 1.11635 52.7 530 36.8543 52.9 288 37.7157 46.5 175 31.2
48 Asia-Pacific Population Journal, Vol. 6, No. 1
Current use pattern according to some selected background charac-teristics is investigated in table 6. As found in other studies, it is also ob-served that more women with higher education are using contraception thanwomen with little or no education. Muslim women are less likely to be usersthan Hindu women because of religious reasons. About 48 per cent ofwomen belonging to the Hindu religion are using contraceptives as againstonly 34 per cent of Muslim women. However, this difference is not verylarge in the case of the programme area. The comparable figures for the1989 CPS are 30.3 per cent and 39.5 per cent, respectively.5/
The association between number of children ever born and number ofchildren surviving with contraceptive practice is curvilinear. Current use ofcontraception is considerably higher compared with those with either manyor only a few children. As regards the ideal family size, it is observed thatabout 53 per cent of the women were current users, with two or three beingthe ideal number of children. This figure was only 47 per cent, with four ormore children, for non-users.
Logistic regression analysis
Logistic regression analysis7/ was used to identify the variables whichinfluence the current use of contraception. Two regressions were con-sidered: one for the programme area, the other for the non-programmearea. The dependent variable considered here was current contraceptive usestatus and the independent variables were those which were assumed to in-fluence contraceptive use of currently married women.
The results of the multivariate regression analysis are presented intable 7. The analysis shows that the likelihood of women using contracep-tives was associated with variables such as age of the youngest living child,availability of electricity, desire for additional children and education of therespondents, all of which were statistically significant. In the programmearea, women having children aged less than 1 year were nearly one and aquarter times as likely as women having children of age 1 year or more tohave used contraceptives. The likelihood of women having electricity in theirhouseholds to be contraceptive users was 1.19 times higher compared withthose women without electricity in their households. Desire for additionalchildren and the religion of the respondent were found to be impedimentsto the use of contraceptives. Similar findings with an even greater likelihoodwere observed for the non-programme area. However, desire for additionalchildren in the non-programme area was strongly negatively associated withthe current use status of the women.
Asia-Pacific Population Journal, Vol. 6, No. 1 49
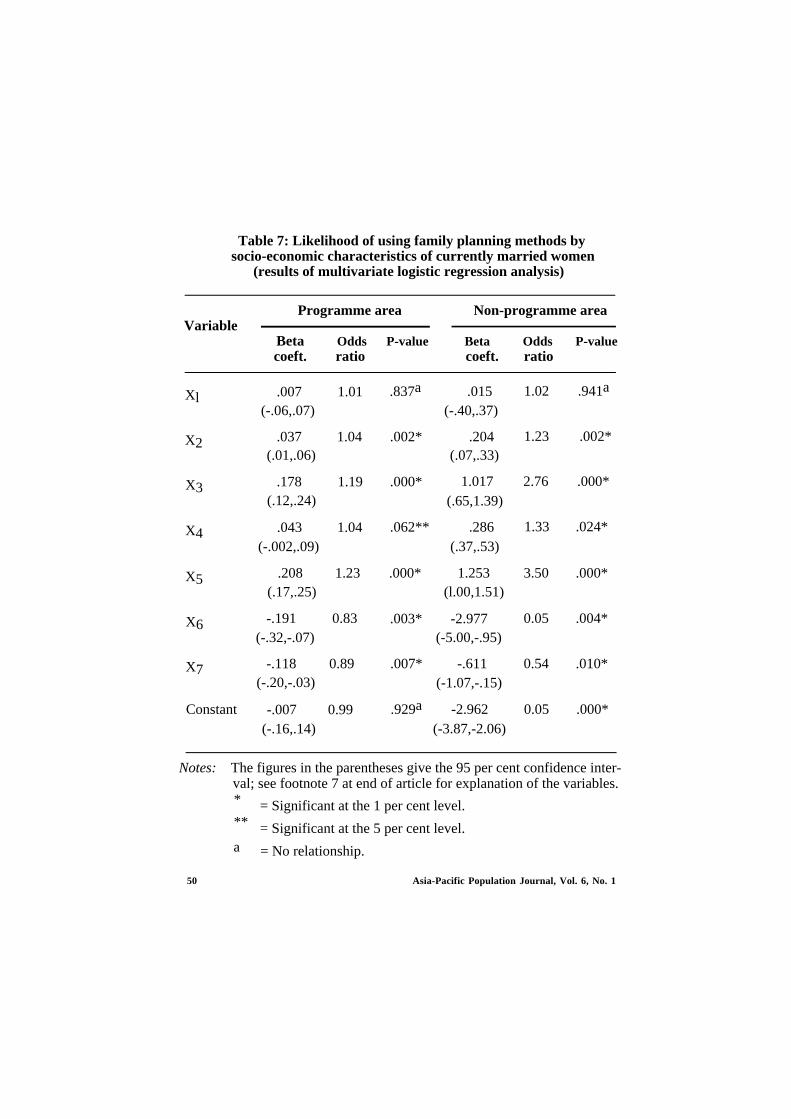
Table 7: Likelihood of using family planning methods bysocio-economic characteristics of currently married women
(results of multivariate logistic regression analysis)
VariableProgramme area Non-programme area
Beta Odds P-value Beta Odds P-valuecoeft. ratio coeft. ratio
Xl
X2
X3
X4
X5
X6
X7
Constant
.007 1.01(-.06,.07)
.037 1.04(.01,.06)
.178 1.19(.12,.24)
.043 1.04(-.002,.09)
(.17,.25).208 1.23 .000*
-.191 0.83(-.32,-.07)
-.118 0.89(-.20,-.03)
-.007 0.99(-.16,.14)
.837a
.002* .204
.000*
.062** .286
.003*
.007*
.929a
.015(-.40,.37)
(.07,.33)
1.017(.65,1.39)
(.37,.53)
1.253(l.00,1.51)
-2.977(-5.00,-.95)
-.611(-1.07,-.15)
-2.962(-3.87,-2.06)
1.02 .941a
1.23 .002*
2.76 .000*
1.33
3.50
0.05
0.54
0.05
.024*
.000*
.004*
.010*
.000*
Notes: The figures in the parentheses give the 95 per cent confidence inter-val; see footnote 7 at end of article for explanation of the variables.* = Significant at the 1 per cent level.** = Significant at the 5 per cent level.a = No relationship.
50 Asia-Pacific Population Journal, Vol. 6, No. 1
Conclusions
This article examined the impact of the Swanirvar Programme on fami-ly planning activities in Bangladesh. The findings suggest that programmeefforts to increase family planning and consequently to improve maternaland child health services have important effects. The programme inputs suchas training for the Swanirvar workers, knowledge and awareness about theimplications of having a large family, benefits of birth spacing and provisionof credit facilities have important effects. Efforts to improve socio-economicconditions through various services will have important impacts onreproductive motives and contraceptive behaviour. The effect of the Swanir-var Programme is reflected in lower levels of fertility and mortality.
Levels of contraceptive use are substantially higher in the programmearea. The percentage of women who were currently using contraception wasabout 53 in the programme area compared with only 36 in the non-programme area. Most of the current users were users of the pill followedby sterilization, condoms and IUDs. Desire for additional children is notcommon. This implies that there is an unmet need for contraception amongnon-users. Multivariate logistic analysis suggests that the age of the youngestliving child, availability of electricity, education of the respondent and desirefor more children are the most important determinants of contraceptive use.Besides, the religion and the sex preference of the couples are also influenc-ing factors in the adoption of contraceptives.
One of the limitations of the study is that there is no baseline informa-tion on any of the areas under investigation. In addition, some parts of theprogramme areas were being supported by the Pathfinder Fund (PF) wherePF workers supply contraceptives. Our field experience suggests that theclients often confused and failed to distinguish among the workers of theself-reliance programme, PF and the Government’s Family PlanningProgramme. Owing to this, the comparison group and the experimentalgroup may not be strictly comparable. Therefore, careful adjustment for theunderlying causes is essential in the interpretation of the programme effects.
Our field observations suggest that procedural barriers within healthcare facilities are major constraints to the acceptance of contraceptivemethods. In many situations, the husband’s consent is required before awoman can accept a contraceptive method. Many women are afraid or un-willing to discuss limiting the size of their families with their husbands. Ef-forts should be made, therefore, to encourage wives to participate in allfamily decisions. Women should also be informed about their rights and
Asia-Pacific Population Journal, Vol. 6, No. 1 51
privileges as well as about family law. These aspects need to be incorporatedin the training of Swanirvar workers to make the family planning programmemore effective and successful.
1.
2.
3.
4.
5.
6.
7.
References and footnotes
Cain, Mead (1981). “Risk and Insurance: Perspectives on Fertility and Agrarian Changein India and Bangladesh”, Population and Development Review, vol. 7, No. 3.
Mabud, M.A. (1987). Recent Trends in Fertility and Mortality in Bangladesh. Proceed-ings of a National Seminar, PDEU, Planning Commission, Dhaka.
Trussel, T. James (1975). “A Re-estimation of the Multiplying Factors for the BrassTechnique for Determining Childhood Survivorship Rates”, Population Studies, vol. xxix,No. 1, pp. 97-108.
Coale, A.J. and Paul Demeny (1966). Regional Model Life Tables and Stable Population,(Princeton University Press, Princeton, U.S.A.).
Mitra, S.N., A. Larson, Gillian Foo and Shahidul Islam (1990). BangIadesh Contracep-tive Prevalence Survey 1989, (Final Report). Mitra and Associates, Dhaka.
Haq, M. Najmul and John Cleland (1990). Bangladesh Fertility Survey 1989 (MainReport). NIPORT, Azimpur, Dhaka.
The model can be written as:
Loge ( P ) = b0 + b1x1 + . . . . . . . . + bnxn1-P
where P is the probability of contraceptive use for the event occuring; b0 b1. . . . . . . bn arethe regression coefficients and x1 x2 . . . . . . . . xn are the independent variables.
Seven independent variables were considered in each model. The variables are:
X1 = Age of the respondent
X2 = Education of the respondent
X3 = Availability of electricity
X4 = No. of male living children
X5 = Age of the youngest living child
X6 = Additional children desired
X7 = Religion of the respondent.
52 Asia-Pacific Population Journal, Vol. 6, No. 1
Demographer’s Notebook
Population Strategies
for the 1990s
A note by the ESCAP secretariat to the forty-seventh session of theCommission, which will be held at Seoul, Republic of Korea, from 1 to 10April 1991, reviews a variety of topics related to population. These includea survey of the population situation in the region, including policies andprogrammes; the state of socio-economic development in the region anddevelopment issues closely linked with population, such as the status ofwomen, quality of population, environment, poverty and rural-urban migra-tion. It also considers various multidisciplinary strategies and programmesof the secretariat such as cross- disciplinary training, multidisciplinary re-search, technical advisory services and population information.
It states that, in late 1990 the total population of the ESCAP regionreached 3.0 billion persons. The last decade of this century will see thelargest absolute increment to the region’s population of any decade in his-tory, 548 million persons. The current growth rate of 1.8 per cent perannum adds over 50 million persons a year to the region’s population.
Of particular concern is the fact that the population growth rate duringthe period 1985-1990 was the same as for 10 years earlier, during the period1975-1980. There are two demographic reasons that the growth rate has notdeclined. The first is that half of the 15 per cent decline in fertility perwoman that has occurred has been offset by a shift in age composition of thepopulation resulting in a higher proportion of women of child-bearing age.Secondly, the small decline in the birth rate that has been achieved in thepast 10 years has been nearly equalled by a reduction in the death rate.
Asia-Pacific Population Journal, Vol. 6, No. 1 53
The note states that demographic levels and trends vary considerablyamong the countries and sub-regions of the ESCAP region. The growth ratein East Asia during the period 1985-1990 equalled 1.3 per cent a year,resulting from a crude birth rate (CBR) of 20 and a crude death rate (CDR)of 7. In South-east Asia the growth rate equalled 1.9 per cent, resultingfrom a CBR of 29 and a CDR of 10. The growth rate had declined from 2.1per cent 10 years earlier. In South Asia the growth rate during the period1985-1990 was 2.3 per cent, based on birth and death rates of 35 and 12,respectively.1/
Socio-economic development in the region
The level of socio-economic development in a country is an importantdeterminant of the level of fertility, according to the note. In particular,fertility is likely to be lower where income distribution, social services, andthe status of women are emphasized. The quality of the population appearsto be more important than its income for achieving population goals. Theinfant mortality rate (IMR) is considered a good indicator of social develop-ment because it reflects the effects of income level and distribution, healthservices and educational level of mothers.
The extent of education is also important for development, as it is anindication of distribution of income and has a direct impact on fertility andmortality levels. It is no coincidence that the countries that were seen tohave fertility and mortality levels lower than would be expected from theirper capita GNP’s, China, Sri Lanka and Viet Nam, also have secondaryschool enrolment rates, especially of females, that are much higher than incountries with similar income levels.
Development issues closely linked with population
Status of women
The close correspondence between fertility levels and various healthand education indicators demonstrates that population is intimately linkedwith social development, perhaps the most direct linkage, and the most valu-able for policy purposes, is through the status of women. The note pointsout that improving the status of women is a desirable goal in itself, asdevelopment must permit all people to realize the fullest of their potential,but in addition, research has demonstrated such a strong relationship be-tween development and the status of women as to suggest that a societycannot achieve economic development unless the status of women is high.Women contribute to economic development through their work on farms
54 Asia-Pacific Population Journal, Vol. 6, No. 1
or outside of the household and because they have primary responsibility forthe nurture, health, and education of children. From the population point ofview, improving the status of women permits them to exercise choice infamily planning and leads to lower fertility. It is estimated that in Asia thenumber of children desired by women is 33 per cent lower that the numberthey actually have.2/
Women are an essential element of family health. They are largelyresponsible for the nutrition of family members because they prepare (andfrequently grow) the food served. Women carry and boil water for familyuse. They train and inform their children about proper sanitation. Womenare mainly responsible for ensuring that their children are immunized.
The major role of women in maintaining family health indicates whythe education of women is so important to development. Schooling helpswomen to acquire the knowledge of nutrition, sanitation, agriculture, andmedical practices so necessary for raising a healthy family. It has been ar-gued that simply attending school is important for women because it in-structs them how to deal confidently with clinics, post offices, banks, books,medicines and bus systems. They are then more able and inclined to taketheir sick children to a clinic and to advise their children about their educa-tion.
The ability of women to choose to use family planning not only lowersfertility, but promotes development by improving the health of women andtheir children and extending the education of children, which are commonlyfound correlates of smaller family size.
Quality of population
Population quality and family size, and therefore population growthrates, are linked in a two-directional relationship. Many scholars consider adecline in infant mortality to be a requirement for a sustained decline infertility. Mother’s education remains a strong determinant of both fertilityand infant mortality. Conversely, smaller families resulting from later age atmarriage, longer birth intervals and earlier cessation of child bearing haveroutinely been found to be healthier.
There is no doubt that population quality, especially in terms of healthand education, is essential for economic development and becomes moreimportant with higher levels of development. As national economies moreto move technology-based industry and services, the need for professional,scientific and technical workers becomes critical. Even non-specialistworkers need to be able to read instructions and make calculations. As
Asia-Pacific Population Journal, Vol. 6, No. 1 55
population and labour force growth rates decline, wages rise and employerssubstitute capital in the form of technology for labour. This in turn calls forhiring employees with more education and training.
In addition to the contribution to productivity that a high- qualitypopulation makes, a human resources based development strategy has beenadvocated as a means of improving equity and income distribution within aneconomy.3/
Environment
The note points out that there has been an upsurge recently in concernabout environmental issues in Asian and Pacific countries. This region facesmajor problems related to deforestation, desertification, air and water pollu-tion, and other forms of environmental degradation. These environmentalproblems are closely linked with population problems in the context ofpopulation and development integration. Increases in the size of populationsand economic development aimed at raising the standards of living of thepeople frequently involve depletion of resources and serious environmentalcomplications.
Yet to view the problems of environmental deterioration as a conse-quence of growing populations and rising subsistence requirements is tooversimplify and, in some ways, to mistake the real situation. In manycountries, the problems are considerably worse than would follow from theincrease in numbers alone. It is not just population growth that is puttingpressure on resources: rather, population growth in conjunction with otherprocesses is leading to much more rapid depletion.
Therefore, an understanding of the interrelationships between popula-tion variables and environmental conditions is essential for the formulationof guidelines for taking curative measures where deteriorating conditionsexist and for the preparation of preventive measures to forestall the develop-ment of environmental problems. At the same time, an understanding of theinterrelationships will also be useful in developing population policies andrelated activities to assist in improving environmental conditions, improvingthe welfare of the population, and regulating population trends.
Poverty
Poverty is linked in an interactive way within population issues and thedevelopmental issues discussed in sections of the note. The most immediatecause of poverty is unemployment or underemployment. High populationgrowth rates are a major factor in the prevalence of poverty as the size ofthe labour force expands more rapidly than employment opportunities. In
56 Asia-Pacific Population Journal, Vol. 6, No. 1
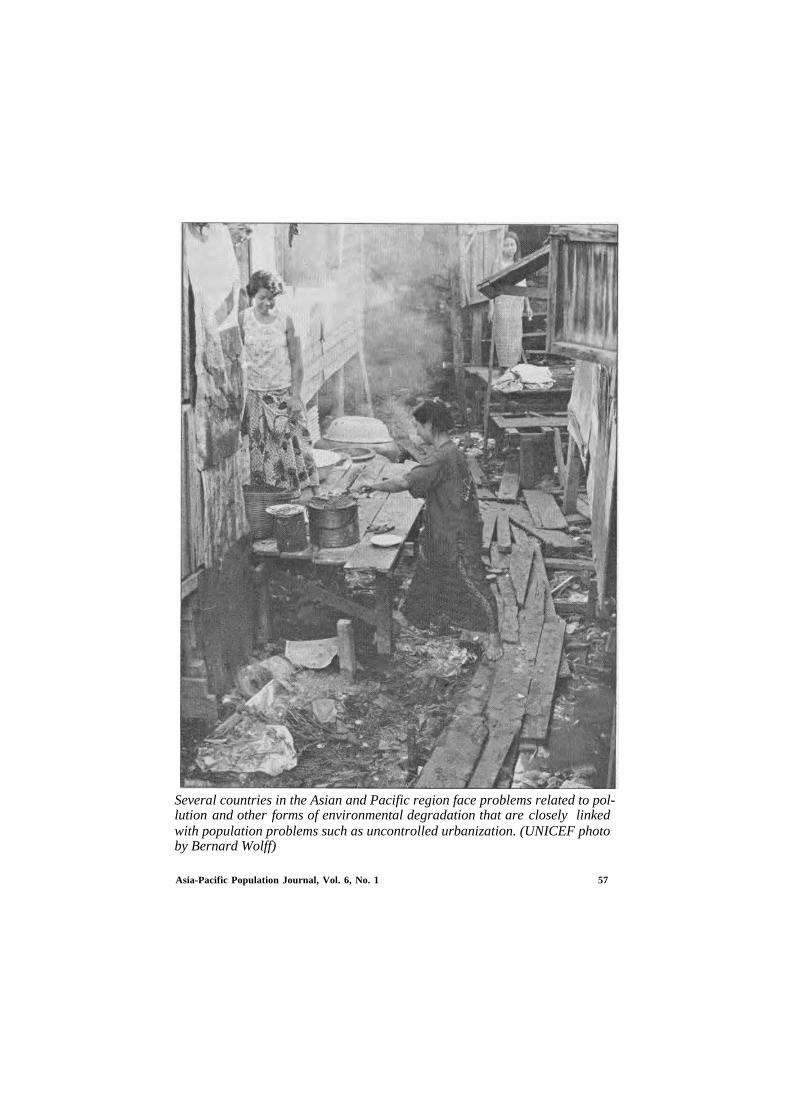
Asia-Pacific Population Journal, Vol. 6, No. 1 57
Several countries in the Asian and Pacific region face problems related to pol-lution and other forms of environmental degradation that are closely linkedwith population problems such as uncontrolled urbanization. (UNICEF photoby Bernard Wolff)
rural areas, population growth increases pressure on arable land andreduces per person earnings from it.
Inadequate attention in the past to the quality of the population hasperpetuated poverty in the region. The lack of productive employment, in-sufficient education, and lack of access to health care and family planningservices have deprived poor people the means of escape from poverty.
In a circular way, poverty worsens the physical well-being of thepopulation. Poor people cannot afford access to the schools, health servicesand family planning programmes that exist. In developing countries, povertyis the most serious threat to health. Poverty accompanies all the commonfactors which account for a high incidence of disease. Poor families haveinadequate and unsanitary housing. High percentages of them do not haveaccess to a safe supply of drinking water. They do not receive adequatehealth care in connection with childbirth. Infant and child mortality ratesamong the poorest groups in a society may be double or more of thoseamong the highest socio-economic groups. In most countries malnutrition iscaused not by a lack of food but by the inability of impoverished people tobuy it.
In developing countries, poverty is a major cause of environmentaldegradation. High rates of population growth and poverty often lead peopleto destroy their immediate environment in order to survive. They cut downforests to use the wood and to gain farm land. They overuse marginal landand their cattle overgraze grasslands. At the national level, the need to earnforeign exchange may encourage countries to cut timber faster than forestscan be regenerated.
Rural-urban migration
One of the most serious population problems to emerge during the lastdecade, and one that should be included in strategic planning, is the large-scale migration of people from rural to urban areas.4/ At the global level,72 per cent of 170 countries have introduced policies to decelerate orreverse trends in migration.
Migration is an integral part of the transition of societies from thosepredominantly rural and agricultural to those largely urban and industrial.None the less, rapid rural-urban migration not only takes qualified workersaway from the countryside, it tends to keep those left behind trapped inunderdevelopment. As the more educated segments of society move totowns and cities, rural areas lose the potential to develop themselves.
58 Asia-Pacific Population Journal, Vol. 6, No. 1
The development of rural areas requires special policy initiatives, butas towns and cities grow in social and political significance, developmentpolicies are more likely to take on an urban bias. National developmentexpenditures tend to be concentrated in urban areas, particularly capitalcities, which then become more attractive to rural residents seeking to im-prove their social and economic positions. There is more to migration thanthe attraction of big cities. Often discriminatory pricing policies for farmproduce keep food prices artificially low, thus reducing rural incomes andhindering job creation. At the same time, urban requirements such astransport, water and electricity are subsidized by the government andprovided to residents at below-cost prices.
Because of urban-biased planning and development, urban populationscontinue to expand, often beyond the capacity of towns and cities to copewith the increasing numbers. As a result, services break down, housing isinsufficient and slums and squatter settlements proliferate. It has beendemonstrated, however, that policies affecting both natural increase andmigration to urban areas have an influence on their eventual size. Theprovision of family planning services may effectively reduce populationgrowth in critical urban areas, especially those suffering from acuteshortages of housing, medical care, educational facilities and potable waterand sanitation.
Multidisciplinary strategies and programmes
The note points out that the interrelatedness of all of the issues dis-cussed above demands that multidisciplinary strategies and programmes bepursued in alleviating the problems. The last part of the note is devoted to adiscussion of those strategies as well as programmes of the secretariat in-cluding cross- disciplinary training, multidisciplinary research, technical ad-visory services and population information.
Footnotes
1.
2.
3.
World Population Prospects 1988 (United Nations Publication, Sales No. E.88.XIII.7).
United Nations Population Fund, Investing in Women: The Focus of the ’90s. (NewYork, 1990).
Ernesto M. Pernia, “Introduction and perspective”, in Asian Development Bank, HumanResource Policy and Economic Development: Selected Country Studies (Manila, 1990).
4. United Nations Population Fund, Meeting the Population Challenge (New York, nodate).
Asia-Pacific Population Journal, Vol. 6, No. 1 59