Graduation qeremony to remain oh the quad - JMU Scholarly ...
Upload
khangminh22Category
view
1download
0
Wind Energy in Virginia: JMU and Beyond
Submitted to the Integrated Science and Technology Program
At James Madison University In partial fulfillment of a B.S. degree in
Integrated Science and Technology
By
Greg Allen Bryan Franey Matthew Heck Adam Jones David Strong
Under the faculty guidance of
Dr. Jonathan Miles
April 24, 2002 ________________________
________________________
________________________
________________________
________________________ ________________________
Faculty Advisor Signature

2
Table of Contents
Wind Energy in Virginia: JMU and Beyond .................................................................... 1
List of Figures .................................................................................................................... 6
List of Tables ...................................................................................................................... 8
Abstract............................................................................................................................... 9
Chapter 1: Introduction................................................................................................... 10
1.1 Overview ............................................................................................................... 10
1.2 Background ......................................................................................................... 11
1.2.1 The State-Based Anemometer Loan Program ............................................... 11
1.2.2 Wind at James Madison University ............................................................... 12
1.3 Purpose and justification..................................................................................... 13
1.4 Goals and objectives ............................................................................................. 14
1.4.1 SBALP Program ............................................................................................ 14
1.4.2 On-campus study ........................................................................................... 14
1.5 Literature survey .................................................................................................. 15
Chapter 2: Wind as an energy resource......................................................................... 18
2.1 What is wind power .............................................................................................. 18
2.2 History of wind power .......................................................................................... 19
2.3 Capturing wind power: old and new technologies............................................. 23
2.4 Meteorology: wind measurement and anemometer towers .............................. 27
2.5 Siting of wind turbines and wind farms.............................................................. 30
2.6 Introduction to WAsP........................................................................................... 32
Chapter 3: State Based Anemometer Loan Program ..................................................... 33
3.1 History of the program......................................................................................... 33
3.2 Program overview............................................................................................... 33

3
3.3 Implementation and administration of the program....................................... 34
3.4 Equipment ........................................................................................................... 35
3.5 Application (See appendix A for example) ......................................................... 38
3.6 Loan Agreement (See appendix B for example)................................................. 39
3.7 Contract (See appendix C for example).............................................................. 40
3.8 Website................................................................................................................. 40
3.9 Press Release (See appendix D for example) ...................................................... 41
3.10 Benefits to borrower ........................................................................................... 41
3.11 Benefits to the state, DOE, and JMU .............................................................. 42
3.12 Results ................................................................................................................ 42
Chapter 4: Borrowers...................................................................................................... 44
4.1 Robert Preston (Installed 10/18/01)..................................................................... 44
4.1.1 The site........................................................................................................... 44
4.1.2 Installation........................................................................................................ 45
4.1.3 Lessons learned................................................................................................ 45
4.1.4 Data .................................................................................................................. 46
4.1.5 Conclusions...................................................................................................... 46
4.2 Jaye Baldwin (Installed 12/12/01)........................................................................ 47
4.2.1 The site............................................................................................................. 47
4.2.2 Installation........................................................................................................ 47
4.2.3 Lessons Learned............................................................................................... 47
4.2.4 Data .................................................................................................................. 48
4.2.5 Conclusions...................................................................................................... 48
4.3 Tim Altizer (Installed 12/21/01)......................................................................... 49
4.3.1 The site............................................................................................................. 49
4.3.2 Installation........................................................................................................ 49
4.3.3 Lessons Learned............................................................................................... 49

4
4.3.4 Data .................................................................................................................. 50
4.3.5 Conclusions...................................................................................................... 50
4.4 Dick Stokes (Installed 1/10/02)........................................................................... 50
4.4.1 The site............................................................................................................. 50
4.4.2 Installation........................................................................................................ 51
4.4.3 Lessons Learned............................................................................................... 51
4.4.4 Data .................................................................................................................. 51
4.4.5 Conclusions...................................................................................................... 51
4.5 Henry’s Point (Installed 2/24/02)....................................................................... 52
4.5.1 The site............................................................................................................. 52
4.5.2 Installation........................................................................................................ 52
4.5.3 Lessons Learned............................................................................................... 52
4.5.4 Data .................................................................................................................. 52
4.5.5 Conclusions...................................................................................................... 53
4.6 Northampton County Landfill (Installed 2/24/02) ............................................. 53
4.6.1 The site............................................................................................................. 53
4.6.2 Installation........................................................................................................ 53
4.6.3 Lessons Learned............................................................................................ 54
4.6.4 Data .................................................................................................................. 54
4.6.5 Conclusions...................................................................................................... 54
Chapter 5: Feasibility study of east JMU campus.......................................................... 55
5.1 Justification for wind power on the east campus of James Madison University
....................................................................................................................................... 55
5.2 Selection of meteorological tower site ........................................................... 58
Chapter 6: Wind modeling with WAsP ........................................................................... 62
6.1 WAsP hierarchy .................................................................................................. 62
6.1.1 WAsP project ................................................................................................. 62
6.2 Site description .................................................................................................... 63
6.2.1 Orography ...................................................................................................... 64

5
6.2.2 Surface roughness .......................................................................................... 65
6.2.3 Shelter effects................................................................................................. 70
6.3 Wind atlas ............................................................................................................ 73
6.3.1 Meteorological station .................................................................................... 73
6.3.2 Observed wind climate .................................................................................. 74
6.4 Resource grid....................................................................................................... 77
6.5 Turbine site.......................................................................................................... 78
Chapter 7: Impact of wind power on east campus.......................................................... 81
7.1 Technical issues ............................................................................................... 81
7.1.1 Regulations: federal, state, and university ................................................ 81
7.1.2 Grid connection............................................................................................. 84
7.1.3 Maintenance.............................................................................................. 85
7.2 Environmental impact ...................................................................................... 85
7.2.1 Avian mortality ......................................................................................... 86
7.2.2 Noise issues............................................................................................... 89
7.2.3 Wind Turbine Testing and Safety ............................................................. 90
7.2.4 Emission reduction impact........................................................................ 95
7.2.5 Other considerations ...................................................................................... 96
7.3 Public perception ............................................................................................ 96
7.3.1 General public and JMU administration concerns.................................... 97
7.3.2 Photomontages of turbine on JMU campus .............................................. 99
Chapter 8: East campus economic analysis.................................................................. 103
Chapter 9: Conclusions and Recommendations........................................................... 110
9.1 SBALP Conclusions and Recommendations ................................................... 110
9.2 East campus conclusions and recommendations ........................................... 111
References ...................................................................................................................... 113

6
List of Figures
Figure 2.3.1. Ancient Dutch windmill (The Franklin Institute Online)........................... 23
Figure 2.3.2. Fan windmill typical of middle America (Vintage Windmills, 2002). ...... 24
Figure 2.3.3. Enron 750-kW airfoil turbines in Culberson County, Texas (Enron Wind).
................................................................................................................................... 25
Figure 2.3.4. Fundamental forces associated with function of an airfoil......................... 25
Figure 2.3.5. Horizontal axis is seen on the left while a vertically oriented device is seen
at right. ...................................................................................................................... 26
Figure 2.4.1 The Hadley Convection Cell Model (Western Illinois University).............. 28
Figure 2.4.2. A three cup anemometer............................................................................. 29
Figure 2.4.3. A wind vane................................................................................................ 30
Figure 2.5.1. The airflow around a building structure (AWEA, 2002). .......................... 31
Figure 3.1. Schematic of 20m tower. ............................................................................... 35
Figure 3.2. Cup anemometer............................................................................................ 36
Figure 3.3. Wind vane....................................................................................................... 36
Figure 3.4. Wind Explorer Logger Kit............................................................................. 37
Figure 3.5. Data plug. ...................................................................................................... 37
Figure 4.1. Locations of erected anemometers. ............................................................... 44
Figure 4.1.1. Preston monthly average wind speeds........................................................ 46
Figure 4.1.1. Baldwin monthly average wind speeds. ..................................................... 48
Figure 5.1.1. Sites considered and final location of tower............................................... 59
Figure 6.1.1. The upper left corner of the screen shot shows the WAsP hierarchy......... 63
Figure 6.2.1. Orographic map of Harrisonburg, Virginia quadrangle. ............................. 65
Figure 6.2.2. Topographic map of Harrisonburg and surrounding quadrangles............... 68
Figure 6.2.3. MapEdit window shows the height contours and topographic bitmap....... 69
Figure 6.2.4. MapEdit window showing fully digitized roughness areas and orography. 70
Figure 6.2.5. Illustration showing the possible effects of an obstacle on wind flow........ 71
Figure 6.2.6. Example of the parameters used by WAsP to calculate the shelter effects of
an obstacle................................................................................................................. 72
Figure 6.2.7. Obstacle diagram of buildings on east campus of JMU. ............................ 73

7
Figure 6.3.1. Map of Harrisonburg quadrangle showing locations of both the
meteorological tower and the turbine site. ................................................................ 74
Figure 6.3.2. Shows a two-year trend for wind speed in both Charlottesville and Staunton,
Virginia and the four months of data collected in Keezletown, Virginia. ................ 75
Figure 6.3.3. Predicted monthly averages for Keezletown and measured averages for
Charlottesville and Staunton. .................................................................................... 76
Figure 6.3.4. Observed wind climate in Keezletown, Virginia. ...................................... 77
Figure 6.4.1. Resource grid of wind speed in Harrisonburg quadrangle. Low wind speed
areas are shown in light blue and higher wind speed areas are shown in dark blue. 78
Figure 6.5.1. Power curve of Bergey ExcelS wind turbine. ............................................ 79
Figure 6.5.2. Predicted wind climate window for turbine site.......................................... 80
Figure 7.3.1. Logarithmic trendline and equation for scaling......................................... 100
Figure 7.3.2. Turbine appearance while traveling south on Interstate 81....................... 101
Figure 7.3.3. View of the Begey Excel from Carrier Drive just past the JMU College
Center. ..................................................................................................................... 102
Figure 9.1.1.. Shows the effect that the turbine cost and the annual energy output also
given as wind classes have on the net benefits of the investment over a thirty year
lifetime. ................................................................................................................... 107
Figure 9.1.2. Net benefits of the Bergey Excel while varying the discount rate. .......... 108

8
List of Tables
Table 5.1.1. Potential courses benefiting from turbine..................................................... 57
Table 6.2.1. Surface characteristics and their associated roughness classes and lengths.66
Table 6.2.2. Shows the wind speed in m/s with increased height and roughness length.. 67
Table 7.1.1. Bergey’s estimated costs of wiring and installing Excel 10-kW system...... 84
Table 7.2.1 Avian Collision Mortality in the United States (NWCC, 2002).................... 87
Table 9.1. Life cycle costs of 10-kW Bergey EXCEL-S............................................... 104
Table 9.2. Simple and discounted payback for the Bergey Excel-S at the JMU turbine
site. .......................................................................................................................... 104
Table 9.3. Net benefits of Bergey Excel system at JMU site. ........................................ 105
Table 9.4. Summary table of sensitivity analysis results. .............................................. 106
Table 9.4. Future value of investment in a CD earning 10% annual interest. ................ 109
9
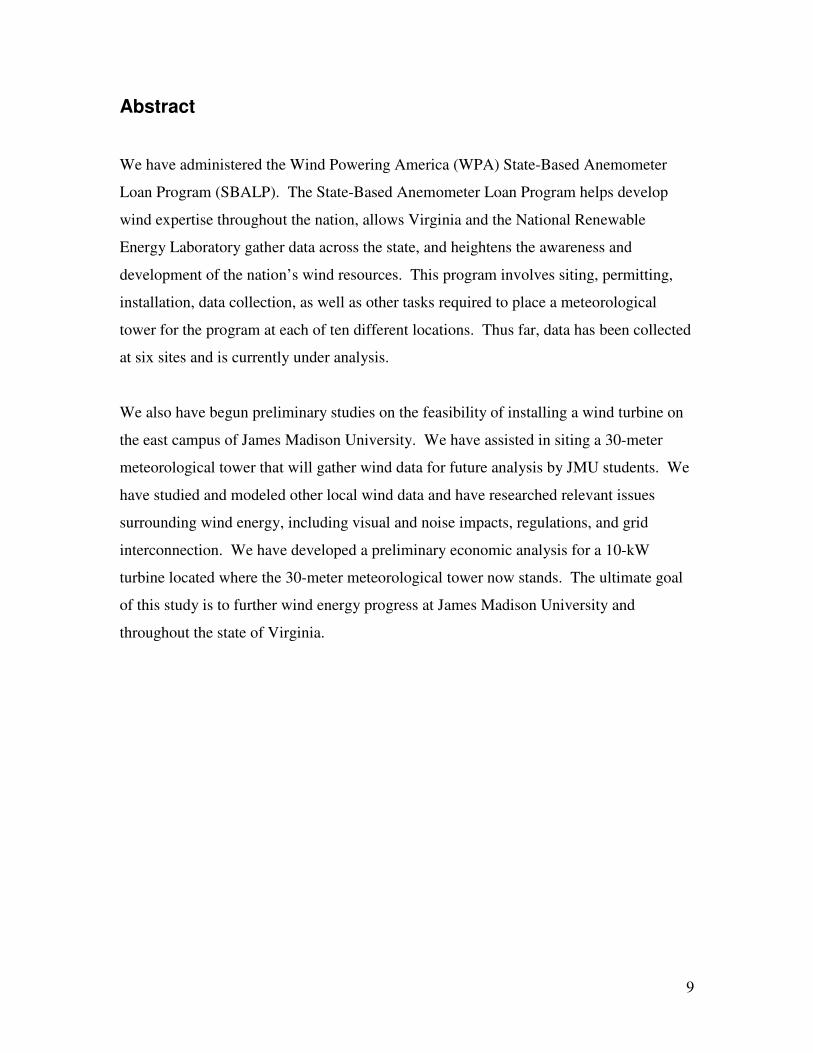
Abstract
We have administered the Wind Powering America (WPA) State-Based Anemometer
Loan Program (SBALP). The State-Based Anemometer Loan Program helps develop
wind expertise throughout the nation, allows Virginia and the National Renewable
Energy Laboratory gather data across the state, and heightens the awareness and
development of the nation’s wind resources. This program involves siting, permitting,
installation, data collection, as well as other tasks required to place a meteorological
tower for the program at each of ten different locations. Thus far, data has been collected
at six sites and is currently under analysis.
We also have begun preliminary studies on the feasibility of installing a wind turbine on
the east campus of James Madison University. We have assisted in siting a 30-meter
meteorological tower that will gather wind data for future analysis by JMU students. We
have studied and modeled other local wind data and have researched relevant issues
surrounding wind energy, including visual and noise impacts, regulations, and grid
interconnection. We have developed a preliminary economic analysis for a 10-kW
turbine located where the 30-meter meteorological tower now stands. The ultimate goal
of this study is to further wind energy progress at James Madison University and
throughout the state of Virginia.

10
Chapter 1: Introduction
1.1 Overview
Wind is a natural resource that has been harvested for centuries. The first uses for wind
began in 5000 B.C. when sailboats were used on the Nile River. As time progressed,
man harnessed the wind’s potential in many different ways. In 1000 A.D. windmills in
the Middle East used windmills to grind grain. The Dutch refined various forms of wind
technology, and used windmills to drain lakes and marshes in the Rhine River Delta. It
was not until the late 19th century that this technology was brought to the United States,
when in 1854 the American windmill was invented. With the rise of industrialization,
and the advent of the steam engine, the use of windmills gradually declined.
Industrialization, however, did contribute to the development of the wind turbine, which
began in Denmark as early as the 1890’s. These wind turbines were the first to be used to
generate electricity. Wind turbine technology further advanced and in the 1980s reached
the point of utility sized wind farms for large-scale electricity generation. With our
current knowledge of the adverse effects of typical coal and oil energy production, we
find wind to be a clean, renewable energy source with countless benefits to the
environment. Because of this and the rise of wind energy as an economically competitive
source of energy, we have based our thesis on the development of wind power.
We have administered the Wind Powering America (WPA) State-Based Anemometer
Loan Program (SBALP). SBALP helps provide landowners with accurate wind speed
measurements, allows Virginia and the National Renewable Energy Laboratory to gather
data across the state, and heightens the awareness and development of the nation’s wind
resources. This program involves informing the general public, reviewing applications,
siting, installing, and collecting and analyzing data for ten meteorological (MET) towers
at different locations. Thus far, data has been collected at six sites and is currently under
analysis.

11
We also have concluded preliminary studies on the feasibility of installing a wind turbine
on the east campus of James Madison University. We have assisted in siting a 30-meter
MET tower that will gather wind data for future analysis by JMU students. We have
studied and modeled other local wind data and have researched relevant issues
surrounding wind energy, including visual and noise impacts, regulations, and grid
interconnection. We have developed a preliminary economic analysis for a 10-kW
turbine located where the 30-meter meteorological tower now stands. The ultimate goal
of this study is to further wind energy progress throughout the state of Virginia, and at
James Madison University.
1.2 Background
1.2.1 The State-Based Anemometer Loan Program
SBALP was created by the Department of Energy’s (DOE) Wind Powering America
(WPA) initiative out of the Philadelphia Regional Office (PRO). The framework for this
program is based on WPA’s Anemometer Loan Programs that are being implemented in
Utah and North Dakota, as well as the Native American Anemometer Loan Program.
The DOE’s National Renewable Energy Laboratory (NREL) oversees all of these
programs. The Native American program allows tribes to borrow a MET tower in order
to measure the available wind resource in their area. Using these data, they can then
decide whether the purchase of a wind energy system would be economical and/or
practical. Through a set of eligibility requirements, an application process, and a set of
agreements, Native Americans can participate in this program. The same structure
applies to North Dakota and Utah where landowners in the state may participate in the
program.
Virginia’s SBALP provides landowners with an opportunity to analyze their own wind
resource. With this information, they can then determine whether or not a wind turbine
would be a wise investment. Also, NREL and the state will use the data to better assess

12
the wind resource in Virginia and validate models. This data is public and will hopefully
spur wind energy developments throughout the state.
1.2.2 Wind at James Madison University
The Integrated Science and Technology (ISAT) program at JMU has a strong focus on
renewable energies. The ISAT program teaches students to understand the technical
aspects of renewable energies, the environmental benefits of renewable energies, as well
as the economical and political aspects. In each of the past three years, thesis groups
have participated in wind energy projects, though none specifically addressed the JMU
campus.
Demetrist Waddy and Margaret James completed the first senior thesis involving wind
energy (The Feasibility of Wind Power in the Shenandoah Valley) in 1999 under the
direction of Dr. Jonathan Miles. They studied available data and previous research from
the National Park Service to determine if the installation of a wind turbine was viable in
the area. They completed calculations to predict turbine performance, assessed the wind
resource in the valley and its surrounding areas, and recommended sites for potential
wind-monitoring stations. Three specific sites were examined in Shenandoah National
Park; Big Meadows, Dickey Ridge, and Sawmill Run. Big Meadows provided the
highest wind speeds of the three sites. They concluded that Big Meadows could be used
as an area for small-scale wind energy production, but was not an ideal location for a
turbine.
In 2000, the team of Scott Abbett, Dan Brewer, Brian Kaulback, Loren Pruskowski, and
Kevin Schulte conducted further research relating to the development of wind energy
(Wind Resource Assessment and Feasibility Study). They investigated the feasibility of a
wind farm at a site adjacent to the Mount Storm Power Station in West Virginia. Their
objectives included calculating the annual energy output using a variety of models,
developing an environmental impact assessment, performing an economic analysis on the
site, and understanding public policies with respect to wind energy. They determined

13
that wind energy was viable at this site and presented a design that would be the most
economically beneficial.
In 2001, Jeanette Studley, Amy McGinty, Ben Orr, John Caley, and Andrea Illmensee
expanded upon the Mount Storm study from the previous year. This group developed a
working model of the wind resource at Mount Storm, researched regulations and issues
surrounding the installation of a wind farm, and studied marketing strategies that have
been successful for wind plants in the past. They also produced a photomontage
describing what the wind farm would look like and performed an economic analysis
based on the suggested turbine layout.
None of these previous studies have focused on the wind energy resource available on
JMU’s campus. One focus of our project is strictly on the JMU campus and its
immediate surroundings to determine what kind of wind energy resource is available to
JMU.
1.3 Purpose and justification
The state of Virginia, being heavily reliant on coal, has not examined its wind energy
resource. By providing anemometer towers to measure a location’s wind speed and
direction, we believe people will gain a better idea of their wind resource. We selected
sites that will most likely show a favorable wind resource. The data collected is available
to the general public and will be used by NREL. Thus, in addition to the landowner
borrowing the tower, residents in the area of the anemometer will have concrete data to
help decide whether wind power might be feasible for them.
In addition to producing energy, a wind turbine on the JMU campus would yield many
other benefits. James Madison University is one of the country’s leaders in training
students to enter the renewable energy industry. Wind energy is one of many renewable
energy sources discussed and studied in classroom activities. However, JMU has long
lacked the hands-on experience of renewable energy systems in real life situations. For

14
the past three years, JMU students have traveled to Malta for hands-on experience with
wind energy. A wind turbine on campus and readily available for analysis would
complement the University’s recently purchased photovoltaic system. The wind energy
system would spark interest both in the students and the entire JMU community,
providing an opportunity to increase general understanding of the technology. A wind
turbine would serve as a landmark for James Madison and would generate interest from
other institutions and prospective students nationwide.
1.4 Goals and objectives
1.4.1 SBALP Program
The overall goal of SBALP is to collect data in the state of Virginia for wind energy.
Through the administration of this project, landowners and their neighbors will have the
opportunity to learn understand what type of wind resource is available to them. With the
landowners support of this project we have placed eight of ten loaned wind-measuring
devices and recorded wind data for a year. After a year, the towers will be relocated and
new landowners will have the opportunity to measure their wind resource. By making
this information available to landowners and the general public, we hope to see the first
commercial wind farm in the state go up, as well as see a large increase in the amount of
small wind energy systems that are used throughout the state.
1.4.2 On-campus study
The intention of the study of the east campus of JMU is to determine whether or not the
purchase of a 10-kW wind turbine would be feasible for the University. By installing a
30-meter MET tower and modeling other local wind data, we expected to find that an
adequate wind resource exists. In addition to the data gathered, we will examine other
issues surrounding wind energy specific to the east campus of JMU. This includes
educational benefits, technical issues, environmental impacts, and public perception. We
also conducted a preliminary economic analysis to decide whether or not the installation

15
of a 10-kW wind turbine on the east campus of JMU would be beneficial to the
University and its community.
1.5 Literature survey
We referenced a number of resources throughout the paper for both specific and general
information. The following gives a description of each source in the order they are listed
on the references page:
� The American Wind Energy Association homepage (www.awea.org) provided a good
background on many aspects of wind resources, economics, policy, and development.
This comprehensive resource was utilized in many areas of our research.
� Alternative Energy: Facts, Statistics, and Issues by Paula Berinstein gave a nice
overview of the wind industry. It presented some useful statistics that were relevant
for our introductory chapters.
� The Bergey WindPower homepage (www.bergey.com) was very useful in regard to
their specific products and features. Since we are considering adding a Bergey
turbine to the meteorological tower, this also provided estimates for various costs.
� Introduction to Energy by Edward S. Cassedy and Peter Z. Grossman examined the
past and future development of large-scale wind farms in the United States.
� Windpower.org, organized by the Danish Wind Industry Association, provided
excellent background information on a variety of wind energy issues. Its “Guided
Tour” was very helpful in allowing us to gain general and specific knowledge on
wind energy.
� Public Attitudes Towards Wind Farms in Scotland: Results of a Residents Survey,
written by Anna Dudleston, was based on research by the Scottish Executive Central

16
Research Unit on the perceived and actual impacts of wind farms. The statistics
helped prove our beliefs that the negative aspects of wind turbines are commonly just
misperceptions based on a lack of public knowledge.
� Enron Wind Corporation’s homepage (www.enronwind.com) provided a number of
turbine pictures used in the paper.
� 1001 Questions Answered About The Weather by Frank H. Forrester explains how
wind power changes drastically with wind velocity.
� The Franklin Institute Online homepage (www.franklininstitute.org) provided a
picture of an ancient Dutch windmill.
� Wind Power for Home and Business by Paul Gipe was an extremely useful resource
conveying information on history, wind applications, measuring wind, estimating
output, economics, and other issues associated with wind energy. This was a very
inclusive source, which was used for a variety of the topics that we covered.
� The Honeywell Obstruction Lighting website
(http://www.airportsystems.honeywell.com/) presented background information on
lighting regulations. It also gave information regarding specific features and
applications of the lighting beacon we ordered from Honeywell Airport Systems.
� The James Madison University 1998-1999 Undergraduate Catalog provided us with
an understanding of James Madison University’s mission and, specifically, the goals
of the College of Integrated Science and Technology. This was useful when
identifying the benefits for specific courses as well as the college as a whole.
� “Hawk-Watching in Virginia” by Kerrie Kirkpatrick and Myriam Moore (from A
Birder’s Guide to Virginia) gave us a general idea on raptor flight patterns in the state
of Virginia.

17
� The Handy Weather Answer Book by Walter A. Lyons was very helpful in explaining
the history of wind measurement.
� We utilized the National Renewable Energy Laboratory homepage (www.nrel.gov) in
a number of ways. It provided excellent information on wind turbine type testing
discussed in the safety section of the paper. It also had many images of Bergey
turbines that we used in creating our photomontages.
� The National Wind Coordinating Committee homepage (www.nationalwind.org)
allowed us access to the NWCC’s various publications on a wide range of wind
energy topics. These were especially helpful on environmental issues that we
addressed.
� The WAsP 7.0 Help Facility by Riso National Laboratory was used to assist in the
development of the WAsP model. In addition, the Help Facility was used as a
reference when explaining the various features of WAsP.
� Birds of Rockingham County Virginia, published by the Rockingham Bird Club, was
an insightful resource on the birds of Rockingham County. This helped us gain a
better knowledge on the raptor species that live in or pass through Harrisonburg.
� Species Information: Threatened and Endangered Animals and Plants
(http://endangered.fws.gov/wildlife.html), a webpage off the U.S. Fish & Wildlife
Service homepage, listed all of the endangered and threatened species in the United
States. We used this to determine the effect of a wind turbine on any endangered
species in the Harrisonburg area.
� Vintage Windmills Online Magazine (www.vintagewindmills.com) provided a
history of American wind power and a picture of the typical agricultural windmill
found in the Midwest.

18
Chapter 2: Wind as an energy resource
2.1 What is wind power
It is important to have some understanding of why wind power is so attractive. As with
any other renewable energy, the increased production of electricity from wind decreases
reliance on traditional energy sources. It is also important for the U.S. to diversify its
sources of energy, as this will provide increased security and independence. As it
currently stands, the United States relies heavily on oil-producing nations for much of its
energy needs. An increase in renewable production will decrease our dependence on
other nations for oil, as well as other traditional sources.
Aside from the strictly economic advantages, wind energy delivers significant
environmental benefits. An elevated environmental awareness has developed around the
globe. Wind power systems do not emit the harmful byproducts that are associated with
traditional energy sources. The only emissions associated with wind turbines occur
during construction and are minimal. Another advantage to wind energy is that it
requires no fuel. Fuel is essential for most types of energy production, and it is often
expensive or in limited supply. Wind, a plentiful resource, is the only input for the
turbines. Furthermore, a wind turbine requires minimal maintenance once installed as it
can operate on its own.
We should also consider the negative features and impacts of wind energy. From the
energy production side, wind itself is intermittent and largely unpredictable. Despite
declining costs, wind energy is still more expensive than traditional sources such as coal
and natural gas. Without monetary incentives, it is currently difficult for wind energy to
significantly contribute to U.S. energy production.
As clean and harmless as wind turbines appear, environmental concerns have arisen
nonetheless. Wind turbines can disrupt wildlife habitats, create noise, and erode land in
some instances. In particular, they sometimes interfere with avian flight patterns, leading

19
to death by direct contact or electrocution. The flight patterns of birds are a factor that
planners must consider when determining wind turbine sites.
There are many other factors pertaining to wind power siting. Wind energy is not
practical in areas where there is little to no wind resource. It is extremely important to
collect and analyze wind measurements before developing sites to determine the nature of
the wind resource present. Collection of wind measurements allows for the estimation of
power output and economic viability. The United States has a good wind resource with
the exception of some southeastern, eastern, and central states. Montana, Wyoming,
North Dakota, and other Great Plains states comprise the windiest areas in the country.
The west, northeast, mid-Atlantic, the Carolinas, and Virginia are also considered to have
“good” resources (Berinstein, 2001).
In 1997, the U.S. achieved a generating capacity of 1,620 megawatts (MW) out of a total
capacity of 778,513 megawatts. This represents approximately 1.7% of all renewable
capacity (Berinstein, 2001). From a numerical standpoint, this may not seem very
impressive. It is more important to realize in which direction the industry is headed.
Most of the renewable electricity growth in the U.S. is expected to derive from wind,
biomass, and geothermal technologies. The American Wind Energy Association
(AWEA) believes that North Dakota, South Dakota, and Texas have enough wind to
power the entire United States. Total U.S. wind capacity increased by 12% in 1998,
while global capacity increased by 35%. By June 30, 1999, utilities had completed large-
scale wind projects which accounted for 858.7 additional megawatts of generation
capacity (Berinstein, 2001).
2.2 History of wind power
Humans have been harnessing wind for centuries. Sailboats use wind for transportation.
Dutch windmills were used as far back as the 1400s to pump water out of swamps. Even
further back, middle easterners built windmills in the 11th century (Lyons, 1998). The
Netherlands, however, must be credited with making wind power what it has become

20
today. By 1900, they had installed 40 MW of electricity-generating turbines (Lyons,
1998). In the United States, windmills were first seen in the mid-1800s. Used on farms
to irrigate and grind grain, up to 6 million metal fan windmills were in place by 1950
(Nelson, 1990).
Wind is a growing form of major power generation in the United States and around the
world. The market for wind power did not really exist in the U.S. until the government
passed the Public Utility Regulatory Policy Act (PURPA) in 1978. From then on,
California took the lead in worldwide wind development during the 1980s, partly a result
of its vast wind resource, favorable incentives, and low-cost lands at certain sites (Gipe,
1995). Still, wind power development was sporadic throughout the second half of the
1980s for a variety of reasons. Low oil prices, unexpected costs, and slow technological
advancements all contributed to a lull in the industry over this period (Berinstein, 2001).
During the 1990s, the U.S. government helped bring the wind industry back to life with
various types of incentives to promote investment in, and production of, wind energy.
Such incentives included investment tax credits, production tax credits, property tax
reductions, accelerated depreciation, government loans, and net metering. In addition, as
the design of wind turbines has improved, maintenance costs have fallen and investment
costs have dropped to an estimated one fourth of what they were in the late 1980s
(Berinstein, 2001). During this time, wind energy spread to other states including Texas,
Iowa, Hawaii, and Minnesota.
Only recently have wind turbines become economically competitive with fossil fuel
technologies. Concerns over global warming have changed public perception of
renewable energy. The controversy over ratification of the Kyoto Protocol reduction in
carbon dioxide emissions has been one major source of publicity. States have passed
laws requiring that a certain percentage of their electricity generation derive from
renewable sources. This concept of a Renewable Portfolio Standard (RPS) has been lead
by Texas, which plans to have 2,000 MW of renewable generation by 2009 (AWEA,
2002).

21
The federal government has also learned the importance of tax rebates in order to
promote and make wind power more affordable. The wind energy Production Tax Credit
(PTC) was recently extended for another 2 years. This credit pays 1.7 cents per kWh
produced by newly constructed turbines (Danish Wind Industry Association, 2002). This
incentive guarantees that 1.7 cents will be paid over the first 10 years of the turbine’s
lifetime. The price will be adjusted for inflation over the ten years the credit is paid to
the utility.
Another federal initiative, known as Wind Powering America, is administered by the
Department of Energy’s Office of Energy Efficiency and Renewable Energy. This
program has set extremely high goals for the growth of wind power in America. The
objectives include the production of better wind resource maps, the use of wind turbines
to displace 35 million tons of CO2 by 2020, and a 5 percent portion of national electricity
generation from wind power by 2020 (DOE, 2002).
Progress in engineering of wind turbines has also made a huge difference in making wind
power more economically attractive. As recently as 1998, 500-kW units were the highest
capacity turbines on the market (Lyons, 1998). Today companies such as Vestas and
Bonus have installed much larger turbines with capacities up to 1.5MW, which can
power up to 1,500 homes (DOE WPA brochure). Danish companies already have 2-MW
and 2.5-MW prototypes in operation and expect to have them on the market soon (Danish
Wind Industry Association).
Small wind turbines for residential consumers are also emerging in the marketplace. In
the early 1980s, there was a sharp increase of new wind power firms starting up
following the new federal tax incentives. Most of those companies went out of business
due to the failure of many systems. Turbine blades were susceptible to breakage, and the
overall maintenance costs made the purchase of a turbine economically unattractive.
However, the advances made since then have created a solid market for companies such

22
as Bergey WindPower, the nation’s leader in small wind systems (Bergey, 2002). Bergey
was founded in 1977 and now has installations in 70 countries.
There are several reasons why a consumer would wish to purchase a small wind turbine.
Farmers may install a turbine to pump water from one location to another in order to feed
livestock, irrigate crops, or grind grain. People in remote locations may use a turbine
with a battery system to supply electricity. The biggest reason for the growth of small
wind is the implementation of net metering programs. Net metering (although laws vary
from state to state) is described as follows: at times when a turbine is producing more
electricity than the household is consuming, the power meter at that house spins
backwards, effectively selling the surplus power back to the utility. The price paid for
that power depends on the state law. Some states offer compensation at the generation
cost the utility reports. Others pay back at the retail cost that the consumer usually pays
on their monthly bill. Since systems cost tens of thousands of dollars (not including
installation), net metering is the only mechanism that makes buying a system
economically feasible.
The future for wind power is very promising. The number of large-scale wind farms has
been growing at a rapid pace. States such as Texas, Iowa, Minnesota, and Pennsylvania
have recently established new farms with capacities up to 193 MW (Enron Wind).
Deregulation of the power industry has paved the way for consumers to decide the
company from which they would prefer to buy their electricity. Some locales even allow
customers to buy renewable energy through green certificates. In such a system, the
buyer is assured through a stringent auditing system that the energy they purchased is
indeed renewable. The end user pays a slightly higher price than usual, a reflection of the
higher generation costs associated with renewables. This marketing scheme is often
referred to as green pricing. As America’s wind resource becomes more completely
understood and public acceptance of aesthetics, noise and avian impact improves, the
wind industry will continue to grow.

23
2.3 Capturing wind power: old and new technologies
The sailboat was the first technology to utilize the wind’s energy. They were essential to
the discovery of new lands, progression of commerce, and development of fishing
industries over thousands of years. Only recently has wind been harnessed for use on
land. The original windmills, started in the Middle East, served to move water and grind
grain. Since then, the Dutch led the world in developing wind power to its full potential.
The first windmills in the Netherlands were used primarily to turn wetlands into areas
where agriculture could occur. These devices look like the stereotypical windmill shown
in Figure 2.3.1.
Figure 2.3.1. Ancient Dutch windmill (The Franklin Institute Online).
During the past century and a half, there have been more modern devices used worldwide
for the same agricultural purposes.

24
These have a much different look and are made of metal fans as shown in Figure 2.3.2.
Figure 2.3.2. Fan windmill typical of middle America (Vintage Windmills, 2002).
The characteristic that links both the ancient and modern windmills seen in the two
figures above is their aerodynamic function. Both use the wind to “push” them around a
central hub. The design is similar to the way a sail works on a boat. One may notice that
the design seen in Figure 2.3.2 seemingly takes advantage of all the available wind power
by intercepting the wind across the entire circular analogous with the blades, while
turbines installed today have only two or three narrow blades. The problem with the
older designs is the limitations on efficiency associated with drag devices. It has been
determined scientifically that only 33 percent of the available power can be harnessed
using a drag design.
The newer design models for wind power use the same aerodynamic properties that allow
an airplane to fly. The concept of lift achieved by using an airfoil has allowed for vast
improvement in turbine efficiency. The efficiency limit for lift devices is 59 percent, an
impressive number considering that significantly less material is needed to build a lift
machine. An airfoil is synonymous with an airplane wing, which works by taking
advantage of the law of conservation of mass. As air flows over the wing (which is
cross-sectional shaped like an irregular teardrop), it must travel a longer path to reach the
other end on one side than the other. As the air on the longer side must travel faster to

25
meet the corresponding air at the other end, it produces a low-pressure area that provides
the necessary lift for an airplane to float, or in this case for a turbine to spin. Figure 2.3.3
shows the look of a modern turbine while Figure 2.3.4 is a free-body diagram to help
explain the forces involved in airfoil performance.
Figure 2.3.3. Enron 750-kW airfoil turbines in Culberson County, Texas (Enron Wind).
Figure 2.3.4. Fundamental forces associated with function of an airfoil.

26
It is important to mention that there are several different turbine designs that have been
invented over the years with both drag and lift features. The images shown so far in this
chapter all feature what is known as a horizontal axis, meaning the blades turn about an
axis parallel to the direction of the wind. Another way to capture wind is via a vertically
oriented axis where the rotation is perpendicular to the movement of the wind. Figure
2.3.5 shows examples of both orientations.
Figure 2.3.5. Horizontal axis is seen on the left while a vertically oriented device is seen at right.
Aside from the development of lift devices, other advancements have been made to
improve the performance of wind turbines. While the smaller residential turbines use a
wind vane that directs the hub (where the blades are connected to the spinning axis)
toward the wind, large-scale generators have different methods of turning the rotor
towards the direction of flow. Since the several hundred kilowatt and megawatt towers
are extremely tall, they experience forces that may compromise their structural stability.
Each tower contains a motor that turns the hub towards the wind slowly in a procedure
known as yawing. The movement must be done slowly to reduce the magnitude of stress
from torque put on the tower.
Self-starting is another feature associated with newer wind power devices. Instead of
waiting for the wind to start the rotation of the blades, the turbine has the ability to begin
rotation using a motor. This serves to increase the efficiency of the turbine since it takes
much more wind to begin rotation of the blades than it does to keep them rotating.

27
When winds become too strong for safe generation to take place, turbines have the ability
to effectively shut themselves down. Extremely powerful winds pose a large threat to the
safety of the tower due to torque. Small turbines have the ability to fold their blades back
behind the hub in a feature known as furling. Large-scale wind turbines have brakes that
simply stop the rotation of the blades until conditions improve.
Power conditioning after generation is necessary before delivering power to the
electricity grid. Large wind farms include a complicated system that takes the variable
power generated and matches it to the power being sent through the nearby transmission
lines. Small wind turbines require an inverter that is located near the connection to the
house line.
2.4 Meteorology: wind measurement and anemometer towers
Wind itself is a product of the sun’s uneven heating of the earth’s surface. As the air at
the equator heats faster than the air at other latitudes, it creates an area of rising hot air,
resulting in a low-pressure system. Low-pressure systems are characterized by rising air,
while high-pressure systems involve sinking air. As this equatorial air rises, it eventually
cools and begins its descent back towards the surface. This parcel of air is effectively
split at the top of the troposphere, and, subsequently, half descends in the Northern
Hemisphere and half in the Southern Hemisphere. The air generally reaches the surface
on its descent around the 30-degree line of latitude. Since this air is sinking, these
regions experience high-pressure conditions. This pattern results in a cycle of air
movement known as a convection cell.

28
Figure 2.4.1 shows the model generally used in meteorology to describe the movement of
air in the atmosphere.
Figure 2.4.1 The Hadley Convection Cell Model (Western Illinois University).
The model is known as the Hadley Convection Cell Model and involves six cycles that
cover the earth.
The direction of surface winds is not solely determined by the action of convection cells.
A force known as the Coriolis force deflects winds in the Northern Hemisphere to the
right and winds in the Southern Hemisphere to the left. The Coriolis Effect is a
phenomenon associated with the earth’s rotation. The resultant prevailing wind
directions shown in Figure 2.4.1 are indicated at the left by the curved arrows.
Despite knowledge of these global patterns, a site will experience wind from all
directions at some time during the year. This is a result of ever-changing weather
conditions that are accompanied by surface and upper-level high and low pressure
systems crossing a region every week. The air that encompasses a high-pressure system
will circulate in a clockwise motion, while the air surrounding a low pressure system will
circulate in a counterclockwise fashion. An example may clarify this explanation. If a
high pressure is located to the immediate south of a given location, it will experience a
westerly flow. On the other hand, if the same site experienced a low pressure to its south
it would observe an easterly wind.
29
One more wind phenomenon of importance is sea breezes. Large wind farms are often
built on the shore or even offshore since there are almost no obstructions and usually
constant winds. The notion of a sea breeze is very similar to that of a Hadley cell.
During the day, as the land heats up faster than the water due to differences in specific
heat, the air over the land rises. This forms an area of low pressure and a vacuum effect
that forces the air over the water to replace the rising air. The coast thus experiences
refreshing cool winds during the day. In the evening the opposite is true. The land cools
faster than the air over the sea, resulting in movement of air from the land to the sea. Sea
breezes are attractive to wind developers since they provide a predictable and consistent
resource.
There are many ways to locate and measure a wind resource at a given location. The
deformation of vegetation by consistent winds is one visible characteristic of many
decent wind sites. In a process known as flagging, trees with obvious damage from wind
exposure can be a somewhat accurate measure of a wind resource. However, observing
even dramatic flagging will not be enough evidence to ensure a good wind turbine site.
The only way to be sure of a location’s resource is to use anemometers, wind vanes, and
a strategic analysis plan.
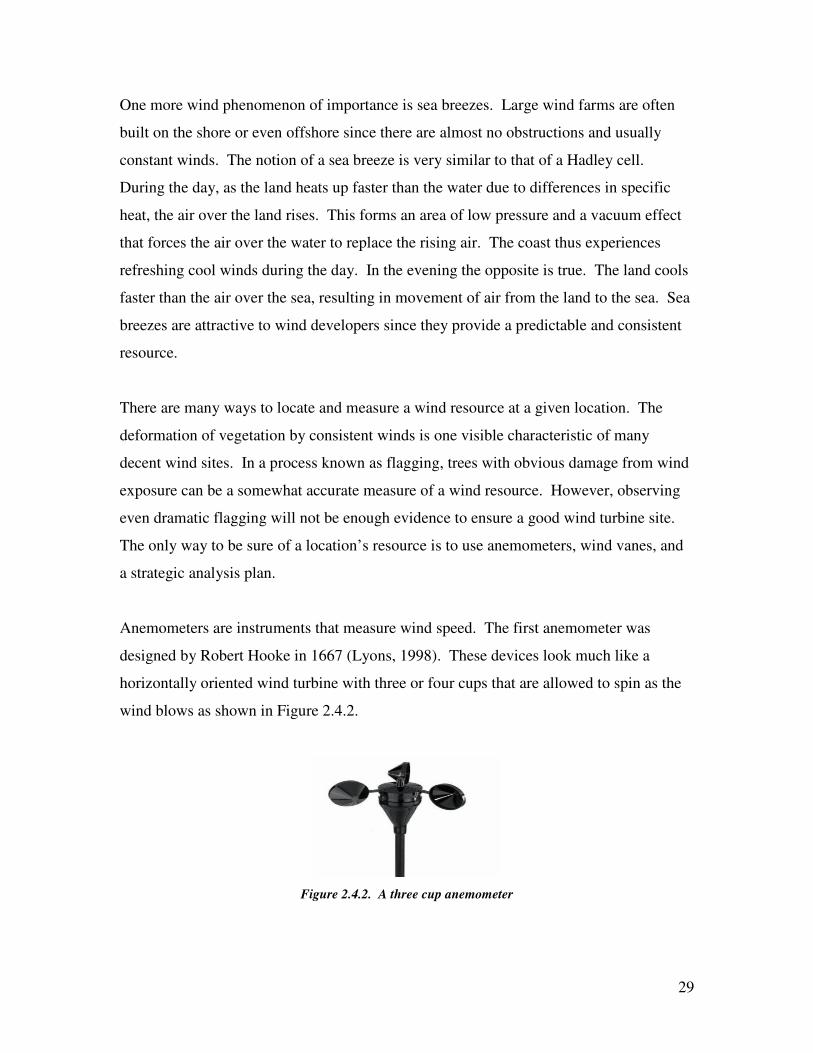
Anemometers are instruments that measure wind speed. The first anemometer was
designed by Robert Hooke in 1667 (Lyons, 1998). These devices look much like a
horizontally oriented wind turbine with three or four cups that are allowed to spin as the
wind blows as shown in Figure 2.4.2.
Figure 2.4.2. A three cup anemometer

30
These anemometers may store data in electric data plugs that can be retrieved at a later
time or they may send the data instantaneously to another locating via telephone lines.
The other device needed to gather sufficient wind data is a wind vane, which measures
the direction of the wind (shown in Figure 2.4.3). The vane records data in the same
manner as the anemometer. The vane always faces the wind like an anchored boat will
naturally do when sitting in the water.
Figure 2.4.3. A wind vane.
These two instruments should be placed at a potential site for at least one year to collect
data. They need to be located on a high tower (20 m - 50 m) above the ground and in a
place free from building and tree turbulence. Accurate measurement of velocity is crucial
since wind power is very sensitive to velocity. It is a function of the cube of the velocity,
meaning a 15-mph velocity can harness 3.4 times the power of a 10-mph measurement.
2.5 Siting of wind turbines and wind farms
Even with all the climatic data available, it is very difficult to pick out exact plots of land
suitable for development of large-scale wind farms. The average wind speed at one
location may be drastically different than a spot only a few hundred feet away. This
microclimate phenomenon is primarily the result of surface roughness factors.
Vegetation, usually trees, is the most common source of turbulence that can slow winds
and make a site inadequate. Since wind power is very sensitive to changes in velocity,
even the slightest interference will seriously reduce the potential power generation of
location. The best areas to investigate for development are high ridge tops with minimal
vegetation. The ideal scenario is a ridge normal to the prevailing wind direction, so many

31
turbines can be placed directly in the path of the wind without interfering with each other.
Another attractive site can come in the form of a large flat field, which are characteristic
of many farms in the Midwest. These areas typically have only a few trees and,
therefore, experience very little turbulence from obstructions.
It is usually more favorable that a site under consideration be away from major cities to
prevent objections from those concerned about potential negative impacts. Places far
from populated areas are also more attractive because their lease prices will most likely
be less expensive. Open farmland is a common site for wind farms for several reasons.
Farms often have acres of wide-open space with minimal roughness from short crops,
which will not significantly affect the winds at hub height. Leasing farmland is also a
good choice because only small portions of land are needed while grazing or crop
growing can easily continue alongside the turbines.
Buildings are another large source of turbulence. As a general rule, any spot within 20
times the height of a building is subject to interference by that structure (AWEA, 2002).
Figure 2.5.1 illustrates this point.
Figure 2.5.1. The airflow around a building structure (AWEA, 2002).
Another issue associated with siting a wind farm is its proximity to the nearest electricity
grid connection. It may cost several thousands of dollars for each kilometer the power
has to be transported before it can connect to the main transmission line. This also favors

32
flat farmland since mountainous terrain, although in many cases more windy, may
complicate construction of towers and placement of wires to grid connection.
Finally, and most importantly, a site cannot be developed until sufficient data have been
collected to evaluate the wind resource available. The standard industry practice is to
collect at least one year of wind data before being convinced that the site is viable.
Average wind speeds of 10 to 12 mph are needed to support a large farm (Lyons, 1998).
Anemometers are generally placed at several heights to establish a quality wind profile at
a location. It is also worth mentioning that even with one year of data it is hard to be sure
of a site’s potential. There really is no such thing as a “typical meteorological year”, so
the data recorded is sure to vary from what is to be expected over the lifetime
performance of the turbine.
2.6 Introduction to WAsP
The most important factor in determining the feasibility of a wind turbine at any location
is the availability of a wind resource. The erection of a wind turbine is a significant
investment, so proper care must be taken in studying the resource. For our study of the
James Madison University campus, we chose to the software package, Wind Atlas
Analysis and Application Program Wind (WAsP) developed by the Wind Energy
Department at the Risø National Laboratory in Denmark,�to model the wind flow in the
surrounding area. WAsP uses the local topography and observed wind data collected at a
meteorological station to generate a predicted wind climate for a given area. Once a
predicted wind climate is available, WAsP allows for the development of a resource grid
and calculation of an annual energy output. A resource grid shows the ideal location for
turbine or wind farm sites within the studied area. An annual energy output or AEO is
the total energy delivered by a wind turbine at a specific location over the course of a
year. This information is vital to an economic analysis and ultimately the decision of
whether or not to build a wind turbine on the campus of JMU.

33
Chapter 3: State Based Anemometer Loan Program
3.1 History of the program
The State-Based Anemometer Loan Program (SBALP) was established in early 2001 by
the Department of Energy's (DOE) Wind Powering America initiative managed by the
Philadelphia Regional Office (PRO). This program loaned 10 anemometers (wind
measuring devices) to James Madison University (JMU). SBALP evolved from the
Native American Anemometer Loan Program. This program allows tribes to borrow
anemometers and use them to estimate their wind energy resource. Because the
anemometers are borrowed, there is no cost to the tribes to conduct measurement of their
wind energy resource. Successful state-based programs are also being administered in
Utah and North Dakota and other state programs are being established throughout the
country.
3.2 Program overview
James Madison University (JMU) is administering the Virginia State Based Anemometer
Loan Program (SBALP) with support from a grant from the Virginia Department of
Mines, Minerals and Energy (DMME) and assistance from the National Renewable
Energy Laboratory (NREL). SBALP was established by the U.S. Department of Energy's
(DOE) Wind Powering America initiative out of the Philadelphia Regional Office (PRO).
The program is designed to spur the development and use of wind power in the state of
Virginia by helping potential wind turbine users to characterize their wind resource.
JMU has received ten wind-measuring anemometers through SBALP. Six of these
anemometers have been loaned to land owners, providing them the opportunity to
estimate their wind energy resource while providing wind data to Virginia and NREL.
The last four will be loaned out in the next few months. JMU is responsible for receiving
applications from interested parties to the program, selecting which sites are most
appropriate for the wind energy study, distribution and installation of the anemometers,

34
and gathering and processing the data. NREL and DMME will work with JMU as
partners on the project.
Applications are accepted in a rolling acceptance format. Each time a tower becomes
available to be loaned, all the applications are reviewed and the best site is chosen based
on the discretion of JMU.
3.3 Implementation and administration of the program
The Virginia State-Based Anemometer Loan Program (SBALP) was started out of the
Philadelphia Regional Office (PRO) of the Department of Energy (DOE). PRO issued a
request for proposal (RFP) to all of the states within the region. Dr. Jonathan Miles
submitted a proposal for James Madison University to be awarded the program.
The approved proposal awarded JMU the program. In order to do so the structure for the
program had to be laid. The following sections describe in detail all of the materials that
were created to carry out the program.
The general procedure for the program is to first generate interest through press releases,
press articles, and word of mouth. The next step is to educate everybody with interest
whether through the Internet, mailings, or phone calls. If the person is still interested
then they would review the loan agreement and contract, and then they would fill out an
application. That application would remain on file for the duration of the program.
If an application is approved then the applicant is notified and asked to sign a contract.
JMU will then schedule an installation date with the applicant. The materials would be
taken to the borrowers site and installed. A typical installation requires 5 hours of time
and at least 4 people. After the towers are up for a year’s period, JMU will disassemble
the tower and move it to a different location. A report of all of the data collected is then
generated and given to the borrower so they can take the next step towards a turbine
purchase if the data is suitable.

35
3.4 Equipment
The equipment loaned to JMU by the PRO are ten identical NRG-NOW System 20 meter
Wind Explorer Tall Tower Kits with ten NRG-NOW System 20 meter Wind Explorer
Logger Kit and ten NRG-NOW System 20 meter Wind Explorer Sensor kits. One of
each item is loaned to a borrower. The Tall Tower Kit consists of ten 2-meter sections of
tower that are placed on top of one another to form the 20-meter tower. The tower is
pictured here:
Figure 3.1. Schematic of 20m tower.
At 6 meters, 12 meters, and 18 meters the tower is supported by a set of guy wires. These
guy wires extend 42 feet from the base of the tower and are attached to anchors. The
typical anchors used for these tower are screw in anchors.

36
The 20 meter Wind Explorer sensor kit consists of an anemometer and a wind vane. The
anemometer, pictured below, is the wind-measuring device positioned at the top of the
20-meter tower. The cups are spun by the wind. The speed of the anemometer is sent
down the length of the tower to the logging device.
Figure 3.2. Cup anemometer.
The wind vane is a directional measurement device that is place on top of the 20-meter
tower with the anemometer. Knowing the direction the wind is coming from and how
frequently is important to optimally site a wind turbine.
Figure 3.3. Wind vane.

37
The 20-meter Wind Explorer Logger Kit is shown below.
Figure 3.4. Wind Explorer Logger Kit.
The logger is attached to the bottom of the tower head height to make it easy to read the
output and to exchange the batteries and data plug. A signal is received from the
anemometer and wind vane via wires. This signal is then translated into readable data
that is collected on the data plug.
Figure 3.5. Data plug.
The data plug records all of the information the Wind Explorer processes. The Wind
Explorer averages the data it receives over ten-minute intervals and this information is
then recorded on to the data plug.

38
3.5 Application (See appendix A for example)
Based on the siting techniques described in Chapter 2 we came up with an application
that demonstrates the information needed to assess the potential for a good wind energy
resource for a given site. The general information, name, address, email, and phone
number with the best time to call are necessary for contact information. The address is
also useful to locate the site on a topographical map to do further site assessment. The
elevation of the site is important because in general, as indicated in Chapter 2, the wind
speed increases as the height increases. The number of acres of the site helps again in
siting to determine if there is enough land area to support a 20-meter tower. The next few
questions are designed to show the reason for a landowner wanting to borrow a tower.
The application asks whether or not an applicant would use a turbine at a grid connected
or non-grid connected site. The type of electricity load question is to get an idea of the
size of a project that might be considered. The distinction between pumping water and
electricity usage is made because DMME is in the process of creating incentive programs
for using wind energy to pump water.
It is important that we know the landowners intended use of wind energy because if they
are interested in pumping water then we would like to make them aware of the incentives
available. The next question gives the applicant an opportunity to elaborate on the
purpose/goal of their wind energy project. The applicant is then asked to describe their
site in greater detail. It is important to know the soil type so that the proper anchors can
be used in the installation of the tower. The amount of open space available again is
important based on the siting criteria listed in Chapter 2. The applicant is then asked to
describe the elevation. As stated before elevation is important; however, if the site has a
high elevation but is in a deep valley then the greater elevation wind speeds cannot be
taken advantage. Any obstacles that might influence wind flow are also considered. The
20-towers are extremely sensitive to obstructions so it is important to be sure that the site
has enough open space to support the tower.

39
Finally, there is a list of items for the applicant to consider and provide with the
application. A proof of ownership is necessary to be sure they own the property that they
intend to use for a tower. A hand drawn sketch or illustration of the property to further
demonstrate obstacles is requested. A topographic map is requested to show the
elevation of the site relative to the surrounding landscape. If energy export is the intent
of the applicant than we ask that they do some research on the transmission possibilities.
Legal and zoning issues often surface in the erection of a tower and we place the
responsibility of researching these issues on the applicant. The bottom of the application
requires the applicants signature to ensure that the loan agreement has been read and is
agreed to, and the terms associated with the application are accepted.
3.6 Loan Agreement (See appendix B for example)
The Loan Agreement was designed to explain the procedure of the program and the
participation required from a landowner and becomes a binding agreement when the
landowner signs the contract. This is necessary so that the landowner knows their
responsibilities in the program and is held responsible for fulfilling these responsibilities.
The first paragraph provides a brief background of the program and indicates the major
participants. The second paragraph describes the eligibility requirements to be fulfilled
by a borrower. A proof of ownership is necessary to be sure that the applicant owns the
land where the tower would be installed. It is also necessary to make sure an applicant
knows this is a Virginia program and applicants outside of Virginia will not be accepted.
Next the borrowing process indicates the general timeline for the program. The
application and approval section is the binding part of the agreement to ensure that the
borrower will replace the batteries and data plugs as indicated. Also, this section asks the
borrower to consider what they will do with the wind speed data that is collected at the
site. The loan agreement section indicates that a contract must be signed in order to
participate in the program. The duration of the loan agreement is 13 months to account
time for installation, collecting one year of data, disassembly and return to JMU. The
equipment is given a brief description in the next section. The anemometer installation
section explains that JMU will carry out the installation of the tower and that if the tower

40
would need to be lowered for any reason that the borrower will contact JMU. The wind
data will be processed by JMU. This data will be collected by data plugs at the logger
and the borrower will be responsible for mailing the data plugs to JMU. Because the
program is government funded all data collected at a site will be public domain and
anybody has the ability to gain access to it upon request. Upon completion of the
program JMU will use all of the data collected to generate a report for the site. The
anemometer will be disassembled by JMU upon completion of the data collection.
Finally the last section describes the roles and responsibilities of JMU and indicates a
contact for any questions, comments or suggestion.
3.7 Contract (See appendix C for example)
The content of the contract was generated based on the contract between JMU and PRO.
It is necessary to pass the liability of the equipment on to the landowner so that they are
responsible while they are in possession of the equipment. JMU cannot assume liability
for the equipment while it is located on somebody else’s personal property.
3.8 Website
The website address is http://www.jmu.edu/sbalp. This site was created to ease the
number of mailings that would need to be made and to reduce the number of phone calls
necessary to explain the program. The website also provides a means for people to learn
about the program at their convenience. The website consists of a home page with
pictures of the first install, a program page that describes the program, a history page that
indicates the roots of the program, an equipment page to describe the equipment loaned,
an application page to provide the loan agreement and application, a contract page to
provide the contract required to be signed prior to acceptance, a frequently asked
questions page to provide more information that is not included elsewhere, a contact
information page to give people another option to receive more information, and a links
page that has links to the project administrators and major stakeholders, as well as links
to where more information can be received.

41
3.9 Press Release (See appendix D for example)
In order to spread the word about the program a press release was developed and sent out
to all of the newspapers in the state. This press release was written to attract the average
landowner to the potential for measuring the wind energy resource at their site at no cost.
The press release is very simple and can be read and understood by most average
newspaper readers. This was done to attract the most amount of people throughout the
state and to generate interest in wind energy in the state. Also, the number of responses
is useful to determine the demand for wind energy in the state.
3.10 Benefits to borrower
The major benefit to a landowner in participating in this program is the ability to study
the wind speeds at their site over a year’s period. As indicated in Chapter 2, at least a
year of wind speed measurements are needed in order to get an accurate representation of
the wind energy resource at a site. After this year’s data set is complete the borrower can
compare their data with data from a nearby airport or other wind speed collection facility.
This helps the borrower determine if the data set they have is a typical meteorological
year. If the landowner is interested in small wind energy systems, then they can take this
data set to a turbine manufacturer and they can say the output they desire from a turbine.
The manufacturer can then take that data and compare it to their power curves, as
described in Chapter 2, and decide which turbine purchase would be right for the
landowner. The payback can then be determined by doing an economic analysis on the
turbine.
By participating in this program all of the guessing of wind speeds and potential output is
virtually eliminated. A landowner can purchase a turbine and feel comfortable in the
output they expect.

42
If the data set indicates an exceptional wind energy resource for the landowner’s site and
their desire is to have a utility sized wind farm on their property, the landowner can take
that data to a developer. The developer can then investigate the site further and
determine if the site can be developed in to a wind farm. If this were to happen the
landowner would receive money in the form of a landowner’s lease so that the developer
can put wind turbines on their property.
3.11 Benefits to the state, DOE, and JMU
The program has a number of benefits to other stakeholders outside the individual
landowner. The data is useful to the state, DOE, other landowners, and many others in
the development of wind resource maps of Virginia. Modeling techniques can be used to
map the wind resource throughout the state, but without physical data taken at sites, these
models cannot be validated.
The major benefit to the program is to promote the use of wind energy and in turn the
increased use of wind energy has many benefits. Wind energy requires no use of natural
resources and causes no pollution, so for a state that is heavily reliant on coal for
electricity the increased use of wind energy would benefit in the reduction of pollution.
Wind energy can also be used to pump water to livestock as opposed to the livestock
going down into rivers and streams for water and in the process polluting these
waterways. This pollution reduction would be very beneficial in the Chesapeake Bay
watershed. Another benefit of the increased use of wind energy in Virginia is for
economic development. Many of the areas of high potential for wind energy
development are economically depressed and the income generated through the use of
wind energy would benefit Virginia’s economy.
3.12 Results
The press release, press articles written about tower installations, and word of mouth
have helped generate over 200 inquiries in the program. Out of these 200 inquiries

43
approximately 70 applications have been received. These results indicate a great interest
in wind energy in Virginia. SBALP is only the first step in promoting the use of wind in
the state and the great response we have gotten shows that more can be done in the state
and the public will support it.

44
Chapter 4: Borrowers
Upon completion of the written thesis, six of the SBALP’s anemometers have been
erected throughout the state of Virginia. Two anemometers on the east coast, two in
southwestern Virginia, one in Rockingham County, and one in Loudon County. The
following figure gives a numbered map of the locations of the sites in order of
installation.
Figure 4.1. Locations of erected anemometers.
The following is a list of all borrowers and background information on the site and any
additional information including lessons learned.
4.1 Robert Preston (Installed 10/18/01)
4.1.1 The site
Robert Preston was the first landowner to receive a tower through SBALP. Rob is a
Virginia Tech mechanical engineering graduate. His now works on his Harrisonburg,
1
2
3 6
5
4
1. Robert Preston
2. Jaye Baldwin
3. Tim Altizer
4. Dick Stokes
5. Henry’s Ponit
6. Northampton County Landfill

45
VA poultry farm in Rockingham County. His qualifications for the tower were more
based on his advanced interest in the program than the quality of his site. Rob contacted
our group long before the structure for the program had been laid and a press release
released. Because of his close proximity to JMU his site was appealing to use as a test
site for our first tower installation.
4.1.2 Installation
The installation on Rob Preston’s farm occurred on Thursday, October 18, 2001 and the
installation team consisted of Dr. Miles, Ken Jurman, Adam Jones, Greg Allen, Bryan
Franey, Dave Strong, Matt Heck, Tyson Utt, and Rob Preston. Dr. Miles used his truck
to transport the equipment to the site. The installation lasted approximately 6 hours and
many things were learned. One issue that came up was using the screw in anchor to raise
the tower. This anchor is positioned so that it can be attached to the gin pole and the
tower can be lifted using a winch. As we began to raise the tower, it was noticed that the
anchor was starting to come up out of the ground. As a result we elected to attach the
winch to Dr. Miles’ truck.
4.1.3 Lessons learned
It was found that after the first installation we were in need of the following pieces of
equipment:
• global positioning system/Compass • hard hats • 2 crowbars • 2 measuring tapes • open ended wrench set for base plate • wooden stake • hammer • support blocks for tower raising • extra straps to secure wires around tower • small screw set for Wind Explorer • level

46
We also needed to determine how to handle the exchange of the data plugs and batteries.
One flaw was later discovered in Rob’s installation. The anchors are not meant to be
installed like tent posts, but rather they are supposed to be in line with the guy wires.
Due to the firmness of the soil, the flaw did not need to be corrected but was made note
of for later installations. This was the reason that the anchor began to come out of the
ground as the tower was being raised.
4.1.4 Data
Monthly Wind Speed Averages
8
8.5
9
9.5
10
10.5
11
October November December January February
Month
Win
d S
peed
(mph
)
Figure 4.1.1. Preston monthly average wind speeds.
4.1.5 Conclusions
Rob’s wind speed data indicates that he is in a Class II wind speed region. Robs
intentions are to use the wind speed at his property to provide electricity to his home. A
Class 2 region indicates that his property is only feasible for the use of small wind, and
even this use would result in a long payback. A further economic analysis would need to
be done to determine the size of the system that should be purchased and the payback that
would be obtained through such a purchase.

47
4.2 Jaye Baldwin (Installed 12/12/01)
4.2.1 The site
Jaye Baldwin was the second landowner to receive a tower through SBALP. Jaye is
currently a Christmas tree farmer in Whitetop, VA. Whitetop is located in Grayson
County in the southwest portion of Virginia. The area is mountainous with elevations on
the order of 4,000 feet.
4.2.2 Installation
The installation on Jaye Baldwin’s farm occurred on Wednesday, December 12, 2001 and
the installation team consisted of Greg Allen, Bryan Franey, Dave Strong, and Matt
Heck. Greg Allen used his jeep to transport the equipment to the site. Upon arrival at
Jaye’s home, we were taken to the site areas that Jaye had picked out. The location we
selected was on the ridge top of his property in an area that he had been clearing with his
bulldozer. The tree cover had been cleared to allow for enough space for the installation.
The soil was very loosely packed due to the heavy activity in the area. This was a large
concern as we screwed in the anchors. We could bring them a little bit out of the ground
simply by pulling on the anchors. In order to determine if the soil was strong enough to
hold the anchors for a year, we used the screw in anchor to lift the tower. After the tower
was successfully lifted and suspended for a while, it was determined that although there
is a good bit of give in the anchors, they would remain in the ground. The bulldozer was
then attached to the winch and anchor just to be safe. This was the only stumbling block
in Jaye’s installation.
4.2.3 Lessons Learned
It was found that after the second installation we were in need of the following pieces of
equipment:
• global positioning system • compass

48
Determining the soil type before going to a site is very important. We need to have
different types of anchors with us when we go to a site so that we can be prepared if we
find an area of very loose soil like Jaye’s place.
4.2.4 Data
Monthly Wind Speed Averages
0
2
4
6
8
10
12
14
16
18
December January February March
Month
Win
d S
peed
(mph
)
Figure 4.1.1. Baldwin monthly average wind speeds.
4.2.5 Conclusions
Jaye’s wind speed data indicates that he is in a Class III wind speed region. Jaye’s
intentions are to utilize the wind speed to its fullest at his site. The wind speeds obtained
at his site indicate that further study needs to be done to determine if the site would be
appropriate for wind farm development. If Jaye were to utilize the wind speed for small
wind energy use than a further economic analysis would need to be done to determine the
size of the system that should be purchased and the payback that would be obtained

49
through such a purchase. The high wind speeds indicate that a small wind energy system
would be very economical in his location.
4.3 Tim Altizer (Installed 1/21/01)
4.3.1 The site
Tim Altizer’s farm is in Tazewell County just West of Tazewell, VA at an elevation of
approximately 2300 ft.. The anemometer is on the top of a ridge, in the grazing area for
his beef cattle.
4.3.2 Installation
The installation took place at the farm on Monday, January 21, 2002. Tim Altizer’s farm
was approximately five hours from the campus at James Madison University, and we
arrived at the site at approximately 12:30 PM. Having never visited the site before, we
needed to choose the location of the anemometer. We initially considered one of two
ridges on his property. The two ridges were at approximately the same elevation, with
low tree cover to the East of both ridges. Because of the steep slope and rock soil on the
first ridge, we decided to place the anemometer on the second, southernmost ridge. The
wind speeds were very high that day, and ridge was slightly sloped. We used much
caution while raising the tower, as the wind was blowing perpendicular to the direction of
lifting. The installation took a total of about four hours.
4.3.3 Lessons Learned
We learned the importance of a very good description of the land prior to visiting the site.
We had a good idea of the soil type, elevation, proximity to trees, and orientation of the
land prior to going to the site. It is essential that all of these criteria, however, are met
with confidence.

50
We also learned an appreciation for the impact the weather can have on an installation.
The wind created many safety concerns, and we spent a substantial amount of time
ensuring a safe installation.
We also directly addressed the problem of cattle on the land. At the time of the
installation, the cattle were not grazing in the anemometer location. However, the land is
used part of the year for grazing. In March, 2002, Mr. Altizer erected an electric fence
around the entire footprint of the tower, preventing cattle from rubbing up against the
guywires.
4.3.4 Data
(data not yet available)
4.3.5 Conclusions
Although difficult to draw many conclusions with the limited data, Mr. Altizer’s property
would be a good site for a small wind system. Mr. Altizer would like to look into a wind
system for pumping water from the stream to a higher elevation for his cattle, and data
shows adequate wind for that purpose.
4.4 Dick Stokes (Installed 2/10/02)
4.4.1 The site
Dick Stokes lives in Bluemont, Virginia on a 60-acre property in Loudon County. We
received many applications in Loudon County, and chose Mr. Stokes’ location for a
variety of reasons. The anemometer was placed in an open field southwest of his house.
The elevation was approximately 200 ft.

51
4.4.2 Installation
The installation took place on Saturday, February 9, 2002. We arrived at Mr. Stokes’
location at approximately11:00 am. The installation team included David Strong, Greg
Allen, Dodge Perry, Tyson Utt, and Adam Jones. Despite a small amount of rain, the
installation was successful. We had slight problems with the stability of the base plate
while initially lifting the tower, and a small problem with the hand winch. The ground
was suitable for the anchors, and the weather posed no problems. By this installation, we
had worked through many of the common installation problems. Overall, this installation
was successful.
4.4.3 Lessons Learned
There were not many lessons learned at Mr. Stokes’ property. We worked efficiently,
and the land and equipment posed minimal problems throughout the day. We could have
come with more information for the landowner regarding small wind systems,
instrumentation, and any other useful information.
4.4.4 Data
(data not yet available)
4.4.5 Conclusions
Data from Mr. Stokes’ property alone will not give us a good idea of the available wind
in Loudon County. Coupled with data from nearby, we will be able to assess the amount
of wind in the area.

52
4.5 Henry’s Point (Installed 2/24/02)
4.5.1 The site
The Henry’s Point location was the fifth location to receive a tower through SBALP.
Rick Hall is the landowner at the site in Accomac County located on the eastern shore of
the Delmarva Peninsula. Rick Hall is a farmer growing crops such as tomatoes and
cucumbers. Dr. Miles, Ken Jurman, and Matt Heck had previously visited the site to
determine the feasibility of an install at the site.
4.5.2 Installation
The installation at the Henry’s Point location occurred on Saturday, February 24, 2002
and Sunday February 25, 2002 and the installation team consisted of Adam Jones, Matt
Heck, Bunty Dharamsi and Peter Salmon. Because of the proximity to marshland and the
soil type at the site a different set of break-out anchors were used. On Saturday, the team,
with the assistance of Rick and his machinery, measured out the positioning of the
anchors and dug the holes. Rick used an auger on a piece of his machinery. These holes
were dug to about 4 feet in depth. On Sunday the team placed the anchors in the holes
and used a metal rod to cause the anchor to flatten itself which allows for its strong
holding power. The remainder of the installation went smoothly.
4.5.3 Lessons Learned
It is important to secure the far set of guy wires as the tower gets close to the upright
position. Due to a sudden change in wind speed the tower would have blown over had
we not previously secured the anchors.
4.5.4 Data
(Data not yet available)

53
4.5.5 Conclusions
The wind speeds expected at the Henry’s Point site are expected to be great enough to
support the development of a wind farm. This prediction is based on the study done by
Willow Thomas in the Appendix and the knowledge that the wind speeds on the shore are
generally high.
4.6 Northampton County Landfill (Installed 2/24/02)
4.6.1 The site
The Northampton County landfill was the sixth location to receive a tower through
SBALP. Tim Hayes, the director for the Northampton County Department of Sustainable
Development, is in charge of the site. The site is located on the eastern shore of the
Delmarva Peninsula on top of a landfill that towers above the surrounding land. Dr.
Miles, Ken Jurman, and Matt Heck had previously visited the site to determine the
feasibility of an install on the landfill.
4.6.2 Installation
The installation at the Northampton County landfill occurred on Sunday, February 24,
2002 and the installation team consisted of Greg Allen, Tyson Utt, and Dodge Perry. Dr.
Miles used his truck to transport the equipment to the site. The landfill had been covered
with a layer of topsoil and the section of the landfill being used for the tower was not
expected to have any activity in the next year. The anchor installation was the most
difficult part of the landfill install. Because of the tough soil it was very difficult to screw
the anchors in. As a result the landfill manager had to use large blocks of cement to
secure one of the anchors.

54
4.6.3 Lessons Learned
Again, determining the soil type before going to a site is very important. It would have
been helpful to have arrowhead type anchors for the install and not to use the screw in
anchors.
4.6.4 Data
(Data not yet available)
4.6.5 Conclusions
The wind speeds expected at the Northampton County landfill site are expected to be
great enough to support the development of a wind farm. ProVENTO has already
expressed interest in developing the site in conjunction with their Cape Charles site.

55
Chapter 5: Feasibility study of east JMU campus
5.1 Justification for wind power on the east campus of James Madison
University
Considering the local wind resource, geographic features, and educational curriculum of
James Madison University, the placement of a small-scale wind turbine on campus seems
a natural step for the university, provided that the data collected during the next two years
demonstrates an appreciable wind resource. A wind turbine on the James Madison
University campus would yield many benefits that cannot be easily evaluated through an
economical analysis. Placement of a wind turbine on campus would be useful for
educating students, building a stronger reputation for JMU and its College of Integrated
Science and Technology (CISAT), and promoting renewable energy locally and across
Virginia. Although methods and tools exist to place a monetary value on such non-
market benefits, including market valuation and contingent valuation, these values are
highly debatable and would require a much more in-depth study. Some people would
argue that such a monetary analysis is essential for sound policy, but in this case we will
merely address these benefits without a specific financial objective in mind.
Before considering wind power as a source of electricity, one must be sure that a
sufficient resource exists. Casual observation by people familiar with the Harrisonburg
area suggests that the east (CISAT) campus of JMU is prone to a considerable wind
resource. Although Harrisonburg is located in a valley, the east campus is elevated well
above the surroundings. The existing buildings and future construction plans on this
campus present sizable obstacles that we must consider when evaluating wind potential.
However, we do not believe that these will be significant barriers given our chosen
location. We have installed a 30-meter meteorological tower in an elevated, relatively
open area to measure the wind speeds and directions on campus. The data that the
anemometer accumulates over the next few years will allow JMU to make a reasonable
prediction on whether a small-scale turbine would be operationally feasible.

56
Providing a “quality, comprehensive” education is a primary objective of James Madison
University (JMU, 1998). In particular, the College of Integrated Science and Technology
emphasizes a hands-on, real-world type experience in its curriculum. An excerpt from
the CISAT mission of states that “The college seeks and creates new models through
innovative curriculum development and uses the advancing knowledge of science and
ever-evolving technologies to integrate the changes in a rapidly shifting world into the
professional lives of faculty and students” (JMU, 1998, p.208). Wind power applies a
technology that is growing in the real world and has potential to expand further in coming
decades. Therefore, it would be beneficial for students to gain a better understanding of
this technology.
A wind turbine would provide an opportunity for students to learn first-hand how a wind
turbine operates. Students could observe how the turbine functions on a daily basis and
study technical aspects of its operation, including the generation and transmission of
electricity. Such a learning experience would be especially advantageous for students
and faculty in the environment and energy sectors of the Integrated Science and
Technology major. It could also benefit other courses outside of CISAT including
general science, physics, and potentially statistics courses. Table 5.1.1 displays a few of
these courses and how they may use a turbine to their educational advantage.

57
Table 5.1.1. Potential courses benefiting from turbine Course Use for turbine
ISAT 301:Instrumentation and Measurement in Energy
Serves as a working model to demonstrate the performance of turbines, also could be useful for data collection and analysis
ISAT 413: Options for Energy Efficiency
Study technical parts of system and energy losses and efficiency
ISAT 410: Sustainable Energy Development
Observe daily operation, features, mechanics, and performance output during wind portion of course
ISAT 320, 321: Fundamentals of Environmental Science and Technology
Demonstrates a model of non-polluting energy production, students could calculate the amount of pollution prevented from its performance
ISAT 491, 492, 493: Senior Thesis Continue performance study and economic analyses; potentially begin work towards more turbines on JMU campus
GSCI 101: Physics, Chemistry and the Human Experience
Students can learn the physics of how the turbine converts wind power into electricity
GSCI 115E: Earth Systems, Cycles and the Human Imapct
Study of windy areas, consideration of reduction in greenhouse gas emissions from the turbine
GSCI 104: Scientific Perspectives Special study of renewable energy could feature the newly installed photovoltaic panels as well as the turbine
PHYS 215: Energy and the Environment
Study energy conversions, thermodynamic restrictions, and environmental impact
For all of these courses a turbine would provide a working example for students to learn
by, helping to balance a learning process that is often abstract. Supplementing textbook
material with real-life experience and modern technology adds to the learning experience
of students. The College of Integrated Science and Technology prides itself on providing
students with a unique learning experience, and the installation of a wind turbine would
surely have tremendous educational benefits.
Similarly, a wind turbine would serve as a very visible symbol of the university’s
determination to provide students with the best education possible and to promote
renewable energy in an environmentally conscious world. In conjunction with the solar
panels in front of the ISAT building, a wind turbine would help to boost the reputation of
JMU on a national level as a technologically advanced university. This prominence
would help the expansion of the university by helping attract the best and brightest

58
students. The turbine would provide a lasting image to prospective students who see it in
person or in recruitment brochures. It projects a strong image of a university that cares
for the environment and the education of its students.
Finally, we should not overlook the impact that such a project would make to promote
renewable energy in local and state communities. A turbine on the JMU campus would
complement the Student-Based Anemometer Loan Program in helping change the public
perception of wind power. The construction of the turbine would help raise awareness of
the potential of wind energy and renewable energy in general across Virginia. It may
encourage Virginians to consider wind energy as an electricity option in the future. The
university could use this as an opportunity to teach the general public about renewable
sources. As more people become educated about the increasing feasibility of renewable
energy, utilization of renewable resources will continue to grow.
5.2 Selection of meteorological tower site
In selecting the tower site on campus, we considered all of the criteria that we established
for a satisfactory anemometer site for off-campus locations, as well as additional site
requirements determined by campus administration. As will be discussed later, campus
administrators had major concerns over the aesthetics of the tower in certain locations.
This process occurred over a six-month period until we established a final location
suiting everyone’s needs. We believe that the chosen site will provide good wind data
and will be a good location for a wind turbine in the future.
Originally, the following six sites were considered on the JMU East campus for the
placement of the tower:
A. Corner of faculty parking lot (D2) at top of hill B. Slightly to the right and below student commuter lot (C10) C. Grassy area between Carrier Dr. and gravel driveway D. Behind new extension of resident parking lot (R3) E. Hilltop to right of University Blvd. entrance to campus F. Adjacent to softball field near modular building

59
Figure 5.1.1. Sites considered and final location of tower.
The JMU administration, faculty, students, facilities management all visited and
evaluated each site based on several criteria. At the beginning of the process, we had
planned on erecting an NRG 20-meter meteorological tower to support a wind vane, wind
anemometer, and a data collection system. Thus, in collaboration with Dr. Jonathan
Miles, our team rated the sites based on the following criteria:
a. Viability of wind data to be collected b. Remoteness from pedestrian and vehicular traffic c. Visual impact d. Ease of installation
In addition, Mr. Ken Jurman of the Virginia Department of Mines, Minerals and Energy
and Mr. Tony Jiminez of the U.S. Department of Energy’s National Renewable Energy
Laboratories visited each site and provided additional input.
N ♦A
♦B
♦C
♦D
♦E ♦F
G

60
Our first preference was to place the tower on top of the hill to the right of the University
Blvd. entrance to campus (Site E). Dr. Miles, Mr. Jurman and Mr. Jiminez all agreed that
many features of this location make it the most desirable for gathering wind data. Its
relatively high elevation and remoteness from buildings and obstructions would likely
yield viable wind data. Secondly, this location sees little pedestrian traffic that could
potentially interfere with the structure. However, since a tower at this site would be
visible from traffic entering and exiting the East campus, JMU administrators believed
that the tower would have a negative impact on aesthetics. This small portion of campus
has been set aside to be preserved in a more natural condition.
Our second preference was the grassy area between Carrier Dr. and gravel driveway (Site
C). This location would be fairly good and offers a large footprint for installation, but
has several drawbacks as well. Turbulence from trees to the east of the site would
interfere with the data to an unknown extent, and future construction planned to the west
would also have some impact. Pedestrian traffic more often passes near this location than
it does at site E.
All student and expert parties deemed the area adjacent to the softball field as acceptable,
but not desirable. Though surrounded by ample space, we believe that trees to the north
and south would greatly interfere with wind data. These obstructions, its relatively low
elevation and its remote location would not likely provide data representative of the east
campus.
Finally, we considered sites A, B, and D to be impractical, as there is not sufficient space
for safe erection of the NRG 20-meter tower. The guy wires require a 42-foot distance
on each of four sides to safely install the towers. The manufacturer recommends against
installation at these sites.
Based on our recommendations and the preferences of JMU administration in regard to
aesthetics and safety, another proposal arose. The administration offered to provide
partial funding for a freestanding, 30-meter meteorological lattice tower to be placed at

61
site B. The tower would measure wind speed and direction, as well as other climactic
variables that ISAT students and faculty could benefit from. Such a tower would not
require support wires and JMU administrators deemed it more aesthetically pleasing. In
addition, this eliminates the possibility of students tripping with the guy wires or
interfering with them. In the absence of support wires, the area slightly to the right and
below the student commuter lot (site B) provides a sufficient footprint to construct this
tower.
However, facilities management considered the site too close to the grounds for future
construction. A track is planned on being built directly to the east of this site. Dr. Miles,
in collaboration with JMU administrators and facilities management, determined the area
directly behind student commuter lot C10 (site G in Figure 5.3.1) to be the best overall
location.
This location has a relatively high elevation with few major obstructions in its
surroundings. The Health and Human Services building to the southwest of the site is a
large obstruction, but it should not cause a great disruption to wind flow due to its
distance from the site and the direction of prevailing winds. Thus, data gathered at this
location should serve as representative of the east campus. It will also not hinder any
vegetation growth or wildlife, being in a already developed area. Although this location
directly abuts a parking lot, this does not infringe upon any safety or proximity
specifications. There is enough open area to place a freestanding tower, where a tower
with support wires would not have been feasible. Site G fits all of our criteria for a
desirable location, and we expect that it will yield reliable, valid wind data in this
position.

62
Chapter 6: Wind modeling with WAsP
In the absence of sufficient wind data on a site, as is the case in our project, the most
effective way to determine the annual energy output is to develop a computer model of
the surrounding region. For our project, we chose to use WAsP (Wind Atlas Analysis
and Application Program), which has earned a reputation as an industry standard for wind
resource assessment and the siting of wind turbines and wind farms (WAsP 7.0 Help
Facility). WAsP was released in 1987 and has been employed by over 800 users in more
than 70 countries worldwide (www.wasp.dk). WAsP consists of five main “calculation
blocks”: raw data analysis, generation of wind atlas data, wind climate estimation,
estimation of wind power potential, and calculation of wind farm production. This
chapter will focus on the functions of WAsP and how they were applied to our feasibility
study.
6.1 WAsP hierarchy
WAsP, itself, is a relatively simple program to run. Obtaining the materials used to
create a wind model, however, can be difficult and/or tedious. WAsP is organized in a
hierarchical fashion. When WAsP is first opened, the user is presented with an empty
white window. To begin working, a new workspace must be created which becomes the
‘root’ of the entire program. All projects within a WAsP model branch off from a
common workspace. After creating a workspace, the next step is to add all the elements
of the site being investigated. These items are referred to as ‘hierarchy members’ or
‘members’ for short.
6.1.1 WAsP project
The first member of the workspace root is the ‘project.’ The project contains all the
elements for a given situation within a particular site. To add a project to the workspace,
the user must right-click on the workspace icon, first select ‘Insert New’, and then select

63
‘Project.’ For example, in Figure 6.1.1, the CISAT workspace contains two different
projects for testing separate conditions.
Figure 6.1.1. The upper left corner of the screen shot shows the WAsP hierarchy.
6.2 Site description
James Madison University is located in midwestern Virginia in the city of Harrisonburg.
The area is known as the Shenandoah Valley as the Blue Ridge Mountains can be seen to
both the east and the west. The Shenandoah Valley is characterized by rolling hills,
scattered forests, and large agricultural areas. Several small towns and suburban areas
also fill the landscape. Looking at a wind resource map of Virginia, one would not
expect the Harrisonburg area to be an ideal place to do a wind feasibility study.
However, the east portion of JMU campus, separated from the west by Route 81, is
located at a high point in the valley at an elevation of 1490 ft. In addition to the relatively
high elevation, there is strong anecdotal evidence of the winds present on the east side of
campus offered by students who walk around the area each day.
A wind resource map can offer an idea of the nature of winds that might be expected at a
given area; however, the behavior of the wind at a specific site is directly affected by the

64
characteristics of the landscape. In an ideal wind resource study, the site would be flat,
smooth and there would be no buildings, hills, or mountains within hundreds of miles.
Unfortunately, windy areas almost never fit this ideal scenario. As a result,
characteristics such as orography, surface roughness, and shelter effects (obstacles) all
must be taken into consideration when conducting a wind study. These characteristics
are referred to collectively as the topography of a site. In order for WAsP to calculate the
effects of topography on the wind at a given site, it is necessary to systematically describe
the orography, surface roughness, and shelter effects of the surroundings in a digital
form.
6.2.1 Orography
Orography refers to the terrain and elevation of an area. Orographic features, including
hills, valleys, cliffs, escarpments, and ridges, all influence the flow of wind at a site.
Wind turbines are commonly placed on hilltops or mountain ridges to allow as wide a
view of the prevailing wind direction as possible. In addition, hills may experience wind
speeds that are higher than in the surrounding areas. This is because the wind becomes
compressed on the windy side of the hill and once the air reaches the ridge, it can expand
again as it soars down into the low-pressure area on the lee side of the hill. The hill effect
is one of the reasons why we wanted to investigate the higher elevations on the east side
of the JMU campus.
The speed of the wind can also be influenced by the tunnel effect. The tunnel effect
occurs when air becomes compressed on the windy side of mountains or buildings and its
speed increases considerably between the obstacles to the wind. An example of the
tunnel effect occurs when you use an ordinary bicycle pump. When you push down on
the bicycle pump, the air that comes out the nozzle is considerably faster than the rate at
which you push the pump. The reason is that the nozzle is much narrower than the
cylinder in the pump creating a tunnel effect.

65
The most accurate way to describe orography in WAsP is to obtain a digital elevation
model (DEM) of the area. Digital elevation models are compiled by the USGS and are
designed to digitally describe terrain elevations located at regularly spaced horizontal
intervals. We obtained a DEM for the Harrisonburg quadrangle through MapMart.com.
We chose high-detail, 7.5-minute maps with 10-meter resolution in order to achieve the
highest degree of orographic accuracy. Once we had obtained the DEM, we converted it
into a WAsP compatible MAP file. Using Golden Software’s Surfer 7.0, we first
imported the DEM file and then converted it into a DXF file. The final step was to use
WAsP’s DXF-to-MAP converter to produce working map of the orography. Our
orographic map of the Harrisonburg quadrangle is shown in Figure 6.2.1.
Figure 6.2.1. Orographic map of Harrisonburg, Virginia quadrangle.
6.2.2 Surface roughness
High above the ground, the surface of the earth has very little impact on the wind. At
lower altitudes, however, wind speeds are directly affected by the friction of the wind
moving against the earth’s surface. The magnitude of friction is dependent on the
roughness of the surface. Surface roughness is defined by roughness classes or roughness

66
lengths. The classes range from Class 5 surfaces such as large cities and forests, which
slow down the wind considerably, to Class 0 surfaces, such as areas of water that have
little effect on the speed of the wind. In general, the more pronounced the roughness of
the earth’s surface, the more the wind will be slowed down and the higher the
corresponding roughness class.
Table 6.2.1. Surface characteristics and their associated roughness classes and lengths. Class Roughness Length (m) Surface Characteristic
5 1.0 City
5 0.8 Forest
4 0.5 Suburbs
3 0.3 Shelter belts
3 0.2 Many trees and/or bushes
2 0.1 Farmland with closed
appearance
2 0.05 Farmland with open
appearance
1 0.03 Farmland with very few
buildings/trees
1 0.02 Airport areas with buildings
and trees 1 0.01 Airport runway areas 1 0.008 Mown grass 1 0.005 Bare soil 1 0.001 Snow surfaces 1 0.0003 Sand surfaces 0 0.0001 Water areas
The roughness length is the value that is utilized by WAsP in its roughness algorithm.
The roughness length is defined as the height above the ground where the wind speed is
theoretically zero. For instance, in a city, the wind speed theoretically goes to zero at a
height of one meter above ground level.

67
The table below is provided by the Danish Wind Energy Industry and shows the effect of
surface roughness on wind speed as you approach the earth’s surface from above.
Table 6.2.2. Shows the wind speed in m/s with increased height and roughness length. Roughness
Class 0 0.5 1 1.5 2 3 4
Roughness
Length (m) 0.0002 0.0024 0.03 0.055 0.1 0.4 1.6
100 10 10 10 10 10 10 10
90 9.92 9.9 9.87 9.86 9.85 9.81 9.75
80 9.83 9.79 9.72 9.7 9.68 9.6 9.46
70 9.73 9.66 9.56 9.52 9.48 9.35 9.14
60 9.61 9.52 9.37 9.32 9.26 9.07 8.76
50 9.47 9.35 9.15 9.08 9 8.74 8.32
40 9.3 9.14 8.87 8.78 8.67 8.34 7.78
30 9.08 8.87 8.52 8.4 8.26 7.82 7.09
20 8.77 8.49 8.02 7.86 7.67 7.09 6.11
Hei
ght (
m)
10 8.25 7.84 7.16 6.93 6.67 5.83 4.43
Notice that the wind speed declines as you approach ground level. In addition, one can
see that the wind speed declines more rapidly with increased surface roughness.

68
The roughness of the Harrisonburg quadrangle generally fits into one of four
classifications: suburban/village, forested, water, or open agricultural area. A
topographic map of the quadrangle is shown in Figure 6.2.2. . The different colors
indicate areas of varying roughness. Green is defined as forested areas, blue is water,
gray is suburban, and the remaining area is open agricultural land.
Figure 6.2.2. Topographic map of Harrisonburg and surrounding quadrangles.
In order to define roughness in WAsP, we first obtained a digital topographic map in a
bitmap form such as the one shown in Figure 6.2.2. Then using MapEdit, we opened the
orographic map (Figure 6.2) of the Harrisonburg quadrangle that was previously created
by the digital elevation model. Once the orographic map was open, we loaded the
topographic bitmap of the Harrisonburg quadrangle on top as a second layer.

69
The MapEdit window showing the orographic map and topographic bitmap is shown in
Figure 6.2.3.
Figure 6.2.3. MapEdit window shows the height contours and topographic bitmap.
To ensure that our topographic bitmap and orographic map were properly georeferenced,
we had to mark three “fixpoints”. The fixpoints should be placed in three of the four
corners of the quadrangle. After marking and setting the coordinates of the fixpoints,
WAsP will automatically effectuate the bitmap and the orographic map.
The next step was to digitize the different roughness areas by manually creating
roughness change lines. Roughness-change lines represent a change in surface roughness
from one area to another. Roughness information consists of two roughnesses: a right
hand and a left-hand value with reference to the direction of tracing. To begin digitizing
we first selected Enable Digitizing from the Digitize menu. We then left-clicked on a
line that separated two roughness areas. WAsP then prompts you to specify the
roughness length value on either side of the line. Once the roughness values were
specified, we continued to trace around the common roughness area until we reached the
point from which we started. To automatically enclose the roughness area, we right-

70
clicked on our last point and selected Finish with Close. This process was repeated until
all the roughness areas within the quadrangle were digitized. A map of the orography
and surface roughness is shown in Figure 6.2.4.
Figure 6.2.4. MapEdit window showing fully digitized roughness areas and orography.
An alternative method to define roughness in WAsP is through the use of Didger
(produced by Golden Software). Didger is capable of digitizing topographic maps as
well as hand tracings made on the topographic map. Once digitized, Didger allows the
user to input roughness lengths for the defined roughness areas. A Didger file can be
saved and imported directly into WAsP.
6.2.3 Shelter effects
In addition to the orography and the surface roughness of a site, surrounding obstacles
can have a negative impact on the flow of wind. Obstacles such as buildings, trees, large
rocks, etc. can all significantly decrease wind speed and cause turbulence.

71
Notice, in Figure 6.2.5, that the turbulence zone caused by an obstacle can extend well
above and beyond the obstacle itself.
Figure 6.2.5. Illustration showing the possible effects of an obstacle on wind flow.
Also, note that the turbulence is more apparent on the backside of the obstacle than on the
front side. As a result, it is best to place wind turbines in an open area free of obstacles
that may cause turbulent winds. If an obstacle is unavoidable then it is best to place the
turbine upwind.
The decrease in wind speed behind an obstacle is directly related to its porosity. Porosity
is defined as the ratio of the area of the obstacles 'pores' to its total area facing the wind.
In other words, it is a measure of the openness of an obstacle. Porosity values general
range from solids obstacles such as buildings, which have a value of zero, to trees, which
generally have a value of 0.5. Trees are unusual because their porosity may change from
season to season. A tree during the winter with no leaves may have a porosity value of
greater than 0.5 and have a value of less than 0.5 during the summer when it has all its
leaves. The decrease in wind speed is a result of both the height and the length of an
obstacle. The closer you are to the obstacle and the closer to the ground you are, the
greater the effect.
In order for WAsP to calculate the effects of obstacles on the wind at our site, we had to
define seven characteristics of each obstacle: the angle to the first corner in degrees (�1),
the distance to the first corner in meters (R1), the angle to the second corner in degrees
(�2), the distance to the second corner in meters (R2), the height in meters (h), the depth
in meters (d), and the porosity (P). On the JMU campus, we identified a number of

72
obstacles that would affect the flow of wind to the turbine site including the Integrated
Science and Technology (ISAT) building, the Health and Human Services (HHS)
building, Potomac Hall, Chesapeake Hall, the College Center, and the newly completed
Leeolou Alumni Center. The ISAT and HHS buildings were combined into one obstacle,
as were the College Center and the Alumni Center since they are both connected
buildings.
Figure 6.2.6. Example of the parameters used by WAsP to calculate the shelter effects of an obstacle.
In order to determine the seven obstacle characteristics of our four obstacles, a two-step
process was used. First, we obtained blueprints of each of the buildings in question from
the JMU Office of Facilities Management. From the blueprints we were able to
determine the height, depth, and the length of each wall for each building. The second
part of the process was to find the exact global position of the turbine site and the
position of two corners for each building using a Global Positioning System (GPS). The
global position allowed us to calculate the distance (�1 and �2) and the angle of each
corner with respect to the turbine site.
N
W
S
R1
R2 α2
α1
d
R1: Radial distance to first corner
R2: Radial distance to second corner
d: depth of obstacle
α1: Angle from North to first corner

73
The following figure shows obstacle diagram for the JMU east campus as described in
WAsP.
Figure 6.2.7. Obstacle diagram of buildings on east campus of JMU.
6.3 Wind atlas
A wind atlas is one of the essential components in calculating the annual energy output of
a turbine at a given site. The atlas describes the behavior of the wind at a given site by
analyzing an observed wind climate and incorporating local topographic characteristics.
In order to calculate a wind atlas, WAsP must have a meteorological station as one of its
“children” and the met station must have an observed wind climate as one of its
“children.” Optionally, the meteorological station may include an obstacle list, a
roughness description, and a list of user corrections.
6.3.1 Meteorological station
A meteorological station is an essential element in the calculation of a wind atlas. A
meteorological station has no data of its own, except its coordinates within the
topographic map. The coordinates are specified in Universal Transversal Mercator

74
(UTM) units. To find the UTM coordinates we used a GPS to establish the position of
the meteorological station in Keezletown, Virginia in units of latitude and longitude. We
then converted these coordinates to UTM coordinates and entered them into WAsP. The
following figure shows the locations of both the meteorological tower and turbine site.
The meteorological tower is located on the right and the proposed turbine is located to the
left.
Figure 6.3.1. Map of Harrisonburg quadrangle showing locations of both the meteorological tower and
the turbine site.
6.3.2 Observed wind climate
The observed wind climate (OWC) is a time-independent collection of wind data that are
used to calculate the wind atlas. The OWC is created from raw wind data, wind speed
and direction, collected from a meteorological station. The wind data used in our project
was collected from Keezletown, Virginia on Mr. Rob Preston’s farm described in Chapter
4. We chose to use the Keezletown data due to the lack of other data. The closest data
other than the Keezletown data was collected in Staunton, Virginia located approximately

75
25 miles away. The accuracy of WAsP’s predictions decreases with increased distance
between MET and proposed turbine sites so it was desired to locate data that were as
close together as possible.
Unfortunately, the data collected at Mr. Preston’s farm included only the months of
October through March. Generally, the winter months are windier than the summer
months and needed a full year’s worth of data to produce a valid OWC. To do so, we
first analyzed data collected in Staunton, Virginia as well as in Charlottesville, Virginia
to establish an annual trend.
0
2
4
6
8
10
12
Jan
March May Ju
lySep
tNov Ja
n
March May Ju
lySep
tNov
Charlottesville Staunton Keezletown
Figure 6.3.2. Shows a two-year trend for wind speed in both Charlottesville and Staunton, Virginia and the four months of data collected in Keezletown, Virginia.
Wind speeds usually vary sinusoidally throughout the year, with the peak typically in the
winter or spring and the trough in the summer or fall. By plotting an annual trend of
wind speeds, we were able to establish a peak month and a low month. From the graph
above, we chose April as the peak month and August as the low month.

76
Using this information we sinusoidally extrapolated the Keezletown data for a full year.
Monthly Wind Speed Averages
0
2
4
6
8
10
12
14
Jan
Feb
March
AprilMay
June
July
AugSep
tOct
NovDec
Win
d S
peed
(m/s
)
Charlottesville Staunton Keezletown 1 Keezletown 2
Figure 6.3.3. Predicted monthly averages for Keezletown and measured averages for Charlottesville and Staunton.
To account for possible error in the extrapolation we created two raw data sets. The
annual trends for the extrapolated data sets are the red and light blue lines in Figure 6.3.3.
The data set associated with the red line attempts to mirror the trend seen in
Charlottesville and Staunton by sinusoidally distributing unknown points between April
and August and then between August and October. The data set associated with the blue
line takes a more conservative approach. The peak in April is reduced and the low in
August is increased. The values in between these months are then adjusted accordingly.
For both data sets, the months of that were already known, October through March, were
not modified during the extrapolation process.
We determined the direction distribution over the full year by creating wind roses of both
the Staunton and Charlottesville data. The wind roses indicated that wind direction at the
two locations does not vary seasonally. As a result, we used the same wind direction
measured during the four months of Keezletown data to produce a wind rose.

77
After creating a full year’s wind data, we used the WAsP’s OWC Wizard to convert the
raw file into a working OWC file. The OWC for the Mr. Preston’s farm is shown below.
Figure 6.3.4. Observed wind climate in Keezletown, Virginia.
The graphic on the left of Figure 6.3.4 shows a wind rose derived from the Keezletown
data. A wind rose indicates the percent of the time that the wind is blowing from a
particular direction. In this case, the predominant winds are from the southwest. A wind
rose is important because it helps you to site a wind turbine with as few upwind obstacles
as possible and as smooth a terrain as possible in that direction.
The graph on the right in Figure 6.3.4 shows the frequency of wind speeds. A wind
speed distribution aids in calculating the wind density and ultimately the energy output of
a turbine. In addition, the wind resource distribution helps to optimally match a turbine
with a resource. In this case, the wind blows at a velocity between 4 and 5 meters per
second 15% of the time and between 5 and 6 meters per second 14.4% of the time.
6.4 Resource grid

78
A resource grid is a rectangular set of points for which summary predicted wind climate
data are calculated. The points are separated into evenly spaced grids allowing you to see
a pattern of wind climate or wind resources for a given area. A wind resource grid is
important when siting numerous turbines across a wide area. Since our study was limited
to a single turbine location, a resource grid was not utilized. A view of the resource grid
for the Harrisonburg quadrangle is shown in Figure 6.4.1.
Figure 6.4.1. Resource grid of wind speed in Harrisonburg quadrangle. Low wind speed areas are shown
in light blue and higher wind speed areas are shown in dark blue.
6.5 Turbine site
Turbine sites are used to calculate a predicted wind climate for a specific location. Like
with a meteorological site, turbine sites contain no data; only its UTM coordinates within
the map and a list of its children. A turbine site calculates a predicted wind climate by
taking the wind atlas and applying it to a specific location, making adjustments for the
topography of the area. The site itself has an x and a y location in the map (UTM
coordinates and two z locations: the elevation of the site and the height above the ground
level for which the prediction is generated - WAsP Help Facility 7.0).

79
In order to calculate a predicted wind climate for a given turbine location, it is necessary
to specify an associated wind atlas and map in which the turbine site is located. WAsP
can also incorporate a power curve, describing turbine generating characteristics, a list of
surrounding obstacles, a local surface roughness description, or a set of user corrections
into its calculation of a predicted wind climate. In the absence of a power curve, WAsP
predicts a wind speed and a power density of the location. When a power curve is
included, WAsP additionally calculates an annual energy output.
When studying the feasibility of a wind farm, it is important to compare the power curves
of several different models of turbines to find the ideal turbine for a given area. For our
project, we were not interested in comparing turbines. Instead, we were interested in
proving that there is a wind resource available on the JMU campus that warrants further
study. As a result, we used only the power curve that applies to the Bergey Excel, rated
at 10-kW for our model. The power curve was obtained from Bergey Windpower in a
tabular format that shows the expected power output (kW) versus the wind speed (m/s).
Figure 6.5.1. Power curve of Bergey ExcelS wind turbine.
The power curve and a list of obstacles near the turbine location were applied to create a
predicted wind climate for the turbine site at JMU. A summary of the predicted wind
climate is shown in Figure 6.5.2.

80
Mean speed: 5.15 ms-1 Power density: 162.1 Wm-2 AEO: 11.480 MWh
Figure 6.5.2. Predicted wind climate window for turbine site.

81
Chapter 7: Impact of wind power on east campus
7.1 Technical issues
There are a number of technical issues that must be addressed in regard to wind turbines.
Such issues range from regulations that apply to the construction of any structure to
issues of how electricity generated will be transmitted. Here, we will present an
overview of the considerations we have encountered and that will be faced in future
attempts to install a turbine.
7.1.1 Regulations: federal, state, and university
In most cases, various regulations apply to the erection of any large structure, most
notably zoning codes and height restrictions. For our 30-meter meteorological tower, we
had to assure compliance with all applicable federal, state, and James Madison University
regulations before proceeding with the process. We must also consider such regulations
if the university proceeds with the addition of a wind turbine. Since small-scale turbine
use is relatively new, there are not many regulations in existence that are specific to wind
turbines, and the main concerns are height and aesthetics.
First, it is necessary to understand the restrictions on the location of a tower, whether
equipped with a turbine or not. According to Mr. Mike Bergey, President and CEO of
Bergey Windpower Co., there are no regulations that apply to small-scale wind turbines
concerning proximity to roads, parking lots, or other such structures. Small-scale wind
turbines are very stable and safe, so these issues are not problems in siting.
There are not many relevant federal regulations involved with the construction of a single
small-scale turbine. However, Federal Aviation Administration (FAA) regulations
deserve careful consideration with the erection of any tower. Tall structures may be in
the flight paths of different aeronautical vehicles, and their visibility to the pilot is the key
issue. Aviation safety considerations played a primary part in our decision to equip our

82
tower with a lighting device. According to Part 20 of the Aeronautical Information
Manual, Official Guide to Basic Flight Information and ATC Procedures, AOPA Air
Safety Foundation:
“Any temporary or permanent object, including all appurtenances, that exceeds an overall height of 200 feet (61 m) above ground level (AGL) or exceeds any obstruction standard contained in FAR Part 77, Subpart C, should normally be marked and/or lighted.”
The 30-meter turbine is not subject to these conditions; however, the FAA may
recommend marking and/or lighting that does not exceed 200 feet “because of its
particular location.” Under a strict interpretation of these guidelines, it does not appear
that the FAA requires a marking and/or lighting device for the 30-meter tower.
Although an aeronautical light beacon may not be required for the tower, there were other
conditions that made our decision to equip the tower with lights logical. Mr. Alan
MacNutt, JMU Director of Public Safety, recommended a lighting device based on the
following considerations:
1. The east campus is in the descending approach/descending departure path for the medevac helicopters utilizing the Rockingham Memorial Hospital helipad.
2. The Virginia State Police (VSP) routinely conducts speed enforcement
flights up and down Interstate 81 and, in some cases, may fly below minimums.
3. The U.S. Army and VSP aviation division aircraft occasionally
arrive/depart the JMU campus transporting dignitaries and JMU ROTC cadets, and the tower may be in their arrival/departure path.
4. Private individuals occasionally use the JMU campus as a landing zone.
All of these circumstances support the conclusion that there is moderate air traffic over
the JMU campus. Since the east campus of James Madison University is the highest part
of the campus terrain, a safety standard would dictate that the tower be marked and/or

83
lighted. For these reasons, we concluded that a beacon would be desirable for the tower’s
particular location
The given criteria led us to select the LED2x series of obstruction light from Honeywell
Airport Systems. This model qualifies as FAA type L-810 Low Intensity Steady Burning
Light and can be operated as a steady burn or flashing light (Honeywell, 2000). This
lighting device upholds the standards of the International Civil Aviation Organization and
the Federal Communications Commission as well as those of the FAA. The LED2x
Series is weather/corrosion resistant, lasts up to five times longer than incandescent,
utilizes 90 percent less power than an equivalent incandescent, and comes with a five-
year warranty.
We did not run into any state regulations that apply to the tower, and we have not
discovered any regulations or restrictions that will apply specifically to the addition of a
small-scale wind turbine on campus. Counties and cities often have their own guidelines
for such structures. Height restrictions for Rockingham County would have required
formal approval for construction at another location. However, being on a university
campus, these guidelines did not serve as major obstacles in the permitting for the
construction of the tower, nor should they affect the addition of a turbine.
The primary impediment from the university perspective was the appearance of the
tower. When proceeding with the addition of a turbine, this will likely also be the major
issue. Again, there were no specific restrictions on how close the tower could be placed
to vehicular and pedestrian traffic. There are no further restrictions of this nature that
would hinder the addition of a wind turbine. James Madison University administration is
very concerned with the aesthetics of the campus, and compromise in regard to location
and type of tower was needed to satisfy their stipulations. We were not involved in any
permitting processes, as the university handled all of these additional requirements. All
that our group had to do was obtain permission from the university.

84
7.1.2 Grid connection
One of the main issues associated with system design is connection to the utility power
grid from the turbine tower. This is important with respect to both the performance and
the construction costs associated with the system. Regardless of installation costs, it is
worth mentioning that this turbine will at least partially pay for itself through net
metering. In reference to the actual connection site, the Festival was determined to be
our closest opportunity according to Mr. David Mars of JMU Facilities Management.
Since much of the distance between the tower and the connection is covered by asphalt,
Mr. Mars indicated that the project would be “extremely expensive” and that burying the
cable would cost “many thousands of dollars.” These comments may basically deem
connection at the Festival economically unfeasible. There are currently other methods of
connection under investigation. One alternative plan recommended by Mr. Mars is to use
the power to charge batteries in an off-grid system that could power a digital display
mounted on the tower that would serve to promote wind power. This would most
certainly reduce any installation costs considerably.
Bergey does provide nominal installation costs associated with the wiring of a 10-kW
system. Table 7.1.1 shows these fees.
Table 7.1.1. Bergey’s estimated costs of wiring and installing Excel 10-kW system. Item Cost
Energy Meter $250
Four-Gauge Wire (250ft) $203
Wire Conduit (250ft) $125
Trencher (4hrs) $300
Misc. materials $375
Wiring labor (5hrs) $250
Electrician (4hrs) $400
Total $1,903

85
The losses incurred from wiring that connects the turbine to the inverter are usually
below 5 percent, and are often below 2 percent depending on the length of the wire.
7.1.3 Maintenance
Regular inspection of the wind turbine is not required, but is certainly recommended.
The Bergey machines are claimed to “not require any regular maintenance” (Bergey,
2002). That statement, however, may be biased to help increase sales. On the other
hand, Mr. Mick Sagrillo of Michigan Wind and Sun (1993) reminds customers that they
should complete at least one tower-top inspection each year. Mr. Sagrillo states that two
inspections would be the ideal plan with one occurring at the start of winter and one at
the start of the thunderstorm season. The problems that should be considered during
these preventive maintenance checkups include loose bolts, cracked welds, fluid leaks,
and blades covered with bugs. It is also important not to ignore any strange sounds that
may be produced by a damaged system. Turbine generation output should be monitored
as well for any suspicious drops in production that could indicate a problem.
7.2 Environmental impact
One of the major advantages to wind power technology is that it has essentially no
harmful emissions; however, there are environmental concerns that relate to wind
turbines. Some of these problems relate more to large-scale turbines or are more
apparent in particular regions. We have examined these issues in relation to the tower’s
specific location at JMU and with the given size of the turbine. Further research into
these issues is warranted, although it does not appear that these concerns will be realized
with the placement of a single 10-kW turbine on the east campus.

86
7.2.1 Avian mortality
We do not believe that avian mortality will be a problem with the installation of a single,
30-meter wind turbine on the JMU campus; however, turbine-related bird death/injury is
a critical issue that must not be overlooked. Most of the studies completed on avian
collisions and electrocution relate to large-scale wind plants, which consist of many
turbines located together. It is at these wind farms where death potentially becomes a
serious issue.
All tall structures are targets for bird collisions, but the blade movement on a turbine is
unique. This movement further increases the potential of collision by birds in flight
(NWCC, 1998). The problem first became prominent in the 1980s when it was
discovered that transmission lines and wind turbines were killing federally protected
Golden Eagles and Red-tailed Hawks in California (NWCC, 1997). It did not take long
for environmental activists to take note and protest the Altamont Pass wind project.
Similar occurrences in Spain and northern Europe sparked controversy among
conservationist groups in the U.S. and Europe. Their concerns reflect their care for
individual birds and the negative effects on local populations, particularly of sensitive
species.
Further studies on avian mortality are necessary to determine how important certain
factors may be in turbine-related casualties. Thus far, location and species type appear to
be significant variables involved with avian deaths. Raptors are by far the leading bird
species killed in wind turbine collisions for a variety of reasons. Wind energy
development in California’s Altamont Pass, a high-raptor activity area, has caused a
notable number of bird losses. However, studies in wind sites with low raptor activity in
California reveal few to no avian casualties (AWEA, 2001).
Various studies to date have discovered that wind turbine-related deaths involve both
migratory and resident birds (NWCC, 1998). Migratory birds generally fly at an
elevation well above the blade level in most places, so deaths during migratory flight

87
should be rare (NWCC, 1998). In addition, investigations have shown that birds will
alter their flight pattern to avoid wind turbines when the structure is visible (NWCC,
1998). Again, it is important to emphasize that research to this point has been very
preliminary, since we have only recently shed light on the problem. In addition, wind
plants across the U.S. are still relatively sparse, so it is difficult to develop a
comprehensive study.
The National Wind Coordinating Committee has reviewed various reports estimating
from 10,000 to 40,000 wind turbine-related bird deaths per year (NWCC, 2001). Table
7.2.1 displays estimates of annual avian collision deaths in the U.S. from a variety of
structures.
Table 7.2.1 Avian Collision Mortality in the United States (NWCC, 2002). Source Annual Deaths
Vehicles 60 million – 80 million
Buildings and Windows 98 million – 980 million
Powerlines Tens of thousands – 174 million
Communication Towers 4 million – 50 million
Wind Generation Facilities 10,000 – 40,000
Even with the wide range in these estimates, it is clear that wind generation facilities
make up a relatively small number of collision deaths. It is also believed that all of these
estimates are biased high, since these studies were mostly conducted as a result of a
perceived risk (NWCC, 2001). Current calculations convey that wind turbine collisions
represent approximately 0.01 percent to 0.02 percent of annual avian collision deaths in
the U.S. (NWCC, 2001). These estimates convert into an average of 2.19 avian fatalities
per turbine in the United States, with an average of 1.83 yearly fatalities per turbine when
excluding California (NWCC, 2001).
It is important to understand that these numbers are relatively low, primarily because
these other structures greatly outnumber wind turbine facilities. The wind industry is still
growing and is in a development period. As infrastructure expands throughout the

88
nation, the avian mortality problem has the potential to become more serious. It does not
appear that there have been any notable disturbances of individual populations and, in
comparison with other structures, wind turbines seem to provide a relatively minor cause
of avian mortality (NWCC, 2001).
In Virginia, the fall migration period is the prime time for raptor watching. Thousands of
hawks move southward through the Blue Ridge and Appalachian Mountains between
August and December (Kirkpatrick 1997, p. 193). The beginning of the migration season
finds the Osprey, American Kestrel, Bald Eagle, and Broad-winged Hawk traveling
through Virginia’s mountains, with major flights underway by the second week of
September. October is the peak month for Sharp-shinned and Cooper’s Hawks, as well
as Merlins and Peregrine Falcons in much smaller numbers. Dozens and even hundreds
of sightings of these hawks can be expected on a daily basis from mountain lookout sites
(Kirkpatrick 1997, p. 193). The peak of the fall migration begins to close in November,
with the flights of Red-tailed and Red shouldered Hawks, Northern Goshawks, Rough-
legged Hawks, and Golden Eagles through the mountainous regions.
Sightings of many of these raptors are very rare and limited to a few weeks during the fall
migration period, since Virginia’s mountainous region does not experience as much in
the way of spring migration. Of the species mentioned, the Red-tailed Hawk is
considered the most common hawk in Rockingham County by most birders, as it is a
permanent resident of the area (Rockingham Bird Club 1998, p. 48). The American
Kestrel may be the county’s most common raptor and is easily found throughout the
county in all seasons. In addition, the Barred Owl, Great Horned Owl, and Turkey
Vulture are all raptors that are common in the area. While the Barred Owl resides more
commonly in the mountains near streams, rivers, and other water, the Great Horned Owl
can be found within the Harrisonburg city limits (Rockingham Bird Club 1998, p. 63).
It is also worth mentioning that of all the raptor species in the area, only the Bald Eagle is
on the U.S. Fish & Wildlife Service threatened and endangered species list (USFWS
2001). Its status is currently listed as threatened, and in July of 1999 there was actually a

89
proposal for the species to be de-listed (USFWS 2001). The Bald Eagle is still rare in
Rockingham County, so the tower site on the JMU campus would infrequently
experience Bald Eagle flights.
Many of the migrant raptors are seen better from mountain lookout sites, as they fly at
high altitudes. Although James Madison’s east campus is higher than its immediate
surroundings, it is still located in a valley. There are few trees or other perching sites for
these birds around the tower, so they will probably not visit the site very often. In
addition, the tower is only 30 meters high, much smaller than large-scale turbines where
most of bird deaths have been observed. Raptors glide long distances high in the sky, so
we do not believe that the tower would be a factor for them often. The potential for
resident raptors to be affected by the turbine is present, but the lack of trees directly
surrounding the tower location makes it an unlikely site for raptors to nest.
In our estimation, the installation of a turbine on the east campus will not have any major
effects on migratory birds or on local bird populations. It is important to understand that
we would only be erecting a single, 10-kW turbine. With the lattice tower already in
place, the addition of a turbine would not alter the situation significantly. We do not
consider the 2.19 annual fatalities per turbine to be a significant number, since we expect
this figure to be even lower at our particular location due to migration patterns and the
distribution of local species. Most studies undertaken on this issue apply to large-scale
wind farms, so we do not believe the avian impact will be as severe in this case. Unless
further research proves otherwise, the concern for avian mortality should not be an
obstacle for wind power at JMU.
7.2.2 Noise issues
The issue of noise being a negative side effect of small turbines is more a myth than a
viable concern. The only noise produced by a Bergey Excel 10-kW turbine is known as
aerodynamic noise. These are sounds associated with the blades moving through the air

90
(Sagrillo, 1997). This noise increases as the blade velocity increases, so windier days
will result in a greater amount of noise pollution.
In order to properly understand how noisy a turbine is, one must understand the way
sound is measured. Noise is measured on a logarithmic scale with decibels (dB) as the
units. A source of noise is twice as powerful when it is three decibels higher than another
source. Also, most humans cannot detect the difference between two sounds unless there
is a 3-dB disparity between them.
A Bergey sound study shows that the noise generated by a Bergey Excel 10-kW turbine
is 54-55 dB at 300 feet from the hub in 25-mph winds and 53 dB at 500 feet. In
comparison, a car driving on the road generates 60 dB at a distance of 300 feet. A
highway creates 70 dB when measured 100 feet away. The sound level measured in 25-
mph winds is significantly higher than what would typically be experienced on the
CISAT campus, as is shown by the data collected in the area. Considering the location of
the proposed system, the 10-kW turbine will be almost unnoticeable. The commuter
parking lot beside which the tower resides is not only subject to noise from the large
volume of cars passing through campus, but also to noise produced by Interstate 81 that is
only a few hundred feet down the hill. More importantly, the tower is not so close to any
dormitory or academic building that it would be heard from indoors. This is an important
consideration for people trying to sleep at night, since the swishing sound of the blades
could possibly be annoying.
7.2.3 Wind Turbine Testing and Safety
Small wind turbines are now a proven technology, with over 150,000 installed across the
globe (AWEA 2002). As demand for wind turbines has increased over the years,

91
manufacturers have developed better designs, standards, and features for turbines.
Manufacturers have learned from past mistakes and have adjusted their products
accordingly. Turbines are designed very carefully and undergo rigorous testing before
being approved for sale. They are both more efficient and safer than previous designs.
Although there have been past instances of turbine failure, turbines are being built
stronger than ever to ensure maximum safety. Turbines manufactured by Bergey
Windpower have additional structural features that provide for further safety.
The American Wind Energy Association has worked with the American Society of
Mechanical Engineers (ASME), the American Society for Testing of Materials (ASTM),
the American National Standards Institute (ANSI), the National Fire Protection
Association (NFPA), the American Gear Manufacturer's Association (AGMA), and the
Institute of Electrical and Electronics Engineers (IEEE) in wind turbine standards
development (AWEA 2002). Standards subcommittees have also worked to make U.S.
standards compatible with IEC standards, so U.S. turbines can be sold in foreign markets.
Large wind turbines possess several safety devices, including vibration sensors,
overspeed protection systems, aerodynamic braking systems, and backup mechanical
braking systems, that assure safe operation of the system.
However, small systems have different inherent risk factors than larger systems, so safety
standards for wind turbines with swept areas less than 40 square meters have been
developed separately (AWEA 2002). Small systems are designed with unique control
methods and features. Imposing uniform standards to all turbines would likely result in
costly requirements that would not necessarily improve safety for smaller turbines
(AWEA 2002).
An accredited test laboratory, such as the NWTC, completes type testing on wind
turbines such as safety and function tests, dynamic behavior tests, duration tests for small
wind turbines, load measurements, blade tests, and other component tests (NWTC 1998).

92
For small wind systems the dynamic behavior test consists of observation of the system at
wind velocities of at least 10, 15, and 20 m/s (NWTC 1998). The purpose of this test is
to confirm that system natural frequencies do not interfere with operational frequencies.
According to IEC 61400-2, a duration test for small wind turbines may substitute for the
safety and function tests and the load measurements. This single test serves for small
turbines because only a few simplified calculations are required for design approval for
such systems. The duration test verifies functionality, structural integrity and material
degradation (deformations, cracks, corrosion), and quality of environmental coatings.
The turbine is subjected to a minimum number of hours of normal operation (250 h at
average wind speeds 10 m/s and 25 h at average wind speeds 15 m/s, where the turbine
should produce at least 5,000 h of energy production (NWTC 1998). In addition, new
shapes, sizes, and internal structure of blades as well as other components must be tested
in accordance with IEC code 61400-23.
The certification organization must then affirm that the turbine has fulfilled all essential
type tests carried out by NREL. Finally, a test report is issued describing the test
standards. For the NWTC, the test report includes (NWTC 1998):
� a description of the test turbine, including serial number, control system revision number and differences between it and the production turbine configuration
� a description of the test site � instrumentation � calibration procedures � test procedure � test conditions � data analysis procedure � uncertainty analysis � results
The testing of turbines is a very deliberate process. The tests are very comprehensive so
that maximum safety is ensured. As wind turbine technology has evolved, these
standards have been adjusted as well. Today the requirements placed on wind turbine

93
systems are thorough and turbines that comply with all of these standards should be
considered very safe.
There are a number of safety hazards associated with wind turbines, though many are
associated more with tall towers. The 30-m tower on JMU’s campus is not considered a
tall tower in comparison with other wind turbines. Tall towers are more prone to damage
from severe storms and lightning strikes, although there is protection built into the system
to prevent this. Turbines are designed to take this abuse from rugged conditions, and we
do not perceive that this will be a problem with a small wind turbine at the selected
location.
Towers have failed in the past, but these occurrences have been rare and far less frequent
than the falling of trees or utility poles (Gipe 1993, p. 270). With the continual
improvement on wind turbine technology, these incidences are becoming increasingly
rare. There are a large number of light towers and other tall structures, as well as a radio
tower already on the James Madison campus. The risk of a wind turbine next to a
parking lot would be comparable to these structures that are placed in moderate vehicular
and pedestrian traffic areas.
There may also be concern over the potential for the turbine to throw a blade from its
rotor. Once again, the components of a wind turbine are all rigorously tested, and this
scenario is highly unlikely. These incidences have happened in the past, but are
extremely rare. Fires have also broken out from wind turbines in the past, but this is
more of a concern for rural western locations during dry seasons. Bergey Windpower has
a proven track record, with approximately 700 Bergey Excel-S turbines installed. Since
its establishment in 1977, BWC has continued to work toward increased efficiency and
safety, altering turbine designs to ensure the best product possible.
Other less obvious safety hazards are sometimes associated with wind turbines. A strobe
effect may be caused when turbine blades chop the sunlight into a blinking light that may
cause dizziness, headaches, disorientation, and trigger seizures and migraines. However,

94
one turbine will not have as great an effect as an entire wind farm will, and no one on the
east campus would be subjected to this effect for any extended period of time. It may be
noticed from time to time, but would not likely have any consequences.
Some people have also had concerns that wind turbines in some locations may have a
negative impact on traffic safety. The turbine would be most visible to drivers on James
Madison’s east campus and, to a lesser extent, on Interstate 81. After students and
parents have seen the structure once, there will be no reason for travelers to slow down or
pause significantly. As people become accustomed to its existence, they will not feel the
need to slow down as they pass by it. In addition, the speed limit in this area on campus
is 25 mph, so drivers will have good control over their vehicles. Interstate 81 travelers
will be moving around 60 mph, but the stretch where the turbine would be visible to
passersby is a straight path. More than likely, drivers already glance at JMU’s features as
they drive by the campus in the absence of the tower. The wind turbine should not cause
any additional traffic disturbances in its location.
Bergey Windpower Co. strives to ensure its small wind systems are of the highest quality
for 30 years of operation. Currently, the oldest Bergey turbines have been in operation
for 19 years. With thousands of grid-connected systems installed since 1980, Bergey has
established itself as a reliable turbine manufacturer (Bergey, 2002). It is important for
turbines to have some form of overspeed protection in case a component malfunctions.
For example, if the generator disconnects from the grid or overheats, its braking function
will fail and the rotor will accelerate rapidly (Krohn, 2000). Some small systems may be
at risk if the electrical connection is lost. Unlike many other small wind turbines, Bergey
turbines operate safely from no load at all up to their maximum design wind speeds (120
mph) (Bergey 2002). Bergey systems have a passive overspeed protection system by
furling.
Bergey turbines are constructed with heavyweight material to help their reliability and
longevity. Bergey notes that evidence dating back to the 1920s shows that light-weight
turbines do not stand the test of time, while heavy-duty Jacobs turbines from the 1930s

95
can still be found functioning today (Bergey, 2002). Bergey also uses high-strength
blades, as they are the most worked part of the turbine. It developed fiberglass blades
that are twice the strength of steel, with a tensile strength greater than 100,000 psi
(Bergey, 2002). In addition, their turbines do not employ a mechanical brake, but shut
down with electrical braking when necessary.
There have been a number of instances where Bergey turbines have withstood severe
storms and even tornadoes, while buildings a few hundred meters away were completely
destroyed. Bergey Windpower notes that its corporate location in the heartland of
“Tornado Alley” (Norman, OK) has helped it develop more rugged products. They have
over 150 turbines in this area, which are all subjected to some of the worst weather
conditions imaginable (Bergey, 2002). Since turbines are designed for such strong
winds, turbine safety should certainly not be an issue with the installation of a Bergey
turbine on the JMU campus.
7.2.4 Emission reduction impact
The most attractive characteristic of wind power is that it creates no pollution. Other
generation techniques involve emission of particulates, greenhouse gases, nitrogen oxides
(NOx) and sulfur oxides (SOx). Nuclear reactors create thermal pollution of water bodies
and nuclear waste that must be stored somewhere safe. If the United States ever decides
to implement the Kyoto Protocol reduction in greenhouse gas emissions, wind farms may
be a vital source of power that could replace coal combustion. As part of the ISAT
curriculum, environment students learn about pollution control technologies and the
impact pollution has on the environment. A wind turbine on campus would serve as a
symbol to those on the interstate that JMU is environmentally conscience. The turbine
would perfectly complement the photovoltaic panels being installed on the hill in front of
the ISAT/CS building. Environment students could study the emission reduction based
on the amount of power produced by the turbine when compared to traditional generation
sources. For a 30-year life cycle of a Bergey Excel, the power produced is expected to
displace 1.2 tons of pollutants and 250 tons of greenhouse gases (Bergey.com).

96
7.2.5 Other considerations
Thus far, we have covered most of the common concerns that arise in regard to wind
turbines. There are a few other considerations that are still worth addressing. People
sometimes worry that a new wind turbine will interfere with their radio and/or television
reception. However, turbines today, including the Bergey Excel-S, use materials other
than metal for blades, including wood, plastic, and fiberglass. Only a few of the 25,000
wind turbines installed in the U.S. and Europe have had any effect on communications,
and reception was weak anyways in these cases (Gipe 1993). In fact, many small-scale
wind turbines double as communications towers. Interference of these signals would not
be a problem for a wind turbine on the James Madison campus.
Most people are still very unfamiliar with wind turbines and their characteristics. People
in any community may fear the change that a wind turbine would bring. Paul Gipe points
out that wind machines are as uncommon today as utility lines were 100 years ago, but
now people have grown to accept transmission lines as part of the everyday landscape
(Gipe 1993). A single small-scale wind turbine on campus would not bring about any
major changes for JMU or the Harrisonburg community. All aspects of a wind turbine,
whether it be noise, appearance, or other concerns, would blend into the JMU atmosphere
in time.
7.3 Public perception
Public perception of wind turbines is one barrier that has successfully slowed or blocked
wind farm development in the past. A fairly significant number of people object to wind
projects in their area, but, eventually, many find their worries were exaggerated. The vast
majority of people who originally object discover that even large-scale wind turbines do
not ruin the surrounding landscape. With a 30-meter tower in place already, we do not
believe that the general public will find the addition of a turbine objectionable on a visual
basis.

97
7.3.1 General public and JMU administration concerns
As previously mentioned, one of the JMU administration’s major concerns in regard to
the placement of the tower was its visual impact. They worried that the tall structure may
be detrimental to the James Madison’s scenic campus. Wind turbines are very visible
structures and will affect a landscape’s appearance in some way. Certainly students and
faculty alike should also be concerned with any structure that may be detrimental to the
campus’s beautiful environment. However, we believe that based on the tower’s
location, other structures in the area, and past studies on visual impact, the tower and
turbine will not have strong negative affects on campus aesthetics.
The setting of wind turbines is one factor that determines whether they generate
complaints about visual impact (NWCC, 1997). Our tower’s location is a compromise
between all parties involved in the siting decision. In addition, JMU helped pay for the
tower so that we could afford a freestanding, lattice tower, which will not be as
objectionable as a tower with guy wires. The campus administration approved the
current location because it felt that it would not present a strong negative impact with
respect to campus aesthetics.
The tower is adjacent to a large parking lot, so the surrounding land has already been
developed. There are smaller parking light towers in the area and other taller structures
in the extended region. JMU has a radio tower on its campus as well as tall lighting
devices for various athletic facilities. The lights on the soccer and lacrosse fields just to
the south of the MET tower stand tall enough that the FAA required a lighting beacon be
placed on top of the towers. People have come to accept these structures as part of the
surroundings. Given a brief adjustment period, a turbine will not stand apart from its
encompassing area, especially since the tower will have been in place for at least two
years. We expect that there will be few vehement complaints in regard to its visual
impact.

98
In addition, due to the tower’s current location, a turbine would not be very visible from
the west campus of JMU. It would be perceptible only to JMU visitors when travelling to
the east campus, where much of the land is already developed or being planned for
development. The ISAT/CS and HHS buildings would still effectively catch the eyes of
most people. The turbine would also be visible to travelers of Interstate 81 and to people
in the north of its location, since the land slopes downward in that direction. However,
all of the JMU campus that these people see from this distance is its development. They
do not enjoy a view of green grass and flowers that JMU students, faculty, and visitors
witness. Therefore, a turbine should not affect these people as it would those closer to
the structure. We believe that a turbine’s visibility would actually generate more interest
and excitement for such observers than it would complaints.
Past studies on wind turbine aesthetics have shown that they do not create the negative
visual impact that some expect. For example, the Scottish Executive conducted a survey
of residents within 20 kilometers of four different large wind farms in Scotland to gain a
better understanding of public acceptance of wind farms. Results show that 29 percent of
the respondents within 5 km of the farm were worried that the landscape would be
spoiled; however, after construction of the wind farm, 6 percent of respondents indicated
that this actually was a problem (Dudleston 2000, pp. 14-15). Of the people that
perceived aesthetics to be a problem, only a small percent realized these worries.
It is also important to understand that this turbine would be placed on the existing MET
tower, so the aesthetics would not change much. We were only interested in erecting a
single, 30-m tower, where most of the perceived problems come from more numerous
and taller towers being placed in rural areas. If students made an attempt to educate the
JMU and Harrisonburg communities on the turbine’s purpose before constructing it, we
would expect to hear even fewer objections. Providing residents with the understanding
that the turbine is producing clean energy and educating students will lead to a more
positive overall perception of the turbine.

99
7.3.2 Photomontages of turbine on JMU campus
One of our goals was to create a photomontage to provide interested parties with a visual
image of what a small-scale wind turbine would look like on the JMU campus.
Originally, we took pictures with a digital camera from a variety locations on and around
campus where the turbine would be visible. We used Adobe Photoshop to place a turbine
image into the picture of the site. Due to the great distances between the picture location
and the tower site, the turbine image appeared very small in the photomontages. After
taking several more pictures, we created two more photomontages and settled on two to
present.
We first took several pictures of the tower site from a variety of locations on the east
campus and on Interstate 81. At each location we recorded the global coordinates and
elevation for scaling purposes. We used the latitude and longitude values and adjusted
for elevation differences of each picture location to determine its distance from the tower
site. We also took three pictures of the back of the HHS building from three different
distances to provide a scaling reference. By using the ruler in Adobe Photoshop, we
measured the height of the corner of the HHS building in the picture. We calculated the
distances from each picture location to the building using the same methods as before.
We plotted these three distances versus the heights of the building on the computer screen
in Microsoft Excel. This allowed us to fit a function yielding what the height on the
computer screen should be for our photomontages.

100
Figure 7.3.1 shows this function for the first set of photomontages.
Figure 7.3.1. Logarithmic trendline and equation for scaling.
The images of the turbines in the photomontages are of small-scale Bergey wind turbines
currently in operation. We created the photomontages so that the rotors of the turbine are
in the direction of the prevailing wind on the east campus. Of course, the alignment of
the rotor will vary due to the direction of the wind on any given day, but the images
provide a good representation of what a 30-m turbine would look like at the MET tower
site.
Logarithmic relationship between distance and height in photomontage
y = -477.27Ln(x) + 717.67R2 = 0.9465
0
500
1000
0 1 2 3
Height in picture (in)
Dis
tanc
e fr
om H
HS
bu
ildin
g (f
t)

101
Figure 7.3.2 shows the first photomontage created, which displays a view of a turbine
from a location along Interstate 81 south (approximately 758 feet away from the turbine).
Figure 7.3.2. Turbine appearance while traveling south on Interstate 81.
The turbine is almost unperceivable from this vantage point when considering the
surrounding trees and light towers. Thus, it should certainly not have a negative impact
from the viewpoint of interstate travelers.

102
The second photomontage location is from a viewpoint on the left side of Carrier Dr.
when entering campus from University Blvd. This location is along the left curve on
Carrier Dr. and is approximately 377 feet away from the turbine site. Figure 7.3.3
displays this vantage point.
Figure 7.3.3. View of the Begey Excel from Carrier Drive just past the JMU College Center.
The turbine does appear to be a sizable structure in this image, but this is a very close
view. If you observe the tower site from the exit of the HHS building, it is barely visible.
A 30-m wind turbine will stand out from some locations on the east campus, but it should
not be a major eyesore, especially after a period of adjustment.

103
Chapter 8: East campus economic analysis
The most important economic consideration when analyzing a renewable energy system
is whether or not it will pay for itself. In other words, will the money saved on electricity
bills offset the money spent on a wind turbine? Large wind farms intended to provide
bulk electricity should pay for themselves in a relatively short period of time, but a small
to medium-sized turbine need not pay for itself immediately. In fact, it may not pay for
itself in 10 years. As long as it pays for itself over the expected lifetime of the machine,
then a small wind turbine is a cost-effective investment.
It is not unusual for a consumer to make a large purchase that does not have any return on
the investment. However, unlike a swimming pool or family set of jet-skis, a wind
turbine can save or even earn money in the form of electricity savings. When a turbine is
installed on a university campus, it also provides many educational benefits as described
earlier.
Before performing any economic analysis of our wind energy system, we determined all
of the costs associated with the wind system over its 30-year lifetime. These include
purchase and installation, maintenance, and repair costs. In addition, a life cycle cost
analysis of a wind system must account for the costs associated with sales tax, shipping,
permits, foundation and anchoring, wire run, turbine erection, tower erection, electrical
hook-up, inspection fees.

104
An estimate of these miscellaneous costs is shown in Table 9.1 along with the traditional
costs.
Table 9.1. Life cycle costs of 10-kW Bergey EXCEL-S.
Life Cycle Costs Cost
EXCEL-S wind turbine and inverter $20,900.00
Shipping and delivery $ 1,000.00
Wire run $ 5,000.00
Electrical contractor/hook-up $ 1,000.00
Turbine erection (incl. crane) $ 950.00
Misc. costs and inspection fees $ 500.00
TOTAL $29,350.00
Sales tax (4.5%) $ 1,320.75
TOTAL WITH TAX $30,670.75
* Maintenance costs are not included in this table as they are calculated on a per kilowatt-hour basis.
Once the total life cycle cost and the annual energy output predicted by WAsP are
known, we can calculate the simple and discounted payback of the wind system. The
electricity rate used in our calculations is the premium price that JMU pays for electricity
5.4¢/kWh). This is a flat rate, so we assumed this to be constant over the lifetime of the
turbine. The annual savings are calculated at the end of each year. Maintenance costs are
estimated to be $0.005 per kilowatt-hour for the Excel-S (Bergey, 2002). We set the
electricity escalation rate, the discount rate, and the maintenance cost inflation rate at 2
percent, 10 percent, and 4 percent respectively (Refer to appendix for a full list of
assumptions). Table 9.2 displays the results of our payback period calculations.
Table 9.2. Simple and discounted payback for the Bergey Excel-S at the JMU turbine site. Payback Periods
Life Cycle Cost $30,670.75
Annual Energy Output (MWh) 11.870
Electricity Rate ($/kWh) $0.054
Annual Savings $563.56
Simple Payback 54.4
Discounted Payback n/a

105
In the simple payback analysis, our wind turbine pays for itself in 54.4 years, which is
beyond the expected lifetime of the machine. There are three primary reasons for the
long payback period: (1) JMU pays a discounted rate for electricity, (2) there is a high
upfront investment cost, and (3) the predicted value we assumed for the annual energy
output is low. The ‘n/a’ listed for the discounted payback recognizes that the wind
system will never pay for itself given the stated assumptions.
Ideally, a small wind turbine would pay for itself in less than 10 years, since it can earn
money from that point forward. At JMU, however, the rate for electricity has to increase,
the investment cost has to go down, or the AEO must increase in order for the turbine to
pay for itself in ten years, let alone over the expected lifetime.
We next calculated the net benefits of the system. In order to do this we subtracted the
total cost of the wind system from the discounted lifetime electricity savings. Table 9.3
shows the net benefits of the system.
Table 9.3. Net benefits of Bergey Excel system at JMU site. Annual Energy Output Total Cost Discounted Lifetime Savings Benefits - Costs
11.870 MWh $30,670.75 $7,639.06 ($23,031.69)
Again, in an ideal situation, the benefits or electricity savings would exceed the total
costs. However, the original investment in our case is so great and the annual energy
output and electricity rates so low that the economic benefits do not outweigh the costs.
Consequently, we conducted a sensitivity analysis on these three factors to evaluate their
effects on the payback period. The first variable considered was the annual energy
output. Using an Excel spreadsheet, we determined what the annual energy output would
have to be to produce a discounted payback period of 10 years or 30 years while holding
all other variables constant. In order for the wind system to pay for itself in 10 or 30
years, the AEO would have to be 85,365 kWh or 51,465 kWh, respectively. For the
Bergey Excel to produce 85,365 kWh, the system would have to operate at near peak

106
capacity, thus requiring a constant wind speed of 14 m/s throughout the year. To produce
51,465 kWh, the system would have to operate at about 60% capacity requiring an
average wind speed of 11 m/s. Speeds of 14 and 11 m/s would be classified as Class 7
winds, which are extremely rare in the United States let alone Virginia.
The second variable examined was the electricity rate. In order for the system to pay
itself back in 10 years or 30 years, the electricity rate would have to be $0.35/kWh or
$0.22/kWh. Although JMU pays a premium rate for its electricity, these rates fall well
outside the normal residential rate, which can range between $0.05/kWh and $0.12/kWh
depending on the region of the country.
The third variable examined was the upfront investment. With all other variables held
constant, the upfront cost would have to be reduced to $4,265 or $7,050 for the system to
pay for itself in 10 or 30 years, respectively. These costs are about 75% to 85% less than
the projected life cycle cost of $30,670. Figure 9.4 a summary of the sensitivity analysis
results.
Table 9.4. Summary table of sensitivity analysis results. Variables 10 year payback 30 year payback
AEO 85,365 kWh 51,465 kWh
Electricity Rate $0.35 $0.218
Initial Investment $4,265 $7,050
Despite the pessimism of these figures, the payback period can significantly be improved
by increasing the annual energy output and decreasing the initial investment
simultaneously. The annual energy output derived from WAsP is a prediction.
Predictions are inherently inaccurate, so further study is needed at the turbine site itself to
validate the annual output prediction. In addition, the high initial investment may be
reduced through the acquisition of grants and/or tax credits. Increasing the electricity rate
would also reduce the payback period; however, significant changes in the price that
JMU pays for electricity are unlikely to occur in the coming years.

107
The following figure shows the effect that the AEO of the wind turbine and the initial
cost of the wind turbine have on the net benefits of the investment over the thirty-year
lifetime.
The Effect of Turbine Cost and Annual Energy Output on the Net Benefits
-$20,000.00
-$15,000.00
-$10,000.00
-$5,000.00
$0.00
$5,000.00
$10,000.00
$15,000.00
$5,000 $10,000 $15,000 $20,000 $25,000
Turbine Cost
12 MWh (Class 2) 15 MWh (Class 3) 19 MWh (Class 4) 22 MWh (Class 5)
Figure 9.1.1.. Shows the effect that the turbine cost and the annual energy output also given as wind classes have on the net benefits of the investment over a thirty year lifetime.
As discussed in Chapter 6, our WAsP analysis of the JMU east campus shows that the
Bergey Excel would have an AEO of close to 12 MWh per year, equivalent to a Class 2
wind resource. An AEO of 12 MWh per year corresponds to the blue line shown in
Figure 9.1.1. Looking at the blue line in the figure indicates that the turbine would have
to cost less than $10,000 in order to have a net positive benefit over the lifetime of the
machine. As shown in Table 9.1, the total turbine cost is closer to $30,000. As a result,
we would have to reduce our initial investment by almost $20,000 to have a net positive
benefit over the lifetime of the wind turbine assuming a Class 2 wind resource. If we
have a greater wind resource than what was predicted by the WAsP model, then we may
experience a net positive benefit even with a higher initial cost.

108
In addition to performing a sensitivity analysis on the AEO, electricity rate, and the initial
investment cost, we investigated the influence of the discount rate on the net benefits of
the system.
The results are shown in Figure 9.1.2.
Net Benefits vs. Discount Rate
($25,000.00)
($20,000.00)
($15,000.00)
($10,000.00)
($5,000.00)
$0.000 2 4 6 8 10 12
Discount Rate
Net
Ben
efits
($)
Figure 9.1.2. Net benefits of the Bergey Excel while varying the discount rate. * Parentheses indicate a negative number.
As one would expect, the interest rate selected does have an influence on the net benefits
of the wind system. When the interest rate is set to zero, the net loss is reduced to
$7,877. At a university, an aggressive discount rate such as 10% may not be as necessary
as in a residential or business setting. A discount rate closer to 5%, corresponding to the
current interest rate on a government bond, may be more appropriate. However, even
with a reduced discount rate of 5%, the calculated net loss of the wind system is still
$19,105.

109
When analyzing a wind system investment, it is important to consider what the
investment money could be earning in other financial assets. Table 9.4 shows our results
when we compared the electricity savings of investing in a wind machine to investment
in a Certificate of Deposit (CD) with a 10% annual interest rate over the 30-year lifetime.
Table 9.4. Future value of investment in a CD earning 10% annual interest. Capital
Investment Electricity Savings
Value of Alternative
Investment
$36,130.00 $6,846.37 $363,563.80
$38,880.00 $11,981.14 $391,236.10
$41,630.00 $21,394.90 $418,908.40
As the table indicates, the money saved by the turbine does not even compare to the
money earned in the CD. If the purpose of the investment is earning money, then the CD
is the indisputable choice.

110
Chapter 9: Conclusions and Recommendations
9.1 SBALP Conclusions and Recommendations
The SBALP has proven to be very successful. The number of people interested in wind
energy in the state, as shown by this program, has shocked most everybody involved in
the wind energy industry. Over 200 inquiries were made about the program and that
number keeps growing. Out of those 200 inquiries, we have received between 60 and 70
applications for the program. As shown by Chapter 4 we have installed six towers that
are currently taking data. Two more towers will be installed before May 2002.
As a result of the programs success, a proposal to expand the program has been submitted
to WPA. Under this grant, JMU would receive funding to purchase four 30-meter MET
towers. These towers would be placed at the most successful sites as based on the data
received by the 20-meter towers. The thought of purchasing two 50-meter towers has
also been entertained as well. These 50-meter towers are what developers use in large-
scale wind farm projects.
Some of the framework needs a little tweaking. The application should be revised to
include a Tax Map number for zoning issues. The contract needs to be looked at more
thoroughly and should be analyzed by a lawyer or the university to be sure of its validity
and needed scope. How next years group is going to handle batteries should be addressed
and we recommend that they make it obvious to the landowner from the start that they are
responsible for the batteries.
Now that the framework for the program has been laid, a more stringent application
process should be administered. A wind resource assessment that addresses issues of
view sheds, transmission lines, public acceptance, etc. of the entire state would benefit in
this. Also because the framework has been taken care of many of the issues faced by this

111
year’s group will not need to be addressed by next years group. A stronger outreach
should be made as well. Site research on areas with a known strong wind energy
resource should be made and landowners approached on an individual basis. Relying on
one press release is not enough and more needs to be done to reach out to the public.
Next year’s thesis group has the opportunity to take this program to the next level and we
expect that they will do this.
9.2 East campus conclusions and recommendations
We believe that potential for a small-scale turbine on James Madison’s east campus
exists. However, it is still too early to accurately predict the economic feasibility of a
turbine on the JMU campus. It is difficult to assess the wind resource on the east campus
given the limited data set that we have acquired thus far. In the next few years, students
should continue to analyze local data along with data received from the meteorological
tower on campus. Two years of data are necessary to make a more reliable estimate of
the wind resource that is present at the tower site. Once better data are received, students,
faculty, and the JMU administration will be better able to determine whether wind energy
is right for JMU.
From the limited data set that we have obtained so far, it is impossible to justify the
purchase and installation of a turbine on an economic basis alone. In other words, it
appears that JMU will probably not save enough in electricity costs to offset investment
costs and other costs associated with the system. The reduced electricity rate that JMU
receives makes it even less likely that the turbine will pay back. However, even when we
tested the system with a higher electricity price, the turbine did not pay for itself holding
other variables constant. For these reasons, we believe that the university should
consider the purchase of a turbine in the same way it does lab equipment. Such
investments that are crucial to the ISAT learning experience may never pay for
themselves in monetary units, but serve the university by helping it achieve its
educational goals.

112
We believe that a wind turbine would have a very positive impact on JMU. A turbine on
the James Madison campus would serve as a visible symbol for the university and would
aid in the recruitment of students and faculty, build a strong reputation for JMU and its
College of Integrated Science and Technology, and promote renewable energy on both
local and state levels. More importantly, the turbine would yield educational benefits for
students enrolled in a multitude of courses. The turbine would also provide students with
a unique hands-on learning experience.
Our research shows that the perceived problems with wind turbines should not pose
major obstacles to the erection of a wind turbine on campus. There are several issues
other than economic feasibility that students should study more comprehensively in the
future. It is important that we have a better understanding of the local public perception
associated with a wind turbine. One means of achieving this goal would be to conduct
surveys distributed to JMU students, faculty, administration, and Harrisonburg residents
designed to address their perception of all issues that may be perceived as problems. In
particular, these surveys should help determine what percentage of respondents objects to
a turbine’s visual impact.
Another issue that should be researched further is the potential problem of avian
mortality at the tower’s particular location. We do not believe that this will be a
significant problem with the installation of a single 30-m turbine, but research to this
point has been preliminary. We were unsuccessful in gaining specific information
through the environmental groups that we contacted, so a slightly different approach
might be taken in the future. Students should complete a Phase I evaluation by informing
the county, environmental groups, and other parties that may be interested in the process.
These groups should be willing to provide input on any bird species that may be
influenced by a turbine or whether further studies should be done. If James Madison
continues to show that it is serious in its attempt to install a turbine on its campus, groups
with concerns about the process will emerge.

113
References
American Wind Energy Association. <www.awea.org>, 2002. 23 Apr. 2002. Berinstein, Paula. Alternative Energy: Facts, Statistics, and Issues. Westport, CT: Oryx
Press, 2001 Bergey WindPower. Small Wind Turbines for Homes, Businesses, and Off-Grid.
<www.bergey.com>, 2002. 23 Apr. 2002. Cassedy, Edward S. and Peter Z. Grossman. Introduction to Energy. New York:
Cambridge University Press, 1990. Danish Wind Industry Association. Windpower.org. <www.windpower.org>. 12 Mar.
2002. Dudleston, Anna. Public Attitudes Towards Wind Farms in Scotland: Results of a
Residents Survey. Scottish Executive Central Research Unit, 2000.
Enron Wind Corporation. <www.enronwind.com>, 2 Mar. 2002. Forrester, Frank H. 1001 Questions Answered About The Weather. New York: General
Publishing Company, 1981. Franklin Institute Online. <www.franklininstitute.org>, 14 Mar. 2002. Gipe, Paul. Wind Power for Home and Business. Post Mills: Chelsea Green Publishing
Co., 1993. Honeywell Airport Systems. Honeywell Obstruction Lighting.
<http://www.airportsystems.honeywell.com/>, 2000. 3 Apr. 2002. James Madison University. James Madison University 1998-1999 Undergraduate
Catalog. Harrisonburg: JMU Office of Publications, Vol. 22, No.1, June 1998. Kirkpatrick, Kerrie, and Myriam Moore. “Hawk-Watching in Virginia.” A Birder’s Guide
to Virginia. Comp. David W. Johnston. American Birding Association, 1997. 193-196.
Lyons, Walter A. The Handy Weather Answer Book. Detroit: Accord Publishing, 1997. This book helped explain the history of wind measurement. National Renewable Energy Laboratory. <www.nrel.gov>, 2002. 1 May 2002. National Wind Coordinating Committee. <www.nationalwind.org>, 2001. 23 Apr. 2002.

114
Ris¿e National Laboratory. The WAsP 7.0 Help Facility. Roskilde, Denmark: January 15, 2000.
Rockingham Bird Club. Birds of Rockingham County Virginia. Ed. Clair Mellinger.
Rockingham Bird Club, Nov. 1998. U.S. Fish & Wildlife Service. Species Information: Threatened and Endangered Animals
and Plants. USFWS. <http://endangered.fws.gov/wildlife.html>.Jul. 2001. 31 Mar. 2002.
Vintage Windmills Online Magazine. <www.vintagewindmills.com>, 14 Mar. 2002.
Copyright © 2022 FDOKUMEN