Why Pharmacists Choose to Seek or Not Seek Board ...
209
University of Tennessee Health Science Center University of Tennessee Health Science Center UTHSC Digital Commons UTHSC Digital Commons Theses and Dissertations (ETD) College of Graduate Health Sciences 5-2008 Why Pharmacists Choose to Seek or Not Seek Board Certification Why Pharmacists Choose to Seek or Not Seek Board Certification in Pharmacy Practice: A Comparison of Motivation and Motivating in Pharmacy Practice: A Comparison of Motivation and Motivating Factors Factors Mark Tankersley University of Tennessee Health Science Center Follow this and additional works at: https://dc.uthsc.edu/dissertations Part of the Health and Medical Administration Commons, Other Medicine and Health Sciences Commons, and the Pharmacy Administration, Policy and Regulation Commons Recommended Citation Recommended Citation Tankersley, Mark , "Why Pharmacists Choose to Seek or Not Seek Board Certification in Pharmacy Practice: A Comparison of Motivation and Motivating Factors" (2008). Theses and Dissertations (ETD). Paper 258. http://dx.doi.org/10.21007/etd.cghs.2008.0315. This Dissertation is brought to you for free and open access by the College of Graduate Health Sciences at UTHSC Digital Commons. It has been accepted for inclusion in Theses and Dissertations (ETD) by an authorized administrator of UTHSC Digital Commons. For more information, please contact [email protected].
-
Upload
khangminh22 -
Category
Documents
-
view
1 -
download
0
Transcript of Why Pharmacists Choose to Seek or Not Seek Board ...

University of Tennessee Health Science Center University of Tennessee Health Science Center
UTHSC Digital Commons UTHSC Digital Commons
Theses and Dissertations (ETD) College of Graduate Health Sciences
5-2008
Why Pharmacists Choose to Seek or Not Seek Board Certification Why Pharmacists Choose to Seek or Not Seek Board Certification
in Pharmacy Practice: A Comparison of Motivation and Motivating in Pharmacy Practice: A Comparison of Motivation and Motivating
Factors Factors
Mark Tankersley University of Tennessee Health Science Center
Follow this and additional works at: https://dc.uthsc.edu/dissertations
Part of the Health and Medical Administration Commons, Other Medicine and Health Sciences
Commons, and the Pharmacy Administration, Policy and Regulation Commons
Recommended Citation Recommended Citation Tankersley, Mark , "Why Pharmacists Choose to Seek or Not Seek Board Certification in Pharmacy Practice: A Comparison of Motivation and Motivating Factors" (2008). Theses and Dissertations (ETD). Paper 258. http://dx.doi.org/10.21007/etd.cghs.2008.0315.
This Dissertation is brought to you for free and open access by the College of Graduate Health Sciences at UTHSC Digital Commons. It has been accepted for inclusion in Theses and Dissertations (ETD) by an authorized administrator of UTHSC Digital Commons. For more information, please contact [email protected].

Why Pharmacists Choose to Seek or Not Seek Board Certification in Pharmacy Why Pharmacists Choose to Seek or Not Seek Board Certification in Pharmacy Practice: A Comparison of Motivation and Motivating Factors Practice: A Comparison of Motivation and Motivating Factors
Abstract Abstract The stated mission of the Board of Pharmaceutical Specialties (BPS) with regard to specialization is, via board certification, to recognize specialty areas, define skill standards for those specialty areas, and evaluate the knowledge and skills of individual Pharmacy specialists. The perceived or real benefits to the pharmacist of pursuing board certification are unknown. These benefits can be evaluated by separating into values (valences) and instrumentalities, the latter of which is the perceived or known probability that a performance will lead to an outcome. The primary purpose of this study was to determine the differences in values and instrumentalities perceived by the pharmacist, and differing calculated forces of motivation, using an Expectancy Valence equation, between board certified pharmacists and those who were not.
A survey instrument, the Advanced Certification Index for Pharmacists (ACI-P), was designed to test instrumentalities, values, and calculated force of motivation. The ACI-P was deployed via electronic mail and the internet in cooperation with four major Pharmacy organizations and the Board of Pharmaceutical Specialties. Four direct comparisons between the two groups were completed. These were instrumentality, valence, valence-minus-instrumentality and valence-times-instrumentality. Additionally, the components of the valence and instrumentality products (the VI Scores) were multiplied by expectancy (anticipated chance of success of an effort leading to successful performance) resulting in a force of motivation calculation for each pharmacist’s score.
The ACI-P was deployed in the summer of 2007. Of the 2,274 pharmacists who began the survey, 2,129 completed all of the survey question sets for a completion percentage of 93.7%. A total of 2,057 of 2,129 completed surveys were retained for the research data representing a clean data rate of 96.6% of those completing all questions and 90.5% of those initiating the survey. This data set was comprised of 496 (24.1%) non-board certified pharmacists and 1,561 (75.9%) board certified pharmacists.
Validation and reliability of the ACI-P was confirmed via parallel axis analysis and Cronbach’s alpha reliability coefficient. There were two factors or domains found in the data and these were Professional, Career and Personal (PCP) and Financial Support (FS). Cronbach’s alpha for the PCP factor or domain was 0.94 and the FS domain had an alpha of 0.81. The constructs were validated and the items addressed within the constructs of PCP and FS were reliable. The overall Cronbach’s alpha reliability coefficient for the ACI-P was 0.94.
In the four major comparisons, there were significant differences between non-board certified and board certified pharmacists.
The primary value used for the motivational force calculation was based on valence-times-instrumentality-times-expectancy. The valence-times-instrumentality value was the VI score or VIS. The summed VI scores for the non-board certified pharmacists were in general lower (303.54; SD 101) than those for the board certified pharmacists (343.82; SD 83), and these were statistically different (t= -8.03, p<.0001).
The overall expectancy mean for non-board certified pharmacists was 4.05 and 4.4 for board certified pharmacists (5-point Likert scale), and these were significantly different (t = -9.16, p<.0001).
The overall motivational force calculated using the ACI-P scoring methodology yielded a force of motivation to seek board certification of 1249 (95% CI 1201-1296) for non-board certified pharmacists and 1521 (95% CI 1499-1544) for board certified pharmacists. The differences were statistically

significant. (t=10.15, p=<0.001). A tipping point in the range of 1500-1520 was identified that would indicate a 95% probability that a pharmacist scoring in this range would be a board certified pharmacist.
The results of this study show that there were significant differences in motivational factors between non-board certified pharmacists and those that were board certified with the latter scoring higher on nearly every measure. The ACI-P survey instrument was shown to be a valid and reliable tool for evaluation of the force of motivation for pharmacists to seek board certification.
Document Type Document Type Dissertation
Degree Name Degree Name Doctor of Philosophy (PhD)
Program Program Health Science Administration
Research Advisor Research Advisor Peter Chyka, Pharm. D.
Keywords Keywords ACI-P, Advanced Certification Index, BPS, Board Certification, Board of Pharmaceutical Specialties, Expectancy, Motivation, Motivational theory, Pharmacists, Specialists, VIE
Subject Categories Subject Categories Health and Medical Administration | Medicine and Health Sciences | Other Medicine and Health Sciences | Pharmacy Administration, Policy and Regulation
This dissertation is available at UTHSC Digital Commons: https://dc.uthsc.edu/dissertations/258
WHY PHARMACISTS CHOOSE TO SEEK OR NOT
SEEK BOARD CERTIFICATION IN PHARMACY PRACTICE:
A COMPARISON OF MOTIVATION AND MOTIVATING FACTORS
A Dissertation
Presented for
The Graduate Studies Council
The University of Tennessee
Health Science Center
In Partial Fulfillment
Of the Requirements for the Degree
Doctor of Philosophy
From The University of Tennessee
By
Mark A. Tankersley
May 2008

ii
Copyright © Mark Alan Tankersley, 2008
All rights reserved

iii
Dedication
This dissertation is dedicated to my wife Debbie who has graced me with
companionship, love, and support for 33 years. I also dedicate this work to my daughter
Jessica, my son Alan and my mother-in-law Margaret Crumley.
Their support and assistance offered along this journey have been incredible and
have made this effort tolerable and worthwhile.

iv
Acknowledgements
I would like to thank my major professor, Dr. David Solomon, for his support,
guidance and belief in this project. I would also like to thank my committee members, Dr.
Dick Gourley, Dr. Cheryl Stegbauer, Dr. Peter Chyka and Dr. Vivian Loveless for their
support, comments, time and assistance.
Two consultants to this project were of immense value. They were Dr. Raoul
Arreola and Dr. Richard Bertin. Dr. Arreola lent considerable expertise in survey design
concepts and Dr. Richard Bertin, Executive Director of the Board of Pharmaceutical
Specialties, offered insight, direction and access to information.
I would also like to thank my earlier major professor, Dr. Pamala Reed, for her
guidance during the development of this project.
Further, I would like to thank the Pharmaceutical Journal, the official publication
of the Royal Pharmaceutical Society of Great Britain (RPSGB), for their permission to
reproduce Figure 1-1.
I would also like to thank the American Pharmaceutical Association, American
Society of Health-System Pharmacists, American College of Clinical Pharmacy,
American Association of Colleges of Pharmacy, and the Board of Pharmaceutical
Specialties for their participation, cooperation and assistance with deployment of the
survey instrument employed for this research.
I would like to thank Samantha Norton for her assistance as a lay reviewer of the
manuscript to assure general understandability of the narrative and concepts.
v
Abstract
The stated mission of the Board of Pharmaceutical Specialties (BPS) with regard
to specialization is, via board certification, to recognize specialty areas, define skill
standards for those specialty areas, and evaluate the knowledge and skills of individual
Pharmacy specialists. The perceived or real benefits to the pharmacist of pursuing board
certification are unknown. These benefits can be evaluated by separating into values
(valences) and instrumentalities, the latter of which is the perceived or known probability
that a performance will lead to an outcome. The primary purpose of this study was to
determine the differences in values and instrumentalities perceived by the pharmacist,
and differing calculated forces of motivation, using an Expectancy Valence equation,
between board certified pharmacists and those who were not.
A survey instrument, the Advanced Certification Index for Pharmacists (ACI-P),
was designed to test instrumentalities, values, and calculated force of motivation. The
ACI-P was deployed via electronic mail and the internet in cooperation with four major
Pharmacy organizations and the Board of Pharmaceutical Specialties. Four direct
comparisons between the two groups were completed. These were instrumentality,
valence, valence-minus-instrumentality and valence-times-instrumentality. Additionally,
the components of the valence and instrumentality products (the VI Scores) were
multiplied by expectancy (anticipated chance of success of an effort leading to successful
performance) resulting in a force of motivation calculation for each pharmacist’s score.
The ACI-P was deployed in the summer of 2007. Of the 2,274 pharmacists who
began the survey, 2,129 completed all of the survey question sets for a completion

vi
percentage of 93.7%. A total of 2,057 of 2,129 completed surveys were retained for the
research data representing a clean data rate of 96.6% of those completing all questions
and 90.5% of those initiating the survey. This data set was comprised of 496 (24.1%)
non-board certified pharmacists and 1,561 (75.9%) board certified pharmacists.
Validation and reliability of the ACI-P was confirmed via parallel axis analysis
and Cronbach’s alpha reliability coefficient. There were two factors or domains found in
the data and these were Professional, Career and Personal (PCP) and Financial Support
(FS). Cronbach’s alpha for the PCP factor or domain was 0.94 and the FS domain had an
alpha of 0.81. The constructs were validated and the items addressed within the
constructs of PCP and FS were reliable. The overall Cronbach’s alpha reliability
coefficient for the ACI-P was 0.94.
In the four major comparisons, there were significant differences between non-
board certified and board certified pharmacists.
The primary value used for the motivational force calculation was based on
valence-times-instrumentality-times-expectancy. The valence-times-instrumentality
value was the VI score or VIS. The summed VI scores for the non-board certified
pharmacists were in general lower (303.54; SD 101) than those for the board certified
pharmacists (343.82; SD 83), and these were statistically different (t= -8.03, p<.0001).
The overall expectancy mean for non-board certified pharmacists was 4.05 and
4.4 for board certified pharmacists (5-point Likert scale), and these were significantly
different (t = -9.16, p<.0001).
The overall motivational force calculated using the ACI-P scoring methodology
yielded a force of motivation to seek board certification of 1249 (95% CI 1201-1296) for
vii
non-board certified pharmacists and 1521 (95% CI 1499-1544) for board certified
pharmacists. The differences were statistically significant. (t=10.15, p=<0.001). A
tipping point in the range of 1500-1520 was identified that would indicate a 95%
probability that a pharmacist scoring in this range would be a board certified pharmacist.
The results of this study show that there were significant differences in
motivational factors between non-board certified pharmacists and those that were board
certified with the latter scoring higher on nearly every measure. The ACI-P survey
instrument was shown to be a valid and reliable tool for evaluation of the force of
motivation for pharmacists to seek board certification.
viii
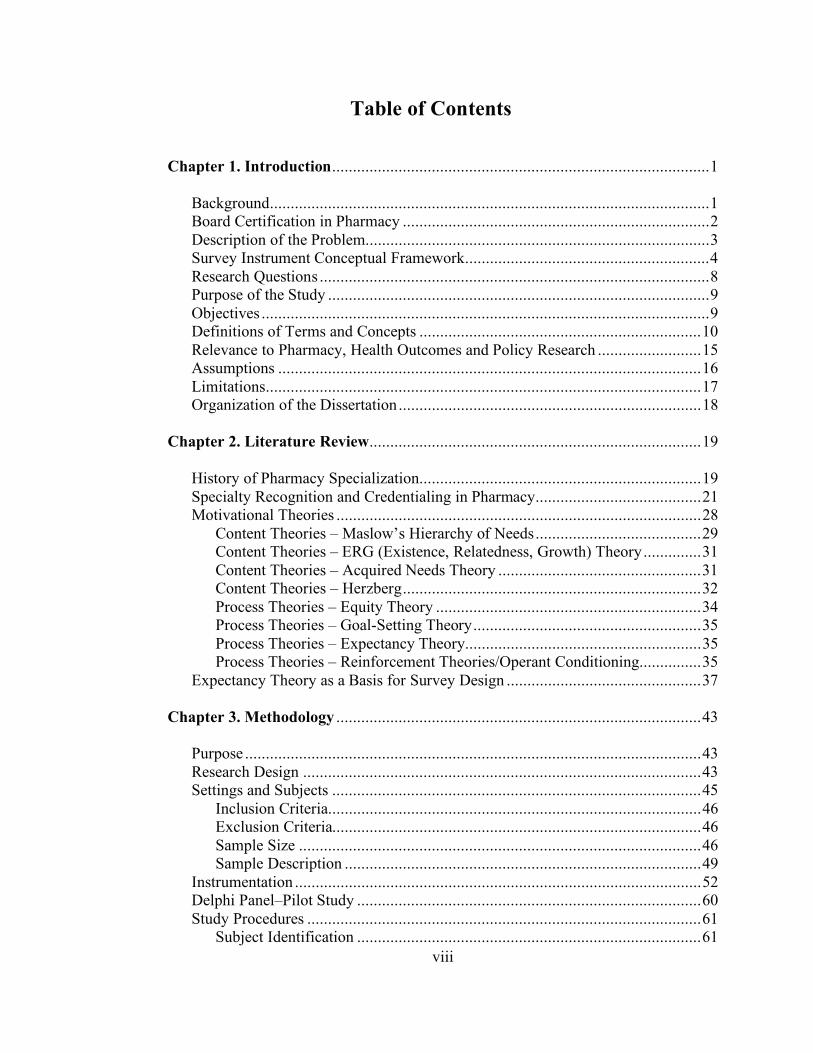
Table of Contents
Chapter 1. Introduction...........................................................................................1
Background..........................................................................................................1
Board Certification in Pharmacy ..........................................................................2
Description of the Problem...................................................................................3
Survey Instrument Conceptual Framework...........................................................4
Research Questions ..............................................................................................8
Purpose of the Study ............................................................................................9
Objectives ............................................................................................................9
Definitions of Terms and Concepts ....................................................................10
Relevance to Pharmacy, Health Outcomes and Policy Research .........................15
Assumptions ......................................................................................................16
Limitations.........................................................................................................17
Organization of the Dissertation.........................................................................18
Chapter 2. Literature Review................................................................................19
History of Pharmacy Specialization....................................................................19
Specialty Recognition and Credentialing in Pharmacy........................................21
Motivational Theories ........................................................................................28
Content Theories – Maslow’s Hierarchy of Needs........................................29
Content Theories – ERG (Existence, Relatedness, Growth) Theory..............31
Content Theories – Acquired Needs Theory .................................................31
Content Theories – Herzberg........................................................................32
Process Theories – Equity Theory ................................................................34
Process Theories – Goal-Setting Theory.......................................................35
Process Theories – Expectancy Theory.........................................................35
Process Theories – Reinforcement Theories/Operant Conditioning...............35
Expectancy Theory as a Basis for Survey Design ...............................................37
Chapter 3. Methodology ........................................................................................43
Purpose ..............................................................................................................43
Research Design ................................................................................................43
Settings and Subjects .........................................................................................45
Inclusion Criteria..........................................................................................46
Exclusion Criteria.........................................................................................46
Sample Size .................................................................................................46
Sample Description ......................................................................................49
Instrumentation ..................................................................................................52
Delphi Panel–Pilot Study ...................................................................................60
Study Procedures ...............................................................................................61
Subject Identification ...................................................................................61

ix
Internet Survey.............................................................................................62
Data Analysis.....................................................................................................62
Consideration of Human Subjects ..................................................................... 64
Chapter 4. Results and Findings ...........................................................................65
Survey Mechanics and Data Collection ..............................................................65
Demographics ....................................................................................................66
Instrumentality...................................................................................................73
Valence..............................................................................................................79
Valence Minus Instrumentality (VI_Diff)...........................................................83
Valence Times Instrumentality (VI_Score).........................................................88
Force of Motivation ...........................................................................................94
Validity of Survey Instrument ............................................................................99
Reliability of Survey Instrument.......................................................................105
Comparison of 2004 BPS Survey Findings and 2007 ACI-P Findings ..............109
Comparison of Additional Comments from 2007 ACI-P Survey ......................112
Chapter 5. Study Discussion and Conclusions....................................................118
Discussion........................................................................................................118
Additional Comments Analysis........................................................................119
Instrumentality.................................................................................................122
Valence............................................................................................................124
Valence Times Instrumentality (VI_Score).......................................................126
Valence Minus Instrumentality (VI_Diff).........................................................128
Motivational Force Computations ....................................................................131
Validity and Reliability of ACI-P.....................................................................132
Tipping Point Confirmed..................................................................................133
Limitations of the Study...................................................................................134
Conclusions .....................................................................................................134
Recommendations for the Future of Board Certification in Pharmacy.........135
Contributions of this Research....................................................................137
Recommendations for Future Research ......................................................139
List of References.................................................................................................142
Appendix A ..........................................................................................................149
Advanced Certification Index for Pharmacists (ACI-P) ....................................150
Appendix B........................................................................................................... 173
Letters to Pharmacy Organizations Seeking Assistance and Cooperation
and Communications of Agreement to Participate ............................................174
x
Appendix C ..........................................................................................................187
Permission to Reprint Figure 1-1 from the Pharmaceutical Journal...................188
Appendix D ..........................................................................................................189
University of Tennessee IRB Approval (Exemption)........................................190
Vita .......................................................................................................................193

xi
List of Tables
Table 2-1. Tangible and Intangible Benefits that BPS Certification May
Bring to the Pharmacist as Reported in BPS Online Survey
Results 2004 .....................................................................................27
Table 3-1. Sample Size Projections Based on Cohen’s d Estimates,
Effect Size is an Estimate of Discernible Effect ................................48
Table 3-2. Proposed Domains of ACI-P, Questions within Domains and
Percentages of Total .........................................................................55
Table 4-1. Distribution of Pharmacist Respondents to 2007 ACI-P Survey ........67
Table 4-2. Distribution of Retained Pharmacist Respondents from 2007
ACI-P Survey ...................................................................................67
Table 4-3. Demographics of Respondent Sample in Retained Survey
Dataset from 2007 ACI-P (N=1924 for Age + Gender [A+G]) ..........68
Table 4-4. Respondent Groups by Age, Certification Status and Gender
(N=1,924 for Age + Gender [A+G])..................................................68
Table 4-5. Differences in Instrumentalities, (SD), between Board Certified
(BCP) and Non-Board Certified Pharmacists (NONBCP) .................74
Table 4-6. Differences in Valences, (SD), between Board Certified (BCP)
and Non-Board Certified Pharmacists (NONBCP)............................80
Table 4-7. Differences in Valences Minus Instrumentality Scores (V_Diff),
(SD), between Board Certified (BCP) and Non-Board
Certified Pharmacists (NONBCP).....................................................85
Table 4-8. Differences in Valences Times Instrumentality Scores
(VI_Score), (SD), between Board Certified (BCP) and
Non-Board Certified Pharmacists (NONBCP) ..................................90
Table 4-9. Differences in Expectancy, Sums of VIS and Motivational Force
as Calculated by ACI-P, (SD), between Board Certified (BCP)
and Non-Board Certified Pharmacists (NONBCP)............................97
Table 4-10. Differences in VIS for a priori Proposed Domains, (SD),
between Board Certified (BCP) and Non-Board Certified
Pharmacists (NONBCP) .................................................................101

xii
Table 4-11. Two Factor Solution from Factor Analysis and Parallel Axis,
Analysis from ACI-P Survey Findings............................................103
Table 4-12. PCP and FS Comparisons Derived with Parallel Axis Analysis
from ACI-P Survey Findings, VI Scores (VIS) for Two Factor
Solution (Sum of V * I per Domain) ...............................................106
Table 4-13. Reliability Calculated with Cronbach’s Alpha for ACI-P
Survey Instrument...........................................................................108
Table 4-14. Items and Responses from Board Certified Pharmacists from
2007 ACI-P Survey Reported and Matched to Categories from
2004 BPS Survey (N=1561)............................................................110
Table 4-15. Tangible and Intangible Benefits that BPS Certification May
Bring to the Pharmacist as Reported in BPS Online Survey
Results 2004 (Redisplay of Table 1-1) ............................................111
Table 4-16. Comparison of Relative Sequence of Findings from 2004
BPS Survey and 2007 ACI-P Survey, Highest to Lowest
Based on the 2004 BPS Survey.......................................................113
Table 4-17. Comparison of Non-Board Certified (NONBCP) and Board
Certified Pharmacists (BCP) Findings from Additional
Comments and Questions (Responses=620, Respondents=324) ......115
Table 4-18. General Findings from Additional Comments; Responses
Greater than 27 per Item in either NONBCP or BCP group
(N = 591) ........................................................................................116
Table 4-19. General Findings from Additional Comments: Responses
Greater than 27 in NONBCP and BCP groups (N=353) ..................117
Table 5-1. Summarized Findings from Additional Comments with
Combined Groups (N=461).............................................................120

xiii
List of Figures
Figure 1-1. Expectancy Theoretical Model Demonstrated as a Model
of Motivation (Reproduced with Permission of the
Pharmaceutical Journal)......................................................................5
Figure 1-2. Conceptual Framework of Practitioner Valence, Instrumentality
and Expectancy Perceptions of Board Certification (Original
Work adapted from Theoretical VIE Model of Motivation).................7
Figure 4-1. VIS Score Relative Values for Non-Board Certified and
Board Certified Pharmacists from 2007 ACI-P Survey......................95

1
Chapter 1. Introduction
Background
Drug therapy is an integral component of the modern health care delivery
system accounting for 10% of health care spending and 16% of incremental
spending.1 Market introduction of drugs and the rate of drug approval has doubled in
the last three decades while expenditures for research and development have
increased more than twelve times.2 These new drugs and new drug delivery systems
offer options for the treatment of conditions that were deemed untreatable just a few
years ago. In addition to an increasing number of drugs, the types of drugs have
increased in complexity. Currently there are more than 400 biotechnology medicines
in the drug pipeline. “These include 210 medicines for cancer, 50 for infectious
disease, 44 for autoimmune diseases and 22 for AID/HIV and related conditions”.3
Newer genetically engineered and biotechnology drugs have set the stage for a
paradigm shift in healthcare, particularly in the practice of Pharmacy. New practice
models and practitioner competencies are required to assure that the needs of the
public and health care system are met. Specialization in healthcare has become more
of a need as these rapid advancements in drug therapy and technology have created an
environment requiring extensive knowledge of the many facets of healthcare and how
drug therapy can best be incorporated to provide optimal patient care.2, 4-6
Specialization is an evolution within a profession to accommodate new knowledge,
techniques and/or technology into the improvement of health care. “Specialization in
the healing arts is unique because it places the needs of the person receiving care at

2
the center of concern.” 5, 7
Accommodating these changes calls for specialization and
specialized practitioners in Pharmacy. Does a pharmacist stand to gain from
achieving specialization? Why do qualified pharmacists seek specialty board
certification? Why do qualified pharmacists not seek board certification? Is
specialization attainable without formal recognition of an “approval body”? The
purpose of this research was to examine and compare pharmacist groups seeking or
not seeking board certification.
Board Certification in Pharmacy
Becoming board certified in Pharmacy is a rigorous and involved process.8, 9
It is also voluntary and may not lead to a tangible reward. In the practice of
Medicine, and in some other health care disciplines, board certification may not be
required but is highly desired for practice. It is required for advanced practice
licensure in most states for nursing. Reimbursement and/or accreditation processes
may also be tied to the number of board certified practitioners, especially physicians,
in a practice or area.9 Although not required, there are a number of factors which
motivate pharmacists to pursue board certification, as well as a perceived value of
those motivating factors. It is reasonable to expect that the number of pharmacists
seeking board certification is related to these factors and their perceived values.
Studies assessing expectations and related perceived values of a pharmacist pursuing
board certification were not found in the literature.

3
Description of the Problem
There are potential benefits to employers, and other health care providers, of
pharmacist specialization. It has also been postulated, and is indeed the point of
board certification, that such pursuit and accomplishment produces a better provider
of care. However, in the medical profession, this has yet to be definitively proven.9
The practice setting may affect the perceived or actual benefits to a
pharmacist. In areas where financial reward is greater, that particular benefit may
take prominence. In practice areas that have a preference for specialty certification,
work related benefits may move to the forefront.
Board Certification in any Pharmacy practice area has specifics that make it
unique, hence the specialization designation. Contributing factors may be a perceived
difference due to the fact that the pharmacist’s practice area is quite different from
standard clinical practice and they seek some level of differentiation. There may also
be more reward or benefit within a particular specialty than the others. The
tangibility of these rewards may be questionable as there are a number of former
board certified pharmacists that have elected to not maintain their certification. To
evaluate the issues of possible benefits or rewards specific to being a board certified
pharmacist, a conceptual model and survey instrument based on Expectancy theory
was developed. Principal to this model and instrument design were the values
(valence), probability of performance leading to the outcome (instrumentality) and
the attributed expectation (expectancy).
Four domains of valence and instrumentality were proposed. They were:
1. Personal

4
2. Financial
3. Career
4. Professional
The purpose of the use of this theory was to fashion a survey instrument based
on its components and not to prove the validity of the theory or its application to this
research. Some discussion focuses on potential uses and applications of the
instrument derived from this study.
Survey Instrument Conceptual Framework
Valence-instrumentality-expectancy (VIE) theory is a major theory of
motivation and work behavior. It may also be called Expectancy theory, Expectancy-
Valence (EV), instrumentality theory, and path-goal theory. The three major
variables are expectancy, instrumentality and valence (value).10-12
For the purpose of
this study, VIE is an explanatory acronym that is used as a synonym for Expectancy
theory and these two terms or names may be considered interchangeable. It is a
process theory in that it seeks to identify the relationship between the variables in a
dynamic state as they affect individual behavior. Vroom, the initiator and synthesizer
of Expectancy/VIE theory, postulated that one’s perception of a link between effort
and reward, plus values attributed to aspects of the task or rewards at hand, lead to
motivation at work. In this theory, the relationships between the inputs are more the
focal point than the inputs themselves.12
Figure 1-1 is a graphical depiction of Expectancy theory listed as the
components of VIE Theory. 10
In this figure, expectancy is a perceived probability

5
Effort 0.5 Performance Rewards
0.9
0.5 Pay Raise 6
Promotion 8
0.3
Longer holiday 5
0.6
Company car 9
Expectancy Instrumentalities Valences
Figure 1-1. Expectancy Theoretical Model Demonstrated as a Model of Motivation
(Reproduced with Permission of the Pharmaceutical Journal)10
6
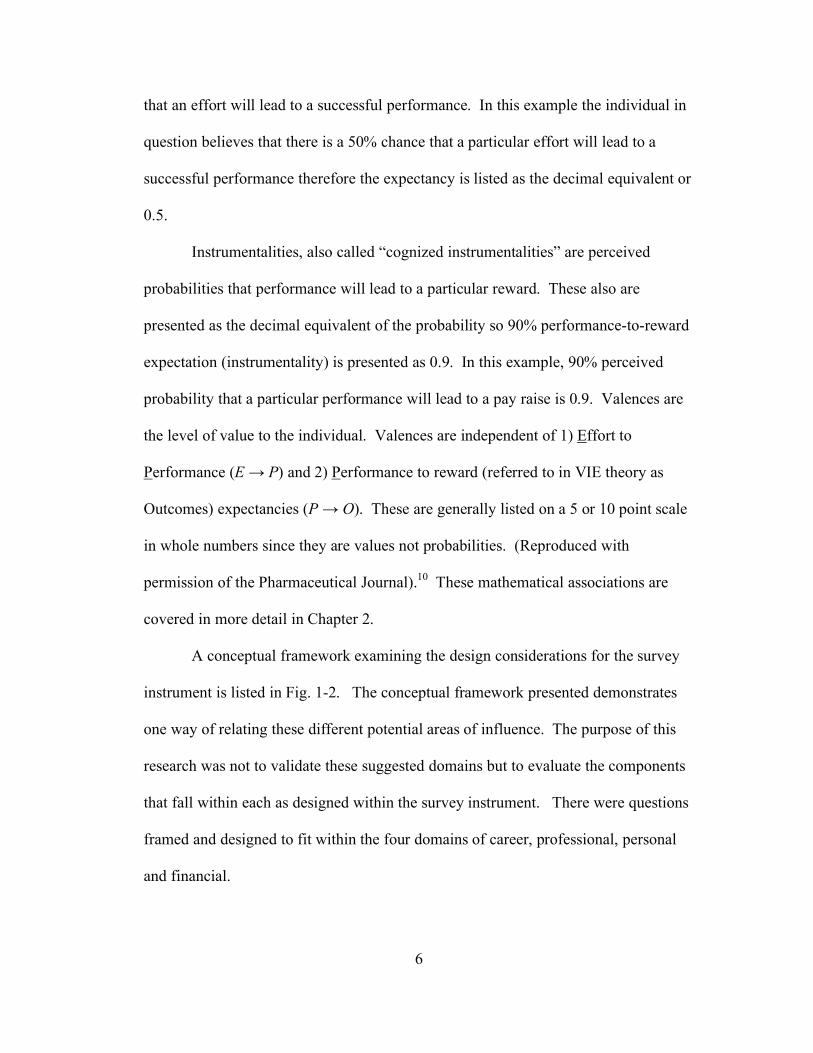
that an effort will lead to a successful performance. In this example the individual in
question believes that there is a 50% chance that a particular effort will lead to a
successful performance therefore the expectancy is listed as the decimal equivalent or
0.5.
Instrumentalities, also called “cognized instrumentalities” are perceived
probabilities that performance will lead to a particular reward. These also are
presented as the decimal equivalent of the probability so 90% performance-to-reward
expectation (instrumentality) is presented as 0.9. In this example, 90% perceived
probability that a particular performance will lead to a pay raise is 0.9. Valences are
the level of value to the individual. Valences are independent of 1) Effort to
Performance (E P) and 2) Performance to reward (referred to in VIE theory as
Outcomes) expectancies (P O). These are generally listed on a 5 or 10 point scale
in whole numbers since they are values not probabilities. (Reproduced with
permission of the Pharmaceutical Journal).10
These mathematical associations are
covered in more detail in Chapter 2.
A conceptual framework examining the design considerations for the survey
instrument is listed in Fig. 1-2. The conceptual framework presented demonstrates
one way of relating these different potential areas of influence. The purpose of this
research was not to validate these suggested domains but to evaluate the components
that fall within each as designed within the survey instrument. There were questions
framed and designed to fit within the four domains of career, professional, personal
and financial.

7
Figure 1-2. Conceptual Framework of Practitioner Valence, Instrumentality and
Expectancy Perceptions of Board Certification (Original work adapted
from theoretical VIE Model of Motivation)
8
Research Questions
The principal question asked in this research was; what are the differences in
instrumentalities, values placed on those outcomes and force of motivation between
board certified pharmacists and those that are not board certified? Instrumentalities
are perceived probabilities that performance will lead to particular benefits, rewards
or outcomes.
The following specific questions, based on the perception of the pharmacist,
were addressed:
1. What were the differences in instrumentalities (probabilities) between
board certified and non-board certified pharmacists?
2. What were the differences in valences (values) between board certified
and non-board certified pharmacists?
3. What were the differences in the product of instrumentalities and valences
between board certified and non-board certified pharmacists?
4. What were the differences between the value-minus-instrumentality
calculation between board certified and non-board certified pharmacists?
5. What were the differences in calculated force of motivation, as defined by
the Expectancy Value (VIE) model, between board certified and non-
board certified pharmacists?
6. Was there a tipping point where a certain combination of factors would
indicate a pharmacist would be board certified, i.e. would a certain
calculated overall force of motivation be definitely different in board
certified pharmacists than in those that were not board certified?
9
7. Were there certain instrumentalities, valences or combinations of
instrumentalities and valences, as well as expectations, as defined by the
Expectancy Value (VIE) model, that were the most valued by pharmacists
that are board certified?
Purpose of the Study
The primary purpose of this study was to compare the values,
instrumentalities, expectations, and calculated force of motivation between
pharmacists that choose to seek or not seek board certification in a Pharmacy
specialty.
Objectives
The objectives of this study were to:
1. Create a survey instrument and utilize to determine the differences in
motivating factors (forces) between board certified and non-board certified
pharmacists.
2. Determine the overall scores of those factors or forces.
3. Evaluate the relationships among and between the factors or forces.
4. Compare motivating factors between board certified pharmacists and those
that were not board certified in specialty Pharmacy practice.
5. Compare calculated motivational force between board certified
pharmacists and those that were not board certified in specialty Pharmacy
practice.
10
Definitions of Terms and Concepts
• Expectancy: Expectancy refers to the expectation, or anticipated chance of
success of an effort leading to successful performance. In this case that would
be exertion of effort leading to achievement of the designation of board
certification in a specialty by BPS.10-12
• Valence: Valence refers to the perceived value that correlates to the
instrumentality of the particular outcome. This may also be interpreted as
value to the individual.10-12
• Instrumentality: Instrumentality is a perceived or known probability that a
performance will lead to an outcome. It is also called a performance-to-
outcome expectancy (P O). This may also be called cognized
instrumentality.10-12
• VIE (Valence-Instrumentality-Expectancy) Theory: VIE, also called
expectancy theory, it is a major theory of motivation and work behavior. It is
a process theory in that it seeks to identify the relationship between the
variables in a dynamic state as they affect individual behavior. Other
synonyms include instrumentality theory and path-goal theory.10-12
• Expectancy Theory: Also called VIE theory, it is a major theory of
motivation and work behavior. It is a process theory in that it seeks to identify
the relationship between the variables in a dynamic state as they affect
individual behavior. Other synonyms are instrumentality theory and path-goal
theory.10-12
11
• Demographic Variances and Inputs: Pharmacists may be influenced by
demographic inputs and these may be categorized. Some of these
characteristic demographic categories may or may not have a bearing on the
outcome of the study. Categories of characteristics, or demographic variances
(inputs), captured during the survey process in this study were:
1. Current professional Pharmacy organizations memberships
2. Age
3. Gender
4. Current board certification status
5. City of primary practice setting
6. State, territory or location of primary practice setting
7. Practice position/title/role at primary practice site (could be multiple)
8. Type of practice setting
9. Average number of hours worked per week in the practice of Pharmacy
10. Entry level Pharmacy degree
11. Highest level Pharmacy related degree
12. Type of Pharm.D. Degree (if earned)
13. Residency completion status and type
14. Number of years worked in full or part-time status as a licensed
pharmacist
15. Number of years worked in current specialty or practice focus
16. Primary reason for seeking board certification
17. Secondary reason for seeking board certification
12
• Organizational Inputs: This refers to the various groups and associations
that may be considered influential in the pharmacist’s decision to become a
board certified pharmacist. For the purposes of this study, those considered
were as follows:
1. Board of Pharmaceutical Specialties (BPS)
2. Professional organizations were the American Society of Health-System
Pharmacists (ASHP), American Pharmacists Association (APhA),
American College of Clinical Pharmacy (ACCP), American Association
of Colleges of Pharmacy (AACP)
3. Company (employer)
• AMA: The American Medical Association is the nation’s largest physician’s
professional association and by their own credo advocate on the part of the
nation’s health.13
• ABMS: “The American Board of Medical Specialties (ABMS), a not-for-
profit organization comprising 24 medical specialty boards, is the pre-eminent
entity overseeing physician certification in the United States.”14
• AMA Council on Medical Education: Also known as the American Medical
Association Council on Medical Education. “The Council on Medical
Education (CME) formulates policy on medical education by recommending
educational policies to the American Medical Association (AMA) House of
Delegates, through the AMA Board of Trustees. The Council is also
responsible for recommending the appointment of representatives to
accrediting bodies and to other national organizations.”13
13
• Board of Pharmaceutical Specialties (BPS): The Board of Pharmaceutical
Specialties (BPS) was established by the American Pharmaceutical
Association (now the American Pharmacists Association, APhA) in 1976.
The stated mission of BPS with regard to specialization is, via board
certification, to recognize specialty areas, define skill standards for those
specialty areas, and to evaluate the knowledge and skills of individual
Pharmacy specialists. The purpose of board certification was to respond to
the rapidly evolving requirements of patients and other health care
professionals for pharmacists.4, 15-17
• Pharmaceutical Care: Pharmaceutical care is a manner of Pharmacy practice
that strives to promote health, prevent disease, and assess, monitor, and
modify medication use to assure that drug therapy regimens are appropriate,
safe and effective.18
• APhA: “The American Pharmacists Association (APhA), a national
professional association of pharmacists, founded in 1852 as the American
Pharmaceutical Association, is the first-established and largest professional
association of pharmacists in the United States.”19
• ASHP: ASHP is the American Society of Health-System Pharmacists. It was
known as the American Society of Hospital Pharmacists until the scope and
name change in 1995. It is a “national professional association that represents
pharmacists who practice in hospitals, health maintenance organizations, long-
term care facilities, home care, and other components of the health care
system.”20

14
• ACCP: “The American College of Clinical Pharmacy (ACCP) is a
professional and scientific society that provides leadership, education,
advocacy, and resources enabling clinical pharmacists to achieve excellence in
practice and research. ACCP’s membership is composed of practitioners,
scientists, educators, administrators, students, fellows, and others committed
to excellence in clinical Pharmacy and patient pharmacotherapy.”21
• AACP: “Founded in 1900, the American Association of Colleges of
Pharmacy (AACP) is the national organization representing the interests of
Pharmacy education and educators. [It is comprised of] all 105 U.S. colleges
and schools of Pharmacy including more than 4,300 faculty, 48,500 students
enrolled in professional programs and 3,600 individuals pursuing graduate
study. AACP is committed to excellence in Pharmacy education.”22
• Clinical Pharmacy: “Clinical Pharmacy is a health science discipline in
which pharmacists provide patient care that optimizes medication therapy and
promotes health, wellness, and disease prevention. The practice of clinical
Pharmacy embraces the philosophy of pharmaceutical care; it blends a caring
orientation with specialized therapeutic knowledge, experience, and judgment
for the purpose of ensuring optimal patient outcomes. As a discipline, clinical
Pharmacy also has an obligation to contribute to the generation of new
knowledge that advances health and quality of life.”21
• Accreditation Council for Pharmacy Education (ACPE): “Accreditation
Council for Pharmacy Education (ACPE) is the national agency for the
accreditation of professional degree programs in Pharmacy and providers of

15
continuing Pharmacy education. ACPE was established in 1932 for the
accreditation of Pharmacy education, and in 1975 its scope of activity was
broadened to include accreditation of providers of continuing Pharmacy
education. The Council is an autonomous and independent agency whose 10
member Board of Directors is comprised of representatives of the American
Association of Colleges of Pharmacy (AACP), the American Pharmacists
Association (APhA), the National Association of Boards of Pharmacy
(NABP) (three appointments each), and the American Council on Education
(ACE) (one appointment).”23
• SAS: SAS is an acronym for statistical analytical software. This research
employed SAS Version 9.1 TS Level M3, Copyright © 2002-2003 by SAS
Institute Inc., Cary, NC, USA. All Rights Reserved. 24
Relevance to Pharmacy, Health Outcomes and Policy Research
Board certification in many health specialties is preferred or expected and, in
some cases, driven by financial reimbursement or rights to practice in certain settings.
In Pharmacy, however, becoming board certified in specialty areas is still a voluntary
effort. This is true in all specialty areas of Pharmacy practice.8, 9
Therefore,
determining the motivational factors and values ascribed to those factors is essential
for determining measures that could be taken to increase the numbers of pharmacists
seeking certification. The scope of Pharmacy is expanding. Board certification could
become more important as pharmacists take on new challenges. Indeed, the interest
of pharmacists in seeking board certification could be instrumental in acceptance of

16
new practice models for pharmacists, as well as helping to form a structure for
reimbursement of cognitive clinical activities.16, 17, 25
This research was expected to offer information on differences in factors or
influences between board certified and non-board certified pharmacists. This
information has the opportunity of determining a level of motivation that may be able
to predict whether a pharmacist might pursue board certification. This could have an
impact on the overall pursuit of board certification by pharmacists. An effective tool
that could identify those individuals would be of enormous value. This information
may add to the knowledge needed for continued review and possible modification of
the certification process. If value to a pharmacist is not present or perceived then a
road map of where value needs to be improved would be helpful.
Assumptions
1. Pharmacists involved in completing the study’s survey would respond to
survey items as honestly and accurately as possible.
2. Pharmacists taking the survey would only complete one survey.
3. Sufficient numbers of pharmacists would have internet access to assure an
adequate number of respondents.
4. Pharmacists that respond to the internet based survey would represent the
targeted pharmacist population.
5. There is sufficient evidence of the effectiveness and value of the
pharmacist clinician.

17
Limitations
The following limitations were identified prior to initiation of research:
1. The study references surveys completed by the Board of Pharmaceutical
Specialties and others utilized and referenced by BPS in 1989, 1996, 2002
and 2004.26
There are economic, socioeconomic, and health care system
factors that may have changed in the years between surveys that were not
measured in the surveys.
2. Limited data are available on the number of pharmacists licensed to
practice in the United States, as well as overlap of practice areas, e.g.
pharmacotherapy and nutritional support.
3. Although BPS records the number of pharmacists who seek board
certification, limited data are available on the percentage of licensed
pharmacists seeking board certification in a specialty area because practice
area focus and total numbers of pharmacists in practice are difficult to
obtain and confirm.
4. Prior studies assessing values associated with expectations,
instrumentalities, and values related to Pharmacy specialization were not
found in the literature.
5. The time and expenses involved in pursuing board certification vary
among candidates and this variance could have biased the results.
6. Poor survey return rate could have impaired interpretation of the results.
7. Duplicate entries into the survey instrument could not be prevented.
8. Non-pharmacist entries into the survey instrument could not be prevented.

18
Organization of the Dissertation
The remainder of this dissertation is organized into the following four
chapters. Chapter 2 reviews the literature relative to the history and process of
becoming board certified in a Pharmacy specialty. The literature related to
motivational theories and expectancy theory is also reviewed as it pertains to the
reason for the selection of the expectancy theory mathematical model for the survey
instrument design.
Chapter 3 provides a description of the methods used, including the research
design, inclusion and exclusion criteria, data collection, and statistical methodology.
Chapter 4 describes the results and findings of the research and offers some
discussion regarding the mathematical aspects of expectancy theory. This is followed
in Chapter 5 by a review of the study conclusions and discussion.

19
Chapter 2. Literature Review
History of Pharmacy Specialization
The practice of Medicine has long utilized specialization to differentiate
practitioners. For over 100 years the medical profession has formally recognized
specialty practice. As far back as the recognition of a priest, shaman, or medicine
man as having special knowledge, insight, or power to heal, specialization in the
healing arts has been in place. That difference set them apart from the rest of the
village, community, clan, or town.9, 27
Medicine, nursing, optometry, and dentistry
exhibit a history of advanced level credentialing.9, 28
The history of specialization in
Medicine began in the 1920’s and 1930’s and was a result of the developments in
medical science and was perhaps causal in the resulting improvements in the delivery
of medical care. Specifically, specialization in the United States in Medicine can be
seen as a result of the need to master all the special tools and skills needed for the
delivery of appropriate and targeted health care. In addition to the development of
these skills, social, political and economic forces shaped the framework of the
medical specialties. In the practice of Medicine, specialty areas developed around
organ systems or functions. The current specialty titles are clear indicators of these.
Some examples of medical specialties are cardiology, obstetrics, gynecology,
dermatology, thoracic surgery, ophthalmology, otolaryngology, gastroenterology, and
neurosurgery. Clearly, the area or particular anatomical need or function played a
significant part in medical practice’s path toward specialization. Early on, individual
physicians were the only persons to assess their specialization qualifications. Lacking

20
was a formal process and a set of guidelines, requirements and rules to determine who
was indeed qualified to be known and practice as a specialist. Medical educational
institutions and specialty societies collaborated to create boards to define specialty
qualifications. These boards would function both to identify requirements of a
specialist and to assure the public of the specialist’s qualifications.9, 28
The first specialty board formed in the United States was the American Board
of Ophthalmology established in 1917. Candidates wishing to practice
ophthalmology had established guidelines for their education, training, and
importantly, evaluation of their skills. The American Board of Otolaryngology
followed in 1924. In 1930 the American Board of Obstetrics and Gynecology was
formed. They were joined shortly with the formation of the American Board of
Dermatology and Syphilology in 1932. Several other specialty groups followed with
the formation of the American Board of Internal Medicine in 1936 and the American
Board of Surgery in 1937.9, 28, 29
Board certification for physicians was based on the concept that physician
specialists who met certain qualifications and standards, and having attained the
necessary level of knowledge, skill, and experience in their respective area of practice
offered a higher level of care than practitioners who did not. While it may seem
intuitively logical that such specialists would produce better health care outcomes,
with lower morbidity and greater efficiency, this has not been validated by any
studies.9 Some have argued that the highly skilled and trained specialist dominated
care model actually does not improve outcomes over simpler and less expensive

21
models of health care.30
However, this has not deterred or altered the progression and
acceptance of the model of board certification as a means to improve healthcare.
Since 1934 specialty boards in Medicine have been officially recognized by
the American Board of Medical Specialties (ABMS) and the American Medical
Association (AMA) Council on Medical Education (CME). The American Board of
Medical Specialties approves 24 medical specialties and has become the standard by
which the profession and the public recognize physician specialists in the United
States. Additionally, 180 other non-ABMS boards issue specialty certifications.9, 29
Board certification is not currently required for a physician to practice
Medicine in most areas. But there is value to a specialty certification. Managed care
organizations require a certain percentage of the members of a medical staff to be
board certified for many contractual arrangements and the Joint Commission on
Accreditation of Health Care Systems (JCAHO) and the National Committee of
Quality Assurance (NCQA) incorporate medical specialty board certification in their
accreditation standards. These measures of acceptance provide a basis for the public
view of medical specialty board certification as a measure of expertise and
achievement and seem to be the entrenched pattern of acceptance.9, 31
Specialty Recognition and Credentialing in Pharmacy
Throughout most of its history Pharmacy has remained undifferentiated.
Hospital Pharmacy first began movement toward differentiation in the late 1960’s and
through the mid-1970’s. This environment of thought began to require a new model
of practice. Pharmacists practicing in these areas took on new roles. Activities and
22
communications in the late 1960’s and through the mid 1970’s addressed this new
practice model and the need for the development of a “new practitioner” who had
unique roles distinctive from those of the traditional dispensing pharmacist.9, 32
Early pioneering pharmacists participated with physicians in a variety of tasks
including therapeutic decision making. These tasks offered new opportunities.9
Recommendations were made to organize hospital Pharmacy departments in novel
ways to recognize and utilize what were then the new Pharmacy specialists. It was
suggested that the medical model of specialization be applied to Pharmacy.9, 32
Between the years 1973 and 1976 many activities, resulting from the movements
dating back to the late 1960’s and through the early 1970’s, took place that moved the
profession of Pharmacy into the realm of specialization.4, 6, 17, 33
There are a variety of
ways that pharmacists may be additionally trained and credentialed to meet the needs
of their expanding and more specialized roles. These include residencies,
fellowships, certificates and board certification.4, 6, 9, 15-17, 34
The American Pharmaceutical Association (now the American Pharmacists
Association, APhA) established the Board of Pharmaceutical Specialties (BPS) in
1976.5 The stated mission of BPS with regard to specialization is, via board
certification, to recognize specialty areas, define skill standards for those specialty
areas, and to evaluate the knowledge and skills of individual Pharmacy specialists.
The purpose of board certification was to respond to the rapidly evolving
requirements of patients and other health care professionals for pharmacists. The first
Pharmacy specialty recognized by BPS was Nuclear Pharmacy, which occurred in
23
1978. The others were Nutrition Support Pharmacy (1988), Pharmacotherapy (1988),
Psychiatric Pharmacy (1992), and Oncology Pharmacy (1996).4-6, 8, 9, 15, 17
Since the inception of Pharmacy board certification in these areas, research
and emphasis has been focused on the value that this specialization brings to the
patient, other members of the health care team and the health care system as a whole.
Areas of research have been in demonstrating higher levels of practice, better patient
outcomes, and cost reduction, where possible. Studies evaluating the effectiveness of
the pharmacist in pharmaceutical care have demonstrated successful activities in
lower drug costs and reduced overall health care expenditures, lower mortality rates
and prevention of errors. Meta-analyses and individual articles have outlined
pharmaceutical outcomes research as well as scientific applications of pharmaceutical
care. These reveal that indeed pharmacists do make an impact.35-56
Pharmaceutical care is designed to promote health, prevent disease, and
assess, monitor, and modify medication use to assure that drug regimens are safe and
effective.25, 34-43, 48, 51
In general, it appears that pharmacists’ activities in the hospital,
nursing home, retail/ambulatory practice and clinic settings have been well received
and have demonstrated the effectiveness of pharmaceutical care. For the purposes of
this study, it will be assumed that at this point in the development of the model of
pharmaceutical care that there is sufficient research evidence of the effectiveness and
value of the pharmacist clinician.35-56
These findings, along with the development of
increased and improved automated systems, and the move to the entry-level Doctor of
Pharmacy (Pharm.D.) degree, have prompted some medical organizations and
governmental bodies to strongly support the expanded role of pharmacists.25
Official
24
recognition via increased pay, and/or ability to receive reimbursement for services,
has been offered by others.25, 57, 58
Becoming board certified in Pharmacy is a rigorous and involved process.8 It
is also voluntary and perhaps lacks a tangible reward. In the practice of Medicine,
and in some other health care disciplines like nursing, board certification may not be
required but is highly desired for practice. Reimbursement and/or accreditation
processes may also be tied to the number of board certified practitioners, especially
physicians, in a practice or area. Although not required, there are a number of
factors, as well as a perceived value of those motivating influences or factors, which
may motivate pharmacists to pursue board certification. It is reasonable to expect that
the number of pharmacists seeking board certification is related to these factors and
their perceived values. Studies assessing associated expectations and values of
pharmacists pursuing board certification were not found in the literature.
Although some professional groups and societies have suggested board
certification by pharmacists as a necessary credential for acceptance as a peer
practitioner,25
the number of pharmacists seeking board certification in the various
specialties is relatively small. From 1995 to 2006 the numbers of board-certified
Pharmacy specialists has grown from 1649 to 4940, a three-fold increase.59
This type of percentage increase would seem to be impactful. But during this
same period it was estimated that fewer than 5% of practicing pharmacists had sought
any advanced practice certification.9, 33
Of the currently licensed pharmacists, precise
percentages of those seeking certification is difficult to determine due to the lack of
records of numbers of all practitioners and/or possible overlapping practice areas, e.g.

25
pharmacotherapy and nutrition support. As in any health care discipline, becoming
board-certified represents an additional amount of effort on the part of the candidate
beyond licensure.
The requirements for becoming certified in a Pharmacy specialty area are
multi-faceted. Typically it requires many hours of training and experience (which
might be gained in several ways including supervised work experience, postgraduate
academic programs, certificate training programs, residency, etc.) and successful
completion of a rigorous written exam.8, 9, 60
Once a pharmacist has obtained
certification, recertification by written exam is required every seven years.8, 60
One
question this study sought to answer was what would motivate a pharmacist to exert
the time, energy, and money to obtain this certification, given the fact that it was not
required for him or her to obtain or maintain employment?
In the case of the physician or the nurse-practitioner, the motivating factors
are more obvious. They may seek certification as a condition of practice, and they
can therefore expect to practice under the umbrella of their sanctioning organization.
They can also expect to reap the benefits, e.g. enhanced professional stature or
abilities to provide services for certain health insurance or third-party payment
providers that require such certification, such a level of achievement affords.
However, they are also proceeding with the knowledge of what they would not be
able to do without that certification. This latter limitation may be imposed by the
sites where they practice or by regulations in their area of practice.
Since board-certification in Pharmacy is not currently required, the pharmacist
must recognize or perceive that there are benefits of board certification. One survey in
26
1996 of 733 BPS certified specialists sought to measure the tangible and intangible
benefits that BPS certification might bring to the pharmacist. Of the respondents,
90% practiced Pharmacy within their specialty. Cited as their reason for pursuing
board certification were 1) to test their competence (65.5%); 2) increase marketability
(49.6%); and 3) to increase their acceptance by other health care professionals
(34.3%).61
A small number noted financial or career boosts that resulted from the
certification. A prior survey in 1989 of board certified pharmacists found 72% of
respondents listed self-recognition and acceptance as their principal satisfactions.61
This same group reported the least satisfaction related to employers. It is not
immediately obvious as to whether their employers attached any value to their status
because respondents were able to answer with multiple responses. Other studies have
found that some financial reward, e.g. slightly higher compensation, may exist for
certain specialists like those certified in pharmacotherapy. BPS surveyed 1141 board-
certified pharmacists in 2002. Less than 5% reported that certification was required
for their job, although 31% listed it as preferred by their employers. This study found
that there was some employer recognition. However, only reports of public
recognition (21%), financial reimbursement for certification (33%), and financial
reimbursement for recertification (24%) managed to exceed the 20% mark.61
In the 2004 on-line survey of BPS-Certified Specialists, represented in Table
2-1, some changes were noted. Specifically 31% of total respondents reported no
formal employer recognition which could mean that 69% did. This demonstrates a
slight decrease from 2002 where 333 out of 1135 respondents (29%) reported no
recognition, so 71% were apparently recognized in some way. Other attestations of

27
Table 2-1. Tangible and Intangible Benefits that BPS Certification May Bring to
the Pharmacist as Reported in BPS Online Survey Results 200463, 64
Survey Item Number of BPS responses
(Multiple Allowed)
Percentage of BPS
Respondents (N=1995)
Pay Certification Costs 686 34%
No Recognition 618 31%
Pay Recertification Costs 433 22%
Public Notice 325 16%
Hiring Priority 324 16%
Salary Increase 302 15%
Pay BPS Annual Fee 296 15%
Increased Responsibility 224 11%
Promotion Priority 137 7%
One-time Pay Bonus 98 5%

28
their accomplishments were spread among a variety of types of recognition and
respondents could answer with multiple responses. It should be noted that in the
surveys done in 1996, 2002, and 2004, respondents could choose as many
recognition types (responses) as they wanted, therefore the number of recognition
responses greatly exceeded the number of survey respondents.62
In this survey, 34% reported that their employer paid their certification costs
and 22% had their employer pay their recertification costs. Tangible or intangible
rewards for either hiring priority or public notice were tied at 16%. And 15% reported
a salary increase which was the same as those saying their employer paid their annual
BPS fee. Only 5% reported a one-time pay bonus. There may be some increase
occurring in willingness by employers to recognize and value the BPS certification,
but it appears to be minor compared to previous periods.63
What, then, would motivate a pharmacist to exert the time, effort and money
to obtain this certification, given the fact that it is not required for him or her to obtain
or maintain employment and that there may be few work-related rewards after
completion? A discussion of motivational theories may offer some direction in
answering that question.
Motivational Theories
Motivational theories are classically divided into two major categories. These
are content and process.10
Content theories are based on the assumption that all
individuals possess a given set of needs. Process theories stress the differences in the
individual’s needs and are more related to the human cognitive processes that create

29
differences. The four primary content theories are Maslow’s theory, The Existence,
Relatedness and Growth (ERG) theory, Acquired Needs theory, and Herzberg’s two-
factor theory.11
The three primary process theories are Equity theory, valence-
instrumentality-expectancy (VIE) theory, more commonly called Expectancy theory,
and Goal-Setting theory.10
Additionally, Reinforcement theory, also commonly
classified into process theories, seeks to explain the role of rewards and how those
rewards may lead to changes in behavior. These basic types of theories vary in their
scope. Some of these theories seek to explain human behavior while others are
focused entirely on workplace motivation. Simply put, content theories seek to
explain what motivates us, process theories seek to explain why and how we are
motivated, and reinforcement theory, a subset of process theories, seeks to explain
how outcomes influence behaviors. For the purposes of this discussion psychological
theories related to organizational motivation and job satisfaction alone are omitted in
favor of focusing on those theories that may have application to personal motivation.
To better understand what factors may be affecting pharmacists in their decision to
pursue or not to pursue board certification a review of each of the theories mentioned
above follows.
Content Theories – Maslow’s Hierarchy of Needs
Some theories of motivation propose a hierarchical approach to explaining or
describing a transitional approach to motivation. Abraham Maslow was a pioneer in
this type of approach and indeed one of the early promoters of the field of self-
actualization65
. His initial work in 1943 synthesized many fragments and smaller

30
theories into a more cohesive framework. This was later updated by Maslow and
Lowery in 1998 to explain “growth levels” and again in 1971 to identify some more
differentiation at the higher levels formerly titled “self-actualization”.65, 66
The final
components of Maslow’s work from 1943-1971 demonstrate a pyramid of effects that
posit that humans go through a progression of states to reach the higher levels. The
stages, listed from the lower to the higher are:11, 65
1. Physiological Needs (hunger, thirst, sexual, comforts, etc.)
2. Safety Needs (security, out of harm’s way, no fear, etc.)
3. Belongingness and Love Needs (being accepted, approval of peers)
4. Esteem Needs (achievement, accomplishment, etc.)
5a. Cognitive Needs (to know, to understand, to explore, etc…)
5b. Aesthetic (symmetry, order, beauty, etc.)
6a. Self-actualization (self-fulfillment, realization of potential, etc.)
6b. Self-transcendence (connection to a greater good, assisting others with
self-fulfillment, self-actualization or self-transcendence)
These values are traditionally arranged in a pyramid, with the higher numbers
at the top of the pyramid and the lower numbers at the bottom, and is often called
Maslow’s “pyramid of needs”. This theory has been widely reviewed and accepted
by many despite a lack of empirical evidence that any of the segments are in fact
distinct, or that the progressions must occur linearly. Some suggest that Maslow’s
concepts of self-actualization and transcendence are perhaps the most important
contributions to the study of human behavior and particularly motivation.65
Others

31
have attempted to modify and improve upon Maslow’s work and these are discussed
below.
Content Theories – ERG (Existence, Relatedness, Growth) Theory
Clayton Alderfer took the results of studies done on Maslow’s work and
developed a similar and comparable structure, albeit more simplified. He called this
the existence, relatedness and growth (ERG) theory.11, 67, 68
Contrary to hierarchical,
i.e. progressive nature of the component sections of Maslow’s pyramid, Alderfer
posited that existence, relatedness and growth needs existed simultaneously and may
vary for each person.11, 67-69
An important contribution from the ERG theory is that it
was recognized that a frustration-regression principle could occur, i.e. if a person did
not achieve a higher level and remained unfulfilled then that individual might regress
to an easier and more comfortable level. This is an important concept as it speaks to
positive and negative work place motivation.11, 69
Content Theories – Acquired Needs Theory
David McClelland proposed that a person’s needs are acquired over time.
These needs are specific to the individual and are shaped by experiences in life. The
needs fall into three categories which are the need for achievement (nAch), the need
for power (nPower) and the need for affiliation (nAff).11, 68, 70
The need for
achievement should increase the desire to do things better, work more efficiently,
solve problems, master complex tasks or other measures of measurable achievement.
Persons high in nAch prefer to work alone or with other high achievers and take

32
personal ownership of results. They prefer achievable goals and will seek things that
are challenging as long as they are perceived as doable. Regular feedback is
important to this group. 11, 68, 70
There are two types of power addressed with the nPower category. These are
social or institutional power and personal power. Persons with high personal nPower
are likely to be controlling of other persons by influencing their behavior and perhaps
will become responsible for the work of others. This trait is generally perceived as
undesirable. Those with high social nPower use organization as a means to further
their goals, which are generally the goals of the social group. This trait is generally
perceived as desirable and is in fact a sought after trait for managers within
organizations.11, 68, 70
The third category of needs is nAff. This speaks to the need for
affiliation. Individuals with high nAff tend to work toward creation of harmonious
relationships and seek to establish and maintain relationships. People with high nAff
will generally conform to the needs of their work or social group.
McClelland developed a test called the Thematic Apperception Test (TAT).
The TAT is a test of imagination and is based on ambiguous pictures and the
subject’s ability to spontaneously develop a story about each picture. Scoring with
this instrument has been refined to test individuals to determine types of jobs for
which an individual may be best suited.70
Content Theories – Herzberg
Frederick Herzberg studied employees in the workplace to determine factors
leading to satisfaction and dissatisfaction. He published his findings in 1959 in The
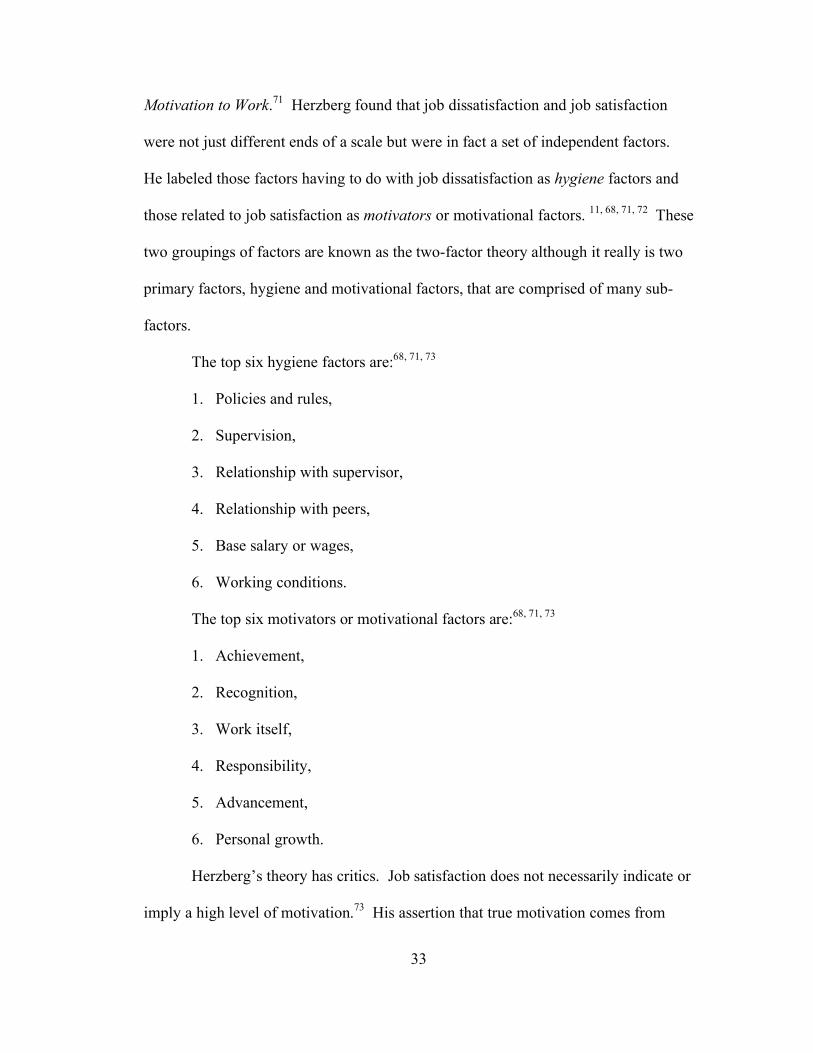
33
Motivation to Work.71
Herzberg found that job dissatisfaction and job satisfaction
were not just different ends of a scale but were in fact a set of independent factors.
He labeled those factors having to do with job dissatisfaction as hygiene factors and
those related to job satisfaction as motivators or motivational factors. 11, 68, 71, 72
These
two groupings of factors are known as the two-factor theory although it really is two
primary factors, hygiene and motivational factors, that are comprised of many sub-
factors.
The top six hygiene factors are:68, 71, 73
1. Policies and rules,
2. Supervision,
3. Relationship with supervisor,
4. Relationship with peers,
5. Base salary or wages,
6. Working conditions.
The top six motivators or motivational factors are:68, 71, 73
1. Achievement,
2. Recognition,
3. Work itself,
4. Responsibility,
5. Advancement,
6. Personal growth.
Herzberg’s theory has critics. Job satisfaction does not necessarily indicate or
imply a high level of motivation.73
His assertion that true motivation comes from

34
within the individual however does seem to be an overarching take-away from his
perhaps difficult to confirm factor interactions.
Process Theories – Equity Theory
Equity theory, also known as Adam’s Equity Theory, developed by John
Stacy Adams in 1963, is based on a perceived sense of equity, i.e. people are happiest
in relationships where the inputs they bring to a job and the outcomes that they
receive from those inputs are the same as that of others .11, 68, 74, 75
Equity theory also
has application to personal relationships where the give and take aspects of the
relationship must be perceived to be equitable or dissatisfaction or distress will occur.
Whether focused on personal relationships or job satisfaction, equity theory proposes
that motivation that comes from the outcomes or outputs from the company, project,
or task must have tangible and intangible aspects that are in balance with the
inputs.11,68, 75
In essence, the referents for comparison are our friends, colleagues,
family, competitors, workplace superiors and inferiors, and it is by these that equity is
evaluated.
Critics of Equity theory argue that the model is too simple to explain many
real world interactions of complex factors.75
A reasonable summary of Equity theory,
as it could have application to this study, is that individuals could equate value of
rewards to effort and compare those values to other people, in effect making
motivation perhaps based on competition.11

35
Process Theories – Goal-Setting Theory
Goal-Setting Theory was developed by Edwin Locke. It is based on a simple
premise. Properly set and managed goals can be motivating. Goal-setting theory has
four major components which are difficulty, specificity, acceptance and
commitment.4, 11, 76, 77
This theory focuses on specific motivations that are task based.
Feedback and reward are principal aspects of this theory. Feedback is important to
reinforce progress made toward goals. Reward is anticipated and interim rewards
often are defined as goals building toward a larger goal. The realm of sports is an
area where goal setting theory has application. It is also the underpinning for the
modern management by objectives (MBO) tool common in the business world.11, 68, 78
Goal setting theory as an abstract concept could have an explanatory value for
individual motivation to achieve things. No sound mathematical model to evaluate
different interactions and relative weights to the different types of goal and rewards
based on this theory was found in the literature.
Process Theories – Expectancy Theory
Expectancy theory is covered in detail later as it is the basis for the survey
instrument design and metrics for this study. It is classified as a process theory but it
also brings together many aspects and elements of both content and process theories.
Process Theories –Reinforcement Theories/Operant Conditioning
B.F. Skinner proposed the concept of operant conditioning which is now
commonly referred to as Reinforcement theory. This theory explains the role of

36
rewards, or reinforcements, as they cause behavior to change or remain the same over
time. Since rewards can be both positive and negative within this theory
consequences and rewards are sometimes used interchangeably.11, 68
There are four operant conditioning strategies according to this theory. They
are positive reinforcement, negative reinforcement, punishment and extinction.
Two are intended to strengthen a behavior. Positive reinforcement is the
process of the getting something for doing something paradigm. Frequency or quality
of a behavior then is increased as consequences of that behavior are rewarded.
Negative reinforcement is the process of strengthening a behavior by the removal of
some undesired consequence. Frequency or quality of a behavior is increased as
negative consequences, also called stressors, diminish.
The other two operant conditioning strategies are intended to weaken a
behavior. Extinction is the process of getting nothing for doing something. Extra
effort means no additional rewards or basically no reward period. Extinction
decreases the frequency or quality of a behavior. Punishment is the process of being
punished for a behavior. If you do an undesired behavior there will be a
commensurate punishment or removal of a pleasant consequence.68
In addition to the operant conditioning strategies there are two types of
reinforcement schedules. The first of these is the continuous reinforcement schedule
where each time a desired behavior is performed there is reinforcement or reward.
The second is the intermittent reinforcement schedule. This schedule has fixed and
variable categories. These categories are the fixed-interval schedule, fixed-ratio
schedule, variable-interval schedule and the variable-ratio schedule. The fixed
37
interval schedule provides reinforcement after some predefined time period has
elapsed. The fixed-ratio schedule provides reinforcement after a predefined number
of desired actions or responses. The variable-interval schedule provides
reinforcement after varying amounts of time have elapsed and the variable-ratio
schedule provides a reward after varying amounts of correct responses or actions have
occurred.11, 68
Reinforcement theory has some place in understanding individual motivation
from an abstract aspect. It does explain the concept of reward for behavior or lack of
reward for no desired activity. It is probably better suited for an organizational
approach to motivation than one to describe individual motivation.
For the purposes of this study it was desired that pharmacists’ perceptions at
some point in time be measured and operant conditioning theory works better to
describe overall behavior over some time period.
Expectancy Theory as a Basis for Survey Design
Valence-instrumentality-expectancy (VIE) theory, as noted above, is a major
theory of motivation and work behavior. It may also be called Expectancy-Valence
(EV), instrumentality theory, and path-goal theory. The three major variables are
expectancy, instrumentality and valence (value)10
so VIE is commonly used as a title
for this theory. It is a process theory in that it seeks to identify the relationship
between the variables in a dynamic state as they affect individual behavior. Vroom,
the initiator of VIE theory postulated that what was crucial to motivation at work was
38
the perception of a link between effort and reward. In this theory, the relationships
between the inputs are more the focal point than the inputs themselves.12
Expectancy theory has applicability to the evaluation of motivation for
pharmacists choosing to pursue board certification. The purpose of this theory is to
evaluate possible connections between expectations of effort to performance,
instrumentality of the performance to outcomes, and the valences (or values) that
individuals ascribe to those actions. It also addresses instrumentality as the perceived
probability of a performance leading to a desired outcome. Instrumentality is
therefore sometimes also called cognized instrumentality.12
It may seem intuitive that financial inducements would increase interest in the
pursuit of Pharmacy practice specialization, but at what point does this occur? While
this may seem reasonable, there is no definitive evidence that financial rewards are
the critical or most significant motivating factor. Other factors related to career,
personal concerns, and professional standing may have an equal or greater impact on
decisions. More likely, combinations of factors within these four proposed domains,
and potentially the interactions among the domains, may be involved with the
motivation to pursue or not pursue board certification for pharmacists.
There are two key concepts at the base of Expectancy theory. The first is that
“…the valence of an outcome to a person is a monotonically increasing function of
the algebraic sum of the products of the valences of all other outcomes and his
conceptions of its instrumentality for the attainment of these other outcomes.”12
This can be expressed mathematically as:12
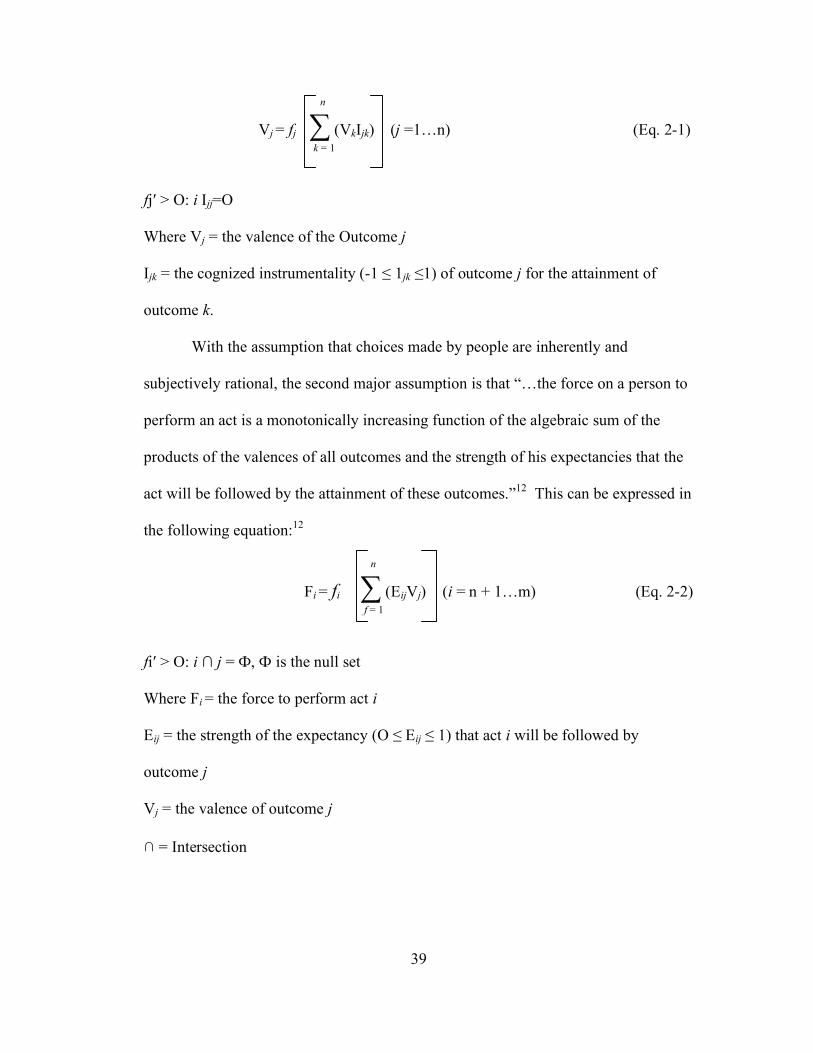
39
n
Vj = fj (VkIjk) (j =1…n) (Eq. 2-1) k = 1
fj > O: i Ijj=O
Where Vj = the valence of the Outcome j
Ijk = the cognized instrumentality (-1 1jk 1) of outcome j for the attainment of
outcome k.
With the assumption that choices made by people are inherently and
subjectively rational, the second major assumption is that “…the force on a person to
perform an act is a monotonically increasing function of the algebraic sum of the
products of the valences of all outcomes and the strength of his expectancies that the
act will be followed by the attainment of these outcomes.”12
This can be expressed in
the following equation:12
n
Fi = fi (EijVj) (i = n + 1…m) (Eq. 2-2) f = 1
fi > O: i j = , is the null set
Where Fi = the force to perform act i
Eij = the strength of the expectancy (O Eij 1) that act i will be followed by
outcome j
Vj = the valence of outcome j
∩ = Intersection

40
This equation can also be written more simply as:
n
F = (EiVi) (Eq. 2-3)
t = 1
The value Ei has two components. One is the effort-to-performance expectancy (E
P). The second is the performance-to-outcome expectancy (P O) which is also
known as instrumentality.72, 79
This can be mathematically expressed, in VIE terms,
as:12
F = (E P) x (P O) (V) (Eq 2-4)
Where, (E P) =Expectancy, (P O) = Instrumentality, and V =Valence (Value).
From the example shown in Figure 1-1, and utilizing the derived formula in
Equation 2-4, the value of the motivational force to pursue a position, certification or
additional qualification (or effort that is willing to be expended) can be calculated by
adding the values of the valence and the instrumentality calculations (products) and
multiplying the total by the expectancy value.
If we review the data from Figure 1-1 we find that the values discussed and
represented as decimal equivalents were:
• Expectancy = 0.5
The performance-to-expected reward instrumentalities were:
• Performance to pay raise = 0.9
• Performance to promotion = 0.5
• Performance to longer holiday = 0.3

41
• Performance to company car = 0.6
Valences or values were:
• Pay raise = 6
• Promotion = 8
• Longer holiday = 5
• Company car = 9
The instrumentality and valence products summed are:
(0.9 x 6) + (0.5 x 8) + (0.3 x 5) + (0.6 x 9) = 16.3. With the result multiplied by the
expectancy of 0.5 this yields 8.15 based on 16.3 x 0.5.10
The decimal equivalents are
typically seen but the whole number equivalent can be used as well. The only change
to the result is the order of magnitude. For example, using the numbers just listed but
substituting whole numbers we see (9 x 6) + (5 x 8) + (3 x 5) +(6 x 9) = 163, and
163 x 5 = 815. So the formula is reduced to the sums of instrumentality multiplied by
the value sums and then multiplied by the expectancy, or Motivation = Expectancy x
Instrumentality x Value (M = E x I x V).
In the classical use of the expectancy theory formula, zero values are allowed
but the expectancy (expectancy-to-performance, E P), instrumentality (P O,
performance-to-outcome, valence (value) must all have at least one value greater than
zero or the resultant calculation leads to zero.
This is the numerical representation of the force of motivation. With a
numerical result calculable, the potential to mathematically compare various persons
or groups exists. Rather than relying on complex statistical comparisons a rapid
mathematical comparison of motivational force and categorization can be performed.

42
The result of the VIE calculation has no independent value. However, results
of multiple VIE calculations, which are measures of motivational force, have
comparative value. It was for this reason that a survey instrument was developed
based on this mathematically based theory and that the methodology described in the
next chapter utilizes it as underpinning for the study.
43
Chapter 3. Methodology
Purpose
The primary purposes of this study were to: (1) compare the benefits and
rewards (instrumentalities) that are perceived as most important by pharmacists with
regard to board certification by BPS, (2) compare the most valued aspects or factors
perceived by pharmacists with regard to board certification, (3) evaluate the
relationship between instrumentalities and values, (4) determine if a certain set of
factors was more prevalent in board certified pharmacists than those that were not,
(5) compare the calculated force of motivation between board certified and non-board
certified pharmacists and, (6) evaluate if there was a tipping point where a certain
combination of factors would be present in board certified pharmacists that were
greater than non-board certified pharmacists. This latter point was defined as a
marked difference in overall score on the VIE scale, or calculated force of motivation
(MF), on the survey instrument.
Research Design
This research was designed as a prospective internet survey employing an
exploratory descriptive design. Participants that agreed to participate in the study
were asked to respond to a series of survey items related to probability of occurrence
of an event stated and the importance or value to them of that event or action.
Additionally, the respondents were asked a question regarding their anticipated
44
success rate given that the effort was put forth. The survey instrument was unique in
design in that multiple levels of answers to the same statement were required.
Summary and descriptive statistical measures were used to evaluate means,
variance and other related aspects of the study population. The primary statistical
marker was the Student’s t-test80
as a comparative measure for all variables between
pharmacists that were board certified and those that were not. For the purposes of
this study a significance level of p < 0.05 was established. Included in this evaluation
was a determination of a threshold level, i.e. the level that motivational force,
measured as an overall score based on the collective individual scores, caused
individuals to take action.
A survey instrument titled “Advanced Certification Index for Pharmacists”
(ACI-P) was developed for this study. There were three levels of items to be
addressed via the survey instrument. These were instrumentality, valence and
expectancy. Instrumentality is an individual’s anticipated probability of an event
occurring. Valence, also known as value, is a measure of the value or importance to
the respondent of that particular item, question or statement. Expectancy is a measure
of the respondent’s belief that an action or series of actions will lead to a successful
outcome. In this case the outcome was attainment of specialty certification in one or
more of the five identified Pharmacy practice specialties.
The survey instrument design used an a priori determination of domains as a
means to fashion the item sets. The intent of this research was not to prove or
substantiate those domains but rather to evaluate the item sets and compare the
generated responses.

45
Settings and Subjects
The study was completed via the internet. Respondents hailed from various
practice settings including private pharmacies, hospitals, academia, specialty
pharmacies, government, and large chain/company owned pharmacies. Due to the
fact that specialty certification may not have been a job requirement in a majority of
settings, but may have been in others, the practice setting of the individual may have
contributed to the individual’s opinions. Access to computers and assurance of
anonymity of the respondent was important. The study setting allowed for remote
access, i.e. home, library, or other portal into the data collection mechanism. The
internet protocol (IP) address for the computer used by the respondent was not
captured. This can be captured automatically by survey tools but was deliberately
omitted for the purposes of this study to assure anonymity of respondents.
The study group included currently BPS board certified members from the
five specialties, those that were not currently board certified, and those that had never
been board certified that were members of one or more of the American Society of
Health-System Pharmacists (ASHP), American Pharmacists Association (APhA), the
American College of Clinical Pharmacy (ACCP), the American Association of
Colleges of Pharmacy (AACP) and the Board of Pharmaceutical Specialties (BPS).
Former board certified pharmacists that had not renewed their certification were
considered for the comparison and their responses were included with the ones that
were not board certified. Information that was gleaned from this research will be
shared with the Board of Pharmaceutical Specialties and other professional
organizations as summary information only.

46
Inclusion Criteria
All pharmacists practicing in any practice setting were eligible to participate.
The focus was directed toward members of APhA, ASHP, ACCP, AACP and BPS.
However, since dissemination of the survey link was also to non-members of any of
these organizations, via word of mouth or secondary electronic transmission to
colleagues, any practicing pharmacist was eligible to participate whether a member of
an organization or not.
Exclusion Criteria
Non-pharmacists were not to complete the survey and if they did their data
was excluded.
Sample Size
To determine a sample size needed for the study a technique was established
as the primary statistical method for evaluation. This was the Student’s t-test. Using
a methodology developed by Cohen known as the Cohen’s “d”, sample size estimates
were made.81
The Cohen’s d procedure for sample size determination is adequate
even when the standard deviation (sigma) of a population is unknown. These
estimates or projections were made based on an unknown sigma on two independent
means. Effect size, as defined by Cohen, is the difference in means between two
groups divided by the standard deviation.81
Interpretation of the Cohen’s d allows a
differential when comparing statistical significance versus practical significance. One
way of looking at the comparison of effect size is to consider d = 0.0 to 0.2 as a trivial

47
effect size, d = 0.2 to 0.5 as a small effect size, d = 0.5 to 0.8 a moderate effect size
and d > 0.8 to be a strong effect size. Or, more commonly, 0.2 = small effect, 0.5 =
moderate effect and 0.8 = strong effect.81
In other words, if one expects a more easily
discernible effect (a strong effect) a 0.8 would be the choice and if one were to expect
the effect to be small then the 0.2 would be the choice for the Cohen d classification.
Using tables based on Cohen’s d, three sample size potentials were found and
are listed in Table 3-1.
Since there were no assumptions about the effect size that could be expected,
a sufficient sample size was projected to determine the smallest possible effect size so
790 was the projected sample size with at least 395 occurring within the board
certified group and at least 395 occurring in the non-board certified group. To
account for incomplete or missing data, actual projections were escalated by 20%
higher than these numbers, therefore it was estimated that 474 (1.2 x 395) would be
needed for each group. To attain the large numbers needed for this study four of the
large Pharmacy organizations and the Board of Pharmaceutical Specialties were
requested to contact their membership electronically and solicit participation.
Exploratory factor analysis and parallel axis analysis were used to evaluate
like factors and determine the underlying constructs, or commonly associated items,
within the data. It must be pointed out that although confirmation of stated or
particular factors can be useful for many survey instruments, the purpose of this
research was not to prove or disprove the a priori proposed domains, and therefore
confirmatory factor analysis was not attempted. These a priori domains were helpful
in creation and stratification of the questions for the survey instrument.
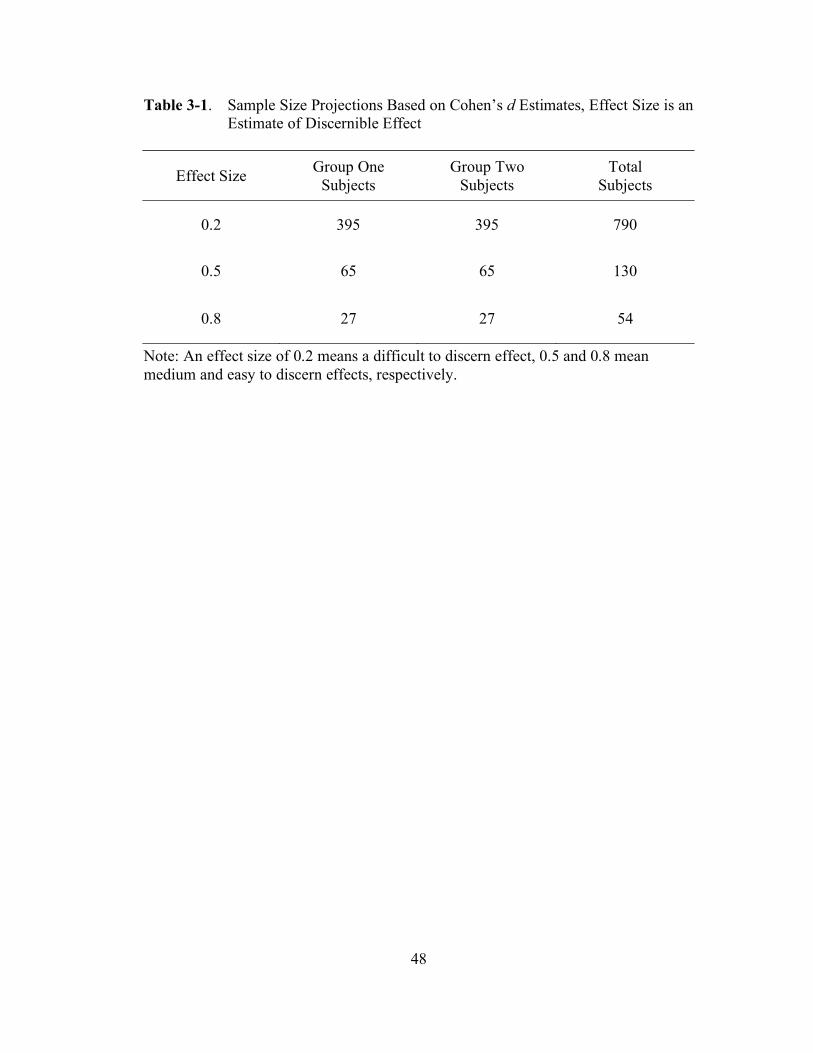
48
Table 3-1. Sample Size Projections Based on Cohen’s d Estimates, Effect Size is an
Estimate of Discernible Effect
Effect Size Group One
Subjects
Group Two
Subjects
Total
Subjects
0.2 395 395 790
0.5 65 65 130
0.8 27 27 54
Note: An effect size of 0.2 means a difficult to discern effect, 0.5 and 0.8 mean
medium and easy to discern effects, respectively.

49
To calculate a sample size for exploratory factor analysis or parallel analysis,
in order to evaluate relationships among the questions on the survey, ten responses
per question were necessary. Much debate in the literature has focused on an
appropriate subject-to-item ratio with the lower level seen at 2:1 and the upper end at
100:1. However, 63% of studies evaluated have used 10:1 or less with the 10:1 ratio
still considered a prevalent rule of thumb for a priori evaluations of sample size.82-84
With a survey totaling 51 items, not including demographics, that translates to a
sample size of 510 subjects. However, since there are 25 question sets each of the
subsets could be considered an independent set for the same issue which means only
260 responses would be necessary. This included the additional question regarding
expectancy (25 + 1 x 10 = 260).
Some assumptions of data lost similar to those mentioned under the Cohen’s d
projection were factored in to increase the projected need of 260 by 20% to 312 total
respondents needed. However, utilizing the small effect calculation via Cohen’s d, a
sufficient sample size would have been attained for factor and parallel axis analysis.
Sample Description
The investigator obtained demographic information that was completed by the
respondents. The demographic information included age, gender and an additional 13
items summarized from the five separate board certification tests currently in use by
the Board of Pharmaceutical Specialties for their Pharmacy Examination
Demographic Survey, which accompanies the component of the Certification
Examination for Board Certification in any specialty area in Pharmacy.85
The
50
demographic responses were not required of the respondent although this information
was requested to compare findings of this survey with those done previously by BPS.
The demographic findings and relationships were pertinent but were not a focal point
of the study.
The included items in the demographic and BPS survey alignment for this
project, minus the responses, are listed below. These retain original wording where
possible from the BPS surveys. The demographic and BPS survey alignment section
followed the primary questions on the survey.
1. Age.
2. Gender.
3. What is your current board certification status? List all that apply.
4. What is the CITY of your PRIMARY practice setting?
5. What is the STATE, TERRITORY or LOCATION (e.g. international
work location) of your PRIMARY practice setting?
6. Which of the following most closely classifies your position at your
primary practice setting? Multiple answers are allowed but please limit to
two.
7. What is the average number of hours you typically work each week in the
practice of Pharmacy?
8. What was your ENTRY LEVEL Pharmacy-related degree?
9. What is the HIGHEST Pharmacy-related degree you have earned?
10. If you earned a Pharm.D. degree, please indicate the TYPE of Pharm.D.
program.
51
11. Have you completed a residency training program?
12. In total, how many years have you worked full- and/or part-time as a
licensed pharmacist?
13. In total, how many years have you worked full- and/or part-time in your
current area of specialty or practice focus?
14. Indicate your PRIMARY reason for seeking board certification.
15. Indicate a SECONDARY reason for seeking board certification.
16. List Pharmacy organizations to which you belong.
Additionally the respondents were asked to respond to twenty-five different
sets of two questions or statements. These two set questions were divided into PVI
groups (PVIGs). For each instrumentality response statement, the part “a” of the
statements/questions (items) addressed the instrumentality related to that factor or
aspect. This was the probability of that factor or aspect occurring as perceived by the
respondent. Part “b” of the item set was related to the value (valence) an individual
held for that particular aspect. The item sets were numbered and had a part “a” and
“b” to reduce confusion. They were organized in such a way that, except for question
26 and higher, each was a set involving an instrumentality question (probability of
occurrence) and valence (value) component, in that order.
High instrumentality does not indicate high valence and low instrumentality
does not indicate low valence. The opposite may well be true.

52
Instrumentation
The survey instrument titled “Advanced Certification Index for Pharmacists”
(ACI-P) which was developed for this study records three primary response types
within the context of the design. All responses were answered using a Likert type
five-point scale with the lower end identified as “Will definitely not occur” and the
upper end identified as “Will definitely occur” on the instrumentality (perceived
probability) questions. The value (valence) questions had a scale with the lower end
identified as “No value” and the upper end as “Highly valuable”. Each lower end
was treated statistically as a “1” and each upper end was treated as a “5”. Both scales
had an identified neutral point. The utilization of these scales shaped the VIE theory-
based instrument into a non-zero environment, which means that zeros, which can
cause problems with the calculations, were eliminated. Also, since it was posited that
the absolute value of the VIE calculation had no true definition or baseline, relative
metrics were more important. By using a non-zero scale and using the whole
numbers of the 5-point scale a useful scoring methodology was employed.
With all demographics and ACI-P specific questions the total number of items
was sixty-seven (16 + 51 = 67). This was a lengthy survey but could be completed in
about 15 minutes utilizing the on-line/internet format. Demographic questions were
included at the end of the survey to prevent possible survey fatigue from interfering
with the most needed responses from the instrumentality and valence sections.
The ACI-P was modified to fit an internet-only approach. This is discussed in
more detail below under Internet Survey.

53
The instructions for the ACI-P Survey Tool were listed on page one of the
web survey tool. They read:
This survey seeks your opinions on the factors that may influence a pharmacist’s
decision to seek board certification in a Pharmacy specialty. The survey should take
no more than 15 minutes.
Your input is important whether you have no intention of pursuing board
certification in Pharmacy practice, intend to pursue in the future, have already
completed the certification or were previously board certified.
This survey is based on two components of each factor that may be related to pursuit
of specialty certification in Pharmacy practice. These components are: 1) the
probability of occurrence as you perceive it, and 2) the value of that particular factor.
Definitions:
For the probability of occurrence (the first part of each question) the scale is a
measure of perceived probability with the lower end “Will not occur” being the
lowest probability of occurrence and “Will definitely occur” being the highest.
For the value assessment, the lower end value of “No value” means the lowest value
to you as a pharmacist and “Highly valuable” means the highest value to you. Please
check the corresponding bubble for each selection.
All questions are related to pursuit and achievement of board certification in
Pharmacy by the Board of Pharmaceutical Specialties. An asterisk (*) next to a
question means a response is required and only applies to the first 26 questions.”
Additional Information:
There are 16 demographic questions at the end of the survey that will be used in
comparing this information with what has been collected by the Board of
Pharmaceutical Specialties in previous surveys.
This study has been approved by the University of Tennessee Institutional Review
Board. There is no consequence for refusing to take the survey or any direct benefit
to you other than professional value to Pharmacy in general. Your identity will not
be disclosed and no relational information regarding your demographics information
will be attempted. The scope of this study is to characterize aggregate trends and not
those of an individual. Summary data only will be made available to Pharmacy
organizations. The results of this survey may be presented at a professional meeting,
become published or become part of a Ph.D. dissertation.
Consent for Participation:
This survey is voluntary. By proceeding with this survey I consent to participate.
The questions on the survey were arranged so that each value (valence)
question was listed at the same time on the computer screen with the instrumentality
(perceived probability of occurrence). These were the Perceived Valence

54
Instrumentality groups (PVIGs) described above and were important considerations
for data evaluation. Some value questions were so basic to the human condition that
it was expected that most of the responses would be on the high end. However others
were expected to have considerable variance. Not aligning the benefits to the
pharmacist with highly regarded values could be problematic and where they do not
align was an important finding of the study. For this reason one variable within the
PVIG analysis was the result of subtracting the instrumentality from the value.
The questions were designed based on a priori proposed domains. These four
proposed domains were professional, personal, career and financial with the
understanding that the lines of distinction between these were not clearly defined and
that these domains may not have existed as separate constructs. Item to domain
relationships were proposed and are listed in Table 3-2. The domains were not
equally represented by numbers of items and career and financial aspects were the
two most highly represented of the domains. It was thought that these may be more
influential and more items were added in these sections to more fully characterize
these elements.
Item sets were arranged with specific Perceived Value Instrumentality groups.
The PVI groups and survey questions are listed below. The Perceived Valence
Instrumentality groups are helpful to understand some discussions in Chapter 4. The
PVI group headings are listed with the designated item group as follows:

55
Table 3-2. Proposed Domains of ACI-P, Questions within Domains and
Percentages of Total
Domain Item Sets Percentage of Total
Professional 4,5,11,16,24 5/25=20%
Personal 1,10,17,18,23 5/25=20%
Career 2,6,7,8,13,19,22,25 8/25=32%
Financial 3,9,12,14,15,20,21 7/25=28%
Expectancy 26 N/A

56
1. Self image
a. My self image will be improved by becoming board certified.
b. I value my self image.
2. Employable
a. I would become more employable if I were board certified.
b. I value becoming more employable.
3. Higher salary
a. I will receive a higher annual salary if I am board certified.
b. I value a higher annual salary
4. Professional opportunities
a. My professional opportunities will improve with board certification.
b. I value professional opportunities.
5. Peer respect
a. I will have increased peer respect by becoming board certified.
b. I value peer respect.
6. Career advancement
a. My career will be positively advanced by becoming board certified.
b. I value career advancement.
7. Academic opportunities
a. My academic opportunities will improve if I am board certified.
b. I value academic opportunities.
8. Downsizing protection

57
a. In a workplace that is downsizing, board certification will protect my
job
b. I value a protective effect from downsizing.
9. Initial costs
a. My initial certification costs will be paid by my employer.
b. I value my initial certification costs being paid by my employer.
10. Credibility
a. Board certification credentials will add credibility to my opinions.
b. I value credentials to improve my credibility.
11. Professional respect (Colleagues)
a. Other practitioners within my profession will respect my board
certification status.
b. I value professional respect from my colleagues.
12. Annual salary increases
a. If I am board certified I will receive higher annual salary increases.
b. I value higher annual salary increases.
13. Hiring influence
a. I would hire a board certified practitioner over another non-board
certified practitioner with otherwise equal qualifications.
b. I value board certification enough to positively influence a hiring
decision between candidates with otherwise equal qualifications.
14. Financial incentive to SEEK board certification
58
a. Increased financial incentive from my employer would cause me to
SEEK board certification status.
b. I value a financial incentive from my employer based on SEEKING
board certification.
15. Financial incentive to MAINTAIN board certification
a. Increased financial incentive from my employer would cause me to
MAINTAIN board certification.
b. I value a financial incentive from my employer to MAINTAIN board
certification status.
16. Non-professional co-workers’ respect
a. Non-professional co-workers will respect board certification status.
b. I value non-professional co-workers respect of board certification status.
17. Practice skills confidence
a. I will have increased confidence in my practice skills as a result of being
board certified.
b. I value increased confidence in my practice skills.
18. Personal accomplishment
a. I will feel a sense of personal accomplishment by becoming board
certified.
b. I value personal accomplishment demonstrated by a board certification
credential.
19. Increased responsibility
59
a. I will have increased responsibility in my job role after becoming board
certified.
b. I value increased responsibility in my job role.
20. One time bonus
a. I will receive a one time pay bonus upon completion of board
certification.
b. I value a one time pay bonus for completion of board certification.
21. Paid certification costs
a. My recertification costs will be paid by my employer.
b. I value that my employer would pay my recertification costs.
22. Promotion potential
a. I will be more likely to be promoted by my employer by employer if I
am board certified.
b. I value promotions based on board certification.
23. Public notification
a. There would be a public notification of my achievement and status if I
become board certified.
b. I value a public notification of my achievement and status.
24. Improved professional network
a. I would have an improved professional network by becoming board
certified.
b. I value an improved professional network.
25. Job requirement

60
a. Board certification will become necessary for my job.
b. I value that my job will require board certification.
The following information was included as directions preceding Question 26 -
Expectation.
“This section is based on your opinion of the likelihood of completion of
board certification upon expenditure of the effort. If you have no intention of
pursuing board certification in a Pharmacy practice specialty please answer question
26.a. Please answer N/A as needed.
26. Expectancy
c. I am NOT currently board certified but I feel that if I expended the effort
I would successfully complete the board certification process.
d. I AM currently board certified and PRIOR TO BEGINNING
preparation for specialty certification I felt that if I expended the effort I
would successfully complete the requirements for board certification.
e. I WAS formerly board certified and PRIOR TO BEGINNING
preparation for specialty certification I felt that if I expended the effort I
would successfully complete the requirements for board certification.”
Delphi Panel–Pilot Study
The ACI-P was presented to and evaluated by a Delphi panel-pilot study to
establish face and content validity. This panel was made up of the faculty at the
University of Tennessee College of Pharmacy and other faculty associated with the
University of Tennessee College of Pharmacy. There were twenty one respondents to
61
the survey. Eleven respondents were currently board certified, eight were never
board certified and two were previously board certified. No material changes were
made but two minor wording changes were made to the ACI-P survey instrument as a
result of the pilot study. The survey was deployed with an understanding that face
and content validity was established.
Study Procedures
Subject Identification
All pharmacists in the United States, whether board certified by BPS or not,
were subjects for this research. Since the survey was an internet based instrument,
access was limited by access to computers and the internet. Internet connection speed
may have also been a limiting factor for subjects. Pharmacy organizations,
particularly the Board of Pharmaceutical Specialties, American Society of Health-
System Pharmacists, American Pharmacists Association, American College of
Clinical Pharmacy and the American Association of Colleges of Pharmacy were
engaged by the investigator and encouraged to distribute the hyperlinks for the survey
site. Hyperlinks are imbedded computer codes that allow a user to activate those
links, which are uniform resource locators (URLs), by mouse or keyboard and be
immediately directed to a location which is defined by the link. See Appendix B to
view requests for participation and agreements to participate by the five participating
organizations.
62
Internet Survey
Enrollment was open and voluntary. At no time were the respondents asked
their name or any personal questions other than demographics. No tracking of the
location of the respondents was done and communication of the anonymity measures
of the survey information was included in survey instructions. The survey was
completed by internet at the respondent’s convenience. The automated approach may
have made the number of questions less intimidating as the length of the survey was
long but unknown to the participants at the outset. The design and completion of the
survey was completed by using the internet survey tools available at
SurveyMonkey.com.86
Data Analysis
Data collected for the study included:
A. Responses for items of the Advanced Certification Index for Pharmacists
(ACI-P) as previously described.
B. Demographics based on previous BPS surveys were collected. This was
for comparison purposes to previous studies and was not a primary
endpoint of the study.
Data were analyzed via standard statistical analysis which included Student’s
t-tests, correlational analysis, exploratory factor analysis, parallel axis analysis, and
internal consistency and reliability measures. Validation of the survey constructs of
the ACI-P instrument was completed with factor analysis and verified with parallel
63
analysis utilizing SAS. Reliability of the ACI-P constructs were established with the
Cronbach’s alpha reliability coefficient utilizing SAS.87
There were at a minimum six extreme subsets of the data predicted as far as
Instrumentality (Probability of occurrence) and Valence (Value):
a. High instrumentality x high value (sum of the products)
b. High instrumentality x low value (sum of the products)
c. Low instrumentality x high value (sum of the products)
d. Low instrumentality x low value (sum of the products)
e. Ambivalent instrumentality x ambivalent value (sum of the products
f. Large differences in value minus instrumentality (difference)
These of course could each be subdivided by various demographic differences
to achieve other subsets of the data. Most of the findings fell between these extremes.
The VIE calculation, minus the “E” part since it was the same value for any
individual respondent, became the Valence x Instrumentality score or the VI Score
(VIS). Perceived Value Instrumentality groups (PVI groups or PVIGs) provided four
different responses, two of which were directly reported and two of which were
calculated. Using “Self Image” as an example the following four variables were seen:
• Selfimage_P Probability (instrumentality). This was directly
reported.
• Selfimage_V Value to the individual. This was directly reported.
• Selfimage_VIS Instrumentality x value (VIS). This was calculated.
• Selfimage_Diff Value – instrumentality. This was calculated.
64
The intent of the study was not to prove or disprove VIE theory but rather to
compare groups to determine if there were differences in instrumentalities and
valences, as well as expectations, between practicing and qualified pharmacists that
were board certified and those that were not. The mathematical model of VIE
provided a framework to evaluate multiple and interactive forces and perceptions
simultaneously. Comparing currently board certified and non-board certified
pharmacists with these various mathematical findings, based on the VIE model,
demonstrated motivational factors and calculated motivational force for both groups.
Consideration of Human Subjects
This study was designed to determine the motivational forces leading certain
health care professionals, in this case pharmacists, to seek specialty certification in
their practice area. It was based on perceptions of benefits and beliefs of the
respondents. Since establishing forces leading to an unrealized or not yet attained
goal was too complex, a comparison of motivational force and motivating factors
between board certified and non-board certified pharmacists was completed.
Participating pharmacists were asked to provide information anonymously via an
internet portal. Participation in the study by the pharmacists was voluntary. Exempt
status was requested and granted by the University of Tennessee Institutional Review
Board.

65
Chapter 4. Results and Findings
Survey Mechanics and Data Collection
The Advanced Certification Index for Pharmacists (ACI-P) was deployed via
electronic mail and webpage notification by four Pharmacy organizations and the
Board of Pharmaceutical Specialties in the summer of 2007. The intent was to begin
the survey on June 1, 2007 and leave it open for entry until the sample size
projections needed were met or for a total of six weeks. Due to some issues with
several of the organizations’ communication systems, deployment was uneven and
sporadic at the outset. Information about the importance, need and a request for
participation was put forth by APhA, ASHP, ACCP, AACP and BPS. It was likely,
and was intended, that this combined effort contributed to a good survey response.
The collaboration and cooperation of these five organizations contributed
considerably to both the numbers of respondents, as well as to a good cross section of
various practitioner types and comparably matched ages and genders.
The first survey response was received at 5:38 PM on June 5, 2007 and the
last survey was received at 8:23 AM on August 7, 2007. The survey was left open
longer than the anticipated six weeks due to the slower than expected beginning date
for several of the organizations and because the continued daily receipt rate was high.
Total time open was 62 days and 15 hours.
In all, 2,274 pharmacists began the survey. Of those, 2,129 completed all of
the 25 PVIG sets for a completion percentage of 93.7%. The question regarding
expectancy (question number 26) was apparently unclear as 2,095 of the 2,129

66
(98.4%) responded to the question but some answered all, or several, of the options.
Recoding on this variable required manually comparing the data to demographic
questions, or to other markers, to determine status of the pharmacist. Those that
could not be positively identified as to board certification status were omitted from
the research data set. A total of 2,057 of 2,129 completed surveys were retained for
the research data representing a clean data rate of 96.6% of those completing all
questions and 90.5% of those initiating the survey (See Table 4-1). All VIE
calculations were based on the data set of 2,057 complete surveys. This data set was
comprised of 496 (24.1%) non-board certified pharmacists and 1,561 (75.9%) board
certified pharmacists (See Table 4-2). Responses from both groups were in excess of
the calculated 395 per group sample size needed for statistical significance.
Demographics
The demographic questions were optional and 1,940 (94.3% of 2,057)
completed at least the gender question and 1,924 (93.5% of 2,057) completed the age
question. There were 1,924 (93.5%) respondents that answered both the age and
gender questions (A+ G respondents). The differences in age between genders in the
sample population were significantly different with the mean of the female
participants at 42.3 (SD 10.6) and the male participant mean of 37.9 (SD 8.5). The
demographic statistics of gender and age are depicted in Table 4-3 and Table 4-4.
There was less variance in the age of the board certified pharmacists group
which may have been due to the larger number of those pharmacists responding. The

67
Table 4-1. Distribution of Pharmacist Respondents to 2007 ACI-P Survey
Status Number % of Began Survey
Began Survey 2,274 100%
Completed Survey 2,129 93.7%
Retained Survey Dataset 2,057 90.5%
ACI-P = Advanced Certification Index for Pharmacists
Table 4-2. Distribution of Retained Pharmacist Respondents from 2007 ACI-P
Survey
Sample Number % of Retained
Responses
Non-Board Certified Pharmacists 496 24.1%
Board Certified Pharmacists 1,561 75.9%
Retained Pharmacist Respondents 2,057 100%
ACI-P = Advanced Certification Index for Pharmacists

68
Table 4-3. Demographics of Respondent Sample in Retained Survey Dataset from
2007 ACI-P (N=1924 for Age + Gender [A+G])
Respondents Number % Mean Age SD 95% CI
Male 1,176 61.1 37.9 8.5 37.4-38.4
Female 748 38.9 42.3 10.6 41.5-43.0
Total
(Age/Gender) 1,924 100 39.6 9.6 39.2-40.0
p value M
Age/F Age p<.0001 (Student’s t test)
Table 4-4. Respondent Groups by Age, Certification Status and Gender (N=1,924
for Age + Gender [A+G])
BCP
Male
BCP
Female
NONBCP
Male
NONBCP
Female
Number (%) 892
(46.4%)
569
(29.6%)
284
(14.8%)
179
(9.3%)
Mean Age 38.2 42.0 37.2 43.1
Std Dev 8.3 9.7 9.0 13.0
95% CI 37.7-38.7 41.2-42.8 36-38.2 42.5-43.7
Age range 25-62 25-69 22-63 24-80
BCP = Board Certified pharmacists, NONBCP = Non-Board certified pharmacists

69
range for non-board certified pharmacists was 22 to 80 and for the board certified
pharmacists the age range was 25 to 69. There were no significant differences in the
male and female subsets for the non-board certified pharmacists and the board
certified pharmacists. However, there were differences among age by gender
segments. The overall age mean for all respondents was 39.6 (SD 9.6, 95% CI 39.2 –
40.0). Male respondents had a mean age of 37.9 (SD 8.5, 95% CI 37.4 – 38.4) and
female respondents had a mean age of 42.3 (SD 10.6, 95% CI 41.5 – 43.0). These
were significantly different and are depicted in Table 4-3.
The means for the ages, plus standard deviations were 39.4 (SD 11.1) for the
total non-board certified pharmacists and 39.7 (SD 9.0) for the total board certified
pharmacists. These were not statistically different (t = -0.49, p > 0.63). The non-
board certified pharmacists had 284 male respondents (14.8% of A+ G respondents)
and 179 female respondents (9.3% of A+ G respondents). The board certified
pharmacists had 992 male respondents (46.4% of A+ G respondents) and 569 female
respondents (29.6% of A+ G respondents). Table 4-4 depicts segmentation of the
pharmacists that answered both the age and gender questions on the ACI-P
demographic section.
Within gender groups, ages were significantly different for males in the non-
board certified and board certified groups with means of 38.2 years of age (95% CI
37.7 – 38.7] for NONBCP and 37.2 years (95% CI 36 – 38.2). The female
comparison showed the NONBCP with a mean age of 43.1 (95% CI 42.5 – 43.7) and
42 (95% CI 41.2 – 42.8). These ages were significantly different between groups for
female pharmacists. Although these groups were statistically different they were very

70
close from a practical standpoint. The two male sub-groups were within 1 year of age
and the two female sub-groups were within 1 year of each other and the confidence
intervals were very close.
Other demographic responses were somewhat sporadic. In addition to the 16
demographic questions, a single comment question regarding the pharmacists’
opinion of board certification in general was asked and 331 of the 2,274 (14.6%)
responded. The final retained dataset contained 324 of 2,057 (15.7%) additional
comment responses. Despite the relatively low response rate this provided some
interesting viewpoints on pharmacists’ perceptions of the current board certification
process and their opinions of its status. The response rate may actually have been
acceptable or appropriate considering it was the last of 67 questions and required free
text entry. A full analysis of this separate data set was beyond the scope of this study
but a categorical stratification of the data was completed and a total of 620 separate
findings were categorized into 12 groupings. These are discussed at the end of this
chapter.
The cleaned dataset was large at 6 megabytes (1 megabyte is about the
amount of information in the text of a 600 page paperback book in the most efficient
storage method). The primary and master data table was comprised of 2,057 data
rows and 120 columns of information related to the VIE components (directly
reported and calculated) which was 246,840 individual data elements. In addition,
there were 53 columns of additional demographic information. This was a rich
dataset that may be useful for future research.

71
Use of the five-point Likert scales for the survey instrument presented some
options for using a standard survey scale and adapting to the Expectancy Valence
model (VIE) format. In the classic sense of the VIE model there can be zero values
for value, instrumentality or expectancy. The purposes of this study were not to
determine an actual or “real” value of motivation or to create a benchmark of value. It
was to determine how a given set of Perceived Valence Instrumentality group
components compared. For this reason, the five-point Likert scales with 1 being
lowest and 5 being highest, were used for both populations and the usual use of a
decimal equivalent was not necessary since the numbers were used for comparison
only. By observing these two conventions, the zero effect on the product of the
calculations in VIE was eliminated and a direct measure of statistics compared to the
ACI-P methodology was made.
Utilizing this model, the lowest score that could be made on the ACI-P was 25
(1 for all valences, 1 for all instrumentalities [25 total for VIS] and 1 for expectancy,
and the highest score was 3125 (5 for all valences, 5 for all instrumentalities [625
total for VIS] and 5 for expectancy).
The following were the PVI groups (each of which had four associated
variables) that are addressed in the data tables to follow. Using the example
discussed previously these basic variables exist within each PVIG:
• Selfimage_P Probability (instrumentality). This was directly
reported.
• Selfimage_V Value to the individual. This was directly reported.
• Selfimage_VIS Instrumentality x value (VIS). This was calculated.

72
• Selfimage_Diff Value – instrumentality. This was calculated.
These were the PVI group names:
1. Self image
2. Employable
3. Higher salary
4. Professional opportunities
5. Peer respect
6. Career advancement
7. Academic opportunities
8. Downsizing protection
9. Initial costs
10. Credibility
11. Professional respect (Colleagues)
12. Annual salary increases
13. Hiring influence
14. Financial incentive to SEEK board certification
15. Financial incentive to MAINTAIN board certification
16. Non-professional co-workers’ respect
17. Practice skills confidence
18. Personal accomplishment
19. Increased responsibility
20. One time bonus
21. Paid certification costs

73
22. Promotion potential
23. Public notification
24. Improved professional network
25. Job requirement
Expectancy responses were re-coded into two variables due to apparent
complexities with the question based on some respondent’s actions. The first of these
was AM_BC which had a binary classification of “Y” for yes if the respondent was
currently board certified and an “N” if they were not. The second variable was Exp
(expectancy) for the numerical value (1 – 5) reported on the survey section on
Question 26. Despite problems with some persons understanding the question, only
72 responses (3.4%) were lost due to inability to confirm the expectancy value.
Instrumentality
Table 4-5 lists findings from the survey instrumentality questions in the order
of the PVIG group listings on the ACI-P survey. In general, the board certified
pharmacists had a higher perception that rewards would occur than did the non-board
certified pharmacists and 20 of 25 (80%) were different statistically at a significance
level of p < 0.05. The instrumentality differences were seen at the highest level for
eight questions. These all had statistically significant differences between means
demonstrated by a t-score lower than negative 7.0 and a p of <0.0001. These eight
question response differences are listed in descending order based on t values:
a. I would hire a board certified practitioner over another non-board
certified practitioner with otherwise equal qualifications.
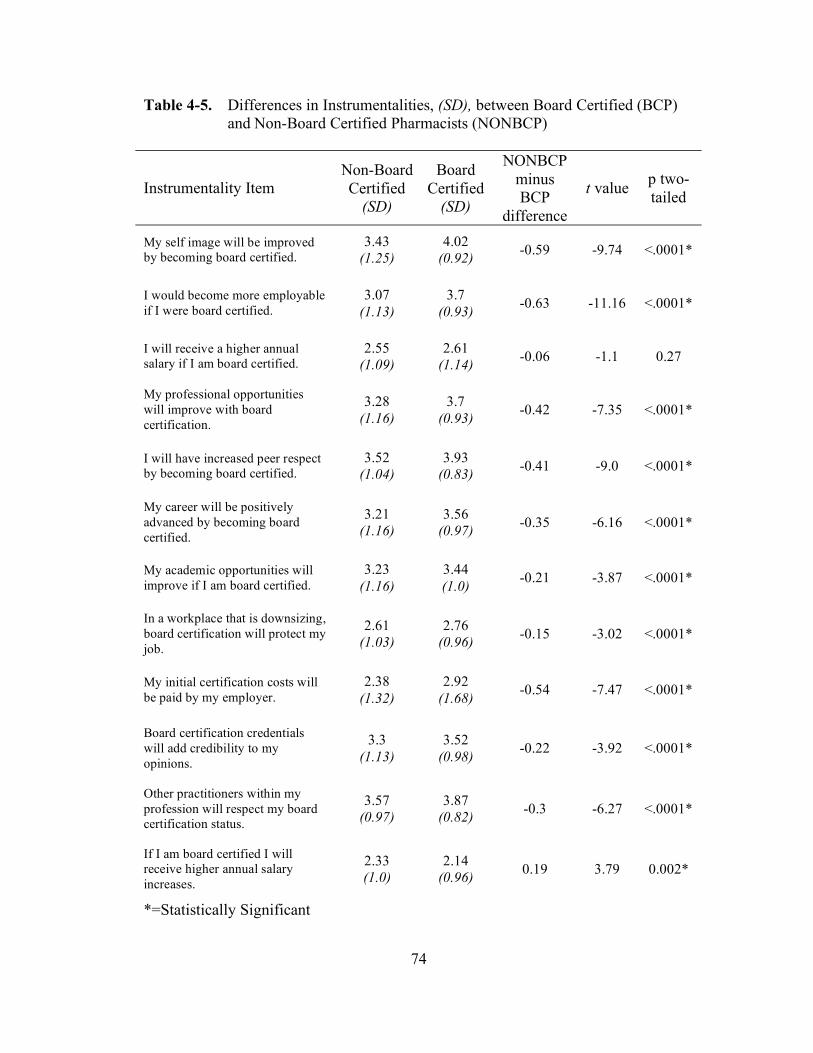
74
Table 4-5. Differences in Instrumentalities, (SD), between Board Certified (BCP)
and Non-Board Certified Pharmacists (NONBCP)
Instrumentality Item
Non-Board
Certified
(SD)
Board
Certified
(SD)
NONBCP
minus
BCP
difference
t value p two-
tailed
My self image will be improved
by becoming board certified.
3.43
(1.25)
4.02
(0.92) -0.59 -9.74 <.0001*
I would become more employable
if I were board certified.
3.07
(1.13)
3.7
(0.93) -0.63 -11.16 <.0001*
I will receive a higher annual
salary if I am board certified.
2.55
(1.09)
2.61
(1.14) -0.06 -1.1 0.27
My professional opportunities
will improve with board
certification.
3.28
(1.16)
3.7
(0.93) -0.42 -7.35 <.0001*
I will have increased peer respect
by becoming board certified.
3.52
(1.04)
3.93
(0.83) -0.41 -9.0 <.0001*
My career will be positively
advanced by becoming board
certified.
3.21
(1.16)
3.56
(0.97) -0.35 -6.16 <.0001*
My academic opportunities will
improve if I am board certified.
3.23
(1.16)
3.44
(1.0) -0.21 -3.87 <.0001*
In a workplace that is downsizing,
board certification will protect my
job.
2.61
(1.03)
2.76
(0.96) -0.15 -3.02 <.0001*
My initial certification costs will
be paid by my employer.
2.38
(1.32)
2.92
(1.68) -0.54 -7.47 <.0001*
Board certification credentials
will add credibility to my
opinions.
3.3
(1.13)
3.52
(0.98) -0.22 -3.92 <.0001*
Other practitioners within my
profession will respect my board
certification status.
3.57
(0.97)
3.87
(0.82) -0.3 -6.27 <.0001*
If I am board certified I will
receive higher annual salary
increases.
2.33
(1.0)
2.14
(0.96) 0.19 3.79 0.002*
*=Statistically Significant

75
Table 4-5. Continued.
Instrumentality Item
Non-Board
Certified
(SD)
Board
Certified
(SD)
NONBCP
minus
BCP
difference
t value p two-
tailed
I would hire a board certified
practitioner over another non-
board practitioner with otherwise
equal qualifications.
3.32
(1.1)
3.93
(0.85) -0.61 -11.28 <.0001*
Increased financial incentive from
my employer would cause me to
SEEK board certification status.
3.54
(1.18)
3.65
(1.14) -0.11 -1.98 0.049*
Increased financial incentive from
my employer would cause me to
MAINTAIN board certification.
3.8
(1.09)
3.84
(1.17) -0.04 -0.67 0.50
Non-professional co-workers will
respect board certification status.
2.64
(1.08)
2.7
(0.99) -0.06 -1.09 0.27
I will have increased confidence
in my practice skills as a result of
being board certified.
3.43
(1.23)
3.59
(1.08) -0.16 -2.58 0.01*
I will feel a sense of personal
accomplishment by becoming
board certified.
4.24
(1.0)
4.66
(0.6) -0.42 -8.94 <.0001*
I will have increased
responsibility in my job role after
becoming board certified.
2.64
(1.18)
2.72
(1.12) -0.08 -1.37 0.17
I will receive a one time pay
bonus upon completion of board
certification.
1.88
(0.98)
1.75
(1.1) 0.13 2.56 0.01*
My recertification costs will be
paid by my employer.
2.12
(1.09)
2.32
(1.43) -0.2 -3.22 0.001*
I will be more likely to be
promoted by my employer if I am
board certified.
2.57
(1.09)
2.68
(1.08) -0.11 -1.91 0.056
There would be a public
notification of my achievement
and status if I become board
certified.
2.72
(1.14)
2.2
(1.31) -0.2 -3.35 0.001*
I would have an improved
professional network by
becoming board certified.
3.09
(1.07)
3.24
(1.05) -0.15 -2.86 0.003*
Board certification will become
necessary for my job.
2.42
(1.07)
2.83
(1.18) -0.41 -7 <.0001*
*=Statistically Significant
76
b. I would become more employable if I were board certified.
c. My self image will be improved by becoming board certified.
d. I will have increased peer respect by becoming board certified.
e. I will feel a sense of personal accomplishment by becoming board certified.
f. My initial certification costs will be paid by my employer.
g. My professional opportunities will improve with board certification.
h. Board certification will become necessary for my job.
For this particular group of comparative instrumentalities there was a more
pronounced difference than in the others. As noted, 20 of 25 (80%) of the
instrumentality comparisons demonstrated statistically significant differences. The
group identified in the list above, however, may have more practical relevance since
they have a much larger degree of difference.
In five of the questions the instrumentalities reported by the BCP’s were about
the same as those listed by the NONBCP group due to no statistically significant
differences.
This group is listed below (mean ranges in parentheses):
i. Increased financial incentive from my employer would cause me to
MAINTAIN board certification (Both about 3.8).
j. I will receive a higher annual salary if I am board certified (Both about 2.6).
k. Non-professional co-workers will respect my board certification status (Both
about 2.7).
l. I will have increased responsibility in my job after becoming board certified
(Both about 2.7).

77
m. I will be more likely to be promoted by my employer if I am board certified
(both about 2.6).
Four of these items had values for both groups below 3.0. As a result, both
groups perceived instrumentalities lower than the mid-point (3 on the 5 point scale).
Although the responses were not very different statistically, the findings in the four
below 3 were on the negative side of the scale. In other words, despite that fact that
they did not differ very much between groups, the overall perception of these
instrumentalities was negative in both groups.
The question regarding an increased employer financial incentive to maintain
board certification had a relatively high score from both groups indicating that this
was an area of high perception of instrumentality.
Since all the responses captured on the instrumentality questions were able to
be summed, the accumulated overall instrumentality was compared. This is an
important concept as the products of all instrumentality multiplied by the valences are
accumulated and summed in the VIE equation. The mean for the accumulated non-
board certified pharmacists (NONBCP) instrumentalities was 74.9 (95% CI 73.6 –
76.5) compared to the mean for the board certified pharmacists (BCP) of 81.0 (95%
CI 80.3 – 81.7) so overall this group scored at a neutral or near midpoint range. The
NONBCP and BCP groups were significantly different (t = -6.9, p < 0.0001).
A neutral accumulated instrumentality score would have been 75 (25
questions x 3; on the 1-5 scale) and the highest attainable accumulated score would
have been 125 (25 x 5; on the 1-5 scale). Both groups were closer to the midpoint

78
than to the higher end and the NONBCP group was essentially neutral at 74.9
compared to an actual midpoint of 75.
Similarly, taking a mean of the means for the instrumentalities shows the
mean of all for the accumulated non-board certified pharmacists (NONBCP)
instrumentalities at 3.0 (95% CI 2.93 – 3.06) compared to the instrumentality mean
for the board certified pharmacists of 3.24 (95% CI 3.21 – 3.27). These were
significantly different (t = -6.9; p < 0.0001).
Even though the BCP group was just slightly higher than the NONBCP group,
both groups were very near neutral, or near the midpoint, in their instrumentality.
Their general impression that there would be a reward for effort put forth for board
certification was nearly ambivalent.
In the VIE equation, scores calculated from the instrumentality questions
would likely have had a neutral or negative pull on the calculations. However, the
values that were on the extremes of the instrumentality scores may have had a greater
overall effect since they were not neutral. The eleven statistically significant
differences in means demonstrated that, in this large survey population, they were
indeed different statistically but perhaps not to a degree that made them actually
practically relevant. Final determination of that position was examined by evaluating
the differences in value and instrumentality (VI_Diff) and the products of the value
and instrumentality scores (VIS).

79
Valence
Findings from the valence (value) questions and the differences between non-
board certified pharmacists and board certified pharmacists are displayed in Table 4-
6. In general, 23 of 25 (92%) of board certified pharmacists had a higher perception
of value (valence) than did the non-board certified pharmacists and these were
significantly different. The valence differences were seen at the highest level for four
questions. These all had practically and statistically significant differences between
means demonstrated by a t-score lower than negative 7.0 and a p of <0.0001.
These four item responses are listed in descending order from the most
difference noted:
1. I value that my job will require board certification.
2. I value board certification enough to positively influence a hiring decision.
3. I value personal accomplishment demonstrated by a board certification.
4. I value promotions based on board certification.
For this particular group of comparative valences there was a more
pronounced difference than in the others. As noted, 23 of 25 (92%) of the valence
comparisons demonstrated statistically significant differences, but the group
identified in the list above may have had more relevance since they had a much larger
degree of difference.
In three of the questions, the valences reported by the BCP’s were about the
same as those listed by the NONBCPs, i.e. they were not statistically different. This
group was, in order of descending from highest to lowest:
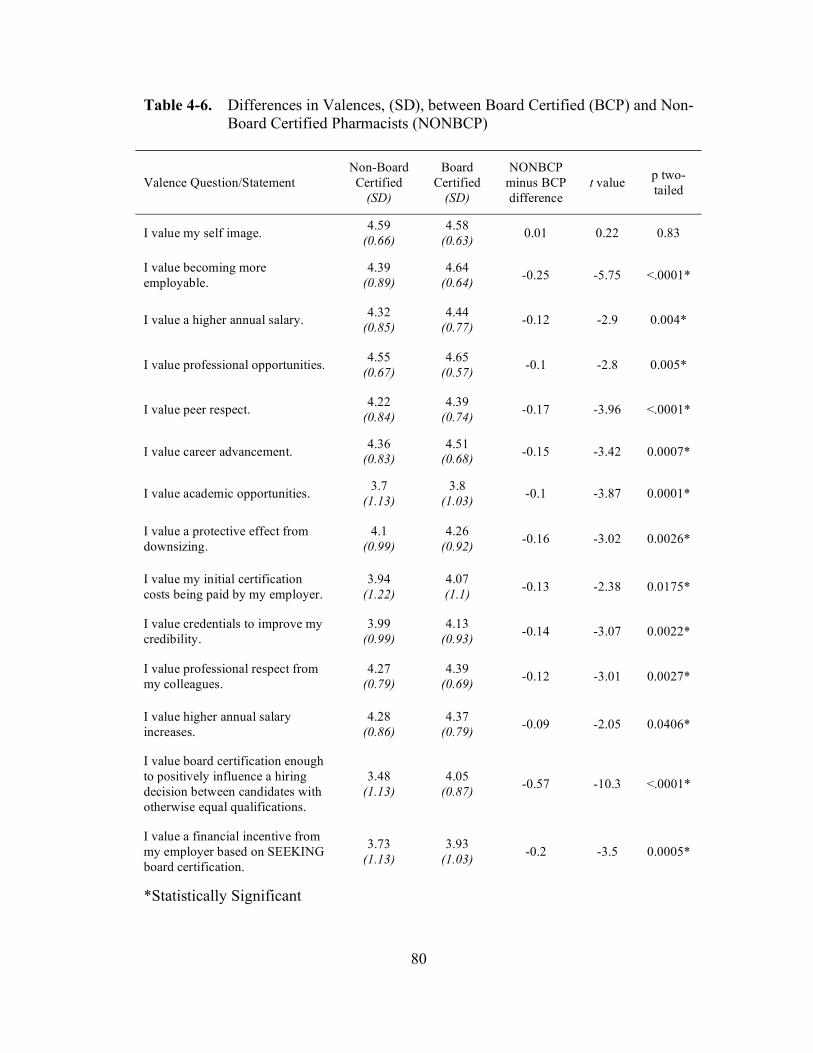
80
Table 4-6. Differences in Valences, (SD), between Board Certified (BCP) and Non-
Board Certified Pharmacists (NONBCP)
Valence Question/Statement
Non-Board
Certified
(SD)
Board
Certified
(SD)
NONBCP
minus BCP
difference
t value p two-
tailed
I value my self image. 4.59
(0.66)
4.58
(0.63) 0.01 0.22 0.83
I value becoming more
employable.
4.39
(0.89)
4.64
(0.64) -0.25 -5.75 <.0001*
I value a higher annual salary. 4.32
(0.85)
4.44
(0.77) -0.12 -2.9 0.004*
I value professional opportunities. 4.55
(0.67)
4.65
(0.57) -0.1 -2.8 0.005*
I value peer respect. 4.22
(0.84)
4.39
(0.74) -0.17 -3.96 <.0001*
I value career advancement. 4.36
(0.83)
4.51
(0.68) -0.15 -3.42 0.0007*
I value academic opportunities. 3.7
(1.13)
3.8
(1.03) -0.1 -3.87 0.0001*
I value a protective effect from
downsizing.
4.1
(0.99)
4.26
(0.92) -0.16 -3.02 0.0026*
I value my initial certification
costs being paid by my employer.
3.94
(1.22)
4.07
(1.1) -0.13 -2.38 0.0175*
I value credentials to improve my
credibility.
3.99
(0.99)
4.13
(0.93) -0.14 -3.07 0.0022*
I value professional respect from
my colleagues.
4.27
(0.79)
4.39
(0.69) -0.12 -3.01 0.0027*
I value higher annual salary
increases.
4.28
(0.86)
4.37
(0.79) -0.09 -2.05 0.0406*
I value board certification enough
to positively influence a hiring
decision between candidates with
otherwise equal qualifications.
3.48
(1.13)
4.05
(0.87) -0.57 -10.3 <.0001*
I value a financial incentive from
my employer based on SEEKING
board certification.
3.73
(1.13)
3.93
(1.03) -0.2 -3.5 0.0005*
*Statistically Significant

81
Table 4.6. Continued.
Valence Question/Statement
Non-Board
Certified
(SD)
Board
Certified
(SD)
NONBCP
minus BCP
difference
t value p two-
tailed
I value a financial incentive from
my employer to MAINTAIN
board certification status.
3.93
(1.04)
4.14
(0.96) -0.21 -4.19 <.0001*
I value a non-professional co-
workers’ respect of board
certification status.
3.12
(1.15)
3.27
(1.08) -0.15 -2.76 0.0058*
I value increased confidence in
my practice skills.
4.42
(0.79)
4.47
(0.69) -0.05 -1.26 0.2082
I value personal accomplishment
demonstrated by a board
certification credential.
4.19
(1.02)
4.55
(0.72) -0.36 -7.31 <.0001*
I value increased responsibility in
my job role.
3.75
(0.99)
3.85
(0.91) -0.1 -1.98 0.0482*
I value a one time pay bonus for
completion of board certification.
3.4
(1.27)
3.62
(1.24) -0.22 -3.45 0.0006*
I value that my employer would
pay for my recertification costs.
3.76
(1.19)
4.08
(1.06) -0.32 -5.45 <.0001*
I value promotions based on board
certification.
3.2
(1.22)
3.64
(1.06) -0.44 -7.05 <.0001*
I value a public notification of my
achievement and status.
2.84
(1.24)
3.05
(1.18) -0.21 -3.48 0.0005*
I value an improved professional
network.
3.87
(1.01)
3.93
(0.9) -0.06 -1.33 0.1827
I value that my job will require
board certification.
2.59
(1.19)
3.27
(1.16) -0.68 -11.42 <.0001*
*Statistically Significant

82
a. I value my self image.
b. I value increased confidence in my practice skills.
c. I value an improved professional network.
All three of these questions had responses above 3.8; placing values attributed
to all three issues higher than the mid-point (3 on the 5 point scale). Although these
responses are not very different statistically, the findings in the three above 3.8 are on
the positive side of the scale. In other words, despite that fact that they don’t differ
very much, the overall perceptions of these valences were positive in both groups.
Since all the responses captured on the valence items could be summed, the
accumulated overall valence was compared. As noted in the instrumentality section,
this is an important concept as the products of all instrumentality multiplied by the
valences are accumulated and summed in the VIE equation. The mean of all for the
accumulated non-board certified pharmacists (NONBCP) instrumentalities was 97.1
(95% CI 95.8 to 98.4) compared to the mean for the board certified pharmacists
(BCP) of 102.2 (95% CI 101 to 103). Overall, this group scored in the positive range
although they were significantly different (t = -7.1, p < 0.0001).
A neutral accumulated valence score would have been 75 (25 questions x 3;
on the 1-5 scale) and the highest attainable accumulated score would have been 125
(25 x 5; on the 1-5 scale). Both groups were on the higher end with the NONBCP
group at 95.8 compared to 75 (higher than neutral,) and the BCP group was 102.2
compared to 75 (higher than neutral).
Similarly, taking a mean of the means for the valences shows the mean of all
for the accumulated non-board certified pharmacists (NONBCP) instrumentalities at

83
3.9 (95% CI of 3.8 to 3.95) compared to the valence mean for the board certified
pharmacists (BCP) of 4.09 (95% CI of 4.06 to 4.11). These were different and
statistically significant.
The BCP group was slightly higher but both groups were on the positive side
of the scale for valence, i.e. their general impression of values for these questions
were relatively high.
In the VIE equation, scores calculated for the valence scores would have had a
positive pull on the calculations, i.e. since they were above neutral they would have
contributed more to the products since they were of a higher value. Final
determination of that position was examined by evaluating the differences in value
and instrumentality (V_Diff) and the products of the value and instrumentality scores
(VIS). Extremes of differences on either end of the scales may have had a
pronounced affect on overall variance on the factor model.
Valence Minus Instrumentality (VI_Diff)
Valence is the same as value. This comparison evaluates the valence or value
item within a PVI group against the instrumentality item by subtracting the
instrumentality from the valence. During the literature search and design of the
survey instrument (ACI-P) it was considered that the product of instrumentality and
valence, as defined in the VIE equation, would produce useable results.
Additionally, it was considered that if certain PVI groups showed larger differences
than others it could be a beneficial addition to the evaluation of these PVIGs. To
accomplish this comparison each respondent’s instrumentality score was subtracted
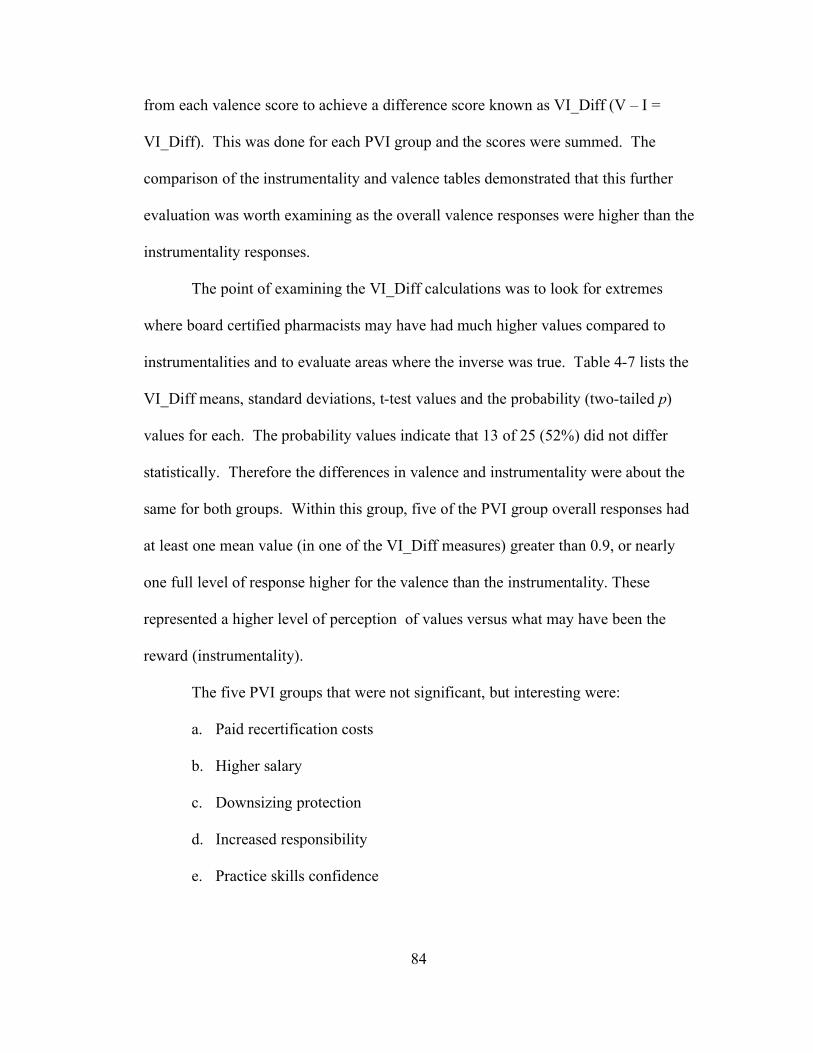
84
from each valence score to achieve a difference score known as VI_Diff (V – I =
VI_Diff). This was done for each PVI group and the scores were summed. The
comparison of the instrumentality and valence tables demonstrated that this further
evaluation was worth examining as the overall valence responses were higher than the
instrumentality responses.
The point of examining the VI_Diff calculations was to look for extremes
where board certified pharmacists may have had much higher values compared to
instrumentalities and to evaluate areas where the inverse was true. Table 4-7 lists the
VI_Diff means, standard deviations, t-test values and the probability (two-tailed p)
values for each. The probability values indicate that 13 of 25 (52%) did not differ
statistically. Therefore the differences in valence and instrumentality were about the
same for both groups. Within this group, five of the PVI group overall responses had
at least one mean value (in one of the VI_Diff measures) greater than 0.9, or nearly
one full level of response higher for the valence than the instrumentality. These
represented a higher level of perception of values versus what may have been the
reward (instrumentality).
The five PVI groups that were not significant, but interesting were:
a. Paid recertification costs
b. Higher salary
c. Downsizing protection
d. Increased responsibility
e. Practice skills confidence
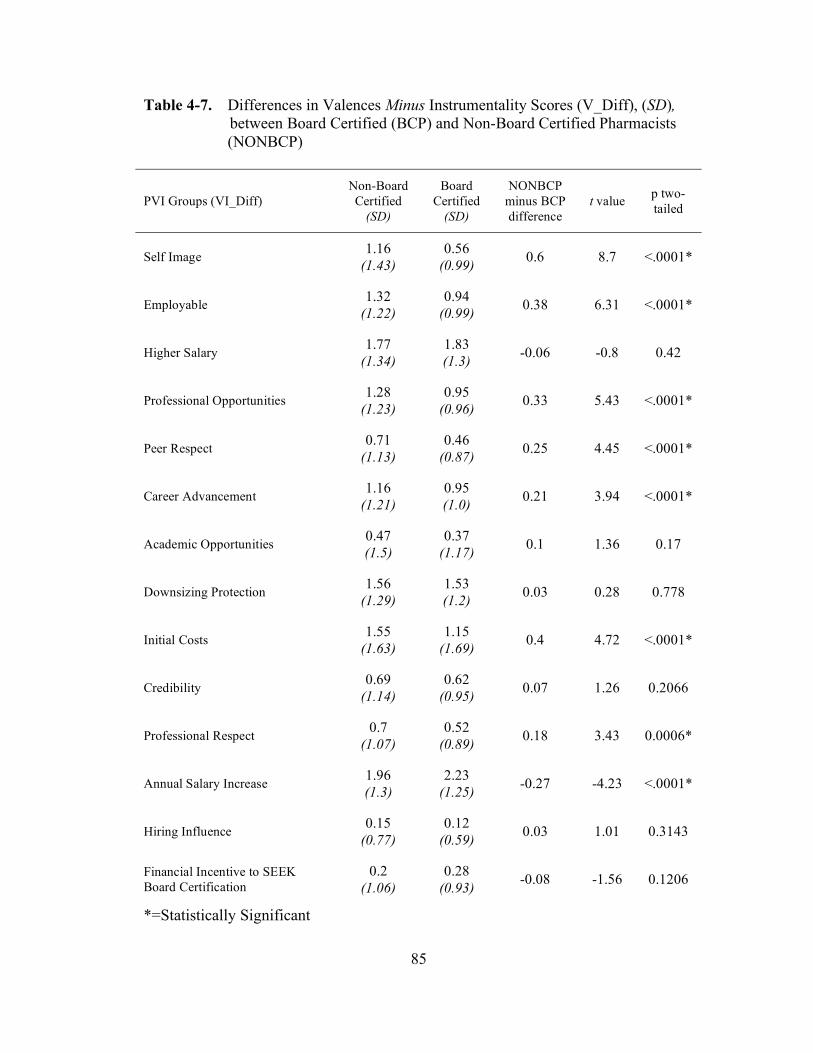
85
Table 4-7. Differences in Valences Minus Instrumentality Scores (V_Diff), (SD),
between Board Certified (BCP) and Non-Board Certified Pharmacists
(NONBCP)
PVI Groups (VI_Diff)
Non-Board
Certified
(SD)
Board
Certified
(SD)
NONBCP
minus BCP
difference
t value p two-
tailed
Self Image 1.16
(1.43)
0.56
(0.99) 0.6 8.7 <.0001*
Employable 1.32
(1.22)
0.94
(0.99) 0.38 6.31 <.0001*
Higher Salary 1.77
(1.34)
1.83
(1.3) -0.06 -0.8 0.42
Professional Opportunities 1.28
(1.23)
0.95
(0.96) 0.33 5.43 <.0001*
Peer Respect 0.71
(1.13)
0.46
(0.87) 0.25 4.45 <.0001*
Career Advancement 1.16
(1.21)
0.95
(1.0) 0.21 3.94 <.0001*
Academic Opportunities 0.47
(1.5)
0.37
(1.17) 0.1 1.36 0.17
Downsizing Protection 1.56
(1.29)
1.53
(1.2) 0.03 0.28 0.778
Initial Costs 1.55
(1.63)
1.15
(1.69) 0.4 4.72 <.0001*
Credibility 0.69
(1.14)
0.62
(0.95) 0.07 1.26 0.2066
Professional Respect 0.7
(1.07)
0.52
(0.89) 0.18 3.43 0.0006*
Annual Salary Increase 1.96
(1.3)
2.23
(1.25) -0.27 -4.23 <.0001*
Hiring Influence 0.15
(0.77)
0.12
(0.59) 0.03 1.01 0.3143
Financial Incentive to SEEK
Board Certification
0.2
(1.06)
0.28
(0.93) -0.08 -1.56 0.1206
*=Statistically Significant
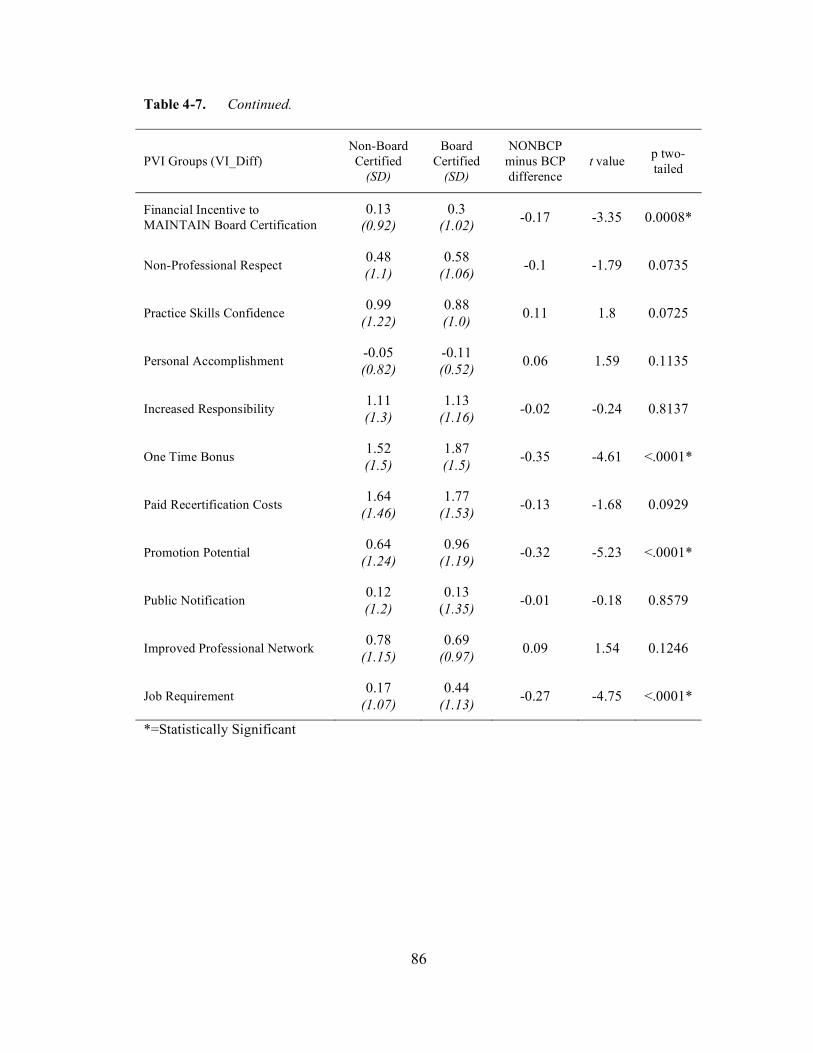
86
Table 4-7. Continued.
PVI Groups (VI_Diff)
Non-Board
Certified
(SD)
Board
Certified
(SD)
NONBCP
minus BCP
difference
t value p two-
tailed
Financial Incentive to
MAINTAIN Board Certification
0.13
(0.92)
0.3
(1.02) -0.17 -3.35 0.0008*
Non-Professional Respect 0.48
(1.1)
0.58
(1.06) -0.1 -1.79 0.0735
Practice Skills Confidence 0.99
(1.22)
0.88
(1.0) 0.11 1.8 0.0725
Personal Accomplishment -0.05
(0.82)
-0.11
(0.52) 0.06 1.59 0.1135
Increased Responsibility 1.11
(1.3)
1.13
(1.16) -0.02 -0.24 0.8137
One Time Bonus 1.52
(1.5)
1.87
(1.5) -0.35 -4.61 <.0001*
Paid Recertification Costs 1.64
(1.46)
1.77
(1.53) -0.13 -1.68 0.0929
Promotion Potential 0.64
(1.24)
0.96
(1.19) -0.32 -5.23 <.0001*
Public Notification 0.12
(1.2)
0.13
(1.35) -0.01 -0.18 0.8579
Improved Professional Network 0.78
(1.15)
0.69
(0.97) 0.09 1.54 0.1246
Job Requirement 0.17
(1.07)
0.44
(1.13) -0.27 -4.75 <.0001*
*=Statistically Significant

87
There were also two extreme findings on the VI-Diff scale where there were
statistically different groups. These were where BCP responses were higher than
NONBCP and where NONBCP responses were higher than BCP. The BCP higher
than NONBCP VI_Diff statistically significant end of the responses showed four PVI
groups. These, listed in order of greatest difference descending to lowest, were;
a. Promotion potential
b. Job requirement
c. One time bonus
d. Annual salary increase
All values were negative for this group. This means that the perceptions of
value for the board certified pharmacists were higher compared to the non-board
certified pharmacists.
On the other end of the scale for comparison within this group were the
positive t-test values where the NONBCP scores were higher than the BCP. The
following seven PVI groups showed areas where the non-board certified pharmacists
had a higher difference in valence minus instrumentality (VI_Diff) responses than did
the board certified pharmacists. These, listed in order of greatest t-test value
difference descending to lowest, with difference in VI_Diff level noted in
parentheses, are:
a. Self image (0.6)
b. Employability (0.38)
c. Professional opportunities (0.33)
d. Initial costs (0.4)

88
e. Peer respect (0.25)
f. Career advancement (0.21)
g. Professional respect (0.18)
Of this group, five had at least a VI_Diff mean greater than 0.9 in at least one
of the groups. These were self image, employability, professional opportunities,
initial costs, and career advancement.
The purpose of the VI_Diff evaluation was to further examine the differences
seen on overall comparison of valences and instrumentalities in the preceding
sections.
Valence Times Instrumentality (VI_Score)
Using an Expectancy Valence (VIE) mathematical approach to development
of a survey instrument had as a basis the position that the product of the
instrumentalities and the valences (values) would be more representative of the actual
propensity of motivational force than either of the independent item types or scales.
Additionally, the accumulation of these products provided the opportunity to not have
the selection of some factor on an extreme end of one of the scales of the findings
overly influence interpretation. Thus far, a focus of the discussion has been on the
areas where one overall propensity was noted for instrumentality, valence or the
difference between valence and instrumentality. These are all worthwhile
examinations and lend some credence to the argument for evaluating those sections of
the PVI groupings. However, the most important of the four different components of
89
the PVI groups, each of which consists of instrumentality, valence, VI_Diff and the
product of the valence and instrumentality (VI_Score), was the latter.
The valence times instrumentality score (VI_Score) was derived by
multiplying the PVI group valence by the instrumentality within that group. Each of
the 25 PVI groups has a VI_Score. The advantage of using this variable for
evaluation of components of motivational force, aside from the fact that it was the
basis for the VIE mathematical model, was that it had the potential advantage of
smoothing out extremes on either the valence or instrumentality scales and may be
more representative of a more realistic measure of perception.
An examination of Table 4-8 demonstrates that 22 of 25 of the VI scores were
different statistically and only one of 25 had a higher VIS for NONBCP than for
BCP. The PVI group that showed a higher VIS mean for NONBCP was annual
salary increase and it was statistically significant at p < 0.05.
Evaluation of the instrumentality and valence responses demonstrated some
interesting findings on extreme ends of each scale and also showed an overall
tendency to be near a neutral point (3 on the 5 point scale) of instrumentality.
However, the overall valence scores, although statistically different from each other
as far as NONBCP and BCP, were nearer a 4 on the 5 point scale. The lower and
higher means overall were used to establish some parameters for low and higher end
VI Scores (VIS).
If we consider all the VIS means below a product of 9.0 (3 of 5 for
instrumentality x 3 of 5 for valence) to be in negative range, and all means with
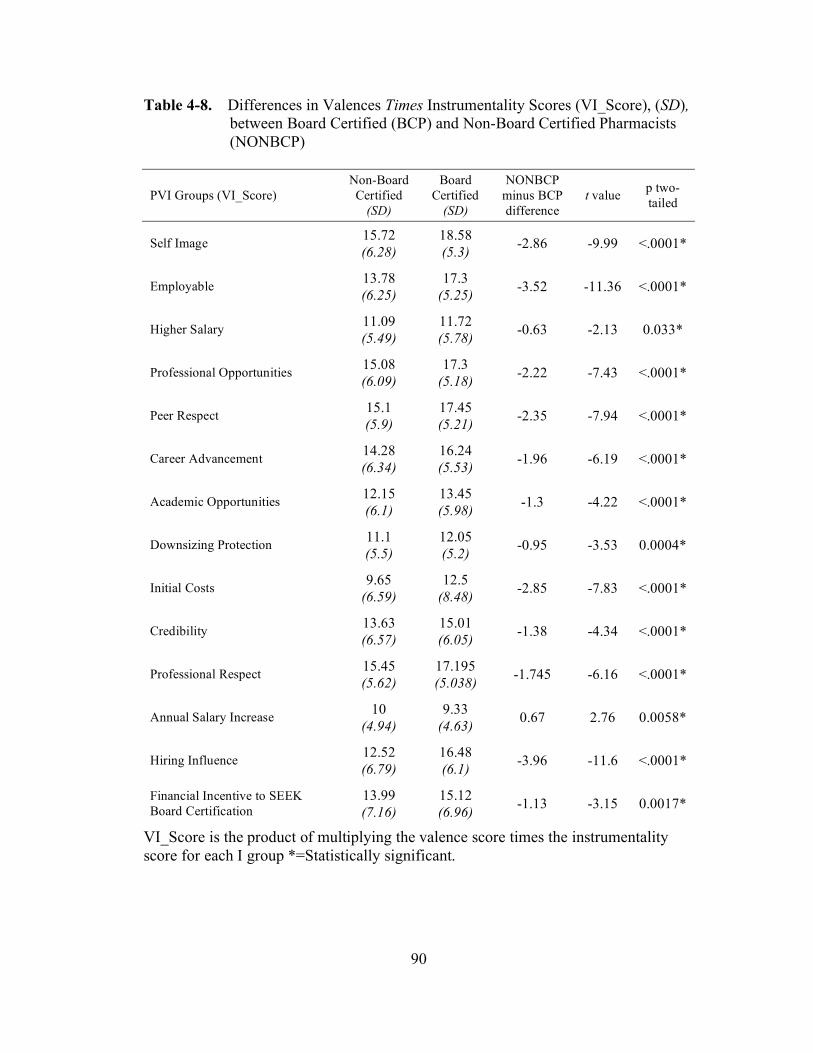
90
Table 4-8. Differences in Valences Times Instrumentality Scores (VI_Score), (SD),
between Board Certified (BCP) and Non-Board Certified Pharmacists
(NONBCP)
PVI Groups (VI_Score)
Non-Board
Certified
(SD)
Board
Certified
(SD)
NONBCP
minus BCP
difference
t value p two-
tailed
Self Image 15.72
(6.28)
18.58
(5.3) -2.86 -9.99 <.0001*
Employable 13.78
(6.25)
17.3
(5.25) -3.52 -11.36 <.0001*
Higher Salary 11.09
(5.49)
11.72
(5.78) -0.63 -2.13 0.033*
Professional Opportunities 15.08
(6.09)
17.3
(5.18) -2.22 -7.43 <.0001*
Peer Respect 15.1
(5.9)
17.45
(5.21) -2.35 -7.94 <.0001*
Career Advancement 14.28
(6.34)
16.24
(5.53) -1.96 -6.19 <.0001*
Academic Opportunities 12.15
(6.1)
13.45
(5.98) -1.3 -4.22 <.0001*
Downsizing Protection 11.1
(5.5)
12.05
(5.2) -0.95 -3.53 0.0004*
Initial Costs 9.65
(6.59)
12.5
(8.48) -2.85 -7.83 <.0001*
Credibility 13.63
(6.57)
15.01
(6.05) -1.38 -4.34 <.0001*
Professional Respect 15.45
(5.62)
17.195
(5.038) -1.745 -6.16 <.0001*
Annual Salary Increase 10
(4.94)
9.33
(4.63) 0.67 2.76 0.0058*
Hiring Influence 12.52
(6.79)
16.48
(6.1) -3.96 -11.6 <.0001*
Financial Incentive to SEEK
Board Certification
13.99
(7.16)
15.12
(6.96) -1.13 -3.15 0.0017*
VI_Score is the product of multiplying the valence score times the instrumentality
score for each I group *=Statistically significant.
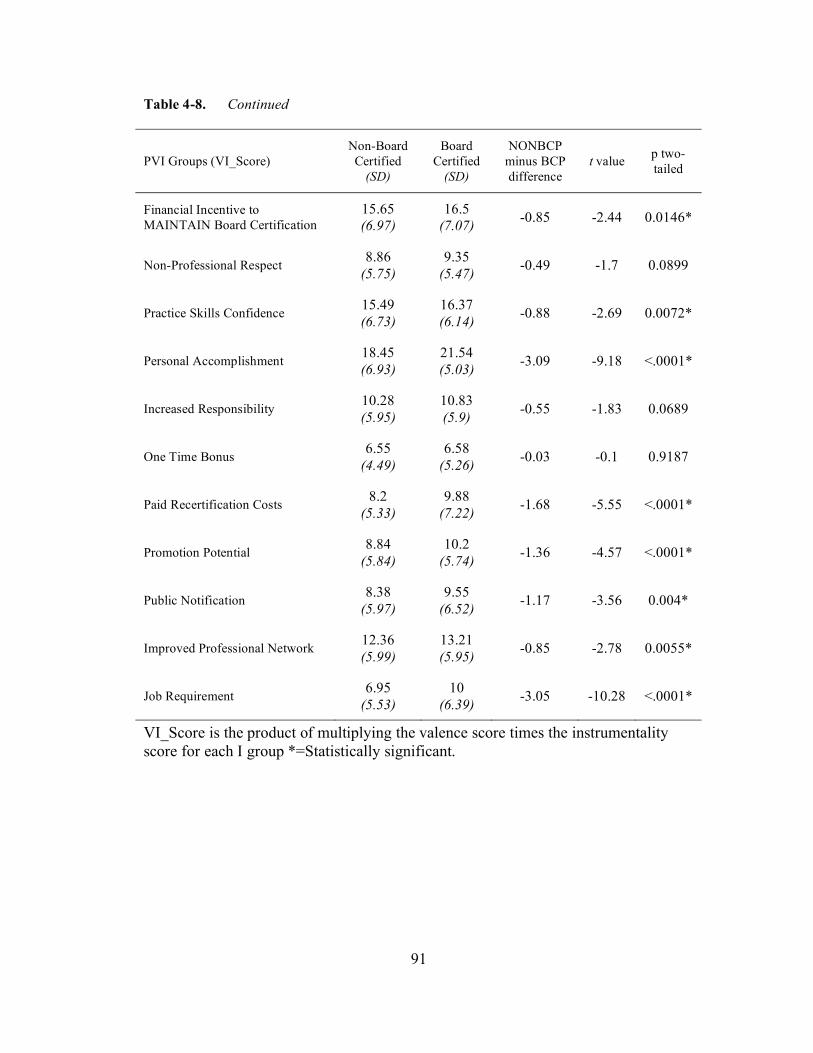
91
Table 4-8. Continued
PVI Groups (VI_Score)
Non-Board
Certified
(SD)
Board
Certified
(SD)
NONBCP
minus BCP
difference
t value p two-
tailed
Financial Incentive to
MAINTAIN Board Certification
15.65
(6.97)
16.5
(7.07) -0.85 -2.44 0.0146*
Non-Professional Respect 8.86
(5.75)
9.35
(5.47) -0.49 -1.7 0.0899
Practice Skills Confidence 15.49
(6.73)
16.37
(6.14) -0.88 -2.69 0.0072*
Personal Accomplishment 18.45
(6.93)
21.54
(5.03) -3.09 -9.18 <.0001*
Increased Responsibility 10.28
(5.95)
10.83
(5.9) -0.55 -1.83 0.0689
One Time Bonus 6.55
(4.49)
6.58
(5.26) -0.03 -0.1 0.9187
Paid Recertification Costs 8.2
(5.33)
9.88
(7.22) -1.68 -5.55 <.0001*
Promotion Potential 8.84
(5.84)
10.2
(5.74) -1.36 -4.57 <.0001*
Public Notification 8.38
(5.97)
9.55
(6.52) -1.17 -3.56 0.004*
Improved Professional Network 12.36
(5.99)
13.21
(5.95) -0.85 -2.78 0.0055*
Job Requirement 6.95
(5.53)
10
(6.39) -3.05 -10.28 <.0001*
VI_Score is the product of multiplying the valence score times the instrumentality
score for each I group *=Statistically significant.
92
product of 16.0 (4 of 5 for instrumentality and 4 of 5 for valence) to be in the positive
range, as indicated by the valence scores, we can then examine more closely the two
ends of the scale. However, regardless of how the scale extremes occur with the VI
scores, each of the contributory VIS products were accumulated and summed in the
VIE methodology. Therefore, even if many of the VIS products did not measure as
being on the high or low end, they did accumulate to a summary score. Consequently
each had some additive contribution to the final result.
There were a total of 6 of 25 (24%) of the VI scores for PVI groups that had at
least one mean (NONBCP or BCP) below 9.0 (i.e. negative). These were:
a. Job requirement
b. Paid certification costs
c. Promotion potential
d. Public notification
e. Non-professional respect (p = 0.09, not significant)
f. One time bonus (p = 0.9, not significant)
Of these, only non-professional respect and one time bonus were not
significantly different. But all of these VI score means fell into the negative range.
Within the VIE calculation they made a contribution to the sums of all the VI scores
but their impact was less than those that were more positive, i.e. above a 9.0 product.
There were 10 of 25 (40%) that had at least one VI score mean for either NONBCP or
BCP above 16.0. All 10 of those were different statistically. These are, in
descending order from highest difference of means to lowest difference (with
NONBCP minus BCP differences noted in parentheses):
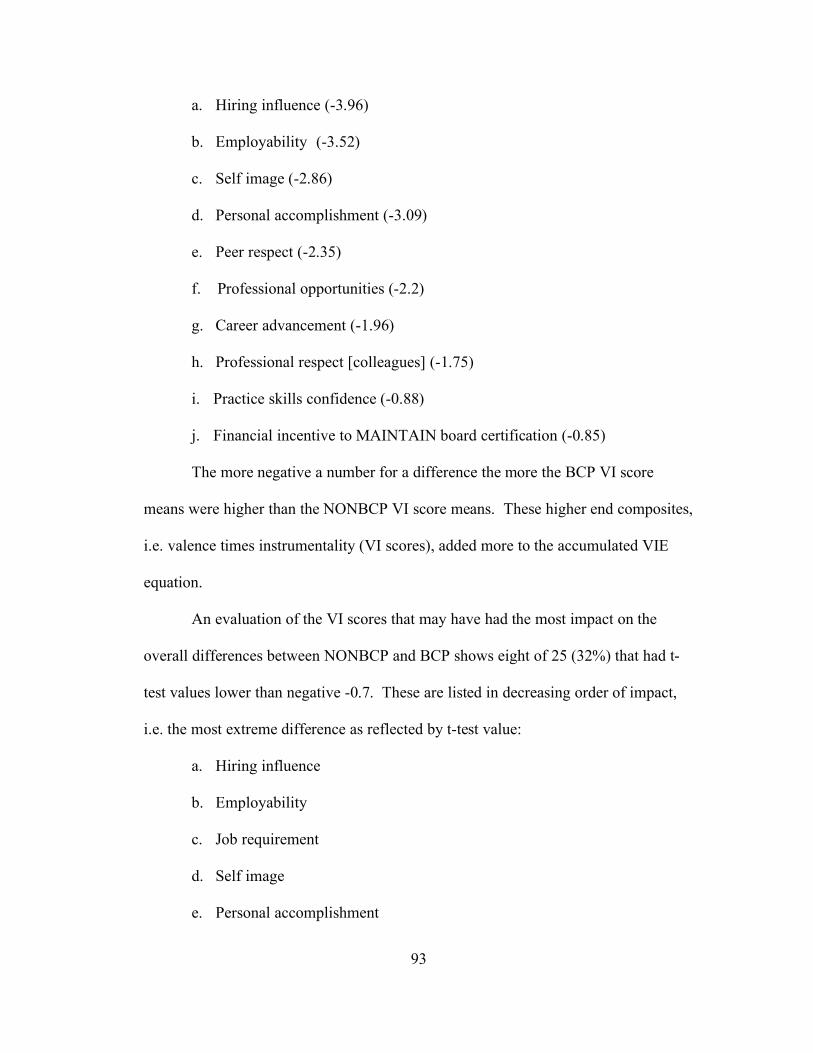
93
a. Hiring influence (-3.96)
b. Employability (-3.52)
c. Self image (-2.86)
d. Personal accomplishment (-3.09)
e. Peer respect (-2.35)
f. Professional opportunities (-2.2)
g. Career advancement (-1.96)
h. Professional respect [colleagues] (-1.75)
i. Practice skills confidence (-0.88)
j. Financial incentive to MAINTAIN board certification (-0.85)
The more negative a number for a difference the more the BCP VI score
means were higher than the NONBCP VI score means. These higher end composites,
i.e. valence times instrumentality (VI scores), added more to the accumulated VIE
equation.
An evaluation of the VI scores that may have had the most impact on the
overall differences between NONBCP and BCP shows eight of 25 (32%) that had t-
test values lower than negative -0.7. These are listed in decreasing order of impact,
i.e. the most extreme difference as reflected by t-test value:
a. Hiring influence
b. Employability
c. Job requirement
d. Self image
e. Personal accomplishment
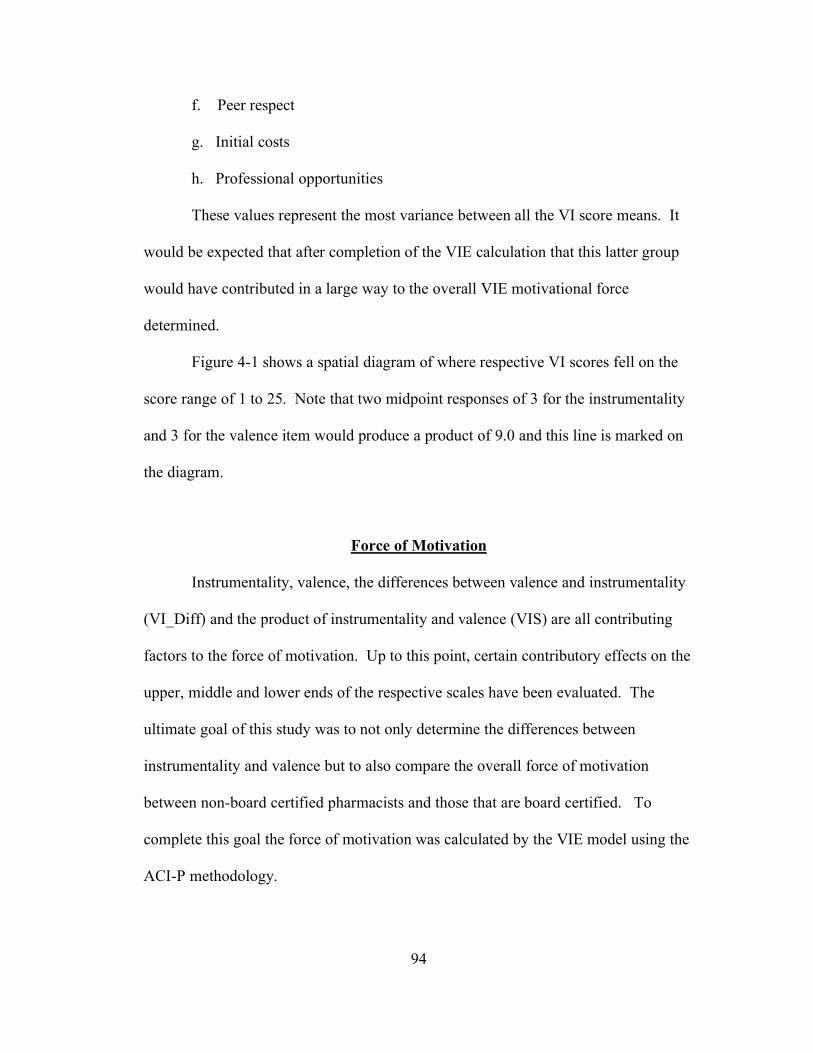
94
f. Peer respect
g. Initial costs
h. Professional opportunities
These values represent the most variance between all the VI score means. It
would be expected that after completion of the VIE calculation that this latter group
would have contributed in a large way to the overall VIE motivational force
determined.
Figure 4-1 shows a spatial diagram of where respective VI scores fell on the
score range of 1 to 25. Note that two midpoint responses of 3 for the instrumentality
and 3 for the valence item would produce a product of 9.0 and this line is marked on
the diagram.
Force of Motivation
Instrumentality, valence, the differences between valence and instrumentality
(VI_Diff) and the product of instrumentality and valence (VIS) are all contributing
factors to the force of motivation. Up to this point, certain contributory effects on the
upper, middle and lower ends of the respective scales have been evaluated. The
ultimate goal of this study was to not only determine the differences between
instrumentality and valence but to also compare the overall force of motivation
between non-board certified pharmacists and those that are board certified. To
complete this goal the force of motivation was calculated by the VIE model using the
ACI-P methodology.

95
VIS
ScoreNONBCP BCP
25
24.5
24
23.5
23
22.5
22
21.5 Personal Accomplishment
21
20.5
20
19.5
19
18.5 Personal Accomplishment Self Image
18
17.5 Employable, Professional Ops, Peer Respect
17 Professional Respect
16.5 Hiring Influence, Fin Maintain, Prac Skills Conf
16 Career Advancement
15.5Self Image, Professional Respect, FIN Maintain,
Prac Skills Conf
15 Prof Ops, Peer Respect Credibility, FIN Seek
14.5 Career Advancement
14 Employable, Credibility, FIN Seek
13.5 Academic Ops
13 Improved Network
12.5 Hiring Influence, Improved Network Initial Costs
12 Academic Ops Downsizing Protection
11.5 Higher Salary
11 Higher Salary, Downsizing Protection Increased Responsibility
10.5 Increased Responsibility
10 Initial Costs, Annual Costs Paid Cert Costs, Promotion Pot, Job Requirement
9.5 Annual Costs, Non-Prof Resp
9 Non-Prof Resp, Promotion Pot Public Notice
8.5 Public Notice
8 Paid Cert Costs
7.5
7 Job Requirement
6.5 One Time Bonus One Time Bonus
6
5.5
5
4.5
4
3.5
3
2.5
2
1.5
1
Figure 4-1. VIS Score Relative Values for Non-Board Certified and Board Certified
Pharmacists from 2007 ACI-P Survey. VIS= Valence-times-
Instrumentality score, ACI-P = Advanced Certification Index for
Pharmacists. Midpoint is 9.0.

96
Table 4-9 examines the components needed to complete this final step of the
calculation and to determine if there was a tipping point, i.e. a point where a
prediction could be made as to whether a pharmacist was board certified or non-board
certified. If so, that knowledge and methodology may be used to determine if a
qualified pharmacist would have proper motivational force to pursue board
certification.
Expectancy, as defined earlier, refers to the expectation, or anticipated chance
of success of an effort leading to successful performance. In this case that would be
the exertion of effort leading to achievement of the designation of board certified
in a specialty by BPS. In the VIE equation it has a pivotal role in that it can
contribute enough negative or positive influence to change the overall VIE
motivational force (MF) outcome. For example:
a. If the summed VIS is a total of 400, which would be a high score
representing a response of 4 for an instrumentality and 4 for a response on
valence and the multiplied to reach 16 and then those 16 scores were
summed to make 25 x 16 = 400;
b. and there were two expectancy scores of 2 and 5;
c. the resultant products for the overall VIE calculation would be;
d. 2 x 400 = 800 for the low end of the expectancy (Exp) and;
e. 5 x 400 = 2000;
With the same high level of VIS, the resultant VIE (MF) score could be as
much as 250% larger based on the expectancy contribution. There were examples of
this type of occurrence in the survey findings just as there were examples where a

97
Table 4-9. Differences in Expectancy, Sums of VIS and Motivational Force as
Calculated by ACI-P, (SD), between Board Certified (BCP) and Non-
Board Certified Pharmacists (NONBCP)
Measures of ACI-P Scoring
Methodology
Non-Board
Certified
(SD)
Board
Certified
(SD)
NONBCP
minus BCP
difference
t value p two-
tailed
Expectancy 4.05
(0.95)
4.4
(0.66) -0.35 -9.16 <.0001*
Sums of all Valence x
Instrumentality Calculations
303.54
(101)
343.82
(83) -40.28 -8.03 <.0001*
Motivational Force (MF) based
on ACI-P
1248.8
(540)
1521.0
(457) -272.2 10.15 <.0001*
Confidence Intervals (95%) of
MF from ACI-P Score 1201-1296 1499-1544
*=Statistically Significant

98
lower level of VIS, e.g. a neutral score of 3 for instrumentality times a 3 for valence
across the board yielded a VIS low sum score, e.g. 225, but the expectation of
success (Exp = 5) was high and that yielded a relatively high VIE (MF) score, e.g.
1125 (225 x 225 = 1125). These are very simple examples to demonstrate the effects
of the Exp (expectancy) component of the VIE calculation. The VIS scores were
much more complicated than what was demonstrated here and, since they were an
accumulated (summed) result of 25 separate VI scores, the variance within those 25
separate PVI groups was considerable.
Table 4-9 depicts that there was a significant difference between the mean
expectancy (Exp) for the NONBCP and the BCP. The NONBCP mean was 4.05 and
the BCP mean was 4.4. The difference between these was -0.35. The overall impact
on the VIE, or motivational force (MF), calculations had a higher contribution by the
board certified pharmacists than did the expectancy of the non-board certified
pharmacists. So, in addition to being statistically significant the difference in these
two means had a material impact on the final calculated MF.
Table 4-9 also shows a significant difference between the summed VI scores.
The NONBCP mean was 303.5 and the BCP mean was 344. The difference between
these was -40.3. The overall impact on the VIE (MF) calculations had a higher
contribution by the board certified pharmacists than did the VI score accumulations
(sums) of the non-board certified pharmacists. This shows that, in addition to being
statistically significant, the difference in these two means had a material impact on
the final calculated MF.

99
The final calculated motivational force (MF) via the VIE calculation yielded a
mean of 1249 (95% CI 1201 – 1296) for NONBCP and a mean of 1521 (95% CI
1499 – 1544). These were different statistically at a p < 0.0001. The difference
between the means was -272 (95% CI -321 to -224).
There were significant differences in every measure of the VIE components
throughout the data. In addition, these were material to the final calculation and there
was a clear separation of the 95% confidence intervals for the calculated MF for
NONBCP and BCP. Pharmacists scoring an ACI-P score on this survey between
1201 and 1206 were 95% of the time NONBCP. Pharmacists scoring an ACI-P score
on this survey between 1499 and 1544 were 95% of the time BCP. There was a
tipping point at approximately 1500 where a pharmacist would be likely to be a board
certified pharmacist. At this point the ACI-P appears to be an accurate predictor of a
pharmacist’s board certification status. ACI-P scores are stratified by BCP and
NONBCP and the scores are different between groups.
Validity of Survey Instrument
Validity is a measure of the amount to which a survey instrument is actually
measuring what it is intended to measure. There are different types of validity. One
type is called face validity. This is the degree to which an instrument appears to
measure a construct or what it is intended to measure. Face and content validity for
the ACI-P was established by using a Delphi panel in a pilot survey prior to the
primary research.

100
Construct validity is a measure of how well a survey instrument measures a
pre-defined or hypothesized pattern predicted by a model, theory or an a priori
assumption. If the position of the research is to validate a structure, or constructs,
then the comparison would be to determine if the predicted matched the actual and
this would be performed by confirmatory factor analysis. Table 4-10 demonstrates
the findings from the data on the four proposed domains, or constructs, from the ACI-
P. These were in fact established not to prove but as a basis for development of
questions that had instrumentality and valence pairs within each of these domains.
There were statistically significant differences in each of the four compared a priori
domains.
These a priori domains were calculated by summing the instrumentality and
valences products from each PVI group within the items that belonged to that domain.
The relative values of each within the NONBCP or BCP groups were not pivotal and
not very meaningful since they had different numbers of questions within that domain
and therefore would have had different anticipated sum scores. The differences
between the NONBCP and BCP groups are meaningful because they do have the
same number of questions within each domain.
All four of the proposed domains do demonstrate a considerable difference.
Therefore, as components of the overall VI scores, the items within each of these
contributed in the same general direction, i.e. with the NONBCP lower on every
measure than the BCP.
An exploratory factor analysis (EFA) was performed on the data to determine
measurement constructs. The initial loading on the factors demonstrated a one factor

101
Table 4-10. Differences in VIS for a priori Proposed Domains, (SD), between Board
Certified (BCP) and Non-Board Certified Pharmacists (NONBCP)
VIS a priori Domains
Non-Board
Certified
(SD)
Board
Certified
(SD)
NONBCP
minus BCP
difference
t value p two-
tailed
VIS – Professional 66.85
(23.6)
74.5
(20) -7.65 -6.53 <.0001*
VIS – Personal 71.67
(25.3)
81.05
(20.9) -9.38 -7.47 <.0001*
VIS – Career 89.9
(37.4)
106.6
(31.8) -16.7 -8.97 <.0001*
VIS – Financial 75.14
(27.6)
81.7
(27.9) -6.56 -4.56 <.0001*
*Statistically significant.
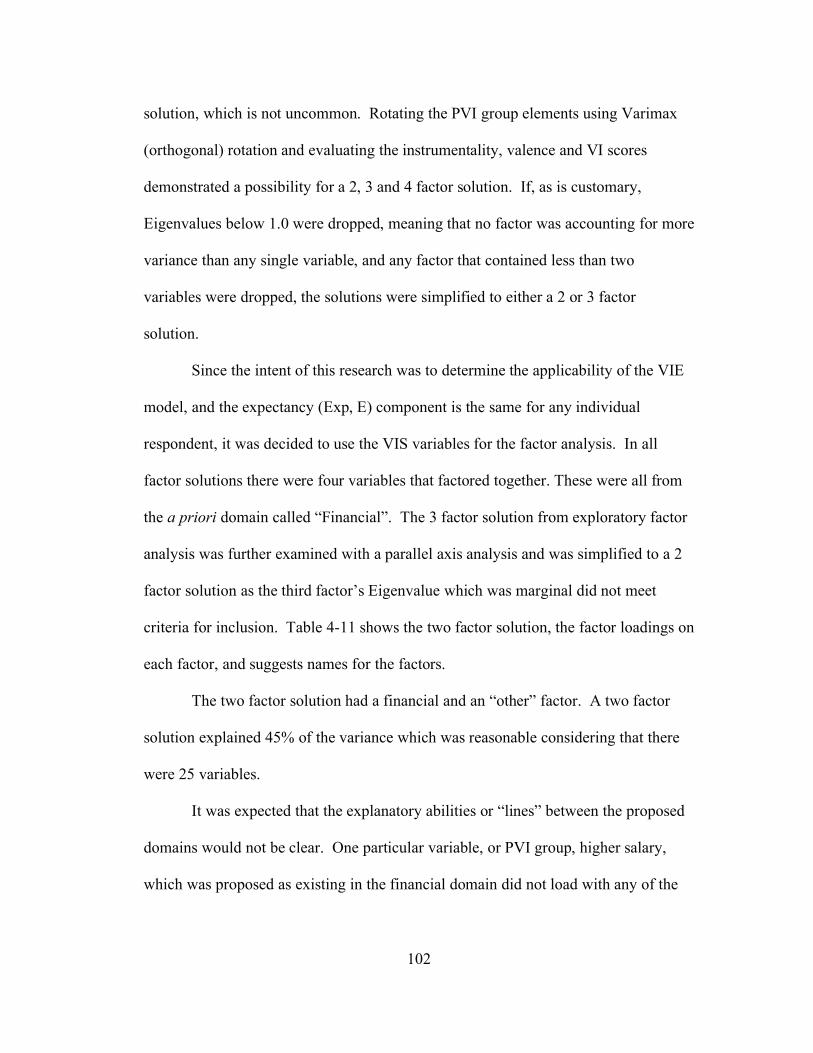
102
solution, which is not uncommon. Rotating the PVI group elements using Varimax
(orthogonal) rotation and evaluating the instrumentality, valence and VI scores
demonstrated a possibility for a 2, 3 and 4 factor solution. If, as is customary,
Eigenvalues below 1.0 were dropped, meaning that no factor was accounting for more
variance than any single variable, and any factor that contained less than two
variables were dropped, the solutions were simplified to either a 2 or 3 factor
solution.
Since the intent of this research was to determine the applicability of the VIE
model, and the expectancy (Exp, E) component is the same for any individual
respondent, it was decided to use the VIS variables for the factor analysis. In all
factor solutions there were four variables that factored together. These were all from
the a priori domain called “Financial”. The 3 factor solution from exploratory factor
analysis was further examined with a parallel axis analysis and was simplified to a 2
factor solution as the third factor’s Eigenvalue which was marginal did not meet
criteria for inclusion. Table 4-11 shows the two factor solution, the factor loadings on
each factor, and suggests names for the factors.
The two factor solution had a financial and an “other” factor. A two factor
solution explained 45% of the variance which was reasonable considering that there
were 25 variables.
It was expected that the explanatory abilities or “lines” between the proposed
domains would not be clear. One particular variable, or PVI group, higher salary,
which was proposed as existing in the financial domain did not load with any of the
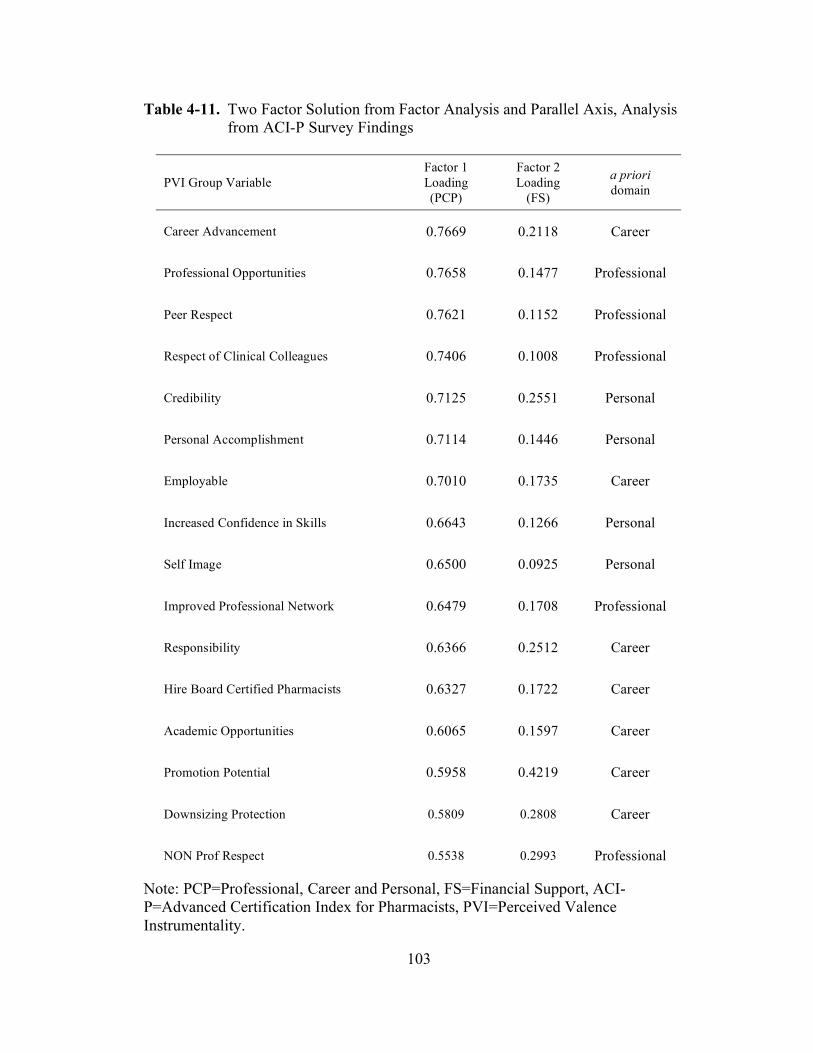
103
Table 4-11. Two Factor Solution from Factor Analysis and Parallel Axis, Analysis
from ACI-P Survey Findings
PVI Group Variable
Factor 1
Loading
(PCP)
Factor 2
Loading
(FS)
a priori
domain
Career Advancement 0.7669 0.2118 Career
Professional Opportunities 0.7658 0.1477 Professional
Peer Respect 0.7621 0.1152 Professional
Respect of Clinical Colleagues 0.7406 0.1008 Professional
Credibility 0.7125 0.2551 Personal
Personal Accomplishment 0.7114 0.1446 Personal
Employable 0.7010 0.1735 Career
Increased Confidence in Skills 0.6643 0.1266 Personal
Self Image 0.6500 0.0925 Personal
Improved Professional Network 0.6479 0.1708 Professional
Responsibility 0.6366 0.2512 Career
Hire Board Certified Pharmacists 0.6327 0.1722 Career
Academic Opportunities 0.6065 0.1597 Career
Promotion Potential 0.5958 0.4219 Career
Downsizing Protection 0.5809 0.2808 Career
NON Prof Respect 0.5538 0.2993 Professional
Note: PCP=Professional, Career and Personal, FS=Financial Support, ACI-
P=Advanced Certification Index for Pharmacists, PVI=Perceived Valence
Instrumentality.

104
Table 4-11. Continued.
PVI Group Variable
Factor 1
Loading
(PCP)
Factor 2
Loading
(FS)
a priori
domain
Necessary for Job 0.5155 0.2217 Career
Public Notice of Completion 0.4679 0.1708 Personal
Higher Salary 0.4539 0.3690 Financial
Financial SEEK 0.1970 0.6717 Financial
Financial MAINTAIN 0.2026 0.6592 Financial
Recertification Costs Paid by Employer 0.0316 0.6328 Financial
Initial Costs Paid 0.0422 0.5453 Financial
One Time Bonus paid 0.2251 0.5236 Financial
Annual Salary Increase 0.4153 0.4981 Financial
Note: PCP=Professional, Career and Personal, FS=Financial Support, ACI-
P=Advanced Certification Index for Pharmacists, PVI=Perceived Valence
Instrumentality.

105
other financial factors and may have been regarded by pharmacists as a perception of
work “worth” rather than a financial consideration. It was close to being a split factor
loading but did meet the criteria for inclusion since the factor loading was > 0.4. The
two factor solution fit the survey findings.
These two constructs and number of PVI group variables associated with them
were:
1. Professional, Career and Personal (PCP), 19 PVI groups
2. Financial Support (FS), 6 PVI groups
In both of the final factors, PCP and FS, the same general pattern was seen,
i.e. the relative comparison of cumulative VI scores shows that the NONBCP scores
(means) was between 87-92% of the BCP. The PCP has the greatest difference where
NONBCP was 87% of BCP group. The FS group was slightly closer with the
NONBCP at 92% of the BCP group. Table 4-12 lists differences between NONBCP
and BCP for the two factors.
Reliability of Survey Instrument
The ACI-P is a survey instrument created specifically for this research. As
such, it had not been evaluated for reliability. Reliability is essentially the extent to
which a survey will provide the same results with repeated measurements or would
this same test given in the future produce reliable results.
A method of the measurement of reliability for a survey instrument is
Cronbach’s alpha83, 87, 88
. There are three measures of reliability; they are stability,
equivalence and consistency. Cronbach’s coefficient alpha measures consistency.
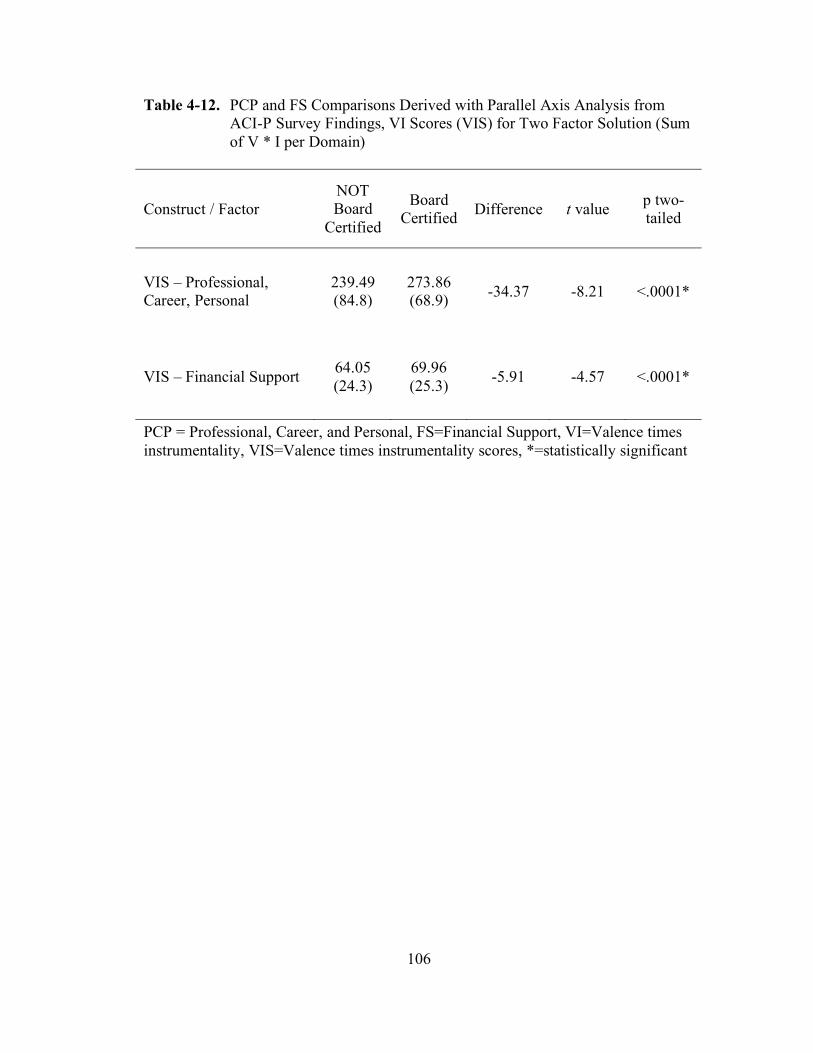
106
Table 4-12. PCP and FS Comparisons Derived with Parallel Axis Analysis from
ACI-P Survey Findings, VI Scores (VIS) for Two Factor Solution (Sum
of V * I per Domain)
Construct / Factor
NOT
Board
Certified
Board
Certified Difference t value
p two-
tailed
VIS – Professional,
Career, Personal
239.49
(84.8)
273.86
(68.9) -34.37 -8.21 <.0001*
VIS – Financial Support 64.05
(24.3)
69.96
(25.3) -5.91 -4.57 <.0001*
PCP = Professional, Career, and Personal, FS=Financial Support, VI=Valence times
instrumentality, VIS=Valence times instrumentality scores, *=statistically significant

107
This test is frequently the primary measure of estimating internal consistency with a
test or survey instrument.88
The Cronbach’s alpha reliability coefficient was computed using SAS on the
measures of the ACI-P that were directly reported and not computed. These were the
recorded responses for questions and were related to instrumentality and valence for
the overall measures within each factor. Cronbach’s alpha has not been confirmed to
be accurate using two measures reported and then computed based on responses on a
test or survey. The responses on the valence and instrumentality questions were used
to compute the valence x instrumentality score (VIS) which was used for the primary
factor analysis.
The value of raw versus standardized alpha coefficients is, at times, a point of
contention so both values are supplied in Table 4-13. They were nearly the same to
two decimal points in most of the alpha calculations. No questions from either the
instrumentality or valence sections had to be removed to increase alpha.
There was no posited level of Cronbach’s alpha that would be judged
acceptable to establish reliability for this survey instrument. For the purposes of this
research and for this instrument the questions existing in PVI groups are the most
important aspect because neither of the individual scales (instrumentality or valence)
is used alone and they are in fact presented in pairs on the ACI-P. The combined
instrumentality plus valence values in Table 4-9 are the most important.
Table 4-13 lists the Cronbach’s alpha for several measures. The standardized
alpha for all was above the established baseline of an alpha of 0.7, which is a
commonly accepted conservative level. Reliability coefficients of 0.5 are acceptable
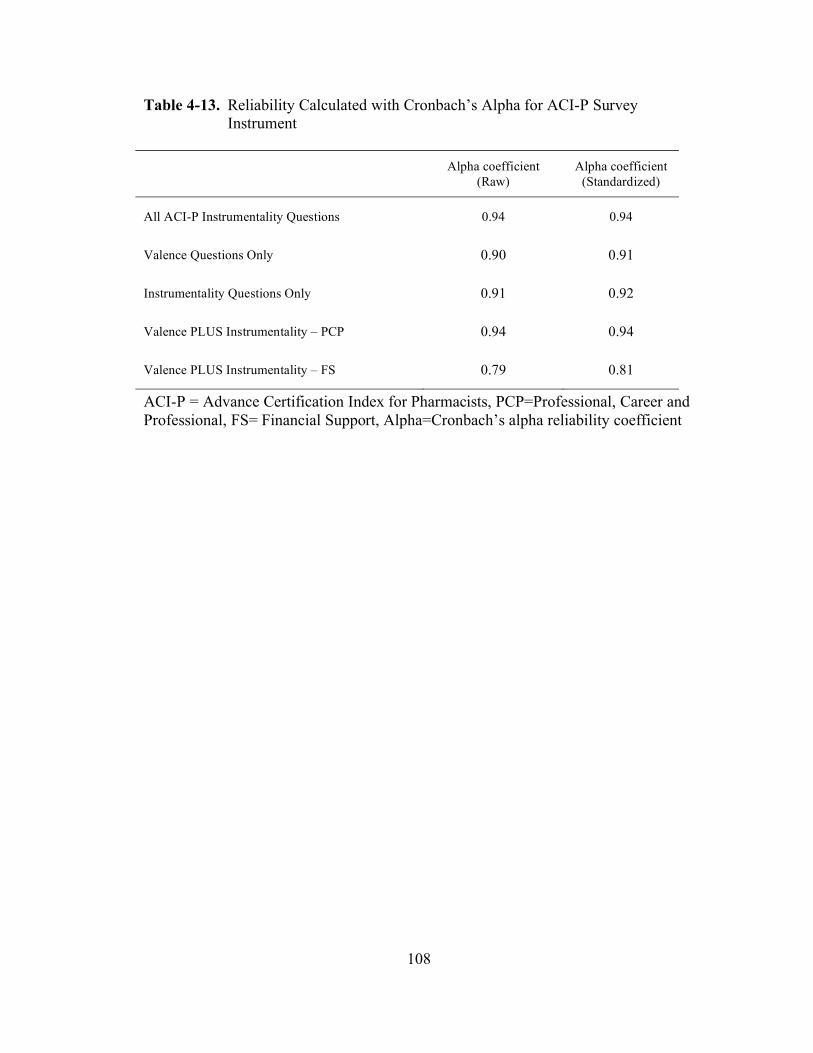
108
Table 4-13. Reliability Calculated with Cronbach’s Alpha for ACI-P Survey
Instrument
Alpha coefficient
(Raw)
Alpha coefficient
(Standardized)
All ACI-P Instrumentality Questions 0.94 0.94
Valence Questions Only 0.90 0.91
Instrumentality Questions Only 0.91 0.92
Valence PLUS Instrumentality – PCP 0.94 0.94
Valence PLUS Instrumentality – FS 0.79 0.81
ACI-P = Advance Certification Index for Pharmacists, PCP=Professional, Career and
Professional, FS= Financial Support, Alpha=Cronbach’s alpha reliability coefficient

109
in some areas of research. The final alpha coefficient for each of the 2 factor
solutions, listed by ACI-P domain constructs, and based on instrumentality PLUS
valence questions and responses were:
1. Professional, Career and Personal – 0.94
2. Financial Support – 0.81
Additionally, the overall standardized Cronbach’s alpha for the questions
related to the overall survey, instrumentality, and valence were:
3. All PVI groups – 0.94
4. Instrumentality – 0.91
5. Valence – 0.90
The overall test items within the instrumentality and valence groups were
found reliable. The two factored constructs of professional, career and personal
(PCP), and financial support (FS) were reliable via calculated internal consistency
with the alpha reliability coefficient.
Comparison of 2004 BPS Survey Findings and 2007 ACI-P Findings
Table 1-1 showed the responses listed in 2004 by board certified pharmacists
as tangible and intangible benefits that BPS certification may bring to the pharmacist.
The ACI-P survey included these same question concepts. These were not directly
asked but were the same as the PVI groups which contained an instrumentality and
valence question. The ACI-P VI Scores were used for comparison.
The differences in survey findings from the BPS 2004 survey and findings
from the ACI-P survey in 2007 are listed in Table 4-14 and in Table 4-15 which is a
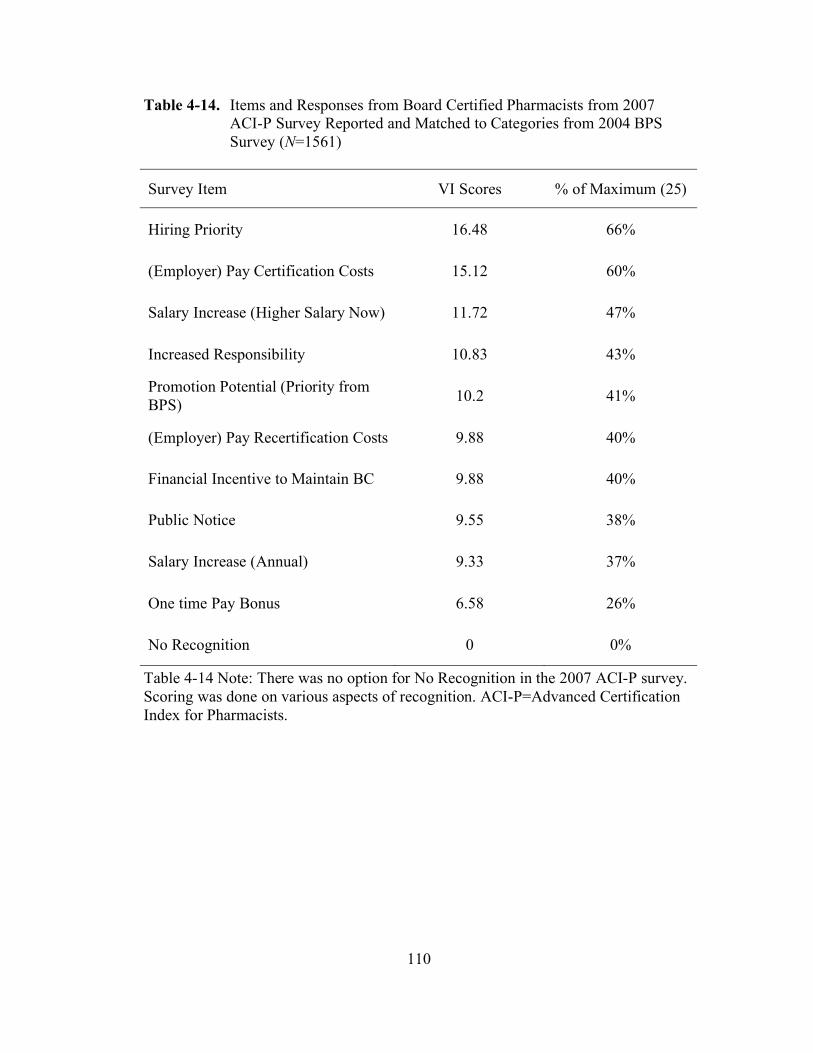
110
Table 4-14. Items and Responses from Board Certified Pharmacists from 2007
ACI-P Survey Reported and Matched to Categories from 2004 BPS
Survey (N=1561)
Survey Item VI Scores % of Maximum (25)
Hiring Priority 16.48 66%
(Employer) Pay Certification Costs 15.12 60%
Salary Increase (Higher Salary Now) 11.72 47%
Increased Responsibility 10.83 43%
Promotion Potential (Priority from
BPS) 10.2 41%
(Employer) Pay Recertification Costs 9.88 40%
Financial Incentive to Maintain BC 9.88 40%
Public Notice 9.55 38%
Salary Increase (Annual) 9.33 37%
One time Pay Bonus 6.58 26%
No Recognition 0 0%
Table 4-14 Note: There was no option for No Recognition in the 2007 ACI-P survey.
Scoring was done on various aspects of recognition. ACI-P=Advanced Certification
Index for Pharmacists.

111
Table 4-15. Tangible and Intangible Benefits That BPS Certification May Bring To
the Pharmacist as Reported in BPS Online Survey Results 2004
(Redisplay of Table 1-1)63, 64
Survey Item Number of Responses % of Responses
Pay Certification Costs 686 34%
No Recognition 618 31%
Pay Recertification Costs 433 22%
Public Notice 325 16%
Hiring Priority 324 16%
Salary Increase 302 15%
Pay BPS Annual Fee 296 15%
Increased Responsibility 224 11%
Promotion Priority 137 7%
One-time Pay Bonus 98 5%
BPS = Board of Pharmaceutical Specialties
112
repeat of information seen in Table 1-1 but sorted in descending order to facilitate
comparison.
Comparison of this data was problematic. The top five findings in both
groups were similar. Table 4-16 shows a side by side comparison of relative
sequence. There were no easily discernible patterns observed by comparing these
two as the 2004 BPS survey allowed multiple answers, as did the 2007 ACI-P survey,
but with different question or item types.
Comparison of Additional Comments from 2007 ACI-P Survey
At the conclusion of the fifty-one questions that covered instrumentality,
valence and expectations for the ACI-P and the 16 questions related to pharmacist
demographics was a single comment opportunity. This final section was in the form
of a statement and said simply, “Additional comments related to board certification in
Pharmacy practice:” This was not addressed or referred to in the directions. The
purpose of this question was to allow users to offer their candid comments on board
certification in Pharmacy.
Of the 2,057 total survey respondents, 324 (15.8%) offered additional
comments. These comments were in form of narrative and more than one subject was
addressed or offered by many of the pharmacists resulting in a total of 620 comments
recorded and these divided by the two groups into 228 responses from 115
pharmacists (36.8% of responses and 35.5% of pharmacists) for the non-board
certified pharmacists. The board certified pharmacists responding recorded 392
responses from 209 pharmacists (63% of responses and 64.5% of pharmacists).
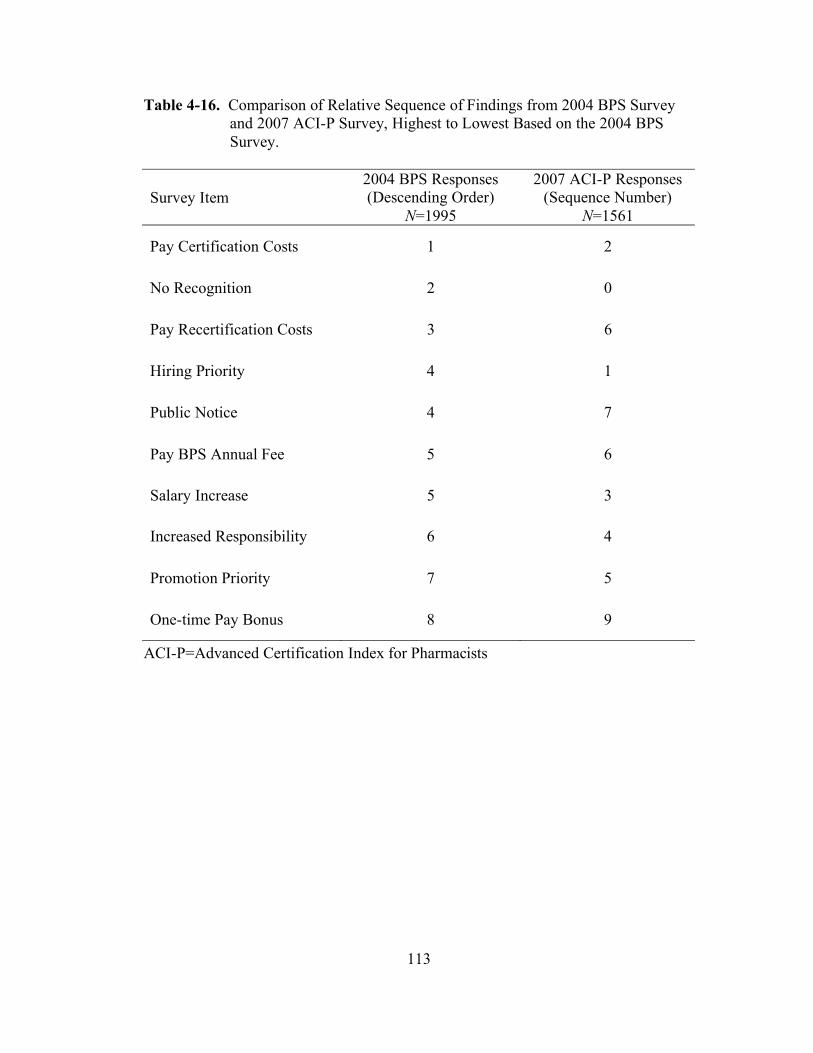
113
Table 4-16. Comparison of Relative Sequence of Findings from 2004 BPS Survey
and 2007 ACI-P Survey, Highest to Lowest Based on the 2004 BPS
Survey.
Survey Item
2004 BPS Responses
(Descending Order)
N=1995
2007 ACI-P Responses
(Sequence Number)
N=1561
Pay Certification Costs 1 2
No Recognition 2 0
Pay Recertification Costs 3 6
Hiring Priority 4 1
Public Notice 4 7
Pay BPS Annual Fee 5 6
Salary Increase 5 3
Increased Responsibility 6 4
Promotion Priority 7 5
One-time Pay Bonus 8 9
ACI-P=Advanced Certification Index for Pharmacists

114
A review and analysis of the data suggested that the responses fell into some general
areas. These are listed in Table 4-17. These comments were thought to be a large or
medium effect, because they were offered by the respondent and therefore did not
have to depend on interpretation of a pre-defined scale, an amount to be statistically
meaningful in each group would be 27 respondents and a total of 54 for a large effect
or 65 respondents in each group for a total of 130 for a medium effect per Cohen’s
d.81
It was determined that a “large effect” sample size was sufficient for this
additional finding group and the number to be included within each group was 27
respondents. It was determined that the overall responses that were over 27 in either
group were the most important. This list included the items found in Table 4-18.
If a further reduction in the findings were focused on the items from Table 4-
18 that had 27 responses in both groups then the most important overall findings were
those listed in Table 4-19. Essentially, these three would be the ones that are the
most important.

115
Table 4-17. Comparison of Non-Board Certified (NONBCP) and Board Certified
Pharmacists (BCP) Findings from Additional Comments and Questions
(Responses=620, Respondents=324)
Findings from Additional Comments NONBCP
(N=228)
BCP
(N=392)
Need more Specialization / Board Certification
Process Has Not Kept Pace 55% 34%
Value Unrecognized / Academic Preparation is
Sufficient 50% 38%
Costs too High / Not enough Return on
Investment 23% 27%
Makes No Difference in my Practice 17% 8%
Test Not Equal to Ability 13% 8%
Commentary on Survey / Questions 13% 29%
Don’t See Better Practice in Other BCPs 10% 1%
Board Certification is the way to / Easiest way
to get Additional Letters after Name 9% 28%
Method to Make Money / CE Needed for
Retesting 6% 10%
Required 4% 1%
Too Specialized / Not General Enough 1% 2%
Too Much US Practice Focus 0% 1%
BCP = Board Certification in Pharmacy practice, CE=Continuing Education.

116
Table 4-18. General Findings from Additional Comments; Responses Greater than
27 per Item in either NONBCP or BCP group (N = 591)
CE = Continuing Education
Findings from Additional Comments Number of
Responses
Percent of
Responses
Need More Specialization /
Board Certification Process Has Not Kept Pace 135 41.7%
Value Unrecognized/Academic Preparation is Sufficient 135 41.7%
Costs Too High/ Not Enough Return on Investment 83 25.6%
Commentary on Survey/Questions 76 23.5%
Board Certification is The Way to Go/
Easiest way to get Additional Letters after Name 68 21.0%
Makes No Difference in My Practice 35 10.8%
Test Not Equal to Ability 31 9.6%
Method to Make Money/CE Needed for Retesting 28 8.6%

117
Table 4-19. General Findings from Additional Comments: Responses Greater than
27 in NONBCP and BCP groups (N=353)
Findings from Additional Comments Number of
Responses
Percent of
Responses
Need More Specialization / BC Has Not Kept
Pace 135 41.7%
Value Unrecognized / Academic Prep OK 135 41.7%
Costs Too High / Not Enough ROI 83 25.6%
BC = Board certification in Pharmacy practice, ROI = Return on investment.

118
Chapter 5. Study Discussion and Conclusions
"All human actions have one or more of these seven causes: chance, nature,
compulsion, habit, reason, passion, desire."
--Aristotle
Discussion
The passions, interests and/or influences that cause people to take action have
been the subjects of study through the ages. The study of motivation has seen
pioneers, many of whom were reviewed earlier, make attempts to either explain or
quantify these influences. Categorization and a qualitative approach is a convenient
way to attempt to summarize or encapsulate these influences. Quantification of these
influences, i.e. motivational forces, has been somewhat more elusive. This study has
posited that the Expectancy Valence (VIE) model could be applied to equivalently
qualified pharmacists that were eligible to pursue specialty certification in Pharmacy
practice known as board certification, via the Board of Pharmaceutical Specialties, to
determine why some would choose this path and others would not. This was found to
be true in that the motivational force calculated by the Advanced Certification Index
for Pharmacists (ACI-P) showed a significant difference between the two groups.
The realms of medication management and clinical Pharmacy practice
continue to get more and more complicated. The impact of pharmacists on
the economic, clinical, and humanistic outcomes of patients has been increasing.
With the current, and anticipated escalating, level of new drugs and treatment
modalities, as well as biotechnology drugs, the need for advanced knowledge levels
119
for these new advents is considerable. Some would argue that the role of formal
traditional Pharmacy education is to prepare pharmacists for that knowledge level.
Pharmacy continuing education would then continue the process of assuring that
pharmacists stay current.
But that presupposes that the education received, as well as training in the
customary curricula, covers all the specifics of any particular practice area within the
profession. Some would argue that the difficulty in achieving this level of specific
training in itself supports specialization. Board Certification on the other hand is
designed to define the parameters by which a pharmacist could be validated as a
specialty practitioner. Differences in opinion of the needs to be a pharmacy
practitioner exist and some of the fundamental issues revolve around the types of
education, training, residencies, certifications and degrees one must hold to be
classified as an expert in a particular field of practice.
Additional Comments Analysis
The additional comments section at the end of the ACI-P survey had a fair
response rate (N=324, 15.8% of all respondents). A considerable number of
pharmacists in this survey who were asked to offer their opinions of board
certification in general felt that the board certification process is either excessive or
that specialization is not specialized enough and therefore does not meet their needs.
These were diametrically opposed opinions. Pharmacists responding to this
commentary based survey question, as listed in Table 5-1, reported that about 42%

120
Table 5-1. Summarized Findings from Additional Comments with Combined
Groups (N=461)
Findings from Additional Comments Number of
Responses
Percentage of
Responses
Need More Specialization / BC Has Not Kept
Pace 135 41.7%
Value recognized / Academic Prep OK 135 41.7%
Financial Perceptions 111 34.3%
Not Proven in Practice 80 24.7%
BC = Board Certified in Pharmacy practice
121
(135 of 324) of the time there was a need for more specialization and that perhaps the
process of board certification in Pharmacy had not kept pace with their needs. Others
reported at the same rate, 42% (135 of 324), that the value was unrecognized for
board certification and that academic preparation was adequate. Another important
result from these narrative responses was that about 26% (83 of 324) of the
respondents found the costs for board certification to be too high or that the costs did
not return enough on investment. These three areas are important focal points for any
future messages developed to convey the importance and need for board certification.
Some findings from the comments entries that did not make inclusion, since these
were categorized differently, would be important if they were combined as “not
proven in practice”. These would be “makes no difference in my practice”, “test not
equal to ability” and “don’t see better practice in other BCPs”. With this new
combined group the percentage of overall pharmacists falling into this “not proven in
practice” would be 24.7% (35 + 32 + 13/ 324). This may be important to the process
of board certification since this sentiment was a more exaggerated finding in the non-
board certified pharmacist group (Table 4.13). An additional combination group
could be the “financial perceptions”. These would include “costs too high/not enough
ROI” and “method to make money/CE needed to for recertification”. As a combined
variable of financial perceptions this group, which just fell under the 27 cut point on
one of the four previously included groups, would represent 34% (111 of 324) of
findings. A summary of the findings from these responses is listed in Table 5-1.

122
Instrumentality
Instrumentality differences were noted between the non-board certified
pharmacists and the board certified pharmacists. Instrumentality is a perceived or
known probability that a performance will lead to an outcome. It is also called a
performance-to-outcome expectancy (P O). The board certified pharmacists had a
higher instrumentality on 20 of 25 (80%) of the instrumentality measures in the
survey and these were statistically significant.
The responses to these eight questions were the most pronounced:
a. I would hire a board certified practitioner over another non-board certified
practitioner with otherwise equal qualifications.
b. I would become more employable if I were board certified.
c. My self image will be improved by becoming board certified.
d. I will have increased peer respect by becoming board certified.
e. I will feel a sense of personal accomplishment by becoming board
certified.
f. My initial certification costs will be paid by my employer.
g. My professional opportunities will improve with board certification.
h. Board certification will become necessary for my job.
If this research was based on the instrumentality scale alone these items would
be the points of most interest. They would also perhaps offer a window on areas to
improve the perception of board certification. The most interesting finding in this
comparison may be that despite statistically significant differences in the two groups
the overall accumulated instrumentality scores was near the neutral score for both

123
groups. This means that the perceived likelihood of reward of each of the PVI
groups was nearly neutral.
There was also a group that was about the same. The items and responses in
this group were:
a. Increased financial incentive from my employer would cause me to
MAINTAIN board certification (Both about 3.8).
b. I will receive a higher annual salary if I am board certified (both about
2.6).
c. Non-professional co-workers will respect my board certification status
(both about 2.7).
d. I will have increased responsibility in my job after becoming board
certified (both about 2.7)
e. I will be more likely to be promoted by my employer if I am board
certified (both about 2.6)
Only one of the members of this grouping was not different statistically and
was positive (3.8). That one however is quite telling. Financial incentive from an
employer seems important to both the non-board certified and board certified
pharmacists to an equivalent degree. This is an important finding and may be the
basis for an important communication regarding board certification. The other four
of the non-different group were about the same for the BCP and NONBCP groups,
however they were all on the negative side (< 3.0). If these issues are to be
considered important to the profession and to the status of board certification, they
will need to be addressed as they are obviously not considered likely to occur.

124
Valence
Valence differences were more pronounced than those seen with the
instrumentality items. Instrumentality may be something outside of the control of the
pharmacist. It is in essence a measure of the current environment in which they work,
live, and operate. Perhaps responses on these items were a pragmatic statement of
their reality. It was not surprising that the instrumentality scores were relatively
neutral, with some exceptions, since these findings may be a true measure of
pharmacist’s thoughts on rewards associated with board certification. These
perceptions of low reward may be linked to the large numbers of pharmacists that
have not sought board certification.
In general the valence scores were higher than the instrumentality scores.
There were 23 of 25 that were statistically different between the non-board certified
pharmacists and those that were board certified. The valence differences were seen at
the highest level for four items. These were, in descending order of the most
difference noted:
a. I value that my job will require board certification.
b. I value board certification enough to positively influence a hiring decision.
c. I value personal accomplishment demonstrated by a board certification.
d. I value promotions based on board certification.
For this particular group of comparative valences there was a more
pronounced difference than in the others. These are definitely areas where either
addressing the extreme differences in non-board certified pharmacist’s perceived
value would be indicated or where actions should be taken to achieve work place

125
acceptance and reward for board certification. Alternatively, it may indicate that
board certification does not have a place and is not valued by many pharmacists.
In three of the questions, the valences reported by the BCP’s were about the
same as those listed by the NONBCP group and were not statistically different. This
group was:
a. I value my self image.
b. I value increased confidence in my practice skills.
c. I value an improved professional network.
All three of these questions had responses above 3.8 so values attributed to all
three issues were higher than the mid-point (3 on the 5 point scale). Although these
responses are not very different statistically, the findings in the three above 3.8 are on
the positive side of the scale. In other words, despite the fact that they don’t differ
greatly, the overall perception of these valences, in both groups, was positive
indicating a potential opportunity area for perfecting communication and a clear
message regarding the value of board certification to pharmacists and to some extent
employers.
All of the responses captured on the valence items were summed. Both
groups were on the higher end with the NONBCP group at 95.8 versus 75 (higher
than neutral) and the BCP group at 102.2 versus 75 (higher than neutral).
Similarly, taking a mean of the means for the valences shows that the BCP
group is slightly higher but both groups are on the positive side of the scale for
valence, i.e. their general impression of values for these items was high.

126
In the VIE equation, scores calculated for the valence scores had a positive
influence, i.e. > 3.0, effect on the calculations.
Valence Times Instrumentality (VI_Score)
Two breakpoints were established for the low and high end means of the VI
scores (VIS). These were a product of < 9.0 for the negative range and product of
16.0 for valence in the high positive range. Regardless of how the scale extremes
occur with the VIS each of the contributory VIS products are accumulated and
summed in the VIE methodology. Therefore, even if many of the VIS products did
not measure as being on the high or low end, they did accumulate to a summary score
and each had some additive contribution to the summary score.
There were a total of 6 of 25 (24%) of the VI scores for PVI groups that had at
least one mean (NONBCP or BCP) below 9.0. These were:
a. Job requirement
b. Paid certification costs
c. Promotion potential
d. Public notification
e. Non-professional respect (p = 0.09, not significant)
f. One time bonus (p = 0.9, not significant)
Of these, only non-professional respect and one-time bonus were not
statistically different. All of these VI score means fell into the negative range.
Within the VIE calculation they made a contribution to the sums of all the VI scores
but their impact was less than those that are more positive, i.e. above a 9.0 product.

127
There were 10 of 25 (40%) that had at least one VI score mean for either
NONBCP or BCP above 16.0. All 10 of those were different statistically between
the non-board and board certified pharmacists. These were, in descending order from
highest difference of means to lowest difference (with NONBCP minus BCP
differences in means noted in parentheses):
a. Hiring influence (-3.96)
b. Employability (-3.52)
c. Self image (-2.86)
d. Personal accomplishment (-3.09)
e. Peer respect (-2.35)
f. Professional opportunities (-2.2)
g. Career advancement (-1.96)
h. Professional respect [colleagues] (-1.75)
i. Practice skills confidence (-0.88)
j. Financial incentive to MAINTAIN board certification (-0.85)
The more negative a number for a difference the more the BCP VI score
means were higher than the NONBCP VI score means. This higher end composite,
i.e. valence times instrumentality (VI) scores added more to the accumulated VIE
calculation.
An evaluation of the VI scores showed that 8 of 25 (32%) had the most impact
on the overall differences between NONBCP and BCP. These are listed in
decreasing order of impact, i.e. the most extreme difference as indicated by t value to
the lowest level within the group.

128
a. Hiring influence
b. Employability
c. Job requirement
d. Self image
e. Personal accomplishment
f. Peer respect
g. Initial costs
h. Professional opportunities
These values represent the most variance between all the VI score means.
This group contributed more to the completion of the VIE calculation and to the
resultant calculation of motivational force.
Valence Minus Instrumentality (VI_Diff)
The valence-minus-instrumentality scores were covered in detail in Chapter
IV. This was a computation to determine the extremes of the differences in the two
scales. There were 13 of 25 (52%) that did not differ statistically. Therefore the
differences in valence and instrumentality were about the same for both groups.
Within this group, five of the PVI group overall responses had at least one mean
value greater than 0.9, or nearly one full level of response higher for the valence than
the instrumentality. These represented a higher level of perception of value than for
instrumentality (reward).
The five PVI groups falling into this group listed by PVI group name were:
129
a. Paid recertification costs
b. Higher salary
c. Downsizing protection
d. Increased responsibility
e. Practice skills confidence
There were also two extreme findings on the VI_Diff scale where there were
statistically different groups; these were where BCP responses were higher than
NONBCP and where NONBCP responses were higher than BCP.
The BCP higher than NONBCP VI_Diff statistically significant end of the
responses showed four PVI groups. These, listed in order of greatest difference
descending to lowest, were:
f. Promotion potential
g. Job requirement
h. One time bonus
i. Annual salary increase
All values were negative for this group, which means that the perceptions of
value for the board certified pharmacists were higher compared to the non-board
certified pharmacists. Three of these, promotion potential, one time bonus and annual
salary increase, had at least one mean value of 0.9 or greater representing almost a
full level higher (on the 1-5 scale) for the valence than for the instrumentality.
On the other end of the scale for comparison of this group were the positive
values where the non-board certified pharmacists’ perceptions of value were higher
than the board certified pharmacists. The following PVI groups showed areas where

130
the non-board certified pharmacists had a higher difference in valence-minus-
instrumentality responses than did the board certified pharmacists.
a. Self image (0.6)
b. Employability (0.38)
c. Professional opportunities (0.33)
d. Initial costs (0.4)
e. Peer respect (0.25)
f. Career advancement (0.21)
g. Professional respect (0.18)
Of this group, five had at least a one VI_Diff mean in one of the groups
greater than 0.9. These were self image, employability, professional opportunities,
initial costs, and career advancement. In all of these, particularly the five with the
highest differences, there may be an opportunity to close the gap between perceived
value and instrumentality. A focus here would be to improve the likelihood that some
of the things that the non-board certified pharmacists held in high value but that they
felt would not come to pass would actually be realized. This area may represent an
opportunity to refine the message of board certification to employers and emphasize
the importance and value of a board certification.
The purpose of the VI_Diff evaluation was to further examine the differences
seen on overall comparison of valences and instrumentalities in the preceding
sections. The VI differences were not used in the computation of any values for the
final motivational force.

131
Motivational Force Computations
A methodology to calculate and compare motivational force between groups
was a primary endpoint of this research. Instrumentality, valence and the product of
instrumentality and valence were all contributing factors to the force of motivation
within the VIE model. Expectancy, as defined earlier, refers to the expectation, or
anticipated chance of success of an effort leading to successful performance. In this
case that would be exertion of effort leading to achievement of the designation of
board certification in a specialty by BPS. In the VIE equation it has a pivotal role in
that it can contribute enough negative or positive influence to change the overall VIE
(motivational force [MF]) outcome. There was a statistically significant difference
between the mean expectancy (Exp) for NONBCP and BCP. The NONBCP mean
was 4.05 and the BCP mean was 4.4. The difference between these was -0.35. The
overall impact on the VIE, or motivational force (MF), calculations was a higher
contribution by the board certified pharmacists than was the expectancy of the non-
board certified pharmacists. In addition to being statistically significant the
difference in these two means had a material impact on the final calculated MF.
The final calculated motivational force (MF) via the VIE calculation yielded a
mean of 1249 (95% CI 1201 – 1296) for NONBCP and a mean of 1521 (95% CI
1499 – 1544). These were statistically and materially different. The difference
between the means was -272 (95% CI -321 to -224) indicating a large separation
between the two groups (22% of the NONBCP mean and 18% of the BCP mean).
Pharmacists scoring an ACI-P score in this data between 1201 and 1206 were
95% of the time NONBCP. Pharmacists scoring an ACI-P score on this survey

132
between 1499 and 1544 were 95% of the time BCP. There was a tipping point at
approximately 1500 (1500 - 1520) where a pharmacist would be found to be board
certified in Pharmacy practice 95% of the time.
Validity and Reliability of ACI-P
The Advanced Certification Index for Pharmacists (ACI-P) proved to be a
valid and reliable tool. Validation of constructs demonstrated that there were two
factors, or domains, rather than the four proposed. These were:
1. Professional, Career and Personal
2. Financial Support
Construct validity was established with these two factors. Face and content
validity was established by a pilot survey. Reliability was confirmed for the two
factors using Cronbach’s alpha with alpha reliability coefficient values of 0.94 for the
professional, career and personal (PCP) construct and 0.81 for financial support (FS).
Additionally, the overall ACI-P had an alpha coefficient of 0.94, the instrumentality
scale had an alpha of 0.91 and the valence scale had an alpha of 0.9. All of these
were equal to or above the criterion established of 0.7 and therefore demonstrate
internal consistency of the test items.
There were material differences in certain areas of instrumentality, expectancy
and VI scores. Expectancy of successful completion of the board certification
process weighed heavily in establishing motivational force. The two factors
(domains) found in the structure of the ACI-P were professional, career and personal
(PCP), and financial support (FS). These were different than the a priori proposed

133
domains but still include the initial classifications, only they are combined rather than
in existence separately as originally proposed. The standardized alpha for all was
above the established conservative baseline of alpha of 0.7 which is a commonly
accepted level, although minimum levels as low as 0.5 are accepted by some.83,84
The
final alpha for each of the 2 factor solutions, listed by ACI-P domain constructs, and
based on instrumentality PLUS valence questions and responses were:
1. Professional, Career and Personal – 0.94
2. Financial Support – 0.81
The overall Cronbach’s alpha reliability coefficient for the ACI-P was 0.94.
Tipping Point Confirmed
A tipping point of a score of 1500 on the ACI-P exists. Pharmacists scoring
between 1499 and 1544 on the ACI-P are 95% of the time board certified
pharmacists. The ACI-P was not intended as a predictive indicator but the data
suggests that given at the appropriate point in a pharmacist’s career it could indicate
whether they will or will not pursue board certification. Since that “career point”
may move or change based on external endpoints or by changes in the acceptance of
board certification’s importance or value, a point in time score for a pharmacist would
not be expected to be accurate for any length of time. The length of time of accuracy
for scores and findings from the ACI-P is a point for future research.

134
Limitations of the Study
1. There was no way to control duplicate entries by pharmacists as the survey
instrument was internet based and did not limit one user to one entry.
2. There was no way to prevent non-pharmacists from completing the survey.
3. It could be argued that non-board certified pharmacists have no specialty area
of practice and therefore may have a different point of reference than those
that are board certified in a specialty.
4. There are no totals of board certified and non-board certified pharmacists that
received notification of the survey and therefore no response rate could be
calculated.
5. Access to the internet could have provided information on what was not truly
a cross section of the pharmacist population.
6. Members of the participating pharmacy organizations may not have been truly
representative of the pharmacist population in the United States.
Conclusions
This research was enhanced by the cooperation, support and participation by
four major Pharmacy organizations and the Board of Pharmaceutical Specialties. No
surveys of this magnitude including this many Pharmacy organizations were found in
the literature. The cooperative nature and high interest given this project by these
different, and sometimes disparate organizations, demonstrates that there is high
interest in this particular area.
135
If board certification is to move into a leadership role for advancing the
practice of Pharmacy and establishing the standards from which it originated, there
are 12 points that must be addressed. The separate recommendations listed below are
based on approximately five years of study on this issue, research findings from this
study on the numerical scales, free text commentary captured for 16% of the
respondents, voluntary offers of opinions from thought leaders during this research
and 27 years of work place experience.
Recommendations for the Future of Board Certification in Pharmacy
• Recommendation 1. Employer recognition of the value of board certification
in Pharmacy practice must be improved.
• Recommendation 2. Tangible and intangible rewards for pharmacists
achieving board certification must be identified and improved.
• Recommendation 3. The significant differences between board certified and
non-board certified pharmacists as far as perceptions of value must be
addressed via promotion, communication and/or engagement of non-board
certified pharmacists.
• Recommendation 4. The essentially neutral perception of rewards by both
board certified and non-board certified pharmacists must be addressed via
promotion, communication and/or engagement by other means.
• Recommendation 5. The relatively high range of perceptions of value for both
board certified and non-board certified pharmacists form a strength and should
be used as a basis for fashioning a positive promotional message.

136
• Recommendation 6. Financial aspects related to board certification must be
addressed. These include perceptions in general of costs to reward or return
on investment. Solutions should be sought for shifting the costs from the
individual practitioner.
• Recommendation 7. Proof of superiority of practice skills and/or improved
patient outcomes by board certified practitioners is a fundamental need and
must be proven.
• Recommendation 8. Evaluations of current applicability of board certification
categories and recommendations for future needs must be undertaken.
• Recommendation 9. Some consideration should be given to bringing
pharmacists that have been practicing for many years into the fold of board
certification. Peer evaluation along with specified didactic material
completion seems reasonable. A non-test mechanism for this effort should be
evaluated.
• Recommendation 10. All Pharmacy organizations must financially support
and endorse board certification in Pharmacy practice for this credentialing to
have a growing future. A one time endowment of monies may be needed to
establish a higher base number of board certified pharmacists.
• Recommendation 11. The Advanced Certification Index for Pharmacists
(ACI-P) should be used as a tracking mechanism to see how actions taken
with regard to board certification affect the motivational force over time of
qualified pharmacists to seek board certification in Pharmacy practice.
Temptation to simplify the tool should be avoided as the specifics of the
137
survey instrument tool may help simultaneously and specifically track minor
changes on several scales.
• Recommendation 12. Additional efforts by BPS to ensure that its processes
remain current and credible, and to educate the profession and the public
about Board Certification in Pharmacy, will be resource-intensive. In order
for BPS to be successful and accomplish these goals, sufficient resources,
both financial and personnel, must be made available.
In this study, the investigator has developed an important survey instrument
for the study of motivational force with pharmacists and has made findings that are
both interesting and important to the profession of Pharmacy and to the future of
Pharmacy practice.
Contributions of this Research
Considerable contributions of this research included, but were not limited to,
the following:
• A survey instrument, the ACI-P, was developed based on a mathematical
model of motivation. This tool allows a quantification of motivational force
and motivating factors.
• The survey instrument was validated and the constructs of the validation were
found to be reliable.
• A survey that included cooperation of APhA, ASHP, ACCP and AACP as
well as the Board of Pharmaceutical Specialties was deployed. This
cooperative participation indicated a high level of interest and perhaps a

138
willingness to pursue a joint approach to the issues related to board
certification in Pharmacy practice.
• The survey instrument was deployed and all data retrieval was done using an
internet-based electronic communication and data collection methods. A good
response to the survey was achieved.
• Statistically significant differences in board certified and non-board
pharmacists were found for most measures of instrumentality. Information
was gleaned from this data that suggested changes in message and perhaps
direction for the profession of Pharmacy.
• Statistically significant differences in board certified and non-board
pharmacists were found for most measures of valence. Information was
gleaned from this data that suggested changes in message and perhaps
direction for the profession of Pharmacy.
• Statistically significant differences in board certified and non-board
pharmacists were found for most measures of valence-times-instrumentality
(VIS). Information was gleaned from this data that suggested changes in
message and perhaps direction for the profession of Pharmacy.
• Statistically significant differences in board certified and non-board
pharmacists were found for the calculated motivational force (MF).
Information was gleaned from this data that suggested changes in message
and perhaps direction for the profession of Pharmacy.
• Narrative based commentary offered by 324 pharmacists produced 620
meaningful findings that were classified and stratified into useable groups and

139
further enhanced the findings of the mathematical scales of the ACI-P. The
narrative component should be retained as a part of the survey instrument.
The findings in this research present opportunities as well as challenges for
Pharmacy practitioners, colleges of Pharmacy, professional organizations, and the
Board of Pharmaceutical Specialties. Specifically, pharmacists may wish to
reevaluate the importance of specialty certification, while colleges of Pharmacy may
wish to address curricula and their support of post-doctoral training programs. Also,
professional Pharmacy organizations may wish to enhance membership services,
programming, etc. that relate to and support the process of specialty certification via
board certification in Pharmacy practice.
Recommendations for Future Research
This study revealed a great deal of information regarding the differences
between board certified and non-board certified pharmacists. There are several
research projects that could be pursued based on the findings and conclusions of this
study. These could include the data collected from this research, use of the ACI- P
survey instrument, or be completely new directions for study. Some
recommendations for future research are:
• A cross sectional review of a comparison between BPS survey type questions
regarding demographic nuances between former surveys completed,
particularly the one BPS 2004 of only board certified pharmacists which was
not anonymous , and the findings from the 2007 ACI-P survey for board
certified and non-board certified pharmacists, which was anonymous.
140
• An evaluation of the ACI-P applied to various student class levels,
particularly the last two years and during residencies, to focus on changing
motivational factors during these years for a given set of students. Tracking
changes perceived in this population could establish a baseline for change
implementation effect.
• A broader test of ACI-P with full cooperation of all Pharmacy organizations
and the schools of Pharmacy to corroborate the findings from the ACI-P 2007
survey would be of great interest.
• A five year annual ACI-P survey process to determine if changes in support
of the board certification process are affecting motivation. This should be
paralleled with a tracking of number of pharmacists seeking and attaining
board certification in Pharmacy practice.
• Evaluation of the impact of extended board certification categories on
acceptance and propagation of board certification for pharmacists.
• Evaluation of the impact of a continuing education approach on
recertification retention rate.
• Evaluation of ACI-P 2007 compared to subsequent years to determine
specific profiles of pharmacists to establish a demographic profile of the
highly motivated pharmacist.
• Evaluation of regional, state, city, rural and urban influences on perceptions
of board certification and motivation may be an important research topic.
Evaluation should determine if influences are based on geographic or
economic area or on schools and colleges of Pharmacy.

141
• The ACI-P Survey Instrument and methodology could be used for other
health care or other disciplines, where a specialty certification is attainable
but not necessary, to determine force of motivation. Licensure requirements
may make this a more complex evaluation but it could be done. Validation is
needed in other disciplines.
• Additional data analysis and focus on sub-groups could provide valuable
insight and pave the way for the future of board certification in Pharmacy
practice and for the way Pharmacy is practiced in the future.
There are many other things to consider and study with the information
gleaned from the 2007 ACI-P survey. This is an exciting frontier for Pharmacy
research that has little precedent. A renewed focus and interest on specialty
certification in Pharmacy practice could help propel the Pharmacy profession into the
next century at the forefront of healthcare.
The Advanced Certification Index for Pharmacists is a valuable tool and its
creation and validation will benefit the profession of Pharmacy. Tracking specific
areas of pharmacist’s perceptions can provide the profession with insights into
particular strengths or needs. Acting and addressing these needs and using strengths
as a basis could lead to a material increase in the numbers of board certified
pharmacists. Likewise, not acting on the needs identified by the differences in
perceptions, as indicated by the motivational factors and calculated motivational level
as indicated by the ACI-P, may result in specialty certification in Pharmacy practice
continuing to be an exception that is pursued and maintained by only a very small
segment of practicing pharmacists.

142
List of References
1. Long D. 2003 U.S. pharmaceutical market: trends, issues, forecasts.
Available from http://www.imshealth.com. Accessed December 4, 2004.
2. Outlook 2003. Boston: Tufts Center for the Study of Drug Development;
2003.
3. 418 biotechnology medicines in testing promise to bolster the arsenal against
disease. Medicines in Development-Biotechnology. Available from
http://www.phrma.org/new_medicines_in_development_for_biotechnology.
Accessed January 10, 2007.
4. Board certification and you. Board of pharmaceutical specialties: over 20
years of service to the public and the Pharmacy profession: Report from Board
of Pharmaceutical Specialties; 1995:17.
5. Over 20 years of service to the public and the Pharmacy profession: the
Pharmacy specialty certification program. Available from
http://www.bpsweb.org/About.BPS/About.BPS.shtml. Accessed February 6,
2005.
6. Gourley DR. Accreditation and certification programs: who benefits? Paper
presented at: NABP's Executive Officer's Conference; October 2, 1995;
Loew's L'enfant Plaza, Washington, DC.
7. Fenniger LD. Specialization and specialty recognition in the healing
professions. Am J Hosp Pharm. 1991(48):476-480.
8. 2007 Candidate's Guide. Specialty certification in: nuclear Pharmacy,
nutrition support Pharmacy, oncology Pharmacy, pharmacotherapy,
psychiatric Pharmacy. Available from
http://www.bpsweb.org/04_Exams.html. Accessed September 6, 2007.
9. Talbert RL, Bertin RJ. Specialization in Pharmacy practice. Remingtons
Pharmaceutical Sciences; 2005.
10. Calder G. Motivating pharmacists. Pharmaceutical Journal. May 13
2000;264(7096):729-731.
11. Turnley W. Chapter 16 Managing employee motivation and performance.
Available from http://info.cba.ksu.edu/turnleys/MANGT420/ch16.ppt.
Accessed September 5, 2007.
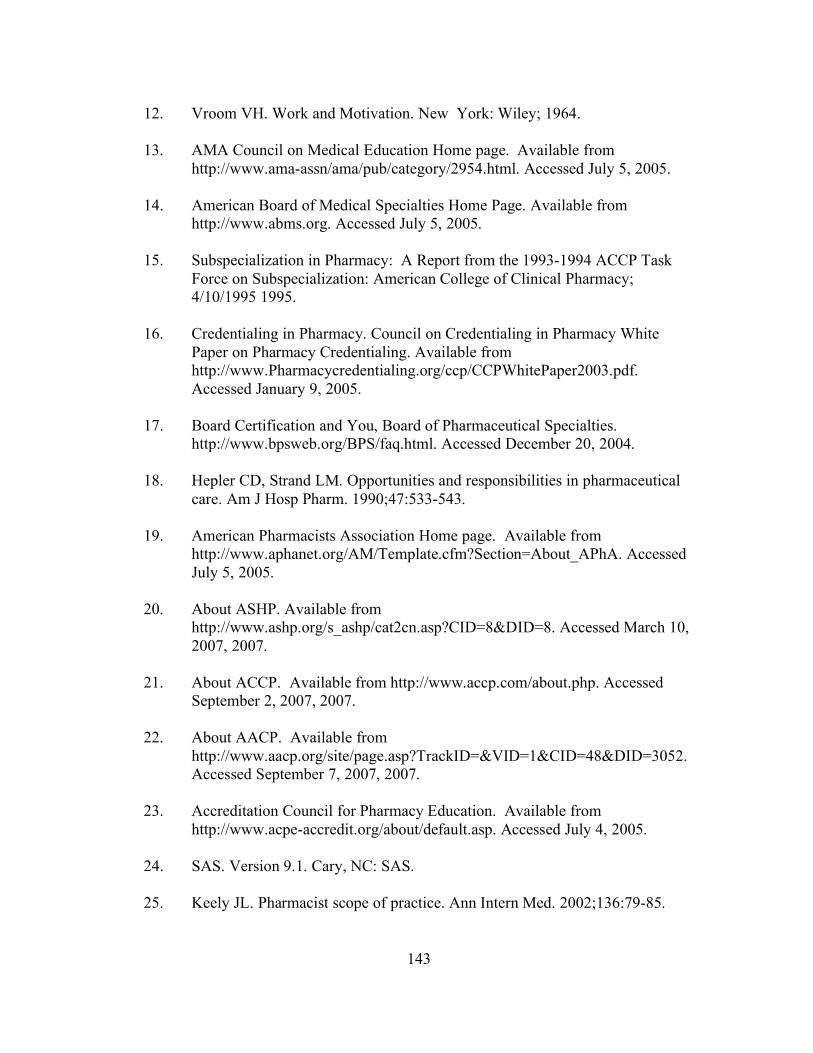
143
12. Vroom VH. Work and Motivation. New York: Wiley; 1964.
13. AMA Council on Medical Education Home page. Available from
http://www.ama-assn/ama/pub/category/2954.html. Accessed July 5, 2005.
14. American Board of Medical Specialties Home Page. Available from
http://www.abms.org. Accessed July 5, 2005.
15. Subspecialization in Pharmacy: A Report from the 1993-1994 ACCP Task
Force on Subspecialization: American College of Clinical Pharmacy;
4/10/1995 1995.
16. Credentialing in Pharmacy. Council on Credentialing in Pharmacy White
Paper on Pharmacy Credentialing. Available from
http://www.Pharmacycredentialing.org/ccp/CCPWhitePaper2003.pdf.
Accessed January 9, 2005.
17. Board Certification and You, Board of Pharmaceutical Specialties.
http://www.bpsweb.org/BPS/faq.html. Accessed December 20, 2004.
18. Hepler CD, Strand LM. Opportunities and responsibilities in pharmaceutical
care. Am J Hosp Pharm. 1990;47:533-543.
19. American Pharmacists Association Home page. Available from
http://www.aphanet.org/AM/Template.cfm?Section=About_APhA. Accessed
July 5, 2005.
20. About ASHP. Available from
http://www.ashp.org/s_ashp/cat2cn.asp?CID=8&DID=8. Accessed March 10,
2007, 2007.
21. About ACCP. Available from http://www.accp.com/about.php. Accessed
September 2, 2007, 2007.
22. About AACP. Available from
http://www.aacp.org/site/page.asp?TrackID=&VID=1&CID=48&DID=3052.
Accessed September 7, 2007, 2007.
23. Accreditation Council for Pharmacy Education. Available from
http://www.acpe-accredit.org/about/default.asp. Accessed July 4, 2005.
24. SAS. Version 9.1. Cary, NC: SAS.
25. Keely JL. Pharmacist scope of practice. Ann Intern Med. 2002;136:79-85.

144
26. Bertin RJ. Results of previous BPS post-examination surveys. In: Tankersley
M, ed. Memphis, TN: Board of Pharmaceutical Specialties; 2004.
27. Fenniger LD. Specialization and specialty recognition in the healing
professions. Am J Hosp Pharm. 1991;(48):476-480.
28. Stevens R. American medicine and the public interest; a history of
specialization. Berkeley: Univ of California Press; 1998.
29. American Board of Medical Specialists. Available from
http://www.abms.org/about.asp. Accessed November 13, 2004.
30. Slogoff S, Hughes FP, Hug CC, et al. A demonstration of validity for
certification by the American Board of Anesthesiology. Acad Med.
1994;69:740-746.
31. Sharp LK, Bashook PG, Lipsky MS, et al. Specialty board certification and
outcomes: the missing link. Acad Med. 2002;77:534-542.
32. Bond AC, Raehl CL, Franke T. Clinical Pharmacy services and hospital
mortality rates. Pharmacotherapy 1999;19:556-564.
33. Report on the Status of Board Certification in Pharmacy. Washington, DC:
Board of Pharmaceutical Services; 2005.
34. The Pharmacy professsion: transitioning from prescription provider to health
care manager. American Pharmaceutical Association.
http://www.Pharmacyandyou.org/about/pharmcarefacts.html. Accessed
December 21, 2004.
35. Outcomes of pharmaceutical outcomes research-impact of studies funded:
final report. Rockville, MD: Agency for Health Care Policy and Research;
October 2001. Publication No. 02-R201.
36. Brophy GM, Tesoro EP, Schrote GL, Garnett WR. Pharmacist impact on
posttraumatic seizure prophylaxis in patients with head injury.
Pharmacotherapy. 2002;22(2):251-255.
37. McAllister D, Schrommer JC, McAuley JW, et al. Comparison of skilled
nursing and assisted living residents to determine potential benefits of
pharmacist intervention. Consultant Pharmacist. 2000;15:1110-1116.
38. Bootman JL, Harrison DL, Cox E. The health care cost of drug-related
morbidity and mortality in nursing facilities. Arch Intern Med.
1997;157:2089-2096.
145
39. Willett MS, Bertch KE, Rich DS, Ereshefsky L. ACCP Official Position
Statement: Prospectus on the economic value of clinical Pharmacy services.
Pharmacotherapy. November 1, 1989 1989;9(1):45-56.
40. Hatoum HT, Catizone C, Hutchinson RA, Purohit A. An eleven-year review
of the Pharmacy literature: documentation of the value and acceptance of
clinical Pharmacy. Drug Intell Clin Pharm. 1986(20):33-48.
41. Reid LD, McKenna DA, Horn JR. Meta-analysis of research on the effect of
clinical pharmacokinetics services on therapeutic drug monitoring. Am J Hosp
Pharm. 1989(46):945-951.
42. Tett SE, Higgins GM, Armour CL. Impact of pharmacist interventions on
medication management by the elderly: a review of the literature. Ann
Pharmacotherapy. 1993(27):80-86.
43. Hatoum HT, Akhras K. 1993 Bibliography: a 32-year literature review on the
value and acceptance of ambulatory care provided by pharmacists. Ann
Pharmacotherapy. 1993(27):1106-1119.
44. Peterson AM, Taklya L, Finley R. Meta-analysis of trials of interventions to
improved medication adherence. Am J Hosp Pharm. 2003;60(7):657-665.
45. Machado M, Bajcar J, Guzzo GC, Einarson TR. Sensitivity of patient
outcomes to pharmacist interventions. Part I: Systematic review and meta-
analysis in diabetes management. Ann Pharmacother; 2007.
46. Jenkins MH, Bond CA. The impact of clinical pharmacists on psychiatric
patients. Pharmacotherapy. 1996(16):708-714.
47. Lipton HL, Bero LA, Bird JA, McPhee SJ. The impact of clinical pharmacists'
consultations on physician's geriatric drug prescribing. Med Care.
1992(30):646-658.
48. Saseen JJ, Grady SE, Hansen LB, Hodges BM, Kovacs SJ, al e. Future
clinical Pharmacy practitioners should be board-certified specialists.
Pharmacotherapy. 2006;26(12):1816-1825.
49. Schumock GT, Butler MG, Meek PD. Evidence of the economic benefit of
clinical Pharmacy services: 1996-2000. Pharmacotherapy. 2003(23):113-132.
50. Helling DK, Nelson KM. How to develop and implement a program to
continuously demonstrate the value of clinical Pharmacy services.
Pharmacotherapy. 2000;20 (10 PT 2)(S340-343).
146
51. McMullin ST, Hennenfent JA, Ritchie DJ, et al. A prospective randomized
trial to assess the cost impact of pharmacist-initiated interventions. Arch Int
Med. 1999;159:2306-2309.
52. Evidence of the value of the pharmacist. Alliance for pharmaceutical care.
Partners to improve health outcomes. Available from
http://www.accp.com/position/paper6.pdf. Accessed December 8, 2003.
53. Carmichael JM, O'Connell MB, Devine B, et al. Collaborative drug therapy
management by pharmacists. Pharmacotherapy. 1997;17:1050-1061.
54. Berringer R, Shibley MC, Cary CC, Pugh CB, Powers PA, Rafi JA. Outcomes
of a community Pharmacy-based diabetes monitoring program. J Am Pharm
Assoc. 1999;39:791-797.
55. Gattis WA, Hasselblad V, Whelan DJ, O'Conner CM. Reduction in heart
failure events by addition of a clinical pharmacist to the heart failure
management team: Results of the Pharmacist in Heart Failure Assessment
Recommendation and Monitoring (PHARM) Study. Arch Int Med.
1999;159:1938-1945.
56. Leape LL, Cullen DJ, Clapp MD, et al. Pharmacist participation on physician
rounds and adverse drug events in the intensive care unit. JAMA.
1999;282:267-270.
57. Farris KB, Kumbera P, Halterman T, Fang G. Outcomes-based pharmacist
reimbursement: reimbursing pharmacists for cognitive services, part 1. J
Manag Care Pharm. 2002(8):383-393.
58. Snella KA, Trewyn RR, Hansen LB, Bradberry JC. Pharmacist compensation
for cognitive services: focus on the physician office and the community
Pharmacy. Pharmacotherapy. 2004(24):372-388.
59. Bertin RJ. Employer Information Profile of BPS Pharmacists. In: Tankersley
M, ed. Memphis, TN; 2006.
60. "Fast Facts" for Certification. Available from
http://www.bpsweb.org/04_Exams.html. Accessed September 7, 2007.
61. Bertin RJ. Results of previous BPS post-examination surveys. In: Tankersley
M, ed. Memphis, TN: Board of Pharmaceutical Specialties; 2004.
62. Bertin RJ. Sanity Check. In: Tankersley M, ed; 2007.

147
63. Results of 2004 BPS Examinations Announced. Pharmacy Specialization. Vol
14; 2004:6.
64. Bertin RJ. In: Tankersley M, ed. Memphis; 2005:Electronic mail correction of
data from 2004 BPS Newsletter.
65. Huitt W. Maslow's hierarchy of needs. Educational Psychology Interactive.
Available from http://chiron.valdosta.edu/whuitt/col/regsys/maslow.html.
Accessed January 9, 2007.
66. Maslow AH. A theory of human motivation. Psychological Review. July
1943:370-396.
67. Alderfer C. Existence, relatedness, & growth. New York: Free Press; 1972.
68. Schermerhorn JR. PowerPoint Presentation to Accompany Chapter 14 of
Management, 8/e. Available from
http://www.mime.eng.utoledo.edu/people/faculty/rbennett/engineering_manag
ement/Powerpoint%20Slides/ch14.ppt. Accessed September 3, 2007.
69. Existence, relatedness, growth - ERG theory. Available from
http://www.valuebasedmanagement.net/methods_alderfer_erg_theory.html.
Accessed February 10, 2007, 2007.
70. McClelland’s theory of needs. Available from
http://www.netmba.com/mgmt/ob/motivation/mcclelland. Accessed August
21, 2007.
71. Herzberg F, Mausner B, Snyderman BB. The motivation to work. New York:
John Wiley & Sons; 1959.
72. Lawler EE. Motivation in Work Organizations. Monterey, CA: Brooks/Cole;
1973.
73. Herzberg's Motivation-Hygiene Theory (Two Factor Theory). Available from
http://www.netmba.com/mgmt/ob/motivation/herzberg/. Accessed September
7, 2007.
74. Adams JS. Inequity in social exchange. Adv Exp Soc Psychol. 1965;62:333-
343.
75. Huseman RC, Hatfield JD, Miles EW. A new perspective on equity theory:
the equity sensitivity construct. The Academy of Management Review.
1987;12(2):222-234.

148
76. Lathem G, Locke E. Building a practically useful theory of goal setting and
task motivation. American Psychologist. 2002;57(9):705-717.
77. Locke EA. Motivation through conscious goal setting. Applied and Preventive
Psychology. 1996;5(117-124).
78. Antoni C. Management by Objectives – an effective tool for teamwork? The
International Journal of Human Resource Management. February
2005;16(2):174-184.
79. Lawler EE. Pay and organization effectiveness: a psychological view. New
York: McGraw-Hill; 1971.
80. Tabachnick BG, Fidell LS. Using Multivariate Statistics. 4th ed. MA: Allyn
and Bacon; 2001.
81. Cohen J. Statistical power analysis for the behavioral sciences. 2nd ed. New
Jersey: Lawrence Erlbaum; 1988.
82. Costello AB, Osborne JW. Best practices in exploratory factor analysis: four
recommendations for getting the most from your analysis. Practical
Assessment, Research & Evaluation. July 2005;10(7):3-4.
83. Gourley GK, Gourley DR, Rigolosi EL, Reed P, Solomon DK, Washington E.
Development and validation of the pharmaceutical care satisfaction
questionnaire. American Journal of Managed Care. May 2001;7(5):463.
84. Nunally J. Psychometric Theory. 2nd ed. New York, NY: McGraw-Hill Co;
1978.
85. 2005 Nuclear Pharmacy Examination; Demographic Survey: Board of
Pharmacy Specialties; 2005:4.
86. Finley R. SurveyMonkey.com. Available from http://SurveyMonkey.com;
Accessed July 5, 2007.
87. Cronbach LJ. Coefficient alpha and the internal structure of tests.
Psychometricka. 1951;16:297-334.
88. Chong HY. An introduction to computing and interpreting Cronbach
coefficient alpha in SAS. Available from
www2.sas.com/proceedings/sugi26/p246-26.pdf. Accessed September 2,
2007.

149
Appendix A

150
Advanced Certification Index for Pharmacists (ACI-P)
Manual Version Adapted from Internet Based Survey
© Copyright Mark A. Tankersley, All Rights Reserved.
Directions and Consent
This survey seeks your opinions on the factors that may influence a pharmacist’s
decision to seek board certification in a Pharmacy specialty. The survey should take
no more than 15 minutes.
Your input is important whether you have no intention of pursuing board certification
in Pharmacy practice, intend to pursue in the future, have already completed the
certification or were previously board certified.
This survey is based on two components of each factor that may be related to pursuit
of specialty certification in Pharmacy practice. These components are: 1) the
probability of occurrence as you perceive it, and 2) the value of that particular factor.
Definitions:
For the probability of occurrence (the first part of each question) the scale is a
measure of perceived probability with the lower end “Will not occur” being the
lowest probability of occurrence and “Will definitely occur” being the highest.
For the value assessment, the lower end value of “No value” means the lowest value
to you as a pharmacist and “Highly valuable” means the highest value to you. Please
check the corresponding bubble for each selection.
All questions are related to pursuit and achievement of board certification in
Pharmacy by the Board of Pharmaceutical Specialties.

151
Additional Information:
There are 16 demographic questions at the end of the survey that will be used in
comparing this information with what has been collected by the Board of
Pharmaceutical Specialties in previous surveys.
This study has been approved by the University of Tennessee Institutional Review
Board. There is no consequence for refusing to take the survey or any direct benefit
to you other than professional value to Pharmacy in general. Your identity will not be
disclosed and no relational information regarding your demographics information will
be attempted. The scope of this study is to characterize aggregate trends and not
those of an individual. Summary data only will be made available to Pharmacy
organizations. The results of this survey may be presented at a professional meeting,
become published or become part of a Ph.D. dissertation.
Consent for Participation:
This survey is voluntary. By proceeding with this survey I consent to participate.
Probabilities of Occurrence and Values
1. Self image
A. My self image will be improved by becoming board certified.
Will definitely
not occur
Unlikely to
occur
Unsure
Likely to
occur
Will definitely
occur

152
1. Self image (continued)
B. I value my self image.
No value
Low value
Mid range of
value
Somewhat
valuable
Highly
valuable
2. Employable
A. I would become more employable if I were board certified.
Will definitely
not occur
Unlikely to
occur
Unsure
Likely to
occur
Will definitely
occur
B. I value becoming more employable.
No value
Low value
Mid range of
value
Somewhat
valuable
Highly
valuable
3. Higher salary
A. I will receive a higher annual salary if I am board certified.
Will definitely
not occur
Unlikely to
occur
Unsure
Likely to
occur
Will definitely
occur
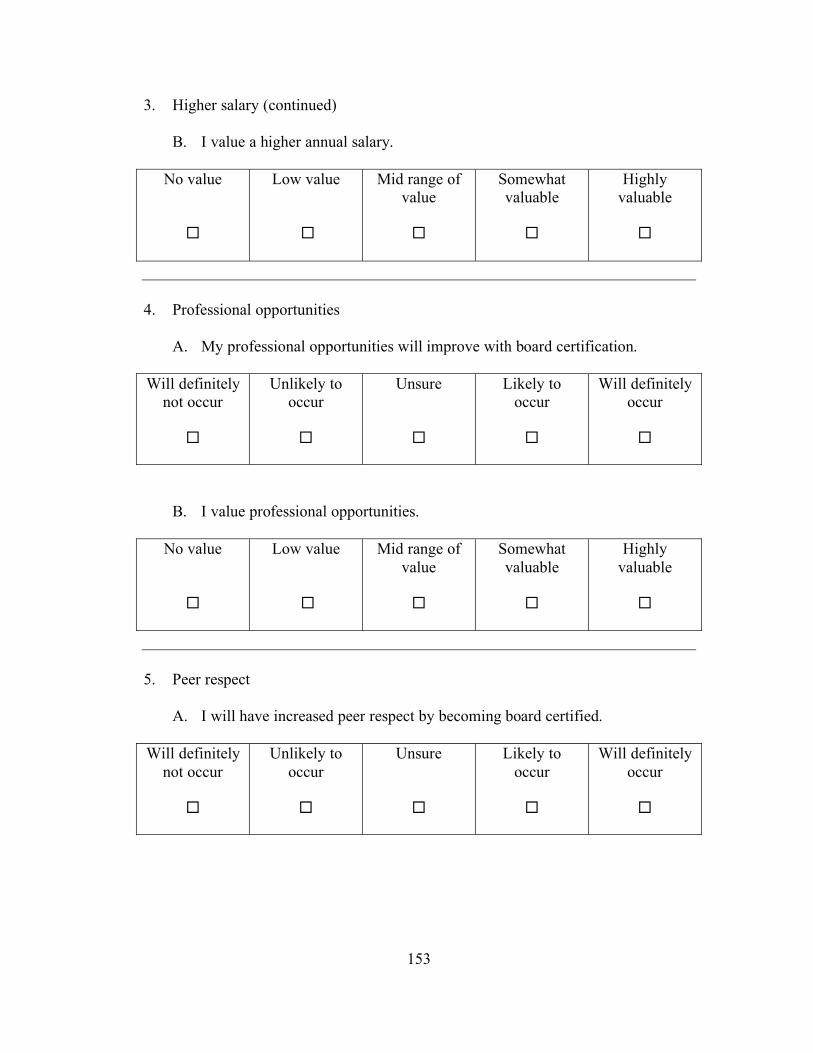
153
3. Higher salary (continued)
B. I value a higher annual salary.
No value
Low value
Mid range of
value
Somewhat
valuable
Highly
valuable
4. Professional opportunities
A. My professional opportunities will improve with board certification.
Will definitely
not occur
Unlikely to
occur
Unsure
Likely to
occur
Will definitely
occur
B. I value professional opportunities.
No value
Low value
Mid range of
value
Somewhat
valuable
Highly
valuable
5. Peer respect
A. I will have increased peer respect by becoming board certified.
Will definitely
not occur
Unlikely to
occur
Unsure
Likely to
occur
Will definitely
occur

154
5. Peer respect (continued)
B. I value peer respect.
No value
Low value
Mid range of
value
Somewhat
valuable
Highly
valuable
6. Career advancement
A. My career will be positively advanced by becoming board certified.
Will definitely
not occur
Unlikely to
occur
Unsure
Likely to
occur
Will definitely
occur
B. I value career advancement.
No value
Low value
Mid range of
value
Somewhat
valuable
Highly
valuable
7. Academic opportunities
A. My academic opportunities will improve if I am board certified.
Will definitely
not occur
Unlikely to
occur
Unsure
Likely to
occur
Will definitely
occur

155
7. Academic opportunities (continued)
B. I value academic opportunities.
No value
Low value
Mid range of
value
Somewhat
valuable
Highly
valuable
8. Downsizing protection
A. In a workplace that is downsizing, board certification will protect my
job.
Will definitely
not occur
Unlikely to
occur
Unsure
Likely to
occur
Will definitely
occur
B. I value a protective effect from downsizing.
No value
Low value
Mid range of
value
Somewhat
valuable
Highly
valuable
9. Initial costs
A. My initial certification costs will be paid by my employer.
Will definitely
not occur
Unlikely to
occur
Unsure
Likely to
occur
Will definitely
occur
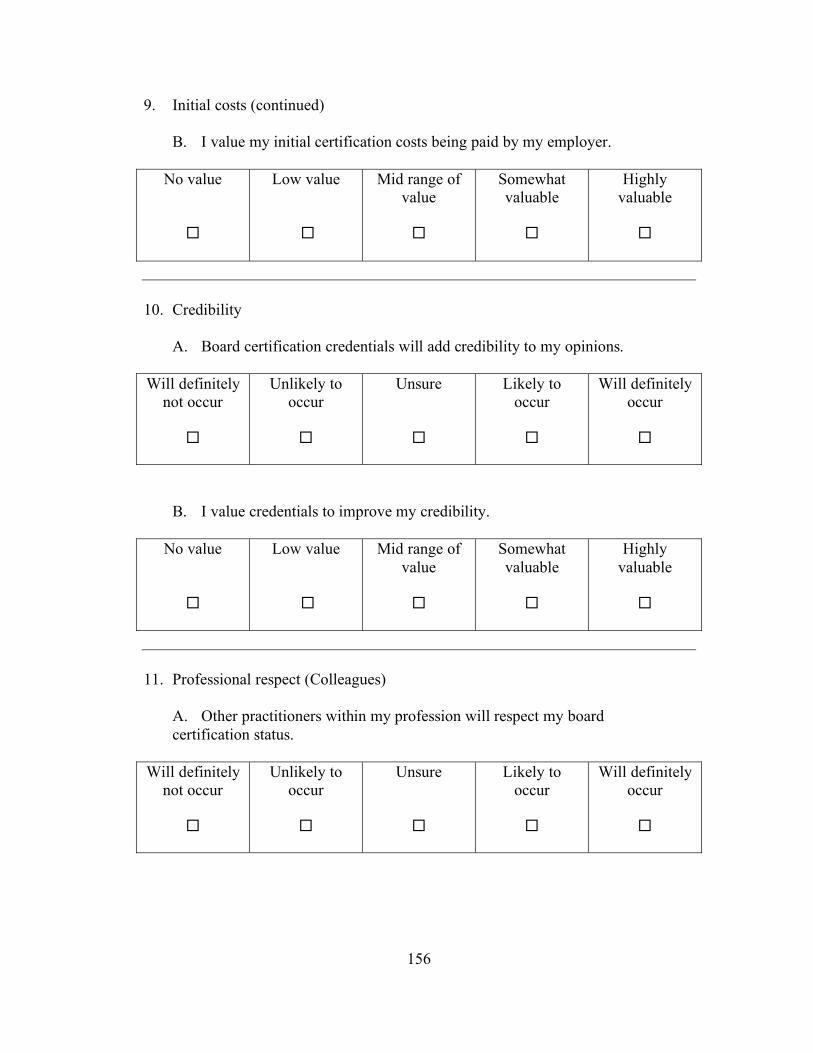
156
9. Initial costs (continued)
B. I value my initial certification costs being paid by my employer.
No value
Low value
Mid range of
value
Somewhat
valuable
Highly
valuable
10. Credibility
A. Board certification credentials will add credibility to my opinions.
Will definitely
not occur
Unlikely to
occur
Unsure
Likely to
occur
Will definitely
occur
B. I value credentials to improve my credibility.
No value
Low value
Mid range of
value
Somewhat
valuable
Highly
valuable
11. Professional respect (Colleagues)
A. Other practitioners within my profession will respect my board
certification status.
Will definitely
not occur
Unlikely to
occur
Unsure
Likely to
occur
Will definitely
occur

157
11. Professional respect (Colleagues), (continued)
B. I value professional respect from my colleagues
No value
Low value
Mid range of
value
Somewhat
valuable
Highly
valuable
12. Annual salary increases
A. If I am board certified I will receive higher annual salary increases.
Will definitely
not occur
Unlikely to
occur
Unsure
Likely to
occur
Will definitely
occur
B. I value higher annual salary increases.
No value
Low value
Mid range of
value
Somewhat
valuable
Highly
valuable
13. Hiring influence
A. I would hire a board certified practitioner over another non-board
certified practitioner with otherwise equal qualifications.
Will definitely
not occur
Unlikely to
occur
Unsure
Likely to
occur
Will definitely
occur

158
13. Hiring influence (continued)
B. I value board certification enough to positively influence a hiring
decision between candidates with otherwise equal qualifications.
No value
Low value
Mid range of
value
Somewhat
valuable
Highly
valuable
14. Financial incentive to SEEK board certification
A. Increased financial incentive from my employer would cause me to
SEEK board certification status.
Will definitely
not occur
Unlikely to
occur
Unsure
Likely to
occur
Will definitely
occur
B. I value a financial incentive from my employer based on SEEKING
board certification.
No value
Low value
Mid range of
value
Somewhat
valuable
Highly
valuable
15. Financial incentive to MAINTAIN board certification
A. Increased financial incentive from my employer would cause me to
MAINTAIN board certification.
Will definitely
not occur
Unlikely to
occur
Unsure
Likely to
occur
Will definitely
occur
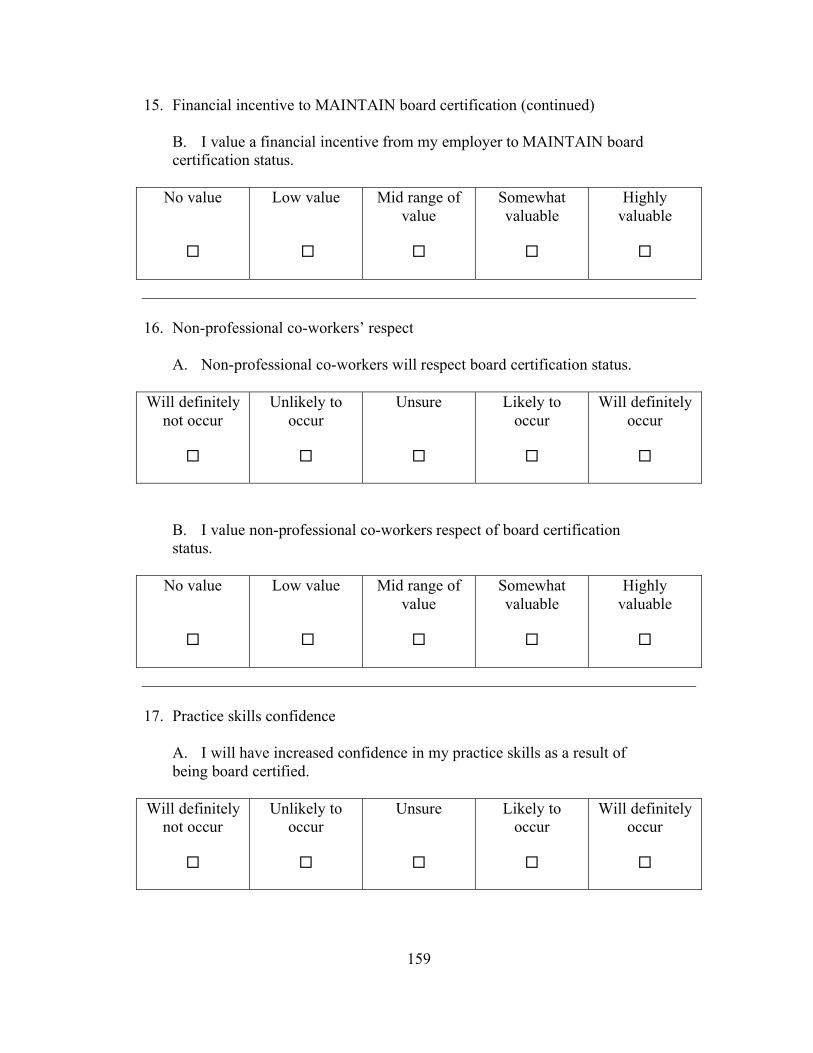
159
15. Financial incentive to MAINTAIN board certification (continued)
B. I value a financial incentive from my employer to MAINTAIN board
certification status.
No value
Low value
Mid range of
value
Somewhat
valuable
Highly
valuable
16. Non-professional co-workers’ respect
A. Non-professional co-workers will respect board certification status.
Will definitely
not occur
Unlikely to
occur
Unsure
Likely to
occur
Will definitely
occur
B. I value non-professional co-workers respect of board certification
status.
No value
Low value
Mid range of
value
Somewhat
valuable
Highly
valuable
17. Practice skills confidence
A. I will have increased confidence in my practice skills as a result of
being board certified.
Will definitely
not occur
Unlikely to
occur
Unsure
Likely to
occur
Will definitely
occur

160
17. Practice skills confidence (continued)
B. I value increased confidence in my practice skills.
No value
Low value
Mid range of
value
Somewhat
valuable
Highly
valuable
18. Personal accomplishment
A. I will feel a sense of personal accomplishment by becoming board
certified.
Will definitely
not occur
Unlikely to
occur
Unsure
Likely to
occur
Will definitely
occur
B. I value personal accomplishment demonstrated by a board certification
credential.
No value
Low value
Mid range of
value
Somewhat
valuable
Highly
valuable
19. Increased responsibility
A. I will have increased responsibility in my job role after
becoming board certified.
Will definitely
not occur
Unlikely to
occur
Unsure
Likely to
occur
Will definitely
occur
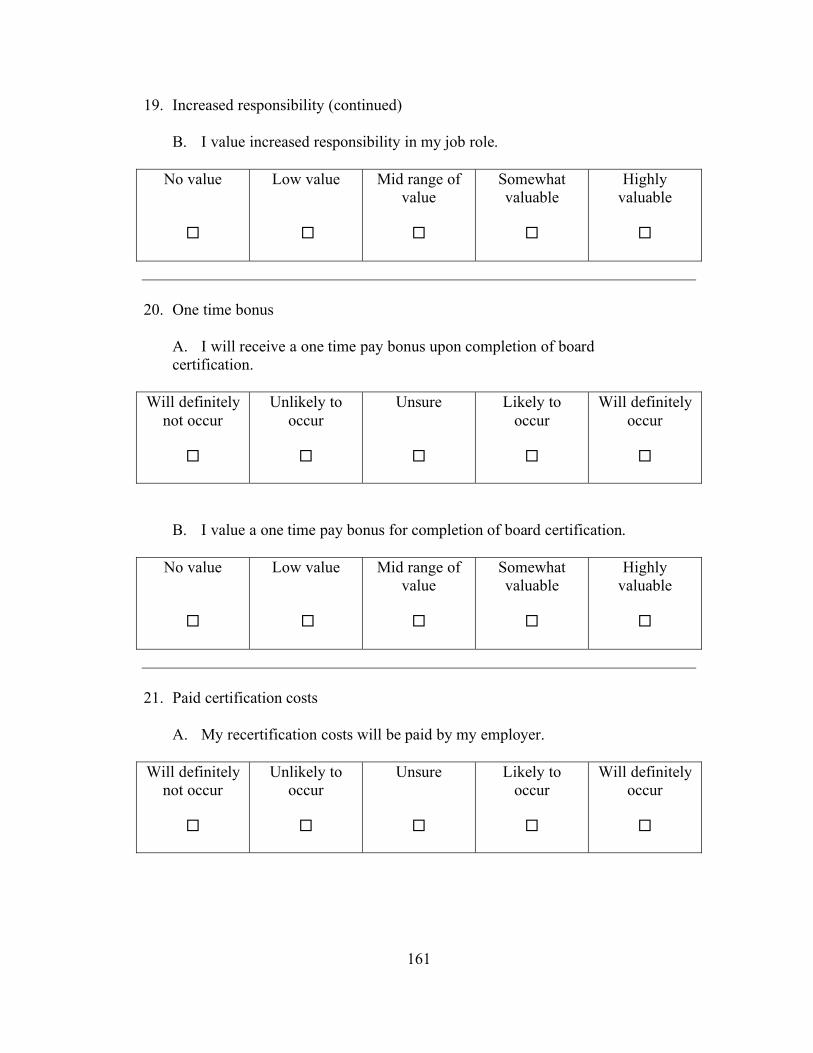
161
19. Increased responsibility (continued)
B. I value increased responsibility in my job role.
No value
Low value
Mid range of
value
Somewhat
valuable
Highly
valuable
20. One time bonus
A. I will receive a one time pay bonus upon completion of board
certification.
Will definitely
not occur
Unlikely to
occur
Unsure
Likely to
occur
Will definitely
occur
B. I value a one time pay bonus for completion of board certification.
No value
Low value
Mid range of
value
Somewhat
valuable
Highly
valuable
21. Paid certification costs
A. My recertification costs will be paid by my employer.
Will definitely
not occur
Unlikely to
occur
Unsure
Likely to
occur
Will definitely
occur

162
21. Paid certification costs (continued)
B. I value that my employer would pay my recertification costs.
No value
Low value
Mid range of
value
Somewhat
valuable
Highly
valuable
22. Promotion potential
A. I will be more likely to be promoted by my employer by
employer if I am board certified.
Will definitely
not occur
Unlikely to
occur
Unsure
Likely to
occur
Will definitely
occur
B. I value promotions based on board certification.
No value
Low value
Mid range of
value
Somewhat
valuable
Highly
valuable
23. Public notification
A. There would be a public notification of my achievement and s
status if I become board certified.
Will definitely
not occur
Unlikely to
occur
Unsure
Likely to
occur
Will definitely
occur
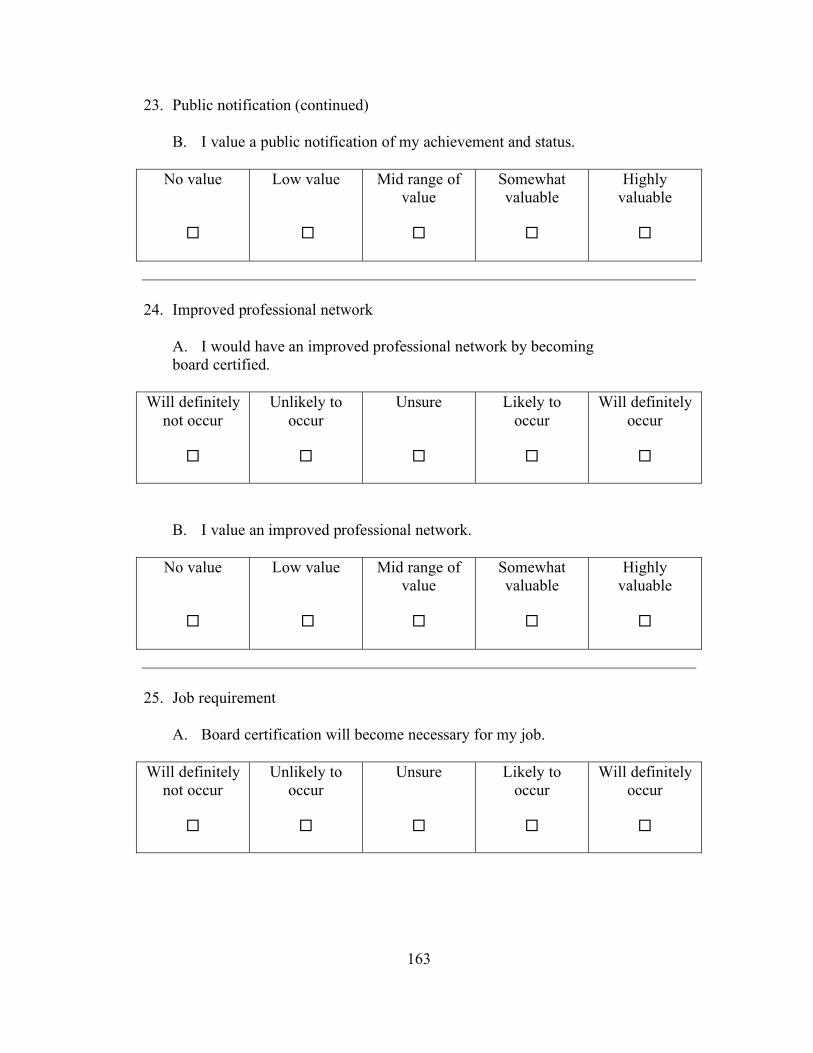
163
23. Public notification (continued)
B. I value a public notification of my achievement and status.
No value
Low value
Mid range of
value
Somewhat
valuable
Highly
valuable
24. Improved professional network
A. I would have an improved professional network by becoming
board certified.
Will definitely
not occur
Unlikely to
occur
Unsure
Likely to
occur
Will definitely
occur
B. I value an improved professional network.
No value
Low value
Mid range of
value
Somewhat
valuable
Highly
valuable
25. Job requirement
A. Board certification will become necessary for my job.
Will definitely
not occur
Unlikely to
occur
Unsure
Likely to
occur
Will definitely
occur

164
25. Job requirement (continued)
B. I value that my job will require board certification.
No value
Low value
Mid range of
value
Somewhat
valuable
Highly
valuable
Expectancy
This section is based on your opinion of the likelihood of completion of board
certification upon expenditure of the effort. If you have no intention of pursuing
board certification in a Pharmacy practice specialty please answer question 26.a.
Please answer N/A as needed.
26. Expectancy
A. I am NOT currently board certified but I feel that if I expended the effort I
would successfully complete the board certification process.
Will
definitely
not occur
Unlikely to
occur
Unsure
Likely to
occur
Will
definitely
occur
N/A

165
26. Expectancy (continued)
B. I AM currently board certified and PRIOR TO BEGINNING preparation for
specialty certification I felt that if I expended the effort I would successfully
complete the requirements for board certification.
Will
definitely
not occur
Unlikely to
occur
Unsure
Likely to
occur
Will
definitely
occur
N/A
C. I WAS formerly board certified and PRIOR TO BEGINNING preparation
for specialty certification I felt that if I expended the effort I would successfully
complete the requirements for board certification.
Will
definitely
not occur
Unlikely to
occur
Unsure
Likely to
occur
Will
definitely
occur
N/A
Demographics
The following are demographic questions modified from previous Board of
Pharmaceutical Specialties surveys. They are an important link from earlier studies
findings and those from this study.
Responses are not required for this section but are important to this research.
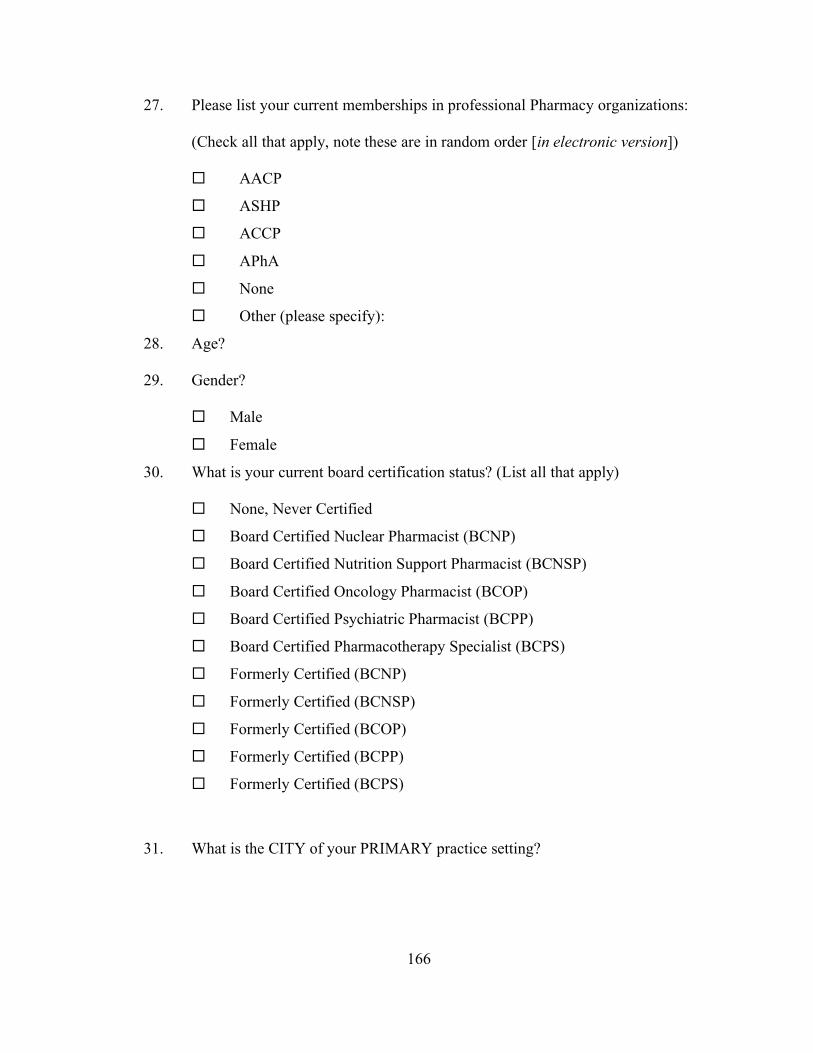
166
27. Please list your current memberships in professional Pharmacy organizations:
(Check all that apply, note these are in random order [in electronic version])
AACP
ASHP
ACCP
APhA
None
Other (please specify):
28. Age?
29. Gender?
Male
Female
30. What is your current board certification status? (List all that apply)
None, Never Certified
Board Certified Nuclear Pharmacist (BCNP)
Board Certified Nutrition Support Pharmacist (BCNSP)
Board Certified Oncology Pharmacist (BCOP)
Board Certified Psychiatric Pharmacist (BCPP)
Board Certified Pharmacotherapy Specialist (BCPS)
Formerly Certified (BCNP)
Formerly Certified (BCNSP)
Formerly Certified (BCOP)
Formerly Certified (BCPP)
Formerly Certified (BCPS)
31. What is the CITY of your PRIMARY practice setting?

167
32. What is the STATE, TERRITORY or LOCATION (e.g. international work
location) of your PRIMARY practice setting?
(If not found in drop down menu please enter in box below that line:
AK
AL
AR
AZ
CA
CO
CT
DC
DE
FL
GA
HI
IA
ID
IL
IN
KS
KY
LA
MA
MD
ME
MI
MN
MO
MS
MT
NC
ND
NE
NH
NJ
NM
NV
NY
OH
OK
OR
PA
RI
SC
SD
TN
TX
UT
VA
VT
WA
WI
WV
WY
AS
GU
MP
PR
VI
FM
MH
PW
AA
AE
AP

168
33. Which of the following most closely classifies your position at your primary
practice site? Multiple answers are allowed but please limit to two.
Staff Pharmacist
Clinical Staff Pharmacist
Clinical Manager
Pharmacy Manager
Pharmacy Director
Regional Manager
Corporate Position
Owner/Partner in Pharmacy Business
Educator
Researcher
34. Select the ONE area from those listed below, in which the MAJORITY of your
practice takes place.
Academic Institution
Ambulatory Care Clinic
Cancer Center
Community Pharmacy, Chain
Community Pharmacy, Independent
Correctional Facility
Drug Information Center
Government/Military Hospital/Institution
Hospital, Community for Profit
Hospital, Community Not-for-Profit
Hospital, University
Hospital, University-Affiliated
Home Health Care
Intermediate Care Facility

169
34. Select the ONE area from those listed below, in which the MAJORITY of your
practice takes place (continued).
Long Term Care
Managed Health Care, HMO, PPO or other plan
Managed Health Care, Pharmacy Benefits Manager
Nuclear Pharmacy, Centralized, Independent
Nuclear Pharmacy, Centralized, Chain
Nuclear Pharmacy, Hospital/Academic
Pharmaceutical Industry
Psychiatric Hospital/Facility
Specialty Pharmacy
34. What is the average number of hours you typically work each week in the practice
of Pharmacy?
Less than 20
20-30
31-40
41-50
51-60
35. What was your ENTRY LEVEL Pharmacy-related degree?
Bachelor's Degree
Pharm.D.
Other (please specify):
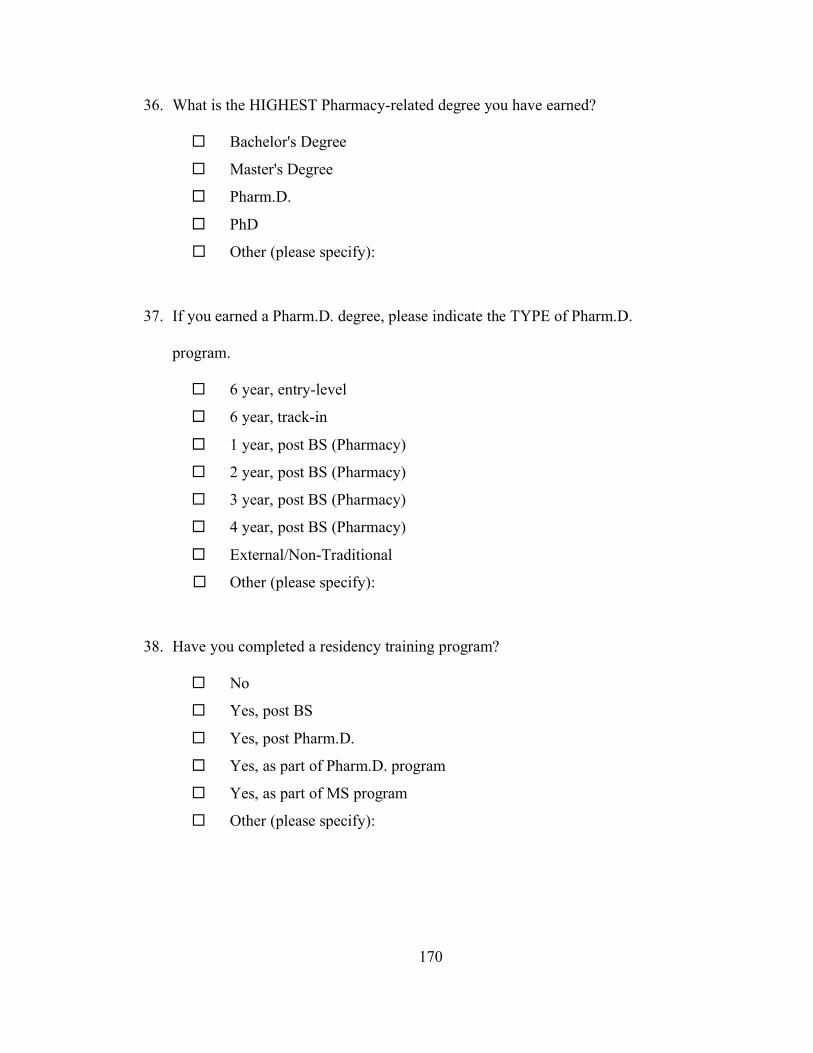
170
36. What is the HIGHEST Pharmacy-related degree you have earned?
Bachelor's Degree
Master's Degree
Pharm.D.
PhD
Other (please specify):
37. If you earned a Pharm.D. degree, please indicate the TYPE of Pharm.D.
program.
6 year, entry-level
6 year, track-in
1 year, post BS (Pharmacy)
2 year, post BS (Pharmacy)
3 year, post BS (Pharmacy)
4 year, post BS (Pharmacy)
External/Non-Traditional
Other (please specify):
38. Have you completed a residency training program?
No
Yes, post BS
Yes, post Pharm.D.
Yes, as part of Pharm.D. program
Yes, as part of MS program
Other (please specify):
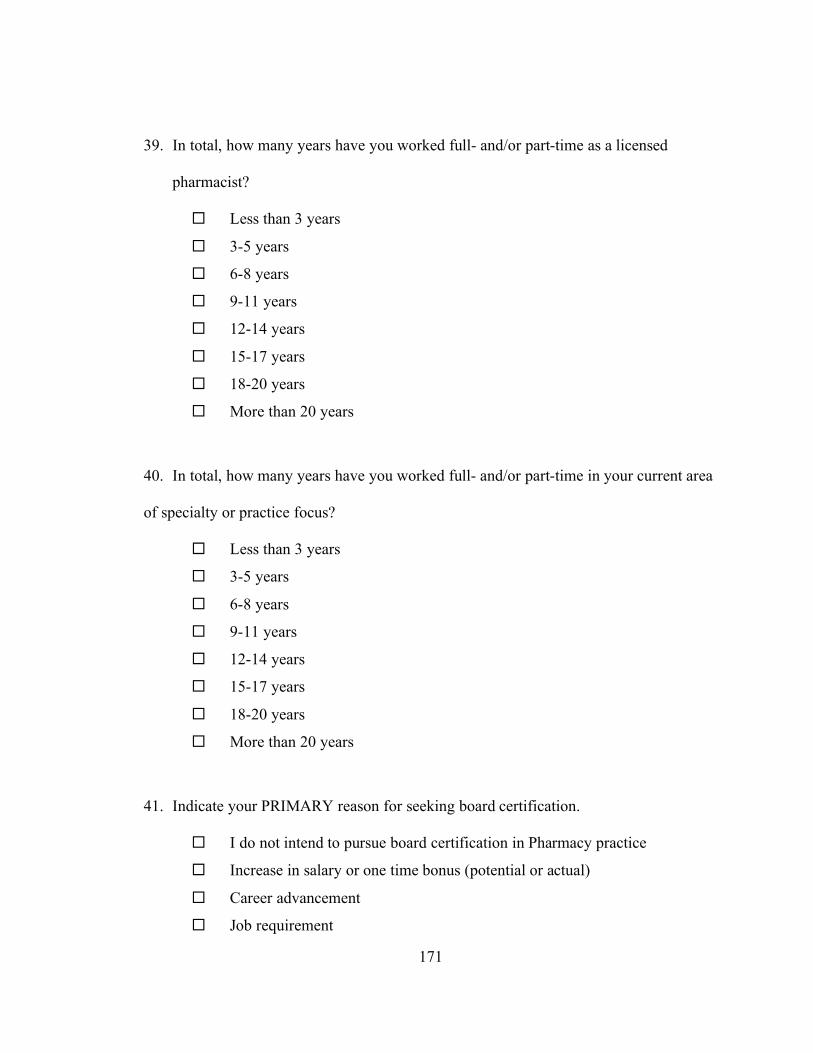
171
39. In total, how many years have you worked full- and/or part-time as a licensed
pharmacist?
Less than 3 years
3-5 years
6-8 years
9-11 years
12-14 years
15-17 years
18-20 years
More than 20 years
40. In total, how many years have you worked full- and/or part-time in your current area
of specialty or practice focus?
Less than 3 years
3-5 years
6-8 years
9-11 years
12-14 years
15-17 years
18-20 years
More than 20 years
41. Indicate your PRIMARY reason for seeking board certification.
I do not intend to pursue board certification in Pharmacy practice
Increase in salary or one time bonus (potential or actual)
Career advancement
Job requirement

172
41. Indicate your PRIMARY reason for seeking board certification (continued).
Job security
Increase in professional status
Peer recognition
Other (please specify):
42. Indicate a SECONDARY reason for seeking board certification.
I do not intend to pursue board certification in Pharmacy practice
Increase in salary or one time bonus (potential or actual)
Career advancement
Job requirement
Job security
Increase in professional status
Peer recognition
Other (please specify):
Additional Comments
Additional comments related to board certification in Pharmacy practice:

173
Appendix B

174
Letters to Pharmacy Organizations Seeking Assistance and Cooperation and
Communications of Agreement to Participate

175
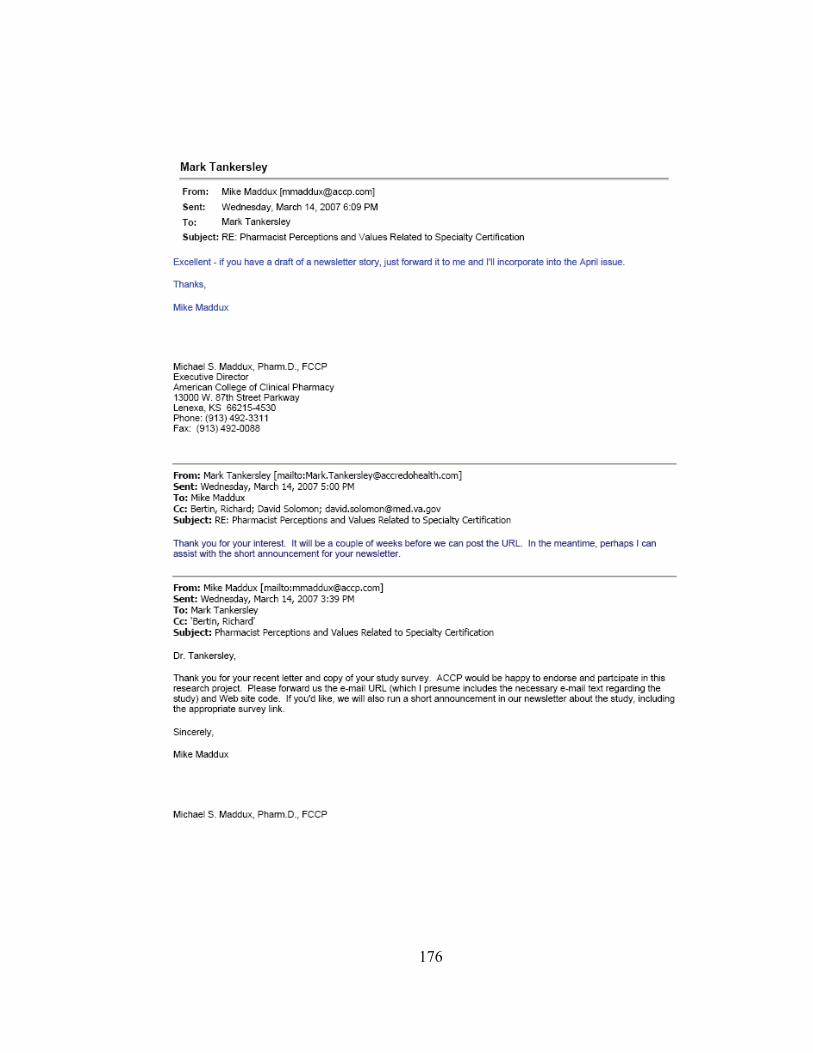
176

177

178

179

180

181
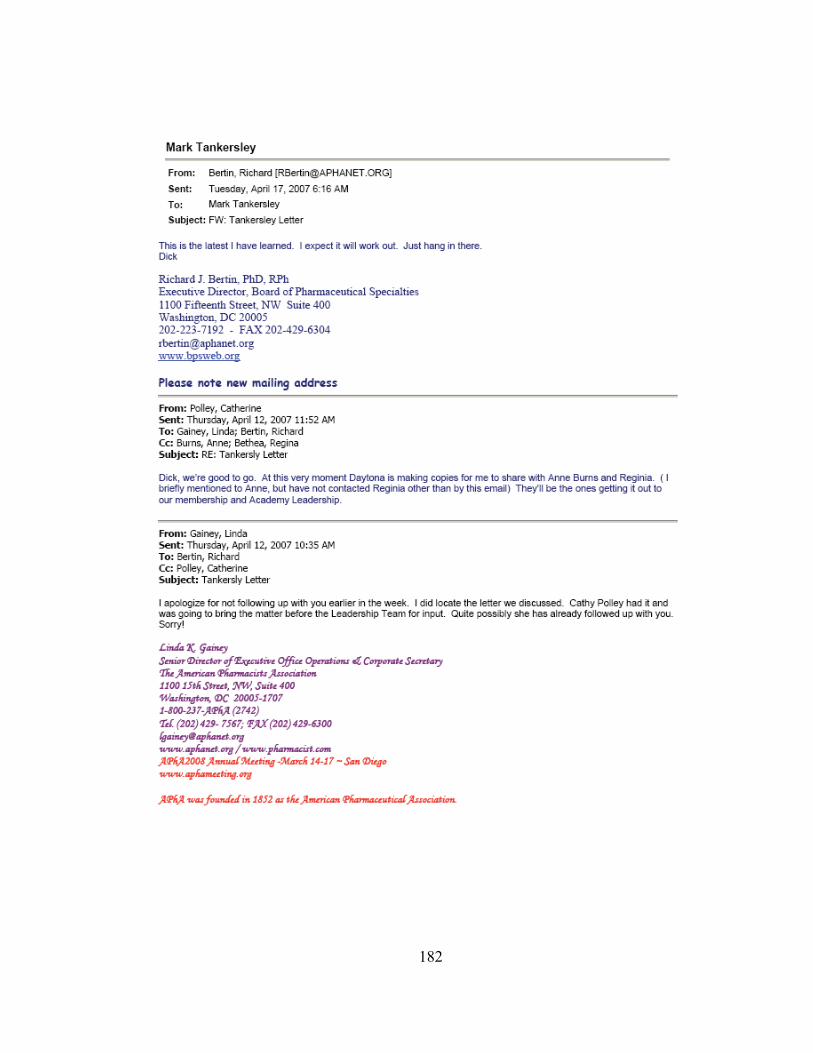
182
183

184

185

186

187
Appendix C

188
Permission to Reprint Figure 1-1 from the Pharmaceutical Journal

189
Appendix D

190
University of Tennessee IRB Approval (Exemption)

191
192

193
VITA
Mark Tankersley was born in Jesup, Georgia in 1957. He grew up in the Atlantic
coastal community of Brunswick, Georgia and the Golden Isles. Mark has practiced
Pharmacy since graduating from the University of Georgia in 1980. He has worked
directly with patients practicing in the realms of infectious disease, clinical nutrition,
psychiatric Pharmacy, drug information and in general clinical practice in community,
hospital, healthcare facility, nuclear Pharmacy and specialty Pharmacy settings. Mark
also has held a variety of positions in local, regional and national managerial roles as well
as that of a consultant providing support and assistance to healthcare organizations. He is
an Authorized User of nuclear pharmaceuticals.
During his years in Pharmacy operations and clinical practice, Mark has
participated in teaching clinical and administrative Pharmacy practice as and adjunct
clinical instructor or faculty member for the University of Georgia, the University of
South Carolina and The University of Tennessee Health Sciences Center.
While completing his graduate studies, Mark has kept current with the practice of
Pharmacy by working continuously in patient care support roles and is currently Director
of Medical Informatics and Outcomes at Accredo Health Group in Memphis, Tennessee.
His interests in Pharmacy include infectious disease, clinical nutrition, applications of
immune globulin for primary immune and neurological disorders, pulmonary arterial
hypertension, biotechnology, health outcomes, medical informatics and clinical
documentation systems.