Why do Emerging Market Firms Issue Offshore Dollar Equity ...
52
1 Why do Emerging Market Firms Issue Offshore Dollar Equity Linked Securities? Rama Seth Copenhagen Business School, Denmark [email protected] Keerat Bhurjee Shiv Nadar University, India [email protected] Vishwanath S R Shiv Nadar University, India [email protected] Abstract While depository receipts have attracted much scholarly attention, there is little research on the consequences of issuing foreign currency convertible bonds that account for a large fraction of issuance in global capital markets. We bridge this gap by examining FCCB issuance by Indian firms amounting to $22 billion during 2000-2017. We find that FCCBs could be delayed equity or cheap debt or relax capital constraints. However, issuers experience an increase in default probabilities, a rating downgrade and a deterioration in operating and stock performance. In line with this analysis, stock markets react negatively to the issuance of offshore convertibles. JEL Classification: G320, G140, G150 Keywords: Financing Policy, Event Studies, International Financial Markets We thank Raghu Rau for helpful comments. All errors are ours.
-
Upload
khangminh22 -
Category
Documents
-
view
1 -
download
0
Transcript of Why do Emerging Market Firms Issue Offshore Dollar Equity ...

1
Why do Emerging Market Firms Issue Offshore Dollar Equity Linked Securities?
Rama Seth
Copenhagen Business School, Denmark
Keerat Bhurjee
Shiv Nadar University, India
Vishwanath S R
Shiv Nadar University, India
Abstract
While depository receipts have attracted much scholarly attention, there is little research on the consequences of issuing foreign currency convertible bonds that account for a large fraction of issuance in global capital markets. We bridge this gap by examining FCCB issuance by Indian firms amounting to $22 billion during 2000-2017. We find that FCCBs could be delayed equity or cheap debt or relax capital constraints. However, issuers experience an increase in default probabilities, a rating downgrade and a deterioration in operating and stock performance. In line with this analysis, stock markets react negatively to the issuance of offshore convertibles.
JEL Classification: G320, G140, G150
Keywords: Financing Policy, Event Studies, International Financial Markets
We thank Raghu Rau for helpful comments. All errors are ours.

2
1. Introduction
One of the important characteristics of emerging markets is that they present numerous profitable
business opportunities. Realizing those opportunities is difficult because emerging markets present
unique financing challenges. Emerging markets are characterized by illiquid capital markets that
are also smaller in size. Consequently, emerging market firms may have to source capital from
developed markets. Often managers of emerging market firms believe that sourcing capital from
international capital markets reduces the cost of capital and the empirical evidence supports this
notion, at least partially, in the context of American Depository Receipt (ADR) issues1. In recent
years the issuance of foreign currency denominated convertible bonds (FCCBs) has become
popular. For instance, 333 Indian companies raised $22 billion through US dollar equity-linked
offshore debt during 2000-2017 while South Korean, Taiwanese and Singapore firms issued
$50.8b, $48.11b and $12.78b worth of foreign currency convertibles during the same period.
FCCBs pay interest and principal in a foreign currency such as the USD but the bond gets
converted into shares of the issuing company in the currency of the issuer and trades in the
domestic market. Issuance of foreign currency convertible bonds is not restricted to emerging
market companies alone. U.S. and UK corporations have issued large amounts of convertible
bonds with coupon and principal payments denominated in all major currencies. In this paper we
investigate the motives and the consequences of issuing offshore dollar-denominated equity linked
bonds. India presents an opportunity to study the use of foreign currency convertible bonds for
several reasons. 11.5% of firms that issued FCCBs actually defaulted on interest and principal
payments. Further, the Indian Rupee has been extremely volatile during the period we study. The
Indian Rupee appreciated from INR 46/USD in 2000 to INR39/USD in 2007 and then depreciated
to INR 68/USD in 2016. Due to this enormous volatility it is quite likely that convertibles
denominated in a foreign currency are probably neither cheap debt nor delayed equity, the
traditional rationale for convertibles. On the other hand, the issuers may become more prone to
default. Thus, India provides an opportunity to test several theories of convertibles in a cross border
context. Further, cross-country regressions suffer from measurement, statistical and conceptual
1 Errunza and Miller (2000) report that foreign firms listed in the U.S. experience an 11.4 percentage point decrease
in their cost of capital whereas Sarkissian and Schill (2009) find that valuation gains (or reduction in cost of capital)
are transitory.
3
problems. Single country studies may shed new light on the consequences of issuing FCCBs2.
While we use Indian data, our methodology is equally applicable to other emerging markets with
floating exchange rate regimes.
FCCBs issued by Indian firms are denominated in U.S Dollars and are mainly listed in
Singapore, Luxembourg, London and Hong-Kong. Given the size and importance of the market
this paper fills an important gap in the literature3. Specifically, we present empirical evidence to
answer the following questions: How do firms choose between foreign currency convertibles and
depository receipts (i.e. equity linked and equity issues in a cross border context)? How do stock
markets react to the issuance of cross border equity linked securities as opposed to depository
receipts? Are these securities cheap debt or delayed equity? Does the issuance of FCCBs relax
capital constraints? Does the introduction of these instruments make the issuing firm more prone
to default? How does the issuance affect the firm’s long term operating and stock market
performance?
This topic is of more than academic interest. A currency mismatch could affect the financial
health of unhedged borrowers. If currency mismatch is common to many borrowers, large currency
depreciations could induce systemic crises and potentially cripple the system. For instance, prior
to the East Asian crisis in 1997, many firms in these countries had contracted substantive unhedged
foreign currency debt. These firms and economies experienced financial distress when their
currencies depreciated during the crisis.
Our analysis uses data on 458 firms that issued FCCBs (333), ADRs (101) and GDRs (24)
during 2000-2017. By studying the market for offshore foreign currency convertibles we
contribute to the literature in several ways. First, many papers have studied the issuance of
American Depository Receipts (Alexander et al., 1988; Chaplinsky and Ramchand, 2000; Errunza
and Miller, 2000; Foerster and Karolyi, 2000; Baker et al., 2002; Pagano et al., 2002; Doidge et
al., 2003, Lins et al. 2005; Sarkissian and Schill, 2009). The literature suggests that firms that
2 For instance, to determine whether FCCBs are cheap debt, we have to examine deviations from parity conditions. If
the sample consists of firms from many countries, the procedure would become cumbersome but it may not add to the
insight.
3 Henderson et al. (2006) point out that cross border issuance of debt is more common than equity. Although, in their
sample, the fraction of convertible issues is much smaller than equity issues, convertibles are more popular than
depository receipts in our context.
4
choose to list in foreign equity markets realize substantial valuation gains (Foerster and Karolyi,
1999; Errunza and Miller, 2000). The literature also documents substantial long-run abnormal
performance before and after global equity listing. In a sample of 333 global equity offerings with
U.S. depositary receipt (ADR) tranches from 35 countries in Asia, Latin America, and Europe,
Foerster and Karolyi (2000) find that these securities under-perform local market benchmarks of
comparable firms by 8%-15% over the three years following issuance. They find that while firms
from markets with significant investment barriers for foreigners outperform their benchmarks,
those from segmented markets that issue equity in the U.S. by way of Rule 144A private
placements significantly underperform. We contribute to the cross listing literature by examining
foreign currency convertibles that are an important segment of the global capital market.
Second, several papers have examined the rationale for convertibles (Brigham, 1966;
Brennan and Schwartz, 1988; Stein, 1992; Mayers, 1998), the short run and long run performance
of convertible bond issuers (Lee and Loughran, 1998; Lewis et al., 2001; Lewis et al., 2003) and
how firms choose between convertibles and equity (Lewis et al., 1999). These papers have studied
domestic issuance of convertible bonds. We contribute to this literature by studying cross border
issuance of convertibles by emerging market firms. Kang et al. (1995) analyze the wealth effects
of offshore convertible and warrant issues of Japanese firms. Our paper differs from theirs in that
we analyze the motives and the consequences of issuing these instruments although we incorporate
an event study. To the best of our knowledge this is the first paper to do so.
Third, Kedia and Mozumdar (2003) and Keloharju and Niskanen (2001) find a strong
relation between aggregate foreign exchange exposure and foreign currency denominated debt.
Kedia and Mozumdar (2003) also find a positive relation between the currency of denomination
of debt and the firm’s exposure to that currency. We extend this analysis to offshore, foreign
currency denominated convertible debt. Specifically, we examine the hedging rationale for foreign
currency convertibles.
Fourth, a study by Moody’s finds that default rates for rated convertible bond issuers are
higher than those without convertible bonds in their capital structures (Hamilton et al., 2001). We
expect this to be particularly true of FCCB issuers. Issuers in emerging markets may not have
access to long dated forwards or swaps to hedge the currency risk. We investigate whether issuing
FCCBs increases the probability of default and makes the issuers vulnerable to downturns.

5
Fifth, Lins et al. (2005) document that, following a U.S. listing of ADRs, the sensitivity of
investment to free cash flow decreases significantly for firms from emerging capital markets. We
apply this analysis to convertible bond issuers because these companies are likely to be more
constrained than ADR issuers that are arguably better quality firms. Further, convertibles are more
popular than depository receipts in many emerging markets. We study how the issuance of these
securities affects investments when compared with firms that do not raise capital abroad.
Our main result is that while FCCBs may be delayed equity or may relax capital constraints,
issuers experience an increase in default probability, a rating downgrade and significant
deterioration in financial and stock market performance. Cumulative abnormal returns of FCCB
issuers are 25% lower than matched, non-issuing, firms over three years after the issuance.
Likewise, return on assets of issuers falls by 2.5% over four years after issuance. Stock markets
react significantly negatively to FCCB issues. FCCB issues generate -4% CAR over a 11-day
window around the announcement date after adjusting for systematic risk and -4.4% CAR after
adjusting for Fama-French risk factors.
The rest of the paper is organized as follows. In section 2 we present the related literature
and hypotheses. In section 3 we describe the data and sample. Empirical results are presented in
section 4. Section 5 concludes.
2. Related Literature
The literature on cross listing suggests that firms list (depository receipts) in overseas
markets to overcome segmented capital markets that limit capital flow and present information
barriers. Several papers document a lowering of cost of capital for firms from segmented markets
(Errunza and Miller, 2000). The decline in expected returns is attributed to portfolio diversification
potential that these offer foreign investors. The increase in investor base could increase the
liquidity of the firm’s equity (Amihud and Mendelson, 1986). The increase in investor base may
also stabilize stock prices (Merton, 1987). These arguments can be readily extended to equity
linked securities with relatively short maturity4. Firms facing greater uncertainty in post-issue
performance may be forced to issue convertibles rather than depository receipts by providing
investors the safety of debt before they convert these securities into equity. Also, convertible
4 Most foreign currency convertibles have a maturity of five years with the first call date within two years

6
issuers may subsequently issue equity in foreign markets once an investor base is established. In
the context of foreign currency convertibles, a reduction in the cost of capital implies a break down
in parity conditions. Firms may alter the currency composition of their debt in order to capture the
differences in covered or uncovered borrowing rates in different currencies. Du et al. (2018) show
that the Covered Interest Parity condition is systematically and persistently violated among G10
currencies, leading to significant arbitrage opportunities in currency and fixed income markets
since the 2008 global financial crisis. However, McBrady et al. (2010) observe that emerging
market issuers are less likely to respond to differences in covered yields consistent with their
limited access to currency swap markets. In our sample we find that the propensity to issue foreign
currency denominated convertible bonds is higher. McBrady et al. (2010) conclude that although
the gains from opportunistic currency denomination are economically significant, they may still
be consistent with efficient markets. In particular, covered interest parity that works well for short-
term money market instruments5 may not work well in case of long term bonds. While an ex-post
analysis suggests that it was cheaper to borrow in one currency, ex ante it is difficult to predict the
relative advantage of any currency since financial instruments have long tenor. Consequently, one
currency might be as good as another. In other words, we hypothesize that there is no systematic
advantage to denominating convertibles in a foreign currency.
The window of opportunity hypothesis suggests that firms cross list to take advantage of
pre-issue run up in stock prices only for the pattern to be reversed after the issuance. Firms may
issue FCCBs when overseas valuations are higher than domestic valuations to obtain better prices
for their stock or the issuance may coincide with periods of lower covered yields in foreign
currency. That is, issuers may time either stock or bond markets or both. Often convertibles are
viewed as delayed equity. If the managers of a company expect the firm’s stock price to rise and
expect investors to exercise their option of conversion, a convertible, as opposed to an outright
equity issue will result in lower dilution. On one hand, FCCB issuance may aid price discovery6.
The conversion premium is justified on the basis of valuations of similar stocks traded abroad.
Thus, an issuer can raise the domestic price of the stock by issuing FCCBs. On the other hand,
emerging market currencies and stock prices are more volatile than their developed market
5 The interest rate parity does not hold even for the short horizon (Froot and Thaler, 1990)
6 When the linkages between the two markets are strong we would expect rapid dissemination of information due to
an increase in the number of traders, a reduction in spreads and an improvement in the overall quality of the market.

7
counterparts because of which overseas investors may not convert. Since these firms face greater
uncertainty in post-issue performance we hypothesize that a debt overhang is more likely. That is,
foreign currency convertibles are less likely to be converted into equity.
Access to developed capital markets and raising new funds may be an important motivation
for these firms (Lins et al., 2005) and these may enable issuing firms to take advantage of growth
opportunities (Stulz, 1999; Doidge et al., 2003). Issuers of foreign currency convertibles may be
rapidly growing firms that are capital constrained. We hypothesize that these firms would be able
to undertake capital investments that are unavailable to firms that have not internationalized their
capital structures.
The bonding hypothesis suggests that firms issuing depository receipts bond themselves to
better governance standards of countries where they are listed and investors pay a premium for the
improvement in governance. The bonding hypothesis is not relevant in our context because issuers
of foreign currency convertibles are not required to comply with the governance standards of
countries where they are listed. Further, the instrument is converted into shares of the issuing
company in the domestic market. It is not traded abroad.
3. Data and Sample
Our sample consists of all issuers of FCCBs, ADRs and GDRs. During 2000-2017 333
firms issued FCCBs; 101 firms issued American Depository Receipts and 24 firms issued Global
Depository Receipts. We collected firm level and offer details from the Bloomberg database, the
Centre for Monitoring Indian Economy’s Prowess Database, and company websites. We obtained
stock price, stock return and index data from the website of Bombay Stock Exchange and Prowess
database.
3.1.Variable Construction
Appendix A provides a summary of the key variables used in our analysis and the data
sources. We briefly discuss some of the important variables here.
FCCB Dummy is a Dummy Variable set equal to 1 if the firm has issued Foreign Currency
Convertible Bonds and zero otherwise
Cumulative abnormal returns are computed by the following formula: CARi = Σt=1toT
(Rit –Rmt)
Buy and hold abnormal returns are computed by the following formula: BHARi = Πt=1toT
(1+Rit) – Πt=1toT (1+Rmt)

8
Investment is the ratio of annual capital expenditures to capital at the start of the period
Macro Q is the Sum of total book debt and market equity less total inventory divided by
the start-of-period capital stock measured by net property, plant and equipment
Rating Dummy is a dummy variable set equal to 1 if the rating of a firm issuing FCCB (i)
declines or (ii) declines below investment grade or (iii) if the firm defaulted, and zero
otherwise, respectively
The market value of common stock is measured as the closing stock price at the fiscal year
end immediately preceding the announcement date multiplied by the number of shares
outstanding at the same date.
Change in total assets is the difference between total assets at the end of the fiscal year
immediately following the offer date minus total assets in the fiscal year immediately
preceding the offer date.
Firm size is the natural log of total assets.
Volatility is the standard deviation of the issuer’s raw return over the 90 days preceding
the announcement date.
Issue size is equal to the gross proceeds of the issue divided by total assets.
Pre-issue run up in stock price is equal to the issuer’s raw return over the 90 days preceding
the announcement date.
Pre-issue run up in index is equal to the market’s raw return over the 90 days preceding the
announcement date.
Volatility of exchange rate is the standard deviation of changes in USD/INR exchange rate
Cash flow is measured as Operating income before depreciation minus total taxes adjusted
for changes in deferred taxes, minus gross interest expense, and minus dividends paid on
common and preferred stock, divided by total assets
3.2.Descriptive Statistics
In figure 1 we plot the distribution of FCCB issues from 2000-2017. Issuance of FCCBs
rose dramatically from 2004-2007 but fell in 2008 due to the global financial crisis. In 2007 more
than 70 FCCBs were issued. Issuance has been subdued since then. In many years less than 10
issues are made. Table 1 reports the summary statistics for our sample. In Panel A we report the
means, medians and standard deviations of outcome and explanatory variables for issuers of
FCCBs and depository receipts. We also report the differences in means and medians, and the
9
results of student t test and Wilcoxon test. The summary statistics suggest that FCCB issuers are
less profitable (ROA), more leveraged, smaller (in terms of market capitalization), issue smaller
amounts of capital, spend more on R&D and have fewer growth opportunities (i.e. sell at lower
market/book). FCCB issues are less likely following periods of currency appreciation but are more
likely when there is greater pre-issue run up in the market (index). In Panel B we present the
pairwise correlation between the variables. The correlation analysis suggests that the CARs
following announcements of FCCB are insignificant. The remaining results are qualitatively
similar to the above.
4. Empirical Results
In this section we present the main results of the paper. The discussion is divided into four
sub-sections. We begin with the determinants of FCCB issuance, then examine the stock market
reaction to FCCBs and contrast it with depository receipts and finally we examine the motives and
consequences of issuing these instruments.
4.1.The Choice between FX Convertibles and Depository Receipts
We would expect a wide range of firm, economic, and market related factors to affect the
choice of foreign currency convertibles. Firms may issue foreign currency denominated debt to
match the currency of debt service (an expense) with the currency of income to create a natural
hedge. Dollar denominated convertible bonds may appeal to firms with substantial exposure to the
U.S dollar because it enables issuers to match currencies of revenues and expenses. Depository
receipts, on the other hand, may be issued by firms that do not have foreign currency denominated
revenues. It may simply be an attempt at globalizing liabilities or overcoming segmented capital
markets. Issuing depository receipts abroad may enable a firm to design a stock option incentive
plan for overseas executives or use it as a currency to acquire firms abroad. These firms too may
experience a reduction in cost of capital. In addition to matching currencies (of revenues and
expenses), tax considerations or geographically segmented capital markets or poor liquidity of
domestic capital markets may all lead to currency preferences in the denomination of debt. We
take the fraction of foreign sales as proxy for foreign currency exposure. This approach is used in
earlier papers by Jorion (1990) and Kedia and Mozumdar (2003). On the other hand, conventional
wisdom would suggest that trading abroad makes a firm inherently risky. Such firms ought to
avoid financial risk. This leads us to financial risk avoidance hypothesis.
10
Issuers are more likely to issue a foreign currency denominated instrument when the
domestic currency is appreciating. On the other hand, an appreciation in currency may be reversed
later, because of which FCCB issuers may be wary of issuing foreign currency denominated debt
as it increases debt service. We include a currency appreciation dummy. Currency Appreciation
(or depreciation) is the percentage change in exchange rates over 90 days before issuance and is
set equal to 1 if the currency has appreciated.
We considered swap covered yields relative to yields at home to hypothesize that firms
issue equity linked debt abroad when covered yields abroad are lower. But there is no active market
for long dated swaps in INR/USD. So we have dropped it.
Firms that are already leveraged may issue depository receipts rather than convertibles. We
measure debt capacity in two ways: Long Term Debt/Total Assets and Long Term Debt/Market
capitalization. Likewise, they are more likely to issue foreign currency convertibles when
exchange rate volatility is low. We control for the 90-day exchange rate volatility just before
issuance to account for recent currency volatility. Firms are more likely to issue equity or equity
linked securities when stock prices are less volatile. We incorporate the volatility of stock returns
measured over 90-days before the issuance.
Although convertibles ordinarily make sense for high growth firms, they are not
appropriate for R&D intensive firms that are exposed to earnings shocks arising out of
uncertainties in R&D outcomes. Consequently, foreign convertibles would not be suitable for
R&D focused firms and are less likely to issue these instruments. We measure the R&D intensity
as R&D expense divided by sales.
The rationing hypothesis (Lewis et al., 2001) suggests that firms facing uncertainty in post-
issue operating performance would be forced to issue equity linked securities rather than
depository receipts. Convertibles allow investors to benefit from the upside potential of the
company while retaining the safety of debt. Likewise, when there is difference in opinion about
the risk of the issuing firm, and hence the discount rate, issuers may be forced to issue convertibles
rather than depository receipts. Convertibles are relatively insensitive to firm risk (Brennan and
Schwartz, 1988). We measure risk through beta, a measure of systematic risk.
Straight debt suffers from moral hazard problem. Shareholders can take on business
gambles at the expense of bondholders (Jensen and Meckling, 1976; Smith and Warner, 1979).
Bondholders may realize this ex-ante and demand a premium. To prevent agency conflicts arising

11
from risk shifting, firms may issue equity. But an all-equity capital structure might not be optimal
as it results in loss of interest tax shields and excessive managerial discretion. The risk shifting
hypothesis suggests that firms substitute convertible bonds for straight debt and this substitution
is more likely when the firms face significant risk in investment opportunities (Green, 1984; Lewis
et al., 1999). According to the risk shifting hypothesis firms are likely to issue convertibles when
they face higher idiosyncratic risk. We take the 90-day standard deviation of stock returns (total
risk) as proxy.
The backdoor equity financing hypothesis suggests that convertibles are an alternative to
an outright sale of equity (Stein, 1992). Firms may issue convertibles to obtain equity at better
prices than the prevailing stock price. Substituting equity with convertibles is more likely when
bankruptcy costs are high (because of which they may be reluctant to sell debt) and asymmetric
information is high (because of which they may be reluctant to sell equity). We take firm size as
proxy for information asymmetry. We posit that bankruptcy costs are high when firms have high
intangible assets. We take the Market/Book ratio as proxy for future growth opportunities. It is
also possible that firms may resort to convertibles when firms expect higher capital gains or lower
dividend yield.
The pecking order theory of capital structure predicts that when the internal cash flow is
less than the investment requirement, companies issue the least information sensitive security first
and work downwards (Myers and Majluf, 1984). That is, issue debt, convertibles, preferred stock
and then equity in that order. Consequently, when firms have larger liquid resources (measured as
Cash + Marketable Securities/Total Assets) they are more likely to issue convertibles. These firms
may also have higher cash flows. We measure cash flow as operating income before depreciation
minus total taxes adjusted for changes in deferred taxes, minus gross interest expense, and minus
dividends paid on common and preferred stock, divided by total assets.
Finally, we introduce industry and time fixed effects to account for potentially omitted
variables. We present the results of our logit regression in Table 2. The dependent variable is a
dummy set equal to 1 if the firm issues FCCBs and 0 if it issues depository receipts. We estimate
three regression models in which alternate proxies for firm size such as total assets and cash flow
from operations and for leverage (i.e. Debt/total assets and debt/equity).
In all the three regressions, the coefficients of foreign sales and M/B are negative and
significant. The negative coefficient on foreign sales indicates that firms with higher foreign sales

12
are less likely to issue FCCB. It is entirely possible that firms may have foreign sales denominated
in currencies other than the USD but FCCBs are mostly denominated in USD. However, a large
number of foreign transactions are settled in USD. Therefore, our result does not support the
natural hedge hypothesis of FCCBs. However, our result supports the financial risk avoidance
hypothesis. Firms with better growth opportunities are less likely to issue FCCBs. This result is
consistent with the notion that growth firms may avoid foreign currency debt that may interfere in
their product market strategy if debt service rises to unacceptable levels due to a decline in the
value of domestic currency. We also find that more leveraged, riskier, and R&D intensive firms
are more likely to issue FCCBs. More leveraged firms may choose to issue equity linked securities
abroad because of the small size of domestic capital market (for convertibles or equity). The
positive coefficient on taxes/total assets suggests that the security choice may also be driven by
tax considerations. Our models correctly classify 83%-86% of observations.
4.2. How do Stock Markets React to Foreign Currency Convertible Issuance?
Having examined the determinants of foreign currency convertible issuance, we turn to the
stock market reaction to announcement of FCCBs. If the benefits from these instruments exceed
costs, we would expect the stock market to react positively.
Prior research on the announcement day effects of straight debt, convertible debt and
convertible preferred stock issues reports an insignificant negative stock price reaction to the
announcement of straight debt issues but a significant negative stock price reaction for convertible
debt and convertible preferred stock issues (Dann and Mikkelson, 1984; Eckbo, 1986; Mikkelson
and Partch, 1986; Kim and Stulz, 1992; and Jung et al., 1996). Dann and Mikkelson (1984) find a
-2.3% significant return around announcement day of convertible debt issues. In the context of
depository issues Miller (1999) finds a significantly positive three-day cumulative abnormal return
around the announcement dates. Kang et al. (1995) investigate the stock price reaction to issues of
offshore dollar-denominated equity-linked debt by Japanese corporations and find a significant
positive abnormal return of 0.5 percent over the three days surrounding the issue announcement.
Our event study methodology is similar to Kang et al., 1995; Lewis et al., 2003; Field and Hanka,
2001; Miller, 1999. We follow a standard event study methodology to measure abnormal returns
(Kothari and Warner, 1997). We compute abnormal returns in two ways. First, we compute
abnormal returns relative to the CAPM and second, we compute abnormal returns relative to the
Fama-French three factor model.

13
We measure cumulative abnormal returns over 41-day, 15-day, 11-day, 4-day, 3-day 2-
day, and 1-day event windows. Announcement dates were identified using the Bloomberg database
to run the event study. Out of 458 firms that issued FCCBs (333), ADRs (101) and GDRs (24)
during 2000-2017, stock prices were not available for 4 firms as they were delisted. More than one
issue made by the same company on the same date were considered as single issue, which reduced
our sample to 402 firms (DRs- 117 and FCCBs- 285). Daily stock returns before the announcement
dates were collected to calculate firms’ normal returns.
When the conversion premium is high, the probability of conversion is low, ceteris paribus,
because of strong growth assumption7. These convertibles would behave like bonds, especially if
the coupon is high. Firms with low conversion ratios, on the other hand, aim to share risk, and
thus, are more equity-like. The interest on convertibles is a tax-deductible expense. Consequently,
firms with predictable taxable income could issue bond-like instruments to take advantage of tax
deductibility of interest expense and issue equity- like instruments when the prospects of stock
price rising are high. We classify FCCB issues as bond-like and equity-like by setting the cut off
at the median conversion premium. Those issues with below the median conversion premiums are
equity like.
FCCBs were classified as Bond-like and Equity-like by setting the cutoff at the median
conversion premium of 19.19%. Bonds above the cutoff are classified as Bond-like (with a dummy
variable equal to 1) and those below than the cut off are treated as Equity-like with dummy variable
equal to 0. The conversion prices were gathered from the annual reports of companies. We use an
estimation window starting 200 trading days prior to the event date and ending 60 days before the
event window. These normal returns were used to calculate abnormal returns surrounding multiple
event windows using the Capital Asset Pricing Model and Fama-French three-factor models.
Abnormal returns are calculated as follows:
CAPM ARit = Rit – αi – βi(Rmt - Rft) (1)
7 Conversion Premium is calculated as the percentage difference between conversion price and the stock price on the
date of issue.

14
Where Rit is the daily return of firmi, Rmt is the market benchmark return (S&P Bombay Stock
Exchange- stock index, Sensex), Rmt - Rft is the excess return on the market portfolio, αi and βi are
the intercept and slope estimated from pre-event estimation window.
FFM ARit = Rit – αi – βi(Rmt - Rft) - βi2 HMLt - βi3 SMBt (2)
Where HMLt (i.e. high minus low) and SMBt (i.e. small minus big) are Fama-French book-to-
market and size factor returns. We then compute cumulative abnormal returns for different event
windows around the announcement dates.
N
Cumulative Abnormal Return, CARi = ∑ ARit (3)
t=1
Where ARit is the abnormal returns of stocki on trading day t
Table 3 presents the results of our event study. In Panel A we tabulate the returns relative
to the CAPM. Column 1 shows that the 3-Day cumulative abnormal return for FCCB issues is -
1.463%, which is statistically significant at the 5% level. Longer windows produce even more
negative returns. 11-Day cumulative abnormal returns are -4.013%, which is statistically
significant at 1% level, and 41-Day cumulative abnormal returns are -14.50%. In the next two
columns we tabulate the results for bond-like and equity-like instruments. Throughout the event
window, both types of FCCB issues elicit negative stock market reactions. The abnormal returns
are most negative for equity like issues. Column 4 displays CARs for depository receipts. We find
that depository receipt issues too elicit negative returns but are insignificant.
As an alternative to the CAPM and for robustness, we estimate the CARs after adjusting
for the Fama-French three factors. The results are tabulated in Panel B of Table 3. The results are
qualitatively similar. The CARs are mostly significantly negative throughout the estimation
window. The 3-Day abnormal return is -1.549%, which is statistically significant at 1% level. The
11-Day and 41-Day cumulative abnormal returns are -4.400% and -15.524%, respectively.
Further, depository receipts elicit a negative but insignificant return. Our results reinforce the
hypothesis that the benefits from cross border issuance of convertibles are at best illusory. The
costs may exceed the benefits.
4.3. Motives for Issuing FCCBs

15
In this sub section we examine the motives for issuing FCCBs. The literature on convertibles
and depository receipts suggest three motives. They include delayed equity, cheap debt and
relaxing capital constraints. We investigate whether these motives are valid for issuing foreign
currency convertibles.
4.3.1. Delayed Equity
Firms may issue foreign currency convertibles because they allow issuers to sell stock at a
premium to the prevailing stock price. FCCBs would be particularly attractive if similar stocks
trade at higher multiples in foreign markets. One of the prime assumptions in issuing convertibles
is that the company’s stock price will rise in future. If the stock price falls after issuing the
convertible, investors will not convert resulting in a debt overhang. We estimate a logistic
regression in Table 4 in which the dependent variable is a dummy equal to 1 if the firm issues
equity over 5 years. We match FCCB issuers with domestic issuers in the same industry that have
not issued FCCBs. For FCCB issuers the dummy would be equal to 1 if the firm issues equity due
to conversion of the bond. The variable of interest is the FCCB dummy. We control for capital
expenditure intensity, growth opportunities, firm size, liquidity, financial leverage, firm
profitability, R&D intensity and volatility of stock returns over 90 days. We include industry and
time fixed effects. We find that FCCB issuers are more likely to issue equity due to conversion of
FCCBs. That is, the coefficient on FCCB dummy is significantly positive. The signs and
magnitudes of control variables suggest that bigger, more leveraged and risky firms are more likely
to issue equity. Our result supports the hypothesis that FCCBs may be delayed equity.
4.3.2. Cheap Debt
Managers often believe that issuing debt in a foreign currency results in savings. The yield
to maturity on FCCBs range from 4-8.5 percent with an average of 6.1 percent. Most FCCBs were
priced to yield 5-7 percent. YTMs on FCCBs were favorable compared to straight debt issues. The
coupon on FCCBs were 30 to 40 percent lower than straight bonds and foreign currency loans.
This translates into cost savings of 2-3 percent per annum. One-third of the issuers could raise
funds at yields lower than the sovereign yield. FCCBs carry fewer covenants than syndicated loans
and straight bonds. Hence these were more convenient to issuers. In most cases, the conversion
price embedded in the bond involved a substantial premium to the market price at the time of the
issue. On average, FCCB issues commanded a premium of 44%. FCCB bondholders who chose
not to convert would receive the principal at an exchange rate fixed at the time of the issue.
16
Firms may opportunistically source capital in a foreign currency when interest rates are
lower (Keloharju and Niskanen, 2001). International interest rate arbitrage ensures that nominal
yield differentials between debt denominated in different currencies equal the expected rates of
change in the spot exchange rates. The interest rate parity condition ensures that returns measured
in a common currency are the same. As a result, firms should be indifferent between currencies if
they base their decision on expected costs. However, firms may not believe in interest rate parity
(McBrady et al., 2010). And managers may also be overconfident in their decisions (Malmendier
and Tate, 2015).
The covered interest parity suggests that the forward rate and the spot rate are linked by
the difference in nominal interest rates on the two currencies8.
F = S [(1+Rh)/ (1+Rf)] (5)
Where F is the forward exchange rate expressed as units of domestic currency per foreign currency,
S is the spot exchange rate expressed as units of domestic currency per foreign currency, Rh and
Rf are interest rates at home and abroad.
We investigate whether real capital costs were lower in the U.S dollar than the Indian
Rupee during 2000-2017. A related question is whether there were timing opportunities. We
convert US Dollar rates into realized rupee rates by taking the natural log of the ratio of the spot
exchange rate for any one month to the spot rate of three months earlier and then subtracting this
continuous rate of exchange from the Dollar interest rate available three months ago. We take the
difference between this Rupee-equivalent cost of borrowing in dollars and the cost of borrowing
directly in Rupee to conduct a test of uncovered interest arbitrage. Uncovered interest rate parity
stipulates that the expected rate of change in the spot exchange rate equals the difference in the
nominal Rupee and Dollar interest rates. This may be expressed as:
(Rdollar - S) - RRupee = 0 (6)
Where S is the expected rate of change in the spot Rupee-Dollar exchange rate; Rdollar and Rrupee
are nominal Dollar and Rupee interest rates respectively. The difference between S and (Rrupee –
8 This line of analysis is motivated by Kester and Luehrman (1989)

17
Rdollar) is to be estimated. Under no arbitrage conditions it should be zero. We obtained the data on
historical exchange rates and interest rates from the RBI database on Indian Economy, the
Economic Research database of Federal Bank of St. Louis and www.investing.com. We use 90-
day treasury rates in our analysis. While this analysis can be extended to corporate debt issues of
5 year tenors, there could be differences in credit risk and premium in the two currencies. In
addition, reliable data is a challenge. The average 90-day USD rate was 1.6% and the average INR
rate was 6.53%. To compare the nominal yields, we adjust for changes in the rupee-dollar exchange
rates over the 90-day holding period. In our case, we find that the mean difference is -3.67%. Until
2001, borrowing in Rupee was desirable but after 2001 it was cheaper to borrow in USD (Figure
2). We find that the issuance of FCCBs in consistent with this finding. There were not many
FCCBs issued before 2001, but issuance increased after that. FCCB issuance was at its peak during
2007. A record 75 issues were made in that year. There was a rapid decline in issuance since 2008.
The uncovered interest arbitrage equation above can be split into 2 components: a
difference in real interest rates and the expected rate of change in real (inflation-adjusted) exchange
rates. Examining each component of the equation permits to gain insights to the causes underlying
deviations from uncovered interest arbitrage. Ex-post real interest rates can be calculated by
subtracting monthly observations of ninety-day inflation rates in US Dollar and Indian Rupee from
the corresponding monthly observations of 90-day dollar and rupee interest rates. Subtracting
monthly dollar real rates from Rupee real rates provides a time series of differences. We obtained
the data from RBI database on Indian Economy, Economic Research database of Federal Bank of
St. Louis and IMF’s e-Library. The mean of the difference is 4.15%. However, throughout the
period, there were many periods during which rupee and dollar real interest rates were not identical
(see Figure 3). The chart shows that the difference has been positive for most part indicating that
it would have been cheaper to borrow in dollar.
The other factor potentially giving rise to borrowing cost advantages in one currency is
changes in real exchange rates. Real exchange rates are deviations from PPP. That is, they are the
changes in the spot exchange rate that do not reflect differences in inflation rates between the two
currencies. To calculate deviations from PPP, the 90-day rate of change on the spot exchange rate
and rupee inflation are subtracted from the dollar inflation. The differences in inflation rates and
the 90-day rate of change of spot exchange rate are plotted for 2000-2018 in Figure 4. The mean
18
of differences is -0.49%. The graph indicates that the rupee depreciated in real terms mostly before
2008. After 2008, in many periods, borrowing in dollars has been cheaper.
While our analysis of short term risk free rates suggests that there may be some arbitrage
opportunities, they are not likely to persist over long periods of time. Further, corporate bonds
have longer tenor. It is quite likely that the advantage may shift easily to another currency
subsequent to an issuance. That is, real interest rate advantage may switch from USD to INR and
vice –versa. Overall, our analysis suggests that although there could be a break down in parity
conditions, it is impossible to forecast the advantage ex-ante. Consequently, one currency may be
as good as another.
4.3.3. Relax Capital Constraints
Access to developed capital markets and raising new funds may be an important motivation
for these firms (Lins et al., 2005) and these may enable issuing firms to take advantage of growth
opportunities (Stulz, 1999; Doidge et al., 2003). Issuers of foreign currency convertibles may be
rapidly growing firms that are capital constrained. We hypothesize that these firms would be able
to undertake capital investments that would are unavailable to firms that have not internationalized
their capital structure. Lins et al. (2005) document that, following a U.S. listing of ADRs, the
sensitivity of investment to free cash flow decreases significantly for firms from emerging capital
markets. We apply this line of analysis to FX convertible bond issuers because these companies
are likely to be more constrained than ADR issuers that are arguably better quality firms. Further,
convertibles are more popular than depository receipts in many emerging markets. We examine
how the FCCB issuance affects investments relative to others. The dependent variable in each OLS
regression is investment (the ratio of annual capital expenditures to capital at the start of the period)
measured over one and two years after issuance of FCCBs. The explanatory variables include a
FCCB dummy set equal to 1 if the firm has issued FCCBs and zero otherwise, macro q, an
alternative measure of Tobin’s q, defined as the sum of debt and equity less inventory divided by
the start-of-period capital stock (Erickson and Whited, 2000; Chava and Roberts, 2008), cash flow
(to measure a firm’s ability to undertake investments), debt to total assets ratio (measure of
leverage), ROA (profitability) and natural log of total assets (measure of firm size), and market-
to-book ratio (to measure future growth opportunities). All independent variables except for cash
flow are lagged by one period. We include firm and time fixed effects.
19
Table 5 presents the results of regression analysis of how the issuance of FCCBs by firms
affects investments over one and two years after issuance. We find a positive and significant
relation between FCCB dummy and investment indicating that there is an increase in investment
for FCCB issuers after issuance relative to non-issuers. The coefficients on firm size, ROA and
M/B are also significantly positive, which suggests that bigger firms, more profitable firms and
firms with better growth opportunities invest more. Overall, our analysis suggests that firms may
issue FCCBs to relax capital constraints.
4.4. Consequences of Issuing FCCBs
In this sub section we investigate the consequences of issuing FCCBs. In particular, we
examine the impact of issuing FCCBs on default probability and long term operating performance.
4.4.1. Default Probability
The Indian Rupee appreciated from INR 46/USD in 2000 to INR39/USD in 2007 and has
since depreciated to INR 68 in 2016. As a result, we hypothesize that firms issuing convertibles
denominated in a foreign currency are more vulnerable due to currency fluctuations because of
lack of long dated hedging mechanisms. 38 out of 333 issuers of FCCBs actually defaulted on
interest payments. In a sample between 1970 and 2000, Moody’s found that default rates for rated
convertible bond issuers are higher than those without convertible bonds in their capital structures
even when the convertibles are not denominated in foreign currencies (Hamilton et al. 2001). They
also find that convertible bond issuers that do not convert or redeem their bonds early face
heightened risk of default in the third year following issuance and it continues up to 6 years. We
expect this to be particularly true for FCCB issuers. We investigate whether issuing FCCBs
increases the probability of default. We examine whether the default risk of FCCB issuers (as
measured by credit ratings and actual default) increases more than non-issuers (industry peers who
issue only domestic bonds) up to three years from the time of convertible bond issue. In the first
step we model the change in ratings of FCCB issuers and non-issuers over three years after
controlling for financial ratios, corporate governance factors and macroeconomic variables that
are known to affect credit ratings. In the second step we model actual defaults by issuers.
4.4.1.1.Credit Rating Transitions
20
In this section we model rating transitions. In particular, our goal is to examine whether
the issuance of FCCBs results in a deterioration of financial condition and hence a rating
downgrade. A rating downgrade of FCCB issuers may be a result of firm and market variables
rather than the issuance itself. We estimate a logit regression model. We consider FCCB issuance
as the treatment, FCCB issuers as treated units and non-issuers as untreated units. The outcome is
the observed rating downgrade by the third year of issuance.
That financial ratios and financial statement data are related to ratings is at least as old as
Altman (1968). He uses five ratios, similar to those used in rating studies, to predict bankruptcy.
They are working capital/total assets, retained earnings/total assets, earnings before interest and
taxes/total assets, market value of equity/book value of total assets, and sales/total assets. These
ratios have been used to predict rating transitions and are found to have significant effect (Kim
and Sohn, 2008). Blume et al. (1998) employ ratios for pre-tax interest coverage, operating income
to sales, long term debt to assets, total debt to assets, and total assets. The first two ratios should
be positively related to improvements in credit ratings; the last two ratios should be negatively
related to improvements in credit ratings. In addition to these accounting ratios, past studies have
used beta coefficients and standard errors from the market model.
Bhojraj and Sengupta (2003) point out that a firm's likelihood of default depends on the
availability of credible information to evaluate the default risk and agency costs. Both of these are
determined by governance mechanisms. They distinguish between two mechanisms through which
governance affect credit ratings. The first is the agency problem. It is the risk that management
acts in its self-interest rather than maximize firm value. The second is information risk. It is the
risk that managers have private information that would adversely affect the default risk of a firm’s
debt. Governance mechanisms can reduce these risks. More specifically, firms with better
governance ought to receive a higher rating. Similarly, mechanisms that result in timely disclosure
of information should reduce information risks and therefore improve a firm's rating. They identify
three factors to capture these mechanisms- institutional ownership, block holding, and board
structure. Institutional investors may actively monitor the management and take the required steps
to protect shareholder interests. Concentrated ownership (e.g. by founding families) could allow
block holders to exercise undue influence over management to secure benefits that are detrimental
to other providers of capital. Extraction of private benefits is more likely at lower levels of

21
shareholding. At higher levels of shareholding better incentive alignment might discourage
founders from extracting private benefits.
Corporate boards monitor management performance and protect shareholder interests. In
particular, outside directors are expected to monitor management more closely because they would
be wary of their reputation. We would expect board monitoring in a firm with more independent
directors to be better. Other things remaining constant, this should improve ratings. They use the
percentage of stock held by institutional investors and the percentage of outside board directors as
proxies for institutional ownership and board independence respectively. To capture block-
ownership they separately use the percentage of stock held by blockholders and the percentage of
shares held by institutional investors. We too follow a similar methodology.
The observed decrease in credit quality might also be due to macroeconomic effects of the
business cycle. We use a dummy variable to capture the effect of the global financial crisis. The
dummy variable takes the value of 1 for crisis years (2007 and 2008) and zero for other years.
Hence a firms issuing FCCBs in 2004 and 2005 would start in a non-crisis year and end in a crisis
year as we measure the rating transition over three years.
We model credit rating declines over 3 and 5 years after issuance using a logistic regression
in Table 6. The dependent variable is a dummy equal to 1 if the rating declines over 3 or 5 years
in the first two columns. The variable of interest is the FCCB dummy set equal to 1 if a firm issues
FCCBs and zero, otherwise. We match firms FCCB issuers with similar non-issuers in the same
industry. These firms would have issued domestic debt.
We control for firm profitability, profit margin, retained earnings, working capital,
leverage, systematic risk, institutional shareholding, large shareholder holdings, proportion of
independent directors on the board and a global financial crisis dummy set equal to 1 if the issue
is made during 2007 and 2008.
We find that if a firm issues FCCBs there is a significantly higher probability of a rating
decline. In the next two columns we model rating declines below the investment grade. The
dependent variable is a dummy set equal to 1 if the rating declines below investment grade (BBB)
over 3 or 5 years. Again, we find that FCCB issuers have significantly higher probability of a
rating decline below the investment grade.
The signs and magnitudes of controls in column 4 suggest that more profitable firms and
firms with higher family and institutional shareholding are less likely to experience a rating decline
22
below the investment grade whereas firms with higher systematic risk have a higher probability of
a rating decline below the investment grade over 5 years.
4.4.1.2.Modeling Default
As pointed out earlier, 38 firms defaulted on interest payments on FCCBs. In this section
we examine the determinants of actual default. Past studies that predict bankruptcy have mostly
used financial ratios such as working capital/total assets, retained earnings/total assets, and
earnings before interest and taxes/total assets (Altman, 1968; Ohlson, 1980). In the last two
columns of Table 6 we model actual default over 3 and 5 years after issuing (FX convertible or
domestic) debt. The dependent variable in this logistic regression is a dummy set equal to 1 if the
firm has defaulted on debt service. We match each issuer of FCCBs with industry peers that did
not issue foreign debt (but issued domestic debt). The variable of interest is the FCCB dummy,
which is set equal to 1 if the firm has issued FCCBs. We control for firm profitability, profit
margin, retained earnings, working capital, leverage, systematic risk, institutional shareholding,
large shareholder holdings, proportion of independent directors on the board and a global financial
crisis dummy set equal to 1 if the issue is made during 2007 and 2008.
The coefficient of FCCB dummy in column 5 is insignificant but significantly positive in
column 6. That is, FCCB issuers are more likely to default over five years. We also find that more
profitable firms and firms with higher family shareholding are less likely to default. The second
result confirms the hypothesis that family firms may pursue less risky strategies because they value
longevity more. Firms with higher systematic risk are more likely to default. However, the higher
the retained earnings, the higher is the default risk, which is contrary of what we would expect.
Our models correctly classify 90-94% of observations.
4.4.1.3. Propensity Score Matching
As an alternative to the regression analysis we resort to a propensity score matching
procedure. We compare the rating transitions of FCCB issuers and matched peer firms using a
nearest neighbor propensity matching procedure. The propensity score is estimated within a year-
size category during 2000-2017 using controls in a logit regression analysis. We require that the
difference between the propensity score of the firm issuing FCCB and its matching peer does not
exceed 0.2% in absolute value. We compare the rating transitions between the two groups. The
results of PSM are reported in Table 7. Panel A of Table 7 reports the rating transition over 3 years.
We find that FCCB issuers are more likely to experience a decline but not necessarily below the

23
investment grade over 3 years. Panel B reports the results over 5 years. Our results suggest that
firms that issuers of FCCBs are significantly more likely to experience a rating downgrade below
the investment grade over a five-year time horizon.
Similar to rating transitions we compare actual default by FCCB issuers with non-issuers
using a PSM procedure. The results are reported in Table 8. The PSM results confirm the
regression analysis. FCCB issuers are significantly more likely to default on debt service over five
years after issuance.
4.4.2. Operating and Stock Market Performance
A related question of interest is: how does the issuance of FCCBs affect the operating and
stock market performance over a longer horizon? Table 9 presents the operating and stock market
performance of FCCB issuers and their matching firms to determine whether the negative stock
market reaction for announcements of FCCB issues is due to subsequent, poor operating
performance. We measure operating performance as the median net profit margin and return on
assets measured from two fiscal years before the offering to four fiscal years following the offering.
Profit margin is defined as net income before extraordinary items divided by sales and Return on
assets is defined as net income before extraordinary items divided by total assets. Year 0 is the
year of the FCCB offering. Net profit margins and ROA size matched firms are subtracted from
that of FCCB issuers. The last row reports the difference.
We follow the procedure in Barber et. al (1996) and Loughran et. al (1997) in their study
of seasoned equity offerings. We match each issuing firm with a comparison firm that has not
issued foreign currency convertible bonds based on industry affiliation, EBIT/Total assets, size,
and market to book ratio. The following algorithm is used to match the firms: (1) if there is at least
one non-issuer in the same industry with end of the year 0 size within 25% to 200% of the issuing
firm, the non- issuer within the closest EBIT/Assets ratio to that of the issuer is chosen as the
matching firm. (2) if no non-issuer meets this criterion, then all non-issuers with year 0 size of
90% to 110% of issuers are ranked, and firms with closest and higher EBIT/ Assets are selected
as the matching firm.
The operating and stock market performance of issuers and non-issuers are reported in
Table 9. We find that the operating performance of firms issuing FCCBs deteriorates after the
issue. The median profit margin declines from 15.25% in the year of issue to 13.76% over four
years after the offering. The decline in profit margin leads to a reduction in the issuer’s return on
24
assets from 9.13% in the offer year to 7.14% four years later. The median operating performance
of non-issuers also declines during the four years subsequent to the offer year. Profit margin of
non-issuers declines from 9.6% to 9.4% from the year of offer to four years later. The median
return on assets also declines from 9.21% in the offer year to 8.92% after four years. But these are
insignificant.
The third row reports the results of formal statistical tests of the operating performance
differences between the FCCB issuers and the non-issuers. We compute Z-statistics using a
Wilcoxon signed-rank test to examine that the annual distribution of issuers and non-issuers
operating performance measures are identical. Positive (negative) Z-statistics indicates that the
operating performance measure for the issuer is better (worse) than the matching firm. Profit
margins and ROA for FCCB issuers are better than the matching firms before issuance but the
superior performance does not continue into the post-issuance period. FCCB issuers have lower
ROA in each year for up to 4 years relative to non-issuers. Just before the issuance, a median
FCCB issuer has a ROA of 10.69% whereas a median non-issuer has a ROA of 9.7%, leading to
a positive spread of 4.6%. This turns negative soon after the issuance and by the fourth year the
spread is -4.28%.
To measure long-run return performance, we follow Barber and Lyon (1997) and Kothari
and Warner (1997) and estimate annually buy-and-hold abnormal returns (BHAR). We also
estimate annually Cumulative Abnormal Return (CAR). These are the standard metrics used in the
finance literature to represent different ways of defining long-term stock returns. The literature is
inconclusive as to the choice between BHAR and CAR (Gompers and Lerner, 2003). We report
both. BHAR, which is the market-adjusted stock return based on buying at the beginning of the
month and selling at the end of the sample period taking into account any intervening distributions,
and CAR, which is the cumulative average abnormal return assuming annual compounding (Brav
et al., 2000). A formal definition is as follows:
CARi = Σt=1toT (Rit –Rmt) (7)
BHARi = Πt=1toT (1+Rit) – Πt=1toT (1+Rmt) (8)
Rit is the monthly return of firm i and Rmt is the market benchmark return (S&P NSE 50
Index return) in month t. Monthly benchmark-adjusted returns are calculated as the monthly raw
return on a stock minus the monthly benchmark index return for the corresponding period and then
the returns are annualized.
25
In Panel C of Table 9 we report the cumulative abnormal returns and buy and hold
abnormal returns of issuers and non-issuers over 2 and 3 years subsequent to issuance. We find
that issuing firms have substantially lower CARs compared to non-issuers. The average CARs for
issuing firms are -24.36% and -19.46% over 2 and 3-year horizons, whereas non-issuers generate
-11.86 and 5.9% respectively. The differences are statistically and economically significant. The
2-year and 3-year BHARs are -30.74% and -20.42% for issuers and -33.88% and -5.55% for non-
issuers. The differences in BHARs, 3.14% and -14.87%, are insignificant in a statistical sense but
are economically significant.
5. Conclusion
The issuance of offshore dollar convertible securities by Indian firms increased dramatically
during the pre-crisis years. Issuance has been somewhat subdued since then. We analyze the
motives for and consequences of issuing these securities using a sample of issuers during 2000-
2017. Although the traditional rationale for convertibles is equally applicable to offshore
convertibles, their issuance could potentially increase the probability of default and a rating
downgrade. Volatility in exchange rates may jeopardize the financial health of the issuing firm and
may drive it to bankruptcy. Unbridled expansion in issuance of these instruments could induce
systemic crises and potentially cripple the system during periods of large currency depreciations
when the currency mismatch is common to many borrowers. Regulators ought to take note of the
risks involved in issuing these instruments and devise suitable regulatory oversight.

26
References
Alexander, G.J., Eun, C.S., Janakiramanan, S., 1988. International listings and stock returns: Some empirical evidence. Journal of Financial and Quantitative Analysis 23, 135-151. Altman, E.I., 1968. Financial Ratios, Discriminant Analysis and the Prediction of Corporate Bankruptcy. Journal of Finance 23, 589-609. Amihud, Y., Mendelson, H., 1986. Asset Pricing and the Bid-Ask Spread. Journal of Financial Economics 17, 223-249. Baker, H.K., Nofsinger, J.R., Weaver, D.G., 2002. International cross-listing and visibility. Journal of Financial and Quantitative Analysis 37, 495-521. Barber, B.M., Lyon, J.D., 1996. Detecting Abnormal Operating Performance: The Empirical Power and Specification of Test Statistics. Journal of Financial Economics 41, 359-399.
Barber, B.M., Lyon, J.D., 1997. Detecting Long-Run Abnormal Stock Returns. Journal of Financial Economics 43, 341–372. Bhojraj, S., Sengupta, P., 2003. Effect of Corporate Governance on Bond Ratings and Yields: The Role of Institutional Investors and Outside Directors. Journal of Business 76, 455-475. Blume, M., Lim, F., MacKinlay, A., 1998. The declining quality of US corporate debt: Myth or reality? Journal of Finance 53, 1389-1413. Brav, A., Geczy, C., Gompers, P.A., 2000. Is the abnormal return following the equity issuance anomalous? Journal of Financial Economics 56, 209-249. Brennan, M.J., Schwartz, E.S., 1988. The Case for Convertibles. Journal of Applied Corporate Finance 1, 55-64. Brigham, E.F., 1966. An Analysis of Convertible Debentures: Theory and Some Empirical Evidence. Journal of Finance 21, 35-54. Chaplinsky, S., Ramchand, L., 2000. The impact of global equity offerings. Journal of Finance 55, 2767-2789. Chava, S., Roberts, M.R., 2008. How does Financing Impact Investment? The Role of Debt Covenants. The Journal of Finance 63, 2085-2121. Dann, L.Y., Mikkelson, W.H., 1984. Convertible Debt Issuance, Capital Structure Change and Financing-Related Information. Journal of Financial Economics 13, 157-186. Doidge, C., Karolyi, G.A., Stulz, R.M., 2004. Why are foreign firms listed in the U.S. worth more? Journal of Financial Economics 71, 205-238.

27
Du, W., Tepper, A., Verdelhan, A., 2018. Deviations from Covered Interest Parity. Journal of Finance 73, 915-957. Eckbo, B.E., 1986. Valuation Effects of Corporate Debt Offerings. Journal of Financial Economics 15, 119-151. Erickson, T., Whited, T.M., 2000. Measurement error and the relationship between investment and q. Journal of Political Economy 108, 1027–1057. Errunza, V.R., Miller, D.P., 2000. Market segmentation and the cost of capital in international equity markets. Journal of Financial and Quantitative Analysis 35, 577-600. Field, L.C., Hanka, G., 2001. The Expiration of IPO Share Lockups. Journal of Finance 56, 471- 500. Foerster, S.R., Karolyi, G.A., 1999. The effects of market segmentation and investor recognition on asset prices: Evidence from foreign stocks listing in the United States. Journal of Finance 54, 981-1013. Foerster, S.R., Karolyi, G.A., 2000. The long run performance of global equity offerings. Journal of Financial and Quantitative Analysis 35, 499-528. Green, R.C., 1984. Investment Incentives, Debt, and Warrants. Journal of Financial Economics 13, 115-136. Hamilton, D., Stumpp, P.M., Cantor, R., 2001. Default and Recovery rates of Convertible Bond Issuers: 1970-2000. Moody’s Investor Service.
Henderson, B.J., Jegadeesh, N., Weisbach, M.S., 2006. World markets for raising new capital. Journal of Financial Economics 82, 63-101. Jensen, M.C., Meckling, W.H., 1976. Theory of the Firm: Managerial Behavior, Agency Costs and Ownership Structure. Journal of Financial Economics 3, 305-360. Jorion, P., 1990. The exchange rate exposure of U.S. Multinationals. Journal of Business 63, 331-345. Jung, K., Kim, Y-C., Stulz, R.M., 1996. Timing, Investment Opportunities, Managerial Discretion, and the Security Issue Decision. Journal of Financial Economics 42, 159-185. Kang, J.K., Kim, Y.C., Park, K.J., Stulz, R.M., 1995. An analysis of the wealth effects of Japanese offshore dollar denominated convertible and warrant bond issues. Journal of Financial and Quantitative Analysis 30 (2), 257-270. Kedia, S., Mozumdar, A., 2003. Foreign currency denominated debt: An empirical examination. Journal of Business 76, 521-546.

28
Keloharju, M., Niskanen, M., 2001. Why do firms raise foreign currency denominated debt? Evidence from Finland. European Financial Management 7, 481-496. Kester, W. C., Luehrman, T.A., 1989. The Bank for International Development. Harvard Business School Case No 9-289-034. HBS Publishing, Boston MA.
Kim, Y-C., Stulz, R.M., 1992. Is There a Global Market for Convertible Bonds? Journal of Business 65, 75-91. Kim, Y., Sohn, S., 2008. Random effects model for credit rating transitions. European Journal of Operational Research 184, 561-573. King, T-H. D., Mauer, D.C., 2014. Determinants of Corporate Call Policy for Convertible Bonds. Journal of Corporate Finance 24, 112-134. Kothari, S. P., Warner, J.B., 1997. Measuring Long-Horizon Security Price Performance. Journal of Financial Economics 43, 301–339. Lee, I., Loughran, T., 1998. Performance Following Convertible Debt Issuance. Journal of Corporate Finance 4, 185-207. Lewis, C., Rogalski, R., Seward, J., 1999. Is Convertible Debt a substitute for Straight Debt or for Common Equity? Financial Management 28, 5-27. Lewis, C., Rogalski, R., Seward, J., 2001. The Long-Run Performance of Firms that Issue Convertible Debt: An Empirical Analysis of Operating Characteristics and Analysts Forecasts. Journal of Corporate Finance 7, 447–474. Lewis, C., Rogalski, R., Seward, J., 2003. Industry Conditions, Growth opportunities and market reactions to convertible debt financing decisions. Journal of Banking and Finance 27, 153-181.
Lins, K.V., Strickland, D., Zenner, M., 2005. Do non-U.S. firms issue stock on U.S. equity markets to relax capital constraints? Journal of Financial and Quantitative Analysis 40, 109-133. Loughran, T., Ritter, J.R., 1997. The Operating Performance of Firms Conducting Seasoned Equity Offerings. Journal of Finance 52, 1823-1850.
Malmendier, U., Tate, G. 2015. Behavioral CEOs: The Role of Managerial Overconfidence. Journal of Economic Perspectives 29, 37-60.
Mayers, D., 1998. Why Firms Issue Convertible Bonds: The Matching of Financial and Real Investment Options. Journal of Financial Economics 47, 83-102. McBrady, M.R., Mortal, S., Schill, M.J., 2010. Do Firms Believe in Interest Rate Parity? Review
of Finance 14, 695-726.

29
Merton, R.C., 1987. A simple model of capital market equilibrium with incomplete information. Journal of Finance 42, 483-510. Mikkelson, W.H, Partch, M.M., 1986. Valuation Effects of Security Offerings and the Issuance Process, Journal of Financial Economics 15, 31-60. Miller, D., 1999. The market reaction to international cross-listings: Evidence from depositary Receipts. Journal of Financial Economics 51, 103-123.
Myers, S.C., Majluf, N.S., 1984. Corporate Financing and Investment Decisions When Firms Have Information that Investors Do Not Have. Journal of Financial Economics 13, 187-222. Ohlson J.S., 1980. Financial Ratios and the Probabilistic Prediction of Bankruptcy. Journal of Accounting Research 18, 109-131. Pagano, M., Roell, A.A., Zechner, J., 2002. The geography of equity listing: Why do European companies list abroad? Journal of Finance 57, 2651–2694.
Sarkissian, S., Schill, M.J., 2009. Are There Permanent Valuation Gains to Overseas Listing? Review of Financial Studies 22, 371-412.
Smith, C.W., Warner, J.B., 1979. On Financial Contracting: An Analysis of Bond Covenants. Journal of Financial Economics 7, 117-162. Stein, J.C., 1992. Convertible Bonds as Backdoor Equity Financing. Journal of Financial Economics 32, 3-21. Stulz, R.M., 1999. Globalization, corporate finance and the cost of capital. Journal of Applied Corporate Finance 12, 8-25.

30
Appendix: Description of Variables
Variable Description Source Dependent Variables
CAR Cumulative abnormal returns computed by the following formula: CARi = Σt=1toT (Rit –Rmt)
CMIE Prowess Database/BSE website/Author computation
BHAR Buy and hold abnormal returns computed by the following formula: BHARi = Πt=1toT (1+Rit) – Πt=1toT (1+Rmt)
CMIE Prowess Database /BSE website/Author computation
3 Day CAR Cumulative abnormal returns from the day immediately prior to and the day after the announcement.
BSE website/Author computation
Equity Dummy A Dummy Variable set equal to 1 if a firm has issued equity 0 otherwise.
CMIE Prowess Database /Author computation
Rating Dummy A Dummy Variable set equal to 1 if the rating of a firm issuing FCCB (i) declines (ii) declines below investment grade (iii) defaulted, zero otherwise
CMIE Prowess Database /Author computation
Investment Ratio of annual capital expenditures to capital at the start of the period
CMIE Prowess Database /Author computation
Independent Variable FCCB Dummy A Dummy Variable set equal to 1 if the firm has issued Foreign
Currency Convertible Bonds and zero otherwise. Author Computation
Control Variables Return on Assets (ROA)
Earnings before interest and taxes scaled by Total assets. CMIE Prowess Database /Author computation
Leverage Debt scaled by Total Assets CMIE Prowess Database /Author computation
Exchange Rate Volatility
Standard Deviation of INR/USD RBI Database/Author computation
R&D intensity Research and Development expense scaled by sales. CMIE Prowess Database
/Author computation
future growth opportunities
Sum of the total assets plus the market value of common stock minus the book value of common equity divided by the book value of total assets
CMIE Prowess Database /Author computation
Change in total assets
Difference between total assets at the end of the fiscal year immediately following the offer date minus total assets in the fiscal year immediately preceding the offer date.
CMIE Prowess Database /Author computation
Firm Size Natural log of total assets CMIE Prowess Database /Author computation

31
Cash Flow Operating income before depreciation minus total taxes adjusted for changes in deferred taxes, minus gross interest expense, and minus dividends paid on common and preferred stock, divided by total assets.
CMIE Prowess Database /Author computation
Financial Slack Cash plus marketable securities scaled by total assets. CMIE Prowess Database /Author computation
Volatility Standard deviation of the issuer’s raw return BSE website/Author computation
Issue size Gross proceeds of the issue scaled by total assets CMIE Prowess Database /Author computation
Pre-issue run up in stock price Average of issuer’s raw return
BSE website/Author computation
Pre-issue run up in market Average of market’s raw return
BSE website/Author computation
Foreign currency exposure Foreign Sales scaled by Total Sales
CMIE Prowess Database /Author computation
Dividend yield Dividend in INR divided by the price per share CMIE Prowess Database /Author computation
Beta Systematic risk CMIE Prowess Database
Currency Dummy
Currency Appreciation (or depreciation) is the percentage change in exchange rates between the beginning and ending dates and dummy is set equal to 1 if the currency has appreciated
RBI Database/Author computation
volatility of exchange rates Standard deviation Indian currency to USD
RBI Database/Author computation
P/E divided by Industry P/E
Price-earnings ratio of company scaled by the average price-earnings ratio of industry
NSE website/Author computation
Investment opportunities Capital Expenditure scaled by Sales and Market to Book
CMIE Prowess Database /Author computation
Liquidity Working capital scaled by Total Assets CMIE Prowess Database /Author computation
Profitability Retained Earnings scaled by Total Assets CMIE Prowess Database /Author computation
Operating margin Earnings before interest and taxes scaled by Sales CMIE Prowess Database /Author computation
Institutional investor shareholding (%) Percentage of shares held by institutional investors
CMIE Prowess Database /Author computation
Family shareholdings (%) Percentage of the shares held by the founding family
CMIE Prowess Database /Author computation
Proportion of independent directors (%) The number of independent directors on the board
CMIE Prowess Database /Author computation
Crisis dummy
Crisis dummy takes the value 1 for the financial crisis (also called subprime mortgage crisis) of 2007-08 and zeros for other years.
Author Computation

32
Macro Q
Sum of total book debt and market equity less total inventory divided by the start-of-period capital stock measured by net property, plant and equipment
CMIE Prowess Database /Author computation
Other Variables Exchange Rate Value of INR/USD. RBI Database/Author
computation
Rupee/Dollar lending rates
90 day interest rates www.investing.com
India/USA CPI Inflation Rates
Changes in CPI Economic Research database of Federal Bank of St. Louis
Forward Exchange Rate INR/$
Spot exchange rate [(1+interest rate at home)/ (1+interest rate abroad)].
Author Computation
Real Interest Rates
Subtracting monthly observations of inflation rates in Dollar and Rupee from the corresponding monthly observations of dollar and rupee interest rates.
Author Computation

33
Figure 1: Distribution of FCCB Issues
0
10
20
30
40
50
60
70
80
2000 2001 2002 2003 2004 2005 2006 2007 2008 2009 2010 2011 2012 2013 2014 2015 2016 2017No. of Issues
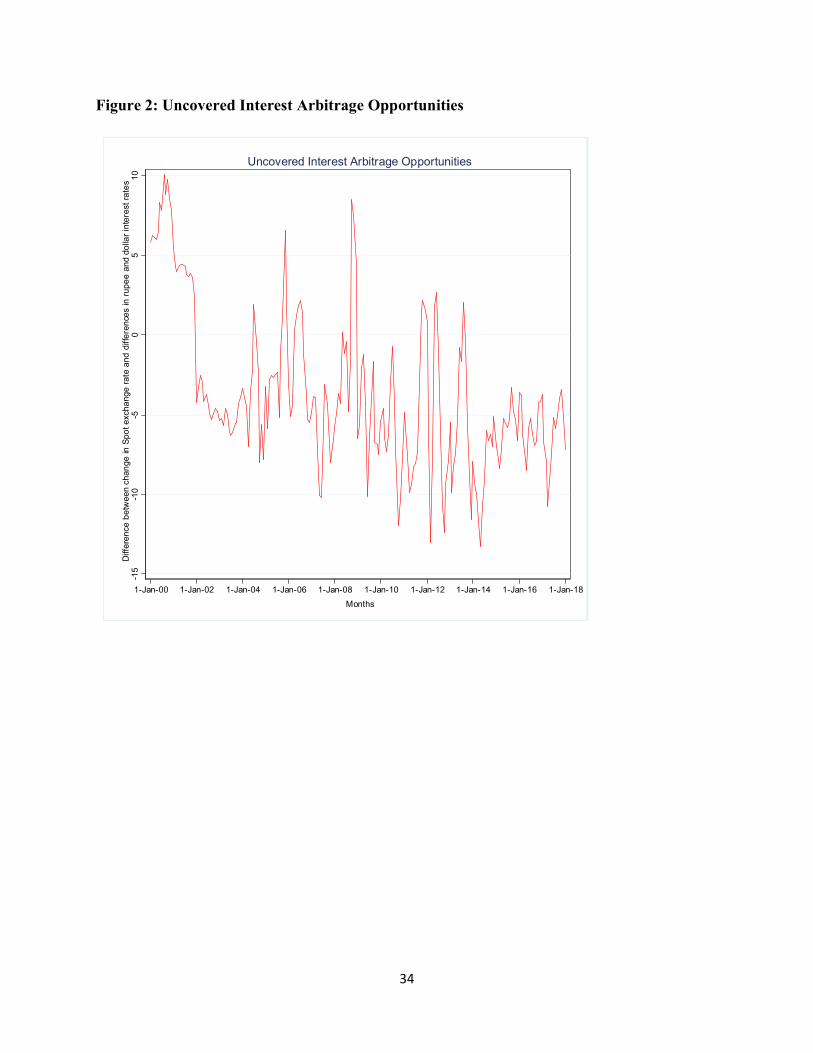
34
Figure 2: Uncovered Interest Arbitrage Opportunities
-15
-10
-50
51
0D
iffe
ren
ce b
etw
een
ch
ang
e in
Sp
ot e
xch
an
ge r
ate
and
diff
ere
nce
s in
rup
ee
and
do
llar
inte
rest
ra
tes
1-Jan-00 1-Jan-02 1-Jan-04 1-Jan-06 1-Jan-08 1-Jan-10 1-Jan-12 1-Jan-14 1-Jan-16 1-Jan-18
Months
Uncovered Interest Arbitrage Opportunities

35
Figure 3: Differences in Real Interest Rates
-10
-50
510
15
Diff
ere
nce
be
twe
en
inte
rest
rat
e d
iffe
ren
ces
and
FX
Fo
rwar
d P
rem
ia/D
isco
unt
s
1-Jan-00 1-Jan-02 1-Jan-04 1-Jan-06 1-Jan-08 1-Jan-10 1-Jan-12 1-Jan-14 1-Jan-16 1-Jan-18
Months
Differences in Real Interest Rates
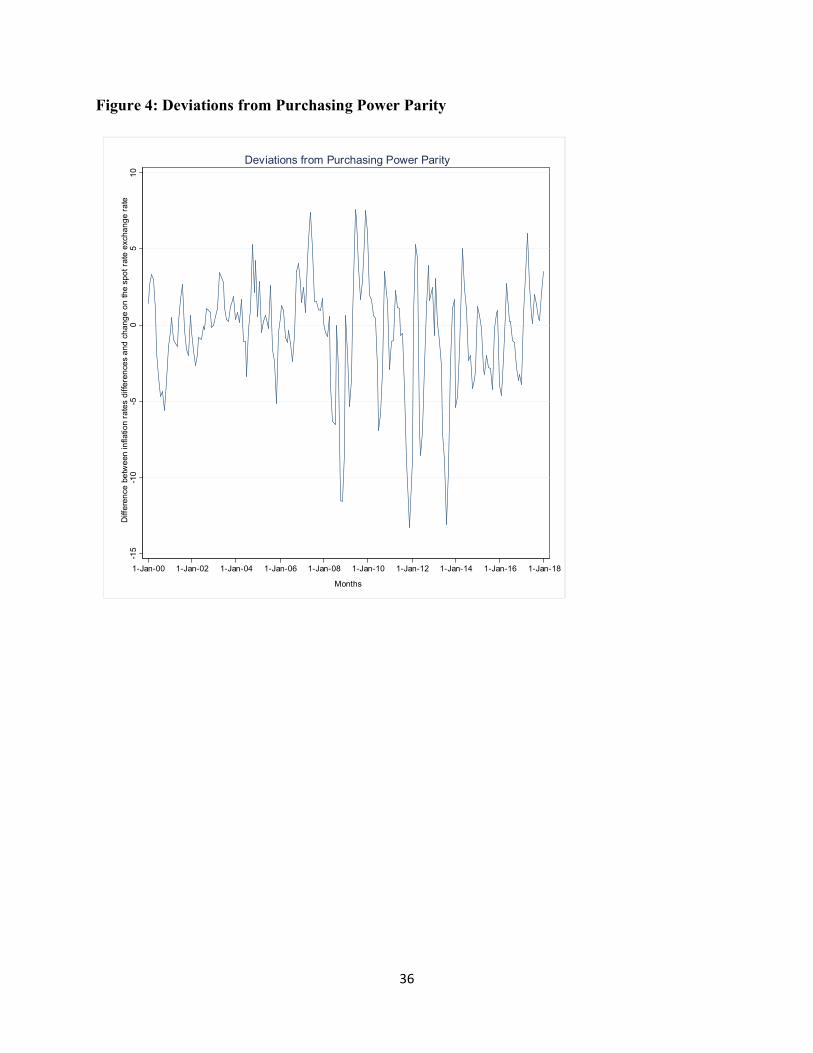
36
Figure 4: Deviations from Purchasing Power Parity
-15
-10
-50
51
0D
iffe
ren
ce b
etw
een
infla
tion
ra
tes
diff
ere
nce
s a
nd
cha
ng
e o
n t
he
sp
ot
rate
exc
ha
ng
e r
ate
1-Jan-00 1-Jan-02 1-Jan-04 1-Jan-06 1-Jan-08 1-Jan-10 1-Jan-12 1-Jan-14 1-Jan-16 1-Jan-18
Months
Deviations from Purchasing Power Parity
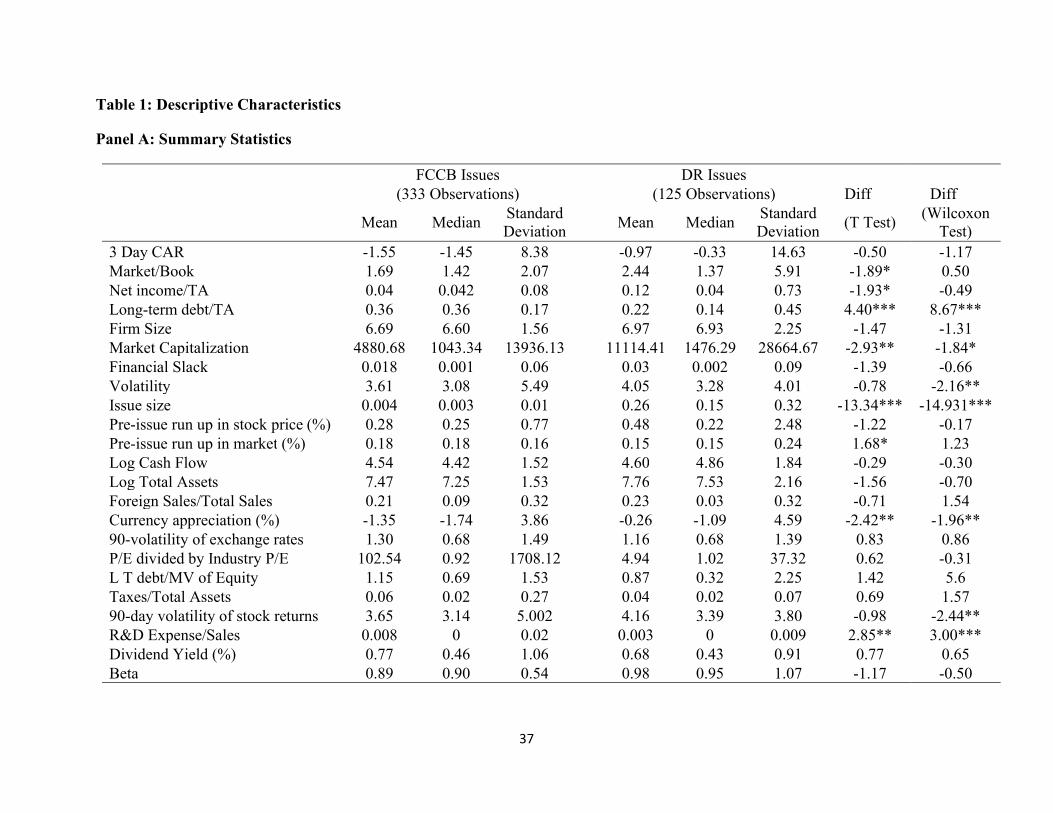
37
Table 1: Descriptive Characteristics
Panel A: Summary Statistics
FCCB Issues DR Issues (333 Observations) (125 Observations) Diff Diff
Mean Median
Standard Deviation
Mean Median Standard Deviation
(T Test) (Wilcoxon
Test) 3 Day CAR -1.55 -1.45 8.38 -0.97 -0.33 14.63 -0.50 -1.17 Market/Book 1.69 1.42 2.07 2.44 1.37 5.91 -1.89* 0.50 Net income/TA 0.04 0.042 0.08 0.12 0.04 0.73 -1.93* -0.49 Long-term debt/TA 0.36 0.36 0.17 0.22 0.14 0.45 4.40*** 8.67*** Firm Size 6.69 6.60 1.56 6.97 6.93 2.25 -1.47 -1.31 Market Capitalization 4880.68 1043.34 13936.13 11114.41 1476.29 28664.67 -2.93** -1.84* Financial Slack 0.018 0.001 0.06 0.03 0.002 0.09 -1.39 -0.66 Volatility 3.61 3.08 5.49 4.05 3.28 4.01 -0.78 -2.16** Issue size 0.004 0.003 0.01 0.26 0.15 0.32 -13.34*** -14.931*** Pre-issue run up in stock price (%) 0.28 0.25 0.77 0.48 0.22 2.48 -1.22 -0.17 Pre-issue run up in market (%) 0.18 0.18 0.16 0.15 0.15 0.24 1.68* 1.23 Log Cash Flow 4.54 4.42 1.52 4.60 4.86 1.84 -0.29 -0.30 Log Total Assets 7.47 7.25 1.53 7.76 7.53 2.16 -1.56 -0.70 Foreign Sales/Total Sales 0.21 0.09 0.32 0.23 0.03 0.32 -0.71 1.54 Currency appreciation (%) -1.35 -1.74 3.86 -0.26 -1.09 4.59 -2.42** -1.96** 90-volatility of exchange rates 1.30 0.68 1.49 1.16 0.68 1.39 0.83 0.86 P/E divided by Industry P/E 102.54 0.92 1708.12 4.94 1.02 37.32 0.62 -0.31 L T debt/MV of Equity 1.15 0.69 1.53 0.87 0.32 2.25 1.42 5.6 Taxes/Total Assets 0.06 0.02 0.27 0.04 0.02 0.07 0.69 1.57 90-day volatility of stock returns 3.65 3.14 5.002 4.16 3.39 3.80 -0.98 -2.44** R&D Expense/Sales 0.008 0 0.02 0.003 0 0.009 2.85** 3.00*** Dividend Yield (%) 0.77 0.46 1.06 0.68 0.43 0.91 0.77 0.65 Beta 0.89 0.90 0.54 0.98 0.95 1.07 -1.17 -0.50

38
This table reports summary statistics of all dependent and independent variables as well as the results of tests of differences between means and medians. Our sample consists of 333 FCCBs and 125 ADRs/GDRs with data over 18 years from 2000-2017. Three-day cumulative abnormal return is calculated from the day immediately prior to the day after the announcement. All variables are defined in Appendix. The significance of the differences in means is based on the Student t-test and differences in the medians are based on Mann-Whitney Wilcoxon rank-sum test. ***, **, and * represent significance at the 1%, 5%, and 10% levels, respectively.
Panel B: Correlation Matrix
This panel reports the pairwise correlation between the outcome and explanatory variables used in our study. ***, **, * represents significance at 1%, 5% and 10% level respectively.
VariablesFCCB
Dummy3 Day CAR
(%)LT debt/TA
Market-book
Change in total assets
NI/TA Firm Size Volatility Issue size
Pre-issue run up in
stock price (%)
Log Cash Flow
90-day σ of FX rates
For. Sales/Total
SalesTaxes/TA Beta R&D/Sales
FCCB Dummy 1
3 Day CAR (%) -0.025 1
Long-term debt/TA 0.215*** -0.004 1
Market-book -0.094* 0.002 -0.038 1
Change in total assets -0.163*** 0.014 0.001 -0.027 1
Net income/TA -0.096* 0.015 -0.084* 0.031 -0.011 1
Firm Size -0.073 -0.008 -0.032 0.216*** 0.392*** -0.082* 1
Volatility -0.039 -0.243*** -0.071 0.006 -0.062 0.007 -0.103** 1
Issue size -0.555*** 0.046 -0.188*** 0.167*** -0.059 0.115** -0.080* 0.049 1
Pre-issue run up in stock price (%) -0.061 -0.528*** -0.086* 0.011 -0.017 0.001 -0.025 0.627*** 0.047 1
Log Cash Flow -0.016 -0.019 -0.003 0.048 0.336*** 0.216*** 0.750*** -0.097* -0.129** -0.004 1
90-volatility of exchange rates 0.041 0.021 -0.02 -0.043 0.029 -0.014 -0.004 -0.04 -0.034 -0.033 -0.063 1
Foreign Sales/Total Sales -0.035 0.064 -0.026 0.368*** -0.097* -0.015 -0.006 -0.009 0.132*** -0.058 -0.105* -0.006 1
Taxes/Total Assets 0.034 0.018 0.06 0.454*** -0.025 -0.023 0.038 -0.021 0.055 -0.003 -0.047 -0.038 0.549*** 1
Beta -0.058 0.096* 0.041 0.024 -0.023 -0.066 0.074 0.001 -0.032 -0.061 0.096* -0.108** 0.093* -0.001 1
R&D Expense/Sales 0.141*** 0.04 0.059 0.043 -0.053 -0.005 0.129*** -0.051 -0.078 -0.046 0.031 0.069 0.092* 0.017 -0.036 1

39
Table 2: The Choice between FX Convertibles and Depository receipts
VARIABLES FCCB
Dummy FCCB
Dummy FCCB
Dummy Foreign Sales/ Total Sales -1.936*** -1.873*** -1.140* (0.725) (0.714) (0.612) Currency Appreciation -0.606 -0.572 -0.598 (0.474) (0.475) (0.399) 90-day volatility of exchange rates -0.059 -0.049 0.065 (0.193) (0.189) (0.158) Price/Earnings divided by Industry P/E 0.0002 0.0002 0.0002 (0.0009) (0.0009) (0.00095) Dividend Yield 0.098 0.159 0.027 (0.209) (0.221) (0.185) Log Cash flow 0.089 0.095 (0.125) (0.124) Taxes/Total Assets 11.66* 10.38* 4.936*** (6.552) (6.173) (1.827) (Cash+ Marketable securities)/Total Assets
-1.683 -1.259 0.615
(3.025) (2.913) (2.473) Market/Book of Equity -0.626** -0.611** -0.390* (0.260) (0.262) (0.214) 90-day volatility of stock return -0.021 -0.023 -0.011 (0.024) (0.024) (0.024) Beta 0.641* 0.623* 0.199 (0.384) (0.374) (0.310) R&D Expense/Sales 33.19** 34.53** 25.60* (15.56) (15.91) (14.01) Long Term Debt/Total Assets 1.285** 1.531** (0.595) (0.611) Long Term Debt/MV of Equity 0.103 (0.132) Log Total Assets 0.086 (0.114) Intercept -0.484 1.134 -1.455 (2.068) (2.387) (1.909) Observations Chi-Square Pseudo R2 Log likelihood Percentage Correct Industry Fixed Effects Time Fixed Effects
458 115.56 0.3587
-103.31786 86.01%
Yes Yes
458 111.53 0.3462
-105.32966 84.98%
Yes Yes
458 127.69 0.3091
-142.73648 83.43%
Yes Yes
This table presents the results of logistic regressions in which the dependent variable takes the value of 0 for depository issues and 1 for FCCBs. The explanatory variables include Foreign currency exposure measured by Foreign Sales/ Total Sales (where foreign sales are measured by export revenue), Currency Appreciation (or depreciation) is the percentage change in exchange rates between the beginning and ending dates and dummy is

40
set equal to 1 if the currency has appreciated, Volatility in exchange rates is measured over a period of 90 days prior to the announcement date, price-earnings ratio of company divided by the average price-earnings ratio of industry, Dividend yield, Leverage (i.e. Long Term Debt/Total Assets and Long Term Debt/Market Capitalization of Equity), Cash flow measured as operating income before depreciation minus total taxes adjusted for changes in deferred taxes, minus gross interest expense, and minus dividends paid on common and preferred stock, divided by total assets, future growth opportunities (Market/Book), Financial slack (measured as Cash + Marketable Securities/Total Assets), R & D intensity (R&D Expense/Sales), systematic risk (i.e. Beta), and firm size (i.e. Total Assets). The t-values have been reported in the parenthesis and standard errors are clustered at the firm level. The asterisk superscripts *, **, *** represent significance at the 10%, 5% and 1% levels respectively. The regressions include time and industry fixed effects.
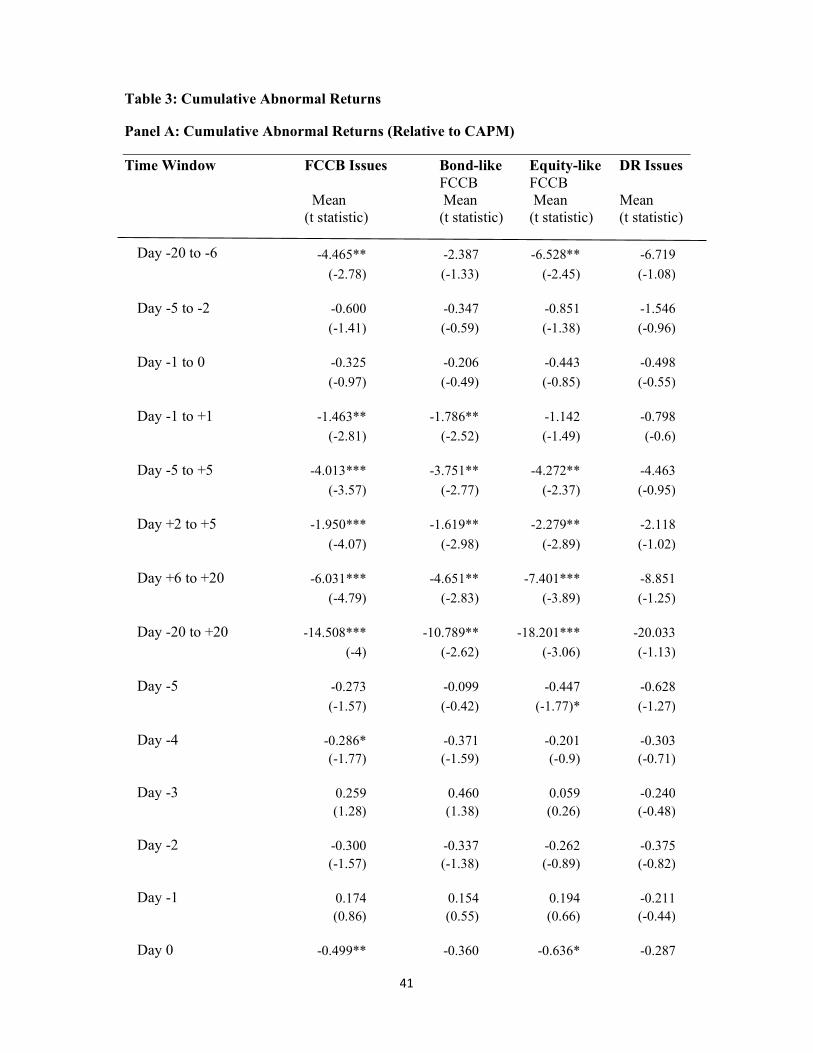
41
Table 3: Cumulative Abnormal Returns
Panel A: Cumulative Abnormal Returns (Relative to CAPM)
Time Window FCCB Issues Bond-like Equity-like DR Issues FCCB FCCB Mean Mean Mean Mean (t statistic) (t statistic) (t statistic) (t statistic)
Day -20 to -6 -4.465** -2.387 -6.528** -6.719 (-2.78) (-1.33) (-2.45) (-1.08) Day -5 to -2 -0.600 -0.347 -0.851 -1.546 (-1.41) (-0.59) (-1.38) (-0.96) Day -1 to 0 -0.325 -0.206 -0.443 -0.498
(-0.97) (-0.49) (-0.85) (-0.55) Day -1 to +1
-1.463**
-1.786**
-1.142
-0.798
(-2.81) (-2.52) (-1.49) (-0.6) Day -5 to +5 -4.013*** -3.751** -4.272** -4.463 (-3.57) (-2.77) (-2.37) (-0.95) Day +2 to +5 -1.950*** -1.619** -2.279** -2.118 (-4.07) (-2.98) (-2.89) (-1.02) Day +6 to +20 -6.031*** -4.651** -7.401*** -8.851 (-4.79) (-2.83) (-3.89) (-1.25) Day -20 to +20 -14.508*** -10.789** -18.201*** -20.033 (-4) (-2.62) (-3.06) (-1.13) Day -5 -0.273 -0.099 -0.447 -0.628 (-1.57) (-0.42) (-1.77)* (-1.27) Day -4 -0.286* -0.371 -0.201 -0.303 (-1.77) (-1.59) (-0.9) (-0.71) Day -3 0.259 0.460 0.059 -0.240 (1.28) (1.38) (0.26) (-0.48) Day -2 -0.300 -0.337 -0.262 -0.375 (-1.57) (-1.38) (-0.89) (-0.82) Day -1 0.174 0.154 0.194 -0.211 (0.86) (0.55) (0.66) (-0.44) Day 0 -0.499** -0.360 -0.636* -0.287
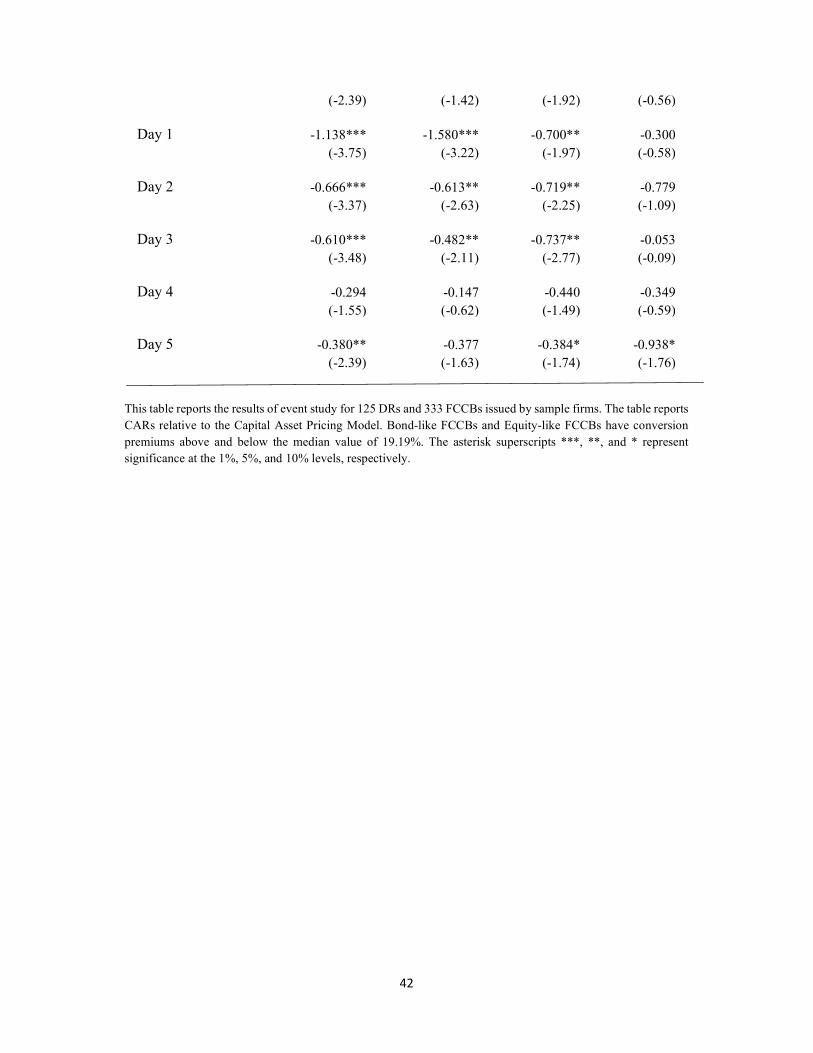
42
(-2.39) (-1.42) (-1.92) (-0.56) Day 1 -1.138*** -1.580*** -0.700** -0.300 (-3.75) (-3.22) (-1.97) (-0.58) Day 2 -0.666*** -0.613** -0.719** -0.779 (-3.37) (-2.63) (-2.25) (-1.09) Day 3 -0.610*** -0.482** -0.737** -0.053 (-3.48) (-2.11) (-2.77) (-0.09) Day 4 -0.294 -0.147 -0.440 -0.349 (-1.55) (-0.62) (-1.49) (-0.59) Day 5
-0.380**
-0.377
-0.384*
-0.938*
(-2.39) (-1.63) (-1.74) (-1.76)
This table reports the results of event study for 125 DRs and 333 FCCBs issued by sample firms. The table reports CARs relative to the Capital Asset Pricing Model. Bond-like FCCBs and Equity-like FCCBs have conversion premiums above and below the median value of 19.19%. The asterisk superscripts ***, **, and * represent significance at the 1%, 5%, and 10% levels, respectively.
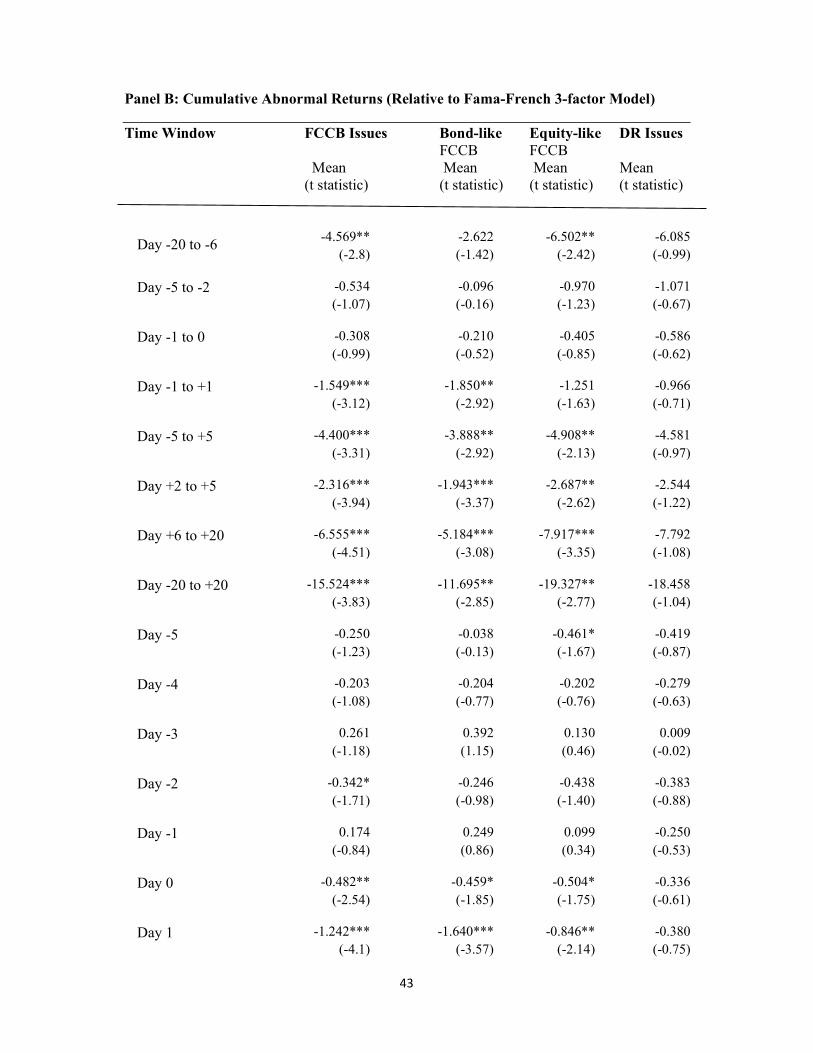
43
Panel B: Cumulative Abnormal Returns (Relative to Fama-French 3-factor Model)
Time Window FCCB Issues Bond-like Equity-like DR Issues FCCB FCCB Mean Mean Mean Mean (t statistic) (t statistic) (t statistic) (t statistic)
Day -20 to -6 -4.569** -2.622 -6.502** -6.085
(-2.8) (-1.42) (-2.42) (-0.99)
Day -5 to -2
-0.534 -0.096 -0.970 -1.071 (-1.07) (-0.16) (-1.23) (-0.67)
Day -1 to 0
-0.308 -0.210 -0.405 -0.586 (-0.99) (-0.52) (-0.85) (-0.62)
Day -1 to +1
-1.549*** -1.850** -1.251 -0.966 (-3.12) (-2.92) (-1.63) (-0.71)
Day -5 to +5
-4.400*** -3.888** -4.908** -4.581 (-3.31) (-2.92) (-2.13) (-0.97)
Day +2 to +5
-2.316*** -1.943*** -2.687** -2.544 (-3.94) (-3.37) (-2.62) (-1.22)
Day +6 to +20
-6.555*** -5.184*** -7.917*** -7.792 (-4.51) (-3.08) (-3.35) (-1.08)
Day -20 to +20
-15.524*** -11.695** -19.327** -18.458 (-3.83) (-2.85) (-2.77) (-1.04)
Day -5
-0.250 -0.038 -0.461* -0.419 (-1.23) (-0.13) (-1.67) (-0.87)
Day -4
-0.203 -0.204 -0.202 -0.279 (-1.08) (-0.77) (-0.76) (-0.63)
Day -3
0.261 0.392 0.130 0.009 (-1.18) (1.15) (0.46) (-0.02)
Day -2
-0.342* -0.246 -0.438 -0.383 (-1.71) (-0.98) (-1.40) (-0.88)
Day -1
0.174 0.249 0.099 -0.250 (-0.84) (0.86) (0.34) (-0.53)
Day 0
-0.482** -0.459* -0.504* -0.336 (-2.54) (-1.85) (-1.75) (-0.61)
Day 1
-1.242*** -1.640*** -0.846** -0.380 (-4.1) (-3.57) (-2.14) (-0.75)

44
Day 2
-0.660*** -0.718*** -0.602** -0.943 (-3.47) (-2.88) (-2.09) (-1.27)
Day 3
-0.639** -0.418 -0.859** -0.157 (-2.89) (-1.47) (-2.54) (-0.27)
Day 4
-0.399* -0.177 -0.618 -0.565 (-1.69) (-0.69) (-1.56) (-1.01)
Day 5
-0.618*** -0.630** -0.607** -0.879* (-3.51) (-2.62) (-2.35) (-1.66)
This table reports the results of event study for 125 ADRs issue and 333 FCCBs issued by sample firms. The table reports CAR relative to the Fama-French 3-factor Model. Bond-like FCCBs and Equity-like FCCBs have conversion premiums above and below the median value of 19.19%. The asterisk superscripts ***, **, and * represent significance at the 1%, 5%, and 10% levels, respectively.

45
Table 4: Logit Analysis of Equity Issuance
Equity Issued Equity Issued VARIABLES (Over 5 Years) (Over 5 Years) FCCB Dummy 1.181*** 3.529*** (0.188) (0.316) Capital Expenditure/Sales 1.354** 0.610 (0.679) (0.937) Market to Book -0.019 0.100 (0.356) (0.460) Firm Size 0.443*** 0.438*** (0.075) (0.096) Cash and Marketable Securities/Total Assets 28.97** -14.34 (13.34) (16.85) Leverage 3.547*** 1.164** (0.388) (0.540) Return on Assets 2.157 4.885*** (1.508) (1.844) Research and Development expense/Sales 83.09* 60.35 (43.82) (55.46) Volatility 0.006*** 0.005** (0.002) (0.002) Intercept -6.305*** -4.091*** (0.610) (1.244) Observations Chi-Square Pseudo R2
Log likelihood Percentage Correct Industry Fixed Effects Time Fixed Effects
1,514 459.52 0.2807
-588.84984 82.10%
No No
1,514 768.99 0.4731
-428.29344 86.74%
Yes Yes
In this table we model equity issuance. The dependent variable is Equity dummy which takes the value 1 if a firm has issued equity over five years, otherwise 0. The variable of interest is FCCB dummy, which takes the value 1 if the company issues FCCB and 0 if a peer company does not issue FCCB during the same period. All other variables are defined in Appendix. The asterisk superscripts***, ** and * represent significance at 1%, 5% and 10% levels, respectively. The t-values have been reported in the parenthesis and standard errors are clustered at the firm level. All the variables are winsorized at the 1% level.

46
Table 5: Impact of FCCB Issuance on Investments
VARIABLES I (t+1) I (t+2) FCCB Dummy 0.657*** 0.450*** (0.161) (0.106) Macro Q -0.025*** -0.026*** (0.003) (0.002) Cash Flow 0.008*** 0.006*** (0.001) (0.0009) Debt/TA 0.083 0.178 (0.162) (0.128) ROA 2.945*** 3.705*** (0.569) (0.429) Firm Size 0.0598* 0.085*** (0.032) (0.024) Market to Book 0.213** 0.361*** (0.096) (0.096) Intercept 3.828*** -1.895* (0.499) (1.093) Observations 4,655 4,655 R-squared Firm Fixed Effects Time fixed Effects
0.094 Yes Yes
0.107 Yes Yes
In this table we examine how the issuance of FCCBs affects investments. The dependent variable in each OLS regression is investment (I), which is the ratio of annual capital expenditures to capital at the start of the period measured over one and two years. The explanatory variables include a FCCB dummy set equal to 1 if the firm has issued FCCBs and zero otherwise, macro q is the sum of total book debt and market equity less total inventory divided by the start-of-period capital stock measured as net PPE, cash flow, total debt to total assets ratio, ROA (EBIT/TA), firm size (natural log of total assets) and market-to-book ratio. All independent variables except for cash flow are lagged by one period. All the variables are winsorized at the 1% level. The t-values have been reported in the parenthesis and standard errors are clustered at the firm level. The asterisk superscripts***, ** and * represent significance at 1%, 5% and 10% levels, respectively.

47
Table 6: Probability of Credit Rating Transition and Default
Rating Decline
Rating Decline
Decline below investment
Grade
Decline below investment
Grade
Default
Over 3 years
Default
Over 5 years VARIABLES Over 3 Years Over 5 Years Over 3
Years Over 5 Years
FCCB Dummy 1.176*** 1.718*** 0.507** 1.331*** 0.667 1.486*** (0.231) (0.203) (0.253) (0.209) (0.406) (0.285) EBIT/Sales -0.021 -0.069 -0.096 -0.245 -0.048 -0.087 (0.018) (0.049) (0.119) (0.213) (0.130) (0.105) EBIT/Total Assets -7.576*** 1.264*** -8.921*** 1.661*** -11.58*** -12.41*** (1.911) (0.390) (2.116) (0.446) (3.341) (2.787) Working capital/Total Assets -0.712 -0.588 -0.902* -0.176 -1.337* -0.0728 (0.467) (0.395) (0.489) (0.428) (0.791) (0.633) Retained Earnings/Total Assets 3.268 -4.642*** 6.932*** -6.131*** 10.83*** 7.876*** (2.242) (1.482) (2.286) (1.705) (3.141) (2.992) Total Debt/Total Assets -0.565 -1.206*** -0.287 -0.585 0.393 -0.518 (0.350) (0.401) (0.375) (0.413) (0.510) (0.574) Beta (no.) 0.266 0.458*** 0.315* 0.514*** 1.075*** 0.130 (0.181) (0.167) (0.190) (0.171) (0.322) (0.239) Family Shareholding (%) -0.006 -0.001 -0.029*** -0.027*** -0.018** -0.010* (0.005) (0.004) (0.005) (0.004) (0.008) (0.006) Institutional Investor Shareholding (%) 0.006 0.01* -0.04*** -0.033*** -0.014 -0.002 (0.006) (0.005) (0.007) (0.006) (0.011) (0.008) Proportion of independent directors (%) -0.001 0.001 -0.0009 0.002 0.0007 0.002 (0.002) (0.001) (0.002) (0.002) (0.002) (0.001) Crisis Dummy -0.628 2.351 -0.966* 1.909 -0.715 -0.177 (0.570) (1.447) (0.581) (1.529) (0.831) (1.458) Intercept -0.594 -3.736** 2.988*** -0.969 -2.218 0.0500 (0.979) (1.557) (0.862) (1.613) (1.438) (1.731)

48
Observations Chi- square Pseudo R square Log Likelihood Percentage Correct Industry Fixed Effects Time Fixed Effects
1,396 197.56 0.1346
-635.36315 78.44%
Yes Yes
1,417 185.81 0.1056
-786.53025 71.28%
Yes Yes
1,427 250.56 0.1701
-611.21087 79.61%
Yes Yes
1,438 241.87 0.1434
-722.46657 76.22%
Yes Yes
1,342 116.85 0.1982
-236.39887 94.41%
Yes Yes
1,428 155.33 0.1738
-369.17375 90.41%
Yes Yes
In this table, we model rating transitions. The dependent variable is a rating dummy. For the first two regressions the rating dummy takes the value 1 if it declines over three years and five years respectively after the issuance and 0 otherwise. For the next two regressions, the rating dummy takes the value 1 if it declines below investment grade over three years and five years respectively after the issuance and 0 otherwise. In the last two regressions, the rating dummy takes the value 1 if the company has defaulted within three years and five years, respectively, of issuance and zero otherwise. The independent variable is FCCB Dummy which takes the value 1 if the company issues FCCB and 0 if the peer firm does not issue FCCBs during the same period. Family shareholdings include the percentage of the shares held by the founding family. Other variables include systematic risk (Beta), liquidity (Working capital/Total Assets), profitability (Retained Earnings/Total Assets), return on total assets (EBIT/Total Assets), Operating margin (EBIT/sales), and leverage (Total debt/Total Assets). Institutional investor shareholding includes the percentage of shares held by institutional investors. The number of independent directors on the board. The Crisis dummy takes the value 1 for the financial crisis years (also called subprime mortgage crisis) of 2007-08 and zero for other years. The t-values have been reported in the parenthesis and standard errors are clustered at the firm level. The asterisk superscripts ***, ** and * represent significance at 1%, 5% and 10% levels, respectively.

49
Table 7: Rating Transitions: Propensity Score Matching Panel A: Rating Transition over three years
N Mean % Difference% t-statistics (Rating Decline) FCCB issuers 1406 37.21 20.93 3.68*** (Rating Decline) Non FCCB issuers 16.28 (Rating Decline below investment grade) FCCB issuers 1406 21.08 6.86 1.39 (Rating Decline below investment grade) Non FCCB issuers 14.22
Panel B: Rating Transition over five years
N Mean % Difference% t-statistics (Rating Decline) FCCB issuers 1421 54.67 30.67 5.23**** (Rating Decline) Non FCCB issuers 24 (Rating Decline below investment grade) FCCB issuers 1421 39.13 22.93 4.46*** (Rating Decline below investment grade) Non FCCB issuers 16.21
In this table we compare the rating transitions of FCCB issuers and matched peer firms using a nearest neighbor propensity matching procedure. The propensity score is estimated within a year-size category during 2000-2017 using controls in a logit regression analysis. We require that the difference between the propensity score of the firm issuing FCCB and its matching peer does not exceed 0.2% in absolute value. We compare the rating transitions of the two groups. The asterisk superscript *** indicates statistical significance at the 1% level.
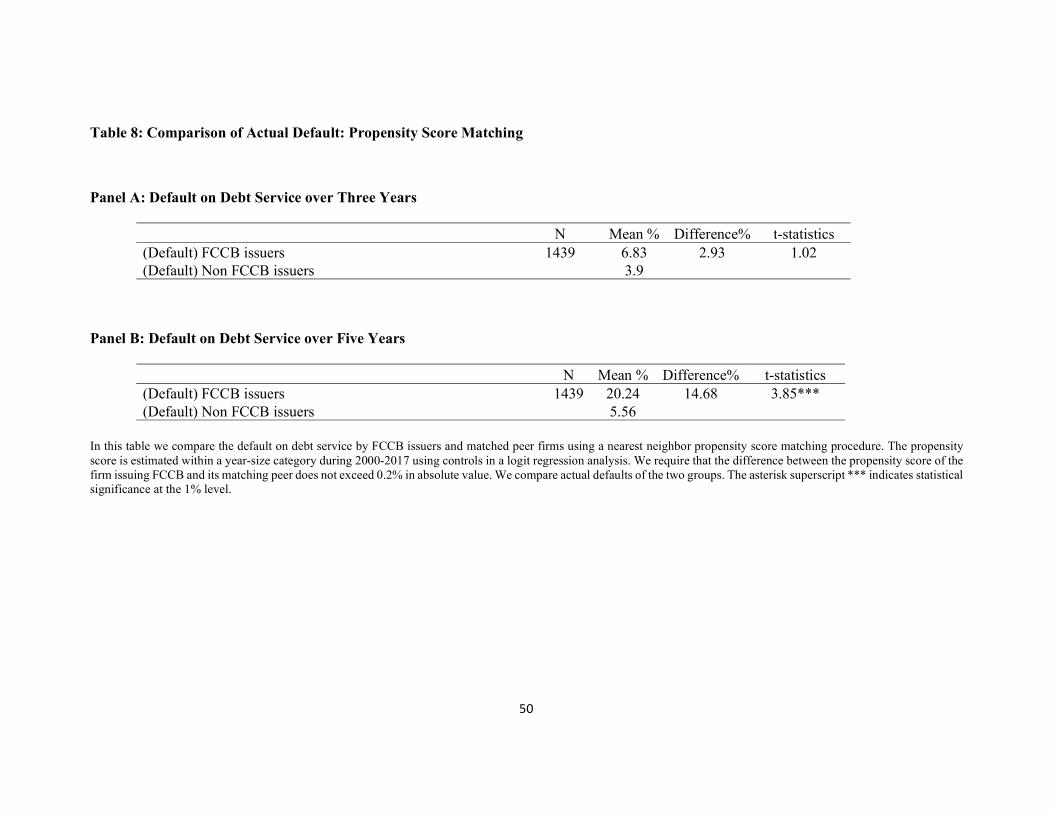
50
Table 8: Comparison of Actual Default: Propensity Score Matching
Panel A: Default on Debt Service over Three Years
N Mean % Difference% t-statistics (Default) FCCB issuers 1439 6.83 2.93 1.02 (Default) Non FCCB issuers 3.9
Panel B: Default on Debt Service over Five Years
N Mean % Difference% t-statistics (Default) FCCB issuers 1439 20.24 14.68 3.85*** (Default) Non FCCB issuers 5.56
In this table we compare the default on debt service by FCCB issuers and matched peer firms using a nearest neighbor propensity score matching procedure. The propensity score is estimated within a year-size category during 2000-2017 using controls in a logit regression analysis. We require that the difference between the propensity score of the firm issuing FCCB and its matching peer does not exceed 0.2% in absolute value. We compare actual defaults of the two groups. The asterisk superscript *** indicates statistical significance at the 1% level.

51
Table 9: Post Issuance Operating and Stock Market Performance of FCCB issuers
Panel A: Operating Performance
This table compares the comparison of operating of firms that issued FCCBs and matching firms that did not. Operating performance is estimated as the median of Profit Margin (%) and return on assets (%). Profit margin is defined as Net Income divided by Sales. ROA is defined as EBIT/Total Assets. The last row reports the significance of the difference between the medians by using the Wilcoxon signed-rank test.
Profit Margin %
Fiscal Year Relative to Offering -2 -1 0 1 2 3 4 0 to 4 change
FCCB Issuers
14.72% 15.31% 15.31% 15.25% 15.69% 14.88% 13.76% -3.05%
Non FCCB Issuers
9.62% 9.52% 9.6% 9.73% 9.71% 10.27% 9.4% 0.02%
Z Statistic 5.114*** 7.108*** 6.991*** 5.200*** 4.561*** 3.421*** 2.329** -2.524**
ROA %
Fiscal Year Relative to Offering
-2 -1 0 1 2 3 4
0 to 4 change
FCCB Issuers 10.37% 10.69% 9.54% 9.13% 8.82% 8.12% 7.14% -2.48%
Non FCCB Issuers
9.35% 9.7% 9.21% 9.16% 9.47% 9.62% 8.92% -0.06
Z Statistic 3.371*** 4.684*** -2.133** -2.294** -2.764*** -3.601*** -4.287*** -3.449***

52
Panel B: Stock Market Performance
This panel reports the mean differences between cumulative abnormal returns (CAR) and Buy-and-Hold Abnormal returns (BHAR) of issuers of FCCBs and non-issuers over 2 and 3 years after issuance. The t statistics are in parentheses. The asterisk superscripts ***, **, and * represent significance at the 1%, 5%, and 10% levels, respectively.
FCCB Issuers
Matching Firms
Difference (t stat)
2 Year CAR (%) -24.36 -11.86 -12.50*
(-1.82) 2 Year BHAR (%) -30.74 -33.88 3.14 (-0.39) 3 Year CAR (%) -19.46 5.9 -25.36**
(-2.85) 3 Year BHAR (%) -20.42 -5.55 -14.87
(-0.86)