Which countries bid for the Olympic Games? Economic ...
26
-
Upload
khangminh22 -
Category
Documents
-
view
1 -
download
0
Transcript of Which countries bid for the Olympic Games? Economic ...


Hamburg Contemporary Economic Discussions University of Hamburg School of Business, Economics and Social Sciences Chair for Economic Policy Von-Melle-Park 5 D-20146 Hamburg | Germany Tel +49 40 42838 - 4622 Fax +49 40 42838 - 6251 http://www.uni-hamburg.de/economicpolicy/maennig.htm Editor: Wolfgang Maennig
Wolfgang Maennig University of Hamburg Faculty of Business, Economics and Social Sciences Chair for Economic Policy Von-Melle-Park 5 20146 Hamburg | Germany Tel +49 40 42838 - 4622 Fax +49 40 42838 - 6251 [email protected]
Christopher Vierhaus University of Hamburg Faculty of Business, Economics and Social Sciences Chair for Economic Policy Von-Melle-Park 5 20146 Hamburg | Germany
ISSN 1865 - 2441 (Print) ISSN 1865 - 7133 (Online) ISBN 978-3-942820-24-0 (Print) ISBN 978-3-942820-25-7 (Online)

Wolfgang Maennig & Christopher Vierhaus
Which countries bid for the Olympic Games? Economic, political, and social factors and chances of winning
Abstract: This contribution analyzes 132 factors on their potential to discriminate countries bidding for hosting
the Olympic Games from non-bidding countries. Our binary, clustered model using generalized estimating
equations (GEE) shows that countries recording long-term economic growth and pursuing a liberalization and
globalization policy will consider an Olympic bid. In addition, countries with an urban population above 10
million, with stable election results and an improvement in health standards as well as more attractive tourism
destinations are more likely to bid for the Olympic Games. Finally, the bid decision is shaped by experience in
hosting major sports events, a country and regional rotation, persistence and climatic conditions.
Keywords: Olympic Summer Games, mega events, bidding, host city election, IOC, decision-making
JEL Classification: R58, L83, Z28
Version: February 2016
1 Introduction
The socio-economic impacts and legacies of hosting the Olympic Games have been
widely analyzed with the vast majority of economists not able to confirm significant
positive effects (Feddersen and Maennig 2013a, 2013b; Hotchkiss et al. 2003; Jasmand
and Maennig 2008; Porter and Fletcher 2008). Recently though, Rose and Spiegel (RS
2011) and Brückner and Pappa (BP 2013) find significant positive economic effects such
as growing exports and GDP per capita growth of the Olympic Games, and even of
(unsuccessful) Olympic bids.
RS and BP regress, among other variables, Olympic dummy variables on economic
variables like GDP and export, which implies a test “Olympic Games competiveness.”
Nevertheless, they – possibly due to the background of the aforementioned literature,
which almost unanimously does not find any significant Olympic impacts – interpret
their results as a signal effect for a liberalization process in the bidding countries, which
stimulated the local economy or may do so in the future.

HCED 55 – Which countries bid for the Olympic Games? 2
Their interpretation implies a reverse hypothesis of “competiveness (bidding for)
Olympic Games,” which should be based on tests that regress export performance and
other determinants on (the probability of) bidding for the Olympic Games. We are not
aware of any such direct tests on the determinants which lead countries to bid for the
Olympic Games and contribute to closing this gap.
The economic, political, and social environment of countries (and cities) may well
influence their decision to bid for the Games, although the direction of causality is a
matter of debate. Hiller (2000) argues that more developed countries with less social
issues might be more likely to make a bid, which is then not seen as a ‘misplaced priority.’
By contrast, Jakobsen et al. (2013) find that smaller or less-developed countries generate
more noticeable effects from hosting. In addition, potential bids might be concerned
with their prospects of success. Consequently, a substantial overlap with the key success
factors for winning the host city election could be expected. Maennig and Vierhaus
(2014) identify the city size, five-year GDP growth and the liberalization of political
rights, experience in hosting world championships, years since the country last hosted
the Olympics and the FIFA World Cup, number of stadia in the bid country, size of the
urban population, and public support as determinants of the International Olympic
Committee’s (IOC) decision.
This paper contributes to the identification of economic, political, social, touristic,
infrastructural or Olympics and sports factors that discriminate bidding from non-
bidding countries. We find that countries indeed consider their economic, political, and
social conditions as well as their chances of winning when deciding upon an Olympic
bid.
This knowledge may be used by the IOC to attract a larger, high-quality pool of
applicants (Humphreys and van Egteren 2012).1 The Olympic Agenda 2020, which
includes an “invitation phase” for potential bidding countries, shows that the IOC is
concerned with too few Olympic bids. In addition, potential bids may identify potential
1 The example of Los Angeles shows the opposite case of just one city interested in hosting the 1984
Olympics, which was followed by a dramatic shift of power and revenues from the IOC to the host (Baade and Matheson (2002); Hill (1996)).

HCED 55 – Which countries bid for the Olympic Games? 3
competitors in order to realistically estimate their own chances of winning the host city
election.
The remainder of this article is structured as follows: Section two reviews the
determinants that potentially shape a country’s bid decision and describes the empirical
strategy. Section three presents the model and discusses the relevant political,
economic, social, and sports factors for a country’s decision to place an Olympic bid.
Section four concludes.
2 Data and empirical strategy
This empirical study employs the dataset introduced in Maennig and Vierhaus (2014),
which focuses on the bidding success for eight Olympic Summer Games from 1992 to
2020. Their panel consists of all countries with national Olympic committees (NOCs) that
were eligible to bid, making it a complete panel study with 1,477 cases and no missing
subjects.2 The dichotomous response variable bid separates countries with a bid city
from countries without. During the period considered, 39 cities from 27 countries
applied for hosting. Including double and triple attempts, the IOC received 59
applications: on average, 7.4 per Olympic Summer Games.
We organize the potential determinants of Olympic bids into five complementary
groups, namely economic, socio-political, tourism, infrastructure, and Olympics and
sports. We adopt the variables introduced in detail in Maennig and Vierhaus (2014)
excluding the bid-specific factors.3 One dichotomous variable, checking if the country
has applied for the foregoing Winter Olympics, is added. All data relates to 10 years prior
2 During the period considered, substantial changes occurred as the IOC recognized many new NOCs,
while others, like the USSR split. For the 1992 Olympics, 151 NOCs were eligible for bidding, which increased to 204 NOCs for the 2020 Olympic Games. The included NOCs are tabulated in the appendix.
3 Bid-specific factors include, for example, the average distance from the Olympic village to sports venues, the capacity of the Olympic villages or the public support of an Olympic bid. Due to a lack of data availability for all countries, we exclude them from this analysis and focus on the national decision to bid for the Olympics.
HCED 55 – Which countries bid for the Olympic Games? 4
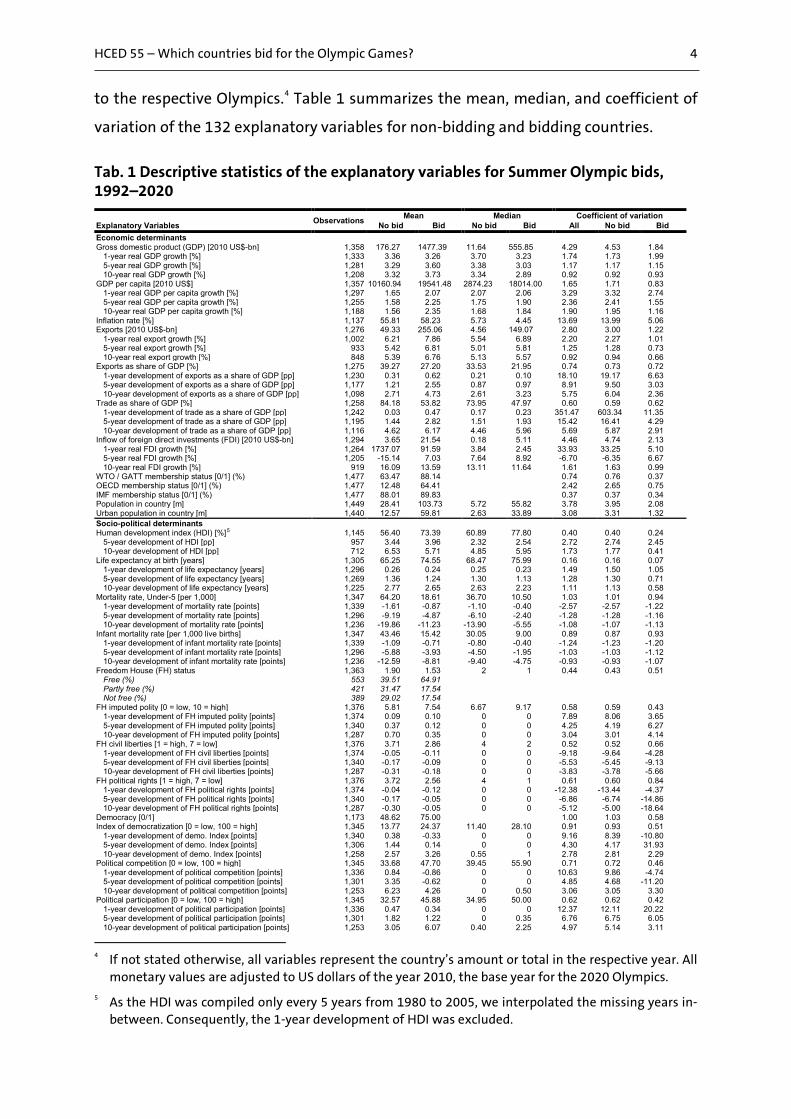
to the respective Olympics.4 Table 1 summarizes the mean, median, and coefficient of
variation of the 132 explanatory variables for non-bidding and bidding countries.
Tab. 1 Descriptive statistics of the explanatory variables for Summer Olympic bids, 1992–2020
Observations Mean Median Coefficient of variation Explanatory Variables No bid Bid No bid Bid All No bid Bid Economic determinants Gross domestic product (GDP) [2010 US$-bn] 1,358 176.27 1477.39 11.64 555.85 4.29 4.53 1.84 1-year real GDP growth [%] 1,333 3.36 3.26 3.70 3.23 1.74 1.73 1.99 5-year real GDP growth [%] 1,281 3.29 3.60 3.38 3.03 1.17 1.17 1.15 10-year real GDP growth [%] 1,208 3.32 3.73 3.34 2.89 0.92 0.92 0.93 GDP per capita [2010 US$] 1,357 10160.94 19541.48 2874.23 18014.00 1.65 1.71 0.83 1-year real GDP per capita growth [%] 1,297 1.65 2.07 2.07 2.06 3.29 3.32 2.74 5-year real GDP per capita growth [%] 1,255 1.58 2.25 1.75 1.90 2.36 2.41 1.55 10-year real GDP per capita growth [%] 1,188 1.56 2.35 1.68 1.84 1.90 1.95 1.16 Inflation rate [%] 1,137 55.81 58.23 5.73 4.45 13.69 13.99 5.06 Exports [2010 US$-bn] 1,276 49.33 255.06 4.56 149.07 2.80 3.00 1.22 1-year real export growth [%] 1,002 6.21 7.86 5.54 6.89 2.20 2.27 1.01 5-year real export growth [%] 933 5.42 6.81 5.01 5.81 1.25 1.28 0.73 10-year real export growth [%] 848 5.39 6.76 5.13 5.57 0.92 0.94 0.66 Exports as share of GDP [%] 1,275 39.27 27.20 33.53 21.95 0.74 0.73 0.72 1-year development of exports as a share of GDP [pp] 1,230 0.31 0.62 0.21 0.10 18.10 19.17 6.63 5-year development of exports as a share of GDP [pp] 1,177 1.21 2.55 0.87 0.97 8.91 9.50 3.03 10-year development of exports as a share of GDP [pp] 1,098 2.71 4.73 2.61 3.23 5.75 6.04 2.36 Trade as share of GDP [%] 1,258 84.18 53.82 73.95 47.97 0.60 0.59 0.62 1-year development of trade as a share of GDP [pp] 1,242 0.03 0.47 0.17 0.23 351.47 603.34 11.35 5-year development of trade as a share of GDP [pp] 1,195 1.44 2.82 1.51 1.93 15.42 16.41 4.29 10-year development of trade as a share of GDP [pp] 1,116 4.62 6.17 4.46 5.96 5.69 5.87 2.91 Inflow of foreign direct investments (FDI) [2010 US$-bn] 1,294 3.65 21.54 0.18 5.11 4.46 4.74 2.13 1-year real FDI growth [%] 1,264 1737.07 91.59 3.84 2.45 33.93 33.25 5.10 5-year real FDI growth [%] 1,205 -15.14 7.03 7.64 8.92 -6.70 -6.35 6.67 10-year real FDI growth [%] 919 16.09 13.59 13.11 11.64 1.61 1.63 0.99 WTO / GATT membership status [0/1] (%) 1,477 63.47 88.14 0.74 0.76 0.37 OECD membership status [0/1] (%) 1,477 12.48 64.41 2.42 2.65 0.75 IMF membership status [0/1] (%) 1,477 88.01 89.83 0.37 0.37 0.34 Population in country [m] 1,449 28.41 103.73 5.72 55.82 3.78 3.95 2.08 Urban population in country [m] 1,440 12.57 59.81 2.63 33.89 3.08 3.31 1.32 Socio-political determinants Human development index (HDI) [%]5 1,145 56.40 73.39 60.89 77.80 0.40 0.40 0.24 5-year development of HDI [pp] 957 3.44 3.96 2.32 2.54 2.72 2.74 2.45 10-year development of HDI [pp] 712 6.53 5.71 4.85 5.95 1.73 1.77 0.41 Life expectancy at birth [years] 1,305 65.25 74.55 68.47 75.99 0.16 0.16 0.07 1-year development of life expectancy [years] 1,296 0.26 0.24 0.25 0.23 1.49 1.50 1.05 5-year development of life expectancy [years] 1,269 1.36 1.24 1.30 1.13 1.28 1.30 0.71 10-year development of life expectancy [years] 1,225 2.77 2.65 2.63 2.23 1.11 1.13 0.58 Mortality rate, Under-5 [per 1,000] 1,347 64.20 18.61 36.70 10.50 1.03 1.01 0.94 1-year development of mortality rate [points] 1,339 -1.61 -0.87 -1.10 -0.40 -2.57 -2.57 -1.22 5-year development of mortality rate [points] 1,296 -9.19 -4.87 -6.10 -2.40 -1.28 -1.28 -1.16 10-year development of mortality rate [points] 1,236 -19.86 -11.23 -13.90 -5.55 -1.08 -1.07 -1.13 Infant mortality rate [per 1,000 live births] 1,347 43.46 15.42 30.05 9.00 0.89 0.87 0.93 1-year development of infant mortality rate [points] 1,339 -1.09 -0.71 -0.80 -0.40 -1.24 -1.23 -1.20 5-year development of infant mortality rate [points] 1,296 -5.88 -3.93 -4.50 -1.95 -1.03 -1.03 -1.12 10-year development of infant mortality rate [points] 1,236 -12.59 -8.81 -9.40 -4.75 -0.93 -0.93 -1.07 Freedom House (FH) status 1,363 1.90 1.53 2 1 0.44 0.43 0.51 Free (%) 553 39.51 64.91 Partly free (%) 421 31.47 17.54 Not free (%) 389 29.02 17.54 FH imputed polity [0 = low, 10 = high] 1,376 5.81 7.54 6.67 9.17 0.58 0.59 0.43 1-year development of FH imputed polity [points] 1,374 0.09 0.10 0 0 7.89 8.06 3.65 5-year development of FH imputed polity [points] 1,340 0.37 0.12 0 0 4.25 4.19 6.27 10-year development of FH imputed polity [points] 1,287 0.70 0.35 0 0 3.04 3.01 4.14 FH civil liberties [1 = high, 7 = low] 1,376 3.71 2.86 4 2 0.52 0.52 0.66 1-year development of FH civil liberties [points] 1,374 -0.05 -0.11 0 0 -9.18 -9.64 -4.28 5-year development of FH civil liberties [points] 1,340 -0.17 -0.09 0 0 -5.53 -5.45 -9.13 10-year development of FH civil liberties [points] 1,287 -0.31 -0.18 0 0 -3.83 -3.78 -5.66 FH political rights [1 = high, 7 = low] 1,376 3.72 2.56 4 1 0.61 0.60 0.84 1-year development of FH political rights [points] 1,374 -0.04 -0.12 0 0 -12.38 -13.44 -4.37 5-year development of FH political rights [points] 1,340 -0.17 -0.05 0 0 -6.86 -6.74 -14.86 10-year development of FH political rights [points] 1,287 -0.30 -0.05 0 0 -5.12 -5.00 -18.64 Democracy [0/1] 1,173 48.62 75.00 1.00 1.03 0.58 Index of democratization [0 = low, 100 = high] 1,345 13.77 24.37 11.40 28.10 0.91 0.93 0.51 1-year development of demo. Index [points] 1,340 0.38 -0.33 0 0 9.16 8.39 -10.80 5-year development of demo. Index [points] 1,306 1.44 0.14 0 0 4.30 4.17 31.93 10-year development of demo. Index [points] 1,258 2.57 3.26 0.55 1 2.78 2.81 2.29 Political competition [0 = low, 100 = high] 1,345 33.68 47.70 39.45 55.90 0.71 0.72 0.46 1-year development of political competition [points] 1,336 0.84 -0.86 0 0 10.63 9.86 -4.74 5-year development of political competition [points] 1,301 3.35 -0.62 0 0 4.85 4.68 -11.20 10-year development of political competition [points] 1,253 6.23 4.26 0 0.50 3.06 3.05 3.30 Political participation [0 = low, 100 = high] 1,345 32.57 45.88 34.95 50.00 0.62 0.62 0.42 1-year development of political participation [points] 1,336 0.47 0.34 0 0 12.37 12.11 20.22 5-year development of political participation [points] 1,301 1.82 1.22 0 0.35 6.76 6.75 6.05 10-year development of political participation [points] 1,253 3.05 6.07 0.40 2.25 4.97 5.14 3.11
4 If not stated otherwise, all variables represent the country’s amount or total in the respective year. All
monetary values are adjusted to US dollars of the year 2010, the base year for the 2020 Olympics.
5 As the HDI was compiled only every 5 years from 1980 to 2005, we interpolated the missing years in-between. Consequently, the 1-year development of HDI was excluded.

HCED 55 – Which countries bid for the Olympic Games? 5
Political terror scale (Scale 1–5) 1,276 2.50 2.20 2 2 0.47 0.47 0.57 Secure rule of law, no political imprisonment (%) 308 23.40 40.74 Limited imprisonment for political activity (%) 369 29.21 22.22 Extensive political imprisonment (%) 343 27.33 16.67 Civil and political rights violations common (%) 181 14.08 16.67 Terror expanded to the whole population (%) 75 5.97 3.70 Index of globalization [0 = low, 100 = high] 1,293 48.44 67.24 45.83 68.11 0.36 0.36 0.20 1-year development of globalization Index [points] 1,288 0.55 0.76 0.32 0.38 2.90 2.90 2.75 5-year development of globalization Index [points] 1,255 3.10 4.83 2.34 4.10 1.18 1.20 0.84 10-year development of globalization Index [points] 1,207 6.17 9.43 5.30 9.04 0.85 0.86 0.55 Economic globalization [0 = low, 100 = high] 1,100 52.86 62.09 52.44 61.40 0.36 0.36 0.22 1-year development of economic global. [points] 1,091 0.66 0.36 0.37 0.27 3.86 3.80 5.77 5-year development of economic global. [points] 1,064 3.35 4.09 2.73 4.15 1.56 1.58 1.24 10-year development of economic global. [points] 1,028 6.55 8.84 5.58 8.72 1.10 1.13 0.68 Political globalization [0 = low, 100 = high] 1,354 54.89 83.68 52.78 88.37 0.41 0.41 0.17 1-year development of political global. [points] 1,344 0.56 0.65 0.26 0.22 6.33 6.33 6.28 5-year development of political global. [points] 1,311 3.94 4.35 2.66 2.56 2.00 2.01 1.78 10-year development of political global. [points] 1,263 8.10 9.07 5.80 4.39 1.21 1.22 1.07 Social globalization [0 = low, 100 = high] 1,309 41.51 61.31 38.79 64.62 0.52 0.52 0.30 1-year development of social global. [points] 1,299 0.42 1.36 0.14 0.37 4.15 4.26 2.64 5-year development of social global. [points] 1,266 2.31 6.01 1.06 3.68 1.82 1.88 1.02 10-year development of social global. [points] 1,218 4.58 10.31 2.60 9.42 1.36 1.41 0.68 Corruption perceptions index (0 = corrupt, 10 = clean)6 669 4.50 5.88 3.60 6.10 0.52 0.53 0.38 CO2 emissions per capita [metric tons] 1,375 4.57 9.22 1.82 7.03 1.41 1.43 0.99 1-year growth of CO2 emissions per capita [%] 1,338 3.35 -0.54 0.35 -0.54 26.46 25.72 -10.42 5-year growth of CO2 emissions per capita [%] 1,305 0.75 0.38 0.72 0.30 9.50 9.48 7.05 10-year growth of CO2 emissions per capita [%] 1,272 0.97 0.80 0.84 0.61 5.34 5.39 3.10 CO2 emissions [kg per PPP$ of GDP] 1,216 0.49 0.65 0.35 0.52 0.97 0.98 0.74 Ratification of the Kyoto Protocol [0/1] (%) 1,477 31.52 28.81 1.48 1.47 1.59 Tourism determinants Accommodation rooms in country [1,000] 1,309 67.19 583.17 8.63 293.83 3.76 4.02 1.50 International tourism arrivals (ITA) [m] 1,389 2.73 17.50 4.61 8.77 2.48 2.50 1.11 1-year development of ITA (%) 1,209 10.59 10.17 5.95 4.11 3.18 3.18 3.23 5-year development of ITA (%) 1,164 6.05 7.16 5.14 5.69 1.83 1.87 1.01 10-year development of ITA (%) 834 5.86 6.92 5.09 6.11 1.31 1.34 0.77 International tourism receipts (ITR) [2010 US$-m] 1,328 2561.69 16980.84 334.14 6909.40 2.90 2.95 1.35 1-year development of ITR (%) 1,121 13.80 5.37 5.24 5.16 5.41 5.38 3.42 5-year development of ITR (%) 1,071 6.73 6.37 5.39 4.98 2.15 2.18 1.52 10-year development of ITR (%) 904 5.95 7.26 5.39 5.48 1.47 1.51 0.79 International tourism receipts as share of exports [%] 1,134 11.73 7.89 5.69 6.04 1.55 1.56 0.91 Infrastructure determinants Distance of road network in country [1,000 km] 1,470 115.11 811.57 20.80 362.66 3.88 4.11 1.70 Airports/airfields in country 1,445 199.72 1292.12 46 176 4.74 4.71 2.57 Plane departures in country [1,000] 1,160 96.96 739.09 14.80 300.05 5.14 5.41 2.42 Airline passengers carried [m] 1,159 7.51 56.85 0.79 21.52 4.91 5.15 2.31 Communications index [per 100 persons] 1,372 0.13 0.20 0.05 0.12 1.39 1.42 0.94 Stadia in country with capacity > 40,000 1,477 1.58 12.32 0 5 4.74 4.88 2.22 Olympics and sports determinants Application for the foregoing Winter Olympics [0/1] (%) 1,477 2.82 13.56 5.46 5.87 2.55 Did the region host the last Summer Olympics? [0/1] (%) 1,477 20.52 15.25 1.98 1.97 2.38 Years since country last hosted the Summer Olympics 1,477 3.14 22.10 0 12 3.86 4.41 1.24 Years since country last hosted the Olympics 1,477 3.49 19.42 0 12 3.62 4.03 1.27 Years since region last hosted the Summer Olympics 1,477 7.48 11.66 8 12 0.97 0.98 0.71 Years since region last hosted the Olympics 1,477 4.62 7.46 4 6 1.28 1.28 1.10 Years since country last hosted the FIFA World Cup 1,477 2.07 11.80 0 0 4.20 4.73 1.43 Failed bids in last 4 host city selections 1,477 0.06 0.81 0 1 4.46 5.37 1.22 Votes in last host city election for the Summer Olympics 1,477 0.28 3.14 0 0 8.07 10.18 2.29 World Championships hosted in country in last 10 years 1,477 1.06 8.29 0 7 2.55 2.79 0.73 IOC Sponsorship fees from country [2010 US$-m] 1,477 2.21 22.50 0 0 10.08 11.65 3.71 IOC Sponsorship fees from region [2010 US$-m] 1,477 126.16 145.26 37.48 136.11 1.34 1.35 1.16 IOC Broadcasting fees from region [2010 US$-m] 1,477 165.79 389.05 38.68 268.92 1.55 1.56 1.06 Involved in dispute with IOC? [0/1] (%) 1,477 0.07 1.69 27.17 37.66 7.68 IOC president 1,477 0.35 5.08 13.56 16.82 4.36 IOC executive board members 1,477 0.06 0.24 0 0 3.87 4.14 1.81 IOC members 1,477 0.53 1.76 0 2 1.46 1.52 0.57 Years since the NOC was recognized by the IOC 1,477 48.88 81.63 44 92 0.55 0.55 0.38 Medals won in last Summer Olympics 1,477 3.39 24.32 0 14 3.33 3.53 1.38 Average temperature in August in bid city [°F] 1,477 73.80 71.32 76.10 73.80 0.13 0.13 0.14 Application for the foregoing Winter Olympics [0/1] (%) 1,477 2.82 13.56 5.46 5.87 2.55 N = Observations without missing data; Label in brackets “[ ]” represents the scale of the variable. Dichotomous variables: ‘Mean’ columns report the average of the characteristic for cities in the category of the characteristic.
The dataset contains 199,395 values (dependent variable, cluster variable, time variable
and 132 explanatory variables multiplied by 1,477 cases), of which 24,986 are missing
(12.5%). Assuming that the data are missing at random (MAR) (Little and Rubin (2002)),
we use multiple imputation (MI) (Rubin 1976, 1987)7 and draw on a dataset that includes
6 The Corruption Perceptions Index was only measured from 1995 onwards. We assume continuity in
corruption perception by using the 1995 values as a proxy for the prior Olympic bids.
7 The MI approach creates multiply-imputed datasets based on the distribution of the observed data and random components (White et al. (2011)). After each imputation is analyzed independently, the results are combined to obtain overall estimates and standard errors (Schafer and Graham (2002)). Compared to the complete cases model, the MI approach yields superior inferences based on unbiased and efficient estimates (Schafer (1999)).

HCED 55 – Which countries bid for the Olympic Games? 6
all (bidding and non-bidding) countries with national Olympic committees to create 88
imputations. While the final model includes non-linear terms with missing values, we
follow the procedure proposed by White et al. (2011), which starts by performing the
multiple imputation without any additional terms (Schafer 1999). On this basis, a
preliminary analysis model determines the non-linear terms. These are then integrated
in the final multiple imputation process.8
According to our objective of identifying factors that discriminate the dichotomous
dependent variable Olympic bid and accounting for data correlated on countries, the
average effect of a covariate is of major interest, while the intra-cluster variability is only
of minor importance (Hardin and Hilbe 2013; Hosmer et al. 2013). Consequently, we
employ the binary population average model (PA) using generalized estimating
equations (GEE) for deriving estimates that are averaged over clusters and are therefore
interpretable on the whole sample (Liang and Zeger 1986). The analysis model is
obtained by minimizing the quasi-likelihood information criterion (QIC), which is
averaged over all imputations (Hardin and Hilbe 2013; Shen and Chen 2013). The GEE
model is set up with a first-order autoregressive correlation to reflect repeated
measurements with an interval of four years. As recommended by Hosmer et al. (2013),
we utilize the sandwich (robust) estimator. The model employs a complementary log-
log link to reflect the asymmetrically distributed response bid with only 4% of all cases
bidding for the Olympics (Hosmer et al. 2013).
The continuous covariates are examined through multivariable fractional polynomials
(FP) analysis, which requires the transformation of nine variables (Royston and Sauerbrei
2008). The variables trade as share of GDP and years since a country last hosted the
Olympic Games employ a two-term FP with powers (-2 -2). The covariate CO2 emissions
per capita is transformed with power (.5). Two-term FP with powers (0 0)9 and powers (-
2 1) are used for the urban population in the country and the international tourism
arrivals respectively. The covariate 10-year development of political participation is best
met with power (3), while the index of democratization employs a two-term FP with
8 For the inclusion of non-linear terms the ‘improved passive approach,’ used as the ‘just another variable
approach,’ is not suitable due to the MAR assumption and a complex initial imputation model (White et al. 2011).
9 Power (0) refers to ln(x) instead of x0 = 1.

HCED 55 – Which countries bid for the Olympic Games? 7
powers (3 3). Finally, the covariates world championships hosted in the last 10 years and
the number of failed bids in the last four bid city selections are transformed using a one-
term FP with power (-2). All other covariates are treated as linear. No meaningful and
significant interaction could be found.
As a final step in the model building process, we assess the sensitivity of the correlation
structure and the linking function in table 2. The complementary log-log function with
the first-order autoregressive correlation yields the best QIC value.
Tab. 2 Sensitivity analysis of the correlation structure and linking function
QIC values Linking function
Correlation structure logit complementary log-log probit
Independent 183.27 174.56 185.63 Exchangeable 183.02 174.71 185.61 Autoregressive 1st order 182.59 173.99 184.79
- without non-linear terms 302.49 309.07 305.34 - empty model 501.30 501.30 501.27
3 Results
Based on eight bid cycles for the Olympics from 1992 until 2020, a country’s bid decision
is best described by the model in table 3. Of the 21 determinants, seven explain bids
from an economic perspective, six from a political perspective, and three from a social
perspective. Five of these determinants supposedly influence the chances of winning the
Olympic host city election.

HCED 55 – Which countries bid for the Olympic Games? 8
Tab.3 Factors for Olympic Games bids: in-sample and out-of-sample models
Determinants Analysis model (1992–2020)
Out-of-sample prediction (1992–2016 2020)
Economic factors 10-year real GDP growth [%] 0.4094*** 0.3883*** Trade as share of GDP [%] FP1 / FP2 0.9282 / 0.4522*** 0.8973 / 0.4365*** Inflow of foreign direct investments (FDI) [2010 US$-bn] -0.0076** -0.0054 10-year development of economic globalization [points] 0.0893*** 0.1031*** CO2 emissions per capita [metric tons] FP1 3.8719*** 4.1221*** International tourism arrivals (ITA) [m] FP1 / FP2 -0.0104 / 0.5402*** -0.0118 / 0.5396*** Urban population [m] FP1 / FP2 -1.5413 / -0.3676*** -1.6755 / -0.4076***
Political factors Democracy [0/1] -2.1493** -2.1169** 10-year development of FH imputed polity [points] -0.5796*** -0.6342*** 1-year development of FH political rights [points] -1.8568*** -1.9321*** 1-year development of political competition [points] -0.0869* -0.0783* 10-year development of political participation [points] FP1 3.2876*** 3.3094*** Index of democratization [0 = low, 100 = high] FP1 / FP2 0.5945 / -0.3995*** 0.5961 / -0.4054***
Social factors 10-year development of infant mortality rate [points] -0.0881*** -0.0836** 1-year development of social globalization [points] 0.1714* 0.2310** 5-year development of social globalization [points] 0.0869* 0.0806*
Factors attributed to the chances of winning World Championships hosted in country in last 10 years FP1 -0.0806*** -0.0802*** Years since country last hosted the Olympics FP1 / FP2 -0.0743 / -0.0189*** -0.0775 / -0.0197*** Years since region last hosted the Summer Olympics 0.1069*** 0.1088*** Failed bids in last 4 host city selections FP1 -1.1522** -0.8352 Average temperature in August in bid city [°F] 0.0816*** 0.0879***
Constant -18.9051*** -19.6407***
Number of Olympic Games 8 7 Applications/NOCs 59 / 1475 54 / 1269 Model F-Test 3.51*** 2.97*** QIC 173.99 174.49 Area under ROC 0.9897 0.9890
*** p < 0.01; ** p < 0.05; * p < 0.10; FP1 / FP2 = first and second term of fractional polynomial transformation. Trade as share of GDP [%] is transformed (x/100)-2 and (x/100)-2 * ln(x/100); CO2 emissions per capita [metric tons] is transformed ((x+2.9802e-06)/10).5; Urban population [m] is transformed ln(x/100) and ln(x/100)2; International tourism arrivals [m] is transformed (x/10)-2 and (x/10); 10-Year development of political participation [points] is transformed ((x+60.6999969)/100)3; Index of democratization [0 = low, 100 = high] is transformed ((x+0.099998474)/10)3 and ((x+0.099998474)/10)3 * ln((x+0.099998474)/10); World championships hosted in country in last 10 years is transformed ((x+1)/10)-2; Years since country last hosted the Olympics is transformed ((x+2/100)-2 and ((x+2/100)-2 * ln((x+2/100); Failed bids in last 4 host city selections is transformed (x+1)-2; the Freedom House scale of political rights ranges from 1 (most free) to 7 (least free).
Interpretation of economic factors
The country’s long-term economic growth is positively correlated with bidding for the
Olympic Games (top-left graph of figure 1). Stronger economies, particularly those with
10-year growth rates above 5% p.a., are ceteris paribus more likely to bid.10 In their
regressions Olympic bids etc. economic growth, Brückner and Pappa (2013) identify
significantly higher GDP growth rates in bid countries nine to seven years prior to the
event. They interpret their results as a signal effect for a liberalization process in the
bidding countries, which stimulated the local economy. Our findings support the idea of
10 All data relates to 10 years prior to the Olympic Games. As an example, the 10-year GDP growth rate of
the bids for the 2020 Olympics refers to the period 2001–2010.

HCED 55 – Which countries bid for the Olympic Games? 9
a causality running from economic prosperity to Olympic bids, but on the basis of an
appropriate test of causality direction.
In a similar manner, Rose and Spiegel (2011) find that organizing the Games or even only
bidding for them induces significant increases in exports. They also argue about a signal
effect. Besides the finding that their results suffer from the fallacy of a selection bias
(Maennig and Richter (2012), they draw their conclusion from a regression which tests
the reverse causality. Our analysis supports the idea of a causality “exports (possibly as
a proxy for openness or competitiveness) Olympic bids” on the basis of a direct test
but on a more differentiated basis: As visualized in the middle-left graph of figure 2, the
probability of countries bidding for the Summer Olympics reaches its peak with an
overall trade as share of GDP (trade openness) of between 17% and 30%. In addition,
lower levels of inflow of foreign direct investments, indicating less financial liberalization,
increase the chances of an Olympic bid (bottom-left graph of figure 1). Finally, a positive
10-year development in economic globalization might indicate an Olympic bid. This
variable condenses the development of actual trade flows and trade restrictions (Dreher
2006; Dreher et al. 2008).11 In sum, countries with lower current levels of trade and
financial openness, but with a positive long-term trend, are more likely to bid for the
Olympic Games.
The transformed variable CO2 emissions per capita (top-right graph, figure 1) has a
“positive” effect with diminishing returns on the probability to bid for the Olympics. The
variable may be interpreted as a proxy for economic development (Raupach et al. 2007).
Hosting the Olympics has become more accessible in recent years, once a country has
entered the ‘developed world’ characterized by higher CO2 emissions. This hypothesis is
supported by the fact that nine countries, which had never previously bid, have applied
for the Summer Olympics since 1992 (Yugoslavia, China, Turkey, South Africa, Puerto
Rico, Thailand, Malaysia, Azerbaijan, Qatar). (Low) CO2 emissions per capita may also be
interpreted as an indicator of environmental awareness; a bid for the Olympics in some
advanced nations was rejected, also for environmental reasons.
11 Actual flows include trade (percent of GDP), foreign direct investment (percent of GDP), portfolio
investment (percent of GDP), and income payments to foreign nationals (percent of GDP). Restrictions account for hidden import barriers, mean tariff rate, taxes on international trade (percent of current revenue), and capital account restrictions.

HCED 55 – Which countries bid for the Olympic Games? 10
Fig. 1 Marginal effects of economic determinants with 95% confidence intervals (CI)
Many Olympic bids are reasoned by the goal of tourism promotion (Fourie and Santana-
Gallego 2011; Song 2010). The chance of a country bidding for the Olympics increases
with the country’s level of tourism. The middle-right graph of figure 1 illustrates that
countries with international tourism arrivals below 2.5 million visitors per year are
unlikely to bid for the Olympic Games, while the probability above this threshold
increases approximately linear by one percentage point per seven million additional
tourist arrivals. We explain this effect with the importance of tourism for a country. If
the country largely depends on tourism and competes with other multiple tourism
destinations, the Olympic Games might be seen as an effective way to improve the
country’s tourism profile.

HCED 55 – Which countries bid for the Olympic Games? 11
The size of the urban population has a mixed effect on bidding for the Olympic Games as
illustrated in the bottom-right graph of figure 1. Chances increase dramatically above a
size of 10 million inhabitants in urban areas, but decrease continuously above this
threshold. However, the average marginal effect is not particularly strong. Ceteris
paribus there exists a difference in probability of four percentage points between
countries with an urban population of 10 million vs. 175 million. Therefore, we view this
indicator as an adjustment for large Asian or African countries such as China, India,
Indonesia, Pakistan, Nigeria, and Bangladesh, which have only bid twice in the past 30
years.
Interpretation of political factors
A country’s political situation, especially in terms of regime status, policy changes, and
election results, has a strong influence on the decision to bid for the Olympic Games. On
the one hand, the binary variable democracy status shows that countries with a non-
democratic regime are more likely to bid for the Olympic Games. In addition, we see that
long-term policy changes restricting political and civil rights (variable 10-year
development of Freedom House imputed policy index) increase the chances of an Olympic
bid. Long-term declines in this variable were recorded, for example, in China (bids for
2000, 2008) and Turkey (bids for 2004, 2008, 2012).
On the other hand, short-term improvements in the political rights situation are powerful
indicators of an Olympic bid (variable 1-year development of FH political rights,12 top-left
graph of figure 2). The bids of Spain for 1992 (transition to democracy in the late 1970s
and early 1980s), Germany for 2000 (reunification in 1990 with an improvement of
political rights in East Germany), and South Africa for 2004 (end of the Apartheid regime
in 1994) come to mind.
The last national election results also play an important role in a country’s decision to
bid for the Olympics. If the leading party in a country extends its majority share by
gaining more votes – i.e., if the political competition (top-right graph of figure 2) is
12 Consider that the Freedom House scale of political rights ranges from 1 (most free) to 7 (least free), which
is why the x-axis in the top-left graph of figure 2 is inverted.

HCED 55 – Which countries bid for the Olympic Games? 12
reduced compared to the last election13 – it is more likely that the country will apply to
host the Olympic Games. In addition, a long-term increase in the political participation
(bottom-left graph of figure 2), i.e., more people voting in the previous election than 10
years ago, increases the chances of an Olympic bid. Finally, the index of democratization
(bottom-right graph in figure 2), which is the political competition multiplied by the
political participation, represents the democratic stability of a country. The graph shows
the highest likeability around the value of 30 representing an election with a stable
majority and solid turnout. In sum, if the country’s leading party extended their share of
votes in the previous national election, if more people voted in the last election than 10
years ago, and if the government has a stable majority of votes, it is likely that the
government will strongly consider an Olympic bid.
Fig. 2 Marginal effects of political determinants with 95% CI
Interpretation of social factors
Although some Olympic bids, such as Toronto 2000 and Rome 2020, faced the allegation
of ‘misplaced priorities’ (Hiller 2000), the majority of countries seem to have improved
13 Political competition is measured as a percentage of votes received by the non-winning parties
(subtracting from 100 the percentage of votes won by the largest part), i.e., lower values indicate an extended majority.

HCED 55 – Which countries bid for the Olympic Games? 13
the social conditions before bidding for the Olympic Games. Our model includes the
positive development of health standards, measured by the long-term improvement of
the infant mortality rate, which increases the probability to bid for the Olympics. In
addition, Olympic bids are more likely to come from countries with stronger short- and
mid-term progress in social globalization, which is defined as an increase in personal
contacts (via communication and tourism), in information flows (e.g., internet users),
and in cultural proximity (trade in books, number of Ikea warehouses per capita).
Interpretation of factors affecting the chances of winning
Of the 22 variables in our model, eight determinants are associated with the chances of
winning the Olympic host city election. Three determinants discussed from an economic
or political perspective overlap with the chances of winning (Maennig and Vierhaus
2014): A long-term GDP growth as well as a short-term improvement of political rights
are important for the IOC members when voting for the Olympic host city. While the
urban population has a mixed effect on the bid decision (see above), it is a factor that is
positively correlated with votes in the IOC election.
Five additional determinants are supposed to influence the bid’s odds of obtaining the
hosting rights. Before countries bid for the Olympics, they usually obtain significant
experience in hosting world championships. The average Olympic bid has hosted over
eight world championships in the years prior to an Olympic bid. Successful hosting of
such events signals to the IOC that the country could be capable of staging the Olympics
(Maennig and Vierhaus 2014). In addition, we assume hosting world championships
helps to establish valuable relationships with the respective international federations,
which might support the Olympic bid.
It is a common belief among Olympic bids and the media that persistence in bidding for
the Olympics pays off. Despite anecdotal evidence (Sydney 2000 after failed Australian
bids in 1992 and 1996; Athens 2004 after failed bid in 1996; Beijing 2008 after failed bid
in 2000; London 2012 after failed UK bids in 1992, 1996, and 2000; Rio 2016 after failed
bid in 2012; Tokyo 2020 after failed bids in 2008 and 2016), there exists no statistical
proof that failed bids lead to higher chances in the next election (Maennig and Vierhaus
2014). Nevertheless, the number of failed Olympic bids increases the bidding probability

HCED 55 – Which countries bid for the Olympic Games? 14
(top-right graph of figure 3). Experience and knowledge from previous bids as well as
encouragement from the IOC might be decisive factors to bid again.
A rotation among countries and regions for Olympic hosts is also often discussed. It has
been shown that the IOC regards the years since the country last hosted the Summer or
Winter Olympics (Maennig and Vierhaus 2014). The bottom-left graph of figure 3 shows
that countries respect this procedure. All countries that have never hosted the Olympics
are coded as 0 years (since last hosting), which results in a similar probability as if the
country had not hosted the Olympic Games for 30 years. The probability of a host bidding
again immediately after hosting is close to zero, but noticeably increases until 30 years
after hosting and then gradually approaches the maximum. In addition, the indicator
years since the region last hosted the Summer Olympics is included in this model for the
country decision (bottom-right graph of figure 3). Countries are unlikely to bid for the
Olympics if their continent hosts the foregoing Summer Olympics. The fact that the
Olympics have never been hosted on the same continent twice in a row appears to be
due more to a lack of supply than a lack of demand.
Model fit and predictive performance
The model fit is assessed from three angles. First, we note that all main effects are
significant at the level of 0.10. Second, the classification accuracy can be regarded as
outstanding with an area under the receiver operating curve (ROC) of 0.9897 (Hosmer et
al. 2013). In other words, if we randomly select two cases from our dataset, the chance
that a bid country has a higher probability than a non-bidding country is almost 99%.
Third, the model is validated with an out-of-sample model (column 2 of table 3). This
reduced analysis model is based on 1,269 cases and 52 bids, ignoring the bids for the
Olympic Games 2020. All but two coefficients remain significant at the traditional levels.
Between the two models, the estimated coefficients vary, on average, by 8.1% indicating
a stable analysis model. The out-of-sample model assigns three bids the highest
probabilities for the 2020 Olympics (Qatar 100.00%, Azerbaijan 86.38%, Japan 83.25%),
while Spain (29.03%) and Turkey (16.21%) are in the top 10 of all 204 potential Olympic
bid countries. To sum up, the full model is well-suited to discriminating bidding from
non-bidding countries and to explaining the conditions in which countries bid for the
Olympic Games.
HCED 55 – Which countries bid for the Olympic Games? 15
4 Summary and conclusions
The effects of bidding for and hosting the Olympics have been widely discussed. This
article analyzes the reverse causality, that is, which effects and factors shape the
country’s decision to bid for the Olympic Games. Based on economic, socio-political,
tourism, infrastructure, and Olympics and sports explanations, we derive and test 132
determinants that potentially discriminate bidding from non-bidding countries. The
study examines 1,477 country cases resulting in 59 bids for the 1992 to 2020 Olympics.
Our findings support the idea that countries consider their economic, political, and social
state as well as their chances of winning the host city election. From an economic
perspective, Olympic bid countries can be characterized by long-term economic growth
and a liberalization policy identified by lower current levels of trade and financial
openness, but increasing long-term economic globalization. In addition, more developed
countries with higher levels of international tourism and an urban population above 10
million inhabitants are more likely to bid. From a political perspective, it is either
countries in process toward democracy and globalization or countries with a long-term
history of autocracy that bid for the Olympics. From a social perspective, countries that
have prioritized the development of health standards and social globalization
contemplate Olympic bids.
Countries also – at least implicitly - assess their chances of winning the Olympic host city
election. Factors such as long-term GDP growth, short-term improvement of political
rights, experience in hosting world championships, and rotation among countries
influence both the country’s decision to bid and the IOC’s decision regarding the host
city. In addition, certain factors which are commonly seen as relevant, but are not
statistically proven, play a role. Persistence demonstrated by the number of failed
Olympic bids, a regional rotation, and the temperature are evaluated by countries before
bidding.
One objective of the IOC is to encourage more countries to bid for the Olympic Games.
Our model reveals three pillars for increasing the number of Olympic bids. First, most
bidding countries likely seek a global stage for presenting their liberalization,
globalization, and development. We recommend that the IOC provides this marketing

HCED 55 – Which countries bid for the Olympic Games? 16
stage and constantly promotes Olympic bid countries and cities. Second, the IOC
members could vary their host city selection criteria to convey the perception that they
can win to more potential bids. For example, the IOC could refute the myth that an
Olympic host cannot come from the same region as the previous host. Similarly, it could
specifically invite and select smaller countries and cities to increase the group of
potential hosts.
Literature
BAADE, R. A. / MATHESON V. A. (2002), Bidding for the Olympics: Fool's Gold? Transatlantic sport: The comparative economics of North American and European sports 54, 127.
BRÜCKNER, M. / PAPPA, E. (2015), News Shocks in the Data: Olympic Games and their Macroeconomic Effects. Journal of Money, Credit and Banking 47, 1339-1367.
DREHER, A. (2006), Does Globalization Affect Growth? Evidence from a new Index of Globalization. Applied Economics 38, 1091–1110.
DREHER, A. / GASTON, N. / MARTENS, P. (2008), Measuring Globalisation. Gauging Its Consequences. New York: Springer-Verlag.
FEDDERSEN, A. / MAENNIG, W. (2013a), Employment Effects of the Olympic Games in Atlanta 1996 Reconsidered. International Journal of Sport Finance 8, 95–111.
FEDDERSEN, A. / MAENNIG, W. (2013b), Mega-Events and Sectoral Employment: The Case of the 1996 Olympic Games. Contemporary Economic Policy 31, 580–603.
FOURIE, J. / SANTANA-GALLEGO, M. (2011), The impact of mega-sport events on tourist arrivals. Tourism Management 32, 1364–1370.
HARDIN, J. W. / HILBE, J. M. (2013), Generalized Estimating Equations. 2nd ed. Boca Raton: CRC Press.
HILL, C. R. (1996), Olympic Politics. Athens to Atlanta, 1896-1996. 2nd ed. Manchester: Manchester University Press.
HILLER, H. H. (2000), Mega-Events, Urban Boosterism and Growth Strategies: An Analysis of the Objectives and Legitimations of the Cape Town 2004 Olympic Bid. International Journal of Urban and Regional Research 24, 439–458.
HOSMER, D. W. / LEMESHOW, S. / STURDIVANT, R. X. (2013), Applied Logistic Regression. 3rd ed. John Wiley & Sons.
HOTCHKISS, J. L. / MOORE, R. E. / ZOBAY, S. M. (2003), Impact of the 1996 Summer Olympic Games on Employment and Wages in Georgia. Southern Economic Journal 69, 691.
HUMPHREYS, B.R. / VAN EGTEREN, H. (2012), Mega Sporting Event Bidding, Mechanism Design and Rent Extraction. In Maennig W., Zimbalist A. (Eds.) International Handbook on the Economics of Mega Sporting Events, 1st edn. Edward Elgar Publishing, Cheltenham, UK, pp 17–36
HCED 55 – Which countries bid for the Olympic Games? 17
JAKOBSEN, J. / SOLBERG, H. A. / HALVORSEN, T. / JAKOBSEN, T. G. (2013), Fool's gold: major sport events and foreign direct investment. International Journal of Sport Policy and Politics 5, 363–380.
JASMAND, S. / MAENNIG, W. (2008), Regional Income and Employment Effects of the 1972 Munich Summer Olympic Games. Regional Studies 42, 991–1002.
LIANG, K.-L. / ZEGER, S. L. (1986), Longitudinal data analysis using generalized linear models. Biometrika 73, 13–22.
LITTLE, R. J. A. / RUBIN, D. B. (2002), Statistical analysis with missing data. 2. ed. Hoboken: Wiley (Wiley series in probability and statistics). Available online at http://www.loc.gov/catdir/description/wiley036/2002027006.html.
MAENNIG, W. / RICHTER, Felix (2012), Exports and Olympic Games: Is There a Signal Effect? Journal of Sports Economics 13, 635–641.
MAENNIG, W. / VIERHAUS, C. (2014), Who Wins Olympic Bids? In Hamburg Contemporary Economic Discussions No 50.
PORTER, P. K. / FLETCHER, D. (2008), The Economic Impact of the Olympic Games: Ex Ante Predictions and Ex Poste Reality. Journal of Sport Management 22, 470–486.
RAUPACH, M. R. / MARLAND, G. / CIAIS, P. / LE QUÉRÉ, C. / CANADELL, J. G. / KLEPPER, G. / FIELD, C. B. (2007), Global and regional drivers of accelerating CO2 emissions. PNAS (Proceedings of the National Academy of Sciences of the United States of America 104, 10288–10293.
ROSE, A. K. / SPIEGEL, M. M. (2011), The Olympic Effect. The Economic Journal 121, 652–677.
ROYSTON, P. / SAUERBREI, W. (2008), Multivariable model-building. A pragmatic approach to regression analysis based on fractional polynomials for modelling continuous variables. Chichester, England, Hoboken, NJ: John Wiley (Wiley series in probability and statistics).
RUBIN, D. B. (1976), Inference and Missing Data. Biometrika 63, 581–592.
RUBIN, D. B. (1987), Multiple Imputation for Nonresponse in Surveys. New York: John Wiley & Sons.
SCHAFER, J. L. (1999), Multiple imputation: a primer. Statistical Methods in Medical Research 8, 3–15.
SCHAFER, J. L. / Graham, J. W. (2002), Missing data: Our view of the state of the art. Psychological Methods 7, 147–177.
SHEN, C.-W. / CHEN, Y.-H. (2013), Model selection of generalized estimating equations with multiply imputed longitudinal data. Biometrical Journal 55, 899–911.
SONG, W. (2010), Impacts of Olympics on Exports and Tourism. Journal of Economic Development 35, 93.
WHITE, I. R. / ROYSTON, P. / WOOD, A. M. (2011), Multiple imputation using chained equations: Issues and guidance for practice. Statistics in Medicine 30, 377–399.

HCED 55 – Which countries bid for the Olympic Games? 18
Appendix 1: NOCs recognized by the IOC and eligible to host OG NOCs
Afghanistan Dominica2004- Lesotho Saint Vincent and the Grenadines2000- Albania Dominican Republic Liberia
Algeria DR Congo Libya Samoa1996- American Samoa2000- Ecuador Liechtenstein San Marino Andorra Egypt Lithuania2004- São Tomé and Príncipe2004- Angola El Salvador Luxembourg Saudi Arabia Antigua and Barbuda Equatorial Guinea1996- Macedonia2004- Senegal Argentina Eritrea2012- Madagascar Serbia2016- Armenia2004- Estonia2004- Malawi Serbia & Montenegro2008-2012 Aruba1996- Ethiopia Malaysia Seychelles Australia Federated States of
Micronesia2008- Maldives1996- Sierra Leone
Austria Mali Singapore Azerbaijan2004- Fiji Malta Slovakia2004- Bahamas Finland Marshall Islands2016- Slovenia2004- Bahrain France Mauritania Solomon Islands1996- Bangladesh Gabon Mauritius Somalia Barbados Gambia Mexico South Africa2004- Belarus2004- Georgia2004- Moldova2004- South Korea Belgium Germany2000- Monaco Soviet Union-2000 Belize East Germany-1996 Mongolia Spain Benin West Germany-1996 Montenegro2020- Sri Lanka Bermuda Ghana Morocco Sudan Bhutan1996- Great Britain Mozambique Suriname Bolivia Greece Myanmar Swaziland Bosnia and Herzegovina2004- Grenada1996- Namibia2004- Sweden Botswana Guam1996- Nauru2004- Switzerland Brazil Guatemala Nepal Syria British Virgin Islands Guinea Netherlands Tajikistan2004- Brunei1996- Guinea-Bissau2008- Netherlands Antilles-2016 Tanzania Bulgaria Guyana New Zealand Thailand Burkina Faso Haiti Nicaragua Timor-Leste2016- Burundi2004- Honduras Niger Togo Cambodia2008- Hong Kong Nigeria Tonga1996- Cameroon Hungary North Korea Trinidad and Tobago Canada Iceland Norway Tunisia Cape Verde2004- India Oman Turkey Cayman Islands Indonesia Pakistan Turkmenistan2004- Central African Republic Iran Palau2012- Tuvalu2020- Chad Iraq Palestine2008- Uganda Chile Ireland Panama Ukraine2004- China Israel Papua New Guinea United Arab Emirates Chinese Taipei Italy Paraguay United States Colombia Ivory Coast Peru Uruguay Comoros2004- Jamaica Philippines Uzbekistan2004- Congo Japan Poland Vanuatu2000- Cook Islands1996- Jordan Portugal Venezuela Costa Rica Kazakhstan2004- Puerto Rico Vietnam Croatia2004- Kenya Qatar Virgin Islands Cuba Kiribati2016- Romania Yemen2000- Cyprus Kuwait Russia2004- North Yemen-1996 Czech Republic2004- Kyrgyzstan2004- Rwanda1996- South Yemen-1996 Czechoslovakia-2000 Laos Saint Kitts and Nevis2004- Yugoslavia Denmark Latvia2004- Saint Lucia2004- Zambia Djibouti1996- Lebanon Zimbabwe Notes: XXXX- Eligible for bidding since the XXXX Olympics; -YYYY Eligible for bidding until the YYYY Olympics

Hamburg Contemporary Economic Discussions (Download: http://www.uni-hamburg.de/economicpolicy/hced.html)
55 MAENNIG, W. / VIERHAUS, C.: Which countries bid for the Olympic Games? Economic, political, and social factors and chances of winning, 2016.
54 AHLFELDT, G. M. / MAENNIG, W. / STEENBECK, M.: Après nous le déluge? Direct democracy and intergenerational conflicts in aging societies, 2016.
53 LANGER, V. C. E.: Good news about news shocks, 2015.
52 LANGER, V. C. E. / MAENNIG, W. / RICHTER, F. J.: News Shocks in the Data: Olympic Games and their Macroeconomic Effects – Reply, 2015.
51 MAENNIG, W.: Ensuring Good Governance and Preventing Corruption in the Planning of Major Sporting Events – Open Issues, 2015.
50 MAENNIG, W. / VIERHAUS, C.: Who Wins Olympic Bids? 2015 (2nd version).
49 AHLFELDT, G. M. / MAENNIG, W. / RICHTER, F.: Urban Renewal after the Berlin Wall, 2013.
48 BRANDT, S. / MAENNIG, W. / RICHTER, F.: Do Places of Worship Affect Housing Prices? Evidence from Germany, 2013.
47 ARAGÃO, T. / MAENNIG, W.: Mega Sporting Events, Real Estate, and Urban Social Economics – The Case of Brazil 2014/2016, 2013.
46 MAENNIG, W. / STEENBECK, M. / WILHELM, M.: Rhythms and Cycles in Happiness, 2013.
45 RICHTER, F. / STEENBECK, M. / WILHELM, M.: The Fukushima Accident and Policy Implications: Notes on Public Perception in Germany, 2014 (2nd version).
44 MAENNIG, W.: London 2012 – das Ende des Mythos vom erfolgreichen Sportsoldaten, 2012.
43 MAENNIG, W. / WELLBROCK, C.: London 2012 – Medal Projection – Medaillenvorausberechnung, 2012.
42 MAENNIG, W. / RICHTER, F.: Exports and Olympic Games: Is there a Signal Effect? 2012.
41 MAENNIG, W. / WILHELM, M.: Becoming (Un)employed and Life Satisfaction: Asymmetric Effects and Potential Omitted Variable Bias in Empirical Happiness Studies, 2011.
40 MAENNIG, W.: Monument Protection and Zoning in Germany: Regulations and Public Support from an International Perspective, 2011.
Hamburg Contemporary Economic Discussions (Download: http://www.uni-hamburg.de/economicpolicy/hced.html)
39 BRANDT, S. / MAENNIG, W.: Perceived Externalities of Cell Phone Base Stations – The Case of Property Prices in Hamburg, Germany, 2011.
38 MAENNIG, W. / STOBERNACK, M.: Do Men Slow Down Faster than Women? 2010.
37 DU PLESSIS, S. A. / MAENNIG, W.: The 2010 World Cup High-frequency Data Economics: Effects on International Awareness and (Self-defeating) Tourism, 2010.
36 BISCHOFF, O.: Explaining Regional Variation in Equilibrium Real Estate Prices and Income, 2010.
35 FEDDERSEN, A. / MAENNIG, W.: Mega-Events and Sectoral Employment: The Case of the 1996 Olympic Games, 2010.
34 FISCHER, J.A.V. / SOUSA-POZA, A.: The Impact of Institutions on Firms Rejuvenation Policies: Early Retirement with Severance Pay versus Simple Lay-Off. A Cross-European Analysis, 2010.
33 FEDDERSEN, A. / MAENNIG, W.: Sectoral Labor Market Effects of the 2006 FIFA World Cup, 2010.
32 AHLFELDT, G.: Blessing or Curse? Appreciation, Amenities, and Resistance around the Berlin “Mediaspree”, 2010.
31 FALCH, T. / FISCHER, J.A.V.: Public Sector Decentralization and School Performance: International Evidence, 2010.
30 AHLFELDT, G. / MAENNIG, W. / ÖLSCHLÄGER, M.: Lifestyles and Preferences for (Public) Goods: Professional Football in Munich, 2009.
29 FEDDERSEN, A. / JACOBSEN, S. / MAENNIG, W.: Sports Heroes and Mass Sports Participation – The (Double) Paradox of the “German Tennis Boom”, 2009.
28 AHLFELDT, G. / MAENNIG, W. / OSTERHEIDER, T.: Regional and Sectoral Effects of a Common Monetary Policy: Evidence from Euro Referenda in Denmark and Sweden, 2009.
27 BJØRNSKOV, C. / DREHER, A. / FISCHER, J.A.V. / SCHNELLENBACH, J.: On the Relation Between Income Inequality and Happiness: Do Fairness Perceptions Matter? 2009.

Hamburg Contemporary Economic Discussions (Download: http://www.uni-hamburg.de/economicpolicy/hced.html)
26 AHLFELDT, G. / MAENNIG, W.: Impact of Non-Smoking Ordinances on Hospitality Revenues: The Case of Germany, 2009.
25 FEDDERSEN, A. / MAENNIG, W.: Wage and Employment Effects of the Olympic Games in Atlanta 1996 Reconsidered, 2009.
24 AHLFELDT, G. / FRANKE, B. / MAENNIG, W.: Terrorism and the Regional and Religious Risk Perception of Foreigners: The Case of German Tourists, 2009.
23 AHLFELDT, G. / WENDLAND, N.: Fifty Years of Urban Accessibility: The Impact of Urban Railway Network on the Land Gradient in Industrializing Berlin, 2008.
22 AHLFELDT, G. / FEDDERSEN, A.: Determinants of Spatial Weights in Spatial Wage Equations: A Sensitivity Analysis, 2008.
21 MAENNIG, W. / ALLMERS, S.: South Africa 2010: Economic Scope and Limits, 2008.
20 MAENNIG, W. / WELLBROCK, C.-M.: Sozio-ökonomische Schätzungen Olympischer Medaillengewinne: Analyse-, Prognose- und Benchmark-möglichkeiten, 2008.
19 AHLFELDT, G.: The Train has Left the Station: Real Estate Price Effects of Mainline Realignment in Berlin, 2008.
18 MAENNIG, W. / PORSCHE, M.: The Feel-good Effect at Mega Sport Events – Recommendations for Public and Private Administration Informed by the Experience of the FIFA World Cup 2006, 2008.
17 AHLFELDT, G. / MAENNIG, W.: Monumental Protection: Internal and External Price Effects, 2008.
16 FEDDERSEN, A. / GRÖTZINGER, A. / MAENNIG, W.: New Stadia and Regional Economic Development – Evidence from FIFA World Cup 2006 Stadia, 2008.
15 AHLFELDT, G. / FEDDERSEN, A.: Geography of a Sports Metropolis, 2007.
14 FEDDERSEN, A. / MAENNIG, W.: Arenas vs. Multifunctional Stadia – Which Do Spectators Prefer? 2007.
13 AHLFELDT, G.: A New Central Station for a Unified City: Predicting Impact on Property Prices for Urban Railway Network Extension, 2007.

Hamburg Contemporary Economic Discussions (Download: http://www.uni-hamburg.de/economicpolicy/hced.html)
12 AHLFELDT, G.: If Alonso was Right: Accessibility as Determinant for Attractiveness of Urban Location, 2007.
11 AHLFELDT, G., MAENNIG, W.: Assessing External Effects of City Airports: Land Values in Berlin, 2007.
10 MAENNIG, W.: One Year Later: A Re-Appraisal of the Economics of the 2006 Soccer World Cup, 2007.
09 HAGN, F. / MAENNIG, W.: Employment Effects of the World Cup 1974 in Germany.
08 HAGN, F. / MAENNIG W.: Labour Market Effects of the 2006 Soccer World Cup in Germany, 2007.
07 JASMAND, S. / MAENNIG, W.: Regional Income and Employment Effects of the 1972 Munich Olympic Summer Games, 2007.
06 DUST, L. / MAENNIG, W.: Shrinking and Growing Metropolitan Areas – Asymmetric Real Estate Price Reactions? The Case of German Single-family Houses, 2007.
05 HEYNE, M. / MAENNIG, W. / SUESSMUTH, B.: Mega-sporting Events as Experience Goods, 2007.
04 DU PLESSIS, S. / MAENNIG, W.: World Cup 2010: South African Economic Perspectives and Policy Challenges Informed by the Experience of Germany 2006, 2007.
03 AHLFELDT, G. / MAENNIG, W.: The Impact of Sports Arenas on Land Values: Evidence from Berlin, 2007.
02 FEDDERSEN, A. / MAENNIG, W. / ZIMMERMANN, P.: How to Win the Olympic Games – The Empirics of Key Success Factors of Olympic Bids, 2007.
01 AHLFELDT, G. / MAENNIG, W.: The Role of Architecture on Urban Revitalization: The Case of “Olympic Arenas” in Berlin-Prenzlauer Berg, 2007.
04/2006 MAENNIG, W. / SCHWARTHOFF, F.: Stadium Architecture and Regional Economic Development: International Experience and the Plans of Durban, October 2006.

Hamburg Contemporary Economic Discussions (Download: http://www.uni-hamburg.de/economicpolicy/hced.html)
03/2006 FEDDERSEN, A. / VÖPEL, H.: Staatliche Hilfen für Profifußballclubs in fi-nanziellen Notlagen? – Die Kommunen im Konflikt zwischen Ima-geeffekten und Moral-Hazard-Problemen, September 2006.
02/2006 FEDDERSEN, A.: Measuring Between-season Competitive Balance with Markov Chains, July 2006.
01/2006 FEDDERSEN, A.: Economic Consequences of the UEFA Champions League for National Championships – The Case of Germany, May 2006.
04/2005 BUETTNER, N. / MAENNIG, W. / MENSSEN, M.: Zur Ableitung einfacher Multiplikatoren für die Planung von Infrastrukturkosten anhand der Aufwendungen für Sportstätten – eine Untersuchung anhand der Fußball-WM 2006, May 2005.
03/2005 SIEVERS, T.: A Vector-based Approach to Modeling Knowledge in Economics, February 2005.
02/2005 SIEVERS, T.: Information-driven Clustering – An Alternative to the Knowledge Spillover Story, February 2005.
01/2005 FEDDERSEN, A. / MAENNIG, W.: Trends in Competitive Balance: Is there Evidence for Growing Imbalance in Professional Sport Leagues? January 2005.