Where have all the blue flowers gone: pollinator responses and selection on flower colour in New...
13
Where have all the blue flowers gone: pollinator responses and selection on flower colour in New Zealand Wahlenbergia albomarginata D. R. CAMPBELL *, M. BISCHOFF*, J. M. LORD & A. W. ROBERTSON à *Department of Ecology and Evolutionary Biology, University of California, Irvine, CA, USA Department of Botany, University of Otago, Dunedin, New Zealand àInstitute of Natural Resources, Massey University, Palmerston North, New Zealand Introduction Many phenotypic traits of flowers, including the bright colours of petals, are thought to have evolved in response to interactions with animal pollinators. This view is a long-standing one (Darwin, 1862; Faegri & van der Pijl, 1966), and it has greatly influenced evolutionary studies of flower colour (review in Fenster et al., 2004). There are, however, few experimental demonstrations that pollinators cause fitness differences between flowers of different colours (reviewed by Rausher, 2008). Pollina- tors may respond to colour for a variety of reasons, including the ability to perceive and distinguish colours, innate preference (Raine & Chittka, 2007) and learning of associations with other traits such as rewards (Menzel, 1979; Melendez-Ackerman et al., 1997). However, flower pigmentation may also serve other functions besides visual signalling, suggesting that selective agents besides pollinators could drive the diversity of petal colours in nature. For example, flower colour can influence flower temperature (McKee & Richards, 1998), which in turn may affect water relations of the plant (Galen, 2006), the microenvironment for developing seeds (Lacey & Herr, 2005) and ⁄ or attractiveness of the flower to herbivores. Like other traits in plants and animals (Lande & Arnold, 1983), flower colour may also be selected not because of its direct effects on fitness components but because of indirect selection of correlated characters. Some enzymes used in the synthesis of anthocyanin pigments are also used to synthesize other flavonoid compounds, which could generate pleiotropic effects of genes influencing flower colour (Rausher, 2008). Whereas pigment syn- thesis can be costly, flower colour mutants not expressing anthocyanins can be less tolerant of stresses such as drought and heat (Coberly & Rausher, 2003; Whittall et al., 2006). Pigmentation in flowers often correlates with pigmentation in vegetative tissues (Armbruster, 2002) and can affect the level of resistance to herbivores (reviewed by Strauss & Whittall, 2006). One common approach to studying selection on floral traits has been to use phenotypic selection analysis to Correspondence: Diane R. Campbell, Department of Ecology and Evolutionary Biology, University of California, Irvine, CA 92697, USA. Tel.: +1 949 824 2242; fax: +1 949 824 2181; e-mail: [email protected] ª 2011 THE AUTHORS. J. EVOL. BIOL. JOURNAL OF EVOLUTIONARY BIOLOGY ª 2011 EUROPEAN SOCIETY FOR EVOLUTIONARY BIOLOGY 1 Keywords: flower colour; male fitness; phenotypic manipulation; phenotypic selection; pollination; solitary bee; spatial scale; Wahlenbergia albomarginata Abstract Although pollinators are thought to select on flower colour, few studies have experimentally decoupled effects of colour from correlated traits on pollinator visitation and pollen transfer. We combined selection analysis and phenotypic manipulations to measure the effect of petal colour on visitation and pollen export at two spatial scales in Wahlenbergia albomarginata. This species is representative of many New Zealand alpine herbs that have secondarily evolved white or pale flowers. The major pollinators, solitary bees, exerted phenotypic selection on flower size but not colour, quantified by bee vision. When presented with manipulated flowers, bees visited flowers painted blue to resemble a congener over white flowers in large, but not small, experimental arrays. Pollen export was higher for blue flowers in large arrays. Pollinator preference does not explain the pale colouration of W. albomargi- nata, as commonly hypothesized. Absence of bright blue could be driven instead by indirect selection of correlated characters. doi: 10.1111/j.1420-9101.2011.02430.x
Transcript of Where have all the blue flowers gone: pollinator responses and selection on flower colour in New...

Where have all the blue flowers gone: pollinator responses andselection on flower colour in New Zealand Wahlenbergiaalbomarginata
D. R. CAMPBELL*, M. BISCHOFF*, J. M. LORD� & A. W. ROBERTSON�*Department of Ecology and Evolutionary Biology, University of California, Irvine, CA, USA
�Department of Botany, University of Otago, Dunedin, New Zealand
�Institute of Natural Resources, Massey University, Palmerston North, New Zealand
Introduction
Many phenotypic traits of flowers, including the bright
colours of petals, are thought to have evolved in response
to interactions with animal pollinators. This view is a
long-standing one (Darwin, 1862; Faegri & van der Pijl,
1966), and it has greatly influenced evolutionary studies
of flower colour (review in Fenster et al., 2004). There
are, however, few experimental demonstrations that
pollinators cause fitness differences between flowers of
different colours (reviewed by Rausher, 2008). Pollina-
tors may respond to colour for a variety of reasons,
including the ability to perceive and distinguish colours,
innate preference (Raine & Chittka, 2007) and learning
of associations with other traits such as rewards (Menzel,
1979; Melendez-Ackerman et al., 1997). However, flower
pigmentation may also serve other functions besides
visual signalling, suggesting that selective agents besides
pollinators could drive the diversity of petal colours in
nature. For example, flower colour can influence flower
temperature (McKee & Richards, 1998), which in turn
may affect water relations of the plant (Galen, 2006), the
microenvironment for developing seeds (Lacey & Herr,
2005) and ⁄ or attractiveness of the flower to herbivores.
Like other traits in plants and animals (Lande & Arnold,
1983), flower colour may also be selected not because of
its direct effects on fitness components but because of
indirect selection of correlated characters. Some enzymes
used in the synthesis of anthocyanin pigments are also
used to synthesize other flavonoid compounds, which
could generate pleiotropic effects of genes influencing
flower colour (Rausher, 2008). Whereas pigment syn-
thesis can be costly, flower colour mutants not expressing
anthocyanins can be less tolerant of stresses such as
drought and heat (Coberly & Rausher, 2003; Whittall
et al., 2006). Pigmentation in flowers often correlates
with pigmentation in vegetative tissues (Armbruster,
2002) and can affect the level of resistance to herbivores
(reviewed by Strauss & Whittall, 2006).
One common approach to studying selection on floral
traits has been to use phenotypic selection analysis to
Correspondence: Diane R. Campbell, Department of Ecology and
Evolutionary Biology, University of California, Irvine, CA 92697, USA.
Tel.: +1 949 824 2242; fax: +1 949 824 2181;
e-mail: [email protected]
ª 2 0 1 1 T H E A U T H O R S . J . E V O L . B I O L .
J O U R N A L O F E V O L U T I O N A R Y B I O L O G Y ª 2 0 1 1 E U R O P E A N S O C I E T Y F O R E V O L U T I O N A R Y B I O L O G Y 1
Keywords:
flower colour;
male fitness;
phenotypic manipulation;
phenotypic selection;
pollination;
solitary bee;
spatial scale;
Wahlenbergia albomarginata
Abstract
Although pollinators are thought to select on flower colour, few studies have
experimentally decoupled effects of colour from correlated traits on pollinator
visitation and pollen transfer. We combined selection analysis and phenotypic
manipulations to measure the effect of petal colour on visitation and pollen
export at two spatial scales in Wahlenbergia albomarginata. This species is
representative of many New Zealand alpine herbs that have secondarily
evolved white or pale flowers. The major pollinators, solitary bees, exerted
phenotypic selection on flower size but not colour, quantified by bee vision.
When presented with manipulated flowers, bees visited flowers painted blue
to resemble a congener over white flowers in large, but not small,
experimental arrays. Pollen export was higher for blue flowers in large arrays.
Pollinator preference does not explain the pale colouration of W. albomargi-
nata, as commonly hypothesized. Absence of bright blue could be driven
instead by indirect selection of correlated characters.
doi: 10.1111/j.1420-9101.2011.02430.x

characterize the relationship of a trait to a fitness
component; a recent review uncovered 56 such studies
on 44 plant species (Harder & Johnson, 2009), although
there were only four estimates included of selection on
petal colour. A limitation of this approach is that it can
only separate direct effects of the trait of interest from
indirect selection of correlated characters if those char-
acters are also included in the analysis (Mitchell-Olds &
Shaw, 1987). Genetic manipulations of flower colour
provide much stronger evidence (Bradshaw & Schemske,
2003), although they do not necessarily eliminate pleio-
tropic effects. An alternative approach is to manipulate a
trait, such as flower colour, phenotypically (Clements &
Long, 1923; Waser & Price, 1981, 1983; Campbell et al.,
1997, 2010; Melendez-Ackerman & Campbell, 1998;
Peter & Johnson, 2008; Dudash et al., 2011). This
approach of phenotypic manipulation, when control
manipulations are included, has the advantage of ascrib-
ing any selection seen directly to flower colour. All
studies referenced above were conducted on small spatial
scales, such that individual plants, inflorescences or
flowers of two experimental colours are intermixed.
Pollinators may, however, show different behavioural
responses depending on the spatial scale, as shown in the
studies of traits other than colour (Campbell et al., 1997;
Leiss & Klinkhamer, 2005). Different responses at differ-
ent scales have been predicted by elements of foraging
theory (Mitchell, 1989) and also observed for animals
foraging at flowers. For example, bumblebees in one
study discriminated between groups of plants with
different nectar rewards only when the groups were
separated by >6 m (Klinkhamer et al., 2001).
Even in those cases where pollinators have been shown
to respond behaviourally to flower colour, the conse-
quences for pollen import and export (female and male
pollination success) are rarely known. A few studies have
examined the net effect of colour manipulation on seed set
(Melendez-Ackerman & Campbell, 1998), and Peter &
Johnson (2008) measured the effect of manipulating UV
reflectance not only on insect visitation but also on
removal and deposition of pollinaria in a deceptive orchid.
But even in that case, the shape of the relationship
between visitation and pollination was not reported.
Given the long history of pollination ecology, there are
remarkably few plant species for which the relationship
between flower visitation and either pollen import or
pollen export has been quantified in the field (Young &
Stanton, 1990; Engel & Irwin, 2003; Price et al., 2005).
In this study, we used both phenotypic selection
analysis and phenotypic manipulations to measure the
effect of flower petal colour on insect visitation and pollen
export (an aspect of male fitness; Campbell, 1989; Galen,
1992) at two different spatial scales. Our study system was
the white- to pale-blue-coloured Wahlenbergia albomargi-
nata Hook. (Campanulaceae) in alpine New Zealand. The
distribution of flower colours in this habitat is unusual.
More than 70% of the flowers are white or near-white,
which is high compared with continental mountain floras
(Godley, 1979). The absence of bright blues and purples
has been suggested to reflect the absence of native social
bees (Wardle, 1978; Godley, 1979; Lloyd, 1985), largely
on the basis of the argument that elsewhere in the world
bright blue is considered part of the pollination syndrome
for plants pollinated by bumblebees (Faegri & van der Pijl,
1966). As many other species of Wahlenbergia in Austral-
asia are much brighter blue, focusing on W. albomarginata
allowed us to examine whether the absence of bright blue
from the New Zealand alpine could be explained by a
preference of native insect pollinators in that habitat for
white flowers. Over four field seasons (2008–2011), we
asked the following specific questions:
1 Do the native pollinators visit flowers of W. albomargi-
nata preferentially on the basis of natural variation in
flower colour and ⁄ or interactions of flower colour
with flower size? We examined visitation rate by
pollinators as a function of petal colour and size using
phenotypic selection analysis (Lande & Arnold, 1983;
Phillips & Arnold, 1989).
2 Do the native pollinators discriminate against flowers
phenotypically manipulated to match the brighter
petal colour of another New Zealand Wahlenbergia?
We used phenotypic manipulations to extend the
range of colour presented, because the absence of
bright blue in the New Zealand alpine might be
explained by insect colour preference even if those
insects do not respond to the intraspecific range of
variation in petal colour.
3 Does success at pollen export to stigmas of surround-
ing flowers, a measure of male pollination success,
depend on flower colour?
4 Do insect visitation rate and pollen export respond to
flower colour in the same way on two different spatial
scales, with equal number of flowers of the two
colours either intermixed on a small scale or presented
in relatively large patches?
5 Is intraspecific variation in flower colour associated
with flower temperature and ⁄ or floral herbivory?
Materials and methods
Study system
Wahlenbergia albomarginata is a small creeping rhizomatous
herb found in tussock grasslands in lowland to alpine areas
of South Island and Stewart Island, New Zealand. The
genus Wahlenbergia originated in South Africa and dis-
persed to Australasia prior to radiating about 3.7 Ma
(Prebble, 2010). Recent molecular evidence suggests two
dispersal events from Australia to New Zealand (Prebble,
2010). One clade, which diversified only about 0.5 Ma,
consists only of lowland species, including the brightly
coloured W. violacea. W. albomarginata belongs to the older
(about 1 Ma) New Zealand clade, as do the other
high-elevation species in New Zealand. The phylogeny of
2 D. R. CAMPBELL ET AL.
ª 2 0 1 1 T H E A U T H O R S . J . E V O L . B I O L . d o i : 1 0 . 1 1 1 1 / j . 1 4 2 0 - 9 1 0 1 . 2 0 1 1 . 0 2 4 3 0 . x
J O U R N A L O F E V O L U T I O N A R Y B I O L O G Y ª 2 0 1 1 E U R O P E A N S O C I E T Y F O R E V O L U T I O N A R Y B I O L O G Y

Wahlenbergia, along with the observation that the Austra-
lian species are brightly coloured, as are some of the New
Zealand species, suggests that bright pigmentation is
the ancestral condition, with a loss of pigmentation in
W. albomarginata that occurred at or after occupation of
high-elevation habitat in New Zealand.
Eachrametof W. albomarginata producesone flower that
is protandrous. The pollen is shed onto retractable stylar
hairswhile theflower is inbudandthepollenpresented ina
cylindrical layer along the side of the style in a sequential
fashion as the hairs progressively retract (Lloyd & Yates,
1982). This form of secondary pollen presentation is
common in the Campanulaceae (Endress, 2011). After a
variablenumberofdays, thestigmatic lobesexpandandthe
stigma becomes receptive. Flowers last 8 days on average
(D. Campbell & M. Bischoff, unpublished data). Autoga-
mous selfing does not occur, and flowers that are hand-
selfed make <5% as many seeds as flowers that are
outcrossed, suggesting that the species is largely self-
incompatible (Bischoff, 2008). We studied W. albomargi-
nata at elevations of 1650–1750 m in the Rastus Burn
Recreation Area within the Remarkables Range in Otago,
New Zealand, along the trail from the Remarkables Ski
Area to Lake Alta. At this site, W. albomarginata blooms
from early February to mid-March. Solitary bees, Hylaeus
matamoko (Hymenoptera: Colletidae) and Leioproctus spp.
(Hymenoptera: Halictidae), are the major pollinators,
contributing about 20 times as much to pollen deposition
as the other common visitors, syrphid and tachinid flies
(M. Bischoff, D.R. Campbell, A.W. Robertson and J.M.
Lord, unpublished data). In single visits, Hylaeus bees
transfer nearly three times as much germinating pollen to
the stigma as do syrphid flies in the genus Allograpta
(means = 113 vs. 40 grains; M. Bischoff, D.R. Campbell,
A.W. Robertson and J.M. Lord, unpublished data). The
petals are often chewed by grasshoppers (Sigaus australis),
who sometimes consume the entire flower (M. Bischoff
and D. Campbell, personal observation).
Flowers are generally white with bluish markings, but
vary at our site from nearly pure white to much more
intensely coloured (Appendix S1). Although colour can
fade slightly with senescence of the flower, the relative
difference between bluer and paler flowers remains
consistent over time. To characterize the flower colour
of individual W. albomarginata flowers, we measured the
reflectance spectra of the adaxial surface of single petals
over wavelengths from 300 to 700 nm. These spectra
were obtained using an Ocean Optics (Dunedin, FL, USA)
USB 4000 reflectance spectrometer with a 200- to 1000-
nm range and a UV–VIS light source, standardized by a
white reflectance standard. The probe was held at a 45�.
Q1: Do the native pollinators visit preferentially basedon natural variation in flower colour and/or size?
To measure the selection based on natural variation in
colour, we examined insect visitation as a function of
flower colour and morphology in experimental arrays,
each with 16 flowers. These arrays are a subset of those
for which M. Bischoff, D.R. Campbell, A.W. Robertson
and J.M. Lord (unpublished data) reported insect visita-
tion, but not flower traits as analysed here. Arrays were
set up near (usually 5–10 m away), but not in, patches of
natural flowers, and were generally placed into mats of
cushion plants that provided a relatively uniform green
background. Flowers were spaced 10 cm apart in four
rows of four flowers, with each flower in a numbered
1.5-mL microcentrifuge tube filled with water. Flowers
were assigned to tubes at random. We observed each of
10 different flower arrays, totalling 160 flowers (Table 1).
All observations were made during sunny conditions
between 11:30 and 16:30. Visitation rates were unusu-
ally high during these periods (for dates see Table 1),
probably because both periods corresponded with a spell
of particularly fine weather, so we watched each array
for only 1 h. Only visitors that were foraging for rewards
on the flower were counted. For each insect that entered
the array, we recorded the sequence of flowers visited
until the insect left and either visited a flower outside of
the array or disappeared from sight. Each such sequence
is hereafter called a foraging bout. After observation, we
measured the corolla width and diameter of the entire
flower using callipers. The two morphometric measure-
ments were strongly correlated (r = 0.46, N = 158,
P < 0.0001), and for further analysis, we used only
diameter to represent flower size.
Flowers were also measured using a spectrometer to
characterize petal colour in a way independent of human
vision. For phenotypic selection analysis, we needed a
summary measure of colour. The few previous estimates
of selection gradients on quantitatively varying petal
colour have used optical density of pigment extractions
(Campbell et al., 1997), reflectances at particular wave-
lengths (Frey, 2004) or extracted brightness, chroma and
hue from the spectra (Caruso et al., 2010). As we were
most interested in insect pollinator responses to colour,
we characterized petal colour using measures based on
the properties of insect vision. Most insects have recep-
tors with peak sensitivities near 350 nm (UV receptor),
440 nm (blue receptor) and 530 nm (green receptor;
Briscoe & Chittka, 2001). Flowers of W. albomarginata do
not reflect in the UV (Fig. 1). So, for our first point
measure of colour, we used the ratio between reflectance
in the blue vs. green (R440 ⁄ R530). We refer to this
measure hereafter as the reflectance ratio. Like the
colour measure used by Frey (2004), this reflectance
ratio captures much of the variation between flowers in
shape of the reflectance curve (Fig. 1).
We also used a second point measure of colour, relying
on plots of the reflectance spectra in bee colour space,
following the hexagon model for honeybees (presented
in Chittka & Kevan, 2005). It is likely that the spectral
sensitivities of other bees, including the common visitors
seen here, are very similar (Briscoe & Chittka, 2001). We
Pollinators and selection on Wahlenbergia colour 3
ª 2 0 1 1 T H E A U T H O R S . J . E V O L . B I O L . d o i : 1 0 . 1 1 1 1 / j . 1 4 2 0 - 9 1 0 1 . 2 0 1 1 . 0 2 4 3 0 . x
J O U R N A L O F E V O L U T I O N A R Y B I O L O G Y ª 2 0 1 1 E U R O P E A N S O C I E T Y F O R E V O L U T I O N A R Y B I O L O G Y

could only plot the flowers observed in 2009, as in 2008
we did not have an available UV spectrometer and only
measured reflectance spectra from 400 to 700 nm. After
determining the x and y coordinates in the hexagon
colour space, which represent excitation values of the
two types of colour opponent neurons (Fig. 2), we used
principal component analysis to find the major axis
explaining the greatest variation in colour as visible to
insects. In this case, the first principal component (PC1)
explained 93% of the variance. We then used the PC1
score as a measure of colour in the phenotypic selection
analysis. Individual flowers at the two ends of this axis
differed by 0.39 Euclidean units in colour space. As bees
can typically learn to discriminate colours, after differ-
ential conditioning, down to about 0.05 units apart (Dyer
& Chittka, 2004), these would have represented distinct
colour stimuli to the insects.
In these arrays of 160 natural flowers (Table 1), 90%
of the flower visits were made by the bees H. matamoko
and Leioproctus spp. (Table 2). These bees collect pollen
from both male-phase and female-phase flowers, the
latter of which generally retain some pollen along the
style. Because these bees are the dominant pollinators
(M. Bischoff, D.R. Campbell, A.W. Robertson and J.M.
Lord, unpublished data), we performed phenotypic
selection analysis based on visitation rate by bees only.
For each flower, we determined the number of visits by
Hylaeus and Leioproctus in the observation period. Because
overall visit rates were highly variable over time, we
standardized these visit rates by finding the residual from
the overall mean for the observation period. We then
regressed residual visit rate (w) on size and colour, after
standardizing each trait to a mean of zero and variance of
1 (represented by X1 and X2):
Table 1 Overview of experimental arrays used to assess pollinator visitation and pollen export.
Experiment
No. flowers
in an array
Independent
variable(s)
Number of
arrays set-up
Array hours of
observation Dates
Q1. Natural arrays 16 Natural petal colour and
Flower diameter
10 10 19–21 February 2008 and
17–19 February 2009
Q2. Small experiment 16 Manipulated colour 7 21 14–17 February 2009
Q3. Pollen export to
surrounding flowers
16 Manipulated donor
colour and Array
8 None 7–18 February 2009
Q4. Large experiment
on pollen export and
visitation
64 Manipulated inner
colour and
Manipulated outer
colour and Array pair
12 38 26 February 2011 to 12
March 2011
Fig. 1 Reflectance spectra for Wahlenbergia albomarginata and
W. violacea. Black line: Mean and 95% CI for 112 W. albomarginata
flowers from the seven arrays observed for phenotypic selection
analysis in 2009. Grey line: Mean and 95% CI for five sample
flowers of W. violacea. Values were binned into the nearest 5 nm
prior to plotting. Numbers on the plot give the ranges for the
reflectance ratio R440 ⁄ R530.
Fig. 2 Petal colours plotted in hexagon colour space. Grey circles:
Individual flowers in the natural arrays used in the phenotypic
selection analysis. Filled blue diamonds: Individual flowers of the
congener W. violacea. Filled black circle: Wahlenbergia albomarginata
painted to resemble W. violacea. Open circle: W. albomarginata
painted white.
4 D. R. CAMPBELL ET AL.
ª 2 0 1 1 T H E A U T H O R S . J . E V O L . B I O L . d o i : 1 0 . 1 1 1 1 / j . 1 4 2 0 - 9 1 0 1 . 2 0 1 1 . 0 2 4 3 0 . x
J O U R N A L O F E V O L U T I O N A R Y B I O L O G Y ª 2 0 1 1 E U R O P E A N S O C I E T Y F O R E V O L U T I O N A R Y B I O L O G Y

w ¼ aþ b1X1 þ b2X2 þ 0:5c11X21 þ 0:5c22X2
2 þ c12X1X2 þ e;
ð1Þ
This expression contains terms for the strength of
directional selection (b1 and b2) and stabilizing or
disruptive selection on each trait (c11and c22), as well as
the strength of correlational selection (c12). Correlational
selection is here represented by interactions between
effects of traits on a fitness component (Phillips & Arnold,
1989).
Q2: Do the native pollinators discriminate againstflowers phenotypically manipulated to match thebrighter petal colour of other Wahlenbergia?
We set up experimental arrays, resembling the natural
arrays described above, except that half of the 16 flowers
were painted white and half painted a blue-purple to
match the reflectance spectrum of W. violacea. The colour
of W. violacea is most likely similar to the ancestral petal
colour when the ancestor of W. albomarginata migrated to
New Zealand. We matched the average spectrum for five
flowers obtained from wild plants transplanted into a
garden near Wellington (Fig. 1) using a mixture of
approximately half blue and half white and a small
amount of red water-based acrylic paint. The reflectance
ratio (R440 ⁄ R530) for our mixture was 2.26, within the
range of 2.23–2.90 for W. violacea, and flowers painted
were just 0.05 units in hexagon colour space away from
the nearest measured W. violacea (Fig. 2). Flowers
painted white were within the natural range for
W. albomarginata, with a reflectance ratio of 1.01
(Fig. 2). Because the petals are delicate, prior to painting
the flowers we affixed the petals to a plastic support.
Each support was made by punching a star-shaped piece
of mylar plastic film (diameter = 24 mm from point to
point) coated with double-sided cellophane tape on each
side and then punching a 5-mm hole through the centre.
The 5-pointed plastic star was mounted on the top of a
1.5-mL microcentrifuge tube after removing the tube’s
lid. We filled each tube with water, placed the flower
stalk through the central hole and with forceps pasted
the five petals down onto the tape on the top of the
plastic mount. Flowers were then painted one of the two
colours, and the tubes were put into wire holders that
held them about 15 cm above the ground. In previous
studies with these same acrylic paints, pollinating insects
at these sites, including flies (Campbell et al., 2010) and
bees (D. Campbell personal observation) did not show
any preference between flowers painted white and
flowers that are naturally white. This indifference to
the paint suggests that it has no unintended effects on
insect visitation that are not driven by colour.
The two colour treatments were assigned at random to
the 16 positions in each 40 cm · 40 cm array. We
observed each of seven different flower arrays for 3 h
each, during the hours of 11:30–16:30 in mid-February
2009 (Table 1), recording insect visitation as described for
the natural arrays. Because our question in this case
centred on insect preference, we analysed the data from
the point of view of the insects by using each foraging
bout as a unit of replication. As individual insects were
not marked, it is possible that some insects made multiple
foraging bouts. However, we frequently observed multi-
ple insects of the same type foraging simultaneously,
reducing the extent of this nonindependence. As the
blue-purple treatment represented a colour not normally
found in the environment, the insects could have
changed behaviour in response to learning over the
course of the experiment.
For each category of insect, we analysed two variables:
the kind of flower (blue or white) first visited by the
insect upon entering the array and the proportion of
visits made to a given flower colour during the foraging
bout (provided the insect made at least two flower visits).
The first variable was compared to the null hypothesis
that both colours were visited equally, using a likelihood
ratio test. The second variable was arcsine-square-root-
transformed to improve normality and compared with
the null hypothesis of 0.5 with a one-sample t test.
Table 2 Distribution of insect visitors at arrays. Values are presented on the basis of per cent of foraging bouts and per cent of flowers visited
for the smaller arrays with 16 flowers. The data for the natural arrays include only those in which we measured flower traits for selection
analysis. For the large colour arrays, individual flower visits were not always recorded for the outer, nontarget, part of the array.
Per cent bouts (Per cent flower visits)
Natural arrays Small colour arrays Large colour arrays
Hylaeus (Colletidae) 81.2 (77.4) 57.9 (58.7) 57.0
Leioproctus (Halictidae) 6.0 (13.4) 0.0 (0.0) 8.7
Allograpta (Syrphidae) 5.8 (3.9) 21.2 (18.2) 13.4
Platycheirus (Syrphidae) 0.2 (0.2) 0.9 (0.4) 1.6
Tachinidae 2.0 (1.4) 11.2 (16.8) 13.7
Other insects 4.0 (3.8) 8.7 (6.2) 1.9
Total N 582 (1453) 321 (499) 321
Pollinators and selection on Wahlenbergia colour 5
ª 2 0 1 1 T H E A U T H O R S . J . E V O L . B I O L . d o i : 1 0 . 1 1 1 1 / j . 1 4 2 0 - 9 1 0 1 . 2 0 1 1 . 0 2 4 3 0 . x
J O U R N A L O F E V O L U T I O N A R Y B I O L O G Y ª 2 0 1 1 E U R O P E A N S O C I E T Y F O R E V O L U T I O N A R Y B I O L O G Y
Q3: Does success at pollen export to stigmas ofsurrounding flowers depend on flower colour?
To determine the effects on pollen export, in 2009, we
also set up experimental arrays using phenotypic mani-
pulations of flower colour as described earlier for ques-
tion 2, but with all experimental flowers in the male
phase. To estimate pollen export from these flowers, we
used two colours of powdered fluorescent dyes, applied
with a wooden toothpick to the pollen arranged along
the stylar pollen presenter. Although fluorescent dyes do
not perfectly mimic pollen export, previous studies of
plants visited by solitary bees and flies have shown good
correspondence between movement of pollen grains and
movement of dye, used as a pollen analogue (Campbell,
1985; Dudash, 1991). On each of 4 days, we set up two
experimental arrays, one with blue dye applied to the
eight blue-painted flowers and fire orange dye applied to
the eight white-painted flowers and another with the
reverse assignment of dye colours to flower petal treat-
ments. These 40 cm · 40 cm arrays of 16 manipulated
flowers (Table 1) were set up so that they were sur-
rounded by natural flowers of W. albomarginata. These
natural flowers served as potential recipients for dye
transfer. The two arrays were placed sufficiently far apart
(>100 m) that the chance of dye transfer between arrays
was negligible. After 48 h, we collected all female-phase
W. albomarginata flowers within 2 m radius of each of the
experimental arrays. For all flowers, dye particles of each
colour on the stigma were counted under 40· power
using a dissecting microscope. In total, we set up eight
arrays of this type and counted dye particles transferred
to 300 flowers, an average of 18.75 flowers per donor
colour and array.
For each array, we totalled the dye particles success-
fully transferred to stigmas from donor flowers of each
colour and log-transformed the value to improve
normality. Dye transfer was then analysed using a
randomized block ANOVAANOVA, with array as the blocking
factor and donor petal colour as the treatment.
Q4: Do insect visitation rate and pollen exportrespond to flower colour in the same way on twodifferent spatial scales?
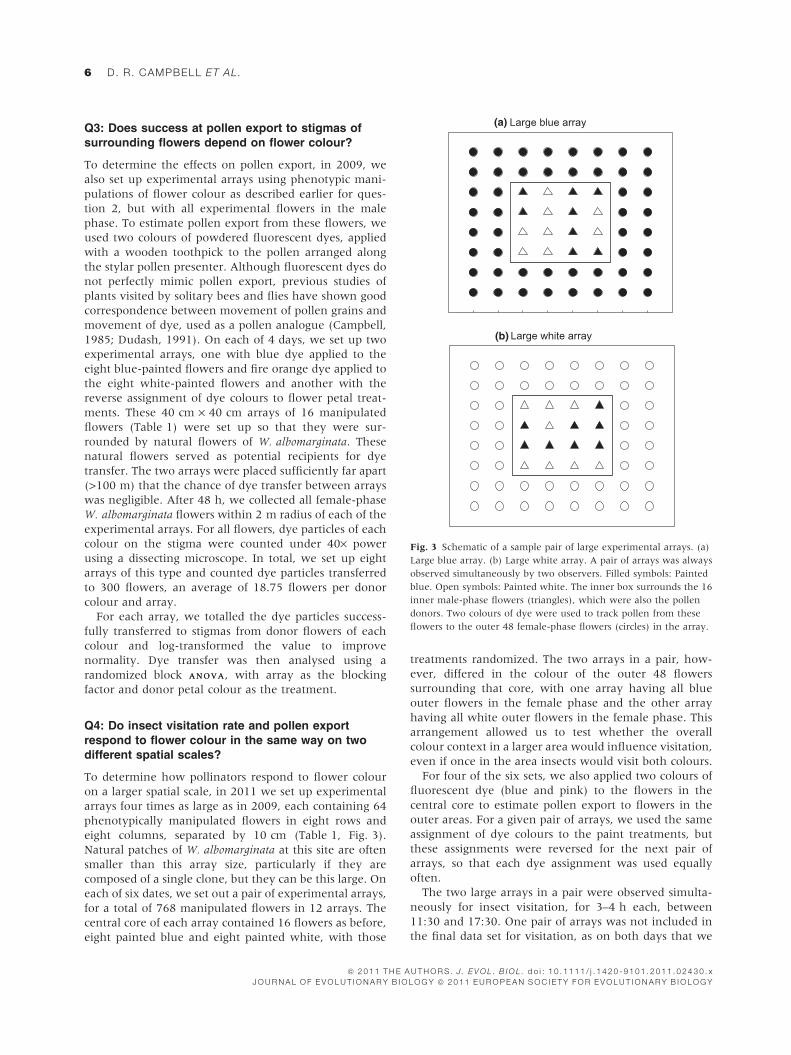
To determine how pollinators respond to flower colour
on a larger spatial scale, in 2011 we set up experimental
arrays four times as large as in 2009, each containing 64
phenotypically manipulated flowers in eight rows and
eight columns, separated by 10 cm (Table 1, Fig. 3).
Natural patches of W. albomarginata at this site are often
smaller than this array size, particularly if they are
composed of a single clone, but they can be this large. On
each of six dates, we set out a pair of experimental arrays,
for a total of 768 manipulated flowers in 12 arrays. The
central core of each array contained 16 flowers as before,
eight painted blue and eight painted white, with those
treatments randomized. The two arrays in a pair, how-
ever, differed in the colour of the outer 48 flowers
surrounding that core, with one array having all blue
outer flowers in the female phase and the other array
having all white outer flowers in the female phase. This
arrangement allowed us to test whether the overall
colour context in a larger area would influence visitation,
even if once in the area insects would visit both colours.
For four of the six sets, we also applied two colours of
fluorescent dye (blue and pink) to the flowers in the
central core to estimate pollen export to flowers in the
outer areas. For a given pair of arrays, we used the same
assignment of dye colours to the paint treatments, but
these assignments were reversed for the next pair of
arrays, so that each dye assignment was used equally
often.
The two large arrays in a pair were observed simulta-
neously for insect visitation, for 3–4 h each, between
11:30 and 17:30. One pair of arrays was not included in
the final data set for visitation, as on both days that we
(a)
(b)
Fig. 3 Schematic of a sample pair of large experimental arrays. (a)
Large blue array. (b) Large white array. A pair of arrays was always
observed simultaneously by two observers. Filled symbols: Painted
blue. Open symbols: Painted white. The inner box surrounds the 16
inner male-phase flowers (triangles), which were also the pollen
donors. Two colours of dye were used to track pollen from these
flowers to the outer 48 female-phase flowers (circles) in the array.
6 D. R. CAMPBELL ET AL.
ª 2 0 1 1 T H E A U T H O R S . J . E V O L . B I O L . d o i : 1 0 . 1 1 1 1 / j . 1 4 2 0 - 9 1 0 1 . 2 0 1 1 . 0 2 4 3 0 . x
J O U R N A L O F E V O L U T I O N A R Y B I O L O G Y ª 2 0 1 1 E U R O P E A N S O C I E T Y F O R E V O L U T I O N A R Y B I O L O G Y

attempted visitation we saw no insect visitation after
45 min. For each array, we noted the number of insects
of each type that entered the array and foraged on at least
one of the 64 flowers. We also determined the number of
bee (Hylaeus + Leioproctus) visits per hour and the num-
ber of fly (Syrphidae + Tachinidae) visits per hour to the
inner blue flowers and to the inner white flowers. These
visitation rates were analysed with split-plot ANOVAANOVA
(implemented in Proc GLM of SAS v9.1.3; SAS Institute
Inc., Cary, NC, USA), with array pair as the blocking
factor, outer colour of the array as the whole-plot factor
and colour of the inner flowers as the split-plot factor.
Flowers were collected after 48 h of exposure to count
dye particles transferred to stigmas of the outer flowers.
In total, we counted dye particles on 384 flowers from
eight arrays. Dye transfer from inner flowers of a
particular colour was log-transformed (after adding 1)
to improve the normality of residuals and then also
analysed using split-plot ANOVAANOVA. To examine the rela-
tionship between insect visitation and overall dye export,
we calculated correlation coefficients between the total
dye moved in an array (log-transformed) and the
numbers of bees and flies observed entering those large
arrays and visiting at least one flower.
Q5: Is intraspecific variation in flower colourassociated with flower temperature and/or floralherbivory?
We examined two other processes besides visual responses
of pollinators hypothesized to be influenced by flower
colour. First, flowers of different colours might differ in
temperature, which could affect attractiveness to insect
visitors and ⁄ or the rate at which stigmas become receptive
or pollen tubes grow. Over three afternoons between 26
February to 9 March 2010, we chose a total of 20 pairs of
natural flowers (usually in male phase) growing within
5 m of each other in similar light conditions, one of which
was unusually white and one of which was unusually
blue. Using a dual thermocouple (Omega model
HH2002A; Stamford, CT, USA), we took simultaneous
readings of the temperature inside the petals and ambient
air temperature and found the discrepancy between these.
For each flower, we averaged measures of discrepancy
after 60 and 90 s of stabilization. We then immediately
measured the other colour flower in the pair, with the
order chosen at random, the same way. Using a random-
ized block ANOVAANOVA with pair of flowers as the blocking
factor, we compared the temperature discrepancies
between the two flower colours. Mean ambient air
temperature during these measurements was 19.7 �C.
After recordings were finished, flowers were collected and
their reflectance spectra measured.
To examine floral herbivory, we located pairs of
unusually blue and unusually white male-phase flowers
growing within about 5 m of each other. We marked 25
pairs with metal rings and a small numbered paper tag on
27 February 2010, 24 pairs on 4 March 2010 and 23 pairs
on 7 March 2011. These pairs were spread out over sites
spanning an elevational range from approximately
1600 m (along a stream below the ski parking lot) to
1750 m (approximately 50 m below Lake Alta). After
4 days (except 5 days for those marked on 4 March
2010), we collected the flowers. Herbivory was assessed
by number of petals (0–5) that were damaged, with a
score of 6 used for flowers that were completely eaten.
For analysis, we collapsed damage scores into three
classes: none (0), partial (1–4) or complete (5–6). If the
entire ramet was gone, we scored the result as missing
data. Reflectance spectra were characterized for a
random sample of those blocks in which both flowers
still retained at least one petal. Herbivory itself did not
change the petal colour. We used contingency analysis to
examine whether damage depended on colour class of
the flower. To supplement this analysis, we also used
logistic regression to model damage (yes or no) as a
function of the reflectance ratio R440 ⁄ R530. The analysis
was implemented in Proc Genmod of SAS v9.13.
Results
Q.1: Do the native pollinators visit preferentiallybased on the natural variation in flower colour and/orsize?
At the 10 arrays of natural, unmanipulated flowers, we
observed 1453 flower visits in 582 foraging bouts by
insects. On average, flowers were 15.9 mm in diameter
with a reflectance ratio of 1.08 (N = 158). Larger flowers
received many more bee visits, with an additional 1.6
visits per hour for every 1 standard deviation (=2.9 mm)
increase in diameter (P < 0.001; Table 3). Selection on
this trait appeared directional, with no evidence for
curvature in the effect on fitness (Table 3). We detected
no selection on flower colour within the range of natural
variation, regardless of whether it was measured as the
reflectance ratio (Table 3A) or as the PC1 in bee colour
space (Table 3B). We also saw no interaction between
the effect of flower size and colour on visitation rate by
bees. Given the absence of nonlinear selection, we also
used multiple regression to analyse bee visitation rate as a
function of three traits: diameter and the two axes in
hexagon colour space. This model also yielded no
significant phenotypic selection on colour (P > 0.50 for
both colour axes).
Q2: Do the native pollinators discriminate againstflowers phenotypically manipulated to match thebrighter petal colour of other Wahlenbergia?
The majority of visitors at the small arrays where we
manipulated flower colour were bees of the species
H. matamoko (Table 2). These native bees did not dis-
criminate against bright blue flowers. Instead, they made
Pollinators and selection on Wahlenbergia colour 7
ª 2 0 1 1 T H E A U T H O R S . J . E V O L . B I O L . d o i : 1 0 . 1 1 1 1 / j . 1 4 2 0 - 9 1 0 1 . 2 0 1 1 . 0 2 4 3 0 . x
J O U R N A L O F E V O L U T I O N A R Y B I O L O G Y ª 2 0 1 1 E U R O P E A N S O C I E T Y F O R E V O L U T I O N A R Y B I O L O G Y

their first visit to blue and white flowers approximately
equally often (45% vs. 55%, N = 186, likelihood ratio
test, P = 0.1425), and in bouts of two or more visits made
a proportion indistinguishable from 0.5 to blue flowers
(N = 73, t72 = 1.37, P = 0.1750, Fig. 4). The syrphid fly
visitors were primarily Allograpta (Table 2), and these
flies did discriminate against blue. Only 18% of first visits
were made to blue flowers (N = 68, P < 0.0001). In
longer foraging bouts of two or more flower visits, on
average they visited blue 0.27 of the time (N = 16,
P < 0.05, Fig. 4). Tachinid flies also discriminated against
bright blue, making only 6% of first visits to blue flowers
(N = 36, P < 0.0001) and visiting blue an average pro-
portion of 0.22 in longer foraging bouts (N = 20,
P < 0.0001; Fig. 4).
Q3: Does success at pollen export to stigmas ofsurrounding flowers depend on flower colour?
In our experiments with eight small arrays of 16 flowers
each, we saw no difference between donor flowers
painted blue and those painted white in the amount of
dye transferred to stigmas of surrounding flowers (ran-
domized block ANOVAANOVA, F1,7 = 0.01, P = 0.9295; Fig. 5).
For a given donor colour, across the eight arrays, 10–88%
of the potential recipient flowers had at least one particle
of dye on the stigma.
Q4: Do insect visitation rate and pollen exportrespond to flower colour in the same way on twodifferent spatial scales?
The large experimental arrays attracted a similar mix of
insects as had the smaller arrays 2 years previous
(Table 2). Visitation rates by the bees varied strongly
across pairs of arrays (Table 4). At the small spatial scale,
inner blue flowers received significantly more bee visits
than did inner white flowers (effect of inner colour in
split-plot ANOVAANOVA, P < 0.05, Table 4, Fig. 6). Visitation
rates by flies were much more consistent, with no
significant variation among pairs and no effects of flower
colour detected (Table 4). Pollen export (estimated with
dyes) differed with colour on the large spatial scale, but
not detectably so on the small spatial scale. Large arrays
with all of the outer flowers painted blue actually had
greater amounts of dye transfer (effect of outer colour in
split-plot ANOVAANOVA, P < 0.05, Table 4, Fig. 6). Dye export
Table 3 Estimates of phenotypic selection on standardized flower size (diameter) and standardized colour in arrays of natural flowers.
The fitness component examined was the number of visits in an hour by bees, as a residual from the mean value for the array. Analysis
employed multiple regression based on eqn 1 in the text.
(A) Colour measured as the reflectance ratio (R440 ⁄ R530). Measurements were made for all but two of the 160 flowers in the 10 arrays
Parameter Estimate Standard error t152 P
Intercept )0.1866 0.4364 )0.43 0.6697
Size 1.6115 0.3263 4.94 < 0.0001
Colour (R440 ⁄ R530) 0.1788 0.4464 0.40 0.6893
Size2 0.3493 0.4772 0.73 0.4654
Colour2 )0.0909 0.4182 )0.22 0.8282
Size · Colour 0.3204 0.3488 0.92 0.3598
(B) Colour measured as principal component 1 for flowers plotted in hexagon colour space. This analysis used only the flowers from 2009
Parameter Estimate Standard error t105 P
Intercept )0.1632 0.5678 )0.29 0.7743
Size 1.5573 0.4261 3.66 0.0004
Colour (PC1) )0.0600 0.4417 )0.14 0.8921
Size2 0.4564 0.5828 0.78 0.4353
Colour2 )0.5633 0.4529 )1.24 0.2164
Size · Colour 0.0127 0.4872 0.03 0.9793
Fig. 4 Proportion of visits made to blue-painted rather than white-
painted flowers in small experimental arrays of Wahlenbergia
albomarginata.
8 D. R. CAMPBELL ET AL.
ª 2 0 1 1 T H E A U T H O R S . J . E V O L . B I O L . d o i : 1 0 . 1 1 1 1 / j . 1 4 2 0 - 9 1 0 1 . 2 0 1 1 . 0 2 4 3 0 . x
J O U R N A L O F E V O L U T I O N A R Y B I O L O G Y ª 2 0 1 1 E U R O P E A N S O C I E T Y F O R E V O L U T I O N A R Y B I O L O G Y

from a given inner colour in an array correlated with bee
visitation (r = 0.58, N = 12, P = 0.0481) but not with fly
visitation (r = )0.30, N = 12, P = 0.3508). After dye
export was summed across the two inner flower colours
to yield a single value for an array, total dye export in an
array also correlated highly with the total number of bees
observed visiting the array during four daytime hours of
those 48 h (r = 0.81, N = 8, P = 0.0140). Number of bees
seen at an array in 4 h ranged from 0 to a high of 24,
with more seen on warmer days. Because visitation rates
by bees were higher to blue flowers, blue flowers in
mostly blue arrays received 92% of their visits from bees,
the more effective pollinators, whereas white flowers in
mostly white arrays received only 68% of their visits
from bees (Fig. 6). Weighting these values by the relative
effectiveness of these two types of insects in single visits
(113 vs. 40 pollen grains) predicts that 97% of pollen
transfer to blue flowers in blue arrays was by bees and
86% to white flowers in white arrays was by bees.
Q5: Is intraspecific variation in flower colourassociated with flower temperature and/or floralherbivory?
The flowers assigned to the blue vs. white categories
differed in colour, as judged by the reflectance ratio
R440 ⁄ R530 (mean ± SE = 1.19 ± 0.4 and 0.96 ± 0.02 for
blue and white, respectively, randomized block ANOVAANOVA,
P < 0.0001). Flowers in both colour groups had internal
temperatures <1� warmer on average than ambient
(mean ± SE = 0.65 ± 0.27 and 0.66 ± 0.32), and there
was no detectable difference between blue and white
flowers in their temperature anomalies from ambient
(randomized block ANOVAANOVA, P = 0.99).
We were able to record herbivore damage for 116 of the
original 144 flowers that we marked. The others had
completely senesced prior to re-checking or were entirely
missing, including the flower stem, for unknown reasons.
As in the temperature study, the flowers assigned to the
blue vs. white categories again differed in the reflectance
ratio (randomized block ANOVAANOVA, P < 0.0001). Petal dam-
age was similar between colour classes, regardless of
whether the analysis used all damage levels individually or
lumped them into three categories of no damage, partial
damage or complete damage (likelihood ratio v2 = 2.5245,
d.f. = 2, P = 0.2830). Logistic regression also yielded no
Fig. 5 Dye exported from painted donor flowers in small experi-
mental arrays in 2009 as a function of colour.
Table 4 Split-plot analysis of variance for (A) insect visitation and (B) dye transfer in the large experimental arrays. The effects of
pair and outer colour were tested over the pair · outer colour interaction, which is equivalent to the whole-plot error.
(A) Insect visits to flowers per hour
Bees Flies
Source of variation d.f. MS F P MS F P
Pair 4 22.15 41.19 0.0017 0.45 0.81 0.5764
Outer colour 1 0.77 1.43 0.2984 0.43 0.77 0.4290
Pair · Outer colour 4 0.54 1.50 0.2884 0.55 1.91 0.2015
Inner colour 1 2.17 6.06 0.0392 0.08 0.27 0.6163
Outer colour · Inner colour 1 0.64 1.80 0.2171 0.90 3.14 0.1143
Residual error 8 0.36 0.29
(B) log(Dye export + 1)
Source of variation d.f. MS F P
Pair 3 26.44 242.94 0.0004
Outer colour 1 1.36 12.53 0.0384
Pair · Outer colour 3 0.11 0.15 0.9262
Inner colour 1 0.09 0.12 0.7405
Outer colour · Inner colour 1 0.02 0.02 0.8888
Residual error 6 0.73
Pollinators and selection on Wahlenbergia colour 9
ª 2 0 1 1 T H E A U T H O R S . J . E V O L . B I O L . d o i : 1 0 . 1 1 1 1 / j . 1 4 2 0 - 9 1 0 1 . 2 0 1 1 . 0 2 4 3 0 . x
J O U R N A L O F E V O L U T I O N A R Y B I O L O G Y ª 2 0 1 1 E U R O P E A N S O C I E T Y F O R E V O L U T I O N A R Y B I O L O G Y

effect of the reflectance ratio (measured for both flowers in
18 blocks) on the occurrence of petal damage (v2 = 0.16,
P = 0.6905). Overall, 39% of the flowers in the blue colour
class and 44% of the flowers in the white colour class
received partial or complete petal damage over the 4- to
5-day period.
Discussion
Pollinators as a source of selection on flower colour
The distribution of flower colours in alpine New Zealand
is unusual in the high percentage of white- to pale-
coloured flowers (Mark & Adams, 1993). Like some other
plants in this habitat (e.g. species of Gentiana and Hebe;
Lloyd, 1985), flowers of W. albomarginata are presumed
to have lost the high level of pigmentation that was present
in ancestral relatives. The traditional explanation offered,
including on New Zealand Department of Conservation
(Te Papa Atawhai) signs at the field site, is that the insect
visitors lack colour selectivity entirely (Wardle, 1978) or
that they discriminate against bright blues, purples and
reds, as those colours are largely missing from the habitat
(Heine, 1938). Here, we found that the major pollinators of
W. albomarginata, small solitary bees such as H. matamoko,
do not discriminate against blue petals painted to resemble
those of a congener, W. violacea, and in some circum-
stances even prefer that bright blue. The progenitors of
Hylaeus bees in New Zealand originated from Australia
(Donovan, 2007), just as did the progenitors of Wahlen-
bergia herbs, so this may be a case where ancestral
responses to blue petals have been retained. This behav-
iour, in combination with the higher pollen transfer
observed in mostly blue-flowered arrays, indicates that
pollinator discrimination cannot explain the absence of
bright blue petals in W. albomarginata. Although some flies
did show a preference for white over blue W. albomarginata
flowers, they were only minor contributors to pollination.
In our large arrays, we estimated that 86–97% of pollen
transfer (depending on flower colour) was by bees rather
than flies. Furthermore, pollen export (as estimated with
dyes) correlated highly with bee visitation, but not with fly
visitation. We have shown elsewhere that the Allograpta
flies preferred yellow- over white-painted petals for three
of four plant species on which they were tested (Campbell
et al., 2010). In combination with those earlier results, the
studies reported here also counter the idea that insect
visitors to New Zealand alpine flowers lack colour selec-
tivity entirely.
Responses to flower colour by the bee pollinators
depended on the range of colour variation offered and on
the spatial scale of the manipulation. When presented with
arrays containing natural variation in petal colour, we
detected no colour preference. This apparent absence of
preference was not due to low statistical power, as we
easily detected preference for visiting larger flowers. In
small experimental arrays with a choice between eight
white flowers and eight flowers painted bright blue to
resemble W. violacea, the bees again showed no preference.
Again, we had sufficient statistical power to detect strong
preferences, as we witnessed significant overvisitation of
white flowers by both syrphid flies and tachinid flies in this
experiment. In contrast to the results in small-scale
manipulations, when flower colour was manipulated over
a larger spatial scale, the bees showed a preference for
flowers painted blue to resemble W. violacea. Pollen trans-
fer (as estimated with dyes) was higher overall in the large
arrays with mostly blue flowers than in the large arrays
with mostly white flowers, although it was not higher
specifically from the blue donor flowers in those arrays.
These findings suggest that bee responses to colour are
dependent on the spatial context. At this field site, the bees
would have had no natural experience with that bright
blue and may only have developed a search image for it
when presented with the large patches of 64 flowers,
presumably offering a rich concentration of rewards. This
(a)
(b)
Fig. 6 Insect visitation rates and dye export in large experimental
arrays of painted flowers in 2011. (a) Visits to inner flowers per hour
for bees and flies visiting the four colour combinations. (b) Dye
export on a log-transformed scale. The scale bars on the left indicate
the square root of the mean square error in the split-plot ANOVAANOVA.
10 D. R. CAMPBELL ET AL.
ª 2 0 1 1 T H E A U T H O R S . J . E V O L . B I O L . d o i : 1 0 . 1 1 1 1 / j . 1 4 2 0 - 9 1 0 1 . 2 0 1 1 . 0 2 4 3 0 . x
J O U R N A L O F E V O L U T I O N A R Y B I O L O G Y ª 2 0 1 1 E U R O P E A N S O C I E T Y F O R E V O L U T I O N A R Y B I O L O G Y

dependence on spatial scale indicates the need to consider
the larger spatial context of available flowers when
measuring pollinator preferences (see also Klinkhamer
et al., 2001).
If the major pollinators at this site do not prefer the pale-
coloured petals that are typical of W. albomarginata, then
why does this species not have brighter blue petals? It is
conceivable that flies provide a much greater proportion of
the pollination in some other parts of the species range,
although this is unlikely given their low effectiveness, and
that there is likely gene flow from those other sites. It is also
theoretically possible that even in the absence of innate
preference for white flowers, many of the herb species
have converged on white as a common floral signal.
However, in that case, we could have expected that
pollinators would visit the occasional brightly coloured
flower in an otherwise white patch, but avoid larger
patches of bright blue flowers. Yet, in our experimental
manipulations on the larger spatial scale, neither bees nor
flies preferred the large white arrays over the large blue
ones. We cannot rule out the possibility entirely that
flowers in this habitat have converged on white as a signal,
despite localized preference of H. matamoko for blue- over
white-painted W. albomarginata, Leioproctus bees for yel-
low- over white-painted Brachyglottis bellidioides and
Allograpta flies for yellow- over white-painted Ourisia
glandulosa (Campbell et al., 2010), but, if so, the process
would have to work on an even larger spatial scale than we
were able to investigate here.
One final hypothesis that could involve pollinators is
that they would be preferentially attracted to white
flowers because of stronger reflectance of long wave-
lengths, heating the interior of the flower and the insect
and possibly increasing pollen germination (McKee &
Richards, 1998). For example, the interior temperature is
higher in the white morph compared with the blue morph
of an alpine species of Gentiana on the Qinghai-Tibetan
Plateau (Mu et al., 2010), although in other cases darker
coloured flowers are more efficient at raising internal
flower temperature (McKee & Richards, 1998). We found
no detectable difference in floral temperature associated
with the natural range of flower colour and no preference
of the major pollinators for white flowers anyway. Thus,
this hypothesis is not supported for W. albomarginata,
perhaps not surprisingly given its relatively open flower.
One remaining potential agent of direct selection on flower
colour would be floral herbivores, but again we detected
no association of florivory with flower colour.
Indirect selection vs. pollinator-mediated selection
Ratherthanbeingmaintainedbyinsectpollinators, it seems
likely that the white or pale petals in W. albomarginata
are maintained by indirect selection on correlated
characters. Although our study, with its reliance on
phenotypic manipulations, was designed to examine
the direct selection on flower colour, and primarily the
hypothesis that pollinators select on flower colour,
there are other hypotheses involving indirect selection
mediated by pleiotropic effects of colour genes on other
traits. At this point, we do not know the extent to which
the intraspecific variation in flower colour is genetic vs.
environmental; however, the species difference between
W. albomarginata and W. violacea is presumably genetic,
suggesting that a loss-of-function mutation or downre-
gulation has occurred in W. albomarginata. The pigment
that produces the petal colour is an anthocyanin with
cyanidin indicated by thin-layer chromatography as
the core anthocyanidin (J. Lord, personal observation).
The anthocyanin biosynthesis pathway is controlled by
the expression of six major structural loci (Holton &
Cornish, 1995), so the potential cost savings for other
functions of downregulating pigment production might
depend on how early in the pathway a loss-of-function
mutation has occurred. In many plant species, there are
pleiotropic effects on flower pigmentation and pigmen-
tation in the vegetative stem or leaves (Armbruster,
2002); however, expression levels of a key gene in the
pathway, chalcone synthase, were decoupled in the
petals and leaves of Parrya nudicaulis (Dick et al., 2011).
In several cases reviewed by Strauss & Whittall (2006),
morphs that produced more anthocyanins or were more
brightly coloured had leaves that were better defended
against vegetative herbivores.
In addition to affecting leaf herbivores, the production
of anthocyanins can affect physiological properties of
the plant. Anthocynanins are involved in multiple
stress-related processes, including drought and heat
tolerance, and protection from photoinhibition (Gould,
2004). In other species, anthocyanin production has
increased fitness under drought conditions (Schemske &
Bierzychudek, 2001), sometimes trading off with lower
fitness under well-watered conditions (Warren &
Mackenzie, 2001), suggesting that there is a cost under
wet conditions of producing the floral pigment. Antho-
cyanin pigments have also been reported to increase the
tolerance to both heat and cold stress. White mutants in
Ipomoea purpurea produced by a mutation at the first step of
the anthocyanin biosynthesis pathway showed poor
tolerance to heat stress (Coberly & Rausher, 2003),
whereas white mutants in an arctic mustard were more
common in cold climates (Dick et al., 2011). In the case of
W. albomarginata and other high-elevation New Zealand
species, the radiation of a clade into a novel environment
might have altered the selective advantage of anthocyanin
production. If tolerance to the heat stress that would be
more common at low elevations is lost in white-flowered
individuals, or if there is a greater cost to producing the
pigment under relatively mesic conditions in the alpine,
such physiological responses could provide hypotheses for
why Australian species and lowland species in New
Zealand can be more brightly coloured than those in the
New Zealand alpine. These potential scenarios for indi-
rect selection mediated by environmental stress or by
Pollinators and selection on Wahlenbergia colour 11
ª 2 0 1 1 T H E A U T H O R S . J . E V O L . B I O L . d o i : 1 0 . 1 1 1 1 / j . 1 4 2 0 - 9 1 0 1 . 2 0 1 1 . 0 2 4 3 0 . x
J O U R N A L O F E V O L U T I O N A R Y B I O L O G Y ª 2 0 1 1 E U R O P E A N S O C I E T Y F O R E V O L U T I O N A R Y B I O L O G Y

vegetative herbivores warrant further investigation in
New Zealand Wahlenbergia as well as other plants.
One way to test for the effect of a particular agent of
selection is to manipulate both the environmental source
of selection and the trait (in this case flower colour; Wade &
Kalisz, 1990). We are now completing such an experiment
with pollination in W. albomarginata, using two extremes
of intraspecific variation in colour to produce two colour
classes crossed with three experimental levels of pollen
supply. To explain the absence of bright blue in species at
high elevation in comparison with low elevation, it would
be valuable to repeat such manipulative studies at a variety
of elevations. Such studies would allow investigating
whether selection by pollinators in favour of blue is even
stronger at lower elevation in the genus Wahlenbergia and
whether there is indirect selection through effects on
herbivores, heat tolerance or other physiological aspects
that may be advantageous at low elevation but not at high
elevation. Our results support the need to consider
hypotheses other than pollinator behaviour (Strauss &
Whittall, 2006) as drivers of flower colour evolution in the
New Zealand alpine, particularly those involving indirect
selection of other characters.
Acknowledgments
This research was partly supported by grant 8621-09
from the Committee for Research and Exploration of
the National Geographic Society and contract
CO9X0503 from the New Zealand Public Good Science
Fund. We are grateful for the field assistance of Mary
Price, Maria Minor, and Nickolas Waser and the
postgraduate students who helped during a field class
held while the first author was a Fulbright Specialist in
Environmental Sciences at Otago University. Mary
Anne Miller and Vickey Tomlinson assisted with
arrangements for supplies. NZ Ski Ltd. provided space
for housing and laboratory work on the mountain. Two
anonymous reviewers provided helpful comments on
the manuscript.
References
Armbruster, W. 2002. Can indirect selection and genetic context
contribute to trait diversification? A transition-probability
study of blossom-colour evolution in two genera. J. Evol. Biol.
15: 468–486.
Bischoff, M. 2008. Pollination Ecology of the New Zealand Alpine
Flora. Vol. Doctor of Natural Sciences, pp. 153. University of
Heidelberg, Heidelberg, Germany.
Bradshaw, H.D. Jr & Schemske, D.W. 2003. Allele substitution at
a flower colour locus produces a pollinator shift in monkey-
flowers. Nature 426: 176–178.
Briscoe, A. & Chittka, L. 2001. The evolution of color vision in
insects. Annu. Rev. Entomol. 46: 471–510.
Campbell, D.R. 1985. Pollen and gene dispersal: the influences
of competition for pollination. Evolution 39: 418–431.
Campbell, D.R. 1989. Measurements of selection in a hermaph-
roditic plant: variation in male and female pollination success.
Evolution 43: 318–334.
Campbell, D., Waser, N. & Melendez-Ackerman, E. 1997.
Analyzing pollinator-mediated selection in a plant hybrid
zone: hummingbird visitation patterns on three spatial scales.
Am. Nat. 149: 295–315.
Campbell, D.R., Bischoff, M., Lord, J. & Robertson, A. 2010.
Flower color influences insect visitation in alpine New
Zealand. Ecology 91: 2638–2649.
Caruso, C.M., Scott, S.L., Wray, J.C. & Walsh, C.A. 2010.
Pollinators, herbivores, and the maintenance of flower color
variation: a case study with Lobelia siphilitica. Int. J. Plant Sci.
171: 1020–1028.
Chittka, L. & Kevan, P.G. 2005. Advertisement in flowers. In:
Practical Pollination Biology (A. Dafni, P.G. Kevan & B.C.
Husband, eds), pp. 157–196. Enviroquest Ltd, Cambridge,
Ontario, Canada.
Clements, F.E. & Long, F.L. 1923. Experimental Pollination: An
Outline of the Ecology of Flowers and Insects. Carnegie Institute,
Washington D.C.
Coberly, L.C. & Rausher, M.C. 2003. Analysis of a chalcone
synthase mutant in Ipomoea purpurea reveals a novel function
for flavonoids: amelioration of heat stress. Mol. Ecol. 2003:
1113–1124.
Darwin, C. 1862. On the Various Contrivances by Which British and
Foreign Orchids are Fertilised by Insects, and on the Good Effects of
Intercrossing. John Murray, London.
Dick, C.A., Buenrostro, J., Butler, T., Carlson, M.L., Kliebenstein,
D.J. & Whittall, J.B. 2011. Arctic mustard flower color
polymorphism controlled by petal-specific down-regulation at
the threshold of the anthocyanin biosynthetic pathway. PLoS
ONE 6: e18230.
Donovan, B.J. 2007. Apoidea (Insecta: Hymenoptera). Fauna of New
Zealand 57. Manaaki Whenua Press, Lincoln, New Zealand.
Dudash, M.R. 1991. Plant size effects on female and male function
in hermaphroditic Sabatia angularis. Ecology 72: 1004–1012.
Dudash, M.R., Hassler, C., Stevens, P.M. & Fenster, C.B. 2011.
Experimental floral and inflorescence trait manipulations
affect pollinator preference and function in a hummingbird-
pollinated plant. Am. J. Bot. 98: 275–282.
Dyer, A.G. & Chittka, L. 2004. Fine colour discrimination
requires differential conditioning in bumblebees. Naturwis-
senschaften 91: 224–227.
Endress, P.K. 2011. Evolutionary diversification of the flowers in
angiosperms. Am. J. Bot. 98: 370–396.
Engel, E. & Irwin, R. 2003. Linking pollinator visitation rate and
pollen receipt. Am. J. Bot. 90: 1612–1618.
Faegri, K. & van der Pijl, L. 1966. The Principles of Pollination
Ecology. Pergamon, Oxford.
Fenster, C.B., Armbruster, W.S., Wilson, P., Dudash, M.R. &
Thomson, J.D. 2004. Pollination syndromes and floral
specialization. Ann. Rev. Ecol. Evol. Syst. 35: 375–403.
Frey, F. 2004. Opposing natural selection from herbivores and
pathogens may maintain floral-color variation in Claytonia
virginica (Portulacaceae). Evolution 58: 2426–2437.
Galen, C. 1992. Pollen dispersal dynamics in an alpine wild-
flower, Polemonium viscosum. Evolution 46: 1043–1051.
Galen, C. 2006. Solar furnaces or swamp coolers: costs and
benefits of water use by solar-tracking flowers of the alpine
snow buttercup, Ranunculus adoneus. Oecologia 148: 195–201.
12 D. R. CAMPBELL ET AL.
ª 2 0 1 1 T H E A U T H O R S . J . E V O L . B I O L . d o i : 1 0 . 1 1 1 1 / j . 1 4 2 0 - 9 1 0 1 . 2 0 1 1 . 0 2 4 3 0 . x
J O U R N A L O F E V O L U T I O N A R Y B I O L O G Y ª 2 0 1 1 E U R O P E A N S O C I E T Y F O R E V O L U T I O N A R Y B I O L O G Y
Godley, E.J. 1979. Flower biology in New Zealand. N. Z. J. Bot.
17: 441–466.
Gould, K.S. 2004. Nature’s Swiss army knife: the diverse
protective roles of anthocyanins in leaves. J. Biomed. Biotechnol.
5: 314–320.
Harder, L. & Johnson, S.D. 2009. Darwin’s beautiful contriv-
ances: evolutionary and functional evidence for floral adap-
tation. New Phytol. 183: 530–545.
Heine, E.M. 1938. Observations on the pollination of New
Zealand flowering plants. Trans. R. Soc. NZ 67: 133–148.
Holton, T.A. & Cornish, E.C. 1995. Genetics and biochemistry of
anthocyanin biosynthesis. Plant Cell 7: 1071–1083.
Klinkhamer, P.G.L., de Jong, T.J. & Linnebank, L.A. 2001.
Small-scale spatial patterns determine ecological relationships:
an experimental example using nectar production rates. Ecol.
Lett. 4: 559–567.
Lacey, E. & Herr, D. 2005. Phenotypic plasticity, parental effects,
and parental care in plants? I. An examination of spike
reflectance in Plantago lanceolata (Plantaginaceae). Am. J. Bot.
92: 920–930.
Lande, R. & Arnold, S.J. 1983. The measurement of selection on
correlated characters. Evolution 37: 1210–1226.
Leiss, K.A. & Klinkhamer, P.G.L. 2005. Spatial distribution of
nectar production in a natural Echium vulgare population:
implications for pollinator behaviour. Basic Appl Ecol 6: 317–
324.
Lloyd, D.G. 1985. Progress in understanding the natural history
of New Zealand plants. N. Z. J. Bot. 23: 707–722.
Lloyd, D.G. & Yates, J.M.A. 1982. Intrasexual selection and the
segregation of pollen and stigmas in hermaphrodite plants,
exemplified by Wahlenbergia albomarginata (Campanulaceae).
Evolution 36: 903–913.
Mark, A.F. & Adams, N.M. 1993. New Zealand Alpine Plants, 3rd
edn. AH & AW Reed Ltd., Wellington, New Zealand.
McKee, J. & Richards, A.J. 1998. Effect of flower structure and
flower colour on intrafloral warming and pollen germination
and pollen-tube growth in winter flowering Crocus L. (Irida-
ceae). Bot. J. Linn. Soc. 128: 369–384.
Melendez-Ackerman, E.J. & Campbell, D.R. 1998. Adaptive
significance of flower color and inter-trait correlations in an
Ipomopsis hybrid zone. Evolution 52: 1293–1303.
Melendez-Ackerman, E.J., Campbell, D.R. & Waser, N.M. 1997.
Hummingbird behavior and mechanisms of selection on
flower color in Ipomopsis. Ecology 78: 2532–2541.
Menzel, R. 1979. Behavioural access to short-term memory in
bees. Nature 281: 368–369.
Mitchell, W. 1989. Informational constraints on optimally
foraging hummingbirds. Oikos 55: 145–154.
Mitchell-Olds, T. & Shaw, R.G. 1987. Regression analysis of
natural selection: statistical inference and biological interpre-
tation. Evolution 41: 1149–1161.
Mu, J., Li, G. & Sun, S. 2010. Petal color, flower temperature,
and behavior in an alpine annual herb, Gentiana leucomelaena
(Gentianaceae). Arct. Antarct. Alp. Res. 42: 219–226.
Peter, C.I. & Johnson, S.D. 2008. Mimics and magnets: the
importance of color and ecological facilitation in floral decep-
tion. Ecology 89: 1583–1595.
Phillips, P.C. & Arnold, S.J. 1989. Visualizing multivariate
selection. Evolution 43: 1209–1222.
Prebble, J.M. 2010. The Evolution of Wahlenbergia (Campanula-
ceae) in Australasia. MSc thesis, Victoria University, Wellington.
Price, M.V., Waser, N.M., Irwin, R.E., Campbell, D.R. & Brody,
A.K. 2005. Temporal and spatial variation in pollination of a
montane herb: a seven-year study. Ecology 86: 2106–2116.
Raine, N.E. & Chittka, L. 2007. The adaptive significance of
sensory bias in a foraging context: floral colour preferences in
the bumblebee Bombus terrestris. PLoS ONE 2: e556.
Rausher, M. 2008. Evolutionary transitions in floral color. Int. J.
Plant Sci. 169: 7–21.
Schemske, D.W. & Bierzychudek, P. 2001. Perspective: evolu-
tion of flower color in the desert annual Linanthus parryae:
Wright revisited. Evolution 55: 1269–1282.
Strauss, S.Y. & Whittall, J.B. 2006. Non-pollinator agents of
selection on floral traits. In: Ecology and Evolution of Flowers (L.
Harder & S. Barrett, eds), pp. 120–138. Oxford University
Press, Oxford.
Wade, M.J. & Kalisz, S. 1990. The causes of natural selection.
Evolution 44: 1947–1955.
Wardle, P. 1978. Origin of the New Zealand mountain flora,
with special reference to trans-Tasman relationships. N. Z. J.
Bot. 16: 535–550.
Warren, J. & Mackenzie, S. 2001. Why are all colour combina-
tions not equally represented as flower-colour polymor-
phisms? New Phytol. 151: 237–241.
Waser, N.M. & Price, M.V. 1981. Pollinator choice and stabilizing
selection for flower color in Delphinium nelsonii. Evolution 35:
376–390.
Waser, N.M. & Price, M.V. 1983. Pollinator behavior and natural
selection for flower colour in Delphinium nelsonii. Nature 302:
422–424.
Whittall, J.B., Voelckel, C., Kliebenstein, D.J. & Hodges, S.A.
2006. Convergence, constraint and the role of gene expression
during adaptive radiation: floral anthocyanins in Aquilegia.
Mol. Ecol. 15: 4645–4657.
Young, H.J. & Stanton, M.L. 1990. Influences of floral variation on
pollen removal and seed production in wild radish. Ecology 71:
536–547.
Supporting information
Additional Supporting Information may be found in the
online version of this article:
Appendix S1 Colour plate showing (A) Wahlenbergia
albomarginata growing in the field, (B) a tachinid fly
visiting a manipulated flower within an experimental
array, (C) an unusually white flower of W. albomarginata,
(D) an unusually blue flower of W. albomarginata, (E)
close up of the colletid bee Hylaeus matamoko on a petal of
W. albomarginata painted to resemble W. violacea, and (F)
a flower of W. violacea.
As a service to our authors and readers, this journal
provides supporting information supplied by the authors.
Such materials are peer-reviewed and may be re-
organized for online delivery, but are not copy-edited
or typeset. Technical support issues arising from support-
ing information (other than missing files) should be
addressed to the authors.
Received 23 August 2011; revised 21 October 2011; accepted 26 October
2011
Pollinators and selection on Wahlenbergia colour 13
ª 2 0 1 1 T H E A U T H O R S . J . E V O L . B I O L . d o i : 1 0 . 1 1 1 1 / j . 1 4 2 0 - 9 1 0 1 . 2 0 1 1 . 0 2 4 3 0 . x
J O U R N A L O F E V O L U T I O N A R Y B I O L O G Y ª 2 0 1 1 E U R O P E A N S O C I E T Y F O R E V O L U T I O N A R Y B I O L O G Y