What Teachers and Students Think about Medical and Dental Admission Test Conducted by ETEA, NWFP,...
184
JOURNAL OF EDUCATIONAL RESEARCH (Vol.12, No.1) 2009 Dept Of Education IUB, Pakistan ISSN 1027-9776 JOURNAL OF EDUCATIONAL RESEARCH Vol. 12 No. 1 2009 DEPARTMENT OF EDUCATION The Islamia University of Bahawalpur PAKISTAN
-
Upload
independent -
Category
Documents
-
view
0 -
download
0
Transcript of What Teachers and Students Think about Medical and Dental Admission Test Conducted by ETEA, NWFP,...

JOURNAL OF EDUCATIONAL RESEARCH (Vol.12, No.1) 2009 Dept Of Education IUB,
Pakistan
ISSN 1027-9776
JOURNAL OF EDUCATIONAL RESEARCH
Vol. 12 No. 1 2009
DEPARTMENT OF EDUCATION
The Islamia University of Bahawalpur PAKISTAN

JOURNAL OF EDUCATIONAL RESEARCH (Vol.12, No.1) 2009 Dept Of Education IUB,
Pakistan
DEPARTMENT OF EDUCATION The Islamia University of Bahawalpur
PAKISTAN
JOURNAL OF EDUCATIONAL
RESEARCH
Vol.12 No. 1 2009
PATRON Professor Dr. Belal A. Khan
Vice Chancellor
Chief Editor Professor Dr. Muhammad Aslam
Adeeb
Dean Faculty of Education
Note
Views expressed in the articles of this journal are of authors and do not reflect the views of the Journal of Educational Research.
SUBSCRIPTION
Annual Rs. 200/- Single Copy Rs. 100/- Special Issue Rs. 150/-
FOREIGN
Individuals US $ 15.00 Annual Libraries and US $ 10.00 Single copy Institutions US $ 12.00 Special Issue US $ 10.00

JOURNAL OF EDUCATIONAL RESEARCH (Vol.12, No.1) 2009 Dept Of Education IUB,
Pakistan
1
EDITORIAL/ ADVISORY BOARD 1. Professor Dr. G.K.Verma
Professor Emeritus, University of Manchester, UK
2. Professor Dr.William Bill Gulam Salford University, Manchester, UK
3. Professor Dr. Muhammad Rashid
Dean, Faculty of Education, Preston University, Islamabad 4. Professor Dr. Harald Husemann
Department of Education, Osnabrueck University, Germany
5. Professor Dr. Zafar Iqbal Chairman, Department of EPM Faculty of Education, AIOU, Islamabad
6. Professor Dr.Aytekin Isman Dean, Faculty Education, Sakarya University, Turkey
7. Dr. Badrul Khan
Facilitator in E- Learning, Instructional Design and Technologies McWeadon University, Springfield, USA
8. Professor Dr. Ugur Demiray
Dean, Faculty of Communication Sciences Anadolu University, Eskisehir, Turkey
9. Dr.Joy Mylek
Consultant, The Open Polytechnic of New Zealand 10. Professor Dr. Paul Kawachi Kurume City Fukuoka -830-0003 Japan 11. Professor Dr. Ahmad Farooq Mashadi
Department of Education, BZU Multan 12. Dr.Irshad Hussain
Department of Education, The Islamia University of Bahawalpur
13. Professor Dr. Ibrahim Khalid University of Education Lahore

JOURNAL OF EDUCATIONAL RESEARCH (Vol.12, No.1) 2009 Dept Of Education IUB,
Pakistan
2
JOURNAL OF EDUCATIONAL RESEARCH
Vol.12 No. 1 2009
CONTENTS
PAGE
NO. Assessing the School Readiness of Children in Jordan Suha M. Al-Hassan
Jennifer E. Lansford 4-17
Assessing the Difficulty Index of Course Materials in National Open University of Nigeria Inegbedion, Juliet O.
18-35
Analysis of In-Service Training Programme for NFBE Community School Teachers in Punjab Muhammad Ashraf Malik
Prof. Muhammad Aslam Adeeb
Dr.Irshad Hussain
36-49
What Teachers and Students Think about Medical and Dental Admission Test Conducted by ETEA, NWFP, Pakistan Arshad Ali
Dr. Umar Ali
Lubna Aziz
50-65
Assessment of High School Teacher Burnout Using the Teacher Burnout Inventory (TBI) in the USA and Iran Ahmadi, G.R.
Esmat Bastan
Yousefi, A.R.
66-77
Comparative Study of Teaching Skills of In-Service Teachers Trained Through Regular and Distance Mode Anupama Bhargava
78-93
Impact of Organizational Behaviour on the Performance of Teachers Dr Naveed Sultana
94-102

JOURNAL OF EDUCATIONAL RESEARCH (Vol.12, No.1) 2009 Dept Of Education IUB,
Pakistan
3
A Study of Secondary School Principals' Mental Health in Relation to their Biographical Variables Saeid Farahbakhsh
103-114
Role of Education in Utilization of Micro-Credit in Poverty Alleviation in Lahore Muhammad Yasser Mustafa
Mustajab Ahmad
Nowshad Khan
Mariyam Mustafa Butt
115-121
A Study of the Impact of Social Mobilization at the Stage of Primary Education in Rural Areas of Punjab Prof. Dr. Ahmad Farooq Shah
Muhammad Aqeel Raza
122-131
Being Vital: A Function of Big Five Personality Traits Dr. Sarwat Sultan
132-140
Effectiveness of Non-formal Education Through the use of Instructional Media Dr. Muhammad Rashid
141-158
Events of Instruction and its Effects on the Achievements of Students Dr Nabi Bux Jumani,
Shahinshah Babar Khan
159-169
Parenting and Children’s Academic Performance: Connections and Consequences Fouzia Janjua
Samina Malik
170-180

JOURNAL OF EDUCATIONAL RESEARCH (Vol.12, No.1) 2009 Dept Of Education IUB,
Pakistan
4
Assessing the School Readiness of Children in Jordan
*Suha M. Al-Hassan †Jennifer E. Lansford
Abstract
In 2003, Jordan initiated a period of education reform, one component of
which was an effort to improve readiness for first grade by opening public
kindergartens. This study had three goals: (a) To describe the school
readiness of Jordanian children; (b) To compare the first grade readiness
of children who had and had not attended kindergarten; and (c) To
compare the 2004 and 2007 readiness of children in areas that instituted
kindergartens during that time period. Trained observers directly assessed
4,681 children’s readiness, and teachers reported on children’s social skills
and behavioral readiness. At least 80% of children were rated as being
almost or fully ready for first grade in each assessed domain. Children who
had attended kindergarten were more ready for first grade than those
children who had not attended kindergarten. In communities with newly
established kindergartens, children were more ready for first grade in 2007
than in 2004.
Keywords: School Readiness, Dynamic, Children Development, Nurturing, Elementary Schools
Introduction During the dynamic years from age one to five, children developed a sense of themselves in relation to family and community. They are exploring the world through play and seemingly endless questions that require caregivers’ validating responses. They are ready to learn a healthy lifestyle from powerful adult role models with which they are strongly identified. The quality of nurturing and stimulation that a child receives in the first few years of life can have effects on development that lasts lifetime (Shonkoff & Phillips, 2000). Although the importance of early experience in shaping school readiness and the importance of school readiness in setting the stage
* Queen Rania Faculty for Childhood, The Hashemite University, Zarqa, Jordan † Duke University, Durham, NC, USA

JOURNAL OF EDUCATIONAL RESEARCH (Vol.12, No.1) 2009 Dept Of Education IUB,
Pakistan
5
for future success in school are well documented in the literature, most of this research has been conducted using North American samples. Much of this research has examined how particular preschool experiences (e.g., attending the American Head Start program) are related to students’ school readiness (e.g., Henry, Gordon, & Rickman, 2006). A limitation of this research is that it does not document how to prepare children for school in other countries. This Research does not consider how well programs are working in other countries for preparing their respective children for school. To address these limitations, we sought to document the school readiness of Jordanian children in relation to a major education reform currently underway in Jordan: the implementation of public kindergartens. This education reform afforded an important opportunity to evaluate whether school readiness improved over time and again in communities; where public kindergartens were implemented and whether children who attended kindergarten had higher levels of school readiness in first grade than did children who did not attend kindergarten.
School Readiness
Quality in early education experiences in families, child care, preschool, and early elementary settings help prepare children to succeed later in school (Meisels, 1999; National Research Council, 2001; Shonkoff & Phillips, 2000). Pianta (2002) has described school readiness as a multifaceted, complex, and systemic combination of children’s experiences and resources at home, experiences and resources in childcare and preschool settings attended by the child, community resources that support high-quality parenting and child care, the extent to which the elementary school is well linked to these family and child care resources, and the degree to which classroom experiences provided for children in kindergarten and first grade effectively build on competencies they bring to school (see also Love, Aber, & Brooks-Gunn, 1992; Meisels, 1999; Pianta & Walsh, 1996). All of these experiences prepare a child (or not) to be ready for school in a number of different social, behavioral, cognitive, emotional, and physical domains.

JOURNAL OF EDUCATIONAL RESEARCH (Vol.12, No.1) 2009 Dept Of Education IUB,
Pakistan
6
Comprehensive efforts to promote school readiness require an adequate understanding and assessment of children’s skills (Meisels, 1999). Such assessments, when repeated at regular intervals over time and again, are like taking the temperature of the community with regard to its efforts to enhance children’s development (Love et al., 1992). Attention to school readiness, in particular, is based on the literature showing when children demonstrate or fail to demonstrate certain skills early in their school careers; they are more or less likely to succeed later in school (Entwisle & Alexander, 1999; Pianta & McCoy, 1997). School readiness includes several dimensions. For example, children must be physically ready for school (Sassu, 2007); this dimension includes children’s health status, growth, and disabilities as well as gross and fine motor skills. Children must also be socially and emotionally ready for school (Webster-Stratton, Reid, & Stoolmiller, 2008). Readiness in this domain includes social skills such as the ability to take turns and to cooperate, the ability to understand the emotions of other people, and the ability to interpret and express one’s own feelings. Approaches to learning, including enthusiasm, curiosity, and persistence on tasks, are also critical to school readiness (Denham, 2006). Language development is another important domain for school readiness (Lunkenheimer et al., 2008). This dimension includes both verbal language (e.g., listening, speaking, vocabulary) and emerging literacy (e.g., print awareness, understanding the components of stories, representing ideas through drawing, letter-like shapes, or letters). Cognition and general knowledge are also important dimensions of school readiness (La Paro & Pianta, 2000; Scott-Little, Kagan, & Frelow, 2006). This includes academic knowledge such as shapes, spatial relations, and number concepts as well as knowledge about social conventions. Education in Jordan
Although many elements of school readiness are likely to be similar across cultural contexts, education systems themselves are largely dependent on national and local policies and practices. In Jordan, first grade is mandatory, but it is not necessary in kindergarten. Until recently, kindergartens were either not available to most children or were available only in the private rather than public sector. However, Jordan is now in a period of education reform. Since 2003, the
JOURNAL OF EDUCATIONAL RESEARCH (Vol.12, No.1) 2009 Dept Of Education IUB,
Pakistan
7
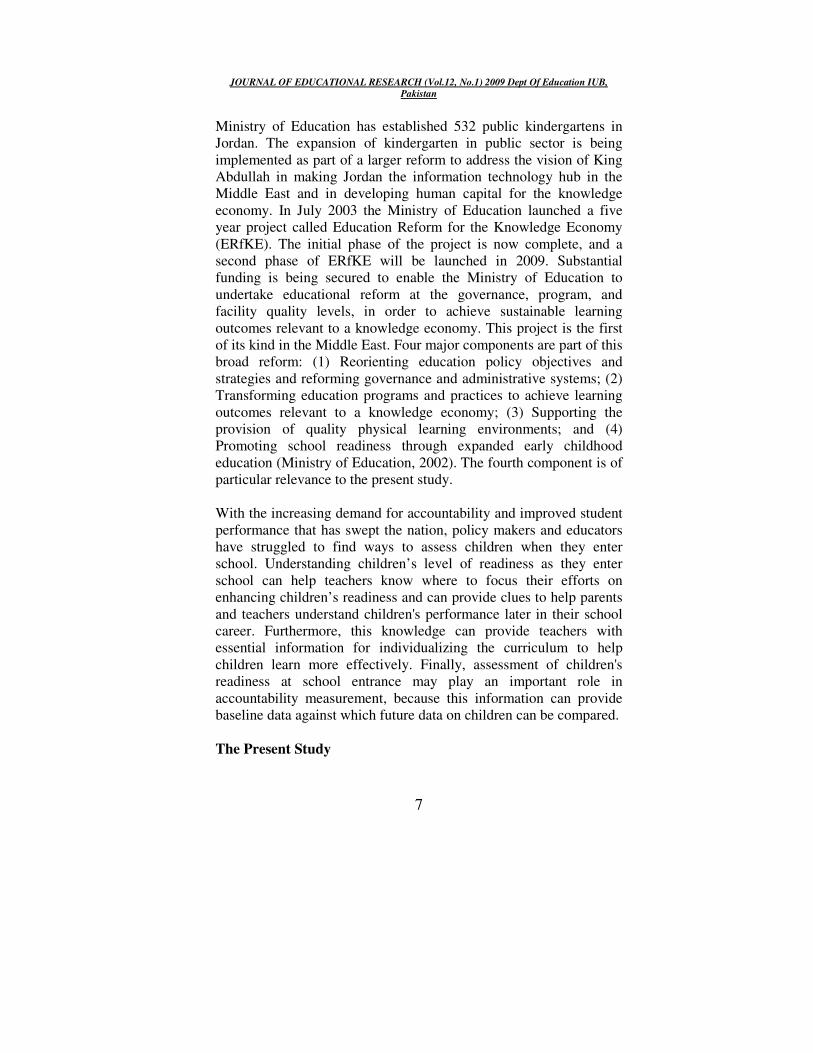
Ministry of Education has established 532 public kindergartens in Jordan. The expansion of kindergarten in public sector is being implemented as part of a larger reform to address the vision of King Abdullah in making Jordan the information technology hub in the Middle East and in developing human capital for the knowledge economy. In July 2003 the Ministry of Education launched a five year project called Education Reform for the Knowledge Economy (ERfKE). The initial phase of the project is now complete, and a second phase of ERfKE will be launched in 2009. Substantial funding is being secured to enable the Ministry of Education to undertake educational reform at the governance, program, and facility quality levels, in order to achieve sustainable learning outcomes relevant to a knowledge economy. This project is the first of its kind in the Middle East. Four major components are part of this broad reform: (1) Reorienting education policy objectives and strategies and reforming governance and administrative systems; (2) Transforming education programs and practices to achieve learning outcomes relevant to a knowledge economy; (3) Supporting the provision of quality physical learning environments; and (4) Promoting school readiness through expanded early childhood education (Ministry of Education, 2002). The fourth component is of particular relevance to the present study. With the increasing demand for accountability and improved student performance that has swept the nation, policy makers and educators have struggled to find ways to assess children when they enter school. Understanding children’s level of readiness as they enter school can help teachers know where to focus their efforts on enhancing children’s readiness and can provide clues to help parents and teachers understand children's performance later in their school career. Furthermore, this knowledge can provide teachers with essential information for individualizing the curriculum to help children learn more effectively. Finally, assessment of children's readiness at school entrance may play an important role in accountability measurement, because this information can provide baseline data against which future data on children can be compared. The Present Study

JOURNAL OF EDUCATIONAL RESEARCH (Vol.12, No.1) 2009 Dept Of Education IUB,
Pakistan
8
The long-term objective behind the present work is to launch a standard for national assessment of school readiness in order to assess the efficacy of national and community-based interventions and social policies aimed at improving early childhood outcomes in Jordan. This involves the measurement of early childhood outcomes over time to identify areas of strengths and weaknesses. The short-term objective was to assess the school readiness of Jordanian children in five key domains: social skills and behavior, awareness of self and environment, cognitive skills, language and communication skills, and physical development. The present study had three specific goals: (a) To describe the school readiness of Jordanian children in the five domains; (b) To compare the first grade school readiness of children who had and had not attended kindergarten; and (c) To compare the 2004 and 2007 school readiness of children in areas that instituted public kindergartens during that time period. Consistent with a large body of research attesting to the importance of early childhood programs in enhancing school readiness (e.g., Gilliam & Zigler, 2000), we hypothesized that children who had attended kindergarten would have higher levels of school readiness than would children who had not attended kindergarten. We hypothesized that children would have higher levels of school readiness in 2007 than in 2004 in communities that instituted public kindergartens across that time period. Method
Participants
The present sample included 4,681 grade one students (46% girls, 54% boys) who were identified by the National Center for Human Resources Development (NCHRD) from the Ministry of Education's database. Most of the sample (n = 3,657) was selected to represent the national population. A nationally representative stratified random sample of 144 schools from a defined population of schools with first grade enrolment of more than 9 children was selected. Twenty-four children were selected from each school that had 24 or more grade one children. The remainder of the sample (n = 1,024) was a stratified over-sample that was selected from 47 schools where public kindergartens were newly established as part of the national education reform; these schools served several towns, were located

JOURNAL OF EDUCATIONAL RESEARCH (Vol.12, No.1) 2009 Dept Of Education IUB,
Pakistan
9
in rural poor areas, and were not previously served by the public sector. Procedure and Measures Data were collected by 63 field researchers at the Ministry of Education. They were chosen by the directorate of Early Childhood Education at the Ministry of Education as qualified personnel to carry out research. All of them had a university degree in education or a related field. In addition, they had specialized training in early childhood education and participated in a workshop that was held in the NCHRD for the purpose of preparing them for the research tasks. Each field researcher was assigned a number of schools and was trained how to select the sample. In schools where there was more than one section of first grade, one section was randomly selected. In the sections where there were more than 24 students, 24 students were randomly selected. In small schools where there were fewer than 24 students in first grade, all of the students were selected. In first grades where there were both genders, approximately equal numbers of males and females were selected. The instrument that was used in this research was developed in Canada as part of a five-year research project called Understanding the Early Years (UEY). The Early Development Instrument used in UEY (Janus & Offord, 2007) was adapted and validated with Jordanian children, resulting in the Early Years Evaluation Tool (EYE). The EYE assessment/evaluation tool has been identified as a useful measure in cross-cultural comparisons of developing countries. The World Bank intends to use the EYE in developing countries to compare children’s readiness to enter school; countries in the first phase of the World Bank’s work are Jordan, India, and Turkey. The EYE assesses children’s performance in five domains: Social Skills and Behavior, Awareness of Self and Environment, Cognitive Skills, Language and Communication, and Physical Development.
The tool is composed of a total of 49 items (α = .94) distributed among the domains as follows: (a) 14 items in the social skills and
behavior domain (α = .93); (b) 9 items in the awareness of self and
environment domain (α = .81); (c) 12 items in the cognitive skills

JOURNAL OF EDUCATIONAL RESEARCH (Vol.12, No.1) 2009 Dept Of Education IUB,
Pakistan
10
domain (α = .85); (d) 7 items in the language and communication
domain (α = .80); and (e) 7 items in the physical development
domain (α = .72). In the social skills and behavior domain, each item was rated by teachers on a 4-point scale with 1 = This trait is never present and has not been observed, 2 = This trait is seldom present and rarely observed, 3 = This trait is frequently present and is usually observed, or 4 = This trait is consistently present and is always observed. In the remaining domains, a trained researcher observed the child’s performance on specific tasks and rated the child’s performance on each item with 1 = Child is unable to do this and appears not to have any of the skills required for this task, 2 = Child has some of the skills required for this task but was unable to do it at this time, 3 = Child can do this partially but not consistently. It appears that he/she will soon master this task, 4 = Child can do this confidently and consistently; It is clear that he/she could do it correctly whenever asked. Scale averages in each domain and for the total measure were used in analyses. On the basis of the teacher and observer ratings, four levels of school readiness were defined. Level 1 (mean score < 1.5) indicated that children were developing readiness slowly and were not yet ready for school; the skills, knowledge, or behaviors necessary for readiness were absent or rarely demonstrated by children at this level. Level 2 (mean score ≥ 1.5 and < 2.5) indicated that children were approaching readiness; skills, knowledge, or behaviors were emerging but not yet demonstrated consistently. Level 3 (mean score ≥ 2.5 and < 3.5) indicated that children were ready for school and almost proficient; the skills, knowledge, or behaviors were partially demonstrated, and children were on the verge of mastery. Level 4 (mean score ≥ 3.5) indicated that children were fully ready for school and proficient; the skills, knowledge, or behaviors were firmly within the children’s range of performance. Results Table 1 shows the percent of children who were classified at each level of school readiness overall and for each of the five subdomains. It is notable that in every domain, at least 80% of children were deemed to be at Level 3 or higher, indicating that they were almost

JOURNAL OF EDUCATIONAL RESEARCH (Vol.12, No.1) 2009 Dept Of Education IUB,
Pakistan
11
ready or fully ready for school. Less than 2% of children were classified in the not ready category for all five domains. As shown in Table 1, overall 39.7% of children can be described as fully ready for school, and 54.2% can be described as almost ready for school. Six percent of the children were emerging in readiness, and only .2% of the children were not ready for school. Table 1 also summarizes Jordanian children’s school readiness in five specific domains. With respect to social skills and behavior, 45% of Jordanian children are almost ready for school, and 43.1% are fully ready for school. In terms of awareness of self and environment, 43.2% of the children are almost ready for school, and 44.4% are fully ready for school. For cognitive skills, 41.6% of the children are almost ready for school, and 49.5% are fully ready for school. In the domain of language and communication skills, 49.9% are almost ready for school, and 31.2% of the children are fully ready for school. With respect to physical development, 28.7% of the children are almost ready for school, and 68.3% are fully ready for school. We next turned to the question of whether children who had attended kindergarten were more ready for first grade than were children who had not attended kindergarten. Using the continuous measure of overall readiness, children who had attended kindergarten (M = 3.36, SD = .42) were found to be significantly more ready for first grade than were children who had not attended kindergarten (M = 3.05, SD = .51), t(3,632) = 16.98, p < .001. Forty-five percent of children who had attended kindergarten were at Level 4 of school readiness, compared to 22% of children who had not attended kindergarten. Fifty-two percent of children who had attended kindergarten were at Level 3 of school readiness, compared to 63% of children who had not attended kindergarten. Four percent of children who had attended kindergarten were at Level 2 of school readiness, compared to 15% of children who had not attended kindergarten. Finally, .1% of children who had attended kindergarten were at Level 1 of school readiness, compared to .4% of children who had not attended kindergarten.

JOURNAL OF EDUCATIONAL RESEARCH (Vol.12, No.1) 2009 Dept Of Education IUB,
Pakistan
12
Given the particular importance of the communities in which kindergartens had recently been established as part of the education reform, the next set of analyses compared the school readiness of children in these communities at the beginning of education reform in 2004 (n = 955) with the school readiness of children in these communities in 2007 (n = 1,024). Using the continuous measure of school readiness, children in 2007 (M = 3.31, SD = .44) were significantly more ready for school than were children in 2004 (M = 3.21, SD = .45), t(1,977) = 4.97, p < .001. Overall, 39.3% of children in these communities were observed to be fully ready for school (Level 4 of school readiness) in 2007, compared to 29.1% in 2004. In these communities, 55.7% of children were observed to be almost ready for school (Level 3 of school readiness) in 2007, compared to 63.2% in 2004. Thus, one of the main effects of introducing public kindergartens appears to have been moving children from being almost ready to fully ready for school. Only .1% of the children in these communities were observed not to be ready for school (Level 1 of school readiness) in 2007, compared to .3% in 2004. Table 2 shows school readiness in 2004 compared to 2007 in each of the five domains of readiness. In communities with newly introduced kindergartens, children in 2007 were significantly more ready for school than were children in 2004 with respect to their social skills and behavior, t(1,977) = -4.69, p < .001, language and communication, t(1,977) = -4.95, p < .001, and physical development, t(1,977) = -6.49, p < .001. There were no significant differences between 2004 and 2007 in children’s awareness of self and environment or cognitive readiness.
Discussion
The present study had three goals: (a) To describe the school readiness of Jordanian children in five domains; (b) To compare the first grade school readiness of children who had and had not attended kindergarten; and (c) To compare the 2004 and 2007 school readiness of children in areas that instituted public kindergartens during that time period. Overall, results revealed that over 80% of Jordanian children were almost ready or fully ready for first grade in each of the five domains. Less than 2% of children were rated as being not ready for first grade in each of the five domains. Children who had attended kindergarten were significantly more ready for

JOURNAL OF EDUCATIONAL RESEARCH (Vol.12, No.1) 2009 Dept Of Education IUB,
Pakistan
13
first grade than were children who had not attended kindergarten. In communities with newly established kindergartens, children were significantly more ready for first grade in 2007 than in 2004. The results are encouraging in that most Jordanian children were either nearly ready or fully ready for first grade (the first year of mandatory schooling). For the children whose school readiness is just beginning to emerge and for those children who are not yet ready for school, the quality of kindergarten and other early childhood programs is likely to be especially important in helping these children prepare for school (Henry et al., 2006). Individualized instruction in addition to a high quality school curriculum may be necessary for the small percent of children who are at the lowest level of school readiness to help them advance to the level of their peers (National Association for the Education of Young Children, 1995). As expected and consistent with previous research regarding early childhood education in other countries (Gilliam & Zigler, 2000), children who had attended kindergarten were significantly more prepared for first grade than were children who had not attended kindergarten. These findings lend support to the national objectives in education reform being implemented by the Ministry of Education in a long-term plan to establish public kindergartens that will eventually be available to all Jordanian children. The establishment of public kindergartens is especially important for children in rural areas who are not typically served by the private sector. In the context of this reform, a national kindergarten curriculum was prepared by a team of national experts in early childhood education and was finalized and launched by her Majesty Queen Rania in the beginning of the 2004-2005 school years. The findings are encouraging in suggesting that the quality of the newly implemented kindergartens is high enough to be improving children’s school readiness in several domains important to later school success, as indicated by the higher levels of school readiness of children in 2007 than in 2004 in communities with newly launched kindergartens. Despite these encouraging results, there is still room for improvement in enhancing Jordanian children’s school readiness.

JOURNAL OF EDUCATIONAL RESEARCH (Vol.12, No.1) 2009 Dept Of Education IUB,
Pakistan
14
For example, although 43% of Jordanian children were fully ready for school in terms of their social skills and behaviors, almost half of Jordanian children were rated as nearly (but not fully) ready for school, indicating minor difficulties coping with school in terms of their social abilities. Social skills at school entry are importantly related to later school success (Webster-Stratton et al., 2008), therefore, additional efforts should be implemented in kindergarten to help students learn to get along with other children, accept responsibility for their own actions, follow rules and class routines, respect adults, gain self-confidence and self-control, adjust to change, and work independently. Similarly, additional efforts should be made to improve the school readiness of children by working through kindergartens to enhance children’s awareness of themselves and their environment, cognitive skills, language and communication skills, and physical development. Language and communication skills appear to be in need of particular attention because 17% of children were observed to be only beginning to show school readiness in this domain. Recommendations for Policy and Practice
Within Jordan, the Ministry of Education should continue to expand kindergarten coverage. It should aim at increasing kindergarten enrollment rates by expanding the reach of quality kindergarten programs, especially to poor, remote, and underserved areas in order to ensure equitable access of sufficient quality to prepare all children for school. The private sector also should be encouraged to establish and run kindergartens under the supervision of the Ministry of Education, especially in poor and rural areas. When public kindergartens are not available in a particular geographic area, the Ministry of Education could provide economic support for low-income families to enable them to send their children to private kindergartens. The Ministry of Education should make sure that the kindergarten curriculum is responsive to the varying needs of children and the different developmental strengths and weaknesses they bring to kindergarten. The school curriculum also should be responsive to the unique needs of children who are considered at-risk and with developmental delays.

JOURNAL OF EDUCATIONAL RESEARCH (Vol.12, No.1) 2009 Dept Of Education IUB,
Pakistan
15
More broadly, investment and commitment are needed to ensure that every child enters school ready to succeed and that schools are effective in educating every child. Every child must be provided with a basic foundation that is critical to learning in school, and schools must be prepared to meet the needs of individual children as they enter school. It is important that kindergarten teachers be aware that by the end of kindergarten children should be able to adjust socially and be emotionally secure in school, communicate with adults and other children, be aware of print and letter-sound relationships, understand stories, recognize and understand basic mathematical concepts including the ability to identify patterns and place items in a certain order, have a basic understanding of their environment and the roles of people in their families and communities, and be physically strong and coordinated. Being equipped with this diverse set of skills early in their school careers will prepare children for future academic success. References Denham, S. A. (2006). Social-emotional competence as support for
school readiness: What is it and how do we assess it? Early
Education and Development, 17, 57-89. Entwisle, D. R., & Alexander, K. L. (1999). Early schooling and
social stratification. In R. C. Pianta & M. J. Cox (Eds.), The
transition to kindergarten (pp. 13-38). Baltimore: Paul H. Brookes Publishing Co.
Gilliam, W. S., & Zigler, E. F. (2000). A critical meta-analysis of all evaluations of state-funded preschool from 1977 to 1998: Implications for policy, service delivery and program evaluation. Early Childhood Research Quarterly, 15, 441-473.
Henry, G. T., Gordon, C. S., & Rickman, D. K. (2006). Early education policy alternatives: Comparing quality and outcomes of Head Start and state prekindergarten. Educational Evaluation and Policy Analysis, 28, 77-99.
Janus, M., & Offord, D. (2007). Development and psychometric properties of the Early Development Instrument (EDI): A measure of children’s school readiness. Canadian Journal of
Behavioural Science, 39, 1-22.

JOURNAL OF EDUCATIONAL RESEARCH (Vol.12, No.1) 2009 Dept Of Education IUB,
Pakistan
16
La Paro, K. M., & Pianta, R. C. (2000). Predicting children's competence in the early school years: A meta-analytic review. Review of Educational Research, 70, 443-484.
Love, J. M., Aber, J. A., & Brooks-Gunn, J. (1992). Strategies for
assessing community progress toward achieving the first
national goal. Princeton, NJ: Mathematica Policy Research, Inc.
Lunkenheimer, E. S., Dishion, T. J., Shaw, D. S., Connell, A. M., Gardner, F., Wilson, M. N., & Skuban, E. M. (2008). Collateral benefits of the family check-up on early childhood school readiness: Indirect effects of parents' positive behavior support. Developmental Psychology, 44, 1737-1752.
Meisels, S. J. (1999). Assessing readiness. In R. C. Pianta & M. J. Cox (Eds.), The transition to kindergarten (pp. 39-66). Baltimore: Paul H. Brookes Publishing Co.
Ministry of Education. (2002). The Education Reform for the Knowledge Economy Project. Ministry of Education, Amman, Jordan. Available online: http://www.moe.gov.jo/a_erfke/a_er.htm
National Association for the Education of Young Children. (1995). School readiness: A position statement of the National
Association for the Education of Young Children. Washington, DC: Author.
National Research Council. (2001). Eager to learn: Educating our
preschoolers. Washington, DC: National Academic Press. Pianta, R. C. (2002). School readiness: A focus on children, families,
communities, and schools. The Informed Educators Series (pp. 1-11). Arlington, VA: Educational Research Service.
Pianta, R. C., & McCoy, S. (1997). The first day of school: The predictive validity of early school screening. Journal of
Applied Developmental Psychology, 18, 1-22. Pianta, R. C., & Walsh, D. J. (1996). High risk children in the
schools: Creating sustaining relationships. New York: Routledge.
Sassu, R. (2007). The evaluation of school readiness for 5-8 year old children: Cognitive, social-emotional, and motor coordination and physical health perspectives. Cognitie
Creier Comportament, 11, 67-81.

JOURNAL OF EDUCATIONAL RESEARCH (Vol.12, No.1) 2009 Dept Of Education IUB,
Pakistan
17
Scott-Little, C., Kagan, S. L., & Frelow, V. S. (2006). Conceptualization of readiness and the content of early learning standards: The intersection of policy and research? Early Childhood Research Quarterly, 21, 153-173.
Shonkoff, J., & Phillips, D. (2000). From neurons to neighborhoods:
The science of early childhood development. Washington, DC: National Academy Press.
Webster-Stratton, C., Reid, M. J., & Stoolmiller, M. (2008). Preventing conduct problems and improving school readiness: Evaluation of the Incredible Years teacher and child training programs in high-risk schools. Journal of
Child Psychology and Psychiatry, 49, 471-488.

JOURNAL OF EDUCATIONAL RESEARCH (Vol.12, No.1) 2009 Dept Of Education IUB,
Pakistan
18
Assessing the Difficulty Index of Course Materials in
National Open University of Nigeria
‡Inegbedion, Juliet O.
Abstract To have a sustainable learning outcome in open and distance learning there
must be availability of quality course materials for the students, which is
one of the criteria considered in setting up a new programme; it is also
used by the public in determining the quality of education the students are
expected to receive. National Open University of Nigeria (NOUN) is not an
exception in this regard. Therefore, this study is interested in assessing the
difficulty index of NOUN course materials; which is a criterion for
determining quality. The assessment of course materials is not a new
phenomenon, educational researchers and practitioners have over the time
recognised this. To find out the level of text difficulty of NOUN course
materials, three research questions were raised – Are required course
materials available? Do the available course materials meet the standard
specified for ODL? What should be the criteria in reviewing course
materials published in 2004? To answer these questions the survey method
was used to generate responses. All registered students in Lagos Study
Centre formed the population, Through judgment/purposive sampling
method 100 students were selected for the sample; while systematic
sampling technique was used in selecting 10% out of the total number of
printed course materials that were available at the time of study. Following
this, the Gunnings’s Fog Index, Flesch Reading Ease, Cloze text and
Rowntree’s Complexity Quotient were used to assess the difficulty index of
selected course materials; while questionnaires were designed to elicit data
from the learners to get their perception on the content, format and
language of the course materials including any other opinion they may
share. The results showed a shortfall of course materials, fairly adequate
age matching of text, a need for course material review, and fairly adequate
difficulty level of text.
‡ National Open University of Nigeria, Lagos ([email protected] or [email protected])

JOURNAL OF EDUCATIONAL RESEARCH (Vol.12, No.1) 2009 Dept Of Education IUB,
Pakistan
19
Keywords: Difficulty Index, Materials, Open and Distance Learning, Knowledge, Text Difficulty
Introduction Course materials are vital tool which determine the progress of academic sessions in Open and Distance Learning (ODL). The need for availability and quality course materials cannot be overemphasized especially for new institutions like The National Open University of Nigeria (NOUN) where the populace wants to know the quality of knowledge that would be received by the learners; which is a determinant of the quality of products. It therefore means that to attain a sustainable learning outcome in Open and Distance Learning, quality course materials must be available. Presently, NOUN is facing the challenge of course material production, more so that the course materials need to be reviewed in every five years. One major challenge faced during course material production is ‘Editing’, which includes content, language and format, where the shafts are sieved from the wheat; because it is during the editing stage you determine the quality. It therefore means that the editors need to know the areas of concentration that would be used to determine quality. To find solution to the challenge the following research questions were raised – Are the required course materials available? Do the available course materials meet the standard specified for ODL? What should be the criteria in reviewing course materials published in 2004? To answer these questions, the study assessed the difficulty index of available course materials. Literature Review Text difficulty is determined by looking at the ease the learner would have in comprehending a text and the interest the learner would derive. To be able to match students with appropriate texts, you need to assess the difficulty of the texts you consider using, as well as the likelihood that the students will be motivated to read them (Hiebert, 2005). Hiebert identified the following as factors influencing text difficulty: vocabulary, sentence structure, length, elaboration, coherence and unity, text structure, familiarity of content

JOURNAL OF EDUCATIONAL RESEARCH (Vol.12, No.1) 2009 Dept Of Education IUB,
Pakistan
20
and background knowledge required, audience appropriateness, quality and verve of the writing, interestingness. Vocabulary – is one of the major identifiable characteristics suggesting text difficulty. It should be noted that a mere replacement of difficult words with simple one does not make the difficulty level simple. Sometimes this type of replacement may lead to confusion because there are words that cannot be replaced if the meaning has to be retained (Anderson and Freebody, 1981). It should however be noted that a few difficult words may cause serious barrier to comprehension as shown by Freebody and Anderson (1983) that it takes a substantial proportion of difficult words to affect students’ comprehension. Sentence Structure – is one of the text characteristics that is easy to assess, very long and very complex sentences make text very difficult to read. But, sentence structure strength on text difficulty is not as strong as that of vocabulary (Coleman, 1971). Also, it is recommended that the sentence in a text need to be complex enough to clearly convey the meaning of the text (Pearson, 1974 – 1975). Length – for learner who cannot read fluently, length could form a formidable obstacle. It is also applicable to those learners who have a short reading span. Elaboration – “Texts can be written so that they present concepts without much explanation, or so that they present concepts along with a good deal of explanatory material – examples, analogies, and linkages of various sorts” (Hiebert and Fisher, 2005). Coherence and Unity – Anderson and Armbruster, 1984; Beck and Mckeown, 1989, see coherence as the integration of material how each topic and subtopic is defined and the relationship that exists between the parts. Unity is the oneness of purpose. Good texts are directed to a particular topic, objectives, concepts and particular points.

JOURNAL OF EDUCATIONAL RESEARCH (Vol.12, No.1) 2009 Dept Of Education IUB,
Pakistan
21
Text Structure – is the organization of text. Drum, 1984 identifies narratives or expository as the two categories student text normally fall into. Quality and Verve of the Writing – it is also important to consider the quality of the writing, the flair of the writing, the particular blend of topic, organization and style that make one piece of writing intriguing and memorable and another mundane (Hiebert and Fisher, 2005). Interestingness – is the most subjective factor, because the factor used in determining interest is dependent on the reader. What may serve as interest to one may not serve as an interest to another? In writing, the main theme must not suffer even while sustaining interest. In addition to these factors, the aims, goals and objectives of each programme or course would be other elements to consider when matching texts and students.
Methodology The descriptive method of research was used. Descriptive research involves “collection of data in order to test hypotheses or to answer questions concerning the current status of the subject of the study” (Gay, 1992). The survey method was used in the collection of data. “A survey is an attempt to collect data from members of a population in order to determine the current status of that population with respect to one or more variables” (Gay, 1992). All registered NOUN students and all available printed course materials formed the population of the study. For the purpose of this research, the students’ population was restricted to Lagos Study Centre because of the difficulty of getting all registered students in NOUN, but from statistics, Lagos Study Centre has the highest number of registered students among other Study Centres, which formed a good representation of the entire students. Judgment/purposive sampling method was used in selecting the respondents while systematic sampling technique was used in the

JOURNAL OF EDUCATIONAL RESEARCH (Vol.12, No.1) 2009 Dept Of Education IUB,
Pakistan
22
selection of the number of course materials used for the research. Using the judgmental sampling method, 100 students comprising 40 postgraduate and 60 undergraduate students were sampled. 10% of the printed course materials were used. Table 1: Available Printed Course Materials as at
April 30th, 2008
S/N School
Available
Printed
Materials
No of
Printed
Materials
Used
1
School of Arts & Social Sciences (SASS)
116
11
2
School of Business & Human Resources Management (SBHRM)
47
5
3 School of Education (SED) 67 7
4 School of Law (LAW) 16 2
5 School of Science & Technology (SST)
72
7
Total
318 32
A questionnaire was designed to elicit information from the respondents. The questionnaire had three main sections – content, format and language. The items were drawn to get the learners (users) feeling about the three main areas which determine the quality of course materials. In addition to the main sections, a section was set aside for free comments. The items designed required ‘yes’ or ‘No’ answer. The validity and reliability of the instrument were tested using content and construct validity; and split-half reliability after which a pre-test of the questionnaire was carried out before it was finally administered to the selected respondents. 100

JOURNAL OF EDUCATIONAL RESEARCH (Vol.12, No.1) 2009 Dept Of Education IUB,
Pakistan
23
questionnaires were distributed and only 80 were successfully filled and returned; which reflected 80% response. Also used in the study is Gunnings’s Fog Index, Flesch Reading Ease, Cloze text and Rowntree’s Complexity Quotient to assess the course materials as recommended by Staff Training and Research Institute of Distance Education (STRIDE) in 1993. STRIDE is an autonomous institution under the control of the Board of Management of Indira Gandhi National Open University (IGNOU). Gunnings’s Fog Index or Modified Gunning Fog Index was used in measuring the level of reading difficulty of the course materials. Though it has received criticism, it is still a good instrument in knowing the tone and style of writing a particular text. The modified Fog Index helps in measuring the ‘reading age’ of a particular text. It is also important to know that the use of technical terms or jargon can increase Fog Index scores. The Modified Fog Index can be calculated as:
1. Count exactly 100 words from a paragraph of your text. 2. Underline those words that have 3 or more syllables (a,
e, i, o, u). 3. Count the underlined words (A) 4. Count the number of sentences. 5. Workout the average words per sentence. Round up to
the nearest (B). 6. Add A and B (C). 7. Multiply C by 4. 8. Divide D by 10 (E) 9. Add 5 to E and you will get fog Index
(http://www.wikieducator.org/session_10).
Before the modification of Fog Index, it was said that: The Fog Index does not determine if the writing is too basic or too advanced for a particular audience rather; it helps to decide whether a document could benefit from editing or using plain language techniques (Klariti, 2000). Flesch Reading Ease is another formula for calculating reading age and the formula is: RE = 206.535 - 0.846w - 1.015s

JOURNAL OF EDUCATIONAL RESEARCH (Vol.12, No.1) 2009 Dept Of Education IUB,
Pakistan
24
Where: w = average number of syllabus per 100 words; s = average number of words per sentence. The higher the RE, the easier the text Harley (1994) in Wikieducator (2008). Microsoft Word could also be used in calculating the Flesch Reading Ease. This can be assessed through ‘Spelling and Grammar’ from ‘Tools’ on the menu bar. Cloze Test is also used for testing readability. “In the cloze test, every 5th or 7th word of a sample text is omitted, and the text is given to the target group to read by filling the missing words. Readability is calculated on the basis of predicting the correct words, and a 60% score is considered satisfactory for comprehension, while 40 – 60% indicates partial comprehension, and less than 40% indicates inadequate comprehension” (Wikieducator, 2008). Rowntree’s (1996) Complexity Quotient is another way of testing the readability of a text. The writer further suggests the calculation of complexity quotient viz:
1. Count the number of complete sentences you have on a page (A).
2. Count the number of “long” words (three or more syllables) (B).
3. Divide B by A to get complexity quotient. The prose is regarded as difficult ones when the score exceeds 3 as compared to most novelists. Presentation of Data Table 2: Percentage of Learners’ Response on the Quality of Course
Materials Content
S/N Details
%
YES
%
NO
%
NR
1 Is the introduction of modules adequate?
91 9 0
2 Does the Introduction of a 94 3 3

JOURNAL OF EDUCATIONAL RESEARCH (Vol.12, No.1) 2009 Dept Of Education IUB,
Pakistan
25
unit/module relate the present unit/module to the previous unit/module and the next, to ascertain continuity?
3 Does the Introduction reflect the reason for studying the content in that unit/module?
91 6 3
4 Does the Introduction serve as a good motivator for the learners?
94 6 0
5 Are there clearly stated behavioural objectives in the course materials?
85 15 0
6 Do the objectives cover the entire unit content?
70 27 3
7 Would the objectives help you assess your own learning?
97 3 0
8 Do the objectives set achievable task before you?
91 6 3
9 Is the study material planed to meet the theme of the unit?
85 15 0
10 Is the content logically sequenced? 85 12 3
11 Is the level of content appropriate for your level?
94 6 0
12 Is the content lucid and learner friendly?
82 12 6
13 Are explanations in the course materials adequate?
67 33 0
14 Is the content designed to sustain your interest by using example, illustrations, humour, anecdotes etc?
67 21 12
15 Are there adequate self-practice activities for you?
91 6 3
16 Are ideas and arguments sequential? 70 21 9
17 Are relevant information supplied in the content?
73 21 6
18 Is the given information up-to-date and accurate?
64 36 0
19 Are the conclusions in the course materials adequate?
64 30 6
JOURNAL OF EDUCATIONAL RESEARCH (Vol.12, No.1) 2009 Dept Of Education IUB,
Pakistan
26
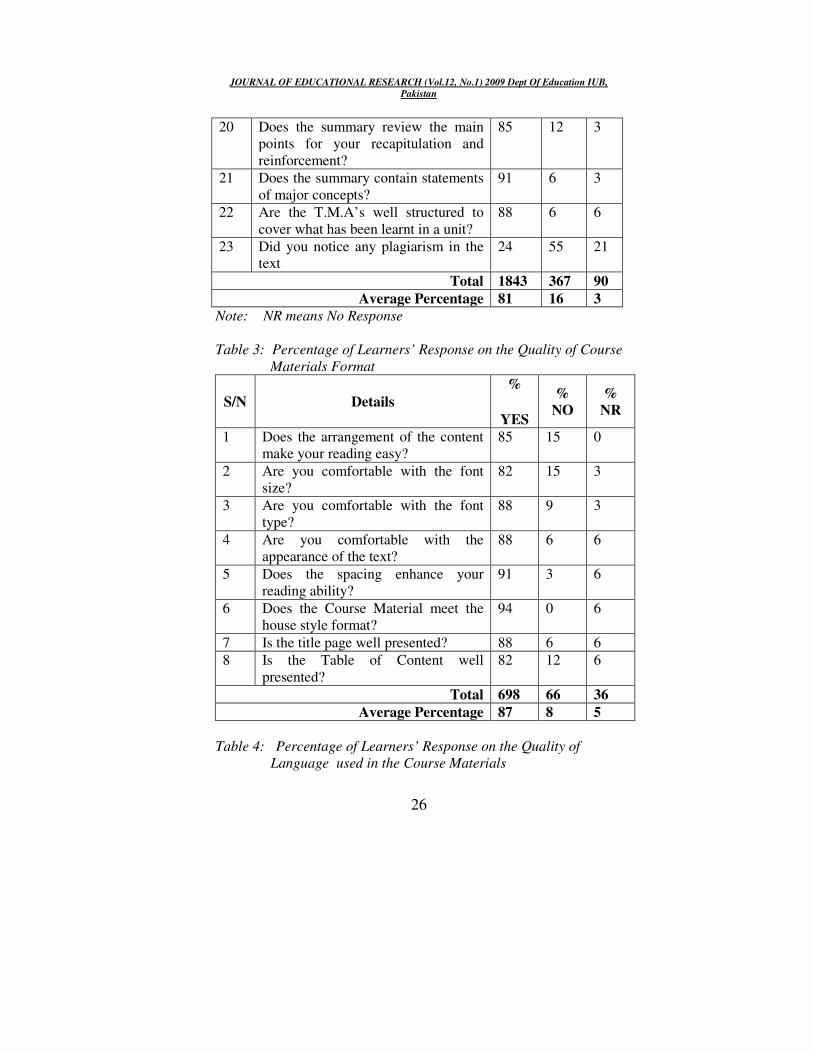
20 Does the summary review the main points for your recapitulation and reinforcement?
85 12 3
21 Does the summary contain statements of major concepts?
91 6 3
22 Are the T.M.A’s well structured to cover what has been learnt in a unit?
88 6 6
23 Did you notice any plagiarism in the text
24 55 21
Total 1843 367 90
Average Percentage 81 16 3
Note: NR means No Response
Table 3: Percentage of Learners’ Response on the Quality of Course
Materials Format
S/N Details
%
YES
%
NO
%
NR
1 Does the arrangement of the content make your reading easy?
85 15 0
2 Are you comfortable with the font size?
82 15 3
3 Are you comfortable with the font type?
88 9 3
4 Are you comfortable with the appearance of the text?
88 6 6
5 Does the spacing enhance your reading ability?
91 3 6
6 Does the Course Material meet the house style format?
94 0 6
7 Is the title page well presented? 88 6 6
8 Is the Table of Content well presented?
82 12 6
Total 698 66 36
Average Percentage 87 8 5
Table 4: Percentage of Learners’ Response on the Quality of
Language used in the Course Materials

JOURNAL OF EDUCATIONAL RESEARCH (Vol.12, No.1) 2009 Dept Of Education IUB,
Pakistan
27
S/
N Details
%
YES
%
NO
%
NR
1 Is the language learner friendly? 94 6 0
2 Is the style of writing personalized? 48 48 4
3 Is the text written in simple and short sentences?
76 18 6
4 Is the communication effective and readable?
88 12 0
5 Is the paragraphing adequate? 97 3 0
6 Are the sentences free of grammatical errors?
36 64 0
7 Are all words spelt correctly? 39 58 3
8 Are all the spellings in UK English format?
55 33 12
9 Are active voice used correctly? 55 24 21
10 Is the usage of idioms adequate? 61 21 18
11 Is the text in conversational format? 67 18 15
12 Is the language in the course material gender sensitive?
30 58 12
13 Does the writing style makes the learner feel he/she is being talked to? By using the words “You”, “I”, “We”
79 12 9
14 Did the level of the language match the level of the content?
73 12 15
15 Are the vocabulary and technical terms used adequate?
85 6 9
16 Is the language used simple and clear?
76 15 9
17 Did the language used meet with the linguistic ability of the learners?
76 15 9
18 Is the complexity quotient adequate? 61 24 15
19 Is the fog index adequate? 52 24 24
20 Is the cloze test adequate? 49 24 27
21 Are there inconsistent spellings? 52 36 12
22 Are the quotations used very essential to the theme?
79 6 15
23 Are there superfluous words or 36 46 18

JOURNAL OF EDUCATIONAL RESEARCH (Vol.12, No.1) 2009 Dept Of Education IUB,
Pakistan
28
phrases?
24 Are there clichés and worn out phrases?
36 40 24
25 Are the tenses inconsistent? 39 39 22
26 Are the punctuations adequate? 55 27 18
27 Are there verbal expressions? 58 21 21
28 Is the use of nominal expression avoided?
61 21 18
29 Is the use of non English words in an English text expressed in bold format?
43 36 21
Total 1756 767 377
Average Percentage 61 26 13
Comments on Availability of Course Materials by Respondents
From the section of the questionnaire where respondents were given opportunity to comment as desired, 90% of the total number of respondents expressed dissatisfaction with the non availability of most of their course materials. Table 5: Presentation of Difficulty Index of the Selected Course
Materials at the Undergraduate Level
S/N Course
Code
Modified
Fog Index
Flesch
Reading
Ease
Complexity
Quotient
Cloze
Test
1 BIO 111 16 50.4 1 58%
2 BIO 191 16 54.3 0.5 55%
3 BIO 222 16 38.1 2.2 60%
4 CSS 105 18 49.3 2.6 60%
5 CTH 011 16 46.9 2.0 65%
6 CTH 025 17 47.6 2.1 58%
7 CTH 031 20 53.2 2.5 57%
8 DFR 022 19 48.7 2.5 60%
9 EDU 202 17 44.5 2.2 56%
10 EDU 204 22 43.2 3.5 63%
11 HCM 112
20 57.1 1.7 61%
12 INR 101 17 29.0 2.3 55%

JOURNAL OF EDUCATIONAL RESEARCH (Vol.12, No.1) 2009 Dept Of Education IUB,
Pakistan
29
13 LAW 102
19 41.0 3.0 66%
14 NSS 217 18 50.5 2.0 58%
15 NSS 301 19 47.4 1.5 57%
16 PHY 204 16 39.7 2.2 50%
Total 286 740.9 33.8 939%
Average 18 46.3 2.1 59%
Table 6: Presentation of Difficulty Index of the Selected Course
Materials at the Post Graduate Level
S/N Course
Code
Modified
Fog Index
Flesch
Reading
Ease
Complexity
Quotient
Cloze
Test
1 BHM 667
23 26.5 3.7 60%
2 CTH 603 22 40.5 2.5 54%
3 EDA 710 21 33.3 3.0 62%
4 EDU 634 20 40.2 3 62%
5 EDU 702 16 34.7 1.7 61%
6 HEM 603
16 47.6 1.5 62%
7 JLS 602 19 47.8 2.0 61%
8 JLS 608 20 37.6 1.8 53%
9 LED 605 20 39.0 2.5 60%
10 MBA 701
20 34.5 2.5 66%
11 MED 708
22 39.2 3.3 60%
12 MPA 704
19 30.9 2.5 60%
13 MPA 706
23 38.4 2.0 65%
14 PCR 601 27 48.6 2.6 56%
15 PCR 702 18 50.6 2 61%
16 SED 713 21 41.9 3.8 58%
Total 327 631.3 40.4 961%
Average 20 39 2.5 60%

JOURNAL OF EDUCATIONAL RESEARCH (Vol.12, No.1) 2009 Dept Of Education IUB,
Pakistan
30
Discussion Research Question 1:
Are the required course materials available? From the data presented in Table 1, there were only 318 printed course materials in NOUN as at April 30th, 2008. Considering the total number of courses offered in the various schools; the total number of course materials required would be about 1000. This, therefore means that there is a short fall in the production of course materials, which implied that students might have problem completing their programmes as at when due. This was further confirmed by the respondents’ free comments in the questionnaire. It was discovered that the management of the university was also disturbed about the non availability of course materials; which was expressed by the vice chancellor at the Senate, for which the management is presently doing every thing possible to salvage the situation. Research Question 2: Do the available course materials meet the standard specified for ODL? In testing the standard specified for ODL, the index difficulty of the course materials was calculated using Fog Index, Flesch Reading Ease, Cloze Test and Rowntree’s Complexity Quotient. The Fog Index and the Flesch Reading Ease help to calculate the reading age, which will help determine the matching of the course materials with the age of learners. From the results presented in Tables 5 and 6 above, the average reading age for the course materials prepared for the undergraduate level is 18 and that of the post graduate 20 years. Considering the recommended minimum school age for university education in Nigeria, which is 16 and the practical age at which students turn out of university education these days, it could be said that the course materials fairly suit the students age. Fairly, because using the government regulations, the minimum age for post graduate would have been 21, age attained after the National Youth Service Corps (NYSC). That is to say that the level of difficulty in the course is what they could cope with. Considering the suggested

JOURNAL OF EDUCATIONAL RESEARCH (Vol.12, No.1) 2009 Dept Of Education IUB,
Pakistan
31
table presented by Flesch Formula Readability Ease Score which states thus:
Table 7
RE
Value
Description of
Style
Required Reading
Skill
90 – 100 Very Easy 5th Grade
80 – 90 Easy 6th Grade
70 – 80 Fairly Easy 7th Grade
60 – 70 Standard 6th – 9th Grade
50 – 60 Fairly Difficult 10th – 12th Grade
30 – 50 Difficult 13th – 16th Grade
0 – 30 Very Difficult College Graduation
and its equivalent in Nigeria as shown below: Table 8
Required Reading Skill
RE Value Description
of Style Nigerian
Equivalent
90 – 100 Very Easy 5th Grade Primary 5
80 – 90 Easy 6th Grade Primary 6
70 – 80 Fairly Easy 7th Grade JSS 1
60 – 70 Standard 8th – 9th Grade
JSS 2 & 3
50 – 60 Fairly Difficult
10th – 12th Grade
SSS 1 – 3
30 – 50 Difficult 13th – 16th Grade
Under Graduate Levels
0 – 30 Very Difficult
College Graduation
Post Graduate Levels
A fair judgment could be made on the Flesch Reading Ease of the course materials. From Tables 5 and 6, the average Flesch Reading Ease record 46.6 for undergraduate and 39 for the post graduate. Using Tables 7 and 8, it could be said that the course materials

JOURNAL OF EDUCATIONAL RESEARCH (Vol.12, No.1) 2009 Dept Of Education IUB,
Pakistan
32
prepared for undergraduate students have their correct level of difficulty. But that of the post graduate levels need an upgrade in the level of difficulty to adequately suit the level it is meant for. This is very important at the time of review. A close look at Tables 5 and 6 revealed the need to stabilise difficulty levels for which course materials are written e.g. INR 101, a 100 level course, shows a Flesch Reading Ease of 29.0 which is an indication that this course material is very difficult for this level, again the difficulty may have been as a result of some or all the factors influencing text difficulty – vocabulary, sentence structure, length, elaboration, coherence and unity, text structure, familiarity of content and background knowledge required, audience appropriateness, quality and verve of the writing, interestingness as stated by Hiebert (2005). Also PCR 702 records a Flesch Reading Ease of 50.6 and a Modified Fog Index of 18. From the formula, 50.6 is below the level of a post graduate programme but comparing the Flesch Reading Ease of 50.6 and the Modified Fog Index that showed the reading age at 18, which is the age that mostly falls under the undergraduate level, it could be said that the course material matches the age and not the level. There is a need to watch out for the appropriateness of the level of difficulty in course material production, because inappropriateness of difficulty level may bring discouragement to students in the programme. Using Rowntree’s Complexity Quotient, any text with a score that exceeds 3 is regarded as a difficult text. From the analysis given above, the undergraduate course materials record complexity quotient average of 2.1 and post graduate 2.5. This implies that the texts are not difficult for the levels they are meant for, but rather considered fairly adequate. The Cloze Test rule says that when the cloze test of a text is 60% it means the text his satisfactory for comprehension, when it is 40% - 60% it would be considered partial for comprehension and less than 40% is taken as inadequate comprehension. With this rule in place, it could be said that the cloze test for the undergraduate text which has an average of 59% and the postgraduate average of 60% are partial for comprehension. This reflects the need for improvement on the content and language of the course materials, though some of the course materials are satisfactory for comprehension.
JOURNAL OF EDUCATIONAL RESEARCH (Vol.12, No.1) 2009 Dept Of Education IUB,
Pakistan
33
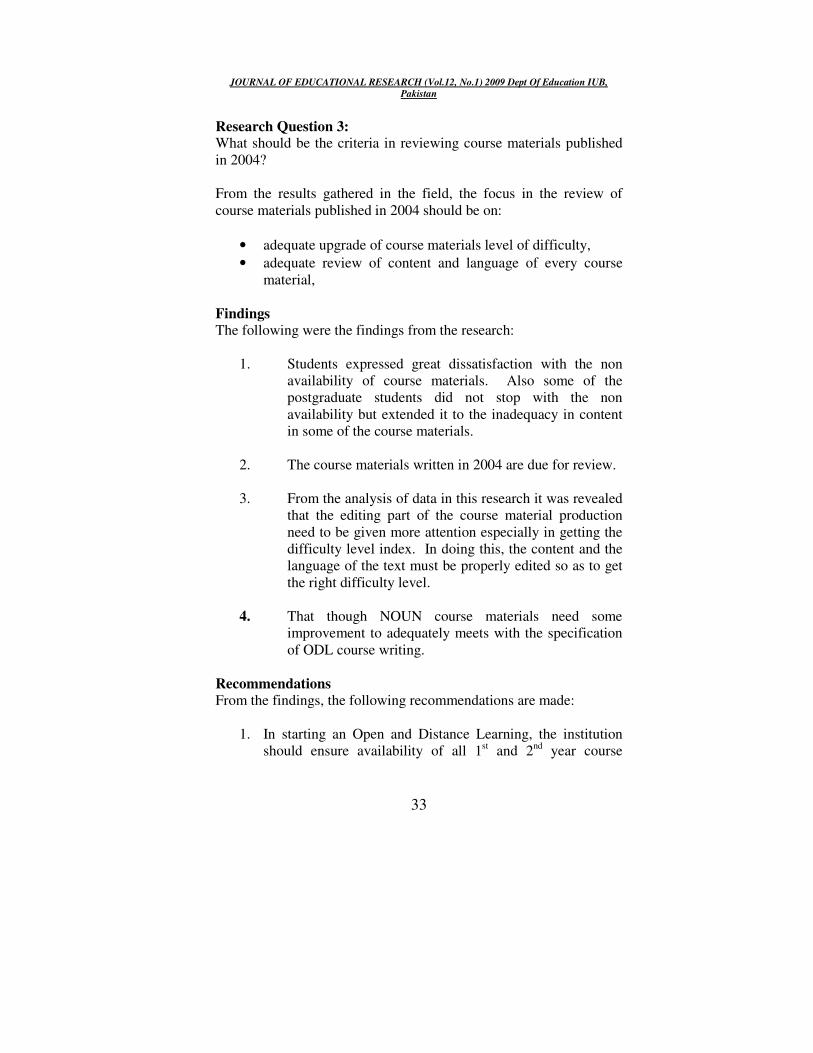
Research Question 3: What should be the criteria in reviewing course materials published in 2004? From the results gathered in the field, the focus in the review of course materials published in 2004 should be on:
• adequate upgrade of course materials level of difficulty,
• adequate review of content and language of every course material,
Findings The following were the findings from the research:
1. Students expressed great dissatisfaction with the non availability of course materials. Also some of the postgraduate students did not stop with the non availability but extended it to the inadequacy in content in some of the course materials.
2. The course materials written in 2004 are due for review.
3. From the analysis of data in this research it was revealed
that the editing part of the course material production need to be given more attention especially in getting the difficulty level index. In doing this, the content and the language of the text must be properly edited so as to get the right difficulty level.
4. That though NOUN course materials need some
improvement to adequately meets with the specification of ODL course writing.
Recommendations From the findings, the following recommendations are made:
1. In starting an Open and Distance Learning, the institution should ensure availability of all 1st and 2nd year course

JOURNAL OF EDUCATIONAL RESEARCH (Vol.12, No.1) 2009 Dept Of Education IUB,
Pakistan
34
materials before taking off. This might not be through development but adaptation and better still adoption where possible. While the 1st and 2nd sessions are running the courses of other levels would be undergoing development. Through this process there would be a minimal shortage and stagnation of sessions.
2. The university should procure software for calculating Text
Difficulty Index to be used in calculating the Difficulty Index of course materials in the university. The use of the software will enhance adequacy in the quality of course materials.
3. There should be a re-training for course materials reviewers.
4. Difficulty Index of the text should be considered at whatever
method the course materials are produced – development, adaptation and adoption.
References Anderson, R. C., & Freebody, P. (1981). Vocabulary Knowledge. In
Hiebert, E. H. & Fisher C. W. The Effect of Text Difficulty
on Second Graders’ Fluency Development.
Anderson, T. H., & Armbruster, B. B. (1984). Content Area
Textbooks. In R. C. Anderson, J. Osborn, & R. J. Tierney (Eds.), Learning to Read in American Schools (pp 193 – 226).
Coleman, E. B. (1971). Determining a Technology of Written
Instruction: Some Determiners of the Complexity of Prose. In E. Z. Rothkopf & P. E. Johnson (Eds), Verbal Learning
Research and The Technology of Written Instruction. New York: Teachers College Press. An early look at factor affecting text difficulty.
Drum, P. (1984). Children’s Understanding of Passages. In J. Flood (Ed), Promoting Newark, DE: International Reading Association. A very lucid examination of what children
understand from narrative & expository texts.
Freebody, P., & Anderson, R. C. (1983). Effects on text
comprehension of differing proportions and locations of

JOURNAL OF EDUCATIONAL RESEARCH (Vol.12, No.1) 2009 Dept Of Education IUB,
Pakistan
35
difficult vocabulary – Journal of Readings Behaviour, 15, 19-39.
Gay, L. R. (1992). Educational Research: Competencies For
Analysis & Application. New York, Macmillan Publishing Coy. Pp 217 – 219).
Hiebert, E. H. & Fisher C. W. (2005). The Effect of Text Difficulty
on Second Graders’ Fluency Development. http://quikreads.org/publications/text-difficulty. Retrieved 13th May, 2008.
Klariti. http://www.klariti.com/business-writing/fog-Index-Readability-fromulas.shtml. Retrieved 11th April, 2008.
Lively, B., & Pressey, S. (1923). A Method for Measuring the
“Vocabulary Burden” of textbooks. Educational
Administration and Supervision, 99, 389 – 398. In Hiebert, E. H. (in press). Standards, Assessment and Text Difficulty.
Pearson, P. D. (1974 – 1975). The Effect of Grammatical
Complexity on Children’s Comprehension, recall, and
Conception of Certain Semantic reactions. Reading Research Quarterly, 10, 155, 192.
STRIDE Handbook (1993). Editing in Distance Education. Revised & Re-Designed by P. R. Ramanujam (2002), Indira Gandhi National Open University, Krishna Printers.
Wiki Educator: http://www.wikieducator.org.session_10. Retrieved 11th April, 2008.

JOURNAL OF EDUCATIONAL RESEARCH (Vol.12, No.1) 2009 Dept Of Education IUB,
Pakistan
36
Analysis of In-Service Training Programme for
NFBE Community School Teachers in Punjab
♣Muhammad Ashraf Malik
♣♣Prof. Muhammad Aslam Adeeb
♣♣♣Dr.Irshad Hussain
Abstract Non-formal education is considered a supplementary approach to the
formal system which bridges the educational gaps in developing
countries. The present study evaluated the current status of teachers
working in non-formal basic education community schools to estimate
their in-service training needs. It focused on the analysis of in-service
training of non-formal basic education community school teachers.
The population of the study consisted of all the non-formal basic
education community school teachers in central Punjab, Pakistan.
The researchers used questionnaire (validated through pilot study) as
research tool for quantitative data collection. Data were collected
from 200 basic education community school teachers of five districts
of central Punjab, Pakistan. Data were analyzed in terms of
percentage and frequencies. The main findings of the study revealed
that i) a wide range of multidimensional topics were tried by trainers
during short term in-service training, ii) teacher training centers were
poorly equipped with modern teaching aids. It was also identified that
teachers needed guidance and training to improve knowledge in the
subjects like English, Mathematics and Science. Need of further
training in the areas of teaching methods, multi-grade teaching,
preparation and use of AV aids, examination process, preparation of
♣ PhD Scholar, Department of Education, The Islamia University of Bahawalpur, Pakistan. Email: [email protected] ♣♣ Professor & Dean, Faculty of Education, The Islamia University of Bahawalpur, Pakistan. ♣♣♣ Assistant Professor, Department of Education, The Islamia University of Bahawalpur, Pakistan Note: The preliminary results of the study were presented &discussed in the International Seminar on Quality Education for All Organized by National University of Educational Planning and Administration New Delhi India; March 5-7, 2009

JOURNAL OF EDUCATIONAL RESEARCH (Vol.12, No.1) 2009 Dept Of Education IUB,
Pakistan
37
school record, and stimulating community participation was also
expressed by the teachers. Therefore, the researchers recommended
that in-service training of these teachers may be initiated to enhance
the quality of teaching and appropriate use of modern teaching aids
and techniques. It will help to achieve the goal of quality basic
education for all in Pakistan.
Keywords: Non-formal Basic education, Community school,
Needs assessment, In-service teachers Training
Introduction
The problems of education in Pakistan appear to be the same as in other developing countries of the world. Different official reports and documents (Government of Pakistan, 2009; Government of Pakistan, 2008; Government of Pakistan, 1998) reflect that about half of the population in Pakistan is illiterate. The main factors of this phenomenon seem to include low participation rate and increased dropout at all levels of education in the country. Population explosion may be another factors and a big hurdle in achieving the national goals of ‘education for all’ to meet the international commitments made in Dakar conference in the year 2000. In the World Education Forum, Dakar Framework of Action (2000) signified the importance of quality education as one of the six goals:
Improving all aspects of the quality of education, and ensuring the excellence of them all so that recognized and measurable learning outcomes are achieved by all, especially in literacy, numeracy and essential life skills
(Article 7(vi))
Similarly, the Jomtien Declaration of EFA, (1990) considered learning outcomes more important and asserted to focus on learning rather enrolment. Likewise, the Beijing Declaration of the E-9 Project on ICT and EFA (August 2001) re-affirmed the commitment to raise the quality of education through using Information Communication Technology(ICT), and better training of teachers and administrators.
Therefore, the government of Pakistan is questing on priority basis to provide the opportunity of quality basic education to all. The

JOURNAL OF EDUCATIONAL RESEARCH (Vol.12, No.1) 2009 Dept Of Education IUB,
Pakistan
38
Government of Pakistan has prepared a comprehensive plan for non-formal basic education. More than 10,000 non-formal basic education community schools have been established to address the issues of literacy, left-outs and drop-outs (Nuzhat, 2007). Mirza (2003) stated that during the last decade government of Pakistan has re-addressed the International commitments by setting educational targets and adopting a two-pronged approach based on quantitative and qualitative expansion of education at grassroots level. Similarly, in 2008 Mirza (2008) pointed out that the quality-based output can be achieved by ensuring quality instruction at all levels of educational process including objectives, teaching learning environment, teachers’ training, assessment and monitoring. All these aspects seem very crucial and need appropriate attention of all stakeholders. Burke &Kenzie (2007) conducted a research on students learning and concluded that
…in particular, the board consensus is that “teacher quality” is the single most important factor to achieve the goal of quality education.
Teachers’ qualification, experience and their training account for quality education. Tariq et al. (2008) stated that there are more than seven thousand basic education teachers who are working in single teacher Non-formal Basic Education(NFBE) Community Schools in the Punjab under the control of National Education Foundation in which almost 0.25 million children are enrolled for basic education. In all these schools teachers need training because their performance is poor and attracting the attention of all stakeholders to improve the situation. The teachers’ poor performance appears to be the main reason of low achievement of the children. It demands in-service and pre-service training of teachers.
Therefore, all policies and plans of the Government of Pakistan emphasized on proper training of teachers working at all levels of school education. Different programmes and projects have been implemented from time to time to address the issue of teachers’ training in Pakistan. These policies and plans include National Education Policy 1979, National Education Policy 1992, National Education Policy 1998-2010, and Perspective Plan 2001-2011. The National Education Policy 1998-2010 envisaged pre-service and in-

JOURNAL OF EDUCATIONAL RESEARCH (Vol.12, No.1) 2009 Dept Of Education IUB,
Pakistan
39
service training of teachers as quality inputs to enhance the quality of education. Education Sector Reforms: Action Plan 2001-2005 re-addressed the issue of teachers’ training for quality instruction. The white paper of the upcoming Education Policy 2008 has also emphasized on teachers’ training acknowledging it high priority area for effective learning. However, teachers are the real implementer of such educational policies and plans. If teachers are un-trained and incompetent then an appropriate and operational policy may become collapsed (Malik et al. 2008). Therefore, teachers’ training seems necessary for realizing the national goals and international commitment of quality education.
The 21st century appeared with some unprecedented changes in the society making it a knowledge society on account of knowledge generation, its application, multiplication and dissemination. In knowledge society the role of a teacher particularly, a basic education teacher seems more demanding and challenging. Even the trained teachers need to build their capacity to use innovative teaching techniques and technologies for effective instructional process. Today knowledge is freely available to all at all place round the clock. Students may have the information of which the teacher is unaware. Therefore, teachers need to enhance and update his/her knowledge to satisfy the educational needs of the children (Rashid, 2006) and work in dignified manner. Teacher should develop competencies through in-service training programmes. The David Son College (2008) has divided the competencies of teachers in professional and pedagogical categories. An ideal teacher applies these competencies to achieve the goals of quality education for all and his continuous training help him for it. According to Jamani (2007) the teaching profession requires teachers who are continuously updating their professionalism and learning.
Different researchers (Saeed, 2006 & 2000; Mirza, 2003; Mirza & Iqbal, 1994) categorically asserted that the in-service education and training of teachers is essential to improve their efficiency in term of contents, pedagogy, administrative and managerial skills. But Saeed & Salamat (2006) stated that the in-service training of teachers is the most neglected area in the field of education. The training imparted by the Directorate of Staff Development (DSD) under different projects – Punjab Middle Schooling Project (PMSP), Primary

JOURNAL OF EDUCATIONAL RESEARCH (Vol.12, No.1) 2009 Dept Of Education IUB,
Pakistan
40
Education Project Phase-III(PEPIII), Girls Primary Education Project (GPEP), Primary Teachers Orientation Course (PTOC), Science Education Project (SEP), and Primary Education Curriculum Reforms Project (PECRP) is limited only to the formal school teachers.
The teachers working in NFBE community schools are recruited without professional training. Therefore, the government has planned pre-service and in-service training programme for teachers of non-formal schools. In the year 2008, a programme for pre-service and in-service training was launched for such teachers. It was intended that this program would enhance the basic teaching skills, lesson planning, multi-subject teaching, multi-grade teaching, administration of community school, and community participation.(Tariq et al. 2008)
According to the National Education Foundation (2009) teachers are still facing difficulties in the teaching of different subjects, lesson planning, multi-grade teaching, class management and other academic activities. Teachers have been advised to inform the authorities about their difficulties so that the administration may guide and help them providing in-service training.
The present study focused on the in-service training of non-formal community school teachers in order to analyze its effectiveness for the system.
Objectives of the study
The objectives of the study were
1. To analyze in-service training process of non-formal basic education community school teachers
2. To assess the training needs of teachers in terms of
pedagogy, subject knowledge and management
3. To propose the possible solutions to the problems involved in the In-service teacher training

JOURNAL OF EDUCATIONAL RESEARCH (Vol.12, No.1) 2009 Dept Of Education IUB,
Pakistan
41
Methodology
The present study was delimited to the in-service training of non-formal community school teachers held in 2008. Population of the study consisted of all the non-formal basic education community school teachers of central Punjab. Two hundred NFBE community school teachers were selected as sample from the following five districts of central Punjab (Pakistan).
Table 1. District wise sample teachers
District Sample
Hafiz Abad 61
Sahiwal 45
Toba Tek Singh 21
Faisalabad 40
Sheikhupura 33
Total 200
Since the study was descriptive in nature, survey approach was considered appropriate to collect data. For this purpose, a questionnaire was developed and administered on the selected sample. Data collected through questionnaire were coded and analysed by utilizing SPSS XIV in terms of frequencies and percentages.
Findings of the Study The findings drawn out from the data collected through the questionnaire are given below:

JOURNAL OF EDUCATIONAL RESEARCH (Vol.12, No.1) 2009 Dept Of Education IUB,
Pakistan
42
Table2. Important topics covered during in-service teachers’
training.
Topic Frequency Other Topics Frequency
Multi Grade Teaching
4
Teaching Methods
14
Preparation of Teaching Aids
9
Subject Teaching
28
School Administration
15
Lesson Planning
10
Preparation of Record
8
Child Psychology
13
VEC Matters, Community Mobilization, Examination System, Co curricular Activities, School Discipline, Non-formal Education System, Class Management
18
N 200 Total = 119
Above table indicates, the opinion of 119 teachers, that a wide range of multidimensional topics were carried out during six days in-services training for non-formal basic education community school teachers.
Table3 : Subject wise need assessment for training
Class Science.
Math Urdu Islamic Studies
English
Social Studies
V 69 117 4 1 84 10
IV 42 78 3 2 41 6
III 18 36 1 1 12 2
II 18 26 2 - 9 1
I 11 24 2 - 9 -

JOURNAL OF EDUCATIONAL RESEARCH (Vol.12, No.1) 2009 Dept Of Education IUB,
Pakistan
43
Table 3 shows the need for further training in all subjects. More focus is needed on Math, English & Science of Class V and Math, Science & English Class IV.
Table 4: Assessment of professional need for teachers training
Area of Need
Teach-ing Methods
Multi Grade Teach-ing
Prepara-tion & Use of Teaching Aids
Exam. Steps
Preparation of School Record
Comm-unity Partici-pation
Yes Freque-ncy
76 110 98 91 104 65
% 38% 55% 49% 40.5% 52% 32.5%
No Freque-ncy
124 90 102
109 96 135
% 62% 45% 51% 54.5% 48% 67.5%
Table 4 indicates that 55% teachers need training in multi grade teaching, 49% teachers need further training for the preparation and use of teaching aids, 52% teachers need training in preparation of school record while less but not least number of teachers need training in teaching methods, examination steps, and community participation.
Table 5: Support of teaching/AV aids during in-service teachers
training.
Teaching/ AV aids
Charts Maps Pictures Models
Proj-ector
Slides
Yes Frequ-ency
168 79 105 110 25 17
% 84% 39.5% 52.5% 55% 12.5% 8.5%
No Frequ-ency
32 121 95 90 175 183
% 16% 60.5% 47.5% 45% 82.5% 91.5%

JOURNAL OF EDUCATIONAL RESEARCH (Vol.12, No.1) 2009 Dept Of Education IUB,
Pakistan
44
Teaching/ AV aids
Tape Reco-rder
Radio TV Multim-edia
Comp-uter
Internet
Yes Frequ-ency
13 6 6 9 26 0
% 6.5% 3% 3% 4.5% 23% 0%
No Frequ-ency
187 194 194 191 174 200
% 93.5% 97% 97% 95.5% 87% 100%
Table 5 indicates the opinion of teachers that training was supported by charts, pictures, models while projector, slides, tape recorder, radio, TV, multimedia, computer and internet was not used during the in-service training.
Table 6: Trainees’ opinion about the importance of teaching/
AV aids
Teaching/ AV aids Charts Maps Pict-ures
Models Proj-ector
Slides
Yes Frequency 99 96 85 114 94 62
% 49.5% 48% 42.5%
57% 47% 31%
No Frequency 101 104 115 86 106 138
% 50.5% 52% 57.5%
43% 53% 69%
Teaching/ AV aids Tape Reco-rder
Rad-io
TV Multimedia
Computer
Inter-net
Yes Frequency 82 58 78 77 148 55
% 41% 29% 39% 38.5% 74% 27.5%
No Frequency 118 142 122 123 52 145
% 59% 71% 61% 62.5% 26% 72.5%
Table 6 indicates the opinion of teachers that training may be supported by charts, maps, models, and computer during the in-service training.

JOURNAL OF EDUCATIONAL RESEARCH (Vol.12, No.1) 2009 Dept Of Education IUB,
Pakistan
45
Table 7: Place of in-service teachers training centre
Union Council
Tehsil / Town
District Province National
Current Training Area
15 104 80 0 0
Suggested Training Area
59 100 32 3 2
Table 8: Possibility of in-service training
through distance education ( TV and Radio)
Option Frequency
Yes 164
No 25
Table 9. Opinion about better mode for in-service training
Training in Local Centre
Training Through Distance Education by TV & Radio
Both Methods
51 8 141
Conclusions Quality of teacher training directly affects the quality of teachers’ knowledge, skills and his competence to achieve the goal of quality education in non-formal basic education community schools. On the basis of findings we arrive at the following conclusions:-
1. A wide range of multidimensional topics were tried by trainers during short period of in-service training but the topics became too wide to be completed satisfactorily.
2. In most of the centres the training was not aided by the use of TV, radio, audio tape recorder, projector, transparencies, and multimedia.
3. Most of the teachers expressed the desire that the training should be reinforced by the use of computer.
4. A large number of teachers showed the need for guidance

JOURNAL OF EDUCATIONAL RESEARCH (Vol.12, No.1) 2009 Dept Of Education IUB,
Pakistan
46
and training to improve knowledge of subjects like Mathematics, English, and Science of Class IV and V.
5. Need of further training in the areas of teaching methods, multi-grade teaching, preparation and use of AV aids, examination process, preparation of school record, and community participation was also expressed by the teachers.
6. Most of the teachers showed keen desire for arrangements of training through distance education along with training in local centers.
7. Training centers were situated at district or tehsil headquarters. During the months of June and July, the weather was too hot to carry on the training with ease and peace of mind.
Recommendations
On the basis of findings and conclusions, following recommendations are made to achieve the goals of quality basic education for all in Pakistan:
1. The in-service training programme for NFBE community school teachers may be revisited to focus on and cover the selective topics during the six days training. The teachers need further training for teaching Mathematics, English, and Science to Class IV and V in future.
2. Training in the areas of multi-grade teaching, preparation and use of AV aids, and preparation of school record, may also be given in future.
3. The in-service training be supported by the proper use of modern teaching aids like multimedia, computer etc. to make the teaching learning process more effective.
4. The provincial office may ensure the use of modern AV aids during the teachers training workshops.
5. Use of television and radio as devices of distance education may be considered to make the in-service training more useful as well as cost effective.

JOURNAL OF EDUCATIONAL RESEARCH (Vol.12, No.1) 2009 Dept Of Education IUB,
Pakistan
47
References Burke, G. and Kenzie, Mc. P.(2007). Economics of Quality
Schooling. Paper presented in International Conference on Quality School Education during November 21-23, 2007 at New Delhi. Retrieved on 07-02-2009 from http://www.education.monash.edu.au/centres/ceet/docs/conferencepapers/2007burkemckenzie_uqse_indiapaper191107.pdf.
David Son College, (2008). Licensure in Education. Retrieved on 07-02-2009 from http://www.davidson.edu/academic/education/licensure.html
Government of Pakistan, (1998). National Education Policy 1998-2010, Islamabad Ministry of Education
Government of Pakistan, (2008). Economic Survey of Pakistan 2007-08, Islamabad; Ministry of Planning
Government of Pakistan, (2009). Economic Survey of Pakistan 2008-09, Islamabad; Ministry of Planning
Jamani, N.B.(2007). Study on the Classroom Methdology of Secondary School Teachers Trained through Distance Education. Journal of Educational Research Vol. 10(1). Bahawalpur: Islamia University.
Malik, M.A., Gujjar, A.A, & Adeeb, M.A (2008). Role of
Instructional Technology in Distance Teachers training
programme. Paper presented in “International Conference on Computer and Instructional Technologies-2008” Izmir: Ege University.
Ministry of Education, (1979). National Education Policy 1979. Islamabad: Ministry of Education.
Ministry of Education, (1990). Teacher Education in Pakistan. Islamabad: Government of Pakistan.
Ministry of Education, (1992). National Education Policy 1992. Islamabad: Ministry of Education.
Ministry of Education, (1998). Iqra National Education Policy 1998-
2010. Islamabad: Ministry of Education. Ministry of Education, (2001). Education Sector Reforms 2002-
2006. Islamabad: Ministry of Education. Ministry of Education, (2001). Perspective Plan 2001-2011.
Islamabad: Ministry of Education.

JOURNAL OF EDUCATIONAL RESEARCH (Vol.12, No.1) 2009 Dept Of Education IUB,
Pakistan
48
Ministry of Education, (2008). White Paper National Education
Policy 2008. Islamabad: Ministry of Education. Mirza, M. & Iqbal, M.H. (1994). A Study on Evaluation of Present
In-service Training Programme for Teachers and
Development of more Cost Effective Method of INSET at
Various Levels. Lahore: Directorate of Staff Development. Mirza, M.S.(2003). Quality of Primary Education in Pakistan.
Islamabad: Ministry of Education, Government of Pakistan in collaboration with UNESCO.
Mirza, M.S. (2008). Quality Education at Primary Level.
Proceedings of International Conference on Embedding Quality Education for All: District Initiatives across Pakistan March 5-6, 2008 at Fasilabad. Retrieved on 07-02-2009 from http://www.faisalabad.gov.pk/download.aspx?fId=284&fPath=/FilesCollection/Sections/Education/Reports/edu_conf_proceedings.pdf.
National Education Foundation, (2009). Basic Education Community
Schools’ Policy-2009. Letter No. Dated.10-01-2009. Lahore: National Education Foundation, BECS Project, Punjab .
Nuzhat, R. et al.(2007). Teacher Guide for Non-formal Basic
Education. Islamabad: Basic Education Community School Project, Ministry of Education.
Rashid, M.(2006). Effectiveness of Non-Formal Education through the use of Instructional Media. Pakistan Journal of
Education, XXIII (I). Islamabad. Allama Iqbal Open University.
Saeed, M. & Salamat, S. (2006). Evaluation of In-service Training Programme and its Impact on Head Teachers’ Performance at Secondary School Level. Journal of Educational
Research. 9(1). Bahawalpur: Department of Education, the Islamia University.
Saeed, M.(2000). A report on the monitoring of pre-service practices in Govt. Colleges for teachers training of Punjab. Lahore: Directorate of Staff Development.
Tariq, M. Brg.(2008). Master Trainer Manual: Training Workshop
for Basic Education Community School Teachers. Lahore: National Education Foundation.
UNESCO. (1990). The World Declaration on Education for All. Paris: UNESCO.

JOURNAL OF EDUCATIONAL RESEARCH (Vol.12, No.1) 2009 Dept Of Education IUB,
Pakistan
49
UNESCO. (2000). World Education Forum: Dakar Framework for
Action 2000. Paris: UNESCO. UNESCO. (2001). E-9 Ministerial Review Meeting 2001, Beijing,
China: Report. Retrieved on 07-02-2009 from http://unesdoc.unesco.org/images/0012/001242/124211Eo.pdf

JOURNAL OF EDUCATIONAL RESEARCH (Vol.12, No.1) 2009 Dept Of Education IUB,
Pakistan
50
What Teachers and Students Think about Medical and Dental
Admission Test Conducted by ETEA, NWFP, Pakistan
♣Arshad Ali ♣♣Dr. Umar Ali ♣♣♣Lubna Aziz
Abstract The purpose of the study was to ascertain the opinions of teachers &
students of Khyber College of Dentistry, Peshawar, Pakistan about entry
test conducted by Educational Testing and Evaluation Agency (ETEA), from
the last 10 years, as criteria for admission to Dental colleges of NWFP.
Sample of the study was 15 Khyber College of Dentistry (KCD) teachers
who were selected out of 30 teachers through simple random sampling and
140 dental students(representing students from 1st to final year), selected
through Stratified random sampling procedure, in which 60 and 80 were
male and female respectively. The data was collected through two
questionnaires i.e. one for Teachers and another for Students. Questions
were about their opinions about entry test weight age, format, exclusion and
inclusion of subjects in the test and suggestions for the possible
improvement of the entry test. The information collected through the
questionnaires was tabulated and were analyzed in percentage and Chi-
square. Majority of the students were in favour of entry test for selection
while some of the teachers were against entry test. Majority of the students
were satisfied with the existing criteria (F.Sc marks + Entry test marks)
while the number of teachers are in favour of F.Sc marks only. Most of the
students are satisfied with entry test format but the large number of
teachers are not satisfied with entry test format. Higher education
commission (HEC) was recommended by the large number of teachers and
students for conducting entry test instead of ETEA.
Key Words: Entrance Test, Medical and Dental Admission, Khyber College of Dentistry (KCD)
♣ Lecturer Institute of Education and Research (IER), University of Peshawar, NWFP, Pakistan ♣♣ Institute of Education and Research (IER), Gomal University, Dera Ismail Khan, Pakistan ♣♣♣ Institute of Education and Research (IER), University of Peshawar, NWFP, Pakistan

JOURNAL OF EDUCATIONAL RESEARCH (Vol.12, No.1) 2009 Dept Of Education IUB,
Pakistan
51
Introduction Admission to higher education holds far reaching implications and an impact not only on individual, but also on society. The main objective is to seek out, those candidates from the pool of applicants whose academic standard is good, who are highly motivated with potential to become good dentists. The admission system determines who will have access to higher education (Roding, K., 2005, p.2). In Pakistan, the responsibility of maintenance of educational standards of Medical, Nursing, Dental, Pharmaceuticals, Pre-Medical and allied subjects rests on the Federal Government. The Federal Government through Medical and Dental Ordinance XXXII of 1962 has constituted an Authority Known as Medical and Dental Council (PMDC) in Pakistan, which has been entrusted with the responsibility of establishing a uniform standard of basic and higher qualifications in medicine and dentistry. As of September 2008, there were 72 Medical and Dental colleges in Pakistan recognized by the Pakistan Medical & Dental Council (PM&DC).The Province wise detail is presented in the following table:
Province Government Private Total
Punjab 14 18 32
Sindh 10 16 26
NWFP 06 06 12
Balochistan 02 0.0 02
Total 32 40 72
(Source: PM&DC, 2008)
PMDC in exercise of its power under Section 33(2) of the Ordinance, under the heading Admission to Medical and Dental College laid down the following conditions for Admission to Medical and Dental colleges:
• No candidate should be allowed to begin the medical curriculum proper unless:

JOURNAL OF EDUCATIONAL RESEARCH (Vol.12, No.1) 2009 Dept Of Education IUB,
Pakistan
52
• He/She has passed Intermediate Science examination (Pre-Medical group) of a Pakistani university, or an equivalent examination of a Board of Secondary Education in Pakistan.
• He/She has qualified a completely computerized entrance examination.
The final selection of the candidate will be elaborated by adding his performance in the intermediate science (Medical Group) examination and computerized entrance examination. At present there are approximately 28 dental colleges (public & private) throughout Pakistan, according to the Pakistan Medical & Dental Council, the state regulatory body has upwards of 6200 registered dentists. The four year training culminates in achieving a Bachelor of
Dental Surgery (BDS) degree, which also requires a one year compulsory internship to be a registered dentist in Pakistan. In Pakistan, conventionally the scores of intermediate exam; were used to develop a merit list and top students were admitted based in the number of seats in the college/university. Till the mid-nineties, the students of public sector medical colleges were selected on the basis of intermediate exams. Aga Khan University (AKU) started admitting students on the basis of a written admission tests and interview both conducted in-house. The students of AKU performed well in the FCPS and foreign certification examinations and it was thought that besides the curriculum and the teaching methodology, it was their process of student selection that produced better quality doctors. The other private sector universities viz Baqai and Ziauddin also adopted the similar selection procedure (Baig, L A. et al, 2001). Since mid-ninetees the procedure for admissions in medical colleges and engineering institutions has been changed. For admissions now entry tests play a major role in the selection of students joining these professional colleges. Dental Admission Testing in Different Countries Before to ascertain the views of the teachers and students about the entry test, conducted by Educational Testing and Evaluation Agency (ETEA), NWFP, we should know about the entrance test conducted

JOURNAL OF EDUCATIONAL RESEARCH (Vol.12, No.1) 2009 Dept Of Education IUB,
Pakistan
53
in other countries of the world. So, the brief introduction of the entrance test for admission to dental colleges of the few selected countries is presented in the following lines:
1. Dental Admission in USA
Two selection tools, Grade Point Average (GPA) and (entry) test scores; remain prime factors in the admissions process in USA (Wightman, 2003). The admission criteria at the University of Florida, College of Dentistry (UFCD), USA included the undergraduate science grade point average (GPA), undergraduate non-science GPA, Perceptual Motor Aptitude Test (PMAT) score, admission interview score and Dental Admissions Test (DAT) academic score, as mentioned by Sandow, P.L et al (2002). The Dental Admission Test (DAT) is conducted by the American Dental Association (ADA) and has been in operation on a national basis since 1950. According to Kingsley K (2007) time periods in which the DAT is administered and the four tests in the DAT are as follow:
Subtests Time
Survey of Natural Sciences 90 minutes
Perceptual Ability Test 60 minutes
Optional Break 15 minutes
Reading Comprehension Test 60 minutes
Quantitative Reasoning Test 45 minutes
2. Dental Admission in Canada Smithers,S., Catano V.M, & Cunningham(2004) stated that in Canada students are selected upon reference letters, psychomotor skills, perceptual abilities, an interview and measures of academic achievement(GPA and Entrance test). The Canadian Dental Association introduced the Dental Aptitude Test (DAT) for the selection of dental students into dental schools in 1967. This test was developed keeping in view the American Dental Admission Test. At present there are four components in the DAT:

JOURNAL OF EDUCATIONAL RESEARCH (Vol.12, No.1) 2009 Dept Of Education IUB,
Pakistan
54
A. the Survey of Natural Science Examination (biology- and inorganic or general chemistry-based material) B. the Reading Comprehension Examination in the Dental Sciences, C. the Perceptual Motor Ability Component, and D. the Carving Dexterity test. 3. Dental Admission in Korea: In Korea, a standardized aptitude test, Dental Education Eligibility Test (DEET) is used for admission to dental programs. The pattern of this test is similar to those of the Medical College Admission Test (MCAT) and Dental Admission Test (DAT) in the United States. For instance, DEET includes reading comprehension, scientific reasoning parts I and II, and perceptual ability (Minkang K., & Jae I. L., 2007). 4. Dental Admission in India The First Dental College of India, the then Calcutta Dental College and Hospital, was established in Calcutta (presently Kolkata) in the year 1924. It was the first Dental College to be established in Asia. In India, in most states, one has to appear for an entrance test conducted by the Directorate of Medical Education, whereas some autonomous universities conduct their own entrance tests for admission to medical and dental colleges. Dental education in Pakistan History of dentistry in Pakistan starts even before its birth. Pakistan's premier and oldest dental institution 'de'Montmorency college of Dentistry' was established in 1934 at Lahore by then Governor of Punjab Sir Jeff Fitz Harway de' Montmorency. History of dentistry in Pakistan is in fact story of progress of de'Montmorency College of Dentistry. According to the Pakistan Medical & Dental Council, the four year course/training leading to Bachelor of Dental Surgery (BDS) degree, which also requires a one year compulsory internship to be a registered dentist in Pakistan. Admission Policy of NWFP Medical/ Dental Colleges Medical/Dental Colleges of NWFP offer 5 year/4 years course leading to MBBS/BDS degree respectively and are affiliated with different universities of NWFP. Admission to the public sector

JOURNAL OF EDUCATIONAL RESEARCH (Vol.12, No.1) 2009 Dept Of Education IUB,
Pakistan
55
Medical/Dental Colleges of NWFP is finalized by the Joint Admission Committee (JAC).The Admission Policy is applicable to all NWFP Medical & Dental Colleges under the administrative control of Government of NWFP namely: i. Khyber Medical College (KMC) Peshawar ii. Ayub Medical College (AMC) Abbott Abad iii. Saidu Medical College (SMC) Swat iv. Gomal Medical College (GMC) DI Khan v. Khyber Girls Medical College Peshawar vi. Khyber College of Dentistry (KCD) Peshawar vii. Dental Section Ayub Medical College, Abbott Abad viii. Bannu Medical College, Bannu Old Criteria for admission
According to old criteria the scores of intermediate exam; were used to develop a merit list and top students were admitted based in the number of seats in the college/university. Prospects of Khyber Medical College (Session1994-1995) mentioned the following criteria for medical and dental colleges’ admissions:
1st Preference Inter Science (Pre-Medical Group) adjusted marks 660 and above.
2nd Preference B.Sc (Biological Science with inter Science Medical Group) adjusted marks 330 and above.
3rd Preference Inter Science (Pre-Medical Group) adjusted marks 550 and above.
4th Preference B.Sc (Biological Science with inter Science pre Medical Group) adjusted marks 275 and above (p. 54).
New Criteria for admission since 1996
Apart from the regulations framed by PMDC which demanded for entry test for admission to MBBS/BDS classes and which became effective from academic year 1987,the provincial Government of NWFP issued a notification on 2-09-1996 providing for introduction

JOURNAL OF EDUCATIONAL RESEARCH (Vol.12, No.1) 2009 Dept Of Education IUB,
Pakistan
56
of entry test for admission to Medical and Dental colleges of NWFP from the academic year 1996-97 which was as follows:
The Government of NWFP is pleased to direct that an entry test shall be introduced in Medical and Dental colleges of NWFP from the next academic year 1996-97. It has further been decided that:
1. All candidates seeking admission to Medical and Dental colleges shall have to qualify the entry test.
2. In order to qualifying the entrance test, a candidate must
secure at least 40% marks in the prescribed test. If a candidate fails in the prescribed entry test, he will not be eligible for admission in the respective college. The eligibility for appearing in the entry test for medical/Dental colleges shall be 60% marks in F.Sc.
3. In the entry test basic Mathematics of Matric standard with
only 5% Weight age will be included 4. The Merit of the candidate for admission shall be determined
in the following manner: 5.
Marks of Weight age
SSC or equivalent level examination
10%
F.Sc or equivalent examination
50%
Entrance Test 40%
In the light of above notification the entrance test was introduced in the Medical and Dental colleges of NWFP from the academic year 1996-97 as mentioned in the prospects of Khyber Medical College, 1996 in these words “There will be a combined entry test for admission into first year MBBS classes of Khyber Medical College / Ayub Medical College / Khyber College of Dentistry and other medical colleges in public/ private sector” (p.63). Consequently,

JOURNAL OF EDUCATIONAL RESEARCH (Vol.12, No.1) 2009 Dept Of Education IUB,
Pakistan
57
from the Academic year 1996-97 the entrance test is mandatory for admission to medical colleges of NWFP. For the Academic year 1996-97 and 1997-98, entrance test for admission to medical colleges of NWFP was designed and administered by the well known –reputed institution, Agha Khan Medical College, Karachi. After that, since 1998, ETEA has been conducted these test for medical and Engineering admissions.
Educational Testing and Evaluation Agency (ETEA) ETEA of the NWFP is an independent and autonomous educational body established by the Government of NWFP for the development of resources and systems for the conduct of educational evaluation and testing for the educational institutions in a transparent, uninfluenced and academically sound manner. The Agency is responsible for the educational evaluation of educational institutions in general, and for admission to the professional institutions providing Medical and Engineering education in particular. ETEA has been conducting Entrance Tests for admission to the NWFP University of Engineering and Technology and to the Medical and Dental Colleges of NWFP since 1998. It has also been conducting Entrance Tests for admission to the Undergraduate and Graduate Programmes of IMS, Hayatabad. Tests for selection of Lecturers, IT Teachers and for admission to Quality Education Institutions have also been conducted by ETEA. (p.2) The Entrance test composed of Multiple- Choice Items. The test contains four subtests: Physics Chemistry, Biology and now recently English section also has been added. The following Table shows the subsections, total questions and marks for Medical/Dental entry test.
Subtests Total Questions Total marks
Physics 60 240 Chemistry 60 240
Biology 60 240
English 20 080
Total 200 800
(Source: ETEA Students Guide for Entry Test 2008)

JOURNAL OF EDUCATIONAL RESEARCH (Vol.12, No.1) 2009 Dept Of Education IUB,
Pakistan
58
Statement of the Study
Admission testing has generated substantial public debate and many people have expressed concern about the fairness of standardized test, about test bias, and about over reliance on multiple-choice test scores in admission decision making. The purpose of the study was to ascertain the opinions of teachers & students of Khyber College of dentistry about entry test conducted by ETEA as criteria for admission to Dental colleges of NWFP. Significance of the Study:
To conduct this research the expected results of the study are following.
1 The study will provide valuable information about the current status of entry test for selection of dentistry students
2 It wills help the directors & administration of KCD to improve the selection criteria for admission.
3 The study will provide feed back to the administration of ETEA for the Improvement of the quality of entry test
4. To suggest suitable criterion for admission in lighted for student and teachers views about entry test.
Delimitation of the Study
1. There are two Government and one private dentistry colleges recognized by PMDC in NWFP, but due to limited time and resources the study was delimited to Khyber College of Dentistry, Peshawar
2. The data was collected from the students of session 2007- 08
only.
Method and Procedure
It was a survey type “Descriptive type research” in nature. It involves collection analyzing and interpretation of data in order to find out the views of K.C.D teacher and students about entry test conducted from last 10 years by ETEA for admission to K.C.D. All

JOURNAL OF EDUCATIONAL RESEARCH (Vol.12, No.1) 2009 Dept Of Education IUB,
Pakistan
59
teachers and students (from first to final year) of Khyber college of dentistry (KCD), Peshawar was the population of this study.
Sample Sample of the study was 15 Khyber College of Dentistry (KCD) teachers who were selected out of 30 teachers through simple random sampling and 140 dental students, selected through Stratified random sampling procedure, in which 60 and 80 were male and female respectively.
The detail is given in the following table:
Academic Year
Male Female Total
1st year 15 20 35
2nd year 15 20 35
3rd year 15 20 35
Final year 15 20 35
Total 60 80 140
Research Tools For collection of the requisite information on the subject two questionnaires were prepared; i.e. one for Teachers and another for Students. Questions were about their opinions about entry test weight age, format, exclusion and inclusion of subjects in the test and suggestions for the possible improvement of the entry test. Data Analysis
The information collected through the questionnaires was tabulated and were analyzed in percentages. Results and Discussion
The information collected through the questionnaires were tabulated and analyzed as follows:

JOURNAL OF EDUCATIONAL RESEARCH (Vol.12, No.1) 2009 Dept Of Education IUB,
Pakistan
60
Category A: Teachers Responses: The table -1 shows that Sixty percent teachers were in favor of entry test While 40% teachers were against the entry test as part of criteria for selection.
The table-2 indicates that 40% teachers recommended only F.Sc.
marks. 53.3% teachers agree with existing criteria and 6.66%
teachers want any other criteria.
Table-1: Entry test necessary for selection
Description Responses %age
Yes 9 60 %
No 6 40%
Table:-2: View of Teachers about Criteria for
Selection
Description Responses %age
Only F.Sc Marks
6 40%
Only entry test marks
0 0
Existing criteria
8 53.3%
Any other 1 6.66%
Table-3 shows that 73.3% teachers were not satisfied with entry test format while 26.6% teachers were satisfied from entry test format.
Table-4 indicates that 60% teacher recommended HEC for conducting entry test. While 26.6% teachers suggest ETEA and 13.3% teachers recommended KMC.
Table-3: Are you satisfied with entry test?
Description Response %age
Yes 4 26.6%
No 11 73.3%

JOURNAL OF EDUCATIONAL RESEARCH (Vol.12, No.1) 2009 Dept Of Education IUB,
Pakistan
61
Table-4: Who should conduct entry test?
Description Responses % age
ETEA 4 26.6%
KMC 2 13.3%
Any Other(HEC) 9 60%
Category B: student responses
Table number-5 shows 84% Students attended coaching classes for entry test 15.7 % students did not attend coaching classes for entry test.
Table number-6 shows 66.4% Students agreed with the entry test for selection and 33.5% students did not agree with the entry test for selection.
Table-5: Have you attended coaching classes for entry test?
Description Male %age Female %age Total
Yes 48 80% 70 87.5% 84%
No 12 20% 10 12.5% 15.7%
Table-6: Entry Testy is Necessary for Selection
Description Male %age Female %age Total
Yes 38 63.3% 55 68.7% 66.4%
No 22 36% 25 31.5% 33.5%
Table-7 illustrates that 38% students were in the favour of F.Sc Marks, 36% Students wants both marks (F.Sc + Entry Test Marks) while 12% students were in favor entry test marks and 8.57% students want any other criteria for selection.

JOURNAL OF EDUCATIONAL RESEARCH (Vol.12, No.1) 2009 Dept Of Education IUB,
Pakistan
62
Table-7: Criteria for Selection.
Description Male %age Female %age Total
F.Sc Marks 19 36.6% 35 43.3% 38%
Entry Test 09 15% 8 10% 12%
Both F.Sc + Entry Test 21 35% 30 37.5% 36%
Any other 5 8.35 7 9% 8.57%
Table-8: Weightage of entry Test.
Description Male %age Female %age Total
20% 3 5% 0 0% 2%
30% 6 10% 16 20% 15%
40% 31 51.6% 46 57.5% 55%
60% 19 31.6 18 22.5% 26%
It is obvious from the table-8 that 55% students suggested 40% weight age, 26% students suggested 60% weight age, 15% students suggest 30% weight age, and 2% students suggested 20% weight age of entry test in the admission criteria.
Table-9 indicates that 56.4% students were of the view that they are not satisfied with entry test format while 43% students have shown satisfaction with entry test format.
Table-9: Whether Students Are Satisfied From Entry Test Format
Description Male %Age Female %Age Total
Yes 28 46.6% 33 41.2% 43%
No 32 53.3% 47 58.7% 56.4%

JOURNAL OF EDUCATIONAL RESEARCH (Vol.12, No.1) 2009 Dept Of Education IUB,
Pakistan
63
Table-10: Institute Recommend for Entry Test
Description Male %Age Female %Age Total
ETEA 15 25% 27 33.7% 30%
KMC 14 23.3% 24 30% 27%
Any other (HEC)
31 51.6% 29 36.2% 42.8%
Table No-10 shows that 42.8% students recommend HEC for conducting entry test while 30% students suggest ETEA and 27% students want KMC for conducting entry test. Conclusion
The analysis of the data collected thorough questionnaire from teachers and students of K.C.D about the entry test conducted by ETEA led the researcher to draw the conclusion that Most of the students attend coaching classes for preparation of entry test. Majority of the students were in favour of entry test for selection while some of the teachers were against of the entry test. Majority of the students were satisfied with the existing criteria (F.Sc marks + Entry test marks) while the number of teachers are in the favour of F.Sc marks only. Most of the students are satisfied with entry test format but the number of teachers is not satisfied with entry test format. Higher education commission is recommended by the large number of teachers and students for conducting entry test instead of ETEA.
Recommendations In the light of above mentioned analysis and conclusion the following suggestions are herby recommended for the improvement of admission process of Medical and Dental Colleges of NWFP.
• H.E.C should be involved in monitoring of the entry test conduction process.

JOURNAL OF EDUCATIONAL RESEARCH (Vol.12, No.1) 2009 Dept Of Education IUB,
Pakistan
64
• Seminars should be arranged for teachers to construct high quality test items for entry test.
• Strict Disciplinary action may be taken against those who involved in Unfair Means of entry test conduction process.
• For the improvement of entry test format there should be specific budget allocation for the test
• Examination centers should be increased according to the number of students.
• Research studies may be conducted on “Item Analysis” of the test items (Questions), to identify the defects of test questions/Items and improve the quality of test items.
• Proper guidance/training may be given to students about the entrance test.
• The selection process should attempt to identify both Academic and Nonacademic qualities of the applicants.
Reference Baig, L. A. Ghouri, G.H, Fehmida, T and Nargis, A. (2001). Is the
admission test at institute of business Administration a good
predictor of final professional test grades? Pakistan Journal of Medical Sciences, Vol 17, No.3, p.160. Dentistry_Throughout_the_World:Dentistry_in_Pakistan: Retrieved from: http://en.wikipedia.org/wiki/Dentistry_throughout_the_world#Dentistry_in_ Pakistan Dated: 11-9-2008
Educational Testing and Evaluation Agency, (2005). Entrance Tests
2002-2004. Evaluation Report Peshawar: Author. Educational Testing and Evaluation Agency (n.d) Students Guide for
Entry Test, Peshawar: Author. Government of NWFP (2nd September, 1996).Notification No. SO-II
(Health)/-2/96-96.Peshawar: Health Department Khyber Medical College (1994) Prospects 1994-1995.KMC,

JOURNAL OF EDUCATIONAL RESEARCH (Vol.12, No.1) 2009 Dept Of Education IUB,
Pakistan
65
Peshawar. Khyber Medical College (1996) Prospects 1996-1997.KMC,
Peshawar. Kingsley K, Sewell J, Ditmyer M, O'Malley S, Galbraith GM. (Apr;
2007) Journal of Dental Education.71 (4):492-500 Retrieved from: http://www.ncbi.nlm.nih.gov/sites/entrez dated 3-9-2008
Minkang K., & Jae I. L. (April, 2007). Variables Predicting
Students’ First Semester Achievement in a Graduate-Entry
Dental School in Korea. Journal of Dental Education; American Assn. of Dental Schools. United States 71(4): 550-556 Retrieved from: http://www.jdentaled.org/cgi/content/abstract dated: 31-08-08
Roding, K. (2005). University Admission Based on Test and
Interview: Implementation And Assessment, Medical Management Centre, Karolinska, Stockholm, Sweden
Sandow PL, Jones AC, Peek CW, Courts FJ, Watson RE (Mar; 2002). Correlation of Admission Criteria with Dental School
Performance and Attrition. Journal of Dental Education.66 (3):385-92 Retrieved from: http://www.ncbi.nlm.nih.gov/pubmed/ Dated: 3-9-2008
Smithers, S. Catano, V. M. & Cunningham (June, 2004). What
Predicts Performance in Canadian Dental Schools? Journal
of Dental Education; Volume 68, Number 6 598-613 from: http://www.jdentaled.org/cgi/reprint/68/6/598 Dated: 26/08/2008
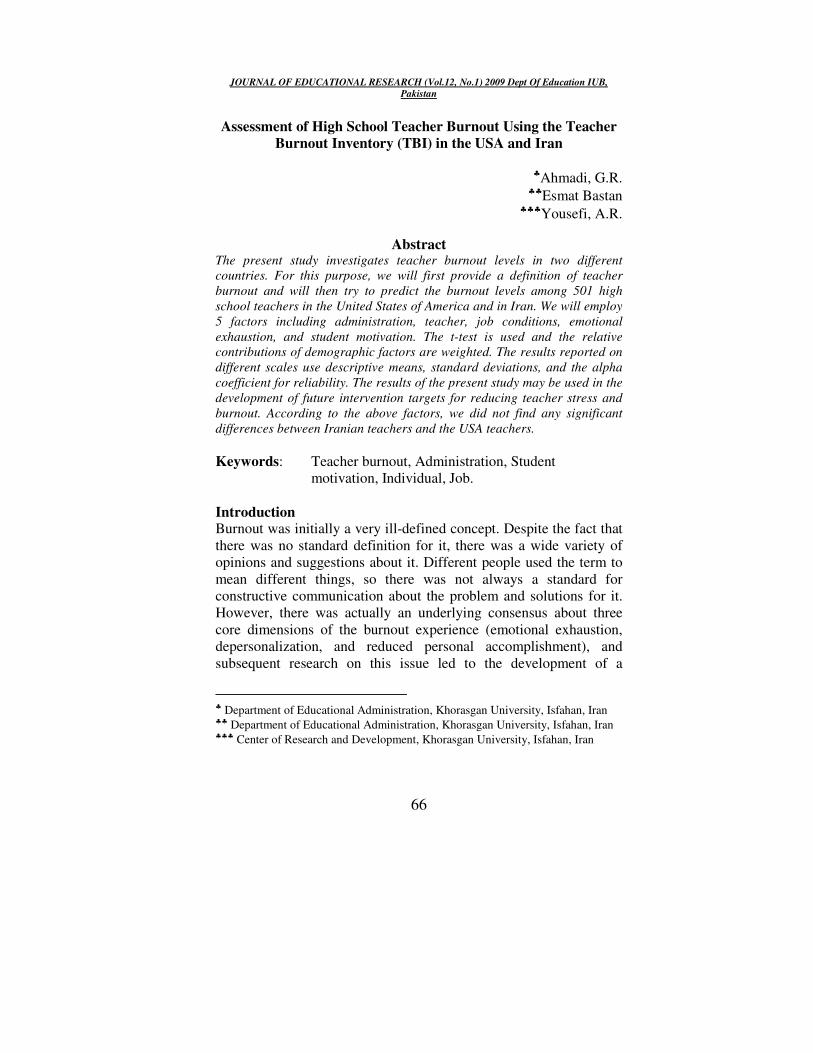
JOURNAL OF EDUCATIONAL RESEARCH (Vol.12, No.1) 2009 Dept Of Education IUB,
Pakistan
66
Assessment of High School Teacher Burnout Using the Teacher
Burnout Inventory (TBI) in the USA and Iran
♣Ahmadi, G.R.
♣♣Esmat Bastan ♣♣♣Yousefi, A.R.
Abstract The present study investigates teacher burnout levels in two different
countries. For this purpose, we will first provide a definition of teacher
burnout and will then try to predict the burnout levels among 501 high
school teachers in the United States of America and in Iran. We will employ
5 factors including administration, teacher, job conditions, emotional
exhaustion, and student motivation. The t-test is used and the relative
contributions of demographic factors are weighted. The results reported on
different scales use descriptive means, standard deviations, and the alpha
coefficient for reliability. The results of the present study may be used in the
development of future intervention targets for reducing teacher stress and
burnout. According to the above factors, we did not find any significant
differences between Iranian teachers and the USA teachers.
Keywords: Teacher burnout, Administration, Student
motivation, Individual, Job.
Introduction Burnout was initially a very ill-defined concept. Despite the fact that there was no standard definition for it, there was a wide variety of opinions and suggestions about it. Different people used the term to mean different things, so there was not always a standard for constructive communication about the problem and solutions for it. However, there was actually an underlying consensus about three core dimensions of the burnout experience (emotional exhaustion, depersonalization, and reduced personal accomplishment), and subsequent research on this issue led to the development of a
♣ Department of Educational Administration, Khorasgan University, Isfahan, Iran ♣♣ Department of Educational Administration, Khorasgan University, Isfahan, Iran ♣♣♣ Center of Research and Development, Khorasgan University, Isfahan, Iran

JOURNAL OF EDUCATIONAL RESEARCH (Vol.12, No.1) 2009 Dept Of Education IUB,
Pakistan
67
multidimensional theory of burnout. This theoretical framework continues to be predominant in the study of burnout (Maslach, 1998). The earliest research relating to “burnout” was done in the United States in the 1970’s. In the beginning, the goal was to define burnout and to demonstrate that it is not an uncommon response to stress. Since 1980’s, teacher stress and burnout has increasingly been recognized as a significant issue and even a global concern in recent years (e.g., Boyle, Borg, Falzon, & Baglioni, 1995; Kyriacou, 2001). Job satisfaction has always been a significant factor in quality of performance and a person’s overall happiness. The word "burnout" was first utilized in 1961 by author Greene in his novel “A Burnout Case” in which a spiritually and disillusioned architect dwells in an African Jungle after quitting his job. Loss of passion for one’s job and “burnout” were used to describe the same phenomenon. Long before becoming a focus of systematic study by researchers, the burnout issue was a social problem and was identified by human service practitioners (Maslach, 2001). Administrators in academic fields should be aware of symptoms of burnout, because the problem among educators has costly consequences including emotional, attitudinal, and physical exhaustion for both the teachers and those with whom she/he works. Individual consequences of burnout include physiological and psychological, problems (Schonfeld, 2001a). In addition, the correlation between an individual’s job satisfaction and his/her psychological well-being was investigated by Blasé, 1982. If not identified or recognized, burnout could have adverse effects on a person’s social and family relations (Cano-Garcia, Padilla-Munoz, & Carrasco-Ortiz, 2005). Individuals with burnout often reported common symptoms including headache, frequent colds, and flu, or even serious cardiovascular problems (Hock, 1988; Schonfeld, 2001). Besides physical harm, there was financial damage caused by increased teacher absenteeism, turnover, career change, mental health and medical claims, deteriorating performance, and early retirement (Leithwood, Menzies, Jantzi, & Leithwood, 1999). Furthermore, teachers’ decreased tolerance for behavior problems is a consequence of burnout. While up to a third of the teachers surveyed in various studies have indicated that they regarded teaching as highly stressful, teachers

JOURNAL OF EDUCATIONAL RESEARCH (Vol.12, No.1) 2009 Dept Of Education IUB,
Pakistan
68
differ markedly in the way they manage stress in the teaching profession (Milstein & Farkas, 1988). The negative affective experience or condition of physical and emotional exhaustion, with the accompanying negative attitudes, can be described as burnout (see, e.g., Bakker, Schaufeli, Sixma, & Bosveld, 2001). Several studies have shown how teachers' cognitive structures may contribute to the development of experiences of stress and burnout McGuire (1979) first warned that public school teachers were experiencing a significant degree of burnout. Since that time, teachers report primary concerns that are closely linked to burnout, such as lack of support and poor working conditions (Alliance for Excellent Education, 2005). This is a critical issue as teacher stressors are related to high turnover in the profession. Ahmadi et al. (2001) studied the different factors effecting job burnout among many teachers of human sciences and applied sciences in secondary schools in (Iran). The results of this study showed that the effects of administration and teaching subject on burnout were not important factors, whereas job-related factors and student motivation were meaningful. In addition, they the male teachers were more affected by the burnout factors than females. The aim of the present study is to gain further understanding of the most prominent factors of teacher burnout including administration, individual, job, emotional exhaustion, and student motivation. The variables evaluated for each of the factors are: age, gender, years of teaching, last degree, and marital status. In an attempt to better understand burnout issues, the relationships among all the studied factors and the variables were measured.
Methodology
Participants Participants included 501 professionals teachers 252 participants were from the USA and 249 participants were from Iran. A summary of the participants' demographic information is presented in Table.

JOURNAL OF EDUCATIONAL RESEARCH (Vol.12, No.1) 2009 Dept Of Education IUB,
Pakistan
69
Summary of Demographic Descriptive Statistics Table 1 Sex
Frequency Percent Valid
Percent Cumulative
Percent
Male 220 43.9 43.9 43.9
Female 281 56.1 56.1 100.0
Total
501
100.0
100.0
Table 1 showed about 56% was female and 44% was male.
Table 2 Age
Frequency Percent Valid Percent Cumulative
Percent
20-30 57 11.4 11.7 11.7 31-40 161 32.1 33.1 44.9 41-50 170 33.9 35.0 79.8 51-60 85 17.0 17.5 97.3 <61 13 2.6 2.7 100.0
Total
486
97.0
100.0
Missing
15 3.0
Total
501 100.0
Table 2 showed about 40% had 41-50 years old and about 32% had 31-40 years old and the other had deferent age.

JOURNAL OF EDUCATIONAL RESEARCH (Vol.12, No.1) 2009 Dept Of Education IUB,
Pakistan
70
Table 3 Years of teaching
Frequency Percent Valid
Percent Cumulative
Percent
<5 42 8.4 8.5 8.5 5-10 83 16.6 16.7 25.2
11-15 79 15.8 15.9 41.0 16-20 107 21.4 21.5 62.6 21-25 104 20.8 20.9 83.5 26-30 69 13.8 13.9 97.4 >30 13 2.6 2.6 100.0
Total
497
99.2
100.0
Missing
4
0.8
Total
501
100.0
Table 3 showed about 56% had 11-25 years experience.
Table 4 degree
Frequency Percent Valid
Percent Cumulative
Percent
0.00 8 1.6 1.6 1.6
BS, BA 316 63.1 63.1 64.7
MS, MA 157 31.3 31.3 96.0
Ed's 15 3.0 3.0 99.0
PhD 5 1.0 1.0 100.0
Total
501
100.0
100.0
Table 5 showed about 63% had BA or BS degree and the other had different degree.
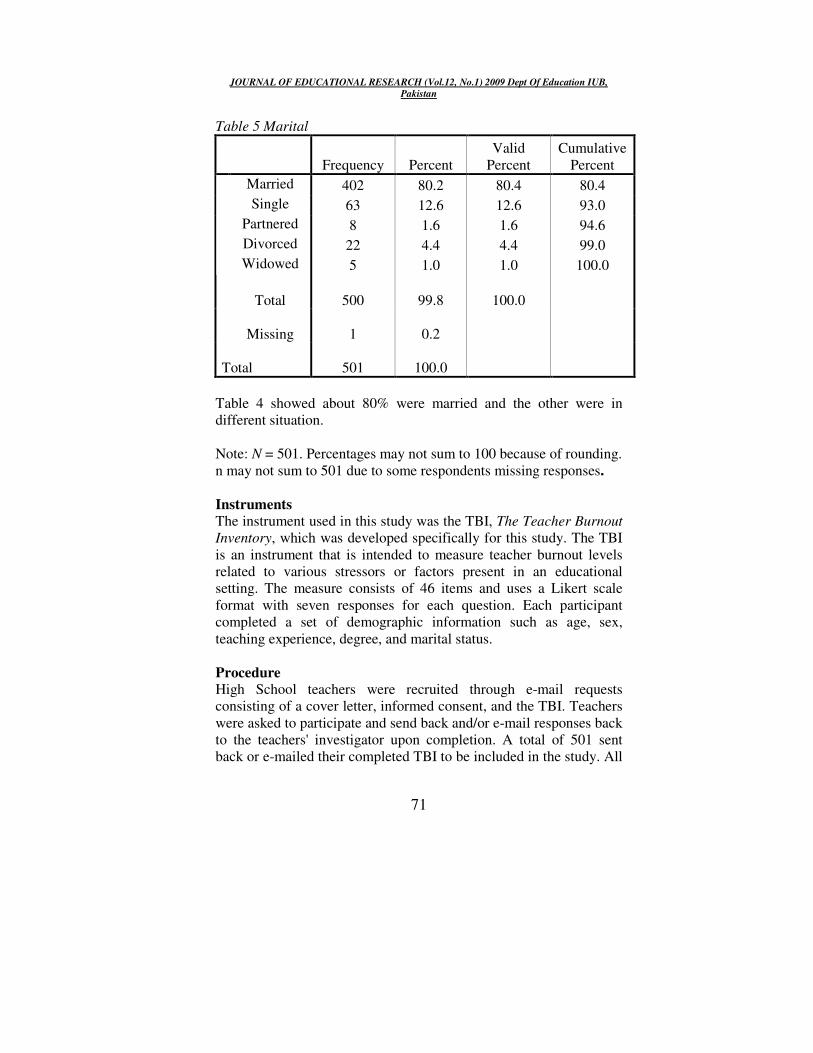
JOURNAL OF EDUCATIONAL RESEARCH (Vol.12, No.1) 2009 Dept Of Education IUB,
Pakistan
71
Table 5 Marital
Frequency Percent Valid
Percent Cumulative
Percent
Married 402 80.2 80.4 80.4
Single 63 12.6 12.6 93.0
Partnered 8 1.6 1.6 94.6
Divorced 22 4.4 4.4 99.0
Widowed 5 1.0 1.0 100.0
Total
500
99.8
100.0
Missing
1
0.2
Total
501
100.0
Table 4 showed about 80% were married and the other were in different situation. Note: N = 501. Percentages may not sum to 100 because of rounding. n may not sum to 501 due to some respondents missing responses. Instruments
The instrument used in this study was the TBI, The Teacher Burnout
Inventory, which was developed specifically for this study. The TBI is an instrument that is intended to measure teacher burnout levels related to various stressors or factors present in an educational setting. The measure consists of 46 items and uses a Likert scale format with seven responses for each question. Each participant completed a set of demographic information such as age, sex, teaching experience, degree, and marital status.
Procedure
High School teachers were recruited through e-mail requests consisting of a cover letter, informed consent, and the TBI. Teachers were asked to participate and send back and/or e-mail responses back to the teachers' investigator upon completion. A total of 501 sent back or e-mailed their completed TBI to be included in the study. All

JOURNAL OF EDUCATIONAL RESEARCH (Vol.12, No.1) 2009 Dept Of Education IUB,
Pakistan
72
participant results were kept in the strictest of confidence and all surveys were completed anonymously.
Results A summary of the demographic variable data are presented in Table 1. Summary normative sample data on the TBI are presented in Table 6. Values are given for the entire sample. T-test was used to differences on the TBI and the results showed that there were no significance differences between the results of Iran and the USA teachers. Further analysis of group differences on the TBI are discussed later in the results section.
Table 6: Normative Data on TBI
Instrument- Scale Sample M (SD) Range Cronbach's Alpha
Total 2.3 (0.65) 38-186 0.88
Motivation 2.79 (1.04) 2-36 0.78
Administration 2.06 (1.03) 0-45 0.88
Job 2.31 (0.68) 4-48 0.72
Emotional 2.31 (0.91) 10-62 0.73
Individual 0.53 1.64 (0.86) 0-29
As Table 6 showed the TBI have internal consistency instead of individual. Table 7: Administration
Sig. (2-tailed)
t Std. Deviation
mean
0.602 0.521 1.02 1.88 American
0.849 0.191 1.02 2.24 Iran
0.000 3.919 1.03 2.06 Total

JOURNAL OF EDUCATIONAL RESEARCH (Vol.12, No.1) 2009 Dept Of Education IUB,
Pakistan
73
Table 7 showed on the Administration scale, scores can range from 0 to 48 (eight items). On this scale, the sample mean value was 2.06 (SD=1.03) with a range of scores from 0 to 45. T-test was also used to analyze the group differences on this scale. The t-test results for the Administration scale showed that the calculated t=3.92 and sing (2-tailed) = 0.0 Therefore, there was no significant difference observed between the Iranian and American teachers.
Table 8: Job
Sig. (2-tailed)
T Std. Deviation
Mean
0.584 0.325 0.66 2.23 American
0.001 3.517 0.70 2.38 Iran
0.000 5.88 0.65 2.13 Total
Table 8 showed on the Job scale, scores can range from 0 to 66 (eleven items). On this scale, the sample mean was 2.13 (SD = 0.65) with a range of scores from 4 to 48. T-test was also used to analyze the group differences on this scale. The t-test results for the Job scale showed that the calculated t=5.88 and sing (2-tailed) = 0. Therefore, no significant differences were observed between Iranian and American teachers. Table 9: Motivation
Sig. (2-tailed)
T Std. Deviation
mean
0.465 0.731
1.05 2.74 American
0.876 0.157 1.02 2.84 Iran
0.000 3.79 1.04 2.79 Total

JOURNAL OF EDUCATIONAL RESEARCH (Vol.12, No.1) 2009 Dept Of Education IUB,
Pakistan
74
Table 9 showed on the Motivation scale, scores can range from 0 to 36 (six items). On this scale, the sample mean was 2.79 (SD = 1.04) with a range of scores from 2 to 36. T-test was also used to analyze the group differences on the Motivation scale. The t-test results for the Motivation scale showed that the calculated t = 3.97 and sing (2-tailed) = 0. Therefore, no significant differences were observed between Iranian and American teachers on the Motivation scale. Table 10: Emotional
Sig. (2-tailed)
T Std. Deviation
mean
0.789 0.268 0.75 2.09 American
0.244 1.167 1.00 2.74 Iran
0.000 3.14 0.91 2.31 Total
Table 10 showed on the Emotional scale, scores can range from 0 to 78 (13 items). On this scale, the sample mean was 2.31 (SD = 0.91) with a range of scores from 10 to 62. T-test was also used to analyze the group differences on this scale. The t-test results for the Emotional scale showed that the calculated t = 3.14 and sing (2-tailed) = 0.002. Therefore, no significant differences were observed between Iranian and the USA teachers for Emotional scale.
Table 11: Individual
Sig. (2-tailed)
T Std. Deviation
mean
0.858 0.179 0/74 1.57 American
0.977 0.029 0.96 1.71 Iran
1.03 1.63 0.86 1.64 Total

JOURNAL OF EDUCATIONAL RESEARCH (Vol.12, No.1) 2009 Dept Of Education IUB,
Pakistan
75
Table 11 showed on the Individual scale, scores can range from 0 to 42 (seven items). On this scale, the sample mean was 1.64 (SD = 0.86) with a range of scores from 0 to 29. T-test was also used to analyze the group differences on the Individual scale. The t-test results for the Individual scale showed that the calculated t = 1.63 and sing (2-tailed) = 1.030. Therefore, there is a significant difference between Iranian and the American teachers for Emotional scale. In addition, the results confirmed that this factor for the Iranian teachers was bigger, because its mean values were bigger than those for the USA teachers. . Table 12: Total
Sig. (2-tailed)
t Std. Deviation
mean
0.745 0.325 0.59 2.11 American
0.373 0.893 0.69 2.42 Iran
0.000 5.20 0.65 2.3 Total
Table 12 showed on the Total Inventory, scores can range from 0 to 276 (46 items). On the Total Inventory, the sample mean was 2.3 (SD = 0.65) with a range of scores from 38 to 186. T-test was also used to analyze the group differences on the Total Inventory. The t-test results for the Total Inventory showed that the calculated t = 5.20 and sing (2-tailed) = 0. Therefore, there is no significant difference between Iranian and American teachers for Total Inventory
Discussion Ahmadi et al. (2001) studied the different factors effecting job burnout among many teachers of human sciences and applied sciences in secondary schools in (Iran). Emotional exhaustion that it is one of the three core dimensions of the burnout experience of the teachers is studied in this project. However this factor has been studied by Maslach as an important factor in teacher burnout (Maslach 1998). In addition, because Job satisfaction has always been a significant factor in quality of performance and a person’s overall happiness (Maslach 2001), this factor also used as an important factors in this study. The third important factor in this

JOURNAL OF EDUCATIONAL RESEARCH (Vol.12, No.1) 2009 Dept Of Education IUB,
Pakistan
76
study was administrators that should be aware of symptoms of burnout (Schonfeld, 2001a). Overall, this study was to explore the use of the TBI to measure high school teacher's levels of burnout and also comparison between the teachers' burnout in the USA and in Iran. While the inventory had some strong support for face validity, the overall alpha scale and of the investigated variables such as administration, job, student motivation, and emotional support internal consistency. For this reason, results and implications could be considered valid. In addition, further study and development of the TBI could be used for more accurate assessment and measurement of levels of teacher burnout. Overall teachers in this current sample were not demonstrating strong levels of teacher burnout for both of the countries surveyed. It was hypothesized that factors such as age, years of teaching experience, degree earned, sex, and marital status could have an impact on the levels of burnout, but none of the analyses resulted in significant group differences, nor were any of the variables significant predictors of teacher burnout. In addition, the author has designed the TBI for measuring level of teacher burnout and further investigations on using, developing, or revising of TBI are warranted. The main reason of the similarity of the teacher burnout results between the USA and Iran is that job security and their level of life expectation of the Iranian teachers. As the Iranian teachers' salary are less than the USA teaches' salary, the satisfaction of the Iranian teachers is the same as the USA teachers.
References Ahmadi, G. R., Rahimifar, M. (2001). Study of human sciences and
applied sciences teachers burnout in secondary schools in
Isfahan (Iran). Alliance for Excellent Education. (2005). Teacher attrition: A costly
loss to the nation and to the states. Retrieved from www.all4ed.orgs
Bakker, A. B., Schaufeli, W. B., Sixma, H. J., & Bosveld, W. (2001). Burnout contagion among general practitioners. Journal of
Social and Clinical Psychology, 20, 82–98.

JOURNAL OF EDUCATIONAL RESEARCH (Vol.12, No.1) 2009 Dept Of Education IUB,
Pakistan
77
Boyle, G. J., Borg, M. G., Falzon, J. M., & Baglioni, A. J., Jr. (1995). A structural model of the dimensions of teacher stress. British Journal of Educational Psychology, 65, 49–67.
Cano-Garcia, F. J., Padilla-Munoz, E. M., & Carrasco-Ortiz, M. A. (2005). Personality and contextual variables in teacher
burnout. Personality and Individual Differences, 38, 929– 940.
Forman, S.G. (1994): Teacher stress management. In M.E. Bernard & R. DiGiuseppe (Eds.), Rational-emotive consultation in
applied settings. Hillsdale, N J: Erl baum. Leithwood, K. A., Menzies, T., Jantzi, D., & Leithwood, J. (1999).
Teacher burnout: A critical challenge for leaders of
restructuring schools. In R. Vandenberghe, & A.M. Huberman (Eds.), Understanding and preventing teacher
burnout: A sourcebook of
international research and practice (pp. 1–13). New York, NY: Cambridge University Press.
Maslach C. 1998. A multidimensional theory of burnout. In Theories
of Organizational Stress, ed. CL Cooper, pp. 68–85. Oxford,UK: Oxford Univ. Maslach C, Schaufeil WB, Leiter MP. Job burnout. Annua lrewiew of psychology, 2001, 52; 397- 422
McGuire, W. H. (1979). Teacher burnout. Today’s Education, 68, 5. Milstein, M. M., & Farkas, J. (1988). The overstated case of educator
stress. Journal of Educational Administration, 26, 232–249 Schonfeld, I. S. (2001). Stress in first-year women teachers: The
context of social support and coping. Genetic,
Social, and General Psychology Monographs, 127, 7547–
8756.

JOURNAL OF EDUCATIONAL RESEARCH (Vol.12, No.1) 2009 Dept Of Education IUB,
Pakistan
78
Comparative Study of Teaching Skills of In-Service Teachers
Trained Through Regular and Distance Mode
§Anupama Bhargava
Abstract Effectiveness of a teacher in the complex classroom situations has
always been an area of interest for researchers. Subject matter
expertise is not the only criteria that effective teacher has to fulfill.
Creating an environment in the classroom where reshaping and
redesigning of knowledge, stimulation of intellectual curiosity,
innovative and independent thinking can take place, is a real
challenge for teachers. To inculcate these attributes in teachers,
teacher training programmes put utmost stress on developing skills
among student teachers. During teaching practice, novice student
teacher uses teaching skills strictly as per guidelines given by
teacher educator, but state of affairs become different in real class
room situations. The present study is designed to take into account
the comparison of in-service teachers trained by regular and
distance mode with respect to use of teaching skills in the classroom.
No significant differences are observed in use of skills of set
induction, illustration with example, recapitulation, blackboard
writing and use of teaching aids. Significant differences at 5 % level
are observed in questioning and evaluation skills.
Key words: Teaching skills, effective teacher, pre service
training, micro teaching Introduction Prime aim of teachers has always been to make student learn effectively and efficiently. To comply with this pursuit, teachers have to be proficient enough in the usage of various teaching skills in the classroom. One of the ways to maximize learning and to achieve the learning objectives is to understand the importance of individual skill and integration of different skills. This holds true even more for
§ Lecturer in Education; St. Xavier`s College, Ranchi

JOURNAL OF EDUCATIONAL RESEARCH (Vol.12, No.1) 2009 Dept Of Education IUB,
Pakistan
79
teachers teaching in secondary classes where to keep students involved in the classroom, a teacher has to deal with topics in such a way to motivate them for discussions, take the help of questions to move ahead and interact, change the sensory focus with the help of teaching aids and above all summarize to help students learn. A thorough knowledge of subject matter is vital for imparting instruction (James & Choppin, 1977). In addition to this, systematic presentation of content matter is another requisite for teaching effectively. To bring forward the instruction in a logical sequenced manner, teaching expertise is essential. Even experienced teachers need to refine this aspect and add value to maximize the effect of teaching in the classroom (Sharma 2000). Effectiveness of teacher behaviour can be judged through two approaches (Van der sijde & Tomic, 1989). The first approach requires finding out efficient use of learnt teaching behaviour (skills) by school teachers. Here emphasis is on the teachers. The second approach deals with outcome of such behaviour on the performance of students. Here onus lies on the effect of teaching on students learning outcome. The qualities of an effective teacher include as the one who is intellectually effective, uses various approaches while teaching and exhibition of high achievement performance by his students. These foremost teaching behaviors have been supported by Rosenshine & Frust (1971), Walberg & Haertal (1990), Good & Brophy (2004) and Borich (1988). A teacher not only affects but also modifies teaching learning environment through personal factors like nature, interest, and code of conduct. Veldman & Peck (1963) have listed five prominent characteristics of an effective teacher: friendly and cheerful, knowledgeable and poised, lively and interesting, firm control and above all non directive. Smith (2002) opined similar views that an effective teacher makes his classroom lively and full of activities. Kuhn’s Process Product Paradigm (1970) also establishes a positive relation between teacher behaviour and student’s achievement in learning. Kwoklun & Lew (1981) revealed that an ideal teacher besides having sound knowledge of subject matter has fluency of speech and is able to develop thought process of students.

JOURNAL OF EDUCATIONAL RESEARCH (Vol.12, No.1) 2009 Dept Of Education IUB,
Pakistan
80
Relevance of teaching skills Effective teaching skills are a precondition for translating theory into practice. Implementation of teaching principles in the classroom is facilitated with certain skills acquired by teachers through education and training. Farooq & Shahzadi (2006) revealed that students of trained teachers are better performer than untrained ones. Set induction, stimulus variation, questioning, illustration with example and closure are the essential teaching skills listed by Allen & Ryan (1969). Passi (1976) identified the following skills essential for a successful teaching: writing instructional objectives, introducing a lesson, questioning, explaining, illustration with example, stimulus variation, reinforcement, using blackboard, closure etc. Verbal & non verbal expressions of a teacher (body language, facial expressions, and gestures) to facilitate learning are called Teaching Skills. These skills can be observed and measured in terms of student’s change in behaviour (objectives realized). This implies that teaching skills are instructional techniques and procedures put to use by teachers to make teaching learning feasible by initiating two way communications between teachers and taught. An insight of when and where to apply relevant teaching skills is used as a yardstick of teacher’s performance. Role of pre service educational training in developing teaching
skills Anderson (1989) stressed the importance of effective teacher training programme in inculcating skills among teachers. Pre service training modules facilitate teachers in understanding various theories of teaching learning, subject matter, principles of curriculum construction, students’ development and application of knowledge (Cooper, 2003; Moore, 2003 & Aggarwal, 1999). Pre service training programmes employ various approaches like simulation techniques, demonstration, interaction analysis and more notably micro teaching to build up teaching skills among student teachers. These learnt skills are reinforced during teaching practice session while preparing lesson plans or teaching in the class room. Much value is attached to proper use & sequence of teaching skills. As a consequence of this constant drill, student teacher makes
JOURNAL OF EDUCATIONAL RESEARCH (Vol.12, No.1) 2009 Dept Of Education IUB,
Pakistan
81
headway in the class with set induction and reaches the closure by giving home assignments. This practice is adopted by both regular and distance mode of teacher training programmes. Microteaching is a skill oriented programme (where content takes a back stage). Intrinsic skills can be mastered by it. Allen (1966) described microteaching as scaled down teaching in terms of content, class size and time. In regular teacher training institutes to develop teaching skills, one skill is demonstrated at a time by teacher educator and later on practiced by student teachers in reduced class size and time. Immediate feedback received from teacher and peer group help in amendments. Re-teaching session which is held after a time interval of an hour strengthens the rectified behaviour. Integrated skill approach followed during teaching practice session later on becomes an irreplaceable part of teacher’s behaviour in the classroom. Sachs (1999) put forth microteaching as an efficacious means to bridge the gap between theory and practice if more progressive and reflective approaches are adopted in teacher education. Distance education teacher training programmes also lay emphasis on skill development among student teachers. For this, workshops are held during contact programmes. In such sessions, attendance of students is made mandatory. Teacher educators from local college or experts from Distance University demonstrate various skills followed by practice and preparation of micro lesson plans based on specific skills by student teachers. Instructions regarding steps followed in lesson plan are also imparted. These academic skills are acquired, sharpened and updated for making teaching learning more competitive Murthy (2008). Objectives
The teaching learning is a complex process consisting of a host of activities to be performed by the teacher. To ensure understanding and assimilation of content matter by students, teachers use various skills. The main thrust areas of this paper are- a) To find out how teaching skills are used differently by the
teachers in the classroom

JOURNAL OF EDUCATIONAL RESEARCH (Vol.12, No.1) 2009 Dept Of Education IUB,
Pakistan
82
b) To investigate significance difference, if any, between teachers trained through regular and distance mode with respect to use of teaching skills.
c) To examine improvisations made by teachers while applying teaching skills in the classroom.
Methodology
The present study is survey based. Sample The population under investigation included secondary school teachers. A sample of 100 secondary school teachers was randomly selected from eight schools of the city. 62 teachers were trained by regular mode while 38 through distance mode. Out of the 8 schools, 3 were Government, 3 were semi-aided and 2 were public schools. 49 teachers from Government Schools, 31 from semi-aided and 20 teachers from public schools responded to the questionnaire. a) Govt. Schools- Schools that are run and managed by state
govt. b) Semi aided missionaries- Schools which are managed by
Christian missionaries but semi aided from the state government.
c) Public Schools- Schools which are managed by societies/ trusts have their own management and do not get aid from the central / state government.
Research Tools used Questionnaire A questionnaire comprising of questions on seven skills practiced in the classroom was developed. To ensure content validity the draft was shown to colleagues who gave suggestions. Then it was applied to a sample of 5 student-teachers to assess the difficulty level and based on the feedback, final version was prepared. Multiple choice questions were incorporated in the questionnaire and teachers were asked to tick the option being practiced by them more often in the class room. In case given choices didn’t suit their methodology,

JOURNAL OF EDUCATIONAL RESEARCH (Vol.12, No.1) 2009 Dept Of Education IUB,
Pakistan
83
blank space was given at the end of alternatives which could be used to write teacher’s own preferred style. In the end, teachers were asked to write in two to three lines on classroom management skill. Statistical Techniques
Cross tabulation analysis for two rows vs. four/ five columns was carried out by applying Chi-square test to find out significance difference between teachers of regular and distance mode in application of teaching skills. The Chi-square test was estimated on the basis of cell frequencies and whenever cell frequency is less than five, Yates correction method has been applied. Results and Findings In this research an investigation was carried out into the different kinds of skills used by student-teachers. The different teaching skills can be broadly classified in the following categories-
a) Basic / fundamental skills- Set induction, illustration with example and blackboard writing are Basic or key skills. These skills form base for other skills which are used by teacher while teaching.
b) Skill for interaction- Questioning is a skill which is
required by teacher to make interaction and communication between teacher and student a two way process.
c) Skills for assessment- Recapitulation and evaluation are the
skills which are utilized by teachers to assess the achievement of teaching objectives in terms of student’s performance.
d) Allied skills- To teach effectively and sustain interest in
teaching learning environment, allied skills play crucial role. These include skills of using teaching aids and skills of classroom management.
The results pertaining to different skills are presented hereunder. Figures in the tables given below denote cell frequencies. Figures in parenthesis are in percentage. Chi square test is based on cell

JOURNAL OF EDUCATIONAL RESEARCH (Vol.12, No.1) 2009 Dept Of Education IUB,
Pakistan
84
frequency. ‘R’ represents Regular mode and ‘D’ represents Distance mode.
Skill of Set induction Table-1 (a) depicts that 6.45 % of teachers (R) and 2.63 % of teachers (D) prefer giving long introduction, while 38.71% of teachers (R) and 44.74% of teachers (D) take more time to introduce complex topic in comparison to easier one. The value of Chi-square of 1.51 depicts no significance.
Table 1(a): Skill of Set induction Use of teaching skills
Mode of Training
Always give short induction
Always give long introduction
Take more time for introducing complex topic than easier
No set pattern
Chi square test
Regular 33.00 (53.23)
4.00 (6.45)
24.00 (38.71)
1.00 (1.61)
Distance 20.00 (52.63)
1.00 (2.63)
17.00 (44.74)
0.00 (0.00)
1.51NS
Total 53.00 5.00 41.00 1.00
Table 1(b): Skill of Set induction Use of teaching skills
Mode of Training
Ask questions based on previous Knowle-
dge
Use examples/ riddle/ story
Direct announcement of topic
No set pattern to introduce
Chi square test
Regular 30.00 (48.39)
19.00 (30.65)
9.00 (14.52)
4.00 (6.45)
Distance 21.00 (55.26)
11.00 (28.95)
6.00 (15.79)
0.00 (0.00)
2.72NS
Total 51.00 30.00 15.00 9.00
Table-1 (b) depicts that 48.39 % of teachers (R) and 55.26 % of teachers (D) ask questions based on previous knowledge while

JOURNAL OF EDUCATIONAL RESEARCH (Vol.12, No.1) 2009 Dept Of Education IUB,
Pakistan
85
30.65% of teachers (R) and 28.95 % of teachers (D) give examples/ riddle / story to introduce a topic. N.C.E.R.T has laid stress on many core teaching skills which include introducing lesson. Illustration with example, questioning, using teaching aids, use of blackboard, evaluation and management of class. Most of the trained teachers whether by regular or distance mode use them in the classroom. Marked differences in use of teaching skills are not prominent among teachers trained by regular and distance mode. In the present study, it is observed that 38.71 percent (regular) and 44.74 percent (distance) teachers take more time to introduce a complex topic in comparison to an easier one as shown in fig. 1(a). For majority of teachers i.e. 48.39 percent (regular) and 55.26 percent (distance), chosen way of set induction is asking questions based on previous knowledge as shown in fig 1 (b). This gives them scope to assess the understanding of students besides maintaining connectivity with previous chapter / content and helps in keeping set induction short.
Skill of Illustration with examples
Table 2: Skill of Illustration with examples Use of teaching skills
Mode of Training
Give many
examples
Don’t give
examples
Give examples
only when
required
No set pattern
Chi square test
Regular 30.00 (48.39)
7.00 (11.29)
25.00 (40.32)
0.00 (0.00)
Distance 18.00 (47.37)
2.00 (5.26)
17.00 (44.74)
1.00 (2.63)
2.70NS
Total 48.00 9.00 42.00 1.00
Table-2 depicts that 11.29 % of teachers (R) and 5.26 % of teachers (D) don’t give examples while teaching while 40.32% of teachers (R) and 40.32 % of teachers (D) give examples only when required.

JOURNAL OF EDUCATIONAL RESEARCH (Vol.12, No.1) 2009 Dept Of Education IUB,
Pakistan
86
Skillful teachers take the help of examples to illustrate idea, concept or principle. An example helps to engage student’s attention provided it is of his level of understanding. 48.39 percent (regular) and 47.37 percent (distance) teachers quote various examples in the classroom, while 40.32 percent (regular) and 44.74 percent (distance) teachers feel that examples should be given only when necessary as shown in fig.2. Skill of Questioning
Table 3(a): Skill of Questioning Use of teaching skills
Mode of Training
Teachers ask many questions
Ask questions
only when
required
No questions asked by teachers
No set pattern
Chi square test
Regular 9.00 (14.52)
46.00 (74.19)
4.00 (6.45)
3.00 (4.84)
Distance 7.00 (18.42)
28.00 (73.68)
1.00 (2.63)
2.00 (5.26)
0.92NS
Total 16.00 74.00 5.00 5.00
Table- 3(a) depicts that 14.52 % of teachers (R) and 18.42 % of teachers (D) ask many questions in the classroom while 6.45% of (R) and 2.63 % of (D) do not prefer asking questions in the classroom. Questioning is a tool to make teaching learning process more lively and participatory. It can transform teaching learning environment from usual routine type to intellectually charged one. It helps teacher in various ways, to stimulate thinking among students, checking previous knowledge and sometimes to maintain discipline in the class. This skill becomes efficacious only when used in thoughtful manner by judging classroom state of affairs. Keeping this in mind, 74.19 percent (regular) and 73.68 percent (distance) teachers ask questions as per requirement of content/ topic/ classroom circumstance as observed in fig. 3(a). Questioning can be from students also in terms of enquiries/ doubts. When it is expected from students to reflect upon issues / topics, then it becomes prime duty of teachers to respond to their queries. 37.10 percent (regular) and

JOURNAL OF EDUCATIONAL RESEARCH (Vol.12, No.1) 2009 Dept Of Education IUB,
Pakistan
87
60.53 percent (distance) teachers are ready to answer anytime questions/ doubt asked by the students while 53.23 percent (regular) and 36.84 percent (distance) teachers specify that they like better if students ask questions after finishing the topic as evident from fig 3 (b) . Table 3(b): Skill of Questioning Use of teaching skills
Mode of Training
Encourage students to
ask questions any time
Give time for
questioning after
finishing topic
Don’t like if students
ask questions
No set pattern
Chi square
test
Regular 23.00 (37.10)
33.00 (53.23)
3.00 (4.84)
3.00 (4.84)
Distance 23.00 (60.53)
14.00 (36.84)
0.00 (0.00)
1.00 2.63)
7.84*
Total 46.00 47.00 3.00 4.00
Table-3(b) depicts that 53.23 % of teachers (R) and 36.84 % of teachers (D) give time for questioning only after finishing the topic while 37.10% of teachers (R) and 60.53 % of teachers (D) encourage students to ask questions any time. Here for this skill set a *Significant difference at 5% level is observed. Questioning skill can be used by the teacher to act as moderator during discussions or debates held in class. A significant difference at 5 percent level is observed (fig.3b) among teachers of regular and distance mode in using this skill. Skill of Recapitulation
Summarizing main points and retouching the complete topic in short is recapitulation. This helps in reinforcing the comprehension level of the students. 12.90 percent (regular) and 21.05 percent (distance) teachers recapitulate if time permits while 24.19 percent (regular) and 26.32 percent (distance) teachers improvise by combining recapitulation with evaluation as shown in fig.4.

JOURNAL OF EDUCATIONAL RESEARCH (Vol.12, No.1) 2009 Dept Of Education IUB,
Pakistan
88
Table: 4: Skill of Recapitulation Use of teaching skills
Mode of Training
Always do recapitulation
Recapitulation if time permits
Don’t recapitulate
Comb-ine recap-itulation with evalu-ation
No set pattern
Chi sq-uare test
Regular 33.00 (53.23)
8.00 (12.90)
6.00 (9.68)
15.00 (24.19)
0.00 (0.00)
Distance 17.00 (44.74)
8.00 (21.05)
3.00 (7.89)
10.00 (26.32)
0.00 (0.00)
1.44NS
Total 50.00 16.00 9.00 25.00 0.00
Table-4 depicts that 53.23 % of teachers (R) and 44.74 % of teachers (D) always do recapitulate while 12.90% of teachers (R) and 21.05 % of teachers (D) recapitulate depending on the availability of time. Skill of Evaluation Table-5 depicts that 20..97 % of teachers (R) and 7.89 % of teachers (D) always ask oral questions while 24.19 % of teachers (R) and 15.79 % of teachers (D) evaluate on the basis of written work given in class. Here for this skill, a significant difference at 5% level is observed.
Table 5: Skill of Evaluation Use of teaching skills
Mode of Training
Always ask oral que-stions
Always give quest-ions to write
Evaluate Orally or in written form
Don’t find evaluation mandatory
No set pattern
Chi square test
Regular 13.00 (20.97)
15.00 (24.19)
34.00 (54.84)
0.00 (0.00)
0.00 (0.00)
Distance 3.00 (7.89)
6.00 (15.79)
25.00 (65.79)
1.00 (2.63)
3.00 (7.89)
10.31*
Total 16.00 21.00 59.00 1.00 3.00
To assess outcome of teaching in the form of student learning or understanding, teacher evaluates. A significant difference at 5 percent level is observed among teachers of regular and distance

JOURNAL OF EDUCATIONAL RESEARCH (Vol.12, No.1) 2009 Dept Of Education IUB,
Pakistan
89
mode in using this skill. 54.84 percent (regular) and 65.79 percent (distance) teachers specify that they opt for evaluation in either written or oral form (fig.5). Most of the teachers show flexibility and act as per context. Evaluation helps them to assess not only the cognitive but affective and psychomotor domain also. Skill of Black board writing
Table-6 depicts that 14.52 % of teachers ( R ) and 10.53 % of teachers ( D ) writes main points on the black board , 29.03 % of teachers (R) and 26.32 % of teachers (D) write complete information and 45.16 % of teachers (R) and 55.26 % of teachers (D) write main points & tough words on black board. Table 6: Skill of Black board writing Use of teaching skills
Mode of Training
Write main point only
Write tough words only
Write comp-lete infor-mation
Write main points & tough words
No set patt-ern
Chi square test
Regular 9.00 (14.52)
5.00 (8.06)
18.00 (29.03)
28.00 (45.16)
2.00 (3.23)
Distance 4.00 (10.53)
3.00 (7.89)
10.00 (26.32)
21.00 (55.26)
0.00 (0.00)
2.07NS
Total 13.00 8.00 28.00 49.00 2.00
Blackboard is the most vital teaching aid in the classroom teaching. It not only helps in changing the sensory focus but also imparts correct information to the students. Use of blackboard depends on factors like class size, nature of the content, section (primary/ secondary, senior secondary etc.). Irrespective of these, it has the status of most favored teaching aid by teachers. 45.16 percent (regular) and 55.26 percent (distance) teachers write main points and tough words on blackboard (fig.6). Skill of using teaching aids Table-7 depicts that 12.90 % of teachers (R) and 18.42 % of teachers ( D) always use teaching aids while 29.03 % of teachers (R) and 18.42 % of teachers ( D) do not use Teaching aids.
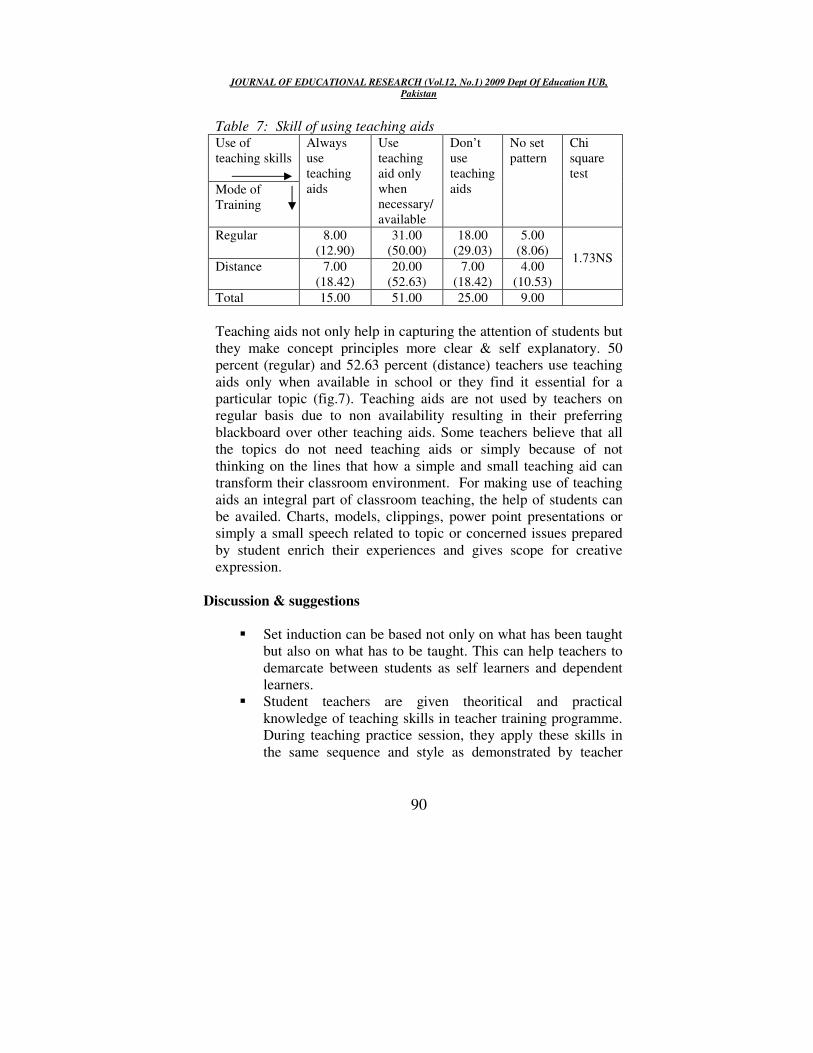
JOURNAL OF EDUCATIONAL RESEARCH (Vol.12, No.1) 2009 Dept Of Education IUB,
Pakistan
90
Table 7: Skill of using teaching aids Use of teaching skills
Mode of Training
Always use teaching aids
Use teaching aid only when necessary/ available
Don’t use teaching aids
No set pattern
Chi square test
Regular 8.00 (12.90)
31.00 (50.00)
18.00 (29.03)
5.00 (8.06)
Distance 7.00 (18.42)
20.00 (52.63)
7.00 (18.42)
4.00 (10.53)
1.73NS
Total 15.00 51.00 25.00 9.00
Teaching aids not only help in capturing the attention of students but they make concept principles more clear & self explanatory. 50 percent (regular) and 52.63 percent (distance) teachers use teaching aids only when available in school or they find it essential for a particular topic (fig.7). Teaching aids are not used by teachers on regular basis due to non availability resulting in their preferring blackboard over other teaching aids. Some teachers believe that all the topics do not need teaching aids or simply because of not thinking on the lines that how a simple and small teaching aid can transform their classroom environment. For making use of teaching aids an integral part of classroom teaching, the help of students can be availed. Charts, models, clippings, power point presentations or simply a small speech related to topic or concerned issues prepared by student enrich their experiences and gives scope for creative expression.
Discussion & suggestions
� Set induction can be based not only on what has been taught but also on what has to be taught. This can help teachers to demarcate between students as self learners and dependent learners.
� Student teachers are given theoritical and practical knowledge of teaching skills in teacher training programme. During teaching practice session, they apply these skills in the same sequence and style as demonstrated by teacher

JOURNAL OF EDUCATIONAL RESEARCH (Vol.12, No.1) 2009 Dept Of Education IUB,
Pakistan
91
educator. As a result, whole process becomes very mechanical, monotonous and takes place in laboratory like conditions. While instructing student teacher about various skills, approach must be flexible and during teaching practice, skills should be practiced by student teacher as per requirement of real classroom settings.
� Teachers whether trained by regular or distance mode make various improvisations in using teaching skills. This is practical aspect of classroom teaching. Due to heavy workload, compulsion of covering syllabus within given time limit and overcrowded classes, teachers tend to combine certain skills like evaluation and recapitulation or overlook some skills like use of teaching aids. Experimentation, creativity and innovation do not find priority in teaching behaviour of most of the teachers.
� Recapitulation and evaluation are integral part of teaching behaviour in the class. If in a given period, teacher is unable to use these skills, in the next class these can be used as set induction to introduce new topic.
� Science and math teachers use blackboard for drawing diagrams, writing formulae or solving problems. In language or social science class, a picture, scene or mood related to content matter drawn on blackboard can be used to capture interest, stimulate thought process and promote divergent thinking.
� As per Ur (1996). Classroom discipline refers to a state where both teacher and taught accept and follow code of conduct to facilitate smooth, efficient teaching & learning in the class. ‘A well prepared content matter with interesting examples is the foremost condition for managing class well’ is the view point of majority of teachers. Some teachers take the help of questioning skills to keep students attentive in the class. Seating arrangement i.e. not allowing all the impish students to sit together is another way to maintain discipline in the class. Using easy language, involving students in various activities like group work, using teaching aids, written assignments and giving every one chance to speak or answer in the class help in effective classroom management.

JOURNAL OF EDUCATIONAL RESEARCH (Vol.12, No.1) 2009 Dept Of Education IUB,
Pakistan
92
Conclusion Teaching skills are imperative for teachers as means to fulfill the ultimate aim of bringing positive and desired change in cognitive, co-native and affective domain of the students. All the teaching skills are interrelated and influence one another. The way teaching skills are learnt and practiced in teacher training institutes remain different from the style teachers use them everyday in the classroom. The difference between the two needs to be blurred. Effectiveness of a teacher’s teaching behavior is determined not by number of skills she uses in the class, but depends on how these skills are interwoven, adjusted and refashioned to make pedagogy an effective tool in putting students in the mould of active learners, explorers and thinkers. Updated pre service and in service programs can act as suitable vehicles to achieve the desired goal. References
Aggarwal, J.C.(1999). Development and planning of modern education, New Delhi : Waqas Publishing
Allen, D.W. (1966). Microteaching a description. Stanford University School of education.
Allen, D.W., Ryan, K.A. (1969). Microteaching reading mass: Addison –Wesley.
Anderson, L.W. (1989). The effective teachers, Study guide and reading, New York : Random House
Borich, G.D. (1998). Effective teaching method. New york : Merill Publishing Company.
Cooper, M.J.(2003). Classroom teaching skills. Bostan: Houghton Mifflin
Farroq, M.S. & Shahzadi, N.(2006), Effects of teacher’s professional education on student’s achievement in mathematics. Bulletin of education & research 28(1).PP. 47-55.
Good , T.L. & Brophy, J.E (2004): Looking in the Classroom. Boston : Allyn & Bacon
James, G. & Choppin, B. (1977). Teachers for tomorrow, Educational research: 19, 184-191.
Kuhn, T.S. (1970), Structure of scientific revolution, Chicago: University of Chicago Press
Kwoklun, C. & Lew, J.F. (1981).The criteria of teacher competence as perceived by students, student teachers and serving

JOURNAL OF EDUCATIONAL RESEARCH (Vol.12, No.1) 2009 Dept Of Education IUB,
Pakistan
93
teachers in Hong Kong: CUHK Education Journal, Vol.9, No. 1.
Moore, K.D. (2003), Classroom teaching skills. Mexico city : Mc Graw company
Murthy, G.S. (2008). ‘Academic skills of teachers for student performance’: Rajat Publications, New Delhi, India
Passi, B.K. (1976). Becoming better teachers. Baroda: Centre for advanced study in education, M.S.University of Baroda, 1976.
Rogers, B.W & Hamil B.W. (2008). The first year teacher in a critical needs school : Teaching the content area or solving student’s problems ? National forum of teacher education Journal, Volume 18, No.3.
Rosenshine, B & Frust, N (1971). Research in teacher performance criterion. Englewood Cliffs : Prentice Hall.
Sachs, G.T. (1999). Pre service teacher development through a more dynamic approach to microteaching, Hong Kong journal online, Vol. II, Perspective (City University of Hong Kong).
Sharma, S.R. (2000). Modern teaching strategies, New Delhi: Omsons Publications.
Smith, R.(2002). Effective primary school a guide for school leaders and teachers. London : Kogan Page Limited.
Tomic, W. (1991). Training programs in research into effectiveness of teacher behaviours : Journal of education for teaching, Volume 17, No.2.
Ulaah, S.Z.& Farooq. R.A.(2008). Effectiveness of teacher education programmes in developing teaching skills for secondary level. Journal of Quality and Technology Management, June 2008 issue.
Ur. P.(1996), A course in language teaching : Practice & Theory, Cambridge university Press.
Vander sijde, P.C.& Tomic, W.(1987). Design of training programmes for teachers based on the results of Research, Education & Society, 5,PP.37-48.
Veldman, D.J. and Peck , R.F. (1963). Student teacher characteristics from pupils’ viewpoint, Journal of educational psychology, 54, 346-355
Walberg, H.J. & Haertal, G.D. (1990). The international encyclopedia of education evaluation, New York: Pergaman Press

JOURNAL OF EDUCATIONAL RESEARCH (Vol.12, No.1) 2009 Dept Of Education IUB,
Pakistan
94
Impact of Organizational Behaviour on the
Performance of Teachers
♣Dr Naveed Sultana
Abstract The main purpose of the study was to investigate the impact of
organizational behaviour of university administration on the performance
of university teachers. Out of five federal public universities hundred
teachers were selected through random sampling technique. The objectives
of study were, (1) to explore the indicators of organizational behaviour of
university administration. (2) To determine the criterion of acceptable
organizational behaviour perceived by the university teachers. (3) To
measure the effectiveness of organizational behaviour regarding the
performance of university teachers. (4) To recommend for improving
organizational behaviour of university administration in the light of the
conclusions of the study. For data collection one questionnaire on three
point scale was developed. After analysis following findings were drawn (1)
working environment was ineffective (2) adequate facilities were not
available (3) management effectiveness is questionable (4) ensure the
teachers’ involvement in decisions making. On the basis of the findings it
was recommended that for enhancing the performance of teachers the
universities administration may improve their organizational behaviour
regarding the all aspects of institution.
Keywords: Organizational Behaviour, Administration, Performance
Introduction Education can play its role effectively if it is managed properly. Because an educational institution is a world in which people live and work. Like any other social organization the world of educational institution has power, structure, logic and values, which combine to exert strong influence on the ways in which individual perceive the world, interpreted and respond to it so the behaviour of people at work in an educational organization, individually as well as a group (Owens, R.G. 1998). The success of institution is based on worker who is running the institutions. It is recognized that a happy
♣ Assistant Professor; Elementary Teacher Education Allama Iqbal Open
University Islamabad, Pakistan

JOURNAL OF EDUCATIONAL RESEARCH (Vol.12, No.1) 2009 Dept Of Education IUB,
Pakistan
95
worker is a better worker, because only happy and healthy people are productive (ILO, 1985). For making the people productive organizational behaviour counts as a key factor which affects the performance of the persons in the institutions. Basically, high levels of job performance are predicted when there is a match between the growth needs of an individual, a measure of an employee’s desire to obtain growth satisfaction from his/her work, and the motivating characteristics of the job being performed. According to Robbins (2001), performance is expected when individual experience psychological states: experienced meaningfulness- a job perceived as being important, valuable, and worthwhile; experienced responsibility- a job perceived as providing autonomy; and knowledge of results- a job perceived as providing feedback about hoe effectively the work is being performed. It is recognized that a happy worker is a better worker. What makes a worker (University teacher) happy has attracted the attention of the researcher. In what condition and with what morale the university teachers are operating? What is it that influences their performance? A Job performance, like all aspects of human behaviour, is a function of both individual and the institution in which he or she exists, namely, the organization. It is also reasonable to expect, on the basis of everyday experience of university teachers, that organizational behaviour of the universities’ administrations influences the teacher’s behaviour and thus his or her performance so this study aims at determining the overall dynamics organizational behaviour and its impact on the job performance of university teachers. Review of Literature Education modified that behaviour of a person, thus education can perform this duty well if the systems of education runs effectively. For making the education system workable successful organization and management, which leads to organizational behaviour must be focused. People (working in organization) are the key for running the organization. We live in an organizational world. Organizations of one form or another re a necessary part of our society and serve may important
JOURNAL OF EDUCATIONAL RESEARCH (Vol.12, No.1) 2009 Dept Of Education IUB,
Pakistan
96
needs. The decision and actions of management in organizations have an increasing impact on individuals, other organizations and the community. It is important, therefore, to understand how organizations function and pervasive influences which they exercise over the behaviour of people. Overall an organization facilitates the learning of all its members and continually transforms itself (Mullins, 2005, p.26). Jerald and Robert, 2000, high-lighted that organization is a structured social system consisting or groups and individuals working together to meet some agreed on objectives. People and organization need each other. Attention should be focused, therefore, on improving the people-organization relationship. Management is an integral part of this relationship. It should serve to reconcile the needs of people at work with the requirement of the organization. Management is essentially an integrating activity which permeates every facet of the operation of the organization. The style of the management adopted can be seen as a function of the manager’s attitudes towards people, and assumptions about human nature and behaviour (Mullins, 2005, p.37)
Organizational behaviour is a discipline that seeks to describe understand and predict human behaviour in the environment of formal organization. A distinctive contribution and characteristic of organizational behaviour as discipline is the explicit recognition that (1) organizations create internal contextual setting or environments, that have great influence on the behaviour of people in them and (2) to some extent the internal environment of an organization is influenced by the large context in which the organization itself exists (for example, the social, political, economic and technological systems that support the organization). Moreover, the internal environment or context of the organization (which is so influential in eliciting and shaping human behaviour) is not merely physical and tangible but also includes the social and psychological characteristics of the living human system (Owens, R.G. 1998). Organization behaviour is the field that seeks knowledge about the behaviors in organizational setting by systematically studying individual, group and organizational processes. Thus knowledge is used both as an end in itself by scientists interested to basic human

JOURNAL OF EDUCATIONAL RESEARCH (Vol.12, No.1) 2009 Dept Of Education IUB,
Pakistan
97
behavior and by practitioners interested in enhancing organizational effectiveness and individual well being (Jerald and Robert, 2000).
Organizational behaviour provides the indispensable foundation of knowledge that is absolutely essential if one hopes to achieve success in educational leadership. Because the education leadership is the key to open the door of education development and developed educational system can enhance the quality of human capital. Although a fully developed education system is the result of proper funding, adequate supervision, properly qualified managers, adequate educational facilities, efficiency and effectiveness of teaching staff but the organizational behaviour of the educational managers counts much in the uplift of standards of out put. So organizations do not succeed or fail people do. Organizations are intimately associated with people who are living and changing; therefore human behaviours must be considered and understood within the dynamics of the formal organization (Choudhury, 2001).
Organizational behaviour is formally defined as the study of individuals and groups in organizations. It is academic disciplines that can help managers make good decision while working with people in complex and dynamic environments. The field of organizational behaviour included concepts and theories relevant to managing individual, groups and entire organizations. It offers insights that can help manager’s better deal with leadership and interpersonal aspects of key process including decision making, communication, conflict, negotiation, power and politics. It also contains useful implications for managing planned change, innovation, and organization development, stress management and career planning (Wood et all. 1998). Organizations can only achieve their aims and objectives through the co-ordinate efforts of their members. This involves the effective management of human resources. However, it is important always to remember that it is people who are managed and people should be considered in human terms. Unlike physical resources, people are not owned by the organization. People bring their own perceptions, feelings and attitudes towards the organization, system and styles of

JOURNAL OF EDUCATIONAL RESEARCH (Vol.12, No.1) 2009 Dept Of Education IUB,
Pakistan
98
management, their duties and responsibilities and the considerations under which they are working (Argyris, 1964). Stalker (2003) suggests that successful organizations are those that have the ability to balance the unwritten needs of their employees with the needs of organization. Such organizations use a simple formula of Caring, Communicating, Listing, Knowing & rewarding.
• Caring- demonstrating genuine concerned for individuals working in the organization.
• Communicating - really talking about what the companies hoping to achieve.
• Listening – hearing not only the words but also what lies behind the words.
• Knowing – the individual who work for you, their families, personal wishes, desires and ambitions. Rewarding – money is always not necessary; genuine ‘thank you’ or public recognition can raise morale.
Mullins (2005) pointed out the study of organizational behaviour embraces therefore an understanding of:
• The behaviour of people;
• The process of management
• The organizational context in which the process of management takes place;
• Organizational process and the execution of work; and
• Interactions with the external environment of which the organization is part (p.27).
Cyret and March (1992) argued that an organization is developed to achieve certain goal or objectives by group activity. Teaching is also a group activity and for quality teaching or performance of teacher, we must hire better teachers. One of the most important tasks to create a professional learning environment and community, a strategy that combines leadership and management, is to hire the best teachers. Whitaker in his book What Great Principals Do Differently (2003) stated, “A principal’s single most precious commodity is an opening in the teaching staff. The quickest way to improve your school is to hire great teachers at every opportunity” (p.43).

JOURNAL OF EDUCATIONAL RESEARCH (Vol.12, No.1) 2009 Dept Of Education IUB,
Pakistan
99
By hiring the best teachers, the principal shapes the academic accomplishment of the students and school culture. “Experience is not the best teachers. The best teacher is the best teacher” (Whitaker, 2003, p.46). His comment is reminiscent of Jim Collins’ belief in Good to Great (2001) that it is important to have the right people on the bus and in the right seats and wrong people off the bus (p.39). Collins believes that people are not the most important asset; the right people are the most important asset. Overall above all discussion may be summarized as Mullins (2005) highlighted the following individuals’ expectations of the organization.
• Provide safe and hygienic working conditions;
• Make every reasonable effort to provide job security;
• Attempt to provide challenging and satisfying jobs, and reduce alienating aspects of work;
• Adopt equitable human resource management polices and procedures;
• Respect the role of trade union officials and staff representatives;
• Consult fully with staff and allow genuine participation in decisions which effect them;
• Implement best participate in equal opportunity polices and procedures;
• Reward all staff fairly according to their contributions and performance;
• Provide reasonable opportunities for personal development and career progression;
• Treat members of staff with respect;
• Demonstrate an understanding and considerate attitude towards personal problems of staff (p.38).
Objectives of the Study These objectives were focused during the study, (1) to explore the indicators of organizational behaviour of university administration. (2) To determine the criterion of acceptable organizational behaviour perceived by the university teachers. (3) To measure the

JOURNAL OF EDUCATIONAL RESEARCH (Vol.12, No.1) 2009 Dept Of Education IUB,
Pakistan
100
effectiveness of organizational behaviour regarding the performance of university teachers. (4) To recommend for improving organizational behaviuor of university administration in the light of the conclusions of the study. Research Methodology The nature of study was descriptive. It was delimited to only federal universities. All the teachers of these universities were the population of the study. From this population 100 teachers (20 from each university) were selected as sample. This sample was selected randomly. For collection of data one questionnaire on three point scale was used and these scales are described as 3 certainly, 2 seldom and 1 never. Collected data was analyzed through applying the mean score. Conclusions On the basis of Mean scores of table No 1 which analyses the opinion of the university teachers about the impact of organizational behaviour of university administrations on the performance of their teachers. Following conclusions were drawn: Work environment is the yardstick which measures the success of institutions as well as teachers. Keeping in view the analysis of this study it is concluded that majority of the respondents opined that work environment is never well maintained physically as mean score came out 1.32. For enchansing the performance of teachers friendly environment counts as key factor. But majority of the respondents of this study disagreed that work environment of institution is not stressful. Hence mean score came out 1.3. About work load 2.14 mean score showed that sometime it is distributed equally but responsibilities of each faculty member are clearly defined as 1.95 mean score highlighted. Majority teachers respond that opportunities for professional development are not provided equally hence mean score was 1.28. Although enough help and resources are indispensable but these are provided seldom during job as 1.95 mean score depicted.

JOURNAL OF EDUCATIONAL RESEARCH (Vol.12, No.1) 2009 Dept Of Education IUB,
Pakistan
101
About the teachers involvement in decisions making process regarding organizational polices and plans, it is concluded that mostly teachers are ignored (1.32). Mean scores also depicted that teachers are not treated fairly (1.55), recognition and rewards are not given for good performance (1.63), and work environment conditions are not helpful for enhancing the performance of organization (1.48). Majority of teachers opined that sometime competent management is provided in the department (2.11). Commutation among the members of organization is not all the time effective (1.73). Sometime organization evaluates its staff’s satisfaction but not on regular basses (1.89), as well to some extent it has a good under standing of what is happening in the departments (2.19). Majority of the respondents agreed that enough information regarding organizational plans and operating results are provided to faculty members (2.27). Respondents also opined that responsibilities are clearly defined (2.07). Keeping in view the results of this study it is conclude that high levels of teachers performance depends upon the effective organizational behaviore of the people works in the universities. Key factor in organizational effectiveness is the successful managements and the quality of management is one of the most important factors in the success of any organization. As management is considered a process through which efforts of members of the organization are co-coordinated direct and guided towards the achievement of organizational goals (Mullins, 2005, P.200). So the clarification of objectives, planning, organizing, directing, facilitating and monitoring other peoples work is the organization behaviour which counts a key element for the success of organizations. Recommendations It is recommended that the high ups of the universities may focus their diligent attention on providing the workable environment, effective management, resources and facilities and professional development of their teachers. This type of organizational behaviour may improve the teachers’ performance which will improve the organizational performance and effectiveness.

JOURNAL OF EDUCATIONAL RESEARCH (Vol.12, No.1) 2009 Dept Of Education IUB,
Pakistan
102
References Argyris, C. (1964). Integrating the Individual and the Organization.
John Wiley and Sons. Burke, W. W. & Litwin, G. 1992. A causal model of organizational
performance and change. Journal of Management, 18: 523-545.
Collins, J. (2001). A good to great. New York: Simon and Schuster. Cyert, R.M and J. G. March. 1992. A behavioral theory of the firms.
2nd ed. Blackwell, Oxford. Pp.11-16. Chatman, J. A. 1989. Improving international organizational
research: a model of performance-organization fit. Academy
of Management Review, 14: 333-349. Choudhury, N.R. 2001. Management in Education. A.P.H.
Publishing Corporation, New Delhi. Pp. 3-17 Hamner, O. 1982 Organizational Behaviour: Business Publications,
Inc. USA.p.88. Jerald Greeberg, Robert A. Baron (2000). Behaviour in
Organizations, New Jersy: Printice-Hall, Inc.Upper saddle River, USA. P.4.
Mullins, L.J. 2005. Management and Organizational Behaviour, prentice Hall, London.
Owens R. G. 1998. Organizational Behavior in Education Allyn and Bacon London, P.2.
Owens, R. G. 1998. Organizational Behaviour in Education. 6th ed. Prentice Hall, Allyn and Bacon, Boston, USA. Pp.119.121, 224.
Robbins, S. P. 2001. Organizational behavior. Upper Saddle River, New Jersey: Prentice Hall.
Stalker, K. (2003). The Individual and the Organization: Student
Adviser Issue No- 51. The Institute of Administrative Management.
Whitaker, T. (2003). What great principals do differently: fifteen things that matter most? Larchmont, NY: Eye on Education.
Wood, Wallace, Zeffane, Schermer horn, Hunt and Osborn (1998) organizational behaviour: An Asian-Pacific Perspective, John Wiley

JOURNAL OF EDUCATIONAL RESEARCH (Vol.12, No.1) 2009 Dept Of Education IUB,
Pakistan
103
A Study of Secondary School Principals' Mental Health
in Relation to their Biographical Variables
♣Saeid Farahbakhsh
Abstract
The mentally healthy status is essential for the administrators. A principal
with low mental health not only tends to incapacitate himself for the
performance of his multifarious duties in the school but also creates
difficulties and problems for his subordinates. This paper examined level of
mental health of secondary school principals in respect to some biographical
variables i.e. Gender, Age, and qualifications of them. The study used
descriptive method of research to measure current level of mental health of
principals. The sample consisted of sixty male and female secondary school
principals who are working in Isfahan, second big city of Iran. The two
instruments employed for gathering the required data i.e. Demographic
Survey Form and Mental Health Scale (MHS) developed by Kamau (1992).
The t-test was used to determine difference between two categories of
independent variables i.e. gender, age and qualifications in respect to mental
health of principals. Findings of the study indicate that there was not
significant difference between mental health of principals in respect of their
gender and qualifications. However, significant difference was found between
principals’ mental health in aspect of their age.
Keywords: Gender, Mental Health, Biographical Variables, Introduction
The mental health often has a bearing on making the right decisions and poor health may cause ineffective administration. Chandra, Desai and Ranjan (2005) argued that People with poor mental health, including those with untreated mental illnesses such as depression tend to have impaired judgment, impulsive behaviour, reduced fear of consequences, and increased vulnerability to outside influences, and as a result are more likely to engage in risk behaviours. Similarly, Patel and Kleinman (2003) indicated that poor mental health predisposes people to mental illnesses, which are common in all populations. Mental illnesses are
♣ Assistant Professor, Education Department, Lorestan University, Iran. Email: [email protected]

JOURNAL OF EDUCATIONAL RESEARCH (Vol.12, No.1) 2009 Dept Of Education IUB,
Pakistan
104
associated in all settings with indicators of poverty; including low levels of education, poor housing and low income. The principal can play a key role in helping the community to become aware of its responsibilities. The administrator has an even greater responsibility to create an emotional climate within the school, which is conductive to mental health. The mental health for principals is essential for their ever-increasing professional growth as well as for creating a suitable emotional climate in the school. A principal with low mental health not only tends to incapacitate himself for the performance of his multifarious duties in the school but also creates difficulties and problems for his subordinates. It is, therefore, logical to infer that the mental health of principals must have something to do with the attitude towards leading of their subordinates as well as towards teaching and learning- two activities in which are professionally engaged in educational institutions. In addition, Principals are expected to be hardly individuals who are capable of coping with stress. However, they are persons and subject to breakdown if the stress becomes excessive. The principals hold a pivotal position between two groups of forces. On the one hand serve the parents, teachers, and students of their school (Subordinates); on the other, they must satisfy their administrative superiors, the governing board, and community (Superiors). Whenever the pressure from any of these sources increases, it definitely affects mental health of the principals and completely their effectiveness, efficiency, decisions as well as leadership behaviors. Accordingly, Kaplan (1959), states that relations with teachers, parents, peers, superiors and status in the system are important reasons of that affect of mental health of principal. Concept of mental health Mental health is described by WHO(2005) as an integral component of health, and as: a state of well-being in which the individual realizes his or her own abilities, can cope with the normal stresses of life, can work productively and fruitfully, and is able to make a contribution to his or her community. According to Herrman, Saxena, Moodie, and Walker (2005) mental health is not simply the absence of mental illness. It is the foundation for well-being and effective functioning of individuals and communities. Taggi (1983) presented a vivid picture of mentally healthy

JOURNAL OF EDUCATIONAL RESEARCH (Vol.12, No.1) 2009 Dept Of Education IUB,
Pakistan
105
persons. The description goes as: A healthy people's response to life is without strain; their ambitions are within the scope of practical realization; they can be helpful, but can also accept aid. They are resilient in failure and level headed in success. They are capable of friendship and of aggressiveness when necessary. The recent emphasis has been on development of adaptability and compatibility so that the individuals are able to maintain internal balance in ever- changing situations and environment. Accordingly, it can be saying mentally healthy principals are free from anxiety and disabling symptoms. They can establish relationship with others, cope well with life’s demands then their physical, mental, social, and emotional well-being can be said to be complete (Kamau, 1992). A review of related literature shows that little research has been conducted in the few years concerning comparison of mental health of the school’s principals. Defrank, & others (1988) compared managerial samples from the United State, India and Japan. Japanese executives reported more stress in all aspects of life than either the Americans or Indians. Masuda (2000) indicated that Japanese are to be less likely to have favourable attitudes towards mental health services than Americans. Neuman (1991), reported significant difference among central office administrators, and local school managers on two stress factors viz. no authority and relationships. Tong (1994) examined impact of cultural, social, and physical stress factors on the mental health. The researcher found that mental health status had a different effect on perceived support from friends and from relatives; and the relationship among religious commitment and mental health was not found to be significant in this study. The effect of life events on mental health was mediated through physical health symptoms. Green (1993), reported a positive correlation between satisfaction and job related stress, gender appears to have an effect on job stress, years of experience appears to have an effect on job stress, and school size appears to have an effect on job satisfaction and job stress. Sproul (1994) found that variables of age, employment status, source of employment, social/community integration, work program, subject’s contact with their social network, and the degree of help received for problem solving were significantly related to mental health.
JOURNAL OF EDUCATIONAL RESEARCH (Vol.12, No.1) 2009 Dept Of Education IUB,
Pakistan
106
In the present study, the main objective was to compare six measures of mental health namely overall mental health status and it’s five different subscales as personal well-being (PW), anxiety factor (AF), disabling symptoms (DS), capacity to establish constructive relationships (CR) and capacity to cope with the ordinary demands and stress of life (CD) among secondary school principals regarding to their gender. Other purposes of the study were comparison of mental health of the secondary school principals in relation to their age categories as well as level of their qualifications. In the light of above-mentioned objectives, investigator hypothesized that: 1. There is a significant difference of mental health among principals
regarding to their gender. 2. There is a significant difference of mental health among principals
regarding to their age. 3. There is a significant difference of mental health among principals
regarding to their qualifications.
Method
In the study, the descriptive method of research was employed. Best and Kahn (1995) considered descriptive research studies as non-experimental studies because they deal with the relationship between non-manipulated variables in a natural, rather than artificial setting. According to them the method of descriptive research is particularly appropriate in the behavioural sciences because many of the types of behaviour that interest the researcher cannot be arranged in an artificial setting. Types of behaviours, under the natural conditions occur in the school. In fact, the events that are observed and described would have happened even though there had been no observation or analysis. Descriptive research also involves events that have already existed and may be related to a present condition. This method was chosen because of these distinctive advantages for the various aspects of mental health of school principals. Participants The sample of this study consisted of sixty (30 males and 30 female) government secondary school principals who were randomly selected from Isfahan (Iran). Isfahan is the capital city of Isfahan province. The

JOURNAL OF EDUCATIONAL RESEARCH (Vol.12, No.1) 2009 Dept Of Education IUB,
Pakistan
107
city is one of the most advanced and developed cities not only in Iran but also in the whole of the Middle East. Isfahan is also known as the art and cultural capital of Iran. For the selection of the sample, the cluster-sampling technique was used. Principals’ age average was 46.30 years (ranged from 30 to 57 years old), and who had an average of 7 years administrative experiences (ranged from 1 to 26 years). Further, they had an average of 22 years work experiences (ranged from 6 to 32 years). Out of the total sample, 55 principals were married, two unmarried, and three of them were widows. They had also an average of two children (ranged from 0 to 4). Ethics approval for the study was obtained from the Education Department of Isfahan City; In addition, all of the secondary school principals agreed to participate and completed the related questionnaire. Instruments
The instruments were contained in a questionnaire consisting of following two sections. A demography survey form was applied to obtain regarding the biographical variables like gender, age, marriage status, etc. The Mental Health Scale developed by Kamau (1992) was used to determine level of mental health of participants. The instrument contained a 50 items as well as 5 subscales i.e. personal well being (PW), anxiety factor (AF), disabling symptoms (DS), capacity to establish constructive relationships (CR) and capacity to cope with the ordinary demands and stress of life (CD). Participants were required to respond fifty simple Yes-No questions. Each item was scored on a scale from 1 to 0. Certain items were scored negatively in which the scoring is reversed. The possible range of score for scale is zero to fifty. Researcher distributed the initial questionnaire among 20 participants to find out its internal consistency reliability, the extent to which items within each scale correlate with each other to form a multi-item scale was assessed using Cronbach's alpha. Consequently, the instrument has shown high reliability coefficiency. The estimated reliability coefficient used in this method, was found .83 for Mental Health Scale. Further, construct validity was assessed by examining the inter-scale correlations

JOURNAL OF EDUCATIONAL RESEARCH (Vol.12, No.1) 2009 Dept Of Education IUB,
Pakistan
108
between the MHS and the GHQ. Correlations were found to range among ‘0.20 to 0.60’ for all the subscales, thus indicating satisfaction with the validation. Procedure
The investigator officially sought the permission from authoritarian positions at first to go to government secondary schools of Isfahan. Before administering the questionnaire, Proper instructions were given to participants and if any doubts or questions were raised, they were convincingly answered. Researcher distributed number of sixty copies of ultimate questionnaire among randomly selected principals personally. Questionnaires completion took approximately 10 minutes and was done during two weeks. All the respondents returned the complete questionnaires to researcher. Therefore, the final complete questionnaires were 60. Data Analysis
Descriptive statistics were used for analysis of the demographic characteristics of participants and frequency of items. Researcher used t- test to compare the mean score of male and female principals as well as to compare principals who have B.A./B.Sc. with those who have M.A./M.Sc. qualifications on their mental health level and its five different subscales as above named. T–value also used for comparing of mean score of the principals that their age was divided into two various categories. The version 10 of statistical package for the social science (SPSS) computer software was used for analyzing of the data by investigator. Results
The t-values as entered in table 1, for six measures of secondary school principals’ mental health were personal well-being (PW), (t=1.99, P>.05); anxiety factor (AF), (t=.00, P>.05); disabling symptoms (DS), (t=.59, P>.05); capacity to establish constructive relationships (CR), (t=.60, P>.05); capacity to cope with the ordinary demands and stress of life (CD), (t=.18, P>.05); and overall mental health (OMH), (t=.80, P>.05). In the light of results reported in table 1, it is evident that there were not statistically significant difference even at .05 level of confidence between mean scores of male principals and female principals on six measures of mental health as above-mentioned.
JOURNAL OF EDUCATIONAL RESEARCH (Vol.12, No.1) 2009 Dept Of Education IUB,
Pakistan
109
However, t- value of male and female principals on variable of personal well-being had significantly different at near .05 level of confidence, but generally, our research hypothesis number (1) that “there is a significant difference among male and female secondary school principals in relation to their mental health” can be rejected. From the results reported in table 1, it is clear that two different groups of male and female secondary school principals do not differ with one another in term of mental health. The values of (t) reported in table 2, for six measures of secondary school principals’ mental health were personal well-being (PW), (t= .83, P>.05); anxiety factor (AF), (t=. 2.28, P<. 05); disabling symptoms (DS), (t=2.24, P<.05); capacity to establish constructive relationships (CR), (t=.49, P>.05); capacity to cope with the ordinary demands and stress of life (CD), (t=1.50, P>.05), and overall mental health (OMH), (t=2.05, P<.05). The results of the study show that there was statistically difference at .05 level of confidence between mean scores of principals who were less than 45 years with those who were more than 45 year, on three out of six measures of mental health namely anxiety factor, disabling symptoms and overall mental health. In addition, there was not any statistically significant between two various groups of principals in relation to personal well-being, capacity to establish constructive relationships, and capacity to cope with the ordinary demands and stress of life. Hence, our research hypothesis number (2) that “there is a significant difference on mental health among principals regarding to their age” can be partially accepted. Therefore, the results show that principals who were more than 45 years were healthier as compared with those who were less than 45 years considering of their anxiety factor, disabling symptoms, and overall mental health. Furthermore, two different age categories of secondary school principals do not differ with one another regarding to personal well-being, capacity to establish constructive relationships, and capacity to cope with the ordinary demands and stress of life dimensions of mental health. The values of (t) reported in table 3, for six measures of secondary school principal’s mental health were personal well-being (PW), (t=.36, P>.05); anxiety factor (AF), (t=.1.55, P>.05); disabling symptoms (DS), (t=1.34, P>.05); capacity to establish constructive relationships (CR),

JOURNAL OF EDUCATIONAL RESEARCH (Vol.12, No.1) 2009 Dept Of Education IUB,
Pakistan
110
(t=.34, P>.05); capacity to cope with the ordinary demands and stress of life (CD), (t=.69, P>.05); and overall mental health (OMH), (t=1.40, P>.05). From the results of the study, it is clear that there were not statistically difference even at .05 level of confidence between mean scores of principals who had B.A/B.Sc. with those who had M.A./M.Sc. qualifications on six measures of mental health as above mentioned. Hence, our research hypothesis number (3) that “there is a significant difference between B.A/B.Sc. and M.A./M.Sc. principals on their mental health” can be rejected. Therefore, the results of the study indicate that two different groups of B.A/B.Sc. and M.A. /M.Sc. secondary school principals do not differ with one another in term of mental health. Discussion The findings of the study indicated that the mean scores of principals’ mental health were above scale’s mean. Further, no statistically difference was found among mental health of the secondary school principals according to their gender as well as their qualifications. However, Kaur (2000) in his study indicated significant gender differences are present in occupational stress and coping resources. Besides, Tung (1980) showed that female administrators experienced substantially lower levels of self-perceived occupational stress than their male counterparts. Occupational stress is major cause of low mental health. In this regards, can be argued that conceivably the organizational stressors in schools were the same for both of male and female principals. According to Tosi and others (1998), there are five work stressors as occupational factors, role pressures, participation opportunities, responsibility for people and organization factors. Furthermore, principals who were more than 45 years had a better status regarding to anxiety factor, disabling symptoms and overall mental health than principals who were less than 45 years. The reason possibly for this disparity can be declared that principals with increasing their age take big salary, become more experienced, and have no financial difficulty as compared to low age principals. Nevertheless, Goedhard and Goedhard (2005) resulted that work ability scores also were negatively associated with increasing age. Himmelfarb (1984) and Sproul (1994) indicated that mental health was linear related to age group. Reigo, et al. (1988), in their study showed that the

JOURNAL OF EDUCATIONAL RESEARCH (Vol.12, No.1) 2009 Dept Of Education IUB,
Pakistan
111
development of mental disorders and occurrence of symptoms increased with age. Reason In addition, the findings of the study indicate that two different groups of B.A/B.Sc. and M.A./M.Sc. secondary school principals do not differ with one another in terms of mental health. This means education grade of principal is not an appropriate predictor of good or bad mental health. Furthermore, findings of this study appear that perhaps are some other environmental factors, which affect mental health level of principals. In this regard, Koch, Tung, Gmelch and Swent (1982) in their research were extracted 4 factors of job-related stress perceived by school administrators, indicating the Role-Based Stress, Conflict-Mediating Stress, Task-Based Stress, and Boundary-Spanning Stress. Mentally healthy principals can establish relationships with others, cope well with life demands, and then their physical, mental, social, and emotional well-being can be complete. They are also free from anxiety, and disabling symptoms. They do not feel depressed, not afraid of unfamiliar things and so on. They feel contended that belong to the school administration position and willingly undertake extra duties.
Reffrence
Best, J.W., and Kahn, J. V. (1995). Research in Education. 7th Edition, New Delhi: Prentice Hall of India.
Bonney, M.E.( 1960). Mental health in education. Boston: Allyn and Bacon,Inc.
Chandra, P.S.; Desai, G.; and Ranjan, S. (2005) HIV & psychiatric disorders. Indian Journal of Medical Research 2005, 121:445-467.
Defrank, R.S. and Others. (1988). Job stress and mental well being: similarities and differences among Americans, Japanese, and Indians managers. Journal of Behavioural Medicine, No.14, PP. 160-170.
Goedhard, R.G. and Goedhard, W.J.A. (2005). Work ability and perceived work stress. International Congress Series, Volume 1280, pp. 79-83.
Green, G. (1993). The relationship between high school athletic

JOURNAL OF EDUCATIONAL RESEARCH (Vol.12, No.1) 2009 Dept Of Education IUB,
Pakistan
112
administrators’ job satisfaction and job related stress. Dissertation Abstract International – A, 53(11), P. 3841.
Herrman H, Saxena S, Moodie R, Walker L.(2005). Promoting mental health as a public health priority. In Promoting Mental
Health: concepts, emerging evidence, practice. Geneva: World Health Organization.
Himmelfarb, S. (1988). Age and sex difference in the mental health of older persons. Journal of Consulting and Clinical
Psychology, 52(5), PP. 844-856. Kaur, K. (2000). Occupational stress of high and higher secondary
school teachers in relation to mental health and coping resources. Unpublished Doctoral Thesis in Education, submitted in Panjab University, Chandigarh.
Lindgren, H.C.(1954) Mental health in education. New York, Holt: Rineltart and Winston.
Kamau, C.W. (1992). Burnout, locus of control and mental health of
teachers in Eastern Province of Kenya. Unpublished Doctoral Thesis in Education, submitted in Punjab University, Chandigarh.
Kaplan, L. (1959) Education and mental health. New York: Harper and Row Publishers.
Koch, J.L., Tung, R., Gmelch, W., and Swent, B. (1982). Job stress among school administrators: Factorial dimensions and differential effects. Journal of Applied Psychology, Volume 67, Issue 4, pp. 493-499.
Neuman, T.R. (1991) Reported job related stress and job performance of selected groups of school employs. Dissertation Abstract
International - A, 51(4), P.1070. McCall, M.E. (1989). Social roles and mental health: gender differences
in source and forms of mental distress. Dissertation
Abstract International-A, 5(4), 1990. Masuda, A. (2000). Attitudes toward seeking professional
psychological help: A cross – national study between American and Japanese college students. Dissertation
Abstract International- A, 38(2), P. 484. Patel. V. and Kleinman, A. (2003). Poverty and common mental
disorders in developing countries. Bulletin of the World Health Organization, 81: 609-615.
Reigo, H., and et.al. (1988). Assessment of mental health and illness,

JOURNAL OF EDUCATIONAL RESEARCH (Vol.12, No.1) 2009 Dept Of Education IUB,
Pakistan
113
considered in the light of a 13 tear longitudinal study of mental health of the finish student follow up. Psychology
Abstract, 75(7-9), P. 26686. Sproul, N. (1994). Relationship among social support and mental health
status of persons with mild intellectual impairments. Dissertation Abstract International– A, 54(9), P. 3334.
Taggi, O.P. (1984). Mental tension and its cure. New Delhi: Orient paperbacks.
Tong, I. (1994). Impact of cultural, social and stress factors on the mental health of urban, elderly Afro- American women. Dissertation Abstract International - A, 54(10), P. 3883.
Tung, R.L. (1980). Comparative analysis of the occupational stress profiles of male versus female administrators. Journal of
Vocational Behavior, Volume 17, Issue 3, pp. 344-355. World Health Organization (2005). Promoting Mental Health,
Concepts, Emerging evidence, Practice. Edited by: Herrman H, Saxena S, Moodie R. WHO Department of Mental Health and
Substance Abuse in collaboration with the Victorian Health Promotion Foundation and The University of Melbourne.

JOURNAL OF EDUCATIONAL RESEARCH (Vol.12, No.1) 2009 Dept Of Education IUB,
Pakistan
114
Table 1: Values of t-ratio of male and female secondary school principals on mental
health
Males N=30 Females N=30 Variable
Mean S.D. Mean S.D.
t-value
PW 11.66 2.02 12.73 2.14 1.98
AF 8.46 2.12 8.46 1.75 .00
DS 6.96 1.44 6.73 1.59 .59
CR 5.63 1.42 5.83 1.11 .60
CD 5.50 1.50 5.56 1.27 .18
OMH 38.23 5.69 39.40 5.55 .80
Table 2: Values of t-ratio of secondary school principals on mental health according to
their age categories
Age below 45 N=35
Age above 45 N=25
Variable
Mean S.D. Mean S.D.
t-value
PW 11.91 2.33 12.38 2.00 .83
AF 7.79 1.76 8.91 1.93 2.28*
DS 6.29 1.51 7.22 1.41 2.42*
CR 5.83 1.16 5.66 1.35 .49
CD 5.20 1.58 5.74 1.20 1.50
OMH 37.04 5.60 40.00 5.36 2.05*
Table 3: Values of t-ratio of mental health of secondary school principals in respect to
their qualifications
B.A./B.Sc. N=35
M.A/M.Sc. N=25
Variable
Mean S.D. Mean S.D.
t-value
PW 12.11 1.92 12.32 2.44 .36
AF 8.14 1.95 8.92 1.84 1.55
DS 6.62 1.30 7.16 1.74 1.34
CR 5.68 1.32 5.80 1.22 .34
CD 5.42 1.31 5.68 1.49 .69
OMH 37.94 4.90 40.04 6.37 1.40

JOURNAL OF EDUCATIONAL RESEARCH (Vol.12, No.1) 2009 Dept Of Education IUB,
Pakistan
115
Role of Education in Utilization of Micro-Credit in Poverty
Alleviation in Lahore
♣Muhammad Yasser Mustafa
♣♣Mustajab Ahmad ♣♣♣Nowshad Khan
♣♣♣♣Mariyam Mustafa Butt Abstract
Impact of micro-credit and role of education in poverty alleviation through
income generating of the poor rural people was studied in three rural union
councils in district Lahore. The results showed that 16% micro-credit
beneficiaries were matric, 8% middle, 32% primary and 44% illiterate
these beneficiaries utilized their credit in agriculture, livestock, and shop.
60% deal with agriculture and livestock while 12% were servants. After
utilizing micro-credit 92% were increased their income. The overall impact
of micro-credit on income generating of the respondents/ beneficiaries was
found positive particularly of educated people who have also less children
in poverty alleviation.
Key words: Education, Micro-credit, Income, Poverty, Illiterate, Primary, Middle, Matric and Impact.
Introduction Poverty is a worldwide phenomenon. It prevails in both developing and developed countries. Poverty is characterized by lack of financial resources. Poor people live without fundamental freedom of action and choice that the better off take for granted. They often lack adequate food and shelter, education and health deprivation that keep them away from lending this kind of life that everyone values. They also face extreme vulnerability to ill health, economic dislocation and natural disaster. For those who live in poverty, escaping it can see impossible (World Development Report, 2000). The most important piece of evidence on rural poverty is that nearly two third
♣ Directorate of Extension, Livestock and Dairy Development- Punjab-Pakistan ♣♣ Department of Sociology, Government college of Science, Whadat Road, Lahore ♣♣♣ Department of Agricultural Sciences, Allama Iqbal Open University, Islamabad ♣♣♣♣ Hailey College of Banking and Finance, Punjab University, Lahore

JOURNAL OF EDUCATIONAL RESEARCH (Vol.12, No.1) 2009 Dept Of Education IUB,
Pakistan
116
of the rural poor are working in agriculture as small owner-operator, share cropping, tenants and labors (Khan, 2002). Poverty limits economic, social and human resources for the poor. Limitations of these resources may result in low income, malnutrition, ill health, illiteracy and inadequate clothing for the poor. Lack of economic resources may become a root cause for lying behind in social and human. Poverty has increased dramatically in Pakistan in the period 1988-2004. Of the 60 percent of Pakistan’s population that lives in rural areas, nearly 35 percent is below the poverty line. This means that around 32 million Pakistanis in the rural areas live in poverty. The incidence of rural poverty is highest amongst those who own no land and over 40 percent of landless households are poor and together constitute 70 percent of the rural poor. The rural poor spent 80 percent of the budget on the four essentials i.e. food, rent, energy and apparel. In absolute terms, the poor have less to spend on other commodities which include essentials like health and education (Zaidi, 2005). In Pakistan, a typical poor household’s income is about 40% low than a typical non-poor household (Haq, 1999). The Punjab Rural Support Programme was established in November 1997 as a non-profit organization and registered as limited company under section 42 of the companies Ordinance 1984. It is currently operating in 42 districts of the Punjab (PRSP, 2000). PRSP works in agriculture, livestock, enterprises and S.I.I.E. (small infrastructure as individual enterprise) sectors without any ethnic, political and gender bias. The present study was conducted to study the role of education in utilizing the micro-credit for income generating beneficial for poverty alleviation in the rural areas.
Materials and Methods
In the present study, Case study method was used which is qualitative intensive and comprehensive methods as suggested by Fairchild (1995). For this purpose, 25 cases selected through purposive sampling from the Universe as described by Neumann (1997). All the respondents of the present study were married and micro-credit beneficiaries of PRSP from three different Union Council named Sultan Key, Manga Mandi and Pajian of District

JOURNAL OF EDUCATIONAL RESEARCH (Vol.12, No.1) 2009 Dept Of Education IUB,
Pakistan
117
Lahore. The respondents were selected whoso income was less than Rs.2000/= and returned fully their installments and duration between interview and return of credit installments was at least six months. Interview guide/Questionnaire was used as tool for Data collection (Goode and Hatt, 1957). This have different topics including demographic information, income, food, clothing, housing, social status and satisfaction towards micro-credit scheme of PRSP. Data was analyzed statistically by applying percentage (Rothstein, 1985).
Results and Discussion The present study was conducted to observe the role of education of respondents in better utilization of micro-credit for poverty alleviation. The number of respondents in area showed in table-1. The number of children of respondents show that uneducated person have moiré children than educated as shown in table-2. The education level of the respondents is shown in table-3. Because of education levels different occupations were done by the respondents as shown in table-4. The present income level and increased income after utilizing the micro-credit is shown in table-5 and table-6. Table1: Number of Respondents according to their
Residence
Sr.No. Union Council No. of Respondents
Percentage (%)
1 Manga Mandi 12 48
2 Burki 8 32
3 Sultan Kay 5 20
Total 25 100
48% of the respondents were from village and Union Council Manga Mandi, 32%were from village Brahamanabad, Union Council Burki and 20% from village Manak, Union Council Sultan Kay.

JOURNAL OF EDUCATIONAL RESEARCH (Vol.12, No.1) 2009 Dept Of Education IUB,
Pakistan
118
Table 2: Number of Children of the Respondents
Sr.No. Number of Children
No. of Respondents
Percentage (%)
1 Nil 1 4
2 1-4 2 8
3 5-8 16 64
4 9-12 6 24
Total 25 100
64% respondents had no. of children 5-8, 24% had no. of children 9-12, 8% had 1-4 and only 4% had no child.
Table 3: Education of the Respondents
Sr.No. Age group (years) No. of Respondents
Percentage (%)
1 Un-educated 11 44
2 Primary 8 32
3 Middle 2 8
4 Matric 4 16
Total 25 100
44% of the respondents were un-educated, 32% were primary, 8% were middle and 16% were educated up to matric. Table 4: Occupation of the Respondents
Sr.No. Occupation No. of Respondents
Percentage (%)
1 Agriculture/Livestock 15 60
2 Labor 7 28
3 Servant 3 12
Total 25 100
60% of the respondents occupation was related to agriculture/livestock they were having primary or middle education, 28%were labors working on daily wages who were illiterate and only 12% were servant working privately who were matric (industry, school).

JOURNAL OF EDUCATIONAL RESEARCH (Vol.12, No.1) 2009 Dept Of Education IUB,
Pakistan
119
Table 5: Present Income level of the Respondents
Sr.No. Income level in Rupee/Month
No. of Respondents
Percentage
1 2500 4 16
2 2501-3500 9 36
3 3501-5000 6 24
4 5001-6000 2 8
5 6001-7500 3 12
6 7501-10500 1 4
Total 25 100
More than one third i.e. 36% of the respondents have their income between 2501-3500, 24% have 3501-5000, 12% have 6001-7500, 16% have income level 2500, 8% have 5001-6000 and only one respondent i-e.4% have their income from 7501 to 10500. Table 7: Impact of micro-credit on Income of the micro-credit
Beneficiaries
Sr.No. Impact on Income No. of Respondents
Percentage (%)
1 Improved 23 92
2 Remained same 2 8
3 Decreased Nil Nil
Total 25 100
92% respondents increased their monthly income after getting micro-credit and investing it in income generating projects. This is because they were educated and have matric qualification. Only 8% who were illiterate or primary education said that their monthly incomes were remaining same. The Data collected was showing positive impact on poverty alleviation of the beneficiaries. Results showed that after getting the micro-credit, all the respondents have increased their income particularly those having education of matric. These findings were also supported by the results of Usmani (2000), NRSP (1998), Zaman (1999), PRSP (2000), Tahir and Hussain (2000), Harding
JOURNAL OF EDUCATIONAL RESEARCH (Vol.12, No.1) 2009 Dept Of Education IUB,
Pakistan
120
(2003) and Hussain,et.al,(2005). Increased income was the base which facilitated poor to alleviate their poverty. 88% respondents claimed that after getting micro-credit and investing in income generating projects their food quality had been improved. The results was also supported by Usmani (1998), Satti (1998) and Tahir and Hussain (2000). 60% respondents told that there affordability to purchase new cloths according to the season and occasions were increased. These findings are in accordance with the results of Usmani (1998), Satti (1998) and Tahir and Hussain (2000). Data showed that after getting micro-credit the health status of the respondents was increased and better, which was due to better feed intake, clothing and housing as their income increased. These results are in accordance with Satti (1998), population council (1999) and Hussain et. al (2005).
References
Fairchild, H. P. (1995) A Dictionary of Sociology. Iowa, Littlefield, Adann and Co.
Goode, W. J. and Hatt, P. K. (1957) Methods in Social Research, McGraw Hill Book Co., New York.
Harding, D.J. (2003) Counterfactual models of neighborhood effects: The effect of neighborhood poverty on dropping out and teenage pregnancy. American J. Sociology, 109(3): 676-719.
Haq, K. (1999) A profile of poverty in Pakistan. Mahbub-Ul-haq center for Human Dev., Islamabad, Pakistan.
Hussain, I., Shakir, I. and Ahmad, M. (2005) Impact of NRSP on rural areas of Rawalakot, Azd Kasmir. Pak. J. Sci., 57(3-4):109-112.
Khan, M. H. (2002) Why the poor are poor. The Dawn, Feb.19. Lahore.
Neumann, W. L. (1997) Social Research Methods, Qualitative and Quantitative approaches, Allyss and Bacon, USA.
National Rural Support Programme (1998) Fifth Annual Report, Pan Graphics (pvt) Ltd., Islamabad.
Population Council. (1999) Annual Report. Micro-credit programme,

JOURNAL OF EDUCATIONAL RESEARCH (Vol.12, No.1) 2009 Dept Of Education IUB,
Pakistan
121
poverty and contraceptive. [www.popcouncil.org]. Punjab Rural Support Programme (2000) Monitoring and Evolution Section. Lahore Region. Rothstein, A, L. (1985) Research Design and Statistics for Physical
education. Hall, Inc., Englewood Cliffs, NJ. USA. Satti, N. (1998) Girls in domestic child labour. M.A. Thesis. Deptt.
of Sociology, PU. Lahore. Tahir, R.R., B. Hussain (2000) A study on micro-credit. M.A. Thesis.
Deptt. of Sociology, PU. Lahore. Usmani, A. (1998) Women and empowerment, (H. Afshar)
Illustration from the third world. St. Martin’s Press. Inc. New York.
World Bank (2000) World Development Report, Attacking on poverty. Oxford Uni. Press, Inc. New York.
Zaidi, S. A., (2005) Issues in Pakistan Economy. 2nd Ed., Oxford Uni. Press. Karachi.
Zaman, H. (1999) Assessing the impact of micro-credit on poverty and Vulnerability in Bangladesh. Policy Res. working Paper,
World Bank Dev. Eco. of the SVP. and Chief Economist, USA.

JOURNAL OF EDUCATIONAL RESEARCH (Vol.12, No.1) 2009 Dept Of Education IUB,
Pakistan
122
A Study of the Impact of Social Mobilization at the Stage
of Primary Education in Rural Areas of Punjab
♣Prof. Dr. Ahmad Farooq Shah
♣♣Muhammad Aqeel Raza
Abstract The article is based on a study conducted to examine the impact of social
mobilization at the stage of primary education in the rural areas of Punjab.
The sample was composed of 85 community primary schools working under
the Punjab Rural Support Program (PRSP)-Multan. A survey with the help
of a social organizer of PRSP-Multan was conducted to calculate cost per
student per year during the session 2004-05. The technique used was the
“Cost Benefit Analysis” to find the cost per student of Government primary
school as well as the community schools run by PRSP in Punjab. It was
found that this cost is one-third to the cost per student studying in
Government primary schools. On the basis of Participatory Rural Appraisal
(PRA) conducted by PRSP, there were a number of non-tangible benefits. It
was concluded that cost per student can be reduced by Government to one
third with the help of social mobilization which will ultimately improve
confidence, modesty and curiosity of the children.
Keywords: Social Mobilization, Primary School, Rural Community
Introduction Education is the process of learning and social adjustment of an individual (Sadiq, 1993, p.28), therefore it is a basic need of every member of society which is provided formally through public and private sector and non-formally through Masjid, Maktib, Self Study etc. So, it is the duty of Government to provide opportunities of education at all levels to every individual of society. There are different levels of education, but basic and most important level is the “Primary Education.” In “The Encyclopedia Americana” (1983, p.667), Primary Education is defined as:
♣ Professor & Chairman, Department of Education, Bahauddin Zakariya University, Multan ♣♣ Ph. D. Research Scholar, Department of Education, Bahauddin Zakariya University, Multan

JOURNAL OF EDUCATIONAL RESEARCH (Vol.12, No.1) 2009 Dept Of Education IUB,
Pakistan
123
Primary education can be called the most universal and significant level of formal education is that for more of world’s people get schooling at this level than at the secondary and higher levels.
At this stage, the age of the individual is between four to seven years, when he/she is taught fundamental skills to provide stronger base for secondary and higher education. In developing countries like Pakistan, the governments have limited resources for the provision of social services to all individuals. Therefore, governments are facing a lot of problems to provide Primary Education to all concerned specifically in rural and remote areas. Following comparison between rural and urban areas of Punjab provides the facts.
Rural Urban Total
Literacy Rate 38.5% 66.2% 47.4%
Formally Trained 38.1% 65.2% 47.0%
Non-Formally Trained
0.4% 0.4% 0.4%
Source: Population & Housing Census; 1998.
(Mukhtar, 1999, P.11)
To minimize the above-mentioned differences between urban and rural areas, governments have taken different steps and involved private sector to share the local problems.
Such types of sharing provided the bases of the local bodies at grass root level in the fields of education, health, disaster, rural development, capacity building, capital formation, child labor, special education, family planning, emergencies, etc. This supports to Community Based Organizations (CBOs) to solve their community problems, which work through self-help. So, a new concept “Social Mobilization” was introduced by these organizations. The concept of social mobilization emerged from the

JOURNAL OF EDUCATIONAL RESEARCH (Vol.12, No.1) 2009 Dept Of Education IUB,
Pakistan
124
recognition that a genuine participatory approach to development is essential for success and sustainability (Family Tree of Theories, 2005). In second Annual Report, PRSP- Multan (2000, p. 5), Social Mobilization is defined as:
Social Mobilization is the process by which individual thoughts of people are concentrated and metamorphosed into a communal cogitation for development that would benefit everybody equitably.
It means that people are most important and key role players in this design of development. People are gathered on a platform through social guidance. Every individual has equal chance to give views. A successful mobilization must be built on the basis of mutual benefits of partners and a decentralized structure. Similarly, Social Mobilization is defined by Family Tree of Theories (2005) as:
Social mobilization is an approach and tool that enables people to organize for collective action, by pooling resources and building solidarity required to resolve common problems and work towards community advancement. It is a process that empowers women and men to organize their own democratically self-governing groups or community organizations which enable them to initiate and control their own personal and communal development, as opposed to mere participation in an initiative designed by the government or an external organization.
Effective social mobilization goes beyond community organizations, harnessing the potential and efforts of government, non-governmental sector and citizens to work towards sustainable social, economic and political development. The benefits of social mobilization to community organizations and its impact locally and nationally can be best sustained within an enabling political, policy and regulatory environment and where mechanisms for linking
JOURNAL OF EDUCATIONAL RESEARCH (Vol.12, No.1) 2009 Dept Of Education IUB,
Pakistan
125
experiences and lessons at the community level to policy are developed. So, Mobilization is an approach that empowers people to participate actively in development processes – through their own local initiatives and through well-informed and constructive dialogue at the policy level. On the whole, it is an effective tool for building a well-informed, proactive and strong civil society, making it a valuable partner for government and the private sector in shaping national development that is equitable and sustainable (Thompson and Pertschuk, 1992), (Family Tree of Theories, 2005). Social mobilization interventions are empowerment or the process through which individuals or communities take direct control over their lives and environment (Minkler, 1990). This is also called a participatory development. Examples of NGOS providing Social Mobilization are Agha Khan Rural Support Program (AKRSP); National Rural Support Program (NRSP); Punjab Rural Support Program (PRSP); Baluchistan Rural Support Program (BRSP); Sarhad Rural Support Corporation (SRSC); etc.
From worldwide experience, there are four basic elements of social mobilization: Organizational development, Capital formation, Trainings and Socio-economic development. Organizational development is a process in which community members organizations based on common interests and needs (Family Tree of Theories, 2005 and Atwood, 2001). Capital formation (through mobilization of savings) enhances a community organization’s power to realize its full potential (Pandey, 2002). Training for Human Resource Development Community members can maximize their potential not only by organizing themselves but also by upgrading their existing skills (Pandey, 2002). Socio-economic development initiatives are a great incentive for community members to organize themselves.
Social mobilization is an important tool in the poverty alleviation process. Experience shows that poverty and bad governance mutually reinforce, as they foster exclusion of citizens from decision-making processes, lack of access to basic services, lack of opportunity, dependency, and limit availability of public goods. Social mobilization must be institutionalized within government for

JOURNAL OF EDUCATIONAL RESEARCH (Vol.12, No.1) 2009 Dept Of Education IUB,
Pakistan
126
it to be effective. This would encourage participation and decision-making, build capacity for participatory planning, build a common vision on development and ensure transparency. By organizing people to better manage their natural resources and fight against practices and organizations that degrade the environment through promoting appropriate legal, regulatory and institutional frameworks and policy dialogue. As people organize to address common problems, and to collectively improve their socio-economic conditions in an equitable, democratic and transparent manner, possibility of conflict can be significantly reduced.
Punjab Rural Support Program (PRSP), Multan-As a Model
In Punjab, more than 4500 different NGOs are registered, working in different fields of interests. Department of Social Welfare has no proper record of particular area of activities of NGOs. Punjab Rural Support Program (PRSP) was initiated and funded by provincial government in 1998. PRSP is non-governmental organization, registered under section 42 of Companies ordinance (1984). This program was initiated in eight regions of Punjab namely Multan, Sahiwal, Muzafargarh, Faisalabad, Lahore, Sargodha, Gujranwala and Narowal. PRSP is working in Education through Social Mobilization as well as in other fields. The program is based on the assumption that, there is the tremendous willingness among the rural people to help themselves and PRSP strives to harness the potential of these willing people. So that they can identify, plan and implement the development activities with their own resources and under their own management. Right from the very beginning, PRSP-Multan motivated and encouraged the community to work for the promotion of the Primary Education on self-help basis. Till June 2005, 85 community schools were established. These schools had been established in the villages where the nearest government schools are more than two kilometers away. Community appointed teachers. The minimum qualification of these teachers was matric. Teachers of these schools were also trained. Impressed by these developments, Government of Punjab decided to provide an endowment fund of Rs.200, 000 for each of these community schools. The management of these schools was directly in the hands of parents. They ensured a learning atmosphere at the school.

JOURNAL OF EDUCATIONAL RESEARCH (Vol.12, No.1) 2009 Dept Of Education IUB,
Pakistan
127
To see the impact of attending school on the behavior of children, who were previously not attending school even after reaching school-going age, a Participatory Rural Appraisal (PRA) exercise was conducted. The exercise revealed improvement in confidence, modesty, decorousness and curiosity of the children.
Achievement in Education Sector as on June, 2005
Community Schools Established: 85
No. Of Teachers Employed: 118
Male: 45
Female: 73
No. Of Students: 5,278
Boys: 2,605
Girls: 2,673
A large number of children started to go to schools. Rural communities got a chance of quality education at doorstep. A small amount of resources used and it was also saving from wastage of resources. A study is done in this regard.
Cost-Benefit Analysis
Cost Benefit Analysis (CBA) estimates and totals up the equivalent money value of the benefits and costs to the community of projects (Department of Economics, 2007). Economist argued that Cost Benefit Analysis is systematic evaluation (Reichert, 2007) and very effective tool in comparison of magnitude of cost and benefits in public and private sector (Rehman, 2007), formal discipline used to help appraise, or assess, the case for a project or proposal (Wikipedia, 2007), widely used technique for deciding whether to make a change (The Mind Tool Community, 2007) (NCEDR Interactive, 2007). Cost Benefit analysis attempts to put all relevant costs and benefits

JOURNAL OF EDUCATIONAL RESEARCH (Vol.12, No.1) 2009 Dept Of Education IUB,
Pakistan
128
(Wikipedia, 2007) (Reh, 2007) . The technique used to data analysis is the “Cost Benefit Analysis (The Mind Tool Community, 2007) (Department of Economics, 2007) (NCEDR Interactive, 2007) (Koutsoyiannis, 2006) (Gould and Lazear, 1991) (Salvatore, 2001) ” to find the cost per student of the community schools run by PRSP in Punjab as given.
(A study with the help of SO, PRSP-Multan)
Region: Multan No. of Community Schools: 85 No. of students: 5,278 No. of students (Male): 2,605 No. of Students (Female): 2, 673 No. of Teachers Employed: 118 No. of Teachers Employed (Male): 45 No. of Teachers Employed (Female): 73 Duration: One Year Endowment Fund for One School: Rs. 200,000.00 Endowment Fund for 85 Schools: Rs. 17,000,000.00
Costs
A cost is the value of inputs that have been used up to produce something, and hence are not available for use anymore (Wikipedia, 2007). (Costs provided by Government of Punjab and PRSP-Multan.) Income from Endowment Fund: Rs. 1,700,000.00(Nearly/Year) Expenditure on Teacher Training: Rs. 260,000.00 Visit of Social Organizer (SO): Nil (In Routine) Deprives: Rs.1, 700,000.00 (10 Percent/Year) Total Costs: Rs. 3,660,000.00 Benefits
Benefits are the outputs that have been produced with some inputs
(Wikipedia, 2007). In this case benefits are:

JOURNAL OF EDUCATIONAL RESEARCH (Vol.12, No.1) 2009 Dept Of Education IUB,
Pakistan
129
No. of Students: 5,278 Costs per Student: Rs. 693.44 So, cost per student per year is just Rs. 693.44 Non-Tangible Benefits On the basis of Participatory Rural Appraisal (PRA) conducted by PRSP, the non-tangible benefits are:
1- Improvement in confidence, modesty, decorousness and curiosity of the children (Study by PRSP).
2- Employment opportunities for 118 persons especially for females.
3- Increment of literacy rate of females in rural areas. 4- Awareness in community. 5- Helping in poverty alleviation.
Findings So, with the help of Social Mobilization, the cost per student per year was just Rs. 639.44 and local communities do all other expenditures. The management was in the hands of local people who ensured the quality education. While cost per student by Punjab Government was Rs. 2500 (EFA, 2004). Conclusions In the process of Social Mobilization, the social guidance is provided to people to harness their potentials, to organize the people at a platform to solve their problems and for the activities of development of their communities. Through Social Mobilization, we can save a lot of resources and development is sustainable development. Government should start such programs in the field of Education in rural areas. In this way, Government can increase literacy rate with the help of Social Mobilization and participation of communities in rural areas using limited resources. We can improve in confidence, modesty, decorousness and curiosity of the children in limited resources and this is helpful for the economy of country.

JOURNAL OF EDUCATIONAL RESEARCH (Vol.12, No.1) 2009 Dept Of Education IUB,
Pakistan
130
Recommendations Government of Pakistan should start such programs in the field of Education especially in primary education. These programs are more beneficial in rural areas where the population is scattered and effective monitoring is not possible. With the participation of local people, Government can provide the standard education using limited resources. Bibliography Atwood, (2001). Social Mobilization, Retrieved on July 17, 2005
from http://www. undp.org/poverty/docs-civilsociety/socialmobilization-local-governance.doc
Chauhan, S.S. (1978. Advanced Education Psychology, New Delhi: Chetna Printers.
Department of Economics, (2007), Cost Benefit Analysis, Retrieved on May 11, 2007 from http://www.sjsu.edu/faculty/watkins /cba.htm
EFA, (2004). Retrieved on July 17, 2005 from www.Unesco.orgwefcountry rapports_2_html
Family Tree of Theories, (2005), Social Mobilization, Retrieved on July 17, 2005 from http://search.msn.click-url.com/go /onm00200636 ave/direct/01/
Iram, M. (2001). The Role of the NGOS in the Field of Education, Multan: Unpublished Thesis, B.Z. University.
Jilani, H. (1998). Human Rights and Democratic Development in
Pakistan, Lahore: Visionaries. Gould, J. P. and Lazear, E. P. (1991). Microeconomic Theory, Delhi:
Laxman Chand Arya. Koutsoyiannis, A. (2006). Modern Microeconomics, 2nd ed.,
Rawalpindi: National Book Foundation. Minkler, (1990). Social Mobilization, Retrieved on July 17, 2005
from http://www.tulane.edu/~icec/socmob.htm. Mukhtar, E. (1999). Draft of Basic Education in Pakistan, A
Background study for UNESCO, Islamabad: UNESCO. NCEDR Interactive, (2007). Cost Benefit Analysis, Retrieved on
May 11, 2007 http://sunsite.utk.edu/ncedr/tools/othertools/costbenefit/lead.htm

JOURNAL OF EDUCATIONAL RESEARCH (Vol.12, No.1) 2009 Dept Of Education IUB,
Pakistan
131
Net-NGO, (2004), “FAQ’s, What is an NGO”, Retrieved October 1, 2004 from http;//www.net-ngo.com/
Pandey, K. (2002). Social Mobilization: Concept and Application for
Poverty Reduction and Self-Governance, Paper for Regional Workshop on Promoting Effective Participation of Civil Society in Local Governance and Poverty \Alleviation in the ECIS Region – Challenges and Good Practices, Retrieved on July 17, 2005 from http://www.undp.org/poverty/docs-civilsociety/social-mobilization-local-governance.doc
PRSP-Multan, (2000). Second Annual Report 1999- 2000, Multan: Punjab Rural Support Program-Multan.
Reh, F. J. (2007), Cost Benefit Analysis; Retrieved on May 10, 2997 from http://management.about.com/cs/money/a/CostBenefit.htm
Rehman, A. (2007). The Study of Cost-Benefit Analysis of Private
and Government Schools In Journal of Research in Education, Lahore: Faculty of Education, University of Punjab
Reichert, P. (2007). Benefit-Cost Analysis for Transportation
Projects, Retrieved on May 10, 2007 from http://www.oim.dot.state.mn.us/EASS/
Sadiq. M.I. (1993). What is Education; in Journal of Elementary
Education, Lahore: Department of Elementary Education, Institute of Education and Research, University of Punjab.
Salvatore, D. (2001). Managerial Economics, 4th ed., Australia: South- Western Thomson Learning.
The Encyclopedia America, (1983). Vol. 22, Danbury: Grolier Incorporated.
The Mind Tool Community, (2007). Retrieved on May11, 2007 from http://www.mindtools.com/pages/article/newTED_08.htm
Thompson and Pertschuk, (1992), “Social Mobilization”, Retrieved on July 17, 2005 from http://www.tulane.edu/~icec/socmob.Shtm
Wikipedia, (2007). Retrieved on May 12, 2007 from http://en.wikipedia.org/

JOURNAL OF EDUCATIONAL RESEARCH (Vol.12, No.1) 2009 Dept Of Education IUB,
Pakistan
132
Being Vital: A Function of Big Five Personality Traits
♣Dr. Sarwat Sultan
Abstract Individuals vary in their experience of vitality as a function not only of
physical influences (e.g., states of illness and fatigue), but also
psychological factors (e.g., being in love, having a mission, being effective).
So for, the present study was conducted to examine the relationship between
subjective vitality and personality traits. The sample consisted of 100
students taken from Bahauddin Zakariya University Multan. To measure the
subjective vitality and personality traits, Subjective Vitality Scale (Ryan &
Frederick, 1997) and Five-Factor Inventory (Fincham & Rhodes, 1999)
were used respectively. Empirical results indicated that two of the Big-five
personality traits; extraversion and conscientiousness are significantly
positively correlated to subjective vitality. Traits of neuroticism and
agreeableness are negatively but not significantly correlated with subjective
vitality.
Keywords: Subjective Vitality, Personality Traits, Psychological Factors, Empirical Results Introduction The concept of subjective vitality refers to the state of feeling alive and alert--to having energy available to the self. Vitality is considered an aspect of eudemonic well-being (Ryan & Deci, 2000), as being vital and energetic is part of what it means to be fully functioning and psychologically well. In essence, vitality expresses a general energy for life.As a subjective feeling, vitality has been variously defined as a sense of “feeling really alive,” invigorated, or full of energy and enthusiasm for life. Various authors have used a number of adjectives in adjective selection tests to attempt to capture the concept. These have included active, peppy, energetic, vigorous, lively (Purcell, 1982), and enthusiasm, zeal, zest, exhilaration (Shaver, Schwartz, Kirson, & O'Connor, 1987). It is interesting to
♣ Department of Applied Psychology, Bahauddin Zakariya University Multan

JOURNAL OF EDUCATIONAL RESEARCH (Vol.12, No.1) 2009 Dept Of Education IUB,
Pakistan
133
note that in these adjective tests, affective terms such as happy, contented, pleased, elated, overjoyed, satisfied, cheerfulness, joy, the light, happiness, and satisfaction did not load on the factor described as vigor (Purcell, 1982; Shaver, et al., 1987). Yet, these descriptive expressions may refer to anything from a momentary feeling in the emotional swing of everyday life to physical symptoms of fatigue and improper diet. This positive sense of aliveness and energy refers to more than merely being active, aroused, or even having stored caloric reserves. Rather we believe it concerns a specific psychological experience of possessing enthusiasm and spirit that we refer to as vitality. The concept was revisited when Deci and Ryan (1987) first suggested a connection between personal vitality and their theories of intrinsic motivation and self-determination. Ryan and Frederick (1997) observed that the concept of vitality generally centers on a need to be competent, flourishing, and an active agent in the world. They point out that these fundamental needs tend to be most clearly correlated to the phenomenon of intrinsic motivation. Ryan and Frederick (1997) define personal vitality as "one’s conscious experience of possessing energy and aliveness” and “energy that is perceived to emanate from the self". Others restate Ryan and Frederick’s definition as "the subjective experience of being full of energy and alive’ (Bostic, Rubio & Hood, 2000) or "a positive feeling of aliveness and of possessing personal energy" (Nix, Ryan, Manley & Deci, 1999). Yet, vitality is not a completely psychological notion. The physiological aspect of vitality refers to sense of having or indicating good health in body or mind; free from infirmity or disease, having capacity or ability, and possessing or exerting or displaying energy. The psychological aspect of this vitality refers to a sense that the acts of individual are meaningful and purposeful. It has been clearly noted that vital force is more than just stimulation. Vitality connotes an extract of positive energy as opposed to aggression, nervousness, or arousal induced by drugs e.g. caffeine. The energy related to vitality is different from energy associated with calories. One can not take hope or support for vitality even when is seriously in deprivation of calories, eating and

JOURNAL OF EDUCATIONAL RESEARCH (Vol.12, No.1) 2009 Dept Of Education IUB,
Pakistan
134
drinking (Selye, 1956). However excessive eating may lower vitality and exercise may increase vitality (Myers et al, 1999). Personality refers to the enduring or unceasing patterns of knowing, relating to, and thinking about the environment and oneself that are showed in a wide range of social and personal contexts (Diagnostic & Statistical Manual of the American Psychiatric Association, (2000). Theorists are of the views that usually (a) traits remain constant over time, (b) different people have different traits e.g. some people may be introvert while some may be extrovert (c) behaviors are influenced by traits.. Traits are basically the different characteristics of a people that make them different to each other. Traits help in to perceive or to make actions in a similar way in reaction to a wide range of different events or circumstances. Personality theories also explain that in general, individuals may differ on the elements that are continuous. Individuals may not differ in the quality of their characteristics but may differ in the quantities or amounts of their characteristics (Harris, 2006). Goldberg, (1993) has presented a model of Big Five personality traits. He was of the view that basically there are five main factors or dimensions of personality which are identified by the empirical studies. These factors are Conscientiousness, Neuroticism, Agreeableness, Extraversion, and Openness to Experience. Each factor further has a number of more specific traits. For example, the trait of conscientiousness may further be linked with the trait of being painstaking and careful. Conscientiousness – The person with this trait will be self-disciplined, will do act dutifully, and will have aim for success. Agreeableness – A person under this trait will be courteous, empathic, compassionate and cooperative rather than suspicious and resistant towards other people. Neuroticism – A person will be poised, secure, and calm, and will have the experiences of unpleasant emotions of aggression, sadness, grief, anxiety, and depression. Sometimes it is also called emotional instability.

JOURNAL OF EDUCATIONAL RESEARCH (Vol.12, No.1) 2009 Dept Of Education IUB,
Pakistan
135
Openness to Experience - Sensitive, flexible, creative, appreciation for art, adventure, imagination, and curiosity are the important faces of this traits. Extraversion – This trait includes the tendency to outgoing, energy, positive emotions, and talkative. Many of the studies on the subject of vitality have been conducted by Ryan and Frederick (1997). They clearly described that subjective vitality is another form of well being. Well being can be predicted by the subjective vitality. Individuals of varying personalities may be differing in the level of subjective vitality (Ryan & Frederick, 1997). Another study examined subjective vitality’s correlation with five personality traits and with social desirability. Positive significant correlations were found between vitality and extroversion and with conscientiousness. There was a larger negative correlation between vitality and neuroticism. There were also significant correlations between vitality and mood states – a positive correlation with positive mood states and a negative correlation with negative mode states. There was no significant correlation with the personality traits of openness or agreeableness, or with social desirability (Ryan & Frederick, 1997).On the basis of existing literature, the present study was planed to examine the association of subjective vitality, a positive feeling of aliveness and energy, with personality traits. The main objective of this study was to find out what sort of correlation is present between feelings of vitality and big five personality traits. On the basis of existing literature following hypothesis was formulated;
� Subjective vitality is positively correlated with extroversion, openness to experience and conscientiousness, while is negatively correlated with neuroticism and agreeableness.
Method
Participants
Sample consisted of 320 students (160 males and 160 females) taken from Bahauddin Zakariya University Multan, ranging in age from18 to 25 years. Participants were selected through non-probability convenience sampling technique.

JOURNAL OF EDUCATIONAL RESEARCH (Vol.12, No.1) 2009 Dept Of Education IUB,
Pakistan
136
Instruments
Following instruments were used to collect the data. Subjective Vitality Scale Subjective Vitality Scale (Ryan & Frederick 1997) has two versions. One version assesses individual difference of vitality. The other version of the scale assesses the state of subjective vitality rather than its enduring aspect. In short, because the concept of psychological well-being is addressed at both the individual difference level and the state level, the two levels of assessing subjective vitality tie into the two level of well being. The original scale has 7 items and is validated at both levels. A scale score is formed for either version of the scale by averaging the individual’s items scores. As noted above, it is recommended that you use six items, omitting item #2, in which case a person’s score would be the average of the six items. If you do use item #2, that item has to be reverse scored before it is averaged with the other items. Thus, you would subtract the person’s score on item #2 from 8 before averaging the resulting number with the person’s responses on the other six items. Five-Factor Inventory Five-factor inventory (Fincham & Rhodes, 1999) measures five dimensions of personality, i.e. Extroversion, Neuroticism, Openness to experience, Agreeableness and Conscientiousness. Inventory is comprised of 60 adjectives with 5 options for responses; strongly disagree, disagree, neutral, agree and strongly agree. These responses are scored as 4 for strongly disagree, 3 for disagree, 2 for neutral, 1 for agree and 0 for strongly agree. Some items will be reverse scored as 0 for strongly disagree, 1 for disagree, 2 for neutral, 3 for agree and 4 for strongly agree. The items which have the value from 4 to 0 are: 1, 3, 8, 9, 12, 14, 15, 16, 24, 27, 29, 30, 31, 38, 39, 42, 44, 45, 46, 48, 54, 55, 57, and 59. Resting items have the worth from 0 to 4. The scale has scoring range of minimum 0 to maximum 48. Each dimension of personality is measured by 12 adjectives and has its separate score. The items that make up the subscales are as follows.

JOURNAL OF EDUCATIONAL RESEARCH (Vol.12, No.1) 2009 Dept Of Education IUB,
Pakistan
137
Extroversion; 2, 7, 12, 17, 22, 27, 32, 37, 42, 47, 52 57 Neuroticism; 1, 6, 11, 16, 21, 26, 31, 36, 41, 46, 51, 56 Openness to Experience; 3, 8, 13, 18, 23, 28, 33, 38, 43, 48, 53, 58 Agreeableness; 4, 9, 14, 19, 24, 29, 34, 39, 44, 49, 54, 59 Conscientiousness; 5, 10, 15, 20, 25, 30, 35, 40, 45, 50, 55, 60
Procedure For the present study, students were contacted in different departments of university. Subjective vitality scale and Five-Factor Inventory were distributed to those students who volunteered to participate in the study. It was made clear to the respondents that the questionnaires were to be filled out anonymously and their responses would be kept confidential. Respondents were requested to fill up the questionnaires according to the instructions written on it. Analysis of data was performed using SPSS.
Results and Discussion
Table 1: Correlation between subjective vitality and big five
personality traits
Personality traits Pearson Correlation
p
Extroversion .607 0.001**
Neuroticism -.411 0.02*
Openness to experience .525 0.09
Agreeableness -.142 0.03*
Conscientiousness .721 0.001**
df = 98, *p<0.05, **p<0.01

JOURNAL OF EDUCATIONAL RESEARCH (Vol.12, No.1) 2009 Dept Of Education IUB,
Pakistan
138
Results (Table 1) are analyzed on the basis of assumption that subjective vitality level is significantly correlated with big five personality traits. Subjective vitality is positively correlated with extroversion, openness to experience and conscientiousness. While is negatively correlated with neuroticism and agreeableness. Results reveal that subjective vitality is positively and significantly correlated with extroversion (r = .607, p<.01) and conscientiousness (r = .721, p<.01). This finding is supported by that of previous study conducted by Ryan and Frederick (1997). According to their study, results showed positive significant correlations between vitality and extroversion and with conscientiousness. Findings also indicated that subjective vitality is negatively correlated with neuroticism (r= -.411, p<.05) and agreeableness (r= -.142, p<.05). This finding is also supported by the study conducted by Ryan and Frederick, (1997). As they concluded there was a larger negative correlation between vitality and neuroticism. Study also demonstrated that subjective vitality is positively correlated with openness to experience but this correlation is not statistically significant. These results are also in tune with the study (Ryan & Frederick 1997) that there was no significant correlation of subjective vitality with the personality traits of openness to experience. Conclusions On the basis of the findings obtained in the present research it is concluded that subjective vitality level and big five personality traits are correlated with each other. Extroversion and conscintiousness are significantly positively correlated with subjective vitality. Neuroticism and agreeabelness are negativly and openness to experience is positively but none significantly correlated with subjective vitality. Limitations & Suggestions
There were certain limitations of the present research which must be mentioned here. Sample was restricted to only students of BZU, Multan, the sample was not large enough so that the findings therefore can not be generalized to other sample of this kind who can have different social background. The study may well be replicated in other settings, exploring some more variables which could be associated with subjective vitality and personality traits.

JOURNAL OF EDUCATIONAL RESEARCH (Vol.12, No.1) 2009 Dept Of Education IUB,
Pakistan
139
References Bostic, T. J., Rubio, D. M., & Hood, M. (2000). A validation of the
Subjective Vitality Scale using structural equation modeling. Social Indicators Research, 52(3), 313 - 324.
Deci, E.L., & Ryan, R. M. (1987). The support of autonomy and the control of behavior. Journal of Personality and Social
Psychology, 53, 1024-1037. Diagnostic and Statistical Manual of Mental Disorders – Text
Revision (DSM-IV-TR) (4th ed.). (2000). Washington, DC: American Psychiatric Association.
Fincham, R. & Rhodes, P. S. (1999). Individual Differences. ‘Principles of Organizational Behavior’. Oxford University Press Inc, New York: ISBN 0-19-877577-6. Fayol, H. General and Industrial Management, trans. C. Storrs (London: pitman, 1949).
Goldberg, L. R. (1993). The structure of phenotypic personality traits. American Psychologist, 48, 26-34.
Harris, J. R. (2006). No two alike: Human nature and human
individuality. WW Norton & Company. Myers, A. M., Malott, O.W., Gray, E., Tudor-Locke, C., Ecclestone,
N.A., Cousins, S.O., et al. (1999). Measuring accumulated health-related benefits of exercise participation for older adults: The Vitality Plus Scale. Journal of Gerontology,
54 , M456-M466. Nix, G., Ryan, R. M., Manly, J. B., & Deci, E. L. (1999).
Revitalization through self-regulation: The effects of autonomous and controlled motivation on happiness and vitality. Journal of Experimental Social Psychology, 35, 266-284.
Purcell, A. T. (1982). The structure of activation and emotion. Multivariate Behavioral Research, 17, 221-251..
Ryan, R. M. and Frederick, C. (1997). On energy, personality, and health: Subjective vitality as a dynamic reflection of well-being. Journal of Personality, 65, 529- 565.
Ryan, R. M., & Deci, E. L. (2000). Self-determination theory and the facilitation of
intrinsic motivation, social development, and well-being. American Psychologist, 55, 68- 78.
Selye, H. (1956). The stress of life. New York: McGraw-Hill.

JOURNAL OF EDUCATIONAL RESEARCH (Vol.12, No.1) 2009 Dept Of Education IUB,
Pakistan
140
Retrieved on 14 dec 2007 from F:\Authentic Happiness Using the
new Positive Psychology.htm Shaver, P., Schwartz, J., Kirson, D., & O'Connor, C. (1987).
Emotion knowledge: Further exploration of a prototype approach. Journal of Personality and Social Psychology,52, 1061-1086.

JOURNAL OF EDUCATIONAL RESEARCH (Vol.12, No.1) 2009 Dept Of Education IUB,
Pakistan
141
Effectiveness of Non-formal Education through the
Use of Instructional Media
♣Prof. Dr. Muhammad Rashid*
Abstract
The use of instructional media in non-formal education is appreciated all
over the world. Non-formal education as an alternate of formal system is
the demand of developing counties. To make its use more effective various
instructional media are used. Different roles of some of the instructional
media are highlighted in this paper. It was pointed out how to make the use
of instructional media in non-formal education more effective.
Keywords: Non-formal Education, Instructional Media, Classroom Introduction Doubtless to say that neglecting functional non-formal an educational programme is a greatest mistake done by a nation. Such mistake has been identified by countries that had fallen victim to it as being grievous and costly. For instance, it was observed by several educators such as Dave.R.H.et.al. eds. (1986, p.4) in considering learning strategies for post-literacy and continuing education in China, India, Indonesia, Nepal, Thailand, Vietnam and Pakistan that ".... for a long time non-formal approaches to adult education have been neglected, as well as informal education. As a consequence of this neglect, it has been very difficult in recent years to organize the education of the working people into a widespread mass movement." Non-formal education covers every aspect of our educational enterprise which is neither confined to a classroom situation nor subject to organized strategies, curricula, etc. It is the type of education that is free from rigidity with regards to curriculum, learning materials, methodology, venue, duration or the length an individual takes to complete a particular instructional session.
♣ Dean, Faculty of Education, and Dean Doctoral Programs , Preston University Islamabad.

JOURNAL OF EDUCATIONAL RESEARCH (Vol.12, No.1) 2009 Dept Of Education IUB,
Pakistan
142
Because of its non-formality non-formal education is very necessary in the third world countries where the level of illiteracy is still very high, and the high rate of school drop-out is prevalent as a result of poverty, wars, ignorance, cultural values, carelessness, etc. Besides the fact that neglect is grievous the approach used for conveying what is taught also matters. Even in formal education, the strategy and instructional materials used for teaching are extremely important. For instance, Kindler (1973) asserts that learners comprehend and retain more of what they are taught when adequate and appropriate instructional media is employed. Learners are said to remember ninety per cent of what they say as they do a thing as against only twenty percent of what they hear. If this assertion is correct and instructional materials play a great role in making learning effective in formal education, then it is more needful and inevitable for non-formal education because non-formal education covers a wider range of people who are more delicate or complex to handle while teaching. For instance, the following are usually the target groups:
1) Unschooled Children
Children of school age who are unfortunate because they cannot be enlisted in a formal educational system due to poverty, ignorance, inability to cope with formal education as a result of drop-out, etc.
2) Illiterate youths and adults These are the people who have never had the opportunity of formal education or its equivalent.
3) Rural dwellers
Majority of the Pakistan populace of rular sind and balichistan who live far away from urban areas or locations where formal education is accessible.
4) Nomads
People who have to move from place to place in search of "greener pastures" either for their herds or farmlands. As a result, a meaningful and consistent formal education is not usually considered necessary.

JOURNAL OF EDUCATIONAL RESEARCH (Vol.12, No.1) 2009 Dept Of Education IUB,
Pakistan
143
The achievement of the non-formal education as stated in the National Policy of Education will also be better enhanced through the utilization of instructional media as it is done in the formal educational system; The following are the objectives of policy (1998-2010, p.20):
1. To achieve the global objective of Education for All and All for Education.
2. To complement and supplement the formal system to achieve the target of Universal Primary Education (UPE) through community involvement in the shortest possible time.
3. To impart functional literacy for adolescents (10-14) who missed out the chance of primary education.
4. To provide lasting functional literacy and income generation skills for rural women of 15 to 25 age group.
5. To provide the basic educational facilities of working children and reduce child labar.
6. To expend the facilities and services of middle level education through community involvement and non-formal means.
From the above policy statements on education, it is certain that both formal and non formal educational systems have a common aim of making learners literate and thereby helping them to be fruitful citizens of the country so that they can contribute meaningfully to the social, economic, political sectors of public at large. The ultimate achievement of these goals is largely anchored on the technological advancement of the society and the application of technological and scientific approaches to all our educational enterprises. The main focus of this paper, therefore, is to bring to the limelight the needed emphasis on the importance of instructional media in making non-formal education functional and more effective. General Background According to Dave et al, eds. (1986, p.63), "illiteracy is a serious impediment to the individuals' growth and the country's socio-economic progress." This is a true statement of any country whose illiteracy level remains high. When the level of illiteracy is high in

JOURNAL OF EDUCATIONAL RESEARCH (Vol.12, No.1) 2009 Dept Of Education IUB,
Pakistan
144
any society, that society will remain backward, antisocial with all barbaric behaviors and actions. on-formal education dates back to the colonial era when colonial masters exposed their "servants" or "maids" to some basic non-formal learning. For instance, cooking, dress making or knitting, handwork, housekeeping and the teaching of English language for easy communication were among the common features of informal ways the colonial masters used. This type of education was successful and indirectly executed informally during the free or leisure periods of the colonial house helps or maids; Advantages of non-formal Education
Non-formal education, in general, is an effective way of liberating the individuals in any society from ignorance, poverty, antisocial activities, etc. According to Visocchi (1978, p.3) education is seen as "that process of liberation whereby man frees himself from whatever obstructs him from thinking capacity....." Liberating the individual is the main focus of any form of education. Non-formal education, therefore, helps the rural man to become more human, more of a person and to acquire a higher level in his thinking ability that provides the liberation he truly needs. This type of freedom which a man needs cannot be acquired for him by others no matter how intelligent they are. Man's liberation actually comes from the continued development and evolution of his ability that can enable him to think or reflect and question what goes on in his environment as opposed to total submission to authority and human exploitation. Non-formal education also provides alternatives to complement or supplement the incompleteness or inadequacies of the formal educational system. Non-formal education further helps the learners to develop and practice self-help activities rather than mere theories. Research confirms that positive results from non-formal education (especially adult education) come as a result of practice of professional skills (Knowles. 1980; Freire, 1985; Freire and Macedo. 1987; etc). The acquisition and practice of skills boost the self-image self-reliance and confidence of the individual. This is very necessary especially for those who had dropped out from formal education or schooling.
JOURNAL OF EDUCATIONAL RESEARCH (Vol.12, No.1) 2009 Dept Of Education IUB,
Pakistan
145
The roles of Instructional Media in Non-formal Education The application of instructional media in non-formal education is extremely essential for effectiveness. Besides helping students to comprehend. retain and recall concepts, principles or theories, instructional media also helps them to acquire professional skills which is the main core of the non-formal education. The use of instructional media increases flexibility in learning. For instance, learning programmes which are highly individualized and self-evaluated (such as programmed instruction) increase capacities for self-learning and also opportunities for inter-learning. According to Dave, et al.eds. (1982, p.314) "Technology also provides multiple learning opportunities through a variety of places at a variety of times". This according to him, helps to save cost in the long run. The following are the examples of specific contribution of instructional materials or media to non-formal education.
a) Eradication of illiteracy
The use of instructional media in non-formal education reduces and or totally eradicates illiteracy when the participants are adequately and appropriately exposed. For instance, developed countries such as the U.S.A., U.K., etc.. where about 80-85 per cent is said to be the literate, it is largely due to their technological advancement which helps them to be able to make use of educational technology or instructional media such as television, satellite, slides, film strips, audio materials, etc. Actually, the use of instructional materials is the surest means of combating illiteracy especially at the rural level and for bridging the gap between the formal and non-formal learning.
b) Change in social and cultural biases
The application of instructional media in teaching has the potential of breaking social as well as cultural barriers. It is possible for a group of learners to detest certain people or some of their teachers on the ground that they are not from their locality. But most people especially fully illiterates and semi illiterates regard instructional materials such as the television, radio, films, etc as mere independent and innocent channels of information. As a result, some undesirable cultural habits and antisocial behaviors can be modified without necessarily hurting the people involved. Negative or wrong views

JOURNAL OF EDUCATIONAL RESEARCH (Vol.12, No.1) 2009 Dept Of Education IUB,
Pakistan
146
about education can also be corrected with the utilization of instructional media.
c) Equal opportunities to education The use of instructional materials will bridge the gap between the formal and non-formal systems of education. The use of instructional materials help learners whether rich or poor normal or handicapped, from rural or urban areas to be equally exposed to about the same learning experiences. This can be possible if the same instructional materials such as flip charts, posters, flash cards, television, etc are used for education. Technological advancement has also made instructional materials accessible and has removed all limitations that could hamper this through mobility and portability. Instructional Media take technologically or scientifically based instruction experienced in formal system of education to non-formal system of education as well.
d) Individualized instruction The application of instructional media provides enough varieties of resources which are capable of helping learners proceed according to their abilities, interest, speed and convenience, etc. This is particularly significant when considering the fact that non-formal education should be made relevant to the individual's aspirations, interest, convenience, abilities and timing. The individuals can learn at their own speed and ability while avoiding unnecessary rushing or speed that normally occur in formal education. It is further possible to do self-appraisal or assessment with the use of instructional materials such as programmed instruction, slides, teaching machines, etc. For instance, after teaching the primer, the learner can have further drilling with whatever instructional media is made available and to be able to assess his own mastery of what he is learning.
e) Scientifically based instruction There is a tendency to want to believe that non-formal education does not have to be scientifically based. This is a great error that needs to be corrected. Since the success of the nation's literacy programme is anchored largely on how effective every facet of the nation's educational system including the non-formal system of education is, it is necessary to make non-formal education

JOURNAL OF EDUCATIONAL RESEARCH (Vol.12, No.1) 2009 Dept Of Education IUB,
Pakistan
147
scientifically based through the use of instructional media. When this is done, learners will be more creative, innovative and generally successful in their learning.
f) Flexibility in learning
The use of instructional media makes learning programmes and strategies flexible in that they can be adapted to suit individual needs. Capabilities, convenience etc. Flexibility in learning is particularly important in non-formal education. All confinements, restrictions, and formalities experienced in the formal education may not work in non-formal education. Thus, flexibility, which is capable of making learners feel at home, while learning is made more desirable. Flexibility makes non-formal learning truly formal and this is desirable because of the learners' specific needs.
g) Mass education Instructional materials such as films, television, radio and posters are effective means for mass literacy campaign. They help to bring proper awareness to the public on the importance of education, where and when they can attend literacy classes, etc. Many of the instructional materials can also be used to teach or give information to a large group, especially where there is shortage of instructors. Instructional Media and acquisition of some specific skills The acquisition of skills requires a step-by-step teaching, demonstrating and exposing the learners to such skills. Even though the learners are often taught Urdu language, the knowledge of many of the participants is not usually adequate to help them understand the instructions given on the procedures necessary for acquiring some skills. While it is desirable and unavoidable that learners are taught the basic rudiments of reading and writing, the use of instructional media provides an alternative or solution to learners who are not yet capable of handling the written instructions or procedures for acquiring a particular skill.

JOURNAL OF EDUCATIONAL RESEARCH (Vol.12, No.1) 2009 Dept Of Education IUB,
Pakistan
148
Utilization of Instructional Media in Non-formal Education
a) Instructional radio and television programmes
Radio The importance of radio in these days of education, technology can hardly be over-stressed. It is a powerful audio-aid. Pupils of remote places have been benefitted by radio lessons. Lectures by educationists are broadcast for imparting useful information. The concerned teachers must have beforehand information about such lesson programmes. (Bhattt,et. Al(2007, p.99).There are two types of radio broadcasts i.e. ordinary broadcast and educational broadcast. Use of Radio in Teaching
a) First of all, (lie teacher must gather information about radio lessons and study the same. This type of study includes time table and list of programmes.
b) He should carefully plan on the basis of information collected earlier and by establishing its relevance for the subject to be taught.
c) He should motivate the pupils mentally so that they learn to listen attentively.
d) Physical conditions i.e. seating arrangement, light and air, silence, etc., should be well-organized.
e) Follow-up should also be done after listening to the radio. Discussion should be held on the radio-lesson. Pupils should get opportunity to remove their doubts. They should take note’s while listening to the broadcast lesson and thereafter they should get time to complete their notes. They should be asked not to put questions during the broadcast lesson. They should be instructed to note down all the questions they want to ask when the broadcast is over.rashid,m.(1993,pp.18-19)
Advantages of Radio
i) Radio gives opportunity for listening to lectures of famous educationists and thinkers which is otherwise not possible for each and every pupil and teacher.
ii) Radio broadcast helps the teacher in achievement of

JOURNAL OF EDUCATIONAL RESEARCH (Vol.12, No.1) 2009 Dept Of Education IUB,
Pakistan
149
teaching objectives. iii) They also provide entertainment in addition to serious
learning. iv) Radio is very helpful for remote areas where teaching
facilities are not adequately available. v) It is less costly and even common people can make use
of it. vi) The teacher also learns much about latest concepts and
principles. vii) In view of the increasing population, radio ^broadcasts
have acquired much importance. Educational Television Through a television programme the audience not only hears but also sees an event taking place. Television is both audio and visual. It is a great improvement upon radio broadcast. It is fast becoming an integral part of school education; invention of television has brought a great revolution in the world of education. Today it is considered to be really an important means for effective education. It is a powerful medium of communication through auditory as well as visual channels. It helps the students to listen and directly see the lesson on the television screen ensuring teaching learning to be durable and everlasting. (Das, R.C. 1993, p.24) Role of television in education Use of television has fascinating and tremendous opportunities for the world of education. Television as an instructional tool, is being used in a variety of ways: for direct teaching, for supplementary or enriching the work of schools and colleges, for eradicating illiteracy, for adult education and teacher training etc. At school level, different countries are using this powerful medium in different ways in solving their immediate problems. For instance Italy made use of it to meet lack of middle school facilities in rural areas by imparting complete course of instruction normally given in middle schools. In France television has been greatly utilized as part of a vast effort to modernize teaching techniques. Rashid, M. (2001,pp.207-8) has stated that:
a) Television teaching provides greater equality of

JOURNAL OF EDUCATIONAL RESEARCH (Vol.12, No.1) 2009 Dept Of Education IUB,
Pakistan
150
opportunities of receiving education for all pupils. We know education is the most important single factor in achieving rapid economic development and for creating a democratic order. Television acts as a mass medium of education and is really a very powerful tool to provide qualitative expansion of education at all levels.
b) Television teaching creates initiative and inquisitiveness in
students. Tele-lessons open a lot of avenues for the students for new creative activities by encouraging model making, experimenting with home made apparatus and becoming keen observers.
c) The impact of television on teachers is in no way less. It is
evident that tele-lessons put greater demands upon teacher's time because they have to make intensive preparations for these lessons. Naturally this pressure for better preparation will result in better classroom teaching. Thus television is of great help in professional in developing a teacher's capacities.
d) Through television, the whole teaching process is
undergoing a change for the better. Teachers are giving more thought to what topics needed to be included in the syllabus. Television programmes prove helpful in upgrading the curriculum and enriching the educational programme more easily and economically. Students are learning better with television.
e) Television can display the world of reality and students
can see a host of other things in the classroom through its screen which serves to widen the horizons of children, something that is not within the reach of a common student.
f) Television as a medium of education has helped in making
school a centre for community welfare and education.
g) Television can help the teachers and the students in the

JOURNAL OF EDUCATIONAL RESEARCH (Vol.12, No.1) 2009 Dept Of Education IUB,
Pakistan
151
realization of various teaching and learning objectives, its use has improved attendance in high schools. In two shift schools, in view of less time at the disposal of teachers, television helps in completing the prescribed course in time. As an educational device it has helped in overcoming problems of shortage of good teachers, classrooms, audio and visual aids and other resources.
h) Television can serve as a vehicle of excellence to the
students. They can view and hear about the works and thoughts of eminent educationists, renowned teachers and scholars, creative scientists and excellent musicians and artists. Various discussions, which arc shown on television, are based on the latest researches and innovations, and by listening to these and by seeing these experts on the television screen students and teachers get due inspiration and motivation and enrich their knowledge. By viewing the visit to Pakistan of foreign Presidents and other dignitaries and foreign visits of our national leaders and their welcome in foreign countries, children feel excited and it gives them the feeling as if they are also visiting foreign countries with their national leaders.
i) Television has played perhaps the greatest role in
promoting international understanding. Recently all over the world a great emphasis has been laid on education in international understanding.
j) The usefulness of television for social education cannot be
under estimated. Various programmes covering topics like traffic and road sense, community health, adulteration in food, child marriage, good manners, and encroachment of public property relating to social education can be put out for the welfare of the people. Experience shows that television teaching has greatly spread social education in underdeveloped countries having high illiteracy rates.
k) Television is a very useful device and not a means of
luxury. Things that are listened are not as effective as the

JOURNAL OF EDUCATIONAL RESEARCH (Vol.12, No.1) 2009 Dept Of Education IUB,
Pakistan
152
things seen by one's own eyes. The younger generation feels more impressed by seeing a person on T.V. The main reason for the popularity of dramas and films is due to their hold on growing minds.
l) With the help of television celebration of various national
days, for example Independence Day, birthday of Quaid-i-Azam, Pakistan Day, Army parade, Eids, Muharram etc, can be shown. Thus television helps in inculcating in students feelings of nationalism, patriotism and brotherhood.
m) With the help of television, the students can be made
aware of the progress and events of the nation and of foreign countries. While in school they can see the events taking place in any part of the world. They can also know about the educational system and structure of different countries.
n) Television's contribution in the field of sports too is
appreciable. Telecast of various games and matches of cricket, hockey, badminton, table tennis, etc, which are played the world over, created interest among children for games and sports. It also motivates children to participate in sporting activities;
o) Television teaching can contribute a great deal in
promoting general education like art, humanities, science, music, agriculture languages, health education, yoga, home administration, etc. These' programmes help children in learning about the modern techniques used in above mentioned disciplines. These programmes will develop basic skills and stimulate the students' interest in a variety of subjects. Such programmes can also introduce the students to Pakistan crafts and rich cultural background, the meaning of citizenship and the interpretation of current affairs.

JOURNAL OF EDUCATIONAL RESEARCH (Vol.12, No.1) 2009 Dept Of Education IUB,
Pakistan
153
Consequently, we can say that television holds vast opportunities and great potentialities for the world of education. Record Players The oldest form of record player was the hand operated gramophones. It played discs. The electric version was used to play discs which taught correct pronunciation of languages called lingua phone records. English teachers of good schools still use these records in their day-to-day teaching. At times, records are also available about sound effects. Teachers can use these records in various teaching learning situations. Records of speeches of leaders can be well integrated with classroom teaching activities. Tape Recorder This equipment records sound. It has three parts: -
a) Implement for sound input called microphone. b) Amplifier c) Reproducer.
There are two main functions of this equipment. Recording and reproducing. An ordinary person can operate it. There are clear-cut instructions on every button of all the tape recorders regarding its operation. For example, the word 'Play' is written on the button meant for starting the operation of the tape recorder. In the same way 'stop' is written on the button required for halting the recorder. According to Romiszowski, A.J. (1974, p.163). Tape recorder is useful for imparting training of music, language, drama, etc. It can also be used to correct defects of speech and pronunciation. It is also useful in microteaching, reinforcement of general teaching and its evaluation, in preparing commentary with film slides. Lectures for educational importance and other programmes can also be recorded and reproduced at any time. Video Cassette Recorder
Audio-video technology has emerged as an important tool in imparting knowledge for a distance learner. Unlike traditional student, the distance learner need not travel to school or college. The audio-video cassettes can be played and replayed at his own will. He can stop a particular tape at a point where more details are necessary
JOURNAL OF EDUCATIONAL RESEARCH (Vol.12, No.1) 2009 Dept Of Education IUB,
Pakistan
154
and can play on slow motion to understand a difficult point. He need not get up early in the morning or late in the night for radio and TV broadcasts. Audio-video cassettes produced for each course by AIOU are kept at Model Study Centres and Regional Offices established all over the country.Potential exists for providing the basis for learning a wide range of motor, intellectual and cognitive and interpersonal skills, as well as affective aspects. These are important aspects which printed materials cannot deal with adequately.In some countries as a way of regionalizing a centrally produced programme, video cassette programmes are being built round the study centre concept, a location where several video machines are available to which students bring their study notes. The students run the programmes as individuals. Sometimes study centre provides for groups sessions during which videocassettes are played. (Samanta, R.K. 1991, p.37)In other countries some institutions assume that students can gain access to such equipment and make programmes which will be used on an individual basis as either supplementary learning material or integral to the teaching programme. Video Discs Videodtex involves the transmission of display text and graphics and their reception to an adopted television set. A videotext system would be useful in disseminating general information about course and programme available through distance education. However, videotext system can be useful in distribution of texts and diagrams to accompany educational broadcast and the teletext to distribute computer programmes. (Rashid, M, (2001, p.311). The disadvantages of videodiscs are: (i) the high cost of producing the master laser disc (this is in addition to producing a videotape master): (ii) the high cost of players; and (iii) the fact that it is a 'play only' device that cannot record. While a great deal of research and money have gone into videotex in equipment and software development it is fair to say that as yet it is in its infancy. (Rashid, M. 1998, p.109)

JOURNAL OF EDUCATIONAL RESEARCH (Vol.12, No.1) 2009 Dept Of Education IUB,
Pakistan
155
Language Laboratory The purpose of the language laboratory is to develop listening and speaking skills in foreign languages. The system employs individual study carrels (booths) and the use of audiotape equipment and headphones in combination with other materials. For reasons of convenience, these facilities are housed in one place, as opposed to being portable or mobile. The maintenance of the complicated electronic components is a highly skilled job, requiring an appropriately skilled staff. Printed Media Printed materials are instructions or information written down for the benefit of the learner or reader. They are various types but the ones specifically recommended for non-formal education are as pointed out by Lalit Kishore (1989, p.101)
a. Books - printed books such as the primer and other available texts
b. Newspapers, magazines, journals or periodicals. These are educative and have been used to reach the neo-literates or semi literates in particular.
c. Generally, textbooks are not easy to come by these days because of their exorbitant cost. Besides, illiterates place little or no value on the purchase of textbooks.
d. Handouts/handbills - even though these are not widely used for non-formal education, there is a need to use handouts to teach.
Integration of Instructional Media into Non-formal Education
System It is very imperative to fully integrate instructional media into the non-formal educational system, especially considering the above-mentioned roles instructional media have been playing and can play in making teaching more effective even in non-formal education. There are possible hurdles, as listed below that needed to be removed before full integration can be achieved.
1) Ignorance and lack of knowledge in the design, production and utilization of instructional media

JOURNAL OF EDUCATIONAL RESEARCH (Vol.12, No.1) 2009 Dept Of Education IUB,
Pakistan
156
2) Assumption by instructors that learners can assimilate fully without employing all the senses in the process of learning
3) Technological backwardness and insensitivity. such as failure to follow technological advancement or computer based instructions like other nations
4) Lack of conscious efforts by instructors to integrate instructional media into their instruction
5) Non-availability of funds 6) Lack of expertise to assist instructors where possible 7) Lack of innovation and creativity on the part of the
instructors 8) Non availability of basic instructional materials to be
provided by the government 9) Lack of incentives and proper remuneration by the various
forms of government Despite all the problems enumerated above, the teachers of non-formal education should have been convinced by now that they will be more effective when they consciously design, produce and utilize instructional media while teaching. The more appropriate and adequate the channel (or instructional media) for transmitting information, the more effective the learning is likely to be. The channel enables the teacher to concretely establish a dialogue with the learner. This sharpens the ability of the learner to assimilate and comprehend the information given, and to analyze and interpret the information in terms of the learners' social, environmental or societal dispositions. The integration of instructional media is not only desirable in the formal education as always heralded by educators but much more desirable for non-formal education, considering the caliber of learners. Conclusion Instructional media is a channel through which instructors or teachers in non-formal education can make their instruction more scientifically based and more effective. It is capable of increasing the effectiveness of their communication skills and hence resulting an effective teaching and learning process. The need to improve the effectiveness of non-formal education has been the emphasis in this

JOURNAL OF EDUCATIONAL RESEARCH (Vol.12, No.1) 2009 Dept Of Education IUB,
Pakistan
157
paper. Pakistan is currently passing through an important stage of her educational development, a stage in which one can safely conclude that the nation's formal educational system is inadequate. This stage is also witnessing a rather increasing rate of children's dropout from the formal educational systems. More and more adults are withdrawing from forma Education into business and professional skills because of dissatisfaction and the craze for wealth. All these (inexhaustible) reasons place a strong force behind the need for integrating instructional media into the non-formal educational system which, in turn, will make non-formal education more effective. To achieve this deliberate plan to design, produce, utilize and integrate instructional media in the learning and teaching processes should be employed. Finally, according to Quane (1989, p.32), since it is not conclusive that education can be acquired only through the formal system of education, but also through non-formal education, informal learning opportunities should be provided through instructional media, both modern and traditional, so that the total learning continuum is integrated into the learners' social and vocational domains of life. Non-formal education programmes embody a great richness of experience corresponding at least partially to the idea of basic education. Thus, the emphasis in this paper is that non-formal education can be made as effective as the formal system of education, if the media used in teaching can be as scientifically oriented as those used in formal education. Bibliography Bhat, B. D & Sharma, S. R (2007). Educational Technology:
Concept and Technique, New Delhi, Kanishka Publishers. Bhola, H.S. (1980). Program and Curriculum Development in the
Post-Literacy Stages (A Workshop Manual) D.S.E. Bonn. Das, R.C. (1993). Educational Technology: A Basic Text, New
Delhi, Sterling Publishing Private Ltd. Dave, R.H. et. al. eds. (1986). Learning Strategies for Post-Literacy
and Continuing Education in China, India, Indonesia. Nepal,
Thailand, Vietland and Vietnam. Hambvurg: Robert Seeman. Freire. P. (1985). The Politics of Education: Culture Power and

JOURNAL OF EDUCATIONAL RESEARCH (Vol.12, No.1) 2009 Dept Of Education IUB,
Pakistan
158
Liberation. Macmillan, Freire, P. and Maceddo. D. (1987), Literacy: Reading the Word and the World. RKP.
Govt. of Pakistan (1998). National Education Policy, Islamabad, Ministry of Education.
Knowles, M. (1980). The Modern Practice of Adult Education; Fro Pedagogory to Andragogy. Follet Publishing Co.
Lalit Kishore (1989). A textbook of Audio Visual Aids, New Delhi, Doaba House publisher.
Quane, A.. (1989). Handbook on Learning Strategies for Post-
Literacy and Continuing Education, Hamburg: Repro Lucke. Rashid, M. (1993). Distance Education, Study Guide, Code 741,
Islamabad AIOU. Rashid, M. (1998), Educational Technology, Study Guide, Code 834,
Islamabad, AIOU. Rashid, M. (2001). Trends and Issues in Distance Education,
Islamabad, AIOU. Samanta, R. K. (1991). Manual on International Aids for Teaching
Excellence, New Delhi, Mittal Publications Visocchi. A.M. (1978). Non-formal Education for Rural
Development in Western Uganda, Manchester Monographs.

JOURNAL OF EDUCATIONAL RESEARCH (Vol.12, No.1) 2009 Dept Of Education IUB,
Pakistan
159
Events of Instruction and its Effects on the
Achievements of Students
♣Dr Nabi Bux Jumani,
♣♣Shahinshah Babar Khan
Abstract
Gagne defines nine steps of instruction. He thinks that while teaching, more
effective results can be achieved if the lesson may teach according to these
nine steps. The aim of the present study is to investigate the effectiveness of
teaching through Gange’s events of instruction. For this study, students of
class X, of a model college of Islamabad were selected as sample. The
students were divided into two groups i.e. experimental Group (Gagnian
group) and control Group (Non- Gagnian group). Pre test was
administered. One hour was given for this test. Pre test was divided into two
parts. Part I consists on multiple choice item while second part consists on
questions from the chapters, students already studied in class IX and some
basic definitions. The duration for this experiment was four weeks. After
four weeks post test was administered. The colleted data were analyzed by
using statistical techniques of arithmetic mean, standard deviation and t
test. The study showed that the results of Gagnian group were better than
non-Gagnian group. The study also reveals that teaching-learning process
produce more effective results if some systematic approach may be used.
With the help of some technique or theory the teaching process can be made
more interesting and more fruitful.
Keywords: Instruction, Effects, Achievement of students, Lessons, Deductive method Introduction
Mathematics is the study of abstractions and their relationships in which the only technique of reasoning that may be used to confirm any relationship between one abstraction and another is deductive reasoning. Mathematics is simply an extension of reality (Reddy, 2007). In mathematics there are some concepts which have only definitions and there is no specific reason for them. We must
♣ Assistant Professor, Faculty of Education AIOU Islamabad ♣♣ M.Phil Research Fellow, Allama Iqbal Open University Islamabad

JOURNAL OF EDUCATIONAL RESEARCH (Vol.12, No.1) 2009 Dept Of Education IUB,
Pakistan
160
consider them as they are. Ortan (2004) described some with some references, about types of mathematics learning: There have been various attempts to classify the mental constructs involved in learning mathematics. Gagne (1985) listed and described eight types of learning. Bloom et al. (1956) provided a detailed analysis of the objectives of education in the cognitive domain. Skemp (1971) discussed the process which needs to be adopted in doing mathematics. Polya (1957) attempted to analysis the process of solving mathematical problem. Brown (1978) suggested that there are four types of mathematical learning, namely simple recall, algorithmic learning, conceptual learning and problem solving.At present, mathematics is getting more and more importance. With the help of Gange’s events of instruction intellectual skills of learners can be enhanced and enable them to think scientifically ,logically and process of learning may be more effective and better understandable for the learners and ultimately the achievement of the learners will increased. Gagne’s believed that the human learned capabilities must be break down into domains for better understanding and for better approach to the topic. The main objective of Gagne’s events of instruction is to organize the lesson in a sequence, systematically so that the effectiveness of learning is increased and cognitive power of learner increased, and the presented lesson produce better results. Review of Literature “Mathematics has been described as the queen of the subjects” (Williams & Easingwood, 2004). Mathematics is a core subject and main aim of teaching mathematics is to enable the students think more logically and scientifically. For better learning of mathematics, there are several points which are necessary. Students’ participation is much more important. Streeter, Hutchison and Hoelzle in the preface of their book named Mathematical Skills with Geometry describe the importance of student’s active participation in the following words:
We believe that the key to learning mathematics, at any level, is active participation. When students are active

JOURNAL OF EDUCATIONAL RESEARCH (Vol.12, No.1) 2009 Dept Of Education IUB,
Pakistan
161
participants in the learning process, they have the opportunity to construct their own mathematical ideas and make connections to previously studied material. Such participation leads to understanding, success and confidence.
Teaching of mathematics open new horizons for children. At school level , objectives of teaching mathematics are to prepare such students who can cope with the daily life problems and can deal with the cahllanges of 21st century. According to Lumb (1987,p.10)
Today mathematics is regarded as an essential component of the school curriculum. Literacy and numeracy are assumend to be acquired by all children during their school careers, though this assumption is not always found to be valid in reality and a considerable number of them do leave school at 16 either illiterate or innumerate
Debate about how mathematics is learned has continued, throughout the recorded history of mathematics teaching, yet the process is still not founded on a single universally accepted theory (Orton, 2004). Teaching systematically can increase the effectiveness. There are many theories about learning mathematics. These are known as theories of mathematics. Theory is a path which leads to the destination. It helps to achieve the objectives, and is a systematic approach to the instruction. According to Mergel, B (1998):
A theory provides a general explanation for observations made over time.
A theory explains and predicts behavior.
A theory can never be established beyond all doubt. A theory may be modified.
Following are the some famous theories of learning.

JOURNAL OF EDUCATIONAL RESEARCH (Vol.12, No.1) 2009 Dept Of Education IUB,
Pakistan
162
• Piaget's theory of intellectual development.
• The Dienes theory of mathematics learning
• The Van Hiele theory of learning geometry
• Ausubel’s theory of meaningful learning
• Robert Gagne theory of mathematics learning.
Piaget's theory of intellectual development
Piaget's "theory" is a theory of intellectual development. It is not a theory of learning, teaching, instruction or curriculum -- either in general or with respect to mathematics in particular. But much writing and many investigations have been directed toward hypothesized implications of Piaget's theory for mathematics learning, teaching and instruction, for the nature and sequence of curricular content, and for classroom structure, organization and management. And concerns have been expressed regarding ways in which Piaget's theory has been applied to different aspects of education and mathematics (Weaver ,l972). Piaget's theory of intellectual development was based on results from experiments which children using the clinical or individual interviewing method Piaget explained many aspects of children’s thought and behavior by considering them as going through definite stages. Piaget’s four major stages of cognitive development are:
(i) Sensori Motor Stage (0-2 Years). (ii) Pre-Operational Stage (2-7 Years) (iii) Concrete Operational Stage l (7-11 Years) (iv) Formal Operational Stage (12-15 Years)
In learning mathematics, Piaget’s theory would suggest that the ability to cope with abstractions depends on the emergence or development of formal operational thinking (Orton, 2004).
The Dienes theory of mathematics learning Dienes took Piaget’s work to suggest that learning is an active process, and the dynamic principle was directly derived from the assumption that concept formation is promoted by providing suitable learning materials with which children can interact. Dienes also believed that mathematics must be a constructive activity for

JOURNAL OF EDUCATIONAL RESEARCH (Vol.12, No.1) 2009 Dept Of Education IUB,
Pakistan
163
children, rather than an analytic one. Dienes’s theory of mathematics learning comprised four principles:
• The dynamic principle
• The constructivity principle
• The mathematical variability principle
• The perceptual variability principle. (Orton, 2004).
The Van Hiele theory of learning geometry Van Hiele postulated sequential levels of geometrical thought but, in addition, suggested phases of instruction intended to enhance the learning of geometrical ideas. (Orton, 2004).
Ausubel’s theory of meaningful learning The theory of meaningful learning was a general theory and was not specific to mathematics. Ausubel learning was a process through which new knowledge was absorbed by connecting it to some existing relevant aspect of the individual’s pre existing knowledge structure. (Orton, 2004). Robert Gagne theory of mathematics learning Robert sGagne used the idea that a sequence of tasks could be established for a desired learning outcome. If the student practiced each required task as it was learned and developed, that student would then be able to move on to the next step in the continuum (Siddiqui, 2005). According to Clendaniel, W.D (2003):
Bloom’s taxonomy dealt with the cognitive outcome. Bloom then worked with Masia to develop a taxonomy that dealt with the affective domain. Simpson’s plan dealt with the psychomotor domain. Gagne’s taxonomy however was the first to identify learning outcomes in all three domains. Gagne's taxonomy contained 5 components: Verbal Information, Intellectual Skills, Cognitive Strategies, Attitudes, and Motor Skills. Gagne proposed his taxonomy with the assumption, “That different outcomes call for different learning conditions.
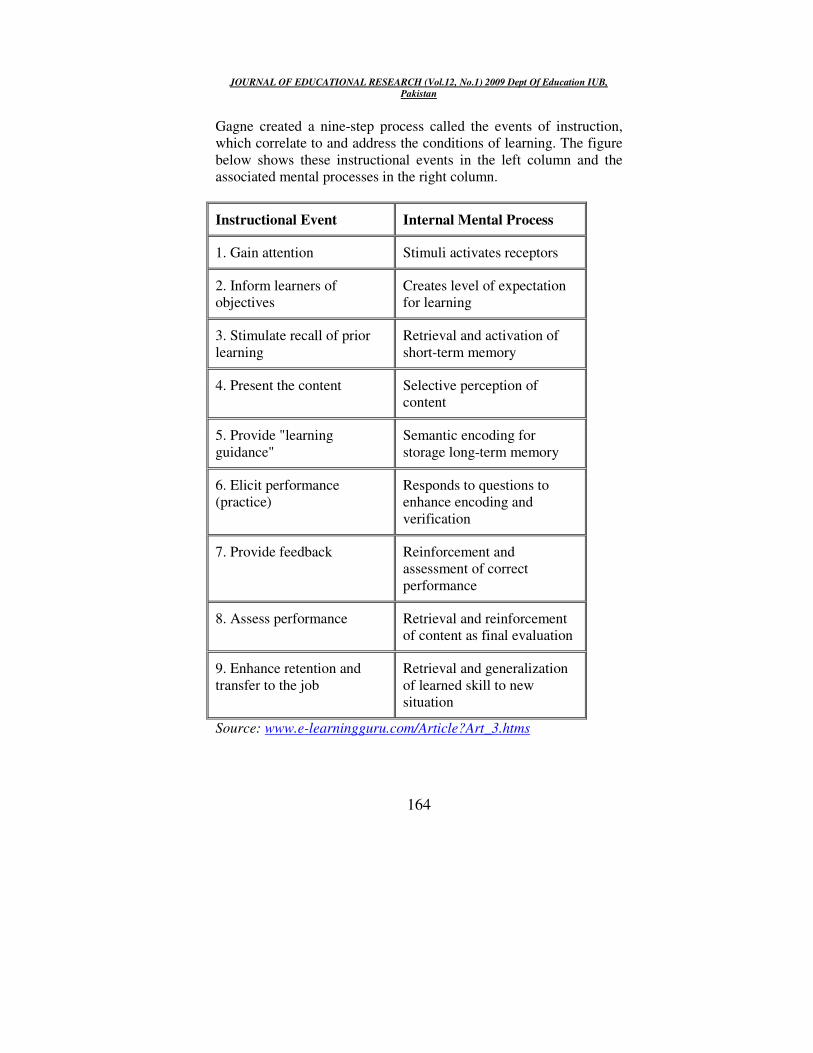
JOURNAL OF EDUCATIONAL RESEARCH (Vol.12, No.1) 2009 Dept Of Education IUB,
Pakistan
164
Gagne created a nine-step process called the events of instruction, which correlate to and address the conditions of learning. The figure below shows these instructional events in the left column and the associated mental processes in the right column.
Instructional Event Internal Mental Process
1. Gain attention Stimuli activates receptors
2. Inform learners of objectives
Creates level of expectation for learning
3. Stimulate recall of prior learning
Retrieval and activation of short-term memory
4. Present the content Selective perception of content
5. Provide "learning guidance"
Semantic encoding for storage long-term memory
6. Elicit performance (practice)
Responds to questions to enhance encoding and verification
7. Provide feedback Reinforcement and assessment of correct performance
8. Assess performance Retrieval and reinforcement of content as final evaluation
9. Enhance retention and transfer to the job
Retrieval and generalization of learned skill to new situation
Source: www.e-learningguru.com/Article?Art_3.htms

JOURNAL OF EDUCATIONAL RESEARCH (Vol.12, No.1) 2009 Dept Of Education IUB,
Pakistan
165
Procedure For this study, students of class X of a model college, Islamabad were selected as sample. The students were divided into two groups I.e. experimental group (Gagnian group) and control group (Non-Gagnian group). Pre-test -posttest design was used. After pre-test the experimental group (Gagnian group) was taught for 4 weeks according to the theory of Gagne’s while control group (Non-Gagnian group) was taught by traditional method. The researcher himself developed pre-test with the help of four mathematics teachers and administered test under his supervision. Pre-test was divided into two parts first part comprised multiple choice questions while second part comprised on questions from chapters which have some relation with the chapters already studied by the students in IX class and some basic definitions which they have learnt in the previous classes. Methodology
While teaching lesson sequence of Gagne’s events of instruction was followed as under: Gain attention For gaining attention, I asked some basic questions from the students. For example, what is algebraic expression (They have read in class IX)? There are how many types of algebraic sentences? If students make some mistake, guide them so that they remembered what they have forgotten.
Informing the learner about the objective In the start of lesson, I inform the students that after this topic they will be able to solve the questions of this type (Which I may teach them).
Stimulate recall of prior learning While teaching the new topic, prior knowledge help in building the confidence level. For example I asked about algebraic expression while I was going to teach algebraic sentences, and with the help of their knowledge connect these two definitions and give them some examples.

JOURNAL OF EDUCATIONAL RESEARCH (Vol.12, No.1) 2009 Dept Of Education IUB,
Pakistan
166
Present the content I present the content to the learners so that they would be aware which they are going to be learnt. At this stage I, explained the content in a meaningful way .While teaching mathematics ,if graphs and slides of solved questions may showed to the learners, it would enables the learners to understand the topic very clearly.
Provide "learning guidance" At this stage I told the learners how to remember this definition for a long time, and also made a link between the existing and previous terms or methods they had learnt.
Elicit performance (practice) Mathematics is not like other subjects, it becomes easier by doing. For elicit the performance of learners I asked them to do some questions right now, so that they can check their level of understanding.
Provide feedback Feed back to the learners can produce better results .while teaching mathematics I check the question on the spot and provide them extra guidance and point out their mistakes.
Assess performance At the end of the chapter I took test to check their understanding of the whole chapter. Enhance retention and transfer For enhance retention I asked the students to do this work twice or thrice to make concepts clear and try to use them in new situation. Hypothesis
H0 1: There is no significant difference between the performance of the students taught through Gagne’s events of instruction
H0 2: There is no significant difference between the achievement of the students taught through traditional method.

JOURNAL OF EDUCATIONAL RESEARCH (Vol.12, No.1) 2009 Dept Of Education IUB,
Pakistan
167
Data analysis After taking tests, mean, standard deviation were calculated, t-test was used to find the significant difference. Results were drawn on the basis of analysis. Results Table No. 2: Comparison between scores of pre-test and post-test of Experimental group (Gagne group)
Experimental
Group Mean N Std.
Deviation Value of
“t”
Pre 9.0000 30 2.67814
Post 11.0667 30 3.18329 2.920
df= 29 Tabulated value of t= 1.699 The above table shows that the calculated value of t (2.920) is greater than the tabulated value (1.699) at level .05 for df 29, rejects the hypothesis that there is no significance difference between the mean score of the students learning through Gagne’s events of instruction. The above table reveals that the Gagne groups of students improve their mean score after the treatment. Table No. 3 Comparison between scores of pre-test and post-test of
Control Group
Control group Mean N Std.
Deviation Value of
“t”
Pre 9.0000 30 3.67658
Post 9.6333 30 3.67658 1.374
df =29 Tabulated value of t= 1.699 The above table shows that calculated value of t (1.374) is smaller than the tabulated value of t at level .05 for df=29 which is 1.699,it means that the hypothesis “There is no significant difference between the mean scores of the students taught through traditional method” is accepted.
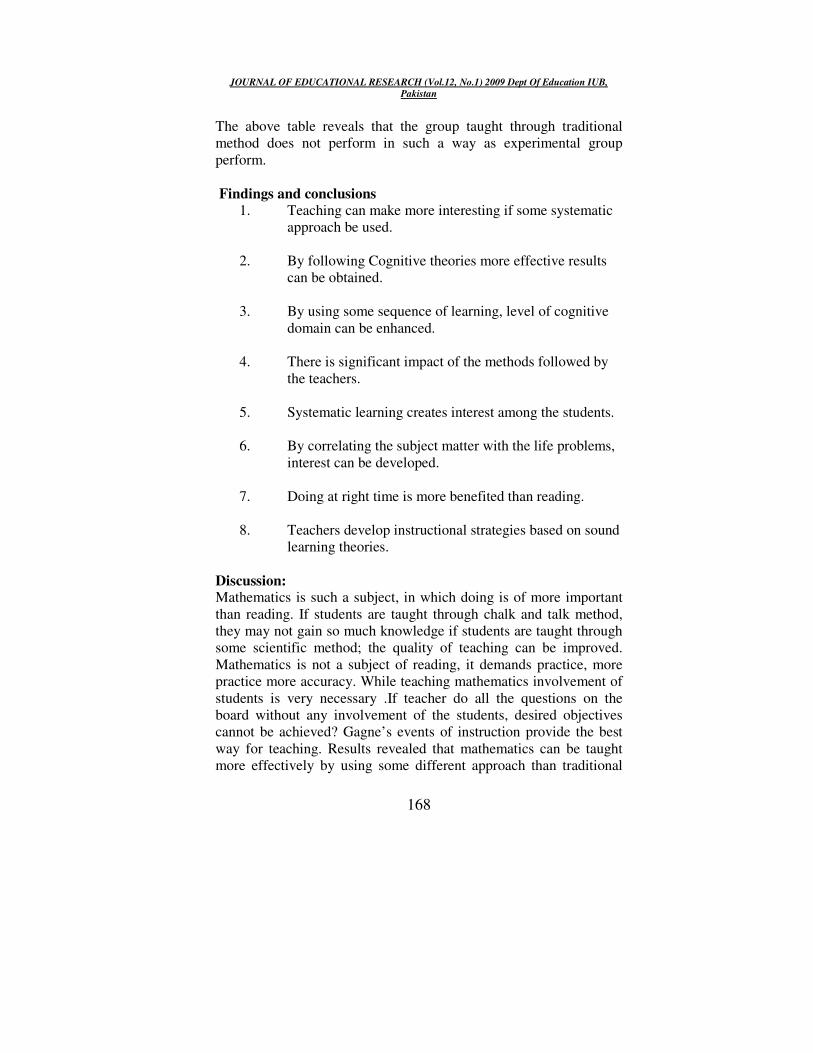
JOURNAL OF EDUCATIONAL RESEARCH (Vol.12, No.1) 2009 Dept Of Education IUB,
Pakistan
168
The above table reveals that the group taught through traditional method does not perform in such a way as experimental group perform. Findings and conclusions
1. Teaching can make more interesting if some systematic approach be used.
2. By following Cognitive theories more effective results
can be obtained.
3. By using some sequence of learning, level of cognitive domain can be enhanced.
4. There is significant impact of the methods followed by
the teachers.
5. Systematic learning creates interest among the students.
6. By correlating the subject matter with the life problems, interest can be developed.
7. Doing at right time is more benefited than reading.
8. Teachers develop instructional strategies based on sound
learning theories.
Discussion: Mathematics is such a subject, in which doing is of more important than reading. If students are taught through chalk and talk method, they may not gain so much knowledge if students are taught through some scientific method; the quality of teaching can be improved. Mathematics is not a subject of reading, it demands practice, more practice more accuracy. While teaching mathematics involvement of students is very necessary .If teacher do all the questions on the board without any involvement of the students, desired objectives cannot be achieved? Gagne’s events of instruction provide the best way for teaching. Results revealed that mathematics can be taught more effectively by using some different approach than traditional

JOURNAL OF EDUCATIONAL RESEARCH (Vol.12, No.1) 2009 Dept Of Education IUB,
Pakistan
169
methods. Guidance is very necessary for the better achievement if teacher guides the students in time the achievement level can be maximized. Some students feel shy while asking the questions by the teacher; feedback can motivate the students to ask more questions. References Clendaniel, W.D (2003). Robert Gagne & 9 Instructional Events.
Towson University Lumb, D (1987). Teaching Mathematics 5 to 11. New York: Nichols
Publishing Company Mergel, B (1998). Instructional Design & Learning Theory.
University of Saskatchewan Orton, A. (2004).Learning Mathematics, Issues, theory and
classroom practice. London: Continuum. Siddiqui, H (2005). Teaching of Mathematics. New Delhi: A.P.H
Publishing Corporation. Srihari Reddy,N.& Nagaraju M.T.V (2007). Problems of teaching
secondary school Mathematics. Delhi: Discovery Publishing House.
Streeter,J., Hutchison, D., and Hoelzle, L (1998). Mathematical
Skills with Geometry. New York: McGraw Hill Weaver, J. F. (l972): "Some Concerns About the Application of
Piaget's Theory and Research to Mathematical Learning and
Instruction." ARITHMETIC TEACHER l9 263-270. Williams, J., & Easingwood, N (2004). ICT and Primary
Mathematics. New York. Routledge Falmer. (www.e-learningguru.com/Article?Art_3.htms)

JOURNAL OF EDUCATIONAL RESEARCH (Vol.12, No.1) 2009 Dept Of Education IUB,
Pakistan
170
Parenting and Children’s Academic Performance: Connections
and Consequences
♣Fouzia Janjua
♣♣Samina Malik
Abstract To educate children, parents construct their own parenting styles which
effect the academic achievement of the child. Effect of parenting style on the
academic achievement of the secondary school children has been the
question of this ex-post facto research, Sample of the study constituted 154
secondary school students, both male and female. Parenting styles of the
parents of the selected learners were identified by using a closed form of
questionnaire to be filled in by the learners. The academic achievement of
the selected children was measured by calculating the mean scores of the
compulsory subjects for the last three annual results. Data was analyzed
statistically by calculating Pearson’s correlation.. The study led to the
findings that the parenting styles have been positively associated with the
academic achievement of the secondary school pupils in Pakistan and it
was further found out that the authoritative and authoritarian parenting are
positively related to the academic achievement of the students at secondary
school level whereas permissive and indulgent parenting are negatively
related to the academic achievement of the students at secondary school
level.
Key words: Parenting styles, students’ performance, secondary school students, Pakistan
Introduction Indefinitely large number of researches has examined the relationship between parenting styles and their relationship with children’s personality development. The earliest studies on parenting styles and its influence on child development investigated the ways parents discipline their child. Different facets of the personality of a child are the indicators of the parental style he has been reared in. Diverse parenting style typologies emerged since 1948; these studies
♣ Department of English, International Islamic University, Islamabad, Pakistan E-mail: [email protected] ♣♣ Department of Education, International Islamic University, Islamabad, Pakistan E-mail: [email protected]

JOURNAL OF EDUCATIONAL RESEARCH (Vol.12, No.1) 2009 Dept Of Education IUB,
Pakistan
171
provided a ground to Diana Baumrind’s extensive investigation of the parenting style typology. After conducting several researches three parenting styles were identified: 1) Authoritative 2) Authoritarian 3) Permissive (1967, 1970, 1971; Baumrind & Black, 1967). Her studies led to the findings that authoritative parents are moderate and responsive, extending an affectionate and supportive environment to their children. These parents expect high maturity and achievement level and demand explanation of their behavior. Baumrind (1978) further suggested that authoritarian parents are very demanding, rigid and intolerant towards the behavior of their children. Permissive parents according to her are temperate in their responsiveness, some of them are high and others are low towards the level of demandingness even sometimes unconcerned. Macoby and martin added a fourth parenting style “indulgent” to Baumrind’s typology. According to them indulgent parents are similar to permissive parents as far as the control factor is concerned but they differ in temperateness and responsiveness. Later in 1991 Baumrind reduced the typologies to demandingness and responsiveness on the basis of factor analysis. Demanding parents she says demands maturity from their children and supervises their children wherever required. Responsive parents help to develop self regulation and self assertion among their children. She defines parenting style as “the overall attitude and pattern of behavior that a parent uses when interacting with his or her child”. Parenting Practices Parenting practices are constructed on the basis of parental involvement, parental monitoring, parental goals, values and aspirations. All these elements when comes to play in academics of the children involves supporting the child in doing home work, attending parent teacher meetings, volunteering participation in school welfare activities and taking part in co-curricular activities. Epstein and other researchers ---------have categorized parenting practices into school initiated and parent initiated practices. Those initiated by the parents include the activities volunteered and initiated by parents without school initiation. Positive effect of parent initiated practices has been found on the academic achievement of the children (Epstein and Sanders, 2002). It was also found out that the relationship between these variables is stronger at elementary

JOURNAL OF EDUCATIONAL RESEARCH (Vol.12, No.1) 2009 Dept Of Education IUB,
Pakistan
172
level as compared to middle school level (Epstein and Dauber, 1991). Researches also suggested that parental involvement decreases in adolescence and reasons for the decline were also investigated (Rayan and Stiller, 1991; Steinberg, 1990) and found out that the decline stems out of the recognition of an increased need for adolescence to express with autonomy by the parents.
Later Darling and Steinberg (1993) defined parenting style as a process which is a combination of parenting styles identified by Baumrind and parenting practices through which parents make their child achieve social goals. Integrating the two they identified 4 major types of parenting styles; 1) Indulgent parents: they tend to be permissive, non-directive and lenient, exercise less control on their children leaving them to an unassisted decision making. 2) The authoritarian parents: they impose their authority in decision making and expect to be obeyed without explanation. 3) The authoritative parents: they foster autonomy and depend on rules rather than strict imposition of obedience, are assertive but not restrictive. 4) Uninvolved parents: they are neither very demanding nor very responsive. Gadsden and Bowman (1999) found that parenting styles influence the child’s literacy development which directly affects its literacy achievement. Guarian (2007) reports the extent to which parenting styles affects the reading ability of the children. If reading ability is affected by parenting styles so can be the other language skills and other knowledge areas. Researchers have acknowledged the influence of parenting style on children’s academic achievements. Relationship between authoritative parenting style and academic performance appears to be positive among Caucasian students ((Dornbusch et al, 1987; Steinberg et al., 1994). ), and is strongly associated with the European American students as compared to the association of the two variables among Asian and African youths(Dornbusch et al, 1987; Steinberg et al.,1991). The Problem:
Despite an exhaustive research into parenting style, a number of issues still remain outstanding. The present study attempts to investigate the relationship between parenting styles and the

JOURNAL OF EDUCATIONAL RESEARCH (Vol.12, No.1) 2009 Dept Of Education IUB,
Pakistan
173
academic achievement of the children and the level of the achievement as well. Research Questions: Two research questions formulated for the study are:
• Are Parenting styles associated with the academic achievement of the secondary school children in Pakistan?
• To what extent four Parenting styles are associated with the academic achievement of the secondary school children in Pakistan?
Significance of the Study:
The study will add to the existing knowledge of the relationship between different types of parenting style and their influence on the academic achievement of the children in Pakistan. Further more, it will provide a direction for child rearing practices which will help giving solution to the problem of making children achieve good grades. Research Design: The study adopted an ex-post facto design to examine the influence of parenting styles on the academic achievements of the children. Method:
Variables of the study: The present study has addressed only two variables, the parenting styles and the academic achievement of the children. Four different types of the Parenting styles acted as independent variables of the study where as pupil’s academic achievement in their compulsory subjects of the curriculum was a dependent variable for the present study while controlling the gender variable. Sample of the study: The study sample involved 154 randomly selected secondary school students, 77 boys and 77 girls. All of them were selected from the model schools of Islamabad. Schools were also selected randomly in order to give an equal chance of selection to every institution and to include other variables randomly in the study. In this way the effect

JOURNAL OF EDUCATIONAL RESEARCH (Vol.12, No.1) 2009 Dept Of Education IUB,
Pakistan
174
of other variables on the study was also randomly distributed thus neutralizing the overall effect. The mean age of the selected sample was approximately 15 years. Secondary school students were chosen for the study for the reason that this age group was expected to respond as directed. Secondly the relationship between student’s goal orientation and parenting styles was studied at primary and undergraduate levels using different variables but the study at this level has not been conducted and specifically in Pakistan. Research Instruments:
A self designed questionnaire was used to identify the parenting styles. The questionnaire was divided into two parts, first part was meant to discover the demographic details of the individuals such as gender, age, level, institution etc. Second part was divided into 4 sections, each meant to identify different parenting style. Each section consisted of 6 items making a total of 24 items with a 3 point Likert scale. Each individual can score up to a maximum of 6 scores from second section thus identifying a particular parenting style. The academic achievement of the students was measured by calculating the mean scores of the compulsory subjects for the last three annual results. Procedure: The questionnaire was administered on a selected sample to be filled in independently. The completed questionnaires were collected immediately after filling to avoid manipulation of data through discussion. Compulsory subjects of the secondary school students were selected to measure the academic achievement in order to equate the assumed difference of scores for science and humanities optional subjects. The selected subjects were: 1) English 2) Urdu 3) Mathematics 4) Islamic Studies 5) Pakistan Studies. A mean score of each individual was calculated by finding out the mean of the scores of past three annual results of the identified subjects which represented the academic achievement of the pupil under study. Method of Data analysis: Data collected through questionnaires regarding the identification of parenting style was scored by giving 1 point to each marked option. A maximum of 6 score can be made and a minimum of 3 score was

JOURNAL OF EDUCATIONAL RESEARCH (Vol.12, No.1) 2009 Dept Of Education IUB,
Pakistan
175
required to identify a specific parenting style. Academic achievement of the students was measured by calculating the mean score of past three annual results of the selected subjects. Overall academic achievement of the students from four different parenting styles was again measured by calculating a mean value for each group of students. Then deviations from means were calculated and Pearson’s co-relation was measured. The data was presented in the form of table. Descriptive Statistics Showing the average relationship of parenting Styles with academic achievement of Secondary school students in Pakistan. Table 1: Relationship of parenting Styles with academic achievement
Variables N Average Means Co-relation
Parenting style 4 4.23
Academic achievement
4 76.7
0.285
Descriptive Statistics Showing the average Academic Achievement of the Students from different parenting Styles and its relationship with the parenting styles Table 2: Average Academic Achievement of the Students from
different parenting Styles
and its relationship with the parenting styles
Name of the Par-Pare-nting Style
N Mean Score of the Pare-nting Styles
Mean Scores of the Aca-demic Achie-vement of the Stud-ents
Standard Devia-tion of the Paren-ting Styles from the Means
Standard Deviation of the Acade-mic Achie-vement of the Students from the Means
Co-relation between Parenting Styles and Academic Achievem-ent of the Students
Auth-oritati
280 4.25 87.0 4.30 87.22 0.613

JOURNAL OF EDUCATIONAL RESEARCH (Vol.12, No.1) 2009 Dept Of Education IUB,
Pakistan
176
ve
Authoritarian
280 4.14 77.07 4.21 77.24 0.212
Permissive
168 4.28 71.33 4.31 71.59 -0.33
Indu-lgent
140 4.25 71.43 4.35 71.70 -0.45
Results
Table 1 means to report the relationship of parenting on the academic achievement of secondary school children. There were four parenting styles reported by the children and the correlation between the four parenting styles and the academic achievement of the secondary school children reared by these four styles of parenting strongly support the results of the previous studies on the cognitive effect of parenting styles. The co-relation between the means on parenting styles and the means on academic achievement of the students from these four styles shows a direct relationship of parenting to the educational achievement of the children. The value of co-relation is 0.285 which shows that the two variables are positively associated. Table 2 reveals the extent to which the four parenting styles are affecting the academic achievement of the children reared by them. All co-relations are significant at .05 levels. The tabulated values of the Pearson’s co-relation shows that the authoritative parenting style has the strongest co-relation value of 0.613, which means that authoritative parenting style is the most effective parenting style for educating the secondary school children in Pakistan. Authoritarian parenting has also a positive value of co-relation with the academic achievement of the students’ i.e. 0.212, but the value is lower than that of the authoritative style of parenting. For permissive parenting the co-relation is -0.33 which shows that this style is negatively related to the academic achievement of the secondary school students in Pakistani society. Indulgent parenting again shows a negative co-relation value i.e. -0.45. The relation of indulgent parenting to the academic achievement of the secondary school children is the weakest of the four co-relations.

JOURNAL OF EDUCATIONAL RESEARCH (Vol.12, No.1) 2009 Dept Of Education IUB,
Pakistan
177
Discussion A substantial literature available on parenting style is based on studies of young children and those children belonged to cultures and societies very different from Pakistani culture and society. Some of the studies based on ethnic differences and economic status of the parents within the community states that authoritative style of parenting was positively related to the grades of the children whereas authoritarian and permissive styles were negatively related to the grades of the children (Dornbusch, et al. 1987). We did not expect that the relations between parenting styles and academic scores would be same for Pakistani students, so we tested the possibility by the present research. To asses the overall average effect of parenting on academic achievement of Pakistani secondary school students, Pearson’s co-relation was used as the descriptive measure. Parenting was used as an independent variable whereas the academic achievement of the students was used as dependent variable. The analysis confirms the findings reported by many researchers that a positive relationship exists between parenting and academic achievement of the children. Values of Table 1 indicate that both the parenting and the academic achievement have strong effects on the correlation coefficients between the two variables. But the general analysis reveals that the relationship between parenting styles and student’s academic achievement could not be generalized across different styles of parenting. It therefore became necessary to examine the co-relation coefficients between different types of parenting and academic achievement of the students. As a result a separate analysis was conducted for different types of parenting styles. Table 2 presents the co-relation coefficients for the four types of parenting and academic achievement of the students. The breakdown of analysis for the average co-relation coefficient of the four styles of parenting shows that there exists a significant relationship between authoritative parenting and academic achievement of the secondary school students in Pakistan. The calculated co-relation value is the highest one. This implies that the favoured parenting style towards academic achievement of the learners in Pakistan is authoritative parenting. The responsiveness and valuing child’s opinion nurture their ability to learn. Such children were not only academically efficient but the evaluative remarks on their school report books stated that they were active in

JOURNAL OF EDUCATIONAL RESEARCH (Vol.12, No.1) 2009 Dept Of Education IUB,
Pakistan
178
co-curricular activities, participated in classroom discussions and were more confident. Authoritarian parenting stands next to authoritative in relation to its association with the academic achievement of secondary school learners in Pakistan. Although the coefficient of co-relation is low for this group of parents and academic achievement of their children but the evaluation from their annual report cards stated that they were obedient, proficient and some of them were reported to be aggressive also. Permissive and indulgent parenting styles are negatively associated with the academic achievement, and out of the two indulgent parenting are more negatively related to the academic achievement of the learners at the selected level of schooling in Pakistan as compared to permissive parenting style. The children from permissive and indulgent parents ranked low in academics, their behavioural evaluation as per report card showed that they were aggressive in behaviour towards their teachers and peers and emotionally unstable as well during their school activities. A lot many of them were evaluated as over confident and out spoken too. The results do support that at this stage of academics (teen age) the successful parenting in Pakistan is Authoritative parenting. It would cause to be more effective; if parents would increase their involvement and emphasize their responsiveness towards the curricular and co-curricular activities of their children. Parenting does effect the academic achievement of the learners but another conclusion can be drawn from the analysis; the findings should not be generalized as the students residing in boarding schools usually perform well in academics. All boarding schools rate high in this regard but the army boarding schools in Pakistan are exemplary. This gives rise to another testable hypothesis; how parenting operates on the academic achievement of boarders? Our findings provide a balanced equation of relationship for both genders but on the contrary, parents do respond differently to boys and girls. In Pakistan and most of the south Asian countries, boys get more attention and a warm response from parents as compared to girls and as a result girls perform usually well in academics which provides an evidence of a reactive response towards parenting through competing.

JOURNAL OF EDUCATIONAL RESEARCH (Vol.12, No.1) 2009 Dept Of Education IUB,
Pakistan
179
References Baumrind, D. (1967). Child Care Practices Anteceding Three
Patterns Of Preschool Behaviour. Genetic Psychology
Monographs, 75, 43-88. Baumrind, D. (1970).Socialization and Instrumental
Competence in Young Children. Young Children, 26, 104-119.
Baumrind, D. (1971). Current Practices Practices of Parental Authority. Developmental Psychology Monograph, 4 , 1-103.
Baumrind, D., & Black, A. E. (1967). Socialization Practices Associated with the Dimensions of Competence in Preschool Boys and Girls. Child Development, 38, 291-327.
Baumrind, D. (1978). Parental disciplinary patterns and social competence in children. Youth &
Society, 9(3), 239-251. Baumrind, D. (1991). Parental styles and adolescent
development. In J. Brooks-Gunn, Darling, N., & Steinberg, L. (1993). Parenting style as context:
An integrative model. Psychological Bulletin, 113(3), 487-496.
Dornbusch, S. M., Ritter, P. L., Leiderman, H., Roberts, D. F., & Fraleigh, M. J. (1987). The relation of Parenting Style to Adolescent School Performance. Child Development, 58, 1244-1257.
Epstein, J.L., Dauber S.L., (1991). School Programmes and teacher Practices of parent involvement in inner city elementary and middle schools. Element School J. 91: 289-305
Epstein, J., Sanders, M., Simon, B., Salinas, K., Jansorn, N., & Van Voorhis, F. (2002). School, family, and community
partnerships: Your handbook for action (2nd
ed.). Thousand Oaks, CA: Corwin Press.
Gadsen, V.L. and P.Bowman , 1999. African American Males and the struggle Toward Responsible Fatherhood. In Polite, V. and J. Davis (Eds). A Continuing Challenge in
Times like These: African American males in Schools and
Society. New York: Teachers College Press.

JOURNAL OF EDUCATIONAL RESEARCH (Vol.12, No.1) 2009 Dept Of Education IUB,
Pakistan
180
Guarian,W., (2007) Home and Reading Proficiency. In www.researchunimells.ed.au/rpeg Maccoby, E. E., & Martin, J. A. (1983). Socialization in the
Context of the Family: Parent-Child Interaction. In P. H. Mussen & E. M. Hetherington, Handbook of Child
Psychology: Socialization, Personality and Social
Development (4th ed., 1-101). New York. R.Lerner &A.C.Peterson (Eds) The Encyclopaedia of
adolescence (pp746-758). New York: Garland. Steinberg, L., Lamborn, S. D., Darling, N., Mounts,
N. S., & Dornbusch, S. M. (1994). Overtime Changes in adjustment and Competence among adolescent from authoritative, authoritarian, indulgent and neglectful families. Child Development, 65, 753-770.

JOURNAL OF EDUCATIONAL RESEARCH (Vol.12, No.1) 2009 Dept Of Education IUB,
Pakistan
181
TO THE READER The Journal of Educational Research is an HEC approved journal; published twice a year. It is indexed with Directory of Open Access Journals, Index Copernicus and Ulrichs’ Directory. The primary aim of the journal is to encourage and co-ordinate research in all the areas of education. Authors are desired to send two copies of their paper, not previously published along with computer disc according to the following guidelines. 1. Reports of original educational research, reviews of recent research in all educational areas or discussion articles on research topics will be preferred. 2. The article should be written in English language. 3. The article should begin with a brief summary, and should
not normally exceed to 3000 words. 4. The intrinsic interest of the article, conciseness and clarity
are important considerations. 5. Technical jargon should be avoided, and where possible
statistical data should be summarized in the text, although tables may be included if it is presented clearly.
6. Authors are encouraged to describe their findings intelligible to the non-expert reader.
7. Reference should be given in the following pattern: - [i] Author’s name (Surname, Initials) [ii] Edition No. (if any) [iii] Publishing Year [iv] Book’s name [v] Publishing place (e.g. country) [vi] Publishing company [vii] Page No. (if any)
Authors will receive one complementary copy of the journal. Inquiries, comments and suggestions are welcomed and should be addressed to:
The Chairman Editorial Board, Department of Education
Islamia University, Bahawalpur ([email protected])

JOURNAL OF EDUCATIONAL RESEARCH (Vol.12, No.1) 2009 Dept Of Education IUB,
Pakistan
182
([email protected] ([email protected])
JOURNAL OF EDUCATIONAL RESEARCH
Vol.12 No.1 2009
Published By:
DEPARTMENT OF EDUCATION
The Islamia UnivThe Islamia UnivThe Islamia UnivThe Islamia University of Bahawalpurersity of Bahawalpurersity of Bahawalpurersity of Bahawalpur PAKISTAN
2009
All Rights Reserved
Inquiries, comments and suggestions are welcomed and should be addressed to:
The Chairman
Editorial Board Department of Education
The Islamia University of Bahawalpur ([email protected]) ([email protected]) ([email protected])