What Is New in NGSS For Secondary Science Classrooms?
28
WHAT DO THE NEXT GENERATION SCIENCE STANDARDS MEAN FOR SECONDARY SCIENCE CLASSROOMS? GVSU Fall Science Update Nov 20, 2013 Brian J. Reiser Learning Sciences Northwestern University
-
Upload
northwestern -
Category
Documents
-
view
0 -
download
0
Transcript of What Is New in NGSS For Secondary Science Classrooms?

WHAT DO THE NEXT GENERATION SCIENCE STANDARDS MEAN FOR SECONDARY SCIENCE CLASSROOMS?
GVSU Fall Science Update Nov 20, 2013
Brian J. Reiser Learning Sciences Northwestern University
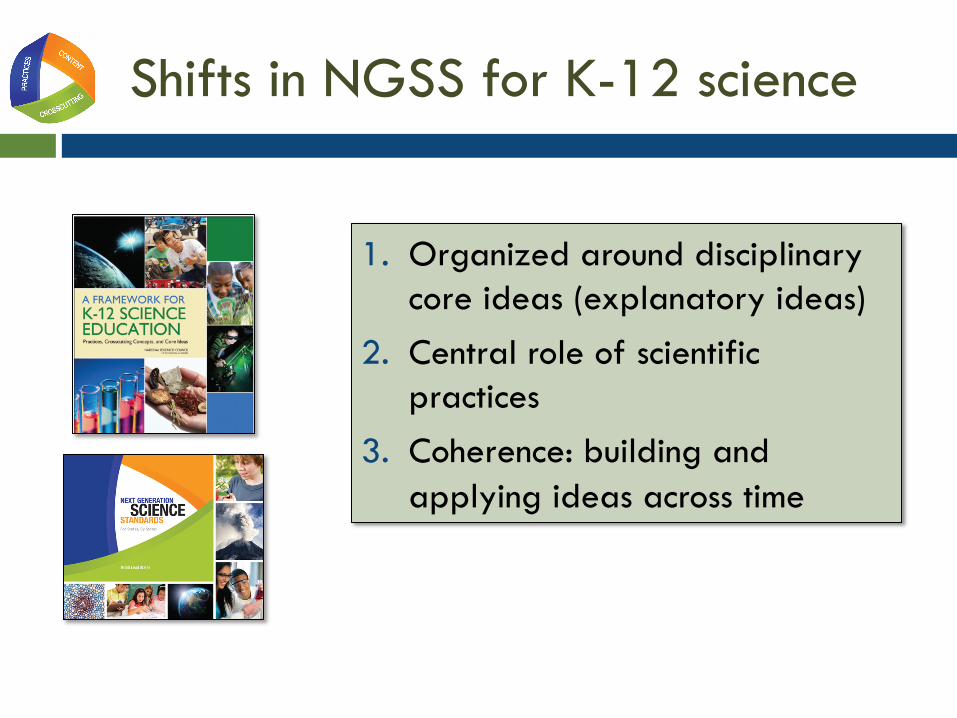
Shifts in NGSS for K-12 science
1. Organized around disciplinary core ideas (explanatory ideas)
2. Central role of scientific practices
3. Coherence: building and applying ideas across time
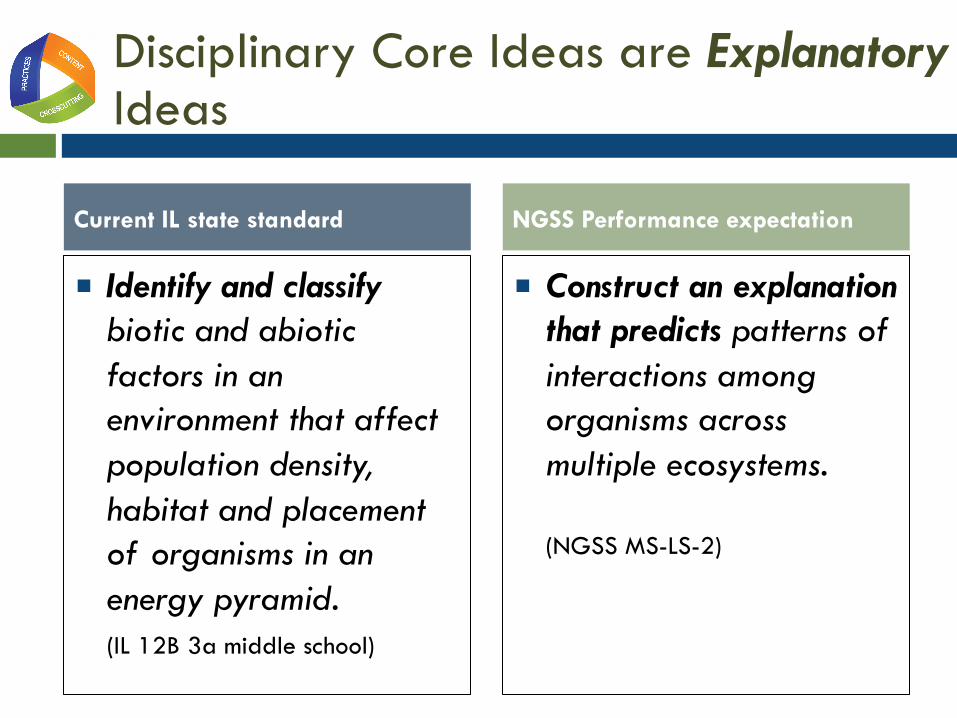
Disciplinary Core Ideas are Explanatory Ideas
■ Identify and classify biotic and abiotic factors in an environment that affect population density, habitat and placement of organisms in an energy pyramid. (IL 12B 3a middle school)
■ Construct an explanation that predicts patterns of interactions among organisms across multiple ecosystems. (NGSS MS-LS-2)
Current IL state standard NGSS Performance expectation
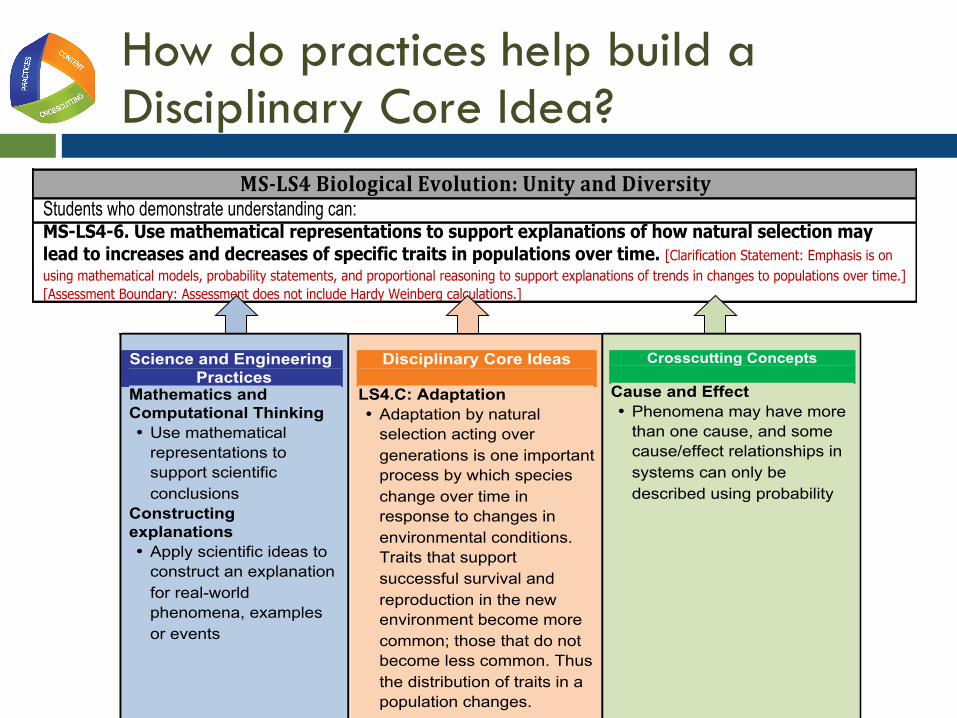
How do practices help build a Disciplinary Core Idea?
MS#LS4&Biological&Evolution:&Unity&and&Diversity Students who demonstrate understanding can: MS-LS4-6. Use mathematical representations to support explanations of how natural selection may lead to increases and decreases of specific traits in populations over time. [Clarification Statement: Emphasis is on using mathematical models, probability statements, and proportional reasoning to support explanations of trends in changes to populations over time.] [Assessment Boundary: Assessment does not include Hardy Weinberg calculations.]
!
Science and Engineering Practices
Mathematics and Computational Thinking • Use mathematical
representations to support scientific conclusions
Constructing explanations • Apply scientific ideas to
construct an explanation for real-world phenomena, examples or events
Disciplinary Core Ideas
LS4.C: Adaptation • Adaptation by natural
selection acting over generations is one important process by which species change over time in response to changes in environmental conditions. Traits that support successful survival and reproduction in the new environment become more common; those that do not become less common. Thus the distribution of traits in a population changes.
Crosscutting Concepts
Cause and Effect • Phenomena may have more
than one cause, and some cause/effect relationships in systems can only be described using probability
!
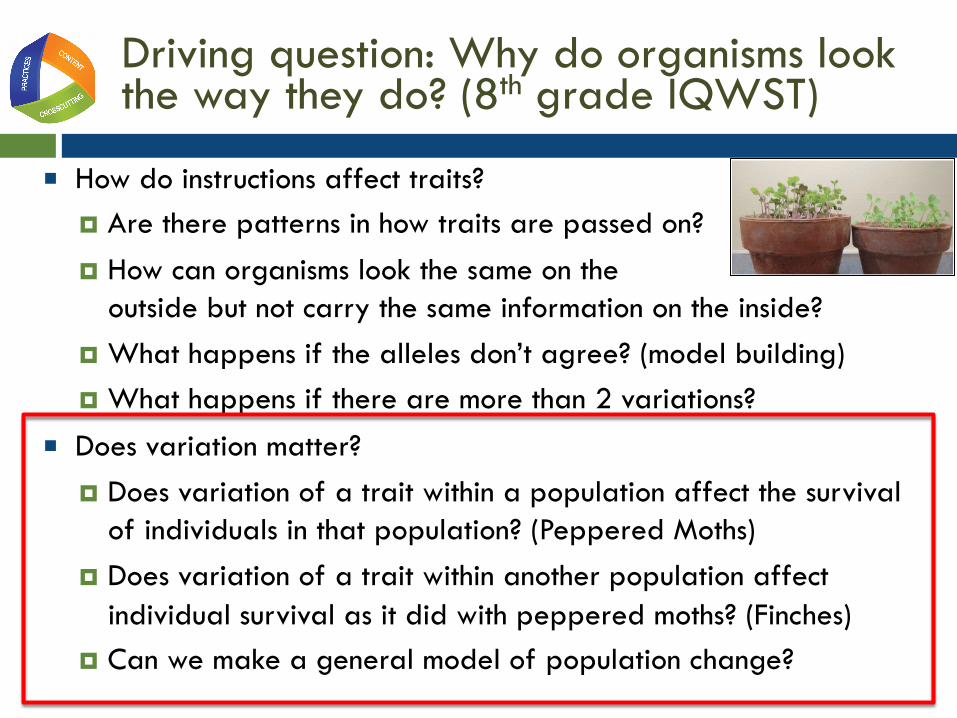
Driving question: Why do organisms look the way they do? (8th grade IQWST)
■ How do instructions affect traits? ¤ Are there patterns in how traits are passed on? ¤ How can organisms look the same on the
outside but not carry the same information on the inside? ¤ What happens if the alleles don’t agree? (model building) ¤ What happens if there are more than 2 variations?
■ Does variation matter? ¤ Does variation of a trait within a population affect the survival
of individuals in that population? (Peppered Moths) ¤ Does variation of a trait within another population affect
individual survival as it did with peppered moths? (Finches) ¤ Can we make a general model of population change?

The peppered moth investigation
“Beginning in the 1950s, scientists began to study the peppered moths. Their goal was to figure out why the carbonaria form of the moth had become more frequent than the typica peppered moth during the late 1800s. Before that time it had been very rare.
…The next sections contain four collections of studies. The studies look at different types of interactions between the moths and the abiotic and biotic factors in their ecosystem. These studies provide clues that can help figure out why the populations of peppered moths have changed over time.”
Carbonaria
Typica
From Why Do Organisms Look the Way That They Do? IQWST Curriculum Series

Research Studies Jigsaw
■ What do the results tell us about the research question? ■ Regroup with one member per RQ: How can we put these studies
together to construct an evidence-based explanation?
1. Pollution – Does pollution have anything to do with the proportions of the carbonaria and typica peppered moths?
2. Predation – Do birds prey on one variation of the peppered moth more easily than the other?
3. Pollution reduction – How did the proportions of carbonaria and typica moths change in the last 50 years?
4. Inheritance – Is the color of the moth inherited or is it something that happens to the moth due to its environment?
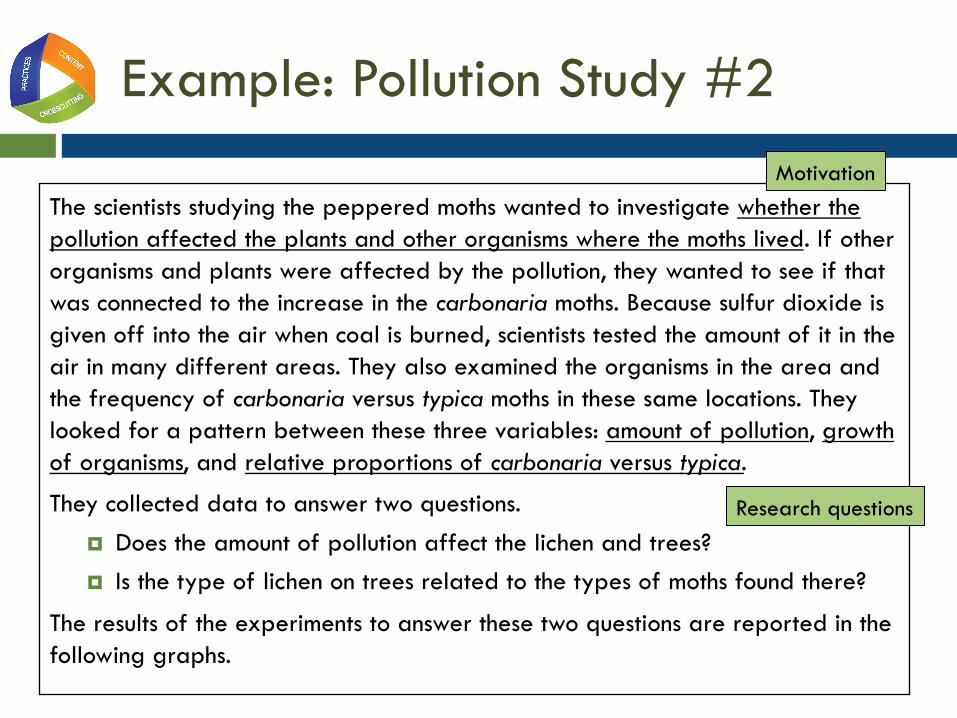
Example: Pollution Study #2
The scientists studying the peppered moths wanted to investigate whether the pollution affected the plants and other organisms where the moths lived. If other organisms and plants were affected by the pollution, they wanted to see if that was connected to the increase in the carbonaria moths. Because sulfur dioxide is given off into the air when coal is burned, scientists tested the amount of it in the air in many different areas. They also examined the organisms in the area and the frequency of carbonaria versus typica moths in these same locations. They looked for a pattern between these three variables: amount of pollution, growth of organisms, and relative proportions of carbonaria versus typica.
They collected data to answer two questions. ¤ Does the amount of pollution affect the lichen and trees? ¤ Is the type of lichen on trees related to the types of moths found there?
The results of the experiments to answer these two questions are reported in the following graphs.
Motivation
Research questions
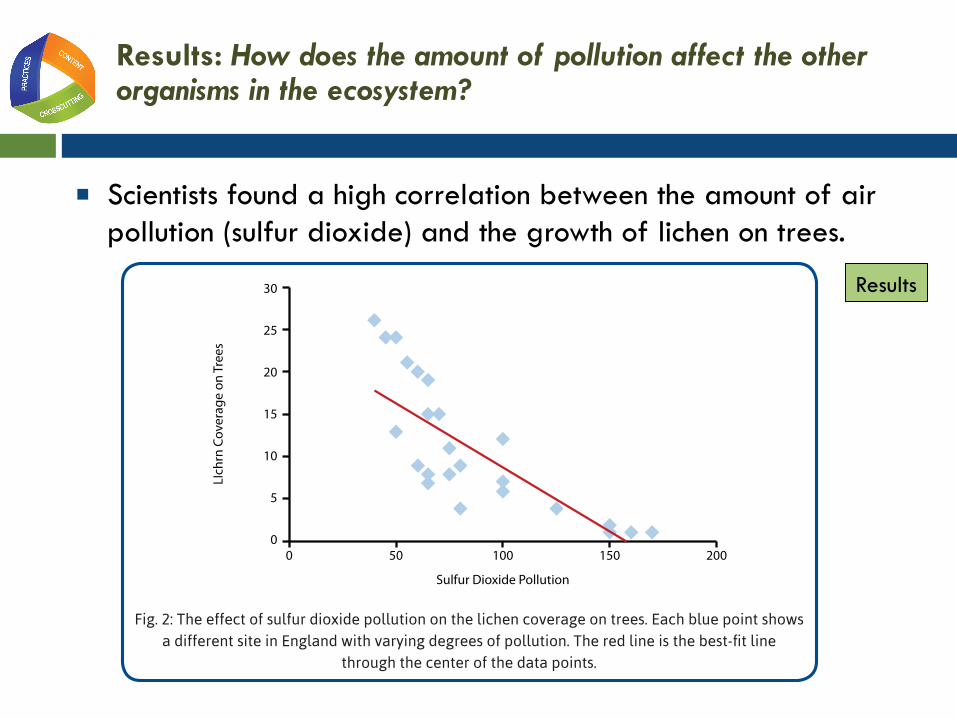
Results: How does the amount of pollution affect the other organisms in the ecosystem?
■ Scientists found a high correlation between the amount of air pollution (sulfur dioxide) and the growth of lichen on trees.
Results
LESSON 9: ഩDO VARIATIONS BETWEEN INDIVIDUALS MATTER? പ109
Scientists found a high correlation between the amount of air pollution (sulfur dioxide) and the growth of lichen on the trees.
Is the type of lichen coverage on trees related to what types of moths are found there?
Scientists again found a high negative correlation between the amount of lichen coverage on trees and the proportion of peppered moths that were the carbonaria rather than the typica variation.
LIch
rn C
over
age
on T
rees
500 100 150
Sulfur Dioxide Pollution
2000
5
10
15
20
25
30
Prop
orti
on o
f Car
bona
ria
50
Lichen Coverage on Trees
0
10
10 15 20 25 30
20
30
40
50
60
70
80
90
100
Fig. 2: The effect of sulfur dioxide pollution on the lichen coverage on trees. Each blue point shows a different site in England with varying degrees of pollution. The red line is the best- fi t line
through the center of the data points.
Fig. 3: The relationship between the lichen coverage on trees and the frequency of carbonaria peppered moths. Each blue point shows a different site in England with varying degrees of lichen coverage. The red line is the
best- fi t line through the center of the data points.

Results: Is the type of lichen coverage on trees related to what types of moths are found there?
Scientists found a high negative correlation between the amount of lichen coverage on trees and the proportion of peppered moths that were the carbonaria rather than the typica variation.
LESSON 9: ഩDO VARIATIONS BETWEEN INDIVIDUALS MATTER? പ109
Scientists found a high correlation between the amount of air pollution (sulfur dioxide) and the growth of lichen on the trees.
Is the type of lichen coverage on trees related to what types of moths are found there?
Scientists again found a high negative correlation between the amount of lichen coverage on trees and the proportion of peppered moths that were the carbonaria rather than the typica variation.
LIch
rn C
over
age
on T
rees
500 100 150
Sulfur Dioxide Pollution
2000
5
10
15
20
25
30
Prop
orti
on o
f Car
bona
ria
50
Lichen Coverage on Trees
0
10
10 15 20 25 30
20
30
40
50
60
70
80
90
100
Fig. 2: The effect of sulfur dioxide pollution on the lichen coverage on trees. Each blue point shows a different site in England with varying degrees of pollution. The red line is the best- fi t line
through the center of the data points.
Fig. 3: The relationship between the lichen coverage on trees and the frequency of carbonaria peppered moths. Each blue point shows a different site in England with varying degrees of lichen coverage. The red line is the
best- fi t line through the center of the data points.
Results
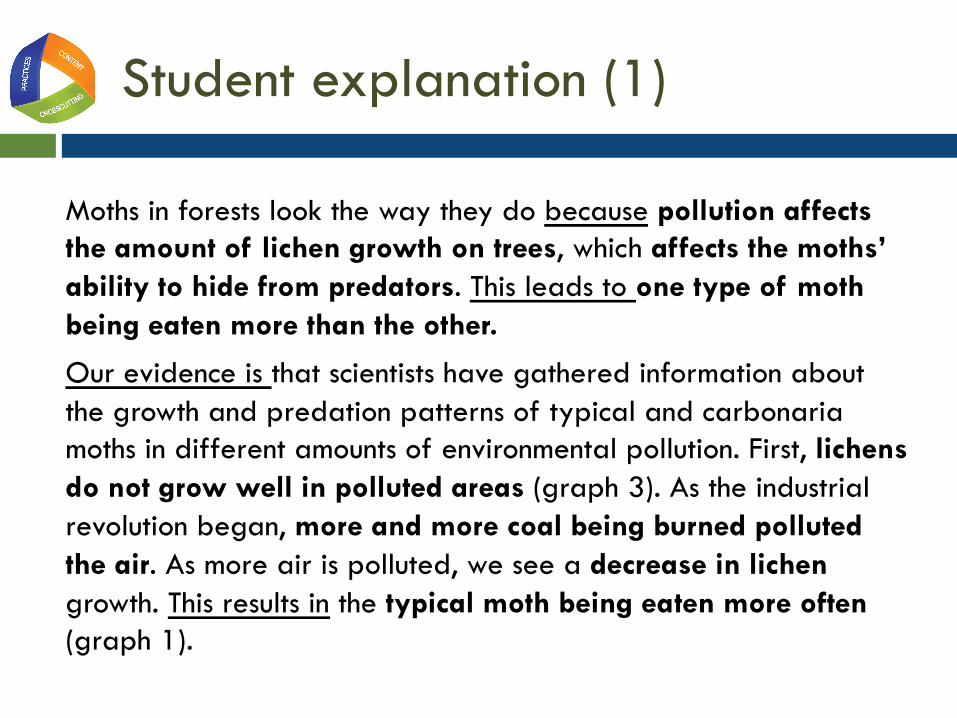
Student explanation (1)
Moths in forests look the way they do because pollution affects the amount of lichen growth on trees, which affects the moths’ ability to hide from predators. This leads to one type of moth being eaten more than the other.
Our evidence is that scientists have gathered information about the growth and predation patterns of typical and carbonaria moths in different amounts of environmental pollution. First, lichens do not grow well in polluted areas (graph 3). As the industrial revolution began, more and more coal being burned polluted the air. As more air is polluted, we see a decrease in lichen growth. This results in the typical moth being eaten more often (graph 1).
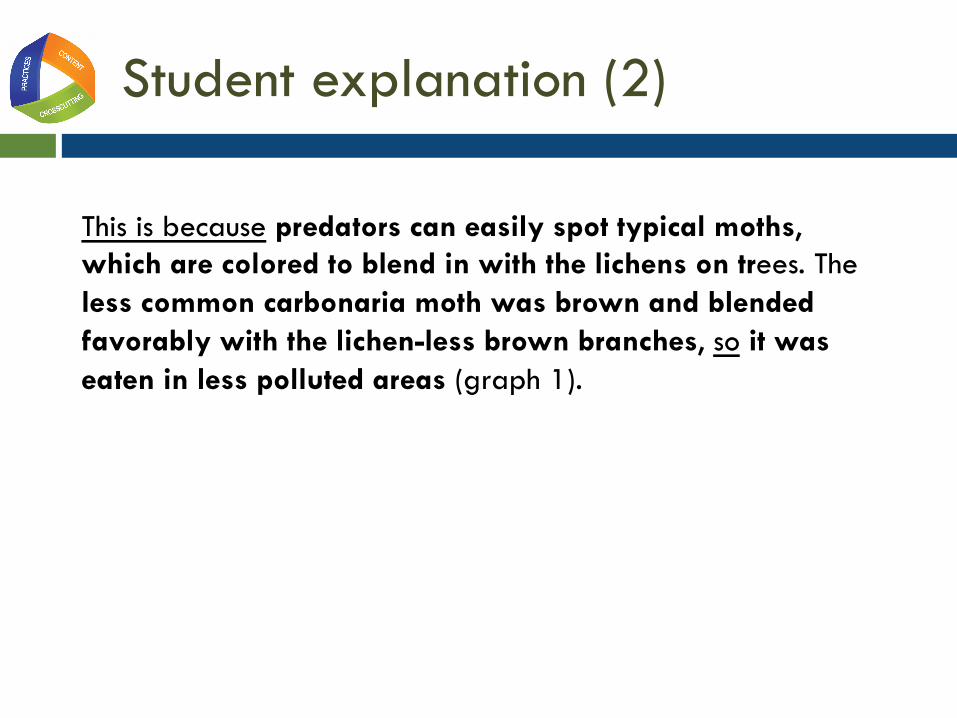
Student explanation (2)
This is because predators can easily spot typical moths, which are colored to blend in with the lichens on trees. The less common carbonaria moth was brown and blended favorably with the lichen-less brown branches, so it was eaten in less polluted areas (graph 1).

Student explanation (3)
Because of this, the gene pool changed so that the majority of the moths were carbonarias (graph 5). As people began adopting cleaner fuels and environmental protection laws were put into effect in the 1950s, the gene pool began to change again, the typical moth now being the most populous (graphs 5, 6). This is because lichens began to grow again due to the cleaner air. Also, we know that the color of the moths is inherited because scientists conducted an experiment to test this. They mated carbonarias with typical and with their own kinds and the results (table 4) showed that it is in fact inherited.
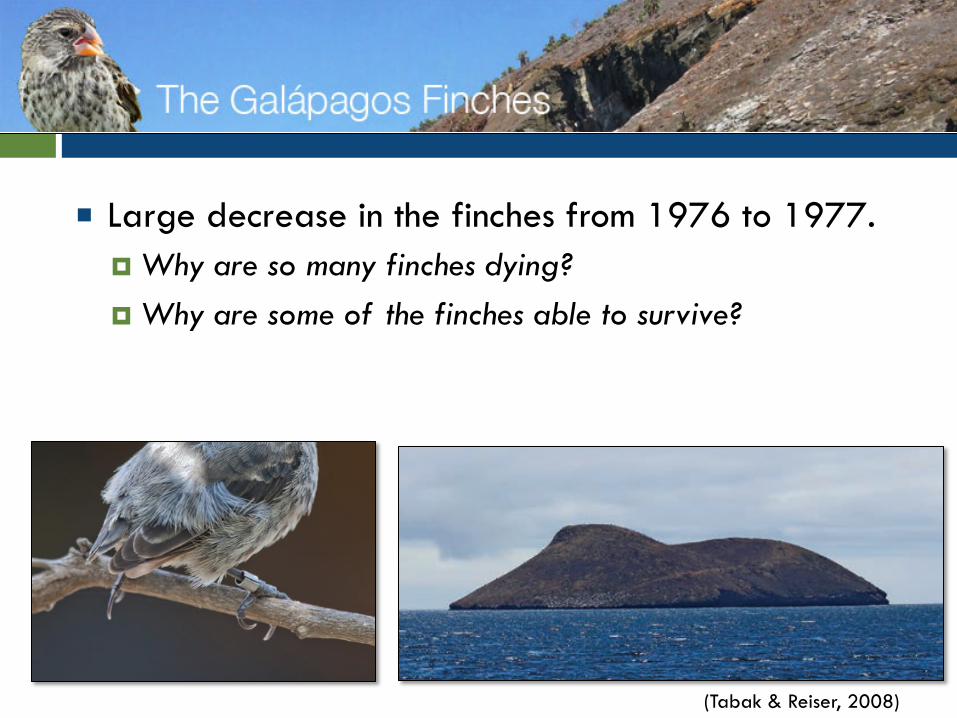
Galapagos Finches mystery
■ Large decrease in the finches from 1976 to 1977. ¤ Why are so many finches dying? ¤ Why are some of the finches able to survive?
(Tabak & Reiser, 2008)

Eco-system data
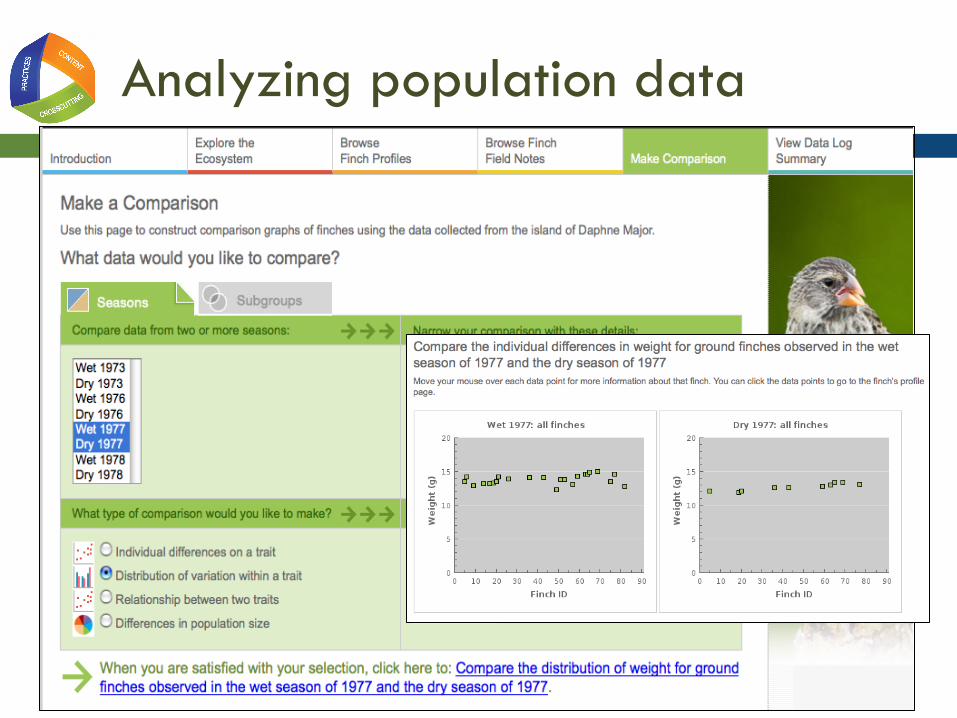
Analyzing population data

Individual profiles
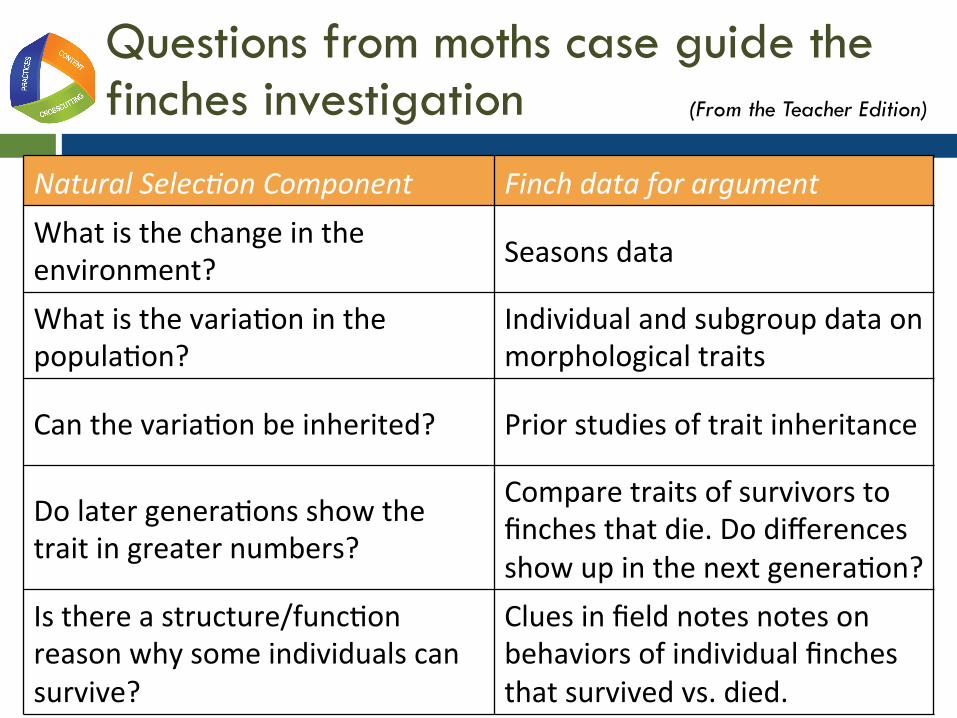
Natural Selec+on Component Finch data for argument What is the change in the environment? Seasons data
What is the varia3on in the popula3on?
Individual and subgroup data on morphological traits
Can the varia3on be inherited? Prior studies of trait inheritance
Do later genera3ons show the trait in greater numbers?
Compare traits of survivors to finches that die. Do differences show up in the next genera3on?
Is there a structure/func3on reason why some individuals can survive?
Clues in field notes notes on behaviors of individual finches that survived vs. died.
Questions from moths case guide the finches investigation (From the Teacher Edition)

Midpoint discussion
■ What have you all found out from the data so far?
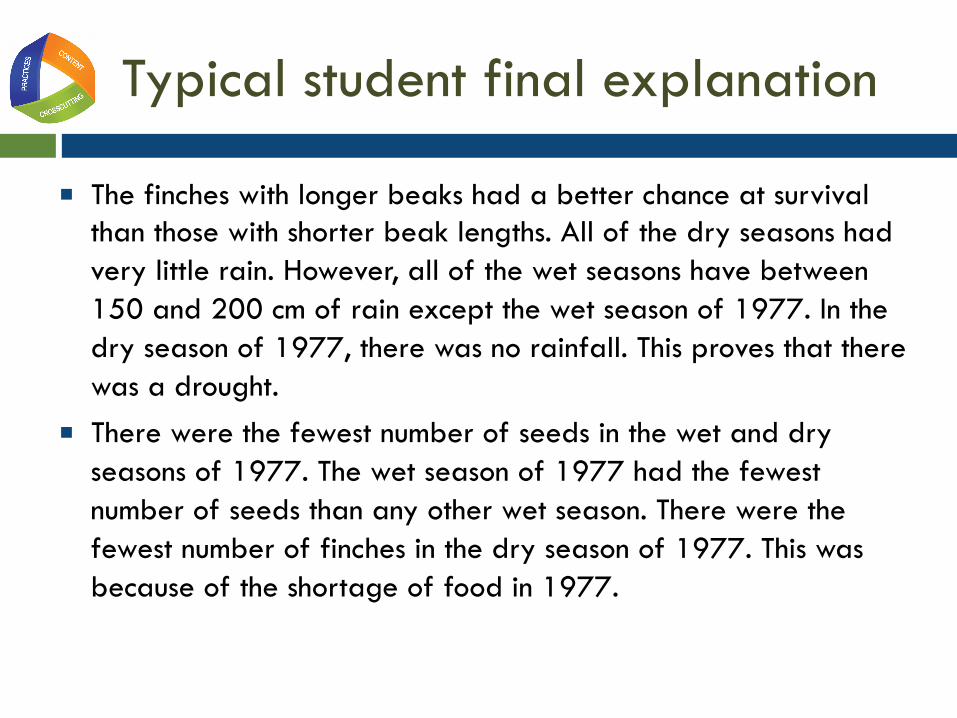
Typical student final explanation
■ The finches with longer beaks had a better chance at survival than those with shorter beak lengths. All of the dry seasons had very little rain. However, all of the wet seasons have between 150 and 200 cm of rain except the wet season of 1977. In the dry season of 1977, there was no rainfall. This proves that there was a drought.
■ There were the fewest number of seeds in the wet and dry seasons of 1977. The wet season of 1977 had the fewest number of seeds than any other wet season. There were the fewest number of finches in the dry season of 1977. This was because of the shortage of food in 1977.

Explanation (cont.)
■ The beak lengths for the finches that died in the wet season of 1977 ranged from 9.0 to 12.9. The beak lengths for the finches that survived in the wet season of 1977 ranged from 10.5 to 13.9. This shows that the finches that survived during the drought had longer beaks than those who died in the drought. There was a drought in the wet and dry seasons of 1977. Since there was less rain, there were fewer plants that were growing. Since there were fewer plants, there were fewer seeds and less food for the finches. Since there was less food, the finches had to dig down into the ground to find the food. Therefore, the longer their beaks were the better chance they had of finding food in the ground. There were more deaths in the wet season of 1977. The finches with the longer beaks could crack open the few seeds left on the island.
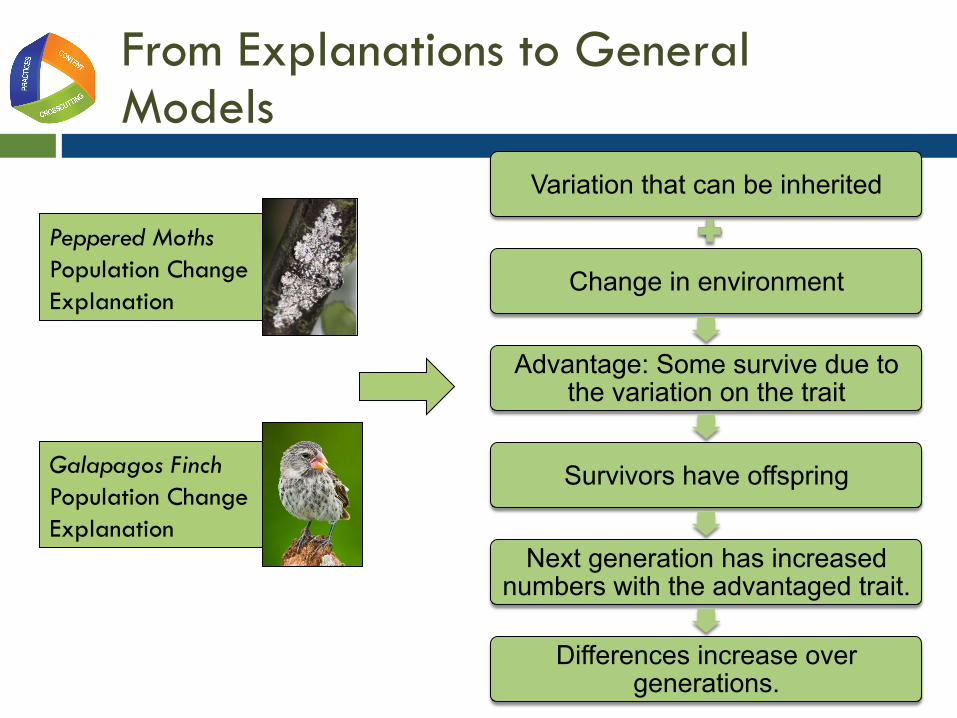
From Explanations to General Models
Variation that can be inherited
Change in environment
Advantage: Some survive due to the variation on the trait
Survivors have offspring
Next generation has increased numbers with the advantaged trait.
Differences increase over generations.
Peppered Moths Population Change Explanation
Galapagos Finch Population Change Explanation
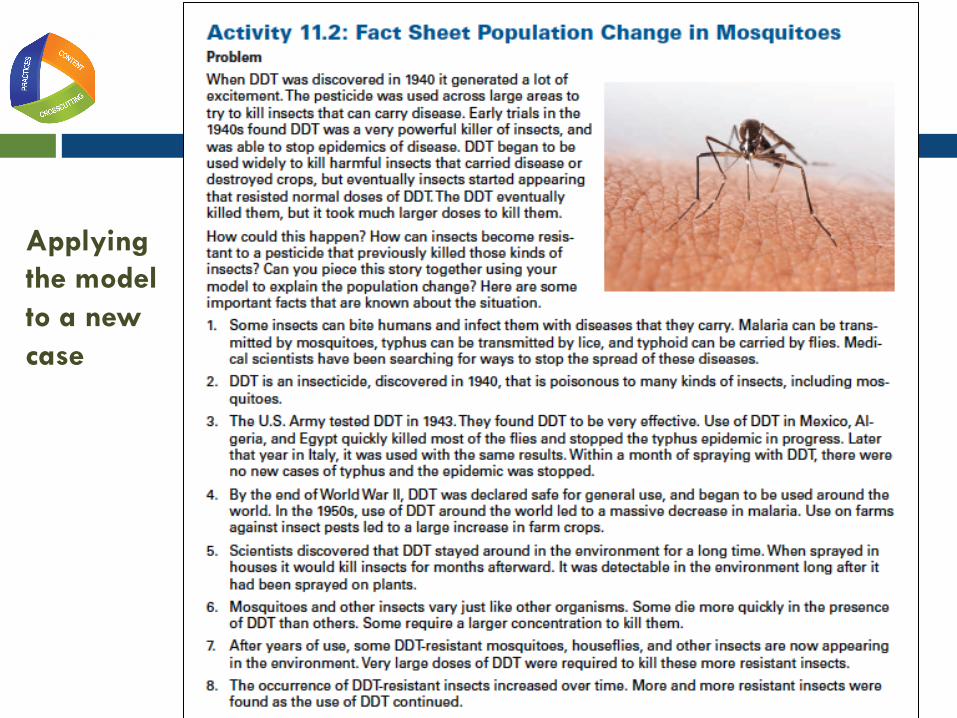
Applying the model to a new case
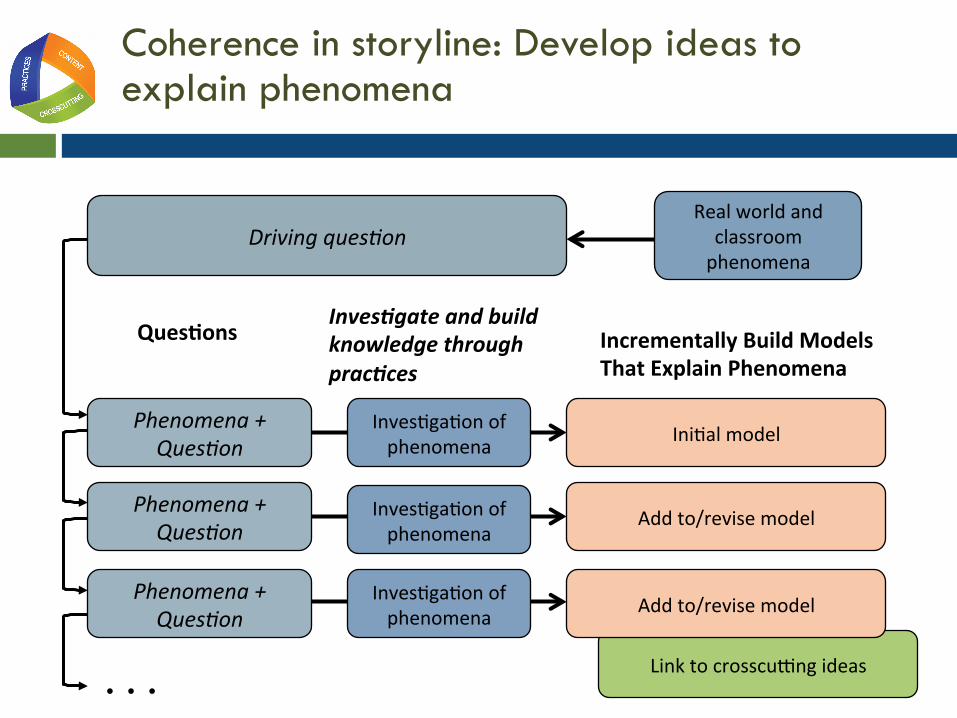
Coherence in storyline: Develop ideas to explain phenomena
Phenomena + Ques+on Add to/revise model Inves3ga3on of
phenomena
Phenomena + Ques+on
Inves3ga3on of phenomena
Ques%ons Inves&gate and build knowledge through prac&ces
Incrementally Build Models That Explain Phenomena
Ini3al model Phenomena + Ques+on
Inves3ga3on of phenomena
Driving ques+on Real world and classroom phenomena
. . . Link to crosscuHng ideas
Add to/revise model
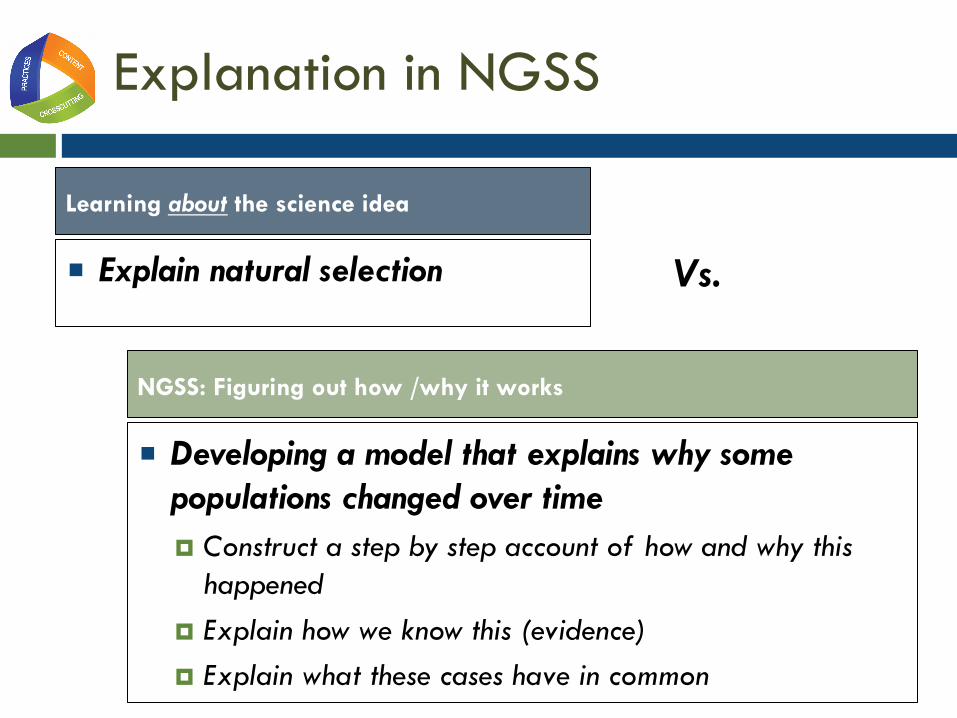
Explanation in NGSS
■ Explain natural selection
■ Developing a model that explains why some populations changed over time ¤ Construct a step by step account of how and why this
happened ¤ Explain how we know this (evidence) ¤ Explain what these cases have in common
Learning about the science idea
NGSS: Figuring out how /why it works
Vs.
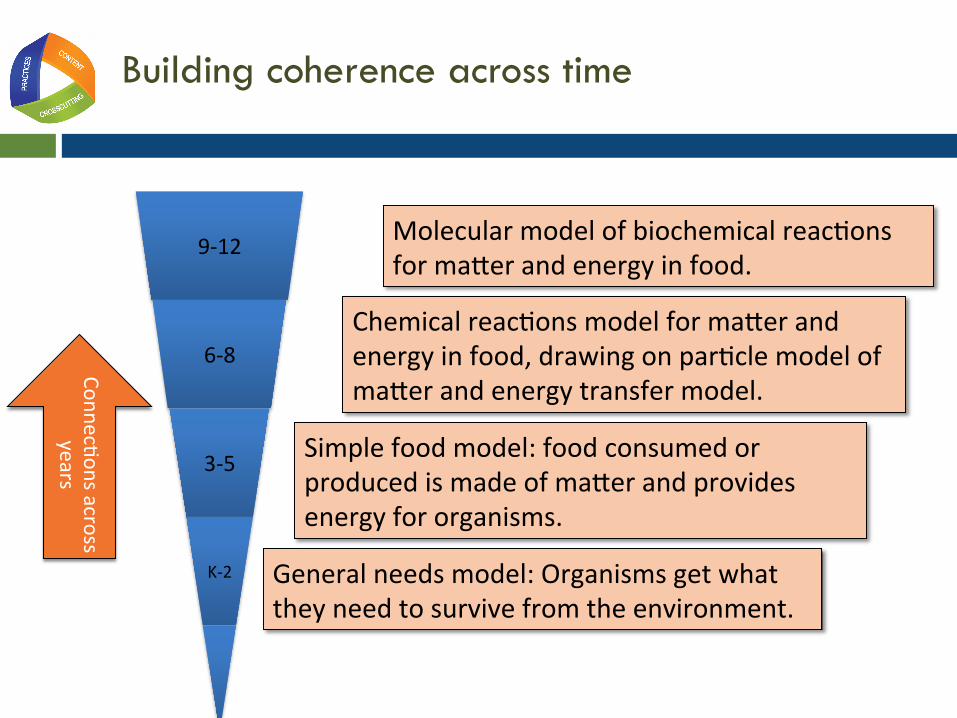
Chemical reac3ons model for maIer and energy in food, drawing on par3cle model of maIer and energy transfer model.
Simple food model: food consumed or produced is made of maIer and provides energy for organisms.
General needs model: Organisms get what they need to survive from the environment.
Molecular model of biochemical reac3ons for maIer and energy in food.
9-‐12
6-‐8
3-‐5
K-‐2
Connec3ons across years
Building coherence across time
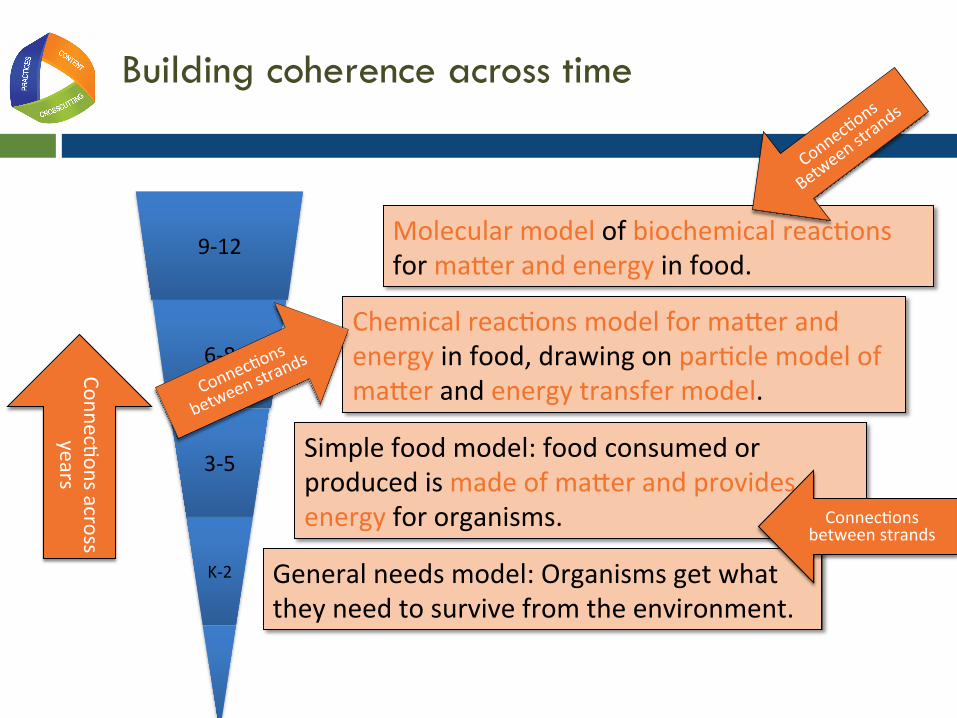
Chemical reac3ons model for maIer and energy in food, drawing on par3cle model of maIer and energy transfer model.
Simple food model: food consumed or produced is made of maIer and provides energy for organisms.
General needs model: Organisms get what they need to survive from the environment.
Molecular model of biochemical reac3ons for maIer and energy in food.
9-‐12
6-‐8
3-‐5
K-‐2
Connec3ons across years
Connec3ons between strands
Building coherence across time
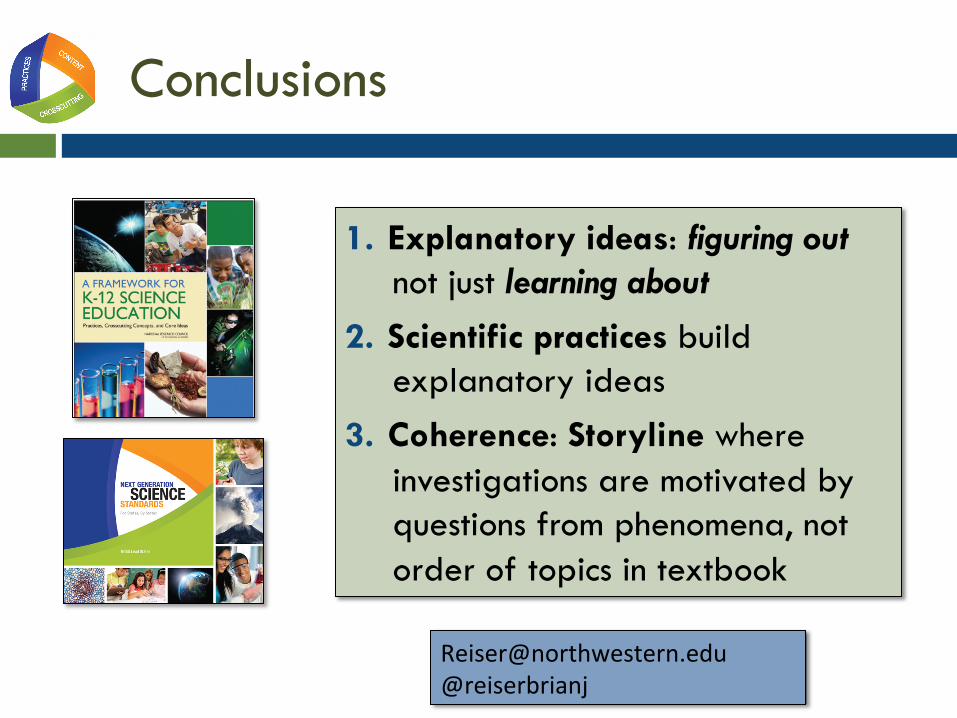
Conclusions
1. Explanatory ideas: figuring out not just learning about
2. Scientific practices build explanatory ideas
3. Coherence: Storyline where investigations are motivated by questions from phenomena, not order of topics in textbook
[email protected] @reiserbrianj