Water Demand Design Standard Review, 2017 Update
31
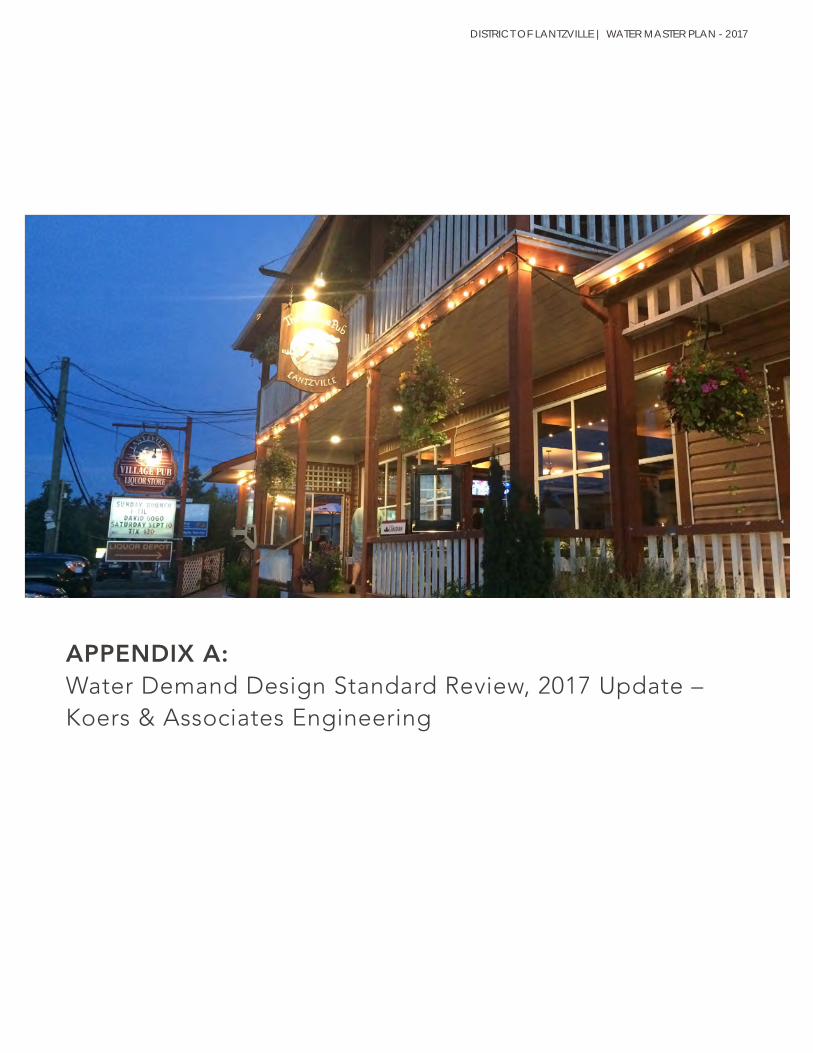
DISTRICT OF LANTZVILLE | WATER MASTER PLAN - 2017 APPENDIX A: Water Demand Design Standard Review, 2017 Update – Koers & Associates Engineering
-
Upload
khangminh22 -
Category
Documents
-
view
1 -
download
0
Transcript of Water Demand Design Standard Review, 2017 Update
DISTRICT OF LANTZVILLE | WATER MASTER PLAN - 2017
APPENDIX A: Water Demand Design Standard Review, 2017 Update – Koers & Associates Engineering
i Water Demand Design Standard Review, 2017 WORKING DRAFT Jul 6, 2017
District of Lantzville
WATER MASTER PLAN WATER DEMAND DESIGN STANDARD REVIEW,
2017 UPDATE
Table of Contents Page
1 INTRODUCTION 1
1.1 Background .............................................................................................. 1
1.2 Study Purpose .......................................................................................... 1
1.3 Scope of Work .......................................................................................... 2
1.4 Acknowledgements .................................................................................. 2
2 WATER DEMANDS 3
2.1 Annual Usage ........................................................................................... 3 2.1.1 Bulk Water Meter .................................................................................. 3 2.1.2 Individual Water Meters ....................................................................... 3 2.1.3 Revenue & Non‐Revenue Water Demand ............................................ 4
2.2 Daily Usage ............................................................................................... 6 2.2.1 Average Day & Maximum Day .............................................................. 6 2.2.2 Per Capita Demand ................................................................................ 7
2.3 Demands by Land Use .............................................................................. 9 2.3.1 District of Lantzville ............................................................................... 9 2.3.2 Other Vancouver Island Municipalities ............................................... 11
3 DESIGN DEMANDS 12
3.1 Current Design Demand Standards ........................................................ 12 3.1.1 District of Lantzville ............................................................................. 12 3.1.2 Other Vancouver Island Municipalities ............................................... 12
3.2 Proposed Land‐Use Based Demand Standards ...................................... 13 3.2.1 Residential ........................................................................................... 13 3.2.2 Non‐Residential (Institutional/Commercial/Industrial) ...................... 14 3.2.3 Peak Hour ............................................................................................ 14 3.2.4 System Redundancy ............................................................................ 14
3.3 Climate Change ...................................................................................... 15
ii Water Demand Design Standard Review, 2017 WORKING DRAFT Jul 6, 2017
4 CONCLUSIONS 16
5 RECOMMENDATIONS 17 Tables Page
1 – Wellfield vs Upper & Lower Pressure Zone Bulk Meter Annual Volumes, 2011 ‐ 2016 ........ 3
2 – System Demand vs Individual Metered Demand, 2011 – 2016 ............................................. 4
3 – Annual, Ave Day, Max Day & Max Week System Demand, 1996 – 2016 .............................. 6
4 – Estimated Lantzville Per Capita Ave Day, Max Day & Max Week Demand, 2012 ‐ 2016 ...... 7
5 – Per Capita Ave and Max Day Demand, Vancouver Island Communities................................ 7
6 – Annual Demand by Land‐Use, 2010 ‐ 2016 ............................................................................ 9
7 – Lantzville Residential Water Demands vs Lot Size, 2010 ‐ 2014 .......................................... 10
8 – Annual Water Demands by Land Use, Vancouver Island Communities ............................... 11
9 – Per Capita Design Standards, Mid Vancouver Island Municipalities .................................... 12
10 – Proposed Residential Water Demand Design Standards .......................................... (after 13)
Figures After Page 1 Total Individual vs Upper & Lower Bulk Metered Quarterly Demand
(2011 – March 2017) ....................................................................................................... 4
2 Revenue & Non‐Revenue Water, 5 Year Average, 2012 ‐ 2016 ........................... on page 5
3 Demands (Annual, Ave Day, Max Day) & Population, 1996 – 2016 ................................... 6
4 Water Demand per Lot, Varying Residential Lot Size, 5 Year Ave (2010 – 2014) ............. 10
5 Waterfront Residential Lot Locations (0.45 ha)................................................................ 10
6 Waterfront Residential Lot Locations (0.12 ha)................................................................ 10
7 Upper Lantzville Residential Lot Locations (0.12 ha) ........................................................ 10
8 Lower Lantzville Residential Lot Locations (0.1 ha) .......................................................... 10
9 Non‐Residential Metered Demands, 2014 (Institutional/Commercial/Industrial) .......... 14
Page 1 of 18 Water Demand Design Standard Review, 2017 Jul 6, 2017
1 INTRODUCTION
1.1 Background The District of Lantzville’s (DoL) current per connection design water demand of 3,400 L/day has been the standard in Lantzville for a long time, reaching back to pre‐incorporation days when the DoL water system was operated by the Lantzville Improvement District. It is believed that the design demand was mainly based on the 0.5 Igpm per connection flow rate that the Regional District of Nanaimo (RDN) had been using as a design standard for developer‐built water systems in the rural areas of the RDN that relied upon groundwater wells as the source of water. We understand that the concept was that at a minimum, any new development had to supply a quantity of water that equalled or exceeded the amount of water that would be needed to supply the new development. Given the variability and potential for declining well yields over time, we understand that a high factor of safety was built into the design rate. With a larger centralized system containing updated storage and supply capability, having new developments add wells on a case‐by‐case basis is not necessarily practical or desired, as supply and treatment regimes become more complex. Having water sources spread throughout the DoL is not considered to be an economical approach in terms of managing infrastructure. The 3,400 L/day per connection has also been used to determine the number of connections that the DoL can supply, based upon the current rating of the DoL’s well field. Before the Water Supply Update was published in July 2015, the capacity of the well field was assessed at 800 to 1,000 m3/day which, when using the 3,400 L/day per connection target, indicated a net deficiency of water within the system. However in May 2016, with several years of metering and consumption data available for review, and an updated assessment of the well field’s aquifer capacity, the DoL requested an updated evaluation of the current design standard. Koers and Associates Engineering Ltd. (KAEL) produced a report titled “Water Demand Design Standard Review” which reviewed historical usage patterns, compared water usage and standards in other jurisdictions, and provided recommendations on potential design standard revisions. In conjunction with the Water Master Plan assignment that the DoL is currently undertaking, KAEL was requested to provide an update on proposed water system demand design standards as they could relate to potential new land uses within the DoL which are being contemplated under the concurrent Official Community Plan (OCP) review process. Additional water meter review data from 2014 to 2017 was also provided for use in this study.
1.2 Study Purpose To review existing design water demands for the DoL, compare against existing consumption data, compare against other local jurisdictions, and recommend design demand standards for the following land‐uses:
Single Family, and
All other types of dwellings and connections, e.g., - Multi‐Family
- Commercial
Page 2 of 18 Water Demand Design Standard Review, 2017 Jul 6, 2017
- Industrial
- Institutional
A review of target fire flow demands was not requested by the DoL in this study, but has been recommended to the DoL in previous studies.
1.3 Scope of Work To accomplish the study purpose, the following work plan was adopted:
Task 1 – Obtain & Analyze Water Demands
Obtain from DoL, bulk metering (upper zone, lower zone and wellfield) and all individual water meter demand spreadsheets.
Process and incorporate data into analyses carried out under previous studies: - District of Lantzville, Water Supply & Distribution System Study, July 2015
- District of Lantzville, Water Demand Design Standard Review, May, 13, 2016
Determine revenue and non‐revenue water demands.
Determine average day, maximum day and per capita demands.
Determine residential water demands.
Compare residential water demands by location/lot size, i.e., waterfront lots vs Upper Lantzville lots.
Compare residential demands against other Vancouver Island municipalities.
Task 2 – Non‐Residential Design Water Demands
Review the DoL’s actual demands for non‐residential properties (e.g., commercial, industrial, public facilities)
Compare DoL demands against other Vancouver Island municipalities.
Task 3 – Report Findings
Present findings in a report complete with tables and figures.
Include an overview of the work completed, the findings and the recommendations for: - per capita average day, maximum day and peak hour demands.
- per connection design demand for Single Family Residential and Multi‐Family
Residential.
1.4 Acknowledgements Koers & Associates Engineering Ltd. acknowledges, with thanks, the assistance provided by District of Lantzville staff and Lanarc Consultants during the preparation of this report.
Page 3 of 18 Water Demand Design Standard Review, 2017 Jul 6, 2017
2 WATER DEMANDS
2.1 Annual Usage
2.1.1 Bulk Water Meter
Water demands in the DoL are recorded by three bulk water meters, all located at the Ware Road reservoir, as follows:
The first bulk meter records the volume extracted from the wellfield as it enters the Ware Road reservoir.
The second bulk meter records the volume leaving (by gravity from) the Ware Road reservoir as into the lower pressure zone.
The third bulk meter records the volume leaving (by pumping from) the Ware Road reservoir and into the upper pressure zone.
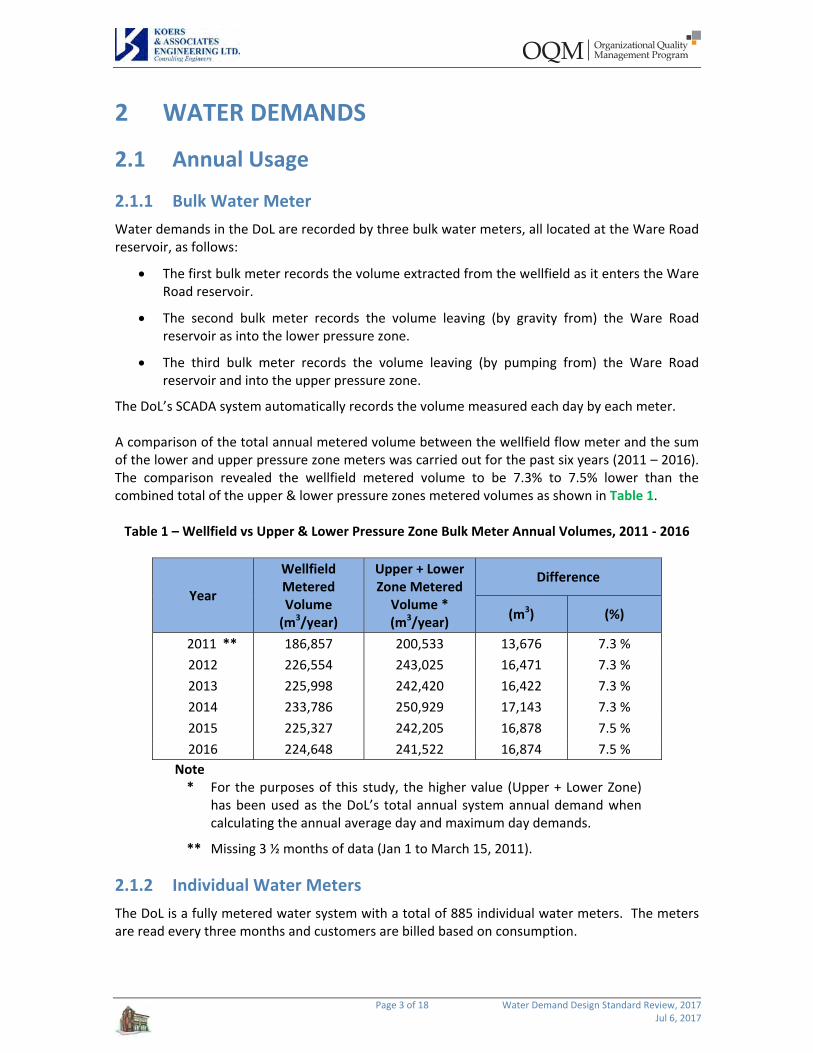
The DoL’s SCADA system automatically records the volume measured each day by each meter. A comparison of the total annual metered volume between the wellfield flow meter and the sum of the lower and upper pressure zone meters was carried out for the past six years (2011 – 2016). The comparison revealed the wellfield metered volume to be 7.3% to 7.5% lower than the combined total of the upper & lower pressure zones metered volumes as shown in Table 1. Table 1 – Wellfield vs Upper & Lower Pressure Zone Bulk Meter Annual Volumes, 2011 ‐ 2016
Year
Wellfield Metered Volume (m3/year)
Upper + Lower Zone Metered Volume * (m3/year)
Difference
(m3) (%)
2011 ** 186,857 200,533 13,676 7.3 %
2012 226,554 243,025 16,471 7.3 %
2013 225,998 242,420 16,422 7.3 %
2014 233,786 250,929 17,143 7.3 %
2015 225,327 242,205 16,878 7.5 %
2016 224,648 241,522 16,874 7.5 %
Note * For the purposes of this study, the higher value (Upper + Lower Zone)
has been used as the DoL’s total annual system annual demand when calculating the annual average day and maximum day demands.
** Missing 3 ½ months of data (Jan 1 to March 15, 2011).
2.1.2 Individual Water Meters
The DoL is a fully metered water system with a total of 885 individual water meters. The meters are read every three months and customers are billed based on consumption.

Page 4 of 18 Water Demand Design Standard Review, 2017 Jul 6, 2017
The total volume recorded by the 885 meters was compared against the volume recorded by the combined total of the upper & lower pressure zones meters for each quarter and annually over the past six years (2011 ‐ 2016). As anticipated, the sum of the individual meters was lower than the combined upper & lower pressure zones meters as not all water usage is metered (this is discussed further under 2.1.3 Revenue & Non‐Revenue Water Demand.) The amount of the difference varied from quarter to quarter and from year to year. The largest and smallest quarterly differences were in the second quarter (April – June) and third quarter (July – Sept) respectively, and with Year 2015 having the largest quarterly and total annual difference. In the third quarter of 2016 (July – Sept,) the total of the individual meters exceeded the combined total of the upper & lower pressure zones meters. The reason for this exceedance could not be determined. A comparison of the annual total demands is presented in Table 2. A comparison of the quarterly and annual demands is graphically shown in Figure 1.
Table 2 – System Demand vs Individual Metered Demand, 2011 – 2016
Year Individual Meters
(m3/year)
Upper + Lower Zone Metered Volume * (m3/year)
Difference (Non‐Revenue Water)
(m3) (%)
2011 ** 158,933 191,268 32,780 18 %
2012 203,413 243,025 39,612 16 %
2013 195,043 242,420 47,372 21 %
2014 196,085 250,929 54,844 22 %
2015 169,380 242,205 72,826 30 %
2016 218,237 241,522 23,285 11 %
5 Yr Ave (2012 – 2016)
196,432 244,020 47,600 20 %
Note * For the purposes of this study, the higher value (upper + lower zones)
has been used as the DoL’s total annual system demand when calculating the annual average day and maximum day demands.
** Missing first three months of 2011 (Jan, Feb, March).
The percentage of non‐revenue water, while a noticeable amount, is not unexpected or unusual for a water system of this size, age and operating pressures.
2.1.3 Revenue & Non‐Revenue Water Demand
The total demand placed on the DoL’s water system can be divided into two components and can be expressed in the following equation:
Total Annual Demand = Revenue Water + Non‐Revenue Water where:
Total Annual Demand = Total of upper pressure zone + lower pressure zone meters Revenue Water = Water usage for which a cost is charged Non‐Revenue Water = Water usage which not charged
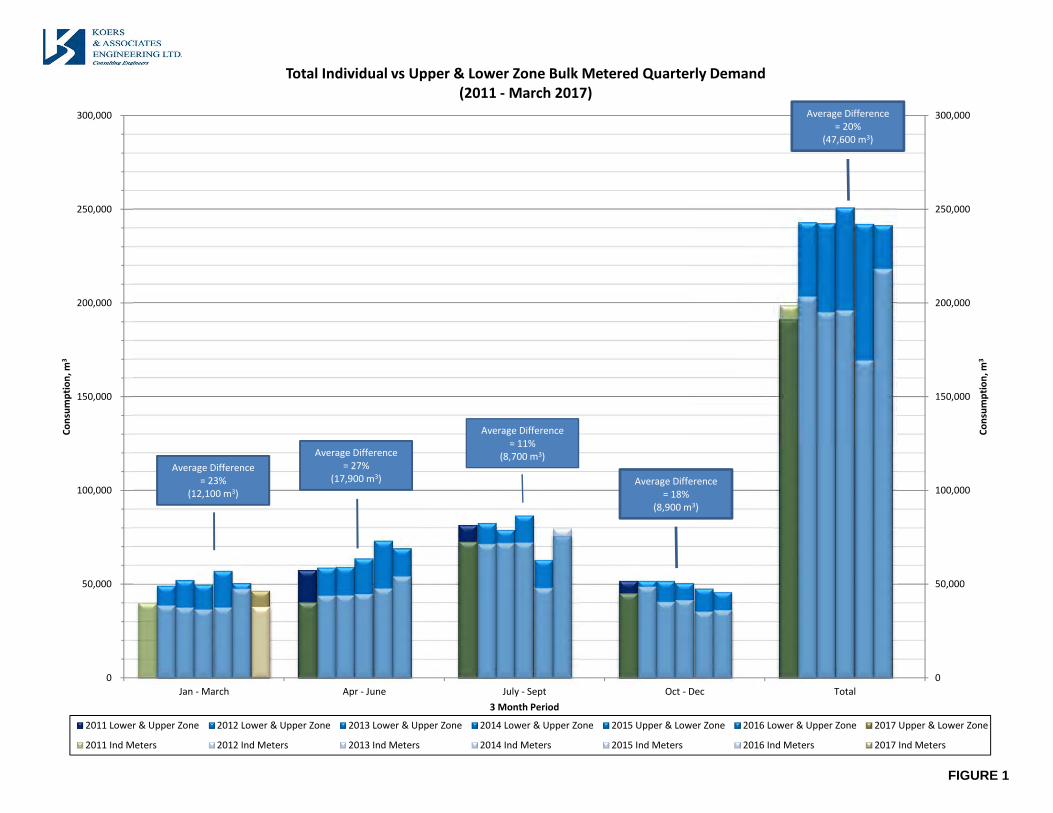
FIGURE 1
0
50,000
100,000
150,000
200,000
250,000
300,000
0
50,000
100,000
150,000
200,000
250,000
300,000
Jan ‐ March Apr ‐ June July ‐ Sept Oct ‐ Dec Total
Consum
ption, m
3
Consum
ption, m
3
3 Month Period
Total Individual vs Upper & Lower Zone Bulk Metered Quarterly Demand(2011 ‐March 2017)
2011 Lower & Upper Zone 2012 Lower & Upper Zone 2013 Lower & Upper Zone 2014 Lower & Upper Zone 2015 Upper & Lower Zone 2016 Lower & Upper Zone 2017 Upper & Lower Zone
2011 Ind Meters 2012 Ind Meters 2013 Ind Meters 2014 Ind Meters 2015 Ind Meters 2016 Ind Meters 2017 Ind Meters
Average Difference= 23%
(12,100 m3)
Average Difference= 27%
(17,900 m3)
Average Difference= 11%
(8,700 m3)
Average Difference= 18%
(8,900 m3)
Average Difference= 20%
(47,600 m3)

Page 5 of 18 Water Demand Design Standard Review, 2017 Jul 6, 2017
Revenue Water in the DoL is the sum of the metered volume of the individual water meters, of which there are presently 885 meters. Non‐Revenue Water is made up of three components and can be expressed in the following equation:
Non‐Revenue Water = Unbilled Authorized Consumption + Apparent Losses + Real Losses
The volume associated with each component can be made up of the following:
Unbilled Authorized Consumption
Watermain flushing
Sewer main flushing
Fire department training and actual fire fighting
Public space irrigation (playfields, parks, boulevards, gardens)
Public facilities (outdoor washroom) Apparent Losses
Metering inaccuracies
Water theft Real Losses
Leakage on transmission and/or distribution mains
Leakage on service connections up to the customer’s meter
Leakage on fire hydrants, air release valves, flushouts Non‐Revenue Water can be determined by the following equation:
Non‐Revenue Water = Bulk Water Meter – Sum of Individual Water Meters
The calculated annual volume of non‐revenue water for the past six years is shown in Table 1. The quarterly and annual volumes are presented in Figure 1. Even though non‐revenue water is not metered or billed, this volume needs to be considered as part of the overall assessment, as the system will generally require this volume on a regular basis, and it needs to be factored in to the annual system demand. A comparison of the average of revenue and non‐revenue water demand (individual meters total and the upper & lower pressure zone meters total) for the past five years (2012 – 2016) is presented in Figure 2.
Figure 2 – Revenue & Non‐ Revenue Water, 5 Year Average, 2012 ‐ 2016
Individual Meter Total196,433 80%
Unaccounted for Water47,588 20%
Page 6 of 18 Water Demand Design Standard Review, 2017 Jul 6, 2017
2.2 Daily Usage
2.2.1 Average Day & Maximum Day
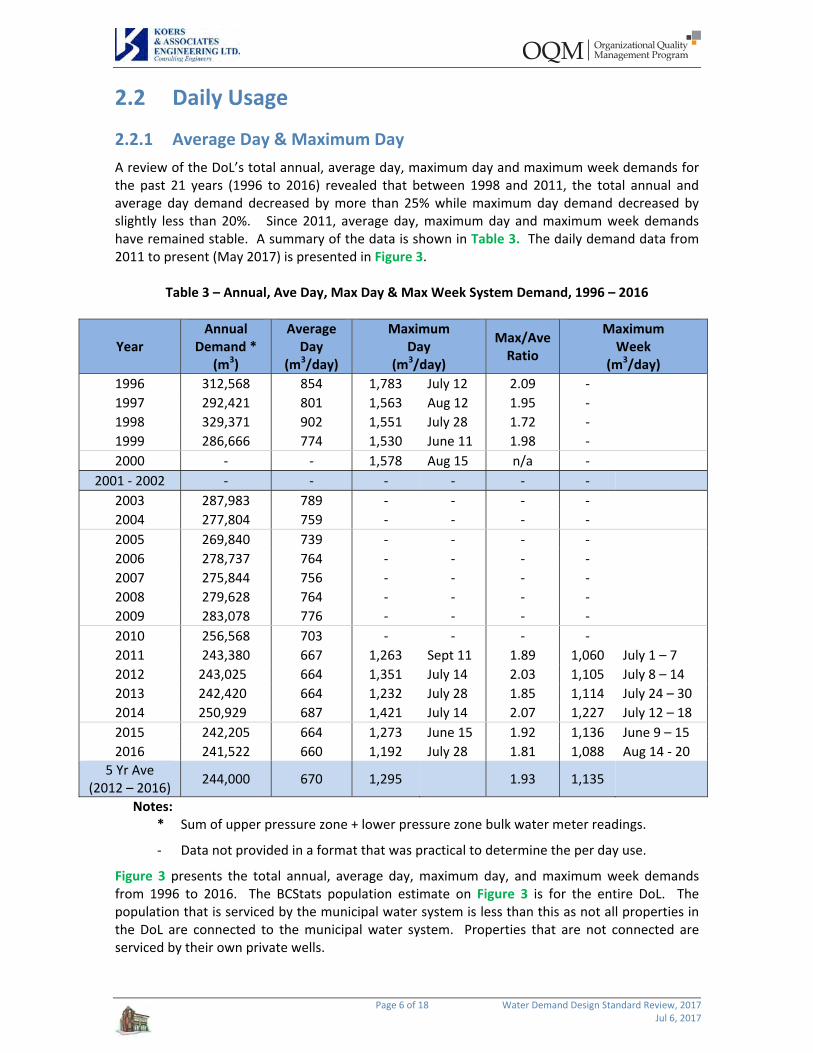
A review of the DoL’s total annual, average day, maximum day and maximum week demands for the past 21 years (1996 to 2016) revealed that between 1998 and 2011, the total annual and average day demand decreased by more than 25% while maximum day demand decreased by slightly less than 20%. Since 2011, average day, maximum day and maximum week demands have remained stable. A summary of the data is shown in Table 3. The daily demand data from 2011 to present (May 2017) is presented in Figure 3.
Table 3 – Annual, Ave Day, Max Day & Max Week System Demand, 1996 – 2016
Year Annual
Demand * (m3)
Average Day
(m3/day)
Maximum Day
(m3/day)
Max/AveRatio
Maximum Week
(m3/day)
1996 312,568 854 1,783 July 12 2.09 ‐
1997 292,421 801 1,563 Aug 12 1.95 ‐
1998 329,371 902 1,551 July 28 1.72 ‐
1999 286,666 774 1,530 June 11 1.98 ‐
2000 ‐ ‐ 1,578 Aug 15 n/a ‐
2001 ‐ 2002 ‐ ‐ ‐ ‐ ‐ ‐
2003 287,983 789 ‐ ‐ ‐ ‐
2004 277,804 759 ‐ ‐ ‐ ‐
2005 269,840 739 ‐ ‐ ‐ ‐
2006 278,737 764 ‐ ‐ ‐ ‐
2007 275,844 756 ‐ ‐ ‐ ‐
2008 279,628 764 ‐ ‐ ‐ ‐
2009 283,078 776 ‐ ‐ ‐ ‐
2010 256,568 703 ‐ ‐ ‐ ‐
2011 243,380 667 1,263 Sept 11 1.89 1,060 July 1 – 7
2012 243,025 664 1,351 July 14 2.03 1,105 July 8 – 14
2013 242,420 664 1,232 July 28 1.85 1,114 July 24 – 30
2014 250,929 687 1,421 July 14 2.07 1,227 July 12 – 18
2015 242,205 664 1,273 June 15 1.92 1,136 June 9 – 15
2016 241,522 660 1,192 July 28 1.81 1,088 Aug 14 ‐ 20
5 Yr Ave (2012 – 2016)
244,000 670 1,295 1.93 1,135
Notes: * Sum of upper pressure zone + lower pressure zone bulk water meter readings.
‐ Data not provided in a format that was practical to determine the per day use.
Figure 3 presents the total annual, average day, maximum day, and maximum week demands from 1996 to 2016. The BCStats population estimate on Figure 3 is for the entire DoL. The population that is serviced by the municipal water system is less than this as not all properties in the DoL are connected to the municipal water system. Properties that are not connected are serviced by their own private wells.
FIGURE 3
329,371
283,078
250,929 241,522
854
801 902
774
789
759
739
764
756
764
776
703
667
664
664
687
664
660
July 12 ‐1,783 m
3
Aug 12
‐1,56
3 m
3
July 28‐1,55
1 m
3
June
11 ‐1,53
0 m
3
Aug 15
‐1,57
8 m
3
Sep 11
‐1,26
3 m
3
July14
‐1,35
1 m
3
July 28‐1,23
2 m
3
July 14 ‐1,421 m
3
June
15 ‐1
,273
m3
July 27‐1
,192
m3
0
250
500
750
1,000
1,250
1,500
1,750
2,000
2,250
2,500
2,750
3,000
3,250
3,500
3,750
4,000
0
25,000
50,000
75,000
100,000
125,000
150,000
175,000
200,000
225,000
250,000
275,000
300,000
325,000
350,000
375,000
400,000
1996 1997 1998 1999 2000 2001 2002 2003 2004 2005 2006 2007 2008 2009 2010 2011 2012 2013 2014 2015 2016
Average Day & M
axim
um Day Dem
and (m
3/da
y) & Ann
ual Pop
ulation
Annu
al Dem
and, m
3District of Lantzville
Demands (Annual, Ave Day, Max Day) & Population 1996 ‐ 2016
Annual Demand Average Day Maximum Day Stats BC Population Estimate
Note:Population estimate is for the entire District of Lantzville . This includes residents that are not connected to the municipal water system
Page 7 of 18 Water Demand Design Standard Review, 2017 Jul 6, 2017
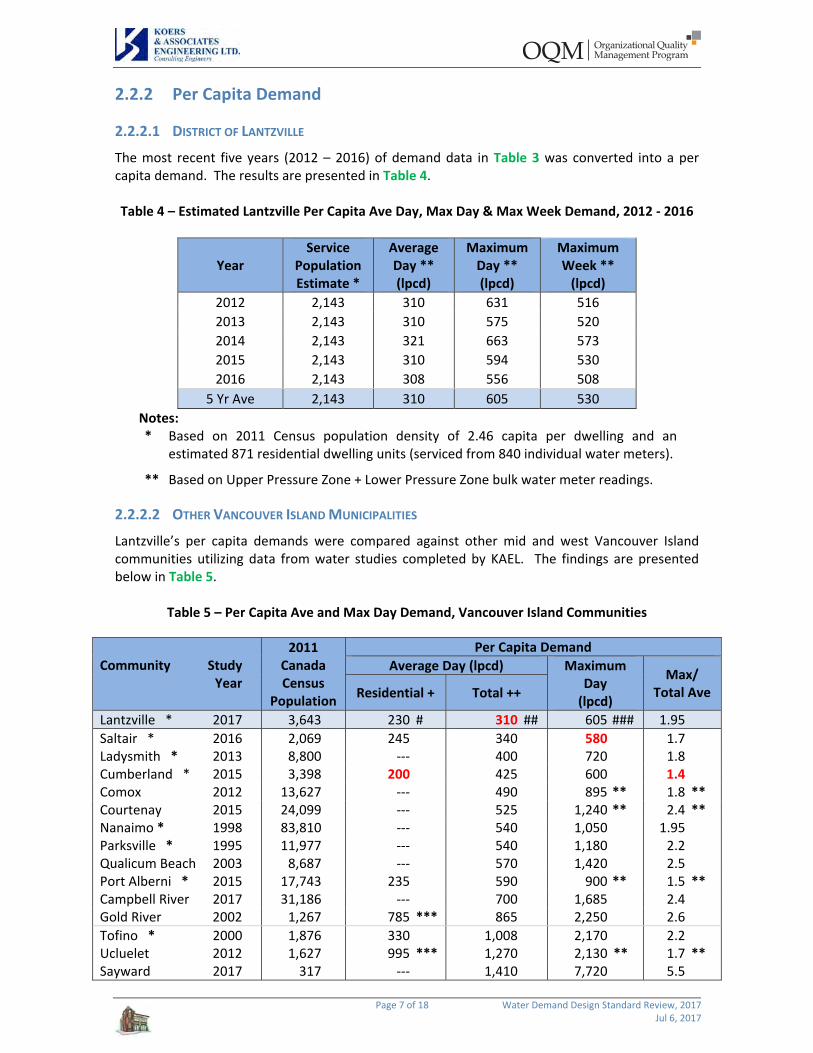
2.2.2 Per Capita Demand
2.2.2.1 DISTRICT OF LANTZVILLE
The most recent five years (2012 – 2016) of demand data in Table 3 was converted into a per capita demand. The results are presented in Table 4. Table 4 – Estimated Lantzville Per Capita Ave Day, Max Day & Max Week Demand, 2012 ‐ 2016
Year Service
Population Estimate *
Average Day ** (lpcd)
Maximum Day ** (lpcd)
Maximum Week ** (lpcd)
2012 2,143 310 631 516
2013 2,143 310 575 520
2014 2,143 321 663 573
2015 2,143 310 594 530
2016 2,143 308 556 508
5 Yr Ave 2,143 310 605 530
Notes: * Based on 2011 Census population density of 2.46 capita per dwelling and an
estimated 871 residential dwelling units (serviced from 840 individual water meters).
** Based on Upper Pressure Zone + Lower Pressure Zone bulk water meter readings.
2.2.2.2 OTHER VANCOUVER ISLAND MUNICIPALITIES
Lantzville’s per capita demands were compared against other mid and west Vancouver Island communities utilizing data from water studies completed by KAEL. The findings are presented below in Table 5.
Table 5 – Per Capita Ave and Max Day Demand, Vancouver Island Communities
Community Study Year
2011 Canada Census
Population
Per Capita Demand
Average Day (lpcd) Maximum Day (lpcd)
Max/ Total Ave Residential + Total ++
Lantzville * 2017 3,643 230 # 310 ## 605 ### 1.95
Saltair * 2016 2,069 245 340 580 1.7 Ladysmith * 2013 8,800 ‐‐‐ 400 720 1.8 Cumberland * 2015 3,398 200 425 600 1.4 Comox 2012 13,627 ‐‐‐ 490 895 ** 1.8 ** Courtenay 2015 24,099 ‐‐‐ 525 1,240 ** 2.4 ** Nanaimo * 1998 83,810 ‐‐‐ 540 1,050 1.95 Parksville * 1995 11,977 ‐‐‐ 540 1,180 2.2 Qualicum Beach 2003 8,687 ‐‐‐ 570 1,420 2.5 Port Alberni * 2015 17,743 235 590 900 ** 1.5 ** Campbell River 2017 31,186 ‐‐‐ 700 1,685 2.4 Gold River 2002 1,267 785 *** 865 2,250 2.6
Tofino * 2000 1,876 330 1,008 2,170 2.2 Ucluelet 2012 1,627 995 *** 1,270 2,130 ** 1.7 ** Sayward 2017 317 ‐‐‐ 1,410 7,720 5.5
Page 8 of 18 Water Demand Design Standard Review, 2017 Jul 6, 2017
Ave (excluding: Tofino,
Ucluelet and Sayward) & ‐‐‐ ‐‐‐ 540 1,175 2.2
Notes: Numbers in bold red lettering indicate lowest value for that column.
+ Residential average day per capita demands are calculated as the annual sum of all residential metered demands divided by the estimated service population, except where noted otherwise.
++ Total Average Day per capita demands are calculated as the total demand of the entire water system divided by the estimated service population.
* Indicates municipalities which meter both residential and commercial properties.
** Calculated by taking the maximum month demand and dividing by the number of days in the month as the daily demand data was not available. Actual maximum day demand and the resulting peaking ratio would be higher.
*** These are non‐metered demand values calculated as the difference between system demand and the commercial/industrial metered demands. As such, they are not solely residential demand but include all system water use excluding commercial/industrial use.
# Based on individual metering data for 2016. Value is sum of individual residential meters (182,429 m3) divided by an estimated service population of 2,143.
## Based on total system metering demand (upper pressure zone + lower pressure zone bulk water meter readings) for 2016. Value is total system demand (241,522 m3) divided by estimated service population of 2,143.
### Based on total system maximum day demand (upper pressure zone + lower pressure zone bulk water meter readings) of 1,192 m3 (July 28, 2016) divided by an estimated service population of 2,143.
& Tofino is not included because of the influence of the water demands from the large tourism population. Ucluelet is not included because of the influence of water demands by the fish processing plants. Sayward is not included due to the large influence of the water demands from the logging dry land sort.
It is noted that the DoL’s per capita demands are the lowest of the 15 municipalities reviewed. It is also noted that they are more than 40% lower than the City of Nanaimo, with whom they share a municipal boundary, and the City of Parksville, its closest neighbour to the west/north. It is believed the awareness of the Lantzville residents and businesses of:
the historical perception of limited capacity of the wellfield,
the requirement that new development secure their own water supply sources, and
the inclining block pricing (Bylaw No. 85)
are factors contributing to the low per capita demand. It is also noted that residential water usage tends to be higher in other Island municipalities where water demand is not metered.

Page 9 of 18 Water Demand Design Standard Review, 2017 Jul 6, 2017
2.3 Demands by Land Use
2.3.1 District of Lantzville
The annual demand, demand per connection, and percent demand per land‐use category for the past five years along with the 5 year average are presented in Table 6.
Table 6 – Annual Demand by Land‐Use, 2010 ‐ 2016
Description Land‐Use Category Total
Individual Meters
Comm‐ ercial
Com/ Res
Public Use
Industrial Other Res.
Residential
Number of Meters
14 5 8 18 17 823 885 TotalSystem
Demand #
(m3) Annual Total of Individual Meter Demands
(m3)
2010 7,818 * 13,007 3,375 3,103 6,834 181,840 215,977 256,568
2011 6,195 2,893 3,835 2,781 7,469 175,460 198,633 243,380
2012 7,318 3,144 4,454 2,539 6,892 179,066 203,413 243,025
2013 7,220 3,639 4,482 2,715 6,468 170,524 195,048 242,420
2014 7,101 3,640 5,190 2,312 5,785 172,057 196,085 250,929
2015 5,564 4,019 1,936 3,229 4,730 149,826 169,304 242,205
2016 7,024 4,388 ** 15,811 3,287 5,298 182,429 218,237 241,522
5 Yr Ave (2012 – 2016)
6,845 3,766 ** 4,375 2,816 5,835 170,780 196,417 244,000
% of Total System Demand
3 % 2 % 2 % 1 % 2 % 70 % 80 % 100%
Average Demand Per Lot (m3/Lot)
5 Yr Ave (2012 – 2016)
489 753 ** 547 156 343 208 222 276
Notes:
# Total system demand is the sum of the upper pressure zone + lower pressure zone bulk meters.
* A review of the 2010 data revealed an excessively high demand (10,340 m3) occurred in the second quarter at a single connection (6690 Dickinson Road) compared to the 202 to 534 m3 for the same period in other years. The cause of the high demand could not be determined.
** A water leak was reported in March 2016 for the Royal Canadian Legion (7225 Lantzville Road). The Legion’s demand for this quarter in 2016 was 10,174 m3 compared to the 108 m3 in 2015 and 135 m3 in 2014. The five year average demand per connection is based on the exclusion of 10,000 m3 from the first quarter of 2016 for the Legion.
The data in Table 6 reveals that residential demands dominate system demand. Although the non‐residential use is higher on a per connection basis, these properties have less influence on the overall system demands since they are much fewer in number. The total system demand is higher
Page 10 of 18 Water Demand Design Standard Review, 2017 Jul 6, 2017
than the sum of the individual meters because it includes the non‐revenue water usage in shown in Table 2, Figure 2, and discussed under 2.1.3 Revenue & Non‐Revenue Water Demand
2.3.1.1 LANTZVILLE RESIDENTIAL DEMAND BY LOCATION & LOT SIZE
A comparison of residential demand by location and lot size was carried out to assess if demands vary by these parameters. Four groups were reviewed:
Waterfront lots (approx. +/‐ 0.45 ha)
Waterfront lots (approx. +/‐ 0.12 ha)
Upper Pressure Zone lots (approx. +/‐ 0.12 ha)
Lower Pressure Zone lots (approx. +/‐ 0.1 ha)
All residential lots (varying sizes)
The quarterly and annual demands from 2010 to 2014 (five years) were analysed for average, median, maximum, and minimum demands for each of the four groups. The analyses indicated a general correlation between increasing demand with increasing lot size. The location of a similar sized lot (waterfront vs non‐waterfront) did not reveal a significant difference on water demand. For all five groups, the lowest quarterly demand occurred in the 1st quarter (Jan – Mar) and the highest quarterly demand occurred in the 3rd quarter (June – Sept). The average annual demand for each group is presented in Table 7.
Table 7 – Lantzville Residential Water Demands vs Lot Size, 2010 ‐ 2014
Group Location
Lot Size
Numberof Lots
Annual Demand *
With Inclusion of Non‐Revenue Water
Annual Demand **
Average Day Per Capita ***
(ha) (#) (m3/year per Lot)
(m3/year Per Lot)
(lpcd)
Waterfront 0.45 48 251 310 340
Waterfront 0.12 20 202 245 275
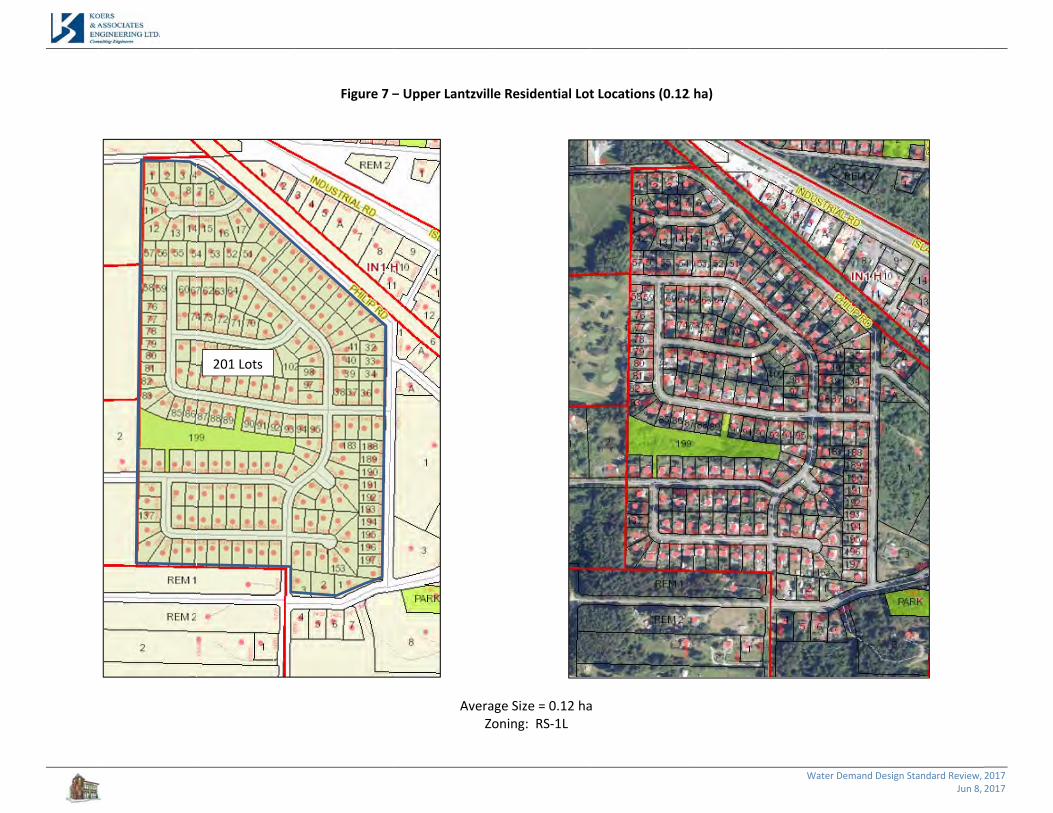
Upper Lantzville 0.12 201 209 255 285
Lower Lantzville 0.10 160 196 240 270
All of Lantzville varies 823 214 260 290
Notes:
* Total of the individual meters divided by the number of meters for the 5 year average of 2010 – 2014.
** Includes allowance for the volume of non‐revenue water within the water system. For the 5 year average of 2010 – 2014, this equates to 22.5% of the total of all the individual water meters (247,300 m3 ÷ 201,800 m3 = 1.225).
*** Based on the five year average of 365.2 days/year and a population density of 2.46 capita per dwelling unit.
A graph of the average and median quarterly and annual demand for each category based on the five years of 2010 to 2014 is shown in Figure 4. The location of each lot for each group (excluding the "all of Lantzville" group) is shown in Figure 5, Figure 6, Figure 7 and Figure 8.
FIGURE 4
50 51
96
54
251
33
51
76
41
202
40 47
77
45
209
42 45
64
45
196
41 48
79
46
214
36 44
74
42
214
29 45
57
40
183
37 41
65
41
193
38 41
58
39
185
36 42
62
40
189
0
50
100
150
200
250
300
0
50
100
150
200
250
300
Jan ‐ Mar Apr ‐ Jun Jul ‐ Sep Oct ‐ Dec
Q1 Q2 Q3 Q4 Annual Total
Total D
eman
d Pe
r Lot (m
3 /Lot)
Total D
eman
d Pe
r Lot (m
3 /lot)
District of LantzvilleWater Demand Per Lot, Varying Residential Lot Size
5 Year Ave (2010 ‐ 2014)
48 Waterfront Properties (Ave = 0.45 ha)
20 Waterfront Properties (Ave = 0.12 ha)
201 Upper Lantzville Properties (Ave = 0.12 ha)
160 Lower Lantzville Properties (Ave = 0.1 ha)
823 Properties, All Lantzville (Varies)
Waterfront Median (0.45 ha)
Waterfront Median (0.12 ha)
Upper Lantzville Median (0.12 ha)
Lower Lantzville Median (0.1 ha)
All Lantzville Median (varies)

15 Lots
4 Lots
Figure
s
5 – Waterfront R
AveZ
5
Residential Lot Lo
e Size = 0.45 ha oning: RS‐1L
15 Lots
ocations (0.45 ha
6 Lots Lot
a)
s3 Lots
Water Demand De
14 Lo
esign Standard Review, Jun 8,
ots
2017 2017
Figure 6 – Waterfront R
AveZ
Residential Lot Lo
e Size = 0.12 ha. oning: RS‐1L
20 Lots
ocations (0.12 haa)
Water Demand De
esign Standard Review, Jun 8,
2017 2017
201 Lots
Figure 7 –– Upper Lantzvill
AveraZ
le Residential Lot
age Size = 0.12 haoning: RS‐1L
t Locations (0.12
a
2 ha)
Water Demand Deesign Standard Review, Jun 8,
2017 2017

Figure 8 – Lower Lantzvil
AveraZ
lle Residential Lo
age Size = 0.1 haoning: RS‐1L
160 Lots
ot Locations (0.1 ha)
Water Demand De
esign Standard Review, Jun 8,
2017 2017
Page 11 of 18 Water Demand Design Standard Review, 2017 Jul 6, 2017
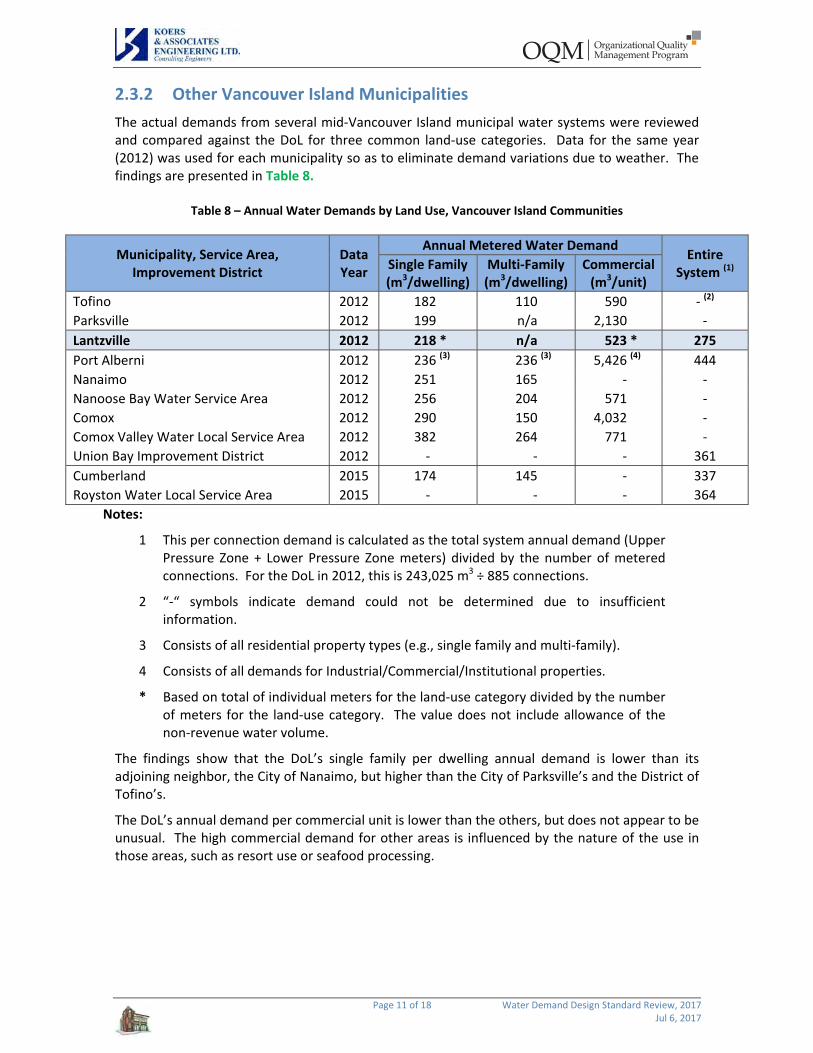
2.3.2 Other Vancouver Island Municipalities
The actual demands from several mid‐Vancouver Island municipal water systems were reviewed and compared against the DoL for three common land‐use categories. Data for the same year (2012) was used for each municipality so as to eliminate demand variations due to weather. The findings are presented in Table 8.
Table 8 – Annual Water Demands by Land Use, Vancouver Island Communities
Municipality, Service Area, Improvement District
Data Year
Annual Metered Water Demand Entire
System (1) Single Family (m3/dwelling)
Multi‐Family (m3/dwelling)
Commercial(m3/unit)
Tofino 2012 182 110 590 ‐ (2)
Parksville 2012 199 n/a 2,130 ‐
Lantzville 2012 218 * n/a 523 * 275
Port Alberni 2012 236 (3) 236 (3) 5,426 (4) 444
Nanaimo 2012 251 165 ‐ ‐
Nanoose Bay Water Service Area 2012 256 204 571 ‐
Comox 2012 290 150 4,032 ‐
Comox Valley Water Local Service Area 2012 382 264 771 ‐
Union Bay Improvement District 2012 ‐ ‐ ‐ 361
Cumberland 2015 174 145 ‐ 337
Royston Water Local Service Area 2015 ‐ ‐ ‐ 364
Notes:
1 This per connection demand is calculated as the total system annual demand (Upper Pressure Zone + Lower Pressure Zone meters) divided by the number of metered connections. For the DoL in 2012, this is 243,025 m3 ÷ 885 connections.
2 “‐“ symbols indicate demand could not be determined due to insufficient information.
3 Consists of all residential property types (e.g., single family and multi‐family).
4 Consists of all demands for Industrial/Commercial/Institutional properties.
* Based on total of individual meters for the land‐use category divided by the number of meters for the land‐use category. The value does not include allowance of the non‐revenue water volume.
The findings show that the DoL’s single family per dwelling annual demand is lower than its adjoining neighbor, the City of Nanaimo, but higher than the City of Parksville’s and the District of Tofino’s.
The DoL’s annual demand per commercial unit is lower than the others, but does not appear to be unusual. The high commercial demand for other areas is influenced by the nature of the use in those areas, such as resort use or seafood processing.

Page 12 of 18 Water Demand Design Standard Review, 2017 Jul 6, 2017
3 DESIGN DEMANDS
3.1 Current Design Demand Standards
3.1.1 District of Lantzville (DoL)
The DoL Subdivision and Development Bylaw No. 55, 2005 governs the design of water supply and distribution systems. The bylaw requires all new properties within the OCP water service area to connect to the municipal water system. If they are not able, each lot must be provided 3.4 m3/day (0.5 igpm) of potable water from a well. The bylaw does not provide a design standard for properties connecting to the municipal system.
3.1.2 Other Vancouver Island Municipalities
Water demand design standards for several municipalities on the east coast of mid‐Vancouver Island were compared to the DoL standards and are presented in Table 9.
Table 9 – Per Capita Design Standards, Mid Vancouver Island Municipalities
Municipality
Per Capita Design Standards
Average Day (lpcd)
Maximum Day (lpcd)
Max/Ave Ratio
Peak Hour (lpcd)
MMCD *
‐ with meters 300 600 2 900
‐ without meters 450 900 2 1,350
Nanaimo 455 1,135 2.5 1,820
Parksville 570 1,364 2.4 1,700
Lantzville ‐ 1,380 ** ‐ ‐
Qualicum Beach ‐ 1,780 ‐ 3,150 ***
Courtenay 635 2,100 3.3 3,000
Comox 635 2,100 3.3 3,000
Campbell River 635 2,100 3.3 3,000
RDN (Nanoose / Fairwinds) # Capita per
Residential Dwelling
- Single Family (detached) ‐ 1,168 2.2 ‐
- Townhouse ‐ 914 1.9 ‐
- Apartment/Condo unit ‐ 424 1.4 ‐
- Secondary Suite ‐ 424 1.1 ‐
- Seniors Living unit ‐ 424 1.1 ‐
Commercial
(l per 100 m2)
##
- Retail ‐ 520 ‐ ‐
- Fitness Centre ‐ 530 ‐ ‐
- Office ‐ 690 ‐ ‐
- Restaurant, Pub ‐ 3,800 ‐ ‐
Notes:

Page 13 of 18 Water Demand Design Standard Review, 2017 Jul 6, 2017
* Master Municipal Construction Document, Design Guideline Manual, 2014. MMCD recommends the use of these metered and non‐metered guideline
values only if there are no reliable water consumption records and/or specific municipal requirements. It further states that because maximum day and peak hour demands increase significantly in dry climate areas due to irrigation, the criteria should be adjusted accordingly, based on local water consumption records.
** Based on Lantzville Bylaw 55.1 requirement of 3.4 m3/day potable water source for a lot not connected to the municipal water supply system. Per capita demand is based on the 2011 Census density of 2.46 capita/dwelling units (3,400 L/day per dwelling ÷ 2.46 capita/dwelling).
*** Based on Qualicum Beach Engineering Standard & Specifications Bylaw No. 545 design of 6.05 m3/day for single family dwelling, duplex. Per capita demand is based on 2011 Census density of 1.92 capita/dwelling unit (6,050 ÷ 1.92).
# From Regional District of Nanaimo Bylaw No. 500.388, 2013, Schedule 4C1, 2013 Lakes District and Schooner Cove Community Water System Standards. These water demand design standards were developed using the BC Government’s 2012 Design Guidelines for Rural Residential Community Water Systems. The BC Government design guidelines calculate max day demand based on the formula:
Max Day = Indoor Usage + Water Loss Allowance + Irrigation Demand – Conservation Incentives.
## Per 100 m2 of leasable floor space.
3.2 Proposed Land‐Use Based Demand Standards
3.2.1 Residential
In order to assess a revised standard, a comparison to other local municipalities was applied. When considering which other jurisdictions to consider, features such as similarity in climatic conditions and population behaviour were considered. Since Nanoose, Parksville, and Nanaimo are the DoL’s closest neighbours, and usage patterns and behaviours could be considered familiar (many people work, visit or shop in their neighbouring communities on a regular basis), a numerical comparison between the various standards was undertaken. In addition, now that the DoL expects to have the ability to obtain water from the City of Nanaimo, as the interconnection main along Lantzville Road is currently being constructed, a comparison against Nanaimo standards was still deemed to be prudent. Table 10 presents a comparison of:
DoL’s current design standards,
Proposed residential design standard
Design standards for the three neighbouring communities noted below are shown in Table 9,
- City of Nanaimo (CoN),
- City of Parksville (CoP),
- Regional District of Nanaimo, Nanoose / Fairwinds area, and

Table 10 ‐ Proposed Residential Water Demand Design Standards Date:
File:
Existing
Lantzville Lantzville
Design Standard
Min. Dwellings Pop Pop
Residential Lot Per Lot Density Density
Land‐Use Size (Average) (capita (capita
(m2) (#) per unit) (l/cap) (l/con) per unit) (l/cap) (l/cap) (l/con) (l/con)
Single Family
1/4 acre 1,000 1 2.4 1,382 3,400 2.4 510 1,150 1,250 2,800
1/3 acre 1,300 1 2.4 1,382 3,400 2.4 515 1,175 1,250 2,850
1/2 acre 2,000 1 2.4 1,382 3,400 2.4 530 1,200 1,300 2,900
1 acre 4,000 1 2.4 1,382 3,400 2.4 555 1,250 1,350 3,000
Multi‐Family
1 storey/Prefab 10,000 24 1.9 1.9 400 900 TBD ‐ based on number of units
2 storey 10,000 36 1.9 1.9 400 900 TBD ‐ based on number of units
Townhouse
3 ‐ 4 storey 6,500 60 1.9 1.9 400 900 TBD ‐ based on number of units
Apartment / Condominium
3 ‐ 4 storey (Assist Living) 6,500 120 1.2 1.2 400 900 TBD ‐ based on number of units
Seniors Living
Ave Day
(rounded)
Max Day
(rounded)
Max Day
(rounded)
Max
Day
Max
Day
Ave Day
(rounded)
July 6th, 2017
1644
Design Standard
PROPOSED
District of Lantzville
Water Demand Design Standard Review, 2017 Update
Page 14 of 18 Water Demand Design Standard Review, 2017 Jul 6, 2017
The proposed land‐use categories, minimum lot size, and population density per unit are from the proposed update to the DoL’s OCP. The proposed water demands have been developed with allowances for indoor and outdoor water use. Indoor demand allowances are generally constant across most residential land‐use categories. Outdoor water demand allowances generally vary based on the lot size and the percentage of the lot that could be greenspace which is based on typical land‐use/zoning lot coverage percentages. The proposed residential demands decrease as the greenspace area decreases and the dwelling unit density increases.
3.2.2 Non‐Residential (Institutional/Commercial/Industrial)
The DoL does have metering data from the relatively small number of non‐residential properties (as shown in Table 6). The types of businesses and activities that can take place within Institutional, Commercial, and Industrial (ICI) development vary widely, as do the required water demands and resulting sewage flows. For example, water demands are significantly different between the following activities:
Institutional – school, church, public works yard
Commercial – brew pub, restaurant, business office, retail store
Industrial – food processing business, engine repair, mobile home manufacturing
The wide range of existing water demands for the properties within each of these categories within the DoL is graphically shown in Figure 9. Because of the variability of potential water demands, each ICI development should be assessed independently with a detailed assessment of the average and maximum day water demands based on the proposed development. Establishing standard ICI design demands for the DoL does not seem practical for the potential small number of ICI developments and the broad range of activities associated for each zone. These areas should be evaluated on a case‐by‐case basis, as a ‘one‐size fits all’ approach may not be an effective approach for the DoL.
3.2.3 Peak Hour
The DoL does not have a peak hour demand design standard. Peak hour demand is used to assess the ability of the water distribution system to maintain an adequate (minimum 275 kPa {40 psi}) pressure to all customers during heavy demand conditions. There are areas within the DoL that currently do not meet the minimum residual pressure during maximum day demands, and a more conservative value is warranted. Adopting a standard consistent with the City of Nanaimo standard of four times the average day flow is recommended.
3.2.4 System Redundancy
3.2.4.1 WATER SUPPLY SOURCE
It is noted that other neighbouring communities that rely on groundwater well systems have back up water sources that can be utilized during heavy demand periods, which helps mitigate system risk if issues arise with their groundwater wells. If the DoL is considering lowering its standard to be more in line with its neighbours, then strong consideration must be given to developing a secondary source of water to provide a suitable backup that can be utilized in emergency
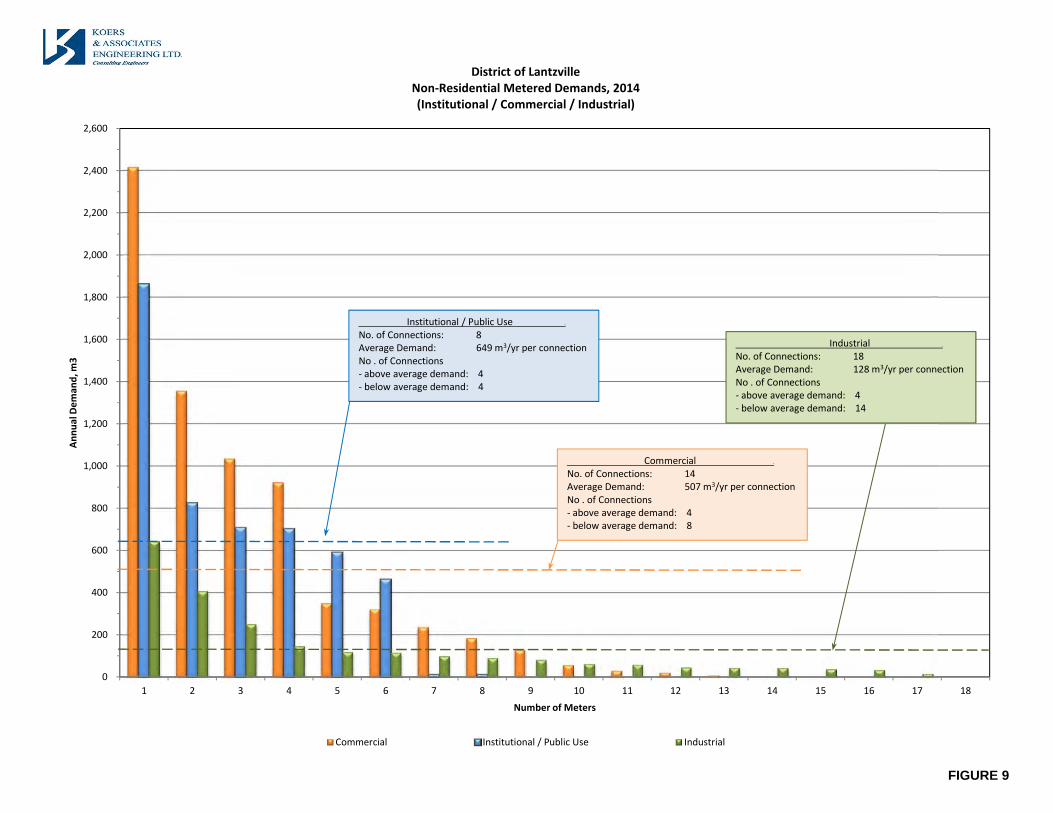
FIGURE 9
0
200
400
600
800
1,000
1,200
1,400
1,600
1,800
2,000
2,200
2,400
2,600
1 2 3 4 5 6 7 8 9 10 11 12 13 14 15 16 17 18
Annu
al Dem
and, m
3
Number of Meters
District of LantzvilleNon‐Residential Metered Demands, 2014(Institutional / Commercial / Industrial)
Commercial Institutional / Public Use Industrial
Institutional / Public Use .
No. of Connections: 8Average Demand: 649 m3/yr per connectionNo . of Connections‐ above average demand: 4‐ below average demand: 4
Commercial .
No. of Connections: 14Average Demand: 507 m3/yr per connectionNo . of Connections‐ above average demand: 4‐ below average demand: 8
Industrial .
No. of Connections: 18Average Demand: 128 m3/yr per connectionNo . of Connections‐ above average demand: 4‐ below average demand: 14
Page 15 of 18 Water Demand Design Standard Review, 2017 Jul 6, 2017
situations. The recent connection to the City of Nanaimo water system could provide a much needed alternate source in the event the wellfield is not available.
3.2.4.2 WATER RESERVOIR STORAGE VOLUME
It should be noted that both the City of Nanaimo and the City of Parksville have more storage within their distribution systems, which tends to provide buffering during periods of heavy demands and potential fire flow scenarios. Before considering revisions to the demand standards it is strongly recommended that the DoL improve storage capacity within their system, especially within the upper zone as noted in the 2015 report. The improved storage would help supply the system demands during a significant fire event, and lessen the strain on the DoL’s well system, which are limited by a set pumping rate. Increasing the volume of water stored in the distribution system should be a priority and implemented before expanding the DoL’s water system to existing properties that are not yet serviced or before providing service to proposed new development. The July 2015 report also recommended an evaluation of fire flow demands within the system (also addressed in the recent FUS report), which could influence potential reservoir sizing and system balancing criteria.
3.3 Climate Change The “District of Lantzville Water Supply and Distribution Study, July 2015” (by KAEL) provided commentary on climate change and its potential impact on the DoL’s water system. As such, we recommend that the DoL continue to monitor and assess system performance on a yearly basis and note trends in both groundwater behaviour and system consumption so that adjustments can be made if trends in supply availability or in average and maximum day usage start to shift. Future trends may require to the DoL to reassess its standards and introduce restrictions.

Page 16 of 18 Water Demand Design Standard Review, 2017 Jul 6, 2017
4 CONCLUSIONS Based on the analysis in this report, the following conclusions are made.
1. Metering data shows that the DoL uses less water than outlined in its standard.
2. Comparison to consumption data in other jurisdictions indicates that the DoL uses less water on a per‐capita basis.
3. An analysis of the system data shows that approximately 20% of the total system demand
is for un‐billed, or non‐revenue water.
4. Residential use constitutes the largest percentage of water consumption within the DoL. 5. A comparison to standards in other local municipalities indicates that the DoL design
standards are not the highest nor are they the lowest.
6. Using standards from neighbouring communities, like the Nanoose Peninsula (Fairwinds), City of Nanaimo, and City of Parksville as a comparison is considered prudent, as these areas share similar climatic and resident behaviour patterns, especially if the DoL is considering a connection to the City of Nanaimo water system.
7. The system improvements to increase storage capacity that have been recommended in previous reports are considered necessary before additional properties (existing or new) are serviced by the DoL’s water system.
8. The development of a secondary, or redundant, water supply would be prudent and
consistent with other neighbouring water supply systems that have adopted lower demand standards.
9. If the design standards are adjusted, continued monitoring and assessment of system use will track overall trends and help the DoL when assessing future changes.
10. Prevailing science on climate change indicates that the local Vancouver Island region will
experience drier summers and wetter winters in the near future, and it would be prudent for the DoL to take these factors into consideration when developing their long range plans for infrastructure renewal and maintenance.
11. An analysis of the data indicates that larger lots tend to use more water on a per connections basis, most likely due to the increased use to irrigate the larger yards.
12. Based on the “smaller yard equals less water use per connection concept,” there appears
to be justification for a smaller per‐capita water demand design standard for multi‐family
dwellings, since the need to irrigate is smaller on a proportional basis ‐ i.e. less yard per
resident. However, available local data is limited further analysis would be needed to
present firmer recommendations.
Page 17 of 18 Water Demand Design Standard Review, 2017 Jul 6, 2017
5 RECOMMENDATIONS
Based on the findings in the report, it is recommended that the District of Lantzville:
1 Complete improvements to the DoL as noted in the July 2015 report, and confirm capacity
through additional testing and monitoring as recommended in the LHC report before
undertaking any revisions to the DoL’s design demand standards.
2 Increase reservoir storage within the DoL as recommended in the July 2015 report before
undertaking any revisions to the DoL’s design demand standards.
3 Consider implementing additional water supply sources, such as the City of Nanaimo
connection prior to adjusting the design standards.
4 Consider establishing the following range for water demand design standards for new
developments serviced by the DoL’s municipal water system as noted in Table 10, with higher
target demands for larger acreage properties, specifically:
Single Family Residential Average Day Demand: 510 litres per capita pd, or 1,100 to 1,300 litres per connection pd Maximum Day Demand: 1,220 litres per capita pd, or 2,800 to 3,000 litres per connection pd Peak Hour Demand: 2,000 litres per capita per day, or 4,800 litres per connection per day Multi‐Family Average Day Demand: 400 ‐ 450 litres per capita per day, Maximum Day Demand: 900 – 1,000 litres per capita per day
5 Proceed with any changes to the design standards on an incremental basis, and only after
improvements to the storage and supply system noted in recommendations 1, 2 and 3 are
successfully implemented.
6 Continue to monitor system demand patterns and assess system performance on a yearly
basis.
7 Continue to implement water conservation measures as they have shown to be effective in
managing system demands.
8 Review water system performance on a regular basis and be prepared to make adjustments
as conditions warrant. Continue to monitor ground water levels within the aquifer and track
long term trends.
Page 18 of 18 Water Demand Design Standard Review, 2017 Jul 6, 2017
9 Re‐rate the aquifer on a regular basis and be prepared to adjust standards if wellfield
performance or water levels drops, especially if per‐capita water use starts to increase.
10 Assess water demands for non‐residential development (ICI) at the time of development and
base design conditions on the proposed business/land‐use activity and general good
engineering best practises.
11 Keep abreast of ongoing climate change research and its potential impact on aquifer recharge
rates, especially when making infrastructure policy decisions.
12 Maintain Bylaw No. 55. for properties that are outside the water service boundary noted in the OCP, and are not connected to the DoL’s municipal water system, i.e., each new lot is provided with 3,400 L/day (0.5 igpm) of drinking water from a well (see Schedule C – Standards for Water Distribution Systems, Scope, Item 2).