Water Column Monitoring 2006 - Norsk olje og gass
236
© This document may only be reproduced with the permission of Akvamiljø a/s or the client. Akvamiljø a/s, Mekjarvik 12, 4070 Randaberg, Norway www.akvamiljo.no Water Column Monitoring 2006 Summary report Rolf C Sundt, Anders Ruus, Merete Grung, Daniela M Pampanin, Janina Baršienė, Halldóra Skarphéðinsdóttir Report AM 2006 / 013
-
Upload
khangminh22 -
Category
Documents
-
view
2 -
download
0
Transcript of Water Column Monitoring 2006 - Norsk olje og gass

© This document may only be reproduced with the permission of Akvamiljø a/s or the client. Akvamiljø a/s, Mekjarvik 12, 4070 Randaberg, Norway
www.akvamiljo.no
Water Column Monitoring 2006
Summary report
Rolf C Sundt, Anders Ruus, Merete Grung, Daniela M Pampanin, Janina Baršienė, Halldóra Skarphéðinsdóttir
Report AM 2006 / 013

© This document may only be reproduced with the permission of Akvamiljø a/s or the client. Akvamiljø a/s, Mekjarvik 12, 4070 Randaberg, Norway
www.akvamiljo.no
Water Column Monitoring 2006
Work note / Report AM - 2006/013
Project number: 695219 Project title: Water Column Monitoring 2006 Client(s): ConocoPhillips. on behalf of the OLF WCM coordination group
Distribution restriction: Confidential
Mekjarvik, 20.03.2007
Rolf C Sundt Project Leader
Jan Fredrik Børseth Project Quality Assurance(IRIS)
Atle Fiskå Manager
Akvamiljø a/s
IRIS & NIVA Water Column Monitoring 2006
Contents
List of symbols ..................................................................................................................... 6
1 INTRODUCTION................................................................................................................ 7
1.1 Objective ..................................................................................................................... 9 1.2 Description of methods ............................................................................................... 9
1.2.1 Sea temperature and salinity ........................................................................ 10 1.2.2 Sea current.................................................................................................... 10 1.2.3 Contamination control during transport ....................................................... 11 1.2.4 General biological observations ................................................................... 11 1.2.5 PAH-metabolites in fish bile ........................................................................ 11 1.2.6 AP metabolites in fish bile ........................................................................... 12 1.2.7 Hepatic GST................................................................................................. 12 1.2.8 CYP1A ......................................................................................................... 13 1.2.9 Vitellogenin.................................................................................................. 13 1.2.10 Zona radiata protein ..................................................................................... 13 1.2.11 DNA adducts ................................................................................................ 14 1.2.12 PAH body burden in mussel ........................................................................ 14 1.2.13 Benzo(a)pyrene hydroxylase activity........................................................... 15 1.2.14 Imunocompetance ........................................................................................ 15 1.2.15 Lysosomal membrane stability .................................................................... 15 1.2.16 Micronucleus formation ............................................................................... 15 1.2.17 Histology 16
2 MATERIAL AND METHODS.......................................................................................... 18
2.1 Sea temperature and salinity ..................................................................................... 19 2.2 Sea current................................................................................................................. 20 2.3 Contamination control during transport .................................................................... 20 2.4 General biological observations ................................................................................ 20 2.5 PAH-metabolites in fish bile ..................................................................................... 21
2.5.1 Fixed fluorescence ....................................................................................... 21 2.5.2 GC/MS ......................................................................................................... 21
2.6 AP metabolites in fish bile ........................................................................................ 22 2.7 Glutathion-S-transferase (GST) activity ................................................................... 22 2.8 Hepatic Cytochrome P450 1A................................................................................... 23 2.9 Vitellogenin............................................................................................................... 23 2.10 Zona Radiata Protein................................................................................................. 24
IRIS & NIVA Water Column Monitoring 2006
2.11 DNA adducts ............................................................................................................. 24 2.12 PAH body burden in mussel...................................................................................... 25 2.13 Benzo(a)pyrene hydroxylase activity........................................................................ 25 2.14 Imunocompetance ..................................................................................................... 26 2.15 Lysosomal membrane stability.................................................................................. 26 2.16 Micronucleus formation ............................................................................................ 27 2.17 Histology in mussels ................................................................................................. 28 2.18 Protein determination ................................................................................................ 29 2.19 Statistical methods..................................................................................................... 29
3 RESULTS........................................................................................................................... 30
3.1 Sea temperature and salinity measurements at Ekofisk ........................................... 30 3.2 Sea current................................................................................................................. 31 3.3 Contamination control during transport .................................................................... 32 3.4 General biological observations ................................................................................ 33 3.5 Cod - PAH-metabolites in bile .................................................................................. 37
3.5.1 PAH-metabolites by Fixed Fluorescence..................................................... 37 3.5.2 PAH-metabolites by GC/MS........................................................................ 39
3.6 AP metabolites in cod bile ........................................................................................ 41 3.7 Hepatic GST.............................................................................................................. 42 3.8 Hepatic Cytochrome P450 1A................................................................................... 43 3.9 Vitellogenin............................................................................................................... 44 3.10 Zona Radiata Protein................................................................................................. 45 3.11 DNA adducts ............................................................................................................. 46 3.12 PAH body burden in mussels .................................................................................... 47 3.13 Benzo(a)pyrene hydroxylase activity........................................................................ 60 3.14 Immunocompetance .................................................................................................. 60 3.15 Lysosomal membrane stability.................................................................................. 62 3.16 Micronucleus formation ............................................................................................ 63 3.17 Histology in mussels ................................................................................................. 64
4 DISCUSSION..................................................................................................................... 67
4.1 Tissue levels of PAHs in caged mussels ................................................................... 67 4.2 Effect responses in caged mussels ............................................................................ 67 4.3 PAH- and AP metabolites in cod bile ....................................................................... 68 4.4 Exposure and effect responses in caged cod ............................................................. 68 4.5 Preliminary ecological risk assessment based on lysosomal stability
in mussels. ................................................................................................................. 69
IRIS & NIVA Water Column Monitoring 2006
5 COMPARISON OF PAH BODY BURDEN WCM 1999 VS. 2006 ................................. 70
6 CONCLUSIONS AND RECOMMENDATIONS FOR FUTURE WCMS ...................... 73
7 REFERENCES ................................................................................................................... 76
8 APPENDIX LIST............................................................................................................... 85
8.1 Appendix A: Cruise report IRIS................................................................................ 85 8.2 Appendix B: Data report NIVA ................................................................................ 85 8.3 Appendix C: Data report IRIS................................................................................... 85 8.4 Appendix D: Data report ITM, University of Stockholm ........................................ 85 8.5 Appendix E: Data report – University of Vilnius ..................................................... 85 8.6 Appendix F: Data report – Battelle ........................................................................... 85

IRIS & NIVA Water Column Monitoring 2006
Summary The report presents results from the Water Column Monitoring 2006, carried out in collaboration between IRIS&Akvamiljø and NIVA, with sub-contractors. The objective of the survey was to assess the extent to which discharges from Ekofisk affect organisms living in the water column. The study was designed to monitor bio-accumulation and biomarker responses in organisms held in cages in the vicinity of the platform. The results from the survey show that caged organisms have been exposed to moderate levels of produced water components. Mussels accumulated PAHs, with levels following the expected gradient with distance from the discharge. Concentrations of PAH- and AP-metabolites in bile of caged cod were elevated suggesting moderate exposure levels. Biological responses that can be interpreted as moderate negative effects, were observed in organisms caged close to points of discharge There was clear signal from the biological responses for several of the methods employed. As expected in animals that were kept close to the discharge, moderate negative effects were observed. The ultimate health effects on the organisms are, however, unknown at this stage. A gradient with distance from the discharge was observed for both bioaccumulation of contaminants and biological effects.
Work participants IRIS: Rolf C Sundt, Lars Petter Myhre, Jan Fredrik Børseth, Daniela Pampanin, Kjell Birger Øysæd, Atle Nævdal, Emily Lyng.
NIVA: Merete Grung, Anders Ruus, Ketil Hylland, Eivind Farmen Finne, Christopher Harman, Kevin Thomas, Sigurd Øxnevad, Oscar Fogelberg, Anja Julie Nilsen, Tor Fredrik Holth, Åse Kristine Gudmundson Rogne, Åse Bakketun, Olav Bøyum.
IRIS & NIVA Water Column Monitoring 2006
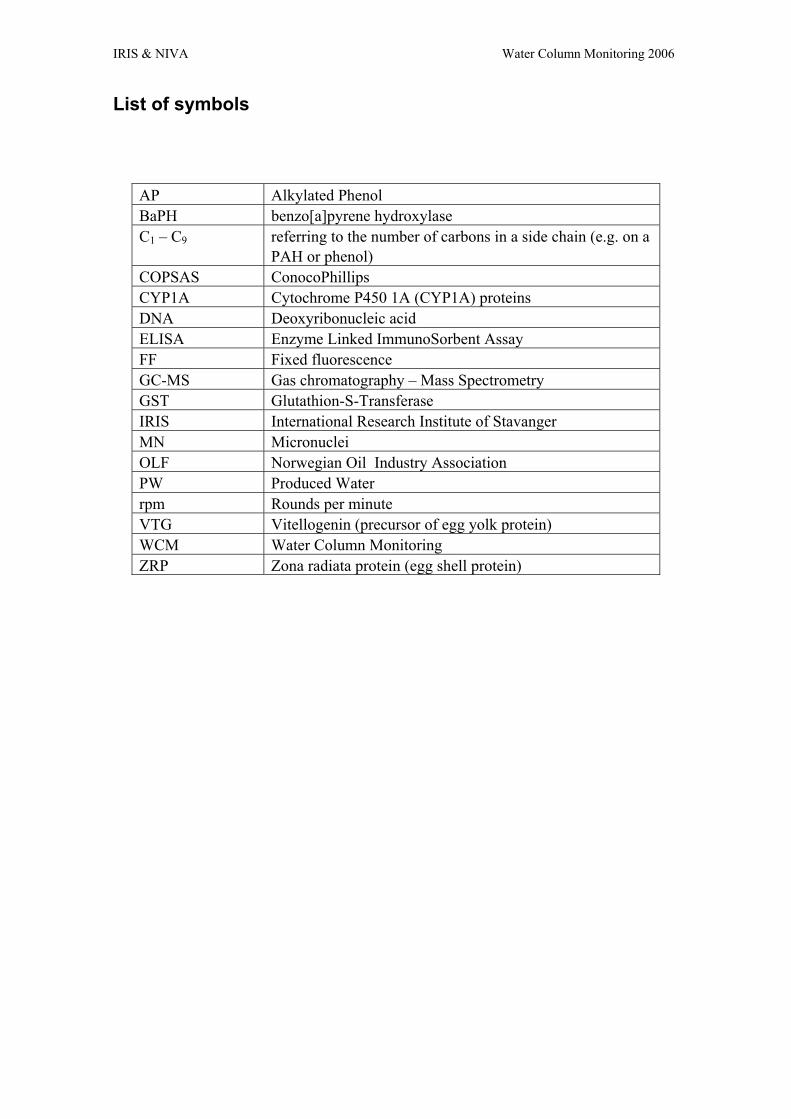
List of symbols
AP Alkylated Phenol BaPH benzo[a]pyrene hydroxylase C1 – C9 referring to the number of carbons in a side chain (e.g. on a
PAH or phenol) COPSAS ConocoPhillips CYP1A Cytochrome P450 1A (CYP1A) proteins DNA Deoxyribonucleic acid ELISA Enzyme Linked ImmunoSorbent Assay FF Fixed fluorescence GC-MS Gas chromatography – Mass Spectrometry GST Glutathion-S-Transferase IRIS International Research Institute of Stavanger MN Micronuclei OLF Norwegian Oil Industry Association PW Produced Water rpm Rounds per minute VTG Vitellogenin (precursor of egg yolk protein) WCM Water Column Monitoring ZRP Zona radiata protein (egg shell protein)

IRIS & NIVA Water Column Monitoring 2006
- 7 -
1 Introduction
The Water Column Monitoring (WCM) 2006 was carried out in collaboration between the Norwegian Institute for Water Research (NIVA) and IRIS&Akvamiljø, with several sub-contractors. The sub-contractors was Battelle (USA), the Institute of Applied Environmental Research at Stockholm University and the University of Vilnius.
Organisms living in the water column around offshore oil and gas production facilities are predominantly exposed to chemicals through discharge of production water (OLF 2000). The amount and composition of produced water (PW) varies from field to field (Røe 1998), but is generally a mixture of:
• Formation water contained naturally in the reservoir. • Injected water used for secondary oil recovery. • Treatment chemicals added during production.
Typically, produced water contains dissolved inorganic salts, minerals and heavy metals together with dissolved and dispersed oil components and other organic compounds. The specific chemical composition varies between reservoirs and within a reservoir as production proceeds. A target chemical characterisation of four offshore oil production platforms in the North Sea showed that the major organic components were BTEX (benzene, toluene, ethylbenzene and xylene), NPD (naphtalenes, phenanthrenes and dibenzothiophenes), PAHs (polyaromatic hydrocarbons), organic acids, alkylphenols (APs) and phenols (Røe and Johnsen 1996; Utvik 1999). As a natural consequence of well exploitation, oil content in the reservoirs will decrease and the need to inject water will increase, thus eventually leading to increase in the discharges of PW. Estimates shows that the total discharges of PW in the Norwegian sector of the North Sea will increase from approximately 130 million m3/year in 2002 to 180 million m3/year in 2011 followed by stabilisation and decrease in discharges (SFT 2004).
Some of the organic chemicals found in PW are relatively resistant to biodegradation, have a bioaccumulation potential and may be toxic to organisms in receiving waters (Brendehaug et al. 1992; Tollefsen et al. 1998; Taban and Børseth 2000; Aas et al. 2000a). This applies in particular to groups of chemicals such as alkylphenols (APs) and polycyclic aromatic hydrocarbons (PAHs) that are known to produce various toxic effects including reproductive disturbances, mutagenicity and carcinogenicity (Landahl et al. 1990; Bechmann 1999; Lye 2000; Meier et al. 2002). Studies from the ICES workshop “Biological effects of contaminants in the pelagic ecosystem (BECPELAG)” indicate that toxic compounds are detectable several kilometres away from a North Sea oil production platform using in vitro bioassays (Thomas et al. 2006; Tollefsen et al. 2006) and biomarkers (Balk et al. in press; Regoli et al. in press; Aas et al. 2006). Although there is reason to assume that many of the chemicals that are present in PW effluents may produce biological responses, the ability to assess the potential for
IRIS & NIVA Water Column Monitoring 2006
- 8 -
adverse effects are limited by the lack of sufficient in situ monitoring data using biological effects methods with endpoints reflecting long term (ecological) effects.
Biological indicators or markers (biomarkers) have been developed to measure the biological response related to an exposure to, or the toxic effect of, an environmental chemical (Peakall 1992). Some biomarkers are specific in terms of their ability to detect and assess the potential for effects through a specific toxic mechanism, whereas others give information about larger groups of chemicals with more diverse mechanisms of action. Common for all of the methods is the capability of performing time-integrating response assessment to complex mixtures over extended periods of time, which is often required in environmental monitoring. Since most of these methods are highly sensitive and responses occur at lower concentrations and/or prior in time to more adverse effects at a higher organisation level, the methods have become convenient early-warning tools for assessing the potential for long term (ecological) effects. The use of biomarkers in sentinel species or specific caging systems with keystone species has consequently facilitated the implementation of such methods in various environmental monitoring programs in freshwater, marine and estuarine areas. Care must be taken to avoid misuse of biomarker data in trials to extrapolate to ecologically relevant effects Forbes et al, 2006; Lam and Gray, 2003. Resent years, a combination of laboratory and field validation of the different biomarker and effects-based methods has greatly improved the knowledge of the potential and limitations of these methods and made it possible to link responses of biomarker signals to the potential for more adverse effects at the ecological level (Collier et al. 1992a; Elliot et al. 2003; Bechmann et al. in prep).

IRIS & NIVA Water Column Monitoring 2006
- 9 -
1.1 Objective The objective of the WCM survey 2006 was to assess the extent to which discharges from an oil production platform affect organisms living in the water column. To fulfil this objective, the survey was designed as described below (chapter 1.2).
Produced water discharges, which are the most pronounced contributor to pollution of the water column, contain polycyclic aromatic hydrocarbons (PAHs), alkylphenols, decalins, organic acids and a range of inorganic chemicals (Utvik, 1999). Some of the relevant chemicals are reported to produce biological responses in controlled laboratory experiments that may ultimately cause long term (ecological) effects. Controlled caging experiments using well documented species and methods of effect have been used as the best suited monitoring system to assess the extent of influence from oil or gas production platforms (SFT, 2003).
1.2 Description of methods This study was designed to monitor bioaccumulation and biomarker responses in organisms held in cages in the vicinity of the Ekofisk field. Six rigs were deployed along the expected current axis, from close to the discharge out to 2000 meters from the installations. Two rigs were regarded as reference, with the intention of sampling one (and have one as backup, see Figure 1). All rigs contained mussels while the two closest to the discharge and the two references also contained fish. All cages were deployed for 6 weeks.
Pre exposure samples were taken for both mussels and Atlantic cod for determination of pre-exposure levels of contaminants and biomarker responses.
Details regarding geographical positions for the deployment stations and CTD profile of the water column can be found in the cruise report (Appendix A). Distance from discharge is indicated in Table 1. The monitoring approach was based on experiences gained in previous water column monitoring surveys and from the BECPELAG workshop (Hylland et al. 2006).
Analyses of lysosomal stability and imunocompetance in mussel haemocytes were preformed of fresh material onboard the vessel. Al other analyses were performed in onshore laboratory.
IRIS & NIVA Water Column Monitoring 2006
- 10 -
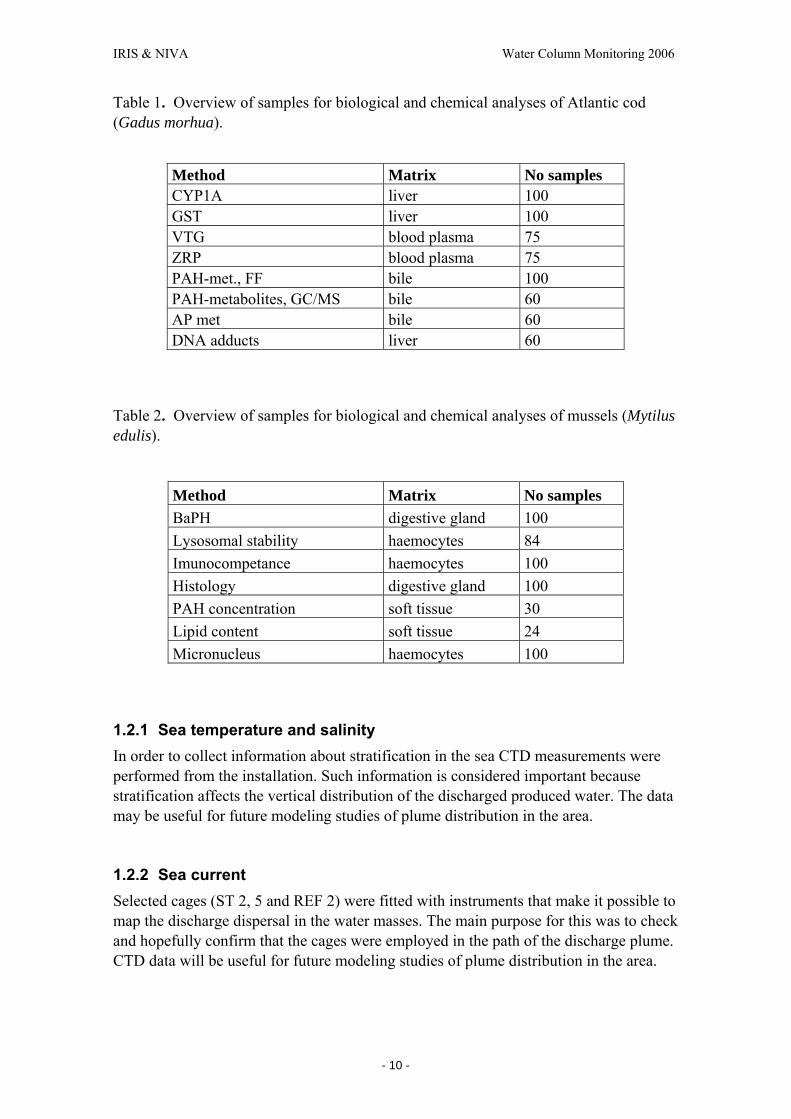
Table 1. Overview of samples for biological and chemical analyses of Atlantic cod (Gadus morhua).
Method Matrix No samples CYP1A liver 100 GST liver 100 VTG blood plasma 75 ZRP blood plasma 75 PAH-met., FF bile 100 PAH-metabolites, GC/MS bile 60 AP met bile 60 DNA adducts liver 60
Table 2. Overview of samples for biological and chemical analyses of mussels (Mytilus edulis).
1.2.1 Sea temperature and salinity In order to collect information about stratification in the sea CTD measurements were performed from the installation. Such information is considered important because stratification affects the vertical distribution of the discharged produced water. The data may be useful for future modeling studies of plume distribution in the area.
1.2.2 Sea current Selected cages (ST 2, 5 and REF 2) were fitted with instruments that make it possible to map the discharge dispersal in the water masses. The main purpose for this was to check and hopefully confirm that the cages were employed in the path of the discharge plume. CTD data will be useful for future modeling studies of plume distribution in the area.
Method Matrix No samples BaPH digestive gland 100 Lysosomal stability haemocytes 84 Imunocompetance haemocytes 100 Histology digestive gland 100 PAH concentration soft tissue 30 Lipid content soft tissue 24 Micronucleus haemocytes 100
IRIS & NIVA Water Column Monitoring 2006
- 11 -
1.2.3 Contamination control during transport To check that organisms were not exposed to petrogenic contamination during the transport, sea water samples from the transportation tanks were collected and analysed for PAHs by GCMS.
1.2.4 General biological observations General biological data as body length, weight and sex is usually recorded in environmental monitoring studies and is used in the interpretation of biomarker data. For the interpretation of biomarkers of reproductive disturbance such as vitellogenin (VTG), the information about sex is crucial for interpretation. A relationship between length and weight can be used as an estimate of the condition of the individual.
1.2.5 PAH-metabolites in fish bile The potential adverse effects of PAHs have resulted in many years of concentration monitoring in water, sediment and biota. However, the extensive bio-transformation of PAHs by fish greatly prevents the accumulation of these compounds in extra-hepatic tissues (Stein et al. 1987). Consequently, tissue levels of parent PAH do usually not provide an adequate assessment of the PAH exposure level (Varanasi 1989). The metabolites concentrate in the gall bladder of fish following bio-transformation. Analysis of PAH metabolites in the fish bile constitutes a very sensitive method for assessment of PAH exposure in laboratory and field studies (Beyer et al. 1998; Aas et al. 2001).
Fixed wavelength fluorescence
A characteristic feature of PAH compounds is their fluorescing properties. All PAH molecules absorb ultraviolet light followed by emission of light of a longer wavelength. This UV-fluorescence phenomenon occurs because PAH molecules contain delocalised electrons. The fluorescence properties, i.e. optimal excitation and emission wavelengths and signal intensity, varies between PAH compounds and is dependent on size, structure and eventual substituents on the molecule. Generally, the optimal excitation wavelength increases with increasing size of the PAH molecule (Vo-Dinh, 1978), i.e. smaller PAHs need more energy (shorter wavelength of the excitation light) than the larger molecules. This variability can be utilised in simple detection methods for PAHs like fixed wavelength fluorescence (FF) detection and synchronous fluorescence spectrography (SFS) (Aas et al. 2000). However, this direct method is not optimal for standardisation and quantification, and should be regarded a screening method. The metabolites measured with the direct method, are mainly conjugated hydroxy PAH compounds. Standards of these compounds are impossible or difficult and expensive to obtain. With the direct method, different PAH compounds, as well as other natural constituents of the bile, may show interfering fluorescence signals. This may reduce the sensitivity of the method. This is particularly critical when levels are low.
IRIS & NIVA Water Column Monitoring 2006
- 12 -
GCMS
For a more quantitiative and qualitative analysis of PAH metabolites high performance liquid chromatography with fluorescence detection (HPLC/F) or gas chromatography with mass spectrography in single ion mode detection (GC-MS SIM) can be applied (Collier et al. 1996; Hellou and Payne 1987). The GC-MS SIM is the best suited method for detection of PAH compounds containing 2 to 3 ring structures, namely the naphthalenes and phenanthrenes (Jonsson et al. 2003; Jonsson et al. 2004). Both alkylated and non alkylated compounds are detected.
1.2.6 AP metabolites in fish bile The alkylphenols (APs) is a group of chemicals which is relevant to discharges from the offshore oil industry. Produced water, which is released in large volumes from many platforms, includes significant levels of APs. As for PAHs the extensive bio-transformation of APs by fish greatly prevents the accumulation of these compounds in extra-hepatic tissues. Exposure studies with radiolabelled alkylphenols in fish shows that AP metabolites preferentially are excreted through the bile pathway (Sundt et al , Tollefsen et al 1998). The metabolites concentrate in the gall bladder of fish and specific metabolites of APs from bile can be quantitatively determined by GC/MS. The approach is similar to the detection of biliary PAH metabolites as a biomarker for exposure to polyaromatic hydrocarbons (Jonsson et al. in prep). For further details see Beyer and Bamber (2004).
1.2.7 Hepatic GST Glutathione S-transferase (GST) is a part of the organisms detoxification system and is evolutionary developed by organisms in order to convert lipophilic compounds into more hydrophilic and thereby more easily excretable metabolites. Excretion of compounds consists of two major types of reactions: phase I, which involves hydrolysis, oxidation and reduction, and phase II, which involves conjugation. Being one of the phase II reaction enzymes, GST catalyses conjugation of glutathione to compounds with electrophilic centres. The compounds may otherwise be harmful as they may react with macromolecules controlling cell growth, such as DNA, RNA and proteins. It is therefore of great importance that the animal is capable of neutralises and excrete these compounds. Changes in the activity of GST may reflect exposure to xenobiotics, and evidence suggests that the level of expression of GST is a crucial factor in determining the sensitivity of cells to a broad spectrum of toxic chemicals. It is also probable that GST are regulated by reactive oxygen species (ROS), and that this would represent an adaptive response within the cell to oxidative stress.

IRIS & NIVA Water Column Monitoring 2006
- 13 -
1.2.8 CYP1A The eucaryotic enzyme cytochrome P4501A (CYP1A), which belongs to the P450 gene superfamily, is a membrane-bound heme protein, located in the endoplasmic reticulum (microsomal fraction) of all examined vertebrates and carries out oxidation reactions related to xenobiotics bio-transformation. CYP1A is induced by certain xenobiotic pollutants and is therefore used as an environmental biomarker of the aquatic environment. Among the xenobiotics known to induce CYP1A are PAHs and PCBs. Immunochemical tools, Western and ELISA, have been used for estimating its relative levels in tissue preparations (Goksøyr 1991).
1.2.9 Vitellogenin In unexposed fish, the synthesis of vitellogenin (VTG) takes place in the liver of oviparous females under the stimulation of endogenous estradiol (Tata and Smith, 1979). Male and juvenile fish of most species, which only have low levels of circulating estrogens, do not produce appreciable levels of VTG. However, these fish exhibit considerable levels of hepatic estrogen receptors and the genetic machinery required for protein synthesis, and are thus capable of producing high levels of VTG when exposed to exogenous estrogens. Induction of this female typical protein in male and juvenile fish has therefore been widely used as a sensitive biomarker for exposure to xenoestrogens (Sumpter and Jobling, 1995). The use of VTG as a biomarker for xenoestrogens in ecologically relevant fish species has since then been employed for coastal and freshwater environmental monitoring (Hylland et al., 1998; Hylland et al., 1999) and for monitoring of areas that are effected by discharged from oil production activities (Scott et al., 2006). Recent studies with freshwater species such as zebrafish and rainbow trout suggest that induction of VTG occur at concentrations of xenoestrogens that also produce alteration in sexual development when exposed during sensitive windows of embryonal and larval development (Jobling et al., 1996; Örn et al., 2003)
1.2.10 Zona radiata protein Both the induction of vitellogenin (VTG) and zona radiata proteins (Zr-proteins) in male and juvenile oviparous vertebrates has been used as an effective and sensitive biomarker for exposure to xenoestrogens (Arukwe et al., 1997; Arukwe et al., 2000). Both VTG and Zr-proteins are synthesized in the liver in response to estrogen stimulation. They are secreted and transported in the blood to the ovary. There VTG is sequestered to form the yolk proteins that serve as nutrient reserve, while Zr-proteins form the eggshell that prevents polyspermy and provides mechanical protection for the developing embryo.
Although the measurements of VTG and Zr-protein levels in plasma have been established as rapid and sensitive assays for assessing the estrogenic potency of endocrine disruptors in both in vitro and in vivo studies (Sumpter and Jobling, 1995 and Arukwe et al., 1997), Zr-proteins have been suggested to be more sensitive than VTG at low dosage of xenoestrogens (Arukwe et al., 1997). In applying the Zr-proteins as
IRIS & NIVA Water Column Monitoring 2006
- 14 -
xenoestrogen biomarkers, it is important to minimize confounding factors, such as stress (Berg et al., 2004).
1.2.11 DNA adducts The detoxification of genotoxicants by the inducible cytochrome P450 mixed function oxygenase systems often results in the production of reactive chemical intermediates that are highly electrophilic and can covalently bind to the bases of DNA forming adducts. Thus, the presence of DNA adducts has been taken as evidence of exposure to specific genotoxicants. DNA adduct is formed when a non-DNA chemical, e.g. a carcinogenic pollutant chemical, binds covalently to the DNA (normally to the nitrogenous base guanine). Because of the sensitive and consistent responses of hepatic DNA adduct levels to the genotoxic forms of PAH, this parameter is considered to be a reliable biomarker of PAH effect and pro-mutagenic DNA lesions in fish. However, PAHs are not the only chemicals that may form DNA adducts, a range of other pollutant chemicals also does, and even endogenous substances. But the stability of the adduct, i.e. the resistance to DNA repair mechanisms, is important. Carcinogenic PAHs form stable DNA adducts after being bio-activated in the cell. And since PAHs are common pollutants in many aquatic recipients, this pollutant class has received much attention. In addition to their use as a biomarker for (exposure and) effect of genotoxins, DNA adducts may provide information about the biological effect and potential risk of a chemical, since it has been suggested that any chemical that forms stable pro-mutagenic DNA adducts, even at very low levels, should be considered to have mutagenic and carcinogenic potential. In fish DNA adducts are most often measured in the liver, since this is the key organ for biotransformation of xenobiotics, but other tissues can also be used. In field collected fish, the DNA adduct level is indicative of a cumulative exposure to genotoxic compounds over a longer period of time (typically several months or years). For further details see Jonsson et al. (2003).
1.2.12 PAH body burden in mussel The chemical composition of produced water is dominated by low molecular PAHs (naphthalenes, phenanthrenes, dibenzothiophenes, commonly denoted NPDs), decalins and their alkylated homologues (Utvik, 1999). High molecular PAHs such as benzopyrene, pyrene and chrysene are also present in effluents of produced water from production platforms in the North Sea, although at lower concentrations than the more low-molecular weight PAHs. Many of those chemicals have also been detected in caged organisms deployed downstream discharge points (Røe, 1998). This applies in particular to alkylated NPDs, which have been found in higher concentrations than their non-alkylated sister compounds in organisms and passive sampling devices (Røe, 1998; Ruus et al., 2006). Although the different compounds represent variable degree of health risk to the aquatic fauna, measurement of their body burden in caged animals are commonly used to assess the exposure situation in a specified area.

IRIS & NIVA Water Column Monitoring 2006
- 15 -
1.2.13 Benzo(a)pyrene hydroxylase activity Benzo(a)pyrene hydroxylase (BaPH), commonly referred to as aryl hydrocarbon hydroxylases (AHH), represents an enzymatic activity commonly grouped as mixed function oxidases (MFOs), i.e. cytochrome P450 enzymes. These enzymes metabolise selected PAHs and consequently alter potentially harmful chemical to non-toxic and readily excretable end products. The BaPH have also an ability to convert moderately toxic chemicals to highly reactive metabolites, as seen with the conversion of benzo(a)pyrene (BaP) to quinone derivatives that may interact with DNA to form DNA-adducts, which may potentially lead to permanent cellular damage and cancer. BaPH has been shown to be induced by a variety of PAHs in mussels and consequently been proposed as a biomarker for the exposure to and the potential for adverse biological effects of certain types of PAHs (Michel et al., 1994; Sole et al., 1998). Measurement of BaPH in sentinel species such as the blue mussel has consequently been used to determine the effects of PAHs in several environmental monitoring studies including the BECPELAG workshop (Burgeot et al., 2006).
1.2.14 Imunocompetance Haemocyte-mediated phagocytosis is the predominant form of internal defence in molluscs (Pipe and Coles, 1995), although it is generally suppressed by exposure to various contaminants (Cheng, 1988). The immune response is comprised of an integrated process of phagocytosis and lysosomal degradation and pollution-induced dysfunction of these processes may suppress immunocompetence.
Phagocytic activity of haemocytes is assessed by measuring the uptake of neutral red stained zymosan yeast cells (Saccharomyces cerevisiae). Phagocytic activity is regarded as a good biomarker of immune function and therefore of organism health. The more particles that are ingested by the cell in the haemolymph sample the more efficiently the immune system of the organism is functioning.
1.2.15 Lysosomal membrane stability Membrane integrity has been found to be affected by a range of stressors, including metals and organic chemicals. One of the most well-established methods to determine changes in membrane integrity is through measurements on the lysosomal membrane stability. The method uses one of a range of available dyes, e.g. neutral red for haemocytes, which will accumulate in the lysosomal compartment of cells. A reduction in membrane integrity will cause the dye to leak back into the cytosol, an effect which can then be quantified. The method is most commonly used with circulating cells, e.g. haemocytes in blue mussels, but methods exist to use a similar method on tissues.
1.2.16 Micronucleus formation Chromosomal rearrangements, such as micronuclei (MN), are recognised as a consequence of genome instability (Fenech et al., 1999). The MN test is among the most widely used tools in eco-genotoxicology. Micronuclei are chromatin-containing
IRIS & NIVA Water Column Monitoring 2006
- 16 -
structures that are surrounded by a membrane and have no detectable link to the cell nucleus. As an index of chromosomal damage, the micronucleus test is based on the enumeration of downstream aberrations after DNA damage and reveals a time-integrated response to complex mixtures of pollutants. The test was developed in several aquatic organisms over the last decade, including mussels (Burgeot et al, 1996, Bolognesi et al., 1996). Cytogenetic damage can result in the formation of MN-containing lagging whole chromosomes or chromosome fragments. Thus, MN assay provide the evidence of DNA breakage and spindle dysfunction caused by clastogens and aneuploidogenic poisons (Heddle et al., 1983, 1991; MacGregor, 1991; Seelbach et al., 1993; Kramer, 1998; Zoll-Moreux 1999).
1.2.17 Histology Histopathological alterations in selected organs and tissues are conceived as histopathological or tissue-level biomarkers. By looking at the structure/morphology of digestive glands, it is possible to follow the metabolic activity. Digestive gland alterations are a reflection of disturbances at the molecular level and identification of these disturbances can aid in the understanding of whole animal impact due to pollutants and other stress factors. Histopathological characteristics of specific organs express condition and represent time-integrated endogenous and exogenous impacts on the organism stemming from alterations at lower levels of biological organisation (Stebbing 1985).
Histological biomarkers provide powerful tools to detect and characterise the biological endpoints of toxicant and carcinogen exposure (Hinton et al., 1992; Moore & Simpson, 1992). As such, the utility of histological lesions as sensitive and reliable indicators of the health of wild fish populations has been demonstrated in several European and North American studies (Kranz & Dethlefsen, 1990; Myers et al., 1998; Köhler, 1991,1992; Lang et al., 1999). Several laboratory and mesocosm studies have also demonstrated causal links between exposure to xenobiotics and the development of toxicopathic hepatic lesions (Malins et al., 1985a; Malins et al., 1985b; Moore & Myers, 1994).
In mussel, histopathological biomarkers are often analysed in the digestive gland. The digestive gland of molluscs is the main centre for metabolic regulation, participating in the mechanisms of immune defence and homeostatic regulation of the internal medium, as well as in the processes of detoxification and elimination of xenobiotics (Moore and Allen, 2002). The biomarkers selected for this study are lipofuscin and neutral lipid accumulation in mussel digestive gland. The digestive gland of bivalves is made by a complex endo-lysosomal system that is primarily in the uptake and digestion of food as well as in process of pollutant accumulation and detoxification (Cajaraville et al., 1995). The lysosomal lipid content may change due to environmental stress. In this study, lipofuscin accumulation and neutral lipid content had been chosen as histological biomarkers. Lipofuscin accumulation represents a general response (Viarengo et al., 1990; Regoli et al. 1992). Elevated lipofuscin accumulation reflects degradation of cellular membrane caused by oxidative damage following the action of different pollutants (Moore, 1988). Neutral lipid accumulation appears to be more strictly linked

IRIS & NIVA Water Column Monitoring 2006
- 17 -
to organic chemical pollution (Pipe and Moore, 1986, Lowe and Clarke, 1989, Cjaraville, 1991). Lipofilic xenobiotics in fact may alter the metabolism of neutral lipids leading to abnormal accumulation of that lipid class inside lysosomes (Moore, 1988).

IRIS & NIVA Water Column Monitoring 2006
- 18 -
2 Material and methods
Atlantic cod and blue mussel that originated from local fish and shellfish farmers were transported to the Ekofisk field and deployed in cages as described in the survey report (Appendix A). After 6 weeks of field exposure, cages with animals were retrieved, biological data on length, weight, and sex was measured and biological samples obtained.
Table 3. Locations and designation for stations.
St designations Location
REF 1 Reference NE of discharge
REF 2 Reference E of discharge
ST 1 1600m SW
ST 2 600m SW
ST 3 Off southern flare
ST 4 Off 2/4J
ST 5 1100m NE
ST 6 2000m NE

IRIS & NIVA Water Column Monitoring 2006
- 19 -
5º W 0º 5º E 10º E
52º N
56º N
60º N
100 km
NORWAY
DENMARK
UK
REF 1
REF 2
REF 1REF 2
ST 1
ST 2
ST 3
ST 4
ST 5
ST 6
X
1 km
DischargeCurre
nt a
xis
Mussels
Mussels and fish
Figure 1. Positions of the caging stations at the Ekofisk field (superimposed panel) and positions of the reference stations in relation to the field.
2.1 Sea temperature and salinity The used instrument was of the type STD/CTD – model SD204, measuring, calculating and recording sea water conductivity/salinity, temperature, depth (pressure) and sound velocity/water density. The instrument was operated by COPSAS personnel at the Ekofisk platform and lowered at 6 occasions (April 5th, May 1st, twice May 10th, May 15th and May 22nd). The instrument logged data every 2nd second. The specifications for the instruments are as follows: Conductivity: Inductive cell, range: 0-70 mS/cm, resolution: 0.01 mS/cm, accuracy: ± 0.02 mS/cm. Salinity: Calculated from C, T and D, range: 0-40 ppt, resolution: 0.01 ppt, accuracy: ± 0.02 ppt. Temperature: range: -2 to +40 °C, resolution: 0.001 °C, accuracy: ± 0.01 °C, response time: <0.5 sec. Pressure: ranges: 500, 1000, 2000, 6000 m, resolution: 0.01 % FS, accuracy: ± 0.02 % FS, Sound velocity: Calculated from C, T and D, ranges: 1300-1700 m/s, resolution: 5 cm/s, accuracy: ± 10 cm/s

IRIS & NIVA Water Column Monitoring 2006
- 20 -
2.2 Sea current Current instruments were deployed at station 2, 5 and reference 2. For stations 2 and 5 the instrument type Recording Current Meter RCM9 was used, measuring current velocity (range: 0 - 300 cm/s, accuracy: 2 cm/s or 2 %), current direction (accuracy/resolution: 0.35°; accuracy ±5° for 0-15° tilt), temperature (range: -2.46 – 36.04 °C, accuracy/resolution: 0.05 °C) and depth (range 0-2000 m, accuracy/resolution: 0.1 %/0.2 %). The instrument logged data every 10th minute. The instruments were deployed in the water from 06:55 hours the 6th of April 2006 until 16:45 the 21st of May 2006 (St. 2) and from 08:25 hours the 6th of April 2006 until 09:45 the 22nd of May 2006 (St. 5). >6600 data points were collected at each station.
For the reference station 200 the used instrument were of the type Aquadopp Current Meter measuring current velocity (range: 0.5 - 500 cm/s, accuracy: 0.5 cm/s or 1 %), current direction (accuracy/resolution: 2°/0.1°), temperature (range: -4 – 40 °C, accuracy/resolution: 0.1 °C/0.01) and depth (range 0-200 m, accuracy/resolution: 0.25 % /better than 0.005 % of full scale per sample). Accuracy of current velocity is dependent on set-up parameters. During the WC monitoring the accuracy was 0.4 cm/s. The instrument measured current velocity as a 60 seconds average and logged data for every 10 minute, diagnostic data were collected every 12 hour.
The instrument was deployed in the water from 14:00 hours the 5th of April 2006 until 11:00 the 21st of May 2006. From the logged results data and diagnostics the instrument seems to work normal through the test period and a total of 6600 data points were collected. For pre-programmed set-up for Aquadopp see appendix.
2.3 Contamination control during transport Sea water samples were collected from the fish well onboard the vessel during the transport. For each of the six samples 10 litres were used for the etyl-acetate extraction. The extracts were analysed for PAHs by GCMS (2.5.2.).
2.4 General biological observations Fish were sexed by visual examination of gonads and liver weight was recorded. Total weight of cod was measured in the lab onboard the vessel. In order to provide best possible measurements of liver and gonads, these tissues were wrapped in aluminium foil, frozen at -20ºC and brought to Akvamiljø lab for measurements.
Condition was determined as the ratio between total weight and the cube of the fork length of the fish.
Condition index = [Weight (g)/Length (cm)3)]×100
Liver somatic index (LSI, liver index) reflects the animal nourishment status. LSI at 0-samplingat the end of the exposure was calculated as:
LSI = [Liver weight X 100] / fish weight
IRIS & NIVA Water Column Monitoring 2006
- 21 -
Gonadosomatic index (GSI, gonad index) reflects the animal reproduction status. GSI at the end of the exposure was calculated as:
GSI = [Gonad weight X 100] / fish weight
2.5 PAH-metabolites in fish bile
2.5.1 Fixed fluorescence Fixed Fluorescence (FF) is a semi-quantitative and semi-qualitative screening method for direct fluorescence detection of groups of PAH metabolites (Aas et al. 2000b). Bile samples were diluted 1:1600 in methanol:water (1:1). Slit widths were set at 2.5 nm for both excitation and emission wavelengths, and samples were analysed in a quartz cuvette. All bile samples were analysed by FF at the wavelength pairs 290/335, 341/383 and 380/430 nm, optimised for the detection of 2-3 ring, 4-ring and 5-ring PAH metabolites, respectively. The fluorescence signal was transformed into pyrene fluorescence equivalents through a standard curve made by pyrene (Sigma St Louis, USA). Pyrene was measured at the same fluorometer, with the same cuvette, same solvent, and with the same slit settings as the bile samples. It was, however, measured at the optimal wavelength pair of pyrene, 332/374 nm (ex/em). The concentration of PAH metabolites in bile samples was expressed as µg pyrene fluorescence equivalents (PFE) /ml bile.
2.5.2 GC/MS Fish bile was prepared for analysis as described by Jonsson et al. (2003; 2004). Briefly, 25–30 µl of bile was weighed accurately into a micro centrifuge vial. Internal standards (2,6-dibromophenol, 3-fluorophenanthrene and 1-fluoropyrene) and β-glucuronidase (3000 units) in sodium acetate buffer (0.4 M, pH = 5) were added and the solution left at 40°C for 2 hours. The OH-PAHs were extracted with ethylacetate (4 times 0.5 ml), the combined extract dried with anhydrous sodium sulphate and concentrated to 0.5 ml. Trimethylsilyl (TMS) ethers of OH-PAHs were prepared by addition of 0.2 ml BSTFA and heating for two hours at 60°C. TPA was added as a GC-MS performance standard before transferring the prepared samples to capped vials.
Trimethylsilyl ethers of OH-PAHs (TMS-OH-PAHs) in fish bile samples were analysed by a GC-MS system consisting of a HP5890 series II Gas chromatograph, Shimudadzu QP2010 GCMS. Helium was used as carrier gas and the applied column was CP-Sil 8 CB-MS, 50 m x 0.25 mm and 0.25 μm film-thickness (Instrument Teknikk A.S., Oslo, Norway). Samples and calibration standards (1 μl) were injected on a split/splitless injector with splitless mode on for one minute. The temperatures for the injector, transfer-line and ion source were held at 250°C, 300°C and 240°C, respectively, and the GC oven temperature programme was as follows: 80°C to 120°C at 15°C min-1, 120°C to 300°C at 6°C min-1 and held at 300°C for 30 min. Mass spectra were obtained at 70 eV in selected ion mode (SIM). Based on the fragmentation pattern of non-alkylated

IRIS & NIVA Water Column Monitoring 2006
- 22 -
TMS-O-PAHs (Jonsson et al. 2003, Krahn et al. (1992); the molecular ions were selected for determination of both alkylated and non-alkylated TMS-O-PAHs.
2.6 AP metabolites in fish bile Fish bile was prepared for analysis as described by Jonsson et al. (2003; 2004). Briefly, 25–30 µl of bile was weighed accurately into a micro centrifuge vial. Internal standards (2,6-dibromophenol, 3-fluorophenanthrene and 1-fluoropyrene) and β-glucuronidase (3000 units) in sodium acetate buffer (0.4 M, pH = 5) were added and the solution left at 40°C for 2 hours. The OH-PAHs were extracted with ethylacetate (4 times 0.5 ml), the combined extract dried with anhydrous sodium sulphate and concentrated to 0.5 ml. Trimethylsilyl (TMS) ethers of OH-APs were prepared by addition of 0.2 ml BSTFA and heating for two hours at 60°C. TPA was added as a GC-MS performance standard before transferring the prepared samples to capped vials.
Trimethylsilyl ethers of OH-APs (TMS-OH-APs) in fish bile samples were analysed by a GC-MS system consisting of a HP5890 series II Gas chromatograph, Shimudadzu QP2010 GCMS. Helium was used as carrier gas and the applied column was CP-Sil 8 CB-MS, 50 m x 0.25 mm and 0.25 μm film-thickness (Instrument Teknikk A.S., Oslo, Norway). Samples and calibration standards (1 μl) were injected on a split/splitless injector with splitless mode on for one minute. The temperatures for the injector, transfer-line and ion source were held at 250°C, 300°C and 240°C, respectively, and the GC oven temperature programme was as follows: 80°C to 120°C at 15°C min-1, 120°C to 300°C at 6°C min-1 and held at 300°C for 30 min. Mass spectra were obtained at 70 eV in selected ion mode (SIM). Based on the fragmentation pattern of non-alkylated TMS-O-APs (Jonsson et al. 2003); the molecular ions were selected for determination of both alkylated and non-alkylated TMS-O-APs.
2.7 Glutathion-S-transferase (GST) activity The method used is based on Habig et al (1974), and optimised for cod tissues. Liver tissue was homogenised with a Potter-Elvehjem glass/teflon homogeniser in four volumes of ice-cold 100 mM KH2PO4 buffer, pH 7.8, 0.15 M KCl. The homogenate was centrifuged at 10 000 × g for 30 min. before the supernatant was centrifuget at 50 000 × g for 2 h. The cytosolic fractions were aliquoted and stored at –80oC.
Cytosol samples were diluted 50 fold in ice cold phosphate buffer (100mM KH2PO4/K2HPO4, pH 7.4, 50 µL of each sample was transferred to 96 microwell plates in triplicates. Each plate additionally contained a negative and a positive control (cod sample). The microplates were stored on ice until analysis. Reagents (2 mM CDNB, 1 mM GSH) were mixed and 200 µL added to the wells (containing cytosol samples, blanks, or positive controls) using a multi channel pipette. The plate was then transferred to the microplatereader were the absorbance was measured at 340 nm during 2 minute run at 22°C. The enzyme activity can be estimated and normalised against the sample protein concentration.
IRIS & NIVA Water Column Monitoring 2006
- 23 -
The activity calculation: (well volume × (Δ Absorbance-blank))/ (sample volume × 9.6 × light-way × [Protein] well), where 9.6 is the molar extinction coefficient (∈) for the CDNB-GSH conjugate (in mM-1cm-1). GST activities were expressed as nanomoles of substrate converted per minute per mg of protein in the cytosol.
The total protein concentrations of the samples where determined by a procedure based on the Lowry method (Lowry, 1951).
2.8 Hepatic Cytochrome P450 1A From homogenised cod liver tissue in 100 mM KH2PO4 buffer, pH 7.8, the centrifuged cytosolic fraction was centrifuged once more at 50 000 g for a microsomal fraction of hepathocytes used in the CYP1A ELISA assay.
Total protein concentrations of the samples were determined by a procedure based on the Lowry method. Based on the total protein concentrations, the samples were diluted to10 µg/ml in carbonate-bicarbonate buffer and transferred to a 96 micro well plate, each containing 4 replicates of the sample, a blank and a positive control (cod sample). The plate was sealed with sealing tape and incubated over night in dark at 4 °C.
The second day the plate was washed three times with TTBS. 1% BSA in TTBS was added to the wells to block unspecific binding and the plate was incubated for 1 hour. The plate was washed a second time with TTBS. The primary anti body rabbit-anti-fish CYP1A (CP226) (Biosense) with dilution 1:1000 was added to all wells and the plate was sealed with sealing tape and incubated over night in dark at 4 °C. The third day the plate was washed three times with TTBS. The secondary anti body goat-anti-mouse HRP conj. (BIORAD) with dilution 1:3000 was added to all wells and incubated at 4 °C for 6 hours. The plate was washed with TTBS. TMB plus (KemEnTec) buffer was added for colour development and the reaction was stopped after 12 min. with 1 M H2SO4. The absorbance was read at 450 nm.
2.9 Vitellogenin Blood samples were taken from the caudal vein by means of pre-cooled syringes containing heparin (10000 IU/ml, Sigma) and the protease inhibitor Aprotinin (5 TIU/ml, Sigma) and centrifuged at approximately 2000 g. The supernatant was carefully transferred to cryo-vials, aliquots were prepared and samples snap-frozen in liquid nitrogen. Plasma samples were stored at -80°C until analysis. Vitellogenin was determined in plasma from caged cod using a competitive ELISA with cod vitellogenin as standard and competing antigen. The analyses were performed using a kit (V01006401) from Biosense Laboratories AS (Bergen, Norway) with anti-cod antiserum and cod vitellogenin as standard, according to the instructions of the manufacturer.
Plasma samples were diluted 50 and 5000 times in Phosphate buffer saline, pH 7.2. The plasma samples were transferred to 96 well microplates, each containing duplicates of the diluted sample, a blank and a positive control (cod sample). Also two VTG standard

IRIS & NIVA Water Column Monitoring 2006
- 24 -
series were transferred to the microplates. The plates were sealed and incubated for 1 hour at 37 °C. The plates were washed three times in PBS buffer. Detecting antibody with dilution 1:500 was added to the wells and incubated for 1 hour at 37 °C. The plates were washed three times in PBS buffer. Secondary antibody with dilution 1:2000 was added to the wells and incubated for 1 hour at 37 °C. The plates were washed five times in PBS buffer and TMB substrate solution was added to the wells. The plates were incubated in the dark at room temperature for 30 min. The reaction was stopped with 0.3 M H2SO4 and the absorbance read at 450 nm. The VTG-concentration in the diluted samples was determined using the equation for the adjusted standard curve from the standard series. The VTG concentration was multiplied with the dilution factor and is expressed in ng/ml.
2.10 Zona Radiata Protein Blood samples were taken from cod as described for vitellogenin. Plasma samples were stored at -80°C until analysis. Zona Radiata Protein (ZRP) was determined in plasma from caged cod using a competitive ELISA with a competing antigen.
The plasma samples were diluted 1:2000 in carbonate-bicarbonate buffer and transferred to a 96 micro well plate, each containing 4 replicates of the sample, a blank and a positive control (cod sample). The plate was sealed with sealing tape and incubated over night in the dark at 4 °C.
The second day the plate was washed three times with 20 mM Tris-buffer, pH 8.5, (TTBS). 1% BSA in TTBS was added to the wells to block unspecific binding and the plate was incubated for 1 hour. The plate was washed a second time with TTBS. The primary anti body rabbit-anti-salmon ZRP (O-146) (Biosense) with dilution 1:400 was added to all wells and the plate was sealed with sealing tape and incubated over night in dark at 4 °C. The third day the plate was washed three times with TTBS. The secondary anti body goat-anti-rabbit HRP conj. (ZYMED) with dilution 1:3000 was added to all wells and incubated at 4 °C for 6 hours. The plate was washed with TTBS. TMB plus (KemEnTec) buffer was added for colour development and the reaction was stopped after 12 min. with 1 M H2SO4. The absorbance was read at 450 nm.
2.11 DNA adducts Deep-frozen liver tissue pieces from cod were semi-thawed. DNA was extracted and purified according to Dunn et al., 1987; Reichert and French 1994, with minor modifications as described by Ericson et al. 1998 and Ericson and Balk 2000. DNA adducts were enriched using the Nuclease P1 method, 0.8 µg Nuclease P1/µg DNA, and a 45 min incubation period (Reddy and Randerath 1986; Beach and Gupta 1992). Finally the DNA adducts were radiolabelled using 5´-[γ-32P]triphosphate ([γ-32P]ATP) and T4 polynucleotide kinase (Aas et al. 2000a). Separation and clean up of adducts was performed by multidirectional thin-layer chromatography (TLC) on laboratory produced polyethyleneimine cellulose sheets, described as suitable for adducts formed from large hydrophobic xenobiotics, such as 4- to 6- ring, PAHs (Reichert and French 1994;
IRIS & NIVA Water Column Monitoring 2006
- 25 -
Ericson et al. 1999). In addition, several quality control experiments were performed parallel to the analysis of the samples. Detection limit for the method varies among samples due to individual plate background.
2.12 PAH body burden in mussel Approximately 15 whole blue mussels were excised from their shell and transferred to solvent cleaned and high temperature treated glass containers. The mussels were frozen and transported to Batelle on dry-ice. The samples were stored at -80oC until analyses.
Analysis at NIVA: (See Appendix F for a detailed description of analysis at Battelle)
The biological matter was homogenised, added internal standards (naphtalene d8, acenaphthene d8, phenanthrene d10, chrysene d12, perylene d12 and athracene d10) and saponified. The compounds were extracted with n-pentane and dried over sodium sulphate. The extraction volume was reduced and the extracts were cleaned by GPC and solvent exchanged to cyclohexane. The extracts were then analysed by GC/MS with the MS detector operating in selected ion monitoring mode (SIM) and analyte concentrations in the standard solutions were in the range 5-1000 ng/µl. The GC was equipped with a 30 m column with a stationary phase of 5% phenyl polysiloxane (0.25 mm i.d. and 0.25 µm film thickness), and an injections operated in splitless mode. The initial column temperature was 60°C, which after two minutes was raised to 250°C at a rate of 7°C/min and thereafter raised to 310°C at a rate of 15°C/min. The injector temperature was 300°C, the transfer line temperature was 280°C, the MS source temperature was 230°C and the column flow rate was 1.2 ml/min. Quantification of individual components was performed by using the internal standard method. The alkylated homologues were quantified by baseline integration of the established chromatographic pattern and the response factors were assumed equal within each group of homologues.
2.13 Benzo(a)pyrene hydroxylase activity Benzo(a)pyrene hydroxylase activity was determined in the microsomal fraction of hepatopancreas by a method modified from Michel et al. (1994). Essentially, frozen hepatopancreas was homogenised in 5 volumes of ice-cold 0.1M potassium phosphate buffer (pH 7.8) containing 0.15 M KCl, one tablet Complete™ protease inhibitor (Boehringer-Mannheim) per 100 ml, 1mM dithiothreitol and 5% glycerol. The homogenate was centrifuged at 10 000 g (4 oC, 30 min.), whereupon the supernatant was removed and subjected to centrifugation at 50 000 g (4oC, 120 min.). After centrifugation, the supernatant was removed and the pellet resuspended in ice-cold homogenisation buffer added 15% glycerol (in total 20% glycerol) and 1mM EDTA to obtain a microsomal fraction.
For analysis, 110 μl of the microsmal fraction was added to 750 μl 0.05M sodium phosphate buffer (pH 7.3) containing 2 mg/ml BSA and 40 μl of a BaP solution of 1,8 mM BaP and 80 nM (180 MBq/L) 14C-BaP in acetone. The solution was divided
IRIS & NIVA Water Column Monitoring 2006
- 26 -
into two glass tubes and one tube added 80 µl sodium phosphate buffer containing 10 mM NADPH, whereas the other was added 80 µl sodium phosphate buffer. Both tubes were mixed and incubated on an orbital shaker (20oC, 20 min.) before the reaction was terminated by adding 1 ml of stop solution containing 15% 1M KOH and 85 % DMSO. Non-metabolised BaP was removed by 2 sequential extraction steps with 5 ml cyclohexane for 30 min. Following extraction, 700 µL of the water phase was removed for liquid scintillation counting using a standard 14C protocol.
2.14 Imunocompetance Phagocytosis is one of the main cellular defence mechanisms in invertebrates. The phagocytosis assay measures the ingestion of zymosan yeast cells by isolated haemocytes. Decreased uptake of particles in haemolymph from experimentally treated organisms, when compared against controls, indicates inhibition of the immune function system. Phagocytic activity of haemocytes is assessed by measuring the uptake of neutral red stained zymosan yeast cells (Saccharomyces cerevisiae). Phagocytic activity is regarded as a good biomarker of immune function and therefore of organism health. The more particles that are ingested by the cell in the haemolymph sample the more efficiently the immune system of the organism is functioning.
Haemolymph is collected from the posterior adductor muscle (500μl) using a syringe preloaded with PBS 50μl samples of the haemolymph/PBS solution is placed into a 96 well poly-L-lysine coated multiwell plate. After an incubation period, 50μl of stock zymosan/neutral red (50 x 107 particles/ml) are added. Samples are then incubated for 30 min at +4°C. 100μl of Bakers Formal Calcium are added into all wells to fix the cells. After incubate for 10 min in the fridge, excess of zymosan is washed out using PBS solution. The neutral red dye is then re-suspended by adding Acidified Ethanol to the sample wells. This lyses the adhered cells so they release their content. The absorbance is read at 550nm with a spectrophotometer. The assay result is relative to the protein concentration of the total haemolymph sample. The protein concentration has to be measured using the Bradford method (Bradford, 1976).
2.15 Lysosomal membrane stability The mussels from the pre-exposure group were brought to the lab in Stavanger on ice. The mussels were acclimatised in the lab in aquaria with fresh supply of sea-water for two days prior to sampling (to alleviate stress during transport). The field groups were analysed onboard the vessel directly after retrieval of cages.
Haemolymph samples were obtained from 15 individuals at each field station (23 individuals from reference station 200) and 15 individuals from the pre-exposure group.
0.4 ml haemolymph was sampled from each mussel and mixed with filtered sea water at the ratio 2:1. 40 µl haemolymph/seawater-mixture was pipetted out on microscope-slides, and incubated in a light-proof box for 20 min before 35 µl neutral red

IRIS & NIVA Water Column Monitoring 2006
- 27 -
(concentration 0.1 µg/µl) was added. All analyses were performed blind. For a detailed description of the method see Lowe (1994).
NR is selectively taken up by haemolymph cells and this adds an extra stress to the membranes. After some time, from 15 to 200 minutes, depending of the health status of the mussels, the membrane will start to burst and NR will leak out in the cytosol. This causes the form of the cells to change from irregular to round shaped. The time from NR is added the cells and until they become round and perish is observed visually with a microscope (Figure 2). The cells are observed repeatedly at 15, 30, 60, 90, 120, 150 and 180 minutes of incubation with NR. The endpoint of the analysis is when 50% of all cells become round and die. This method is perceived as a general health-parameter, and has been shown to respond to PAH/oil-exposed mussels.
Figure 2. Microscope view (400× magnification) of living and dead mussel haemolymph cells
2.16 Micronucleus formation Haemolymph of mussels were applied directly on slides, air-dried and fixed in methanol for 15 min. The slides were then shipped and cytogenetic analysis was done in Institute of Ecology at Vilnius University (Lithuania). Slides were stained with 5% Giemsa solution for 10-20 min. Blind scoring of micronuclei was performed on coded slides without knowledge of the exposure status of the samples to eliminate technical variability.
The frequency of micronuclei in haemocytes was determined by scoring at a 1000× magnification using Olympus BX 51 or Nikon Eclipse 50i bright-field microscope. A total of 20000-30000 cells were examined in each caged experimental group of mussel. In some mussel slides, the deficiency of appropriate cells for the micronuclei analysis
Living cells
Dead cells

IRIS & NIVA Water Column Monitoring 2006
- 28 -
was noted. Nevertheless, 500 haemocytes was a minimum amount of cells suitable for the analysis. Therefore, in mussels micronuclei were counted in 500-2000 haemocytes from each specimen.
Only cells with intact cellular and nuclear membrane were scored. MN are scored when: i) nucleus and MN have a common cytoplasm, ii) colour intensity of MN is the same or lower than the one of the nucleus, iii) the size of the MN is equal or smaller than 1/3 of the nucleus, iv) MN must be completed separated from the nucleus, v) cells with multiple MNs are not scored.
Fig. 2. Micronucleus in haemocyte (arrow) of blue mussel (1000× magnification).
2.17 Histology in mussels For cytochemical examination small pieces (5x5x5mm) or freshly excised digestive gland tissues from animals are placed on metal cryostat chucks. Each chuck is then placed for 1 min in a small bath of n- Hexane that has been pre-cooled to -196°C (using a surrounding bath of liquid nitrogen). The metal chuck plus the quenched (super-cooled) solidified tissues are then sealed by double-wrapping in parafilm and stored at – 40°C until required for sectioning.
Cryostat sections 8µm cut in a cryostat with the cabinet temperature below -25°C and the knife cooled - 20°C. The sections are transferred to “warm” slides (20°C). The section which effectively flash-dries them are (Moore 1976) and the slides can be stored in the freezer at -40 °C before use. Cryostat sections were used for analyses of lipofuscin and neutral lipid accumulation.

IRIS & NIVA Water Column Monitoring 2006
- 29 -
Lipofuscin accumulation
The lipofuscin content of lysosomes was determined using the Schomol reaction. Cryostat sections were fixed in calcium-formol for 15 min at 4°C, rinsed in distilled water and immersed in the reaction medium containing an aqueous solutionof 1% ferric chloride and 1% potassium ferrocyanide in a ratio 3:1 (v:v). Section were stained for 5 min, rinsed in acetic acid (1%) for 1 min and washed in distilled water before mounting. Slides were subjected to image analysis. Results were expressed as pixel density.
Neutral lipid accumulation
For the determination of unsaturated neutral lipids, cryostatic section were fixed in calcium-formol for 15 min at 4°C, rinsed in distilled water and transferred into 60% triethylphosphate (v/v with distilled water) for 3 min. Section were stained in 1% solution of Oil Red O in 60% triethylphosphate for 15 min. Then they were rinsed in 60% triethylphosphate for 30 s, washed in distilled water and mounted using aquous mounting medium. Neutral lipid accumulation was assessed by computer assisted image analysis. Results were expressed as pixel density.
2.18 Protein determination Analyses at IRIS used the Bradford assay for protein normalisation, whereas analyses at NIVA used the Lowry assay to determine the concentration of protein in samples. The Bradford assay relies on the fact that protein binds to Coomassie Brilliant Blue G-250 and changes colour. Coomassie Blue exists in two colour forms, red and blue. Upon binding protein, the red form is converted to the blue form. The protein-dye complex absorbs light at 595 nm of test solution (protein solution + Coomassie) as compared to a set of standard protein solutions (bovine serum albumin, BSA).
Biomarker analyses at NIVA were normalised to protein concentration using Lowry’s method adapted for plate-readers (Lowry et al., 1951) with bovine gammaglobulin as standard. The assay is based on the reaction of protein with an alkaline copper tartrate solution and Folin reagent. Amino acids reduce the Folin reagent, yielding several reduced species that have a blue colour. The colour has maximum absorbance at 750 nm and minimumm absorbance at 405 nm.
2.19 Statistical methods Biological responses in individual mussel or fish were subjected to analysis of variance (ANOVA) to clarify whether there were differences between groups (Sokal & Rohlf, 1981). Prior to analyses, homogeneity of variances was checked using the Levene’s test. Variables were transformed as appropriate to attain homodascicity. Where this was not possible, the non-parametric Kruskal-Wallis analysis was used (Sokal & Rohlf, 1981). Where the parametric ANOVA indicated significant differences, groups were compared using Tukey’s post-hoc test. The level of significance for rejection of H0: “no difference between groups” was set to 0.05.
IRIS & NIVA Water Column Monitoring 2006
- 30 -
3 Results
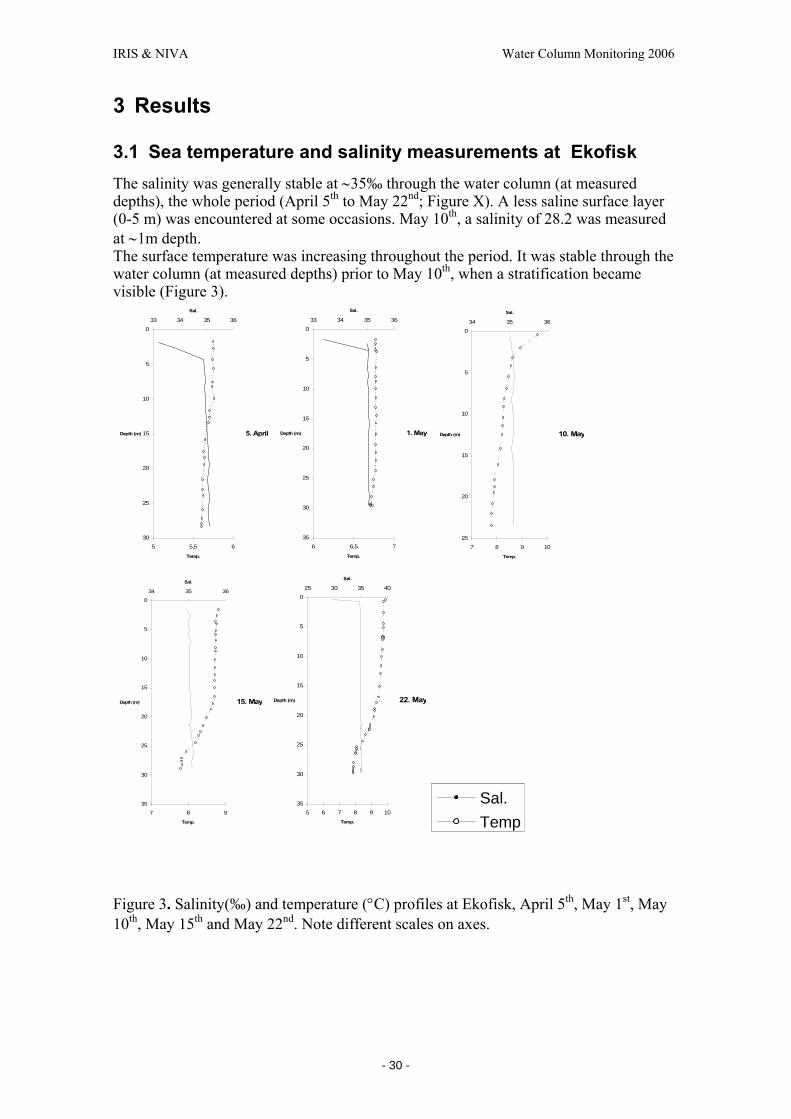
3.1 Sea temperature and salinity measurements at Ekofisk The salinity was generally stable at ∼35‰ through the water column (at measured depths), the whole period (April 5th to May 22nd; Figure X). A less saline surface layer (0-5 m) was encountered at some occasions. May 10th, a salinity of 28.2 was measured at ∼1m depth. The surface temperature was increasing throughout the period. It was stable through the water column (at measured depths) prior to May 10th, when a stratification became visible (Figure 3).
Figure 3. Salinity(‰) and temperature (°C) profiles at Ekofisk, April 5th, May 1st, May 10th, May 15th and May 22nd. Note different scales on axes.
Sal.TempSal.Temp
22. May
25 30 35 400
5
10
15
20
25
30
35
Depth (m)
Sal.
5 6 7 8 9 10Temp.
15. May
34 35 360
5
10
15
20
25
30
35
Depth (m)
Sal.
7 8 9
Temp.
10. May
34 35 360
5
10
15
20
25
Depth (m)
Sal.
7 8 9 10
Temp.
1. May
33 34 35 360
5
10
15
20
25
30
35
Depth (m)
Sal.
6 6,5 7
Temp.
5. April
33 34 35 360
5
10
15
20
25
30
Depth (m)
Sal.
5 5,5 6
Temp.
IRIS & NIVA Water Column Monitoring 2006
- 31 -
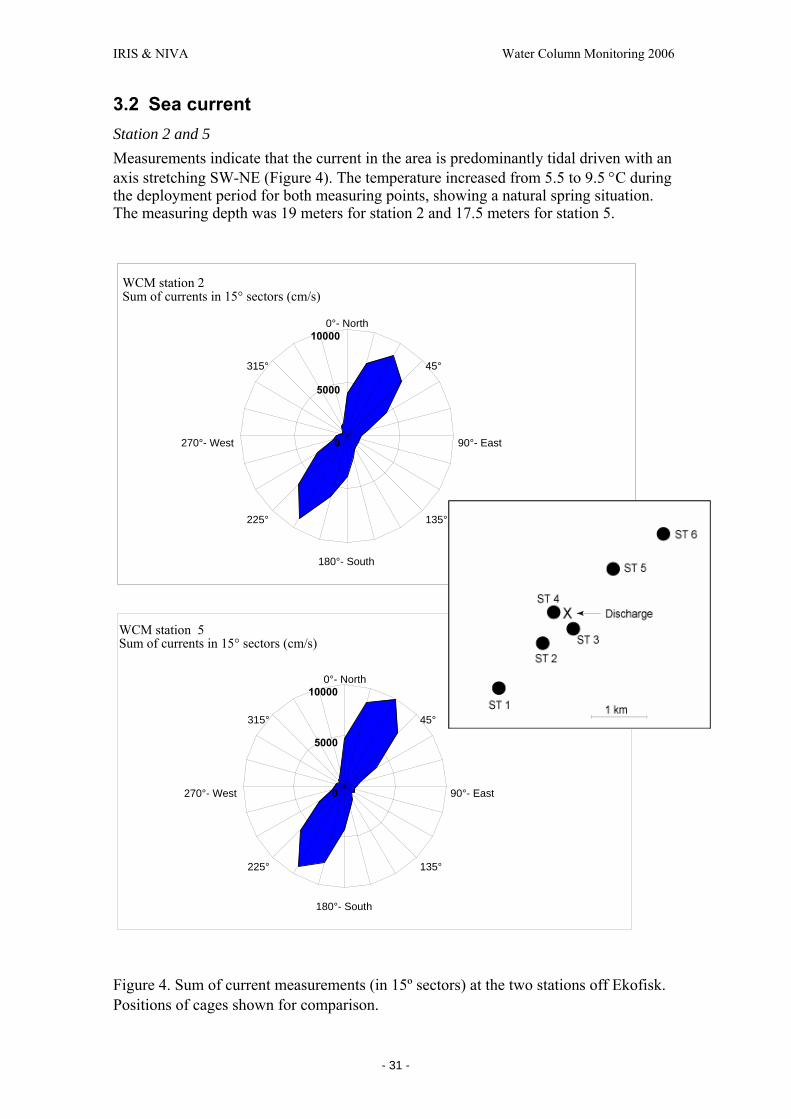
3.2 Sea current Station 2 and 5 Measurements indicate that the current in the area is predominantly tidal driven with an axis stretching SW-NE (Figure 4). The temperature increased from 5.5 to 9.5 °C during the deployment period for both measuring points, showing a natural spring situation. The measuring depth was 19 meters for station 2 and 17.5 meters for station 5.
Figure 4. Sum of current measurements (in 15º sectors) at the two stations off Ekofisk. Positions of cages shown for comparison.
WCM station 5 Sum of currents in 15° sectors (cm/s)
0
5000
100000°- North
45°
90°- East
135°
180°- South
225°
270°- West
315°
WCM station 2 Sum of currents in 15° sectors (cm/s)
0
5000
100000°- North
45°
90°- East
135°
180°- South
225°
270°- West
315°

IRIS & NIVA Water Column Monitoring 2006
- 32 -
Reference station 2 As for the Ekofisk area, measurements at the reference station 2 show predominantly tidal driven current with an axis stretching SW-NE (Figure 5). The temperature increased from 5 to 9 °C during the deployment period. The measuring depth was 12 m until the 16th of April from when it was 14 m (the rig was relocated due to work on pipeline).
Figure 5. Sum of current measurements (in 15º sectors) at reference station 2.
3.3 Contamination control during transport Results from GCMS analysis of PAHs in sea water from the vessels storage tanks showed only background levels. This confirms that the organisms used in the study were not contaminated by PAHs from water during the transport
WCM reference 2. Sum of current measurements in 15° sectors (cm/s)
0
5000
100000°- North
45°
90°- East
135°
180°- South
225°
270°- West
315°
IRIS & NIVA Water Column Monitoring 2006
- 33 -
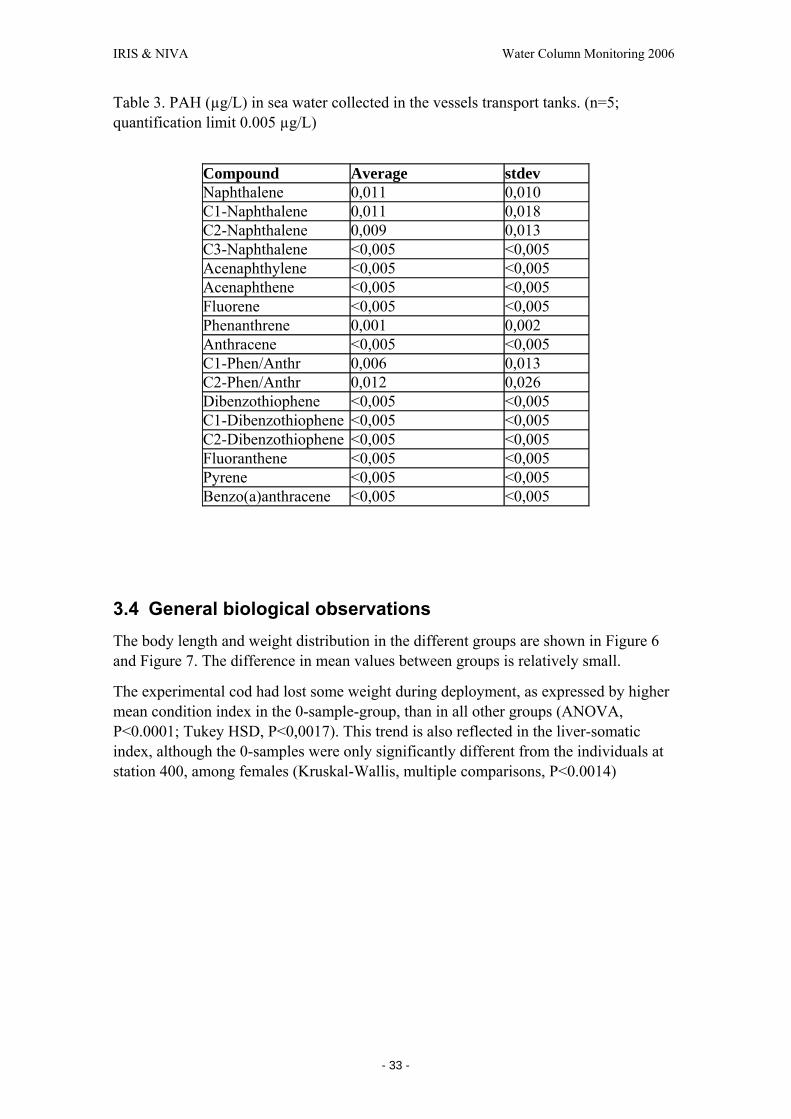
Table 3. PAH (µg/L) in sea water collected in the vessels transport tanks. (n=5; quantification limit 0.005 µg/L)
Compound Average stdev Naphthalene 0,011 0,010 C1-Naphthalene 0,011 0,018 C2-Naphthalene 0,009 0,013 C3-Naphthalene <0,005 <0,005 Acenaphthylene <0,005 <0,005 Acenaphthene <0,005 <0,005 Fluorene <0,005 <0,005 Phenanthrene 0,001 0,002 Anthracene <0,005 <0,005 C1-Phen/Anthr 0,006 0,013 C2-Phen/Anthr 0,012 0,026 Dibenzothiophene <0,005 <0,005 C1-Dibenzothiophene <0,005 <0,005 C2-Dibenzothiophene <0,005 <0,005 Fluoranthene <0,005 <0,005 Pyrene <0,005 <0,005 Benzo(a)anthracene <0,005 <0,005
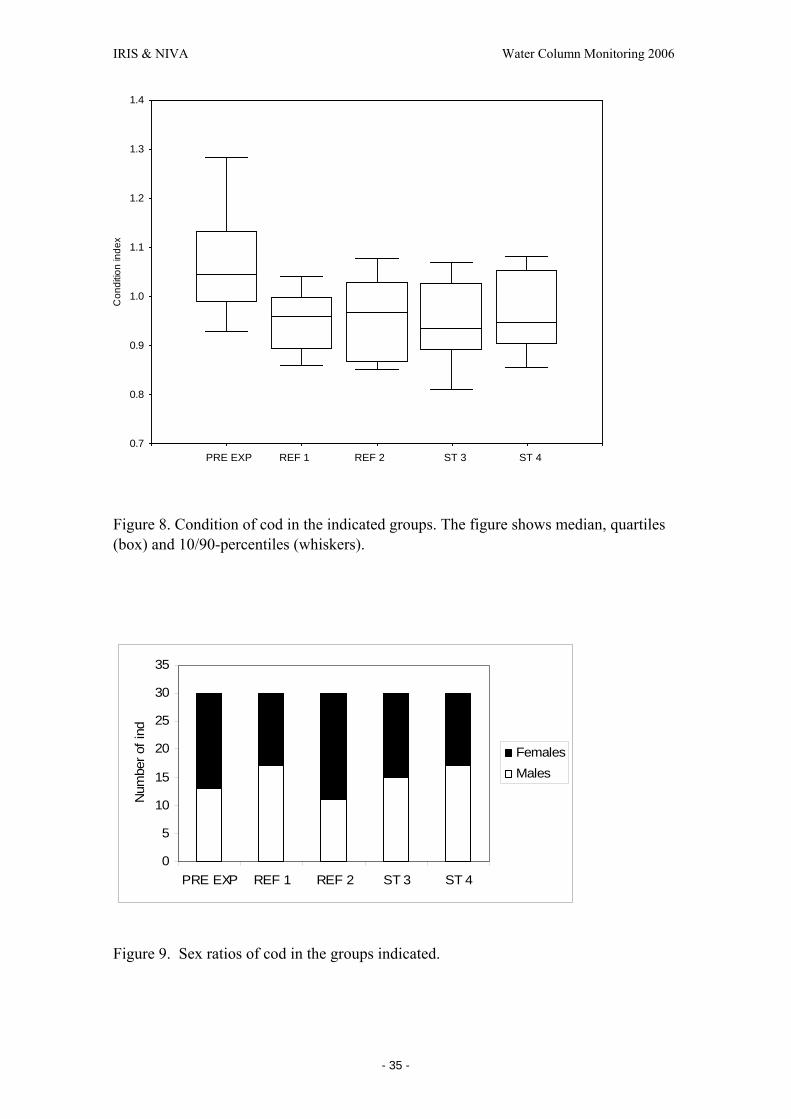
3.4 General biological observations The body length and weight distribution in the different groups are shown in Figure 6 and Figure 7. The difference in mean values between groups is relatively small.
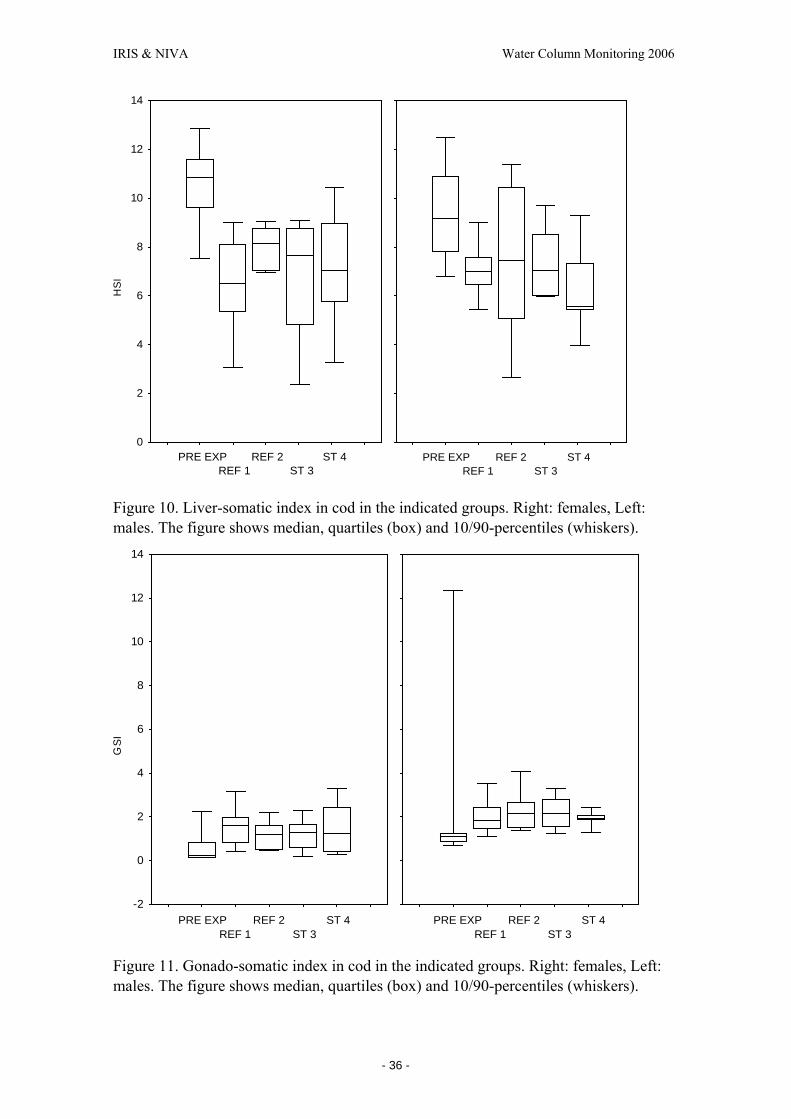
The experimental cod had lost some weight during deployment, as expressed by higher mean condition index in the 0-sample-group, than in all other groups (ANOVA, P<0.0001; Tukey HSD, P<0,0017). This trend is also reflected in the liver-somatic index, although the 0-samples were only significantly different from the individuals at station 400, among females (Kruskal-Wallis, multiple comparisons, P<0.0014)

IRIS & NIVA Water Column Monitoring 2006
- 34 -
PRE EXP REF 1 REF 2 ST 3 ST 438
40
42
44
46
48
50
Leng
th(c
m)
Figure 6. Length (cm) of cod in the different groups. The figure shows median, quartiles (box) and 10/90-percentiles (whiskers).
PRE EXP REF 1 REF 2 ST 3 ST 4500
600
700
800
900
1000
1100
1200
1300
Wei
ght(
g)
Figure 7. Weight (g) of cod in the different groups. The figure shows median, quartiles (box) and 10/90-percentiles (whiskers).
IRIS & NIVA Water Column Monitoring 2006
- 35 -
PRE EXP REF 1 REF 2 ST 3 ST 40.7
0.8
0.9
1.0
1.1
1.2
1.3
1.4C
ondi
tion
inde
x
Figure 8. Condition of cod in the indicated groups. The figure shows median, quartiles (box) and 10/90-percentiles (whiskers).
0
5
10
15
20
25
30
35
PRE EXP REF 1 REF 2 ST 3 ST 4
Num
ber o
f ind
FemalesMales
Figure 9. Sex ratios of cod in the groups indicated.
IRIS & NIVA Water Column Monitoring 2006
- 36 -
HSI
PRE EXP REF 1
REF 2ST 3
ST 40
2
4
6
8
10
12
14
PRE EXP REF 1
REF 2ST 3
ST 4
Figure 10. Liver-somatic index in cod in the indicated groups. Right: females, Left: males. The figure shows median, quartiles (box) and 10/90-percentiles (whiskers).
GSI
-2
0
2
4
6
8
10
12
14
PRE EXP REF 1
REF 2ST 3
ST 4 PRE EXP REF 1
REF 2ST 3
ST 4
Figure 11. Gonado-somatic index in cod in the indicated groups. Right: females, Left: males. The figure shows median, quartiles (box) and 10/90-percentiles (whiskers).
IRIS & NIVA Water Column Monitoring 2006
- 37 -
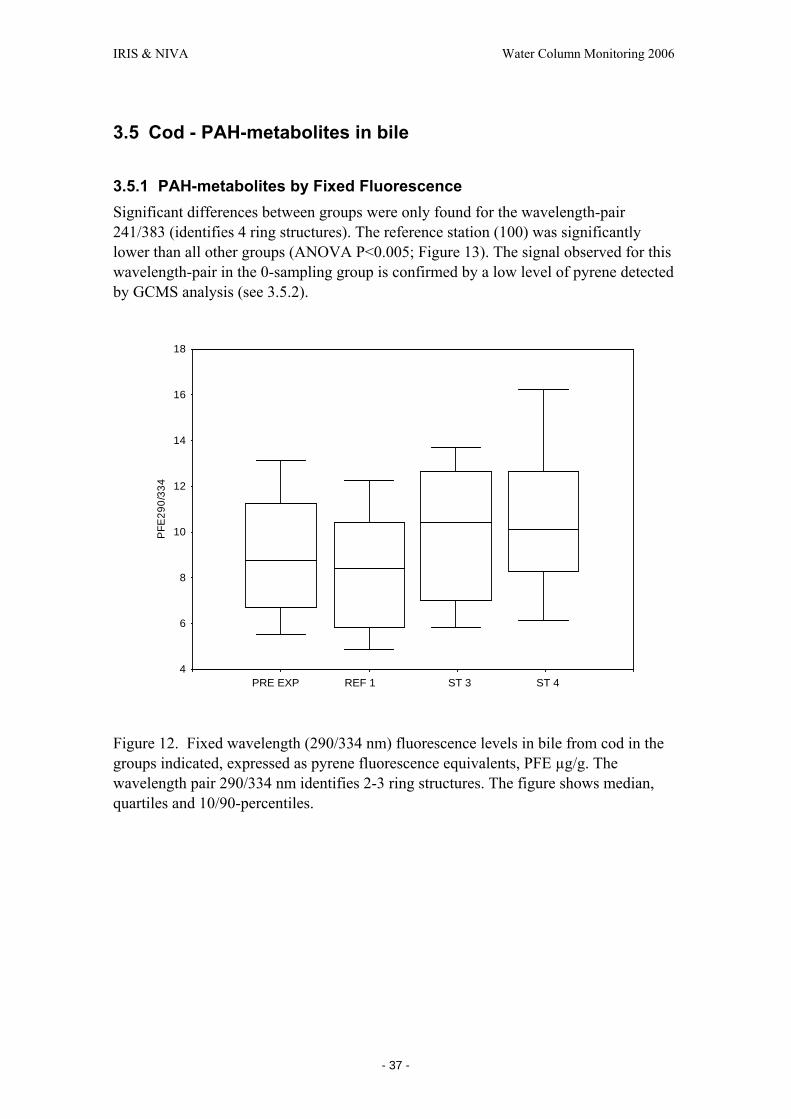
3.5 Cod - PAH-metabolites in bile 3.5.1 PAH-metabolites by Fixed Fluorescence Significant differences between groups were only found for the wavelength-pair 241/383 (identifies 4 ring structures). The reference station (100) was significantly lower than all other groups (ANOVA P<0.005; Figure 13). The signal observed for this wavelength-pair in the 0-sampling group is confirmed by a low level of pyrene detected by GCMS analysis (see 3.5.2).
PRE EXP REF 1 ST 3 ST 44
6
8
10
12
14
16
18
PFE
290/
334
Figure 12. Fixed wavelength (290/334 nm) fluorescence levels in bile from cod in the groups indicated, expressed as pyrene fluorescence equivalents, PFE µg/g. The wavelength pair 290/334 nm identifies 2-3 ring structures. The figure shows median, quartiles and 10/90-percentiles.
IRIS & NIVA Water Column Monitoring 2006
- 38 -
PRE EXP REF 1 ST 3 ST 41.5
2.0
2.5
3.0
3.5
4.0
4.5
5.0
5.5
PFE
341/
383
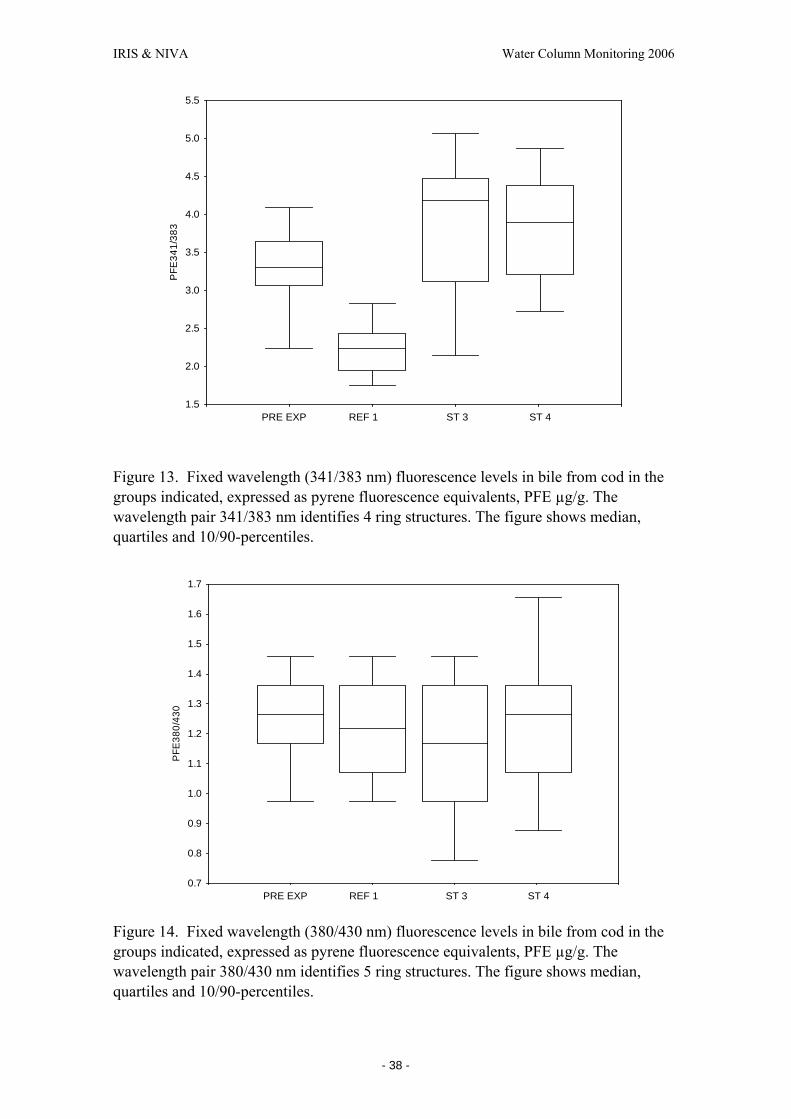
Figure 13. Fixed wavelength (341/383 nm) fluorescence levels in bile from cod in the groups indicated, expressed as pyrene fluorescence equivalents, PFE µg/g. The wavelength pair 341/383 nm identifies 4 ring structures. The figure shows median, quartiles and 10/90-percentiles.
PRE EXP REF 1 ST 3 ST 40.7
0.8
0.9
1.0
1.1
1.2
1.3
1.4
1.5
1.6
1.7
PFE
380/
430
Figure 14. Fixed wavelength (380/430 nm) fluorescence levels in bile from cod in the groups indicated, expressed as pyrene fluorescence equivalents, PFE µg/g. The wavelength pair 380/430 nm identifies 5 ring structures. The figure shows median, quartiles and 10/90-percentiles.
IRIS & NIVA Water Column Monitoring 2006
- 39 -
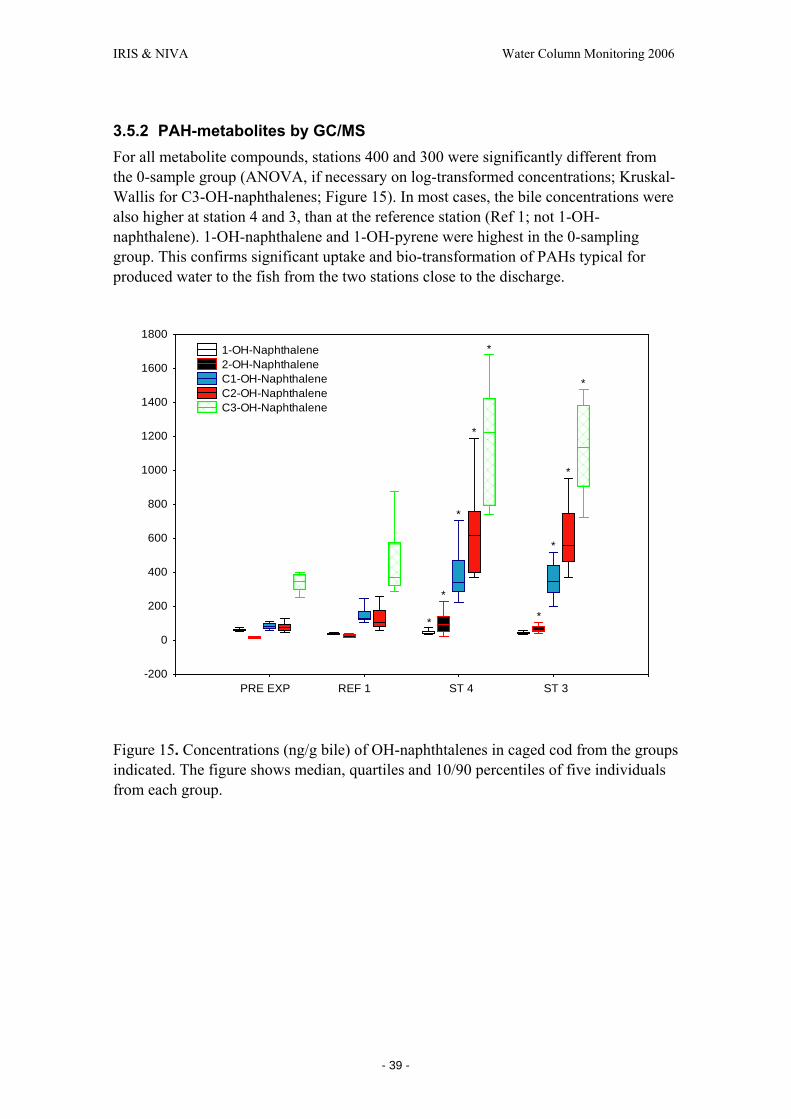
3.5.2 PAH-metabolites by GC/MS For all metabolite compounds, stations 400 and 300 were significantly different from the 0-sample group (ANOVA, if necessary on log-transformed concentrations; Kruskal-Wallis for C3-OH-naphthalenes; Figure 15). In most cases, the bile concentrations were also higher at station 4 and 3, than at the reference station (Ref 1; not 1-OH-naphthalene). 1-OH-naphthalene and 1-OH-pyrene were highest in the 0-sampling group. This confirms significant uptake and bio-transformation of PAHs typical for produced water to the fish from the two stations close to the discharge.
PRE EXP REF 1 ST 4 ST 3-200
0
200
400
600
800
1000
1200
1400
1600
18001-OH-Naphthalene2-OH-NaphthaleneC1-OH-NaphthaleneC2-OH-NaphthaleneC3-OH-Naphthalene
*
*
*
*
**
*
*
*
Figure 15. Concentrations (ng/g bile) of OH-naphthtalenes in caged cod from the groups indicated. The figure shows median, quartiles and 10/90 percentiles of five individuals from each group.

IRIS & NIVA Water Column Monitoring 2006
- 40 -
PRE EXP REF 1 ST 4 ST 3-200
0
200
400
600
800
1000
1-OH-PhenanthreneC1-OH-PhenanthreneC2-OH-Phenanthrene
*
*
*
*
*
*
Figure 16. Concentrations (ng/g bile) of OH-phenanthrenes in caged cod from the groups indicated. The figure shows median, quartiles and 10/90 percentiles of five individuals from each group.
PRE EXPREF 1
ST 3ST 4
0
20
40
60
80
100
120
140
160
ng/g
bile
Figure 17. Concentrations (ng/g bile) of 1-OH-pyrene in caged cod from the groups indicated. The figure shows median, quartiles and 10/90 percentiles of five individuals from each group.

IRIS & NIVA Water Column Monitoring 2006
- 41 -
3.6 AP metabolites in cod bile Significant differences between groups were found for all metabolite compounds (Kruskal-Wallis, P<0.05). This confirms significant bio-concentration and bio-transformation of APs typical for produced water to the fish from the two stations close to the discharge.
REF 1 ST 4 ST 3-20
0
20
40
60
80
100
1202-methylphenol3-methylphenol3,5-dimethylphenol2,4-dimethylphenol2,4,6-trimethylphenol
*
*
*
*
*
* *
*
*
*
Figure 18. Concentrations (ng/g bile) of AP metabolites in caged cod from the groups indicated. The figure shows median, quartiles and 10/90 percentiles of five individuals from each group.

IRIS & NIVA Water Column Monitoring 2006
- 42 -
3.7 Hepatic GST Generally, there were significant differences in hepatic glutathione-S-transferase activity between stations, but not gender related (ANOVA, P<0.0052). The 0-samples had higher GST-activity than the individuals at station 400 (females, P<0.05, Tukey HSD).
GS
Tac
t.(n
mol
/min
/mg
prot
)
PRE EXPREF 1
ST 3ST 4
400
600
800
1000
1200
1400
1600
1800
2000
PRE EXPREF 1
ST 3ST 4
Figure 19. Hepatic Glutathione S-transferase, GST, (nmol/min/mg prot.) activity in cod from the indicated groups. The figure shows median, quartiles and 10/90-percentiles. Males – left panel; females – right panel.
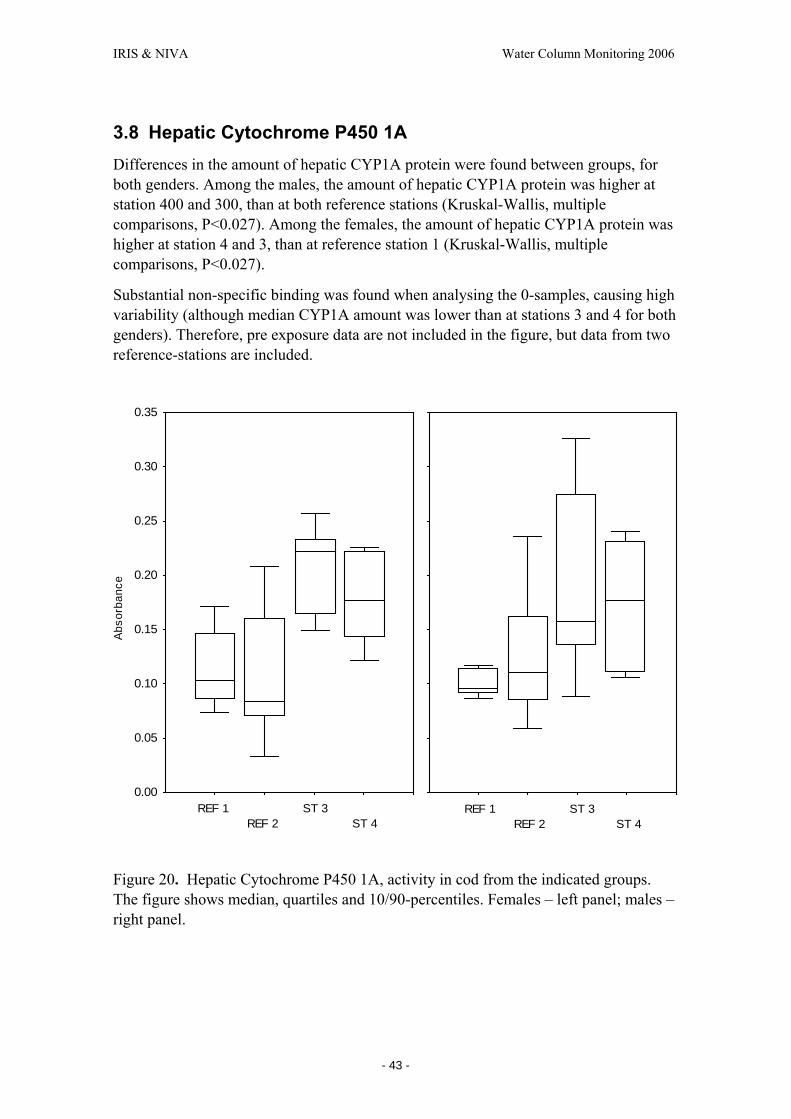
IRIS & NIVA Water Column Monitoring 2006
- 43 -
3.8 Hepatic Cytochrome P450 1A Differences in the amount of hepatic CYP1A protein were found between groups, for both genders. Among the males, the amount of hepatic CYP1A protein was higher at station 400 and 300, than at both reference stations (Kruskal-Wallis, multiple comparisons, P<0.027). Among the females, the amount of hepatic CYP1A protein was higher at station 4 and 3, than at reference station 1 (Kruskal-Wallis, multiple comparisons, P<0.027).
Substantial non-specific binding was found when analysing the 0-samples, causing high variability (although median CYP1A amount was lower than at stations 3 and 4 for both genders). Therefore, pre exposure data are not included in the figure, but data from two reference-stations are included.
Abso
rban
ce
REF 1REF 2
ST 3ST 4
0.00
0.05
0.10
0.15
0.20
0.25
0.30
0.35
REF 1REF 2
ST 3ST 4
Figure 20. Hepatic Cytochrome P450 1A, activity in cod from the indicated groups. The figure shows median, quartiles and 10/90-percentiles. Females – left panel; males – right panel.

IRIS & NIVA Water Column Monitoring 2006
- 44 -
3.9 Vitellogenin
Blood samples were taken from all individuals before deployment (0-samples). The figure depicts the difference in plasma VTG-concentrations from before to after exposure (ΔVTG=[VTG]after exposure – [VTG]before exposure). There was no increase in plasma VTG-concentrations in males at any stations. Median increase in VTG-concentrations in females were highest on station 3, however, this was not significant. A similar trend could be read from the zona radiata protein (ZRP)-results. There was some variability in the gonado-somatic index (GSI;
Figure 11), that could have some influence on the results, especially in the females, where endogenous estrogens could be an influencing factor.
VTG
diff.
(µg/
ml)
REF 1 ST 3 ST 4-20
-10
0
10
20
30
40
50
60
70
80
90
REF 1 ST 3 ST 4
Figure 21. Plasma vitellogenin (ng/ml) in caged cod from the groups indicated. The figure shows median, quartiles and 10/90-percentiles. Males – left panel; females – right panel.
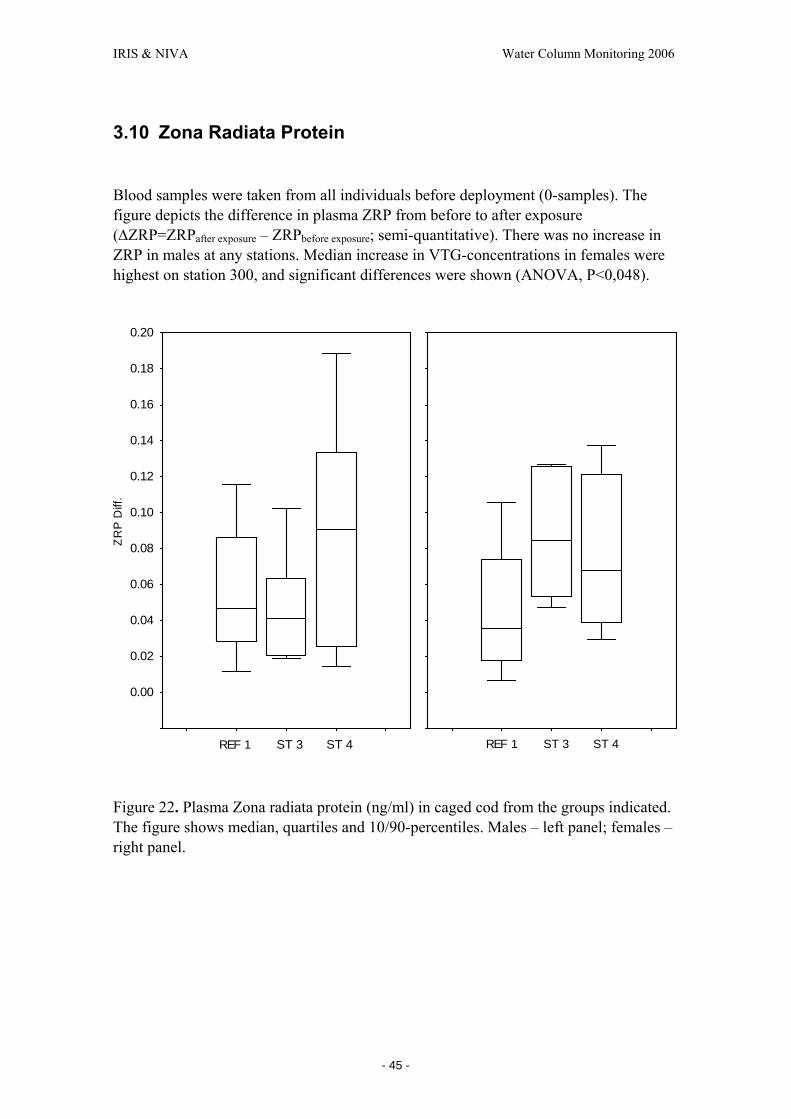
IRIS & NIVA Water Column Monitoring 2006
- 45 -
3.10 Zona Radiata Protein
Blood samples were taken from all individuals before deployment (0-samples). The figure depicts the difference in plasma ZRP from before to after exposure (ΔZRP=ZRPafter exposure – ZRPbefore exposure; semi-quantitative). There was no increase in ZRP in males at any stations. Median increase in VTG-concentrations in females were highest on station 300, and significant differences were shown (ANOVA, P<0,048).
ZRP
Diff
.
REF 1 ST 3 ST 4
0.00
0.02
0.04
0.06
0.08
0.10
0.12
0.14
0.16
0.18
0.20
REF 1 ST 3 ST 4
Figure 22. Plasma Zona radiata protein (ng/ml) in caged cod from the groups indicated. The figure shows median, quartiles and 10/90-percentiles. Males – left panel; females – right panel.

IRIS & NIVA Water Column Monitoring 2006
- 46 -
3.11 DNA adducts The DNA adduct levels found were relatively low, but still indicate that individual fish are affected by PAH contamination. No significant differences between groups were found (P=0.7; ANOVA on log-transformed data). Average levels in cod from station 100 was 1.19 ± 0.70 nmol add/mol normal nucleotides (average ± 95% confidence level), levels from station 3 were 0.74 ± 0.27, and levels from station 4, 1.55 ± 1.10. Number of individuals that had detectable adducts were 7 (37%) from reference station 1, 3 (16%) from station 3, and 7 (37%) from station 4. Other individuals had adduct levels below the detection limits. See Appendix D for details.
REF 1 ST 3 ST 4
0
1
2
3
4
5
6
7
8
9
nmol
add
. / m
ol n
orm
. nuc
leot
ides
Figure 23. DNA adduct levels in liver (nmol add/mol normal nucleotides) in caged cod from the groups indicated. The figure shows median, quartiles and 10/90-percentiles.

IRIS & NIVA Water Column Monitoring 2006
- 47 -
3.12 PAH body burden in mussels In total there were 30 pools of mussels available for PAH analyses; 3 pools from 0-time sampling, and 3 pools from 9 different stations (30 samples in total). Of these; Battelle analysed all the stations, but not the 0-time sampling. Seven of the blue mussel samples analysed for PAH content were analysed both by both NIVA and by Battelle (3 pools from reference station 1, and 2 pools from stations 3 and 4). Three of the blue mussel samples were only analysed by NIVA (zero-time sampling). NIVAs results are given in Appendix B, and the results for analyses performed by Battelle are given in Appendix F. The results in the figures in this chapter are based on the analyses by Battelle.
There were no pronounced differences in the mussel lipid content among stations (Figure 24), and data for PAHs are presented on a wet-weight basis (ng/g; Figures 25 to 30). Due to the small sample sizes (n=3 pools in each group), statistical evaluation was not performed. Groups with no overlapping values can be regarded as different. The results are shown as Sum-PAH16, Total PAH (from naphthalenes; see Appendix F), Total dibenzothiophenes, total phenanthrenes/anthracenes, total naphthalenes and total decalins, respectively.
As is evident from Figure 25, the sum PAH-16 is low for the two reference stations, higher in stations 5-6, and highest for stations 2, 3 and 4 closest to the discharge. This pattern is even more pronounced when looking at total PAHs, single PAHs, decalins and alkylated PAHs (Figures 26-30).
Figure 24. Lipid content (%) of mussels from the groups indicated. The figure shows median and min./max.
REF 1 REF 2
ST 1ST 2
ST 3 ST 4ST 5
ST 6
1,6
1,7
ST 3 2M
1,0
1,1
1,2
1,3
1,4
1,5
1,8

IRIS & NIVA Water Column Monitoring 2006
- 48 -
Figure 25. Concentrations (ng/g wet wt) shown as Sum-PAH16 in caged mussels from the groups indicated. Boxes depict median and min-max (individual observations, since n=3).
REF 1 REF 2
ST 1ST 2
ST 3 ST 4ST 5
ST 6
24
22 20
18 16 14 12 10
8 6 4 2 0
ST 3 2M

IRIS & NIVA Water Column Monitoring 2006
- 49 -
Figure 26. Concentrations (ng/g wet wt) shown as total PAH (from naphtalene; see Appendix F) in caged mussels from the groups indicated. Boxes depict median and min-max (individual observations, since n=3).
REF 1 REF 2
ST 1ST 2
ST 3 ST 4ST 5
ST 6
500
600
0
-100
100
200
300
400
ST 3 2M

IRIS & NIVA Water Column Monitoring 2006
- 50 -
Figure 27. Concentrations (ng/g wet wt) shown as total benzothiophenes in caged mussels from the groups indicated. Boxes depict median and min-max (individual observations, since n=3).
REF 1 REF 2
ST 1ST 2
ST 3 ST 4ST 5
ST 6 ST 3 2M
-10
0
10
20
30
40
50
60
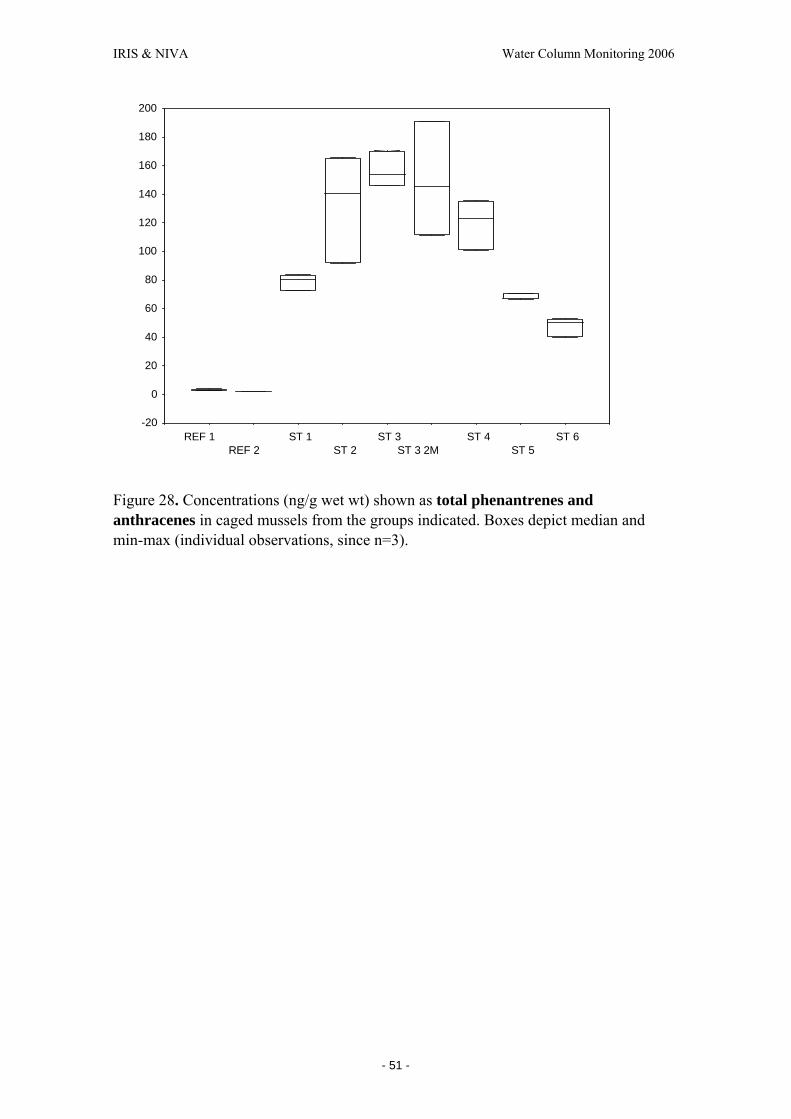
IRIS & NIVA Water Column Monitoring 2006
- 51 -
Figure 28. Concentrations (ng/g wet wt) shown as total phenantrenes and anthracenes in caged mussels from the groups indicated. Boxes depict median and min-max (individual observations, since n=3).
REF 1 REF 2
ST 1 ST 2
ST 3ST 3 2M
ST 4ST 5
ST 6 -20
0
20
40
60
80
100
120
140
160
180
200

IRIS & NIVA Water Column Monitoring 2006
- 52 -
Figure 29. Concentrations (ng/g wet wt) shown as total naphtalenes in caged mussels from the groups indicated. Boxes depict median and min-max (individual observations,
since n=3).
ST 1ST 2
ST 3 ST 4ST 5
ST 6 REF 2
REF 1 ST 3 2M
180 160
140
120
100 80
60
40 20
0
-20

IRIS & NIVA Water Column Monitoring 2006
- 53 -
Figure 30. Concentrations (ng/g wet wt) shown as total decalins in caged mussels from the groups indicated. Boxes depict median and min-max (individual observations, since n=3).
Relative concentrations of alkylated PAHs to parent compounds:
The PAHs found in coal and petroleum often contain one or more methyl (C1), ethyl (C2), propyl (C3), butyl (C4), or (occasionally) higher alkyl substituents on one or more of the aromatic carbons. These alkyl PAHs are generally more abundant than the parent PAHs in petroleum, but are less abundant than the parent PAHs in pyrogenic PAH mixtures. It is earlier shown that mussels caged down-stream of produced water discharges from oil platforms accumulate higher concentrations of alkylnapthalenes, alkylphenanthrenes and alkyldibenzothiophenes, than their respective parent compounds (Ruus et al. 2006 Hylland et al. 2005). Figures 31-36 show this pattern, with higher alkyl-compounds:parent-compound ratios in mussels closest to the produced water discharge.
ST 1ST 2
ST 3 ST 4ST 5
ST 6 ST 3 2MREF 2
REF 1
700
600
500
400
300
200
100
0
-100
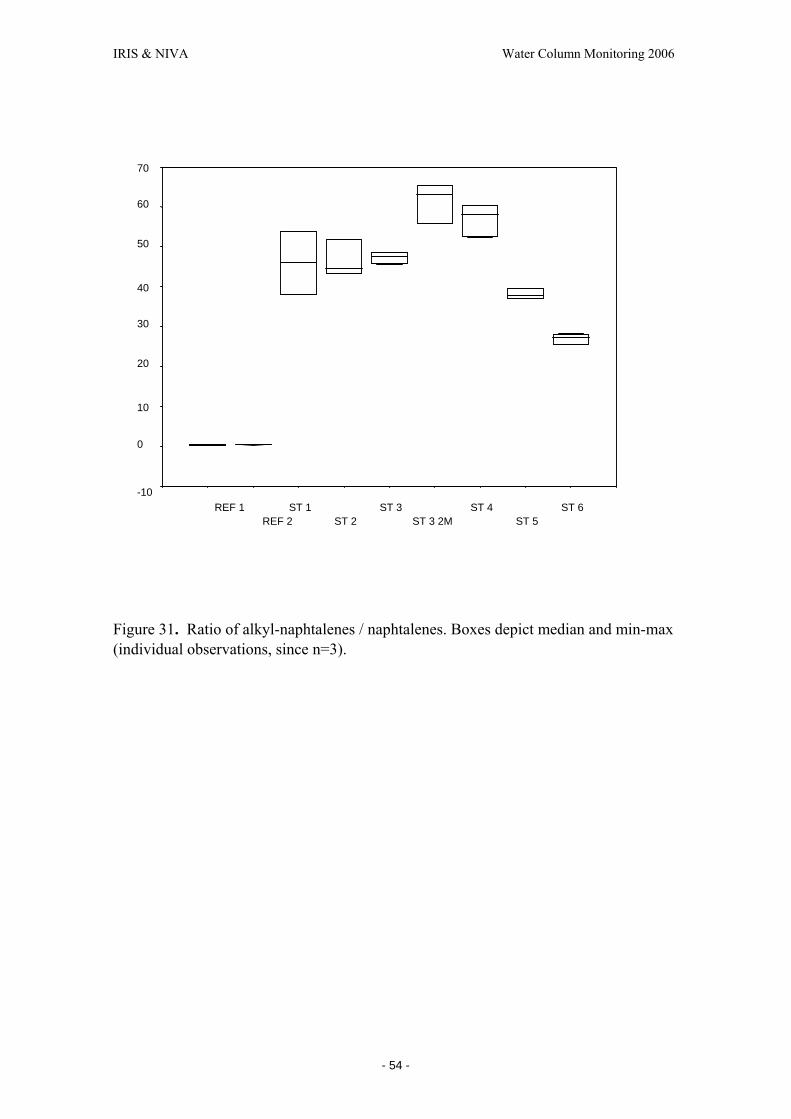
IRIS & NIVA Water Column Monitoring 2006
- 54 -
Figure 31. Ratio of alkyl-naphtalenes / naphtalenes. Boxes depict median and min-max (individual observations, since n=3).
ST 1 ST 2
ST 3 ST 4ST 5
ST 6 ST 3 2M REF 2
REF 1-10
0
10
20
30
40
50
60
70

IRIS & NIVA Water Column Monitoring 2006
- 55 -
Figure 32. Ratio of alkyl-fluorenes / fluorene. Boxes depict median and min-max (individual observations, since n=3).
REF 1REF 2
ST 1ST 2
ST 3ST 3 2M
ST 4ST 5
ST 6
70
60
50
40
30
20
10
0
-10
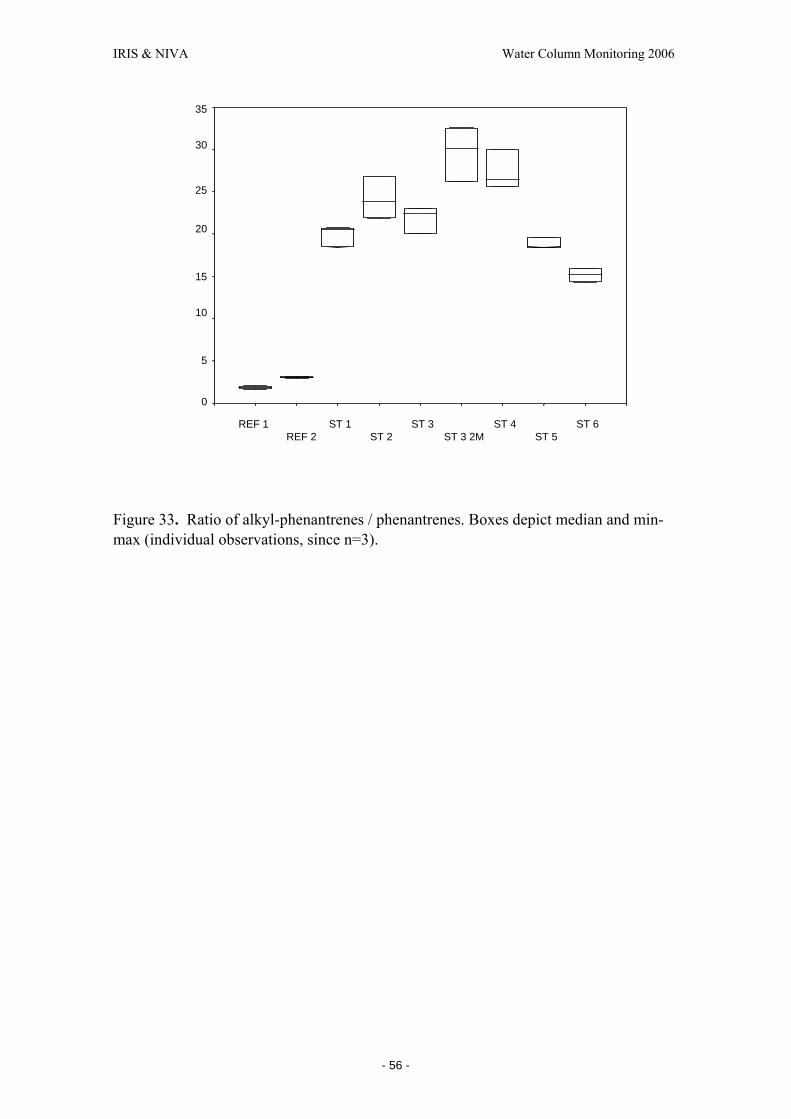
IRIS & NIVA Water Column Monitoring 2006
- 56 -
Figure 33. Ratio of alkyl-phenantrenes / phenantrenes. Boxes depict median and min-max (individual observations, since n=3).
ST 1ST 2
ST 3 ST 4ST 5
ST 6 ST 3 2M
REF 1 REF 2
35
30
25
20
15
10
5
0
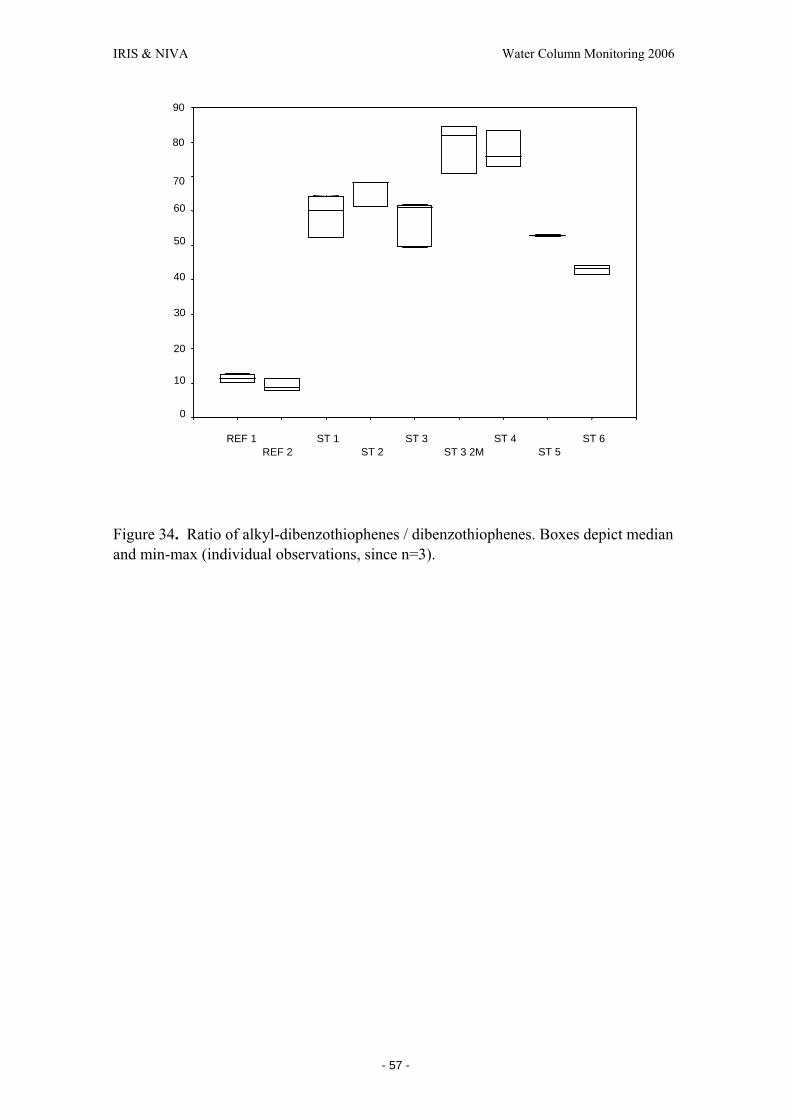
IRIS & NIVA Water Column Monitoring 2006
- 57 -
Figure 34. Ratio of alkyl-dibenzothiophenes / dibenzothiophenes. Boxes depict median and min-max (individual observations, since n=3).
ST 1ST 2
ST 3 ST 4ST 5
ST 6
90
ST 3 2MREF 2 REF 1
80
70
60
50
40
30
20
10
0
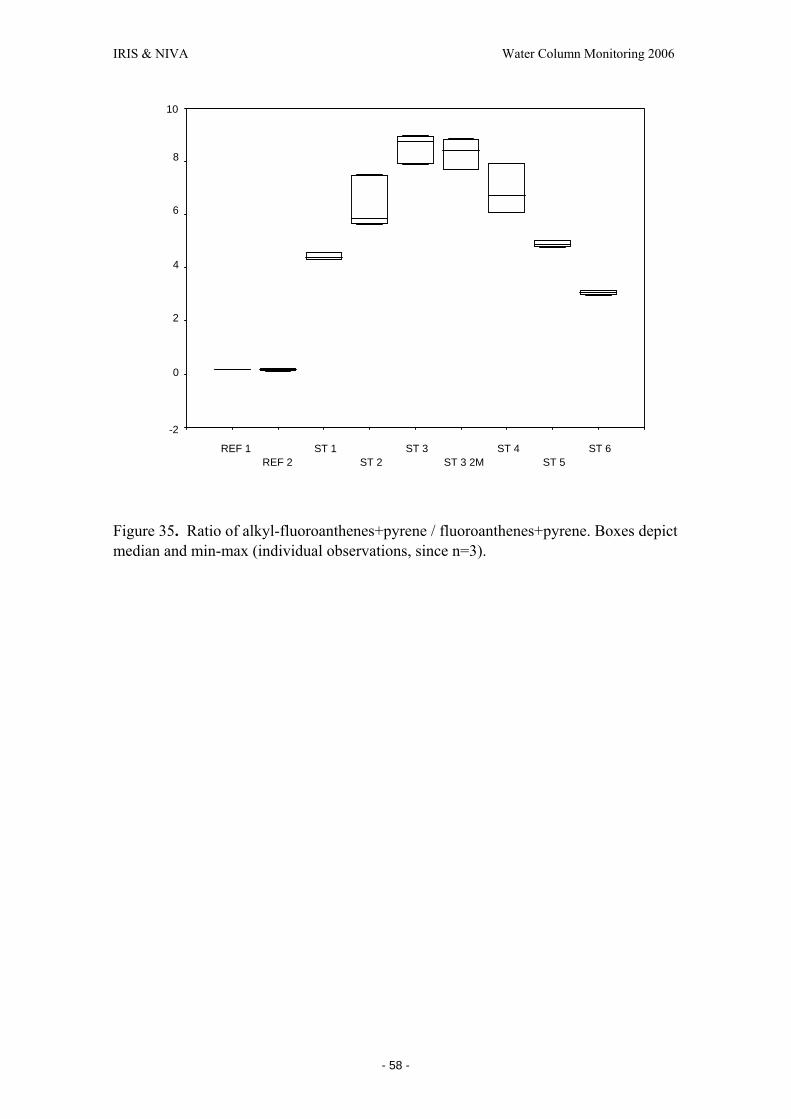
IRIS & NIVA Water Column Monitoring 2006
- 58 -
Figure 35. Ratio of alkyl-fluoroanthenes+pyrene / fluoroanthenes+pyrene. Boxes depict median and min-max (individual observations, since n=3).
ST 1ST 2
ST 3 ST 4ST 5
ST 6 REF 1 REF 2 ST 3 2M
10
8
6
4
2
0
-2
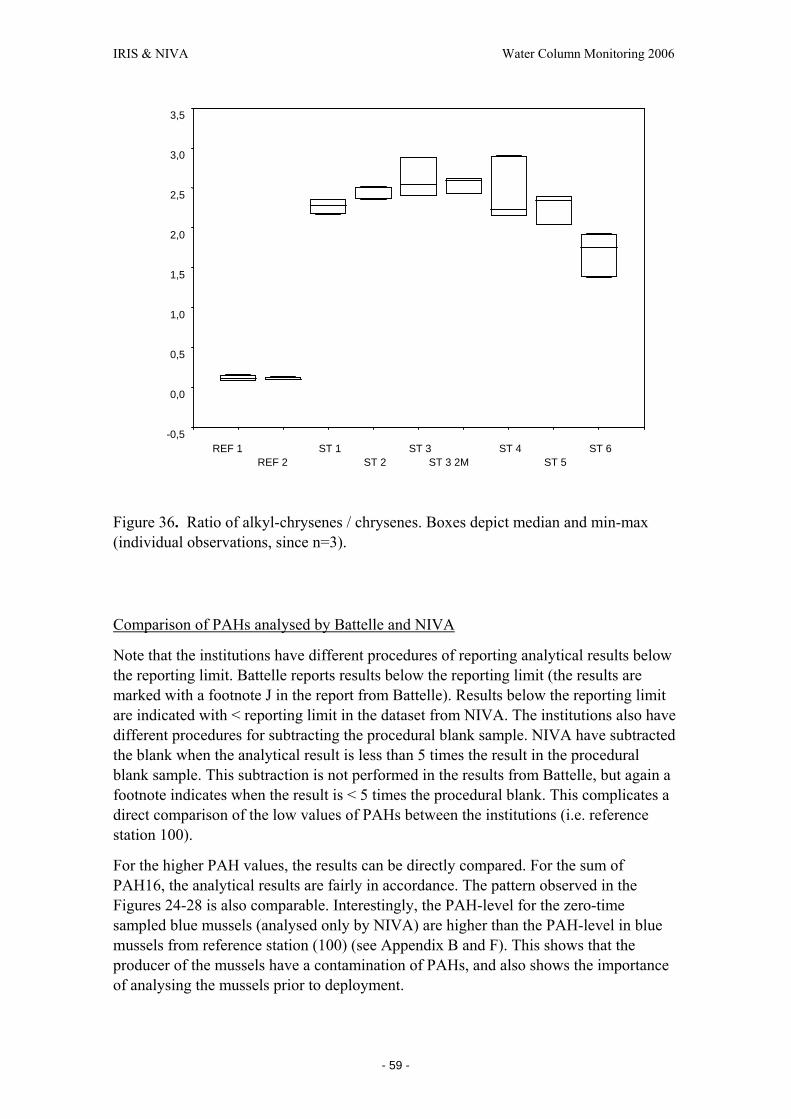
IRIS & NIVA Water Column Monitoring 2006
- 59 -
Figure 36. Ratio of alkyl-chrysenes / chrysenes. Boxes depict median and min-max (individual observations, since n=3).
Comparison of PAHs analysed by Battelle and NIVA
Note that the institutions have different procedures of reporting analytical results below the reporting limit. Battelle reports results below the reporting limit (the results are marked with a footnote J in the report from Battelle). Results below the reporting limit are indicated with < reporting limit in the dataset from NIVA. The institutions also have different procedures for subtracting the procedural blank sample. NIVA have subtracted the blank when the analytical result is less than 5 times the result in the procedural blank sample. This subtraction is not performed in the results from Battelle, but again a footnote indicates when the result is < 5 times the procedural blank. This complicates a direct comparison of the low values of PAHs between the institutions (i.e. reference station 100).
For the higher PAH values, the results can be directly compared. For the sum of PAH16, the analytical results are fairly in accordance. The pattern observed in the Figures 24-28 is also comparable. Interestingly, the PAH-level for the zero-time sampled blue mussels (analysed only by NIVA) are higher than the PAH-level in blue mussels from reference station (100) (see Appendix B and F). This shows that the producer of the mussels have a contamination of PAHs, and also shows the importance of analysing the mussels prior to deployment.
REF 1REF 2
ST 1ST 2
ST 3ST 3 2M
ST 4ST 5
ST 6 -0,5
0,0
0,5
1,0
1,5
2,0
2,5
3,0
3,5
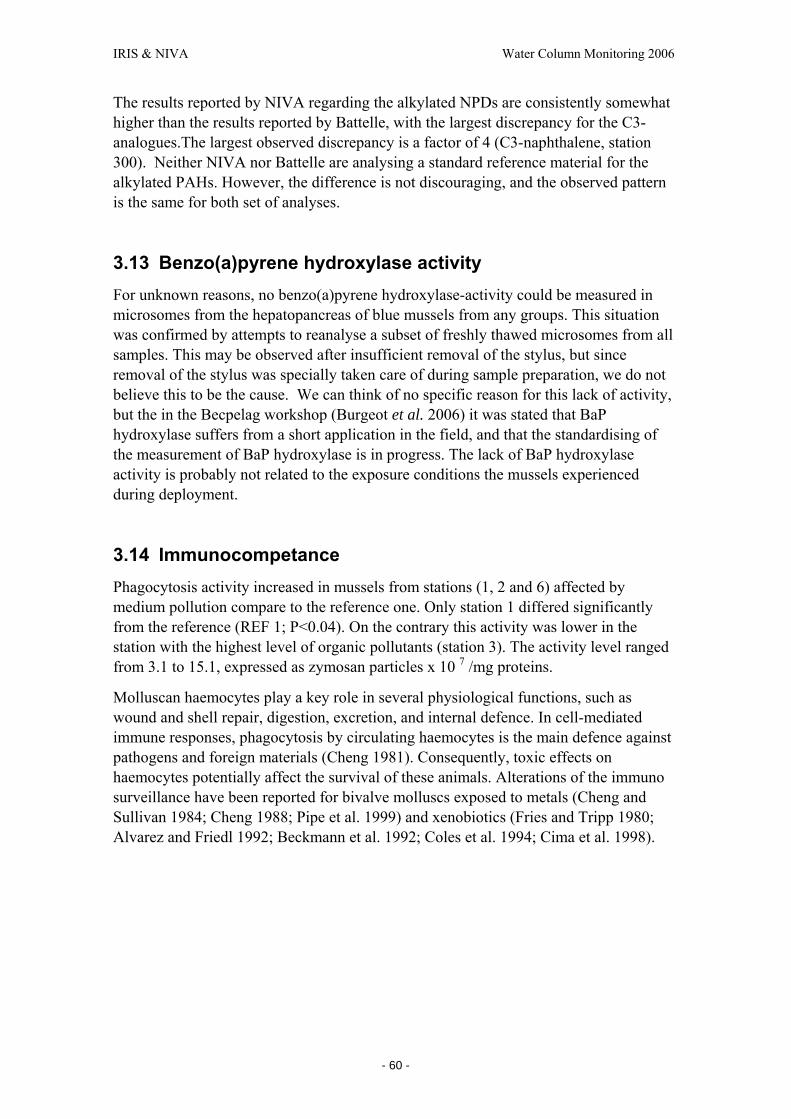
IRIS & NIVA Water Column Monitoring 2006
- 60 -
The results reported by NIVA regarding the alkylated NPDs are consistently somewhat higher than the results reported by Battelle, with the largest discrepancy for the C3-analogues.The largest observed discrepancy is a factor of 4 (C3-naphthalene, station 300). Neither NIVA nor Battelle are analysing a standard reference material for the alkylated PAHs. However, the difference is not discouraging, and the observed pattern is the same for both set of analyses.
3.13 Benzo(a)pyrene hydroxylase activity For unknown reasons, no benzo(a)pyrene hydroxylase-activity could be measured in microsomes from the hepatopancreas of blue mussels from any groups. This situation was confirmed by attempts to reanalyse a subset of freshly thawed microsomes from all samples. This may be observed after insufficient removal of the stylus, but since removal of the stylus was specially taken care of during sample preparation, we do not believe this to be the cause. We can think of no specific reason for this lack of activity, but the in the Becpelag workshop (Burgeot et al. 2006) it was stated that BaP hydroxylase suffers from a short application in the field, and that the standardising of the measurement of BaP hydroxylase is in progress. The lack of BaP hydroxylase activity is probably not related to the exposure conditions the mussels experienced during deployment.
3.14 Immunocompetance Phagocytosis activity increased in mussels from stations (1, 2 and 6) affected by medium pollution compare to the reference one. Only station 1 differed significantly from the reference (REF 1; P<0.04). On the contrary this activity was lower in the station with the highest level of organic pollutants (station 3). The activity level ranged from 3.1 to 15.1, expressed as zymosan particles x 10 7 /mg proteins.
Molluscan haemocytes play a key role in several physiological functions, such as wound and shell repair, digestion, excretion, and internal defence. In cell-mediated immune responses, phagocytosis by circulating haemocytes is the main defence against pathogens and foreign materials (Cheng 1981). Consequently, toxic effects on haemocytes potentially affect the survival of these animals. Alterations of the immuno surveillance have been reported for bivalve molluscs exposed to metals (Cheng and Sullivan 1984; Cheng 1988; Pipe et al. 1999) and xenobiotics (Fries and Tripp 1980; Alvarez and Friedl 1992; Beckmann et al. 1992; Coles et al. 1994; Cima et al. 1998).

IRIS & NIVA Water Column Monitoring 2006
- 61 -
REF 1 ST 1 ST 2 ST 3 ST 4 ST 5 ST 6-5
0
5
10
15
20
25
30
35
40
Pha
gozy
tosi
s
*
Figure 37. Phagocytosis activity levels expressed as zymosan particles x 10 7 /mg proteins.
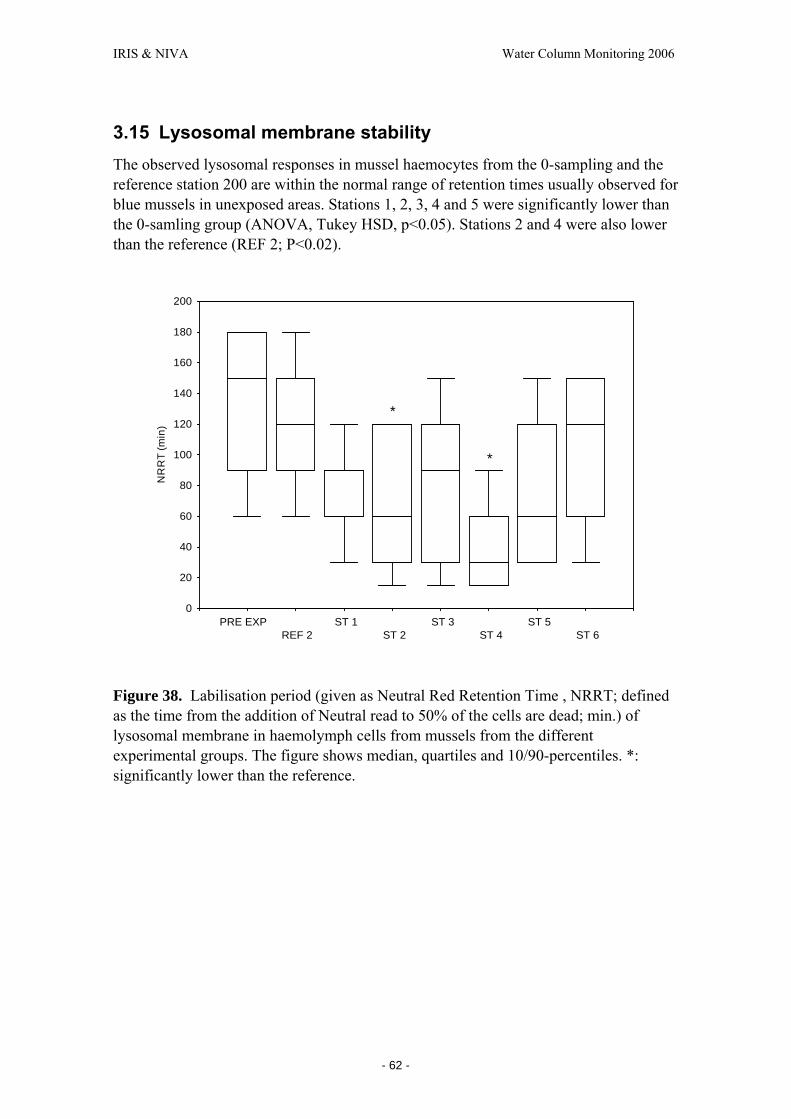
IRIS & NIVA Water Column Monitoring 2006
- 62 -
3.15 Lysosomal membrane stability The observed lysosomal responses in mussel haemocytes from the 0-sampling and the reference station 200 are within the normal range of retention times usually observed for blue mussels in unexposed areas. Stations 1, 2, 3, 4 and 5 were significantly lower than the 0-samling group (ANOVA, Tukey HSD, p<0.05). Stations 2 and 4 were also lower than the reference (REF 2; P<0.02).
PRE EXPREF 2
ST 1ST 2
ST 3ST 4
ST 5ST 6
0
20
40
60
80
100
120
140
160
180
200
NR
RT
(min
)
*
*
Figure 38. Labilisation period (given as Neutral Red Retention Time , NRRT; defined as the time from the addition of Neutral read to 50% of the cells are dead; min.) of lysosomal membrane in haemolymph cells from mussels from the different experimental groups. The figure shows median, quartiles and 10/90-percentiles. *: significantly lower than the reference.
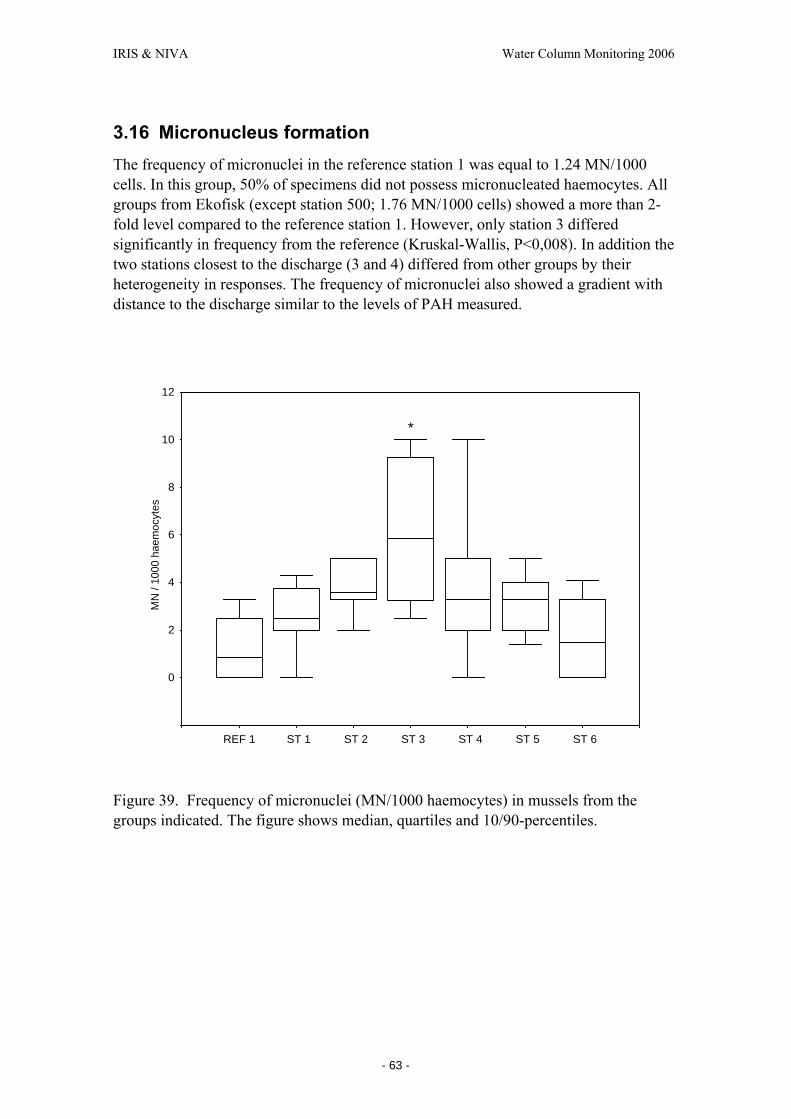
IRIS & NIVA Water Column Monitoring 2006
- 63 -
3.16 Micronucleus formation The frequency of micronuclei in the reference station 1 was equal to 1.24 MN/1000 cells. In this group, 50% of specimens did not possess micronucleated haemocytes. All groups from Ekofisk (except station 500; 1.76 MN/1000 cells) showed a more than 2-fold level compared to the reference station 1. However, only station 3 differed significantly in frequency from the reference (Kruskal-Wallis, P<0,008). In addition the two stations closest to the discharge (3 and 4) differed from other groups by their heterogeneity in responses. The frequency of micronuclei also showed a gradient with distance to the discharge similar to the levels of PAH measured.
REF 1 ST 1 ST 2 ST 3 ST 4 ST 5 ST 6
0
2
4
6
8
10
12
MN
/ 10
00 h
aem
ocyt
es
*
Figure 39. Frequency of micronuclei (MN/1000 haemocytes) in mussels from the groups indicated. The figure shows median, quartiles and 10/90-percentiles.

IRIS & NIVA Water Column Monitoring 2006
- 64 -
3.17 Histology in mussels Neutral lipid accumulation
Neutral lipid accumulation was significantly lower in stations, 3 and 4 compared to the control (Ref 1; Kruskal-Wallis, multiple comparisons, P<0.03). Low values were also found in station 5 and 6, showing a general inhibition of this class of lipid accumulation in the stations around the discharge.
REF 1 ST 1 ST 2 ST 3 ST 4 ST 5 ST 60
100000
200000
300000
400000
500000
600000*
*
*
Figure 40. Neutral lipid accumulation given as optical density in mussels from the groups indicated. The figure shows median, quartiles and 10/90-percentiles.

IRIS & NIVA Water Column Monitoring 2006
- 65 -
Figure 41. Histological sections (400 X magnification) showing neutral lipid accumulation (arrows) in mussel digestive gland from the groups indicated.
Lipofuscin lysosomal accumulation
Lipofuscin accumulation in lysosomes of mussel digestive gland was significantly lower in all the sites around the discharge compared to the reference site (Ref 1; Kruskal-Wallis, multiple comparisons, P<0.0004). Lipofuscin accumulation is the result of peroxidation of authophagocytosed proteins associated with protein aggregates and oxidatively damaged organelles. There was a significantly higher presence of vacuoles in all mussel groups caged in the proximity of the discharge compared to the reference.
REF 1
ST 1 ST 3 ST 4
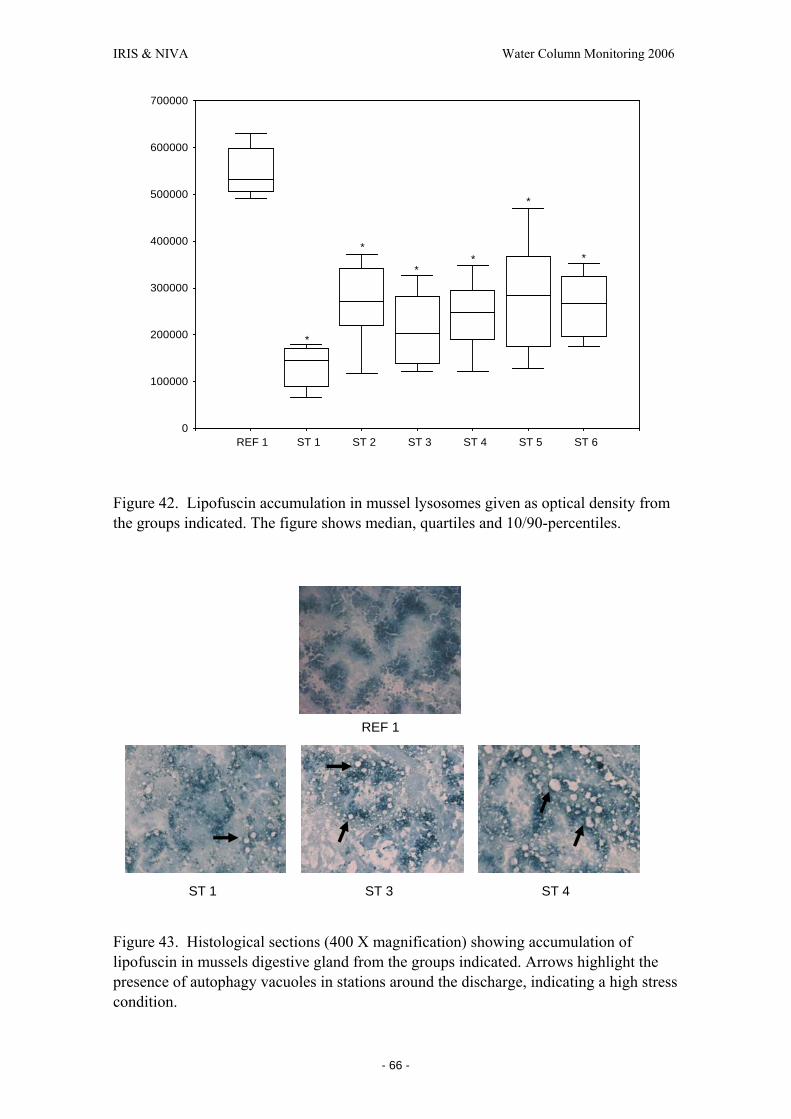
IRIS & NIVA Water Column Monitoring 2006
- 66 -
REF 1 ST 1 ST 2 ST 3 ST 4 ST 5 ST 60
100000
200000
300000
400000
500000
600000
700000
*
*
**
*
*
Figure 42. Lipofuscin accumulation in mussel lysosomes given as optical density from the groups indicated. The figure shows median, quartiles and 10/90-percentiles.
Figure 43. Histological sections (400 X magnification) showing accumulation of lipofuscin in mussels digestive gland from the groups indicated. Arrows highlight the presence of autophagy vacuoles in stations around the discharge, indicating a high stress condition.
REF 1
ST 1 ST 3 ST 4

IRIS & NIVA Water Column Monitoring 2006
- 67 -
4 Discussion
At caging depth temperature increased from 5.5 to 9.5 °C during the deployment period showing a natural spring situation. The salinity was generally stable at ∼35‰ and a less saline surface layer (0-5 m) was encountered at some occasions. Due to low availability of food in the cages the experimental cod lost weight during deployment, as expressed by higher mean condition index in the 0-sample-group, than in the other groups. In general the material was homogeneous and suitable for comparison among groups.
4.1 Tissue levels of PAHs in caged mussels The results from the present Water Column Monitoring survey show that caged organisms from all locations in the proximity of Ekofisk have been exposed to moderate levels of produced water components. For comparison, the concentrations of ΣPAH16 accumulated in mussels closest to the produced water discharge (Station 3) were an order of magnitude higher than in mussels 500 m from the Statfjord B platform in the 2004-monitoring (Hylland et al. 2005). The concentrations were comparable with those found earlier in the vicinity of Troll (23 ng/g wet weight; Utvik et al. 1999) and 500 m from Statfjord B in 2001 (BECPELAG; 34.5 ng/g wet weight).
Analyses performed by NIVA, shows that the level of PAHs were higher in the pre exposure mussels than in the reference station 1. This shows the importance of analysing mussels prior to deployment since contamination might be present at the farm site.
4.2 Effect responses in caged mussels Chemistry data indicated that mussels were exposed to PAHs and biological responses were also observed.
For unknown reasons, no benzo(a)pyrene hydroxylase-activity could be measured in microsomes from the hepatopancreas of blue mussels from any groups. The results were confirmed by reanalyses on a subset of freshly thawed microsomes from all samples (St 1). The background for the failing analysis is not known but quality of analysis reagents is a possible explanation.
Phagocytosis activity has been shown to increase when animals are exposed to low dose of contaminants (Pipe et al. 1999). This is in agreement with the present finding, where this activity was higher in some stations (1, 2, 4 and 6) compared to the control. On the other hand, animals exposed to higher doses of pollutants have been reported to have an inhibition of the phagocytosis activity, as might be the case for mussels from station 3. The immune system is known to be dynamic and a 6 weeks long exposure could be long enough to allow an adaptation of the animals.
The observed lysosomal responses in mussel haemocytes from the pre exposure sampling and the reference station 2 were within the normal range of retention times usually observed for mussels in unexposed areas. All stations off Ekofisk showed
IRIS & NIVA Water Column Monitoring 2006
- 68 -
shorter retention time indicating stress. The differences in this parameter followed the same gradient as for PAH body burden.
A similar gradient was seen in hemocyte micronuclei formation in mussel, although only mussels caged at station 3 had significantly increased levels compared to mussels caged at the reference location. Formation of micronuclei indicates that the PW contains genotoxic compounds in sufficient amounts to cause effects in the sea close to the discharge.
Histology: Also the histological studies of mussels indicated that the mussels were stressed. The results showed lower levels of neutral lipids in 4 stations (1, 4, 5 and 6). Intracellular accumulation of neutral lipids in lysosomes digestive cells has been used as a complementary indication of exposure to organic pollutant (Lowe and Clarke, 1989, Cajaraville, 1991; Regoli, 1992). Moderate levels of PAH exposure normally causes increased levels of neutral lipids.
The lipofuscin accumulation assay also gave an indication of stress in animals from all the stations off Ekofisk compared to the field control. Lipofuscin accumulation is expected to increase in case of organic or metal contamination (Moore, 1988; Regoli, 1992). A possible explanation of the decrease seen in the present study could be the complexity of the xenobiotic mixture in produced water, compared to less chemically complex discharges tested elsewhere.
Nutritional deprivation is an established inducer of autophagy in mussel digestive gland, and recent data indicated that autophagy induced by stress reduces the formation of lipofuscin in oxidatively stressed mussel (Moore et al., 2006). The present results are in agreement with this and the image analysis performed in mussel digestive gland from the Ekofisk area showed a presence of vacuoles, resulting from autophagy. This clearly indicates a stress condition in mussels which is often related to oxidative stress.
4.3 PAH- and AP metabolites in cod bile Low but quantifiable levels of pyrene metabolites in the bile of pre exposure fish indicate that the cod had been exposed to low levels of PAHs prior to deployment. The origin for the pyrene present as OH-pyrene in the cod bile is unknown. Possible sources can be the commercial fish feed, pump lubricants or exhaust from vehicles at the farm site. Presence of the observed levels is not believed to affect the quality of the material for the monitoring purposes significantly.
For all PAH and AP metabolite compounds measured, both stations at Ekofisk were significantly different from the reference station. This confirms significant uptake and bio-transformation of PAHs and APs typical for produced water to the fish from the two stations close to the discharge.
4.4 Exposure and effect responses in caged cod The results for PAH-metabolites in the bile of cod suggest that exposure levels have been evident but moderate, at least during the last week prior to sampling (due to continuous removal by excretion). The exposure was clearly sufficient to induce elevated amounts of hepatic cytochrome P450 (CYP-1A) enzymes in the fish. Several studies have indicated that P450 induction may be the first step in a series of toxic

IRIS & NIVA Water Column Monitoring 2006
- 69 -
symptoms, such as immuno suppression, vitamin and hormonal imbalance, and reproductive failure (Reviewed by Safe, 1994).
There was no increase in plasma VTG-concentrations in males at any stations. Median increase in VTG-concentrations in females were highest on station 3, however, this was not significant. A similar (and significant) trend could be read from the zona radiata protein (ZRP)-results. Arukwe et al. (1997) have shown that ZRP-proteins are sensitive markers for low dosages of xenoestrogens, but it was surprising that the increase was observed in females, and not males.
There was a tendency towards lower GST-activities (both genders) at the stations closer to the discharge, as compared to the reference and 0-time samples (significant differences between 0-time samples and station 4 for females). This could indicate inhibition of these enzymes by produced water components. Furthermore, GSTs are affected by radicals, and the observed results could also be related to the availability of GSH, i.e. the reduced activity could be a result of oxidative stress.
The levels of DNA adducts found were in general low, however some individual fish from all stations (including the field reference station) showed elevated levels of DNA adducts. This indicates that the fish has been exposed to genotoxic pollutants beyond their short term DNA repair capacity. Variability in DNA adduct level among individuals is also recorded for cod, saithe and haddock from the Ling/Egersund bank area in the Condition Monitoring. Few studies on DNA adduct levels in wild cod from open seas in general have been published. But for comparison, Aas et al. (2003) studied DNA adduct levels in ten individuals of cod, from the Barents Sea. Six of them had detectable adduct levels with an average of 0.75 ± 0.58 (± SD) nmol add/mol normal nucleotides (average of individuals with adducts only), to be compared with 2.19, 1.55 and 3.32 for reference 1, station 3 and 4 respectively. Levels of DNA adducts in wild bottom associated fish from the Tampen area show 10-fold higher levels (Beyer et al. 2004), indicating that the bottom sediments holds more of the heavier and more adduct forming PAH compounds than what is dominating in PW. Cod collected close to the discharges from aluminium smelter industry show up to 50-fold higher DNA adducts levels compared to what is found in the present study (Aas et al. 2001). The significant uptake and bio transformation of PAHs found in the present study together with the relatively low levels of DNA adducts found, suggest low levels of adduct forming compounds in the PW discharge.
4.5 Preliminary ecological risk assessment based on lysosomal stability in mussels. For the WCM 1999 an evaluation of environmental risk was carried out based on PAH body burden in mussels (Neff 2000). The evaluation performed by Battelle concluded that the discharge of PW at Ekofisk did not represent any environmental risk for marine life 0.5 km or further away from the discharge point. Uptake of organic compounds in mussels was compared with body burden threshold levels for acute lethality and chronic effects by dividing the threshold level for acute lethality with an application factor of 100.
The basis from WCM 2006 is better for such an evaluation because the biomarkers give a more direct measure of the organism’s health status. These markers cover more types of chemical stress than critical levels based on chemical load are able to.

IRIS & NIVA Water Column Monitoring 2006
- 70 -
Acute lethality / chronic effects are related to a stress caused by a particular type of chemical compound. In cases where stress other than by PAHs influences the situation this would also be intercepted with the biomarker approach but not with the chemical based approach.
Biomarker based risk assessment is limited by the lack of connections between marker level and effect data, information that will be provided in the future. However, for lysosomal stability (NRR) levels have recently been established (OSPAR 2007). For this method, animals are considered to be healthy if NRR is >120 minutes; stressed but compensating if <120 but >50 minutes and severely stressed and probably exhibiting pathology if <50 minutes.
Based on NNR data from WCM 2006 we can conclude the same as in Battetelles report (Neff 2000) and obtain a more balanced evaluation due to more reliable data (Figure 44). Stress is indicated in mussels from all stations situated in the proximity of Ekofisk, however only Station 4 (situated close to the discharge) show NRRT levels indicating severe stress.
0
20
40
60
80
100
120
140
160
PRE EXP REF 2 ST 1 ST 2 ST 3 ST 4 ST 5 ST 6
NR
RT
(min
)
Healty
Stressed butcompensating
Severely stressedand probablyexhibiting pathology
Figure 44. Lysosomal membrane stability in mussels from WCM 2006 (given as Neutral Red Retention Time, NRRT) with the stress definitions defined in OSPAR (2007)
5 Comparison of PAH body burden WCM 1999 vs. 2006
In order to give an indication of discharge development at Ekofisk from 1999 to 2006 a comparison of uptake of organic compounds was carried out. The stations that were compared are encircled in blue in Figure 1.

IRIS & NIVA Water Column Monitoring 2006
- 71 -
5º W 0º 5º E 10º E52º N
56º N
60º N100 km
NORWAY
DENMARK
UK
REF 1
REF 2
REF 1REF 2
ST 1
ST 3
ST 4
ST 6
X
1 km
Discharge
Curre
nt a
xisWCM 1999
WCM 2006
ST 1
ST 2
ST 4ST 5
Figure 45. Map showing positions of WCM 1999 and WCM 2006 mussel stations, cages used for comparison are indicated with blue rings.
The stations closest to the discharge where data are available for comparison were Station 1-1999 and Station 4-2006 situated SW, 500 and 600 metres away respectively. Station 4-2006 had 41.4 % lower levels than Station 1 (1999).
NE of the discharge, Station 4-1999 and Station 6-2006 were used, 1000 and 1100m from the discharge respectively. A 23.3% increase in levels from 1999 to 2006 was observed.
For the reference station 2 (same position both years) a 67.6% reduction was observed, values are given in Figure 46.
A gradient with distance from the discharge was seen for both years.

IRIS & NIVA Water Column Monitoring 2006
- 72 -
1155
1505
18846
2710
4513
0
500
1000
1500
2000
2500
3000
3500
4000
4500
5000
St 1 (1999) St 4 (2006) St 4 (1999) St 6 (2006) Ref 2 (1999) Ref.2 (2006)
ng/g
dry
wei
ght P
AH
's (f
rom
Nap
htal
en
Figure 46. Comparisons of PAH body burden given in ng/g dry weight (from naphthalene). Note that levels are given in wet weight elsewhere in the report.
Results from the comparison must be interpreted with caution since samples are not optimal for comparison. The most important factors expected to influence results are listed below.
1. Locations of cages:
The stations used for comparison did not come from the exact same locations (see Figure 1).
2. Time compared to spring bloom.
WCM 1999: ~ 4 weeks, sampling 12th May
WCM 2006: ~ 6 weeks, sampling 22-22th May
Since lipophilic compounds tend to adsorb to biological surfaces like that of micro algae, differences in time compared to the spring phytoplankton bloom may affect bio availability (increased particle density will most likely increase bio availability of PAHs to filter feeding organisms such as mussels, zooplankton etc.).

IRIS & NIVA Water Column Monitoring 2006
- 73 -
3. Exposure duration
Due to lack of efficient metabolising physiology mussels accumulate PAHs over time and the 50% increase in duration from1999 to 2006 could certainly affect results.
The comparison must therefore be considered as an indication.
4. Changes in discharge volume and quality in not taken into consideration.
6 Conclusions and recommendations for future WCMs
Results show that deployed organisms from the whole investigated area contained moderate levels of hydrocarbons expected to originate from produced water. The levels were within the range found in previous years. This would likely also apply to other oil related compounds than PAH. Caged blue mussels did accumulate PAHs during the, field exposure especially 2- and 3-ring components. Bioaccumulation levels followed the expected gradient with distance to the discharge along the current axis in the area.
The lowest levels were found in 0-time mussels and in mussels held at the reference location. There was a significant increase in micronucleus formation in haemocytes of mussels caged close to the discharge with a gradient along the current axis. It is known that micronucleus formation is commonly observed as a response to PAH exposure. There were histological changes in mussels from all stations off Ekofisk although the examined tissue showed different responses than normally seen after PAH exposure. A possible explanation could be the complex chemical composition of PW compared to the more PAH dominated discharges previously tested with the methods.
For all PAH and AP metabolite compounds measured in cod bile, both stations at Ekofisk were significantly different from the reference station. This confirms significant uptake and bio-transformation of PAHs and APs typical for produced water to the fish from the two stations close to the discharge (St 3 and 4).
The exposure was sufficient to induce elevated amounts of hepatic cytochrome P450 (CYP) 1A enzymes in the fish. There was no increase in plasma VTG-concentrations in males at any stations; however significant differences between stations were seen for ZRP, however only for females.
Results on hepatic DNA adducts indicate no differences between sampling locations.
PAH body burden, lysosomal membrane stability and micronucleus formation indicate a clear gradient in the signals with distance from the discharge.

IRIS & NIVA Water Column Monitoring 2006
- 74 -
Based on experience from WCM 2006 we propose the following recommendations for future WCMs: Current and temperature measurements at selected cages proved to be successful and of value. Future measurements of this kind will allow a better understanding of plume distribution. The measurements can also reveal to what extent stratification of the water column is present during deployment. CTD measurements performed at the platform also proved valuable, but the following improvements should be made:
- Measurements should be performed regularly during the deployment period – e.g. twice a week to increase resolution.
- SOPs for CTD measurements should be closely followed – in 2006 the high speed of bringing up the instrument invalidated measurements (from bottom to surface)
- The CTD instruments should be lowered all the way to the bottom at each measurement
- The platform management should be involved in organising the taking of measurements
The use of a larger number of mussel cages is a good model for deployment. Cages of mussels are less resource demanding than fish, which allows greater coverage and ensures that some locations are exposed to the plume. The tagging of fish proved to be successful for the measurements of biomarker in individual fish before and after deployment. Improvement of the statistical force of VTG and ZRP measurements were seen in the WCM 2006 when a difference (level after deployment – level before deployment) for each individual fish could be calculated. We therefore recommend that both VTG and ZRP are performed on an individual basis (pre-post exposure) in future WCMs. Other biomarkers should also be evaluated for the benefits of this possibility. Sampling in the spring is advantageous for a number of reasons
- More stable weather simplifies operation of gear - No interference with spawning (neither mussels nor fish) - Colder water reduces chances of negative side effects from increased handling,
due to tagging of fish. Quantifiable levels of PAH contamination is commonly observed in farmed organisms. We therefore encourage sampling of organisms prior to deployment to establish the pre exposure level of contamination. Even though the levels are low and the observed PAH profile differs from profiles typical of oil/PW this should be take into consideration. Such anthropogenic contamination in test organisms could be reduced by selecting source and/or by allowing the organism’s to depurate before deployment. Note that such a strategy would have to be planned well ahead of the deployment. The source farms utilized in WCM 2006 show lower levels of contaminations than seen in previous studies and should therefore be strong candidates in future studies.
IRIS & NIVA Water Column Monitoring 2006
- 75 -
In the WCM 2006, PAH analyses performed on the same samples by both NIVA and Battelle showed that the results were comparable. We recommend that future analyses of PAH should be performed by NIVA because it is:
- Easier access to results/chromatograms for further interpretation of the results - Easier to extend the analytical repertoire if required - The results can be used for publications/other purposes later - Shipment of samples is time-consuming and should be kept to a minimum
For 2008, it is possible that the UK sector will perform a one-off monitoring study using blue mussel cages. We propose that the possibility for coordinating the WCM 2008 with the UK study is investigated and encouraged.

IRIS & NIVA Water Column Monitoring 2006
- 76 -
7 References
Alvarez MR, Friedl FE, Hudson CM, O'Neill R (1992) Uptake and tissue distribution of abiotic particles from the alimentary tract of the American oyster: a simulation of intracellular parasitism. Journal of invertebrate pathology. 59: 3, 290-294 .
Anon. (1999) Work package 6: External fish diseases and liver histopathology. Biological Effects Quality Assurance in Monitoring Programmes (BEQUALM). Report on the first workshop, 21-23 October, 1999. CEFAS Weymouth laboratory, UK.
Arukwe A F.R. Knudsen and A. Goksøyr 1997 Fish zona radiata eggshell protein: a sensitive biomarker for environmental estrogens, Environ. Health Perspect. 105 , pp. 418–422.
Arukwe A, T. Celius, B.T. Walther and A. Goksøyr 2000 Effects of xenoestrogen treatment on zona radiata protein and vitellogenin expression in Atlantic salmon (Salmo salar), Aquat. Toxicol. 49, pp. 159–170.
Balk L, BK Liewenborga et al. (In press). "Large hydrophobic adducts and strand breaks analyzed in hepatic DNA from Atlantic cod (Gadus morhua) caged at the Statfjord oil field." Environ. Toxicol. Chem.
Beach AC, Gupta RC. 1992. Human biomonitoring and the 32P-postlabeling assay. Carcinogenesis 13:1053-1074.
Bechmann RK (1999). "Effect of the endocrine disrupter nonylphenol on the marine copepod Tisbe battagliai." The Science of the Total Environment.
Bechmann RK, IC Taban et al. (in prep). "Effects of PAH componds on the reproduction of Cyprinodon variegatus (sheepshead minnow)."
Beyer J, Balk L, Hylland K (2004) Extra analyses of fish from the Tampen, Sleipner and Egersund offshore fields. Additional documentation of biomarker responses in fish collected in the NFR project 152231/720. AM-report 2004/010.
Berg AH, L Westerlund, PE Olsson (2004) Regulation of Arctic charr (Salvelinus alpinus) egg shell proteins and vitellogenin during reproduction and in response to 17β-estradiol and cortisol, Gen. Comp. Endocrinol. 135 , pp. 276–285.
Beyer J, E Aas et al. (1998) "Bioavailability of PAH in effluent water from an aluminium works evaluated by transplant caging and biliary fluorescence measurements of Atlantic cod (Gadus morhua L.)." Marine Environmental Research 46(1-5): 233-236.
Bradford, M. M. (1976) "A rapid and sensitive method for the quantitation of microgram quantities of protein utilizing the principle of protein-dye binding." Analytical Biochemistry 72: 248-254.

IRIS & NIVA Water Column Monitoring 2006
- 77 -
Brendehaug J, S Johnsen et al. (1992). Toxicity testing and chemical characterization of produced water - A preliminary study. Produced Water. Technological/ Environmental Issues and Solutions. F. R. Engelhart. New York, NY, Plenum Press: 245-260.
Burgeot T, Faucet J, Ménard D, Grosjean P, Bocquené G. (2006). Variations of benzo(a)pyrene hydroxylase and cholinesterase activities in mussels caged in the North Sea (German Bight and Statfjord). pp 171-188. In "ICES workshop on biological effects of contaminants in the pelagic ecosystem (ICES)".Eds: Hylland, K., Vethaak, A.D., Lang, T. SETAC special publications.
Cajaraville MP et al (1991) Automated measurement of lysosomal structure alterations in oocytes of mussels exposed to petroleum hydrocarbons. Arch. Environ. Contam. Toxicol., 21, 395-400.
Cajaraville MP, Marigómez JA, Díez G, Angulo E (1992) Comparative effects of the water accommodated fraction of three oils on mussels -. 2. Quantitative alterations in the structure of the digestive tubules. Comp. Biochem. Contam. Toxicol. 19: 17-24.
Cheng TC 1988. In vivo effects of heavy metals on cellular defence mechanisms of Crassotrea virginica: phagocytic and endocytic indices. J. Invertebr. Pathol. 51:215-220.
Cheng TC, JT Sullivan. 1984. Effects of heavy metals on phagocytosis by mollusca hemocytes. Mar. Envir. Res, 14:305-315
Cima F, Spinazzi R, Ballarin L 1998 Possible tributyltin-calmodulin interaction in morphofunctional alterations of ascidian phagocytes Fresenius Environmental Bull 7 (5A-6A): 396-401
Coles, JA, SR Farley, RK Pipe. 1994. The effects of fluoranthene on the immunocompetence of the common marine mussel Mytilus edulis. Aquat. Toxicol. 30:367-379
Collier, T. K., S. V. Singh, et al. (1992b). "Hepatic xenobiotic metabolizing enzymes in two species of benthic fish showing different prevalences of contaminant associated liver neoplasms." Toxicology and Applied Pharmacology 113(2): 319-324.
Collier, T., S. D. Connor, et al. (1992a). "Using cytochrome P450 to monitor the aquatic environment: Initial results from regional and national surveys." Marine Environmental Research 34: 195-199.
Dunn PB, Black JJ, Maccubbin A. (1987) 32P-Postlabelling analysis of aromatic DNA adducts in fish from polluted areas. Cancer Res. 47, 6543-6548.
Elliot, M., K. L. Hemmingway, et al., Eds. (2003) From the individual to the population and community responses to pollution. Effects of pollution on fish. Molecular effects and population responses, Blackwell Publishing.

IRIS & NIVA Water Column Monitoring 2006
- 78 -
Ericson, G. and Balk, L. (2000) DNA adduct formation in northern pike (Esox lucius) exposed to a mixture of benzo(a)pyrene, benzo(k)fluoranthene and 7H-dibenzo(c,g)carbazole: time-course and dose-response studies. Mutation Research 454, 11-20.
Ericson, G., Lindesjöö, E. and Balk, L. (1998) DNA adducts and histopathological lesions in perch (Perca fluviatilis) and northern pike (Esox lucius) along a polycyclic aromatic hydrocarbon gradient on the Swedish coastline of the Baltic Sea. Canadian Journal of Fisheries and Aquatic Sciences 55, 815-824.
Ericson, G., Noaksson, E. and Balk, L. (1999) DNA adduct formation and persistence in liver and extrahepatic tissues of northern pike (Esox lucius) following oral exposure to benzo(a)pyrene, benzo(k)fluoranthene and 7H-dibenzo(c,g)carbazole. Mutation Research 47, 135-145.
Fenech M., Holland N., Chang W.P., Zeiger E., Bonassi S.(1999) The human micronucleus project – an international collaborative study on the use of micronucleus technique for measuring DNA damage in humans. Mut. Res. 428: 271-283.
Fires CR. & MR Tripp (1980) Depression of phagocytosis in Mercenaria mercenaria following chemical stress. Dev. Comp. Immunol. 4:233-244.
Forbes V, Palmqvist A, Bach L (2006) The use and misuse of biomarkers in ecotoxicology. Environmental Toxicology and Chemistry 25,1:272-280
Förlin, L, Hylland, K. (2006) Hepatic cytochrome P4501A concentration and activity in Atlantic cod caged in two North Sea pollution gradients. pp 253-262. In "ICES workshop on biological effects of contaminants in the pelagic ecosystem (ICES)" Eds: Hylland, K., Vethaak, A.D., Lang, T. SETAC special publications.
George, S. G., J. Wright, et al. (1995). "Temporal studies of the impact of the Braer oilspill on inshore feral fish from Shetland, Scotland." Archives of Environmental Contamination and Toxicology 29: 530-534.
Goksøyr A (1991) A semi-quantitative cytochrome P450IA1 ELISA: a simple method for studying the monooxygenase induction response in environmental monitoring and ecotoxicological testing of fish. Sci. Tot. Environ. 101 (1991), pp. 255–262.
Goksøyr, A. and L. Förlin (1992) "The cytochrome P-450 system in fish, aquatic toxicology and environmental monitoring." Aquatic Toxicology 22: 287-312.
Habig W.H., Pabst M.J., Jakoby W.B. (1974). Glutathione S-transferases. The first enzymatic step in mercapturic acid formation. J. Biol. Chem. 249, 7130-7139.
Heddle J.A., Cimino M.C., Hayashi M., Romagna F., Shelby M.D., Tucker J.D., Vanparys Ph. and MacGregor J.T. (1991) Micronuclei as an index of cytogenetic damage: past, present, and future. Environ. Mol. Mutagen., 18: 277-291.
Heddle J.A., Hite M., Kirkhart B., Mavournin K., Mac Gregor J.T., Newell G.T. and Salamone M.F. (1983) The induction of micronuclei as a measure of genotoxicity.

IRIS & NIVA Water Column Monitoring 2006
- 79 -
A report of the U.S. Environmental Protection Agency Gene-Tox Program. Mut. Res., 123: 61-118.
Hinton, D.E., Baumen, P.C., Gardener, G.C., Hawkins, W.E., Hendricks, J.D., Murchelano, R.A., & Okhiro, M.S. (1992). Histopathological biomarkers. In: (Huggett, R.J., Kimerle, R.A., Mehrle, P.M., & Bergman, H.L. eds) Biomarkers: biochemical, physiological and histological markers of anthropogenic stress. Lewis Publishers, MI. pp.155-210.
Hinton, D.E., Lauren, D.J. (1990), Liver structure alterations accompanying chronic toxicity in fishes: Potential biomarkers of exposure. In McCarthy J.F., Shugart, L.R. (Ed.), Biomarkers of environmental contamination, Lewis Publishers, p17-57.
Hylland K, Berge JA, Goksoyr A, Pettersen O, Sætre T, Efraimsen H (1998). Effekter av østrogen-lignende stoffer i norske kystfarvann. ISBN 82-577-3231-1, Norwegian Institute for Water Research (NIVA), Oslo, Norway.
Hylland K, Feist S, Thain J, Förlin L (2003) Molecular/Cellular processes and the health of the individual. In: Effects of Pollution on Fish – Molecular Effects and Population responses. Eds. A. J. Lawrence & K. L. Hemingway. Blackwell Publishing. p. 134-178.
Hylland K, Fjeld E, Øxnevad S, Pettersen O (1999) Kartlegging av effekter av miljø-østrogener på fisk i ferskvann i Norge. ISBN 82-577-3563-9, Norwegian Institute for Water Research (NIVA), Oslo, Norway.
Hylland K, Ruus A, Sundt RC, Feist S, Marigomez I, Balk L, Abrahamsson A, Barsiene J (2005). Water Column Monitoring 2004 – Summary report. Report by NIVA and RF for Statiol ASA on behalf of the OLF WCM coordination group. NIVA-report no. 499-2005, 59 pp. + appendix.
Hylland K, Vethaak AD, Lang T, et al (2006) Biological effects of contaminants in pelagic ecosystems. SETAC special publications. pp 3-7. In "ICES workshop on biological effects of contaminants in the pelagic ecosystem (ICES)" Eds: Hylland, K., Vethaak, A.D., Lang, T. SETAC special publications.
Jobling S, Sheahan D, Osborne JA, Matthiessen P, Sumpter, JP (1996). Inhibition of testicular growth in rainbow trout (Oncorhynchus mykiss) exposed to estrogenic alkylphenolic chemicals. Environ. Toxicol. Chem. 15, 194-202.
Jonsson G, J Beyer et al. (2003) "The application of HPLC-F and GC-MS to the analysis of selected hydroxy polycyclic hydrocarbons in two certified fish bile reference materials." Journal of Environmental Monitoring 5: 513-520.
Jonsson, G., I. C. Taban, et al. (2004) "Quantitative determination of de-conjugated chrysene metabolites in fish bile by HPLC-fluorescence and GC-MS." Chemosphere 54(8): 1085-1097.
IRIS & NIVA Water Column Monitoring 2006
- 80 -
Krahn, MM, DG Burrows et al. (1992). "Mass spectrometric analysis for aromatic compounds in bile of fish sampled after the Exxon Valdez oil spill." Environ. Sci. Technol. 26(1): 116-126.
Kramer PJ (1998) Genetic toxicology. J. Pharm. Pharmacol. 50: 395-405.
Kranz H, Dethlefsen V (1990) Liver anomalies in dab Limanda limanda from the southern North Sea with special consideration given to neoplastic lesions. Diseases of Aquatic Organisms, 9, 171-185.
Köhler A (1991) Lysosomal perturbations in fish liver as indicators for toxic effects of environmental pollution. Comparative Biochemistry and Physiology, 100, 123-127.
Köhler A, Deisemann, H, Lauritzen B. (1992) Histological and cytological indices of toxic injury in the liver of the dab Limanda limanda. Diseases of Aquatic Organisms, 91, 141-153.
Lam PKS, Gray JS 2003. The use of biomarkers in environmental monitoring programmes. Marine Pollution Bulletin 46: 182-186.
Landahl, JT, BB McCain et al. (1990) Consistent associations between hepatic lesions in English sole (Parophrys vetulus) and polycyclic aromatic hydrocarbons in bottom sediment. Environ Health Perspect. 89: 195-203.
Lang, T, Mellergaard S, Wosniok W, Kadakas V, Neumann K (1999). Spatial distribution of grossly visible diseases and parasites in flounder (Platichthys flesus) from the Baltic Sea: a synoptic study. ICES Journal of Marine Science, 56, 138-147.
Lowe DM, Clarke KR (1989). Contaminant-induced changes in the structure of the. digestive epithelium of Mytilus edulis. Aquat Toxicol 15:345-358
Lowe DM, Moore MN, Clarke KR (1981) Effects of oil in the digestive cells in mussels: quantitative alterations in cellular and lysosmal structures. Aquatic. Toxicol. 1: 213-226.
Lowe, D. M. and R. K. Pipe (1994). "Contaminant-induced lysosomal membrane damage in marine mussel digestive cells: an in vitro study." Aquatic Toxicology 30: 357-365.
Lowry OH, NJ Rosebrough, AL Farr, R.J. Randall. 1951. Protein measurement with the folin phenol reagent. Journal of Biological Chemistry 193:265-275.
Lye CM (2000) Impact of estrogenic substances from oil production at sea. Toxicology Letters. 112: 265-272.
MacGregor JT (1991) Micronuclei as an index of cytogenetic damage: past, present, and future. Environ. Mol. Mutagen., 18: 277-291.
Malins, D.C., Krahn, M.M., Brown, D.W., Rhodes, L.D., Myers, M.S., McCain, B.B., & Chan, S-L. (1985a). Toxic chemicals in marine sediment and biota from Mukilteo, Washington: Relationships with hepatic neoplasms and other hepatic

IRIS & NIVA Water Column Monitoring 2006
- 81 -
lesions in English sole (Parophrys vetulus). Journal of the National Cancer Research Institute, 74, 487-494.
Malins DC, Krahn MM, Myers MS, Rhodes LD, Brown DW, McCain, BB, Chan SL (1985b). Toxic chemicals in sediments and biota from a creosote-polluted harbor: relationships with hepatic neoplasms and other hepatic lesions in English sole (Parophrys vetulus). Carcinogenesis, 6, 1463-1469.
Meier S, TE Andersen et al. (2002). Hormonal effects of C4-C7 alkylated phenols in cod. Bergen, Norway, Institute for Marine Sciences (IMS): 70.
Michel X, Salaün JP, Galgani F, Narbonne, JF (1994). Benzo(a)pyrene hydroxylase activity in the marine mussel mytilus galloprovincialis: a potential marker of contamination by polycyclic aromatic hydrocarbon-type compounds. Mar. Environ. Res. 38, 257-273.
Moore MN (1988) Cytochemical responses of the lysosomal system and NADPH-ferrihemoprotein reductase in molluscan digestive cells to environmental and experimental exposure to xenobiotics. Mar. Ecol. Prog. Ser., 46, 81-89.
Moore MJ, Myers MS (1994). Pathobiology of chemical-associated neoplasia in fish. Aquatic Toxicology, 24, 327-386.
Moore MN, Allen JI (2002) A computational model of the digestive gland epithelial cell of marine mussels and its simulated responses to oil-derived aromatic hydrocarbons. Mar. Environ. Res. 54: 579-584.
Moore MN, Simpson MG (1992). Molecular and cellular pathology in environmental impact assessment. Aquatic Toxicology, 22, 313-322.
Moore, M.N., Allen, J.I. and McVeigh, A. (2006) Environmental prognostics: an integrated model supporting lysosomal stress responses as predictive biomarkers of animal health status. Mar. Environ. Res. In press.
Moore, M.N., Allen, J.I., McVeigh, A. and Shaw, J. (2006). Lysosomal and autophagic reactions as predictive indicators of environmental impact in aquatic animals. Autophagy, 2: 217–220.
Myers, M.S., Johnson, L.L., Hom, T., Collier, T.K., Stein, J.E., & Varanasi, U. (1998). Toxicopathic lesions in subadult English sole (Pleuronectes vetulus) from Puget Sound, Washington, USA: Relationships with other biomarkers of contaminant exposure. Marine Environmental Research, 45, 47-67.
Neff JM (2000). Preliminary ecological risk assessment for North Sea Water Column Monitoring Program 1999, Monitoring in the Ekofisk Region. Report Battelle.
OLF (2000). Emissions and discharges from the Norwegian Petroleums industry (2000) Stavanger, Norway, The Norwegian Oil Industry Association (OLF).
IRIS & NIVA Water Column Monitoring 2006
- 82 -
OSPAR Commission SIME (2007) Draft OSPAR Background Document for Biological Effects Monitoring Techniques: Lysosomal stability as a global health status indicator in biomonitoring. Presented by the UK.07/3/15-E (L). Pp 7.
Örn, S, Holbech H, Madsen TH, Norrgren, L, Petersen, GI (2003). Gonad development and vitellogenin production in zebrafish (Danio rerio) exposed to ethinylestradiol and methyltestosterone. Aquat. Toxicol. 65, 397-411.
Payne J F, C Bauld et al. (1984). "Selectivity of mixed-function oxygenase enzyme induction in flounder (Pseudopleuronectes americanus) collected at the site of the Baie
Pipe RK, Coles JA, Carissan FMM, Ramanathan K (1999) Copper induced immunomodulation in the marine mussel, Mytilus edulis. Aquat. Toxicol. 46, 43-54.
Pipe RK, Coles JA (1995) Environmental contaminants influencing immune function in marine bivalve molluscs. Fish. Shellfish Immunol. 5, 581-595.
Peakall D. (1992). Animal biomarkers as pollution indicators. London, Chapman and Hall: 291.
Reichert WL, French B (1994) The 32P-postlabeling protocols for assaying levels of hydrophobic DNA adducts in fish. NOAA Tech. Memo. NMFS-NWFSC-14, National Technical Information Service, Springfield, VA.
Reddy MV, Randerath K (1986) Nuclease P1-mediated enhancement of sensitivity of 32P-postlabeling test for structurally diverse DNA adducts. Carcinogenesis 7, 1543-1551.
Regoli, F., S. Frulla, et al. (In press). "Antioxidant parameters and total oxyradical scavenging capacity in mussels from German Bight and Statfjord oil field." Environ. Toxicol. Chem.
Regoli F (1992) Lysosomal responses as a sensitive stress index in bio-monitoring heavy metal pollution. Mar. Ecol. Prog. Ser., 84, 63-69
Rowlands JC, Gustafsson JÅ (1997). Aryl hydrocarbon receptor-mediated signal transduction. Crit. Rev. Toxicol. 27:109-134.
Ruus A, Hylland K, Green NW (2003) Joint Assessment and Monitoring Programme (JAMP). Biological Effects Methods, Norwegian Monitoring 1997-2001. Norwegian State Pollution Monitoring Programme Report no. 869/03. TA-no. 1948/2003. 139 pp.
Ruus, A., Tollefsen, K.-E., Grung, M., Klungsøyr, J. and Hylland, K. (2006). Accumulation of contaminants in pelagic organisms, caged blue mussels, caged cod and semi-permeable membrane devices (SPMDs). pp 51-74. In "ICES workshop on biological effects of contaminants in the pelagic ecosystem (ICES)" Eds: Hylland, K., Vethaak, A.D., Lang, T. SETAC special publications.
IRIS & NIVA Water Column Monitoring 2006
- 83 -
Røe, T. I. (1998). Produced water discharges to the North Sea: a study of bioavailable organic produced water compounds to marine organisms. Faculty for Chemistry and Biology. Trondheim, Norwegian University of Science and Technology.
Røe, T. I. and S. Johnsen (1996). Discharges of produced water to the North Sea; Effects in the water column. Produced water 2. Environmental Issues and Mitigation Technologies. S. Johnsen. New York, Plenum Press: 13-25.
Safe S. H. (1994). Polychlorinated biphenyls (PCBs):environmental impact, biochemical and toxic responses, and implications for risk assessment. Crit. Rev. Toxicol. 24:87-149.
Scott, A., Kristiansen, I., Katsiadaki, I., Thain, J., Tollefsen, K.-E., Goksøyr, A. and Barry, J. (2006). Assessment of estrogen exposure in cod (Gadus morhua) and saithe (Pollachius virens) in relation to their proximity to an oil field. Pp 329-340. In "ICES workshop on biological effects of contaminants in the pelagic ecosystem (ICES)" (Hylland, K., et al. Eds.). SETAC special publications.
Seelbach A, Fissler B, Strohbusch A, Madle S (1993) Development of a modified micronucleus assay in vitro for detection of aneugenic effects. Toxicol. In Vitro, 7: 185-193.
SFT (2003). Guidelines water column monitoring. Norwegian Pollution Control Authority (SFT), Oslo, Norway.
SFT (2004). Nullutslippsrapporten (National report on Zero effect emissions from the Norwegian offshore oil production industry). Oslo, SFT.
Segner H, Braunbeck T (1988) Hepatocellular adaptation to extreme nutritional conditions in ide, Leuciscus idus melanotus L. (Cyprinidae). A morphofunctional analysis. Fish Physiol. Biochem. 5: 79-97.
Sokal RR, Rohlf FJ (1981) Biometry, W.H. Freeman and Co, New York, pp. 1-859.
Sole, M., Peters, L. D., Magnusson, K., Sjolin, A., Granmo, A. and Livingstone, D. R. (1998). Responses of the cytochrome P450-dependent monooxygenase and other protective enzyme systems in digestive gland of transplanted common mussel (Mytilus edulis L.) to organic contaminants in the Skagerrak and Kattegat (North Sea). Biomarkers 3, 49-62.
Stebbing ARD (1985) Organotins and water quality - Some lessons to be learned Marine Pollution Bulletin 16: 383–390
Stein, J. E., T. Hom, et al. (1987). "Simultaneous exposure of English sole (Parophrys-Vetulus) to sediment associated xenobiotics .2. Chronic Exposure to an Urban Estuarine Sediment with Added H-3 Benzo a Pyrene and C-14 Polychlorinated-Biphenyls." Marine Environmental Research 22(2): 123-149.
Sundt RC, Baussant T, Beyer J (in prep) Bioaccumulation, tissue distribution and elimination of C4-C7 alkylphenols in Atlantic cod (Gadus morhua) exposed via seawater and diet.
IRIS & NIVA Water Column Monitoring 2006
- 84 -
Sumpter, J. P. and Jobling, S. (1995). Vitellogenesis as a biomarker for estrogenic contamination of the aquatic environment. Environ. Health Perspect. 103, 173-178.
Taban, I. C. and J. F. Børseth (2000). Biomarker responses in transplanted mussels (Mytilus edulis L.) in the Ekofisk region. Stavanger, RF-Akvamiljø: p. 34.
Tata, J. R. and Smith, D. F. (1979). Vitellogenisis: a versatile model for hormonal regulation of gene expression. Rec. Prog. Horm. Res. 35, 47-95.
Thomas, K., M. R. Hurst, et al. (2006). In vitro bioassay testing of produced and surface water extracts. Pp 357-366. In "ICES workshop on biological effects of contaminants in the pelagic ecosystem (ICES)" Eds: Hylland, K., Vethaak, A.D., Lang, T. SETAC special publications.
Tollefsen, K.E., Bøyum, O., Kringstad, A., Finne, E.F., Odden, E., Grung, M. 2005. Water column monitoring of polar chemicals by use of POCIS passive samplers. NIVA report no. 4940-2005. 12 pp.
Tollefsen, K.-E., A. Goksøyr, et al. (2006). The use of a fish in vitro bioassay for monitoring of pollutants in the North Sea. In "ICES workshop on biological effects of contaminants in the pelagic ecosystem (ICES)" Eds: Hylland, K., Vethaak, A.D., Lang, T. SETAC special publications.
Tollefsen, K.-E., K. Ingebrigtsen, et al. (1998). Acute toxicity and toxicokinetics of 4- heptylphenol in juvenile Atlantic cod (Gadus morhua L.). Environmental Toxicology and Chemistry. 17: 740-746.
Utvik, T. I. R. (1999). Chemical charaterisation of produced water from four offshore oil production platforms in the North Sea. Chemosphere. 39: 2593-2606.
Varanasi, U. (1989). Metabolism of polycyclic aromatic hydrocarbons in the aquatic environment. Boca Raton, Florida, US, CRC Press.
Vega MM; Marigómez I; AnguloE (1989) Quantitavive alterations in digestive cell structure of the marine gastropod Littorina littorea on exposure to cadmium. Mar. Biol. 103: 547-553.
Viarengo A, CanesiI L, Pertica M, et al.1990 Heavy-metal effects on lipid peroxidation in the tissues of Mytilus galloprovincialis Comparative Biochemistry and Physiology 97 (1): 37-42
Zoll-Moreux C. and Ferrier V. 1999. The Jaylet test (Newt micronucleus test) and the micronucleus test in Xenopus: two in vivo tests on Amphibia evaluation of the genotoxicity of five environmental pollutants and of five effluents. Water Res., 33: 2301-2314.
Aas E, Beyer J, Jonsson G, et al. (2001) Evidence of uptake, biotransformation and DNA binding of polyaromatic hydrocarbons in Atlantic cod and corkwing wrasse caught in the vicinity of an aluminium works. Marine Environmental Research 52 (3): 213-229

IRIS & NIVA Water Column Monitoring 2006
- 85 -
Aas E., Baussant T., Balk L., Liebenberg B., Andersen O.K. 2000a. PAH metabolites in bile, cytochrome P4501A and DNA adducts as environmental risk parameters for chronic oil exposure: a laboratory experiment with Atlantic cod. Aquat. Toxicol. 51: 241-258.
Aas, E., G. Jonsson, et al. (In press). "PAH metabolites and metals in bile from caged Atlantic cod (Gadus morhua) and feral fish in the North Sea used in environmental monitoring." Environmental Toxicology & Chemistry.
Aas, E., J. Beyer, et al. (2000b). "Fixed wavelength fluorescence (FF) of bile as a monitoring tool for polyaromatic hydrocarbon exposure in fish: an evaluation of compound specificity, inner filter effect and signal interpretation." Biomarkers 5(1): 9-23.
Aas, E., J. Beyer, et al. (2001). "Evidence of uptake, biotransformation and DNA binding of polyaromatic hydrocarbons in Atlantic cod and sea partridge caught in the vicinity of an aluminium works." Marine Environmental Research 52: 213-229.
8 Appendix list
8.1 Appendix A: Cruise report IRIS 8.2 Appendix B: Data report NIVA 8.3 Appendix C: Data report IRIS 8.4 Appendix D: Data report ITM, University of Stockholm 8.5 Appendix E: Data report – University of Vilnius 8.6 Appendix F: Data report – Battelle
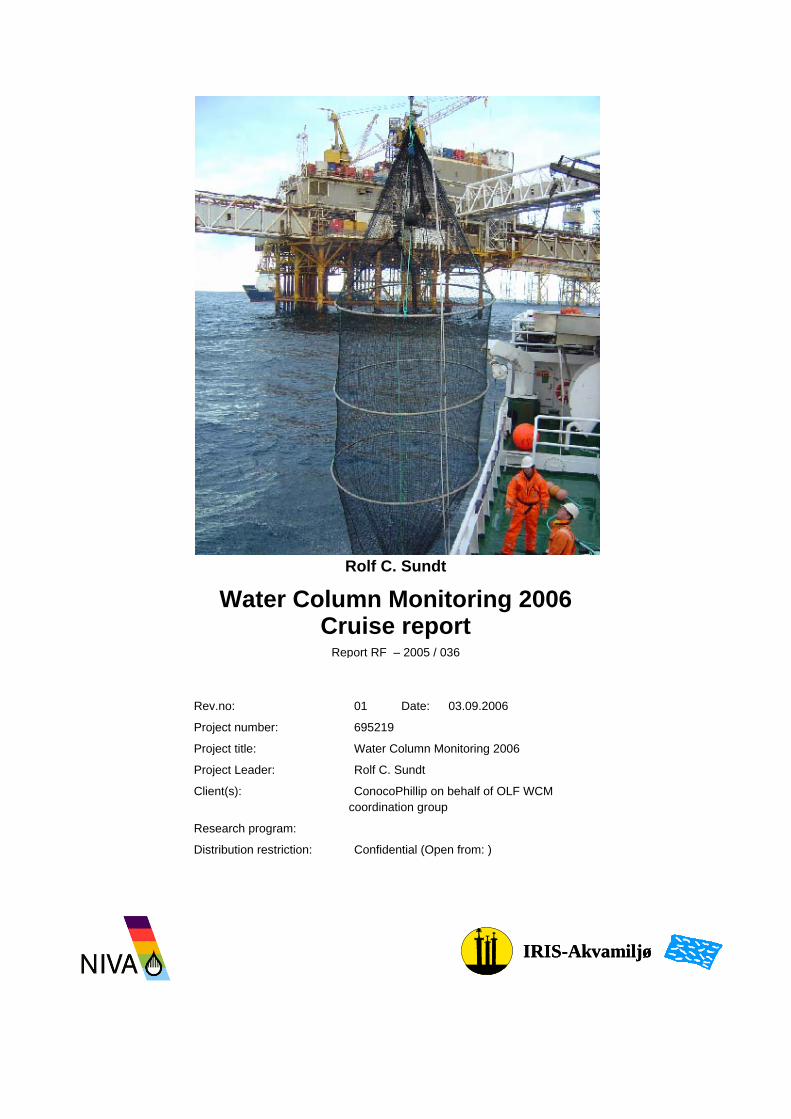
Rolf C. Sundt
Water Column Monitoring 2006
Cruise report Report RF – 2005 / 036
Rev.no: 01 Date: 03.09.2006
Project number: 695219
Project title: Water Column Monitoring 2006
Project Leader: Rolf C. Sundt
Client(s): ConocoPhillip on behalf of OLF WCM coordination group
Research program:
Distribution restriction: Confidential (Open from: )
IRIS-AkvamiljøIRIS-Akvamiljø
Water Column Monitoring 2006
Contents
1 PRE-EXPOSURE SAMPLING ........................................................................................... 1
1.1 Pre-exposure sampling of cod ..................................................................................... 1 1.2 Pre-exposure sampling of mussels .............................................................................. 1
2 FIRST CRUISE – DEPLOYMENT OF ORGANISMS ...................................................... 2
2.1 Research vessel and scientific personnel .................................................................... 2 2.2 Transfer of cod and mussels to the vessel ................................................................... 2 2.3 Stations and rig equipment.......................................................................................... 3 2.4 CTD profiles................................................................................................................ 6 2.5 Monitoring of current data .......................................................................................... 6 2.6 PAH contamination monitoring .................................................................................. 6
3 SECOND CRUISE – SAMPLING....................................................................................... 7
3.1 Objectives.................................................................................................................... 7 3.2 Equipment and logistics .............................................................................................. 7 3.3 Accomplishment.......................................................................................................... 7 3.4 Biological sampling..................................................................................................... 9 3.5 Conclusion................................................................................................................. 11
4 APPENDIX ........................................................................................................................ 12

Water Column Monitoring 2006
1
1 Pre-exposure sampling
1.1 Pre-exposure sampling of cod Pre-exposure sampling of cod was conducted 30th March on the fish farm that delivered fish to the experiment (Rygjabø, Finnøy). Sampling was carried out on the farm facility by personnel from IRIS (Rolf C Sundt and Lars Petter Myhre) and NIVA (Eivind Farmen Finne, Christopher Harman and Kevin Thomas). Samples were taken according to the list in the Appendix. Description of sampling procedure is given in 3.4.
1.2 Pre-exposure sampling of mussels Mussels for the pre-exposure sampling arrived 28th March at the IRIS Akvamiljø facility in Mekjarvik and were kept in clean sea water taken from 80 metres depth for 6 days prior to sampling. Sampling was conducted by personnel from RF-Akvamiljø (Jan Fredrik Børseth and Daniela Pampanin). Tissue was collected according to the list in Appendix.

Water Column Monitoring 2006
2
2 First cruise – Deployment of organisms
2.1 Research vessel and scientific personnel The live fish carrier Seigrunn departured Stavanger 1th April and arrived back in Stavanger 5th April 2006. The scientific personnel onboard were: Rolf C. Sundt (IRIS), Bjørn Serigstad (Seamon a/s), and Dag Altin (Biotrix). The client was represented by Steinar Berntsen (ConocoPhillips).
2.2 Transfer of cod and mussels to the vessel During fish transfer the vessel called at the quay next to the farm facility. The fish was transported from the indoor tanks to the vessel in 2000 L tanks by forklift. From the transport tanks the fish was lifted by hand in landing nets and distributed to cages submerged in the vessels fish well. To secure good water quality in the well, care was taken when choosing locality for the initial filling of the tank.
The general impression was that the fish was of good quality as delivered from the farm and that it coped well with the transport to Ekofisk, no lethality was observed. PAH contamination status was tested Fixed Fluorescent screening.
Figure 1. Fish and mussels were transported to field in cages submerged in the vessels well.

Water Column Monitoring 2006
3
Mussels were transported on ice from the shellfish farm in the Trondheim Fjord to Sola by air and from there to Mekjarvik by car. On board the vessel the mussels were wrapped in protective nets before mounting on the cages.
Figure 2. Preparation of cage with fish and mussels prior to deployment.
2.3 Stations and rig equipment 8 rigs containing mussels were deployed, 4 of the rigs contained fish. Stations were numbered according to Table 1.
Six of the rigs were placed along a transect line in the dominating current direction from SW of the field to NE. In addition two reference stations with fish and mussels were placed at two expectedly clean locations NE of Ekofisk.
The vessels key crew had experience with deployment of the rigs used from a previous experiment (Water Column Monitoring 2004).

Water Column Monitoring 2006
4
5º W 0º 5º E 10º E
52º N
56º N
60º N
100 km
NORWAY
DENMARK
UK
REF 1
REF 2
REF 1REF 2
ST 1
ST 2
ST 3
ST 4
ST 5
ST 6
X
1 km
DischargeCurre
nt a
xis
Figure 3. Positions of the caging stations at the Ekofisk field (superimposed panel) and positions of the reference stations in relation to the field.
Table 1. Locations and designation for stations. Note that the original experiment sample designations are used in appendixes.
Location Sample markings
Mussel st.
Sample markings
Fish st
Report st designations
Reference NE of discharge 100 100 REF 1
Reference E of discharge 200 200 REF 2
1600m SW 600 - ST 1
600m SW 400 - ST 2
Off southern flare 300 300 ST 3
Off 2/4J 800 400 ST 4
1100m NE 700 - ST 5
2000m NE 500 - ST 6

Water Column Monitoring 2006
5
Figure 4. Launching of bottom mooring weight
Figure 5. Deployment of cage containing fish and mussels off platform 2/4 J (station 4).
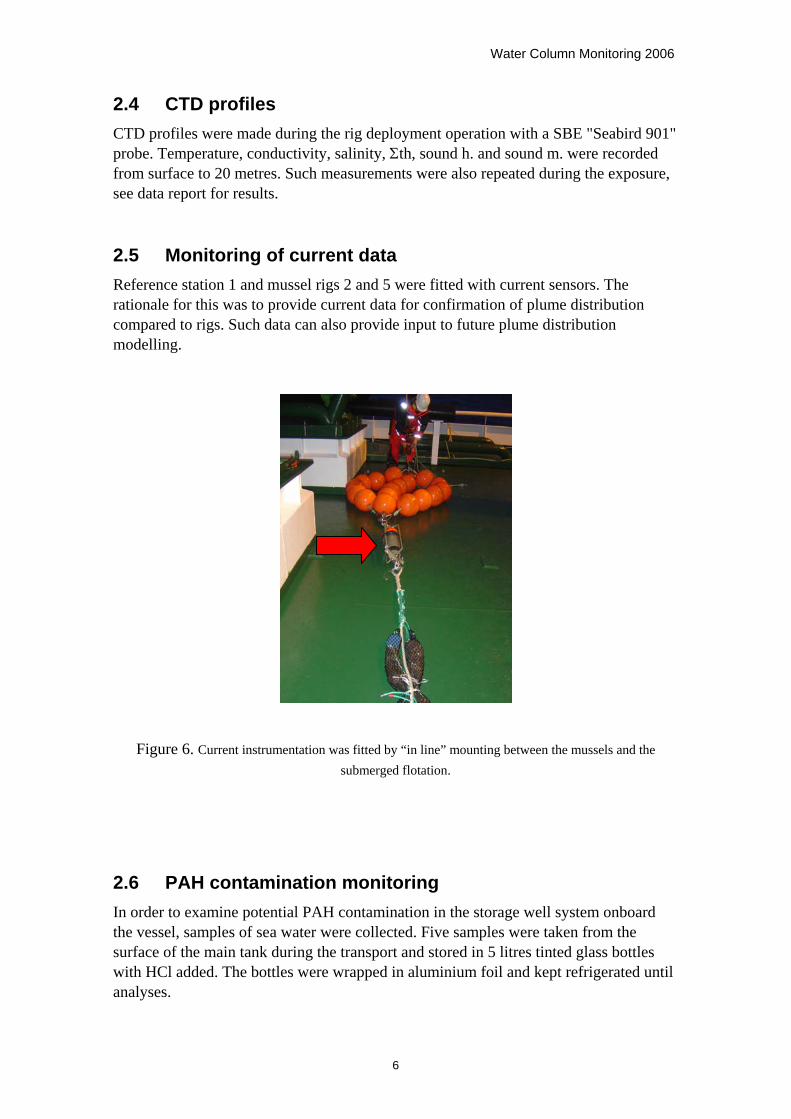
Water Column Monitoring 2006
6
2.4 CTD profiles CTD profiles were made during the rig deployment operation with a SBE "Seabird 901" probe. Temperature, conductivity, salinity, Σth, sound h. and sound m. were recorded from surface to 20 metres. Such measurements were also repeated during the exposure, see data report for results.
2.5 Monitoring of current data Reference station 1 and mussel rigs 2 and 5 were fitted with current sensors. The rationale for this was to provide current data for confirmation of plume distribution compared to rigs. Such data can also provide input to future plume distribution modelling.
Figure 6. Current instrumentation was fitted by “in line” mounting between the mussels and the submerged flotation.
2.6 PAH contamination monitoring In order to examine potential PAH contamination in the storage well system onboard the vessel, samples of sea water were collected. Five samples were taken from the surface of the main tank during the transport and stored in 5 litres tinted glass bottles with HCl added. The bottles were wrapped in aluminium foil and kept refrigerated until analyses.
Water Column Monitoring 2006
7
3 Second cruise – Sampling
3.1 Objectives The objectives were to collect cages with mussels, fish and oceanographic instruments and obtain biological samples for effect related monitoring of discharges from the Ekofisk field. (Water Column Monitoring 2006). In addition samples for analysis of AChE by Prof. Peter-Diedrik Hansen (Technische Universitaet Berlin) were collected.
The live fish carrier Seigrunn departured Stavanger 20th May (2130) and arrived back in Stavanger 23th May 2006 (0800), sampling was commenced 21th/22th May). The scientific personnel onboard were: Rolf C. Sundt, Jan Fredrik Børseth and Daniela Pampanin (IRIS-Akvamiljø), Christopher Harman, Sigurd Øxnevad and Eivind Farmen Finne (NIVA), Bjørn Serigstad (Seamon a/s), and Dag Altin (Biotrix). The client was represented by Eimund Garpestad (ConocoPhillips).
3.2 Equipment and logistics IRIS was responsible for the accomplishment of the mussel sampling and NIVA performed the fish sampling. Equipment and chemicals were brought onboard the vessel together by the sampling personnel. Sample facilities were established in two container mounted the after-deck (mussel sampling) and on the main deck (fish sampling).
3.3 Accomplishment All cages were picked up without any major problems. The surface float at mussel station 800 was lost during the exposure due to collision by vessel, so the rig needed ROV support for retrieval. Based on visual inspection, both mussels and fish apparently were in good shape. Some individual fish had worn fins expectedly due to contact with the net walls (see comments for individual fish in Appendix).
Most fish stomachs investigated were empty; some individuals had been eating fouling from the cages (mainly Bryozoans)
After retrieving the cages, the organisms were stored in tanks with sea water supply until sampling onboard the vessel. Cod was carried to the sampling lab in groups of five individuals. Details regarding distribution of sampling tasks are given in Appendix

Water Column Monitoring 2006
8
Figure 7. Retrieval of cage at mussel station 800 was facilitated by ROV due to damaged surface floats.
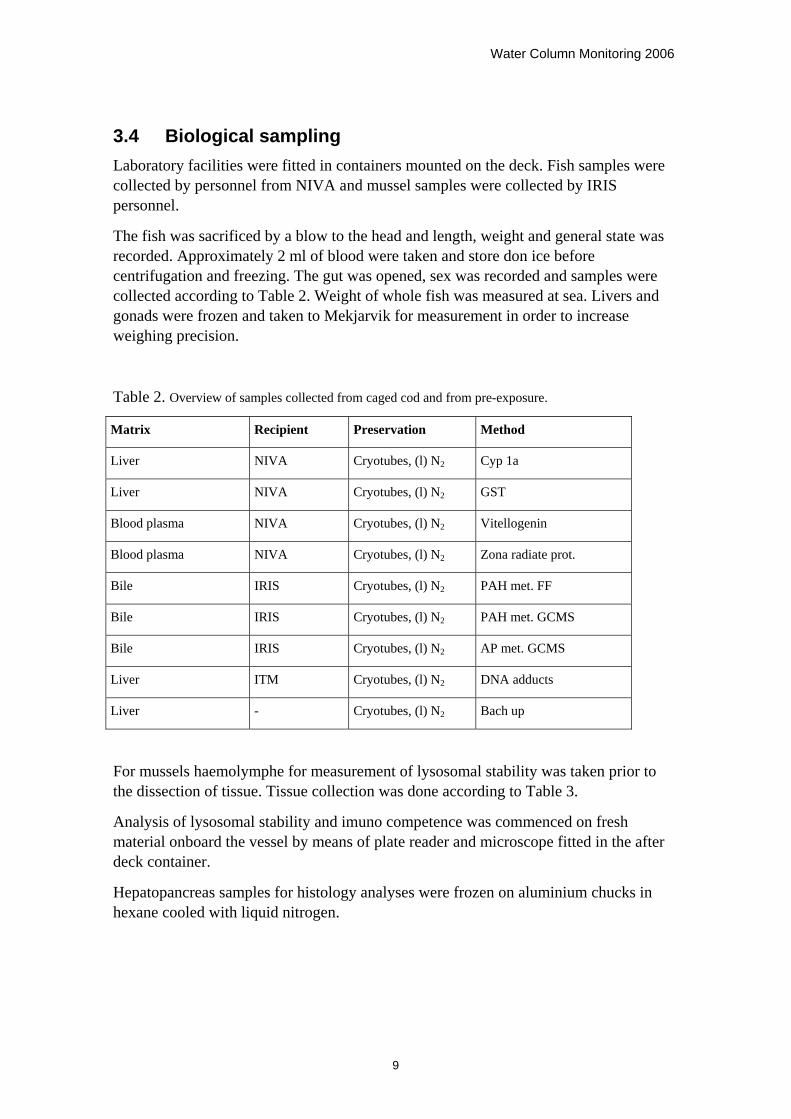
Water Column Monitoring 2006
9
3.4 Biological sampling Laboratory facilities were fitted in containers mounted on the deck. Fish samples were collected by personnel from NIVA and mussel samples were collected by IRIS personnel.
The fish was sacrificed by a blow to the head and length, weight and general state was recorded. Approximately 2 ml of blood were taken and store don ice before centrifugation and freezing. The gut was opened, sex was recorded and samples were collected according to Table 2. Weight of whole fish was measured at sea. Livers and gonads were frozen and taken to Mekjarvik for measurement in order to increase weighing precision.
Table 2. Overview of samples collected from caged cod and from pre-exposure.
Matrix Recipient Preservation Method
Liver NIVA Cryotubes, (l) N2 Cyp 1a
Liver NIVA Cryotubes, (l) N2 GST
Blood plasma NIVA Cryotubes, (l) N2 Vitellogenin
Blood plasma NIVA Cryotubes, (l) N2 Zona radiate prot.
Bile IRIS Cryotubes, (l) N2 PAH met. FF
Bile IRIS Cryotubes, (l) N2 PAH met. GCMS
Bile IRIS Cryotubes, (l) N2 AP met. GCMS
Liver ITM Cryotubes, (l) N2 DNA adducts
Liver - Cryotubes, (l) N2 Bach up
For mussels haemolymphe for measurement of lysosomal stability was taken prior to the dissection of tissue. Tissue collection was done according to Table 3.
Analysis of lysosomal stability and imuno competence was commenced on fresh material onboard the vessel by means of plate reader and microscope fitted in the after deck container.
Hepatopancreas samples for histology analyses were frozen on aluminium chucks in hexane cooled with liquid nitrogen.
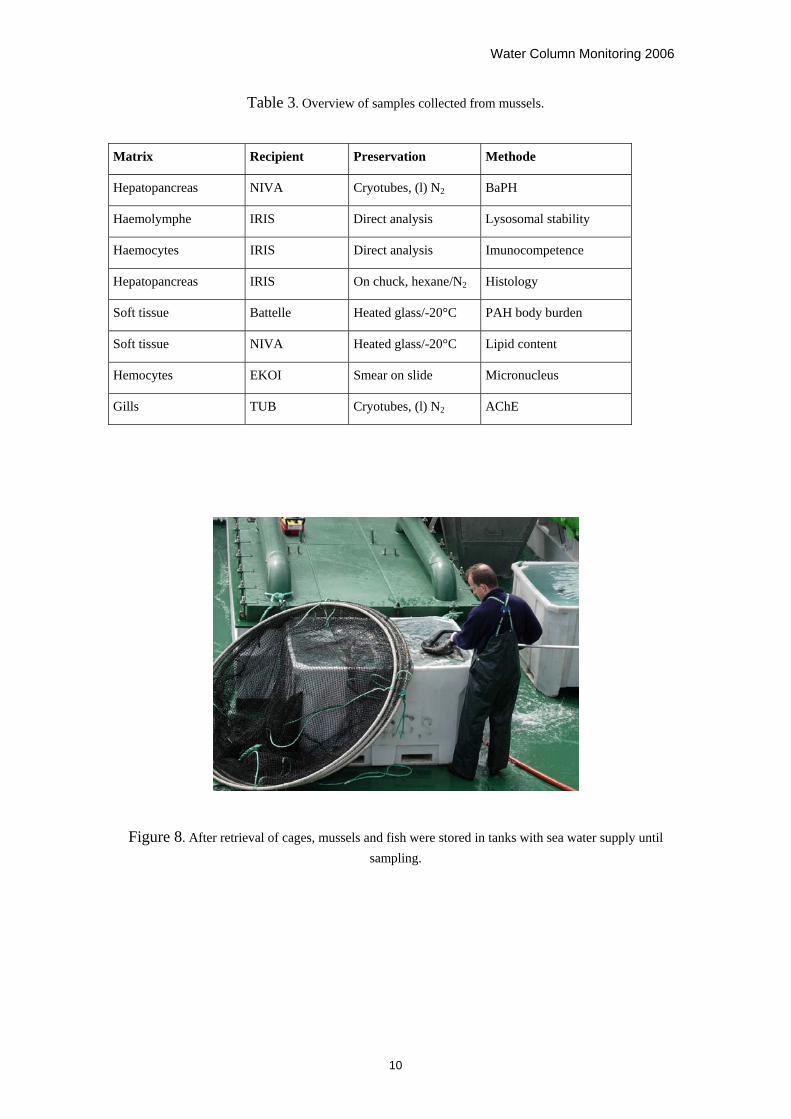
Water Column Monitoring 2006
10
Table 3. Overview of samples collected from mussels.
Matrix Recipient Preservation Methode
Hepatopancreas NIVA Cryotubes, (l) N2 BaPH
Haemolymphe IRIS Direct analysis Lysosomal stability
Haemocytes IRIS Direct analysis Imunocompetence
Hepatopancreas IRIS On chuck, hexane/N2 Histology
Soft tissue Battelle Heated glass/-20°C PAH body burden
Soft tissue NIVA Heated glass/-20°C Lipid content
Hemocytes EKOI Smear on slide Micronucleus
Gills TUB Cryotubes, (l) N2 AChE
Figure 8. After retrieval of cages, mussels and fish were stored in tanks with sea water supply until sampling.

Water Column Monitoring 2006
11
Figure 9. Sampling of cod and mussels was conducted in lab containers mounted on the vessels deck.
3.5 Conclusion Accomplishment of cruises was on the whole successful with respect to pick-up of cages and sampling. Sampling of both fish and mussels was commenced as planned. Loss of surface buoy on one station due to collision with vessel demanded extra effort during retrieval.
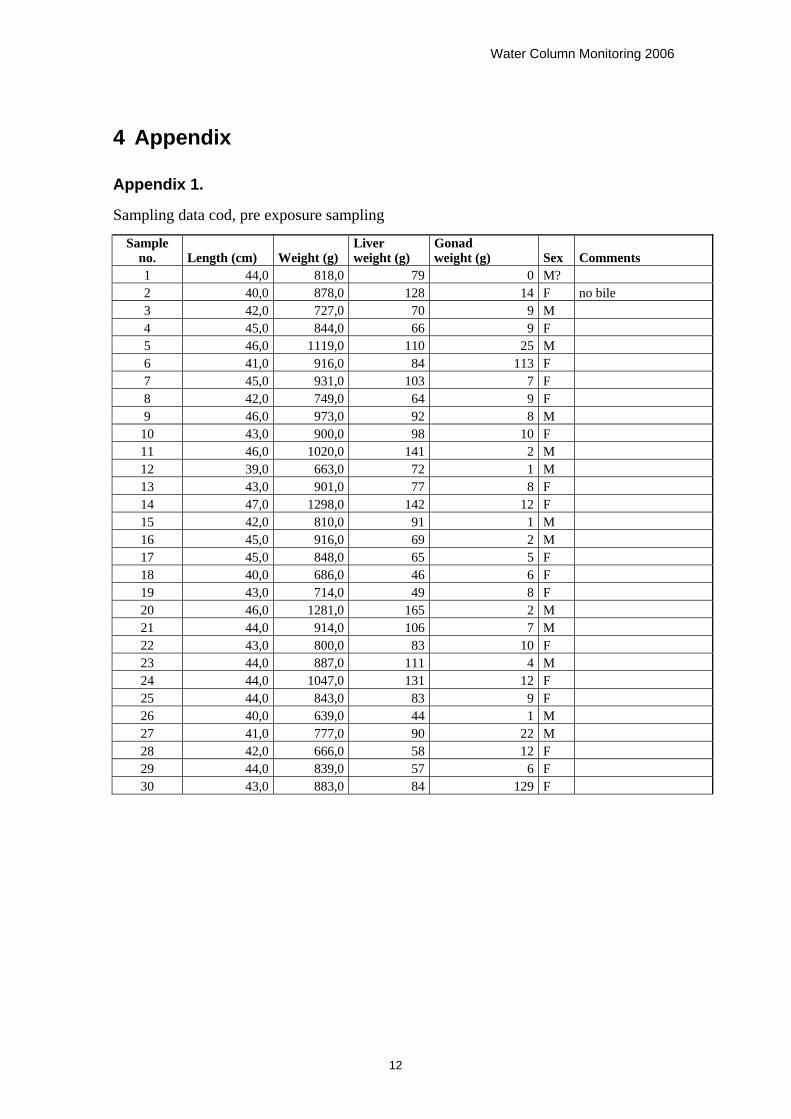
Water Column Monitoring 2006
12
4 Appendix
Appendix 1.
Sampling data cod, pre exposure sampling
Sample no. Length (cm) Weight (g)
Liver weight (g)
Gonad weight (g) Sex Comments
1 44,0 818,0 79 0 M? 2 40,0 878,0 128 14 F no bile 3 42,0 727,0 70 9 M 4 45,0 844,0 66 9 F 5 46,0 1119,0 110 25 M 6 41,0 916,0 84 113 F 7 45,0 931,0 103 7 F 8 42,0 749,0 64 9 F 9 46,0 973,0 92 8 M
10 43,0 900,0 98 10 F 11 46,0 1020,0 141 2 M 12 39,0 663,0 72 1 M 13 43,0 901,0 77 8 F 14 47,0 1298,0 142 12 F 15 42,0 810,0 91 1 M 16 45,0 916,0 69 2 M 17 45,0 848,0 65 5 F 18 40,0 686,0 46 6 F 19 43,0 714,0 49 8 F 20 46,0 1281,0 165 2 M 21 44,0 914,0 106 7 M 22 43,0 800,0 83 10 F 23 44,0 887,0 111 4 M 24 44,0 1047,0 131 12 F 25 44,0 843,0 83 9 F 26 40,0 639,0 44 1 M 27 41,0 777,0 90 22 M 28 42,0 666,0 58 12 F 29 44,0 839,0 57 6 F 30 43,0 883,0 84 129 F

Water Column Monitoring 2006
13
Sampling data cod, reference station 1.
Tag No. Sample no. Weight (g) Length (cm) Sex Gonad (g)
Liver (g) Comments
161 101 1020 47 M 21,4 53,5 197 102 780 43 F 30 59 214 103 650 42 M 20,7 16,6 164 104 730 44 F 8 39,9 201 105 860 44 F 21 51,3 241 106 640 42 M 5,4 36,4 141 107 820 44,5 F 16,8 57,5 184 108 780 44 M 13,8 49,3 119 109 680 44 M 2,8 20,9 262 110 650 44 F 11,9 42,1 255 111 1100 48,5 M 9,3 71,9 206 112 750 42 F 26,5 67,5 237 113 840 43 M 10,6 75,8 162 114 860 44 F 7,4 30,9 257 115 640 42 M 10,5 32,5 134 116 1090 48 M 5,1 92,5 244 117 710 43,5 M 21,3 38,1 227 118 960 44,5 M 18,3 65,1 Burst gall bladder 217 119 910 45 F 16,5 69,1 193 120 920 44 M 3,1 74,6 154 121 960 46 M 11,4 74,6 130 122 670 41 F 17,3 44,1 199 123 530 39 M 10,4 37 181 124 980 47 M 44,9 90,8 251 125 900 45 F 13,1 85,4 253 126 790 44,5 F 14,3 52,1 232 127 980 47 M 12,9 86,7
No Tag 128 990 47 M 16 56,9 145 129 1000 48 F 22,5 70,1
No Tag 130 1030 46,5 F 14,1 81,6 No Tag 131 800 42 F Just plasma No Tag 132 550 39 M Just plasma No Tag 133 850 44,5 M Just plasma No Tag 134 800 43,5 M Just plasma No Tag 135 600 39 M Just plasma No Tag 136 890 44 M Just plasma No Tag 137 760 43,5 M Just plasma No Tag 138 1050 48 F Just plasma No Tag 139 1020 45,5 F Just plasma No Tag 140 940 47 ? Just plasma

Water Column Monitoring 2006
14
Sampling data cod, reference station 2.
Tag No. Sample no. Weight (g)
Length (cm) Sex
Gonad (g)
Liver (g) Comments
125 201 1030 47 F 26 76,9 261 202 890 44 F 23,5 63,7 156 203 1020 46,5 F 41,5 100,5 131 204 690 42 M 1,4 65,2 208 205 750 41 F 17,3 43,1 191 206 1200 50 F 22,8 110,6 136 207 850 45,5 M 4,1 62,5 155 208 700 40 M 3,7 49,2 182 209 730 42,5 F 20,2 25,2 127 210 1200 47 F 17,4 155,4 254 211 690 43 F 10,3 18,3 183 212 950 46 F 13,3 48,2 192 213 700 43 M 15,5 56,9 263 214 690 43 M 9,6 48 221 215 1400 51 F 59,1 156,6 132 216 920 45 F 20,7 74,3 118 217 1300 51 F 19,9 144,6 202 218 710 41 M 8,5 57,8 173 219 620 41,5 F 9,6 36,8 144 220 780 45 M 10,2 66 Burst gall bladder 160 221 960 48,5 M 9,2 86,9 264 222 660 41 M 23 58 215 223 650 40,5 F 10,9 13,7 165 224 750 46 F 2,2 28,6 189 225 680 40,5 F 15,8 69,7
No Tag 226 650 42,5 F 11,2 36,7 No Tag 227 710 40,5 F 23,5 74,3 No Tag 228 710 43 M 11,5 43,4 No Tag 229 610 39 F 13,3 69,5 Fl.1/2 incor. marked No Tag 230 640 42 M 7 46,8 Fl.1/2 incor. marked No Tag 231 660 43,5 F Just Plasma No Tag 232 680 41 M Just Plasma No Tag 233 710 43 M Just Plasma No Tag 234 530 30,5 F Just Plasma No Tag 235 1120 47 F Just Plasma No Tag 236 990 46 M Just Plasma No Tag 237 850 46 F Just Plasma No Tag 238 660 41,5 F Just Plasma No Tag 239 570 40 F Just Plasma No Tag 240 670 42 F Just Plasma

Water Column Monitoring 2006
15
Sampling data cod, station 3
Tag No. Sample no. Weight (g)
Length (cm) Sex
Gonad (g)
Liver (g) Comments
256 301 900 44 M 14,8 76,6 252 302 530 39 F 6,6 15,6 179 303 730 42 F 12,1 43,6 133 304 890 44 M 1,8 21,2 211 305 820 41 F 17,1 54,6 185 306 1030 47 F 25,6 87,8 235 307 990 45 F 27,8 59,5 258 308 750 45 M 15,6 50,5 167 309 850 45 M 11,5 49,2 230 310 1200 48 F 39,8 105,4 234 311 870 45 F 13,5 72,2 178 312 710 43 M 1,5 54,4 229 313 750 46 F 2,6 46,2 203 314 1000 46 M 6,4 83,4 122 315 900 44 F 23,4 69 143 316 760 43,5 F 10,8 49,2 260 317 750 43 M 2,6 30,3 259 318 680 42 M 8,4 45 171 319 860 44 M 6,1 75,4 Damaged fish 126 320 660 43 M 8,5 12,5 239 321 800 44 F 17,2 60,6 150 322 1170 48,5 F 28,8 113,4 153 323 550 41 M 25,4 50,1 128 324 850 45 M 13,3 73,8 220 325 750 44 M 4,6 36,4
No Tag 326 800 44,5 F 53,1 47,9 No Tag 327 840 45 M 19,5 93,8 No Tag 328 710 41 F 11,5 49,9 No Tag 329 780 45 F 22,1 91,9 Badly damaged fish No Tag 330 420 41 M 6 36,8 No Tag 331 850 44 F Plasma only No Tag 332 840 43 M Plasma only No Tag 333 1100 49 M Plasma only No Tag 334 700 42 M Plasma only No Tag 335 780 45,5 M Plasma only No Tag 336 790 44 F Plasma only/ Damaged fish No Tag 337 620 42 M Plasma only No Tag 338 520 38 M Plasma only No Tag 339 680 42 F Plasma only No Tag 340 750 46 M Plasma only

Water Column Monitoring 2006
16
Sampling data cod, station 4
Tag No. Sample no. Weight (g) Length (cm) SexGonad (g)
Liver (g) Comments
210 401 1000 45 F 25,8 93,4 222 402 720 43 M 23,7 67,6 219 403 700 42 M 5 44,7 228 404 670 42,5 F 12,5 49,1 204 405 830 40 M 20,5 74,6 146 406 720 43,5 F 13,7 30 238 407 620 37 F 8,1 14,1 157 408 630 39 F 15,5 40,3 129 409 780 44 F 15,1 31 187 410 710 43 F 13,4 39,4 236 411 680 41,5 F 7 37 240 412 750 43 M 10 54,8 248 413 670 43 F 13,3 62,4 Damaged fish 246 414 910 46 M 10,6 89,9 158 415 550 39 F 9,7 30 186 416 960 45 M - 31,4 245 417 740 44 M 2 62 266 418 720 43 M 2,4 82,2
No Tag 419 700 41 F 15,3 38,2 249 420 950 46 M 22,1 70,1 231 421 660 41 M 20,9 38
No Tag 422 520 37 M 6 30,1 No Tag 423 1050 47 M 3,6 63,3 No Tag 424 790 42 M 18,9 82,6 No Tag 425 840 43 M 36,2 59,3
No Tag 426 1000 47 F 20,7 78,7 Abnorml gall bladder
No Tag 427 550 42 M 12,9 16,9 No Tag 428 690 44 F 14,4 39,3 No Tag 429 790 44 M 4,2 44 No Tag 430 810 42,5 M 2,4 55,7 No Tag 431 640 41 F Plasma only No Tag 432 840 43,5 M Plasma only No Tag 433 720 42 F Plasma only No Tag 434 850 43 F Plasma only No Tag 435 740 43 F Plasma only No Tag 436 850 44 M Plasma only No Tag 437 820 41 F Plasma only No Tag 438 960 47,5 M Plasma only No Tag 439 690 43,5 F Plasma only No Tag 440 850 46 M Plasma only
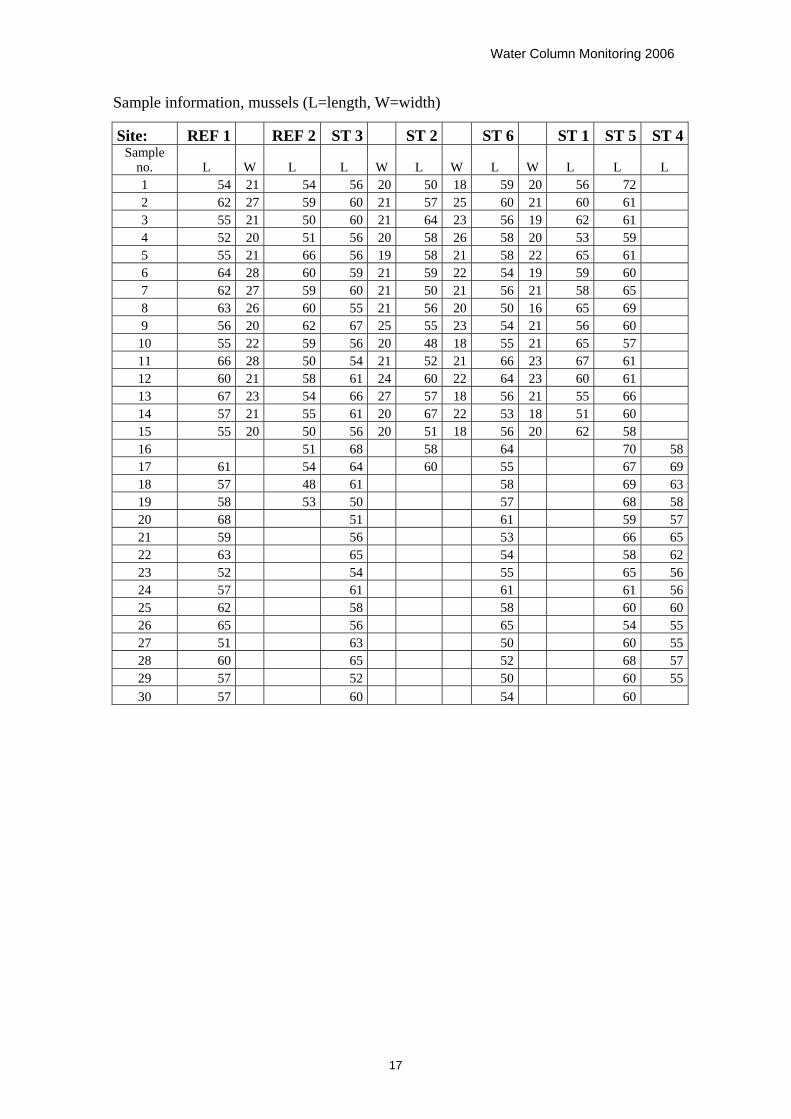
Water Column Monitoring 2006
17
Sample information, mussels (L=length, W=width)
Site: REF 1 REF 2 ST 3 ST 2 ST 6 ST 1 ST 5 ST 4Sample
no. L W L L W L W L W L L L 1 54 21 54 56 20 50 18 59 20 56 72 2 62 27 59 60 21 57 25 60 21 60 61 3 55 21 50 60 21 64 23 56 19 62 61 4 52 20 51 56 20 58 26 58 20 53 59 5 55 21 66 56 19 58 21 58 22 65 61 6 64 28 60 59 21 59 22 54 19 59 60 7 62 27 59 60 21 50 21 56 21 58 65 8 63 26 60 55 21 56 20 50 16 65 69 9 56 20 62 67 25 55 23 54 21 56 60
10 55 22 59 56 20 48 18 55 21 65 57 11 66 28 50 54 21 52 21 66 23 67 61 12 60 21 58 61 24 60 22 64 23 60 61 13 67 23 54 66 27 57 18 56 21 55 66 14 57 21 55 61 20 67 22 53 18 51 60 15 55 20 50 56 20 51 18 56 20 62 58 16 51 68 58 64 70 5817 61 54 64 60 55 67 6918 57 48 61 58 69 6319 58 53 50 57 68 5820 68 51 61 59 5721 59 56 53 66 6522 63 65 54 58 6223 52 54 55 65 5624 57 61 61 61 5625 62 58 58 60 6026 65 56 65 54 5527 51 63 50 60 5528 60 65 52 68 5729 57 52 50 60 5530 57 60 54 60

Water Column Monitoring 2006
18
Appendix 2.
Sampling overview – cod, distribution of tasks among sampling crew.
Personell Task / matrix TreatmentSample splitt Preservation Analysis
A* Fish supply A* Control tagging A Length A Weigth A Fish QA A Sex B Blood spinning Plasma 1 N2 Vtg Plasma 2 N2 Zrp C Open fisk C Bile - One tube N2 AP/PAH met. C Weight liver C Liver - Lever 1 N2 GST,Cyp 1a C - Lever 2 N2 DNA add. Lever 3 N2 Extra
C Weight gonades
Appendix B.
Datareport Water Column Monitoring 2006 NIVA (Oslo)
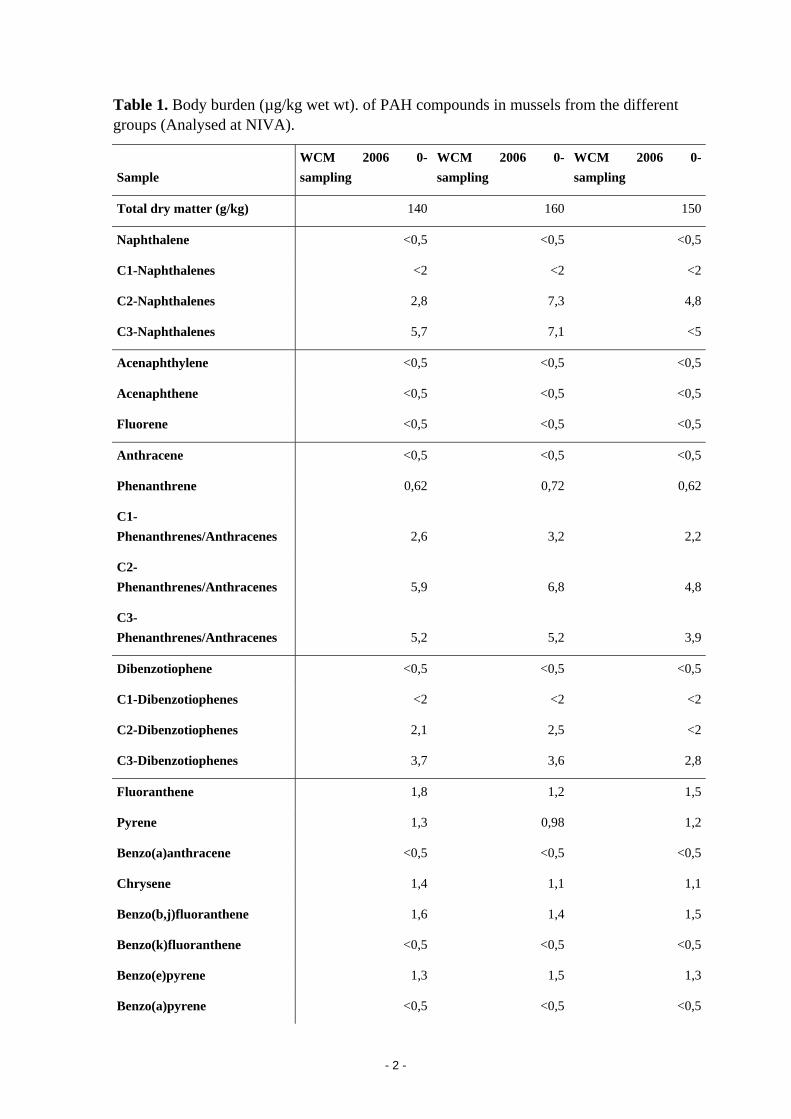
- 2 -
Table 1. Body burden (µg/kg wet wt). of PAH compounds in mussels from the different groups (Analysed at NIVA).
Sample WCM 2006 0-sampling
WCM 2006 0-sampling
WCM 2006 0-sampling
Total dry matter (g/kg) 140 160 150
Naphthalene <0,5 <0,5 <0,5
C1-Naphthalenes <2 <2 <2
C2-Naphthalenes 2,8 7,3 4,8
C3-Naphthalenes 5,7 7,1 <5
Acenaphthylene <0,5 <0,5 <0,5
Acenaphthene <0,5 <0,5 <0,5
Fluorene <0,5 <0,5 <0,5
Anthracene <0,5 <0,5 <0,5
Phenanthrene 0,62 0,72 0,62
C1-Phenanthrenes/Anthracenes 2,6 3,2 2,2
C2-Phenanthrenes/Anthracenes 5,9 6,8 4,8
C3-Phenanthrenes/Anthracenes 5,2 5,2 3,9
Dibenzotiophene <0,5 <0,5 <0,5
C1-Dibenzotiophenes <2 <2 <2
C2-Dibenzotiophenes 2,1 2,5 <2
C3-Dibenzotiophenes 3,7 3,6 2,8
Fluoranthene 1,8 1,2 1,5
Pyrene 1,3 0,98 1,2
Benzo(a)anthracene <0,5 <0,5 <0,5
Chrysene 1,4 1,1 1,1
Benzo(b,j)fluoranthene 1,6 1,4 1,5
Benzo(k)fluoranthene <0,5 <0,5 <0,5
Benzo(e)pyrene 1,3 1,5 1,3
Benzo(a)pyrene <0,5 <0,5 <0,5

- 3 -
Perylene 0,56 <0,5 <0,5
Indeno(1,2,3-cd)pyrene <0,5 <0,5 <0,5
Dibenz(a,c/a,h)anthracene <0,5 <0,5 <0,5
Benzo(ghi)perylene <0,5 <0,5 <0,5
Sum PAH 36,58 42,6 25,72
Sum PAH16 6,72 5,4 5,92
Sum NPD 28,62 36,42 19,12
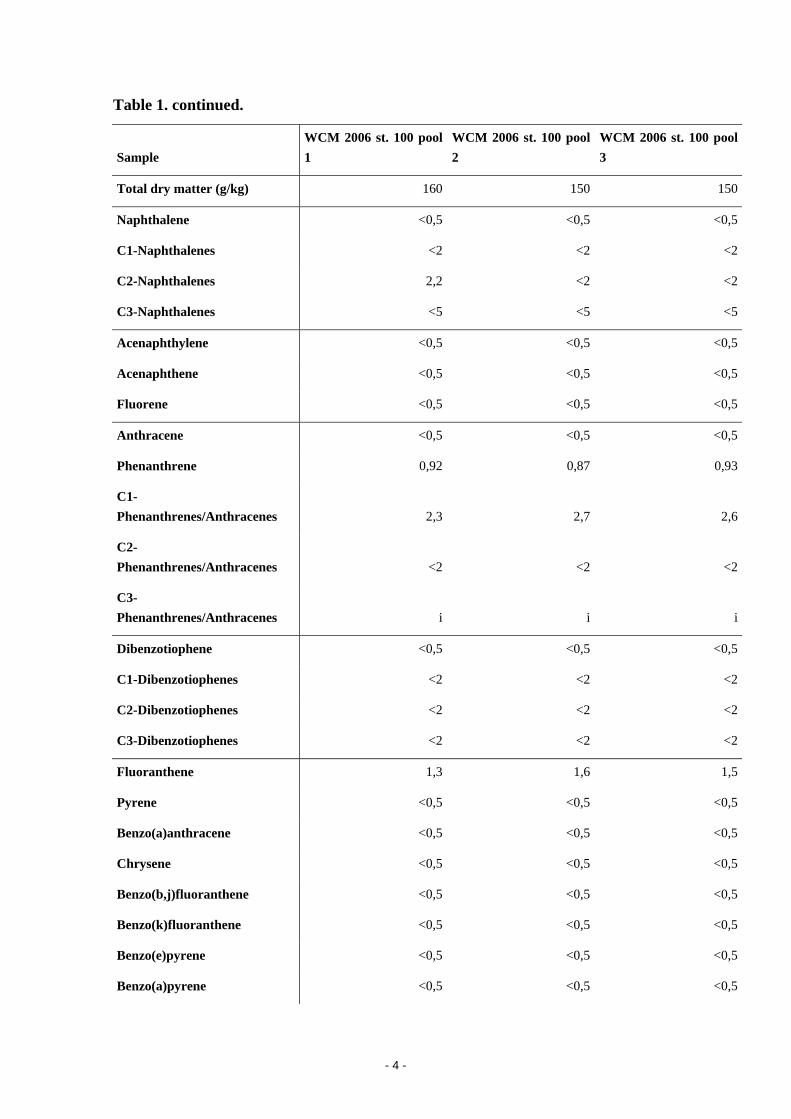
- 4 -
Table 1. continued.
Sample WCM 2006 st. 100 pool 1
WCM 2006 st. 100 pool 2
WCM 2006 st. 100 pool 3
Total dry matter (g/kg) 160 150 150
Naphthalene <0,5 <0,5 <0,5
C1-Naphthalenes <2 <2 <2
C2-Naphthalenes 2,2 <2 <2
C3-Naphthalenes <5 <5 <5
Acenaphthylene <0,5 <0,5 <0,5
Acenaphthene <0,5 <0,5 <0,5
Fluorene <0,5 <0,5 <0,5
Anthracene <0,5 <0,5 <0,5
Phenanthrene 0,92 0,87 0,93
C1-Phenanthrenes/Anthracenes 2,3 2,7 2,6
C2-Phenanthrenes/Anthracenes <2 <2 <2
C3-Phenanthrenes/Anthracenes i i i
Dibenzotiophene <0,5 <0,5 <0,5
C1-Dibenzotiophenes <2 <2 <2
C2-Dibenzotiophenes <2 <2 <2
C3-Dibenzotiophenes <2 <2 <2
Fluoranthene 1,3 1,6 1,5
Pyrene <0,5 <0,5 <0,5
Benzo(a)anthracene <0,5 <0,5 <0,5
Chrysene <0,5 <0,5 <0,5
Benzo(b,j)fluoranthene <0,5 <0,5 <0,5
Benzo(k)fluoranthene <0,5 <0,5 <0,5
Benzo(e)pyrene <0,5 <0,5 <0,5
Benzo(a)pyrene <0,5 <0,5 <0,5

- 5 -
Perylene <0,5 <0,5 <0,5
Indeno(1,2,3-cd)pyrene <0,5 <0,5 <0,5
Dibenz(a,c/a,h)anthracene <0,5 <0,5 <0,5
Benzo(ghi)perylene <0,5 <0,5 <0,5
Sum PAH 6,72 5,17 5,03
Sum PAH16 2,22 2,47 2,43
Sum NPD 5,42 3,57 3,53

- 6 -
Table 1. continued.
Sample WCM 2006 st. 300 pool 1 WCM 2006 st. 300 pool 2
Total dry matter (g/kg) 140 130
Naphthalene 3,1 3,1
C1-Naphthalenes 18 21
C2-Naphthalenes 57 62
C3-Naphthalenes 220 230
Acenaphthylene <0,5 <0,5
Acenaphthene <0,5 <0,5
Fluorene 2 2,4
Anthracene <0,5 <0,5
Phenanthrene 9 9,8
C1-Phenanthrenes/Anthracenes 56 56
C2-Phenanthrenes/Anthracenes 150 140
C3-Phenanthrenes/Anthracenes 82 78
Dibenzotiophene 0,99 1,3
C1-Dibenzotiophenes 11 12
C2-Dibenzotiophenes 37 35
C3-Dibenzotiophenes 48 43
Fluoranthene 2,4 2,3
Pyrene 0,7 0,83
Benzo(a)anthracene 0,52 <0,5
Chrysene 2,4 1,4
Benzo(b,j)fluoranthene 0,89 0,7
Benzo(k)fluoranthene <0,5 <0,5
Benzo(e)pyrene 2,2 2,1
Benzo(a)pyrene <0,5 <0,5
Perylene <0,5 <0,5

- 7 -
Indeno(1,2,3-cd)pyrene <0,5 <0,5
Dibenz(a,c/a,h)anthracene <0,5 <0,5
Benzo(ghi)perylene <0,5 <0,5
Sum PAH 703,2 700,93
Sum PAH16 21,01 20,53
Sum NPD 692,09 691,2
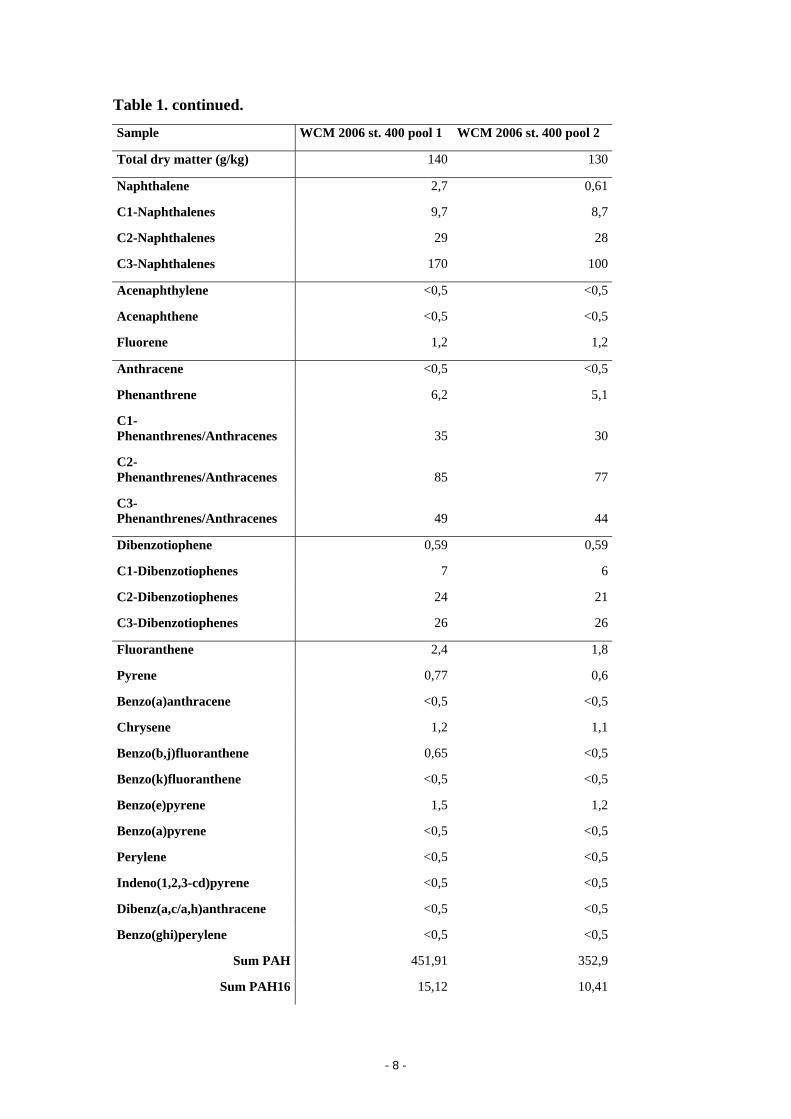
- 8 -
Table 1. continued.
Sample WCM 2006 st. 400 pool 1 WCM 2006 st. 400 pool 2
Total dry matter (g/kg) 140 130
Naphthalene 2,7 0,61
C1-Naphthalenes 9,7 8,7
C2-Naphthalenes 29 28
C3-Naphthalenes 170 100
Acenaphthylene <0,5 <0,5
Acenaphthene <0,5 <0,5
Fluorene 1,2 1,2
Anthracene <0,5 <0,5
Phenanthrene 6,2 5,1
C1-Phenanthrenes/Anthracenes 35 30
C2-Phenanthrenes/Anthracenes 85 77
C3-Phenanthrenes/Anthracenes 49 44
Dibenzotiophene 0,59 0,59
C1-Dibenzotiophenes 7 6
C2-Dibenzotiophenes 24 21
C3-Dibenzotiophenes 26 26
Fluoranthene 2,4 1,8
Pyrene 0,77 0,6
Benzo(a)anthracene <0,5 <0,5
Chrysene 1,2 1,1
Benzo(b,j)fluoranthene 0,65 <0,5
Benzo(k)fluoranthene <0,5 <0,5
Benzo(e)pyrene 1,5 1,2
Benzo(a)pyrene <0,5 <0,5
Perylene <0,5 <0,5
Indeno(1,2,3-cd)pyrene <0,5 <0,5
Dibenz(a,c/a,h)anthracene <0,5 <0,5
Benzo(ghi)perylene <0,5 <0,5
Sum PAH 451,91 352,9
Sum PAH16 15,12 10,41

- 9 -
Sum NPD 444,19 347
Table 2. Sex, CYP1A and GST activity for individual cod from the different groups
Group Sample-
code Sex CYP1A
(Absorbance)
GST act.
(µmol/min/mg prot)
0-sampling 1 Male 0,326 1174,8
0-sampling 2 Female 0,171 1434,3
0-sampling 3 Male 0,000 791,2
0-sampling 4 Female 0,229 907,9
0-sampling 5 Male 0,019 1424,7
0-sampling 6 Female 0,000 935,9
0-sampling 7 Female 0,082 1043,0
0-sampling 8 Female 0,180 667,2
0-sampling 9 Male 0,253 1836,7
0-sampling 10 Female 0,169 1573,6
0-sampling 11 Male 0,354 1086,2
0-sampling 12 Male 0,080 1125,6
0-sampling 13 Female 0,242 1149,6
0-sampling 14 Female 0,142 1037,9
0-sampling 15 Male 0,009 1271,5
0-sampling 16 Male 0,000 1024,3
0-sampling 17 Female 0,000 1819,5
0-sampling 18 Female 0,000 1773,2
0-sampling 19 Female 0,234 1130,7
0-sampling 20 Male 0,210 1316,6
0-sampling 21 Male 0,124 1000,3
0-sampling 22 Female 0,124 1829,6
0-sampling 23 Male 0,052 1081,0
0-sampling 24 Female 0,154 1895,1
0-sampling 25 Female 0,129

- 10 -
Table 2. continued.
Group Sample-
code Sex CYP1A
(Absorbance)
GST act.
(µmol/min/mg prot)
100 (REF) 101-2 Male 0,095 1464,5
100 (REF) 102-2 Female 0,092 1236,4
100 (REF) 103-2 Male 0,105 690,0
100 (REF) 105-2 Female 0,086 910,9
100 (REF) 106-2 Male 0,101 1330,1
100 (REF) 107-2 Female 0,095 1052,5
100 (REF) 108-2 Male 0,122 1986,5
100 (REF) 109-2 Male 0,156 678,8
100 (REF) 110-2 Female 0,069 1084,0
100 (REF) 111-2 Male 0,147 1334,0
100 (REF) 112-2 Female 0,097 1284,6
100 (REF) 114-2 Female 0,117 845,1
100 (REF) 115-2 Male 0,074 1117,2
100 (REF) 116-2 Male 0,114 1503,9
100 (REF) 118-2 Male 0,087 1359,5
100 (REF) 119-2 Female 0,121 907,5
100 (REF) 120-2 Male 0,072 1758,9
100 (REF) 121-2 Male 0,191 722,1
100 (REF) 122-2 Female 0,115 885,9
100 (REF) 123-2 Male 0,094 1655,1
100 (REF) 124-2 Male 0,085 1135,4
100 (REF) 125-2 Female 0,096 1669,2
100 (REF) 126-2 Female 0,092 925,1
100 (REF) 127-2 Male 0,172 802,9
100 (REF) 129-2 Female 0,105 762,5
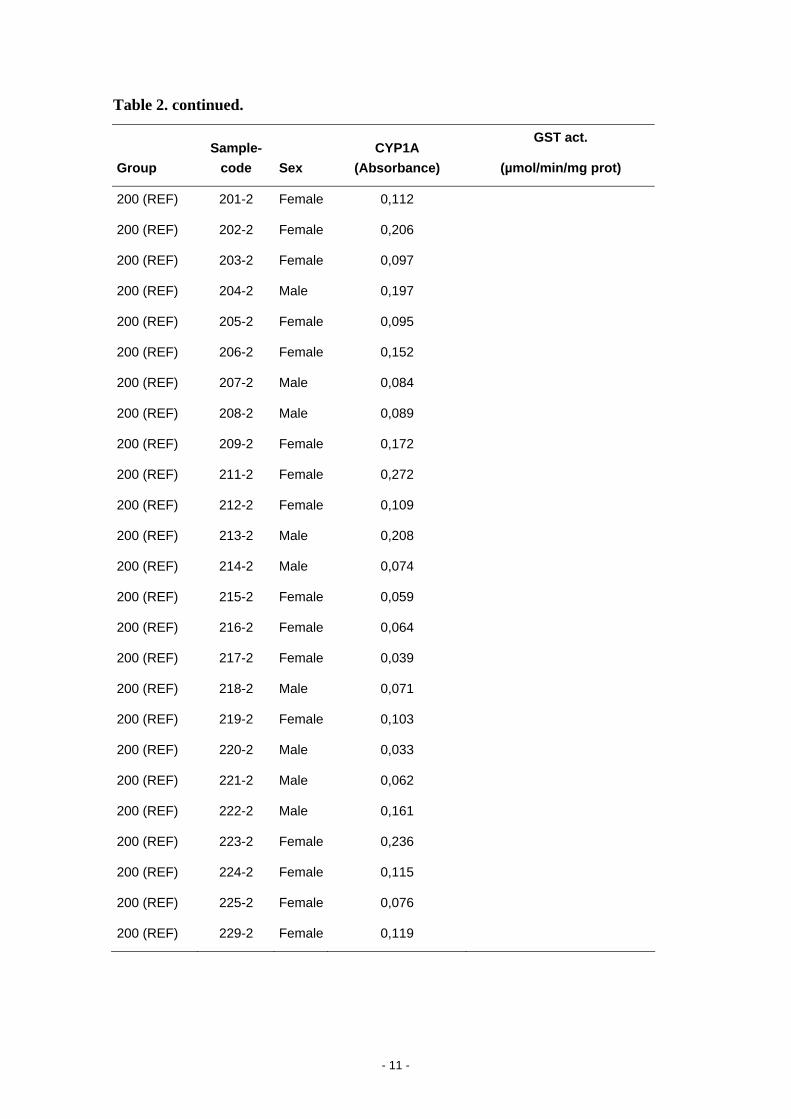
- 11 -
Table 2. continued.
Group Sample-
code Sex CYP1A
(Absorbance)
GST act.
(µmol/min/mg prot)
200 (REF) 201-2 Female 0,112
200 (REF) 202-2 Female 0,206
200 (REF) 203-2 Female 0,097
200 (REF) 204-2 Male 0,197
200 (REF) 205-2 Female 0,095
200 (REF) 206-2 Female 0,152
200 (REF) 207-2 Male 0,084
200 (REF) 208-2 Male 0,089
200 (REF) 209-2 Female 0,172
200 (REF) 211-2 Female 0,272
200 (REF) 212-2 Female 0,109
200 (REF) 213-2 Male 0,208
200 (REF) 214-2 Male 0,074
200 (REF) 215-2 Female 0,059
200 (REF) 216-2 Female 0,064
200 (REF) 217-2 Female 0,039
200 (REF) 218-2 Male 0,071
200 (REF) 219-2 Female 0,103
200 (REF) 220-2 Male 0,033
200 (REF) 221-2 Male 0,062
200 (REF) 222-2 Male 0,161
200 (REF) 223-2 Female 0,236
200 (REF) 224-2 Female 0,115
200 (REF) 225-2 Female 0,076
200 (REF) 229-2 Female 0,119
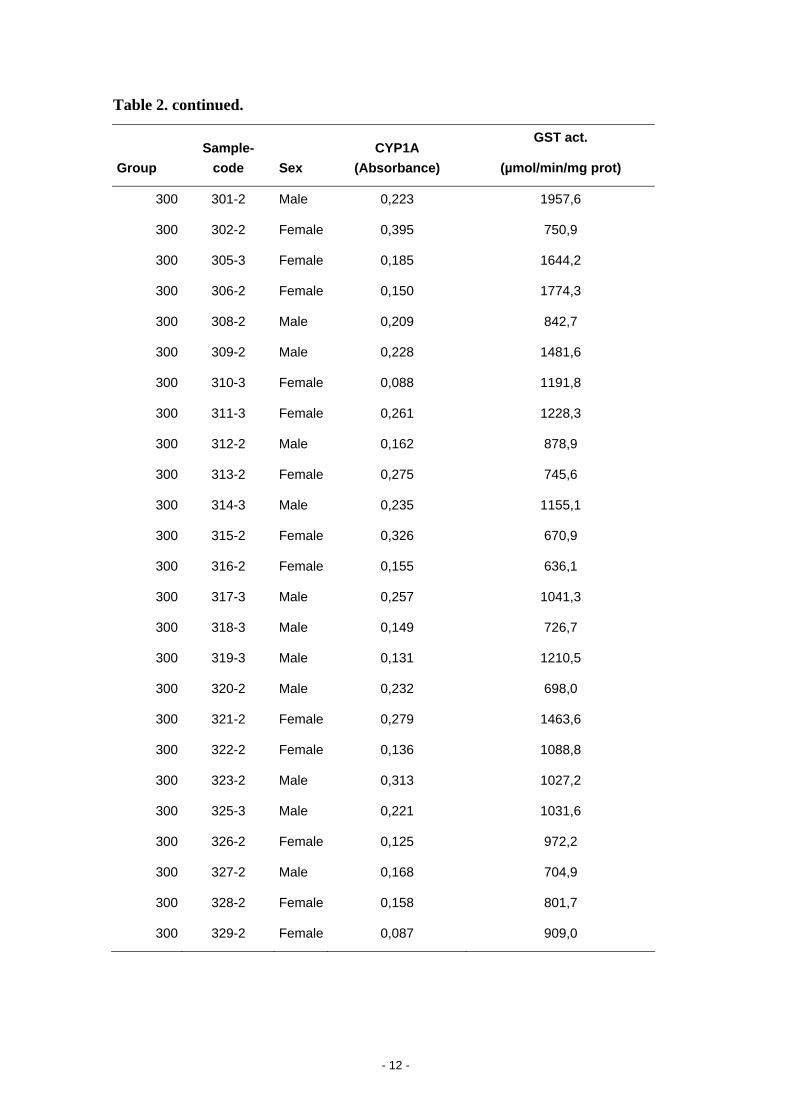
- 12 -
Table 2. continued.
Group Sample-
code Sex CYP1A
(Absorbance)
GST act.
(µmol/min/mg prot)
300 301-2 Male 0,223 1957,6
300 302-2 Female 0,395 750,9
300 305-3 Female 0,185 1644,2
300 306-2 Female 0,150 1774,3
300 308-2 Male 0,209 842,7
300 309-2 Male 0,228 1481,6
300 310-3 Female 0,088 1191,8
300 311-3 Female 0,261 1228,3
300 312-2 Male 0,162 878,9
300 313-2 Female 0,275 745,6
300 314-3 Male 0,235 1155,1
300 315-2 Female 0,326 670,9
300 316-2 Female 0,155 636,1
300 317-3 Male 0,257 1041,3
300 318-3 Male 0,149 726,7
300 319-3 Male 0,131 1210,5
300 320-2 Male 0,232 698,0
300 321-2 Female 0,279 1463,6
300 322-2 Female 0,136 1088,8
300 323-2 Male 0,313 1027,2
300 325-3 Male 0,221 1031,6
300 326-2 Female 0,125 972,2
300 327-2 Male 0,168 704,9
300 328-2 Female 0,158 801,7
300 329-2 Female 0,087 909,0

- 13 -
Table 2. continued.
Group Sample-
code Sex CYP1A
(Absorbance)
GST act.
(µmol/min/mg prot)
400 401-2 Female 0,179 1265,7
400 402-2 Male 0,203 1059,0
400 403-2 Male 0,226 870,5
400 404-2 Female 0,137 756,6
400 405-2 Male 0,183 761,5
400 406-2 Female 0,103 612,9
400 407-2 Female 0,231 645,4
400 409-2 Female 0,240 894,7
400 410-2 Female 0,175 713,3
400 414-2 Male 0,161 675,5
400 415-2 Female 0,217 820,7
400 416-2 Male 0,122 1064,6
400 417-2 Male 0,138 858,9
400 418-2 Male 0,156 801,6
400 419-2 Female 0,111 1383,6
400 421-2 Male 0,225 1129,0
400 422-2 Male 0,143 807,8
400 423-2 Male 0,222 478,4
400 424-2 Male 0,116 1729,1
400 425-2 Male 0,167 1274,8
400 426-2 Female 0,241 953,4
400 427-2 Male 0,216 780,1
400 428-2 Female 0,109 691,8
400 429-2 Male 0,282 882,9
400 430-2 Male 0,177 863,2
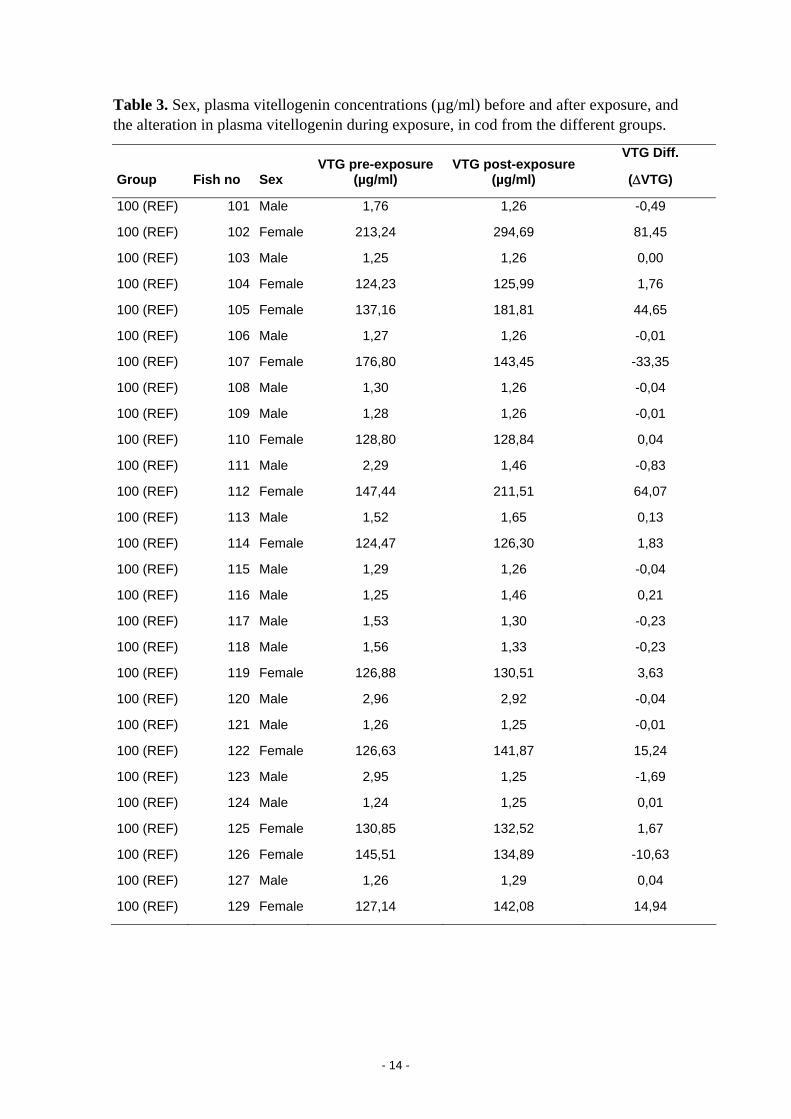
- 14 -
Table 3. Sex, plasma vitellogenin concentrations (µg/ml) before and after exposure, and the alteration in plasma vitellogenin during exposure, in cod from the different groups.
Group Fish no Sex VTG pre-exposure
(µg/ml) VTG post-exposure
(µg/ml)
VTG Diff.
(ΔVTG)
100 (REF) 101 Male 1,76 1,26 -0,49
100 (REF) 102 Female 213,24 294,69 81,45
100 (REF) 103 Male 1,25 1,26 0,00
100 (REF) 104 Female 124,23 125,99 1,76
100 (REF) 105 Female 137,16 181,81 44,65
100 (REF) 106 Male 1,27 1,26 -0,01
100 (REF) 107 Female 176,80 143,45 -33,35
100 (REF) 108 Male 1,30 1,26 -0,04
100 (REF) 109 Male 1,28 1,26 -0,01
100 (REF) 110 Female 128,80 128,84 0,04
100 (REF) 111 Male 2,29 1,46 -0,83
100 (REF) 112 Female 147,44 211,51 64,07
100 (REF) 113 Male 1,52 1,65 0,13
100 (REF) 114 Female 124,47 126,30 1,83
100 (REF) 115 Male 1,29 1,26 -0,04
100 (REF) 116 Male 1,25 1,46 0,21
100 (REF) 117 Male 1,53 1,30 -0,23
100 (REF) 118 Male 1,56 1,33 -0,23
100 (REF) 119 Female 126,88 130,51 3,63
100 (REF) 120 Male 2,96 2,92 -0,04
100 (REF) 121 Male 1,26 1,25 -0,01
100 (REF) 122 Female 126,63 141,87 15,24
100 (REF) 123 Male 2,95 1,25 -1,69
100 (REF) 124 Male 1,24 1,25 0,01
100 (REF) 125 Female 130,85 132,52 1,67
100 (REF) 126 Female 145,51 134,89 -10,63
100 (REF) 127 Male 1,26 1,29 0,04
100 (REF) 129 Female 127,14 142,08 14,94

- 15 -
Table 3. continued.
Group Fish no Sex VTG pre-exposure
(µg/ml) VTG post-exposure
(µg/ml)
VTG Diff.
(ΔVTG)
300 301 Male 2,93 2,57 -0,36
300 302 Female 126,95 127,68 0,73
300 303 Female 128,51 136,59 8,08
300 304 Male 1,25 1,25 0,00
300 305 Female 144,33 204,51 60,18
300 306 Female 134,64 165,97 31,33
300 307 Female 128,70 156,55 27,84
300 308 Male 1,31 1,29 -0,02
300 309 Male 1,49 1,27 -0,22
300 310 Female 197,07 143,21 -53,87
300 311 Female 126,68 127,50 0,82
300 312 Male 2,64 1,29 -1,35
300 313 Female 126,11 126,55 0,44
300 314 Male 1,36 1,30 -0,06
300 315 Female 153,65 238,46 84,82
300 316 Female 134,89 128,61 -6,28
300 317 Male 1,28 1,26 -0,03
300 318 Male 1,28 1,25 -0,03
300 319 Male 1,26 1,25 -0,01
300 320 Male 1,55 1,26 -0,29
300 321 Female 160,73 176,74 16,01
300 322 Female 128,12 171,48 43,36
300 323 Male 1,27 1,26 -0,01
300 324 Male 1,74 1,28 -0,46
300 325 Male 1,41 1,26 -0,15
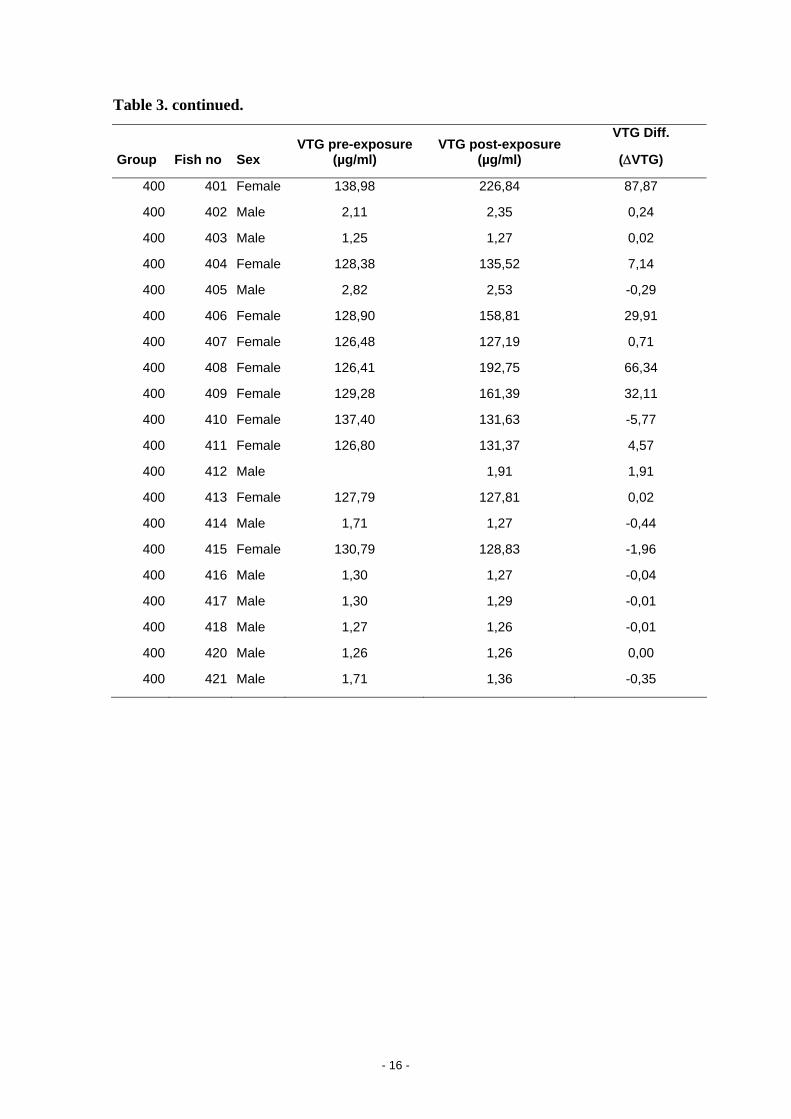
- 16 -
Table 3. continued.
Group Fish no Sex VTG pre-exposure
(µg/ml) VTG post-exposure
(µg/ml)
VTG Diff.
(ΔVTG)
400 401 Female 138,98 226,84 87,87
400 402 Male 2,11 2,35 0,24
400 403 Male 1,25 1,27 0,02
400 404 Female 128,38 135,52 7,14
400 405 Male 2,82 2,53 -0,29
400 406 Female 128,90 158,81 29,91
400 407 Female 126,48 127,19 0,71
400 408 Female 126,41 192,75 66,34
400 409 Female 129,28 161,39 32,11
400 410 Female 137,40 131,63 -5,77
400 411 Female 126,80 131,37 4,57
400 412 Male 1,91 1,91
400 413 Female 127,79 127,81 0,02
400 414 Male 1,71 1,27 -0,44
400 415 Female 130,79 128,83 -1,96
400 416 Male 1,30 1,27 -0,04
400 417 Male 1,30 1,29 -0,01
400 418 Male 1,27 1,26 -0,01
400 420 Male 1,26 1,26 0,00
400 421 Male 1,71 1,36 -0,35

- 17 -
Table 4. Sex, zona radiata protein (Absorbance) before and after exposure, and the alteration in plasma vitellogenin during exposure, in cod from the different groups.
Group Fish no Sex
ZRP (NSB corr. ABS)
pre-exposure
ZRP (NSB corr. ABS)
post-eksposure
ZRP Diff.
(ΔZRP)
100 (REF) 101 Male 0,149 0,195 0,046
100 (REF) 102 Female 0,137 0,261 0,123
100 (REF) 103 Male 0,152 0,189 0,036
100 (REF) 104 Female 0,133 0,169 0,036
100 (REF) 105 Female 0,138 0,208 0,070
100 (REF) 106 Male 0,002 0,118 0,115
100 (REF) 107 Female 0,104 0,124 0,021
100 (REF) 108 Male 0,133 0,146 0,013
100 (REF) 109 Male 0,118 0,138 0,020
100 (REF) 110 Female 0,114 0,130 0,015
100 (REF) 111 Male 0,107 0,160 0,053
100 (REF) 112 Female 0,139 0,145 0,007
100 (REF) 113 Male 0,036 0,135 0,100
100 (REF) 114 Female 0,142 0,177 0,035
100 (REF) 115 Male 0,101 0,139 0,038
100 (REF) 116 Male 0,084 0,152 0,069
100 (REF) 117 Male 0,026 0,160 0,134
100 (REF) 118 Male 0,102 0,148 0,047
100 (REF) 119 Female 0,146 0,182 0,036
100 (REF) 120 Male 0,094 0,168 0,073
100 (REF) 121 Male 0,148 0,160 0,012
100 (REF) 122 Female 0,103 -0,004 -0,107
100 (REF) 123 Male 0,141 0,183 0,042
100 (REF) 124 Male 0,161 0,121 -0,040
100 (REF) 125 Female 0,071 0,177 0,106
100 (REF) 126 Female 0,086 0,164 0,078
100 (REF) 127 Male 0,049 0,150 0,102
100 (REF) 129 Female 0,111 0,148 0,037
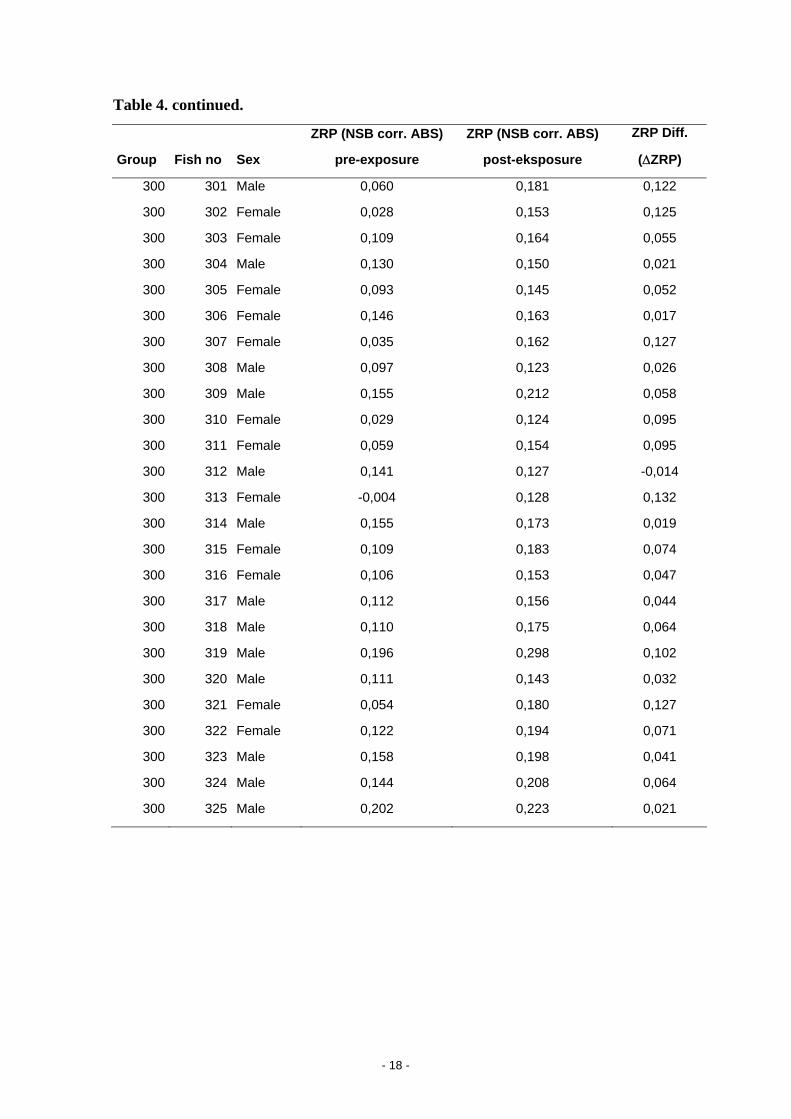
- 18 -
Table 4. continued.
Group Fish no Sex
ZRP (NSB corr. ABS)
pre-exposure
ZRP (NSB corr. ABS)
post-eksposure
ZRP Diff.
(ΔZRP)
300 301 Male 0,060 0,181 0,122
300 302 Female 0,028 0,153 0,125
300 303 Female 0,109 0,164 0,055
300 304 Male 0,130 0,150 0,021
300 305 Female 0,093 0,145 0,052
300 306 Female 0,146 0,163 0,017
300 307 Female 0,035 0,162 0,127
300 308 Male 0,097 0,123 0,026
300 309 Male 0,155 0,212 0,058
300 310 Female 0,029 0,124 0,095
300 311 Female 0,059 0,154 0,095
300 312 Male 0,141 0,127 -0,014
300 313 Female -0,004 0,128 0,132
300 314 Male 0,155 0,173 0,019
300 315 Female 0,109 0,183 0,074
300 316 Female 0,106 0,153 0,047
300 317 Male 0,112 0,156 0,044
300 318 Male 0,110 0,175 0,064
300 319 Male 0,196 0,298 0,102
300 320 Male 0,111 0,143 0,032
300 321 Female 0,054 0,180 0,127
300 322 Female 0,122 0,194 0,071
300 323 Male 0,158 0,198 0,041
300 324 Male 0,144 0,208 0,064
300 325 Male 0,202 0,223 0,021

- 19 -
Table 4. continued.
Group Fish no Sex
ZRP (NSB corr. ABS)
pre-exposure
ZRP (NSB corr. ABS)
post-eksposure
ZRP Diff.
(ΔZRP)
400 401 Female 0,146 0,220 0,074
400 402 Male 0,151 0,158 0,007
400 403 Male 0,131 0,153 0,022
400 404 Female 0,133 0,172 0,039
400 405 Male 0,141 0,167 0,026
400 406 Female 0,099 0,190 0,091
400 407 Female 0,028 0,175 0,147
400 408 Female 0,156 0,190 0,034
400 409 Female 0,122 0,183 0,061
400 410 Female 0,120 0,145 0,025
400 411 Female 0,041 0,170 0,128
400 412 Male 0,022 0,155 0,133
400 413 Female 0,059 0,180 0,121
400 414 Male -0,010 0,225 0,235
400 415 Female 0,170 0,229 0,060
400 416 Male 0,119 0,190 0,071
400 417 Male 0,023 0,165 0,142
400 418 Male 0,090 0,116 0,026
400 420 Male 0,092 0,205 0,113
400 421 Male 0,043 0,153 0,111

- 20 -
Current measurements - details
Station 400
WCM 2006 st. 3
4
6
8
10
12
14
16
03.0
4.06
05.0
4.06
07.0
4.06
09.0
4.06
11.0
4.06
13.0
4.06
15.0
4.06
17.0
4.06
19.0
4.06
21.0
4.06
23.0
4.06
25.0
4.06
27.0
4.06
29.0
4.06
01.0
5.06
03.0
5.06
05.0
5.06
07.0
5.06
09.0
5.06
11.0
5.06
13.0
5.06
15.0
5.06
17.0
5.06
19.0
5.06
21.0
5.06
23.0
5.06
25.0
5.06
Date
Tem
p.
11
12
13
14
15
16
17
18
19
20
21
Dep
th TempDepth
Figure 1. Water temperature (°C)and measuring depth (m) at WCM 2006 station 400. Measurements at 10 minute interval.
Table 1. Calculated parameters from current measurements from April 6th until the 21st of May, station 400.
Parameter Velocity (cm/s)
Average 11.7 Varians 35.4 Maximum 33.4 Minimum 0.0 Median * 11.1 Measuring depth 18-20 (m) Main directions N-E and S-W *See also cumulative probability plot
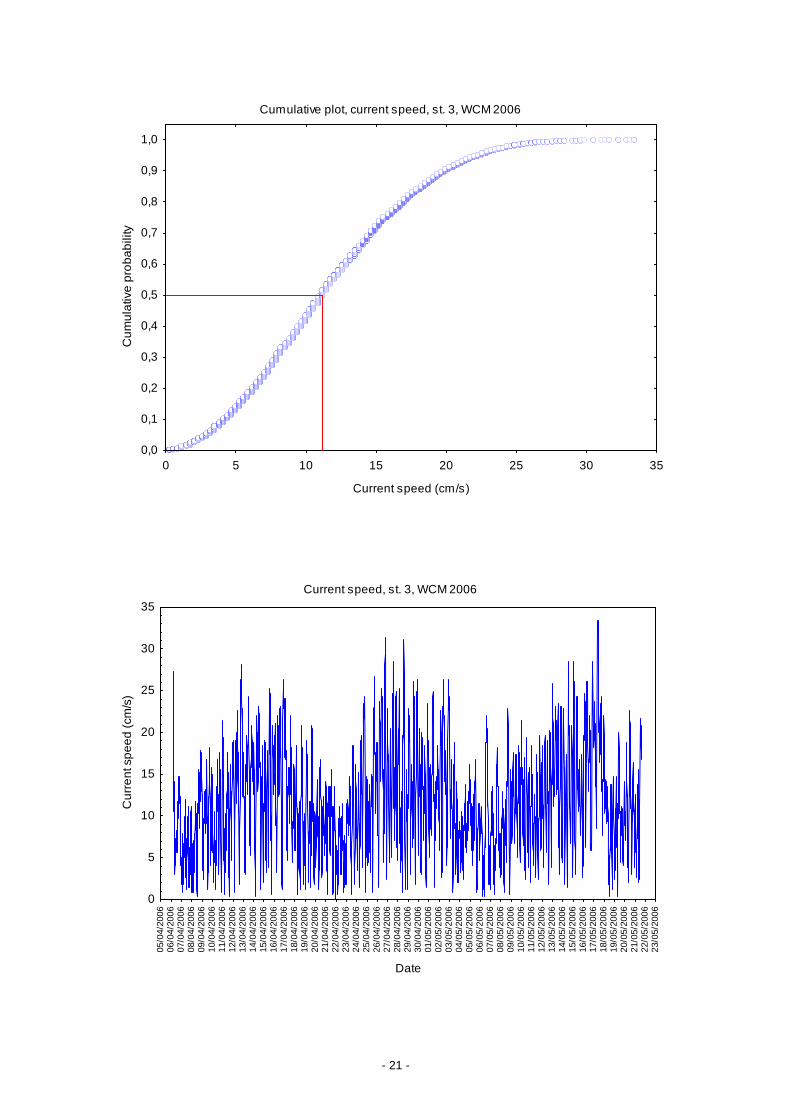
- 21 -
Cumulative plot, current speed, st. 3, WCM 2006
0 5 10 15 20 25 30 35
Current speed (cm/s)
0,0
0,1
0,2
0,3
0,4
0,5
0,6
0,7
0,8
0,9
1,0C
umul
ativ
e pr
obab
ility
Current speed, st. 3, WCM 2006
05/0
4/20
0606
/04/
2006
07/0
4/20
0608
/04/
2006
09/0
4/20
0610
/04/
2006
11/0
4/20
0612
/04/
2006
13/0
4/20
0614
/04/
2006
15/0
4/20
0616
/04/
2006
17/0
4/20
0618
/04/
2006
19/0
4/20
0620
/04/
2006
21/0
4/20
0622
/04/
2006
23/0
4/20
0624
/04/
2006
25/0
4/20
0626
/04/
2006
27/0
4/20
0628
/04/
2006
29/0
4/20
0630
/04/
2006
01/0
5/20
0602
/05/
2006
03/0
5/20
0604
/05/
2006
05/0
5/20
0606
/05/
2006
07/0
5/20
0608
/05/
2006
09/0
5/20
0610
/05/
2006
11/0
5/20
0612
/05/
2006
13/0
5/20
0614
/05/
2006
15/0
5/20
0616
/05/
2006
17/0
5/20
0618
/05/
2006
19/0
5/20
0620
/05/
2006
21/0
5/20
0622
/05/
2006
23/0
5/20
06
Date
0
5
10
15
20
25
30
35
Cur
rent
spe
ed (c
m/s
)

- 22 -
Histogram, current direction, st. 3, WCM 2006
0 30 60 90 120 150 180 210 240 270 300 330 360
Current direction (degrees)
0
100
200
300
400
500
600
700N
o. o
f obs
.

- 23 -
Station 700
WCM 2006 st. 5
4
6
8
10
12
14
16
03.0
4.06
05.0
4.06
07.0
4.06
09.0
4.06
11.0
4.06
13.0
4.06
15.0
4.06
17.0
4.06
19.0
4.06
21.0
4.06
23.0
4.06
25.0
4.06
27.0
4.06
29.0
4.06
01.0
5.06
03.0
5.06
05.0
5.06
07.0
5.06
09.0
5.06
11.0
5.06
13.0
5.06
15.0
5.06
17.0
5.06
19.0
5.06
21.0
5.06
23.0
5.06
25.0
5.06
Date
Tem
p.
1011
12
13
1415
16
1718
19
20
Dep
th TempDepth
Figure X. Water temperature (°C)and measuring depth (m) at WCM 2006 station 700. Measurements at 10 minute interval.
Table X. Calculated parameters from current measurements from April 6th until the 21st of May, station 700, WCM 2006.
Parameter Velocity (cm/s)
Average 12.3 Varians 40.9 Maximum 37.5 Minimum 0.0 Median * 11.4 Measuring depth 17-19 (m) Main directions N-E and S-W *See also cumulative probability plot

- 24 -
Cumulative plot, Current speed, st. 5, WCM 2006
0 5 10 15 20 25 30 35 40
Current speed (cm/s)
0,0
0,1
0,2
0,3
0,4
0,5
0,6
0,7
0,8
0,9
1,0C
umul
ativ
e pr
obab
ility
Current speed, st. 5, WCM 2006
05/0
4/20
0606
/04/
2006
07/0
4/20
0608
/04/
2006
09/0
4/20
0610
/04/
2006
11/0
4/20
0612
/04/
2006
13/0
4/20
0614
/04/
2006
15/0
4/20
0616
/04/
2006
17/0
4/20
0618
/04/
2006
19/0
4/20
0620
/04/
2006
21/0
4/20
0622
/04/
2006
23/0
4/20
0624
/04/
2006
25/0
4/20
0626
/04/
2006
27/0
4/20
0628
/04/
2006
29/0
4/20
0630
/04/
2006
01/0
5/20
0602
/05/
2006
03/0
5/20
0604
/05/
2006
05/0
5/20
0606
/05/
2006
07/0
5/20
0608
/05/
2006
09/0
5/20
0610
/05/
2006
11/0
5/20
0612
/05/
2006
13/0
5/20
0614
/05/
2006
15/0
5/20
0616
/05/
2006
17/0
5/20
0618
/05/
2006
19/0
5/20
0620
/05/
2006
21/0
5/20
0622
/05/
2006
23/0
5/20
06
Date
0
5
10
15
20
25
30
35
40
Cur
rent
spe
ed (c
m/s
)
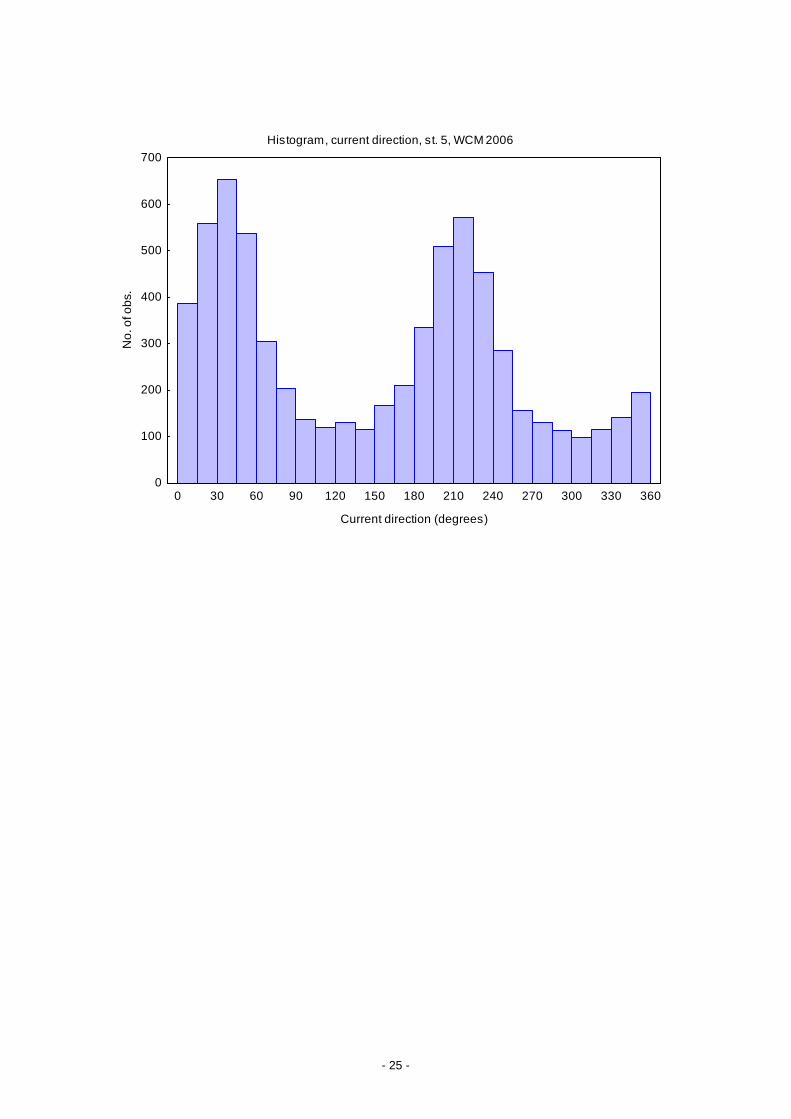
- 25 -
Histogram, current direction, st. 5, WCM 2006
0 30 60 90 120 150 180 210 240 270 300 330 360
Current direction (degrees)
0
100
200
300
400
500
600
700
No.
of o
bs.
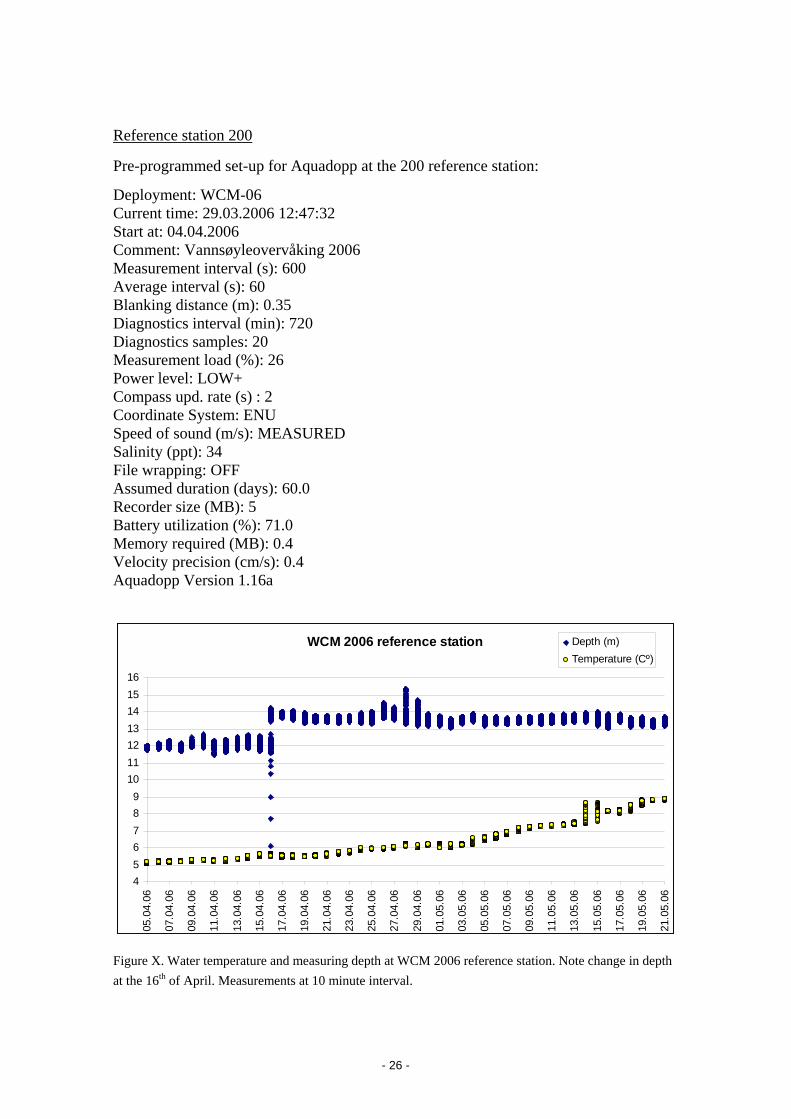
- 26 -
Reference station 200
Pre-programmed set-up for Aquadopp at the 200 reference station:
Deployment: WCM-06 Current time: 29.03.2006 12:47:32 Start at: 04.04.2006 Comment: Vannsøyleovervåking 2006 Measurement interval (s): 600 Average interval (s): 60 Blanking distance (m): 0.35 Diagnostics interval (min): 720 Diagnostics samples: 20 Measurement load (%): 26 Power level: LOW+ Compass upd. rate (s) : 2 Coordinate System: ENU Speed of sound (m/s): MEASURED Salinity (ppt): 34 File wrapping: OFF Assumed duration (days): 60.0 Recorder size (MB): 5 Battery utilization (%): 71.0 Memory required (MB): 0.4 Velocity precision (cm/s): 0.4 Aquadopp Version 1.16a
WCM 2006 reference station
456789
10111213141516
05.0
4.06
07.0
4.06
09.0
4.06
11.0
4.06
13.0
4.06
15.0
4.06
17.0
4.06
19.0
4.06
21.0
4.06
23.0
4.06
25.0
4.06
27.0
4.06
29.0
4.06
01.0
5.06
03.0
5.06
05.0
5.06
07.0
5.06
09.0
5.06
11.0
5.06
13.0
5.06
15.0
5.06
17.0
5.06
19.0
5.06
21.0
5.06
Depth (m)Temperature (Cº)
Figure X. Water temperature and measuring depth at WCM 2006 reference station. Note change in depth at the 16th of April. Measurements at 10 minute interval.

- 27 -
Table x. Calculated parameters from current measurements from the 5th April until the 21st of May. Some data at the 16th of April are excluded.
Parameter Velocity (cm/s)
Average 15,0 Varians 45,4 Maximum 40,9 Minimum 0,2 Median 14,9
Measuring depth 12-14 (m) Main directions N-E and S-W
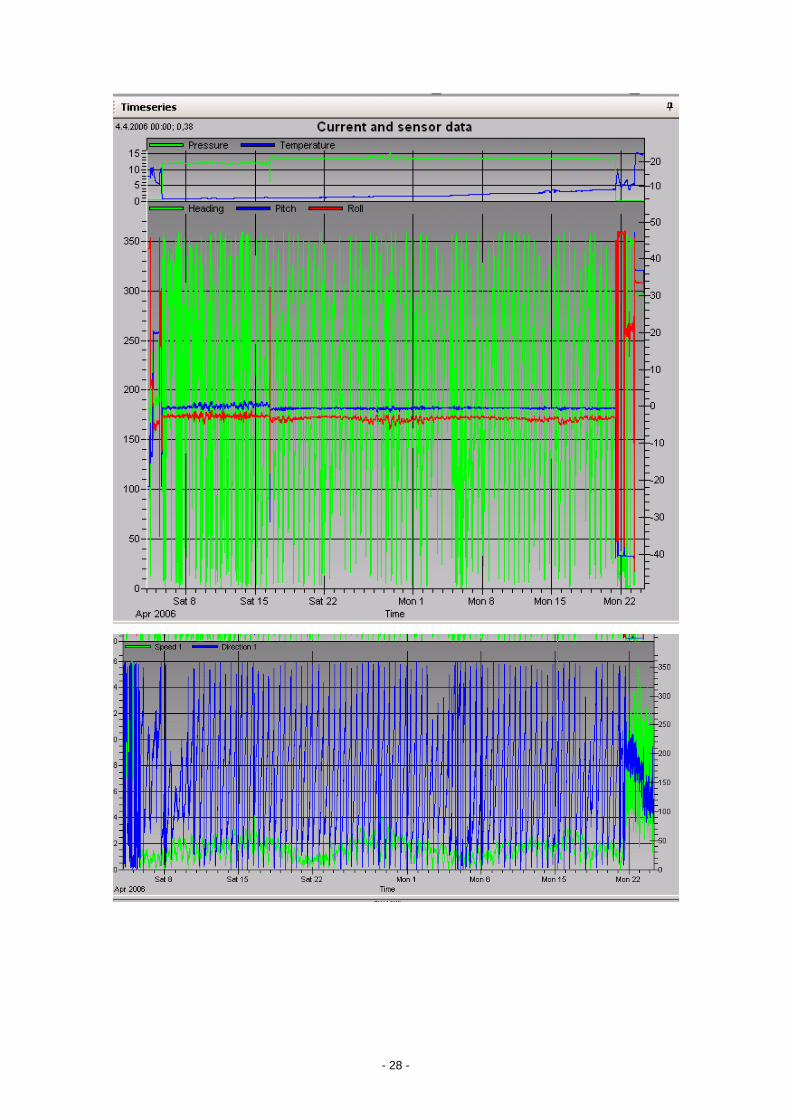
- 28 -
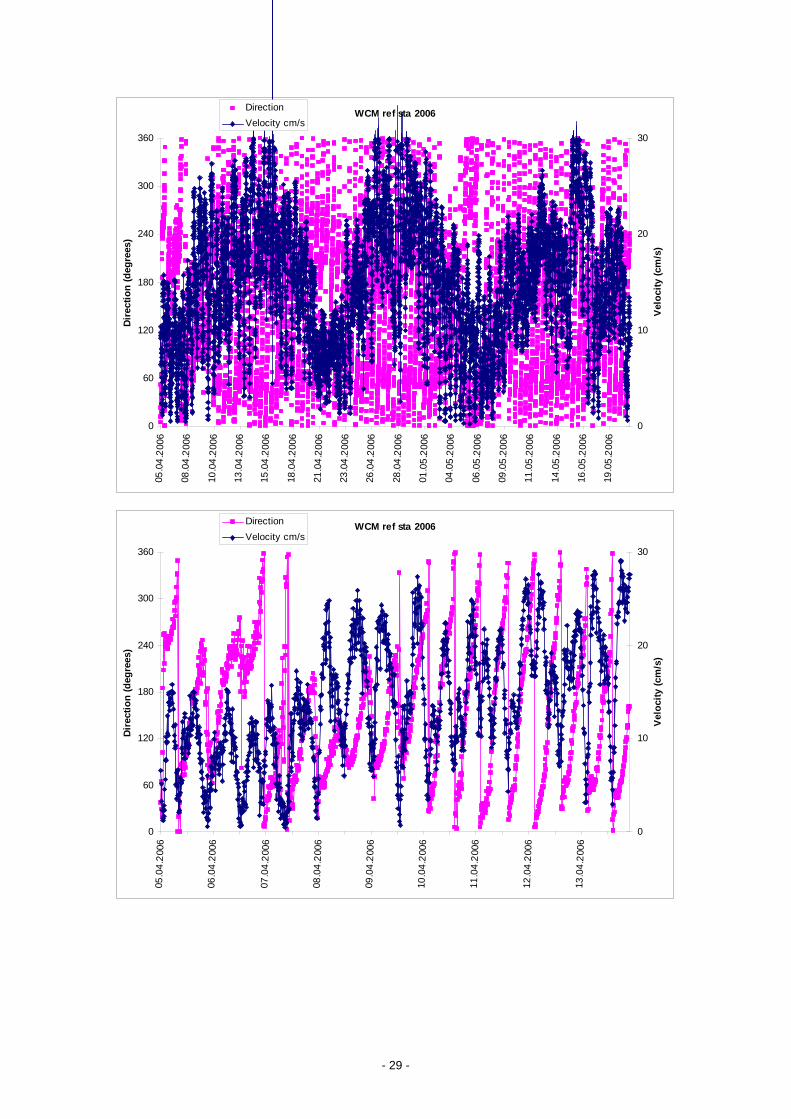
- 29 -
WCM ref sta 2006
0
60
120
180
240
300
360
05.0
4.20
06
08.0
4.20
06
10.0
4 .20
06
13.0
4 .20
06
15.0
4 .20
06
18.0
4.20
06
21.0
4.20
06
23.0
4.20
06
26.0
4 .20
06
28.0
4 .20
06
0 1.0
5 .20
06
04.0
5 .20
06
06.0
5 .20
06
09.0
5 .20
06
11.0
5 .20
06
14.0
5.20
06
16.0
5.20
06
19.0
5.20
06
Dire
ctio
n (d
egre
es)
0
10
20
30
Velo
city
(cm
/s)
DirectionVelocity cm/s
WCM ref sta 2006
0
60
120
180
240
300
360
05.0
4.20
06
06.0
4.20
06
07.0
4 .20
06
08.0
4 .20
06
09.0
4.20
06
10.0
4.20
06
11.0
4.20
06
12.0
4 .20
06
13.0
4 .20
06
Dire
ctio
n (d
egre
es)
0
10
20
30
Velo
city
(cm
/s)
DirectionVelocity cm/s

- 30 -

Rolf C. Sundt
Water Column Monitoring 2006
Data report
Rev.no: 01 Date: 03.09.2006
Project number: 695219
Project title: Water Column Monitoring 2006
Project Leader: Rolf C. Sundt
Client(s): ConocoPhillip on behalf of OLF WCM coordination group
Research program:
Distribution restriction: Confidential (Open from: )
IRIS-AkvamiljøIRIS-Akvamiljø
Appendix C
1
Contents
1 RAW DATA – PAH METABOLITES BY FIXED FLUORECENCE............................... 2
2 RAW DATA – PAH METABOLITES BY GCMS............................................................. 6
3 RAW DATA – AP METABOLITES BY GCMS.............................................................. 10
4 RAW DATA - LYSOSOMAL STABILITY IN MUSSEL ............................................... 13
5 RAW DATA – HISTOLOGY............................................................................................ 14
5.1 Neutral lipid accumulation........................................................................................ 14 5.2 Lipofuscin lysosomal accumulation ......................................................................... 15

2
1 Raw data – PAH metabolites by Fixed Fluorecence
Table 1. Raw data PAH metabolites by Fixed Fluorecence, 0-sampling.
Rådata, 04.03.06 0-sampling FF + biliverdin in bile
Dilution: Biliverdin: 100 X FF: 1600X
Calculation: B*0.057*100 D*0.6082*1600/
1000 F*0.6082*1600/
1000 H*0.6082*1600/
1000 Biliverdin Biliverdin PFE290/334 PFE341/383 PFE380/430
Fish no UV-abs (660) mg/ml 290/335 µg/ml 341/383 µg/ml 380/430 µg/ml Scan
Solvent: 0,000 0,000 0,3 0,3 1,4 1,4 0,6 0,6 x Cod 01 0,044 0,251 8,8 8,6 3,4 3,3 1,5 1,5 Cod 03 0,119 0,678 10,0 9,7 4,2 4,1 1,4 1,4 Cod 04 0,191 1,089 10,6 10,3 3,7 3,6 1,4 1,4 Cod 05 0,085 0,485 7,6 7,4 4,0 3,9 1,2 1,2 Cod 06 0,108 0,616 7,0 6,8 3,8 3,7 1,3 1,3 Cod 07 0,046 0,262 15,6 15,2 3,6 3,5 1,4 1,4 Cod 08 0,088 0,502 9,2 9,0 3,8 3,7 1,5 1,5 Cod 09 0,071 0,405 9,5 9,2 3,4 3,3 1,4 1,4 Cod 10 0,088 0,502 12,9 12,6 3,5 3,4 1,4 1,4 x Cod 11 0,073 0,416 6,0 5,8 3,1 3,0 1,2 1,2 Cod 12 0,049 0,279 8,3 8,1 2,9 2,8 1,2 1,2 Cod 13 0,047 0,268 6,8 6,6 3,3 3,2 1,1 1,1 Cod 14 0,057 0,325 8,4 8,2 3,2 3,1 1,3 1,3 Cod 15 0,062 0,353 12,2 11,9 3,3 3,2 1,3 1,3 Cod 16 0,085 0,485 8,2 8,0 3,4 3,3 1,3 1,3 Cod 17 0,117 0,667 13,5 13,1 3,7 3,6 1,5 1,5 x Cod 18 0,126 0,718 12,0 11,7 4,8 4,7 1,5 1,5 Cod 19 0,154 0,878 6,4 6,2 3,2 3,1 1,3 1,3 Cod 20 0,080 0,456 11,1 10,8 2,9 2,8 1,3 1,3 Cod 21 0,021 0,120 4,2 4,1 2,3 2,2 1,0 1,0 Cod 22 0,040 0,228 15,8 15,4 4,5 4,4 1,6 1,6 Cod 23 0,013 0,074 5,7 5,5 1,7 1,7 0,7 0,7 Cod 25 0,058 0,331 4,6 4,5 2,6 2,5 0,9 0,9 x Cod 26 0,151 0,861 8,5 8,3 3,4 3,3 1,3 1,3 Cod 27 0,095 0,542 12,2 11,9 3,5 3,4 1,4 1,4 Cod 28 0,125 0,713 9,3 9,1 3,9 3,8 1,7 1,7 Cod 29 0,032 0,182 9,8 9,5 2,0 1,9 1,0 1,0 x Cod 30 0,066 0,376 6,0 5,8 3,5 3,4 1,4 1,4
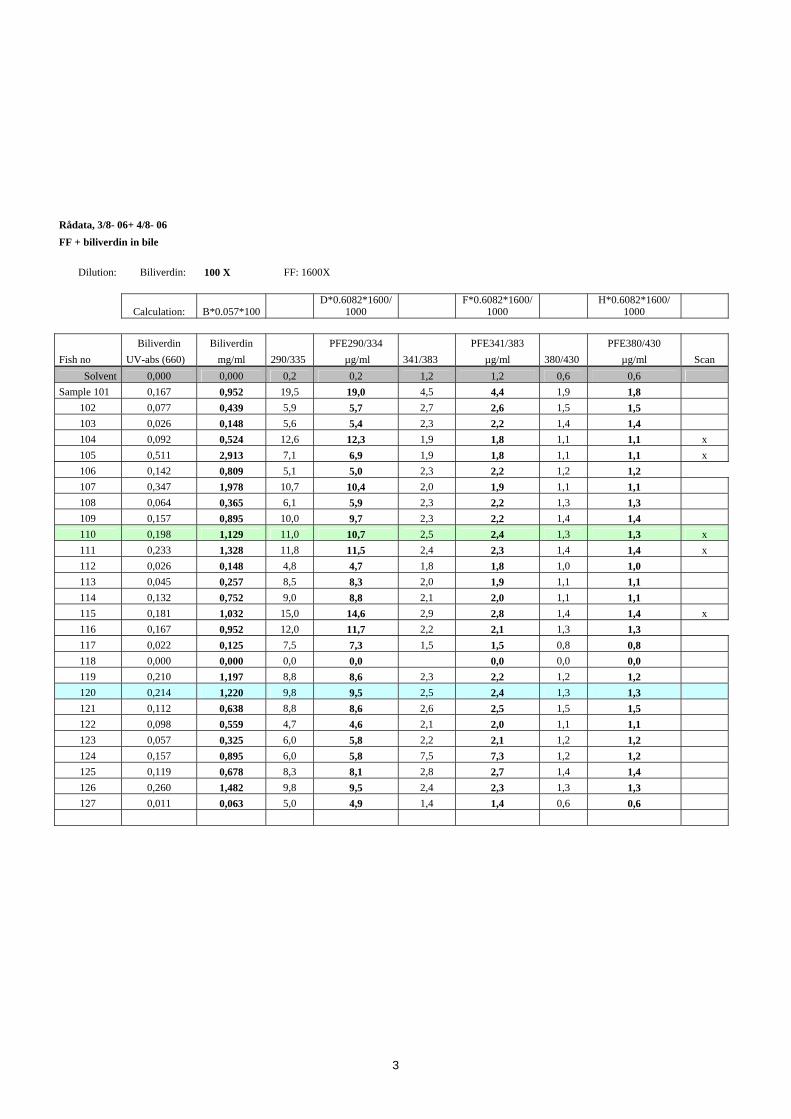
3
Rådata, 3/8- 06+ 4/8- 06
FF + biliverdin in bile
Dilution: Biliverdin: 100 X FF: 1600X
Calculation: B*0.057*100 D*0.6082*1600/
1000 F*0.6082*1600/
1000 H*0.6082*1600/
1000 Biliverdin Biliverdin PFE290/334 PFE341/383 PFE380/430 Fish no UV-abs (660) mg/ml 290/335 µg/ml 341/383 µg/ml 380/430 µg/ml Scan
Solvent 0,000 0,000 0,2 0,2 1,2 1,2 0,6 0,6 Sample 101 0,167 0,952 19,5 19,0 4,5 4,4 1,9 1,8
102 0,077 0,439 5,9 5,7 2,7 2,6 1,5 1,5 103 0,026 0,148 5,6 5,4 2,3 2,2 1,4 1,4 104 0,092 0,524 12,6 12,3 1,9 1,8 1,1 1,1 x 10⁵ 0,511 2,913 7,1 6,9 1,9 1,8 1,1 1,1 x 10⁶ 0,142 0,809 5,1 5,0 2,3 2,2 1,2 1,2 107 0,347 1,978 10,7 10,4 2,0 1,9 1,1 1,1 108 0,064 0,365 6,1 5,9 2,3 2,2 1,3 1,3 109 0,157 0,895 10,0 9,7 2,3 2,2 1,4 1,4 110 0,198 1,129 11,0 10,7 2,5 2,4 1,3 1,3 x 111 0,233 1,328 11,8 11,5 2,4 2,3 1,4 1,4 x 112 0,026 0,148 4,8 4,7 1,8 1,8 1,0 1,0 113 0,045 0,257 8,5 8,3 2,0 1,9 1,1 1,1 114 0,132 0,752 9,0 8,8 2,1 2,0 1,1 1,1 115 0,181 1,032 15,0 14,6 2,9 2,8 1,4 1,4 x 116 0,167 0,952 12,0 11,7 2,2 2,1 1,3 1,3 117 0,022 0,125 7,5 7,3 1,5 1,5 0,8 0,8 118 0,000 0,000 0,0 0,0 0,0 0,0 0,0 119 0,210 1,197 8,8 8,6 2,3 2,2 1,2 1,2 120 0,214 1,220 9,8 9,5 2,5 2,4 1,3 1,3 121 0,112 0,638 8,8 8,6 2,6 2,5 1,5 1,5 122 0,098 0,559 4,7 4,6 2,1 2,0 1,1 1,1 123 0,057 0,325 6,0 5,8 2,2 2,1 1,2 1,2 124 0,157 0,895 6,0 5,8 7,5 7,3 1,2 1,2 125 0,119 0,678 8,3 8,1 2,8 2,7 1,4 1,4 126 0,260 1,482 9,8 9,5 2,4 2,3 1,3 1,3 127 0,011 0,063 5,0 4,9 1,4 1,4 0,6 0,6
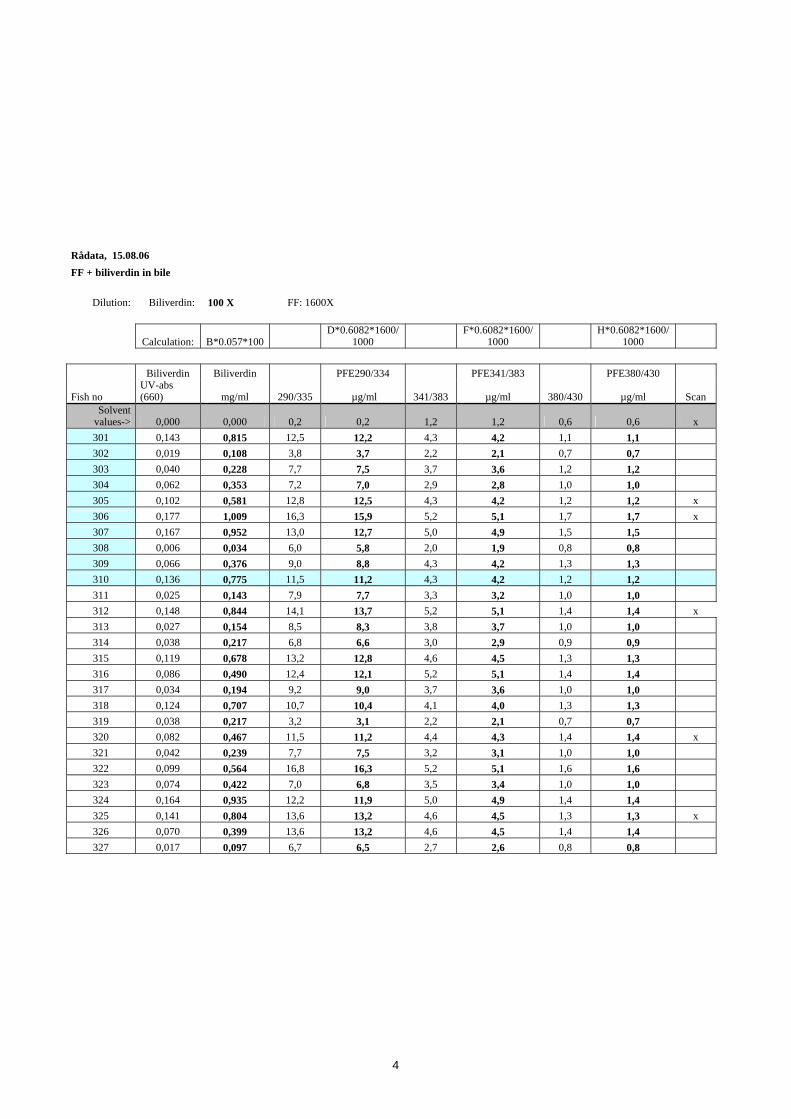
4
Rådata, 15.08.06 FF + biliverdin in bile
Dilution: Biliverdin: 100 X FF: 1600X
Calculation: B*0.057*100 D*0.6082*1600/
1000 F*0.6082*1600/
1000 H*0.6082*1600/
1000 Biliverdin Biliverdin PFE290/334 PFE341/383 PFE380/430
Fish no UV-abs (660) mg/ml 290/335 µg/ml 341/383 µg/ml 380/430 µg/ml Scan
Solvent values-> 0,000 0,000 0,2 0,2 1,2 1,2 0,6 0,6 x 301 0,143 0,815 12,5 12,2 4,3 4,2 1,1 1,1 302 0,019 0,108 3,8 3,7 2,2 2,1 0,7 0,7 303 0,040 0,228 7,7 7,5 3,7 3,6 1,2 1,2 304 0,062 0,353 7,2 7,0 2,9 2,8 1,0 1,0 305 0,102 0,581 12,8 12,5 4,3 4,2 1,2 1,2 x 306 0,177 1,009 16,3 15,9 5,2 5,1 1,7 1,7 x 307 0,167 0,952 13,0 12,7 5,0 4,9 1,5 1,5 308 0,006 0,034 6,0 5,8 2,0 1,9 0,8 0,8 309 0,066 0,376 9,0 8,8 4,3 4,2 1,3 1,3 310 0,136 0,775 11,5 11,2 4,3 4,2 1,2 1,2 311 0,025 0,143 7,9 7,7 3,3 3,2 1,0 1,0 312 0,148 0,844 14,1 13,7 5,2 5,1 1,4 1,4 x 313 0,027 0,154 8,5 8,3 3,8 3,7 1,0 1,0 314 0,038 0,217 6,8 6,6 3,0 2,9 0,9 0,9 315 0,119 0,678 13,2 12,8 4,6 4,5 1,3 1,3 316 0,086 0,490 12,4 12,1 5,2 5,1 1,4 1,4 317 0,034 0,194 9,2 9,0 3,7 3,6 1,0 1,0 318 0,124 0,707 10,7 10,4 4,1 4,0 1,3 1,3 319 0,038 0,217 3,2 3,1 2,2 2,1 0,7 0,7 320 0,082 0,467 11,5 11,2 4,4 4,3 1,4 1,4 x 321 0,042 0,239 7,7 7,5 3,2 3,1 1,0 1,0 322 0,099 0,564 16,8 16,3 5,2 5,1 1,6 1,6 323 0,074 0,422 7,0 6,8 3,5 3,4 1,0 1,0 324 0,164 0,935 12,2 11,9 5,0 4,9 1,4 1,4 325 0,141 0,804 13,6 13,2 4,6 4,5 1,3 1,3 x 326 0,070 0,399 13,6 13,2 4,6 4,5 1,4 1,4 327 0,017 0,097 6,7 6,5 2,7 2,6 0,8 0,8
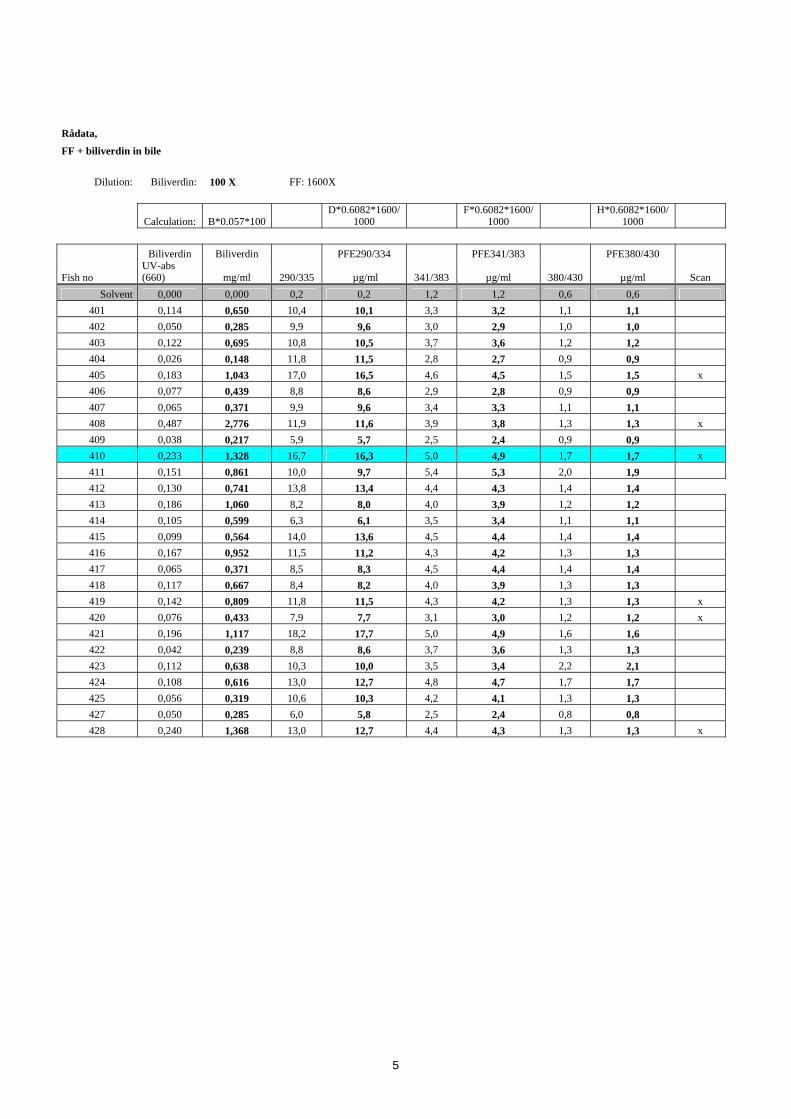
5
Rådata,
FF + biliverdin in bile
Dilution: Biliverdin: 100 X FF: 1600X
Calculation: B*0.057*100 D*0.6082*1600/
1000 F*0.6082*1600/
1000 H*0.6082*1600/
1000 Biliverdin Biliverdin PFE290/334 PFE341/383 PFE380/430
Fish no UV-abs (660) mg/ml 290/335 µg/ml 341/383 µg/ml 380/430 µg/ml Scan
Solvent 0,000 0,000 0,2 0,2 1,2 1,2 0,6 0,6 401 0,114 0,650 10,4 10,1 3,3 3,2 1,1 1,1 402 0,050 0,285 9,9 9,6 3,0 2,9 1,0 1,0 403 0,122 0,695 10,8 10,5 3,7 3,6 1,2 1,2 404 0,026 0,148 11,8 11,5 2,8 2,7 0,9 0,9 405 0,183 1,043 17,0 16,5 4,6 4,5 1,5 1,5 x 406 0,077 0,439 8,8 8,6 2,9 2,8 0,9 0,9 407 0,065 0,371 9,9 9,6 3,4 3,3 1,1 1,1 408 0,487 2,776 11,9 11,6 3,9 3,8 1,3 1,3 x 409 0,038 0,217 5,9 5,7 2,5 2,4 0,9 0,9 410 0,233 1,328 16,7 16,3 5,0 4,9 1,7 1,7 x 411 0,151 0,861 10,0 9,7 5,4 5,3 2,0 1,9 412 0,130 0,741 13,8 13,4 4,4 4,3 1,4 1,4 413 0,186 1,060 8,2 8,0 4,0 3,9 1,2 1,2 414 0,105 0,599 6,3 6,1 3,5 3,4 1,1 1,1 415 0,099 0,564 14,0 13,6 4,5 4,4 1,4 1,4 416 0,167 0,952 11,5 11,2 4,3 4,2 1,3 1,3 417 0,065 0,371 8,5 8,3 4,5 4,4 1,4 1,4 418 0,117 0,667 8,4 8,2 4,0 3,9 1,3 1,3 419 0,142 0,809 11,8 11,5 4,3 4,2 1,3 1,3 x 420 0,076 0,433 7,9 7,7 3,1 3,0 1,2 1,2 x 421 0,196 1,117 18,2 17,7 5,0 4,9 1,6 1,6 422 0,042 0,239 8,8 8,6 3,7 3,6 1,3 1,3 423 0,112 0,638 10,3 10,0 3,5 3,4 2,2 2,1 424 0,108 0,616 13,0 12,7 4,8 4,7 1,7 1,7 425 0,056 0,319 10,6 10,3 4,2 4,1 1,3 1,3 427 0,050 0,285 6,0 5,8 2,5 2,4 0,8 0,8 428 0,240 1,368 13,0 12,7 4,4 4,3 1,3 1,3 x

6
2 Raw data – PAH metabolites by GCMS
0-sampling
File name des 11-08 des 11-09 des 11-10 des 11-11 des 11-12 des 11-13 des 11-14 des 11-15 Sample code 051206-03 051206-04 051206-05 051206-06 051206-07 051206-08 051206-09 051206-10 Sample name Cod 1 Cod 3 Cod 4 Cod 5 Cod 6 Cod 7 Cod 8 Cod 9 Sampling date kalib oppdatert Compound ng/g ng/g ng/g ng/g ng/g ng/g ng/g ng/g 1-OH-Naphthalene 64 56 51 67 44 59 59 622-OH-Naphthalene 23 10 9 8 14 10 10 12C1-OH-Naphthalene 83 71 89 67 95 54 98 101C2-OH-Naphthalene 77 65 98 95 18 46 57 43C3-OH-Naphthalene 348 384 377 297 393 248 317 2231-OH-Phenanthrene 5 6 9 5 3 3 7 5C1-OH-Phenanthrene 161 201 249 133 197 136 179 196C2-OH-Phenanthrene 102 96 135 77 233 67 119 1061-OH-Pyrene 54 60 97 50 65 54 75 77
File name des 11-16 des 11-17 des 11-18 des 11-19 des 11-20 des 11-21 des 11-22
Sample code 051206-11 051206-12 051206-13 051206-14 051206-15 051206-16 051206-17
Sample name Cod 10 Cod 11 Cod 12 Cod 13 Cod 14 Cod 15 Cod 16
Sampling date
Compound ng/g ng/g ng/g ng/g ng/g ng/g ng/g
1-OH-Naphthalene 86 48 58 54 63 65 75
2-OH-Naphthalene 61 20 20 15 20 12 14
C1-OH-Naphthalene 75 160 107 90 59 84 72
C2-OH-Naphthalene 68 158 129 66 82 85 79
C3-OH-Naphthalene 326 401 637 364 351 313 250
1-OH-Phenanthrene 7 3 2 4 2 5 6
C1-OH-Phenanthrene 225 125 129 116 166 160 185
C2-OH-Phenanthrene 103 92 134 78 95 88 112
1-OH-Pyrene 78 42 38 48 60 49 58

7
Station 100
File name sept 07-06 sept 07-
07 sept 07-08 sept 07-09 sept 07-10 sept 08-05 sept 08-06 sept 08-07
Sample code 240806-3 240806-
4 240806-5 240806-6 240806-7 290806-3 290806-4 290806-5 Sample name 111 114 115 116 117 119 120 121 Sampling date Compound ng/g ng/g ng/g ng/g ng/g ng/g ng/g ng/g 1-OH-Naphthalene 31 37 39 46 48 36 31 372-OH-Naphthalene 26 36 37 37 52 18 26 26C1-OH-Naphthalene 121 193 171 244 288 135 127 114C2-OH-Naphthalene 121 177 176 256 351 49 103 94C3-OH-Naphthalene 326 876 574 744 1398 300 252 5451-OH-Phenanthrene 11 10 17 10 3 8 10 3C1-OH-Phenanthrene 87 114 180 137 70 206 281 231C2-OH-Phenanthrene 89 138 138 151 130 105 99 331-OH-Pyrene 20 9 13 11 2 16 20 18
File name sept 08-08 sept 10-06 sept 10-07 sept 10-08 sept 10-09 Sample code 290806-6 010906-03 010906-04 010906-05 010906-06 Sample name 122 123 124 125 126 Sampling date Compound ng/g ng/g ng/g ng/g ng/g
1-OH-Naphthalene 32 36 33 34 39 2-OH-Naphthalene 18 10 13 14 29 C1-OH-Naphthalene 121 137 86 107 120 C2-OH-Naphthalene 106 120 58 65 80 C3-OH-Naphthalene 513 322 283 371 370
1-OH-Phenanthrene 8 6,3 3,5 4,6 9,1 C1-OH-Phenanthrene 203 121 111 217 192 C2-OH-Phenanthrene 100 155 57 120 147 1-OH-Pyrene 14 14 13 23 31
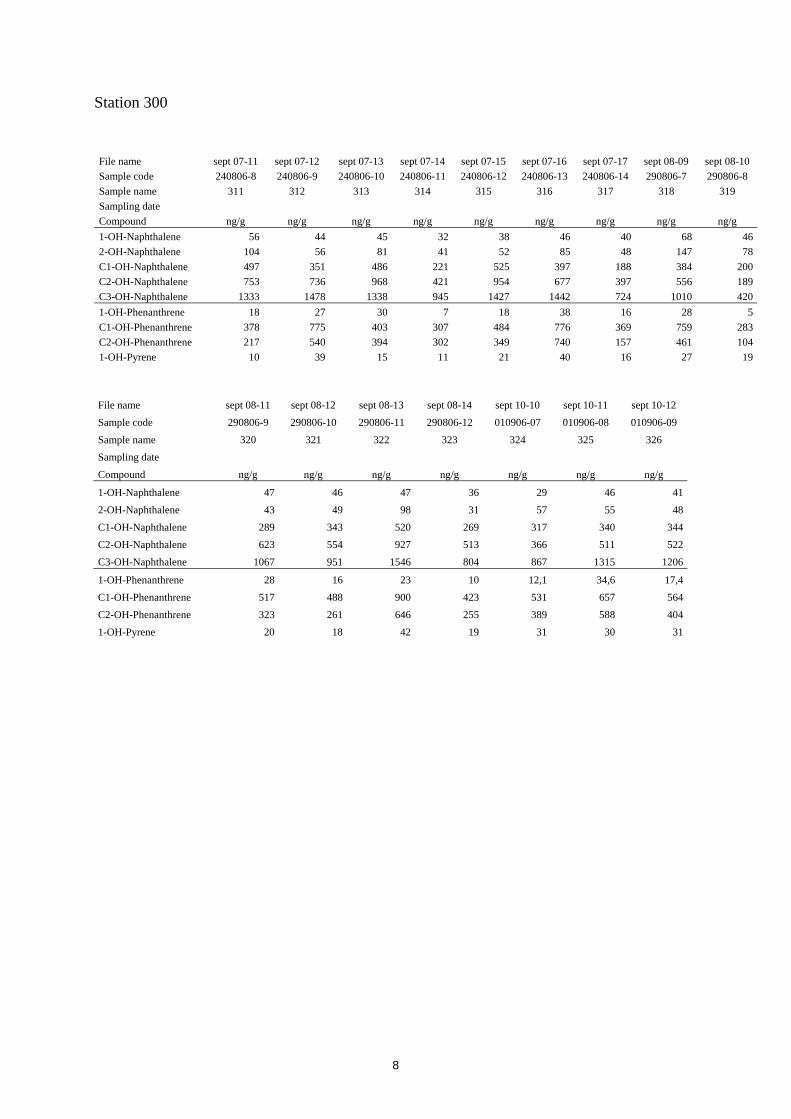
8
Station 300
File name sept 07-11 sept 07-12 sept 07-13 sept 07-14 sept 07-15 sept 07-16 sept 07-17 sept 08-09 sept 08-10 Sample code 240806-8 240806-9 240806-10 240806-11 240806-12 240806-13 240806-14 290806-7 290806-8 Sample name 311 312 313 314 315 316 317 318 319 Sampling date Compound ng/g ng/g ng/g ng/g ng/g ng/g ng/g ng/g ng/g 1-OH-Naphthalene 56 44 45 32 38 46 40 68 462-OH-Naphthalene 104 56 81 41 52 85 48 147 78C1-OH-Naphthalene 497 351 486 221 525 397 188 384 200C2-OH-Naphthalene 753 736 968 421 954 677 397 556 189C3-OH-Naphthalene 1333 1478 1338 945 1427 1442 724 1010 4201-OH-Phenanthrene 18 27 30 7 18 38 16 28 5C1-OH-Phenanthrene 378 775 403 307 484 776 369 759 283C2-OH-Phenanthrene 217 540 394 302 349 740 157 461 1041-OH-Pyrene 10 39 15 11 21 40 16 27 19
File name sept 08-11 sept 08-12 sept 08-13 sept 08-14 sept 10-10 sept 10-11 sept 10-12 Sample code 290806-9 290806-10 290806-11 290806-12 010906-07 010906-08 010906-09 Sample name 320 321 322 323 324 325 326 Sampling date Compound ng/g ng/g ng/g ng/g ng/g ng/g ng/g
1-OH-Naphthalene 47 46 47 36 29 46 412-OH-Naphthalene 43 49 98 31 57 55 48C1-OH-Naphthalene 289 343 520 269 317 340 344C2-OH-Naphthalene 623 554 927 513 366 511 522C3-OH-Naphthalene 1067 951 1546 804 867 1315 1206
1-OH-Phenanthrene 28 16 23 10 12,1 34,6 17,4C1-OH-Phenanthrene 517 488 900 423 531 657 564C2-OH-Phenanthrene 323 261 646 255 389 588 4041-OH-Pyrene 20 18 42 19 31 30 31
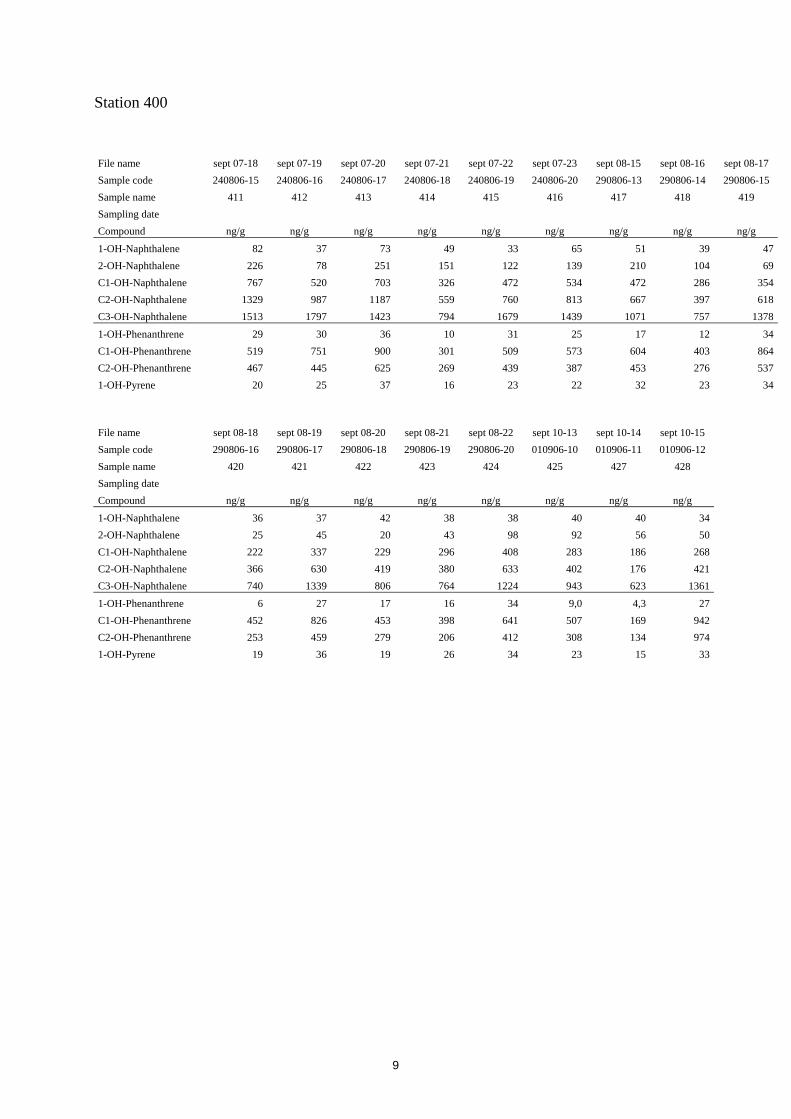
9
Station 400
File name sept 07-18 sept 07-19 sept 07-20 sept 07-21 sept 07-22 sept 07-23 sept 08-15 sept 08-16 sept 08-17 Sample code 240806-15 240806-16 240806-17 240806-18 240806-19 240806-20 290806-13 290806-14 290806-15 Sample name 411 412 413 414 415 416 417 418 419 Sampling date Compound ng/g ng/g ng/g ng/g ng/g ng/g ng/g ng/g ng/g
1-OH-Naphthalene 82 37 73 49 33 65 51 39 472-OH-Naphthalene 226 78 251 151 122 139 210 104 69C1-OH-Naphthalene 767 520 703 326 472 534 472 286 354C2-OH-Naphthalene 1329 987 1187 559 760 813 667 397 618C3-OH-Naphthalene 1513 1797 1423 794 1679 1439 1071 757 1378
1-OH-Phenanthrene 29 30 36 10 31 25 17 12 34C1-OH-Phenanthrene 519 751 900 301 509 573 604 403 864C2-OH-Phenanthrene 467 445 625 269 439 387 453 276 5371-OH-Pyrene 20 25 37 16 23 22 32 23 34
File name sept 08-18 sept 08-19 sept 08-20 sept 08-21 sept 08-22 sept 10-13 sept 10-14 sept 10-15 Sample code 290806-16 290806-17 290806-18 290806-19 290806-20 010906-10 010906-11 010906-12 Sample name 420 421 422 423 424 425 427 428 Sampling date Compound ng/g ng/g ng/g ng/g ng/g ng/g ng/g ng/g
1-OH-Naphthalene 36 37 42 38 38 40 40 342-OH-Naphthalene 25 45 20 43 98 92 56 50C1-OH-Naphthalene 222 337 229 296 408 283 186 268C2-OH-Naphthalene 366 630 419 380 633 402 176 421C3-OH-Naphthalene 740 1339 806 764 1224 943 623 1361
1-OH-Phenanthrene 6 27 17 16 34 9,0 4,3 27C1-OH-Phenanthrene 452 826 453 398 641 507 169 942C2-OH-Phenanthrene 253 459 279 206 412 308 134 9741-OH-Pyrene 19 36 19 26 34 23 15 33

10
3 Raw data – AP metabolites by GCMS
File name sept 18-06 sept 18-07 sept 18-08 sept 18-09 sept 18-10 sept 19-03 sept 19-04 sept 19-05 Sample code 080906-S3 080906-S4 080906-S5 080906-S6 080906-S7 120906-S3 120906-S4 120906-S5 Sample name 111 114 115 116 117 119 120 121 Sampling date Compound ng/g ng/g ng/g ng/g ng/g ng/g ng/g ng/g 2-methylphenol 0 0 31 0 0 0 0 03-methylphenol 21 0 28 0 19 0 0 04-methylphenol 390 0 309 50 0 818 0 3863,5-dimethylphenol 31 33 31 23 58 26 25 282,4-dimethylphenol 18 0 19 0 15 0 0 84-ethylphenol 0 0 0 0 0 0 0 03-ethyl-5-methylphenol 0 62 82 52 44 35 47 264-n-propylphenol 0 0 0 0 0 0 0 02,4,6-trimethylphenol 0 0 0 0 0 0 0 04-tert-butylphenol 0 0 0 0 0 0 0 04-isopropyl-3-methylphenol 0 0 0 0 0 0 0 02-tert-butyl-4-methylphenol 0 0 0 0 0 0 0 04-tert-butyl-2-methylphenol 0 0 0 0 0 0 0 02,5-diisopropylphenol 0 0 0 0 0 0 0 04-n-butylphenol 0 0 0 0 0 0 0 04-n-pentylphenol 0 0 0 0 0 0 0 04-n-hexylphenol 0 0 0 0 0 0 0 04-tert-octylphenol 555 496 422 487 479 26 91 1154,6-di-tert-butyl-2-methylphenol 25 28 26 26 29 29 28 374-n-heptylphenol 0 0 0 0 0 0 0 04-n-octylphenol 0 0 0 0 0 0 0 04-n-nonylphenol 0 26 25 0 31 0 0 0
File name sept 19-06 sept 21-06 sept 21-07 sept 21-08 sept 21-09 Sample code 120906-S6 140906-S03 140906-S04 140906-S05 140906-S06 Sample name 122 123 124 125 126 Sampling date Compound ng/g ng/g ng/g ng/g ng/g 2-methylphenol 0 0 24 0 25 3-methylphenol 0 0 24 0 26 4-methylphenol 0 74 78 49 66 3,5-dimethylphenol 28 25 26 21 28 2,4-dimethylphenol 7 0 0 0 0 4-ethylphenol 0 0 0 0 0 3-ethyl-5-methylphenol 40 37 55 38 55 4-n-propylphenol 0 0 0 0 0 2,4,6-trimethylphenol 0 0 0 0 0 4-tert-butylphenol 0 0 0 0 0 4-isopropyl-3-methylphenol 0 0 0 0 0 2-tert-butyl-4-methylphenol 0 0 0 0 0 4-tert-butyl-2-methylphenol 0 0 0 0 0 2,5-diisopropylphenol 0 0 0 0 0 4-n-butylphenol 0 0 0 0 0 4-n-pentylphenol 0 0 0 0 0 4-n-hexylphenol 0 0 0 0 0 4-tert-octylphenol 130 332 416 323 370 4,6-di-tert-butyl-2-methylphenol 30 27 28 33 33 4-n-heptylphenol 0 0 0 0 0 4-n-octylphenol 0 0 0 0 0 4-n-nonylphenol 0 30 0 0 0

11
File name sept 18-11 sept 18-12 sept 18-13 sept 18-14 sept 18-15 sept 19-07 sept 19-08 sept 19-09 Sample code 080906-S8 080906-S9 080906-S10 080906-S11 080906-S12 120906-S7 120906-S8 120906-S9 Sample name 311 312 313 314 315 316 317 318 Sampling date Compound ng/g ng/g ng/g ng/g ng/g ng/g ng/g ng/g 2-methylphenol 56 46 20 20 0 16 0 223-methylphenol 44 52 38 30 0 24 22 384-methylphenol 91 488 355 0 0 260 292 453,5-dimethylphenol 54 72 73 51 44 51 40 592,4-dimethylphenol 97 121 65 55 60 96 27 664-ethylphenol 0 0 0 0 0 0 0 03-ethyl-5-methylphenol 41 57 65 44 0 42 49 384-n-propylphenol 0 0 0 0 0 0 0 02,4,6-trimethylphenol 52 70 50 28 34 0 0 04-tert-butylphenol 0 0 0 0 41 0 0 04-isopropyl-3-methylphenol 0 0 0 0 0 0 0 02-tert-butyl-4-methylphenol 0 0 0 0 49 0 0 04-tert-butyl-2-methylphenol 0 0 0 0 0 0 0 02,5-diisopropylphenol 0 0 0 0 0 0 0 04-n-butylphenol 0 0 0 0 0 0 0 04-n-pentylphenol 0 0 0 0 0 0 0 04-n-hexylphenol 0 0 0 0 0 0 0 214-tert-octylphenol 472 539 472 546 360 135 188 2204,6-di-tert-butyl-2-methylphenol 33 30 32 36 0 28 30 314-n-heptylphenol 0 30 0 0 0 0 0 04-n-octylphenol 0 0 0 0 0 0 0 04-n-nonylphenol 63 56 32 32 47 0 0 0
File name sept 19-10 sept 19-11 sept 19-12 sept 21-10 sept 21-11 sept 21-12 sept 21-13 sept 21-14 Sample code 120906-S10 120906-S11 120906-S12 140906-S07 140906-S08 140906-S09 140906-S10 140906-S11 Sample name 319 320 321 322 323 324 325 326 Sampling date Compound ng/g ng/g ng/g ng/g ng/g ng/g ng/g ng/g 2-methylphenol 0 10 20 27 0 20 20 263-methylphenol 22 18 28 48 20 32 28 404-methylphenol 40 696 2000 56 61 81 60 603,5-dimethylphenol 31 37 52 82 43 64 57 862,4-dimethylphenol 26 37 73 101 30 60 80 754-ethylphenol 0 0 0 0 0 0 0 03-ethyl-5-methylphenol 42 42 48 60 36 28 38 314-n-propylphenol 0 0 0 0 0 0 0 02,4,6-trimethylphenol 0 0 59 145 0 53 58 914-tert-butylphenol 38 0 0 0 0 0 0 04-isopropyl-3-methylphenol 0 0 0 0 0 0 0 02-tert-butyl-4-methylphenol 0 0 0 0 0 0 0 04-tert-butyl-2-methylphenol 0 0 0 0 0 0 0 02,5-diisopropylphenol 0 0 0 0 0 0 0 04-n-butylphenol 0 0 0 0 0 0 0 04-n-pentylphenol 0 0 0 0 0 0 0 04-n-hexylphenol 0 0 0 0 0 0 0 04-tert-octylphenol 242 278 314 384 427 352 384 4444,6-di-tert-butyl-2-methylphenol 28 29 26 26 28 29 23 294-n-heptylphenol 0 0 0 21 0 0 25 04-n-octylphenol 0 0 0 0 0 0 0 04-n-nonylphenol 0 0 0 0 0 0 0 0
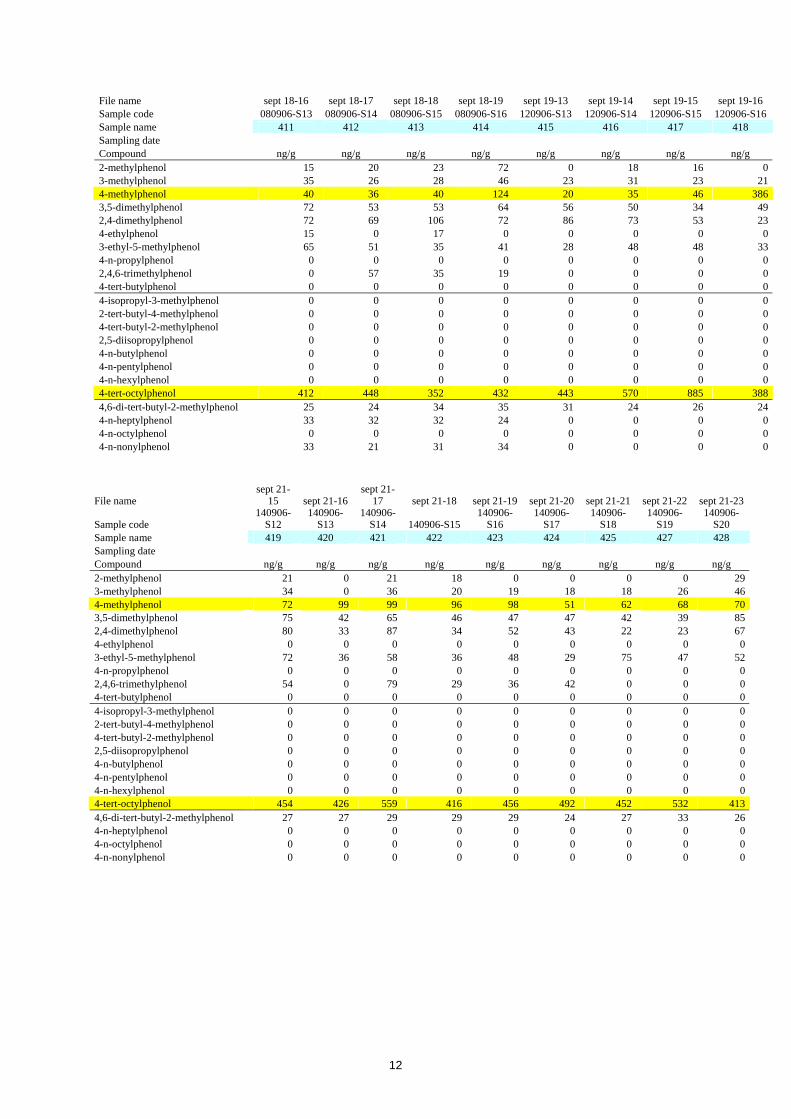
12
File name sept 18-16 sept 18-17 sept 18-18 sept 18-19 sept 19-13 sept 19-14 sept 19-15 sept 19-16 Sample code 080906-S13 080906-S14 080906-S15 080906-S16 120906-S13 120906-S14 120906-S15 120906-S16 Sample name 411 412 413 414 415 416 417 418 Sampling date Compound ng/g ng/g ng/g ng/g ng/g ng/g ng/g ng/g 2-methylphenol 15 20 23 72 0 18 16 03-methylphenol 35 26 28 46 23 31 23 214-methylphenol 40 36 40 124 20 35 46 3863,5-dimethylphenol 72 53 53 64 56 50 34 492,4-dimethylphenol 72 69 106 72 86 73 53 234-ethylphenol 15 0 17 0 0 0 0 03-ethyl-5-methylphenol 65 51 35 41 28 48 48 334-n-propylphenol 0 0 0 0 0 0 0 02,4,6-trimethylphenol 0 57 35 19 0 0 0 04-tert-butylphenol 0 0 0 0 0 0 0 04-isopropyl-3-methylphenol 0 0 0 0 0 0 0 02-tert-butyl-4-methylphenol 0 0 0 0 0 0 0 04-tert-butyl-2-methylphenol 0 0 0 0 0 0 0 02,5-diisopropylphenol 0 0 0 0 0 0 0 04-n-butylphenol 0 0 0 0 0 0 0 04-n-pentylphenol 0 0 0 0 0 0 0 04-n-hexylphenol 0 0 0 0 0 0 0 04-tert-octylphenol 412 448 352 432 443 570 885 3884,6-di-tert-butyl-2-methylphenol 25 24 34 35 31 24 26 244-n-heptylphenol 33 32 32 24 0 0 0 04-n-octylphenol 0 0 0 0 0 0 0 04-n-nonylphenol 33 21 31 34 0 0 0 0
File name sept 21-
15 sept 21-16 sept 21-
17 sept 21-18 sept 21-19 sept 21-20 sept 21-21 sept 21-22 sept 21-23
Sample code 140906-
S12 140906-
S13 140906-
S14 140906-S15 140906-
S16 140906-
S17 140906-
S18 140906-
S19 140906-
S20 Sample name 419 420 421 422 423 424 425 427 428 Sampling date Compound ng/g ng/g ng/g ng/g ng/g ng/g ng/g ng/g ng/g 2-methylphenol 21 0 21 18 0 0 0 0 293-methylphenol 34 0 36 20 19 18 18 26 464-methylphenol 72 99 99 96 98 51 62 68 703,5-dimethylphenol 75 42 65 46 47 47 42 39 852,4-dimethylphenol 80 33 87 34 52 43 22 23 674-ethylphenol 0 0 0 0 0 0 0 0 03-ethyl-5-methylphenol 72 36 58 36 48 29 75 47 524-n-propylphenol 0 0 0 0 0 0 0 0 02,4,6-trimethylphenol 54 0 79 29 36 42 0 0 04-tert-butylphenol 0 0 0 0 0 0 0 0 04-isopropyl-3-methylphenol 0 0 0 0 0 0 0 0 02-tert-butyl-4-methylphenol 0 0 0 0 0 0 0 0 04-tert-butyl-2-methylphenol 0 0 0 0 0 0 0 0 02,5-diisopropylphenol 0 0 0 0 0 0 0 0 04-n-butylphenol 0 0 0 0 0 0 0 0 04-n-pentylphenol 0 0 0 0 0 0 0 0 04-n-hexylphenol 0 0 0 0 0 0 0 0 04-tert-octylphenol 454 426 559 416 456 492 452 532 4134,6-di-tert-butyl-2-methylphenol 27 27 29 29 29 24 27 33 264-n-heptylphenol 0 0 0 0 0 0 0 0 04-n-octylphenol 0 0 0 0 0 0 0 0 04-n-nonylphenol 0 0 0 0 0 0 0 0 0
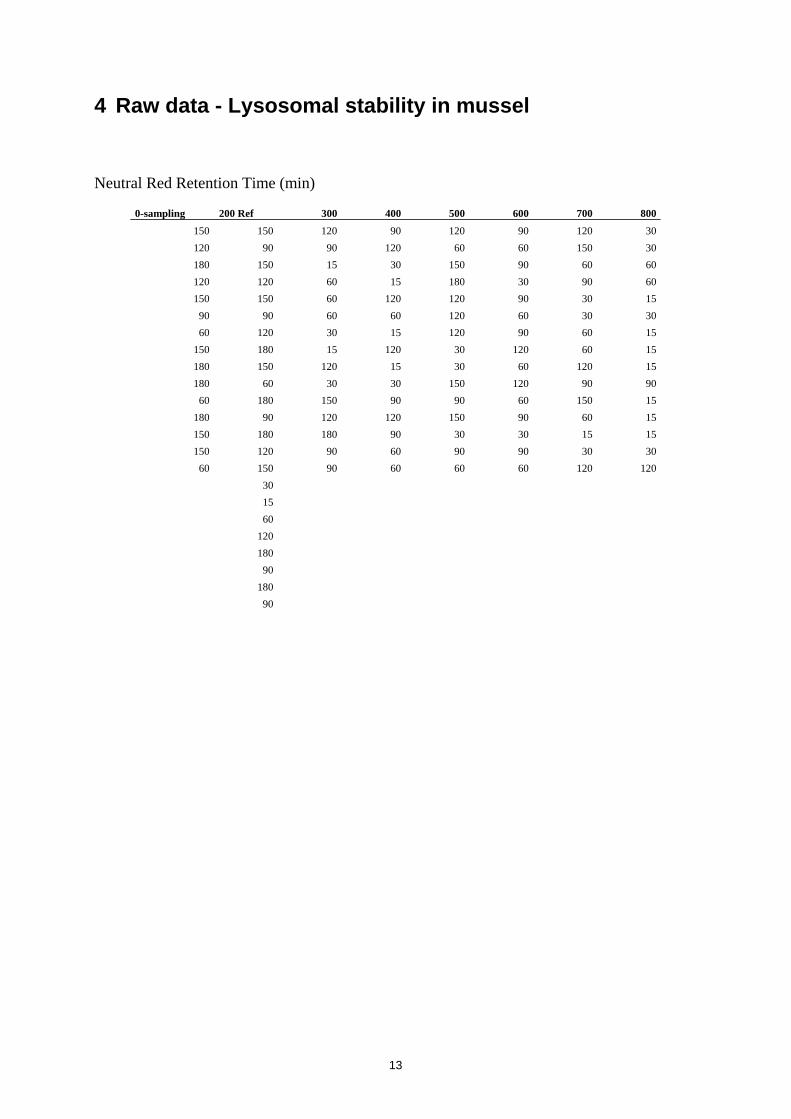
13
4 Raw data - Lysosomal stability in mussel
Neutral Red Retention Time (min)
0-sampling 200 Ref 300 400 500 600 700 800150 150 120 90 120 90 120 30120 90 90 120 60 60 150 30180 150 15 30 150 90 60 60120 120 60 15 180 30 90 60150 150 60 120 120 90 30 15
90 90 60 60 120 60 30 3060 120 30 15 120 90 60 15
150 180 15 120 30 120 60 15180 150 120 15 30 60 120 15180 60 30 30 150 120 90 90
60 180 150 90 90 60 150 15180 90 120 120 150 90 60 15150 180 180 90 30 30 15 15150 120 90 60 90 90 30 30
60 150 90 60 60 60 120 120 30 15 60 120 180 90 180 90
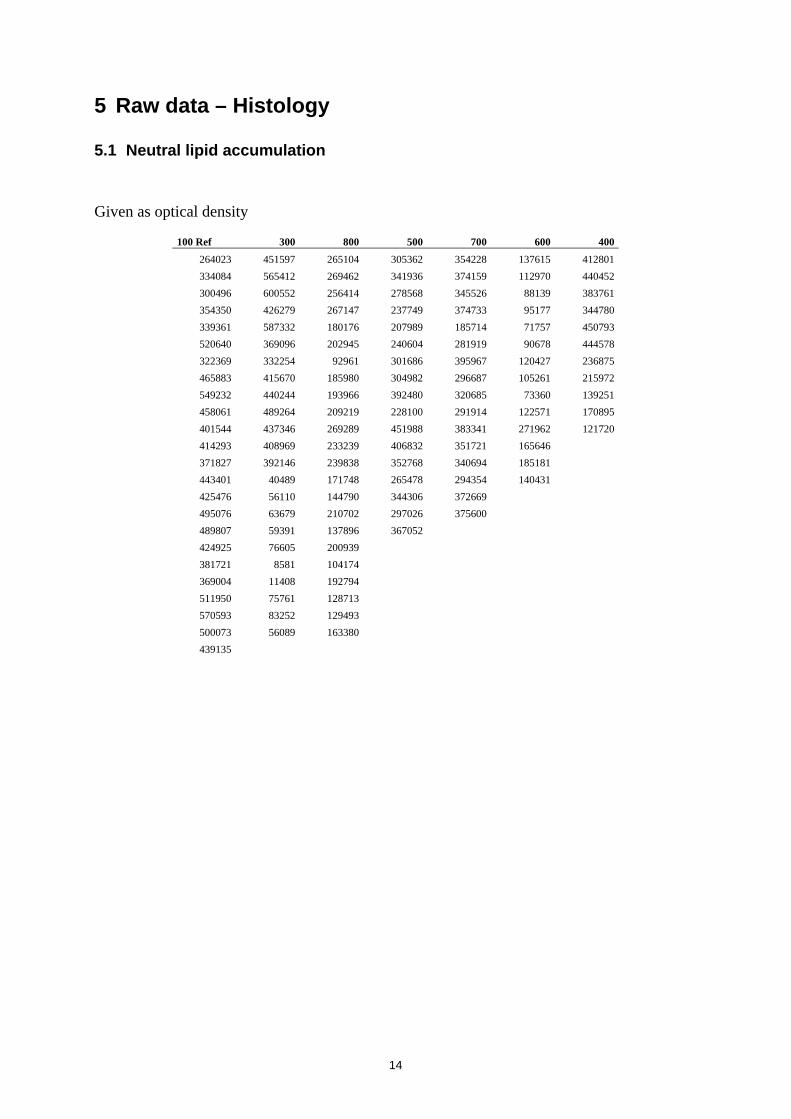
14
5 Raw data – Histology
5.1 Neutral lipid accumulation
Given as optical density
100 Ref 300 800 500 700 600 400 264023 451597 265104 305362 354228 137615 412801 334084 565412 269462 341936 374159 112970 440452 300496 600552 256414 278568 345526 88139 383761 354350 426279 267147 237749 374733 95177 344780 339361 587332 180176 207989 185714 71757 450793 520640 369096 202945 240604 281919 90678 444578 322369 332254 92961 301686 395967 120427 236875 465883 415670 185980 304982 296687 105261 215972 549232 440244 193966 392480 320685 73360 139251 458061 489264 209219 228100 291914 122571 170895 401544 437346 269289 451988 383341 271962 121720 414293 408969 233239 406832 351721 165646 371827 392146 239838 352768 340694 185181 443401 40489 171748 265478 294354 140431 425476 56110 144790 344306 372669 495076 63679 210702 297026 375600 489807 59391 137896 367052 424925 76605 200939 381721 8581 104174 369004 11408 192794 511950 75761 128713 570593 83252 129493 500073 56089 163380 439135
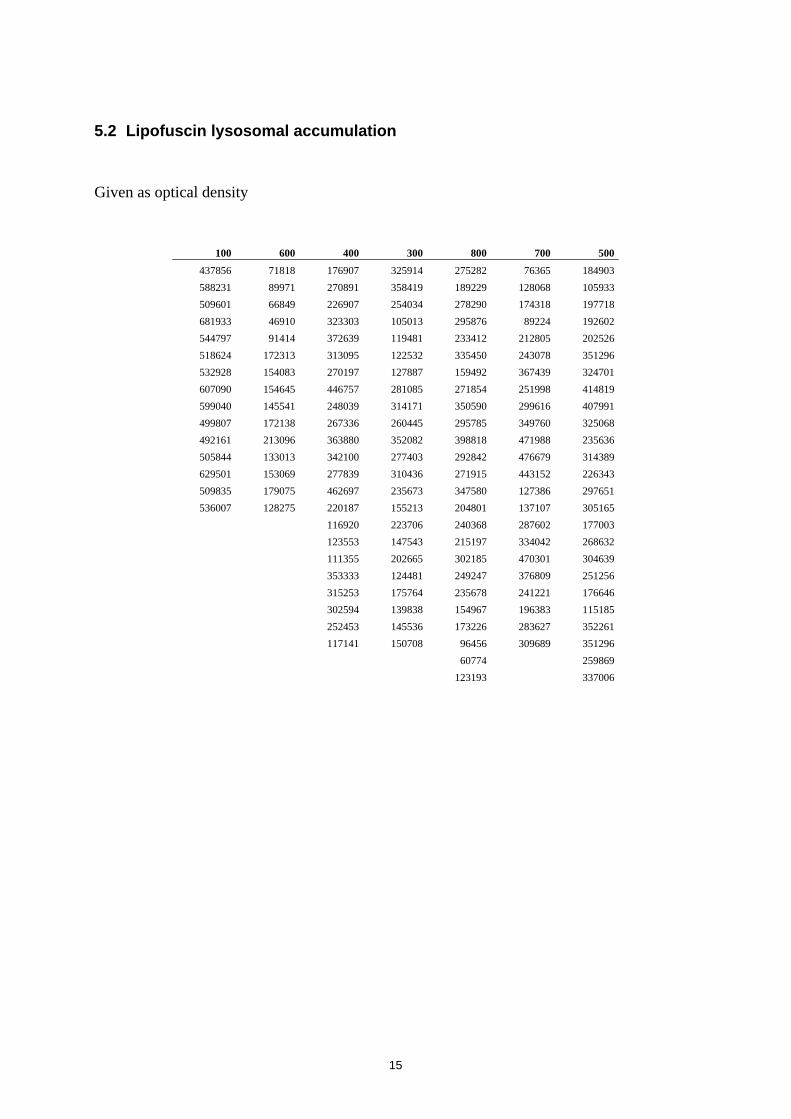
15
5.2 Lipofuscin lysosomal accumulation
Given as optical density
100 600 400 300 800 700 500 437856 71818 176907 325914 275282 76365 184903 588231 89971 270891 358419 189229 128068 105933 509601 66849 226907 254034 278290 174318 197718 681933 46910 323303 105013 295876 89224 192602 544797 91414 372639 119481 233412 212805 202526 518624 172313 313095 122532 335450 243078 351296 532928 154083 270197 127887 159492 367439 324701 607090 154645 446757 281085 271854 251998 414819 599040 145541 248039 314171 350590 299616 407991 499807 172138 267336 260445 295785 349760 325068 492161 213096 363880 352082 398818 471988 235636 505844 133013 342100 277403 292842 476679 314389 629501 153069 277839 310436 271915 443152 226343 509835 179075 462697 235673 347580 127386 297651 536007 128275 220187 155213 204801 137107 305165
116920 223706 240368 287602 177003 123553 147543 215197 334042 268632 111355 202665 302185 470301 304639 353333 124481 249247 376809 251256 315253 175764 235678 241221 176646 302594 139838 154967 196383 115185 252453 145536 173226 283627 352261 117141 150708 96456 309689 351296 60774 259869 123193 337006
Appendix D
WCM 2006 DNA adducts in liver of cod (Gadus morhua)
kept in cages in the “Ekofisk” area in the North Sea
Halldóra Skarphéðinsdóttir, Birgitta Liewenborg, Lennart Balk
Department of Applied Environmental Science
Stockholm University
Sweden

Introduction In this study, aromatic hydrophobic PAH-DNA adducts were analysed in liver of cod (Gadus
morhua), that had been caged for 6 weeks at three different locations in the “Ekofisk” area in
the North Sea. They were analysed with the 32P postlabelling assay, which is the most
sensitive and frequently applied technique for detecting PAH-DNA adducts in marine
organisms (Reichert et al., 1998).
PAHs are readily taken up and metabolised by fish, and it is during the metabolic
transformation of these compounds, that they are activated to become genotoxic. It is the
enzymatic phase I of the biotransformation of PAHs, that leads to the formation of reactive
electrophilic metabolites which can undergo attack and bind covalently to nucleophilic centres
in large molecules such as lipids, proteins, DNA, and RNA, and form adducts. Factors that
affect DNA adduct levels are exposure dose, the degree of bioactivation in phase I into
reactive intermediates in relation to the phase II detoxification, DNA repair efficiency, as well
as cell turnover. DNA adduct levels are thus a quantifiable measure of the biologically
effective dose reaching a critical target site, and they integrate multiple toxicokinetic factors
such as uptake, metabolism, detoxification, excretion and covalent binding of reactive
metabolites to target tissues (Reichert et al., 1998). DNA adducts have shown to be
predecessor of both mutagenic and carcinogenic effects, and they have shown to correlate
with liver lesions in fish (Baumann, 1998; Reichert et al., 1998). They are also widely used
as, and considered to be highly relevant biomarker for PAH exposure to fish (Ericson et al.,
1998).
Materials and Methods
Chemicals Standard DNA (salmon sperm, D-1626), spermidin (S-2626), RNase A (R-4642), micrococcal endonuclease (N-3755) and spleen phosphodiesterase (P-9041) were obtained from Sigma Chemical Company, St. Louis, MO, USA. RNase T1 (109 193), proteinase K (1000144), α-amylase (102814), T4-polynucleotidekinase (3´-phosphatase free, 838 292) and phenol (1814303) were purchased from Roche Diagnostics, Scandinavia AB, Bromma, Sweden. Nuclease P1 (7160) was bought from Yamasa Corporation, Diagnostics Department, Chuo-Ku, Tokyo, Japan, and later Sigma-Aldrich Sweden AB, Stockholm, Sweden. Radiolabelled ATP ([γ-32P]ATP) with specific activity 3000 Ci/mmol (110 TBq/mmol) were obtained from Amersham Biosciences, Uppsala, Sweden. The benzo[a]pyrene standard adduct, 7R, 8S, 9S-trihydroxy, 10R-(N2-deoxyguanosyl-3´-phosphate)-7,8,9,10-tetrahydro-benzo(a)-pyrene (BaPDE-dG-3´p), was obtained from Midwest Research Institute, Kansas City, MO, USA. Cellulose (MN-301) was purchased from Machery-Nagel, Düren, Germany. Vinyl strips (PVC foil, 0.2 mm thickness), used for the groundwork of the polyethyleneimine cellulose sheets were
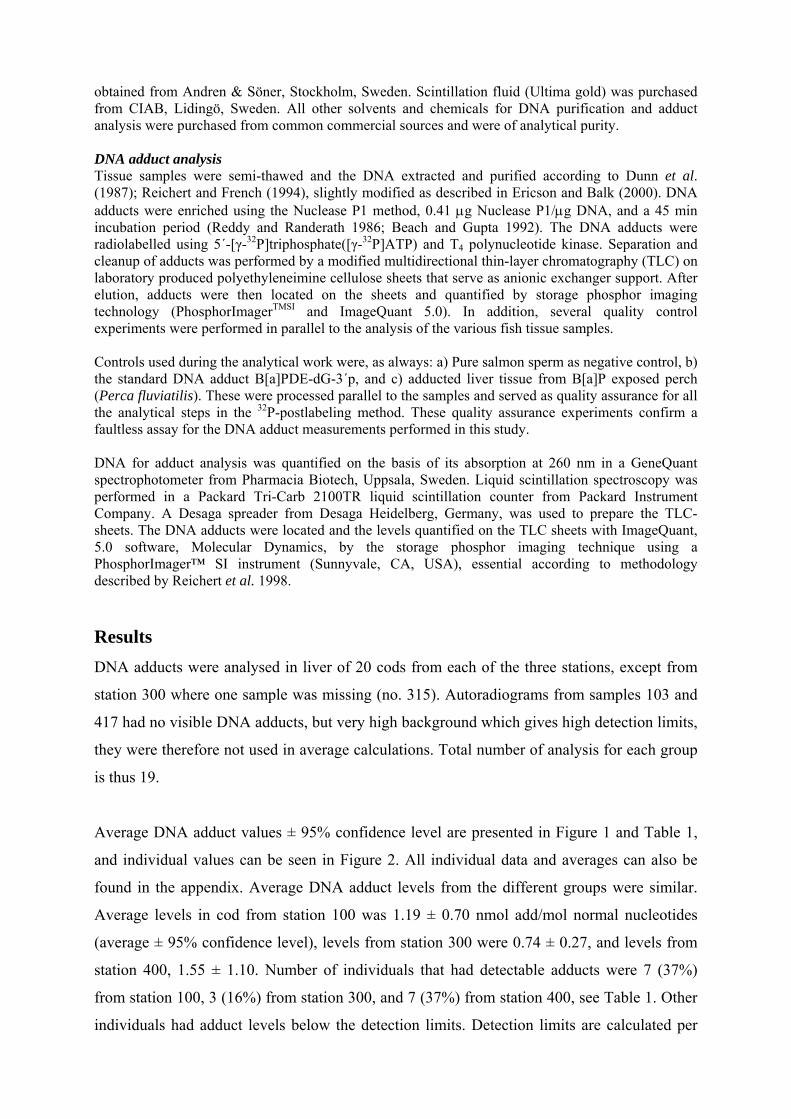
obtained from Andren & Söner, Stockholm, Sweden. Scintillation fluid (Ultima gold) was purchased from CIAB, Lidingö, Sweden. All other solvents and chemicals for DNA purification and adduct analysis were purchased from common commercial sources and were of analytical purity. DNA adduct analysis Tissue samples were semi-thawed and the DNA extracted and purified according to Dunn et al. (1987); Reichert and French (1994), slightly modified as described in Ericson and Balk (2000). DNA adducts were enriched using the Nuclease P1 method, 0.41 μg Nuclease P1/μg DNA, and a 45 min incubation period (Reddy and Randerath 1986; Beach and Gupta 1992). The DNA adducts were radiolabelled using 5´-[γ-32P]triphosphate([γ-32P]ATP) and T4 polynucleotide kinase. Separation and cleanup of adducts was performed by a modified multidirectional thin-layer chromatography (TLC) on laboratory produced polyethyleneimine cellulose sheets that serve as anionic exchanger support. After elution, adducts were then located on the sheets and quantified by storage phosphor imaging technology (PhosphorImagerTMSI and ImageQuant 5.0). In addition, several quality control experiments were performed in parallel to the analysis of the various fish tissue samples. Controls used during the analytical work were, as always: a) Pure salmon sperm as negative control, b) the standard DNA adduct B[a]PDE-dG-3´p, and c) adducted liver tissue from B[a]P exposed perch (Perca fluviatilis). These were processed parallel to the samples and served as quality assurance for all the analytical steps in the 32P-postlabeling method. These quality assurance experiments confirm a faultless assay for the DNA adduct measurements performed in this study. DNA for adduct analysis was quantified on the basis of its absorption at 260 nm in a GeneQuant spectrophotometer from Pharmacia Biotech, Uppsala, Sweden. Liquid scintillation spectroscopy was performed in a Packard Tri-Carb 2100TR liquid scintillation counter from Packard Instrument Company. A Desaga spreader from Desaga Heidelberg, Germany, was used to prepare the TLC-sheets. The DNA adducts were located and the levels quantified on the TLC sheets with ImageQuant, 5.0 software, Molecular Dynamics, by the storage phosphor imaging technique using a PhosphorImager™ SI instrument (Sunnyvale, CA, USA), essential according to methodology described by Reichert et al. 1998. Results DNA adducts were analysed in liver of 20 cods from each of the three stations, except from
station 300 where one sample was missing (no. 315). Autoradiograms from samples 103 and
417 had no visible DNA adducts, but very high background which gives high detection limits,
they were therefore not used in average calculations. Total number of analysis for each group
is thus 19.
Average DNA adduct values ± 95% confidence level are presented in Figure 1 and Table 1,
and individual values can be seen in Figure 2. All individual data and averages can also be
found in the appendix. Average DNA adduct levels from the different groups were similar.
Average levels in cod from station 100 was 1.19 ± 0.70 nmol add/mol normal nucleotides
(average ± 95% confidence level), levels from station 300 were 0.74 ± 0.27, and levels from
station 400, 1.55 ± 1.10. Number of individuals that had detectable adducts were 7 (37%)
from station 100, 3 (16%) from station 300, and 7 (37%) from station 400, see Table 1. Other
individuals had adduct levels below the detection limits. Detection limits are calculated per

individual sample, and are dependent on the background for each autoradiogram.
Autoradiograms can be seen in Figure 3, showing a few samples from each group.
The DNA adduct results from this study were relatively low, but still indicate that individual
fish is affected by PAH contamination. The fact that the fish show elevated levels of DNA
adducts is an abnormal condition, and confirms that the fish has been exposed to genotoxic
pollutants beyond their DNA repair capacity, which suggest PAH exposure. Few studies on
DNA adduct levels in fish from the North Sea or neighboring areas, or even from open seas in
general have been published. But for comparison, Aas et al. (2003) studied DNA adduct
levels in 11 fish species from the open seas of the NE Atlantic. That study showed
undetectable levels of DNA adducts in the fish, or levels just above the detection limits. For
Atlantic cod (Gadus morhua), ten individuals from the Barents Sea were analysed for DNA
adducts. Six of them had detectable adduct levels with an average of 0.75 ± 0.58 (± SD) nmol
add/mol norm. nucleotides (average of individuals with adducts only). To be compared with
2.19, 1.55 and 3.32 for station 100, 300 and 400 respectively.
0
0,5
1
1,5
2
2,5
3
Station 100 Station 300 Station 400
DN
A ad
duct
s
Figure 1. DNA adduct levels (nmol add/mol normal nucleotides) in liver of cod (Gadus morhua) caged at
different locations in “Ekofisk” area in the North Sea (WCM 2006). Average ± 95% confidence level, n= 19 for
all groups.
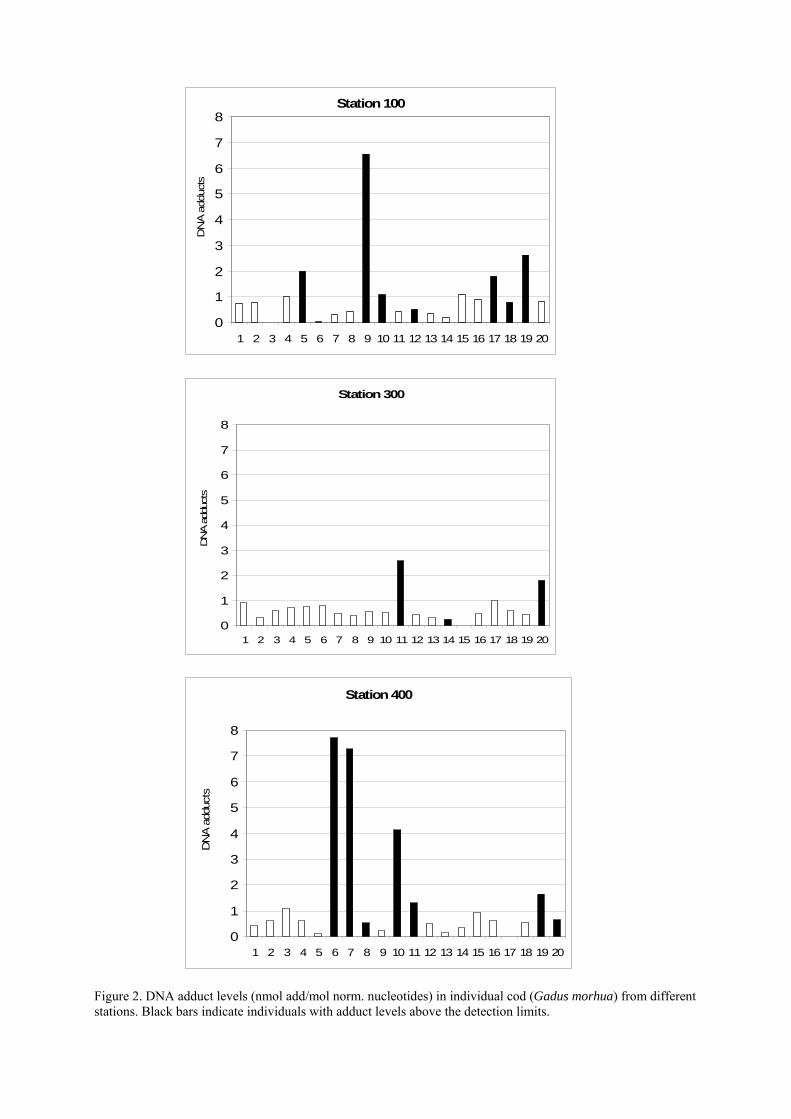
Station 100
0
1
2
3
4
5
6
7
8
1 2 3 4 5 6 7 8 9 10 11 12 13 14 15 16 17 18 19 20
DN
A a
dduc
ts
Station 300
0
1
2
3
4
5
6
7
8
1 2 3 4 5 6 7 8 9 10 11 12 13 14 15 16 17 18 19 20
DNA
addu
cts
Station 400
0
1
2
3
4
5
6
7
8
1 2 3 4 5 6 7 8 9 10 11 12 13 14 15 16 17 18 19 20
DN
A ad
duct
s
Figure 2. DNA adduct levels (nmol add/mol norm. nucleotides) in individual cod (Gadus morhua) from different stations. Black bars indicate individuals with adduct levels above the detection limits.
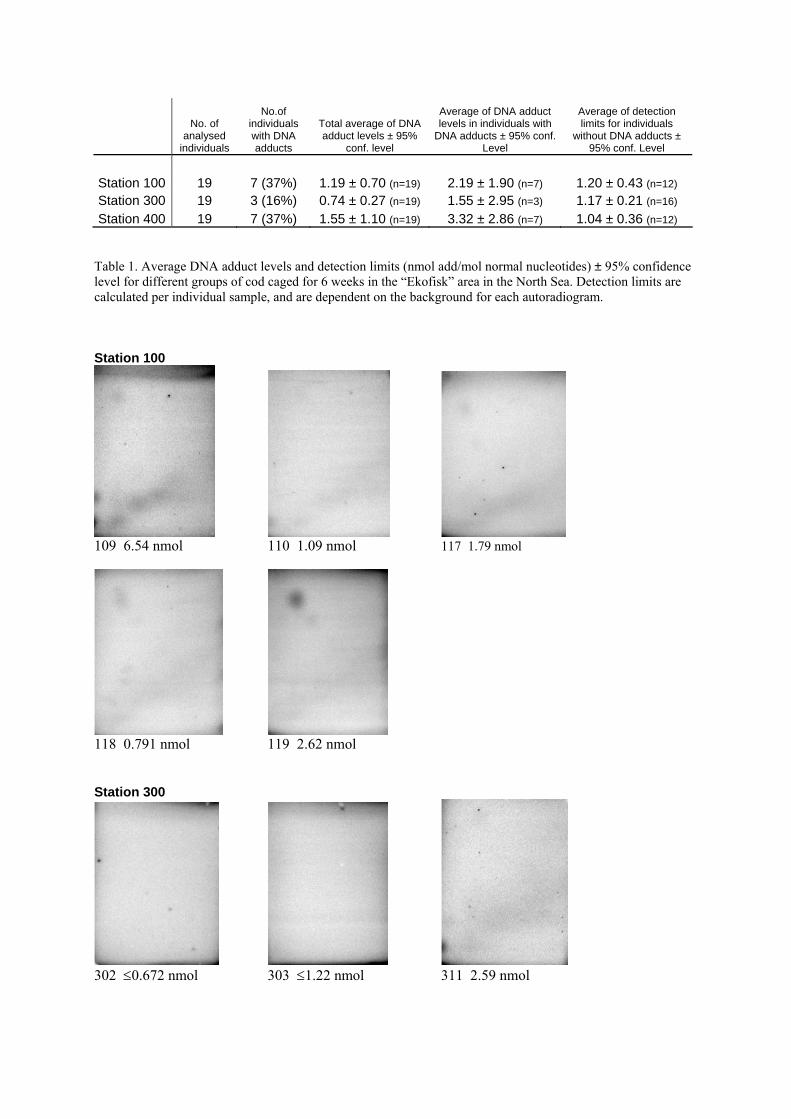
No. of analysed
individuals
No.of individuals with DNA adducts
Total average of DNA adduct levels ± 95%
conf. level
Average of DNA adduct levels in individuals with
DNA adducts ± 95% conf. Level
Average of detection limits for individuals
without DNA adducts ± 95% conf. Level
Station 100 19 7 (37%) 1.19 ± 0.70 (n=19) 2.19 ± 1.90 (n=7) 1.20 ± 0.43 (n=12) Station 300 19 3 (16%) 0.74 ± 0.27 (n=19) 1.55 ± 2.95 (n=3) 1.17 ± 0.21 (n=16) Station 400 19 7 (37%) 1.55 ± 1.10 (n=19) 3.32 ± 2.86 (n=7) 1.04 ± 0.36 (n=12)
Table 1. Average DNA adduct levels and detection limits (nmol add/mol normal nucleotides) ± 95% confidence level for different groups of cod caged for 6 weeks in the “Ekofisk” area in the North Sea. Detection limits are calculated per individual sample, and are dependent on the background for each autoradiogram. Station 100
109 6.54 nmol 110 1.09 nmol 117 1.79 nmol
118 0.791 nmol 119 2.62 nmol Station 300
302 ≤0.672 nmol 303 ≤1.22 nmol 311 2.59 nmol
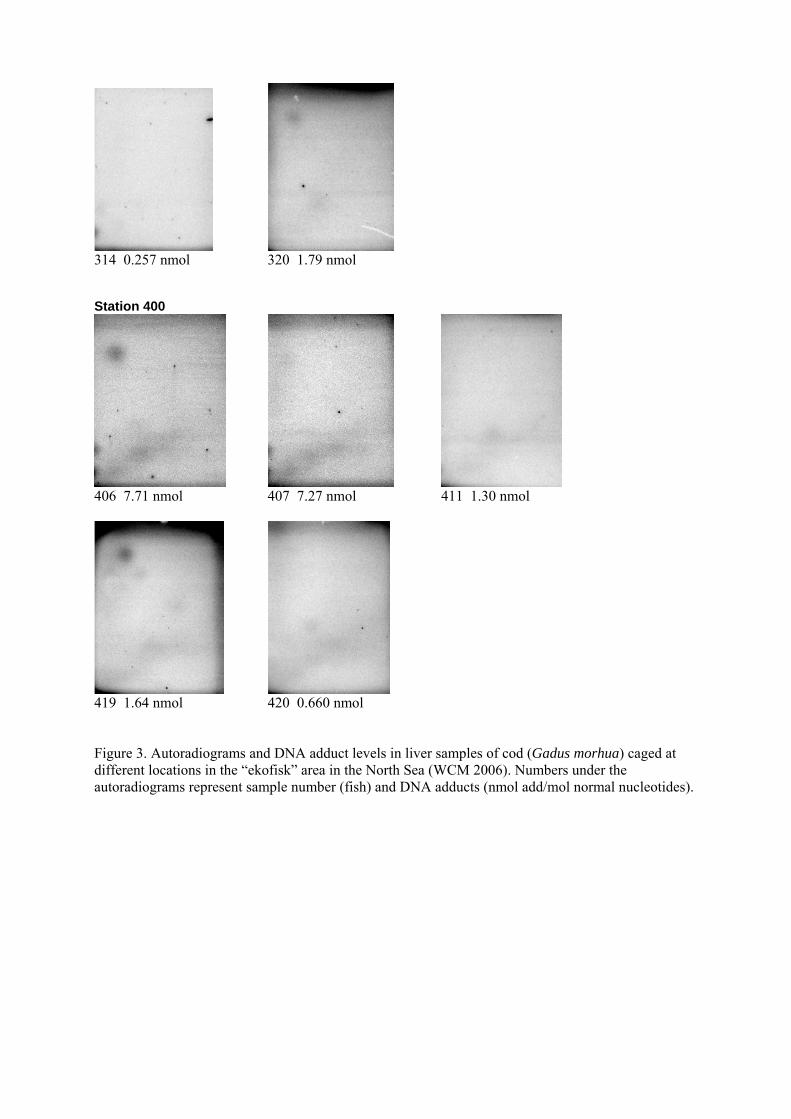
314 0.257 nmol 320 1.79 nmol Station 400
406 7.71 nmol 407 7.27 nmol 411 1.30 nmol
419 1.64 nmol 420 0.660 nmol Figure 3. Autoradiograms and DNA adduct levels in liver samples of cod (Gadus morhua) caged at different locations in the “ekofisk” area in the North Sea (WCM 2006). Numbers under the autoradiograms represent sample number (fish) and DNA adducts (nmol add/mol normal nucleotides).
References Aas, E., Liewenborg, B., Grosvik, B.E., Camus, L., Jonsson, G., Borseth, J.F., Balk, L. 2003. DNA adduct levels
in fish from pristine areas are not detectable or low when analysed using the nuclease P1 version of the P32-postlabelling technique. Biomarkers 8(6): 445-460.
Baumann, P.C. 1998. Epizootics of cancer in fish associated with genotoxins in sediment and water. Mutat. Res. 411, 277-233.
Beach, A.C., Gupta, R.C. 1992. Human biomonitoring and the 32P postlabeling assay. Carcinogenesis 13, 1053-1074.
Dunn, P.B., Black, J.J., Maccubbin A. 1987. 32P-Postlabelling analysis of aromatic DNA adducts in fish from polluted areas. Cancer Res. 47, 6543-6548.
Ericson, G. and Balk, L. 2000. DNA adduct formation in northern pike (Esox lucius) exposed to a mixture of benzo[a]pyrene, benzo[k]fluoranthene and 7H-dibenzo[c,g]carbazole: time-course and dose response studies. Mutat. Res. 454, 11-20.
Ericson, G., Lindesjöö, E., Balk, L. 1998. DNA adducts and histopathological lesions in perch (Perca fluviatilis) and northern pike (Esox lucius) along a polycyclic aromatic hydrocarbon gradient on the Swedish coastline of the Baltic Sea. Can. J. Fish. Aquat. Sci. 55:815–824.
Randerath, E., Randerath, K. 1993. Monitoring tobacco smoke-induced DNA damage by 32P-postlabelling. In: Postlabelling Methods for Detection of DNA adducts. IARC Scientific Publication No. 24. International Agency for Research on Cancer. (eds. Phillips, D. H., Castegnaro, M. & Bartsch, H.) pp. 305-314, Lyon, France.
Reddy, M.V., Randerath, K. 1986. Nuclease P1-mediated enhancement of sensitivity of 32P-postlabeling test for structurally diverse DNA adducts. Carcinogenesis 7, 1543-1551.
Reichert, W.L., French, B. The 32P-postlabeling protocols for assaying levels of hydrophobic DNA adducts in fish. 1994. NOAA Tech. Memo. NMFS-NWFSC-14, National Technical Information Service, Springfield, VA.
Reichert, W.L., Myers, M.S., Peck-Miller, K., French, B.F., Anulacion, B.F. 1998. Molecular epizootiology of genotoxic events in marine fish: Linking contaminant exposure, DNA damage, and tissue level alterations. Mutat. Res. 411, 215-225.

1
Appendix E (the original report contained results from additional surveys, the present version have been modified by IRIS)
Micronucleus analyses Water Column Monitoring 2006
Reporting Period: June 2006 - October 2006 Responsible Person – Dr. habil. Janina Baršienė Institute of Ecology of Vilnius University Akademijos 2 08412, Vilnius Lithuania Tel: +370 6 8260979 Fax: +370 5 2729352 Email: [email protected] Content: Introduction p. 2 Materials and methods p. 4 Results p. 5 Discussion p. 7 Conclusions p. 9 References p. 9

2
1. Introduction In spite of legislation limiting the disposal of toxic compounds, contaminants are chronically
being released to the environment and pollution of environments still occurs. Since the
aquatic environment is the ultimate recipient of the contaminants produced by natural and
anthropogenic sources, circulation and accumulation of hazardous substances constitute
biological damage. Chemicals with genotoxic and carcinogenic potential in the aquatic
environment are serious concern because can bind to DNA molecules and provoke a
damaging chain of biological changes, like impaired enzyme function or general
metabolism, cytotoxicity, immunotoxicity, disturbances in reproduction, inhibition of
growth, or carcinogenesis (Ohe et al., 2004).
Nevertheless, in nowadays an industrial technology improves, but the effluents comprising
mixtures of contaminants should be monitored for the harmful effects to indigenous species.
Aquatic organisms exposed to the mixtures of contaminants, and synergistic effects of
different components are hardly predicted on a basis of chemical analysis. Some compounds
show strong bioaccumulation without evidences to their toxicity, some other contaminants
posses’ very aggressive mode of action and cause harmful effects at low levels of exposure
(Regoli et al., 2004).
The demonstration that industrial wastes can induce genotoxic effects point out the urgent
need for sensitive assays and reliable bioindicators for the evaluation of genotoxic potential
of the industrial effluents. Among current cytogenetic test systems, the assessment of
micronuclei formation is commonly used for the indication of genotoxic compounds
(Heddle et al., 1991). Micronuclei formation in the cells is a reflection of structural and/or
numerical chromosomal disturbances arising due to action of clastogenic and aneugenic
agents. Micronuclei are chromatin-containing structures that are surrounded by a membrane,
are located in cytoplasm and have no detectable link to the cell nucleus. Cytogenetic
damage can result in the formation of MN-containing lagging whole chromosomes or
chromosome fragments. The exposure to substances with aneugenic mode of action results
in damage to the mitotic spindle. The formation of MN, harboring chromosomal fragments
result from direct DNA breakage and usually appear much later after treatment. Thus, MN
assay provide the evidence of DNA breakage and spindle dysfunction caused by clastogens
3
and aneuploidogenic poisons (Heddle et al., 1991; MacGregor, 1991; Seelbach et al., 1993;
Zoll-Moreux, Ferrier, 1999).
Micronucleus assay was originally developed for analysis of chemical genotoxicity in
mammals (Heddle et al., 1991) and later it has been successfully adapted to species from the
other groups, including aquatic organisms. Different fish species and mussels are most
frequently used indicator species, which can reflect genotoxic effects in the marine
environment. Invertebrates compose over 90% of species in aquatic communities and have
particularly important role in ecosystem function (Dixon et al., 2002). The blue mussels are
widely distributed in aquatic habitats and as many other marine species are chronically
exposed to environmental contamination through via feeding and contact with polluted
sediments or water.
Within the last decade, the use marine resident species as appropriate models for genetic
monitoring of toxic chemicals in aquatic environment has become popular and micronuclei
test was applied in both laboratory and field conditions. The micronuclei assay is one of the
best biomarkers that clearly correlate with pollution load, as it has been shown in a number
of studies (Al-Sabti, Hardig, 1990; Bolognesi et al., 1996, 2004, 2006; Pietrapiana et al.,
2002; Baršienė et al., 2002, 2004, 2005, 2006a, 2006b, 2006c, 2006d, 2006e ; Cavas,
Ergene-Gozukara, 2005);
Wastes released from oil industry are well known as representing the primary source of
persistent toxicity in aquatic environment and have particular attention because of their
potential mutagenic/carcinogenic/cytotoxic properties. There are some studies that described
increase of environmental genotoxicity in zones affected by oil spill (Parry et al., 1997;
Harvey et al., 1999; Pietrapiana et al., 2002; Frenzilli et al., 2004; Baršienė et al., 2004,
2005; 2006a, 2006b; Bolognesi et al., 2006). Nevertheless, the scarcity of test validation in
laboratory designed systems remains, as well as monitoring of genotoxic effects in oil
pollution zones in situ..
In order to assess genotoxic impact of wastes from oil platforms, the micronuclei formation
was analyzed in native and commercially important species Atlantic cod treated with
Ekofisk produced water and in mussel’s temporary exposed in the Ekofisk oil platform area.
Fish model exposure experiment was designed as laboratory testing system of genotoxicity

4
in cod liver. Induction of micronuclei in cod immature erythrocytes was used as a “sentinel
system” considering direct contact of contaminants and their metabolic pathway.
Mussels were caged in a gradient of suspected contamination around the Ekofisk oil
platform; consider that in oil drilling areas can be differently distributed potentially
genotoxic polycyclic aromatic hydrocarbons and alkylphenols. In the present study,
micronuclei frequencies in haemocytes of the blue mussel were employed as the endpoint of
cytogenetic damage and index of oil platform effluents genotoxicity. Haemocytes of marine
mussels have been explorated in genotoxicological studies and have proved to be reliable
method for the assessment of direct- and indirect-acting genotoxins (Wrisberg, Rhemrev,
1992; Bolognesi et al., 1999; Jha et al., 2005).
2. Materials and methods The assessment of genotoxic effects of effluents from the Ekofisk oil platform was evaluated
in haemocytes of mussels. Mussels were deployed to two sites close to discharge, in 600 m
and 1600 m SW of discharge, as well as in 1100 m and 2000 m NE from discharge.
Reference clean site was located in 20 km.
Spread on the slides and air-dried mussel hemolymph was fixed 15 min in methanol. After
that the slides were stained with 5% Giemsa solution for 10-20 min. To minimize technical
variation, the blind scoring of micronuclei was performed on coded slides without
knowledge of the exposure status of the samples. The frequency of micronuclei in
haemocytes was determined by scoring at a 1000× magnification using Olympus BX 51 or
Nikon Eclipse 50i bright-field microscopes. A total of 2,000 immature erythrocytes with
intact cellular and nuclear membrane were examined for each mussel specimen.
Only cells with intact cellular and nuclear membrane were scored in cod and in mussels.
Round or ovoid-shaped non-refractory particles with colour and structure similar to
chromatin, with a diameter 1/3-1/20 of the main nucleus and clearly detached from it were
interpreted as micronuclei (Figs. 1 and 2). In general, colour intensity of MN should be the
same or less than of the main nuclei. Particles with colour intensity higher than of the main
nuclei were not counted as MN. The blind scoring of micronuclei was performed on coded
slides without knowledge of the origin of samples. The statistical analysis was carried out
using the Statistica package.

5
Fig. 1. Micronucleus in haemocyte (arrow) of blue mussel (1000× magnification).
3. Results The frequency of micronuclei in the reference group of mussels was equal to 1.24 MN/1000
cells. Comparatively high induction of micronuclei (more than 2-fold level) was observed in
all studied groups of mussels. The exception was only the mussels from the station 500,
which is located in 2000 meters NE from the discharge. There was registered similar level of
response (1.76 MN/1000 cells) as in control group of mussels (Fig. 4).
The highest induction of MN was observed in mussels caged in station 300.

6
100 (REF) 600 400 300 800 700 500-2
0
2
4
6
8
10
12
MN
Figure 2. Frequency of micronuclei (MN/1000 haemocytes) in mussels from the groups indicated. The figure shows median, quartiles and 10/90-percentiles.
Individual analysis of MN incidences in control group of mussels showed that 50% of
specimens did not possessed micronucleated haemocytes. Maximum value of 3.60 MN/1000
haemocytes was recorded in one specimen from control group. The highest response in
mussels caged in the station 600 was equal to 4.40 MN/1000 haemocytes, 5.50 MN/1000
haemocytes – in the station 400, 5.00 MN/1000 haemocytes – in stations 500 and 700, 10
MN/1000 haemocytes – in the station 800. Exceptionally high levels of micronuclei, with a
maximum value of 10.80 MN/1000 haemocytes, were found in mussels caged in the station
300, which is located close to the discharge. In spite, there was one specimen without
formation of micronuclei in haemocytes (Table 1). In overall, mussels after caging in zones
close to the discharge (stations 300 and 800) differed from other groups by their
heterogeneity in responses (Table 1).

7
Table 1. Frequency of micronuclei in mussel caged at Ekofisk oilfield
Mussel No Control 600 400 300 800 700 500 1 0.00 2.00 3.30 10.00 0.00 7.00 0.00 2 0.00 4.40 3.30 8.50 2,00 1.40 5.00 3 0.00 2.50 3.60 No cells* 3.30 2.20 3.30 4 3.30 4.30 5.00 10.80 5.00 No cells* 0.00 5 0.00 1.60 4.00 10.00 3.30 4.50 2.50 6 2.50 3.00 No cells* 6.00 3.30 3.30 1.60 7 0.00 2.20 5.00 5.70 0.00 2.00 2.80 8 3.60 2.50 2.00 2.50 10.00 5.00 1.40 9 0.00 4.30 4.00 2.50 5.00 3.30 0.00 10 2.50 3.75 2.00 5.00 0.00 0.00 0.00 11 1.70 0.00 5.00 No cells* 5.00 4.00 4.00 12 2.00 2.00 3.30 4.00 5.00 2.00 0.00 13 0.00 0.00 5.50 0.00 10.00 4.00 4.10 14 1.70 No cells* 0.00 6.60 3.30 3.00 0.00
* - the slides with a scarce number of cells suitable for the micronuclei analysis
4. Discussion It is known, that petroleum industry and transport cause environmental pollution problems
worldwide. Accidental oil spills from offshore oil installations, oil transportation vessels,
marine oil terminals occurs in marine media and necessity of ecological control is evident.
Harmful effects of crude oil and produced water could be provoked by different
polyaromatic PAHs and alkylphenols, and especially those with genotoxic properties.
Genotoxic effects of different PAHs can result from the oxidative biotransformation
producing highly DNA-reactive metabolites that are recognized carcinogenic and mutagenic
compounds (Torres-Bugarin et al., 1998; Woodhead et al., 1999; Maria et al., 2002c;
Gravato, Santos, 2003). Genotoxic potency of metabolites was confirmed in various fish
species (Metcalfe, 1988; Santos, 1997, 2001; Harvey et al., 1999; Maria et al., 2002a,
2002b; Brown, Steinert, 2003; Teles et al., 2003).

8
The objective of the present study was to estimate genotoxic potential of produced water
discharges in blue mussels, widely used as bioindicator species. Mussel haemocytes were
used as target cells which circulate in open vascular system and are likely to be
homogenously exposed to wastes from the oil platform. Besides, it is noteworthy to stress,
that our previous results have confirmed this parameter being sensitive biomarker for the
assessment genotoxic effects in mussels exposed petroleum refinery plant effluents, also in
mussels caged in the areas of other oil platforms (Baršienė et al., unpublished data).
The study results showed significant increase of genotoxicity in haemocytes of mussel caged
at a station close to the discharge. The reference level of genotoxicity was observed only the
mussels caged at reference station 100. Taking into consideration that in mussels from the
Baltic and North seas, the MN baseline consists of 1-2 MN/1000 cells (Baršienė et al., 2004,
2006a), there was 3-6-fold increase of genotoxicity in the station 300.
Petroleum hydrocarbons in marine environment can seriously impact DNA of filter-feeding
bivalve populations (Hamoutene et al., 2002). Significant elevation of micronuclei level in
mussels 30 days post-oil spill and persistence of the cytogenetic damage up to 100 days
(Parry et al., 1997) and 8 months later (Baršienė et al., 2004, 2006a) has been described.
Interestingly to stress, that statistically significant increase of micronuclei levels has been
found in oysters and fish caged in Haven oil spill zones 10 years after the oil spill
(Bolognesi et al., 2006). Higher frequency of MN has been detected in mussels from oil
terminal and marine port zones in the Baltic Sea (Baršienė, Baršytė Lovejoy, 2000;
Baršienė, 2002), in Mediterranean commercial port zone (Magni et al., 2006), in polluted by
aromatic hydrocarbons zones of the Venice lagoon (Venier, Zampieron, 2005). Cells with
micronuclei were found to increase in the gills or hemolymph of marine molluscs treated
with benzo(a)pyrene (Burgeot et al., 1995; Venier et al., 1997; Siu et al., 2004),
dimethylbenz(a)antracene (Bolognesi et al., 1996), with crude oil from the North Sea
(Baršienė et al., in preparation). The results of the Comet and MN assays have been
presented evidences on clear dose- and time-dependent responses to benzo(a)pyrene
exposure in mytiliid bivalve Perna viridis (Siu et al., 2004).
Summarizing the results of the current study allow to conclude that micronucleus test is
sensitive tool for the determination of produced water genotoxicity. Thus, in the future the
parameter could successfully be used as an early warning sign of pollution-induced genetic

9
damage in marine species. Taking into consideration species-specific responses and the
differences in PW content, the ecologically relevant information from oil industry areas
could be obtained by assessment of genotoxic effects in indigenous species both in situ and
in caged organisms from wild populations. Additionally studies should focus on identifying
environmental genotoxicity modifications by animal age, tissue, sex, season, temperature,
and oxygen content in oil drilling zones.
5. Conclusions Statistically significant increase of micronuclei levels was observed in haemocytes of
mussel caged at one of the studied sites in the Ekofisk oilfield. The reference level of
genotoxicity was detected only the mussels caged in reference station 100. The highest
induction of MN was found in mussels exposed in station 300, close to Ekofisk platform
discharge.
6. References Al-Sabti, K., 1986. Comparative micronucleated erythrocyte cell induction in three cyprinids
by five carcinogenic-mutagenic chemicals. Cytobios 47:, 147-154. Al-Sabti, K., Hardig J. 1990. Micronucleus test in fish for monitoring the genotoxic effects
of industrial waste products in the Baltic Sea, Sweden. Comp. Biochem.Physiol. Part C: Comp. Pharmacol. 97: 179-182.
Baršienė J, Baršytė Lovejoy D. 2000. Environmental genotoxicity in Klaipėda port area. Intern. Review Hydrobiology, 85: 663-672.
Baršienė J. 2002. Genotoxic impacts in Klaipėda marine Port and Būtingė oil terminal areas (Baltic Sea). Marine Environ. Res. 54: 475-479.
Baršienė J., Lazutka J., Šyvokienė J., Dedonytė V., Rybakovas A., Bjornstad A., Andersen O.K. 2004. Analysis of micronuclei in blue mussels and fish from the Baltic and the North Seas. Environ. Toxicol., 19: 365-371.
Baršienė J., Dedonytė V., Rybakovas A., Broeg K., Forlin L. , Gercken J., Kopecka J., Balk L. 2005. Environmental mutagenesis in different zones of the Baltic Sea. Acta Zool. Lituanica, 15: 90-95.
Baršienė J., Schiedek D., Rybakovas A., Šyvokienė J., Kopecka J., Forlin L. 2006a. Cytogenetic and cytotoxic effects in gill cells of the blue mussel Mytilus spp. from different zones of the Baltic Sea. Marine Pollution Bulletin, 53: 469-478.
Baršienė J., Lehtonen K., Koehler A., Broeg K., Vourinen P.J., Lang T., Pempkowiak J., Šyvokienė J., Dedonytė V., Rybakovas A., Repečka R., Vountisjarvi H., Kopecka J.

10
2006b. Biomarker responses in flounder (Platichthys flesus) and mussel (Mytilus edulis) in the Klaipėda-Būtingė area (Baltic Sea). Marine Pollution Bulletin, 53: 422- 436.
Baršienė J., Dedonytė V., Rybakovas A., Andreikėnaitė L., Andersen O.K. 2006c. Investigation of micronuclei and other nuclear abnormalities in peripheral blood and kidney of marine fish treated with crude oil. Aquatic Toxicology, 78: 99-104.
Baršienė J., Šyvokienė J., Bjørnstad A. 2006d. Induction of micronuclei and othernuclear abnormalities in mussels exposed to bisphenol A, diallyl phthalate and tetrabromodiphenyl ether-47. Aquatic Toxicology, 78: 105-108. Baršienė, J., Andreikėnaitė, L., Rybakovas, A., 2006e. Cytogenetic damage in perch (Perca fluviatilis L.) and duck mussel (Anodonta anatina L.) exposed to crude oil. Ekologija No 1, (in press).
Baršienė J., Andreikėnaitė L., Bjornstad A. Induction of micronuclei and other nuclear abnormalities in blue mussels exposed to crude oil from the North Sea (in preparation).
Bolognesi C., Rabboni R. and Roggieri P. 1996. Genotoxicity biomarkers in M. Galloprovincialis as indicators of marine pollutants. Comp. Biochem. Physiol. 113C, No 2: 319-323.
Bolognesi C., Landini E., Roggieri P., Fabbri R. and Viarengo A. 1999. Genotoxicity biomarkers in the assessment of heavy metal effects in mussels: experimental studies. Environ. Molecular Mutagenesis, 33: 287-292.
Bolognesi C., Frenzilli G., Lasagna C., Perrone E., Roggieri P. 2004. Gotoxicity biomarkers in Mytilus galloprovincialis: wild versus caged mussels. Mut. Res. 552: 153-162.
Bolognesi C., Perrone E., Roggieri P., Sciutto A. 2006. Bioindicators in monitoring long term genotoxic impact of oil spill: Haven case study. Marine Environ. Res., 62: S287-S291.
Brown J.S., Steinert S.A. 2003. DANN damage and biliary PAH metabolites in flatfish from Southern California bays and harbors, and the Channel Islands. Ecological Indicat. 3: 263-274.
Burgeot T., His E and Galgani F. 1995. The micronucleus assay in Crassostrea gigas for the detection of seawater genotoxicity. Mut. Res., 343: 125-140.
Cavas T., Ergene-Gozukara S. 2005. Micronucleus test in fish cells: A bioassay for in situ monitoring of genotoxic pollution in the marine environment. Environ. Mol. Mutagenesis, 46: 64-70.
Chang S., Zdanowicz V. S., and Murchelano R. A. 1998. Associations between liver lesions in winter flounder (Pleuronectes americanus) and sediment chemical contaminants from north-east United States estuaries. ICES Journal of Marine Sciences, 55:954-969.
Dixon D.R., Pruski A.M., Dixon L.R.J. & Jha A.N. 2002. Marine invertebrate eco-genotoxicology: a methodological overview. Mutagenesis 17, 495-507.
Frenzilli G., Scarcelli V., del Barga I., Nigro M., Forlin L., Bolognesi C., Sturve J. 2004. DNA damage in eelpout (Zoarces viviparus) from Goteborg harbour. Mut. Res. 552: 187-195.
Gravato, C., Santos, M.A., 2002. Juvenile sea bass liver P450, EROD induction, and erythrocytic genotoxic responses to PAH and PAH-like compounds. Ecotoxicol. Environ. Safety 51:, 115-127.
11
Gravato, C., Santos, M.A., 2003. Genotoxicity biomarkers’ association with B(a)P biotransformation in Dicentrarchus labrax L. Ecotoxicol. Environ. Safety 55:, 352-358.
Hamoutene D., Payne J.F., Rahimtula A., Lee K. 2002. Use of the Comet assay to assess DNA damage in hemocytes and digestive gland cells of mussels and clams exposed to water contaminated with petroleum hydrocarbons. Marine Environ. Res. 54: 471-474.
Harvey J.S., Lyons B.P., Page T.S., Stewart C., Parry J.M. 1999. An assessment of the genotoxic impact of the Sea Empress oil spill by the measurement of DNA adduct levels in selected invertebrate and vertebrate species, Mut. Res., 441: 103–114.
Heddle J.A., Cimino M.C., Hayashi M., Romagna F., Shelby M.D., Tucker J.D., Vanparys Ph. and MacGregor J.T. 1991. Micronuclei as an index of cytogenetic damage: past, present, and future. Environ. Mol. Mutagen., 18: 277-291.
Jha A.N., Dogra Y., Turner A., Millward G.E. 2005. Impact of low doses of tritium on the marine mussel, Mytilus edulis: Genotoxic effects and tissue-specific bioconcentration. Mut. Res. 586:47-57.
MacGregor J.T. 1991. Micronuclei as an index of cytogenetic damage: past, present, and future. Environ. Mol. Mutagen., 18: 277-291.
Magni P., De Falco G., Falugi C., Franzoni M., Monteverde M., Perrone E., Sgro M., Bolognesi C. 2006. Genotoxicity biomarkers and acetylcholinesterase activity in natural populations of Mytilus galloprovincialis along a pollution gradient in the Gulf of Oristano (Sardinia, western Mediterranean). Environ. Poll., in press.
Maria, V.L., Correia, A.C., Santos, M.A., 2002a. Anguilla anguilla L. biochemical and genotoxic responses to benzo[a]pyrene. Ecotoxicol. Environ. Safety 53:, 86-92.
Maria, V.L., Correia, A.C., Santos, M.A., 2002b. Benzo[a]pyrene and β-Naphthoflavone mutagenic activation by European eel (Anguilla anguilla L.) S9 liver fraction. Ecotoxicol. Environ. Safety, 53:, 81-85.
Metcalfe, C.D., 1988. Induction of micronuclei and nuclear abnormalities in the erythrocytes of mudminnows (Umbra limi) and brown bullheads (Ictalurus nebulosus). Bull. Environ. Contam. Toxicol. 40:, 489-495.
Nishikawa T., Nakamura T., Fukushima A., Takagi Y. 2005. Further evaluation of the skin micronucleus test: Results obtained using 10 polycyclic aromatic hydrocarbons. Mut. Res. 588: 56-63.
Ohe T., Watanabe T., Wakabayashi K. 2004. Mutagens in surface waters: a review. Mut. Res. 567: 109-149.
Parry J.M., Harvey J.S., Lyons B.P. 1997. The application of genetic toxicology in the analysis of the consequences of a major marine pollution incident. Mut. Res. Supplement 1, 379: S91.
Pietrapiana D., Modena M., Guidetti P., Falugi C and Vacchi M. 2002. Evaluating the genotoxic damage and hepatic tissue alterations in demersal fish species: a case study in the Ligurian Sea (NW-Mediterranean) Mar. Poll. Bull. 44: 238-243.
Regoli F., Frenzilli G., Bocchetti R., Annarumma F., Scarcelli V., Fattorini D., Nigro M. 2004. Time-course variation of oxyradical metabolism, DNA integrity and lysosomal stability in mussels, Mytilus galloprovincialis, during a field translocation experiment. Aquatic Toxicol. 68: 167-178.
Sánchez P., Llorente M.T., Castaño A. 2000. Flow cytometric detection of micronuclei and cell cycle alterations in fish-derived cells after exposure to three model genotoxic
12
agents: mitomycin C, vincristine sulfate and benzo(a) pyrene. Mut. Res. 465:113-122).
Seelbach A., Fissler B., Strohbusch A. and Madle S. 1993. Development of a modified micronucleus assay in vitro for detection of aneugenic effects. Toxicol. In Vitro, 7: 185-193.
Siu W.H.L., Cao J., Jack R.W., Wu R.S.S., Richardson B.J. Xu L., Lam P.K.S. 2004. Application of the comet and micronucleus assays to the detection of B[a]P genotoxicity in haemocytes of the green-lipped mussel (Perna viridis). Aquatic Toxicol. 66: 381-392.
Teles, M., Pacheco, M., Santos, M.A., 2003. Anguilla anguilla L. liver ethoxyresorufin O-deethylation, Glutathione S-transferase, erythrocytic nuclear abnormalities, and endocrine responses to naphthalene and β-naphthoflavone. Ecotoxicol. Environ. Safety 55:, 98-107.
Torres-Bugarin O., De Anda-Casillas A., Ramirez-Munoz M.P., Sanchez-Corona J., Cantu-Zuniga J.M. 1998. Determination of diesel genotoxicity in firebreathers by micronuclei and nuclear abnormalities in buccal mucosa. Mut. Res., 413: 277-281.
Venier P., Minisi S., Voltan R., Ciccotti E., Pinna A. 1997. Formation and persistence of DNA adducts and micronuclei in rainbow trout after treatment with benzo[a]pyrene. Mut. Res., 379: S94.
Venier P., Zampieron C. 2005. Evidence of genetic damage in grass gobies and mussels from the Venice lagoon. Environ. Intern. 31: 1053-1064.
Woodhead, R.J., Law, R.J., Matthiessen, P., 1999. Polycyclic aromatic hydrocarbons in surface sediments around England and Wales, and their possible biological significance. Mar. Poll. Bull. 9:, 773-790.
Wrisberg M.N., Rhemrev R. 1992. Detection of genotoxins in the aquatic environment with the mussel Mytilus edulis. Water Sci. Technol.,25: 317-324.
Zoll-Moreux C. and Ferrier V. 1999. The Jaylet test (Newt micronucleus test) and the micronucleus test in Xenopus: two in vivo tests on Amphibia evaluation of the genotoxicity of five environmental pollutants and of five effluents. Water Res., 33: 2301-2314.

5
Data Report
Analysis of Blue Mussels
July 2006
Prepared for:
Norwegian Institute for Water Research (NIVA)
Prepared by:
Battelle 397 Washington Street
Duxbury, Massachusetts 02332
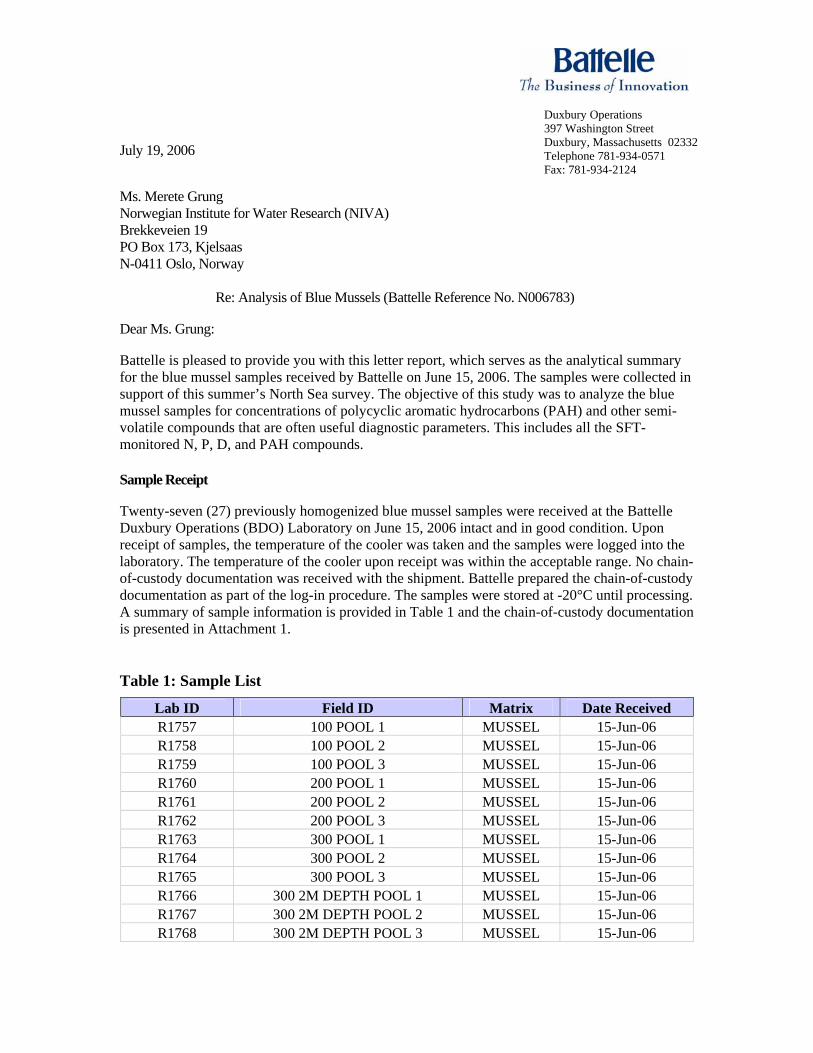
Duxbury Operations 397 Washington Street Duxbury, Massachusetts 02332 Telephone 781-934-0571 Fax: 781-934-2124
July 19, 2006
Ms. Merete Grung Norwegian Institute for Water Research (NIVA) Brekkeveien 19 PO Box 173, Kjelsaas N-0411 Oslo, Norway
Re: Analysis of Blue Mussels (Battelle Reference No. N006783)
Dear Ms. Grung:
Battelle is pleased to provide you with this letter report, which serves as the analytical summary for the blue mussel samples received by Battelle on June 15, 2006. The samples were collected in support of this summer’s North Sea survey. The objective of this study was to analyze the blue mussel samples for concentrations of polycyclic aromatic hydrocarbons (PAH) and other semi-volatile compounds that are often useful diagnostic parameters. This includes all the SFT-monitored N, P, D, and PAH compounds. Sample Receipt
Twenty-seven (27) previously homogenized blue mussel samples were received at the Battelle Duxbury Operations (BDO) Laboratory on June 15, 2006 intact and in good condition. Upon receipt of samples, the temperature of the cooler was taken and the samples were logged into the laboratory. The temperature of the cooler upon receipt was within the acceptable range. No chain-of-custody documentation was received with the shipment. Battelle prepared the chain-of-custody documentation as part of the log-in procedure. The samples were stored at -20°C until processing. A summary of sample information is provided in Table 1 and the chain-of-custody documentation is presented in Attachment 1.
Table 1: Sample List
Lab ID Field ID Matrix Date Received R1757 100 POOL 1 MUSSEL 15-Jun-06 R1758 100 POOL 2 MUSSEL 15-Jun-06 R1759 100 POOL 3 MUSSEL 15-Jun-06 R1760 200 POOL 1 MUSSEL 15-Jun-06 R1761 200 POOL 2 MUSSEL 15-Jun-06 R1762 200 POOL 3 MUSSEL 15-Jun-06 R1763 300 POOL 1 MUSSEL 15-Jun-06 R1764 300 POOL 2 MUSSEL 15-Jun-06 R1765 300 POOL 3 MUSSEL 15-Jun-06 R1766 300 2M DEPTH POOL 1 MUSSEL 15-Jun-06 R1767 300 2M DEPTH POOL 2 MUSSEL 15-Jun-06 R1768 300 2M DEPTH POOL 3 MUSSEL 15-Jun-06
Lab ID Field ID Matrix Date Received R1769 400 POOL 1 MUSSEL 15-Jun-06 R1770 400 POOL 2 MUSSEL 15-Jun-06 R1771 400 POOL 3 MUSSEL 15-Jun-06 R1772 500 POOL 1 MUSSEL 15-Jun-06 R1773 500 POOL 2 MUSSEL 15-Jun-06 R1774 500 POOL 3 MUSSEL 15-Jun-06 R1775 600 POOL 1 MUSSEL 15-Jun-06 R1776 600 POOL 2 MUSSEL 15-Jun-06 R1777 600 POOL 3 MUSSEL 15-Jun-06 R1778 700 POOL 1 MUSSEL 15-Jun-06 R1779 700 POOL 2 MUSSEL 15-Jun-06 R1780 700 POOL 3 MUSSEL 15-Jun-06 R1781 800 POOL 1 MUSSEL 15-Jun-06 R1782 800 POOL 2 MUSSEL 15-Jun-06 R1783 800 POOL 3 MUSSEL 15-Jun-06
Methods
Sample Extraction: The blue mussel samples were previously homogenized. Approximately 10 - 20 g of tissue was used for analysis. A separate 5g aliquot was removed for dry weight determination. The tissue was placed in a clean 250 mL tall wide mouth glass jar with sodium sulfate for extraction. Surrogate internal standard (SIS) compounds were added and the sample was macerated with a Tissuemizer™ using methylene chloride as the extraction solvent. The Tissuemizer™ extraction was repeated once more, followed by a 1-hour solvent extraction on an orbital shaker table. The extracts were dried over sodium sulfate and concentrated by Kuderna-Danish and N2 evaporation techniques. The extracts were processed through alumina columns and further cleaned-up through HPLC equipped with a size exclusion column to isolate analytes of interest. The tissue lipid content was determined using a portion of the pre-purified extract. The final extract was spiked with internal standards (IS) and submitted for the analysis of PAH by GC/MS. The following Quality Control samples were processed along with the batch of tissue samples: two procedural blanks (PB), laboratory control sample (LCS), standard reference material (SRM), and a control oil (NSC).
Sample Analysis: Sample extracts were analyzed for PAH by gas chromatography/ mass spectrometry (GC/MS) in the selected ion monitoring (SIM) mode. Prior to sample analysis, the GC/MS was tuned with perfluorotributylamine (PFTBA) and calibrated with a 5-point calibration consisting of the target compounds to demonstrate the linear range of the analysis. The calibration was verified with a mid-level calibration check standard analysis every 10 samples.
The concentrations of the individual PAH compounds were calculated by the internal standard method. Target PAH concentrations were quantified using average response factors (RF) generated from the five-point linear calibration. Alkyl homologue PAH series concentrations were determined using the average RF for the corresponding parent compound. Well established alkyl homologue pattern recognition and integration techniques were used to determine alkyl homologues. Final concentrations were determined versus the appropriate surrogate compound.
Analytical reporting limits and estimated limits of detections were determined for each sample. The reporting limits are defined as the sample concentration equivalent to the low level standard. The estimated limits of detection are based on a sample concentration equivalent to a signal:noise
ratio of 5:1. The data were qualified with a “J” if the measured concentration was below the reporting limit. Non-detects were qualified with a “U” and null-value was reported.
Quality Assurance/Quality Control
All laboratory and data assessment and reporting activities were conducted under a Quality System defined in the Quality Assurance Manual for the BDO Laboratory. Project activities were defined in a laboratory quality assurance project plan (QAPP) that was prepared by the Project Manager and reviewed by management. The QAPP specified the work to be performed, the analytical methods to be followed, the measurement quality objectives (MQOs) to be achieved, and level of data review. All sample receipt, storage, preparation, analysis, and reporting procedures followed written Standard Operating Procedures (SOPs). Project staff members were responsible for following these procedures and ensuring that MQOs were achieved. In the event that an MQO was not met, the analytical staff documented all corrective actions taken related to that exceedance. The project manager reviewed and approved corrective actions. An independent QC Chemist reviewed all sample preparation and analytical documentation for completeness and accuracy and conducted full error checking of reported project data. The project manager was responsible for ensuring that project objectives were met and that the data were traceable and defensible.
Quality Control Issues
The QC data for the blue mussel analysis were overall good, particularly considering the complex sample matrix, low detection limits, and the variable target compound concentrations. Two procedural blanks were extracted with the large batch of samples. None of the procedural blank data indicate any notable laboratory contamination. Trace PAH was detected, but at concentrations at or below the RL and generally orders of magnitude lower than what was detected in the field samples. In cases where the sample concentration was detected at 5 times less than what was detected in the blank, the data was “B” qualified.
The surrogate recoveries for all of the field and QC samples met the MQO criteria (40 – 120%) with one exception. The surrogate recovery of naphthalene-d8 in one blank was 38%. The majority of the surrogate recoveries were in the 56 to 97% range.
The laboratory control spike (LCS) results were lower than expected. The LCS recoveries were generally in the 56 to 80% range. The tissue standard reference material (SRM) results are very good. The percent difference from target concentrations was less than 35%, with the exception of one compound. The percent difference of benzo[a]pyrene was 50%. Given the acceptable SRM results, the relatively low recoveries in the LCS appear to be an isolated incident and not a laboratory systems issue.
Ultra-trace level analytical sensitivity was obtained for all analyses. The method detection limit goals were met, and allowed for identification and quantitation of almost all target analytes in almost all samples, many at extremely low concentrations. The low detection limits, in combination with the broadly high quality procedural blank evaluations, accuracy, and precision measurements indicated that the analyses were consistently under control, that the objectives were met, and that the results can be used with confidence.
Results
The concentrations of key groups of organic compounds are summarized in Table 2. This table presents the average concentrations from the replicate mussel samples. The concentrations of the decalins were typically much higher than the other compound groups. Although the decalins may

not be an SFT requirement, they are extremely useful diagnostic parameters in this type of work; they are abundant in produced water discharge and have a much higher bioaccumulation potential than other compounds of similar abundance and similar relatively low molecular weight (decalins are quite hydrophobic). PAH are summarized in graphical format in Figure 1. Figure 1 presents the total PAH concentration for the average concentrations from the replicate mussel samples.
Table 2: Average Concentrations (ng/g,wet wt) of Key PAH Compound Groups in the Blue Mussels
Client ID Total Decalins
Total Naphthalenes
Total Phenanthrenes/
Anthracenes
Total Dibenzothiophenes
Total PAH
100 POOL ND 1.33 3.33 1.15 12.64 200 POOL ND 0.66 2.13 0.68 6.62 300 POOL 443.16 157.29 156.81 44.88 483.52 300 2M DEPTH POOL 450.15 116.53 149.29 43.71 424.76 400 POOL 398.37 107.94 132.57 39.69 377.74 500 POOL 113.38 40.08 47.84 15.09 141.49 600 POOL 237.99 66.19 78.97 26.15 238.11 700 POOL 188.17 56.17 68.20 21.52 199.80 800 POOL 341.23 79.23 119.79 38.77 337.98
Total PAH
0
100
200
300
400
500
600
100 POOL 200 POOL 300 POOL 300 2MDEPTHPOOL
400 POOL 500 POOL 600 POOL 700 POOL 800 POOL
Con
cent
ratio
n (n
g/g,
wet
wt)
Figure 1. Total PAH Concentrations (ng/g,wet wt) in the Replicate Mussel Samples
Selected PAH data are summarized in graphical format in Attachment 2. Separate bar charts display the concentrations of key compound classes, including the SFT monitored naphthalenes,
phenanthrenes, and dibenzothiophenes compounds. Figures in Attachment 2 also present the composition of PAH in representative samples. The PAH data are summarized in more detail in tables in Attachment 3, where the results for each sample are presented.
We appreciated the opportunity to work with you on this project. Please do not hesitate to contact me at 781-952-5250 if you require additional information concerning the results.
Sincerely,
Kerylynn Krahforst Project Manager/Research Scientist Attachment 1: Chain-of-Custody Documentation Attachment 2: Summary Data Graphs Attachment 3: PAH Quality Control and Sample Data

Attachment 1 Chain-of-Custody

Sample Receipt FormApproved: Authorized
Project Number: Client: NIVA
Received by: Carlson, Heather Date/Time Received: Thursday, June 15, 2006 3:30 AM
No. of Shipping Containers: 1
SHIPMENTMethod of Delivery: Commercial Carrier Tracking Number: Not Recorded
COC Forms: Shipped with samples No Forms
Cooler(s)/Box(es)
Samples
Container Type Sealed With Seal Condition Container Condition Temp C Total Samples1 of 1 Cooler Tape Intact Intact 5.0 27
Sample Labels: Sample labels agree with COC formsDiscrepancies (see Sample Custody Corrective Action Form)
Container Seals: Tape Custody Seals Other Seals (See sample Log)Seals intact for each shipping containerSeals broken (See sample log for impacted samples)
Condition of Samples: Sample containers intactSample containers broken/leaking (See Custody Corrective Action Form)
Temperature upon receipt (°C): Temperature Blank used5 Yes No(Note: If temperature upon receipt differs from required conditions, see sample log comment field)
Samples Acidified: Yes No Unknown
Initial pH 5-9?: Yes No NAIf no, individual sample adjustments on the Auxiliary Sample Receipt Form
Total Residual Chlorine Present?: Yes No NAIf yes, individual sample adjustments on the Auxiliary Sample Receipt Form
Head Space <1% in samples for water VOC analysis: Yes No NAIndividual sample deviations noted on sample log
Samples Containers:Samples returned in PC-grade jars: Yes No Unknown /Lot No.: UnKnown
Samples logged in by: Carlson, Heather Date/Time: 06/15/2006 3:30 AM
Storage Location: Chem North: Freezer - F0002 (Walk-in) BDO IDs Assigned: R1757 - R1783
Approved By: Abramson, Carla Approved On: 6/27/2006 4:48:
Authorized By: Authorized On:
Printed on 7/19/2006 Page 1 of 1

Report Corrective ActionsApproved:Authorized
Corrective Action No: 1 of
ShpNo: SHP-060615-03
1
Battelle Project No:06783-0001
COC Client: NIVACOC Project:COC Date: 6/15/2006 3:53:00 PM
Documentation of project manager notification
Date: 6/15/2006 4:03:00 PM
Date: 6/27/2006 7:35:00 AM
Date: 6/26/2006 4:21:00 PM
Documentation of client notification (should be completed by project manager within 24 hrs):
On 15-Jun-06 I contacted Grung, Merete at Norwegian Institute for Water Research (NIVA)
Results of communication with client (Describe any corrective action directed by the client):
Notified client. See attached e-mail. KK 6/26/06
Date this form was received back to the custodian: 6/27/2006Reference Number:
Sample Custodian Carlson, Heather
Laboratory Manager: Thorn, Jonathan
Project Manager: Krahforst, Kerylynn
Description of Problem: Explanation:COC missing from shipmentOtherCustody
Printed on 7/19/2006 Page 1 of 1

Sam
ple
Rec
eipt
For
m D
etai
ls
ShpN
oSH
P-0
60
615
-03
App
rove
d:A
uth
oriz
ed
Pro
ject
Nu
mbe
r:C
lien
t:N
IVA
Rec
eive
d by
:Ca
rlson
, Hea
ther
Dat
e/Ti
me
Rec
eive
d:Th
ursd
ay, J
une
15, 2
006
3:30
AM
No.
of
Ship
pin
g C
onta
iner
s:1
BD
O Id
:C
lient
Sam
ple
ID:
Col
lect
ion
Dat
e:Lo
gin
Dat
e:C
trs:
Mat
rix:
Tem
p:pH
:TR
C:
VOC
:St
ored
In:
Loc:
No:
Com
men
ts:
Bat
telle
Pro
ject
No:
NO
P40
521
R17
5710
0 P
OO
L 1
06/1
5/06
15:
55M
US
SE
L5
NA
NA
NA
F000
2 (W
alk-
in)
BIN
86R
1758
100
PO
OL
206
/15/
06 1
5:56
MU
SS
EL
5N
AN
AN
AF0
002
(Wal
k-in
)B
IN86
R17
5910
0 P
OO
L 3
06/1
5/06
15:
56M
US
SE
L5
NA
NA
NA
F000
2 (W
alk-
in)
BIN
86R
1760
200
PO
OL
106
/15/
06 1
5:56
MU
SS
EL
5N
AN
AN
AF0
002
(Wal
k-in
)B
IN86
R17
6120
0 P
OO
L 2
06/1
5/06
15:
56M
US
SE
L5
NA
NA
NA
F000
2 (W
alk-
in)
BIN
86R
1762
200
PO
OL
306
/15/
06 1
5:56
MU
SS
EL
5N
AN
AN
AF0
002
(Wal
k-in
)B
IN86
R17
6330
0 P
OO
L 1
06/1
5/06
15:
56M
US
SE
L5
NA
NA
NA
F000
2 (W
alk-
in)
BIN
86R
1764
300
PO
OL
206
/15/
06 1
5:57
MU
SS
EL
5N
AN
AN
AF0
002
(Wal
k-in
)B
IN86
R17
6530
0 P
OO
L 3
06/1
5/06
15:
57M
US
SE
L5
NA
NA
NA
F000
2 (W
alk-
in)
BIN
86R
1766
300
2M D
EP
TH P
OO
L 1
06/1
5/06
15:
57M
US
SE
L5
NA
NA
NA
F000
2 (W
alk-
in)
BIN
86R
1767
300
2M D
EP
TH P
OO
L 2
06/1
5/06
15:
57M
US
SE
L5
NA
NA
NA
F000
2 (W
alk-
in)
BIN
86R
1768
300
2M D
EP
TH P
OO
L 3
06/1
5/06
15:
57M
US
SE
L5
NA
NA
NA
F000
2 (W
alk-
in)
BIN
86R
1769
400
PO
OL
106
/15/
06 1
5:58
MU
SS
EL
5N
AN
AN
AF0
002
(Wal
k-in
)B
IN86
R17
7040
0 P
OO
L 2
06/1
5/06
15:
58M
US
SE
L5
NA
NA
NA
F000
2 (W
alk-
in)
BIN
86R
1771
400
PO
OL
306
/15/
06 1
5:58
MU
SS
EL
5N
AN
AN
AF0
002
(Wal
k-in
)B
IN86
R17
7250
0 P
OO
L 1
06/1
5/06
15:
58M
US
SE
L5
NA
NA
NA
F000
2 (W
alk-
in)
BIN
86R
1773
500
PO
OL
206
/15/
06 1
5:58
MU
SS
EL
5N
AN
AN
AF0
002
(Wal
k-in
)B
IN86
R17
7450
0 P
OO
L 3
06/1
5/06
15:
59M
US
SE
L5
NA
NA
NA
F000
2 (W
alk-
in)
BIN
86R
1775
600
PO
OL
106
/15/
06 1
5:59
MU
SS
EL
5N
AN
AN
AF0
002
(Wal
k-in
)B
IN86
R17
7660
0 P
OO
L 2
06/1
5/06
15:
59M
US
SE
L5
NA
NA
NA
F000
2 (W
alk-
in)
BIN
86R
1777
600
PO
OL
306
/15/
06 1
5:59
MU
SS
EL
5N
AN
AN
AF0
002
(Wal
k-in
)B
IN86
R17
7870
0 P
OO
L 1
06/1
5/06
15:
59M
US
SE
L5
NA
NA
NA
F000
2 (W
alk-
in)
BIN
86R
1779
700
PO
OL
206
/15/
06 1
5:59
MU
SS
EL
5N
AN
AN
AF0
002
(Wal
k-in
)B
IN86
R17
8070
0 P
OO
L 3
06/1
5/06
16:
00M
US
SE
L5
NA
NA
NA
F000
2 (W
alk-
in)
BIN
86R
1781
800
PO
OL
106
/15/
06 1
6:00
MU
SS
EL
5N
AN
AN
AF0
002
(Wal
k-in
)B
IN86
R17
8280
0 P
OO
L 2
06/1
5/06
16:
00M
US
SE
L5
NA
NA
NA
F000
2 (W
alk-
in)
BIN
86R
1783
800
PO
OL
306
/15/
06 1
6:00
MU
SS
EL
5N
AN
AN
AF0
002
(Wal
k-in
)B
IN86
Prin
ted
on 6
/15/
2006
Pag
e 1
of 2

Sam
ple
Rec
eipt
For
m D
etai
ls
ShpN
oSH
P-0
60
615
-03
App
rove
d:A
uth
oriz
ed
Pro
ject
Nu
mbe
r:C
lien
t:N
IVA
Rec
eive
d by
:Ca
rlson
, Hea
ther
Dat
e/Ti
me
Rec
eive
d:Th
ursd
ay, J
une
15, 2
006
3:30
AM
No.
of
Ship
pin
g C
onta
iner
s:1
BD
O Id
:C
lient
Sam
ple
ID:
Col
lect
ion
Dat
e:Lo
gin
Dat
e:C
trs:
Mat
rix:
Tem
p:pH
:TR
C:
VOC
:St
ored
In:
Loc:
No:
Com
men
ts:
Bat
telle
Pro
ject
No:
NO
P40
521
Tota
l Sam
ples
:27
Prin
ted
on 6
/15/
2006
Pag
e 2
of 2

Attachment 2 Summary Data Graphs

Analyte Profile Histogram100 POOL
0.00
0.20
0.40
0.60
0.80
1.00
1.20
1.40
1.60
1.80
cis-Decalin
trans-Decalin
C1-D
ecalins
C2-D
ecalins
C3-D
ecalins
C4-D
ecalins
Benzo(b)thiophene
C1-benzo(b)thiophenes
C2-benzo(b)thiophenes
C3-benzo(b)thiophenes
C4-benzo(b)thiophenes
Naphthalene
C1-N
aphthalenes
C2-N
aphthalenes
C3-N
aphthalenes
C4-N
aphthalenes
Biphenyl
Acenaphthylene
Acenaphthene
Dibenzofuran
Fluorene
C1-Fluorenes
C2-Fluorenes
C3-Fluorenes
Anthracene
Phenanthrene
C1-P
henanthrenes/Anthracenes
C2-P
henanthrenes/Anthracenes
C3-P
henanthrenes/Anthracenes
C4-P
henanthrenes/Anthracenes
Dibenzothiophene
C1-D
ibenzothiophenes
C2-D
ibenzothiophenes
C3-D
ibenzothiophenes
C4-D
ibenzothiophenes
Fluoranthene
Pyrene
C1-Fluoranthenes/P
yrenes
C2-Fluoranthenes/P
yrenes
C3-Fluoranthenes/P
yrenes
Benzo(a)anthracene
Chrysene
C1-C
hrysenes
C2-C
hrysenes
C3-C
hrysenes
C4-C
hrysenes
Benzo(b)fluoranthene
Benzo(k)fluoranthene
Benzo(e)pyrene
Benzo(a)pyrene
Perylene
Indeno(1,2,3-cd)pyrene
Dibenz(a,h)anthracene
Benzo(g,h,i)perylene
Con
cent
ratio
n (n
g/g,
wet
wt)
Total Decalins
Total Naphthalenes
Total Phenanthrenes/Anthracenes
Total Dibenzothioph
enes
Total Pyrogenic
Analyte Profile Histogram200 POOL
0.00
0.10
0.20
0.30
0.40
0.50
0.60
0.70
0.80
0.90
cis-Decalin
trans-Decalin
C1-D
ecalins
C2-D
ecalins
C3-D
ecalins
C4-D
ecalins
Benzo(b)thiophene
C1-benzo(b)thiophenes
C2-benzo(b)thiophenes
C3-benzo(b)thiophenes
C4-benzo(b)thiophenes
Naphthalene
C1-N
aphthalenes
C2-N
aphthalenes
C3-N
aphthalenes
C4-N
aphthalenes
Biphenyl
Acenaphthylene
Acenaphthene
Dibenzofuran
Fluorene
C1-Fluorenes
C2-Fluorenes
C3-Fluorenes
Anthracene
Phenanthrene
C1-P
henanthrenes/Anthracenes
C2-P
henanthrenes/Anthracenes
C3-P
henanthrenes/Anthracenes
C4-P
henanthrenes/Anthracenes
Dibenzothiophene
C1-D
ibenzothiophenes
C2-D
ibenzothiophenes
C3-D
ibenzothiophenes
C4-D
ibenzothiophenes
Fluoranthene
Pyrene
C1-Fluoranthenes/P
yrenes
C2-Fluoranthenes/P
yrenes
C3-Fluoranthenes/P
yrenes
Benzo(a)anthracene
Chrysene
C1-C
hrysenes
C2-C
hrysenes
C3-C
hrysenes
C4-C
hrysenes
Benzo(b)fluoranthene
Benzo(k)fluoranthene
Benzo(e)pyrene
Benzo(a)pyrene
Perylene
Indeno(1,2,3-cd)pyrene
Dibenz(a,h)anthracene
Benzo(g,h,i)perylene
Con
cent
ratio
n (n
g/g,
wet
wt)
Total Decalins
Total Naphthalenes
Total Phenanthrenes/Anthracenes
Total Dibenzothioph
enes
Total Pyrogenic
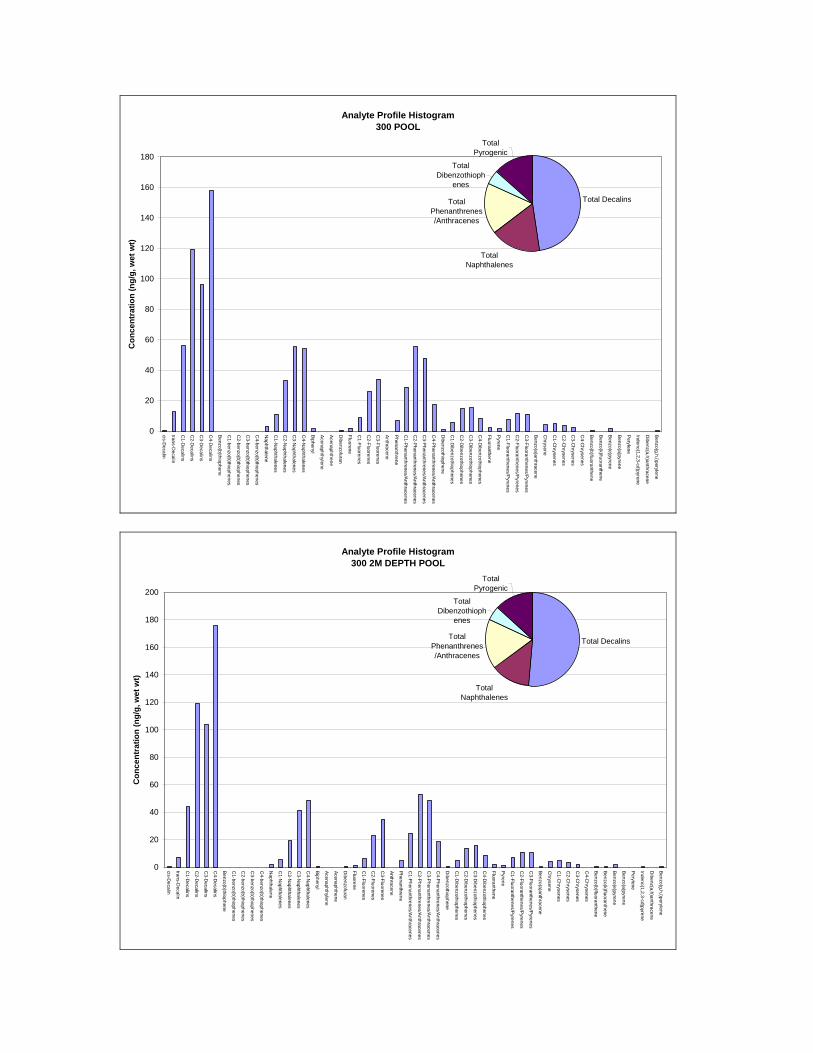
Analyte Profile Histogram300 POOL
0
20
40
60
80
100
120
140
160
180
cis-Decalin
trans-Decalin
C1-D
ecalins
C2-D
ecalins
C3-D
ecalins
C4-D
ecalins
Benzo(b)thiophene
C1-benzo(b)thiophenes
C2-benzo(b)thiophenes
C3-benzo(b)thiophenes
C4-benzo(b)thiophenes
Naphthalene
C1-N
aphthalenes
C2-N
aphthalenes
C3-N
aphthalenes
C4-N
aphthalenes
Biphenyl
Acenaphthylene
Acenaphthene
Dibenzofuran
Fluorene
C1-Fluorenes
C2-Fluorenes
C3-Fluorenes
Anthracene
Phenanthrene
C1-P
henanthrenes/Anthracenes
C2-P
henanthrenes/Anthracenes
C3-P
henanthrenes/Anthracenes
C4-P
henanthrenes/Anthracenes
Dibenzothiophene
C1-D
ibenzothiophenes
C2-D
ibenzothiophenes
C3-D
ibenzothiophenes
C4-D
ibenzothiophenes
Fluoranthene
Pyrene
C1-Fluoranthenes/P
yrenes
C2-Fluoranthenes/P
yrenes
C3-Fluoranthenes/P
yrenes
Benzo(a)anthracene
Chrysene
C1-C
hrysenes
C2-C
hrysenes
C3-C
hrysenes
C4-C
hrysenes
Benzo(b)fluoranthene
Benzo(k)fluoranthene
Benzo(e)pyrene
Benzo(a)pyrene
Perylene
Indeno(1,2,3-cd)pyrene
Dibenz(a,h)anthracene
Benzo(g,h,i)perylene
Con
cent
ratio
n (n
g/g,
wet
wt)
Total Decalins
Total Naphthalenes
Total Phenanthrenes/Anthracenes
Total Dibenzothioph
enes
Total Pyrogenic
Analyte Profile Histogram300 2M DEPTH POOL
0
20
40
60
80
100
120
140
160
180
200
cis-Decalin
trans-Decalin
C1-D
ecalins
C2-D
ecalins
C3-D
ecalins
C4-D
ecalins
Benzo(b)thiophene
C1-benzo(b)thiophenes
C2-benzo(b)thiophenes
C3-benzo(b)thiophenes
C4-benzo(b)thiophenes
Naphthalene
C1-N
aphthalenes
C2-N
aphthalenes
C3-N
aphthalenes
C4-N
aphthalenes
Biphenyl
Acenaphthylene
Acenaphthene
Dibenzofuran
Fluorene
C1-Fluorenes
C2-Fluorenes
C3-Fluorenes
Anthracene
Phenanthrene
C1-P
henanthrenes/Anthracenes
C2-P
henanthrenes/Anthracenes
C3-P
henanthrenes/Anthracenes
C4-P
henanthrenes/Anthracenes
Dibenzothiophene
C1-D
ibenzothiophenes
C2-D
ibenzothiophenes
C3-D
ibenzothiophenes
C4-D
ibenzothiophenes
Fluoranthene
Pyrene
C1-Fluoranthenes/P
yrenes
C2-Fluoranthenes/P
yrenes
C3-Fluoranthenes/P
yrenes
Benzo(a)anthracene
Chrysene
C1-C
hrysenes
C2-C
hrysenes
C3-C
hrysenes
C4-C
hrysenes
Benzo(b)fluoranthene
Benzo(k)fluoranthene
Benzo(e)pyrene
Benzo(a)pyrene
Perylene
Indeno(1,2,3-cd)pyrene
Dibenz(a,h)anthracene
Benzo(g,h,i)perylene
Con
cent
ratio
n (n
g/g,
wet
wt)
Total Decalins
Total Naphthalenes
Total Phenanthrenes/Anthracenes
Total Dibenzothioph
enes
Total Pyrogenic
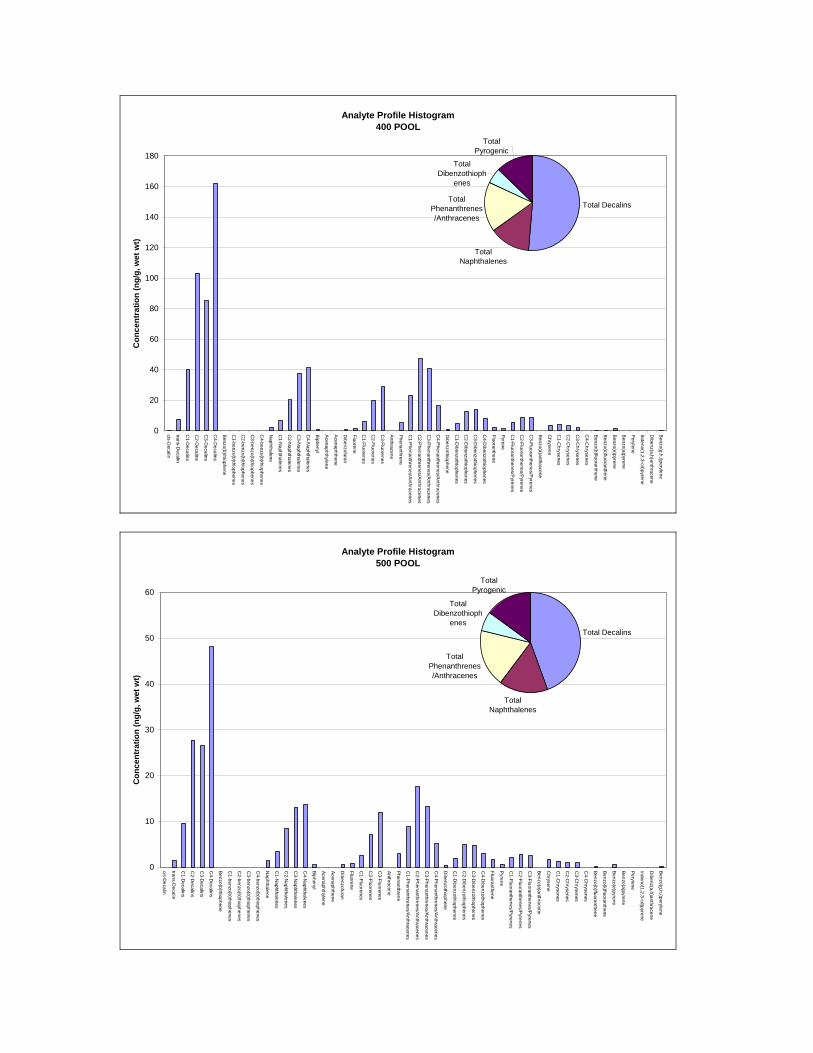
Analyte Profile Histogram400 POOL
0
20
40
60
80
100
120
140
160
180
cis-Decalin
trans-Decalin
C1-D
ecalins
C2-D
ecalins
C3-D
ecalins
C4-D
ecalins
Benzo(b)thiophene
C1-benzo(b)thiophenes
C2-benzo(b)thiophenes
C3-benzo(b)thiophenes
C4-benzo(b)thiophenes
Naphthalene
C1-N
aphthalenes
C2-N
aphthalenes
C3-N
aphthalenes
C4-N
aphthalenes
Biphenyl
Acenaphthylene
Acenaphthene
Dibenzofuran
Fluorene
C1-Fluorenes
C2-Fluorenes
C3-Fluorenes
Anthracene
Phenanthrene
C1-P
henanthrenes/Anthracenes
C2-P
henanthrenes/Anthracenes
C3-P
henanthrenes/Anthracenes
C4-P
henanthrenes/Anthracenes
Dibenzothiophene
C1-D
ibenzothiophenes
C2-D
ibenzothiophenes
C3-D
ibenzothiophenes
C4-D
ibenzothiophenes
Fluoranthene
Pyrene
C1-Fluoranthenes/P
yrenes
C2-Fluoranthenes/P
yrenes
C3-Fluoranthenes/P
yrenes
Benzo(a)anthracene
Chrysene
C1-C
hrysenes
C2-C
hrysenes
C3-C
hrysenes
C4-C
hrysenes
Benzo(b)fluoranthene
Benzo(k)fluoranthene
Benzo(e)pyrene
Benzo(a)pyrene
Perylene
Indeno(1,2,3-cd)pyrene
Dibenz(a,h)anthracene
Benzo(g,h,i)perylene
Con
cent
ratio
n (n
g/g,
wet
wt)
Total Decalins
Total Naphthalenes
Total Phenanthrenes/Anthracenes
Total Dibenzothioph
enes
Total Pyrogenic
Analyte Profile Histogram500 POOL
0
10
20
30
40
50
60
cis-Decalin
trans-Decalin
C1-D
ecalins
C2-D
ecalins
C3-D
ecalins
C4-D
ecalins
Benzo(b)thiophene
C1-benzo(b)thiophenes
C2-benzo(b)thiophenes
C3-benzo(b)thiophenes
C4-benzo(b)thiophenes
Naphthalene
C1-N
aphthalenes
C2-N
aphthalenes
C3-N
aphthalenes
C4-N
aphthalenes
Biphenyl
Acenaphthylene
Acenaphthene
Dibenzofuran
Fluorene
C1-Fluorenes
C2-Fluorenes
C3-Fluorenes
Anthracene
Phenanthrene
C1-P
henanthrenes/Anthracenes
C2-P
henanthrenes/Anthracenes
C3-P
henanthrenes/Anthracenes
C4-P
henanthrenes/Anthracenes
Dibenzothiophene
C1-D
ibenzothiophenes
C2-D
ibenzothiophenes
C3-D
ibenzothiophenes
C4-D
ibenzothiophenes
Fluoranthene
Pyrene
C1-Fluoranthenes/P
yrenes
C2-Fluoranthenes/P
yrenes
C3-Fluoranthenes/P
yrenes
Benzo(a)anthracene
Chrysene
C1-C
hrysenes
C2-C
hrysenes
C3-C
hrysenes
C4-C
hrysenes
Benzo(b)fluoranthene
Benzo(k)fluoranthene
Benzo(e)pyrene
Benzo(a)pyrene
Perylene
Indeno(1,2,3-cd)pyrene
Dibenz(a,h)anthracene
Benzo(g,h,i)perylene
Con
cent
ratio
n (n
g/g,
wet
wt)
Total Decalins
Total Naphthalenes
Total Phenanthrenes/Anthracenes
Total Dibenzothioph
enes
Total Pyrogenic

Analyte Profile Histogram600 POOL
0
20
40
60
80
100
120
cis-Decalin
trans-Decalin
C1-D
ecalins
C2-D
ecalins
C3-D
ecalins
C4-D
ecalins
Benzo(b)thiophene
C1-benzo(b)thiophenes
C2-benzo(b)thiophenes
C3-benzo(b)thiophenes
C4-benzo(b)thiophenes
Naphthalene
C1-N
aphthalenes
C2-N
aphthalenes
C3-N
aphthalenes
C4-N
aphthalenes
Biphenyl
Acenaphthylene
Acenaphthene
Dibenzofuran
Fluorene
C1-Fluorenes
C2-Fluorenes
C3-Fluorenes
Anthracene
Phenanthrene
C1-P
henanthrenes/Anthracenes
C2-P
henanthrenes/Anthracenes
C3-P
henanthrenes/Anthracenes
C4-P
henanthrenes/Anthracenes
Dibenzothiophene
C1-D
ibenzothiophenes
C2-D
ibenzothiophenes
C3-D
ibenzothiophenes
C4-D
ibenzothiophenes
Fluoranthene
Pyrene
C1-Fluoranthenes/P
yrenes
C2-Fluoranthenes/P
yrenes
C3-Fluoranthenes/P
yrenes
Benzo(a)anthracene
Chrysene
C1-C
hrysenes
C2-C
hrysenes
C3-C
hrysenes
C4-C
hrysenes
Benzo(b)fluoranthene
Benzo(k)fluoranthene
Benzo(e)pyrene
Benzo(a)pyrene
Perylene
Indeno(1,2,3-cd)pyrene
Dibenz(a,h)anthracene
Benzo(g,h,i)perylene
Con
cent
ratio
n (n
g/g,
wet
wt)
Total Decalins
Total Naphthalenes
Total Phenanthrenes/Anthracenes
Total Dibenzothioph
enes
Total Pyrogenic
Analyte Profile Histogram700 POOL
0
10
20
30
40
50
60
70
80
90
cis-Decalin
trans-Decalin
C1-D
ecalins
C2-D
ecalins
C3-D
ecalins
C4-D
ecalins
Benzo(b)thiophene
C1-benzo(b)thiophenes
C2-benzo(b)thiophenes
C3-benzo(b)thiophenes
C4-benzo(b)thiophenes
Naphthalene
C1-N
aphthalenes
C2-N
aphthalenes
C3-N
aphthalenes
C4-N
aphthalenes
Biphenyl
Acenaphthylene
Acenaphthene
Dibenzofuran
Fluorene
C1-Fluorenes
C2-Fluorenes
C3-Fluorenes
Anthracene
Phenanthrene
C1-P
henanthrenes/Anthracenes
C2-P
henanthrenes/Anthracenes
C3-P
henanthrenes/Anthracenes
C4-P
henanthrenes/Anthracenes
Dibenzothiophene
C1-D
ibenzothiophenes
C2-D
ibenzothiophenes
C3-D
ibenzothiophenes
C4-D
ibenzothiophenes
Fluoranthene
Pyrene
C1-Fluoranthenes/P
yrenes
C2-Fluoranthenes/P
yrenes
C3-Fluoranthenes/P
yrenes
Benzo(a)anthracene
Chrysene
C1-C
hrysenes
C2-C
hrysenes
C3-C
hrysenes
C4-C
hrysenes
Benzo(b)fluoranthene
Benzo(k)fluoranthene
Benzo(e)pyrene
Benzo(a)pyrene
Perylene
Indeno(1,2,3-cd)pyrene
Dibenz(a,h)anthracene
Benzo(g,h,i)perylene
Con
cent
ratio
n (n
g/g,
wet
wt)
Total Decalins
Total Naphthalenes
Total Phenanthrenes/Anthracenes
Total Dibenzothioph
enes
Total Pyrogenic

Analyte Profile Histogram800 POOL
0
20
40
60
80
100
120
140
160
cis-Decalin
trans-Decalin
C1-D
ecalins
C2-D
ecalins
C3-D
ecalins
C4-D
ecalins
Benzo(b)thiophene
C1-benzo(b)thiophenes
C2-benzo(b)thiophenes
C3-benzo(b)thiophenes
C4-benzo(b)thiophenes
Naphthalene
C1-N
aphthalenes
C2-N
aphthalenes
C3-N
aphthalenes
C4-N
aphthalenes
Biphenyl
Acenaphthylene
Acenaphthene
Dibenzofuran
Fluorene
C1-Fluorenes
C2-Fluorenes
C3-Fluorenes
Anthracene
Phenanthrene
C1-P
henanthrenes/Anthracenes
C2-P
henanthrenes/Anthracenes
C3-P
henanthrenes/Anthracenes
C4-P
henanthrenes/Anthracenes
Dibenzothiophene
C1-D
ibenzothiophenes
C2-D
ibenzothiophenes
C3-D
ibenzothiophenes
C4-D
ibenzothiophenes
Fluoranthene
Pyrene
C1-Fluoranthenes/P
yrenes
C2-Fluoranthenes/P
yrenes
C3-Fluoranthenes/P
yrenes
Benzo(a)anthracene
Chrysene
C1-C
hrysenes
C2-C
hrysenes
C3-C
hrysenes
C4-C
hrysenes
Benzo(b)fluoranthene
Benzo(k)fluoranthene
Benzo(e)pyrene
Benzo(a)pyrene
Perylene
Indeno(1,2,3-cd)pyrene
Dibenz(a,h)anthracene
Benzo(g,h,i)perylene
Con
cent
ratio
n (n
g/g,
wet
wt)
Total Decalins
Total Naphthalenes
Total Phenanthrenes/Anthracenes
Total Dibenzothioph
enes
Total Pyrogenic

Attachment 3 PAH Data

Project Client: Norwegian Institute for Water Research (NIVA)Project Name: NIVA - Analysis of Blue MusselsProject Number: N006783-0001
Client ID 100 POOL 1 100 POOL 2 100 POOL 3Battelle Batch ID 06-0239 06-0239 06-0239Battelle ID R1757-P R1758-P R1759-PCollection Date 06/23/06 06/23/06 06/23/06Extraction Date 06/23/06 06/23/06 06/23/06Analysis Date 06/29/06 06/29/06 06/29/06Moisture Content (%) 83.84 84.01 83.91Matrix MUSSEL MUSSEL MUSSEL AVERAGE %RSDLipid Content (%, dry weight) 9.16 9.45 10.58 9.73 7.71Sample weight (g, wet weight) 4.73 10.05 10.33 8.37 37.70Pre-injection Volume (uL) 500 500 500Dilution Factor 1.754 1.754 1.75Reporting Limit 0.927 0.436 0.424Reporting Unit ng/g, wet weight ng/g, wet weight ng/g, wet weight
cis-Decalin U U U NA NAtrans-Decalin U U U NA NAC1-Decalins U U U NA NAC2-Decalins U U U NA NAC3-Decalins U U U NA NAC4-Decalins U U U NA NABenzo(b)thiophene U U U NA NAC1-benzo(b)thiophenes U U U NA NAC2-benzo(b)thiophenes U U U NA NAC3-benzo(b)thiophenes U U U NA NAC4-benzo(b)thiophenes U U U NA NANaphthalene 1.38 B 0.81 B 0.65 B 0.95 40.53C1-Naphthalenes 0.63 J 0.24 J 0.27 J 0.38 57.11C2-Naphthalenes U U U NA NAC3-Naphthalenes U U U NA NAC4-Naphthalenes U U U NA NABiphenyl 0.34 J 0.09 J 0.25 J 0.23 55.86Acenaphthylene U U U NA NAAcenaphthene U U U NA NADibenzofuran 0.71 J 0.6 0.71 0.67 9.43Fluorene 0.52 J 0.42 J 0.46 0.47 10.79C1-Fluorenes 0.6 J 0.52 0.49 0.54 10.60C2-Fluorenes 1.58 1.05 0.83 1.15 33.43C3-Fluorenes U U U NA NAAnthracene 0.09 J 0.04 J 0.07 J 0.07 37.75Phenanthrene 1.49 B 0.93 B 0.93 B 1.12 28.95C1-Phenanthrenes/Anthracenes 1.07 B 0.77 B 0.69 B 0.84 23.75C2-Phenanthrenes/Anthracenes 0.99 0.81 0.63 0.81 22.22C3-Phenanthrenes/Anthracenes 0.54 J 0.43 J 0.51 0.49 11.53C4-Phenanthrenes/Anthracenes U U U NA NADibenzothiophene 0.13 J 0.07 J 0.08 J 0.09 34.44C1-Dibenzothiophenes 0.6 J 0.35 J 0.26 J 0.40 43.68C2-Dibenzothiophenes 0.87 J 0.54 0.55 0.65 28.73C3-Dibenzothiophenes U U U NA NAC4-Dibenzothiophenes U U U NA NAFluoranthene 2.24 1.49 1.33 1.69 28.80Pyrene 1.37 0.31 J 0.29 J 0.66 94.09C1-Fluoranthenes/Pyrenes 0.56 J 0.32 J 0.29 J 0.39 37.95C2-Fluoranthenes/Pyrenes U U U NA NAC3-Fluoranthenes/Pyrenes U U U NA NABenzo(a)anthracene U U U NA NAChrysene 1 0.62 0.49 0.70 37.68C1-Chrysenes 0.16 J 0.07 J 0.04 J 0.09 69.39C2-Chrysenes U U U NA NAC3-Chrysenes U U U NA NAC4-Chrysenes U U U NA NA
Surrogate CorrectedAnalyzed by Sisson, Jeannine
7/20/2006 Final - Wet: T06-0239MS-Master_157-Final.xls

Project Client: Norwegian Institute for Water Research (NIVA)Project Name: NIVA - Analysis of Blue MusselsProject Number: N006783-0001
Client ID 100 POOL 1 100 POOL 2 100 POOL 3Battelle Batch ID 06-0239 06-0239 06-0239Battelle ID R1757-P R1758-P R1759-PCollection Date 06/23/06 06/23/06 06/23/06Extraction Date 06/23/06 06/23/06 06/23/06Analysis Date 06/29/06 06/29/06 06/29/06Moisture Content (%) 83.84 84.01 83.91Matrix MUSSEL MUSSEL MUSSEL AVERAGE %RSDLipid Content (%, dry weight) 9.16 9.45 10.58 9.73 7.71Sample weight (g, wet weight) 4.73 10.05 10.33 8.37 37.70Pre-injection Volume (uL) 500 500 500Dilution Factor 1.754 1.754 1.75Reporting Limit 0.927 0.436 0.424Reporting Unit ng/g, wet weight ng/g, wet weight ng/g, wet weight
Benzo(b)fluoranthene U U U NA NABenzo(k)fluoranthene U U U NA NABenzo(e)pyrene U U U NA NABenzo(a)pyrene U U U NA NAPerylene U U U NA NAIndeno(1,2,3-cd)pyrene 0.25 J 0.05 J 0.04 J 0.11 104.53Dibenz(a,h)anthracene U U U NA NABenzo(g,h,i)perylene 0.31 J 0.05 J 0.06 J 0.14 105.22
Total Decalins 0 0 0 0.00 NATotal Naphthalenes 2.01 1.05 0.92 1.33 44.88Total Phenanthrenes/Anthracenes 4.18 2.98 2.83 3.33 22.22Total Dibenzothiophenes 1.6 0.96 0.89 1.15 34.02Total PAH (from naphthalene) 17.43 10.58 9.92 12.64 32.89
Surrogate Recoveries (%)
Naphthalene-d8 71 62 73Acenaphthene-d10 70 62 70Phenanthrene-d10 90 80 91Benzo(a)pyrene-d12 71 62 69
B = Result < 5 x procedural blankJ = Detected below Reporting Limit.U = Not Detected.N = QC value outside QC criteria.NA = Not Applicable
Surrogate CorrectedAnalyzed by Sisson, Jeannine
7/20/2006 Final - Wet: T06-0239MS-Master_157-Final.xls

Project Client: Norwegian Institute for Water Research (NIVA)Project Name: NIVA - Analysis of Blue MusselsProject Number: N006783-0001
Client IDBattelle Batch IDBattelle IDCollection DateExtraction DateAnalysis DateMoisture Content (%)MatrixLipid Content (%, dry weight)Sample weight (g, wet weight)Pre-injection Volume (uL)Dilution FactorReporting LimitReporting Unit
cis-Decalintrans-DecalinC1-DecalinsC2-DecalinsC3-DecalinsC4-DecalinsBenzo(b)thiopheneC1-benzo(b)thiophenesC2-benzo(b)thiophenesC3-benzo(b)thiophenesC4-benzo(b)thiophenesNaphthaleneC1-NaphthalenesC2-NaphthalenesC3-NaphthalenesC4-NaphthalenesBiphenylAcenaphthyleneAcenaphtheneDibenzofuranFluoreneC1-FluorenesC2-FluorenesC3-FluorenesAnthracenePhenanthreneC1-Phenanthrenes/AnthracenesC2-Phenanthrenes/AnthracenesC3-Phenanthrenes/AnthracenesC4-Phenanthrenes/AnthracenesDibenzothiopheneC1-DibenzothiophenesC2-DibenzothiophenesC3-DibenzothiophenesC4-DibenzothiophenesFluoranthenePyreneC1-Fluoranthenes/PyrenesC2-Fluoranthenes/PyrenesC3-Fluoranthenes/PyrenesBenzo(a)anthraceneChryseneC1-ChrysenesC2-ChrysenesC3-ChrysenesC4-Chrysenes
200 POOL 1 200 POOL 2 200 POOL 306-0239 06-0239 06-0239R1760-P R1761-P R1762-P06/23/06 06/23/06 06/23/0606/23/06 06/23/06 06/23/0606/29/06 06/29/06 06/29/06
86.35 87.38 86.76MUSSEL MUSSEL MUSSEL AVERAGE %RSD
8.72 8.39 10.14 9.08 10.2415.08 15.19 10.51 13.59 19.65
500 500 5001.754 1.754 1.7540.291 0.289 0.417
ng/g, wet weight ng/g, wet weight ng/g, wet weight
U U U NA NAU U U NA NAU U U NA NAU U U NA NAU U U NA NAU U U NA NAU U U NA NAU U U NA NAU U U NA NAU U U NA NAU U U NA NA
0.47 B 0.35 B 0.6 B 0.47 26.420.15 J 0.14 J 0.28 J 0.19 41.11
U U U NA NAU U U NA NAU U U NA NA
0.14 J 0.11 J 0.12 J 0.12 12.39U U U NA NAU U 0.23 J 0.23 NA
0.33 0.32 0.41 J 0.35 13.960.25 J 0.15 J 0.26 J 0.22 27.650.27 J U U 0.27 NA0.84 U 0.79 0.82 4.34
U U U NA NAU U U NA NA
0.56 B 0.49 B 0.53 B 0.53 6.670.51 B 0.4 B 0.53 B 0.48 14.580.57 0.62 0.53 0.57 7.860.61 0.53 0.51 0.55 9.62
U U U NA NA0.08 J 0.06 J 0.06 J 0.07 17.320.22 J 0.18 J 0.27 J 0.22 20.19
0.4 0.35 0.41 J 0.39 8.31U U U NA NAU U U NA NA
0.83 0.61 0.76 0.73 15.330.23 J 0.22 J 0.25 J 0.23 6.550.19 J 0.09 J 0.22 J 0.17 40.84
U U U NA NAU U U NA NA
0.02 J 0.01 J 0.02 J 0.02 34.640.38 0.42 0.3 J 0.37 16.660.05 J 0.04 J 0.03 J 0.04 25.00
U U U NA NAU U U NA NAU U U NA NA
Surrogate CorrectedAnalyzed by Sisson, Jeannine
7/20/2006 Final - Wet: T06-0239MS-Master_157-Final.xls

Project Client: Norwegian Institute for Water Research (NIVA)Project Name: NIVA - Analysis of Blue MusselsProject Number: N006783-0001
Client IDBattelle Batch IDBattelle IDCollection DateExtraction DateAnalysis DateMoisture Content (%)MatrixLipid Content (%, dry weight)Sample weight (g, wet weight)Pre-injection Volume (uL)Dilution FactorReporting LimitReporting Unit
Benzo(b)fluorantheneBenzo(k)fluorantheneBenzo(e)pyreneBenzo(a)pyrenePeryleneIndeno(1,2,3-cd)pyreneDibenz(a,h)anthraceneBenzo(g,h,i)perylene
Total DecalinsTotal NaphthalenesTotal Phenanthrenes/AnthracenesTotal DibenzothiophenesTotal PAH (from naphthalene)
Surrogate Recoveries (%)
Naphthalene-d8Acenaphthene-d10Phenanthrene-d10Benzo(a)pyrene-d12
B = Result < 5 x procedural blankJ = Detected below Reporting Limit.U = Not Detected.N = QC value outside QC criteria.NA = Not Applicable
200 POOL 1 200 POOL 2 200 POOL 306-0239 06-0239 06-0239R1760-P R1761-P R1762-P06/23/06 06/23/06 06/23/0606/23/06 06/23/06 06/23/0606/29/06 06/29/06 06/29/06
86.35 87.38 86.76MUSSEL MUSSEL MUSSEL AVERAGE %RSD
8.72 8.39 10.14 9.08 10.2415.08 15.19 10.51 13.59 19.65
500 500 5001.754 1.754 1.7540.291 0.289 0.417
ng/g, wet weight ng/g, wet weight ng/g, wet weight
U 0.09 J 0.19 J 0.14 50.51U U U NA NA
0.06 J U U 0.06 NAU U U NA NAU U U NA NA
0.05 J 0.04 J 0.04 J 0.04 13.32U U U NA NA
0.05 J 0.05 J U 0.05 0.00
0 0 0 0.00 NA0.62 0.49 0.88 0.66 29.942.25 2.04 2.1 2.13 5.08
0.7 0.59 0.74 0.68 11.487.26 5.27 7.34 6.62 17.71
71 64 7070 64 6990 82 8966 60 64
Surrogate CorrectedAnalyzed by Sisson, Jeannine
7/20/2006 Final - Wet: T06-0239MS-Master_157-Final.xls
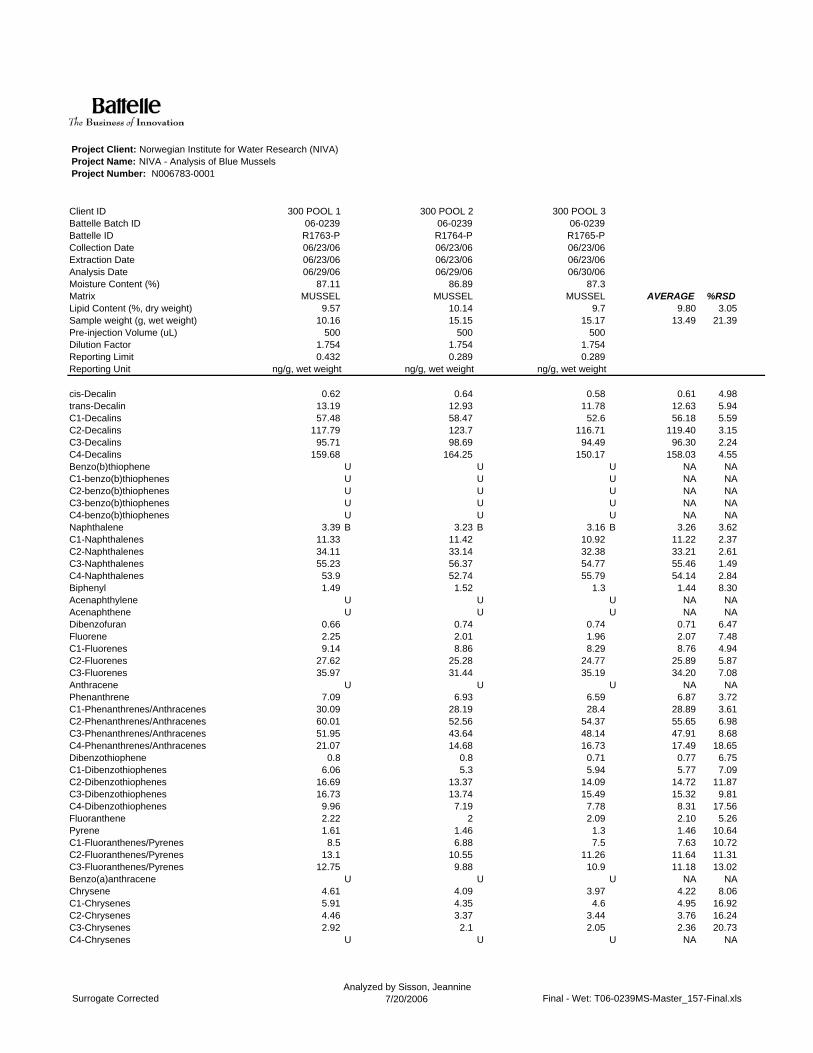
Project Client: Norwegian Institute for Water Research (NIVA)Project Name: NIVA - Analysis of Blue MusselsProject Number: N006783-0001
Client IDBattelle Batch IDBattelle IDCollection DateExtraction DateAnalysis DateMoisture Content (%)MatrixLipid Content (%, dry weight)Sample weight (g, wet weight)Pre-injection Volume (uL)Dilution FactorReporting LimitReporting Unit
cis-Decalintrans-DecalinC1-DecalinsC2-DecalinsC3-DecalinsC4-DecalinsBenzo(b)thiopheneC1-benzo(b)thiophenesC2-benzo(b)thiophenesC3-benzo(b)thiophenesC4-benzo(b)thiophenesNaphthaleneC1-NaphthalenesC2-NaphthalenesC3-NaphthalenesC4-NaphthalenesBiphenylAcenaphthyleneAcenaphtheneDibenzofuranFluoreneC1-FluorenesC2-FluorenesC3-FluorenesAnthracenePhenanthreneC1-Phenanthrenes/AnthracenesC2-Phenanthrenes/AnthracenesC3-Phenanthrenes/AnthracenesC4-Phenanthrenes/AnthracenesDibenzothiopheneC1-DibenzothiophenesC2-DibenzothiophenesC3-DibenzothiophenesC4-DibenzothiophenesFluoranthenePyreneC1-Fluoranthenes/PyrenesC2-Fluoranthenes/PyrenesC3-Fluoranthenes/PyrenesBenzo(a)anthraceneChryseneC1-ChrysenesC2-ChrysenesC3-ChrysenesC4-Chrysenes
300 POOL 1 300 POOL 2 300 POOL 306-0239 06-0239 06-0239R1763-P R1764-P R1765-P06/23/06 06/23/06 06/23/0606/23/06 06/23/06 06/23/0606/29/06 06/29/06 06/30/06
87.11 86.89 87.3MUSSEL MUSSEL MUSSEL AVERAGE %RSD
9.57 10.14 9.7 9.80 3.0510.16 15.15 15.17 13.49 21.39
500 500 5001.754 1.754 1.7540.432 0.289 0.289
ng/g, wet weight ng/g, wet weight ng/g, wet weight
0.62 0.64 0.58 0.61 4.9813.19 12.93 11.78 12.63 5.9457.48 58.47 52.6 56.18 5.59
117.79 123.7 116.71 119.40 3.1595.71 98.69 94.49 96.30 2.24
159.68 164.25 150.17 158.03 4.55U U U NA NAU U U NA NAU U U NA NAU U U NA NAU U U NA NA
3.39 B 3.23 B 3.16 B 3.26 3.6211.33 11.42 10.92 11.22 2.3734.11 33.14 32.38 33.21 2.6155.23 56.37 54.77 55.46 1.49
53.9 52.74 55.79 54.14 2.841.49 1.52 1.3 1.44 8.30
U U U NA NAU U U NA NA
0.66 0.74 0.74 0.71 6.472.25 2.01 1.96 2.07 7.489.14 8.86 8.29 8.76 4.94
27.62 25.28 24.77 25.89 5.8735.97 31.44 35.19 34.20 7.08
U U U NA NA7.09 6.93 6.59 6.87 3.72
30.09 28.19 28.4 28.89 3.6160.01 52.56 54.37 55.65 6.9851.95 43.64 48.14 47.91 8.6821.07 14.68 16.73 17.49 18.65
0.8 0.8 0.71 0.77 6.756.06 5.3 5.94 5.77 7.09
16.69 13.37 14.09 14.72 11.8716.73 13.74 15.49 15.32 9.81
9.96 7.19 7.78 8.31 17.562.22 2 2.09 2.10 5.261.61 1.46 1.3 1.46 10.64
8.5 6.88 7.5 7.63 10.7213.1 10.55 11.26 11.64 11.31
12.75 9.88 10.9 11.18 13.02U U U NA NA
4.61 4.09 3.97 4.22 8.065.91 4.35 4.6 4.95 16.924.46 3.37 3.44 3.76 16.242.92 2.1 2.05 2.36 20.73
U U U NA NA
Surrogate CorrectedAnalyzed by Sisson, Jeannine
7/20/2006 Final - Wet: T06-0239MS-Master_157-Final.xls
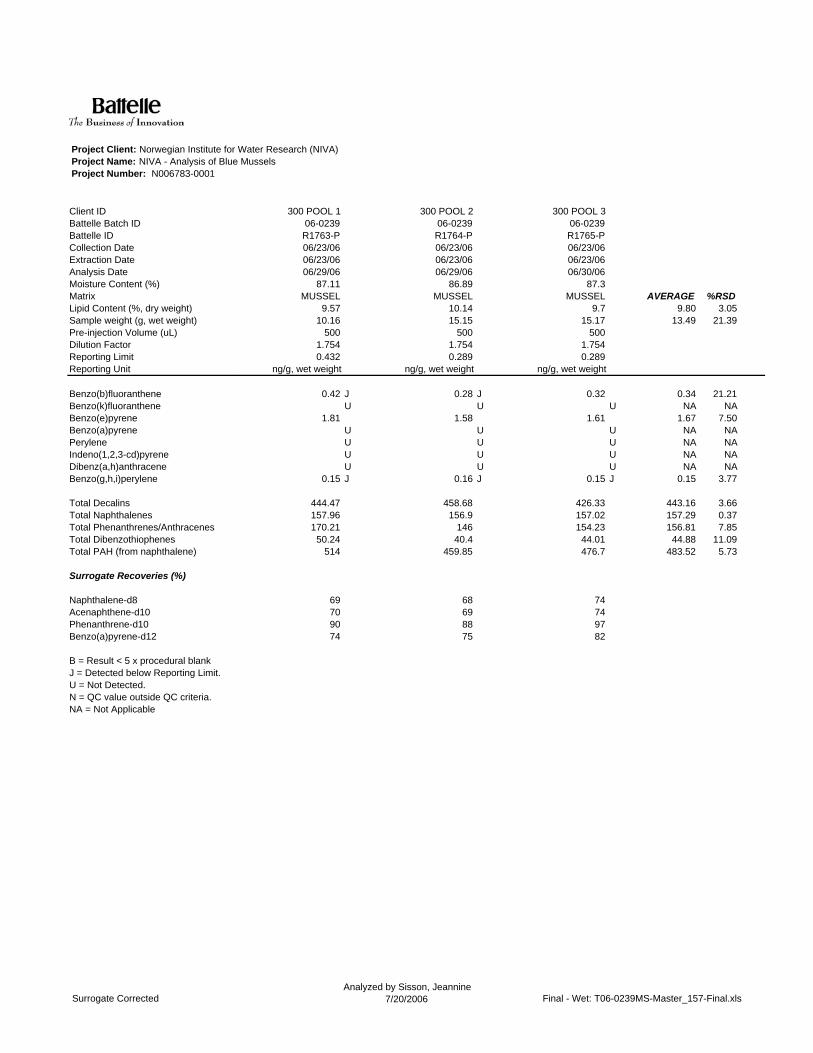
Project Client: Norwegian Institute for Water Research (NIVA)Project Name: NIVA - Analysis of Blue MusselsProject Number: N006783-0001
Client IDBattelle Batch IDBattelle IDCollection DateExtraction DateAnalysis DateMoisture Content (%)MatrixLipid Content (%, dry weight)Sample weight (g, wet weight)Pre-injection Volume (uL)Dilution FactorReporting LimitReporting Unit
Benzo(b)fluorantheneBenzo(k)fluorantheneBenzo(e)pyreneBenzo(a)pyrenePeryleneIndeno(1,2,3-cd)pyreneDibenz(a,h)anthraceneBenzo(g,h,i)perylene
Total DecalinsTotal NaphthalenesTotal Phenanthrenes/AnthracenesTotal DibenzothiophenesTotal PAH (from naphthalene)
Surrogate Recoveries (%)
Naphthalene-d8Acenaphthene-d10Phenanthrene-d10Benzo(a)pyrene-d12
B = Result < 5 x procedural blankJ = Detected below Reporting Limit.U = Not Detected.N = QC value outside QC criteria.NA = Not Applicable
300 POOL 1 300 POOL 2 300 POOL 306-0239 06-0239 06-0239R1763-P R1764-P R1765-P06/23/06 06/23/06 06/23/0606/23/06 06/23/06 06/23/0606/29/06 06/29/06 06/30/06
87.11 86.89 87.3MUSSEL MUSSEL MUSSEL AVERAGE %RSD
9.57 10.14 9.7 9.80 3.0510.16 15.15 15.17 13.49 21.39
500 500 5001.754 1.754 1.7540.432 0.289 0.289
ng/g, wet weight ng/g, wet weight ng/g, wet weight
0.42 J 0.28 J 0.32 0.34 21.21U U U NA NA
1.81 1.58 1.61 1.67 7.50U U U NA NAU U U NA NAU U U NA NAU U U NA NA
0.15 J 0.16 J 0.15 J 0.15 3.77
444.47 458.68 426.33 443.16 3.66157.96 156.9 157.02 157.29 0.37170.21 146 154.23 156.81 7.85
50.24 40.4 44.01 44.88 11.09514 459.85 476.7 483.52 5.73
69 68 7470 69 7490 88 9774 75 82
Surrogate CorrectedAnalyzed by Sisson, Jeannine
7/20/2006 Final - Wet: T06-0239MS-Master_157-Final.xls

Project Client: Norwegian Institute for Water Research (NIVA)Project Name: NIVA - Analysis of Blue MusselsProject Number: N006783-0001
Client IDBattelle Batch IDBattelle IDCollection DateExtraction DateAnalysis DateMoisture Content (%)MatrixLipid Content (%, dry weight)Sample weight (g, wet weight)Pre-injection Volume (uL)Dilution FactorReporting LimitReporting Unit
cis-Decalintrans-DecalinC1-DecalinsC2-DecalinsC3-DecalinsC4-DecalinsBenzo(b)thiopheneC1-benzo(b)thiophenesC2-benzo(b)thiophenesC3-benzo(b)thiophenesC4-benzo(b)thiophenesNaphthaleneC1-NaphthalenesC2-NaphthalenesC3-NaphthalenesC4-NaphthalenesBiphenylAcenaphthyleneAcenaphtheneDibenzofuranFluoreneC1-FluorenesC2-FluorenesC3-FluorenesAnthracenePhenanthreneC1-Phenanthrenes/AnthracenesC2-Phenanthrenes/AnthracenesC3-Phenanthrenes/AnthracenesC4-Phenanthrenes/AnthracenesDibenzothiopheneC1-DibenzothiophenesC2-DibenzothiophenesC3-DibenzothiophenesC4-DibenzothiophenesFluoranthenePyreneC1-Fluoranthenes/PyrenesC2-Fluoranthenes/PyrenesC3-Fluoranthenes/PyrenesBenzo(a)anthraceneChryseneC1-ChrysenesC2-ChrysenesC3-ChrysenesC4-Chrysenes
300 2M DEPTH POOL 1
300 2M DEPTH POOL 2
300 2M DEPTH POOL 3
R1766-P R1767-P R1768-P06/23/06 06/23/06 06/23/0606/23/06 06/23/06 06/23/0606/30/06 06/30/06 06/30/06
86.36 87.11 87.27MUSSEL MUSSEL MUSSEL AVERAGE %RSD
9.93 8.25 9.6 9.26 9.6115.71 15.45 15.20 15.45 1.65
500 500 5001.754 1.75 1.7540.279 0.283 0.288
ng/g, wet weight ng/g, wet weight ng/g, wet weight
0.27 J 0.21 J 0.18 J 0.22 20.839.83 5.73 6.02 7.19 31.81
57.66 38.69 35.64 44.00 27.12150.43 115.68 91.33 119.15 24.93132.43 102.5 76.8 103.91 26.79228.55 170.43 128.08 175.69 28.71
U U U NA NAU U U NA NAU U U NA NAU U U NA NAU U U NA NA
2.32 B 1.65 B 1.6 B 1.86 21.656.74 4.4 4.69 5.28 24.17
23.98 17.82 15.83 19.21 22.1252.34 39.25 32.89 41.49 23.9063.64 46.49 35.95 48.69 28.70
0.92 0.82 0.68 0.81 14.94U U U NA NAU U U NA NA
0.79 0.47 0.48 0.58 31.371.33 1.17 1.12 1.21 9.098.28 6.03 4.47 6.26 30.60
29.05 23.8 16.18 23.01 28.1245.98 34.34 24.13 34.82 31.40
U U U NA NA6.15 4.34 4.09 4.86 23.13
31.64 23.29 18.83 24.59 26.4567.58 51.99 39.37 52.98 26.6761.09 48.91 35.4 48.47 26.5124.57 17.06 13.55 18.39 30.61
0.64 0.53 0.45 0.54 17.676.47 4.62 3.92 5.00 26.33
16.92 13.78 10.63 13.78 22.8320.16 15.8 11.06 15.67 29.0410.61 9.25 6.28 8.71 25.41
2.57 1.77 1.82 2.05 21.831.65 1.57 0.89 1.37 30.488.87 7.22 5.25 7.11 25.48
13.56 11.29 8.02 10.96 25.4213.11 11.05 7.57 10.58 26.47
U U 0.05 J 0.05 NA5.09 3.88 3.13 4.03 24.525.96 4.51 3.77 4.75 23.47
4.3 3.52 2.56 3.46 25.192.09 2.14 1.8 2.01 9.13
U U U NA NA
Surrogate CorrectedAnalyzed by Sisson, Jeannine
7/20/2006 Final - Wet: T06-0239MS-Master_157-Final.xls
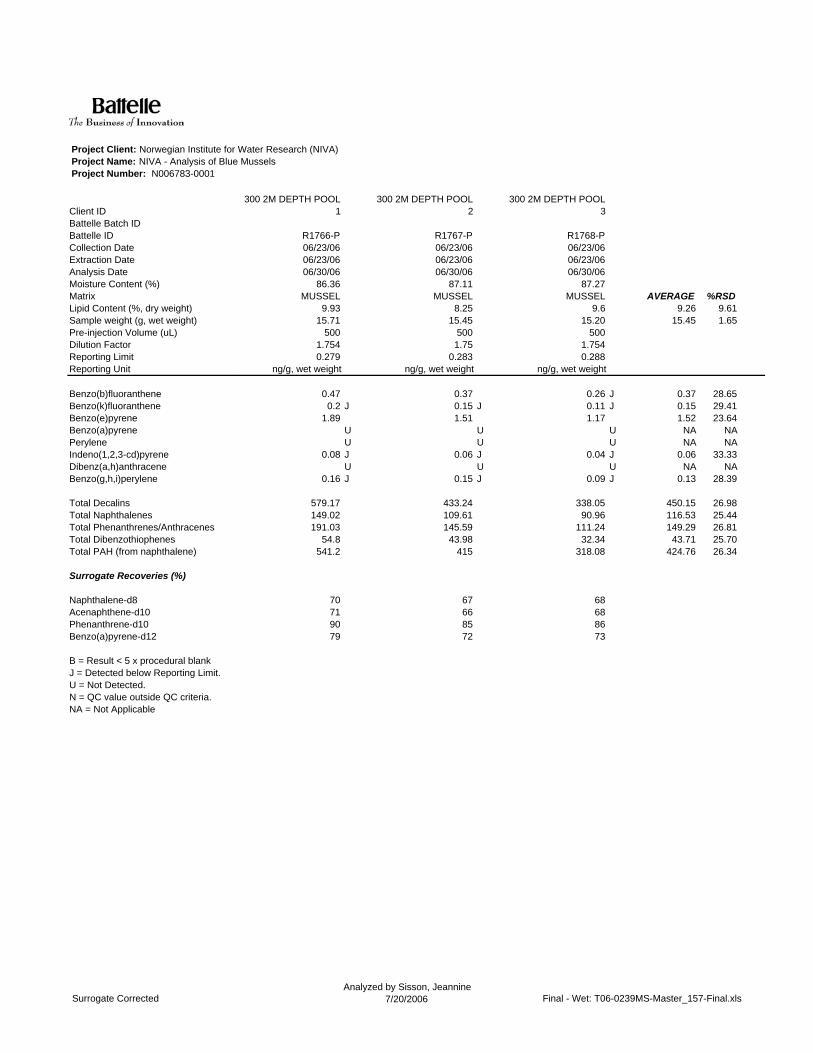
Project Client: Norwegian Institute for Water Research (NIVA)Project Name: NIVA - Analysis of Blue MusselsProject Number: N006783-0001
Client IDBattelle Batch IDBattelle IDCollection DateExtraction DateAnalysis DateMoisture Content (%)MatrixLipid Content (%, dry weight)Sample weight (g, wet weight)Pre-injection Volume (uL)Dilution FactorReporting LimitReporting Unit
Benzo(b)fluorantheneBenzo(k)fluorantheneBenzo(e)pyreneBenzo(a)pyrenePeryleneIndeno(1,2,3-cd)pyreneDibenz(a,h)anthraceneBenzo(g,h,i)perylene
Total DecalinsTotal NaphthalenesTotal Phenanthrenes/AnthracenesTotal DibenzothiophenesTotal PAH (from naphthalene)
Surrogate Recoveries (%)
Naphthalene-d8Acenaphthene-d10Phenanthrene-d10Benzo(a)pyrene-d12
B = Result < 5 x procedural blankJ = Detected below Reporting Limit.U = Not Detected.N = QC value outside QC criteria.NA = Not Applicable
300 2M DEPTH POOL 1
300 2M DEPTH POOL 2
300 2M DEPTH POOL 3
R1766-P R1767-P R1768-P06/23/06 06/23/06 06/23/0606/23/06 06/23/06 06/23/0606/30/06 06/30/06 06/30/06
86.36 87.11 87.27MUSSEL MUSSEL MUSSEL AVERAGE %RSD
9.93 8.25 9.6 9.26 9.6115.71 15.45 15.20 15.45 1.65
500 500 5001.754 1.75 1.7540.279 0.283 0.288
ng/g, wet weight ng/g, wet weight ng/g, wet weight
0.47 0.37 0.26 J 0.37 28.650.2 J 0.15 J 0.11 J 0.15 29.41
1.89 1.51 1.17 1.52 23.64U U U NA NAU U U NA NA
0.08 J 0.06 J 0.04 J 0.06 33.33U U U NA NA
0.16 J 0.15 J 0.09 J 0.13 28.39
579.17 433.24 338.05 450.15 26.98149.02 109.61 90.96 116.53 25.44191.03 145.59 111.24 149.29 26.81
54.8 43.98 32.34 43.71 25.70541.2 415 318.08 424.76 26.34
70 67 6871 66 6890 85 8679 72 73
Surrogate CorrectedAnalyzed by Sisson, Jeannine
7/20/2006 Final - Wet: T06-0239MS-Master_157-Final.xls

Project Client: Norwegian Institute for Water Research (NIVA)Project Name: NIVA - Analysis of Blue MusselsProject Number: N006783-0001
Client IDBattelle Batch IDBattelle IDCollection DateExtraction DateAnalysis DateMoisture Content (%)MatrixLipid Content (%, dry weight)Sample weight (g, wet weight)Pre-injection Volume (uL)Dilution FactorReporting LimitReporting Unit
cis-Decalintrans-DecalinC1-DecalinsC2-DecalinsC3-DecalinsC4-DecalinsBenzo(b)thiopheneC1-benzo(b)thiophenesC2-benzo(b)thiophenesC3-benzo(b)thiophenesC4-benzo(b)thiophenesNaphthaleneC1-NaphthalenesC2-NaphthalenesC3-NaphthalenesC4-NaphthalenesBiphenylAcenaphthyleneAcenaphtheneDibenzofuranFluoreneC1-FluorenesC2-FluorenesC3-FluorenesAnthracenePhenanthreneC1-Phenanthrenes/AnthracenesC2-Phenanthrenes/AnthracenesC3-Phenanthrenes/AnthracenesC4-Phenanthrenes/AnthracenesDibenzothiopheneC1-DibenzothiophenesC2-DibenzothiophenesC3-DibenzothiophenesC4-DibenzothiophenesFluoranthenePyreneC1-Fluoranthenes/PyrenesC2-Fluoranthenes/PyrenesC3-Fluoranthenes/PyrenesBenzo(a)anthraceneChryseneC1-ChrysenesC2-ChrysenesC3-ChrysenesC4-Chrysenes
400 POOL 1 400 POOL 2 400 POOL 3
R1769-P R1770-P R1771-P06/23/06 06/23/06 06/23/0606/23/06 06/23/06 06/23/0606/30/06 06/30/06 06/30/06
86.07 86.73 85.32MUSSEL MUSSEL MUSSEL AVERAGE %RSD
10.09 8.76 9.65 9.50 7.1310.13 15.77 10.07 11.99 27.30
500 500 5001.746 1.754 1.7540.431 0.278 0.435
ng/g, wet weight ng/g, wet weight ng/g, wet weight
0.22 J 0.32 0.34 J 0.29 21.928.96 5.61 7.83 7.47 22.83
53.93 28.66 37.89 40.16 31.84139.28 72.14 98.03 103.15 32.83114.31 57.31 83.98 85.20 33.47214.32 111.5 160.49 162.10 31.73
U U U NA NAU U U NA NAU U U NA NAU U U NA NAU U U NA NA
2.56 B 1.69 B 2.52 B 2.26 21.767.12 5.12 7.27 6.50 18.46
23.77 15.29 21.54 20.20 21.7647.43 26.74 39.16 37.78 27.5754.42 28.1 41.1 41.21 31.94
0.88 0.72 0.83 0.81 10.11U U U NA NAU U U NA NA
0.81 0.51 0.63 0.65 23.231.51 0.95 1.42 1.29 23.257.78 4.58 6.19 6.18 25.88
24.78 13.72 20.98 19.83 28.3437.4 20.18 28.75 28.78 29.92
U U U NA NA5.94 4.02 5.65 5.20 19.89
27.75 16.16 25.11 23.01 26.4059.43 31.38 51 47.27 30.4552.13 27.33 42.79 40.75 30.7420.19 12.99 15.85 16.34 22.18
0.73 0.42 0.61 0.59 26.646.21 3.51 4.88 4.87 27.74
16.01 8.23 13.28 12.51 31.5617.49 8.74 14.86 13.70 32.7810.17 5.25 8.67 8.03 31.40
2.6 1.69 2.47 2.25 21.841.49 1.03 1.49 1.34 19.877.27 3.68 6.06 5.67 32.21
11.71 5.8 8.48 8.66 34.1611.66 5.86 8.68 8.73 33.21
U U U NA NA4.84 2.67 3.7 3.74 29.055.51 2.73 4.03 4.09 34.014.13 2.26 3 3.13 30.092.52 1.3 2.23 2.02 31.60
U U U NA NA
Surrogate CorrectedAnalyzed by Sisson, Jeannine
7/20/2006 Final - Wet: T06-0239MS-Master_157-Final.xls

Project Client: Norwegian Institute for Water Research (NIVA)Project Name: NIVA - Analysis of Blue MusselsProject Number: N006783-0001
Client IDBattelle Batch IDBattelle IDCollection DateExtraction DateAnalysis DateMoisture Content (%)MatrixLipid Content (%, dry weight)Sample weight (g, wet weight)Pre-injection Volume (uL)Dilution FactorReporting LimitReporting Unit
Benzo(b)fluorantheneBenzo(k)fluorantheneBenzo(e)pyreneBenzo(a)pyrenePeryleneIndeno(1,2,3-cd)pyreneDibenz(a,h)anthraceneBenzo(g,h,i)perylene
Total DecalinsTotal NaphthalenesTotal Phenanthrenes/AnthracenesTotal DibenzothiophenesTotal PAH (from naphthalene)
Surrogate Recoveries (%)
Naphthalene-d8Acenaphthene-d10Phenanthrene-d10Benzo(a)pyrene-d12
B = Result < 5 x procedural blankJ = Detected below Reporting Limit.U = Not Detected.N = QC value outside QC criteria.NA = Not Applicable
400 POOL 1 400 POOL 2 400 POOL 3
R1769-P R1770-P R1771-P06/23/06 06/23/06 06/23/0606/23/06 06/23/06 06/23/0606/30/06 06/30/06 06/30/06
86.07 86.73 85.32MUSSEL MUSSEL MUSSEL AVERAGE %RSD
10.09 8.76 9.65 9.50 7.1310.13 15.77 10.07 11.99 27.30
500 500 5001.746 1.754 1.7540.431 0.278 0.435
ng/g, wet weight ng/g, wet weight ng/g, wet weight
0.43 0.29 0.32 J 0.35 21.260.11 J 0.15 J U 0.13 21.761.73 0.98 1.61 1.44 27.98
U U U NA NAU U U NA NAU U U NA NAU U U NA NA
0.15 J 0.1 J 0.17 J 0.14 25.75
531.02 275.54 388.56 398.37 32.14135.3 76.94 111.59 107.94 27.19
165.44 91.88 140.4 132.57 28.2150.61 26.15 42.3 39.69 31.34
478.66 260.39 394.18 377.74 29.14
66 68 7066 68 7285 86 9271 72 71
Surrogate CorrectedAnalyzed by Sisson, Jeannine
7/20/2006 Final - Wet: T06-0239MS-Master_157-Final.xls

Project Client: Norwegian Institute for Water Research (NIVA)Project Name: NIVA - Analysis of Blue MusselsProject Number: N006783-0001
Client IDBattelle Batch IDBattelle IDCollection DateExtraction DateAnalysis DateMoisture Content (%)MatrixLipid Content (%, dry weight)Sample weight (g, wet weight)Pre-injection Volume (uL)Dilution FactorReporting LimitReporting Unit
cis-Decalintrans-DecalinC1-DecalinsC2-DecalinsC3-DecalinsC4-DecalinsBenzo(b)thiopheneC1-benzo(b)thiophenesC2-benzo(b)thiophenesC3-benzo(b)thiophenesC4-benzo(b)thiophenesNaphthaleneC1-NaphthalenesC2-NaphthalenesC3-NaphthalenesC4-NaphthalenesBiphenylAcenaphthyleneAcenaphtheneDibenzofuranFluoreneC1-FluorenesC2-FluorenesC3-FluorenesAnthracenePhenanthreneC1-Phenanthrenes/AnthracenesC2-Phenanthrenes/AnthracenesC3-Phenanthrenes/AnthracenesC4-Phenanthrenes/AnthracenesDibenzothiopheneC1-DibenzothiophenesC2-DibenzothiophenesC3-DibenzothiophenesC4-DibenzothiophenesFluoranthenePyreneC1-Fluoranthenes/PyrenesC2-Fluoranthenes/PyrenesC3-Fluoranthenes/PyrenesBenzo(a)anthraceneChryseneC1-ChrysenesC2-ChrysenesC3-ChrysenesC4-Chrysenes
500 POOL 1 500 POOL 2 500 POOL 3
R1772-P R1773-P R1774-P06/23/06 06/23/06 06/23/0606/23/06 06/23/06 06/23/0606/30/06 06/30/06 06/30/06
85.91 86.23 86.96MUSSEL MUSSEL MUSSEL AVERAGE %RSD
9.41 9.92 9 9.44 4.8810.05 11.06 15.97 12.36 25.62
500 500 5001.754 1.754 1.7460.436 0.396 0.273
ng/g, wet weight ng/g, wet weight ng/g, wet weight
U U U NA NA1.41 1.4 1.58 1.46 6.919.86 9.1 9.7 9.55 4.19
29.54 28.31 25.27 27.71 7.9329.16 26.89 23.49 26.51 10.7650.82 47.43 46.17 48.14 5.00
U U U NA NAU U U NA NAU U U NA NAU U U NA NAU U U NA NA
1.63 B 1.5 B 1.18 B 1.44 16.123.73 3.53 2.91 3.39 12.618.92 9.15 7.4 8.49 11.20
13.58 14.28 11.24 13.03 12.2215.32 14.06 11.8 13.73 12.99
0.54 0.48 0.42 0.48 12.50U U U NA NAU U U NA NA
0.59 0.61 0.53 0.58 7.220.99 0.81 0.76 0.85 14.182.51 2.87 2.3 2.56 11.267.47 7.38 6.43 7.09 8.12
13.44 12.59 9.81 11.95 15.89U U U NA NA
3.1 3.13 2.62 2.95 9.708.94 9.43 7.94 8.77 8.66
19.15 19.2 14.51 17.62 15.2914.13 14.66 10.97 13.25 15.05
5.11 6.61 4.01 5.24 24.890.36 J 0.38 J 0.29 B 0.34 13.762.25 1.96 1.7 1.97 13.975.16 5.57 3.98 4.90 16.845.31 5.05 4.1 4.82 13.213.21 3.18 2.77 3.05 8.051.73 1.86 1.58 1.72 8.13
0.7 B 0.77 0.51 B 0.66 20.382.29 2.25 1.72 2.09 15.252.75 3.07 2.47 2.76 10.862.59 2.48 2.23 2.43 7.58
U U U NA NA1.69 1.93 1.45 1.69 14.201.38 1.42 1.06 1.29 15.340.95 1.3 0.68 0.98 31.83
U 1 0.81 0.91 14.85U U U NA NA
Surrogate CorrectedAnalyzed by Sisson, Jeannine
7/20/2006 Final - Wet: T06-0239MS-Master_157-Final.xls
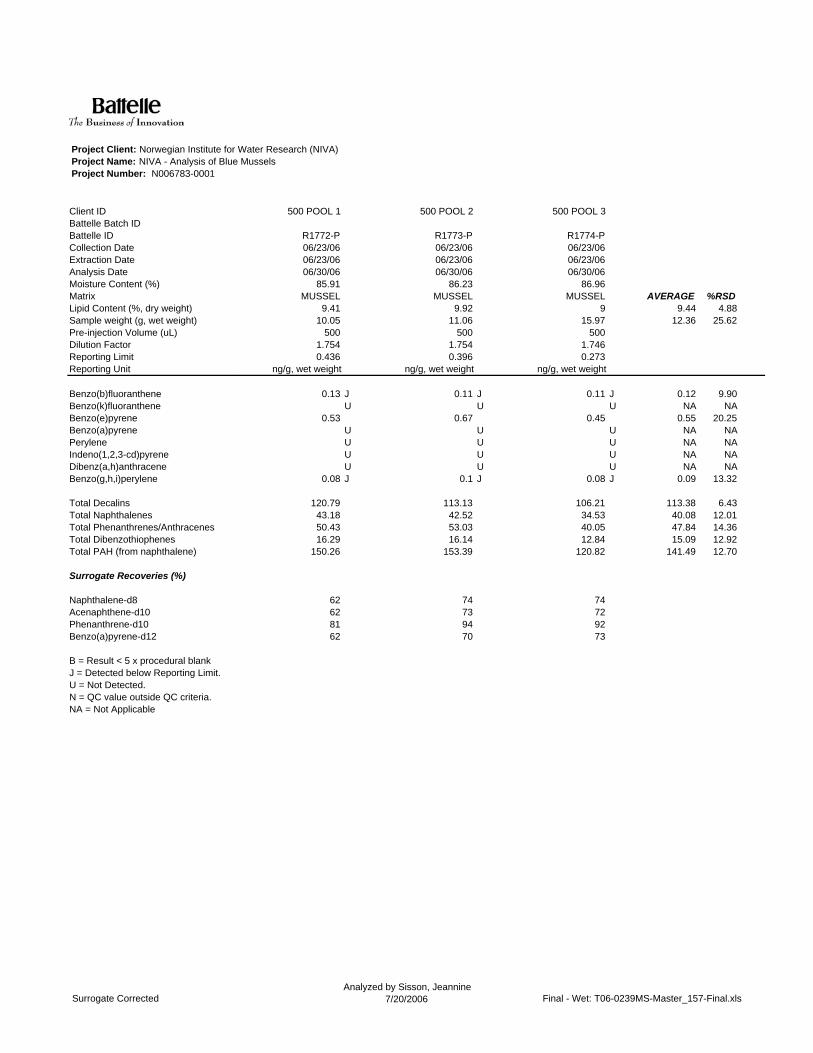
Project Client: Norwegian Institute for Water Research (NIVA)Project Name: NIVA - Analysis of Blue MusselsProject Number: N006783-0001
Client IDBattelle Batch IDBattelle IDCollection DateExtraction DateAnalysis DateMoisture Content (%)MatrixLipid Content (%, dry weight)Sample weight (g, wet weight)Pre-injection Volume (uL)Dilution FactorReporting LimitReporting Unit
Benzo(b)fluorantheneBenzo(k)fluorantheneBenzo(e)pyreneBenzo(a)pyrenePeryleneIndeno(1,2,3-cd)pyreneDibenz(a,h)anthraceneBenzo(g,h,i)perylene
Total DecalinsTotal NaphthalenesTotal Phenanthrenes/AnthracenesTotal DibenzothiophenesTotal PAH (from naphthalene)
Surrogate Recoveries (%)
Naphthalene-d8Acenaphthene-d10Phenanthrene-d10Benzo(a)pyrene-d12
B = Result < 5 x procedural blankJ = Detected below Reporting Limit.U = Not Detected.N = QC value outside QC criteria.NA = Not Applicable
500 POOL 1 500 POOL 2 500 POOL 3
R1772-P R1773-P R1774-P06/23/06 06/23/06 06/23/0606/23/06 06/23/06 06/23/0606/30/06 06/30/06 06/30/06
85.91 86.23 86.96MUSSEL MUSSEL MUSSEL AVERAGE %RSD
9.41 9.92 9 9.44 4.8810.05 11.06 15.97 12.36 25.62
500 500 5001.754 1.754 1.7460.436 0.396 0.273
ng/g, wet weight ng/g, wet weight ng/g, wet weight
0.13 J 0.11 J 0.11 J 0.12 9.90U U U NA NA
0.53 0.67 0.45 0.55 20.25U U U NA NAU U U NA NAU U U NA NAU U U NA NA
0.08 J 0.1 J 0.08 J 0.09 13.32
120.79 113.13 106.21 113.38 6.4343.18 42.52 34.53 40.08 12.0150.43 53.03 40.05 47.84 14.3616.29 16.14 12.84 15.09 12.92
150.26 153.39 120.82 141.49 12.70
62 74 7462 73 7281 94 9262 70 73
Surrogate CorrectedAnalyzed by Sisson, Jeannine
7/20/2006 Final - Wet: T06-0239MS-Master_157-Final.xls

Project Client: Norwegian Institute for Water Research (NIVA)Project Name: NIVA - Analysis of Blue MusselsProject Number: N006783-0001
Client IDBattelle Batch IDBattelle IDCollection DateExtraction DateAnalysis DateMoisture Content (%)MatrixLipid Content (%, dry weight)Sample weight (g, wet weight)Pre-injection Volume (uL)Dilution FactorReporting LimitReporting Unit
cis-Decalintrans-DecalinC1-DecalinsC2-DecalinsC3-DecalinsC4-DecalinsBenzo(b)thiopheneC1-benzo(b)thiophenesC2-benzo(b)thiophenesC3-benzo(b)thiophenesC4-benzo(b)thiophenesNaphthaleneC1-NaphthalenesC2-NaphthalenesC3-NaphthalenesC4-NaphthalenesBiphenylAcenaphthyleneAcenaphtheneDibenzofuranFluoreneC1-FluorenesC2-FluorenesC3-FluorenesAnthracenePhenanthreneC1-Phenanthrenes/AnthracenesC2-Phenanthrenes/AnthracenesC3-Phenanthrenes/AnthracenesC4-Phenanthrenes/AnthracenesDibenzothiopheneC1-DibenzothiophenesC2-DibenzothiophenesC3-DibenzothiophenesC4-DibenzothiophenesFluoranthenePyreneC1-Fluoranthenes/PyrenesC2-Fluoranthenes/PyrenesC3-Fluoranthenes/PyrenesBenzo(a)anthraceneChryseneC1-ChrysenesC2-ChrysenesC3-ChrysenesC4-Chrysenes
600 POOL 1 600 POOL 2 600 POOL 3
R1775-P R1776-P R1777-P06/23/06 06/23/06 06/23/0606/23/06 06/23/06 06/23/0607/01/06 07/01/06 07/01/06
86.06 86.27 85.39MUSSEL MUSSEL MUSSEL AVERAGE %RSD
9.46 9.01 10.08 9.52 5.6515.79 15.44 10.92 14.05 19.33
500 500 5001.754 1.754 1.7540.278 0.284 0.402
ng/g, wet weight ng/g, wet weight ng/g, wet weight
0.15 J 0.18 J 0.23 J 0.19 21.652.29 3.6 3.2 3.03 22.16
17.75 22.59 22.3 20.88 13.0051 58.94 62.92 57.62 10.53
46.31 58.31 62.66 55.76 15.1985.77 105.6 110.17 100.51 12.90
U U U NA NAU U U NA NAU U U NA NAU U U NA NAU U U NA NA
1.51 B 1.24 B 1.52 B 1.42 11.163.56 3.21 3.85 3.54 9.05
10.34 12.3 13.55 12.06 13.4121.12 25.03 24.32 23.49 8.8722.32 26.27 28.44 25.68 12.08
0.58 0.5 0.61 0.56 10.09U U U NA NAU U U NA NA
0.59 0.67 0.66 0.64 6.810.9 1.01 1.22 1.04 15.58
3.97 4.19 4.1 4.09 2.7114.29 13.63 14.02 13.98 2.3719.83 20.04 19.23 19.70 2.13
U U U NA NA3.34 3.73 4.31 3.79 12.87
12.73 14.29 15.66 14.23 10.3026.2 29.59 30.72 28.84 8.16
21.41 24.58 25.05 23.68 8.368.96 8.19 8.15 8.43 5.41
0.4 0.42 0.5 0.44 12.032.65 3.11 3.61 3.12 15.377.29 7.75 8.14 7.73 5.51
10.67 8.91 9.11 9.56 10.085.14 5.45 5.29 5.29 2.931.79 2.21 2.34 2.11 13.60
1.2 1.24 1 1.15 11.213.61 3.82 3.58 3.67 3.565.11 5.85 5.73 5.56 7.14
5 5.43 5.07 5.17 4.47U U U NA NA
2.28 2.47 2.48 2.41 4.682.08 2.53 2.33 2.31 9.751.94 1.99 1.8 1.91 5.160.93 1.3 1.53 1.25 24.15
U U U NA NA
Surrogate CorrectedAnalyzed by Sisson, Jeannine
7/20/2006 Final - Wet: T06-0239MS-Master_157-Final.xls

Project Client: Norwegian Institute for Water Research (NIVA)Project Name: NIVA - Analysis of Blue MusselsProject Number: N006783-0001
Client IDBattelle Batch IDBattelle IDCollection DateExtraction DateAnalysis DateMoisture Content (%)MatrixLipid Content (%, dry weight)Sample weight (g, wet weight)Pre-injection Volume (uL)Dilution FactorReporting LimitReporting Unit
Benzo(b)fluorantheneBenzo(k)fluorantheneBenzo(e)pyreneBenzo(a)pyrenePeryleneIndeno(1,2,3-cd)pyreneDibenz(a,h)anthraceneBenzo(g,h,i)perylene
Total DecalinsTotal NaphthalenesTotal Phenanthrenes/AnthracenesTotal DibenzothiophenesTotal PAH (from naphthalene)
Surrogate Recoveries (%)
Naphthalene-d8Acenaphthene-d10Phenanthrene-d10Benzo(a)pyrene-d12
B = Result < 5 x procedural blankJ = Detected below Reporting Limit.U = Not Detected.N = QC value outside QC criteria.NA = Not Applicable
600 POOL 1 600 POOL 2 600 POOL 3
R1775-P R1776-P R1777-P06/23/06 06/23/06 06/23/0606/23/06 06/23/06 06/23/0607/01/06 07/01/06 07/01/06
86.06 86.27 85.39MUSSEL MUSSEL MUSSEL AVERAGE %RSD
9.46 9.01 10.08 9.52 5.6515.79 15.44 10.92 14.05 19.33
500 500 5001.754 1.754 1.7540.278 0.284 0.402
ng/g, wet weight ng/g, wet weight ng/g, wet weight
0.2 J 0.25 J 0.18 J 0.21 17.17U U U NA NA
0.67 0.98 0.91 0.85 19.05U U U NA NAU U U NA NAU 0.07 J U 0.07 NAU U U NA NA
0.1 J 0.28 J 0.09 J 0.16 68.25
203.27 249.22 261.48 237.99 12.8958.85 68.05 71.68 66.19 9.9972.64 80.38 83.89 78.97 7.2926.15 25.64 26.65 26.15 1.93
222.71 242.53 249.1 238.11 5.77
69 58 6669 56 6788 72 8577 61 70
Surrogate CorrectedAnalyzed by Sisson, Jeannine
7/20/2006 Final - Wet: T06-0239MS-Master_157-Final.xls

Project Client: Norwegian Institute for Water Research (NIVA)Project Name: NIVA - Analysis of Blue MusselsProject Number: N006783-0001
Client IDBattelle Batch IDBattelle IDCollection DateExtraction DateAnalysis DateMoisture Content (%)MatrixLipid Content (%, dry weight)Sample weight (g, wet weight)Pre-injection Volume (uL)Dilution FactorReporting LimitReporting Unit
cis-Decalintrans-DecalinC1-DecalinsC2-DecalinsC3-DecalinsC4-DecalinsBenzo(b)thiopheneC1-benzo(b)thiophenesC2-benzo(b)thiophenesC3-benzo(b)thiophenesC4-benzo(b)thiophenesNaphthaleneC1-NaphthalenesC2-NaphthalenesC3-NaphthalenesC4-NaphthalenesBiphenylAcenaphthyleneAcenaphtheneDibenzofuranFluoreneC1-FluorenesC2-FluorenesC3-FluorenesAnthracenePhenanthreneC1-Phenanthrenes/AnthracenesC2-Phenanthrenes/AnthracenesC3-Phenanthrenes/AnthracenesC4-Phenanthrenes/AnthracenesDibenzothiopheneC1-DibenzothiophenesC2-DibenzothiophenesC3-DibenzothiophenesC4-DibenzothiophenesFluoranthenePyreneC1-Fluoranthenes/PyrenesC2-Fluoranthenes/PyrenesC3-Fluoranthenes/PyrenesBenzo(a)anthraceneChryseneC1-ChrysenesC2-ChrysenesC3-ChrysenesC4-Chrysenes
700 POOL 1 700 POOL 2 700 POOL 3
R1778-P R1779-P R1780-P06/23/06 06/23/06 06/23/0606/23/06 06/23/06 06/23/0607/01/06 07/01/06 07/06/06
86.82 86.71 86.62MUSSEL MUSSEL MUSSEL AVERAGE %RSD
9.31 9.47 9.27 9.35 1.1315.10 15.37 15.25 15.24 0.89
500 500 5001.754 1.754 1.7540.290 0.285 0.288
ng/g, wet weight ng/g, wet weight ng/g, wet weight
U U U NA NA2.09 2.83 1.89 2.27 21.81
15.28 19.5 14 16.26 17.7043.36 52.73 41.87 45.99 12.8042.22 47.86 42.27 44.12 7.3575.41 84.58 78.61 79.53 5.85
U U U NA NAU U U NA NAU U U NA NAU U U NA NAU U U NA NA
1.46 B 1.44 B 1.4 B 1.43 2.133.86 4.22 3.85 3.98 5.30
10.78 11.12 10.42 10.77 3.2519.25 20.72 18.3 19.42 6.2821.37 21.07 19.26 20.57 5.55
0.58 0.67 0.64 0.63 7.27U U U NA NAU U U NA NA
0.58 0.6 0.62 0.60 3.330.88 0.96 0.89 0.91 4.793.49 3.29 3.35 3.38 3.04
10.72 10.64 10.69 10.68 0.3813.98 16.37 15.6 15.32 7.96
U U U NA NA3.47 3.63 3.23 3.44 5.85
12.11 12.69 11.84 12.21 3.5623.95 25.41 23.86 24.41 3.56
20.3 21.36 19.41 20.36 4.807.54 7.58 8.21 7.78 4.830.39 0.41 0.4 0.40 2.502.53 2.85 2.49 2.62 7.526.82 7.26 6.73 6.94 4.096.92 7.1 7.19 7.07 1.944.42 4.38 4.68 4.49 3.631.65 1.76 1.76 1.72 3.690.78 0.65 B 0.71 B 0.71 9.122.96 2.98 3.04 2.99 1.394.41 4.66 4.57 4.55 2.78
4.5 4.47 4.19 4.39 3.90U U U NA NA
2.02 2.35 2 2.12 9.261.95 2.02 2.05 2.01 2.561.74 1.73 1.55 1.67 6.391.04 1.04 1.19 1.09 7.95
U U U NA NA
Surrogate CorrectedAnalyzed by Sisson, Jeannine
7/20/2006 Final - Wet: T06-0239MS-Master_157-Final.xls

Project Client: Norwegian Institute for Water Research (NIVA)Project Name: NIVA - Analysis of Blue MusselsProject Number: N006783-0001
Client IDBattelle Batch IDBattelle IDCollection DateExtraction DateAnalysis DateMoisture Content (%)MatrixLipid Content (%, dry weight)Sample weight (g, wet weight)Pre-injection Volume (uL)Dilution FactorReporting LimitReporting Unit
Benzo(b)fluorantheneBenzo(k)fluorantheneBenzo(e)pyreneBenzo(a)pyrenePeryleneIndeno(1,2,3-cd)pyreneDibenz(a,h)anthraceneBenzo(g,h,i)perylene
Total DecalinsTotal NaphthalenesTotal Phenanthrenes/AnthracenesTotal DibenzothiophenesTotal PAH (from naphthalene)
Surrogate Recoveries (%)
Naphthalene-d8Acenaphthene-d10Phenanthrene-d10Benzo(a)pyrene-d12
B = Result < 5 x procedural blankJ = Detected below Reporting Limit.U = Not Detected.N = QC value outside QC criteria.NA = Not Applicable
700 POOL 1 700 POOL 2 700 POOL 3
R1778-P R1779-P R1780-P06/23/06 06/23/06 06/23/0606/23/06 06/23/06 06/23/0607/01/06 07/01/06 07/06/06
86.82 86.71 86.62MUSSEL MUSSEL MUSSEL AVERAGE %RSD
9.31 9.47 9.27 9.35 1.1315.10 15.37 15.25 15.24 0.89
500 500 5001.754 1.754 1.7540.290 0.285 0.288
ng/g, wet weight ng/g, wet weight ng/g, wet weight
0.15 J 0.2 J 0.17 J 0.17 14.52U U U NA NA
0.79 0.86 0.84 0.83 4.34U U U NA NAU U U NA NA
0.03 J 0.03 J 0.03 J 0.03 0.00U U U NA NA
0.09 J 0.1 J 0.11 J 0.10 10.00
178.36 207.5 178.64 188.17 8.9056.72 58.57 53.23 56.17 4.8367.37 70.67 66.55 68.20 3.2021.08 22 21.49 21.52 2.14
197.51 206.62 195.27 199.80 3.01
68 72 6866 71 6787 90 9071 73 76
Surrogate CorrectedAnalyzed by Sisson, Jeannine
7/20/2006 Final - Wet: T06-0239MS-Master_157-Final.xls

Project Client: Norwegian Institute for Water Research (NIVA)Project Name: NIVA - Analysis of Blue MusselsProject Number: N006783-0001
Client IDBattelle Batch IDBattelle IDCollection DateExtraction DateAnalysis DateMoisture Content (%)MatrixLipid Content (%, dry weight)Sample weight (g, wet weight)Pre-injection Volume (uL)Dilution FactorReporting LimitReporting Unit
cis-Decalintrans-DecalinC1-DecalinsC2-DecalinsC3-DecalinsC4-DecalinsBenzo(b)thiopheneC1-benzo(b)thiophenesC2-benzo(b)thiophenesC3-benzo(b)thiophenesC4-benzo(b)thiophenesNaphthaleneC1-NaphthalenesC2-NaphthalenesC3-NaphthalenesC4-NaphthalenesBiphenylAcenaphthyleneAcenaphtheneDibenzofuranFluoreneC1-FluorenesC2-FluorenesC3-FluorenesAnthracenePhenanthreneC1-Phenanthrenes/AnthracenesC2-Phenanthrenes/AnthracenesC3-Phenanthrenes/AnthracenesC4-Phenanthrenes/AnthracenesDibenzothiopheneC1-DibenzothiophenesC2-DibenzothiophenesC3-DibenzothiophenesC4-DibenzothiophenesFluoranthenePyreneC1-Fluoranthenes/PyrenesC2-Fluoranthenes/PyrenesC3-Fluoranthenes/PyrenesBenzo(a)anthraceneChryseneC1-ChrysenesC2-ChrysenesC3-ChrysenesC4-Chrysenes
800 POOL 1 800 POOL 2 800 POOL 3
R1781-P R1782-P R1783-P06/23/06 06/23/06 06/23/0606/23/06 06/23/06 06/23/0607/06/06 07/06/06 07/06/06
85.75 85.14 86.58MUSSEL MUSSEL MUSSEL AVERAGE %RSD
9.39 10.46 9.69 9.85 5.6115.44 15.19 15.32 15.32 0.82
500 500 5001.754 1.754 1.7540.284 0.289 0.286
ng/g, wet weight ng/g, wet weight ng/g, wet weight
U U U NA NA3.96 5.68 4.07 4.57 21.07
31.36 37.36 30.33 33.02 11.5084.99 102.58 81.97 89.85 12.3979.42 87.51 68.85 78.59 11.91
132.11 150.65 122.85 135.20 10.47U U U NA NAU U U NA NAU U U NA NAU U U NA NAU U U NA NA
1.39 B 1.4 B 1.3 B 1.36 4.043.97 4.16 3.54 3.89 8.17
13.51 13.66 11.2 12.79 10.7829.06 30.24 23.55 27.62 12.9334.39 36.47 29.86 33.57 10.07
0.65 0.71 0.73 0.70 5.98U U U NA NAU U U NA NA
0.62 0.71 0.59 0.64 9.761.26 1.06 1.02 1.11 11.555.27 5.65 4.71 5.21 9.08
19.17 19.29 15.23 17.90 12.9131.25 29.52 25.42 28.73 10.42
U U U NA NA4.37 4.48 3.79 4.21 8.80
21.25 21.03 16.43 19.57 13.9148.96 45.05 37.13 43.71 13.7944.87 38.29 31.12 38.09 18.0516.11 14.14 12.34 14.20 13.28
0.51 0.51 0.46 0.49 5.854.66 4.64 3.4 4.23 17.05
12.74 12.48 11.09 12.10 7.3316.07 13.99 11.2 13.75 17.77
9.1 7.63 7.84 8.19 9.712.48 2.45 2.3 2.41 4.001.19 1.16 1.04 1.13 7.02
6.9 6.3 5.09 6.10 15.1211.74 9.28 7.95 9.66 19.9110.48 8.64 7.25 8.79 18.43
U 4.69 U 4.69 NA4.33 4.3 3.64 4.09 9.545.62 4.29 3.81 4.57 20.504.19 3.2 2.66 3.35 23.162.76 2.09 1.36 2.07 33.83
U U U NA NA
Surrogate CorrectedAnalyzed by Sisson, Jeannine
7/20/2006 Final - Wet: T06-0239MS-Master_157-Final.xls

Project Client: Norwegian Institute for Water Research (NIVA)Project Name: NIVA - Analysis of Blue MusselsProject Number: N006783-0001
Client IDBattelle Batch IDBattelle IDCollection DateExtraction DateAnalysis DateMoisture Content (%)MatrixLipid Content (%, dry weight)Sample weight (g, wet weight)Pre-injection Volume (uL)Dilution FactorReporting LimitReporting Unit
Benzo(b)fluorantheneBenzo(k)fluorantheneBenzo(e)pyreneBenzo(a)pyrenePeryleneIndeno(1,2,3-cd)pyreneDibenz(a,h)anthraceneBenzo(g,h,i)perylene
Total DecalinsTotal NaphthalenesTotal Phenanthrenes/AnthracenesTotal DibenzothiophenesTotal PAH (from naphthalene)
Surrogate Recoveries (%)
Naphthalene-d8Acenaphthene-d10Phenanthrene-d10Benzo(a)pyrene-d12
B = Result < 5 x procedural blankJ = Detected below Reporting Limit.U = Not Detected.N = QC value outside QC criteria.NA = Not Applicable
800 POOL 1 800 POOL 2 800 POOL 3
R1781-P R1782-P R1783-P06/23/06 06/23/06 06/23/0606/23/06 06/23/06 06/23/0607/06/06 07/06/06 07/06/06
85.75 85.14 86.58MUSSEL MUSSEL MUSSEL AVERAGE %RSD
9.39 10.46 9.69 9.85 5.6115.44 15.19 15.32 15.32 0.82
500 500 5001.754 1.754 1.7540.284 0.289 0.286
ng/g, wet weight ng/g, wet weight ng/g, wet weight
0.53 0.35 0.33 0.40 27.310.21 J 0.12 J 0.17 J 0.17 27.06
1.6 1.42 1.22 1.41 13.45U U U NA NAU U U NA NA
0.08 J 0.07 J U 0.08 9.43U U U NA NA
0.14 J 0.14 J 0.13 J 0.14 4.22
331.84 383.78 308.07 341.23 11.3582.32 85.93 69.45 79.23 10.93
135.56 122.99 100.81 119.79 14.6943.08 39.25 33.99 38.77 11.77
371.43 353.61 288.9 337.98 12.85
66 65 6564 64 6483 84 8481 83 80
Surrogate CorrectedAnalyzed by Sisson, Jeannine
7/20/2006 Final - Wet: T06-0239MS-Master_157-Final.xls

Project Client: Norwegian Institute for Water Research (NIVA)Project Name: NIVA - Analysis of Blue MusselsProject Number: N006783-0001
Client ID 100 POOL 1 100 POOL 2 100 POOL 3Battelle Batch ID 06-0239 06-0239 06-0239Battelle ID R1757-P R1758-P R1759-PCollection Date 06/23/06 06/23/06 06/23/06Extraction Date 06/23/06 06/23/06 06/23/06Analysis Date 06/29/06 06/29/06 06/29/06Moisture Content (%) 83.84 84.01 83.91Matrix MUSSEL MUSSEL MUSSEL AVERAGE %RSDLipid Content (%, dry weight) 9.16 9.45 10.58 9.73 7.71Sample weight (g, dry weight) 0.76 1.61 1.66 1.34 37.65Pre-injection Volume (uL) 500 500 500Dilution Factor 1.754 1.754 1.75Reporting Limit 5.770 2.724 2.636Reporting Unit ng/g, dry weight ng/g, dry weight ng/g, dry weight
cis-Decalin U U U NA NAtrans-Decalin U U U NA NAC1-Decalins U U U NA NAC2-Decalins U U U NA NAC3-Decalins U U U NA NAC4-Decalins U U U NA NABenzo(b)thiophene U U U NA NAC1-benzo(b)thiophenes U U U NA NAC2-benzo(b)thiophenes U U U NA NAC3-benzo(b)thiophenes U U U NA NAC4-benzo(b)thiophenes U U U NA NANaphthalene 8.56 B 5.05 B 4.04 B 5.88 40.32C1-Naphthalenes 3.94 J 1.47 J 1.65 J 2.35 58.51C2-Naphthalenes U U U NA NAC3-Naphthalenes U U U NA NAC4-Naphthalenes U U U NA NABiphenyl 2.09 J 0.57 J 1.57 J 1.41 54.79Acenaphthylene U U U NA NAAcenaphthene U U U NA NADibenzofuran 4.4 J 3.74 4.4 4.18 9.12Fluorene 3.23 J 2.61 J 2.86 2.90 10.76C1-Fluorenes 3.74 J 3.22 3.02 3.33 11.17C2-Fluorenes 9.8 6.56 5.17 7.18 33.10C3-Fluorenes U U U NA NAAnthracene 0.59 J 0.27 J 0.43 J 0.43 37.21Phenanthrene 9.26 B 5.78 B 5.8 B 6.95 28.84C1-Phenanthrenes/Anthracenes 6.66 B 4.84 B 4.3 B 5.27 23.48C2-Phenanthrenes/Anthracenes 6.16 5.07 3.9 5.04 22.41C3-Phenanthrenes/Anthracenes 3.36 J 2.66 J 3.2 3.07 11.93C4-Phenanthrenes/Anthracenes U U U NA NADibenzothiophene 0.78 J 0.43 J 0.5 J 0.57 32.49C1-Dibenzothiophenes 3.76 J 2.18 J 1.6 J 2.51 44.48C2-Dibenzothiophenes 5.39 J 3.38 3.42 4.06 28.28C3-Dibenzothiophenes U U U NA NAC4-Dibenzothiophenes U U U NA NAFluoranthene 13.95 9.32 8.25 10.51 28.84Pyrene 8.53 1.93 J 1.78 J 4.08 94.47C1-Fluoranthenes/Pyrenes 3.51 J 2.01 J 1.79 J 2.44 38.41C2-Fluoranthenes/Pyrenes U U U NA NAC3-Fluoranthenes/Pyrenes U U U NA NABenzo(a)anthracene U U U NA NAChrysene 6.19 3.9 3.08 4.39 36.72C1-Chrysenes 0.97 J 0.46 J 0.24 J 0.56 67.27C2-Chrysenes U U U NA NAC3-Chrysenes U U U NA NAC4-Chrysenes U U U NA NA
Surrogate CorrectedAnalyzed by Sisson, Jeannine
7/20/2006 Final - Dry: T06-0239MS-Master_157-Final.xls

Project Client: Norwegian Institute for Water Research (NIVA)Project Name: NIVA - Analysis of Blue MusselsProject Number: N006783-0001
Client ID 100 POOL 1 100 POOL 2 100 POOL 3Battelle Batch ID 06-0239 06-0239 06-0239Battelle ID R1757-P R1758-P R1759-PCollection Date 06/23/06 06/23/06 06/23/06Extraction Date 06/23/06 06/23/06 06/23/06Analysis Date 06/29/06 06/29/06 06/29/06Moisture Content (%) 83.84 84.01 83.91Matrix MUSSEL MUSSEL MUSSEL AVERAGE %RSDLipid Content (%, dry weight) 9.16 9.45 10.58 9.73 7.71Sample weight (g, dry weight) 0.76 1.61 1.66 1.34 37.65Pre-injection Volume (uL) 500 500 500Dilution Factor 1.754 1.754 1.75Reporting Limit 5.770 2.724 2.636Reporting Unit ng/g, dry weight ng/g, dry weight ng/g, dry weight
Benzo(b)fluoranthene U U U NA NABenzo(k)fluoranthene U U U NA NABenzo(e)pyrene U U U NA NABenzo(a)pyrene U U U NA NAPerylene U U U NA NAIndeno(1,2,3-cd)pyrene 1.56 J 0.3 J 0.22 J 0.69 108.41Dibenz(a,h)anthracene U U U NA NABenzo(g,h,i)perylene 1.92 J 0.3 J 0.37 J 0.86 106.07
Total Decalins 0 0 0 0.00 NATotal Naphthalenes 12.5 6.52 5.69 8.24 45.11Total Phenanthrenes/Anthracenes 26.03 18.62 17.63 20.76 22.11Total Dibenzothiophenes 9.93 5.99 5.52 7.15 33.89Total PAH (from naphthalene) 108.35 66.05 61.59 78.66 32.81
Surrogate Recoveries (%)
Naphthalene-d8 71 62 73Acenaphthene-d10 70 62 70Phenanthrene-d10 90 80 91Benzo(a)pyrene-d12 71 62 69
B = Result < 5 x procedural blankJ = Detected below Reporting Limit.U = Not Detected.N = QC value outside QC criteria.NA = Not Applicable
Surrogate CorrectedAnalyzed by Sisson, Jeannine
7/20/2006 Final - Dry: T06-0239MS-Master_157-Final.xls

Project Client: Norwegian Institute for Water Research (NIVA)Project Name: NIVA - Analysis of Blue MusselsProject Number: N006783-0001
Client IDBattelle Batch IDBattelle IDCollection DateExtraction DateAnalysis DateMoisture Content (%)MatrixLipid Content (%, dry weight)Sample weight (g, dry weight)Pre-injection Volume (uL)Dilution FactorReporting LimitReporting Unit
cis-Decalintrans-DecalinC1-DecalinsC2-DecalinsC3-DecalinsC4-DecalinsBenzo(b)thiopheneC1-benzo(b)thiophenesC2-benzo(b)thiophenesC3-benzo(b)thiophenesC4-benzo(b)thiophenesNaphthaleneC1-NaphthalenesC2-NaphthalenesC3-NaphthalenesC4-NaphthalenesBiphenylAcenaphthyleneAcenaphtheneDibenzofuranFluoreneC1-FluorenesC2-FluorenesC3-FluorenesAnthracenePhenanthreneC1-Phenanthrenes/AnthracenesC2-Phenanthrenes/AnthracenesC3-Phenanthrenes/AnthracenesC4-Phenanthrenes/AnthracenesDibenzothiopheneC1-DibenzothiophenesC2-DibenzothiophenesC3-DibenzothiophenesC4-DibenzothiophenesFluoranthenePyreneC1-Fluoranthenes/PyrenesC2-Fluoranthenes/PyrenesC3-Fluoranthenes/PyrenesBenzo(a)anthraceneChryseneC1-ChrysenesC2-ChrysenesC3-ChrysenesC4-Chrysenes
200 POOL 1 200 POOL 2 200 POOL 306-0239 06-0239 06-0239R1760-P R1761-P R1762-P06/23/06 06/23/06 06/23/0606/23/06 06/23/06 06/23/0606/29/06 06/29/06 06/29/06
86.35 87.38 86.76MUSSEL MUSSEL MUSSEL AVERAGE %RSD
8.72 8.39 10.14 9.08 10.242.06 1.92 1.39 1.79 19.74500 500 500
1.754 1.754 1.7542.129 2.284 3.155
ng/g, dry weight ng/g, dry weight ng/g, dry weight
U U U NA NAU U U NA NAU U U NA NAU U U NA NAU U U NA NAU U U NA NAU U U NA NAU U U NA NAU U U NA NAU U U NA NAU U U NA NA
3.42 B 2.78 B 4.54 B 3.58 24.881.13 J 1.1 J 2.11 J 1.45 39.72
U U U NA NAU U U NA NAU U U NA NA
0.99 J 0.83 J 0.89 J 0.90 8.95U U U NA NAU U 1.75 J 1.75 NA
2.39 2.5 3.11 J 2.67 14.541.83 J 1.22 J 1.94 J 1.66 23.322.01 J U U 2.01 NA6.16 U 6.01 6.09 1.74
U U U NA NAU U U NA NA
4.11 B 3.87 B 4 B 3.99 3.013.72 B 3.13 B 4.03 B 3.63 12.61
4.2 4.93 3.98 4.37 11.384.47 4.22 3.84 4.18 7.60
U U U NA NA0.59 J 0.47 J 0.47 J 0.51 13.58
1.6 J 1.42 J 2.07 J 1.70 19.782.93 2.74 3.1 J 2.92 6.16
U U U NA NAU U U NA NA
6.07 4.84 5.71 5.54 11.411.72 J 1.78 J 1.92 J 1.81 5.68
1.4 J 0.71 J 1.65 J 1.25 38.85U U U NA NAU U U NA NA
0.18 J 0.09 J 0.14 J 0.14 32.992.82 3.29 2.26 J 2.79 18.48
0.4 J 0.28 J 0.2 J 0.29 34.32U U U NA NAU U U NA NAU U U NA NA
Surrogate CorrectedAnalyzed by Sisson, Jeannine
7/20/2006 Final - Dry: T06-0239MS-Master_157-Final.xls
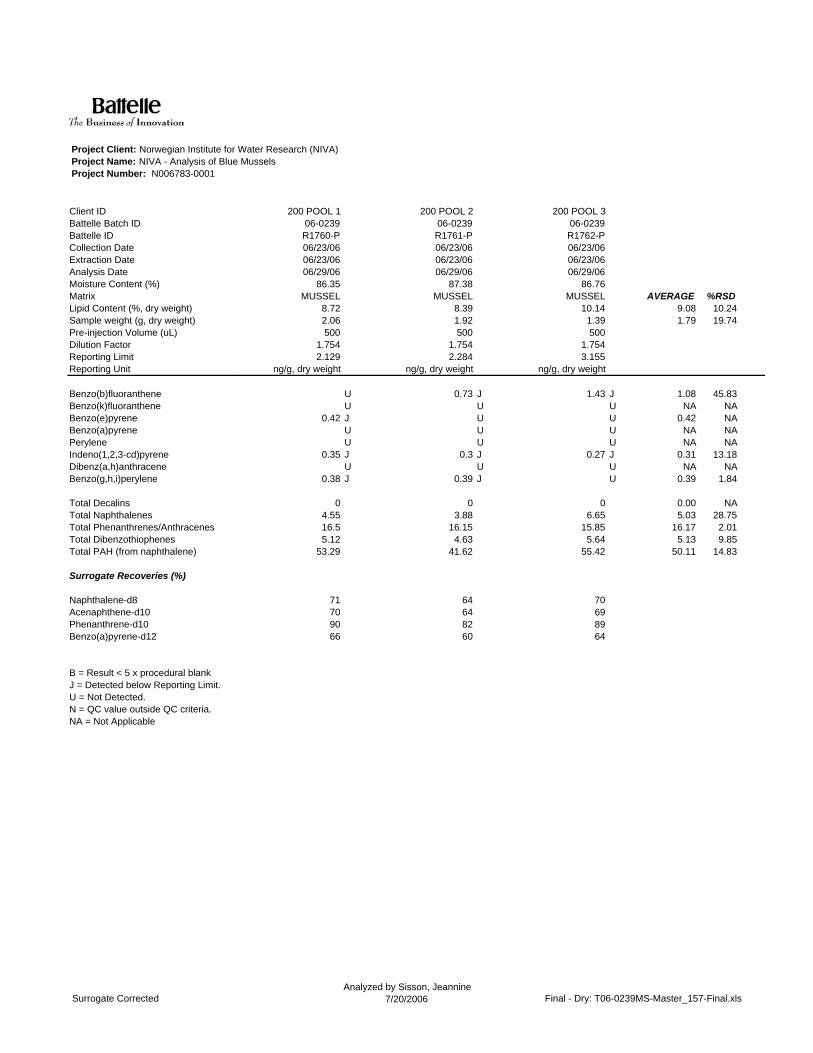
Project Client: Norwegian Institute for Water Research (NIVA)Project Name: NIVA - Analysis of Blue MusselsProject Number: N006783-0001
Client IDBattelle Batch IDBattelle IDCollection DateExtraction DateAnalysis DateMoisture Content (%)MatrixLipid Content (%, dry weight)Sample weight (g, dry weight)Pre-injection Volume (uL)Dilution FactorReporting LimitReporting Unit
Benzo(b)fluorantheneBenzo(k)fluorantheneBenzo(e)pyreneBenzo(a)pyrenePeryleneIndeno(1,2,3-cd)pyreneDibenz(a,h)anthraceneBenzo(g,h,i)perylene
Total DecalinsTotal NaphthalenesTotal Phenanthrenes/AnthracenesTotal DibenzothiophenesTotal PAH (from naphthalene)
Surrogate Recoveries (%)
Naphthalene-d8Acenaphthene-d10Phenanthrene-d10Benzo(a)pyrene-d12
B = Result < 5 x procedural blankJ = Detected below Reporting Limit.U = Not Detected.N = QC value outside QC criteria.NA = Not Applicable
200 POOL 1 200 POOL 2 200 POOL 306-0239 06-0239 06-0239R1760-P R1761-P R1762-P06/23/06 06/23/06 06/23/0606/23/06 06/23/06 06/23/0606/29/06 06/29/06 06/29/06
86.35 87.38 86.76MUSSEL MUSSEL MUSSEL AVERAGE %RSD
8.72 8.39 10.14 9.08 10.242.06 1.92 1.39 1.79 19.74500 500 500
1.754 1.754 1.7542.129 2.284 3.155
ng/g, dry weight ng/g, dry weight ng/g, dry weight
U 0.73 J 1.43 J 1.08 45.83U U U NA NA
0.42 J U U 0.42 NAU U U NA NAU U U NA NA
0.35 J 0.3 J 0.27 J 0.31 13.18U U U NA NA
0.38 J 0.39 J U 0.39 1.84
0 0 0 0.00 NA4.55 3.88 6.65 5.03 28.7516.5 16.15 15.85 16.17 2.015.12 4.63 5.64 5.13 9.85
53.29 41.62 55.42 50.11 14.83
71 64 7070 64 6990 82 8966 60 64
Surrogate CorrectedAnalyzed by Sisson, Jeannine
7/20/2006 Final - Dry: T06-0239MS-Master_157-Final.xls

Project Client: Norwegian Institute for Water Research (NIVA)Project Name: NIVA - Analysis of Blue MusselsProject Number: N006783-0001
Client IDBattelle Batch IDBattelle IDCollection DateExtraction DateAnalysis DateMoisture Content (%)MatrixLipid Content (%, dry weight)Sample weight (g, dry weight)Pre-injection Volume (uL)Dilution FactorReporting LimitReporting Unit
cis-Decalintrans-DecalinC1-DecalinsC2-DecalinsC3-DecalinsC4-DecalinsBenzo(b)thiopheneC1-benzo(b)thiophenesC2-benzo(b)thiophenesC3-benzo(b)thiophenesC4-benzo(b)thiophenesNaphthaleneC1-NaphthalenesC2-NaphthalenesC3-NaphthalenesC4-NaphthalenesBiphenylAcenaphthyleneAcenaphtheneDibenzofuranFluoreneC1-FluorenesC2-FluorenesC3-FluorenesAnthracenePhenanthreneC1-Phenanthrenes/AnthracenesC2-Phenanthrenes/AnthracenesC3-Phenanthrenes/AnthracenesC4-Phenanthrenes/AnthracenesDibenzothiopheneC1-DibenzothiophenesC2-DibenzothiophenesC3-DibenzothiophenesC4-DibenzothiophenesFluoranthenePyreneC1-Fluoranthenes/PyrenesC2-Fluoranthenes/PyrenesC3-Fluoranthenes/PyrenesBenzo(a)anthraceneChryseneC1-ChrysenesC2-ChrysenesC3-ChrysenesC4-Chrysenes
300 POOL 1 300 POOL 2 300 POOL 306-0239 06-0239 06-0239R1763-P R1764-P R1765-P06/23/06 06/23/06 06/23/0606/23/06 06/23/06 06/23/0606/29/06 06/29/06 06/30/06
87.11 86.89 87.3MUSSEL MUSSEL MUSSEL AVERAGE %RSD
9.57 10.14 9.7 9.80 3.051.31 1.99 1.93 1.74 21.60500 500 500
1.754 1.754 1.7543.347 2.204 2.272
ng/g, dry weight ng/g, dry weight ng/g, dry weight
4.84 4.89 4.59 4.77 3.37102.31 98.44 92.63 97.79 4.98445.83 445.15 413.42 434.80 4.26913.55 941.73 917.32 924.20 1.66742.31 751.33 742.7 745.45 0.68
1238.46 1250.47 1180.35 1223.09 3.07U U U NA NAU U U NA NAU U U NA NAU U U NA NAU U U NA NA
26.32 B 24.6 B 24.85 B 25.26 3.6887.9 86.94 85.82 86.89 1.20
264.57 252.26 254.54 257.12 2.55428.32 429.16 430.52 429.33 0.26418.03 401.49 438.54 419.35 4.43
11.56 11.58 10.23 11.12 6.96U U U NA NAU U U NA NA
5.11 5.64 5.78 5.51 6.4117.46 15.3 15.4 16.05 7.5970.88 67.45 65.13 67.82 4.27
214.19 192.49 194.7 200.46 5.96278.97 239.38 276.63 264.99 8.38
U U U NA NA55 52.75 51.8 53.18 3.09
233.37 214.58 223.24 223.73 4.20465.45 400.16 427.34 430.98 7.61402.95 332.26 378.41 371.21 9.67163.43 111.79 131.48 135.57 19.22
6.22 6.09 5.55 5.95 5.9746.99 40.38 46.67 44.68 8.34
129.43 101.79 110.71 113.98 12.38129.78 104.58 121.77 118.71 10.85
77.24 54.76 61.16 64.39 17.9917.21 15.22 16.39 16.27 6.1512.47 11.12 10.24 11.28 9.9665.91 52.41 58.96 59.09 11.42
101.59 80.31 88.53 90.14 11.9098.91 75.18 85.69 86.59 13.73
U U U NA NA35.75 31.12 31.22 32.70 8.0945.82 33.13 36.16 38.37 17.2734.57 25.68 27.02 29.09 16.4822.61 15.96 16.15 18.24 20.76
U U U NA NA
Surrogate CorrectedAnalyzed by Sisson, Jeannine
7/20/2006 Final - Dry: T06-0239MS-Master_157-Final.xls

Project Client: Norwegian Institute for Water Research (NIVA)Project Name: NIVA - Analysis of Blue MusselsProject Number: N006783-0001
Client IDBattelle Batch IDBattelle IDCollection DateExtraction DateAnalysis DateMoisture Content (%)MatrixLipid Content (%, dry weight)Sample weight (g, dry weight)Pre-injection Volume (uL)Dilution FactorReporting LimitReporting Unit
Benzo(b)fluorantheneBenzo(k)fluorantheneBenzo(e)pyreneBenzo(a)pyrenePeryleneIndeno(1,2,3-cd)pyreneDibenz(a,h)anthraceneBenzo(g,h,i)perylene
Total DecalinsTotal NaphthalenesTotal Phenanthrenes/AnthracenesTotal DibenzothiophenesTotal PAH (from naphthalene)
Surrogate Recoveries (%)
Naphthalene-d8Acenaphthene-d10Phenanthrene-d10Benzo(a)pyrene-d12
B = Result < 5 x procedural blankJ = Detected below Reporting Limit.U = Not Detected.N = QC value outside QC criteria.NA = Not Applicable
300 POOL 1 300 POOL 2 300 POOL 306-0239 06-0239 06-0239R1763-P R1764-P R1765-P06/23/06 06/23/06 06/23/0606/23/06 06/23/06 06/23/0606/29/06 06/29/06 06/30/06
87.11 86.89 87.3MUSSEL MUSSEL MUSSEL AVERAGE %RSD
9.57 10.14 9.7 9.80 3.051.31 1.99 1.93 1.74 21.60500 500 500
1.754 1.754 1.7543.347 2.204 2.272
ng/g, dry weight ng/g, dry weight ng/g, dry weight
3.24 J 2.12 J 2.53 2.63 21.55U U U NA NA
14.04 12.05 12.64 12.91 7.92U U U NA NAU U U NA NAU U U NA NAU U U NA NA
1.14 J 1.18 J 1.22 J 1.18 3.39
3447.3 3492.01 3351.01 3430.11 2.101225.14 1194.45 1234.27 1217.95 1.71
1320.2 1111.54 1212.27 1214.67 8.59389.66 307.6 345.86 347.71 11.81
3986.43 3500.91 3747.02 3744.79 6.48
69 68 7470 69 7490 88 9774 75 82
Surrogate CorrectedAnalyzed by Sisson, Jeannine
7/20/2006 Final - Dry: T06-0239MS-Master_157-Final.xls

Project Client: Norwegian Institute for Water Research (NIVA)Project Name: NIVA - Analysis of Blue MusselsProject Number: N006783-0001
Client IDBattelle Batch IDBattelle IDCollection DateExtraction DateAnalysis DateMoisture Content (%)MatrixLipid Content (%, dry weight)Sample weight (g, dry weight)Pre-injection Volume (uL)Dilution FactorReporting LimitReporting Unit
cis-Decalintrans-DecalinC1-DecalinsC2-DecalinsC3-DecalinsC4-DecalinsBenzo(b)thiopheneC1-benzo(b)thiophenesC2-benzo(b)thiophenesC3-benzo(b)thiophenesC4-benzo(b)thiophenesNaphthaleneC1-NaphthalenesC2-NaphthalenesC3-NaphthalenesC4-NaphthalenesBiphenylAcenaphthyleneAcenaphtheneDibenzofuranFluoreneC1-FluorenesC2-FluorenesC3-FluorenesAnthracenePhenanthreneC1-Phenanthrenes/AnthracenesC2-Phenanthrenes/AnthracenesC3-Phenanthrenes/AnthracenesC4-Phenanthrenes/AnthracenesDibenzothiopheneC1-DibenzothiophenesC2-DibenzothiophenesC3-DibenzothiophenesC4-DibenzothiophenesFluoranthenePyreneC1-Fluoranthenes/PyrenesC2-Fluoranthenes/PyrenesC3-Fluoranthenes/PyrenesBenzo(a)anthraceneChryseneC1-ChrysenesC2-ChrysenesC3-ChrysenesC4-Chrysenes
300 2M DEPTH POOL 1
300 2M DEPTH POOL 2
300 2M DEPTH POOL 3
R1766-P R1767-P R1768-P06/23/06 06/23/06 06/23/0606/23/06 06/23/06 06/23/0606/30/06 06/30/06 06/30/06
86.36 87.11 87.27MUSSEL MUSSEL MUSSEL AVERAGE %RSD
9.93 8.25 9.6 9.26 9.612.14 1.99 1.93 2.02 5.35500 500 500
1.754 1.75 1.7542.049 2.198 2.272
ng/g, dry weight ng/g, dry weight ng/g, dry weight
1.99 J 1.64 J 1.43 J 1.69 16.7772.15 44.48 47.4 54.68 27.80
423.28 300.38 280.72 334.79 23.081104.33 898.1 719.29 907.24 21.24
972.19 795.81 604.87 790.96 23.231677.78 1323.19 1008.73 1336.57 25.04
U U U NA NAU U U NA NAU U U NA NAU U U NA NAU U U NA NA
17.03 B 12.82 B 12.61 B 14.15 17.6249.45 34.17 36.95 40.19 20.25
176.04 138.39 124.64 146.36 18.18384.24 304.73 259.02 316.00 20.05467.17 360.96 283.15 370.43 24.94
6.75 6.4 5.38 6.18 11.52U U U NA NAU U U NA NA
5.77 3.62 3.81 4.40 27.059.78 9.11 8.82 9.24 5.33
60.76 46.85 35.21 47.61 26.87213.28 184.76 127.41 175.15 24.97337.57 266.61 190.06 264.75 27.87
U U U NA NA45.12 33.72 32.24 37.03 19.03
232.28 180.81 148.31 187.13 22.63496.13 403.61 310.09 403.28 23.07448.47 379.76 278.77 369.00 23.13180.36 132.46 106.71 139.84 26.73
4.71 4.11 3.57 4.13 13.8147.51 35.83 30.9 38.08 22.40
124.22 106.99 83.72 104.98 19.36148.02 122.64 87.11 119.26 25.66
77.92 71.82 49.48 66.41 22.5518.83 13.71 14.3 15.61 17.9412.11 12.19 7.03 10.44 28.3165.09 56.06 41.34 54.16 22.1399.52 87.69 63.16 83.46 22.2296.25 85.79 59.6 80.55 23.44
U U 0.38 J 0.38 NA37.36 30.14 24.61 30.70 20.8243.79 35.02 29.71 36.17 19.6631.57 27.29 20.18 26.35 21.8415.38 16.59 14.15 15.37 7.94
U U U NA NA
Surrogate CorrectedAnalyzed by Sisson, Jeannine
7/20/2006 Final - Dry: T06-0239MS-Master_157-Final.xls

Project Client: Norwegian Institute for Water Research (NIVA)Project Name: NIVA - Analysis of Blue MusselsProject Number: N006783-0001
Client IDBattelle Batch IDBattelle IDCollection DateExtraction DateAnalysis DateMoisture Content (%)MatrixLipid Content (%, dry weight)Sample weight (g, dry weight)Pre-injection Volume (uL)Dilution FactorReporting LimitReporting Unit
Benzo(b)fluorantheneBenzo(k)fluorantheneBenzo(e)pyreneBenzo(a)pyrenePeryleneIndeno(1,2,3-cd)pyreneDibenz(a,h)anthraceneBenzo(g,h,i)perylene
Total DecalinsTotal NaphthalenesTotal Phenanthrenes/AnthracenesTotal DibenzothiophenesTotal PAH (from naphthalene)
Surrogate Recoveries (%)
Naphthalene-d8Acenaphthene-d10Phenanthrene-d10Benzo(a)pyrene-d12
B = Result < 5 x procedural blankJ = Detected below Reporting Limit.U = Not Detected.N = QC value outside QC criteria.NA = Not Applicable
300 2M DEPTH POOL 1
300 2M DEPTH POOL 2
300 2M DEPTH POOL 3
R1766-P R1767-P R1768-P06/23/06 06/23/06 06/23/0606/23/06 06/23/06 06/23/0606/30/06 06/30/06 06/30/06
86.36 87.11 87.27MUSSEL MUSSEL MUSSEL AVERAGE %RSD
9.93 8.25 9.6 9.26 9.612.14 1.99 1.93 2.02 5.35500 500 500
1.754 1.75 1.7542.049 2.198 2.272
ng/g, dry weight ng/g, dry weight ng/g, dry weight
3.42 2.84 1.63 J 2.63 34.731.49 J 1.14 J 0.88 J 1.17 26.16
13.91 11.72 9.22 11.62 20.20U U U NA NAU U U NA NA
0.59 J 0.47 J 0.32 J 0.46 29.41U U U NA NA
1.15 J 1.17 J 0.69 J 1.00 27.06
4251.72 3363.6 2662.44 3425.92 23.251093.93 851.07 716.37 887.12 21.571402.36 1130.36 876.12 1136.28 23.16
402.38 341.39 254.78 332.85 22.283973.04 3221.99 2505.16 3233.40 22.70
70 67 6871 66 6890 85 8679 72 73
Surrogate CorrectedAnalyzed by Sisson, Jeannine
7/20/2006 Final - Dry: T06-0239MS-Master_157-Final.xls
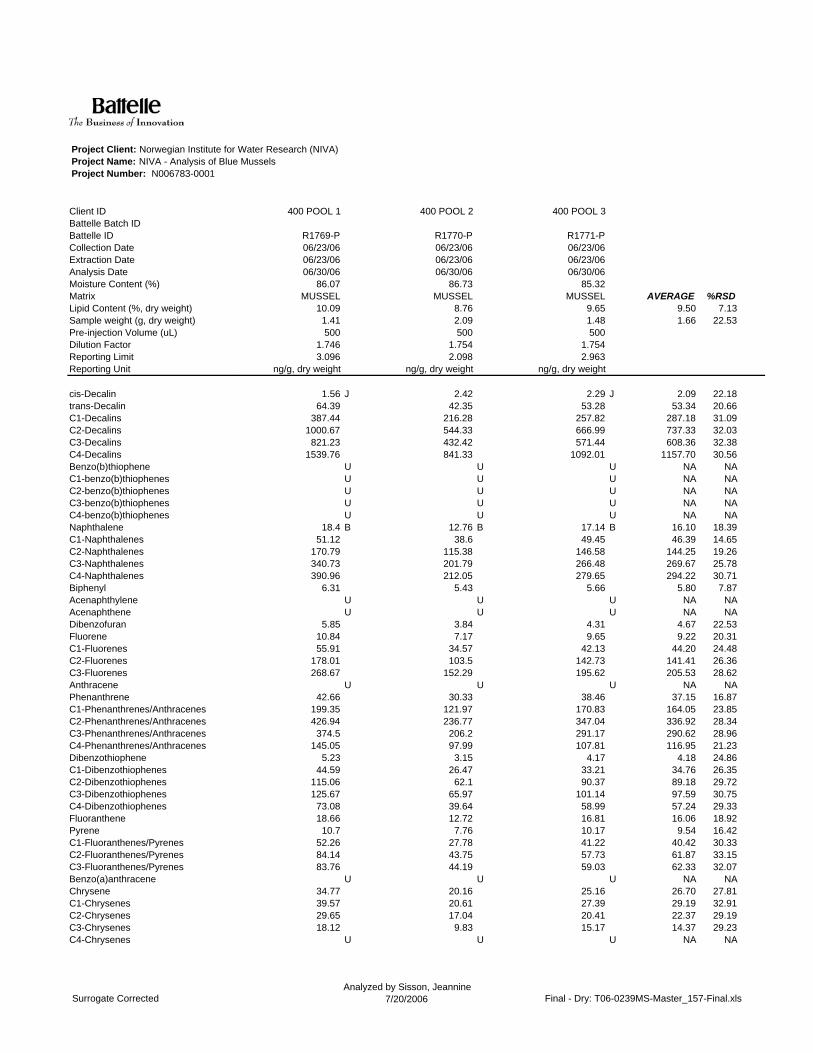
Project Client: Norwegian Institute for Water Research (NIVA)Project Name: NIVA - Analysis of Blue MusselsProject Number: N006783-0001
Client IDBattelle Batch IDBattelle IDCollection DateExtraction DateAnalysis DateMoisture Content (%)MatrixLipid Content (%, dry weight)Sample weight (g, dry weight)Pre-injection Volume (uL)Dilution FactorReporting LimitReporting Unit
cis-Decalintrans-DecalinC1-DecalinsC2-DecalinsC3-DecalinsC4-DecalinsBenzo(b)thiopheneC1-benzo(b)thiophenesC2-benzo(b)thiophenesC3-benzo(b)thiophenesC4-benzo(b)thiophenesNaphthaleneC1-NaphthalenesC2-NaphthalenesC3-NaphthalenesC4-NaphthalenesBiphenylAcenaphthyleneAcenaphtheneDibenzofuranFluoreneC1-FluorenesC2-FluorenesC3-FluorenesAnthracenePhenanthreneC1-Phenanthrenes/AnthracenesC2-Phenanthrenes/AnthracenesC3-Phenanthrenes/AnthracenesC4-Phenanthrenes/AnthracenesDibenzothiopheneC1-DibenzothiophenesC2-DibenzothiophenesC3-DibenzothiophenesC4-DibenzothiophenesFluoranthenePyreneC1-Fluoranthenes/PyrenesC2-Fluoranthenes/PyrenesC3-Fluoranthenes/PyrenesBenzo(a)anthraceneChryseneC1-ChrysenesC2-ChrysenesC3-ChrysenesC4-Chrysenes
400 POOL 1 400 POOL 2 400 POOL 3
R1769-P R1770-P R1771-P06/23/06 06/23/06 06/23/0606/23/06 06/23/06 06/23/0606/30/06 06/30/06 06/30/06
86.07 86.73 85.32MUSSEL MUSSEL MUSSEL AVERAGE %RSD
10.09 8.76 9.65 9.50 7.131.41 2.09 1.48 1.66 22.53500 500 500
1.746 1.754 1.7543.096 2.098 2.963
ng/g, dry weight ng/g, dry weight ng/g, dry weight
1.56 J 2.42 2.29 J 2.09 22.1864.39 42.35 53.28 53.34 20.66
387.44 216.28 257.82 287.18 31.091000.67 544.33 666.99 737.33 32.03
821.23 432.42 571.44 608.36 32.381539.76 841.33 1092.01 1157.70 30.56
U U U NA NAU U U NA NAU U U NA NAU U U NA NAU U U NA NA
18.4 B 12.76 B 17.14 B 16.10 18.3951.12 38.6 49.45 46.39 14.65
170.79 115.38 146.58 144.25 19.26340.73 201.79 266.48 269.67 25.78390.96 212.05 279.65 294.22 30.71
6.31 5.43 5.66 5.80 7.87U U U NA NAU U U NA NA
5.85 3.84 4.31 4.67 22.5310.84 7.17 9.65 9.22 20.3155.91 34.57 42.13 44.20 24.48
178.01 103.5 142.73 141.41 26.36268.67 152.29 195.62 205.53 28.62
U U U NA NA42.66 30.33 38.46 37.15 16.87
199.35 121.97 170.83 164.05 23.85426.94 236.77 347.04 336.92 28.34
374.5 206.2 291.17 290.62 28.96145.05 97.99 107.81 116.95 21.23
5.23 3.15 4.17 4.18 24.8644.59 26.47 33.21 34.76 26.35
115.06 62.1 90.37 89.18 29.72125.67 65.97 101.14 97.59 30.75
73.08 39.64 58.99 57.24 29.3318.66 12.72 16.81 16.06 18.92
10.7 7.76 10.17 9.54 16.4252.26 27.78 41.22 40.42 30.3384.14 43.75 57.73 61.87 33.1583.76 44.19 59.03 62.33 32.07
U U U NA NA34.77 20.16 25.16 26.70 27.8139.57 20.61 27.39 29.19 32.9129.65 17.04 20.41 22.37 29.1918.12 9.83 15.17 14.37 29.23
U U U NA NA
Surrogate CorrectedAnalyzed by Sisson, Jeannine
7/20/2006 Final - Dry: T06-0239MS-Master_157-Final.xls

Project Client: Norwegian Institute for Water Research (NIVA)Project Name: NIVA - Analysis of Blue MusselsProject Number: N006783-0001
Client IDBattelle Batch IDBattelle IDCollection DateExtraction DateAnalysis DateMoisture Content (%)MatrixLipid Content (%, dry weight)Sample weight (g, dry weight)Pre-injection Volume (uL)Dilution FactorReporting LimitReporting Unit
Benzo(b)fluorantheneBenzo(k)fluorantheneBenzo(e)pyreneBenzo(a)pyrenePeryleneIndeno(1,2,3-cd)pyreneDibenz(a,h)anthraceneBenzo(g,h,i)perylene
Total DecalinsTotal NaphthalenesTotal Phenanthrenes/AnthracenesTotal DibenzothiophenesTotal PAH (from naphthalene)
Surrogate Recoveries (%)
Naphthalene-d8Acenaphthene-d10Phenanthrene-d10Benzo(a)pyrene-d12
B = Result < 5 x procedural blankJ = Detected below Reporting Limit.U = Not Detected.N = QC value outside QC criteria.NA = Not Applicable
400 POOL 1 400 POOL 2 400 POOL 3
R1769-P R1770-P R1771-P06/23/06 06/23/06 06/23/0606/23/06 06/23/06 06/23/0606/30/06 06/30/06 06/30/06
86.07 86.73 85.32MUSSEL MUSSEL MUSSEL AVERAGE %RSD
10.09 8.76 9.65 9.50 7.131.41 2.09 1.48 1.66 22.53500 500 500
1.746 1.754 1.7543.096 2.098 2.963
ng/g, dry weight ng/g, dry weight ng/g, dry weight
3.06 J 2.16 2.16 J 2.46 21.120.79 J 1.14 J U 0.97 25.65
12.43 7.36 10.93 10.24 25.43U U U NA NAU U U NA NAU U U NA NAU U U NA NA
1.05 J 0.74 J 1.13 J 0.97 21.16
3815.05 2079.13 2643.83 2846.00 31.11972 580.58 759.3 770.63 25.43
1188.5 693.26 955.31 945.69 26.20363.63 197.33 287.88 282.95 29.43
3438.68 1964.74 2682.1 2695.17 27.35
66 68 7066 68 7285 86 9271 72 71
Surrogate CorrectedAnalyzed by Sisson, Jeannine
7/20/2006 Final - Dry: T06-0239MS-Master_157-Final.xls

Project Client: Norwegian Institute for Water Research (NIVA)Project Name: NIVA - Analysis of Blue MusselsProject Number: N006783-0001
Client IDBattelle Batch IDBattelle IDCollection DateExtraction DateAnalysis DateMoisture Content (%)MatrixLipid Content (%, dry weight)Sample weight (g, dry weight)Pre-injection Volume (uL)Dilution FactorReporting LimitReporting Unit
cis-Decalintrans-DecalinC1-DecalinsC2-DecalinsC3-DecalinsC4-DecalinsBenzo(b)thiopheneC1-benzo(b)thiophenesC2-benzo(b)thiophenesC3-benzo(b)thiophenesC4-benzo(b)thiophenesNaphthaleneC1-NaphthalenesC2-NaphthalenesC3-NaphthalenesC4-NaphthalenesBiphenylAcenaphthyleneAcenaphtheneDibenzofuranFluoreneC1-FluorenesC2-FluorenesC3-FluorenesAnthracenePhenanthreneC1-Phenanthrenes/AnthracenesC2-Phenanthrenes/AnthracenesC3-Phenanthrenes/AnthracenesC4-Phenanthrenes/AnthracenesDibenzothiopheneC1-DibenzothiophenesC2-DibenzothiophenesC3-DibenzothiophenesC4-DibenzothiophenesFluoranthenePyreneC1-Fluoranthenes/PyrenesC2-Fluoranthenes/PyrenesC3-Fluoranthenes/PyrenesBenzo(a)anthraceneChryseneC1-ChrysenesC2-ChrysenesC3-ChrysenesC4-Chrysenes
500 POOL 1 500 POOL 2 500 POOL 3
R1772-P R1773-P R1774-P06/23/06 06/23/06 06/23/0606/23/06 06/23/06 06/23/0606/30/06 06/30/06 06/30/06
85.91 86.23 86.96MUSSEL MUSSEL MUSSEL AVERAGE %RSD
9.41 9.92 9 9.44 4.881.42 1.52 2.08 1.67 21.26500 500 500
1.754 1.754 1.7463.088 2.885 2.099
ng/g, dry weight ng/g, dry weight ng/g, dry weight
U U U NA NA9.98 10.15 12.09 10.74 10.91
69.75 66.2 74.5 70.15 5.94209.1 205.99 194 203.03 3.93
206.39 195.64 180.32 194.12 6.75359.7 345.13 354.48 353.10 2.09
U U U NA NAU U U NA NAU U U NA NAU U U NA NAU U U NA NA
11.56 B 10.95 B 9.02 B 10.51 12.6226.37 25.72 22.31 24.80 8.7963.16 66.55 56.83 62.18 7.9396.08 103.89 86.29 95.42 9.24
108.41 102.29 90.58 100.43 9.023.85 3.46 3.23 3.51 8.92
U U U NA NAU U U NA NA
4.16 4.44 4.08 4.23 4.476.99 5.87 5.8 6.22 10.74
17.79 20.92 17.68 18.80 9.7952.87 53.7 49.35 51.97 4.4495.11 91.57 75.29 87.32 12.10
U U U NA NA21.91 22.76 20.09 21.59 6.3263.29 68.61 60.99 64.30 6.08
135.56 139.67 111.39 128.87 11.86100.03 106.69 84.2 96.97 11.91
36.19 48.06 30.79 38.35 23.042.58 J 2.76 J 2.26 B 2.53 10.00
15.96 14.26 13.07 14.43 10.0736.49 40.53 30.56 35.86 13.9837.56 36.77 31.49 35.27 9.36
22.7 23.14 21.25 22.36 4.4212.27 13.57 12.16 12.67 6.19
4.94 B 5.63 3.93 B 4.83 17.6916.17 16.36 13.2 15.24 11.6319.47 22.35 18.93 20.25 9.0818.33 18.06 17.13 17.84 3.53
U U U NA NA11.96 14.01 11.11 12.36 12.06
9.74 10.34 8.12 9.40 12.226.75 9.46 5.25 7.15 29.83
U 7.29 6.21 6.75 11.31U U U NA NA
Surrogate CorrectedAnalyzed by Sisson, Jeannine
7/20/2006 Final - Dry: T06-0239MS-Master_157-Final.xls

Project Client: Norwegian Institute for Water Research (NIVA)Project Name: NIVA - Analysis of Blue MusselsProject Number: N006783-0001
Client IDBattelle Batch IDBattelle IDCollection DateExtraction DateAnalysis DateMoisture Content (%)MatrixLipid Content (%, dry weight)Sample weight (g, dry weight)Pre-injection Volume (uL)Dilution FactorReporting LimitReporting Unit
Benzo(b)fluorantheneBenzo(k)fluorantheneBenzo(e)pyreneBenzo(a)pyrenePeryleneIndeno(1,2,3-cd)pyreneDibenz(a,h)anthraceneBenzo(g,h,i)perylene
Total DecalinsTotal NaphthalenesTotal Phenanthrenes/AnthracenesTotal DibenzothiophenesTotal PAH (from naphthalene)
Surrogate Recoveries (%)
Naphthalene-d8Acenaphthene-d10Phenanthrene-d10Benzo(a)pyrene-d12
B = Result < 5 x procedural blankJ = Detected below Reporting Limit.U = Not Detected.N = QC value outside QC criteria.NA = Not Applicable
500 POOL 1 500 POOL 2 500 POOL 3
R1772-P R1773-P R1774-P06/23/06 06/23/06 06/23/0606/23/06 06/23/06 06/23/0606/30/06 06/30/06 06/30/06
85.91 86.23 86.96MUSSEL MUSSEL MUSSEL AVERAGE %RSD
9.41 9.92 9 9.44 4.881.42 1.52 2.08 1.67 21.26500 500 500
1.754 1.754 1.7463.088 2.885 2.099
ng/g, dry weight ng/g, dry weight ng/g, dry weight
0.9 J 0.78 J 0.81 J 0.83 7.52U U U NA NA
3.72 4.87 3.44 4.01 18.90U U U NA NAU U U NA NAU U U NA NAU U U NA NA
0.57 J 0.73 J 0.58 J 0.63 14.30
854.92 823.11 815.39 831.14 2.52305.58 309.4 265.03 293.34 8.38356.98 385.79 307.46 350.08 11.32115.29 117.46 98.63 110.46 9.33
1063.44 1116.06 927.42 1035.64 9.40
62 74 7462 73 7281 94 9262 70 73
Surrogate CorrectedAnalyzed by Sisson, Jeannine
7/20/2006 Final - Dry: T06-0239MS-Master_157-Final.xls

Project Client: Norwegian Institute for Water Research (NIVA)Project Name: NIVA - Analysis of Blue MusselsProject Number: N006783-0001
Client IDBattelle Batch IDBattelle IDCollection DateExtraction DateAnalysis DateMoisture Content (%)MatrixLipid Content (%, dry weight)Sample weight (g, dry weight)Pre-injection Volume (uL)Dilution FactorReporting LimitReporting Unit
cis-Decalintrans-DecalinC1-DecalinsC2-DecalinsC3-DecalinsC4-DecalinsBenzo(b)thiopheneC1-benzo(b)thiophenesC2-benzo(b)thiophenesC3-benzo(b)thiophenesC4-benzo(b)thiophenesNaphthaleneC1-NaphthalenesC2-NaphthalenesC3-NaphthalenesC4-NaphthalenesBiphenylAcenaphthyleneAcenaphtheneDibenzofuranFluoreneC1-FluorenesC2-FluorenesC3-FluorenesAnthracenePhenanthreneC1-Phenanthrenes/AnthracenesC2-Phenanthrenes/AnthracenesC3-Phenanthrenes/AnthracenesC4-Phenanthrenes/AnthracenesDibenzothiopheneC1-DibenzothiophenesC2-DibenzothiophenesC3-DibenzothiophenesC4-DibenzothiophenesFluoranthenePyreneC1-Fluoranthenes/PyrenesC2-Fluoranthenes/PyrenesC3-Fluoranthenes/PyrenesBenzo(a)anthraceneChryseneC1-ChrysenesC2-ChrysenesC3-ChrysenesC4-Chrysenes
600 POOL 1 600 POOL 2 600 POOL 3
R1775-P R1776-P R1777-P06/23/06 06/23/06 06/23/0606/23/06 06/23/06 06/23/0607/01/06 07/01/06 07/01/06
86.06 86.27 85.39MUSSEL MUSSEL MUSSEL AVERAGE %RSD
9.46 9.01 10.08 9.52 5.652.20 2.12 1.60 1.97 16.51500 500 500
1.754 1.754 1.7541.993 2.068 2.741
ng/g, dry weight ng/g, dry weight ng/g, dry weight
1.04 J 1.32 J 1.48 J 1.28 17.4016.4 26.23 21.86 21.50 22.91
127.36 164.5 152.21 148.02 12.78366.05 429.22 429.41 408.23 8.95332.38 424.67 427.66 394.90 13.72
615.6 769.05 751.91 712.19 11.81U U U NA NAU U U NA NAU U U NA NAU U U NA NAU U U NA NA
10.87 B 9.03 B 10.37 B 10.09 9.4325.58 23.36 26.25 25.06 6.0474.22 89.61 92.46 85.43 11.49
151.61 182.3 165.96 166.62 9.22160.22 191.36 194.12 181.90 10.35
4.19 3.62 4.17 3.99 8.10U U U NA NAU U U NA NA
4.21 4.88 4.49 4.53 7.436.46 7.35 8.33 7.38 12.67
28.49 30.49 27.97 28.98 4.59102.54 99.24 95.69 99.16 3.45142.31 145.93 131.27 139.84 5.46
U U U NA NA23.97 27.14 29.4 26.84 10.1691.39 104.04 106.91 100.78 8.19
188.08 215.49 209.69 204.42 7.07153.64 179.04 170.96 167.88 7.73
64.29 59.63 55.61 59.84 7.262.84 3.05 3.41 3.10 9.30
19.05 22.67 24.63 22.12 12.8052.33 56.45 55.54 54.77 3.9576.57 64.93 62.16 67.89 11.26
36.9 39.69 36.07 37.55 5.0512.85 16.11 15.96 14.97 12.29
8.59 9.06 6.84 8.16 14.3325.89 27.81 24.46 26.05 6.4536.67 42.6 39.09 39.45 7.5635.88 39.57 34.61 36.69 7.02
U U U NA NA16.36 18 16.93 17.10 4.8714.92 18.44 15.9 16.42 11.0613.92 14.52 12.3 13.58 8.46
6.65 9.44 10.47 8.85 22.32U U U NA NA
Surrogate CorrectedAnalyzed by Sisson, Jeannine
7/20/2006 Final - Dry: T06-0239MS-Master_157-Final.xls
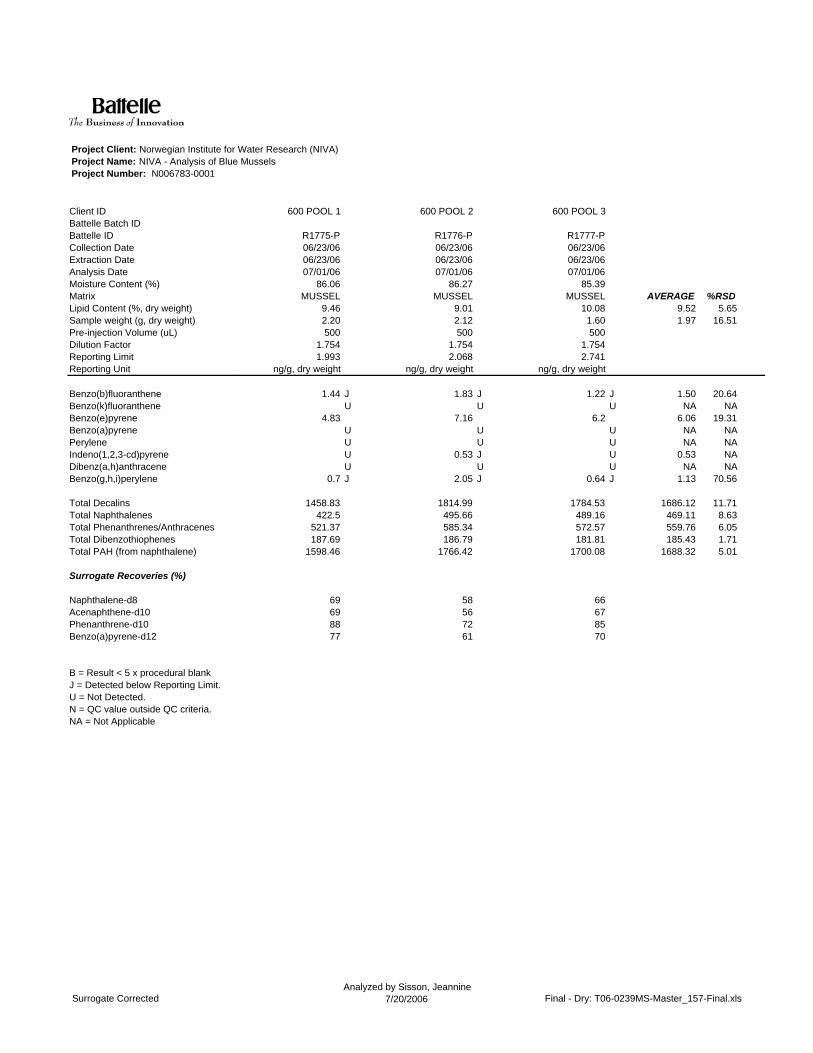
Project Client: Norwegian Institute for Water Research (NIVA)Project Name: NIVA - Analysis of Blue MusselsProject Number: N006783-0001
Client IDBattelle Batch IDBattelle IDCollection DateExtraction DateAnalysis DateMoisture Content (%)MatrixLipid Content (%, dry weight)Sample weight (g, dry weight)Pre-injection Volume (uL)Dilution FactorReporting LimitReporting Unit
Benzo(b)fluorantheneBenzo(k)fluorantheneBenzo(e)pyreneBenzo(a)pyrenePeryleneIndeno(1,2,3-cd)pyreneDibenz(a,h)anthraceneBenzo(g,h,i)perylene
Total DecalinsTotal NaphthalenesTotal Phenanthrenes/AnthracenesTotal DibenzothiophenesTotal PAH (from naphthalene)
Surrogate Recoveries (%)
Naphthalene-d8Acenaphthene-d10Phenanthrene-d10Benzo(a)pyrene-d12
B = Result < 5 x procedural blankJ = Detected below Reporting Limit.U = Not Detected.N = QC value outside QC criteria.NA = Not Applicable
600 POOL 1 600 POOL 2 600 POOL 3
R1775-P R1776-P R1777-P06/23/06 06/23/06 06/23/0606/23/06 06/23/06 06/23/0607/01/06 07/01/06 07/01/06
86.06 86.27 85.39MUSSEL MUSSEL MUSSEL AVERAGE %RSD
9.46 9.01 10.08 9.52 5.652.20 2.12 1.60 1.97 16.51500 500 500
1.754 1.754 1.7541.993 2.068 2.741
ng/g, dry weight ng/g, dry weight ng/g, dry weight
1.44 J 1.83 J 1.22 J 1.50 20.64U U U NA NA
4.83 7.16 6.2 6.06 19.31U U U NA NAU U U NA NAU 0.53 J U 0.53 NAU U U NA NA
0.7 J 2.05 J 0.64 J 1.13 70.56
1458.83 1814.99 1784.53 1686.12 11.71422.5 495.66 489.16 469.11 8.63
521.37 585.34 572.57 559.76 6.05187.69 186.79 181.81 185.43 1.71
1598.46 1766.42 1700.08 1688.32 5.01
69 58 6669 56 6788 72 8577 61 70
Surrogate CorrectedAnalyzed by Sisson, Jeannine
7/20/2006 Final - Dry: T06-0239MS-Master_157-Final.xls

Project Client: Norwegian Institute for Water Research (NIVA)Project Name: NIVA - Analysis of Blue MusselsProject Number: N006783-0001
Client IDBattelle Batch IDBattelle IDCollection DateExtraction DateAnalysis DateMoisture Content (%)MatrixLipid Content (%, dry weight)Sample weight (g, dry weight)Pre-injection Volume (uL)Dilution FactorReporting LimitReporting Unit
cis-Decalintrans-DecalinC1-DecalinsC2-DecalinsC3-DecalinsC4-DecalinsBenzo(b)thiopheneC1-benzo(b)thiophenesC2-benzo(b)thiophenesC3-benzo(b)thiophenesC4-benzo(b)thiophenesNaphthaleneC1-NaphthalenesC2-NaphthalenesC3-NaphthalenesC4-NaphthalenesBiphenylAcenaphthyleneAcenaphtheneDibenzofuranFluoreneC1-FluorenesC2-FluorenesC3-FluorenesAnthracenePhenanthreneC1-Phenanthrenes/AnthracenesC2-Phenanthrenes/AnthracenesC3-Phenanthrenes/AnthracenesC4-Phenanthrenes/AnthracenesDibenzothiopheneC1-DibenzothiophenesC2-DibenzothiophenesC3-DibenzothiophenesC4-DibenzothiophenesFluoranthenePyreneC1-Fluoranthenes/PyrenesC2-Fluoranthenes/PyrenesC3-Fluoranthenes/PyrenesBenzo(a)anthraceneChryseneC1-ChrysenesC2-ChrysenesC3-ChrysenesC4-Chrysenes
700 POOL 1 700 POOL 2 700 POOL 3
R1778-P R1779-P R1780-P06/23/06 06/23/06 06/23/0606/23/06 06/23/06 06/23/0607/01/06 07/01/06 07/06/06
86.82 86.71 86.62MUSSEL MUSSEL MUSSEL AVERAGE %RSD
9.31 9.47 9.27 9.35 1.131.99 2.04 2.04 2.02 1.43500 500 500
1.754 1.754 1.7542.204 2.150 2.150
ng/g, dry weight ng/g, dry weight ng/g, dry weight
U U U NA NA15.86 21.29 14.11 17.09 21.91
115.94 146.9 104.65 122.50 17.86329 397.25 313.03 346.43 12.91
320.34 360.59 316.03 332.32 7.40572.21 637.25 587.64 599.03 5.67
U U U NA NAU U U NA NAU U U NA NAU U U NA NAU U U NA NA
11.09 B 10.84 B 10.47 B 10.80 2.8929.28 31.78 28.77 29.94 5.3881.76 83.79 77.9 81.15 3.69
146.05 156.09 136.78 146.31 6.60162.14 158.74 144 154.96 6.22
4.37 5.07 4.81 4.75 7.45U U U NA NAU U U NA NA
4.43 4.51 4.63 4.52 2.236.7 7.2 6.63 6.84 4.54
26.49 24.76 25.07 25.44 3.6381.33 80.2 79.93 80.49 0.92106.1 123.33 116.62 115.35 7.53
U U U NA NA26.34 27.35 24.15 25.95 6.30
91.9 95.58 88.53 92.00 3.83181.76 191.45 178.36 183.86 3.69154.05 160.97 145.11 153.38 5.18
57.19 57.08 61.4 58.56 4.212.93 3.1 3.02 3.02 2.82
19.17 21.45 18.61 19.74 7.6251.73 54.67 50.33 52.24 4.2452.53 53.49 53.78 53.27 1.2333.56 33 34.97 33.84 3.0012.51 13.27 13.18 12.99 3.20
5.93 4.9 B 5.29 B 5.37 9.6822.43 22.47 22.71 22.54 0.6733.46 35.11 34.15 34.24 2.4234.11 33.68 31.35 33.05 4.49
U U U NA NA15.35 17.68 14.96 16.00 9.19
14.8 15.24 15.31 15.12 1.8313.19 13.01 11.59 12.60 6.96
7.86 7.81 8.9 8.19 7.51U U U NA NA
Surrogate CorrectedAnalyzed by Sisson, Jeannine
7/20/2006 Final - Dry: T06-0239MS-Master_157-Final.xls

Project Client: Norwegian Institute for Water Research (NIVA)Project Name: NIVA - Analysis of Blue MusselsProject Number: N006783-0001
Client IDBattelle Batch IDBattelle IDCollection DateExtraction DateAnalysis DateMoisture Content (%)MatrixLipid Content (%, dry weight)Sample weight (g, dry weight)Pre-injection Volume (uL)Dilution FactorReporting LimitReporting Unit
Benzo(b)fluorantheneBenzo(k)fluorantheneBenzo(e)pyreneBenzo(a)pyrenePeryleneIndeno(1,2,3-cd)pyreneDibenz(a,h)anthraceneBenzo(g,h,i)perylene
Total DecalinsTotal NaphthalenesTotal Phenanthrenes/AnthracenesTotal DibenzothiophenesTotal PAH (from naphthalene)
Surrogate Recoveries (%)
Naphthalene-d8Acenaphthene-d10Phenanthrene-d10Benzo(a)pyrene-d12
B = Result < 5 x procedural blankJ = Detected below Reporting Limit.U = Not Detected.N = QC value outside QC criteria.NA = Not Applicable
700 POOL 1 700 POOL 2 700 POOL 3
R1778-P R1779-P R1780-P06/23/06 06/23/06 06/23/0606/23/06 06/23/06 06/23/0607/01/06 07/01/06 07/06/06
86.82 86.71 86.62MUSSEL MUSSEL MUSSEL AVERAGE %RSD
9.31 9.47 9.27 9.35 1.131.99 2.04 2.04 2.02 1.43500 500 500
1.754 1.754 1.7542.204 2.150 2.150
ng/g, dry weight ng/g, dry weight ng/g, dry weight
1.13 J 1.51 J 1.3 J 1.31 14.49U U U NA NA
5.99 6.46 6.28 6.24 3.80U U U NA NAU U U NA NA
0.24 J 0.24 J 0.21 J 0.23 7.53U U U NA NA
0.66 J 0.79 J 0.81 J 0.75 10.81
1353.35 1563.28 1335.46 1417.36 8.94430.32 441.24 397.92 423.16 5.32511.24 532.43 497.55 513.74 3.42159.92 165.71 160.71 162.11 1.94
1498.56 1556.62 1459.91 1505.03 3.23
68 72 6866 71 6787 90 9071 73 76
Surrogate CorrectedAnalyzed by Sisson, Jeannine
7/20/2006 Final - Dry: T06-0239MS-Master_157-Final.xls

Project Client: Norwegian Institute for Water Research (NIVA)Project Name: NIVA - Analysis of Blue MusselsProject Number: N006783-0001
Client IDBattelle Batch IDBattelle IDCollection DateExtraction DateAnalysis DateMoisture Content (%)MatrixLipid Content (%, dry weight)Sample weight (g, dry weight)Pre-injection Volume (uL)Dilution FactorReporting LimitReporting Unit
cis-Decalintrans-DecalinC1-DecalinsC2-DecalinsC3-DecalinsC4-DecalinsBenzo(b)thiopheneC1-benzo(b)thiophenesC2-benzo(b)thiophenesC3-benzo(b)thiophenesC4-benzo(b)thiophenesNaphthaleneC1-NaphthalenesC2-NaphthalenesC3-NaphthalenesC4-NaphthalenesBiphenylAcenaphthyleneAcenaphtheneDibenzofuranFluoreneC1-FluorenesC2-FluorenesC3-FluorenesAnthracenePhenanthreneC1-Phenanthrenes/AnthracenesC2-Phenanthrenes/AnthracenesC3-Phenanthrenes/AnthracenesC4-Phenanthrenes/AnthracenesDibenzothiopheneC1-DibenzothiophenesC2-DibenzothiophenesC3-DibenzothiophenesC4-DibenzothiophenesFluoranthenePyreneC1-Fluoranthenes/PyrenesC2-Fluoranthenes/PyrenesC3-Fluoranthenes/PyrenesBenzo(a)anthraceneChryseneC1-ChrysenesC2-ChrysenesC3-ChrysenesC4-Chrysenes
800 POOL 1 800 POOL 2 800 POOL 3
R1781-P R1782-P R1783-P06/23/06 06/23/06 06/23/0606/23/06 06/23/06 06/23/0607/06/06 07/06/06 07/06/06
85.75 85.14 86.58MUSSEL MUSSEL MUSSEL AVERAGE %RSD
9.39 10.46 9.69 9.85 5.612.20 2.26 2.06 2.17 4.72500 500 500
1.754 1.754 1.7541.993 1.940 2.129
ng/g, dry weight ng/g, dry weight ng/g, dry weight
U U U NA NA27.82 38.2 30.26 32.09 16.91
220.08 251.12 225.57 232.26 7.13596.49 689.49 609.62 631.87 7.97
557.4 588.19 512 552.53 6.94927.17 1012.55 913.64 951.12 5.64
U U U NA NAU U U NA NAU U U NA NAU U U NA NAU U U NA NA
9.75 B 9.4 B 9.63 B 9.59 1.8527.88 27.98 26.33 27.40 3.3894.81 91.81 83.28 89.97 6.65
203.93 203.25 175.11 194.10 8.47241.35 245.11 222.09 236.18 5.23
4.56 4.77 5.41 4.91 9.01U U U NA NAU U U NA NA
4.32 4.77 4.38 4.49 5.448.84 7.12 7.6 7.85 11.30
36.96 37.94 35.04 36.65 4.03134.57 129.64 113.25 125.82 8.87219.31 198.4 189.02 202.24 7.67
U U U NA NA30.67 30.11 28.22 29.67 4.33
149.14 141.34 122.21 137.56 10.07343.61 302.77 276.1 307.49 11.06314.88 257.36 231.42 267.89 15.94113.04 95.03 91.81 99.96 11.45
3.56 3.4 3.45 3.47 2.3632.72 31.21 25.29 29.74 13.2089.43 83.91 82.44 85.26 4.32
112.77 94.05 83.28 96.70 15.4363.88 51.3 58.32 57.83 10.9017.43 16.49 17.08 17.00 2.79
8.37 7.79 7.77 7.98 4.2748.45 42.37 37.89 42.90 12.3582.42 62.39 59.16 67.99 18.5373.58 58.1 53.95 61.88 16.72
U 31.51 U 31.51 NA30.36 28.91 27.08 28.78 5.7139.43 28.81 28.31 32.18 19.5229.42 21.51 19.75 23.56 21.8619.35 14.02 10.09 14.49 32.08
U U U NA NA
Surrogate CorrectedAnalyzed by Sisson, Jeannine
7/20/2006 Final - Dry: T06-0239MS-Master_157-Final.xls
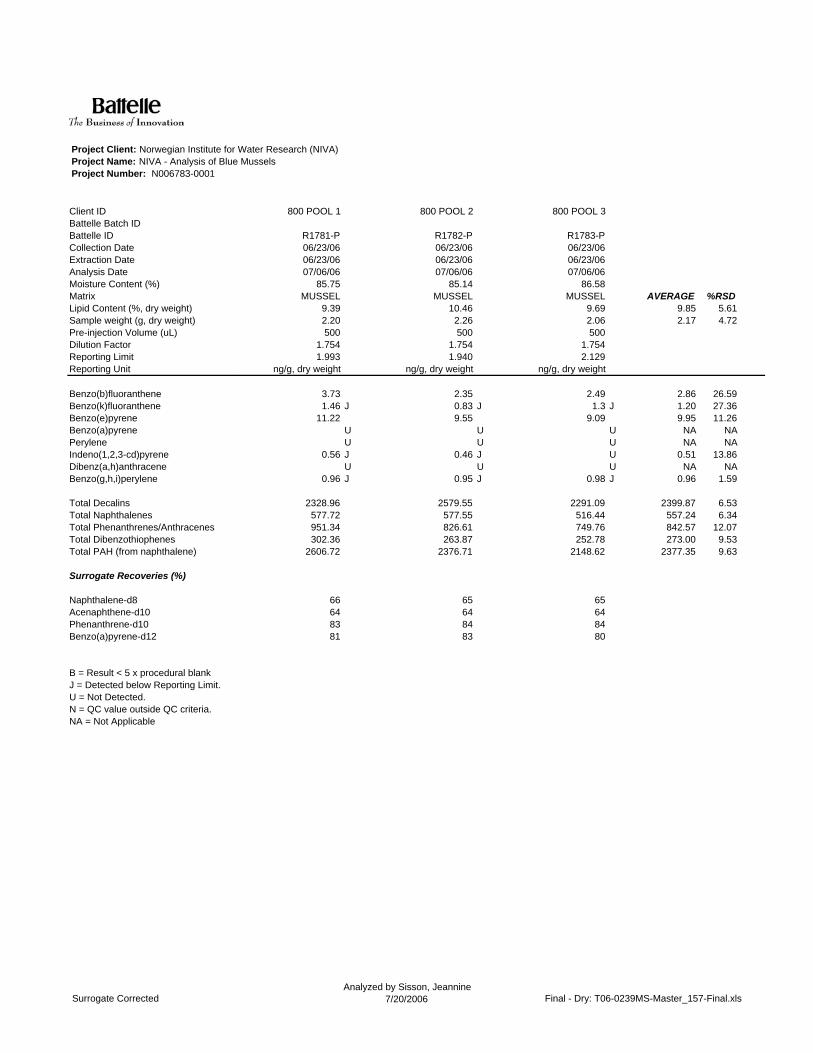
Project Client: Norwegian Institute for Water Research (NIVA)Project Name: NIVA - Analysis of Blue MusselsProject Number: N006783-0001
Client IDBattelle Batch IDBattelle IDCollection DateExtraction DateAnalysis DateMoisture Content (%)MatrixLipid Content (%, dry weight)Sample weight (g, dry weight)Pre-injection Volume (uL)Dilution FactorReporting LimitReporting Unit
Benzo(b)fluorantheneBenzo(k)fluorantheneBenzo(e)pyreneBenzo(a)pyrenePeryleneIndeno(1,2,3-cd)pyreneDibenz(a,h)anthraceneBenzo(g,h,i)perylene
Total DecalinsTotal NaphthalenesTotal Phenanthrenes/AnthracenesTotal DibenzothiophenesTotal PAH (from naphthalene)
Surrogate Recoveries (%)
Naphthalene-d8Acenaphthene-d10Phenanthrene-d10Benzo(a)pyrene-d12
B = Result < 5 x procedural blankJ = Detected below Reporting Limit.U = Not Detected.N = QC value outside QC criteria.NA = Not Applicable
800 POOL 1 800 POOL 2 800 POOL 3
R1781-P R1782-P R1783-P06/23/06 06/23/06 06/23/0606/23/06 06/23/06 06/23/0607/06/06 07/06/06 07/06/06
85.75 85.14 86.58MUSSEL MUSSEL MUSSEL AVERAGE %RSD
9.39 10.46 9.69 9.85 5.612.20 2.26 2.06 2.17 4.72500 500 500
1.754 1.754 1.7541.993 1.940 2.129
ng/g, dry weight ng/g, dry weight ng/g, dry weight
3.73 2.35 2.49 2.86 26.591.46 J 0.83 J 1.3 J 1.20 27.36
11.22 9.55 9.09 9.95 11.26U U U NA NAU U U NA NA
0.56 J 0.46 J U 0.51 13.86U U U NA NA
0.96 J 0.95 J 0.98 J 0.96 1.59
2328.96 2579.55 2291.09 2399.87 6.53577.72 577.55 516.44 557.24 6.34951.34 826.61 749.76 842.57 12.07302.36 263.87 252.78 273.00 9.53
2606.72 2376.71 2148.62 2377.35 9.63
66 65 6564 64 6483 84 8481 83 80
Surrogate CorrectedAnalyzed by Sisson, Jeannine
7/20/2006 Final - Dry: T06-0239MS-Master_157-Final.xls

Project Client: Norwegian Institute for Water Research (NIVA)Project Name: NIVA - Analysis of Blue MusselsProject Number: N006783-0001
Client ID Procedural Blank Procedural BlankBattelle Batch ID 06-0239 06-0239Battelle ID BJ094PB-P BJ095PB-PCollection Date 06/23/06 6/23/2006Extraction Date 06/23/06 6/23/2006Analysis Date 06/29/06 6/29/2006Moisture Content (%) 86.18 86.18Matrix MUSSEL MUSSELLipid Content (%, dry weight) NA NASample weight (g, wet weight) 13.32 13.32Pre-injection Volume (uL) 500 500Dilution Factor 1.667 1.667Reporting Limit 0.313 0.313Reporting Unit ng/g, wet weight ng/g, wet weight
cis-Decalin U Utrans-Decalin U UC1-Decalins U UC2-Decalins U UC3-Decalins U UC4-Decalins U UBenzo(b)thiophene U UC1-benzo(b)thiophenes U UC2-benzo(b)thiophenes U UC3-benzo(b)thiophenes U UC4-benzo(b)thiophenes U UNaphthalene 0.78 0.91C1-Naphthalenes 0.22 J 0.24 JC2-Naphthalenes U UC3-Naphthalenes U UC4-Naphthalenes U UBiphenyl U UAcenaphthylene U UAcenaphthene U UDibenzofuran U 0.14 JFluorene U 0.11 JC1-Fluorenes U 0.59C2-Fluorenes U 1.01 NC3-Fluorenes U UAnthracene U UPhenanthrene 0.38 0.92C1-Phenanthrenes/Anthracenes 0.42 1.82 NC2-Phenanthrenes/Anthracenes U 0.72C3-Phenanthrenes/Anthracenes U UC4-Phenanthrenes/Anthracenes U UDibenzothiophene 0.07 J 0.16 JC1-Dibenzothiophenes 0.23 J 0.81 NC2-Dibenzothiophenes U 0.52 NC3-Dibenzothiophenes U UC4-Dibenzothiophenes U UFluoranthene 0.09 J 0.2 JPyrene 0.15 J 0.36C1-Fluoranthenes/Pyrenes U UC2-Fluoranthenes/Pyrenes U UC3-Fluoranthenes/Pyrenes U UBenzo(a)anthracene U UChrysene U UC1-Chrysenes U UC2-Chrysenes U UC3-Chrysenes U UC4-Chrysenes U UBenzo(b)fluoranthene U U
Surrogate CorrectedAnalyzed by Sisson, Jeannine
7/20/2006 PB - Wet: T06-0239MS-Master_157-Final.xls
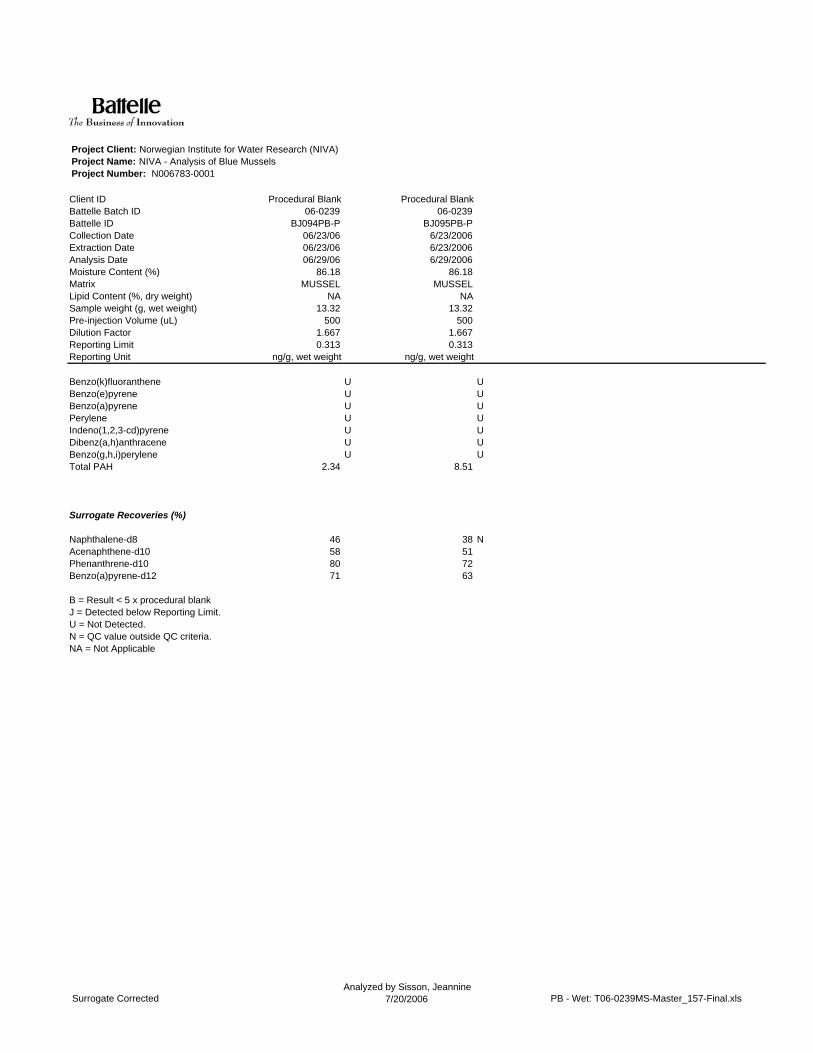
Project Client: Norwegian Institute for Water Research (NIVA)Project Name: NIVA - Analysis of Blue MusselsProject Number: N006783-0001
Client ID Procedural Blank Procedural BlankBattelle Batch ID 06-0239 06-0239Battelle ID BJ094PB-P BJ095PB-PCollection Date 06/23/06 6/23/2006Extraction Date 06/23/06 6/23/2006Analysis Date 06/29/06 6/29/2006Moisture Content (%) 86.18 86.18Matrix MUSSEL MUSSELLipid Content (%, dry weight) NA NASample weight (g, wet weight) 13.32 13.32Pre-injection Volume (uL) 500 500Dilution Factor 1.667 1.667Reporting Limit 0.313 0.313Reporting Unit ng/g, wet weight ng/g, wet weight
Benzo(k)fluoranthene U UBenzo(e)pyrene U UBenzo(a)pyrene U UPerylene U UIndeno(1,2,3-cd)pyrene U UDibenz(a,h)anthracene U UBenzo(g,h,i)perylene U UTotal PAH 2.34 8.51
Surrogate Recoveries (%)
Naphthalene-d8 46 38 NAcenaphthene-d10 58 51Phenanthrene-d10 80 72Benzo(a)pyrene-d12 71 63
B = Result < 5 x procedural blankJ = Detected below Reporting Limit.U = Not Detected.N = QC value outside QC criteria.NA = Not Applicable
Surrogate CorrectedAnalyzed by Sisson, Jeannine
7/20/2006 PB - Wet: T06-0239MS-Master_157-Final.xls
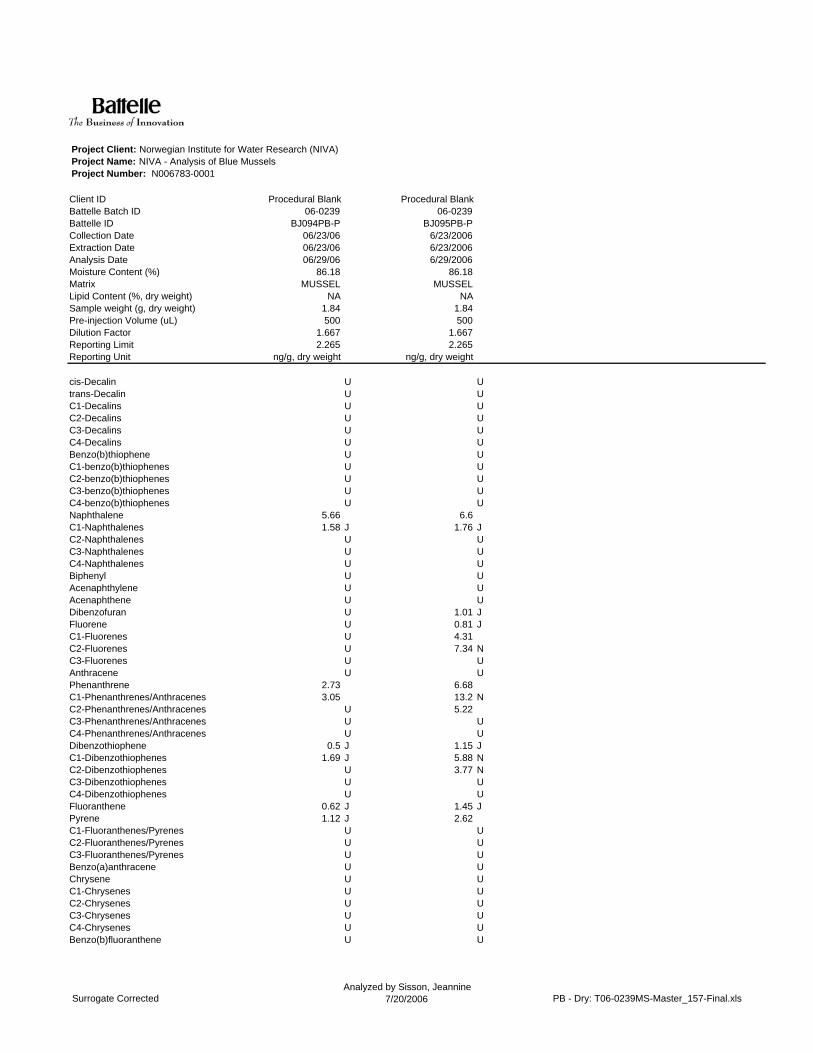
Project Client: Norwegian Institute for Water Research (NIVA)Project Name: NIVA - Analysis of Blue MusselsProject Number: N006783-0001
Client ID Procedural Blank Procedural BlankBattelle Batch ID 06-0239 06-0239Battelle ID BJ094PB-P BJ095PB-PCollection Date 06/23/06 6/23/2006Extraction Date 06/23/06 6/23/2006Analysis Date 06/29/06 6/29/2006Moisture Content (%) 86.18 86.18Matrix MUSSEL MUSSELLipid Content (%, dry weight) NA NASample weight (g, dry weight) 1.84 1.84Pre-injection Volume (uL) 500 500Dilution Factor 1.667 1.667Reporting Limit 2.265 2.265Reporting Unit ng/g, dry weight ng/g, dry weight
cis-Decalin U Utrans-Decalin U UC1-Decalins U UC2-Decalins U UC3-Decalins U UC4-Decalins U UBenzo(b)thiophene U UC1-benzo(b)thiophenes U UC2-benzo(b)thiophenes U UC3-benzo(b)thiophenes U UC4-benzo(b)thiophenes U UNaphthalene 5.66 6.6C1-Naphthalenes 1.58 J 1.76 JC2-Naphthalenes U UC3-Naphthalenes U UC4-Naphthalenes U UBiphenyl U UAcenaphthylene U UAcenaphthene U UDibenzofuran U 1.01 JFluorene U 0.81 JC1-Fluorenes U 4.31C2-Fluorenes U 7.34 NC3-Fluorenes U UAnthracene U UPhenanthrene 2.73 6.68C1-Phenanthrenes/Anthracenes 3.05 13.2 NC2-Phenanthrenes/Anthracenes U 5.22C3-Phenanthrenes/Anthracenes U UC4-Phenanthrenes/Anthracenes U UDibenzothiophene 0.5 J 1.15 JC1-Dibenzothiophenes 1.69 J 5.88 NC2-Dibenzothiophenes U 3.77 NC3-Dibenzothiophenes U UC4-Dibenzothiophenes U UFluoranthene 0.62 J 1.45 JPyrene 1.12 J 2.62C1-Fluoranthenes/Pyrenes U UC2-Fluoranthenes/Pyrenes U UC3-Fluoranthenes/Pyrenes U UBenzo(a)anthracene U UChrysene U UC1-Chrysenes U UC2-Chrysenes U UC3-Chrysenes U UC4-Chrysenes U UBenzo(b)fluoranthene U U
Surrogate CorrectedAnalyzed by Sisson, Jeannine
7/20/2006 PB - Dry: T06-0239MS-Master_157-Final.xls
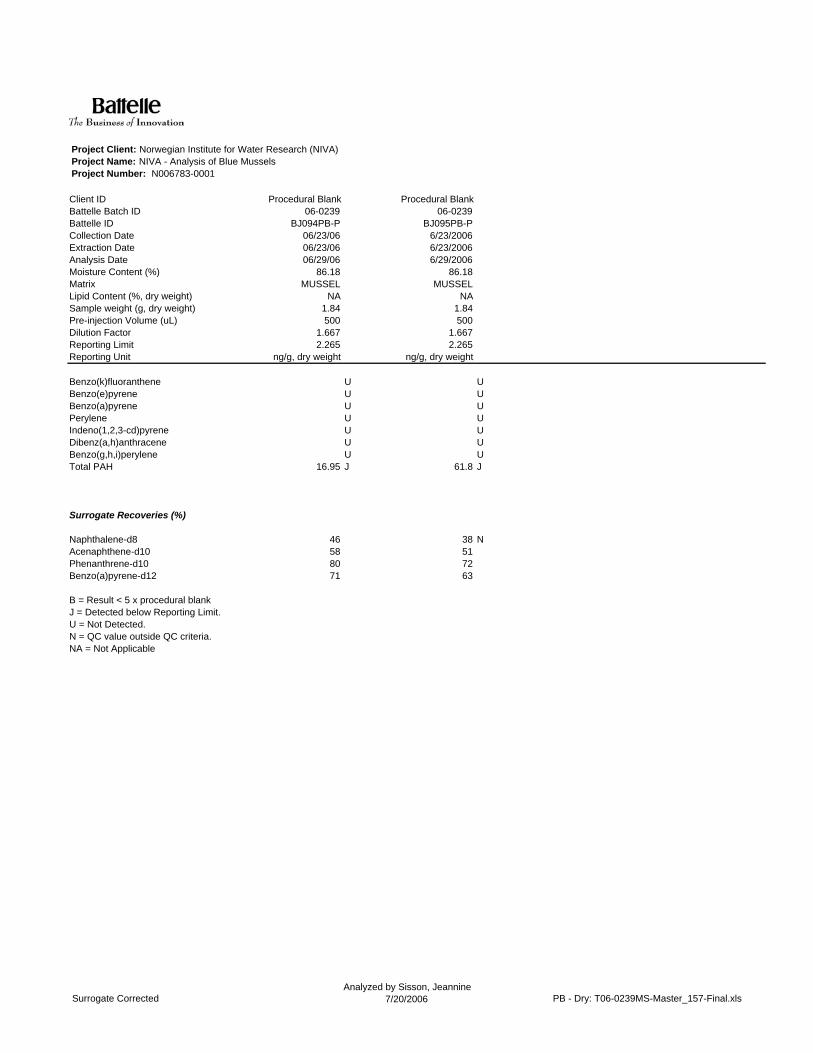
Project Client: Norwegian Institute for Water Research (NIVA)Project Name: NIVA - Analysis of Blue MusselsProject Number: N006783-0001
Client ID Procedural Blank Procedural BlankBattelle Batch ID 06-0239 06-0239Battelle ID BJ094PB-P BJ095PB-PCollection Date 06/23/06 6/23/2006Extraction Date 06/23/06 6/23/2006Analysis Date 06/29/06 6/29/2006Moisture Content (%) 86.18 86.18Matrix MUSSEL MUSSELLipid Content (%, dry weight) NA NASample weight (g, dry weight) 1.84 1.84Pre-injection Volume (uL) 500 500Dilution Factor 1.667 1.667Reporting Limit 2.265 2.265Reporting Unit ng/g, dry weight ng/g, dry weight
Benzo(k)fluoranthene U UBenzo(e)pyrene U UBenzo(a)pyrene U UPerylene U UIndeno(1,2,3-cd)pyrene U UDibenz(a,h)anthracene U UBenzo(g,h,i)perylene U UTotal PAH 16.95 J 61.8 J
Surrogate Recoveries (%)
Naphthalene-d8 46 38 NAcenaphthene-d10 58 51Phenanthrene-d10 80 72Benzo(a)pyrene-d12 71 63
B = Result < 5 x procedural blankJ = Detected below Reporting Limit.U = Not Detected.N = QC value outside QC criteria.NA = Not Applicable
Surrogate CorrectedAnalyzed by Sisson, Jeannine
7/20/2006 PB - Dry: T06-0239MS-Master_157-Final.xls

Project Client: Norwegian Institute for Water Research (NIVA)Project Name: NIVA - Analysis of Blue MusselsProject Number: N006783-0001
Client IDLaboratory Control
SampleBattelle Batch ID 06-0239Battelle ID BJ096LCS-PCollection Date 06/23/06Extraction Date 06/23/06Analysis Date 06/29/06Moisture Content (%) 79.14Matrix MUSSELLipid Content (%, dry weight) 6.09Sample weight (g, wet weight) 20.16Pre-injection Volume (uL) 500Dilution Factor 1.754Reporting Limit 0.218Reporting Unit ng/g, wet weight Target % Recovery Qualifier
cis-Decalin 31.59 53.39 59 Ntrans-Decalin 30.19 51.79 58 NC1-Decalins UC2-Decalins UC3-Decalins UC4-Decalins UBenzo(b)thiophene 36.13 49.64 73C1-benzo(b)thiophenes UC2-benzo(b)thiophenes UC3-benzo(b)thiophenes UC4-benzo(b)thiophenes UNaphthalene 33.77 49.61 68 NC1-Naphthalenes UC2-Naphthalenes UC3-Naphthalenes UC4-Naphthalenes UBiphenyl 37.79 49.69 76Acenaphthylene 36.41 49.65 73Acenaphthene 37.12 49.64 75Dibenzofuran 39.82 49.70 80Fluorene 36.93 49.63 74C1-Fluorenes UC2-Fluorenes UC3-Fluorenes UAnthracene 36.15 49.61 73Phenanthrene 33.89 49.63 68 NC1-Phenanthrenes/Anthracenes UC2-Phenanthrenes/Anthracenes UC3-Phenanthrenes/Anthracenes UC4-Phenanthrenes/Anthracenes UDibenzothiophene 32.65 49.83 66 NC1-Dibenzothiophenes UC2-Dibenzothiophenes UC3-Dibenzothiophenes UC4-Dibenzothiophenes UFluoranthene 33.77 49.63 68 NPyrene 34.53 49.62 70C1-Fluoranthenes/Pyrenes UC2-Fluoranthenes/Pyrenes UC3-Fluoranthenes/Pyrenes UBenzo(a)anthracene 27.75 49.62 56 NChrysene 27.77 49.62 56 NC1-Chrysenes UC2-Chrysenes UC3-Chrysenes UC4-Chrysenes U
Surrogate CorrectedAnalyzed by Sisson, Jeannine
7/20/2006 LCS: T06-0239MS-Master_157-Final.xls

Project Client: Norwegian Institute for Water Research (NIVA)Project Name: NIVA - Analysis of Blue MusselsProject Number: N006783-0001
Client IDLaboratory Control
SampleBattelle Batch ID 06-0239Battelle ID BJ096LCS-PCollection Date 06/23/06Extraction Date 06/23/06Analysis Date 06/29/06Moisture Content (%) 79.14Matrix MUSSELLipid Content (%, dry weight) 6.09Sample weight (g, wet weight) 20.16Pre-injection Volume (uL) 500Dilution Factor 1.754Reporting Limit 0.218Reporting Unit ng/g, wet weight Target % Recovery Qualifier
Benzo(b)fluoranthene 32.5 49.65 65 NBenzo(k)fluoranthene 38.17 49.63 77Benzo(e)pyrene 34.1 49.73 69 NBenzo(a)pyrene 35.29 49.64 71Perylene 38.52 49.70 78Indeno(1,2,3-cd)pyrene 34.25 49.63 69 NDibenz(a,h)anthracene 35.8 49.63 72Benzo(g,h,i)perylene 33.48 49.62 67 NTotal PAH 730.46
Surrogate Recoveries (%)
Naphthalene-d8 68Acenaphthene-d10 64Phenanthrene-d10 79Benzo(a)pyrene-d12 64
B = Result < 5 x procedural blankJ = Detected below Reporting Limit.U = Not Detected.N = QC value outside QC criteria.NA = Not Applicable
Surrogate CorrectedAnalyzed by Sisson, Jeannine
7/20/2006 LCS: T06-0239MS-Master_157-Final.xls
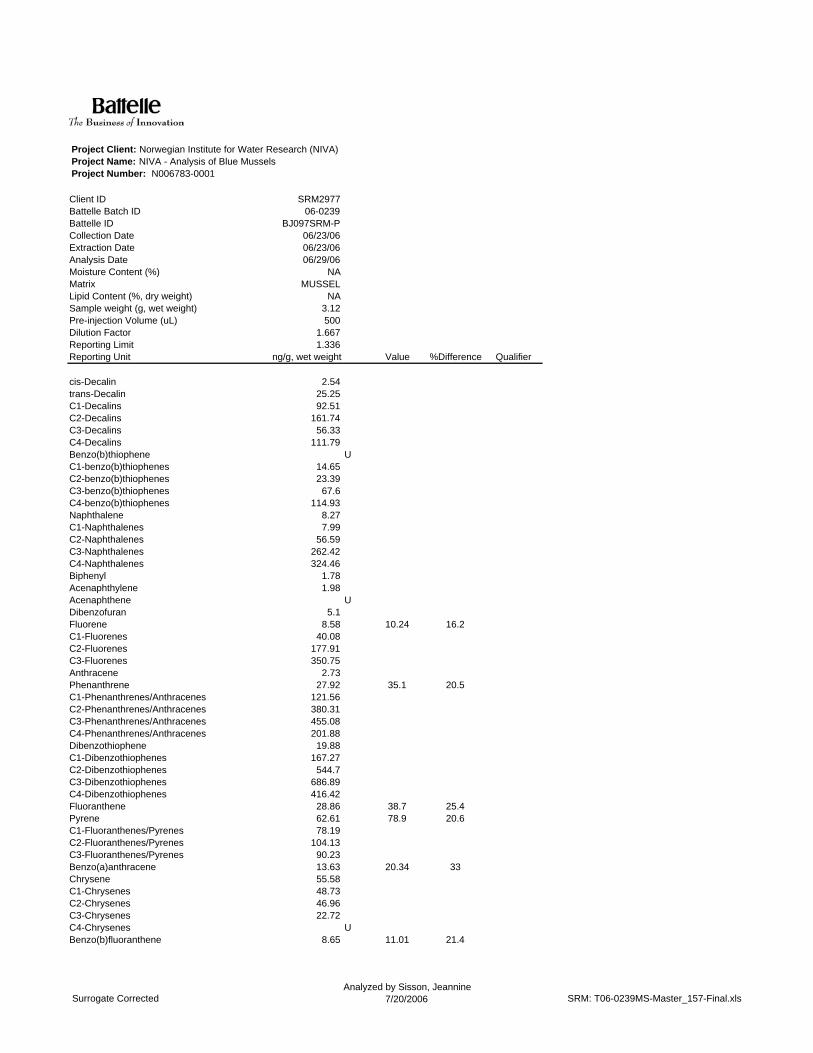
Project Client: Norwegian Institute for Water Research (NIVA)Project Name: NIVA - Analysis of Blue MusselsProject Number: N006783-0001
Client ID SRM2977Battelle Batch ID 06-0239Battelle ID BJ097SRM-PCollection Date 06/23/06Extraction Date 06/23/06Analysis Date 06/29/06Moisture Content (%) NAMatrix MUSSELLipid Content (%, dry weight) NASample weight (g, wet weight) 3.12Pre-injection Volume (uL) 500Dilution Factor 1.667Reporting Limit 1.336Reporting Unit ng/g, wet weight Value %Difference Qualifier
cis-Decalin 2.54trans-Decalin 25.25C1-Decalins 92.51C2-Decalins 161.74C3-Decalins 56.33C4-Decalins 111.79Benzo(b)thiophene UC1-benzo(b)thiophenes 14.65C2-benzo(b)thiophenes 23.39C3-benzo(b)thiophenes 67.6C4-benzo(b)thiophenes 114.93Naphthalene 8.27C1-Naphthalenes 7.99C2-Naphthalenes 56.59C3-Naphthalenes 262.42C4-Naphthalenes 324.46Biphenyl 1.78Acenaphthylene 1.98Acenaphthene UDibenzofuran 5.1Fluorene 8.58 10.24 16.2C1-Fluorenes 40.08C2-Fluorenes 177.91C3-Fluorenes 350.75Anthracene 2.73Phenanthrene 27.92 35.1 20.5C1-Phenanthrenes/Anthracenes 121.56C2-Phenanthrenes/Anthracenes 380.31C3-Phenanthrenes/Anthracenes 455.08C4-Phenanthrenes/Anthracenes 201.88Dibenzothiophene 19.88C1-Dibenzothiophenes 167.27C2-Dibenzothiophenes 544.7C3-Dibenzothiophenes 686.89C4-Dibenzothiophenes 416.42Fluoranthene 28.86 38.7 25.4Pyrene 62.61 78.9 20.6C1-Fluoranthenes/Pyrenes 78.19C2-Fluoranthenes/Pyrenes 104.13C3-Fluoranthenes/Pyrenes 90.23Benzo(a)anthracene 13.63 20.34 33Chrysene 55.58C1-Chrysenes 48.73C2-Chrysenes 46.96C3-Chrysenes 22.72C4-Chrysenes UBenzo(b)fluoranthene 8.65 11.01 21.4
Surrogate CorrectedAnalyzed by Sisson, Jeannine
7/20/2006 SRM: T06-0239MS-Master_157-Final.xls

Project Client: Norwegian Institute for Water Research (NIVA)Project Name: NIVA - Analysis of Blue MusselsProject Number: N006783-0001
Client ID SRM2977Battelle Batch ID 06-0239Battelle ID BJ097SRM-PCollection Date 06/23/06Extraction Date 06/23/06Analysis Date 06/29/06Moisture Content (%) NAMatrix MUSSELLipid Content (%, dry weight) NASample weight (g, wet weight) 3.12Pre-injection Volume (uL) 500Dilution Factor 1.667Reporting Limit 1.336Reporting Unit ng/g, wet weight Value %Difference Qualifier
Benzo(k)fluoranthene 8.03Benzo(e)pyrene 12.49 13.1 4.7Benzo(a)pyrene 4.15 8.35 50.3 NPerylene 2.35 3.5 32.9Indeno(1,2,3-cd)pyrene 3.16 4.84 34.7Dibenz(a,h)anthracene 1.04 J 1.41 26.2Benzo(g,h,i)perylene 6.95 9.53 27.1Total PAH 4869.01
Surrogate Recoveries (%)
Naphthalene-d8 62Acenaphthene-d10 60Phenanthrene-d10 76Benzo(a)pyrene-d12 70
B = Result < 5 x procedural blankJ = Detected below Reporting Limit.U = Not Detected.N = QC value outside QC criteria.NA = Not Applicable
Surrogate CorrectedAnalyzed by Sisson, Jeannine
7/20/2006 SRM: T06-0239MS-Master_157-Final.xls
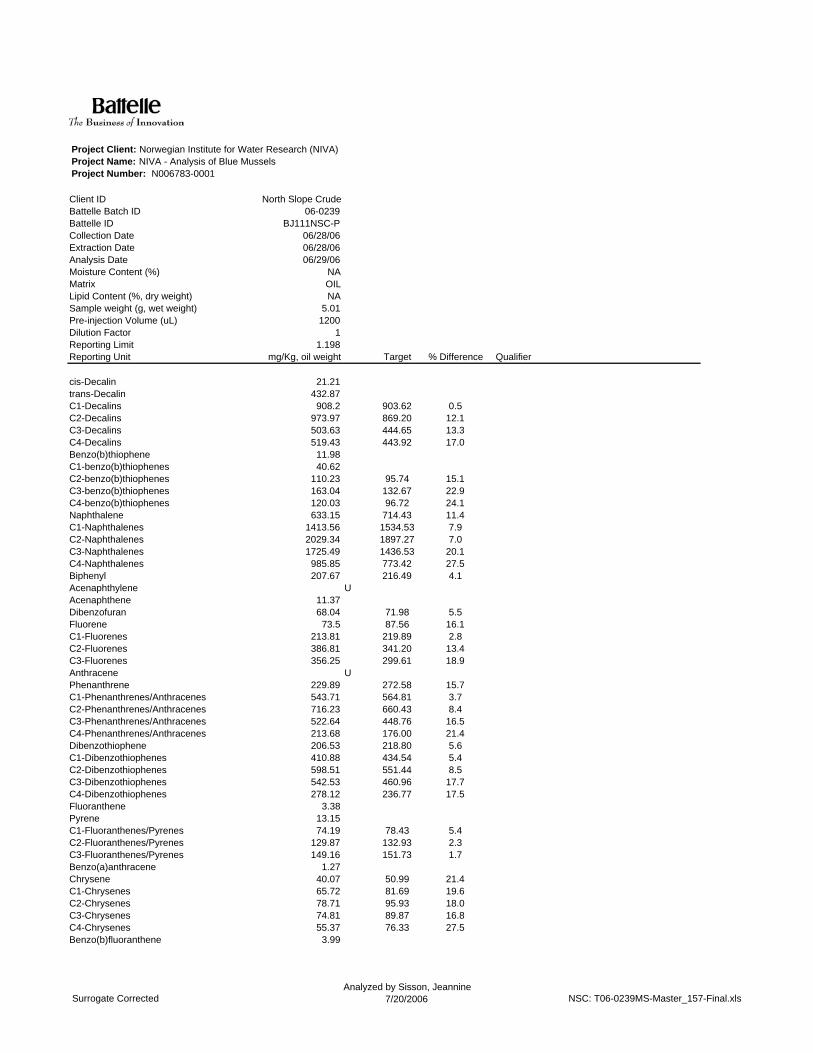
Project Client: Norwegian Institute for Water Research (NIVA)Project Name: NIVA - Analysis of Blue MusselsProject Number: N006783-0001
Client ID North Slope CrudeBattelle Batch ID 06-0239Battelle ID BJ111NSC-PCollection Date 06/28/06Extraction Date 06/28/06Analysis Date 06/29/06Moisture Content (%) NAMatrix OILLipid Content (%, dry weight) NASample weight (g, wet weight) 5.01Pre-injection Volume (uL) 1200Dilution Factor 1Reporting Limit 1.198Reporting Unit mg/Kg, oil weight Target % Difference Qualifier
cis-Decalin 21.21trans-Decalin 432.87C1-Decalins 908.2 903.62 0.5C2-Decalins 973.97 869.20 12.1C3-Decalins 503.63 444.65 13.3C4-Decalins 519.43 443.92 17.0Benzo(b)thiophene 11.98C1-benzo(b)thiophenes 40.62C2-benzo(b)thiophenes 110.23 95.74 15.1C3-benzo(b)thiophenes 163.04 132.67 22.9C4-benzo(b)thiophenes 120.03 96.72 24.1Naphthalene 633.15 714.43 11.4C1-Naphthalenes 1413.56 1534.53 7.9C2-Naphthalenes 2029.34 1897.27 7.0C3-Naphthalenes 1725.49 1436.53 20.1C4-Naphthalenes 985.85 773.42 27.5Biphenyl 207.67 216.49 4.1Acenaphthylene UAcenaphthene 11.37Dibenzofuran 68.04 71.98 5.5Fluorene 73.5 87.56 16.1C1-Fluorenes 213.81 219.89 2.8C2-Fluorenes 386.81 341.20 13.4C3-Fluorenes 356.25 299.61 18.9Anthracene UPhenanthrene 229.89 272.58 15.7C1-Phenanthrenes/Anthracenes 543.71 564.81 3.7C2-Phenanthrenes/Anthracenes 716.23 660.43 8.4C3-Phenanthrenes/Anthracenes 522.64 448.76 16.5C4-Phenanthrenes/Anthracenes 213.68 176.00 21.4Dibenzothiophene 206.53 218.80 5.6C1-Dibenzothiophenes 410.88 434.54 5.4C2-Dibenzothiophenes 598.51 551.44 8.5C3-Dibenzothiophenes 542.53 460.96 17.7C4-Dibenzothiophenes 278.12 236.77 17.5Fluoranthene 3.38Pyrene 13.15C1-Fluoranthenes/Pyrenes 74.19 78.43 5.4C2-Fluoranthenes/Pyrenes 129.87 132.93 2.3C3-Fluoranthenes/Pyrenes 149.16 151.73 1.7Benzo(a)anthracene 1.27Chrysene 40.07 50.99 21.4C1-Chrysenes 65.72 81.69 19.6C2-Chrysenes 78.71 95.93 18.0C3-Chrysenes 74.81 89.87 16.8C4-Chrysenes 55.37 76.33 27.5Benzo(b)fluoranthene 3.99
Surrogate CorrectedAnalyzed by Sisson, Jeannine
7/20/2006 NSC: T06-0239MS-Master_157-Final.xls
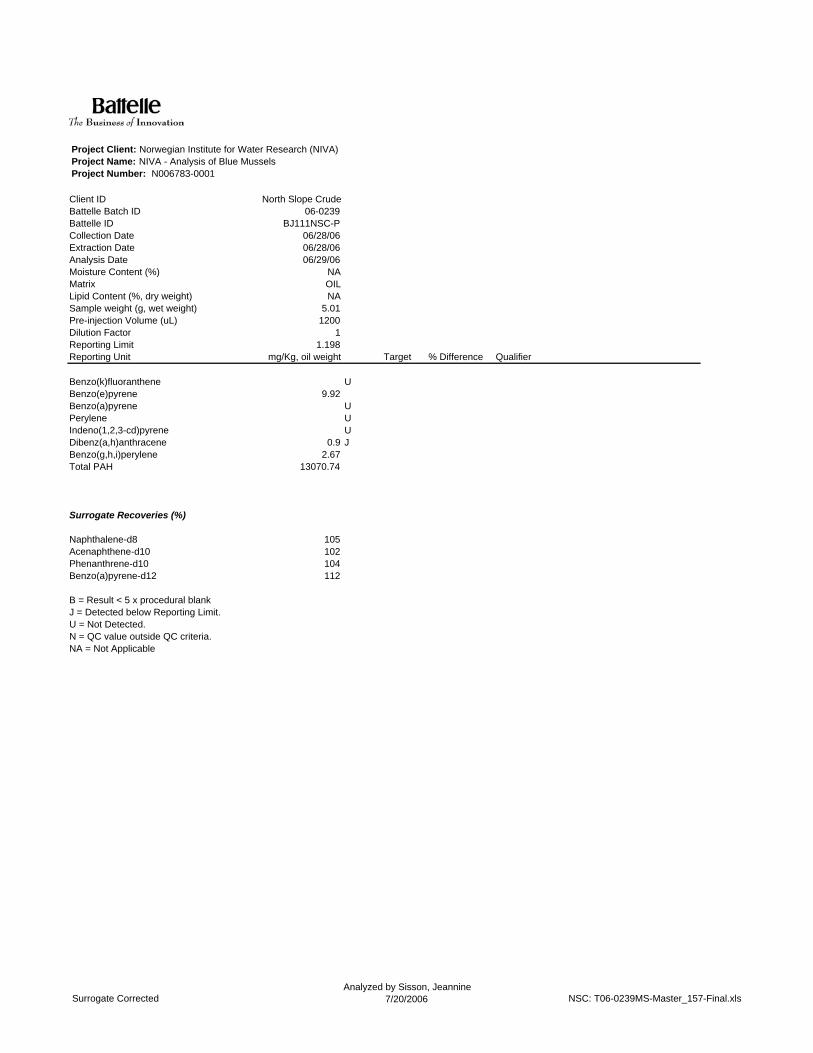
Project Client: Norwegian Institute for Water Research (NIVA)Project Name: NIVA - Analysis of Blue MusselsProject Number: N006783-0001
Client ID North Slope CrudeBattelle Batch ID 06-0239Battelle ID BJ111NSC-PCollection Date 06/28/06Extraction Date 06/28/06Analysis Date 06/29/06Moisture Content (%) NAMatrix OILLipid Content (%, dry weight) NASample weight (g, wet weight) 5.01Pre-injection Volume (uL) 1200Dilution Factor 1Reporting Limit 1.198Reporting Unit mg/Kg, oil weight Target % Difference Qualifier
Benzo(k)fluoranthene UBenzo(e)pyrene 9.92Benzo(a)pyrene UPerylene UIndeno(1,2,3-cd)pyrene UDibenz(a,h)anthracene 0.9 JBenzo(g,h,i)perylene 2.67Total PAH 13070.74
Surrogate Recoveries (%)
Naphthalene-d8 105Acenaphthene-d10 102Phenanthrene-d10 104Benzo(a)pyrene-d12 112
B = Result < 5 x procedural blankJ = Detected below Reporting Limit.U = Not Detected.N = QC value outside QC criteria.NA = Not Applicable
Surrogate CorrectedAnalyzed by Sisson, Jeannine
7/20/2006 NSC: T06-0239MS-Master_157-Final.xls