Energy Need Assessment and Preferential Choice Survey of ...
Warming-enhanced preferential microbial mineralizationof humified boreal forest soil organic matter:Interpretation of soil profiles along a climatetransect using laboratory incubations
Jianwei Li,1 Susan Ziegler,2 Chad S. Lane,2,3 and Sharon A. Billings1
Received 26 May 2011; revised 11 November 2011; accepted 25 February 2012; published 19 April 2012.
[1] Humified soil organic matter storage in boreal forests is large, and its responses towarming over relatively long timescales is critical for predicting soil feedbacks to climatechange. To derive information relevant across decades to centuries from manipulativeshort-term experiments, we conducted incubations of soils from two forested sites alongthe Newfoundland-Labrador Boreal Ecosystem Latitude Transect in eastern Canada andassessed linkages between incubation data and these sites’ profile characteristics. The sitesdiffer in mean annual temperature by 3.4�C, but vegetation and soil types are similar.Organic soils (Oe + Oa) were incubated for 120 days at 15�C and 20�C, with and without areplaced Oi subhorizon possessing a distinct d13C signature. Laboratory warming inducedsignificantly greater mineralization and leaching of humified SOM relative to replaced Oi,congruent with greater warming-induced increases in phenol oxidase activity relative toenzymes associated with labile C acquisition (percent increases of 101% versus 50%,respectively). These data suggest that warming can influence microbial communities andtheir enzymatic dynamics such that relative losses of humified SOM are disproportionatelyenhanced. This is consistent with stable isotopic, C:N, and radiocarbon profile differencesbetween the two sites, which suggest a greater degree of microbial processing andgreater relative losses of older SOC over the preceding decades at the warmer site, givenour knowledge of organic inputs in these soils. This study is a first step toward linkingthe divergent timescales represented by soil profiles and laboratory manipulations, animportant goal for biogeochemists assessing climate change impacts on SOM dynamics.
Citation: Li, J., S. Ziegler, C. S. Lane, and S. A. Billings (2012), Warming-enhanced preferential microbial mineralization ofhumified boreal forest soil organic matter: Interpretation of soil profiles along a climate transect using laboratory incubations,J. Geophys. Res., 117, G02008, doi:10.1029/2011JG001769.
1. Introduction
[2] Soil warming typically accelerates soil organic matter(SOM) decay and associated rates of CO2 flux to the atmo-sphere [Rustad et al., 2001; Bergner et al., 2004; Kirschbaum,2004; Bradford et al., 2008]. A 4 to 7�C increase in meanannual temperature (MAT) is expected this century in high-latitude ecosystems [Intergovernmental Panel on ClimateChange (IPCC), 2007]. Even a relatively small change inrespiratory losses from the large soil organic carbon (SOC)stocks in boreal forest ecosystems (179 Pg C [Schlesinger,1997]) could potentially influence atmospheric CO2 con-centrations. Therefore, quantifying the potential vulnerability
of this significant carbon pool to decomposition with warmingis important for accurate predictions of SOM feedbacks toclimate change. Because SOM is composed of many differentcompounds exhibiting varying degrees of recalcitrance andturnover times, understanding the temperature dependence ofbiogeochemical reactions driving transformations of differentSOM pools with warming is a particularly challenging task.[3] Predictions of SOM degradation with warming often
invoke the Arrhenius equation [Kirschbaum, 1995, 2004],which suggests that decay of humified SOM, possessing arelatively low reactivity and requiring high activation energiesfor decomposition (Ea), is more sensitive to temperature thanmore labile compounds. Studies documenting the greatersensitivity of lignin-derived compounds and lower-qualityorganic materials to warming [Fierer et al., 2005; Feng et al.,2008; Karhu et al., 2010] are consistent with this idea. How-ever, if microbial substrate availability is hindered by dwin-dling supply or limited soil moisture content and associateddiffusion of substrates to enzymatic reaction sites, heterotro-phic respiration may not exhibit the temperature sensitivitypredicted by enzyme kinetics [Davidson and Janssens, 2006].
1Department of Ecology and Evolutionary Biology, Kansas BiologicalSurvey, University of Kansas, Lawrence, Kansas, USA.
2Department of Earth Sciences, Memorial University of Newfoundland,St. John’s, Newfoundland, Canada.
3Now at Department of Geography and Geology, University of NorthCarolina Wilmington, Wilmington, North Carolina, USA.
Copyright 2012 by the American Geophysical Union.0148-0227/12/2011JG001769
JOURNAL OF GEOPHYSICAL RESEARCH, VOL. 117, G02008, doi:10.1029/2011JG001769, 2012
G02008 1 of 13
Indeed, warming can induce an ephemeral increase in soilrespiration, often attributed to depletion of labile SOC [Melilloet al., 2002; Eliasson et al., 2005; Knorr et al., 2005]. Thehighly varied responses of multiple SOM pools to warmingresult in continued controversy regarding the relative temper-ature sensitivity of decomposition of labile versus morehumified SOM pools [Giardina and Ryan, 2000; Thornleyand Cannell, 2001; Niinistö et al., 2004; Fang et al., 2005;Knorr et al., 2005; Bronson et al., 2008; Vanhala et al., 2008;Craine et al., 2010]. Further complicating our understandingof these issues, acclimation or adaptation of microbial physi-ology to soil warmingmaymitigate the temperature sensitivityof SOM decay on relatively short timescales [Luo et al., 2001;Bradford et al., 2008, 2010], though this concept is contro-versial [Hartley et al., 2008]. Thus, predicting SOM degra-dation with temperature variation is highly complex becauseof a suite of interactions between microbial substrate avail-ability and quality, microbial adaptations in structure andfunction, and enzyme kinetics [Davidson and Janssens, 2006;von Lutzow and Kogel-Knabner, 2009; Karhu et al., 2010;Wetterstedt et al., 2010].[4] An important, additional complication in studies of
SOM responses to temperature is the difficulty of linkingpatterns of decay across temporal and spatial scales. Forexample, linking laboratory warming experiments to obser-vations of SOM characteristics in intact soil profiles thatnaturally experience different temperature regimes may helpresolve temporal issues. Making such linkages, however, isdifficult for two key reasons. First, it is challenging to findsoil profiles similar in soil series, disturbance history, currentvegetation type and productivity, physicochemical attributesand precipitation regime, but that differ in MAT. Severalstudies report differences in profile characteristics and SOMturnover across temperature gradients [Trumbore et al.,1996; Leifeld et al., 2009], but the multiple varying factorsin addition to MAT usually make it difficult to elucidate thephysical or biological processes responsible for observeddifferences. Comparing such soil profiles would afford us anopportunity to assess the influence of only MAT over rela-tively long timescales. Further, the timescales over whichrelevant processes act vary greatly, from seconds to millen-nia [Janzen, 2004]. Short-term responses to warming underlaboratory conditions are thus difficult to link to profilecharacteristics governed by decades or centuries of manyinteracting processes.[5] We explore these issues by combining a laboratory
approach with field observations in soil profiles of twomesic boreal forests in eastern Canada. The sites are similarin soil type, vegetation, and disturbance history, but differin MAT by over three degrees. It is likely that in mesic andC-rich soils such as these, substrate availability for microbialtransformations likely remains sufficient across much of thegrowing season to permit enzyme kinetics to play a rela-tively dominant role in determining patterns of SOMdecomposition, compared to diffusion driven substrate lim-itations. Thus, they are well suited for exploring whetherprofile characteristics reveal evidence of greater rates ofSOM processing in a warmer environment, and whetherrelatively slow-turnover SOM compounds are more sensi-tive to temperature than their more labile counterparts. Fur-ther, roots are rare in these soils’ mineral horizons andinstead are concentrated in deep O horizons of these soils
(further discussed below). Thus, SOM characteristics in themineral horizons, where long-term storage is most feasible[Trumbore, 2000], are governed primarily by the quantityand composition of compounds transported from the O hori-zon and the biological and physicochemical processes towhich those compounds are subjected [Dawson et al., 1978],and markedly less so by direct vegetation input. As a result,characterizing O horizon responses to temperature mayreveal both the microbial mechanisms responsible for suchresponses, as well as the associated, potential change incomposition or quantity of material that becomes availablefor transport to the mineral horizons.[6] Invoking our two boreal forest sites, described below in
more detail, we ask, can we identify temperature-dependentmechanisms of O horizon decay that, extended acrossdecadal to centennial timescales, are consistent with obser-vations of these same profiles’ characteristics in the field?In asking such a question, we necessarily must work acrossdramatically divergent timescales, a task fraught with diffi-culties and discussed below. However, attempting to makesuch linkages is an important first step in expanding theapplicability of manipulative studies to observational soilprofile data. We address our questions by conducting labo-ratory incubations of O horizons for which the Oi subhorizonhas been replaced with an Oi source possessing a unique d13Csignature, and quantifying CO2 and dissolved organic C(DOC) released from these pools with warming, as well asquantifying exocellular enzymatic activities. We also definedepth distributions of SOM C:N ratios and stable isotopicand radiocarbon signatures from the two sites and assesswhether the mechanisms and trends exhibited in laboratorydata, if applied across time with all other factors held con-stant, are qualitatively congruent with observed profilecharacteristics.[7] Combining a laboratory incubation approach with
field data is not new, nor does it eliminate all of the chal-lenges described above. However, by conducting theseexplorations at sites comparable in most respects except forMAT, and where inputs to mineral horizons primarily con-sist of O horizon leachates, we can address several issuescritical for predicting soil feedbacks to climate change. First,we can assess microbial substrate choice with warming in Ohorizons by quantifying the extent to which warming influ-ences decay of labile Oi material versus more humified Oeand Oa subhorizons. This permits a qualitative assessment ofthe applicability of decay predictions in these soils withwarming as derived from enzyme kinetics. Second, we candetermine if these dynamics have implications for relativelylong-term C storage in these mineral profiles, where SOM islargely derived from O horizon processing compared todirect input from vegetation. Third, we can take a first steptoward linking short-term microbial processes to profilecharacteristics which integrate decades or centuries ofinputs, transformations, and outputs, in two soils similar inmost respects except MAT.
2. Materials and Methods
2.1. Site Description and Characteristics
[8] The island of Newfoundland and parts of Labrador liein the boreal forest biome. Soil profiles in the region exhibitrelatively high concentrations of SOC, consistent with
LI ET AL.: WARMING AND SOM MINERALIZATION G02008G02008
2 of 13
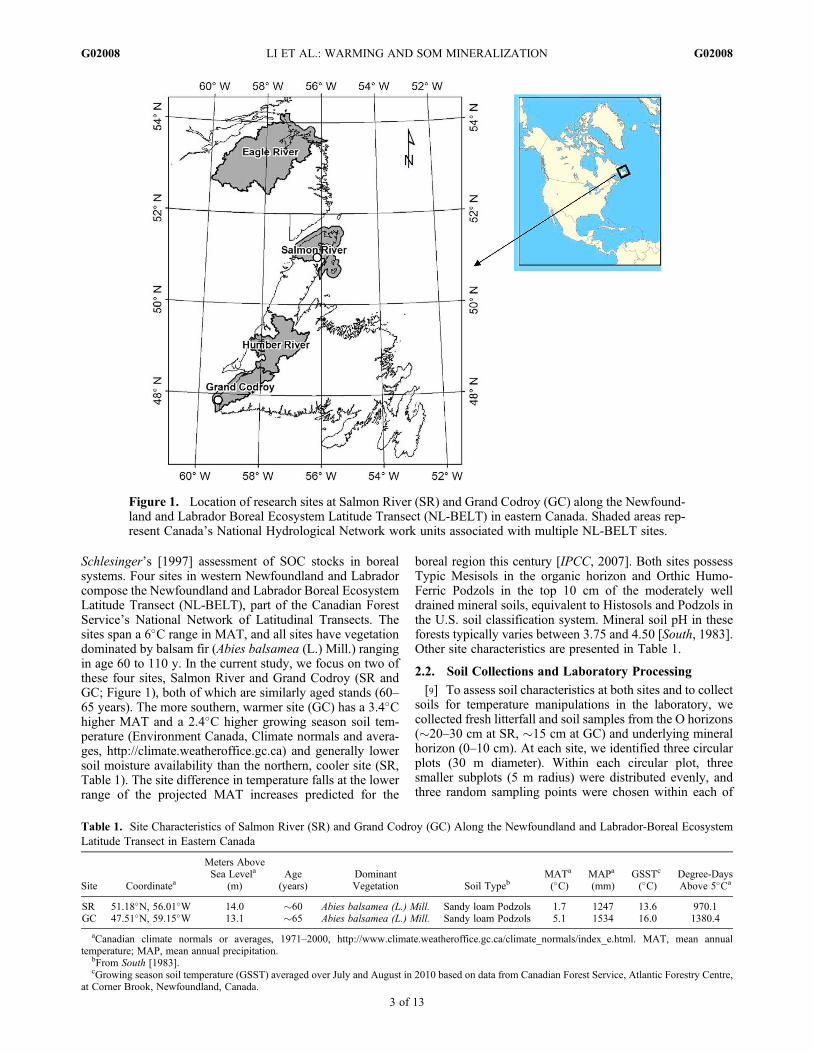
Schlesinger’s [1997] assessment of SOC stocks in borealsystems. Four sites in western Newfoundland and Labradorcompose the Newfoundland and Labrador Boreal EcosystemLatitude Transect (NL-BELT), part of the Canadian ForestService’s National Network of Latitudinal Transects. Thesites span a 6�C range in MAT, and all sites have vegetationdominated by balsam fir (Abies balsamea (L.) Mill.) rangingin age 60 to 110 y. In the current study, we focus on two ofthese four sites, Salmon River and Grand Codroy (SR andGC; Figure 1), both of which are similarly aged stands (60–65 years). The more southern, warmer site (GC) has a 3.4�Chigher MAT and a 2.4�C higher growing season soil tem-perature (Environment Canada, Climate normals and avera-ges, http://climate.weatheroffice.gc.ca) and generally lowersoil moisture availability than the northern, cooler site (SR,Table 1). The site difference in temperature falls at the lowerrange of the projected MAT increases predicted for the
boreal region this century [IPCC, 2007]. Both sites possessTypic Mesisols in the organic horizon and Orthic Humo-Ferric Podzols in the top 10 cm of the moderately welldrained mineral soils, equivalent to Histosols and Podzols inthe U.S. soil classification system. Mineral soil pH in theseforests typically varies between 3.75 and 4.50 [South, 1983].Other site characteristics are presented in Table 1.
2.2. Soil Collections and Laboratory Processing
[9] To assess soil characteristics at both sites and to collectsoils for temperature manipulations in the laboratory, wecollected fresh litterfall and soil samples from the O horizons(�20–30 cm at SR, �15 cm at GC) and underlying mineralhorizon (0–10 cm). At each site, we identified three circularplots (30 m diameter). Within each circular plot, threesmaller subplots (5 m radius) were distributed evenly, andthree random sampling points were chosen within each of
Figure 1. Location of research sites at Salmon River (SR) and Grand Codroy (GC) along the Newfound-land and Labrador Boreal Ecosystem Latitude Transect (NL-BELT) in eastern Canada. Shaded areas rep-resent Canada’s National Hydrological Network work units associated with multiple NL-BELT sites.
Table 1. Site Characteristics of Salmon River (SR) and Grand Codroy (GC) Along the Newfoundland and Labrador-Boreal EcosystemLatitude Transect in Eastern Canada
Site Coordinatea
Meters AboveSea Levela
(m)Age
(years)DominantVegetation Soil Typeb
MATa
(�C)MAPa
(mm)GSSTc
(�C)Degree-DaysAbove 5�Ca
SR 51.18�N, 56.01�W 14.0 �60 Abies balsamea (L.) Mill. Sandy loam Podzols 1.7 1247 13.6 970.1GC 47.51�N, 59.15�W 13.1 �65 Abies balsamea (L.) Mill. Sandy loam Podzols 5.1 1534 16.0 1380.4
aCanadian climate normals or averages, 1971–2000, http://www.climate.weatheroffice.gc.ca/climate_normals/index_e.html. MAT, mean annualtemperature; MAP, mean annual precipitation.
bFrom South [1983].cGrowing season soil temperature (GSST) averaged over July and August in 2010 based on data from Canadian Forest Service, Atlantic Forestry Centre,
at Corner Brook, Newfoundland, Canada.
LI ET AL.: WARMING AND SOM MINERALIZATION G02008G02008
3 of 13
these subplots. At each sampling point, we collected theentire organic horizon using a predesigned, rectangularframe (700 cm2). We chose a separate location within eachplot for collecting the mineral soil sample (0–10 cm). Thissampling scheme generated two sites with three plots at eachsite, and three replicates representing composited subplotsamples within each plot, for a total of 18 organic horizonsamples and 6 mineral soil samples. We also collected freshfir needles by cutting small branches from several dominanttrees in each plot. All samples were shipped to the Univer-sity of Kansas (KU) in coolers and subsequently stored at4�C until analysis.[10] We characterized O horizon samples by dividing
them into three subhorizons (Oi, Oe, and Oa). Materials inthe top layer (�0.5 to �1 cm in depth) typically varied incolor from the underlying soils, and were isolated andhomogenized to a sample we identified as the Oi subhorizon,which is primarily composed of fresh and slightly decom-posed litter. The lowest O horizon materials were separatedinto a sample we identified as the Oa subhorizon on the basisof the relatively dark color and high root density in com-parison to overlying subhorizons. The remaining materialwas identified as Oe subhorizon material. In those cases forwhich Oe and Oa horizons were not clearly differentiated, allmaterial except Oi was regarded as one, Oea subhorizon.The following analyses were conducted on bulk soils at eachsubhorizon, consisting of multiple C pools and a differentratio of these pools at each subhorizon.[11] Soil moisture was determined by drying subsamples
for 24 h at 105�C. The organic matter content of all soilsamples was gravimetrically determined using loss on ignitionfor 4 h at 550�C. Oven-dried subsamples of O and mineralhorizon material (60�C) were ground to a fine powderfor analysis of total organic C and N, and d15N and d13C ona Costech ECS 4010 elemental analyzer (Costech Anal-ytical Technologies, California, USA) coupled to a FinniganMAT253 stable isotope mass spectrometer (Finnigan MAT,Bremen, Germany) at the University of Kansas. Subsampleswere similarly prepared for radiocarbon measurements, andsent to the Center for Applied Isotope Studies at the Univer-sity of Georgia for analysis on an accelerator mass spectro-meter (National Electrostatics Corporation, 1.5SDH-1 PelletronAccelerator Mass Spectrometer, Middleton, Wisconsin). TheD14C value was converted to a radiocarbon age (14C yr B.P.)and calibrated to calendar years before present (cal yr B.P.,where B.P. = A.D. 1950) using Calib 6.0.1 software [Stuiverand Reimer, 1993] and the data set of Reimer et al.[2009]. Age calibrations for samples containing greaterthan 100 percent modern radiocarbon (pMC) were calculatedusing the CALIBomb program [Telford et al., 2004; Reimeret al., 2009]. The rapid decline of radiocarbon in the atmo-sphere following the peak of atmospheric nuclear testingallows for high-resolution determinations of age based onexcess radiocarbon content. All calibrated ages were convertedto a single weighted mean age following the protocol ofTelford et al. [2004]. We present these data as both weightedmean calibrated ages and D14C, to limit problematic infer-ences about the age of biomass formed during nuclear testingperiods. We interpret each age determination as the mean ageof all soil carbon pools in a particular bulk soil sample.
2.3. Laboratory Incubation
[12] We composited Oe and Oa subsamples (with no Oi)from replicated subplots on an equal dry weight basis. Theincubation was conducted at 15�C and 20�C for 120 days.These temperatures are commonly observed in situ duringthe warmest weeks of the growing season at the southernsite, and represent the high end of the range observed at thenorthern site. We substituted the well-quantified, natural Oisubhorizons with proportional amounts of loblolly pine(Pinus taeda L.) litterfall grown with 13C-depleted CO2 atthe Duke FACE site [Hendrey et al., 1999; Andrews andSchlesinger, 2001; Billings and Ziegler, 2008]. This per-mitted us to supply an isotopic tracer to microbial commu-nities via a realistic substrate replacement instead of glucoseor other isolated compound, after which preferential sub-strate utilization is typically observed [Kuzyakov, 2010]. Theconiferous litter possessed a C concentration of 49.4% anda N concentration of 0.56%, resulting in a C:N of 88.2.Replaced Oi material d13C was�34.9‰, and d13C of naturalOea subhorizons was �28.5‰. The replaced Oi was groundon a Wiley mill and sterilized using a pressure cooker[Wright and Jawson, 2001] to ensure that mineralization wasperformed by microbial communities native to the incubatedOea horizons, and to promote adequate microbial accessi-bility of litter and Oea materials on the timescale of theseincubations. Though the bulk Oe + Oa material is composedof more labile organic material than the mineral materialunderlying it, its decades-old age signifies that it representsmore humified, microbially processed organic substratesrelative to our replaced litter [Beyer et al., 1993]. Thus, ourexperiment provides a suitable platform for examiningwarming effects on microbial choice of the two C pools,litter possessing a greater relative abundance of fast-turnovermaterial versus more humified SOC with relatively slowerturnover times.[13] Mesic Oe and Oa subhorizons (equivalent 10.0 g
dry weight total) were weighed into PVC cores (5 cmdiameter, 7.5 cm tall) and sealed at the bottom with glassfiber paper. The uniquely labeled Oi material (2.5 g) wasadded to the cores and well mixed with soils on the 1stand 62nd days of the incubation. These treatments arehereafter termed Oi + Oea treatment. The quantity of littermaterials (5.0 g) added approximated the mass of replacedOi material typically associated with the correspondingmass of incubated Oea material. We incubated an equiv-alent number of Oe + Oa subhorizons without litteradditions (hereafter, termed Oea treatments). Water wasadded to bring the soils from both sites to 75% of theirrespective soil water holding capacity (4.6 and 6.2 gH2Ogsoil�1 for GC and SR, respectively), a moisture content
acknowledged as promoting microbial activity in O hor-izons [Linn and Doran, 1984]. The PVC cores wereplaced in incubation jars (�1 L) on a layer of glass beadsto ensure that the cores did not rest in moisture at thebottom of the jar. A few milliliters of water were added tothe jar to keep the atmosphere within the jar relativelyhumid. The moisture loss in each core was monitoredevery other day and moisture levels were maintained byadding an equivalent amount of water lost in each PVCcore to ensure that diffusion of substrates to enzymaticreaction sites was not limited.
LI ET AL.: WARMING AND SOM MINERALIZATION G02008G02008
4 of 13
[14] Incubating jars were sealed with airtight lidsequipped with a septum for gas sampling, and two 14 mLgas samples were immediately taken from each jar toestablish starting conditions in the incubation vessels. Onesample was injected into a previously evacuated, airtightvial for analysis of CO2 concentration. The other samplewas injected into a previously evacuated, airtight Exetainer(Labco, Buckinghamshire, UK) for analysis of d13C ofCO2. Gas samples were taken and jars were aerated ondays 1, 5, 16, 32, 61, 63, 79, 104 and 120. Carbon dioxideconcentration data were obtained for every sampling date,and isotopic data were obtained on day 1, 32, 61 and 120.Carbon dioxide concentrations were measured via gas chro-matography (thermal conductivity detector, Varian CP3800,Varian Inc., Walnut Creek, California, United States). Thed13C values of respired CO2 were measured on a gas head-space sampling system (ThermoFinnigan GasBench II,ThermoFinnigan, Bremen, Germany) coupled to an isotoperatio mass spectrometer (DeltaPlus XP, ThermoFinnigan,Bremen, Germany). We calculated rates of CO2 productionusing concentration data, dry weight of the soil subsamples,and the headspace volume of each incubation vessel. Thecumulative respiration calculation assumes the respirationrate is constant until the next measurement was made.[15] We corrected for the influence of lab air on measured
[CO2] and d13C of CO2 in each jar using average values oflab air [CO2] (550 ppm) and its d13C value (�8‰). Thesenumbers represent the average of multiple samplings of labair during the incubation. On the basis of a mixing model,d13C of CO2 in our incubation jars (Oi + Oea) represents amixture of CO2 derived from laboratory air, respired SOMand replaced litter. We first derive d13C of mixed CO2-Cfrom respired SOM and replaced litter (equation (1)) byexcluding the influence of laboratory air CO2-C.
d13COiþOea ¼ d13COiþOeaþAir � VOiþOeaþAir � d13CAir � VAir
VOiþOeaþAir � VAirð1Þ
d13COi+Oea+Air and d13COi+Oea denote d13C of CO2-C fromSOM, litter, and laboratory air, and from SOM and replacedlitter, respectively. VOi+Oea+Air denotes the total concentrationof CO2 respired from SOM, the replaced litter, and ambientlaboratory CO2 introduced into the sample. VAir represents theCO2 concentration of laboratory air (550 ppm). We thenderived the proportion of respired CO2-C from SOM (Oea)in the total respiration from SOM and replaced litter(equation (2)).
POea ¼ d13COiþOea � d13COi
d13COea � d13COið2Þ
where POea denotes the proportion of respired CO2-C fromindigenous SOM (Oea), and d13COea and d13COi denote thed13C of SOM and replaced litter, respectively. We assumethat the difference between the d13C of respired CO2 and thed13C of the substrate from which it is derived is negligible,and that this offset is equivalent for both indigenous SOMand replaced litter. We elected to invoke the most simplisticassumption, in keeping with established protocols [O’Malleyet al., 1996; Phillips et al., 2005]. We used estimates of theproportions of material from which CO2 was derived andtotal respired CO2 within each jar to examine the priming
effect of Oi replacement; no significant positive primingeffects were detected on any sampling date.
2.4. Microbial Biomass and ExtracellularEnzyme Activities
[16] Soil subsamples were destructively sampled on day 0,5 and 120 to estimate microbial biomass. We employedchloroform fumigation-K2SO4 extraction [Brookes et al.,1985] and potassium persulfate (0.5M K2S2O4) digestionmethods to quantify microbial biomass C [Paul, 2007]. AllK2SO4 soil extracts were shaken on a mechanical shaker for1 h and then filtered through Whatman #40 filter paper.Extractable organic carbon (EOC) in fumigated and unfu-migated samples was analyzed colorimetrically on a Lachatautoanalyzer (Madison, Wisconsin, United States), and thedifference between fumigated and unfumigated treatmentsrepresents microbial biomass C.[17] At the end of the incubation (day 120), we extracted
dissolved organic C (DOC) to assess its concentration andd13C. Residual soils from each jar were leached with 100 mLof 0.001N NaHCO3 to provide a solution similar in ionicstrength to rainfall [Wickland et al., 2007]. The slurry wasthoroughly stirred and prefiltered with glass microfiber fil-ters (1.6 mm pore size), and final leachates were filteredthrough sterile, prerinsed disposable GF/F filters (0.45 mmpore size). Thirty milliliters of the leachate was frozen at�20�C in HDPE bottles for both DOC concentration andd13C analysis on an Aurora 1030 TOC Analyzer (OI Ana-lytical; College Station, TX, USA) interfaced with a Delta Vplus isotope ratio mass spectrometer (ThermoElectron;Bremen, Germany) via a Conflo III interface (ThermoElectron).The analytical precision for d13C analysis was 0.1‰.[18] On day 120, hydrolytic and oxidative extracellular
enzyme assays were performed according to protocols discussedin several studies [Sinsabaugh et al., 2000; Waldrop et al.,2003; Allison et al., 2008]. These measures represent potentialenzyme activities indicative of overall enzyme concentrations[Wallenstein and Weintraub, 2008] and the potential micro-bial capacity to process labile and relatively slow-turnoverSOM. We used fluorescently labeled substrates to index theenzymes a-1,4-glucosidase (AG), b-1,4-glucosidase (BG),cellobiohydrolase (CBH), b-1,4-xylosidase (BXYL) [Marxet al., 2001]. We also used colorimetric techniques toassess the potential activity of phenol oxidase (PHENOX)and peroxidase (PEROX) [Saiya-Cork et al., 2002]. In thisstudy, we consider labile C acquisition enzymes as the sumof AG, BG, CBH and BXYL.[19] For these assays, 1.0 g soil sample (fresh weight) was
homogenized by mixing with 125 mL of 50 mM sodiumacetate buffer (pH 5.3) for 30 s with a hand blender. Toquantify extracellular enzyme activities (EEA) for each soilsample, 16 replicate wells containing 200 mL soil slurry and50 mL of substrate were used. To calculate the quenchcoefficient, eight wells were used containing 200 mL soilslurry and 50 mL of standard (10 mM 4-methylumbelliferone(MUB)) for hydrolytic enzymes; an additional control(blank) was composed of eight wells pipetted with 200 mLsoil slurry. Negative controls consisted of eight wells with50 mL substrate and 200 mL buffer. Eight wells with 50 mLMUB or 7-Amino 4-methylcoumarin (MC) and 200 mLbuffer were used to derive the emission coefficient. We usedL-3,4-dihydroxyphenylalanine (DOPA) as a substrate for
LI ET AL.: WARMING AND SOM MINERALIZATION G02008G02008
5 of 13
phenol oxidase and peroxidase. The plates were incubated at15�C or 20�C, corresponding to their respective temperaturetreatments, for approximately 20 h. In each well of allfluorescence plates, 10 mL of 0.5 M NaOH was added toraise the MUB or MC emission coefficients to a detectablelevel. Fluorescence was assessed using a microtiter platefluorometer (Molecular Devices, Sunnyvale, California,United States) set to excitation wavelength of 365 nmand emission wavelength of 460 nm. Spectrophotometricactivity was quantified with a spectrophotometer (MolecularDevices, Sunnyvale, California, United States). We mea-sured the absorbance at 460 nm for PHENOX and PEROX.Measurements are presented as nmol activity h�1 gSOM
�1 .
2.5. Statistical Analysis
[20] We applied repeated measure ANOVA (PROCMIXED, SAS, Cary, North Carolina, United States) toassess the main effects of temperature, site, and their inter-action on soil respiration rate, d13C of respired CO2, pro-portion of CO2 respired from Oea, microbial biomass andEEA for multiple enzymes during the incubation for bothOea and Oi + Oea treatments. A separate repeated measureANOVA was conducted for days 1 to 61 (first litterreplacement) and for days 63 to 120 (second litter replace-ment) in Oi + Oea treatments, respectively. To assess ifchanges with warming in these same variables varied withsite, we applied repeated measure ANOVA on variable dif-ferences between two temperatures (values at 20�C minusthat at 15�C). Post hoc tests via Tukey-Kramer adjusted pvalues were also used to assess the effects of temperature,site or their interaction within each date if we observed asignificant interaction with date based on repeated measureANOVA. We also employed a two-way ANOVA test toassess the main effects of temperature, site and their inter-action on cumulative respiration (as distinct from respirationrates) and its difference between two temperatures (values at20�C minus that at 15�C) on each date in Oea and Oi + Oeatreatments, respectively. Paired t tests were used to compared15N, d13C and C:N between sites at each depth, and d13CDOC
and [DOC] between two temperature treatments. The overallaverage of each EEA across all dates was tested by two-wayANOVA to examine generalized temperature and site effects.
3. Results
3.1. Soil C and N Pools, Stable Isotopes,and Radiocarbon Age
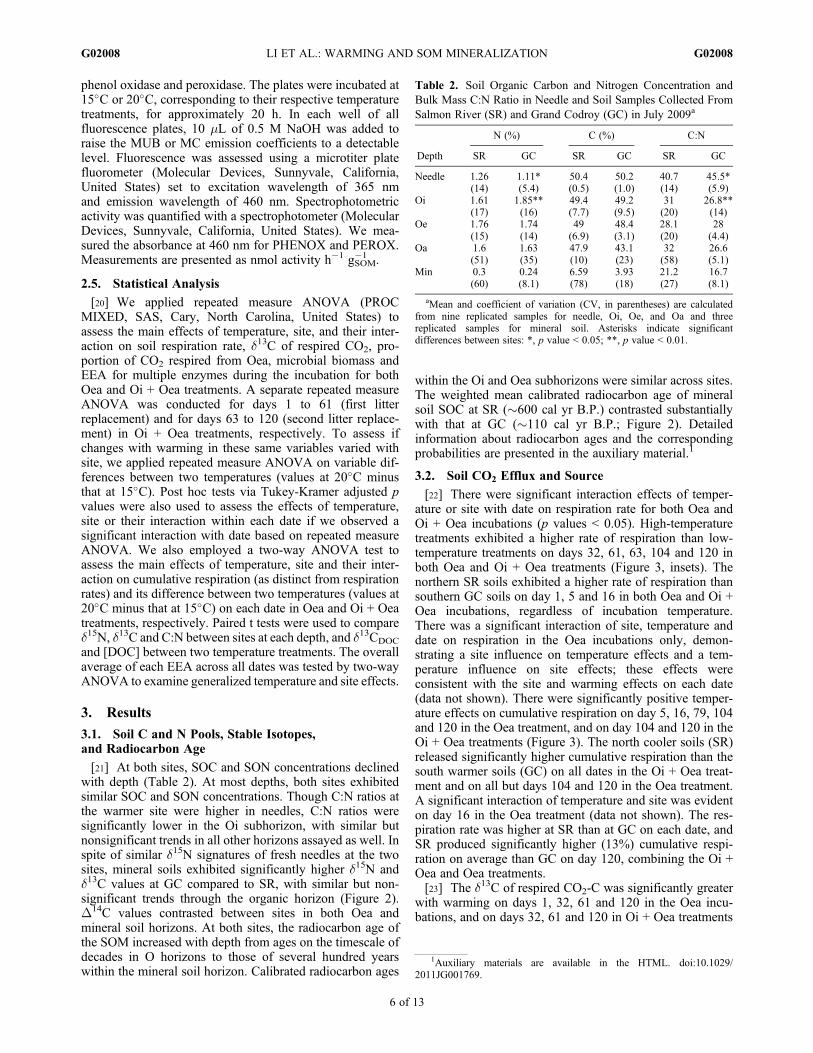
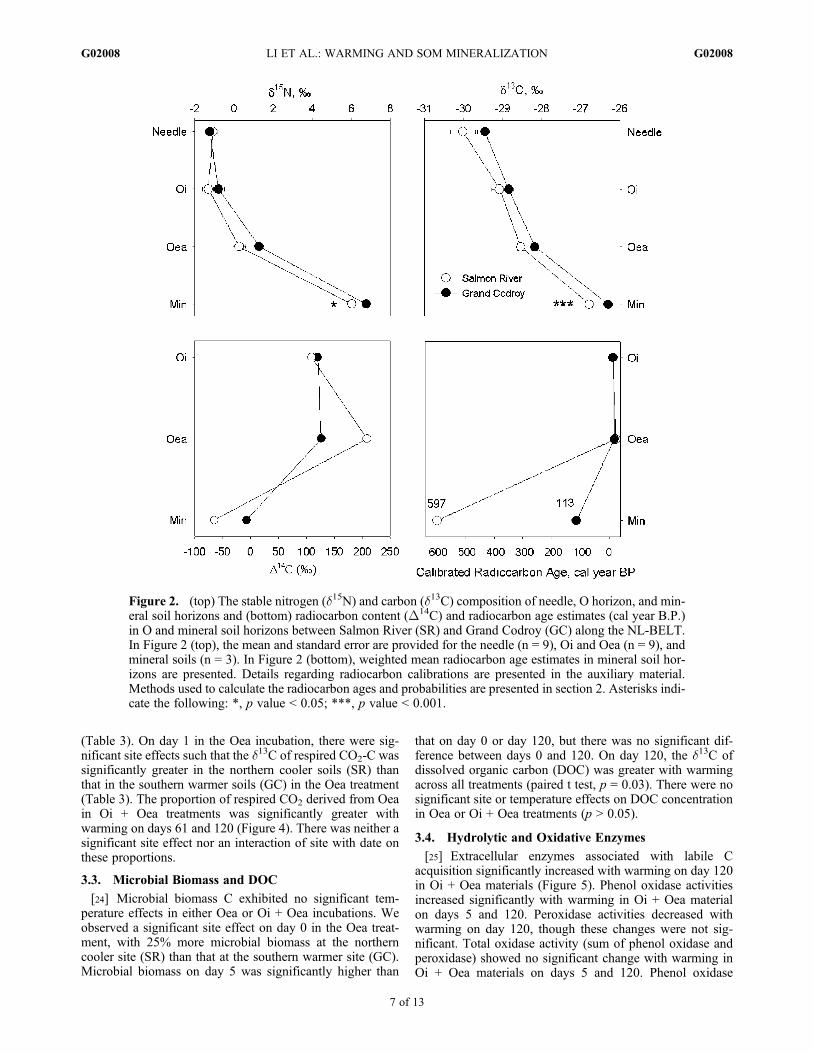
[21] At both sites, SOC and SON concentrations declinedwith depth (Table 2). At most depths, both sites exhibitedsimilar SOC and SON concentrations. Though C:N ratios atthe warmer site were higher in needles, C:N ratios weresignificantly lower in the Oi subhorizon, with similar butnonsignificant trends in all other horizons assayed as well. Inspite of similar d15N signatures of fresh needles at the twosites, mineral soils exhibited significantly higher d15N andd13C values at GC compared to SR, with similar but non-significant trends through the organic horizon (Figure 2).D14C values contrasted between sites in both Oea andmineral soil horizons. At both sites, the radiocarbon age ofthe SOM increased with depth from ages on the timescale ofdecades in O horizons to those of several hundred yearswithin the mineral soil horizon. Calibrated radiocarbon ages
within the Oi and Oea subhorizons were similar across sites.The weighted mean calibrated radiocarbon age of mineralsoil SOC at SR (�600 cal yr B.P.) contrasted substantiallywith that at GC (�110 cal yr B.P.; Figure 2). Detailedinformation about radiocarbon ages and the correspondingprobabilities are presented in the auxiliary material.1
3.2. Soil CO2 Efflux and Source
[22] There were significant interaction effects of temper-ature or site with date on respiration rate for both Oea andOi + Oea incubations (p values < 0.05). High-temperaturetreatments exhibited a higher rate of respiration than low-temperature treatments on days 32, 61, 63, 104 and 120 inboth Oea and Oi + Oea treatments (Figure 3, insets). Thenorthern SR soils exhibited a higher rate of respiration thansouthern GC soils on day 1, 5 and 16 in both Oea and Oi +Oea incubations, regardless of incubation temperature.There was a significant interaction of site, temperature anddate on respiration in the Oea incubations only, demon-strating a site influence on temperature effects and a tem-perature influence on site effects; these effects wereconsistent with the site and warming effects on each date(data not shown). There were significantly positive temper-ature effects on cumulative respiration on day 5, 16, 79, 104and 120 in the Oea treatment, and on day 104 and 120 in theOi + Oea treatments (Figure 3). The north cooler soils (SR)released significantly higher cumulative respiration than thesouth warmer soils (GC) on all dates in the Oi + Oea treat-ment and on all but days 104 and 120 in the Oea treatment.A significant interaction of temperature and site was evidenton day 16 in the Oea treatment (data not shown). The res-piration rate was higher at SR than at GC on each date, andSR produced significantly higher (13%) cumulative respi-ration on average than GC on day 120, combining the Oi +Oea and Oea treatments.[23] The d13C of respired CO2-C was significantly greater
with warming on days 1, 32, 61 and 120 in the Oea incu-bations, and on days 32, 61 and 120 in Oi + Oea treatments
Table 2. Soil Organic Carbon and Nitrogen Concentration andBulk Mass C:N Ratio in Needle and Soil Samples Collected FromSalmon River (SR) and Grand Codroy (GC) in July 2009a
Depth
N (%) C (%) C:N
SR GC SR GC SR GC
Needle 1.26(14)
1.11*(5.4)
50.4(0.5)
50.2(1.0)
40.7(14)
45.5*(5.9)
Oi 1.61(17)
1.85**(16)
49.4(7.7)
49.2(9.5)
31(20)
26.8**(14)
Oe 1.76(15)
1.74(14)
49(6.9)
48.4(3.1)
28.1(20)
28(4.4)
Oa 1.6(51)
1.63(35)
47.9(10)
43.1(23)
32(58)
26.6(5.1)
Min 0.3(60)
0.24(8.1)
6.59(78)
3.93(18)
21.2(27)
16.7(8.1)
aMean and coefficient of variation (CV, in parentheses) are calculatedfrom nine replicated samples for needle, Oi, Oe, and Oa and threereplicated samples for mineral soil. Asterisks indicate significantdifferences between sites: *, p value < 0.05; **, p value < 0.01.
1Auxiliary materials are available in the HTML. doi:10.1029/2011JG001769.
LI ET AL.: WARMING AND SOM MINERALIZATION G02008G02008
6 of 13
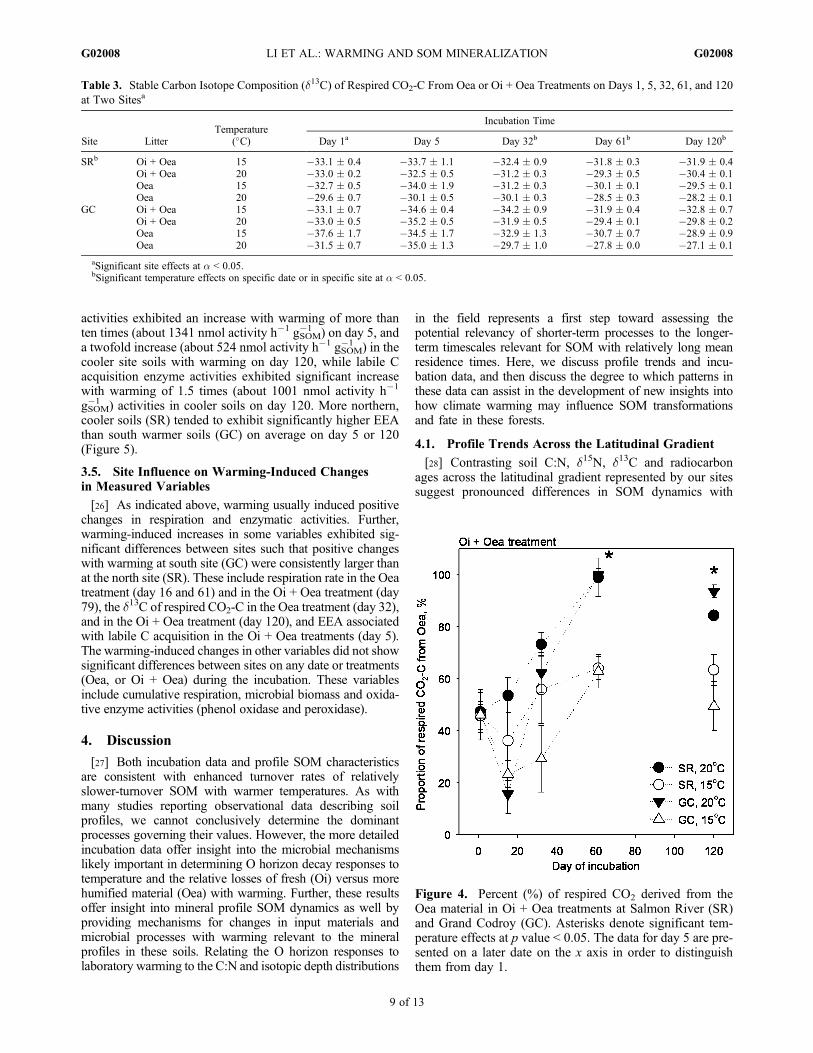
(Table 3). On day 1 in the Oea incubation, there were sig-nificant site effects such that the d13C of respired CO2-C wassignificantly greater in the northern cooler soils (SR) thanthat in the southern warmer soils (GC) in the Oea treatment(Table 3). The proportion of respired CO2 derived from Oeain Oi + Oea treatments was significantly greater withwarming on days 61 and 120 (Figure 4). There was neither asignificant site effect nor an interaction of site with date onthese proportions.
3.3. Microbial Biomass and DOC
[24] Microbial biomass C exhibited no significant tem-perature effects in either Oea or Oi + Oea incubations. Weobserved a significant site effect on day 0 in the Oea treat-ment, with 25% more microbial biomass at the northerncooler site (SR) than that at the southern warmer site (GC).Microbial biomass on day 5 was significantly higher than
that on day 0 or day 120, but there was no significant dif-ference between days 0 and 120. On day 120, the d13C ofdissolved organic carbon (DOC) was greater with warmingacross all treatments (paired t test, p = 0.03). There were nosignificant site or temperature effects on DOC concentrationin Oea or Oi + Oea treatments (p > 0.05).
3.4. Hydrolytic and Oxidative Enzymes
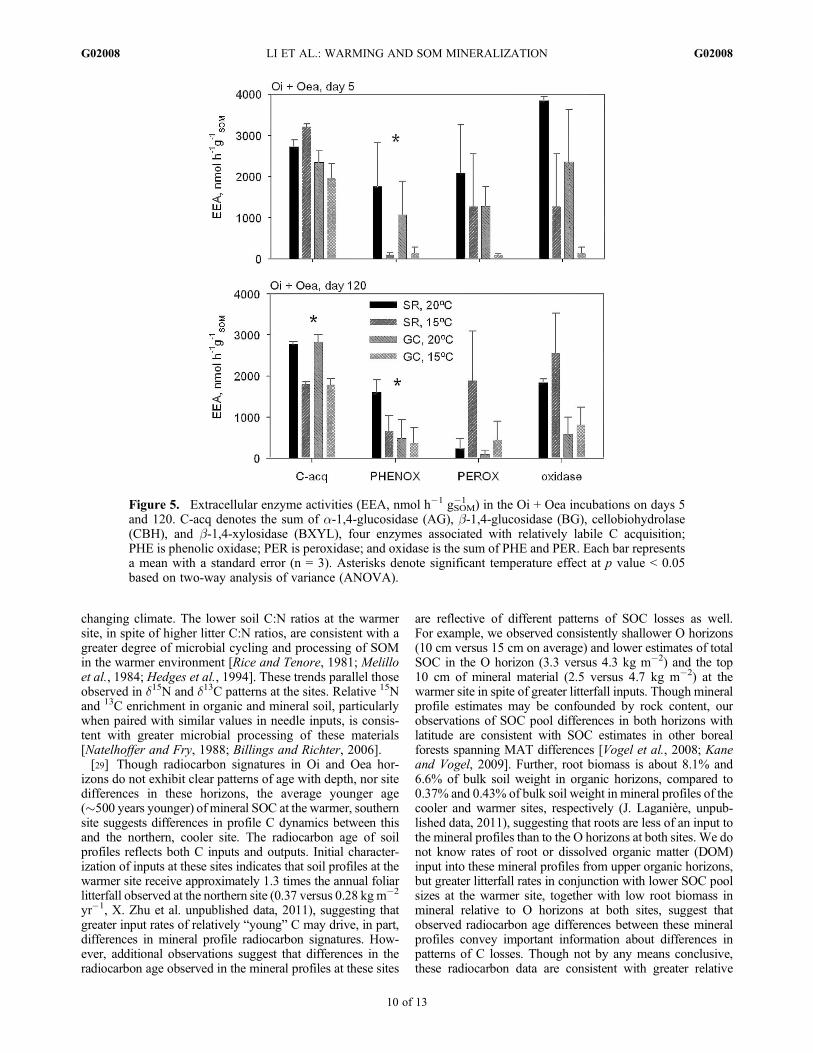
[25] Extracellular enzymes associated with labile Cacquisition significantly increased with warming on day 120in Oi + Oea materials (Figure 5). Phenol oxidase activitiesincreased significantly with warming in Oi + Oea materialon days 5 and 120. Peroxidase activities decreased withwarming on day 120, though these changes were not sig-nificant. Total oxidase activity (sum of phenol oxidase andperoxidase) showed no significant change with warming inOi + Oea materials on days 5 and 120. Phenol oxidase
Figure 2. (top) The stable nitrogen (d15N) and carbon (d13C) composition of needle, O horizon, and min-eral soil horizons and (bottom) radiocarbon content (D14C) and radiocarbon age estimates (cal year B.P.)in O and mineral soil horizons between Salmon River (SR) and Grand Codroy (GC) along the NL-BELT.In Figure 2 (top), the mean and standard error are provided for the needle (n = 9), Oi and Oea (n = 9), andmineral soils (n = 3). In Figure 2 (bottom), weighted mean radiocarbon age estimates in mineral soil hor-izons are presented. Details regarding radiocarbon calibrations are presented in the auxiliary material.Methods used to calculate the radiocarbon ages and probabilities are presented in section 2. Asterisks indi-cate the following: *, p value < 0.05; ***, p value < 0.001.
LI ET AL.: WARMING AND SOM MINERALIZATION G02008G02008
7 of 13
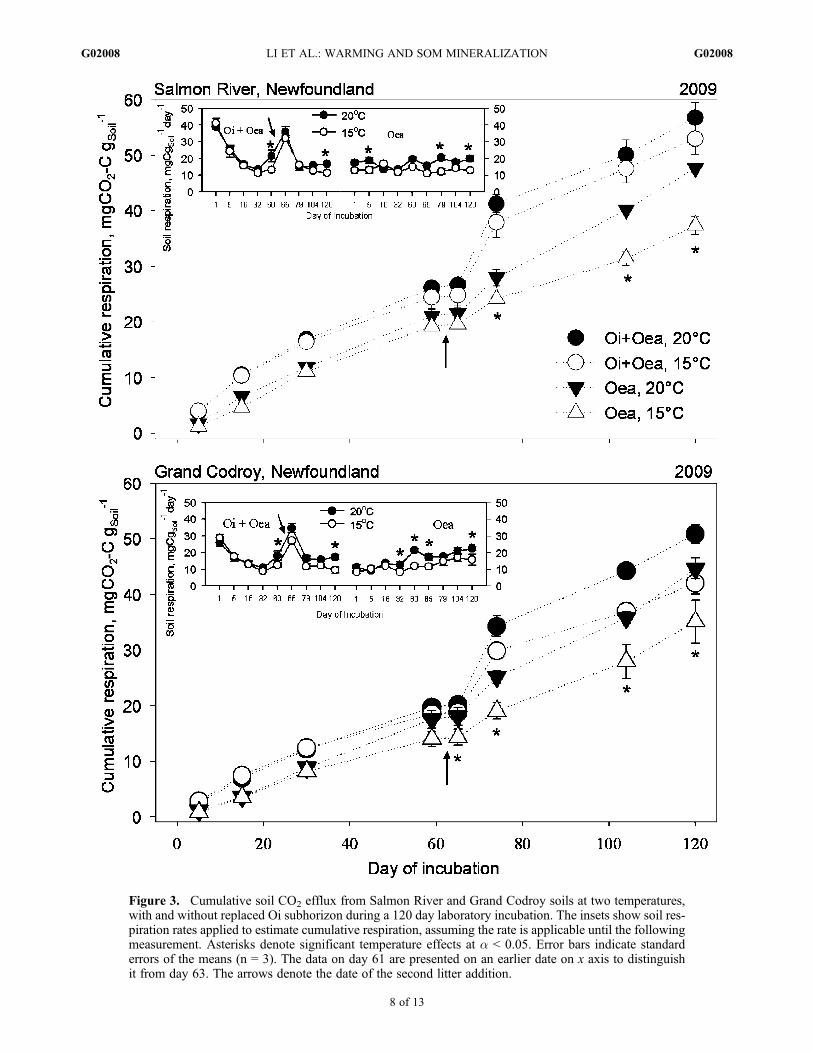
Figure 3. Cumulative soil CO2 efflux from Salmon River and Grand Codroy soils at two temperatures,with and without replaced Oi subhorizon during a 120 day laboratory incubation. The insets show soil res-piration rates applied to estimate cumulative respiration, assuming the rate is applicable until the followingmeasurement. Asterisks denote significant temperature effects at a < 0.05. Error bars indicate standarderrors of the means (n = 3). The data on day 61 are presented on an earlier date on x axis to distinguishit from day 63. The arrows denote the date of the second litter addition.
LI ET AL.: WARMING AND SOM MINERALIZATION G02008G02008
8 of 13
activities exhibited an increase with warming of more thanten times (about 1341 nmol activity h�1 gSOM
�1 ) on day 5, anda twofold increase (about 524 nmol activity h�1 gSOM
�1 ) in thecooler site soils with warming on day 120, while labile Cacquisition enzyme activities exhibited significant increasewith warming of 1.5 times (about 1001 nmol activity h�1
gSOM�1 ) activities in cooler soils on day 120. More northern,
cooler soils (SR) tended to exhibit significantly higher EEAthan south warmer soils (GC) on average on day 5 or 120(Figure 5).
3.5. Site Influence on Warming-Induced Changesin Measured Variables
[26] As indicated above, warming usually induced positivechanges in respiration and enzymatic activities. Further,warming-induced increases in some variables exhibited sig-nificant differences between sites such that positive changeswith warming at south site (GC) were consistently larger thanat the north site (SR). These include respiration rate in the Oeatreatment (day 16 and 61) and in the Oi + Oea treatment (day79), the d13C of respired CO2-C in the Oea treatment (day 32),and in the Oi + Oea treatment (day 120), and EEA associatedwith labile C acquisition in the Oi + Oea treatments (day 5).The warming-induced changes in other variables did not showsignificant differences between sites on any date or treatments(Oea, or Oi + Oea) during the incubation. These variablesinclude cumulative respiration, microbial biomass and oxida-tive enzyme activities (phenol oxidase and peroxidase).
4. Discussion
[27] Both incubation data and profile SOM characteristicsare consistent with enhanced turnover rates of relativelyslower-turnover SOM with warmer temperatures. As withmany studies reporting observational data describing soilprofiles, we cannot conclusively determine the dominantprocesses governing their values. However, the more detailedincubation data offer insight into the microbial mechanismslikely important in determining O horizon decay responses totemperature and the relative losses of fresh (Oi) versus morehumified material (Oea) with warming. Further, these resultsoffer insight into mineral profile SOM dynamics as well byproviding mechanisms for changes in input materials andmicrobial processes with warming relevant to the mineralprofiles in these soils. Relating the O horizon responses tolaboratory warming to the C:N and isotopic depth distributions
in the field represents a first step toward assessing thepotential relevancy of shorter-term processes to the longer-term timescales relevant for SOM with relatively long meanresidence times. Here, we discuss profile trends and incu-bation data, and then discuss the degree to which patterns inthese data can assist in the development of new insights intohow climate warming may influence SOM transformationsand fate in these forests.
4.1. Profile Trends Across the Latitudinal Gradient
[28] Contrasting soil C:N, d15N, d13C and radiocarbonages across the latitudinal gradient represented by our sitessuggest pronounced differences in SOM dynamics with
Table 3. Stable Carbon Isotope Composition (d13C) of Respired CO2-C From Oea or Oi + Oea Treatments on Days 1, 5, 32, 61, and 120at Two Sitesa
Site LitterTemperature
(�C)
Incubation Time
Day 1a Day 5 Day 32b Day 61b Day 120b
SRb Oi + Oea 15 �33.1 � 0.4 �33.7 � 1.1 �32.4 � 0.9 �31.8 � 0.3 �31.9 � 0.4Oi + Oea 20 �33.0 � 0.2 �32.5 � 0.5 �31.2 � 0.3 �29.3 � 0.5 �30.4 � 0.1Oea 15 �32.7 � 0.5 �34.0 � 1.9 �31.2 � 0.3 �30.1 � 0.1 �29.5 � 0.1Oea 20 �29.6 � 0.7 �30.1 � 0.5 �30.1 � 0.3 �28.5 � 0.3 �28.2 � 0.1
GC Oi + Oea 15 �33.1 � 0.7 �34.6 � 0.4 �34.2 � 0.9 �31.9 � 0.4 �32.8 � 0.7Oi + Oea 20 �33.0 � 0.5 �35.2 � 0.5 �31.9 � 0.5 �29.4 � 0.1 �29.8 � 0.2Oea 15 �37.6 � 1.7 �34.5 � 1.7 �32.9 � 1.3 �30.7 � 0.7 �28.9 � 0.9Oea 20 �31.5 � 0.7 �35.0 � 1.3 �29.7 � 1.0 �27.8 � 0.0 �27.1 � 0.1
aSignificant site effects at a < 0.05.bSignificant temperature effects on specific date or in specific site at a < 0.05.
Figure 4. Percent (%) of respired CO2 derived from theOea material in Oi + Oea treatments at Salmon River (SR)and Grand Codroy (GC). Asterisks denote significant tem-perature effects at p value < 0.05. The data for day 5 are pre-sented on a later date on the x axis in order to distinguishthem from day 1.
LI ET AL.: WARMING AND SOM MINERALIZATION G02008G02008
9 of 13
changing climate. The lower soil C:N ratios at the warmersite, in spite of higher litter C:N ratios, are consistent with agreater degree of microbial cycling and processing of SOMin the warmer environment [Rice and Tenore, 1981; Melilloet al., 1984; Hedges et al., 1994]. These trends parallel thoseobserved in d15N and d13C patterns at the sites. Relative 15Nand 13C enrichment in organic and mineral soil, particularlywhen paired with similar values in needle inputs, is consis-tent with greater microbial processing of these materials[Natelhoffer and Fry, 1988; Billings and Richter, 2006].[29] Though radiocarbon signatures in Oi and Oea hor-
izons do not exhibit clear patterns of age with depth, nor sitedifferences in these horizons, the average younger age(�500 years younger) of mineral SOC at the warmer, southernsite suggests differences in profile C dynamics between thisand the northern, cooler site. The radiocarbon age of soilprofiles reflects both C inputs and outputs. Initial character-ization of inputs at these sites indicates that soil profiles at thewarmer site receive approximately 1.3 times the annual foliarlitterfall observed at the northern site (0.37 versus 0.28 kg m�2
yr�1, X. Zhu et al. unpublished data, 2011), suggesting thatgreater input rates of relatively “young” C may drive, in part,differences in mineral profile radiocarbon signatures. How-ever, additional observations suggest that differences in theradiocarbon age observed in the mineral profiles at these sites
are reflective of different patterns of SOC losses as well.For example, we observed consistently shallower O horizons(10 cm versus 15 cm on average) and lower estimates of totalSOC in the O horizon (3.3 versus 4.3 kg m�2) and the top10 cm of mineral material (2.5 versus 4.7 kg m�2) at thewarmer site in spite of greater litterfall inputs. Though mineralprofile estimates may be confounded by rock content, ourobservations of SOC pool differences in both horizons withlatitude are consistent with SOC estimates in other borealforests spanning MAT differences [Vogel et al., 2008; Kaneand Vogel, 2009]. Further, root biomass is about 8.1% and6.6% of bulk soil weight in organic horizons, compared to0.37% and 0.43% of bulk soil weight in mineral profiles of thecooler and warmer sites, respectively (J. Laganière, unpub-lished data, 2011), suggesting that roots are less of an input tothe mineral profiles than to the O horizons at both sites. We donot know rates of root or dissolved organic matter (DOM)input into these mineral profiles from upper organic horizons,but greater litterfall rates in conjunction with lower SOC poolsizes at the warmer site, together with low root biomass inmineral relative to O horizons at both sites, suggest thatobserved radiocarbon age differences between these mineralprofiles convey important information about differences inpatterns of C losses. Though not by any means conclusive,these radiocarbon data are consistent with greater relative
Figure 5. Extracellular enzyme activities (EEA, nmol h�1 gSOM�1 ) in the Oi + Oea incubations on days 5
and 120. C-acq denotes the sum of a-1,4-glucosidase (AG), b-1,4-glucosidase (BG), cellobiohydrolase(CBH), and b-1,4-xylosidase (BXYL), four enzymes associated with relatively labile C acquisition;PHE is phenolic oxidase; PER is peroxidase; and oxidase is the sum of PHE and PER. Each bar representsa mean with a standard error (n = 3). Asterisks denote significant temperature effect at p value < 0.05based on two-way analysis of variance (ANOVA).
LI ET AL.: WARMING AND SOM MINERALIZATION G02008G02008
10 of 13
losses of ‘old’ SOC at the warmer, southern site comparedto the more northern site. We further explore this ideabelow when we discuss these data in conjunction withincubation data.
4.2. O Horizon TransformationsDuring Laboratory Incubations
[30] During the incubation, warming elevated the propor-tion of respired CO2 and leached DOC derived from indig-enous, more humified SOM in comparison to the fresher Oimaterial. This is consistent with the relative 13C-enrichmentof respired CO2-C with warming in the incubated Oea sub-horizons with no Oi replacements, and leached DOC releasedfrom both treatments, given that older, more recalcitrant SOCis usually 13C enriched [Fessenden and Ehleringer, 2002].These results collectively imply that microbial communitiesin these O horizons shift their substrate choice to morehumified material to a greater extent with warming than torelatively labile litter material. If humified SOM experiencesrelatively greater mineralization to CO2 and transformationto DOC with warming than more labile material, we wouldexpect relatively greater increases in the activities of enzymesresponsible for that material’s breakdown. Indeed, we observedsuch EEA responses in our study, with the largest increaseswith warming in phenol oxidase activities, an exoenzymethat plays an active role in more humified SOC degradation[Kirk and Farrell, 1987; Sinsabaugh, 2010]. These increaseswith warming were significantly larger than those observed forthe hydrolytic enzymes linked to labile C decay (100% versus55%). Given the slower-turnover nature of more humifiedmaterial relative to fresh litterfall [Trumbore, 2009], theseresults are suggestive of a biochemical response to warmingthat is at least qualitatively similar to that predicted by theArrhenius relationship.[31] The observed increases in exoenzymatic activities
with warming were not driven by altered biomass pool size.Though some studies have showed that warming canincrease microbial biomass C [Bell et al., 2010; Zhang et al.,2010], warming did not influence this parameter in ourincubation. Given the lack of biomass changes with warm-ing, altered EEA likely was driven by changes in ecophysi-ological properties within the microbial community thatinfluenced EEA per unit biomass. Alternatively, communitycomposition may have changed with warming such that therelative abundances of organisms with contrasting EEAresponses to warming were altered. Isotopic signatures andrelative abundances of phospholipid fatty acids extractedfrom the same incubated soils imply that warming enhancedfungal use of more humified SOM relative to the added litter(S. E. Ziegler et al., unpublished data, 2011), suggesting thatboth ecophysiological and structural features of the soilmicrobial communities were influenced by warming. Futurework exploring the relative abundance of the laccase gene,associated with the expression of phenol oxidase [Lauberet al., 2009], as well as other related functional genes mayhelp inform us on what level (gene and/or community)microbial community structure and function may be alteredwith warming.
4.3. Linking Profile Characteristics to Incubation Data
[32] The differences we observed between O horizonssubjected to different laboratory temperature regimes are
consistent in some ways with differences between profilecharacteristics of the two sites. Most simplistically, weobserved greater microbial processing rates with warmingduring the incubation, which are congruent with thedecreased C:N and increased d13C and d15N within the soilprofiles at the warmer site relative to the cooler site. Greaterinsight is possible when we consider the incubation data inmore detail. The 13C enrichment of DOC leachates, thesimilarity between leachate DOC concentrations, and greaterrelative releases of 13C enriched CO2 with warming all haveimplications for C transfer between horizons in these soils insitu. These data suggest that though the amount of DOCleached into the mineral profile may not vary with temper-ature, its composition changes, becoming increasinglydominated by material derived from relatively humifiedorganic matter with warming. This, in turn, is consistent withthe greater d13C signature of mineral profile SOC at thewarmer, southern site (Figure 2), given that mineral horizonSOM is largely derived from compounds transported fromthe O horizon [Dawson et al., 1978], particularly in soilssuch as these that exhibit extremely limited root develop-ment in the mineral horizons.[33] It is more challenging to associate processes observed
during O horizon incubations with the radiocarbon profiledata. In addition to the obvious issue of differences intimescales between drivers of incubation and profile data,age differences between fresh Oi and more humified Oeasubhorizons could not be resolved using radiocarbon(Figure 2). However, we know from incubation data thatmicrobial communities in these O horizons appear to accessa greater proportion of humified Oea material with warming,at least on relatively short timescales and after labile Oiinput. In the mineral profile, the observed large differencesin mean SOC radiocarbon age primarily reflect the netresults of O horizon processing, subsequent transport of Ohorizon DOC to mineral horizons, and processing within themineral profile itself. As described above, there are a numberof potential explanations for the younger mean age of min-eral SOC at the warmer site, but the relative lack of rootgrowth into the mineral profile at these sites and our obser-vations of litterfall inputs, O horizon thicknesses, and SOCcontent in multiple horizons provide constraints on possiblescenarios. The most parsimonious scenario, consistent withthe incubation observations and mean radiocarbon age dif-ferences in the mineral profile, is greater microbial acquisi-tion of (1) a disproportionately larger fraction of morehumified O horizon material, (2) associated increases inexport of DOC derived from that material, and (3) poten-tially greater relative mineralization of “old” SOM withinthe mineral profile at the warmer site. If robust, this scenariohas important implications for the warming of soils in theseforests, as it implies that more humified and relatively oldermineral SOC is relatively more susceptible to decay withwarming, a conclusion mimicked on much shorter time-scales by our O horizon incubation data.[34] The incubation data also revealed differences between
sites in microbial activity and Oea mineralization relevant toour understanding of the potential impact of warming inthese forests over longer timescales. At a given temperature(15�C or 20�C), higher-latitude O horizon materials exhib-ited greater microbial biomass and oxidative EEA thanlower-latitude O horizons. In contrast, with laboratory
LI ET AL.: WARMING AND SOM MINERALIZATION G02008G02008
11 of 13
warming lower-latitude O horizon material exhibited agreater relative and absolute response than higher-latitude Ohorizon material in terms of changes in the proportion ofhumified SOM mineralized and EEA associated with labileC acquisition. These differences between site incubationdata suggest that microbial communities native to the moresouthern soils were better able to profit from the enhancedaccess to substrates provided by the temperature increase.These data are consistent with profile characteristics, giventhe frequency at which microorganisms from the moresouthern soils experience this warmer temperature. Here itremains unclear what physiological or community structuralmechanisms are responsible for these communities’ differ-ences in abilities to respond to laboratory warming.
5. Conclusions
[35] This study offers empirical evidence derived from soilprofile characteristics and laboratory incubations qualita-tively consistent with predictions of enzyme kinetics withwarming. Extrapolated over a longer timescale, the relativelygreater microbial processing rates of humified SOM withwarming during the short-term incubation are congruentwith the elemental, stable isotopic, and radiocarbon patternsof soil profiles at the warmer site relative to the cooler site.We thus suggest that climate warming may influence soilmicrobial communities and their enzymatic dynamics suchthat relative losses of humified SOM in these mesic borealsoils may be disproportionately enhanced, particularly in thelower-latitude soils. Further, though quantifying spatiallyand temporally heterogeneous processes is inherently chal-lenging, we suggest that linking microbially mediatedmechanisms elucidated in laboratory warming studies withobservations of profile characteristics across sites representsan important first step in linking biogeochemical processesoperating on diverse timescales.
[36] Acknowledgments. This research was supported by the HumberRiver Basin Project, a research initiative of the provincial government ofNewfoundland and Labrador, Canada, Memorial University of Newfound-land, and the Newfoundland and Labrador Department of Education, andby a grant from the National Science Foundation (0950095). We thankMartin Moroni, Darrel Harris and Kate Edwards for site identification andestablishment as well as their forest knowledge, Doug Piercey for makingthe site map, Nameer Baker, Allison King and Lisa Tiemann for theirlaboratory assistance, and the Ecosystems Research Group at Universityof Kansas (KUERG) for insightful discussions.
ReferencesAllison, S. D., C. I. Czimczik, and K. K. Treseder (2008), Microbial activityand soil respiration under nitrogen addition in Alaskan boreal forest,Global Change Biol., 14, 1156–1168, doi:10.1111/j.1365-2486.2008.01549.x.
Andrews, J. A., and W. H. Schlesinger (2001), Soil CO2 dynamics, acidifi-cation, and chemical weathering in a temperate forest with experimentalCO2 enrichment, Global Biogeochem. Cycles, 15, 149–162, doi:10.1029/2000GB001278.
Bell, T. H., J. N. Klironomos, and H. A. L. Henry (2010), Seasonalresponses of extracellular enzyme activity and microbial biomass towarming and nitrogen addition, Soil Sci. Soc. Am. J., 74, 820–828,doi:10.2136/sssaj2009.0036.
Bergner, B., J. Johnstone, and K. K. Treseder (2004), Experimental warm-ing and burn severity alter soil CO2 flux and soil functional groups in arecently burned boreal forest, Global Change Biol., 10, 1996–2004,doi:10.1111/j.1365-2486.2004.00868.x.
Beyer, L., H. R. Schulten, R. Fruend, and U. Irmler (1993), Formation andproperties of organic-matter in a forest soil, as revealed by its biological-activity, wet chemical-analysis, CPMAS C-13-NMR spectroscopy and
pyrolysis field-ionization mass-spectrometry, Soil Biol. Biochem., 25,587–596, doi:10.1016/0038-0717(93)90198-K.
Billings, S. A., and D. D. Richter (2006), Changes in stable isotopic signa-tures of soil nitrogen and carbon during 40 years of forest development,Oecologia, 148 1–9.
Billings, S. A., and S. E. Ziegler (2008), Altered patterns of soil carbon sub-strate usage and heterotrophic respiration in a pine forest with elevatedCO2 and N fertilization, Global Change Biol., 14, 1025–1036,doi:10.1111/j.1365-2486.2008.01562.x.
Bradford, M. A., C. A. Davies, S. D. Frey, T. R. Maddox, J. M. Melillo,J. E. Mohan, J. F. Reynolds, K. K. Treseder, and M. D. Wallenstein(2008), Thermal adaptation of soil microbial respiration to elevatedtemperature, Ecol. Lett., 11, 1316–1327, doi:10.1111/j.1461-0248.2008.01251.x.
Bradford, M. A., B. W. Watts, and C. A. Davies (2010), Thermal adaptationof heterotrophic soil respiration in laboratory microcosms, GlobalChange Biol., 16, 1576–1588, doi:10.1111/j.1365-2486.2009.02040.x.
Bronson, D. R., S. T. Gower, M. Tanner, S. Linder, and I. Van Herk (2008),Response of soil surface CO2 flux in a boreal forest to ecosystem warming,Global Change Biol., 14, 856–867, doi:10.1111/j.1365-2486.2007.01508.x.
Brookes, P. C., A. Landman, G. Pruden, and D. S. Jenkinson (1985), Chlo-roform fumigation and the release of soil-nitrogen—A rapid direct extrac-tion method to measure microbial biomass nitrogen in soil, Soil Biol.Biochem., 17, 837–842, doi:10.1016/0038-0717(85)90144-0.
Craine, J. M., N. Fierer, and K. K. McLauchlan (2010), Widespread cou-pling between the rate and temperature sensitivity of organic matterdecay, Nat. Geosci., 3, 854–857, doi:10.1038/ngeo1009.
Davidson, E. A., and I. A. Janssens (2006), Temperature sensitivity of soilcarbon decomposition and feedbacks to climate change, Nature, 440,165–173, doi:10.1038/nature04514.
Dawson, H. J., F. C. Ugolini, B. F. Hrutfiord, and J. Zachara (1978), Role ofsoluble organics in soil processes of a Podzol, central Cascades, Washington,Soil Sci., 126, 290–296, doi:10.1097/00010694-197811000-00006.
Eliasson, P. E., R. E. McMurtrie, D. A. Pepper, M. Stromgren, S. Linder,and G. I. Agren (2005), The response of heterotrophic CO2 flux to soilwarming, Global Change Biol., 11, 167–181, doi:10.1111/j.1365-2486.2004.00878.x.
Fang, C. M., P. Smith, J. B. Moncrieff, and J. U. Smith (2005), Similarresponse of labile and resistant soil organic matter pools to changes intemperature, Nature, 433, 57–59, doi:10.1038/nature03138.
Feng, X. J., A. J. Simpson, K. P. Wilson, D. D. Williams, and M. J. Simpson(2008), Increased cuticular carbon sequestration and lignin oxidation inresponse to soil warming,Nat. Geosci., 1, 836–839, doi:10.1038/ngeo361.
Fessenden, J. E., and J. R. Ehleringer (2002), Age-related variations in d13Cof ecosystem respiration across a coniferous forest chronosequence in thePacific Northwest, Tree Physiol., 22, 159–167, doi:10.1093/treephys/22.2-3.159.
Fierer, N., J. M. Craine, K. McLauchlan, and J. P. Schimel (2005), Litterquality and the temperature sensitivity of decomposition, Ecology, 86,320–326, doi:10.1890/04-1254.
Giardina, C. P., and M. G. Ryan (2000), Soil warming and organic carboncontent—Reply, Nature, 408, 790, doi:10.1038/35048675.
Hartley, I. P., D. W. Hopkins, M. H. Garnett, M. Sommerkorn, and P. A.Wookey (2008), Soil microbial respiration in arctic soil does not accli-mate to temperature, Ecol. Lett., 11, 1092–1100, doi:10.1111/j.1461-0248.2008.01223.x.
Hedges, J. I., G. L. Cowie, J. E. Richey, P. D. Quay, R. Benner, M. Strom,and B. R. Forsberg (1994), Origins and processing of organic—Matter inthe Amazon River as indicated by carbohydrates and amino-acids, Limnol.Oceanogr., 39, 743–761, doi:10.4319/lo.1994.39.4.0743.
Hendrey, G. R., D. S. Ellsworth, K. F. Lewin, and J. Nagy (1999), A free-air enrichment system for exposing tall forest vegetation to elevatedatmospheric CO2, Global Change Biol., 5, 293–309, doi:10.1046/j.1365-2486.1999.00228.x.
Intergovernmental Panel on Climate Change (IPCC) (2007), ClimateChange 2007: The Physical Science Basis. Contribution of WorkingGroup I to the Fourth Assessment Report of the Intergovernmental Panelon Climate Change, edited by S. Solomon et al., Cambridge Univ. Press,Cambridge, U. K.
Janzen, H. H. (2004), Carbon cycling in Earth systems—A soil science per-spective, Agric. Ecosyst. Environ., 104, 399–417, doi:10.1016/j.agee.2004.01.040.
Kane, E. S., and J. G. Vogel (2009), Patterns of total ecosystem carbonstorage with changes in soil temperature in boreal black spruce forests,Ecosystems, 12, 322–335, doi:10.1007/s10021-008-9225-1.
Karhu, K., H. Fritze, M. Tuomi, P. Vanhala, P. Spetz, V. Kitunen, andJ. Liski (2010), Temperature sensitivity of organic matter decompositionin two boreal forest soil profiles, Soil Biol. Biochem., 42, 72–82,doi:10.1016/j.soilbio.2009.10.002.
LI ET AL.: WARMING AND SOM MINERALIZATION G02008G02008
12 of 13
Kirk, T. K., and R. L. Farrell (1987), Enzymatic “combustion”: Themicrobial-degradation of lignin, Annu. Rev. Microbiol., 41, 465–501,doi:10.1146/annurev.mi.41.100187.002341.
Kirschbaum, M. U. F. (1995), The temperature-dependence of soil organic-matter decomposition, and the effect of global warming on soil organic-Cstorage, Soil Biol. Biochem., 27, 753–760, doi:10.1016/0038-0717(94)00242-S.
Kirschbaum, M. U. F. (2004), Soil respiration under prolonged soil warm-ing: Are rate reductions caused by acclimation or substrate loss?, GlobalChange Biol., 10, 1870–1877, doi:10.1111/j.1365-2486.2004.00852.x.
Knorr, W., I. C. Prentice, J. I. House, and E. A. Holland (2005), Long-termsensitivity of soil carbon turnover to warming, Nature, 433, 298–301,doi:10.1038/nature03226.
Kuzyakov, Y. (2010), Priming effects: Interactions between living and deadorganic matter, Soil Biol. Biochem., 42, 1363–1371, doi:10.1016/j.soilbio.2010.04.003.
Lauber, C. L., R. L. Sinsabaugh, and D. R. Zak (2009), Laccase gene com-position and relative abundance in oak forest soil is not affected by short-term nitrogen fertilization, Microb. Ecol., 57, 50–57, doi:10.1007/s00248-008-9437-0.
Leifeld, J., M. Zimmermann, J. Fuhrer, and F. Conen (2009), Storage andturnover of carbon in grassland soils along an elevation gradient in theSwiss Alps, Global Change Biol., 15, 668–679, doi:10.1111/j.1365-2486.2008.01782.x.
Linn, D. M., and J. W. Doran (1984), Effect of water-filled pore spaceon carbon dioxide and nitrous oxide production in tilled and nontilledsoils, Soil Sci. Soc. Am. J., 48, 1267–1272, doi:10.2136/sssaj1984.03615995004800060013x.
Luo, Y. Q., S. Q. Wan, D. F. Hui, and L. L. Wallace (2001), Acclimatiza-tion of soil respiration to warming in a tall grass prairie, Nature, 413,622–625, doi:10.1038/35098065.
Marx, M. C., M. Wood, and S. C. Jarvis (2001), A microplate fluorimetricassay for the study of enzyme diversity in soils, Soil Biol. Biochem., 33,1633–1640, doi:10.1016/S0038-0717(01)00079-7.
Melillo, J. M., R. J. Naiman, J. D. Aber, and A. E. Linkins (1984), Factorscontrolling mass-loss and nitrogen dynamics of plant litter decaying innorthern streams, Bull. Mar. Sci., 35, 341–356.
Melillo, J. M., P. A. Steudler, J. D. Aber, K. Newkirk, H. Lux, F. P. Bowles,C. Catricala, A. Magill, T. Ahrens, and S. Morrisseau (2002), Soil warm-ing and carbon-cycle feedbacks to the climate system, Science, 298,2173–2176, doi:10.1126/science.1074153.
Natelhoffer, K. F., and B. Fry (1988), Controls on natural nitrogen-15 andcarbon-13 abundances in forest soil organic matter, Soil Sci. Soc. Am.J., 52, 1633–1640, doi:10.2136/sssaj1988.03615995005200060024x.
Niinistö, S. M., J. Silvola, and S. Kellomaki (2004), Soil CO2 efflux in aboreal pine forest under atmospheric CO2 enrichment and air warming,Global Change Biol., 10, 1363–1376, doi:10.1111/j.1365-2486.2004.00799.x.
O’Malley, V. P., T. A. Abrajano, and J. Hellou (1996), Stable carbon isoto-pic apportionment of individual polycyclic aromatic hydrocarbons inSt John’s Harbour, Newfoundland, Environ. Sci. Technol., 30, 634–639,doi:10.1021/es950371t.
Paul, E. A. (Ed.) (2007), Soil Microbiology, Ecology, and Biochemistry,3rd ed., Elsevier, New York.
Phillips, D. L., S. D. Newsome, and J. W. Gregg (2005), Combiningsources in stable isotope mixing models: Alternative methods, Oecologia,144, 520–527, doi:10.1007/s00442-004-1816-8.
Reimer, P. J., et al. (2009), Intcal09 and Marine09 radiocarbon age calibra-tion curves, 0–50,000 years cal BP, Radiocarbon, 51, 1111–1150.
Rice, D. L., and K. R. Tenore (1981), Dynamics of carbon and nitrogen dur-ing the decomposition of detritus derived from estuarine macrophytes,Estuarine Coastal Shelf Sci., 13, 681–690, doi:10.1016/S0302-3524(81)80049-7.
Rustad, L. E., J. L. Campbell, G. M. Marion, R. J. Norby, M. J. Mitchell,A. E. Hartley, J. H. C. Cornelissen, J. Gurevitch, and GCTE-News(2001), A meta-analysis of the response of soil respiration, net nitrogenmineralization, and aboveground plant growth to experimental ecosystemwarming, Oecologia, 126, 543–562, doi:10.1007/s004420000544.
Saiya-Cork, K. R., R. L. Sinsabaugh, and D. R. Zak (2002), The effects oflong term nitrogen deposition on extracellular enzyme activity in an Acersaccharum forest soil, Soil Biol. Biochem., 34, 1309–1315, doi:10.1016/S0038-0717(02)00074-3.
Schlesinger, W. H. (1997), Biogeochemistry: An Analysis of GlobalChange, 2nd ed., Academic, San Diego, Calif.
Sinsabaugh, R. L. (2010), Phenol oxidase, peroxidase and organic matterdynamics of soil, Soil Biol. Biochem., 42, 391–404, doi:10.1016/j.soilbio.2009.10.014.
Sinsabaugh, R. L., H. Reynolds, and T. M. Long (2000), Rapid assay foramidohydrolase (urease) activity in environmental samples, Soil Biol.Biochem., 32, 2095–2097, doi:10.1016/S0038-0717(00)00102-4.
South, G. R. (1983), Biogeography and Ecology of the Island of Newfound-land, Monogr. Boil., vol. 48, Dr. W Junk, The Hague, Netherlands.
Stuiver, M., and P. J. Reimer (1993), Extended C-14 data-base and revisedCalib 3.0 C-14 age calibration program, Radiocarbon, 35, 215–230.
Telford, R. J., E. Heegaard, and H. J. B. Birks (2004), The intercept is apoor estimate of a calibrated radiocarbon age, Holocene, 14, 296–298,doi:10.1191/0959683604hl707fa.
Thornley, J. H. M., and M. G. R. Cannell (2001), Soil carbon storageresponse to temperature: An hypothesis, Ann. Bot., 87, 591–598,doi:10.1006/anbo.2001.1372.
Trumbore, S. (2000), Age of soil organic matter and soil respiration: Radio-carbon constraints on belowground C dynamics, Ecol. Appl., 10, 399–411,doi:10.1890/1051-0761(2000)010[0399:AOSOMA]2.0.CO;2.
Trumbore, S. (2009), Radiocarbon and soil carbon dynamics, Annu. Rev.Earth Planet. Sci., 37, 47–66, doi:10.1146/annurev.earth.36.031207.124300.
Trumbore, S. E., O. A. Chadwick, and R. Amundson (1996), Rapidexchange between soil carbon and atmospheric carbon dioxide drivenby temperature change, Science, 272, 393–396, doi:10.1126/science.272.5260.393.
Vanhala, P., K. Karhu, M. Tuomi, K. Bjorklof, H. Fritze, and J. Liski(2008), Temperature sensitivity of soil organic matter decomposition insouthern and northern areas of the boreal forest zone, Soil Biol. Biochem.,40, 1758–1764, doi:10.1016/j.soilbio.2008.02.021.
Vogel, J. G., B. P. Bond-Lamberty, E. A. G. Schuur, S. T. Gower, M. C.Mack, K. E. B. O’Connell, D. W. Valentine, and R. W. Ruess (2008),Carbon allocation in boreal black spruce forests across regions varyingin soil temperature and precipitation, Global Change Biol., 14, 1503–1516,doi:10.1111/j.1365-2486.2008.01600.x.
von Lutzow, M., and I. Kogel-Knabner (2009), Temperature sensitivity ofsoil organic matter decomposition—What do we know?, Biol. Fertil.Soils, 46, 1–15, doi:10.1007/s00374-009-0413-8.
Waldrop, M. P., J. G. McColl, and R. F. Powers (2003), Effects of forestpostharvest management practices on enzyme activities in decomposinglitter, Soil Sci. Soc. Am. J., 67, 1250–1256, doi:10.2136/sssaj2003.1250.
Wallenstein, M. D., and M. N. Weintraub (2008), Emerging tools for mea-suring and modeling the in situ activity of soil extracellular enzymes, SoilBiol. Biochem., 40, 2098–2106, doi:10.1016/j.soilbio.2008.01.024.
Wetterstedt, J. A. M., T. Persson, and G. I. Agren (2010), Temperature sen-sitivity and substrate quality in soil organic matter decomposition:Results of an incubation study with three substrates, Global Change Biol.,16, 1806–1819, doi:10.1111/j.1365-2486.2009.02112.x.
Wickland, K. P., J. C. Neff, and G. R. Aiken (2007), Dissolved organiccarbon in Alaskan boreal forest: Sources, chemical characteristics, andbiodegradability, Ecosystems, 10, 1323–1340, doi:10.1007/s10021-007-9101-4.
Wright, S. F., and L. Jawson (2001), A pressure cooker method to extractglomalin from soils, Soil Sci. Soc. Am. J., 65, 1734–1735, doi:10.2136/sssaj2001.1734.
Zhang, X.-Y., X.-J. Meng, L.-P. Gao, X.-M. Sun, J.-J. Fan, and L.-J. Xua(2010), Potential impacts of climate warming on active soil organiccarbon contents along natural altitudinal forest transect of ChangbaiMountain, Acta Ecol. Sin., 30, 113–117.
S. A. Billings and J. Li, Department of Ecology and EvolutionaryBiology, Kansas Biological Survey, University of Kansas, Lawrence, KS66047, USA. ([email protected])C. S. Lane, Department of Geography and Geology, University of North
Carolina Wilmington, Wilmington, NC 28403, USA.S. Ziegler, Department of Earth Sciences, Memorial University of
Newfoundland, St. John’s, NL A1B 3X5, Canada.
LI ET AL.: WARMING AND SOM MINERALIZATION G02008G02008
13 of 13
Copyright © 2022 FDOKUMEN