Performance & Operation Improvements using VULCAN Series VSG-F101 High Temperature Shift Catalysts
Upload
khangminh22Category
view
0download
0
UNITED STATESSECURITIES AND EXCHANGE COMMISSION
Washington, D.C. 20549FORM 10-K
� ANNUAL REPORT PURSUANT TO SECTION 13 OR 15(d) OF THE SECURITIES EXCHANGE ACT OF 1934For the Fiscal Year Ended December 31, 2020
OR� TRANSITION REPORT PURSUANT TO SECTION 13 OR 15(d) OF THE SECURITIES EXCHANGE ACT OF 1934
For the Transition Period From to
Commission file number: 001-33841
VULCAN MATERIALS COMPANY(Exact Name of Registrant as Specified in Its Charter)
New Jersey(State or other jurisdiction of incorporation or organization)
20-8579133(I.R.S. Employer Identification No.)
1200 Urban Center Drive, Birmingham, Alabama(Address of Principal Executive Officff es)
35242(Zip Code)
(205) 298-3000����������� �� ������ ��mber, including area code)
Securities registered pursuant to Section 12(b) of the Act:Title of each class
Common Stock, $1 par valueTrading SymbolVMC
Name of each exchange on which registeredNew York Stock Exchange
Securities registered pursuant to Section 12(g) of the Act: None
Indicate by check mark if the registrant is a well-known seasoned issuer, as defined in Rule 405 of the Securities Act.Yes � No �
Indicate by check mark if the registrant is not required to file reports pursuant to Section 13 or Section 15(d) of the Act.Yes � No �
Indicate by check mark whether the registrant: (1) has filed all reports required to be filed by Section 13 or 15(d) of theSecurities Exchange Act of 1934 during the preceding 12 months (or for such shorter period that the registrant wasrequired to file such reports), and (2) has been subject to such filing requirements for the past 90 days.
Yes � No �
Indicate by check mark whether the registrant has submitted electronically every Interactive Data File required to besubmitted pursuant to Rule 405 of Regulation S-T during the preceding 12 months (or for such shorter period that theregistrant was required to submit such files).
Yes � No �
Indicate by check mark whether the registrant is a large accelerated filer, an accelerated filer, a non-accelerated filer, a�� � ������� ������ � � ������� ����� ������� ��� ��� ����������� �� � �� ��� ���� �� ��� ���� ������ ��� ��� � ������� ������� �� �������� ����� ������� �� ��le 12b-2 of the Exchange Act.
Large accelerated filer �Non-accelerated filer �
Accelerated filer �Smaller reporting company �Emerging growth company �
If an emerging growth company, indicate by check mark if the registrant has elected not to use the extended transitionperiod for complying with any new or revised financial accounting standards provided pursuant to Section 13(a) of theExchange Act. �
Indicate by check mark whether the registrant has filed a report on and attestation to its manag������� ��������� �� ���effeff ctiveness of its internal control over financial reporting under Section 404(b) of the Sarbanes-Oxley Act (15 U.S.C.7262(b)) by the registered public accounting firm that prepared or issued its audit report. �
Indicate by check mark whether the registrant is a shell company (as defined in Rule 12b-2 of the Act). Yes � No �
Aggregate market value of voting and non-voting common stock held by non-affiliaff tes as ofJune 30, 2020: $15,315,526,050
Number of shares of common stock, $1.00 par value, outstanding as of February 12, 2021: 132,547,092
DOCUMENTS INCORPORATED BY REFERENCE������� �� ��� ��������� ��� ���� �������� �� ��� ��� ������� �� ��� ����� ��� �� �� �� � ��May 14, 2021, are incorporated by reference into Part III of this Annual Report on Form 10-K.

Table of Contents i
VULCAN MATERIALS COMPANY
ANNUAL REPORT ON FORM 10-KFISCAL YEAR ENDED DECEMBER 31, 2020CONTENTS
PART ITEM PAGE
I 1 Business 31A Risk Factors 191B Unresolved Staffff Comments 242 Propertiesp 253 Legal Proceedingsg g 284 Mine Safety Disclosuresy 28
Information about our Executive Offiff cers 29
II 5 !"�� �� ��� ���������� #����� $%����� �� ���� % ��Stockholder Matters and Issuer Purchases of Equity Securitiesq y 31
7 !��������� &��������� �� '� ���� �� (����� #��������� �and Results of Operationsp 32
7A Quantitative and Qualitative Disclosures about Market Risk 678 Financial Statements and Supplementary Datapp y 689 Changes in and Disagreements with Accountants on Accounting andg g g
Financial Disclosure 1239A Controls and Procedures 1239B Other Information 125
III 10 Directors, Executive Offiff cers and Corporate Governance, p 12611 Executive Compensationp 12612 Security Ownership of Certain Beneficial Owners andy p
Management and Related Stockholder Mattersg 12613 Certain Relationships and Related Transactions, and Director Independencep , p 12614 Principal Accounting Fees and Servicesp g 126
IV 15 Exhibits and Financial Statement Schedules 12716 Form 10-K Summaryy 132
Signaturesg 133
)� ��� ������ �� ����� � ��� ������� �������� �%����� �������� �� ���� ���� �� �*� ���� ��� �#������� ����� ������ ���� ��� �� *� �� !��� � #����� �� ��� ����� ����� �����������

Part I 1
PART I
����� ����� ����� ENT UNDER THE PRIVATE SECURITIESLITIGATION REFORM ACT OF 1995Certain of the matters and statements made herein or incorporated by reference into this report constitute forward-lookingstatements within the meaning of Section 21E of the Securities Exchange Act of 1934. All such statements are madepursuant to the safe harbor provisions of the Private Securities Litigation Reform Act of 1995. These statements reflect ourintent, belief or current expectation. Ofteff n, forward-looking statements can be identified by the use of words, such as����������� ����� ��� ��+��� ���������� ���,�� ���� ��������� �������� �� ���� �� ���� ������ -� ������� �� ���statements included in this report, we may from time to time make other oral or written forward-looking statements in otherfilings under the Securities Exchange Act of 1934 or in other public disclosures. Forwarrr d-looking statements are notguarantees of future performance, and actual results could differ materially from those indicated by the forward-lookingstatements. All forward-looking statements involve certain assumptions, risks and uncertainties that could cause actualresults to differ materially from those included in or contemplated by the statements. These assumptions, risks anduncertainties include, but are not limited to:
� general economic and business conditions
� a pandemic, epidemic or other public health emergency, such as the recent outbreak of COVID-19
� our dependence on the construction industry, which is subject to economic cycles
� the timing and amount of federal, state and local funding for infrastructure
� changes in the level of spending for private residential and private nonresidential construction
� changes in our effeff ctive tax rate
� the increasing reliance on information technology infrastructure, including the risks that the infrastructure does not work asintended, experiences technical difficulties or is subjected to cyber-attacks
� the impact of the state of the global economy on our businesses and financial condition and access to capital markets
� the highly competitive nature of the construction industry
� the impact of future regulatory or legislative actions, including those relating to climate change, wetlands, greenhouse gasemissions, the definition of minerals, tax policy or international trade
� the outcome of pending legal proceedings
� pricing of our products
� weather and other natural phenomena, including the impact of climate change and availability of water
� energy costs
� costs of hydrocarbon-based raw materials
� healthcare costs
� the amount of long-term debt and interest expense we incur
� changes in interest rates
� the impact of a discontinuation of the London Interbank Offeff red Rate (LIBOR)
� volatility in pension plan asset values and liabilities, which may require cash contributions to the pension plans
� the impact of environmental cleanup costs and other liabilities relating to existing and/or divested businesses
� our ability to secure and permit aggregates reserves in strategically located areas
� our ability to manage and successfully integrate acquisitions
� the effeff ct of changes in tax laws, guidance and interpretations
� significant downturn in the construction industry may result in the impairment of goodwill or long-lived assets
� changes in technologies, which could disrupt the way we do business and how our products are distributed
� ��� ��"� ��� ���� �� -��� .' ����" (������ -��� / �0�� ������������ -��� 1 �!��������� &��������� �� '� ������ (����� #�������� �� ���� �� �� 2��������� �� 3��� .4 �#���������� �� #������������� �� ��� �����lidated������ ��������� �� -��� 5 �(����ial ��������� �� ���� ������ &��� � ��� ���� �� ���� ����

Part I 2
� other assumptions, risks and uncertainties detailed from time to time in our filings made with the Securities and ExchangeCommission
All forward-looking statements are made as of the date of filing or publication. We undertake no obligation to publicly updateany forward-looking statements, whether as a result of new information, future events or otherwirr se, except to the extentrequired by law. Investors are cautioned not to rely unduly on such forward-looking statements when evaluating theinformation presented in our filings, and are advised to consult any of our future disclosures in filings made with theSecurities and Exchange Commission and our press releases with regard to our business and consolidated financialposition, results of operations and cash flows.

Part I 3
ITEM 1BUSINESS
Vulcan Materials Company operates primarily in the U.S. and is t�� ������� largest supplier of construction aggregates(primarily crushed stone, sand and gravel), a majora producer of asphalt mix and ready-mixed concrete, and a supplier ofconstruction paving services. We provide the basic materials for the infrastructure needed to maintain and expand the U.S.economy. Delivered by trucks, ships, barges and trains, our products are the indispensable materials building homes,offiff ces, places of worship, schools, hospitals and factories, as well as vital infrastructure including highways, bridges, roads,ports and harbors, water systems, campuses, dams, airports and rail networks. As of December 31, 2020, we had 380active aggregates facilities, 70 asphalt facilities and 46 concrete facilities.
BUSINESS STRATEGYOur strategy and competitive advantage are based on our strength in aggregates which are used in most types ofconstruction and in the production of asphalt mix and ready-mixed concrete. Our strategy for long-term value creation is builton: (1) an aggregates-focused business, (2) a disciplined approach to growth management and capital allocation, (3) a focuson continuous compounding improvement in profitability, (4) a holistic approach to land management, and (5) ourcommitment to safety, health and the environment.
1. AGGREGATES FOCUSAggregates are used in virtually all types of public and private construction, practically no substitutes for quality aggregatesexist, and significant barriers to entry exist in most markets. Vulcan is uniquely positioned as the largest aggregates supplierin the U.S. and the most aggregates-focused public company.
Source: 2019 reporterr d financial information and Company estimates
Given our focus on aggregates, we:
�� TAKE ADVANTAGE OF SIZE AND SCALE: While certain aspects of each aggregates operation are unique, such as itslocation within a local market and its particular geological characteristics, every operation uses a similar group of assets toproduce saleable aggregates and provide customer service. Our 380 active aggregates facilities as of December 31, 2020provide opportunities to share and scale best practices across our operations and to procure equipment (fixed and mobile),partsrr , supplies and services in an effiff cient and cost-effecff tive manner, both regionally and nationally. Additionally, we are ableto share best practices across the organization and leverage our size for administrative support, customer service,accounting, procurement, technical supportrr and engineering.

Part I 4
� BUILD AND HOLD SUBSTANTIAL RESERVES: Our reserves are critical to our long-term success. We currently have15.9 billion tons of permitted and proven or probable aggregates reserves. They are strategically located throughout theUnited States in high-growth areas that are expected to require large amounts of aggregates to meet future constructiondemand. Moreover, there are significant barriers to entry in many metropolitan markets due to stringent zoning andpermitting regulations. These restrictions curtail expansion in certain areas, but they also increase the value of ourreserves at existing locations.
2. GROWTH MANAGEMENT AND CAPITAL ALLOCATION
GROWTH MANAGEMENT: Demand for our products is dependent on construction activity and correlates positively withchanges in population growth, household formation and employment. As such, we have pursued a strategy to increase ourpresence in U.S. metropolitan areas that are expected to grow the most rapidly and to divest assets that are no longerconsidered part of our long-term growth strategy. During the period 2020 - 2030, Moody's Analytics projects that 73% of theU.S. population growth, 70% of household formation and 61% of new jobs will occur in Vulcan-served states. Our coast-to-coast footprint serves 19 of the top 25 highest-growth metropolitan statistical areas in 20 states plus the District of Columbia.The close proximity of our aggregates reserves and our production facilities to this projected population growth createsmany opportunities to invest capital in high-return projects.
Source: Moody�s� Analyticstt as of December 10, 2020
Our top ten revenue producing states accounted for 88% of our 2020 revenues while our top five accounted for 61%.
�������� �� ��� ������� �������� ������ �� ����
1. Texas 6. Florida
2. California 7. Arizona
3. Tennessee 8. Alabama4. Georgia 9. North Carolina5. Virginia 10. South Carolina

Part I 5
Since becoming a public company in 1956, Vulcan has principally grown by mergers and acquisitions. For example, in 1999we acquired CalMat Co., thereby expanding our aggregates operations into California and Arizona and making us one of the������� ����� ������� �� ��� � ���� -� 4661� �� �%���� ( ��� ���" -��������� -���, expanding our aggregatesbusiness in Florida and our aggregates and ready-mixed concrete businesses in other Mid-Atlantic and Southeastern states.In 2017, we acquired Aggregates USA, greatly expanding our ability to serve customers in Florida, Georgia and SouthCarolina. Additionally, throughout our history we have completed many bolt-on aggregates acquisitions that have contributedsignificantly to our growth. For example, during 2019 we acquired aggregates operations that strengthened our position inTennessee.
While an aggregates-focused business, we selectively make investments in downstream products that drive local marketprofitability. Our downstream businesses (asphalt and concrete) use Vulcan-produced aggregates almost exclusively. In2017, we entered the asphalt market in Tennessee through the acquisition of several asphalt mix operations and aconstruction paving business. In 2018, we entered the asphalt mix and construction paving markets in Alabama andexpanded our asphalt operations and service offeff rings in Texas through the acquisition of several asphalt mix operationsand construction paving businesses. Additionally, throughout our history we have completed many bolt-on downstreamacquisitions that have contributed significantly to our growth. For example, during 2020 we acquired asphalt operations inTexas expanding our already strong presence in that market. From 2018 to 2020, we invested over $300 million inacquisitions � ��� ���� �� 3��� .7 �'�%��������� �� &�+��������� �� -��� 5 �(����� ��������� �� ���� ������ &���
CAPITAL ALLOCATIAA ON: Our long-term capital allocation strategy is focused on the following priorities:
� Operating Capital (maintain and grow the value of our franchise)
� Growth Capital (including greenfields and acquisitions)
� Dividend Growth (with a keen focus on sustainability)
� Return Excess Cash to Shareholders (primarily via share repurchases)
Our strategic priorities have given us the ability to leverage decisions we have made over the past few years. During 2020,we reinvested $360.8 million into core operating & maintenance capital and internal growth capital, in addition to $384.1million and $469.1 million reinvested in 2019 and 2018, respectively. These investments are fundamental actions thatsustain and strengthen the business. They improve the longer-term effiff ciency, capacity and flexibility of our production, andthey support our strong commitment to superior customer service.
As illustrated below, our annual Return on Invested Capital (ROIC) increased 0.4 percentage points (40 basis points) in2020 as a 4% increase in Adjusted EBITDA (net earnings decreased 5% in 2020) was leveraged with disciplined capitalmanagement (average invested capital only increased 1%).
1 ROIC and Adjusdd ted EBITDATT are Non-GAAP financial measures. Non-GAAP financial measures are definff ed and reconciledwithi in Item 7 under the captiontt Reconciliall tion of Non-GAAP Financii ial Measures.

Part I 6
3. COMPOUNDING IMPROVEMENT IN PROFITABILITYOur focus on the following four strategic disciplines has made us one of the most profitable public companies in the industry(as measured by aggregates gross profit per ton).
� Operational Excellence Continuous and sustainable improvements in both our operating disciplines and our industry-leading safety performance coupled with better asset utilization through improved availability and throughput leads toeffeff ctive cost control.
� Strategic Sourcing Leveraging common practices and innovation leads to more time in our plants and with oursuppliers to deliver the right parts and services at the right time and optimize the total cost of ownership.
� Commercial Excellence Clearly defined roles and responsibilities together with access to real time, forward-lookingmetrics leads to our sales teams spending less time on non-selling activities and more time responding to our cu�������needs.
� Logistics Innovation 8 Partnering with our customers (truck drivers and contractors) to provide a bundled logistics solutionwith digital shipping records and on-site, mobile visibility leads to streamlined scheduling, speed and accuracy of delivery,and effiff cient back-offiff ce processes.
We manage these disciplines locally and align our talent and incentives accordingly. Our knowledgeable and experiencedworkforce and our flexible production capabilities allow us to manage operational and overhead costs aggressively.
4. LAND MANAGEMENTWith approximately 240,000 acres in our land portfolio, a long-term holistic approach to preserving land and water is integralto sustaining our success. From pre-mining to mining to reclamation, we are actively managing the entire life cycle of ourland, creating maximum value for the business, our shareholders and our communities.
We are putting land to use before we mine by creating opportunities for agriculture and timber development. Afteff r mining,our land and water assets will be converted to other valuable uses including drinking water reservoirs, aquifer rechargebasins, public parks, habitat mitigation banks, wetlands, productive farmland and residential and commercial developments.
Because of the evolving needs of our communities, we listen to and collaborate with our neighbors to prepare the land for itshighest and best use afteff r mining is complete. Our work with state, regional and local governments to develop solutionstoday will benefit future generations.
5. SAFETY, HEALTH AND THE ENVIRONMENTA strategy for sustainable, long-term value creation must include doing right by your employees, your neighbors and theenvironment in which you operate. We are a leader in our industryrr in safety perfor rmance by applying the sharedexperiences, expertise and resources at each of our locally led sites with an emphasis on taking care of one another. Wefocus on our environmental stewardship programs with the same intensity that we bring to our health and safety init iatives.And, our community relations programs serve our neighbors while ensuring that we grow and thrive in the communitieswhere we operate.

Part I 7
PRODUCT LINESOur products are used to build the roads, tunnels, bridges, railroads and airports that connect us, and to build the hospitals,schools, shopping centers, factories and places of worship that are essential to our lives, our communities and the economy.We have four operating (and reportable) segments (Aggregates, Asphalt, Concrete and Calcium) organized around ourprincipal product lines.
Our 2020 total revenues and gross profit by segment are illustrated as follows (Calcium revenues and gross profit were lessthan one percent):
(� ��� ������� ��� 3��� .9 �������� ��������� �� -��� 5 �(����� ��������� �� ���� ������ &���
We generally ship our products upon receipt of a purchase order or in some cases simply a price quote. Thereforff e, we do nothave a significant order backlog.
1. AGGREGATES
Our construction aggregates are used in a number of ways:
� as a base material underneath highways, walkways, airport runways, parking lots and railroads
� to aid in water filtration, purification and erosion control
� as a raw material used in combination with other resources to construct many of the items we rely on to sustain ourquality of life including:
� houses and apartments
� roads, bridges and parking lots
� schools and hospitals
� commercial buildings and retail space
� sewer systems
� power plants
� airports and runways

Part I 8
AGGREGATES INDUSTRY
Factors that affect the U.S. aggregates industry and our business include:
� LOCATION AND TRANSPORTATION OF RESERVES: Aggregates have a high weight-to-value ratio and, in mostcases, must be produced near where they are used; if not, transportation can cost more than the materials, renderingthem uncompetitive compared to locally produced materials. Where practical, we have operations located close to ourlocal markets because the cost of trucking materials long distances is prohibitive. Approximately 80% of our total aggregatesshipments are delivered exclusively from the producing location to the customer by truck.
Exceptions to this typical market structure include areas along the U.S. Gulf Coast and the Eastern Seaboard where thereare limited supplies of locally available, high-quality aggregates. We serve these markets from quarries that have accessto cost-effective long-haul transportation shipping by barge and rail �� ��� �� %�� �� !������� :����Peninsula with our fleet of Panamax-class, self-unloading ships. Approximately 17% of our total aggregates shipments aredelivered by truck to the customer afteff r reaching a sales yard by rail or water. The remaining 3% of aggregates shipmentsare delivered directly to the customer by rail or water.
� LIMITED PRODUCT SUBSTITUTION: There are limited substitutes for quality aggregates. Recycled concrete andasphalt have certain applications as a lower-cost alternative to virgin aggregates. However, many types of constructionprojects cannot be served by recycled concrete and require the use of virgin aggregates to meet technical specificationsand performance-based criteria for durability, strength and other qualities. Likewise, the amount of recycled asphaltincluded in asphalt mix as a substitute for aggregates is limited due to specifications.
� HIGHLY FRAGMENTED INDUSTRY: The U.S. aggregates industry is composed of over 5,000 companies that manageclose to 11,000 operations. This fragmented structure provides many opportunities for consolidation. Companies in theindustry commonly enter new markets or expand positions in existing markets through the acquisition of existing facilities.
Through strategic acquisitions and investments, we have developed an unmatched coast-to-coast footprint of strategicallylocated permit��� ���+�� ���������� �� �� ��+��� ��� ������� "�� ����� ������� ;� �+� �+� 23,000 customersin 20 states, the District of Columbia and Mexico.
� FLEXIBLE PRODUCTION CAPABILITIES: The production of aggregates is a mechanical process in which stone iscrushed and, through a series of screens, separated into various sizes depending on how it will be used. Productioncapacity is flexible by adjusting operating hours to meet changing market demand. We are currently operatingconsiderably below full capacity, making us extremely well positioned to further benefit from economies of scale whenadditional growth materializes.
� RAWAA MATEAA RIAL INPUTS LARGELY CONTROLLED: Unlike typical industrial manufacturing industries, the aggregatesindustry does not require the input of raw material beyond owned or leased aggregates reserves. Stone, sand and gravelare naturally occurring resources. However, production does require the use of explosives, hydrocarbon fuels and electricpower.
� DEMAND CYCLES: Long-term growth in demand for aggregates is largely driven by growth in population, jobs andhouseholds. While short-term and medium-term demand for aggregates fluctuates with economic cycles, declines havehistorically been followed by strong recoveries.
The drivers underpinning long-term demand and sustained pricing growth remain firmly in place, in both the public andprivate sectors of the economy. They include: population growth; gains in total employment (short-term disruption due toCOVID-19 pandemic) and in household income and wages; a continuing increase in household formations; the growingneed for additional housing stock and housing demand; a multi-year federal transportation law in place and continuingincreases in transportation funding at state and local levels; stable state tax receipts; public investment in infrastructurethat is still well below the long-term trend-line; and increasing political awareness and acceptance of the need to invest ininfrastructure.

Part I 9
AGGREGATES MARKETS
We focus on the U.S. markets with above-average long-term expected population growth and where construction isexpected to expand. Because transportation is a significant part of the delivered cost of aggregates, our facilities aretypically located in the markets they serve or have access to economical transportation via rail, barge or ship to a particularend market. We serve both the public and the private sectors.
Public sector construction activity has historically been more stable and less cyclical than privately-funded construction, andit generally requires more aggregates per dollar of construction spending. Private sector construction (primarily residentialand nonresidential buildings) typically is more affeff cted by general economic cycles than publicly-funded projects (particularlyhighways, roads and bridges), which tend to receive more consistent levels of funding throughout economic cycles.
Source: Company estimates

Part I 10
PUBLIC SECTOR CONSTRUCTION MARKET
Public sector construction includes spending by federal, state, and local governments for highways, bridges, buildings,airports, schools, prisons, sewer and waste disposal systems, water supply systems, dams, reservoirs and other publicconstruction projects. Construction for power plants and other utilities is funded from both public and private sources. In2020, publicly-funded construction accounted for approximately 43% of our total aggregates shipments, and approximately23% of our aggregates sales by volume were used in highway construction projects.
� PUBLIC SECTOR FUNDING: Generally, public sector construction spending is more stable than private sectorconstruction spending; public sector spending is less sensitive to interest rates and has historically been supported bymulti-year laws, which provide certainty in funding amounts, program structures, rules and regulations. Federal spendingis governed by authorization, budget and appropriations laws. The level of state and local spending on infrastructurevaries across the United States and depends on individual state needs and economies.
� STATE AND LOCAL TRANSPORTATION FUNDING: Since 2012, 32 states have increased or adjusted taxes onmotor fuel to increase revenues available for transportation investment. Most recently, in 2020 the Virginia legislatureraised its statewide gas tax, and voters in Arkansas renewed a ½ cent sales tax measure originally approved in2012, to provide significant revenue for highway construction and maintenance through motor fuel tax increases.Other states have increased revenues outside of fuel taxes or made one-time increases. Since 2012, eleven Vulcan-served states representing over 87% of our 2020 total revenues have averaged a 69% increase in ���� ������revenues for highways.
In addition, we benefit from state and local transportation funding ballot measures. Majoa r transportation fundingmeasures in Vulcan-served areas approved in 2020 are estimated to result in $2.575 billion in revenues and bondproceeds primarily dedicated to roads, streets and bridges. Across the United States, voters in 18 states approved94% of 322 measures in 2020, which will generate $14.1 billion in new and recurring transportation investment. Thisrepresents a record high approval rate and continues a trend in which voters have approved 83% of nearly 2,300transportation investment ballot measures since 2010.
� FEDERAL HIGHWAY FUNDING: In December 2015, President Obama signed a new, long-term federal highway�� ����� �����<���� �� � (����� '������ ��� �� =��������� -��������� '�� �('�= '��>� ���� aw afteff r thefinal legislation received strong, bipartisan support in both the House and the Senate. The FAST Act provides multi-year funding to state and local governments in support of road, bridge, intermodal and public transportation projects.President Trump signed a one-year extension of the FAST Act into law in 2020.
The FAST Act increases Federal-Aid Highway Program funding from $41 billion in the federal fiscal year (FFY) 2015to $47 billion in FFY 2021. The Bipartisan Budget Act of 2018 added approximately $2 billion per year to basehighway programs in 2018 and 2019. In addition, for FFY 2021, state departments of transportation were allocated$10 billion in emergency aid from the $900 billion Coronavirus Response and Relief Supplemental AppropriationsAct, a COVID-19 relief measure passed by Congress in December 2020 as part of a final year-end legislativepackage.
The long-term nature of the FAST Act is important. The Federal-Aid Highway Program is the largest component ofthe law and has provided, on average, 52% of all state capital investment in roads and bridges over the last 10 years.This multi-year authorization and the associated dedicated funding provides state departments of transportation withthe ability to plan and execute long-range, complex highway projects.
The FAST Act also contains important policy changes. To further accelerate the project delivery process, it augmentsthe environmental review and permitting process reforms contained in the prior law, Moving Ahead for Progress inthe 21st Century Act (MAP-21). The FAST Act also provides assistance for states making investments in majora capitalprojects particularly freight projects. In states where we operate, we are well positioned to serve the large generalcontractors who will compete for new freight and other majora capacity projects that will move forward with FAST Actfunding and policy implementation.
Project financing remains an important additional component of overall surface transportation spending, with theTransportation Infrastructure Finance & Innovation Act (TIFIA) program authorized at $275 million (in line with theprevious program outlays) and growing to $300 million by 2020. The FAST Act also created a new National Surfar ceTransportation and Innovative Finance Bureau to provide technical assistance to states seeking to pursue public-private partnerships and other financing arrangements for transportation projects.

Part I 11
The FAST Act extension expires on September 30, 2021. Congress is in the process of developing policy andfunding legislative proposals for FAST Act reauthorization. It would not be atypical for additional extensions of currentlaw to be required to provide Congress with adequate time to complete the reauthorization process. Historically,there is minimal disruption to the flow of federal funding to state and local projects due to extensions.
� FEDERAL WATEAA R INFRASTRUCTURE: In December 2020, President Trump signed the Water ResourcesDevelopment Act of 2020 (WRDA 2020) into law, enacting the fourth consecutive biennial authorization for the U.S.Army Corps of Engineers (Army Corps) since 2014. WRDA 2020 ������<�� ������ ��+������� �� '������ �����channels, locks, dams, and other infrastructure that supports the maritime and waterwarr ys transportation system andprovides flood protection for communities. It also improves the United States Environmental P�������� '�������(EPA) programs for storm water, water recycling, and sewer overflow projects. The FFY 2021 appropriations for theCorps, also passed as part of the year-end legislative package, funds for the first time the Army Corps WaterInfrastructure Financing Program (CWIFP), which was authorized in the Water Resources Reform and DevelopmentAct of 2014 (WRRDA 2014). Modeled afteff r the highly popular TIFIA program in the surface transportation sector,CWIFP will accelerate non-federal investments in water resources infrastructure by providing long-term, low-costloans to creditworthy borrowers.
PRIVATE SECTOR CONSTRUCTION MARKET
The private sector construction markets include both nonresidential building construction and residential construction andare considerably more cyclical than public construction. In 2020, privately-funded construction accounted for approximately57% of our total aggregates shipments.
� NONRESIDENTIAL CONSTRUCTION: Private nonresidential building construction includes a wide array of projects.Such projects generally are more aggregates intensive than residential construction. Overall demand in privatenonresidential construction generally is driven by job growth, vacancy rates, private infrastructure needs and demographictrends. The growth of the private workforce creates demand for offiff ces, hotels and restaurants. Likewise, populationgrowth generates demand for stores, shopping centers, warehouses and parking decks as well as hospitals, places ofworship and entertainment facilities. Large industrial projects, such as a new manufacturing facility, can increase the needfor other manufacturing plants to supply parts and assemblies. Construction activity in this end market is influenced by afirm's ability to finance a project and the cost of such financing. This end market also includes capital investments in publicnonresidential facilities to meet the needs of a growing population.
� RESIDENTIAL CONSTRUCTION: Household formations in Vulcan-served states continue to outpace householdformations in the rest of the United States. The majora ity of residential construction is for single-family housing with theremainder consisting of multi-family construction (i.e., two family houses, apartment buildings and condominiums). Publichousing comprises only a small portion of housing demand. Construction activity in this end market is influenced by thecost and availability of mortgage financi�� �� ��� ���� �� ��� �� ������ �"� �� ���
U.S. housing starts, as measured by Dodge Data & Analytics data, peaked in early 2006 at over 2 million units annually.By the end of 2009, total housing starts had declined to less than 0.6 million units, well below prior historical lows ofapproximately 1 million units annually. In 2020, total annual housing starts in the U.S. reached 1.475 million units.
ADDITIONAL AGGREGATES PRODUCTS AND MARKETSWe sell aggregates that are used as ballast for construction and maintenance of railroad tracks. We also sell riprap and jettystone for erosion control along roads and waterways. In addition, stone can be used as a feedstock for cement and limeplants and for making a variety of adhesives, fillers and extenders. Coal-burning power plants use limestone in scrubbers toreduce harmful emissions. Limestone that is crushed to a fine powder can be sold as agricultural lime.
We sell a relatively small amount of construction aggregates outside of the United States, principally in the areassurrounding our large quarry on the Yucatan Peninsula in Mexico. Nondomestic sales and long-lived assets outside the)����� ����� � ������ �� 3��� .9 �������� ��������� �� -��� 5 �(����� ��������� �� ���� ������ &���

Part I 12
VERTICAL INTEGRATIAA ON
While aggregates is our focus and primary business, we believe vertical integration between aggregates and downstreamproducts, such as asphalt mix and ready-mixed concrete, can be managed effeff ctively in certain markets to generateattractive financial returns and enhance financial returns in our core Aggregates segment. We produce and sell asphalt mixand/or ready-mixed concrete within each of our three geographic markets, as noted below. Aggregates compriseapproximately 95% of asphalt mix by weight and 80% of ready-mixed concrete by weight. In both of these downstreambusinesses, aggregates are primarily supplied from our operations.

Part I 13
2. ASPHALTWe produce and sell asphalt mix in Alabama, Arizona, California, New Mexico, Tennessee and Texas. In October 2020, westrengthened our asphalt position in Texas by acquiring additional asphalt operations. In June 2018, we acquired additionalasphalt mix operations and a construction paving business in Texas. In March 2018, we entered the Alabama asphaltmarket through the acquisition of an aggregates, asphalt mix and construction paving business. For additional details, see3��� .7 �'�%��������� �� &�+��������� �� -��� 5 �(����� ��������� �� ���� ������ &���
This segment relies on our reserves of aggregates, functioning essentially as a customer to our aggregates operations.Aggregates are a majoa r component in asphalt mix, comprising approximately 95% by weight of this product. We meet theaggregates requirements for our Asphalt segment primarily through our Aggregates segment. These product transfers aremade at local market prices for the particular grade and quality of material required.
Because asphalt mix hardens rapidly, delivery typically is within close proximity to the producing facility. The asphalt mixproduction process requires liquid asphalt cement, which we purchase from third-party producers. We do not anticipate anysignificant difficulties in obtaining the raw materials necessary for this segment to operate. We serve our Asphalt segmentcustomers directly from our local production facilities.
3. CONCRETE
We produce and sell ready-mixed concrete in California, Maryland, Texas, Virginia and Washington D.C. In April 2020, weexited the New Mexico ready-mixed concrete market (we retained the concrete plants and mobile fleet which is leased to thebuyer and obtained a 20-year aggregates supply agreement). In October 2019, we expanded our ready-mixed concreteoperations in Virginia via an acquisition. In March 2018, we exited the Georgia ready-mixed concrete market (we retained allreal property which is leased to the buyer and obtained a long-term aggregates supply agreement). For additional details see3��� .7 �'�%��������� �� &�+��������� �� -��� 5 �(����� ��������� �� ���� ������ &���
This segment relies on our reserves of aggregates, functioning essentially as a customer to our aggregates operations.Aggregates are a majoa r component in ready-mixed concrete, comprising approximately 80% by weight of this product. Wemeet the aggregates requirements of our Concrete segment primarily through our Aggregates segment. These producttransfers are made at local market prices for the particular grade and quality of material required.
Because ready-mixed concrete hardens rapidly, delivery typically is within close proximity to the producing facility. Ready-mixed concrete production also requires cement which we purchase from third-partyrr producers. We do not anticipate anysignificant difficulties in obtaining the raw materials necessary for this segment to operate. We serve our Concrete segmentcustomers from our local production facilities or by truck.
4. CALCIUM
Our Calcium segment is composed of a single calcium operation in Brooksville, Florida. This facility produces calcium productsfor the animal feed, plastics and water treatment industries with high-quality calcium carbonate material mined at theBrooksville quarry.

Part I 14
OTHER BUSINESS-RELATED ITEMS
SEASONALITY AND CYCLICAL NATURE OF OUR BUSINESSAlmost all of our products are produced and consumed outdoors. Seasonal changes and other weather-related conditionscan affeff ct the production and sales volumes of our products. Therefore, the financial results for any quarter do notnecessarily indicate the results expected for the year. Normally, the highest sales and earnings are in the third quarter andthe lowest are in the first quarter. Furthermore, our sales and earnings are sensitive to national, regional and local economicconditions, demographic and population fluctuations, and particularly to cyclical swings in construction spending, primarily inthe private sector.
COMPETITORSWe operate in a fragmented industry with a large number of small, privately-held companies. We estimate that the tenlargest aggregates producers accounted for 31% of the total U.S. aggregates production in 2020. Despite being the industry ���� *� ���� ��� )��� �"�� ��� �� ��� ��� .6?� 2��� ��� �� � traded companies among the ten largest U.S.aggregates producers include the following:
� Cemex S.A.B. de C.V.
� CRH plc
� HeidelbergCement AG
� LafargeHolcim
� Martin Marietta Materials, Inc.
� MDU Resources Group, Inc.
� Summit Materials, Inc.
Because the U.S. aggregates industry is highly fragmented, with over 5,000 companies managing close to 11,000operations during 2020, many opportunities for consolidation exist. Therefore, companies in the industry tend to grow byacquiring existing facilities to enter new markets or extend their existing market positions.
CUSTOMERSNo material part of our business depends upon any single customer whose loss would have a significant adverse effeff ct onour business. In 2020, our five largest customers accounted for 7.5% of our total revenues, and no single customeraccounted for more than 1.8% of our total revenues. Although approximately 45% to 55% of our aggregates shipments havehistorically been used in publicly-funded construction, such as highways, airports and government buildings, a relativelysmall portion of our sales are made directly to federal, state, county or municipal governments/agencies. Therefore, althoughreductions in state and federal funding can curtail publicly-funded construction, the vast majoa rity of our business is notdirectly subject to renegotiation of profits or termination of contracts with local, state or federal governments. In addition, oursales to government entities span several hundred entities coast-to-coast, ensuring that negative changes to variousgovernment budgets would have a muted impact across such a diversified set of government customers.

Part I 15
ENVIRONMENTAL COSTS AND GOVERNMENTAL REGULATIONWe are subject to a wide variety of federal, state and local laws and regulations in the communities where we conductbusiness. Compliance with these laws and regulations ofteff n requires the time and effoff rt of our employees, as well asfinancial resources. The following describes certain significant regulations that may impact our business. For additional��������� ���� �� ��"� � ��� �� ��+������ ��� ������ ��� -��� .' ����" (������
Our operations are subject to numerous laws and regulations relating to the protection of the environment and worker healthand safety; including regulation of facility air emissions and water discharges, waste management, protection of wetlands,listed and threatened species, noise and dust exposure control for workers, and safety regulations under both Mine Safetyand Health Administration (MSHA) and Occupational Safety and Health Administration (OSHA). Compliance with thesevarious regulations requires capital investment, and ongoing expenditures for the operation and maintenance of systemsand implementation of programs. We estimate that capital expenditures for environmental control facilities in 2021 and 2022will be $11.3 million and $7.5 million, respectively. These anticipated expenditures are not material to our earnings orcompetitive position.
We have received notices from the EPA or similar state or local agencies that we are considered a potentially responsibleparty (PRP) at a limited number of sites under the Comprehensive Environmental Response, Compensation and Liability Act(CERCLA or Superfur nd) or similar state and local environmental laws. Generally we share the cost of remediation at thesesites with other PRPs or alleged PRPs in accordance with negotiated or prescribed allocations. There is inherent uncertaintyin determining the potential cost of remediating a given site and in determining any individual party's share in that cost. As aresult, estimates can change substantially as additional information becomes available about the nature or extent of sitecontamination, remediation methods, other PRPs and their probable level of involvement, and actions by or againstgovernmental agencies or private parties.
Frequently, we are required by state and local regulations or contractual obligations to reclaim our former mining sites.These reclamation liabilities are recorded at fair value in our financial statements at the time the obligation arises. Todetermine the fair value, we estimate the cost for a third party to perfor rm the legally required reclamation, which is adjustedfor inflation and risk and includes a reasonable profit margin. Reclaimed quarries ofteff n have potential for use in commercialor residential development or as reservoirs or landfills. However, no projected cash flows from these anticipated uses havebeen considered to offsff et or reduce the estimated reclamation liability.
For additional information about environmental matters and reclamation obligations, see Notes 12 and 17, respectively, to��� ����� ����� ������ ��������� �� -��� 5 �(����� ��������� �� ���� ������ &���
HUMAN CAPITALAs of January 1, 2021, we employed 8,431 people in the United States. Of these employees, 651 are represented by laborunions. Also, as of that date, we employed 415 people in Mexico and 1 person in the Bahamas, and of these employees,339 are represented by labor unions. We do not anticipate any significant issues with any unions in 2021.
*� ���� ���������� �� �� ���� � �� played a key role in the ongoing success and growth of our company throughout ourlong history. We are dedicated to fostering a culture of mutual respect, integrity, teamwork and trust among our workforce.Our people share a competitive drive to be the best they can be and do the right thing, which benefits all our stakeholders.
Diversity and inclusion are important values at Vulcan. Our continued investment in people and strong commitment todiversity and inclusion will help us attract, grow and retain the best talent possible. In 2015, we escalated and formalized oureffoff rts in this area with the launch of our Diversity and Inclusion Council to promote an open workplace where everyone,regardless of background, race, or other factors is free to contribute and grow. In 2019, we signed the CEO Action forDiversity & InclusionTM pledge and we forged a long-term partnership with Historically Black Colleges and Universities(HBCUs) to support our future leaders in our communities and on our team.
AAs a result of our commitment to diversity and inclusion we have:� Cultivated a diverse talent pipeline of next generation leaders through our operations/sales trainee program� Expanded the diversity of our workforce at middle management and higher levels� Increased the number of female hires and promotions in senior leadership roles� Developed a five-year strategy through our Diversity and Inclusion Council� Built partnerships with HBCUs to recruit talented minority students for internships and management training roles

Part I 16
Today, approximately 38% of our workforce is diverse, and we have a number of initiatives to continue building a diverseand inclusive workforce. We have more than doubled the number of diverse Division and Corporate offiff cers since 2013. OurBoard of Directors is 36% diverse; and, we earned recognition in 2017 by 2020 Women on Boardsrr for having 20% or moreof our board seats held by women.
We believe that learning is fundamental to every job and we encourage our people to expand and explore their capabilitiesfor continued growth. Our industry-leading training and development programs encourage collaboration and enable peopleto innovate and flourish on the job and in the community. These programs:� Provide our employees with a Tuition Reimbursement Program which pays up to 100% of tuition costs based onacademic perfor rmance
� Encourage personal and professional growth through our mentoring program which has graduated more than 1,906employees
� Prepare future senior-level leaders through our Leadership 2022 series in partnership with the University of NorthCarolina, Chapel Hill
� Offeff r mini MBA programs and other continuing education opportunities
The result is strong employee engagement that puts Vulcan in the top 10% in our most recent !�@����� A #�������Organizational Health Index cycle (2017), which benchmarked Vulcan against over 5 million respondents from 1,700companies.
Employee Tenure Employees by Age Group
Workforce Racial/Ethnic Diversity Salaried Non-Exempt Employees by Gender

Part I 17
SHAREHOLDER RETURN PERFORMANCEBelow is a graph comparing the perfor rmance of our common stock, with dividends reinvested, to that of the Standard &����� 966 ����" -���� ��A� 966> �� ��� !��� � �� ��+���� ����� �� ��� ;� ���� 9666 -���� �;� ���� 9666 !A�)from December 31, 2015 to December 31, 2020. The Wilshire 5000 M&S is a market capitalization weighted sectorcontaining public equities of firms in the Materials and Services sector, which includes our company and approximately1,300 other companies.
2015 2016 2017 2018 2019 2020
Comparative Total Return 1
Vulcan Materials Company $ 100.00 $ 132.69 $ 137.21 $ 106.66 $ 156.86 $ 163.33S&P 500 $ 100.00 $ 111.96 $ 136.40 $ 130.43 $ 171.48 $ 203.03Wilshire 5000 M&S $ 100.00 $ 111.39 $ 142.11 $ 131.47 $ 175.29 $ 229.20
1 Assumes an initialtt investment at December 31, 2015 of $100 in each stock/ikk ndexii ,x with quarterly reinvesvv tment of dividends.

Part I 18
INVESTOR INFORMATIONWe make available on our website, www.vww ulcanmateriarr ls.com, free of charge, copies of our:
� Annual Report on Form 10-K
� Quarterly Reports on Form 10-Q
� Current Reports on Form 8-K
Our website also includes amendments to those reports filed with or furnished to the Securities and Exchange Commission(SEC) pursuant to Section 13(a) or 15(d) of the Securities Exchange Act of 1934 as well as all Forms 3, 4 and 5 filed withthe SEC by our executive offiff cers and directors, as soon as the filings are made publicly available by the SEC on its EDGARdatabase (www.sww ec.gov).
In addition to accessing copies of our reports online, you may request a copy of our Annual Report on Form 10-K, includingfinancial statements, by writing to Denson N. Franklin III, Senior Vice President, General Counsel and Secretary, VulcanMaterials Company, 1200 Urban Center Drive, Birmingham, Alabama 35242.
We have a:
� Business Conduct Policy applicable to all employees and directors
� Code of Ethics for the CEO and Senior Financial Offiff cers
#����� �� ��� B������� #������ �� ��� �� ��� #��� �� $����� � +� � � �� �� ������� ���� ��� ������ �#�����Governa���� ���� ��� �-�+���� �� ������ ��� If we make any amendment to, or waiver of, any provision of the Code ofEthics, we will disclose such information on our website as well as through filings with the SEC.
Our Board of Directors has also adopted:
� Corporate Governance Guidelines
� Charters for our Audit, Compensation, Executive, Finance, Governance and Safety, Health & Environmental Affaff irsCommittees
These documents meet all applicable SEC and New York Stock Exchange (NYSE) regulatory requirements.
The Charters of the Audit, Compensation and Governance Committees are available on our website under the heading�#����� C�+������ ���� ��� �-�+���� �� ������ �� � ��� �� �%���� ���� �� �� �� ����� ��������� �� ������to Denson N. Franklin III, Senior Vice President, General Counsel and Secretary, Vulcan Materials Company, 1200 UrbanCenter Drive, Birmingham, Alabama 35242.
Information included on our website is not incorporated into, or otherwise made a part of, this report.
CERTIFICATIONS AND ASSERTIONSThe certifications of our Chief Executive Offiff cer and Chief Financial Officer made pursuant to Section 302 of the Sarbanes-Oxley Act of 2002 are included as exhibits to this Annual Report on Form 10-K. Additionally, on June 4, 2020 our ChiefExecutive Offiff cer submitted to the NYSE the annual written affiff rmation required by the rules of the NYSE certifying that hewas not aware of any violations of Vulcan Materials Company of NYSE corporate governance listing standards.

Part I 19
ITEM 1ARISK FACTORS
The following risks could materially and adversely affeff ct our business, financial condition and results of operations, andcause the trading price of our common stock to decline. These risk factors do not identifyff all risks that we face; ouroperations could also be affected by factors that are not presently known to us or that we currently consider to be immaterialto our operations. Due to risks and uncertainties, known and unknown, our past financial results may not be a reliableindicator of future perfor rmance and historical trends should not be used to anticipate results or trends in future periods. Youshould also refer to the other information set forth in this Annual Report on Form 10-@� ��� ����� -��� 1 �!���������Discussion and A� ���� �� (����� #�������� �� ���� �� �� 2�������� �� -��� 5 �(����� ��������� ������ ������ &���
ECONOMIC/POLITICAL RISKSOur business is dependent on the construction industry and is subject to economic cycles � Our products areprincipally sold to the U.S. construction industry. Since our business is dependent on spending in both the public and privatesector construction markets, our profits are sensitive to the underlying national, regional, and local economic conditions.Construction spending, which is cyclical, is affeff cted by general economic conditions, changes in interest rates, demographicshiftsff , industry cycles, employment levels, inflation and other business, economic and financial factors that are beyond ourcontrol. A downturn in construction activities or spending in Vulcan-served markets, particularly in our top revenue-generating markets, could have a material adverse effeff ct on our business, financial condition, and results of operations.
A pandemic, epidemic or other public health emergency, such as the recent outbreak of the current coronavirus(COVID-19) pandemic, could have a material adverse effeff ct on our business, results of operations, financialcondition and cash flows� Our operations expose us to risks associated with pandemics, epidemics or other publichealth emergencies, such as the COVID-19 pandemic. In March 2020, the World Health Organization characterized COVID-19 as a pandemic, and the President of the United States declared the COVID-19 outbreak a national emergency. Theoutbreak has resulted in governments around the world implementing or reimplementing strict measures to help control the���� �� ��� +���� ��� ����� %�������� ���� �� �� � ��� �� ���� � ����� ����� �+� ����������� ��������curtailments, school closures, and other measures. In addition, governments and central banks in several parts of the worldhave enacted fiscal and monetary stimulus measures to counteract the impacts of the COVID-19 pandemic, and may takefurther action as circumstances warrant.
Consistent with federal guidelines and with state and local orders to date, we currently continue to operate across ourfootprint as an essential business. Notwithstanding our continued operations and an economic environment that has shownsigns of improvement, the COVID-19 pandemic has had and may have further negative impacts on our operations, supplychain, transportation networks and customers, which may lower our revenues and EBITDA, including as a result ofpreventative and precautionary measures that we, other businesses and governments are taking. The COVID-19 pandemicis a widespread public health crisis that is adversely affeff cting the economies and financial markets of many countries. Anyresulting economic downturn could adversely affeff ct demand for our products and contribute to volatile supply and demandconditions affeff cting prices and volumes in the markets for our products and services. The progression of this matter has andmay continue to negatively impact our business or results of operations by affecting the health of our employees andthrough the temporary closure of our operating locations or those of our customers or suppliers. The extent to which theCOVID-19 outbreak impacts our business, results of operations, financial condition or cash flows will depend on futuredevelopments, which remain highly uncertain and cannot be predicted, including, but not limited to, the duration andgeographic spread of the outbreak, its severity, the actions to contain the virus or treat its impact including thereimplementation of restrictions on economic activity following new outbreaks, the long-term impacts of the virus ontransportation revenues, government budgets and other funding priorities and the extent and pace at which normaleconomic and operating conditions can resume. There can be no assurance that we will not be impacted by adverseconsequences that may be brought about by pandemics on global financial markets, which may reduce resources, shareprices and financial liquidity and may severely limit the availability of financing capital.

Part I 20
Changes in legal requirements and governmental policies concerning zoning, land use, environmental and otherareas of the law may result in additional liabilities, a reduction in operating hours and additional capitalexpenditures� Our operations are affeff cted by numerous federal, state and local laws and regulations related to zoning,land use and environmental matters. Despite our compliance effoff rts, we have an inherent risk of liability in the operation ofour business. These potential liabilities could have an adverse impact on our operations and profitability. In addition, ouroperations require numerous governmental approvals and permits, which ofteff n require us to make significant capital andoperating expenditures to comply with the applicable requirements. Stricter laws and regulations, or more stringentinterpretations of existing laws or regulations, may impose new liabilities, taxes or tariffsff on us, reduce operating hours,require additional investment by us in pollution control equipment, create restrictions on our products or impede our accessto reserves or opening new or expanding existing plants or facilities.
Our business is dependent on the timing and amount of federal, state and local funding for infrastructure� Ourproducts are used in a variety of public infrastructure projects that are funded and financed by federal, state and localgovernments. In 2020, voters in local jurisdictions in Arizona, California, Florida, Georgia, North Carolina, South Carolina,Texas and Virginia, among others, approved bond and revenue-raising measures to provide additional resources fortransportation projects. In 2020, Virginia passed new long-term highway funding legislation and voters in Arkansas madepermanent a ½ cent gas tax increase first approved in 2012. The federal FAST Act, a five year, fully-funded road, bridge andpublic transportation authorization law, was extended for a year, and continues to provide assistance to state DOTs andmetro areas while Congress contemplates new long-term highway and transit legislation in 2021. However, given varyingstate and local budgetary situations and the associated pressure on infrastructure spending, we cannot be entirely assuredof the existence, amount and timing of appropriations for future public infrastructure projects.
Climate change and climate change legislation or regulations may adversely impact our business � A number ofgovernmental bodies have introduced or are contemplating legislative and regulatory change in response to the potential������ �� � ���� ������ ���� ���� ���� � ��� ����� �� ������� ������� � ��� � ��� ��� ��+������ �� ��� ������ ������ �� ������ �� ������ � ���� ��� ���� ���� ��+isions.
Other potential impacts of climate change include physical impacts, such as disruption in production and product distributiondue to impacts from major storm events, shiftsff in regional weather patterns and intensities, availability of water and potentialimpacts from sea level changes. There is also a potential for climate change legislation and regulation to adversely impactthe cost of purchased energy and electricity. A number of our facilities are located in desert climates, and while we have notexperienced any significant shortarr ges of energy or water in the past, we cannot guarantee that we will not in the future.Furthermore, public expectations for reductions in greenhouse gas emissions could result in increased energy,transportation and raw material costs, and may require us to make additional investments in facilities and equipment.
The impacts of climate change on our operations and the company overall are highly uncertain and difficult to estimate.However, climate change legislation and regulation concerning greenhouse gases could have a material adverse effeff ct onour future financial position, results of operations or cash flows.
We are subject to various risks arising from our international business operations and relationships, which couldadversely affeff ct our business �We have international operations and are subject to both the risks of conductinginternational business and the requirements of the Foreign Corrupt Practices Act of 1977 (the FCPA). We face political andother risks associated with our international operations, including our largest production facility located in Playa del Carmen,Mexico. These risks may include changes in international trade policies, such as the United States - Mexico - CanadaAgreement (USMCA), imposition of duties, taxes or government royalties, arbitrary changes to permits, zoningclassifications or operating agreements, or overt acts by foreign governments, including expropriations and other forms oftakings of property. In addition, failure to comply with the FCPA may result in legal claims against us.
GROWTH AND COMPETITIVE RISKSWithin our local markets, we operate in a highly competitive industry which may negatively impact prices, volumesand costs� The construction aggregates industry is highly fragmented with a large number of independent local producersin a number of our markets. Additionally, in most markets, we also compete against large private and public companies,some of which are significantly vertically integrated. Therefore, there is intense competition in a number of markets in whichwe operate. This significant competition could lead to lower prices and lower sales volumes in some markets, negativelyaffeff cting our earnings and cash flows.

Part I 21
The expanded use of aggregates substitutes could have a material adverse effeff ct on our business, financialcondition and results of operations� Recycled concrete and asphalt are increasingly being used in a number of ourmarkets, particularly urban markets, as a substitute for aggregates. The expanded use of recycled concrete and asphaltcould cause a significant reduction in the demand for aggregates.
Our long-term success depends upon securing and permitting aggregates reserves in strategically located areas. Ifwe are unable to secure and permit such reserverr s it could negatively affeff ct our future earnings � Constructionaggregates are bulky and heavy and, therefore, difficult to transport effiff ciently. Because of the nature of the products, thefreight costs can quickly surpass the production costs. Therefore, except for geographic regions that do not possesscommercially viable deposits of aggregates and are served by rail, barge or ship, the markets for our products tend to belocalized around our quarry sites and are served by truck. New quarry sites ofteff n take years to develop; therefore, ourstrategic planning and new site development must stay ahead of actual growth. Additionally, in a number of urban andsuburban areas in which we operate, it is increasingly difficult to permit new sites or expand existing sites due to communityresistance. Therefore, our future success is dependent, in part, on our ability to accurately forecast future areas of highgrowth in order to locate optimal facility sites and on our ability to secure operating and environmental permits to operate atthose sites.
Our future growth depends in part on acquiring other businesses in our industry and successfully integrating themwith our existing operations. If we are unable to integrate acquisitions successfully, it could lead to higher costsand could negatively affeff ct our earnings� The expansion of our business is dependent in part on the acquisition ofexisting businesses that own or control aggregates reserves. Disruptions in the availability of financing could make it moredifficult to capitalize on potential acquisitions. Additionally, with regard to the acquisitions we are able to complete, our futureresults will depend in part on our ability to successfully integrate these businesses with our existing operations.
FINANCIAL/ACCOUNTING RISKSOur industry is capital intensive, resulting in significant fixed and semi-fixed costs. Therefore, our earnings arehighly sensitive to changes in product shipments� Due to the high levels of fixed capital required for extracting andproducing construction aggregates, our profits are negatively affeff cted by significant decreases in shipments.
Significant downturn in the construction industry may result in an impairment of our goodwill�We test goodwill forimpairment on an annual basis or more frequently if events or circumstances change in a manner that would more likelythan not reduce the fair value of a reporting unit below its carrying value. While we have not identified any events or changesin circumstances since our annual impairment test on November 1, 2020 that indicate the fair value of any of our reportingunits is below its carrying value, a significant downturn in the construction industry may have a material effeff ct on the fairvalue of our reporting units. A significant decrease in the estimated fair value of one or more of our reporting units couldresult in the recognition of a material, noncash write-down of goodwill.
A deterioration in our credit ratings and/or the state of the capital markets could negatively impact the cost and/oravailability of financing�We currently have $3.36 billion of debt with maturities between 2021 and 2048. Given ourcurrent credit metrics and ratings, together with other factors, we expect to refinance our nearer term debt maturities ratherthan repay them when due. Furthermore, we expect to finance acquisitions with a combination of cash flows from existingoperations, additional debt and/or additional equity. The mix of financing sources for acquisitions will be situationallydependent.
A deterioration in our credit ratings, regardless of the cause, could limit our debt financing options and increase the cost ofsuch debt financing. While we do not anticipate a credit ratings downgrade, and plan to manage our capital structureconsistent with investment-grade credit metrics, we cannot assure our current credit ratings.
A deterioration in the state of the capital markets, regardless of our credit ratings, could impact our access to, and cost of,new debt or equity capital.

Part I 22
We use estimates in accounting for a number of significant items. Changes in our estimates could adversely affeff ctour future financial results� '� ��������� ��� �� � �� �#���� '��������� �� ������ ���� -��� 1 �!���������Discussion and Analysis of Financial #�������� �� ���� �� �� 2��������� �� ��� ���������� judgment in accounting for:
� goodwill impairment
� impairment of long-lived assets excluding goodwill
� business combinations and purchase price allocation
� pension and other postretirement benefits
� environmental compliance costs
� claims and litigation including self-insurance
� income taxes
These assumptions and estimates could change significantly in the future and could adversely affeff ct our financial position,results of operations, or cash flows.
The phase-out of LIBOR, or the replacement of LIBOR with a different reference rate or modification of the methodused to calculate LIBOR, may adversely affeff ct interest rates � LIBOR is an interest rate benchmark used as areference rate for a wide range of financial transactions. I� D� � 46.1� ��� )����� @�������� (����� #������ '��������which regulates LIBOR, announced that it intends to stop compelling banks to submit LIBOR rates afteff r 2021. It is unclearwhether LIBOR will cease to exist at that time (and if so, what reference rate will replace it) or if new methods of calculatingLIBOR will be established such that it continues to exist afteff r 2021. The Alternative Reference Rates Committee (ARRC)has proposed the Secured Overnight Financing Rate (SOFR) as the alternative to U.S. LIBOR. ARRC has proposed apaced market transition plan to SOFR from LIBOR, and organizations are currently working on industry wide and companyspecific transition plans. Uncertainty exists as to the transition process and broad acceptance of SOFR as the primaryalternative to LIBOR. We have two material debt instruments with LIBOR as a reference rate: 1) $500.0 million floating-ratenotes due March 2021, and 2) $1,000.0 million line of credit (none outstanding at December 31, 2020) due September 2025.At this time, we cannot predict the impact of a departure from LIBOR as a reference rate.
PERSONNEL RISKSOur future success greatly depends upon attracting and retaining qualified personnel, particularly in sales andoperations� A significant factor in our future profitability is our ability to attract, develop and retain qualified personnel. Oursuccess in attracting qualified personnel, particularly in the areas of sales and operations, is affeff cted by changingdemographics of the available pool of workers with the training and skills necessary to fill the available positions, the impacton the labor supply due to general economic conditions, and our ability to offeff r competitive compensation and benefitpackages.
Disputes with organized labor could disrupt our business operations� Labor unions represent approximately 11% ofour workforce. Disputes with our trade unions, or the inability to renew our labor agreements, may lead to strikes or otheractions that could disrupt our business operations leading to higher costs and/or reduced revenues.

Part I 23
GENERAL RISK FACTORSA significant interruption of our information technology systems or the loss of confidential or other sensitive datacould have a material adverse impact on our operations and financial results� Given our reliance on informationtechnology (our own and that of our service ��+����� such as Amazon Web Services), a significant interruption in theavailability of information technology or the loss of confidential, personal, or proprietary information (whether our own, our��� ������� �� ���� ����� � �� ���������>� ��� ��� �� ��� ����� ��� � �����+� � ����� �� operations and financialresults. We have a dedicated information security team that executes, and updates as warranted based on emerging riskand new risk management technology, our information security program. The Audit Committee, which has oversightresponsibility for our information security program, is briefed on such program at least twice annually, and our ChieffFinancial Offiff cer is briefed on such program at least quarterly. While we have invested in the protection of our data andinformation technology and routinely test the security of our information systems network, we cannot be assured that oureffoff rts will prevent breakdowns or breaches in our systems that could adversely affeff ct our business.
Weather can materially affeff ct our operating results� Almost all of our products are consumed outdoors in the public orprivate construction industry, and our production and distribution facilities are located outdoors. Inclement weather affeff cts both�� �� ��� �� ������ �� ��������� �� ������� �� ����� ��� �� ��������� ���� -term demand because their work also can behampered by weather.
Our products are transported by truck, rail, barge or ship, ofteff n by third-party providers. Significant delays orincreased costs affeff cting these transportation methods could materially affeff ct our operations and earnings � Ourproducts are distributed either by truck to local markets or by rail, barge or oceangoing vessel to remote markets. The costsof transporting our products could be negatively affeff cted by factors outside of our control, including rail service interruptionsor rate increases, tariffs,ff rising fuel costs, truck/railcar/barge shortages, truck driver and rail crew shortages, capacityconstraints and minimum tonnage requirements. Additionally, inclement weather, including hurricanes, tornadoes and otherweather events, can negatively impact our distribution network.
We use large amounts of electricity, diesel fuel, liquid asphalt and other petroleum-based resources that aresubject to potential supply constraints and significant price fluctuation, which could affeff ct our operating resultsand profitability� In our production and distribution processes, we consume significant amounts of electricity, diesel fuel,liquid asphalt and other petroleum-based resources. The availability and pricing of these resources are subject to marketforces that are beyond our control. Our suppliers contract separately for the purchase of such resources, and our sources ofsupply could be interrupted should our suppliers not be able to obtain these materials due to higher demand or other factorsthat interrupt their availability. Variability in the supply and prices of these resources could materially affeff ct our operatingresults from period to period, and rising costs could erode our profitability.
Aggregates resources and reserves calculations are estimates only, and are subject to uncertainty due tofactors including the inherent variability of the deposit and recoverability of saleable material in the miningprocess � The calculation of mineral resources and reserves are estimates and depend upon geologicalinterpretation and statistical inferences or assumptions drawn from drilling and sampling analysis, which may prove tobe unpredictable. Until mineral reserves are actually mined and processed, the quantity must be considered as anestimate only.
We are involved in a number of legal proceedings. We cannot predict the outcome of litigation and othercontingencies with certainty�We are involved in several complex litigation proceedings, some arising from our previousownership and operation of a Chemicals business. Although we divested the Chemicals business in June 2005, we retainedcertain liabilities related to the business. As required by generally accepted accounting principles (GAAP), we establishreserves when a loss is determined to be probable and the amount can be reasonably estimated. Our assessment ofprobability and loss estimates are based on the facts and circumstances known to us at a particular point in time.Subsequent developments in legal proceedings may affeff ct our assessment and estimates of a loss contingency, and couldresult in an adverse effeff ct on our financial position, results of operations or cash flows. For a description of our current���������� �� ���������� ��� 3��� .4 �#���������� �� #������������� in -��� 5 �(����� ��������� ��Suppleme��� &���

Part I 24
Our construction paving business may subject us to contractually imposed penalties or lost profits �We operateconstruction paving businesses in Alabama, Tennessee and Texas. In some instances, including many of our fixed pricepaving contracts, we agree to complete a project by a certain date. If we fail to complete the project as scheduled, we maybe held responsible for costs resulting from the delay. Consequently, the total project cost could exceed our originalestimate, and we could experience reduced profits or even a loss on the project.
We are involved in certain environmental matters. We cannot predict the outcome of these contingencies withcertainty�We are involved in environmental investigations and cleanups at sites that we own or owned, where we operateor have operated or where we sent materials for recycling or disposal, as well as related offsff ite investigations and cleanups.As required by GAAP, we establish reserves when a loss is determined to be probable and the amount can be reasonablyestimated. Our assessment of probability and loss estimates are based on the facts and circumstances known to us at aparticular point in time. Subsequent developments related to these matters may affeff ct our assessment and estimates of losscontingency, and could result in an adverse effeff ct on our financial position, results of operations or cash flows. For a���������� �� �� ����� ���������� ��+������� ����� ��� 3��� .4 �#���������� �� #������������� �� -��� 5�(����� ��������� �� ���� ������ &���
ITEM 1BUNRESOLVED STAFF COMMENTS
We have not received any written comments from the Securities and Exchange Commission staffff regarding our periodic orcurrent reports under the Exchange Act of 1934 that remain unresolved.

Part I 25
ITEM 2PROPERTIES
AGGREGATESAs the largest U.S. supplier of construction aggregates, we serve markets in twenty states, Washington D.C. and the localmarket surrounding our operation in Mexico. Our primary focus is serving states and metropolitan markets in the U.S. thatare expected to experience the most significant growth in population, households and employment. These threedemographic factors are significant drivers of demand for aggregates.
Our current estimate of 15.9 billion tons of proven and probable aggregates reserves reflects a decrease of 0.3 billion tons��� ��� ��� ���� �������� $������� �� ���+�� � �� ���+�� � ������ ��� �� �+� �� ����� � %� ��� ��economic extraction, based on drilling and studies by our geologists and engineers, recognizing reasonable economic andoperating constraints as to maximum depth of overburden and stone excavation, and subject to permit or other restrictions,.
Proven, or measured, reserves are those reserves for which the quantity is computed from dimensions revealed by drilldata, together with other direct and measurable observations, such as outcrops, trenches and quarry faces. The grade andquality of those reserves are computed from the results of detailed sampling, and the sampling and measurement data arespaced so closely and the geologic character is so well defined that size, shape, depth and mineral content of reserves arewell established. Probable, or indicated, reserves are those reserves for which quantity, grade and quality are computedpartly from specific measurements and partly from projections based on reasonable, though not drilled, geologic evidence.The degree of assurance, although lower than that for proven reserves, is high enough to assume continuity between points ofobservation.

Part I 26
Reported proven and probable reserves include only quantities that are owned in fee or under lease, and for which allappropriate zoning and permitting have been obtained through permit, contract or grandfathered status. Leases, zoning,permits, reclamation plans and other government or industry regulations ofteff n set limits on the areas, depths and lengths oftime allowed for mining, stipulate setbacks and slopes that must be left in place, and designate which areas may be used forsurface facilities, berms, and overburden or waste storage, among other requirements and restrictions. Our reserveestimates take into account these factors. Technical and economic factors also affeff ct the estimates of reported reservesregardless of what might otherwirr se be considered proven or probable based on a geologic analysis. For example, excessiveoverburden or weathered rock, rock quality issues, excessive mining depths, groundwater issues, overlying wetlands,endangered species habitats, and rights of way or easements may effeff ctively limit the quantity of reserves consideredproven and probable. In addition, computations for reserves in-place are adjusted for estimates of unsaleable sizes andmaterials as well as pit and plant waste.
The 15.9 billion tons of estimated proven and probable aggregates reserves reported at the end of 2020 include reserves atinactive and greenfield (undeveloped) sites. The table below presents, by division, the tons of proven and probableaggregates reserves as of December 31, 2020 and the types of facilities operated.
(millions of tons)s Count of Aggregates Operatingtt Faciliii tii es 2
Aggregates Reservesvv 2020 Sand andDivisiii on 1 Provrr en Probablrr e Total Producrr tion Stone Gravelv Sales Yardsdd
Central 2,301.3 820.4 3,121.7 32.7 55 5 8International 529.5 0.0 529.5 11.4 1 0 0Mideast 2,422.8 981.2 3,404.0 34.0 37 4 24Mountain West 216.1 112.8 328.9 8.7 2 13 2Southeast 3 2,952.9 871.7 3,824.6 50.1 45 8 24Southern Gulf Coast 1,804.1 52.4 1,856.5 23.1 24 0 19Southwest 1,377.8 0.0 1,377.8 24.3 16 1 24Western 761.9 737.4 1,499.3 18.8 5 12 1Total 12,366.4 3,575.9 15,942.3 203.1 185 43 102
1 The divisiii onii s arerr definedii by states/css ountrierr s as follows:wwCentraltt Divisvv ion Arkarr nsas, Illinll ois, Kentuckyk and TennesseeInternational Divisvv ion MexicoiiMideast Divisiii on Delawarww e,rr Marylayy nd,d Northrr Carolina, Pennsylvyy anvv ia, VirVV girr niaii and Washington D.C.Mountain West Divisionii Arizrr onzz a and New MexicoiiSoutheasttt Divisvv ion Florida (excludingdd panhandle), Georgia and Southtt Carolinll aSouthertt nrr Gulfll Coast Divisiii onii Alabaml a, Florida Panhandle, Louisiii anaii and Missii issippiSouthwtt est Divisiii onii Oklahkk oma and TexasWestern Divisiii on Californiaff
2 In additiontt to the aggregates faciliii ties incii luded in the table above, we operated 50 recyclyy ed concrete plants which are notdependent on reservesvv .
3 Includes a maximuii m of 314.2 millii ioll n tons of reserverr s encumbered by volumetritt c production paymeyy nts as defined in Note 2�Rev� enuesvv � in Item 8 �Financial� Stattt ements and Supplemu entary Data.�
Of the 15.9 billion tons of aggregates reserves at December 31, 2020, 9.2 billion tons or 58% are located on owned land and6.7 billion tons or 42% are located on leased land.

Part I 27
The following table lists our ten largest active aggregates facilities based on the total proven and probable reserves at thesites. None of our aggregates facilities contributed more than 5% to our total revenues in 2020.
(millions of tons)sReservesvv at 12/31/// 2020// 2020
Locationtt (ne(( arest majoa r metroprr olitan area)rr Provrr en Probablrr e Total Producrr tioni
Playa del Carmen (Cancun), Mexico 529.5 0.0 529.5 11.4Hanover (Harrisburg), Pennsylvania 221.5 236.4 457.9 2.0McCook (Chicago), Illinois 96.8 266.5 363.3 4.4Corona (Los Angeles), California 10.0 320.0 330.0 2.1Gold Hill (Charlotte), North Carolina 146.7 121.2 267.9 0.9Postell (Macon), Georgia 186.5 72.3 258.8 4.6San Emidio (Bakersfield), California 28.5 221.5 250.0 0.9Medina (San Antonio), Texas 244.6 0.0 244.6 2.8Macon, Georgia 115.4 128.0 243.4 2.0Norcross (Atlanta), Georgia 180.2 27.7 207.9 3.4
ASPHALT, CONCRETE AND CALCIUMAs of December 31, 2020, we operated a number of facilities producing asphalt mix, ready-mixed concrete and calcium inseveral of our divisions as reflected in the table below:
Asphas lt 2 Concrete Calcium 3
Divisiii on 1 Facilitiei s Facilitiei s Facilitiei s
Central 10 0 0
Mideast 0 36 0Mountain West 21 0 0Southeast 0 0 1Southern Gulf Coast 2 0 0Southwest 15 7 0Western 22 3 0Total 70 46 1
1 Internationaltt Divisvv ion has no asphs alt,t concrete or calcium faciliii ties.2 Asphals t faciliii ties for the Central,tt Southerntt Gulf Coast and Southwest Divisvv ions arerr comprised of asphals tl mixii faciliii tii es andconstrutt ctiontt pavingii businessii es.
3 Comprised of a ground calcium plall nt.
The asphalt and concrete facilities are able to meet their needs for raw material inputs with a combination of internallysourced and purchased raw materials.

Part I 28
Our Calcium segment operates a quarry at Brooksville, Florida which provides feedstock for the ground calcium operation.The Brooksville quarry is not individually material to our business. Calcium resources and reserves are outlined in the tablebelow:
(millions of tons)sReservesvv at 12/31/// 2020// 2020
Locationi Provrr envv Probablerr Total Producrr tioni
Brooksville 4.5 7.1 11.6 0.3
Our Brooksville limestone quarry is mined and processed primarily as a supplement for end-use products, such as animalfeed and plastics. High purity limestone is inert and relatively inexpensive compared to the other components used in theseend-use products. The Brooksville limestone quarry has an average calcium carbonate (CaCO3) content of 98.0%.
HEADQUARTERSOur headquarters are located in an office complex in Birmingham, Alabama. The offiff ce space consists of approximately184,410 square feet and is leased through December 31, 2023, with three five-year renewal periods thereafteff r. The annualrental cost for the current term of the lease is approximately $3.7 million.
ITEM 3LEGAL PROCEEDINGS
We are subject to occasional governmental proceedings and orders pertaining to occupational safety and health or toprotection of the environment, such as proceedings or orders relating to noise abatement, air emissions or water discharges.As partrr of our continuing program of stewardship in safety, health and environmental matters, we have been able to resolvesuch proceedings and to comply with such orders without any material adverse effeff cts on our business.
We are a defendant in various lawsuits in the ordinary course of business. It is not possible to determine with precision theoutcome of, or the amount of liability, if any, under these lawsuits, especially where the cases involve possible jury trials withas yet undetermined jury panels.
We were not subject to any penalties in 2020 for failure to disclose transactions identified by the Internal Revenue Serviceas abusive under Internal Revenue Code Section 6707A.
��� 3��� .4 �#���������� �� #������������� �� -��� 5 �(����� ��������� �� ���� ������ &�� �� ����������of our material legal proceedings.
ITEM 4MINE SAFETY DISCLOSURES
The information concerning mine safety violations or other regulatory matters required by Section 1503(a) of the Dodd-FrankWall Street Reform and Consumer Protection Act and Item 104 of Regulation S-K is included in Exhibit 95 of this report.

Part I 29
INFORMATION ABOUT OUR EXECUTIVE OFFICERSThe names, positions and ages, as of February 20, 2021, of our executive offiff cers are as follows:
Name Positiontt Age
J. Thomas Hill Chairman, President and Chief Executive Officer 61
Suzanne H. Wood Senior Vice President and Chief Financial Offiff cer 60
Stanley G. Bass Chief Strategy Officer 59
Thompson S. Baker II Chief Operating Offiff cer 62
David P. Clement Senior Vice President, Mountain West and Western Divisions 60
Denson N. Franklin III Senior Vice President, General Counsel and Secretary 57
Jerry F. Perkins Jr. Senior Vice President, Southern & Gulf Coast and Southwest Divisions 51
Jason P. Teter Senior Vice President, Mideast and Southeast Divisions 46
Randy L. Pigg Vice President, Controller and Principal Accounting Officer 48
The principal occupations of the executive offiff cers during the past five years are set forth below:
J. Thomas Hill was elected Chairman of the Board of Directors effeff ctive January 1, 2016 and President and Chief ExecutiveOffiff cer in July 2014. Previously, he served as Executive Vice President and Chief Operating Offiff cer from January 2014 toJuly 2014, and Senior Vice President 8 South Region from December 2011 to December 2013. Prior to that, he served in anumber of positions with Vulcan including President, Florida Rock Division from September 2010 to December 2011.
Suzanne H. Wood was elected Senior Vice President, Chief Financial Offiff cer effeff ctive September 2018 and also served asSecretary from September 2019 to December 2019. From 2012 to 2018, she served as Group Finance Director and ChiefFinancial Offiff cer of Ashtead Group plc, a FTSE 50 international equipment rental company serving the construction industryand other markets. Prior to that, she was Executive Vice President and Chief Financial Offiff cer of Sunbelt Rentals, Inc., theNorth American subsidiary of Ashtead Group plc. A certified public accountant, she also previously held Chief FinancialOffiff cer positions at Tultex Corporation and Oakwood Homes Corporation. She currently serves on the board of directors andis chair of the audit committee of RELX Group, a FTSE 50 global professional information and analytics company. She alsoserves on the board of directors, audit committee and nominations committee of Ferguson plc, the FTSE 100 leadingdistributor of plumbing and heating products.
Stanley G. Bass was elected Chief Strategy Offiff cer in February 2021. Prior to that he served as Chief Growth Offiff cer as ofFebruary 2016. He served as Senior Vice President 8Western and Mountain West Divisions from January 2015 to February2016, and Senior Vice President 8West Region from September 2013 to December 2014. Prior to that, he served as SeniorVice President 8 Central and West Regions from February 2013 to September 2013 and Senior Vice President 8 CentralRegion from December 2011 to February 2013. Prior to that, he served in a number of positions with Vulcan includingPresident, Midsouth and Southwest Divisions from September 2010 to December 2011.
Thompson S. Baker II was appointed Chief Operating Offiff cer effecff tive May 2019. He previously served as Senior VicePresident from March 2017 to April 2019. Prior to that, he served in a number of positions with Vulcan, including President 8Florida Rock Division, before serving as Chief Executive Offiff cer of FRP Holdings, Inc. from October 2010 to March 2017 andPresident and Chief Executive Offiff cer of Patriot Transportation Holding, Inc. from December 2014 to March 2017.
David P. Clement was appointed Senior Vice President of the Mountain West and Western Divisions in March 2020. He firstjjoined the organization as an operations management trainee in 1983 and progressed to the position of area productionmanager in 1993. Afteff r spending a few years at Pioneer Mid-Atlantic and working as a consultant, he rejoie ned Vulcan in2004 as vice president and general manager of the Midwest Division. He has held the positions of vice president ofoperations for the Midwest Division, vice president and general manager of the Central Region, senior vice president of theCentral Region, and most recently as president of the Central Division.
Denson N. Franklin III joined us in December 2019 as Senior Vice President, General Counsel and Secretary. Prior to thathe was a partner at Bradley Arant Boult Cummings LLP, a law firm based in Birmingham, Alabama. While at Bradley, he��+�� � *� ���� ���� ������� ������ �� ��� ��� 46 ��� �� �+���� ���� �������� �� ��� �����������materials, building and engineering industries.

Part I 30
Jerry F. Perkins Jr. was appointed Senior Vice President of the Southern & Gulf Coast and Southwest Divisions in March2020. Prior to his current position, he was president of the Southern and Gulf Coast Division. He also served as generalcounsel and corporate secretary and held various legal leadership roles for Vulcan. Before joining Vulcan in 2002, heworked as a certified public accountant (CPA) at a global accounting firm and was an attorney with Burr & Forman LLP inBirmingham, Alabama.
Jason P. Teter was appointed Senior Vice President of the Mideast and Southeast Divisions in March 2020. Prior to hiscurrent position, he was president of the Southeast Division. He joined Vulcan in 2013 as vice president of businessdevelopment. He also served as vice president of finance for Vulcan and president of the Southern and Gulf Coast Division.Before joining Vulcan, he spent ten years in various finance, business development and general management positions withLafarge North America.
Randy L. Pigg was elected Vice President, Controller and Principal Accounting Offiff cer in April 2018. He served as VicePresident, Accounting since June 2016, and prior to that served as Director, Financial Shared Services since April 2014.Prior to that, he served in a number of positions with Vulcan, including Manager Financial Research & Reporting andFinance Director 8 Central Region.

Part II 31
PART IIITEM 5
MARKET FOR REGISTRANT'S COMMON EQUITY, RELATED STOCKHOLDER MATTERSAND ISSUER PURCHASES OF EQUITY SECURITIES
Our common stock is traded on the New York Stock Exchange (ticker symbol VMC). As of February 12, 2021, the number ofshareholders of record was 2,379.
ISSUER PURCHASES OF EQUITY SECURITIESPurchases of our equity securities during the quarter ended December 31, 2020 are summarized below.
Total Number Maximx umof Shares Number of
Total Purchased as Shares that MayNumber of Averagevv Part of Publicll ly YetYY Be Purchrr asedShares Pricerr Paid Announced Plansl Under the Planl s
Periodrr Purchased Per Share or Programrr s or Programrr s 1
2020Oct 1 - Oct 31 0 $ 0.00 0 8,064,851Nov 1 - Nov 30 0 $ 0.00 0 8,064,851Dec 1 - Dec 31 0 $ 0.00 0 8,064,851Total 0 $ 0.00 0
1 In February 2017, our Board of Direcrr tors authoriztt ed us to purchase up to 10,00 00,000 shares of our common stock.kk As ofDecember 31, 2020, there were 8,064,851 shares remainingii under thisii authorizaii tionii . Depending upon market,t busineii ss, legaland othett r conditii onii s, we may purcharr se shares fromrr timeii to timeii through the open market (includingii plans designeii d to complywithi Rule 10b5-1 of the Securitiett s Exchange Act of 1934)4 and/or// through privatvv elyl negotiattt ed transrr actions. The authorizaii tionhas no timeii limiii t, does not obligai te us to purchrr ase any specific number of shares, and may be suspended or discontinuedtt atany time.
We did not have any unregistered sales of equity securities during the fourth quarter of 2020.

Part II 32
ITEM 7MANAGEMENT'S DISCUSSION AND ANALYSIS OF FINANCIAL CONDITION AND RESULTS OF OPERATIONS
Management�� discussion and analysis is intended to help investors understand our operations and current businessenvironment. The following discussion should be read in conjunction with the consolidated financial statements and theaccompanying notes contained in this Annual Report. The following generally includes a comparison of our results ofoperations and liquidity and capital resources for 2020 and 2019. For the discussion of changes from 2018 to 2019 and���� ������ ��������� � ��� �� 46.5� ��� �� �� --� -��� 1� !��������� &��������� �� '� ���� �� (����� Condition and Results of Operations, of our Form 10-K for the year ended December 31, 2019 filed with the Securities andExchange Commission on February 26, 2020.
EXECUTIVE SUMMARYFINANCIAL SUMMARY FOR 2020 (compared to 2019)� Total revenues decreased $72.3 million, or 1.5%, to $4,856.8 million� Gross profit increased $25.6 million, or 2%, to $1,281.5 million� Aggregates segment sales decreased $46.0 million, or 1%, to $3,944.3 million� Aggregates segment freight-adjusted revenues decreased $6.5 million, or less than 1%, to $3,007.6 million
� Shipments decreased 3%, or 7.2 million tons, to 208.3 million tons� Freight-adjusted sales price increased 3.2%, or $0.45 per ton to $14.44� Segment gross profit increased $12.5 million, or 1%, to $1,159.2 million
� Asphalt, Concrete and Calcium segment gross profit increased $13.1 million, or 12%, to $122.3 million, collectively� Selling, administrative and general (SAG) expenses decreased 3% to $359.8 million and decreased 0.1 percentage points(10 basis points) as a percentage of total revenues
� Operating earnings increased $18.3 million, or 2%, to $895.7 million� Earnings from continuing operations before income taxes were $743.8 million compared to $757.7 million� Earnings from continuing operations were $588.0 million, or $4.41 per diluted share, compared to $622.5 million, or $4.67per diluted share� Discrete items in 2020 include:
� pretax charges of $6.9 million for divested operations� pretax charges of $7.3 million associated with non-routine business development� pretax charges of $10.2 million for COVID-19 pandemic direct incremental costs� pretax charges of $22.7 million for pension settlement� pretax charges of $1.3 million for restructuring
� Discrete items in 2019 include:� pretax gains of $13.4 million for the sale of businesses and property donation� pretax charges of $10.8 million for property donation� pretax charges of $3.0 million for divested operations� pretax charges of $1.7 million associated with non-routine business development� pretax charges of $6.5 million for restructuring
� Adjusted (for the discrete pretax items noted above) earnings from continuing operations were $4.68 per diluted share,compared to $4.70 per diluted share
� Net earnings were $584.5 million, a decrease of $33.2 million, or 5%� Adjusted EBITDA was $1,323.5 million, an increase of $53.5 million, or 4%� Returned capital to shareholders via dividends ($180.2 million versus $164.0 million) and share repurchases ($26.1million versus $2.6 million)

Part II 33
Our best-in-class aggregates business, along with the effoff rts and dedication of our employees, allowed us to overcomeCOVID-19 related disruptions in 2020. As we saw in 2020, demand for our products can be subject to market fluctuationsoutside of our control. We remain focused on the factors within our control, including our pricing and cost actions, both ofwhich contributed to further improvement in our industry-leading unit margins in 2020. Most impressive, we delivered year-over-year gains in aggregates unit profitability throughout each quarter in 2020. Our ability to leverage our four strategicdisciplines Commercial and Operational Excellence, Logistics Innovation and Strategic Sourcing enabled us to expandunit margins, deliver improved cash flows, and increase returns on invested capital. Our ����s hard work along with ourleading market positions and strong financial foundation will enable us to capitalize on an improving demand outlook in2021.
Our operating plans are underpinned by our aforementioned four strategic disciplines, a healthy balance sheet, strongliquidity, and the engagement of our people. 2020 revenues were $4,856.8 million, 1% lower than the prior year, while grossprofit margins expanded across each segment. Effeff ctive cost management throughout the organization and aggregatesprice growth helped drive margin expansion. Net earnings were $584.5 million and Adjusted EBITDA was a record $1,323.5million.
At year end, total debt to 2020 Adjusted EBITDA was 2.5 times or 1.6 times on a net debt basis reflecting $1,198.0 million ofcash on hand approximately $500.0 million will be used to pay offff certain debt maturities due in March 2021. Ourweighted-average debt maturity was 13 years, and the effeff ctive weighted-average interest rate was 4.1%.
Return on invested capital increased 0.4 percentage points (40 basis points) from the prior year to 14.3%. Operating cashflows were $1,070.4 million, up 9% versus the previous year. Solid operating earnings growth coupled with disciplinedcapital management led to these results.
CAPITAL ALLOCATIONOur balanced approach to capital allocation remains unchanged. Through economic cycles we intend to balancereinvestment in our business, growth through acquisitions, and return of capital to shareholders while maintaining financialstrength and flexibility evidenced by our strong balance sheet and investment-grade credit ratings. Our capital allocationpriorities are, as follows:
1. Operating Capital (maintain and grow the value of our franchise)
2. Growth Capital (including greenfields and acquisitions)
3. Dividend Growth (with a keen focus on sustainability)
4. Return Excess Cash to Shareholders (primarily via share repurchases)
Our first priority is to maintain and protect our valuable franchise by keeping our operations in good working order to ensurethe production of high quality materials and timely delivery of goods and services to our customers. This capital requirementexpands and contracts as production and shipment levels change. During 2020, we invested $239.3 million to replace orimprove existing property, plant & equipment.
Our second priority is to grow our franchise through internal growth projects and business acquisitions. Internal growthprojects have generally been among our highest returning projects. During 2020, we invested $122.9 million in internalgrowth projects to secure new aggregates reserves, develop new production and/or distribution sites, enhance ourdistribution capabilities and support the targeted growth of our asphalt and concrete operations. During the fourth quarter of2020, we restarted planned growth projects that were put on hold in March 2020 as a result of the pandemic. For businessacquisitions, we tend to look for bolt-on acquisitions which are easy to integrate and will pursue large business combinationsthat are the right fit and the right price. We use strategic and returns-based criteria to price potential acquisitions and aredisciplined in our approach. We look at a lot of potential acquisitions and only make offeff rs on a few. We closed two businessacquisitions during 2020 for total consideration of $73.4 million.
Our third priority is growing the dividend with a keen focus on sustainability through the economic cycle. During 2020, wepaid a dividend per share of $1.36 and paid total dividends of $180.2 million.

Part II 34
And finally, if there is excess cash afteff r fulfilling the prior capital allocation priorities, we will consider returning cash toshareholders via share repurchases. During 2020, we returned $26.1 million to our shareholders through share repurchases.
For a detailed discus���� �� �� �%��������� �� ��+��������� ��� 3��� .7 �'�%��������� �� &�+��������� �� -��� 5�(����� ��������� �� ���� ������ &���
MARKET DEVELOPMENTS AND OUTLOOKConstruction employment gains in key markets are a positive signal that activity levels are recovering across our footprint,as compelling fundamentals in residential construction support growing demand in 2021. Shipments into privatenonresidential continue to benefit from growth in heavy industrial projects such as data centers and warehouses, whileconstruction starts in other categories remain below the prior year. Recent improvements in highway lettings and contractawards indicate growing confidence and visibility fueling advancement of planned projects, particularly in the second half of2021.
The pricing environment remains positive and we continue to execute at a high level positioning us well for 2021. We areencouraged by the continued strength in residential construction activity, particularly single-family housing. Our expectationis also supported by the recent improvement in highway awards and construction employment trends in key markets. Datacenters, distribution centers, and warehouses, which now comprise the largest share of new private nonresidential projectawards, will continue to underpin demand in this end market. We believe these leading indicators, along with sustaining apositive pricing environment, can be a catalyst for further recovery in construction activity during 2021.
Management expectations for 2021 include:
� Aggregates shipments down 2% to up 2% versus 2020
� Aggregates freight-adjusted price increase of 2% to 4% from 2020
� Collective Asphalt, Concrete and Calcium segment gross profit up mid-to high single digits
� SAG expenses of $365 million to $375 million
� Interest expense of approximately $130 million
� Depreciation, depletion, accretion and amortization expense of approximately $400 million
� An effeff ctive tax rate of approximately 21%
� Earnings from continuing operations of $4.80 to $5.40 per diluted share
� Net earnings of $640 million to $720 million
� Adjusted EBITDA of $1.340 billion to $1.440 billion
� No majoa r changes in COVID shelter-in-place restrictions
Additionally, we expect to spend between $450 million and $475 million on capital expenditures, including growth projects.We will continue to review our plans and will adjust as needed, while being thoughtful about preserving liquidity.
For support functions, we previously implemented remote work arrangements and restricted business travel effeff ctive mid-March 2020. To date, these arrangements have not materially affeff cted our ability to maintain our business operations,including the operation of financial reporting systems, internal control over financial reporting, and disclosure controls andprocedures.

Part II 35
COMPETITIVE ADVANTAGES
AGGREGATES FOOTPRINTOver time, we have strategically and systematically built one of the most valuable aggregates franchises in the U.S., with afootprint that is impossible to replicate. Zoning and permitting regulations have made it increasingly difficult to expandexisting quarries or to develop new quarries. Such regulations, while curtailing expansion, also increase the value of ourreserves that were zoned and permitted decades ago.
Demand for aggregates correlates positively with changes in population growth, household formation and employment. Wehave a coast-to-coast footprint that serves 19 of the top 25 highest-growth metropolitan statistical areas (MSAs) and stateswhere 73% of U.S. population growth from 2020 to 2030 is projected to occur. As state and federal spending increases,Vulcan is poised to benefit greatly from growing private and public demand for aggregates, thereby delivering significantlong-term value for our shareholders.
Source: Woodsdd & Poole CEDDS 2020Based on people added fromrr 2020 to 2030

Part II 36
COMPOUNDING IMPROVEMENT IN PROFITABILITYWe have continued to deliver strong financial perfor rmance over time and through business cycles. Through our aggregates-led strategy and focus on our four strategic disciplines operational excellence, strategic sourcing, commercial excellence�� �������� ����+���� �� ��� ���� �� -��� . �B�������� ���� ��� �B������� ������� ������> we have created one ofthe most profitable public companies in our industry as measured by aggregates gross profit per ton.
We are currently operating considerably below full capacity making us extremely well positioned to further benefit fromeconomies of scale as markets recover from the COVID-19 pandemic.
SAFETY, HEALTH AND ENVIRONMENTAL PERFORMANCEA strategy for sustainable, long-term value creation must include doing right by your employees, your neighbors and theenvironment in which you operate. Over our more than six decades as a public company, we have built a strong, resilientand vital business on this foundation of doing things the right way.
We are a leader in our industry in safety, health and environmental performance, with a safety record substantially betterthan the industry average. We apply the shared experiences, expertise and resources at each of our locally led sites, with anemphasis on taking care of one another. The result is a record of safety excellence consistently outperforming the industry.
Sourcerr : Mine Safety and Health Administration (MSHA) recordsrr and Internarr l Vulcan Data.
* The aggregates industii rytt MSHA injury ratrr e for 2020 was not availvv able as of the filiii ngii of this report.
We focus on our environmental stewardship programs with the same intensity that we bring to our health and safetyinitiatives resulting in 98.6% citation-free inspections out of all 2020 federal and state environmental inspections.

Part II 37
We lead community relations programs that serve our neighbors while ensuring that we grow and thrive in the communitieswhere we operate. During 2020, we operated 37 certified wildlife habitat sites, the fourth largest number of sites in thenation, as certified by the Wildlife Habitat Council. We provided over 160 scholarships to students nationwide andemphasized COVID-19 support as well as diversity and inclusion in our community outreach and contributions.
We recognize that the aggregates mining in which we engage is an interim use of the approximately 240,000 acres of landin our portfolio. Our land and water assets will be converted to other valuable uses at the end of mining. Effeff ctivemanagement throughout the life cycle of our land from pre-mining utilization as agriculture and timber development, topost-mining development as water reservoirs or residential and commercial development not only generates significantadditional value for our shareholders but greatly benefits the communities in which we operate.
CUSTOMER SERVICEMore than an aggregates supplier, we are a business dedicated to customer service and finding creative solutions to meet�� ��������� ������ B���� + ��� ���� �� ������ ���� �� ���� ��� �� � ��+����� ��� ���� ������� ���� ���right specifications, that is the right quality, delivered the right way on time and safely. Our One-Vulcan, Locallyll Ledapproach, in which our employees work together to leverage the size and strengths of Vulcan as a whole, while running theiroperations with a strong entrepreneurial spirit and sense of ownership, allows us to deliver market-leading services to ourcustomers.
Transportation costs are passed along to our customers, and because aggregates have a very high weight-to-value ratio,those costs can add up quickly when transporting aggregates long distances. Having the most extensive distribution networkof any aggregates producer sets us apart. Combining our trucking, rail, barge and ocean vessel shipping logisticscapabilities allows us to provide better customer solutions and create a seamless customer experience at a competitiveprice.
As an approxrr imxx ation, a truckrr has a capacity of 20-25 tons of aggregrr ates; a railcar has a capacity of 4-5 trucklrr oads; a bargerr has a capacity of 65truckloads and our ocean vessels have the capacityt of 2,500 truckrr lokk ads.dd

Part II 38
STRONG FINANCIAL FOUNDATIONOur financial position is strong as evidenced by our investment-grade credit ratings (Fitch BBB-/!������ Baa2/Standard &����� BBB+). At December 31, 2020, our available liquidity was $2,141.0 million, including $1,198.0 million of cash onhand, substantially higher than our liquidity needs. Our leverage ratio, as measured by total debt to Adjusted EBITDA, hasimproved from 6.5x at December 31, 2012 to 2.5x at December 31, 2020 (and our net debt to Adjusted EBITDA atDecember 31, 2020 is 1.6x), within our stated leverage target of 2.0 to 2.5x. Over that same period, we also improved thestructure of our debt (average maturity from 7 years to 13 years) and reduced the cost of the debt (weighted averageinterest rate from 7.55% to 4.10%).

Part II 39
RESULTS OF OPERATIONSTotal revenues are primarily derived from our product sales of aggregates, asphalt mix and ready-mixed concrete, andinclude freight & delivery costs that we pass along to our customers to deliver these products. We also generate servicerevenues from our asphalt construction paving business and services related to our aggregates business. We presentseparately our discontinued operations, which consists of our former Chemicals business.
The following table highlights significant components of our consolidated operating results including EBITDA and AdjustedEBITDA.
CONSOLIDATED OPERATING RESULTS HIGHLIGHTS
For the years ended December 31 2020 2019 2018in millii ioll ns, except uniti and per sharerr data
Total revenues $ 4,856.8 $ 4,929.1 $ 4,382.9Cost of revenues 3,575.3 3,673.2 3,282.0Gross profit $ 1,281.5 $ 1,255.9 $ 1,100.9Grossrr prorr fit margin 26.4% 25.5% 25.1%
Selling, administrative and general expenses (SAG) $ 359.8 $ 370.5 $ 333.4SAG as a percentage of total revenues 7.4% 7.5% 7.6%
Operating earnings $ 895.7 $ 877.5 $ 747.7Interest expense $ 136.0 $ 130.2 $ 138.0Earnings from continuing operationsbefore income taxes $ 743.8 $ 757.7 $ 623.3Income tax expense $ 155.8 $ 135.2 $ 105.4Effecff tivevv tax rate fromrr continuing operatiorr ns 20.9% 17.8% 16.9%
Earnings from continuing operations $ 588.0 $ 622.5 $ 517.8Loss on discontinued operations, net of income taxes (3.5) (4.8) (2.0)Net earnings $ 584.5 $ 617.7 $ 515.8
Diluted earnings (loss) per shareContinuing operations $ 4.41 $ 4.67 $ 3.87Discontinued operations (0.02) (0.04) (0.02)
Diluted net earnings per share $ 4.39 $ 4.63 $ 3.85EBITDA 1 $ 1,275.0 $ 1,261.3 $ 1,107.0Adjusted EBITDA 1 $ 1,323.5 $ 1,270.0 $ 1,131.7Average Sales Price and Unit ShipmentsAggregatesTons (thousands) 208,295 215,465 201,375Freight-adjusted sales price $ 14.44 $ 13.99 $ 13.25Asphalt MixTons (thousands) 11,835 12,665 11,318Average sales price $ 57.97 $ 57.79 $ 55.13Ready-mixed concreteCubic yards (thousands) 2,951 3,104 3,223Average sales price $ 128.93 $ 126.38 $ 123.35CalciumTons (thousands) 282 294 285Average sales price $ 27.32 $ 27.85 $ 28.44
1 Non-GAAP measures are definedff and reconciled withitt nii this Item 7 under the captiott n Reconciliatll iontt of Non-GAAP Finaii ncialMeasures.

Part II 40
Net earnings for 2020 were $584.5 million ($4.39 per diluted share) compared to $617.7 million ($4.63 per diluted share) in2019 and $515.8 million ($3.85 per diluted share) in 2018. Each year's results were impacted by discrete items, as follows:
Net earnings for 2020 include:
� pretax charges of $6.9 million associated with divested operations� pretax charges of $7.3 million associated with non-routine business development� pretax charges of $10.2 million for COVID-19 pandemic direct incremental costs� pretax charges of $22.7 million for pension settlement (s�� 3��� .6 �B������ � ��� �� -��� 5 �(����� ��������� ��Supplementary Da��>
� pretax charges of $1.3 million for restructuring
Net earnings for 2019 include:
� pretax gains of $13.4 million related to the sale of businesses and property donation� pretax charges of $10.8 million for property donation� pretax charges of $3.0 million associated with divested operations� pretax charges of $1.7 million associated with non-routine business development� pretax charges of $6.5 million for restructuring
Adjusted for these discrete items, earnings from continuing operations (Adjusted Diluted EPS) was $4.68 per diluted sharefor 2020 compared to $4.70 per diluted share for 2019. In comparison, the 2019 Adjusted Diluted EPS benefited from alower tax rate due to certain tax benefits and credits that were higher than in 2020. The effeff ct of the resulting higher tax ratein 2020 was $0.18 per diluted share.
EARNINGS FROM CONTINUING OPERATIONS BEFORE INCOME TAXESYear-over-year changes in earnings from continuing operations before income taxes are summarized below:
in millii ionsll2018 $ 623.3 2019 $ 757.7
Higher aggregates gross profit 154.8 12.5Higher asphalt gross profit 6.5 12.2Higher (lower) concrete gross profit (6.7) 1.0Higher (lower) calcium gross profit 0.4 (0.2)Lower (higher) selling, administrative and general expenses (37.2) 10.8Higher (lower) gain on sale of property, plant & equipment and businesses 8.8 (19.8)Lower (higher) interest expense 7.8 (5.8)Pension settlement charge 0.0 (22.7)All other 0.0 (1.9)
2019 $ 757.7 2020 $ 743.8

Part II 41
OPERATING RESULTS BY SEGMENTWe present our results of operations by segment at the gross profit level. We have four operating (and reportable) segmentsorganized around our principal product lines: (1) Aggregates, (2) Asphalt, (3) Concrete and (4) Calcium. Managementreviews earnings for our reporting segments principally at the gross profit level.
1. AGGREGATESOur year-over-year aggregates shipments:
� decreased 3% in 2020
� increased 7% in 2019
� increased 10% in 2018 1
1 Of the 10% increasrr e in 2018 shipments, 3% was attriburr table to the fourthtt quarterr r 2017 acquisitiontt of Aggregates USA.SS
Aggregates shipments declined 3% (3% same-store) primarily as a result of COVID-19 disruptions with wide variances inthe amount of disruption across our markets. However, previously-noted recent improvements in highway lettings andcontract awards indicate growing confidence and visibility which should fuel the advancement of planned projects,particularly in the second half of 2021. We intend to capitalize on this improving demand outlook in 2021 utilizing teamwork,our leading market positions and strong financial position.
Our year-over-year freight-adjusted selling price1 for aggregates:
� increased 3.2% in 2020
� increased 5.6% in 2019
� increased 1.5% in 2018
1 We routinelyii arrange the delivll eryrr of our aggregates to the customer. Additii onally,l we incur freigrr ht costs to move aggregatesfromrr the productiontt site to remote distribrr utiott n sites. These costs arerr passed on to our customers in the aggregates pricrr e. Weremove these pass-thrott ugh freighrr t & delivery revenues (and any othett r aggregates-derivedvv revenues, such as landfildd lll tippingiifees)s fromrr the freirr ghtii -adjdd usted sellinll g price for aggregates. See the Reconciliatll iontt of Non-GAAGG P Financii ial Measures withi in thisItem 7 for a reconciliall tionii of freightrr -adjusted revenues.

Part II 42
Despite the 3% decline in shipments, aggregates freight-adjusted pricing increased 3.2%, or $0.45 per ton, with a positivepricing environment across our footprint. On a mix-adjusted basis, pricing increased 3.1% and all of our markets reportedprice growth.
AGGREGATES SEGMENT SALES ANDFREIGHT-ADJUSTED REVENUES
AGGREGATES GROSS PROFIT ANDCASH GROSS PROFIT
in millionsii in milliii ons
AGGREGATES UNIT SHIPMENTS AGGREGATES SELLING PRICE ANDCASH GROSS PROFIT PER TON
tons, in millii ioll ns Freight-adjusted averagevv sales pricrr e per ton 1
1 Freirr ghtii -adjusted sales pricrr e is calculated as freirr ghtii -adjusted revenues dividedii by
aggregates unitii shipii ments
Freight-adjusted unit cost of sales increased 2% (1% on a cash basis). Flexible operating plans, disciplined cost control andlower diesel fuel costs mitigated the impact of operational disruptions caused by the COVID-19 pandemic. The Aggregatessegment earnings impact from lower diesel fuel cost was $34.0 million.
Aggregates segment gross profit increased $12.5 million, or 1%, to $1,159.2 million due to growth in pricing and effeff ctiveprice control and despite the 3% decline in shipments. Unit profitability (as measured by gross profit per ton) grew by 5% to$5.57 per ton. Our focus on compounding unit margins allowed us to deliver year-over-year gains in aggregates unitprofitability throughout each quarter of 2020.

Part II 43
2. ASPHALTOur year-over-year asphalt mix shipments:
� decreased 7% in 2020
� increased 12% in 2019
� increased 4% in 2018 1
1 The 4% increase in asphaltl mix shipments in 2018 was attritt butii able to firsii t and second quarter 2018 acquisitionsii of asphalts mixoperationsii and constructrr iontt pavingii businesses in Alabama and Texasx , coupled withtt the fourthtt quarter 2017 swaw p of ourconcrete operatrr ionstt for asphas lt operatrr ionstt in Arizrr ona. Same-store declinll ed 2%.
Asphalt segment gross profit of $75.2 million was $12.2 million or 19% higher than 2019. Asphalt mix shipments decreased7% while material margins (sales price less unit cost of raw materials) increased 13%, or $2.30 per ton. Segment earningsbenefited from price discipline and effeff ctive cost containment, including lower liquid asphalt costs. The average unit cost forliquid asphalt was 15% lower than 2019, positively affeff cting costs by $37.2 million.
ASPHALT SEGMENT SALES ASPHALT GROSS PROFIT ANDCASH GROSS PROFIT
in millionsii in millionsii

Part II 44
3. CONCRETEOur year-over-year ready-mixed concrete shipments:
� decreased 5% in 2020
� decreased 4% in 2019
� decreased 10% in 2018 1
1 The 10% decrease in ready-d mixeii d concrete shipments in 2018 was attributrr able to the March 2018 dispositiontt of ready-d mixeii dconcrete faciliii ties in Georgia, and the fourthtt quarter 2017 swapw of our concrete operationtt s for asphals t operationstt in Arizrr ona.
Concrete segment gross profit was $44.2 million, up 2% from 2019 despite a 5% decline in shipments (-9% same-store).Improved material margins per cubic yard of 3% (2% same-store) and unit profitability (as measured by gross profit percubic yard) of 8% (10% same-store) offsff et the shipment decline. Shipments for the year were negatively impacted by bothwildfires and cement supply shortages in Northern California resulting from pandemic disruptions.
CONCRETE SEGMENT SALES CONCRETE GROSS PROFIT ANDCASH GROSS PROFIT
in millionsii in milliii ons
4. CALCIUMCalcium segment gross profit decreased 5% from 2019 to $2.9 million.
CALCIUM SEGMENT SALES CALCIUM GROSS PROFIT ANDCASH GROSS PROFIT
in millionsii in millionsii
In total, the 2020 gross profit contribution from our three non-aggregates (Asphalt, Concrete and Calcium) segments was$122.3 million, a $13.1 million or 12% increase from 2019. Each segment reported unit margin expansion on lower segmentsales.

Part II 45
SELLING, ADMINISTRATIVE AND GENERAL (SAG) EXPENSESmillii ionsll
As a percentage of total revenues, SAG expense was:
� 7.4% in 2020 decreased 0.10 percentage points (10 basis points)
� 7.5% in 2019 decreased 0.10 percentage points (10 basis points)
� 7.6% in 2018 decreased 0.75 percentage points (75 basis points)
Our comparative total company employment levels at year end:
� decreased 2% in 2020
� increased 6% in 2019
� increased 6% in 2018
Prior increases in our employment levels were partially driven by our acquisitions (s�� 3��� .7 �'�%��������� ��&�+��������� �� -��� 5 �(����� ��������� �� ���� ������ &��>� As noted above, 2020 SAG expenses were $359.8million or 7.4% as a percentage of total revenues, down from 7.5% in 2019. We remain focused on further leveraging ouroverhead cost structure.
GAIN ON SALE OF PROPERTY, PLANT & EQUIPMENT AND BUSINESSESin millii ionsll
The 2020 gain on sale of property, plant & equipment and businesses of $4.0 million includes a net immaterial pretax lossfrom ready-mix concrete divestitures. The 2019 gain on sale of property, plant & equipment and businesses of $23.8 millionincludes: (1) $4.1 million of pretax gain from the sale of two aggregates operations in Georgia, (2) the reversal of acontingent payable related to the 2017 Department of Justice required divestiture of former Aggregates USA operations and(3) $9.3 million of pretax gain related to property donations. S�� 3��� .7 �'�%��������� �� &�+��������� �� -��� 5 �(����� ��������� �� ���� ������ &���

Part II 46
OTHER OPERATING EXPENSE, NETOther operating expense, which has an approximate run-rate of $12.0 million a year (exclusive of discrete items), iscomposed primarily of idle facilities expense, environmental remediation costs, property abandonments and gain (loss) onsettlement of AROs. Total other operating expense and significant discrete items included in the total were:
� $30.0 million in 2020 includes discrete items as follows:
� $6.9 million of charges associated with divested operations, composed entirely of environmental liability accrualsassociated with previously divested properties
� $10.2 million of charges related to COVID-19 pandemic direct incremental costs
� $1.3 million of managerial restructuring charges
� $31.6 million in 2019 includes discrete items as follows:
� $10.8 million of charges related to property donations
� $3.0 million of charges associated with divested operations, composed entirely of environmental liability accrualsassociated with previously divested properties
� $6.5 million of managerial restructuring charges
OTHER NONOPERATING INCOME (EXPENSE), NETOther nonoperating income (expense) (2020 $(17.5) million, 2019 $9.2 million and 2018 $13.0 million) is composedprimarily of pension and postretirement benefit costs (excluding service costs), foreign currency transaction gains/losses,Rabbi Trust gains/losses and net earnings/losses of nonconsolidated equity method investments. Additionally, during 2020,we incurred a $22.7 million non-cash pension settlement charge this partial settlement will benefit future expense andfunding requirements ���� 3��� .6 �B������ � ��� �� -��� 5 �(����� ��������� �� ���� ������ &��>�
INTEREST EXPENSEin milliii ons
Interest expense was $136.0 million in 2020 compared to $130.2 million in 2019 and $138.0 million in 2018. See Note 6�&���� �� -��� 5 �(����� ��������� �� ���� ������ &�� �� ������� �����������

Part II 47
INCOME TAXESOur income tax expense from continuing operations for the years ended December 31 is shown below:
dollars in millii ioll ns 2020 2019 2018
Earnings from continuing operationsbefore income taxes $ 743.8 $ 757.7 $ 623.3Income tax expense $ 155.8 $ 135.2 $ 105.4Effecff tive tax rate 20.9% 17.8% 16.9%
The $20.6 million increase in our 2020 income tax expense was primarily related to a decrease in excess tax benefits fromshare-based compensation and a smaller research & development tax credit. The $29.8 million increase in our 2019 incometax expense was primarily related to an increase in earnings.
In response to the COVID-19 pandemic, the Coronavirus Aid, Relief, and Economic Security Act (CARES Act) was signedinto law in March 2020. The CARES Act provides numerous tax relief provisions and stimulus measures. A temporaryfavorable change to the prior year and current year limitations on interest deductions and a temporary suspension of certainpayment requirements for the employer portion of Social Security taxes are the relief provisions that are expected to provideus the greatest benefit. In the first quarter of 2020, an expected cash tax benefit of $13.3 million was recorded to account forrthe favorable change to the prior year limitation on interest deductions.
��� 3��� 7 �-����� =���� �� -��� 5 �(����� ��������� �� ���� ������ &���
DISCONTINUED OPERATIONSPretax earnings (loss) from discontinued operations were:
� $(4.7) million in 2020
� $(6.5) million in 2019
� $(2.7) million in 2018
Pretax earnings (loss) from discontinued operations for 2020, 2019 and 2018, resulted primarily from general and productliability costs, including legal defense costs and environmental remediation costs associated with our former Chemicalsbusiness. For additional information about discontinued operations� ��� 3��� . ������ �� ���������� '��������� �� �������� -��� 5 �(����� ��������� �� ���� ������ &�� ���� ��� ������ &����������� Operations.

Part II 48
RECONCILIATION OF NON-GAAP FINANCIAL MEASURES
SAME-STOREWe have provided certain information on a same-store basis. When discussing our financial results in comparison to priorperiods, we may exclude the operating results of recently acquired/divested businesses that do not have comparable results�� ��� ������ ����� ���������� =���� ����� � �%����E��+����� ���������� � ���� ���� �� 3��� .7 �'�%��������� ��&�+��������� �� -��� 5 �(����� ��������� �� ���� ������ &��� =��� ��roach allows us to evaluate theperfor rmance of our operations on a comparable basis. We believe that measuring performance on a same-store basis isuseful to investors because it enables evaluation of how our operations are perfor rming period over period without the effeff ctsof acquisition and divestiture activity. Our same-store information may not be comparable to similar measures used by othercompanies.
AGGREGATES SEGMENT FREIGHT-ADJUSTED REVENUESAggregates segment freight-adjusted revenues is not a Generally Accepted Accounting Principle (GAAP) measure. Wepresent this measure as it is consistent with the basis by which we review our operating results. We believe that thispresentation is consistent with our competitors and meaningful to our investors as it excludes revenues associated withfreight & delivery, which are pass-through activities. It also excludes immaterial other revenues related to services, such aslandfill tipping fees, that are derived from our aggregates business. Additionally, we use this metric as the basis forcalculating the average sales price of our aggregates products. Reconciliation of this metric to its nearest GAAP measure ispresented below:
in millii ioll ns, except per ton data 2020 2019 2018
Aggregates segmentSegment sales $ 3,944.3 $ 3,990.3 $ 3,513.6LessFreight & delivery revenues 1 877.0 921.1 796.9Other revenues 59.7 55.0 49.4Freight-adjusted revenues $ 3,007.6 $ 3,014.2 $ 2,667.3Unit shipments - tons 208.3 215.5 201.4Freight-adjusted sales price $ 14.44 $ 13.99 $ 13.25
1 At the segment level,vv freighrr t & delivll eryvv revenuesvv include intersegment freirr ghii t & delivll eryvv (wh(( ich are elimiii natii ed at theconsolidatd ed level) and freigrr ht to remote distriburr tioni sitei s.

Part II 49
AGGREGATES SEGMENT INCREMENTAL GROSS PROFITAggregates segment incremental gross profit flow-through rate is not a GAAP measure and represents the year-over-yearchange in gross profit divided by the year-over-year change in segment sales excluding freight & delivery (revenues andcosts). We present this metric as it is consistent with the basis by which we review our operating results. We believe that thispresentation is consistent with our competitors and meaningful to our investors as it excludes revenues associated withfreight & delivery, which are pass-through activities. Reconciliation of this metric to its nearest GAAPAA measure is presentedbelow:
MARGIN IN ACCORDANCE WITH GAAPdollall rs in millii ioll ns 2020 2019 2018
Aggregates segmentGross profit $ 1,159.2 $ 1,146.6 $ 991.9Segment sales $ 3,944.3 $ 3,990.3 $ 3,513.6Gross profit margin 29.4% 28.7% 28.2%Incremental gross profit margin 1 N/A 32.5%
FLOW-THROUGH RATE (NON-GAAP)dollars in millii ioll ns 2020 2019
Aggregates segmentGross profit $ 1,159.2 $ 1,146.6Less: Contribution from acquisitions (same-store) 0.8 0.2Same-store gross profit $ 1,158.4 $ 1,146.4Segment sales $ 3,944.3 $ 3,990.3Less: Freight & delivery revenues 2 877.0 921.1Segment sales excluding freight & delivery $ 3,067.3 $ 3,069.2Less: Contribution from acquisitions (same-store) 2.6 1.0Same-store segment sales excluding freight & delivery $ 3,064.7 $ 3,068.2Gross profit margin excluding freight & delivery 37.8% 37.4%Same-store gross profit margin excluding freight & delivery 37.8% 37.4%Incremental gross profit flow-through rate 1 N/ASame-store incremental gross profit flow-through rate 1 N/A
1 Not applicaii ble due to the decrearr se in segment sales.2 At the segment levelvv ,l freirr ghii t & delivll eryvv revenvv ues include intersegment freighrr t & delivery (whiww ch arerr elimll inated at theconsolidatd ed level) and freigrr ht to remote distriburr tioni sitei s.

Part II 50
CASH GROSS PROFITC''� ���� ��� ������ ���� ���� ������� �� �� ���� � ��� �� ��������� � � �����+� �� ������ ������ ������� ��GAAP. We and the investment community use this metric to assess the operating perfor rmance of our business. Additionally,we present this metric as we believe that it closely correlates to long-term shareholder value. We do not use this metric as ameasure to allocate resources. Cash gross profit adds back noncash charges for depreciation, depletion, accretion andamortization to gross profit. Aggregates segment cash gross profit per ton is computed by dividing Aggregates segmentcash gross profit by tons shipped. Reconciliation of this metric to its nearest GAAP measure is presented below:
in millii ioll ns, except per ton data 2020 2019 2018
Aggregates segmentGross profit $ 1,159.2 $ 1,146.6 $ 991.9Depreciation, depletion, accretion and amortization 321.1 305.1 281.6Aggregates segment cash gross profit $ 1,480.3 $ 1,451.7 $ 1,273.5Unit shipments - tons 208.3 215.5 201.4Aggregates segment gross profit per ton $ 5.57 $ 5.32 $ 4.93Aggregates segment cash gross profit per ton $ 7.11 $ 6.74 $ 6.32Asphalt segmentGross profit $ 75.2 $ 63.0 $ 56.5Depreciation, depletion, accretion and amortization 35.0 35.2 31.3Asphalt segment cash gross profit $ 110.2 $ 98.2 $ 87.8Concrete segmentGross profit $ 44.2 $ 43.2 $ 49.9Depreciation, depletion, accretion and amortization 16.0 13.6 12.5Concrete segment cash gross profit $ 60.2 $ 56.8 $ 62.4Calcium segmentGross profit $ 2.9 $ 3.1 $ 2.7Depreciation, depletion, accretion and amortization 0.2 0.2 0.3
Calcium segment cash gross profit $ 3.1 $ 3.3 $ 3.0
NET DEBT TO ADJUSTED EBITDANet debt to Adjusted EBITDA is not a GAAP measure and should not be considered as an alternative to metrics defined byGAAP. We, the investment community and credit rating agencies use this metric to assess our leverage. Net debt subtractscash and cash equivalents and restricted cash from total debt. Reconciliation of this metric to its nearest GAAP measure ispresented below:
in milliii onsi 2020 2019
DebtCurrent maturities of long-term debt $ 515.4 $ 0.0Long-term debt 2,772.3 2,784.3
Total debt $ 3,287.7 $ 2,784.3Less: Cash and cash equivalents and restricted cash 1,198.0 274.5
Net debt $ 2,089.7 $ 2,509.8
Adjusted EBITDA $ 1,323.5 $ 1,270.0
Total debt to Adjusted EBITDA 2.5x 2.2x
Net debt to Adjusted EBITDA 1.6x 2.0x

Part II 51
EBITDA AND ADJUSTED EBITDAC''� ���� ��� ������ �$����� B���� -������� =���� &��������� �� '����<����� �$B-=&'>� �� �� ���� � ��� ��considered as an alternative to earnings measures defined by GAAP. We use this metric to assess the operatingperfor rmance of our business and as a basis for strategic planning and forecasting as we believe that it closely correlates tolong-term shareholder value. We do not use this metric as a measure to allocate resources. We adjust EBITDA for certainitems to provide a more consistent comparison of earnings perfor rmance from period to period. Reconciliation of this metricto its nearest GAAP measure is presented below (numbers may not foot due to rounding):
in millii ionsll 2020 2019 2018
Net earnings $ 584.5 $ 617.7 $ 515.8Income tax expense 155.8 135.2 105.4Interest expense, net of interest income 134.4 129.0 137.6Loss on discontinued operations, net of tax 3.5 4.8 2.0EBIT 878.2 886.7 760.8Depreciation, depletion, accretion and amortization 396.8 374.6 346.2EBITDA $ 1,275.0 $ 1,261.3 $ 1,107.0
Gain on sale of businesses 1 $ 0.0 $ (13.4) $ (2.9)Property donation 0.0 10.8 0.0Business interruption claims recovery 0.0 0.0 (2.3)Charges associated with divested operations 6.9 3.0 18.5Business development 2 7.3 1.7 5.2COVID-19 direct incremental costs 10.2 0.0 0.0Pension settlement charge 22.7 0.0 0.0Restructuring charges 1.3 6.5 6.2Adjusted EBITDA $ 1,323.5 $ 1,270.0 $ 1,131.7Depreciation, depletion, accretion and amortization 396.8 374.6 346.2Adjusted EBIT $ 926.7 $ 895.4 $ 785.5
1 Includes $9.2 millii ioll n of gains associati ed witww htt propertyrr donations in 2019. The net effecff t of the 2019 properto yt donation was aloss of $1.6 millii ioll n.
2 Represents non-rourr tineii charges or gains associati ed withi acquisitiontt s includingii the cost impact of purchasrr e accountinginventvv ory valuationtt s.
ADJUSTED DILUTED EPS FROM CONTINUING OPERATIONSSimilar to our presentation of Adjusted EBITDA, we present Adjusted diluted earnings per share (EPS) from continuingoperations to provide a more consistent comparison of earnings performance from period to period. This metric is notdefined by GAAP and should not be considered as an alternative to earnings measures defined by GAAP. Reconciliation ofthis metric to its nearest GAAP measure is presented below:
2020 2019 2018
Diluted Earnings Per ShareNet earnings $ 4.39 $ 4.63 $ 3.85Less: Discontinued operations loss (0.02) (0.04) (0.02)Diluted EPS from continuing operations $ 4.41 $ 4.67 $ 3.87
Items included in Adjusted EBITDA above 0.27 0.03 0.14Debt refinancing costs 0.00 0.00 0.04Adjusted diluted EPS - continuing operations $ 4.68 $ 4.70 $ 4.05

Part II 52
2021 PROJECTED EBITDAThe following reconciliation to the mid-point of the range of 2021 Projected EBITDA excludes adjustments (as noted inAAdjusted EBITDA above) as they are difficult to forecast (timing or amount). Due to the difficulty of forecasting suchadjustments, we are unable to estimate their significance. This metric is not defined by GAAP and should not be consideredas an alternative to earnings measures defined by GAAP. Reconciliation of this metric to its nearest GAAP measure ispresented below:
2021 Projrr ected 1
in millii ionsll Mid-pointii
Net earnings $ 680Income tax expense 180Interest expense, net of interest income 130Discontinued operations, net of tax 0Depreciation, depletion, accretion and amortization 400Projected EBITDA $ 1,390
1 See the Market Developments and Outloott k sectiontt (earlier withi in this Item 7) for the assumptions used to build this projection.
RETURN ON INVESTED CAPITALWe define �Return on Invested Capital� (ROIC) as Adjusted EBITDA for the trailing-twelve months divided by averageinvested capital (as illustrated below) during the trailing 5-quarters. Our calculation of ROIC is considered a non-GAAPfinancial measure because we calculate ROIC using the non-GAAP metric EBITDA. We believe that our ROIC metric ismeaningful because it helps investors assess how effeff ctively we are deploying our assets. Although ROIC is a standardfinanci ������ ������� ������� ����� �� � �� ���� �������� �2-#� '� ��� �� ��� ������ �� ��� �� � �� �� ��ROIC may differ from the methods used by other companies. This metric is not defined by GAAP and should not beconsidered as an alternative to earnings measures defined by GAAP. Reconciliation of this metric to its nearest GAAPmeasure is presented below:
dollars in millii ioll ns 2020 2019 2018
Adjusted EDITDA $ 1,323.5 $ 1,270.0 $ 1,131.7
Average invested capital 1Property, plant & equipment $ 4,374.0 $ 4,281.3 $ 4,095.4Goodwill 3,170.1 3,165.7 3,150.3Other intangible assets 1,104.0 1,084.1 1,095.2Fixed and intangible assets $ 8,648.1 $ 8,531.1 $ 8,340.9
Current assets $ 1,845.7 $ 1,224.3 $ 1,125.9Less: Cash and cash equivalents 698.9 93.5 68.3Less: Current tax 18.5 12.6 0.0Adjusted current assets 1,128.3 1,118.2 1,057.6
Current liabilities 833.6 599.3 626.2Less: Current maturities of long-term debt 305.0 0.0 8.3Less: Short-term debt 0.0 89.7 178.6Adjusted current liabilities 528.6 509.6 439.3
Adjusted net working capital $ 599.7 $ 608.6 $ 618.3
Average invested capital $ 9,247.8 $ 9,139.7 $ 8,959.2
Return on invested capital 14.3% 13.9% 12.6%
1 Average invested capital is based on a trailrr ingll 5-quarterr rs.

Part II 53
LIQUIDITY AND FINANCIAL RESOURCESOur primary sources of liquidity are cash provided by our operating activities and a substantial, committed bank line of credit.Additional sources of capital include access to the capital markets, the sale of surplus real estate, and dispositions ofnonstrategic operating assets. We believe these financial resources are sufficient to fund our business requirements for2021, including:
� contractual obligations
� capital expenditures
� debt service obligations
� dividend payments
� potential acquisitions
� potential share repurchases
Our balanced approach to capital deployment remains unchanged. We intend to balance reinvestment in our business,growth through acquisitions and return of capital to shareholders, while sustaining financial strength and flexibility.
We actively manage our capital structure and resources in order to balance the cost of capital and the risk of financial stress.We seek to meet these objectives by adhering to the following principles:
� maintain substantial bank line of credit borrowing capacity
� proactively manage our debt maturity schedule such that repayment/refinancing risk in any single year is low
� maintain an appropriate balance of fixed-rate and floating-rate debt
� minimize financial and other covenants that limit our operating and financial flexibility
In an effoff rt to strengthen our liquidity position while navigating the COVID-19 pandemic, we took a number of proactivesteps during 2020. In April 2020, we executed a $750.0 million one-year delayed draw term loan. In May 2020, we issued$750.0 million of 3.50% senior notes due 2030 to prefund: a) the $250.0 million due June 2020, and b) the $500.0 milliondue March 2021. In September 2020, we executed a new five-year unsecured bank line of credit of $1,000.0 million andterminated our April 2020 $750.0 million delayed draw term loan. As the impact of the COVID-19 pandemic on the economyand our operations evolves, we will continue to assess our liquidity sources and needs and take appropriate actions.

Part II 54
CASHIncluded in our December 31, 2020 cash and cash equivalents and restricted cash balances of $1,198.0 million is $0.9million of restricted cash (see Note 1 ������ �� ���������� '��������� �� ������ �� -��� 5 �Financial Statements and���� ������ &�� ���� ��� ������ ��������� #��>.
CASH FROM OPERATING ACTIVITIESinii millii ionsll
Net cash provided by operating activities is derived primarily from net earnings before noncash deductions for depreciation,depletion, accretion and amortization.
in millii ionsll 2020 2019 2018
Net earnings $ 584.5 $ 617.7 $ 515.8Depreciation, depletion, accretionand amortizrr ation (DDA&A) 396.8 374.6 346.2Noncash operating lease expense 38.3 35.3 0.0Contributions to pension plans (8.8) (8.9) (109.6)Deferred tax expense 62.0 76.0 64.6Cost of debt purchase 0.0 0.0 6.9Other operating cash flows, net 1 (2.4) (110.6) 8.9Net cash provided by operating activities $ 1,070.4 $ 984.1 $ 832.8
1 Primrr arilyl reflects changes to workirr ngii capital balances.
2020 VERSUS 2019 Net cash provided by operating activities was $1,070.4 million during 2020, an $86.3 millionincrease compared to 2019. This increase primarily resulted from favorable changes in working capital balances comparedto the prior year period.
Days sales outstanding, a measurement of the time it takes to collect receivables, were 44.9 days at December 31, 2020compared to 48.5 days at December 31, 2019. Additionally, our over 90 day balance of $15.5 million at December 31, 2020was down 55% from $34.1 million at December 31, 2019. All customer accounts are actively managed and no losses inexcess of amounts reserved are currently expected; attention is being paid to the potential negative impact of the COVID-19������� �� �� ��������� �� ��� �� �� ���� ������ ���� �� ���

Part II 55
CASH FROM INVESTING ACTIVITIESin millii ioll ns
2020 VERSUS 2019 Net cash used for investing activities was $381.5 million during 2020, a $34.3 million decreasecompared to 2019. We invested $362.2 million in our existing operations in 2020, a $21.9 million decrease compared to2019. Of this $362.2 million, $122.9 million was invested in internal growth projects to enhance our distribution capabilities,develop new production sites and enhance existing production facilities. Additionally, during 2020 we acquired businessesfor $43.2 million of cash consideration as compared to $44.2 million of cash consideration for businesses in 2019 (see Note.7 �'�%��������� �� &�+��������� �� -��� 5 �(����� ��������� �� ���� ������ &��).
CASH FROM FINANCING ACTIVITIESin milliii onsi
2020 VERSUS 2019 Net cash provided by financing activities in 2020 was $234.7 million, compared to $338.2 million ofnet cash used for financing activities in 2019. The 2020 activity includes: a) net cash proceeds of $734.6 million for theissuance of new debt, b) cash paid to retire the $250.0 million floating rate notes due 2020 and c) $19.9 million of cash paidto settle interest rate derivatives. The 2019 results include a net $133.0 million payment on our bank line of credit.
Additionally, capital returned to our shareholders increased by $39.8 million via higher dividends of $16.2 million ($1.36 pershare compared to $1.24 per share) and higher share repurchases of $23.5 million (214,338 shares @ $121.92 per sharecompared to 18,600 shares @ $139.90 per share).

Part II 56
DEBTCertain debt measures as of December 31 are outlined below:
dollars in millii ioll ns 2020 2019
DebtCurrent maturities of long-term debt $ 515.4 $ 0.0Short-term debt 0.0 0.0Long-term debt 2,772.3 2,784.3Total debt $ 3,287.7 $ 2,784.3CapitalTotal debt $ 3,287.7 $ 2,784.3Equity 6,027.3 5,621.9Total capital $ 9,315.0 $ 8,406.2Total Debt as a Percentage of Total Capital 35.3% 33.1%Weighted-average Effective Interest RatesLine of credit 1 1.25% 1.25%Term debt 4.10% 4.36%
Fixed versus Floating Interest Rate DebtFixed-rate debt 85.1% 73.7%Floating-rate debt 14.9% 26.3%
1 Reflects the marginii above LIBOR for LIBOR-based borrowings;ww we also paid upfrontff fees that are amortirr zeii d to interest expensxx eand pay fees for unused borrowinww g capacity and standby letters of credit.
LINE OF CREDITIn September 2020, we executed a new five-year unsecured line of credit of $1,000.0 million, incurring $4.6 million oftransaction costs. Covenants, borrowing options� ���� ���� �� ���� ���� � � �������� �� 3��� F �&���� �� -��� 5�(����� ��������� �� ���� ������ &��� '� �� &����ber 31, 2020, we were in compliance with the line of creditcovenants and the credit margin for LIBOR borrowings was 1.25%, the credit margin for base rate borrowings was 0.25%,and the commitment fee for the unused portion was 0.15%.
In September 2020, we terminated our $750.0 million 364-day delayed draw term loan executed in April 2020. During thesecond quarter, we had borrowed and repaid $250.0 million leaving $500.0 million available for future borrowings prior to itstermination.
As of December 31, 2020, our available borrowing capacity under the line of credit was $943.9 million. Utilization of theborrowing capacity was as follows:
� none was borrowed
� $56.1 million was used to provide support for outstanding standby letters of credit
TERM DEBTAll of our $3,357.9 million (face value) of term debt is unsecured. $3,346.2 million of such debt is governed by threeessentially identical indentures that contain customary investment-grade type covenants. The primary covenant in all threeindentures limits the amount of secured debt we may incur without ratably securing such debt. As of December 31, 2020, wewere in compliance with all term debt covenants.

Part II 57
In May 2020, we issued $750.0 million of 3.50% senior notes due 2030 for total proceeds of $741.4 million (net of discountsand transaction costs). $250.0 million of the proceeds were used to retire the $250.0 million floating rate notes due in June2020, and the remainder of the proceeds, together with cash on hand, will be used to retire the $500.0 million floating ratenotes due in March 2021.
For additional information regarding term debt, see 3��� F �&���� �� -��� 5 �(����� ��������� �� ���� ������ &���
DEBT PAYMAA ENTS AND MATURITIESScheduled debt payments during 2020 were $250.0 million in June refinanced in May by issuing $750.0 million of 3.50%senior notes due 2030. There were no significant scheduled debt payments during 2019.
As of December 31, 2020, maturities for the next four quarters and for the next five years are as follows (excluding anyborrowings on the line of credit):
2021 Debtin millii ionsll Debt Maturitrr iett s in millioii ns Maturitiett s
First quarter $ 500.4 2021 $ 515.4Second quarter 0.0 2022 0.5Third quarter 9.0 2023 0.5Fourth quarter 6.0 2024 0.5
2025 400.5
For additional information regarding debt payments and maturities, see 3��� F �&���� �� -��� 5 �(����� ��������� ������ ������ &���
DEBT RATINGSOur debt ratings and outlooks as of December 31, 2020 are as follows:
Ratingii /Ogg utloott k Date Descriptrr iontt
Senior Unsecured Term DebtFitch 1 BBB-/stable 5/7/2020 outlook revisedMoody's Baa2/stable 11/9/2020 rating revisedStandard & Poor's BBB+/stable 2/28/2020 rating revised
1 On February 22, 2021, Fitcii h upgraded our ratingtt to BBB/sBB table.
LIBOR TRANSITIONThe London Interbank Offeff red Rate (LIBOR) is an indicative measure of the average rate at which majoa r global banks couldborrow from one another and is used extensively globally as a reference rate for financial contracts (e.g., corporate bonds�� ���> �� ������� ������� ������ � ����� ����>� =�� )����� @�������� (����� #������ '�������� �����regulates LIBOR, announced in July 2017 that it intends to cease requiring banks to submit LIBOR rates afteff r 2021.
The expected discontinuation of LIBOR has led to the formation of working groups in the U.S. and elsewhere to recommendalternative reference rates. The U.S. working group is the Alternative Reference Rates Committee (ARRC) convened by theFederal Reserve Board and the Federal Reserve Bank of New York. The ARRC has selected the Secured OvernightFinancing Rate (SOFR) as the preferred alternative to LIBOR.
As of December 31, 2020, we had two material debt instruments with LIBOR as a reference rate: 1) $500.0 million floating-rate notes due March 2021, and 2) $1,000.0 million line of credit (none outstanding at December 31, 2020) due September2025. At this time, we cannot predict the future impact of a departure from LIBOR as a reference rate; however, if futurerates based upon the successor reference rate (or a new method of calculating LIBOR) are higher than LIBOR rates ascurrently determined, our interest expense would increase.

Part II 58
EQUITYThe number of our common stock issuances and purchases are as follows:
in thousandsdd 2020 2019 2018
Common stock shares at January 1,issued and outstanding 132,371 131,762 132,324Common Stock IssuancesShare-based compensation plans 359 628 630Common Stock PurchasesPurchased and retired (214) (19) (1,192)Common stock shares at December 31,issued and outstanding 132,516 132,371 131,762
As of December 31, 2020, there were 8,064,851 shares remaining under the February 2017 authorization by our Board ofDirectors. Depending upon market, business, legal and other conditions, we may purchase shares from time to time throughthe open market (including plans designed to comply with Rule 10b5-1 of the Securities Exchange Act of 1934) and/orprivately negotiated transactions. The authorization has no time limit, does not obligate us to purchase any specific numberof shares, and may be suspended or discontinued at any time.
The detail of our common stock purchases (all of which were open market purchases) are as follows:
in thousands,dd except average cost 2020 2019 2018
Shares Purchased and RetiredNumber 214 19 1,192Total purchase price $ 26,132 $ 2,602 $ 133,983Average cost per share $ 121.92 $ 139.90 $ 112.41g
There were no shares held in treasury as of December 31, 2020, 2019 and 2018.
OFF-BALANCE SHEET ARRANGEMENTSWe have no material off-ff balance sheet arrangements, such as financing or unconsolidated variable interest entities.
STANDBY LETTERS OF CREDIT(� ���������� �� �� ������ ����� �� ����� ��� 3��� F �&���� �� -��� 5 �(����� ��������� �� ���� ������ &���

Part II 59
CONTRACTUAL OBLIGATIONSWe expect core capital spending (excluding growth capital) of $325 million during 2021. Excluding future cash requirementsfor capital expenditures and immaterial or contingent contracts, our obligations to make future contractual payments as ofDecember 31, 2020 are summarized in the table below:
Note Payments Due by Yearin millii ionsll Reference 2021 2022-2023 2024-2025 Thereafteff r Total
Contractual ObligationsBank line of creditPrincipal payments Note 6 $ 0.0 $ 0.0 $ 0.0 $ 0.0 $ 0.0Interest payments and fees 1 Note 6 2.3 4.5 4.3 0.0 11.1Term debtPrincipal payments Note 6 515.4 1.0 400.9 2,440.6 3,357.9Interest payments Note 6 123.9 244.5 235.5 1,417.1 2,021.0Operating leases 2 Note 7 44.2 61.2 42.0 169.4 316.8Finance leases 2 Note 7 2.0 2.9 1.0 0.0 5.9Mineral royalties Note 12 27.2 43.5 27.7 167.2 265.6Unconditional purchase obligationsCapital Note 12 6.9 0.0 0.0 0.0 6.9Noncapital 3 Note 12 16.0 15.1 4.1 11.0 46.2Benefit plans 4 Note 10 8.1 30.4 51.1 71.6 161.2
Total contractual obligations 5, 6 $ 746.0 $ 403.1 $ 766.6 $ 4,276.9 $ 6,192.6
1 Includes fees for unused borrowrr inww g capacity and fees for standbydd letters of creditrr . The figureii s for all yearsrr assume that theamount of unused borrowingww capacity and the amount of standby letters of credirr ti do not change fromrr December 31, 2020, andborrowingww coststt refleff ct a risiii ngii LIBOR.
2 The above table excludes lease renewalw optionsi which arerr included in the table labeled Maturityi of Lease Liabilill ties in Note 7�Leas� es� in Item 8 �Fina� ncial Statements and Supplu ementary Data.�
3 Noncapital unconditional purchase obligati iontt s relate primarilyl to tranrr sportatiott n and electriciii ty contractt ts.4 Payments in �Thereafter� column for benefitff plans arerr for the years 2026-2030. The future contribtt utiontt s are based on currentrreconomic conditiontt s and may vary based on future intii erest ratrr es, asset performff ance, participant longevity and othertt planexperiencx e.
5 The above table excludes discounted asset retiremii ent obligai tionsii in the amount of $283.2 millii ionll at December 31, 2020, themajora itrr yt of which have an estimaii ted settlemtt ent date beyond 2025 (see Note 17 �Ass� et Retirtt emrr ent Obligationstt � in Item 8�Fi� nanii ciali Statements and Suppleu mentary Data�).�
6 The abovevv table excludes liabilitll iett s for unrecrr ognizeii d tax benefitsff in the amount of $6.8 millii ioll n at December 31, 2020, as wecannot make a reasonably reliablll e estimaii te of the amount and period of related future payment of these uncertain tax positions(forff more detailsii , see Note 9 �In� come Taxes� in Item 8 �Fi� naii ncial Statements and Supplemu entary Data�).�

Part II 60
CRITICAL ACCOUNTING POLICIESWe follow certain significant accounting policies when preparing our consolidated financial statements. A summary of these�� ����� �� ��� ���� �� 3��� . ������ �� ���������� '��������� �� ������ �� -��� 5 �(����� ��������� ������ ������ &���
We prepare these financial statements to conform with accounting principles generally accepted in the United States ofAmerica. These principles require us to make estimates and judgments that affeff ct reported amounts of assets, liabilities,revenues and expenses, and the related disclosures of contingent assets and contingent liabilities at the date of the financialstatements. We base our estimates on historical experience, current conditions and various other assumptions we believereasonable under existing circumstances and evaluate these estimates and judgments on an ongoing basis. The results ofthese estimates form the basis for our judgments about the carryirr ng values of assets and liabilities as well as identifying andassessing the accounting treatment with respect to commitments and contingencies. Our actual results may materially differfrom these estimates.
We believe the following critical accounting policies require the most significant judgments and estimates used in thepreparation of our consolidated financial statements:
1. Goodwill impairment
2. Impairment of long-lived assets excluding goodwill
3. Business combinations and purchase price allocation
4. Pension and other postretirement benefits
5. Environmental compliance costs
6. Claims and litigation including self-insurance
7. Income taxes
1. GOODWILL IMPAIRMENTGoodwill represents the excess of the cost of net assets acquired in business combinations over the fair value of theidentifiable tangible and intangible assets acquired and liabilities assumed in a business combination. Goodwill impairmentexists when the fair value of a reporting unit is less than its carrying amount. Goodwill is tested for impairment on an annualbasis or more frequently whenever events or changes in circumstances would more likely than not reduce the fair value of areporting unit below its carrying amount. The impairment evaluation is a critical accounting policy because goodwill ismaterial to our total assets (as of December 31, 2020, goodwill represents 27% of total assets) and the evaluation involvesthe use of significant estimates, assumptions and judgment.
HOW WE TEST GOODWILL FOR IMPAIRMENTGoodwill is tested for impairment at the reporting unit level, one level below our operating segments. We have identified 17reporting units (of which 9 carry goodwill) based primarily on geographic location. We have the option of either assessingqualitative factors to determine whether it is more likely than not that the carrying value of our reporting units exceeds theirrespective fair value or proceeding directly to a quantitative test. We elected to perfor rm the quantitative impairment test forall years presented.
The quantitative impairment test compares the fair value of a reporting unit to its carrying value, including goodwill. I f the fairvalue exceeds its carrying value, the goodwill of the reporting unit is not considered impaired. However, if the carrying valueof a reporting unit exceeds its fair value, we recognize an impairment loss equal to that excess.
HOW WE DETERMINE CARRYING VALUE AND FAIR VALUEWe determine the carrying value of each reporting unit by assigning assets and liabilities, including goodwill, to those unitsas of the measurement date. We estimate the fair values of the reporting units using both an income approach (whichinvolves discounting estimated future cash flows) and a market approach (which involves the application of revenue andEBITDA multiples of comparable companies). We consider market factors when determining the assumptions and estimatesused in our valuation models. Finally, to assess the reasonableness of the reporting unit fair values, we compare the total ofthe reporting unit fair values to our market capitalization.

Part II 61
OUR FAIR VALUE ASSUMPTIONSWe base our fair value estimates on market participant assumptions we believe to be reasonable at the time, but suchassumptions are subject to inherent uncertainty and actual results may differ. Changes in key assumptions or managementjudgment with respect to a reporting unit or its prospects may result from a change in market conditions, market trends,interest rates or other factors outside of our control, or underperfor rmance relative to historical or projected operating results.These conditions could result in a significantly diffeff rent estimate of the fair value of our reporting units, which could result inan impairment charge in the future.
The significant assumptions in our discounted cash flow models include our estimate of future profitability, capitalrequirements and the discount rate. The profitability estimates used in the models were derived from internal operatingbudgets and forecasts for long-term demand and pricing in our industry. Estimated capital requirements reflect replacementcapital estimated on a per ton basis and if applicable, acquisition capital necessary to support growth estimated in themodels. The discount rate was derived using a capital asset pricing model.
RESULTS OF OUR IMPAIRMENT TESTSThe results of our annual impairment tests for 2018 through 2020 indicated that the fair values of all reporting units withgoodwill substantially exceeded (in excess of 100%) their carrying values.
(� ������� ��������� ���� ������ � ��� 3��� .5 �C����� �� -������ � '������ �� -��� 5 �(����� ��������� ������ ������ &���
2. IMPAIRMENT OF LONG-LIVED ASSETS EXCLUDING GOODWILLWe evaluate the carrying value of long-lived assets, including intangible assets subject to amortization, when events andcircumstances indicate that the carrying value may not be recoverable. The impairment evaluation is a critical accountingpolicy because long-lived assets are material to our total assets (as of December 31, 2020, net property, plant & equipmentrepresents 38% of total assets, while net other intangible assets represents 10% of total assets) and the evaluation involvesthe use of significant estimates, assumptions and judgment. The carrying value of long-lived assets is considered impairedwhen the estimated undiscounted cash flows from such assets are less than their carrying value. In that event, we recognizea loss equal to the amount by which the carrying value exceeds the fair value.
Fair value is estimated primarily by using a discounted cash flow methodology that requires considerable judgment andassumptions. Our estimate of net future cash flows is based on historical experience and assumptions of future trends,which may be different from actual results. We periodically review the appropriateness of the estimated useful lives of ourlong-lived assets.
We test long-lived assets for impairment at the lowest level for which identifiable cash flows are largely independent of thecash flows of other assets. As a result, our long-lived asset impairment test is at a significantly lower level than the level atwhich we test goodwill for impairment. In markets where we do not produce downstream products (e.g., asphalt mix andready-mixed concrete), the lowest level of largely independent identifiable cash flows is at the individual aggregatesoperation or a group of aggregates operations collectively serving a local market. Conversely, in vertically integratedmarkets, the cash flows of our downstream and upstream businesses are not largely independently identifiable as the sellingprice of the upstream products (aggregates) impacts the profitability of the downstream business.
During 2020, 2019 and 2018, we recorded no material losses on impairment of long-lived assets.

Part II 62
We maintain certain long-lived assets that are not currently being used in our operations. These assets totaled $467.1million at December 31, 2020, representing a 12% increase from December 31, 2019. Of the total $467.1 million,approximately 40% relates to real estate held for future development and expansion of our operations. In addition,approximately 20% is comprised of real estate (principally former mining sites) pending development as commercial orresidential real estate, reservoirs or landfills. The remaining 40% is composed of aggregates, asphalt and concrete operatingassets idled temporarily. We evaluate the useful lives and the recoverability of these assets whenever events or changes incircumstances indicate that carryirr ng amounts may not be recoverable.
For additional information about long- �+�� ����� �� ������� � ������ ��� 3��� G �������� � �� A $%�������� �� 3���.5 �C����� �� -������ � '������ �� -��� 5 �(����� ��������� �� ���� ������ &���
3. BUSINESS COMBINATIONS AND PURCHASE PRICE ALLOCATIONOur strategic long-term plans include potential investments in value-added acquisitions of related or similar businesses.When an acquisition is completed, our consolidated statements of comprehensive income includes the operating results ofthe acquired business starting from the date of acquisition, which is the date that control is obtained.
HOW WE DETERMINE AND ALLOCATE THE PURCHASE PRICEThe purchase price is determined based on the fair value of consideration transferred to and liabilities assumed from theseller as of the date of acquisition. We allocate the purchase price to the fair values of the tangible and identifiable intangibleassets acquired and liabilities assumed as of the date of acquisition. Goodwill is recorded for the excess of the purchaseprice over the net fair value of the identifiable assets acquired and liabilities assumed. The purchase price allocation is acritical accounting policy because the estimation of fair values of acquired assets and assumed liabilities is judgmental andrequires various assumptions. Additionally, the amounts assigned to depreciable and amortizable assets compared toamounts assigned to goodwill, which is not amortized, can significantly affeff ct our results of operations.
Fair value is the price that would be received to sell an asset or paid to transfer a liability in an orderly transaction, andtherefore represents an exit price. A fair value measurement assumes the highest and best use of the asset by marketparticipants. The fair value hierarchy prioritizes the inputs to valuation techniques used to measure fair value into threebroad levels as described below:
Level 1: Quoted prices in active markets for identical assets or liabilitiesLevel 2: Inputs that are derived principally from, or corroborated by, observable market dataLevel 3: Inputs that are unobservable and significant to the overall fair value measurement
Level 1 fair values are used to value investments in publicly-traded entities and assumed obligations for publicly-traded long-term debt.
Level 2 fair values are typically used to value acquired machinery and equipment, land, buildings, and assumed liabilities forasset retirement obligations, environmental remediation and compliance obligations. Additionally, Level 2 fair values aretypically used to value assumed contracts at other-than-market rates.
Level 3 fair values are used to value acquired mineral reserves as well as leased mineral interests (referred to in ourfinancial statements as contractual rights in place) and other identifiable intangible assets. We determine the fair values ofowned mineral reserves and leased mineral interests using a lost profits approach and/or an excess earnings approach.These valuation techniques require management to estimate future cash flows. The estimate of future cash flows is basedon available historical information and future expectations and assumptions determined by management, but is inherentlyuncertain. Key assumptions in estimating future cash flows include sales price, shipment volumes, production costs andcapital needs. The present value of the projected net cash flows represents the fair value assigned to mineral reserves andmineral interests. The discount rate is a significant assumption used in the valuation model and is based on the required rateof return that a hypothetical market participant would assume if purchasing the acquired business, with an adjustment for therisk of these assets not generating the projected cash flows.

Part II 63
Other identifiable intangible assets may include, but are not limited to, noncompetition agreements. The fair values of theseassets are typically determined by an excess earnings method, a replacement cost method or a market approach.
MEASUREMENT PERIOD ADJUSTMENTSWe may adjust the amounts recognized in an acquisition during a measurement period afteff r the acquisition date. Any suchadjustments are the result of subsequently obtaining additional information that existed at the acquisition date regarding theassets acquired or the liabilities assumed. Measurement period adjustments are generally recorded as increases ordecreases to goodwill, if any, recognized in the transaction. The cumulative impact of measurement period adjustments ondepreciation, amortization and other income statement items are recognized in the period the adjustment is determined. Themeasurement period ends once we have obtained all necessary information that existed as of the acquisition date, but doesnot extend beyond one year from the date of acquisition. Any adjustments to assets acquired or liabilities assumed beyondthe measurement period are recorded through earnings.
4. PENSION AND OTHER POSTRETIREMENT BENEFITScounting for pension and other postretirement benefits requires that we use assumptions for the valuation of projected
benefit obligations (PBO) and the perfor rmance of plan assets. Each year, we review our assumptions for discount rates(used for PBO, service cost, and interest cost calculations) and the expected return on plan assets. Due to plan changesmade in 2012 and 2013, annual pay increases and the per capita cost of healthcare benefits do not materially impact planobligations.
� DISCOUNT RATES We use a high-quality bond full yield curve approach (specific spot rates for each annual expected��� � ��> �� ���� ��� ��� �������� ��� � ��� ��������� ���� ��� 3��� .6 �B������ � ��� �� -��� 5 �(����� Statements and Supplementar� &�� �� ��� �������� ��� ���� �� �B2� ��+��� ����� �� ������� ���� � �� ������
� EXPECTED RETURN ON PLAN ASSETS Our expected return on plan assets is: (1) a long-term view based on ourcurrent asset allocation, and (2) a judgment informed by co��� ����� ���� �� �������� � ��� ����� ��� �� ��������� � ��� ����� (� ��� �� ����� &������ /.� 4646� ��� �������� ���� �� � � ����� �� 5.75% for theperiod January 1, 2020 8 November 30, 2020 and 5.25% for the period December 1, 2020 8 December 31, 2020 (5.75%for 2019). The plans were remeasured at November 30, 2020 to reflect settlement accounting for the CMG HourlyPension Plan and the Vulcan Materials Company (VMC) Pension Plan (the Chemicals and Salaried Pension Plans weremerged to form the VMC Pension Plan effeff ctive November 30, 2020).
Changes to the assumptions listed above would have an impact on the PBO and the annual net benefit cost. The followingtable reflects the favorable and unfavorable outcomes associated with a change in certain assumptions:
(Favorable)vv Unfavff orablevv0.5 Percentage Point Increasrr e 0.5 Percentage Point Decrease
Inc (Dec)c in Inc (Dec)c in Inc (Dec)c in Inc (Dec)c inin millii ionsll Benefitff Obligai tion Annual Benefit Cost Benefitff Obligai tioni Annual Benefit Cost
Actuarial AssumptionsDiscount ratesPension $ (58.8) $ (0.9) $ 64.8 $ 0.8Other postretirement benefits (1.2) (0.0) 1.3 0.1Expected return on plan assets not applicable (4.5) not applicable 4.5( ))
As of the December 31, 2020 measurement date, the fair value of our pension plan assets decreased from $949.0 million forthe prior year-end to $944.3 million due to voluntary lump sum settlement distributions to certain fully vested planparticipants partially offsff et by investment returns. Our postretirement plans are unfunded.
The discount rate is the weighted-average of the spot rates for each cash flow on the yield curve for high-quality bonds as ofthe measurement date. As of the December 31, 2020 measurement date, the PBO of our pension plans decreased from$1,090.9 million to $1,059.5 million. This decrease was primarily due to the large amount of benefit distributions made fromthe plans as a result of the lump sum settlements offeff red to certain fully vested plan participants. The PBO of ourpostretirement plans decreased from $41.2 million to $33.9 million. This decrease was primarily due to demographicassumption changes.

Part II 64
During 2021, we expect to recognize net pension income of $10.8 million and net postretirement income of $1.9 millioncompared to expense of $21.6 million (which reflects a settlement charge of $22.7 million) and income of $2.2 million,respectively, in 2020. The decrease in pension expense (excluding the settlement charge) is mainly due to greater thanexpected asset returns.
We do not anticipate that contributions to the funded pension plans will be required during 2021, and we do not anticipatemaking a discretionary contribution. We currently do not anticipate that the funded status of any of our plans will fall belowstatutory thresholds requiring accelerated funding or constraints on benefit levels or plan administration.
(� ������� ��������� ���� ������� �� ���� ������������ ��������� ��� 3��� .6 �B������ � ��� �� -��� 5 �(����� ��������� �� ���� ������ &���
5. ENVIRONMENTAL COMPLIANCE COSTSOur environmental compliance costs include the cost of ongoing monitoring programs, the cost of remediation effoff rts andother similar costs. Our accounting policy for environmental compliance costs is a critical accounting policy because itinvolves the use of significant estimates and assumptions and requires considerable management judgment.
HOW WE ACCOUNT FOR ENVIRONMENTAL COSTSTo account for environmental costs, we:
� expense or capitalize environmental costs consistent with our capitalization policy
� expense costs for an existing condition caused by past operations that do not contribute to future revenues
� accrue costs for environmental assessment and remediation effoff rts when we determine that a liability is probable and wecan reasonably estimate the cost
At the early stages of a remediation effoff rt, environmental remediation liabilities are not easily quantified due to theuncertainties of various factors. The range of an estimated remediation liability is defined and redefined as events in theremediation effoff rt occur, but generally liabilities are recognized no later than completion of the remedial feasibility study.When we can estimate a range of probable loss, we accrue the most likely amount. If no amount in the range of probableloss is considered most likely, the minimum loss in the range is accrued. As of December 31, 2020, the difference betweenthe amount accrued and the maximum loss in the range for all sites for which a range can be reasonably estimated was $5.9million this amount does not represent our maximum exposure to loss for all environmental remediation obligations as itexcludes those sites for which a range of loss cannot be reasonably estimated at this time. Our environmental remediationobligations are recorded on an undiscounted basis.
Accrual amounts may be based on technical cost estimations or the professional judgment of experienced environmentalmanagers. Our Safety, Health and Environmental Affaff irs Management Committee routinely reviews cost estimates and keyassumptions in response to new information, such as the kinds and quantities of hazardous substances, availabletechnologies and changes to the parties participating in the remediation effoff rts. However, a number of factors, includingadverse agency rulings and unanticipated conditions as remediation effoff rts progress, may cause actual results to differmaterially from accrued costs.
(� ������� ��������� ���� ��+������� ���� ���� ������ ��� 3��� 5 �'����� $�+������� ���������� #����� ��-��� 5 �(����� ��������� �� ���� ������ &���

Part II 65
6. CLAIMS AND LITIGATION INCLUDING SELF-INSURANCEWe are involved with claims and litigation, including items covered under our self-insurance program. We are self-insured forlosses related to workers' compensation up to $2.0 million per occurrence and automotive and general/product liability up to$10.0 million per occurrence. We have excess coverage on a per occurrence basis beyond these retention levels.
Under our self-insurance program, we aggregate certain claims and litigation costs that are reasonably predictable based onour historical loss experience and accrue losses, including future legal defense costs, based on actuarial studies. Certainclaims and litigation costs, due to their unique nature, are not included in our actuarial studies. For matters not included inour actuarial studies, legal defense costs are accrued when incurred.
Our accounting policy for claims and litigation including self-insurance is a critical accounting policy because it involves theuse of significant estimates and assumptions and requires considerable management judgment.
HOW WE ASSESS THE PROBABILITY OF LOSSWe use both internal and outside legal counsel to assess the probability of loss, and establish an accrual when the claimsand litigation represent a probable loss and the cost can be reasonably estimated. Significant judgment is used indetermining the timing and amount of the accruals for probable losses, and the actual liability could differ materially from theaccrued amounts.
For additional information about claims and litigation including self-�������� ��� 3��� . ������ �� ����������'��������� �� ������ �� -��� 5 �(����� ��������� �� ���� ������ &�� ���� ��� ������ # ��� �� 0��������Including Self-insurance.
7. INCOME TAXESVALUATION OF OUR DEFERRED TAXAA ASSETSWe file federal, state and foreign income tax returns and account for the current and deferred tax effeff cts of such returnsusing the asset and liability method. We recognize deferred tax assets and liabilities (which reflect our best assessment ofthe future taxes we will pay) based on the diffeff rences between the book basis and tax basis of assets and liabilities.Deferred tax assets represent items to be used as a tax deduction or credit in future tax returns while deferred tax liabilit iesrepresent items that will result in additional tax in future tax returns.
Significant judgments and estimates are required in determining our deferred tax assets and liabilities. These estimates areupdated throughout the year to consider income tax return filings, our geographic mix of earnings, legislative changes andother relevant items. We are required to account for the effeff cts of changes in income tax rates on deferred tax balances inthe period in which the legislation is enacted.
Each quarter we analyze the likelihood that our deferred tax assets will be realized. Realization of the deferred tax assetsultimately depends on the existence of sufficient taxable income of the appropriate character in either the carryback orcarryforward period. A valuation allowance is recorded if, based on the weight of all available positive and negativeevidence, it is more likely than not (a likelihood of more than 50%) that some portion, or all, of a deferred tax asset will notbe realized. A summary of our deferred tax assets is i�� ���� �� 3��� 7 �-����� =���� �� -��� 5 �(����� ��������� ������ ������ &���

Part II 66
LIABILITY FOR UNRECOGNIZED TAXAA BENEFITSWe recognize a tax benefit associated with a tax position when we judge it is more likely than not that the position will besustained based upon the technical merits of the position. For a tax position that meets the more likely than not recognitionthreshold, we measure the income tax benefit as the largest amount that we judge to have a greater than 50% likelihood ofbeing realized. A liability is established for the unrecognized portion of any tax position. Our liability for unrecognized taxbenefits is adjusted periodically due to changing circumstances, such as the progress of tax audits, case law developmentsand new or emerging legislation.
Generally, we are not subject to significant changes in income taxes by any taxing jurisdiction for the years before 2017.While it is ofteff n difficult to predict the final outcome or the timing of resolution of any particular tax matter, we believe ourliability for unrecognized tax benefits is appropriate.
;� ������� �� �������� �� �� ��� +�� � ��� � �� �� ��� ����� ����� ��������+� � ���� ���� ���� ����� �� � �������on,or the expiration of the statute of limitations. Upon resolution of a tax position, any liability for unrecognized tax benefits willbe released.
Our liability for unrecognized tax benefits is generally presented as noncurrent. However, if we anticipate paying cash withinone year to settle an uncertain tax position, the liability is presented as current. We classify interest and penalties associatedwith our liability for unrecognized tax benefits as income tax expense.
NEW ACCOUNTING STANDARDSFor a discussion of accounting standards recently adopted or pending adoption and the effeff ct such accounting changes will�+� �� �� ��� �� �� ��������� ������ �������� � �%������� ��� 3��� . ������ �� ���������� '��������� �� ������ �n-��� 5 �(����� ��������� �� ���� ������ &�� ���� ��� ������ 3�w Accounting Standards.
FORWARD-LOOKING STATEMENTSThe foregoing discussion and analysis, as well as certain information contained elsewhere in this Annual Report, contain���� �- ��"��� ���������� ������ ��� ������ �� ������� 41' �� ��� ��������� '�� of 1933, as amended, and Section 21Eof the Securities Exchange Act of 1934, as amended, and are intended to be covered by the safe harbor created thereby.See the discussion in Safe Harbor Statement under the Private Securities Litigation Reform Act of 1995 in Part I, above.

Part II 67
ITEM 7AQUANTITATIVE AND QUALITATIVE DISCLOSURES ABOUT MARKET RISK
MARKET RISKWe are exposed to certain market risks arising from transactions that are entered into in the normal course of business. Tomanage these market risks, we may use derivative financial instruments. We do not enter into derivative financialinstruments for trading or speculative purposes.
As discussed in the Liquidity and Financial Resources section of -��� 1 �!��������� &��������� �� '� ���� ��Financia #�������� �� ���� �� �� 2��������� we actively manage our capital structure and resources to balance the costof capital and risk of financial stress. Such activity includes balancing the cost and risk of interest expense. In addition tofloating-rate borrowings, we at times use interest rate swaps to manage the mix of fixed-rate and floating-rate debt.
At December 31, 2020, the estimated fair value of our long-term debt including current maturities was $3,959.0 millioncompared to a face value of $3,357.9 million. The estimated fair value was determined by averaging several asking pricequotes for the publicly traded notes and assuming par value for the remainder of the debt. The fair value estimate is basedon information available as of the balance sheet date. The effeff ct of a decline in interest rates of one percentage point wouldincrease the fair value of our debt by approximately $414.9 million.
We are exposed to certain economic risks related to the costs of our pension and other postretirement benefit plans. Theseeconomic risks include changes in the discount rate for high-quality bonds and the expected return on plan assets. Theimpact of a change in these assumptions on our annual pension and other postretirement benefits costs is discussed ingreater detail within the Critical Accounting Policies section of this Annual Report.

Part II 68
ITEM 8FINANCIAL STATEMENTS AND SUPPLEMENTARY DATA
REPORT OF INDEPENDENT REGISTERED PUBLIC ACCOUNTING FIRMTo the shareholders and the Board of Directors of Vulcan Materials Company:
Opinion on the Financial Statements
We have audited the accompanying consolidated balance sheets of Vulcan Materials Company and subsidiaries (the�#������> � �� &������ /.� 4646 �� 46.7� ��� � ��� ����� ����� ��������� �� ����rehensive income, equity, andcash flows, for each of the three years in the period ended December 31, 2020, and the related notes (collectively referred�� � ��� ������� ����������>� -� �� �������� ��� ������ ��������� ������ �� �� �� ��erial respects, the financialposition of the Company as of December 31, 2020 and 2019, and the results of its operations and its cash flows for each ofthe three years in the period ended December 31, 2020, in conformity with accounting principles generally accepted in theUnited States of America.
We have also audited, in accordance with the standards of the Public Company Accounting Oversight Board (United States)(PCAOB), the Company's internal control over financial reporting as of December 31, 2020, based on the criteria establishedin Internal Contrott l � Integratrr ed Framrr eworww krr (2013) issued by the Committee of Sponsoring Organizations of the TreadwayCommission and our report dated February 25, 2021 expressed an unqualified opinion on the Company's internal controlover financial reporting.
Basis for Opinion
These financial statements are the responsibility of the Company's management. Our responsibility is to express an opinion�� ��� #������� ������ ��������� ���� �� �� ������ ;� � ��� �� �counting firm registered with the PCAOB andare required to be independent with respect to the Company in accordance with the U.S. federal securities laws and theapplicable rules and regulations of the Securities and Exchange Commission and the PCAOB.
We conducted our audits in accordance with the standards of the PCAOB. Those standards require that we plan andperfor rm the audit to obtain reasonable assurance about whether the financial statements are free of material misstatement,whether due to error or fraud. Our audits included perfor rming procedures to assess the risks of material misstatement of thefinancial statements, whether due to error or fraud, and perfor rming procedures that respond to those risks. Such proceduresincluded examining, on a test basis, evidence regarding the amounts and disclosures in the financial statements. Our auditsalso included evaluating the accounting principles used and significant estimates made by management, as well asevaluating the overall presentation of the financial statements. We believe that our audits provide a reasonable basis for ouropinion.
Critical Audit Matter
The critical audit matter communicated below is a matter arising from the current-period audit of the financial statements thatwas communicated or required to be communicated to the audit committee and that (1) relates to accounts or disclosuresthat are material to the financial statements and (2) involved our especially challenging, subjective, or complex judgments.The communication of critical audit matters does not alter in any way our opinion on the financial statements, taken as awhole, and we are not, by communicating the critical audit matter below, providing a separate opinion on the critical auditmatter or on the accounts or disclosures to which it relates.

Part II 69
Hewitt Landfill Environmental Matter � Refer to Note 12 to the consolidated financial statements
Critrr ictt al Audit Matter Descriptii iott n
The Company is subject to governmental proceedings and orders pertaining to the protection of the environment. Specific tothe Hewitt Landfill Environmental Matter, management is engaged in groundwater testing, certain remedial procedures andongoing dialogue with federal and local agencies such as the Environmental Protection Agency (EPA), Los AngelesRegional Water Quality Control Board (RWQCB) and the Los Angeles Department of Water and Power (LADWP) as well asother interested parties� =�� ������� �� �� ���� �� � ��� �� ��� #������� ������� ����������� �� ��� � ��� +�� ��E�groundwater contamination in the former Hewitt Landfill in Los Angeles and the potential contribution of the Hewitt Landfill togroundwater contamination in the North Hollywood Operable Unit (NHOU) of the San Fernando Valley Superfur nd Site.
The groundwater treatment system for the Hewitt Landfill on-site remediation reached mechanical completion during 2020.The incurred and anticipated costs have been fully accrued for based on facts and circumstances known to the Company atthis time. The Company has disclosed facts and circumstances that led to the accrual and the inherent uncertainty thatexists in the timing and recognition of potential incremental responsibility or share of costs for the Hewitt Landfill on-siteremediation or the NHOU. Due to these uncertainties, future amounts recorded related to the ultimate resolution of claims�� ���������� ��� � �� ���� �� ��+�� ����� �� ��� #������� ��� ts of operations or cash flows.
Evaluating the estimate of the liability and the extent and sufficiency of related disclosures is subjective in nature and assuch requires significant audit effoff rt, involves especially subjective auditing judgements, and requires the use of ourenvironmental specialists.
How the Critrr ictt al Audit Matter Was Addresrr sed in the Audit
Our audit pro������ � ��� �� ��� ��������� �� ��� ������� ���������� �� ���� ���� �� ��� #������� ��������� ��� ��potential share of remediation costs, specifically as they relate to the Hewitt Landfill and NHOU (collectively the HewittLandfill Environmental Matter) include the following, among others:
� We tested the effeff ctiveness of controls over the identification and evaluation of information available to assess potentialresponsibility or share of remediation costs for the Hewitt Landfill Environmental Matter, as well as controls over theadequacy of the related financial statement footnote disclosures.
� ;��� ��� �������� �� �� ��+������� ����� ����� �� �+ ���� ��� ����� �� ���� ������� �� ����������recorded liabilities for the Hewitt Landfill Environmental Matter by:
� 2������� ����� ��� ����� �� ����� ������ � �� ��� ������ ������ ����� ��� �� � ���+�� � ��������and the amount or range of potential loss should the outcome be unfavorable.
� Independently obtaining and reading correspondence from the EPA, RWQCB and LADWP regarding the HewittLandfill Environmental Matter.
� Obtaining an understanding of the change in estimate of remediation costs, as applicable, and performingprocedures to evaluate the appropriateness and sufficiency of the estimate at year-end.
� ;� �� �� ������ ��� #������� �������� ���� ���� �� �+������ ���� ������� ����� �� �����
/s/ DELOITTE & TOUCHE LLPBirmingham, AlabamaFebruary 25, 2021
;� �+� ��+�� � ��� #������� ����� ����� .956.

Part II 70
VULCAN MATERIALS COMPANY AND SUBSIDIARY COMPANIES
CONSOLIDATED STATEMENTS OF COMPREHENSIVE INCOME2020 2019 2018
For the yearsrr ended December 31in thousands, except per sharerr data
Total revenues $ 4,856,826 $ 4,929,103 $ 4,382,869Cost of revenues 3,575,345 3,673,202 3,281,924Gross profit 1,281,481 1,255,901 1,100,945
Selling, administrative and general expenses 359,772 370,548 333,371Gain on sale of property, plant & equipment and businesses 3,997 23,752 14,944Other operating expense, net (29,975) (31,647) (34,805)Operating earnings 895,731 877,458 747,713
Other nonoperating income (expense), net (17,540) 9,243 13,000Interest income 1,567 1,155 554Interest expense 135,960 130,155 137,977Earnings from continuing operations before income taxes 743,798 757,701 623,290Income tax expenseCurrent 93,948 58,941 40,516Deferred 61,855 76,257 64,933
Total income tax expense 155,803 135,198 105,449Earnings from continuing operations 587,995 622,503 517,841Loss on discontinued operations, net of tax (3,515) (4,841) (2,036)Net earnings $ 584,480 $ 617,662 $ 515,805
Other comprehensive income (loss), net of taxDeferred gain (loss) on interest rate derivative (14,679) 0 2,496Amortirr zation of prior interest rate derivative loss 1,689 227 226Adjustment for funded status of benefit plans 6,366 (26,892) (207)Amortirr zation of actuarial loss and prior service cost for benefit plans 23,057 1,142 4,365
Other comprehensive income (loss) 16,433 (25,523) 6,880Comprehensive income $ 600,913 $ 592,139 $ 522,685
Basic earnings (loss) per shareContinuing operations $ 4.44 $ 4.71 $ 3.91Discontinued operations (0.03) (0.04) (0.01)Net earnings $ 4.41 $ 4.67 $ 3.90
Diluted earnings (loss) per shareContinuing operations $ 4.41 $ 4.67 $ 3.87Discontinued operations (0.02) (0.04) (0.02)Net earnings $ 4.39 $ 4.63 $ 3.85
Weighted-average common shares outstandingBasic 132,578 132,300 132,393Assuming dilution 133,245 133,385 133,926
The accompanyingii Notes to Consolidated Financial Statements are an integral part of these statementstt .

Part II 71
VULCAN MATERIALS COMPANY AND SUBSIDIARY COMPANIES
CONSOLIDATED BALANCE SHEETS2020 2019
As of December 31in thousands
AssetsCash and cash equivalents $ 1,197,068 $ 271,589Restricted cash 945 2,917Accounts and notes receivableCustomers, less allowance for doubtful accounts2020 $2,551; 2019 $3,125 512,945 532,012Other 43,352 38,104
Inventories 448,585 458,308Other current assets 74,270 76,396Total current assets 2,277,165 1,379,326Investments and long-term receivables 34,301 60,709Property, plant & equipment, net 4,425,999 4,316,038Operating lease right-of-use assets, net 423,128 408,189Goodwill 3,172,112 3,167,061Other intangible assets, net 1,123,544 1,091,475Other noncurrent assets 230,656 225,995Total assets $ 11,686,905 $ 10,648,793LiabilitiesCurrent maturities of long-term debt 515,435 25Trade payables and accruals 273,080 265,159Accrued salaries, wages and management incentives 91,646 97,228Accrued interest 19,943 19,167Other current liabilities 147,779 153,984Total current liabilities 1,047,883 535,563Long-term debt 2,772,240 2,784,315Deferred income taxes, net 706,050 633,039Deferred management incentive and other compensation 26,787 22,856Pension benefits 107,195 142,363Other postretirement benefits 29,412 35,848Asset retirement obligations 283,163 210,323Deferred revenue 174,045 179,880Operating lease liabilities 399,582 388,042Other noncurrent liabilities 113,218 94,707Total liabilities $ 5,659,575 $ 5,026,936Other commitments and contingencies (Note 12)EquityCommon stock, $1 par value, Authorized 480,000 shares,Outstanding 132,516 and 132,371 shares, respectively 132,516 132,371
Capital in excess of par value 2,802,012 2,791,353Retained earnings 3,274,107 2,895,871Accumulated other comprehensive loss (181,305) (197,738)Total equity 6,027,330 5,621,857Total liabilities and equity $ 11,686,905 $ 10,648,793
The accompanyingii Notes to Consolidated Financial Statements are an integral part of these statementstt .

Part II 72
VULCAN MATERIALS COMPANY AND SUBSIDIARY COMPANIES
CONSOLIDATED STATEMENTS OF CASH FLOWS2020 2019 2018
For the yearsrr ended December 31in thousands
Operating ActivitiesNet earnings $ 584,480 $ 617,662 $ 515,805Adjustments to reconcile net earnings to net cash provided by operating activitiesDepreciation, depletion, accretion and amortization 396,806 374,596 346,246Noncash operating lease expense 38,272 35,344 0Net gain on sale of property, plant & equipment and businesses (3,997) (23,752) (14,944)Contributions to pension plans (8,819) (8,882) (109,631)Share-based compensation expense 32,991 31,843 25,215Deferred tax expense 62,018 76,011 64,639Cost of debt purchase 0 0 6,922(Increase) decrease in assets excluding the initial effeff cts of businessacquisitions and dispositionsAccounts and notes receivable 13,413 (29,734) 63,230Inventories 9,801 (28,273) (34,976)Prepaid expenses 2,585 5,990 (2,167)Other assets (14,430) (61,195) (58,489)
Increase (decrease) in liabilities excluding the initial effeff cts of businessacquisitions and dispositionsAccrued interest and income taxes 775 (4,644) 12,148Trade payables and other accruals (6,942) 21,788 40,181Other noncurrent liabilities (44,912) (51,150) (26,901)
Other, net 8,318 28,518 5,499Net cash provided by operating activities $ 1,070,359 $ 984,122 $ 832,777Investing ActivitiesPurchases of propertyrr , plant & equipment (362,194) (384,094) (469,088)Proceeds from sale of property, plant & equipment 11,461 22,661 22,210Proceeds from sale of businesses 968 1,744 11,256Payment for businesses acquired, net of acquired cash (43,223) (44,151) (221,419)Other, net 11,474 (11,997) (12,850)Net cash used for investing activities $ (381,514) $ (415,837) $ (669,891)Financing ActivitiesProceeds from short-rr term debt 0 366,900 739,900Payment of short-term debt 0 (499,900) (606,900)Payment of current maturities and long-term debt (250,025) (23) (892,055)Proceeds from issuance of long-term debt 750,000 0 850,000Debt issuance and exchange costs (15,394) 0 (45,513)Settlements of interest rate derivatives (19,863) 0 3,378Purchases of common stock (26,132) (2,602) (133,983)Dividends paid (180,216) (163,973) (148,109)Share-based compensation, shares withheld for taxes (22,144) (38,522) (31,846)Other, net (1,564) (63) 0Net cash provided by (used for) financing activities $ 234,662 $ (338,183) $ (265,128)Net increase (decrease) in cash and cash equivalents and restricted cash 923,507 230,102 (102,242)Cash and cash equivalents and restricted cash at beginning of year 274,506 44,404 146,646Cash and cash equivalents and restricted cash at end of year $ 1,198,013 $ 274,506 $ 44,404
The accompanyingii Notes to Consolidated Financial Statements are an integral part of these statementstt .

Part II 73
VULCAN MATERIALS COMPANY AND SUBSIDIARY COMPANIES
CONSOLIDATED STATEMENTS OF EQUITYAccumulated
Capital in Othtt erCommon Stock Excess of Retat ined Comprehensive
in thousands Sharesrr Amount Par Value Earnings Income (Loss)s Total
Balances at December 31, 2017 132,324 $ 132,324 $ 2,805,587 $ 2,180,448 $ (149,466) $ 4,968,893Released stranded tax effeff ctsASU 2018-02 0 0 0 29,629 (29,629) 0Balances at January 1, 2018, due toreclassification 132,324 $ 132,324 $ 2,805,587 $ 2,210,077 $ (179,095) $ 4,968,893Net earnings 0 0 0 515,805 0 515,805Share-based compensation plans,net of shares withheld for taxes 630 630 (32,428) 0 0 (31,798)Purchase and retirement ofcommon stock (1,192) (1,192) 0 (132,791) 0 (133,983)Share-based compensation expense 0 0 25,215 0 0 25,215Cash dividends on common stock 0 0 0 (148,109) 0 (148,109)Other comprehensive income 0 0 0 0 6,880 6,880Other 0 0 112 (112) 0 0Balances at December 31, 2018 131,762 $ 131,762 $ 2,798,486 $ 2,444,870 $ (172,215) $ 5,202,903Net earnings 0 0 0 617,662 0 617,662Share-based compensation plans,net of shares withheld for taxes 628 628 (39,080) 0 0 (38,452)Purchase and retirement ofcommon stock (19) (19) 0 (2,583) 0 (2,602)Share-based compensation expense 0 0 31,843 0 0 31,843Cash dividends on common stock 0 0 0 (163,973) 0 (163,973)Other comprehensive loss 0 0 0 0 (25,523) (25,523)Other 0 0 104 (105) 0 (1)Balances at December 31, 2019 132,371 $ 132,371 $ 2,791,353 $ 2,895,871 $ (197,738) $ 5,621,857Net earnings 0 0 0 584,480 0 584,480Share-based compensation plans,net of shares withheld for taxes 359 359 (22,442) 0 0 (22,083)Purchase and retirement ofcommon stock (214) (214) 0 (25,918) 0 (26,132)Share-based compensation expense 0 0 32,991 0 0 32,991Cash dividends on common stock 0 0 0 (180,216) 0 (180,216)Other comprehensive income 0 0 0 0 16,433 16,433Other 0 0 110 (110) 0 0Balances at December 31, 2020 132,516 $ 132,516 $ 2,802,012 $ 3,274,107 $ (181,305) $ 6,027,330The accompanyingii Notes to Consolidated Financial Statements are an integral part of these statementstt .

Part II 74
NOTES TO CONSOLIDATED FINANCIAL STATEMENTSNOTE 1: SUMMARY OF SIGNIFICANT ACCOUNTING POLICIES
NATURE OF OPERATIONS*� �� !��� � #����� ���� �#������� �*� ���� ����� ����>� 3�� D���� ��������� �� ��� �����H� ���� ���� ��of construction aggregates (primarily crushed stone, sand and gravel) and a majoa r producer of asphalt mix and ready-mixedconcrete.
We operate primarily in the United States and our principal product aggregates is used in virtually all types of publicand private construction projects and in the production of asphalt mix and ready-mixed concrete. We serve markets intwenty states, Washington D.C., and the local markets surrounding our operations in Mexico. Our primary focus is servingmetropolitan markets in the United States that are expected to experience the most significant growth in population,households and employment. These three demographic factors are significant drivers of demand for aggregates. Whileaggregates is our focus and primary business, we produce and sell asphalt mix and/or ready-mixed concrete in ourAlabama, Arizona, California, Maryland, New Mexico, Tennessee, Texas, Virginia and Washington D.C. markets.
While we continue to operate as an essential business, the COVID-19 pandemic has impacted our industry and theeconomy, and it may have far-reaching impacts on many aspects of our operations, directly and indirectly, including withrespect to its impacts on customer behaviors, business and manufacturing operations, our employees, and the marketgenerally.
Due to the 2005 sale of our Chemicals business as described below, the results of the Chemicals business are presented asdiscontinued operations in the accompanying Consolidated Statements of Comprehensive Income.
DISCONTINUED OPERATIONSIn 2005, we sold substantially all the assets of our Chemicals business to Basic Chemicals, a subsidiary of OccidentalChemical Corporation. The financial results of the Chemicals business are classified as discontinued operations in theaccompanying Consolidated Statements of Comprehensive Income for all periods presented. Results from discontinuedoperations are as follows:
in thousandsdd 2020 2019 2018
Discontinued OperationsPretax loss $ (4,752) $ (6,541) $ (2,748)Income tax benefit 1,237 1,700 712
Loss on discontinued operations,net of tax $ (3,515) $ (4,841) $ (2,036)
Our discontinued operations include charges/credits related to general and product liability costs, including legal defensecosts, and environmental remediation costs associated with our former Chemicals business (including certain matters asdiscussed in Note 12). There were no revenues from discontinued operations for the years presented.
PRINCIPLES OF CONSOLIDATIONThe consolidated financial statements include the accounts of Vulcan Materials Company and all our majority orwholly-owned subsidiary companies. Partially-owned affiff liates are either consolidated or accounted for at cost or as equityinvestments depending on the level of �������� ������� � �� �� ��� �� ������� ����� �+� ��� ����� ����� ��������� ' intercompany transactions and accounts have been eliminated in consolidation.

Part II 75
USE OF ESTIMATES IN THE PREPARATION OF FINANCIAL STATEMENTSThe preparation of these financial statements in conformity with accounting principles generally accepted (GAAP) in theUnited States of America requires us to make estimates and judgments that affeff ct reported amounts of assets, liabilities,revenues and expenses, and the related disclosures of contingent assets and contingent liabilities at the date of the financialstatements. We evaluate these estimates and judgments on an ongoing basis and base our estimates on historicalexperience, current conditions and various other assumptions that are believed to be reasonable under the circumstances.The results of these estimates form the basis for our judgments about the carrying values of assets and liabilities as well asidentifyiff ng and assessing the accounting treatment with respect to commitments and contingencies. Actual results may differmaterially from these estimates. The most significant estimates included in the preparation of these financial statements arerelated to goodwill and long-lived asset impairments, business combinations and purchase price allocation, pension andother postretirement benefits, environmental compliance, claims and litigation including self-insurance, and income taxes.Events and changes in circumstances arising afteff r December 31, 2020, including those resulting from the impacts ofCOVID-19� �� �� �� ����� �� ���������� �������� �� ����� �������
BUSINESS COMBINATIONSWe account for business combinations under the acquisition method of accounting. The purchase price of an acquisition isallocated to the underlying identifiable assets acquired and liabilities assumed based on their respective fair values. Thepurchase price is determined based on the fair value of consideration transferred to and liabilities assumed from the selleras of the date of acquisition. We allocate the purchase price to the fair values of the tangible and identifiable intangibleassets acquired and liabilities assumed as of the date of acquisition. Goodwill is recorded for the excess of the purchaseprice over the net fair value of the identifiable assets acquired and liabilities assumed.
Determining the fair values of assets acquired and liabilities assumed requires judgment and often involves the use ofsignificant estimates and assumptions. Fair value is the price that would be received to sell an asset or paid to transfer aliability in an orderly transaction, and therefore represents an exit price. A fair value measurement assumes the highest andbest use of the asset by market participants.
We may adjust the amounts recognized in an acquisition during a measurement period afteff r the acquisition date. Any suchadjustments are the result of subsequently obtaining additional information that existed at the acquisition date regarding theassets acquired or the liabilities assumed. Measurement period adjustments are generally recorded as increases ordecreases to goodwill, if any, recognized in the transaction. The cumulative impact of measurement period adjustments ondepreciation, amortization and other income statement items are recognized in the period the adjustment is determined.
FOREIGN CURRENCY TRANSACTIONSThe U.S. dollar is the functional currency for all of our operations. For our non-U.S. subsidiaries, local currency inventoriesand long-term assets such as property, plant & equipment and intangibles are remeasured into U.S. dollars at approximaterates prevailing when acquired; all other assets and liabilities are remeasured at year-end exchange rates. Inventoriescharged to cost of sales and depreciation are remeasured at historical rates; all other income and expense items areremeasured at average exchange rates prevailing during the year. Gains and losses which result from remeasurement areincluded in other nonoperating income/expense in the accompanying Consolidated Statements of Comprehensive Incomeand are not material for the years presented.
CASH EQUIVALENTSWe classifyff as cash equivalents all highly liquid securities with a maturity of three months or less at the time of purchase.The carrying amount of these securities approximates fair value due to their short-term maturities.
RESTRICTED CASHRestricted cash generally consists of cash proceeds from the sale of property held in escrow for the acquisition ofreplacement property under like-kind exchange agreements and cash reserved by other contractual agreements (such asasset purchase agreements) for a specified purpose and therefore not available for use for other purposes. The escrowaccounts are administered by an intermediary. Cash restricted pursuant to like-kind exchange agreements remainsrestricted for a maximum of 180 days from the date of the property sale pending the acquisition of replacement property.Restricted cash is included with cash and cash equivalents in the accompanying Consolidated Statements of Cash Flows.

Part II 76
ACCOUNTS AND NOTES RECEIVABLEAccounts and notes receivable from customers result from our extending credit to trade customers for the purchase of ourproducts. The terms generally provide for payment within 15 days of the month following invoice. On occasion, whennecessary to conform to regional industry practices, we sell product under extended payment terms, which may result ineither secured or unsecured short-term notes; or, on occasion, notes with durations of less than one year are taken insettlement of existing accounts receivable. Other accounts and notes receivable result from short-term transactions (lessthan one year) other than the sale of our products, such as interest receivable, insurance claims, freight claims, bid depositsor rents receivable.
Allowance for doubtful accounts is based on our assessment of the collectability of customer accounts. We regularly review theallowance by considering factors such as historical experience, credit quality, the age of the accounts receivable balances, and����� �������� ���������� ��� �� ����� �� ��������� �� ��� �� ��� B� ���� ������� �� ��� ��� ����� &������ /.was as follows: 2020 $1,091,000, 2019 $1,426,000 and 2018 $251,000. Write-offsff of accounts receivables for theyears ended December 31 were as follows: 2020 $2,046,000, 2019 $809,000 and 2018 $1,291,000.
INVENTORIESInventories and supplies are stated at the lower of cost or net realizable value. We use the last-in, first-out (LIFO) method ofvaluation for most of our inventories because it results in a better matching of costs with revenues. Such costs include fuel,parts and supplies, raw materials, direct labor and production overhead. An actual valuation of inventory under the LIFOmethod can be made only at the end of each year based on the inventory levels and costs at that time. Accordingly, interimLIFO calculations are based on our estimates of expected year-end inventory levels and costs and are subject to the finalyear-end LIFO inventory valuation. Substantially all operating supplies inventory is carried at average cost.
For additional information about inventories see Note 3.
PROPERTY, PLANT & EQUIPMENTProperty, plant & equipment (including finance leases) are carried at cost less accumulated depreciation, depletion andamortization.
Capitalized software costs of $2,110,000 and $2,976,000 are reflected in net property, plant & equipment as of December31, 2020 and 2019, respectively. We capitalized software costs for the years ended December 31 as follows: 2020 $1,116,000, 2019 $1,506,000 and 2018 $2,213,000.
For assets sold or otherwisrr e disposed of, the cost and related accumulated depreciation are removed, and any related gainor loss is reflected in income.
For additional information about our property, plant & equipment see Note 4.
REPAIR AND MAINTENANCERepair and maintenance costs generally are charged to operating expense as incurred. Renewals and betterments that addmaterially to the utility or useful lives of property, plant & equipment are capitalized and subsequently depreciated. Actualcosts for planned majoa r maintenance activities, related primarily to periodic overhauls on our oceangoing vessels, arecapitalized and amortized to the next overhaul.
LEASESOur nonmineral leases with initial terms in excess of one year are recognized on the balance sheet as right-of-use (ROU)assets and lease liabilities. Mineral leases are exempt from balance sheet recognition.
ROU assets represent our right to use an underlying asset for the lease term, and lease liabilities represent our obligation tomake lease payments arising from the leases. ROU assets and lease liabilities are recognized at the lease commencementdate based on the present value of lease payments over the lease term. The lease term only includes options to extend orterminate the lease when it is reasonably certain that we will exercise that option. As our leases do not provide an implicitrate, we use our incremental borrowing rate based on the information available at the commencement date in determiningthe present value of lease payments. ROU assets are adjusted for any prepaid lease payments and lease incentives. Exceptfor equipment with monthly monitoring service where the service component accounts for a majoa rity of the lease cost, thenon-lease components of our lease agreements are not separated from the lease components.

Part II 77
For additional information about leases see Note 7.
DEPRECIATION, DEPLETION, ACCRETION AND AMORTIZATIONDepreciation is generally computed by the straight-line method at rates based on the estimated service lives of the variousclasses of assets, which include machinery and equipment (3 to 35 years), buildings (7 to 20 years) and land improvements(3 to 20 years). Finance leases are amortized over varying periods not in excess of applicable lease terms or estimateduseful lives. Capitalized software costs are included in machinery and equipment and are depreciated on a straight-linebasis beginning when the software project is substantially complete.
Cost depletion on depletable land is computed by the unit-of-sales method based on estimated recoverable units.
Accretion reflects the period-to-period increase in the carrying amount of the liability for asset retirement obligations. It iscomputed using the same credit-adjusted, risk-free rate used to initially measure the liability at fair value.
Leaseholds are amortized over varying periods not in excess of applicable lease terms or estimated useful lives.
Amortization of intangible assets subject to amortization is computed based on the estimated life of the intangible assets.A significant portion of our intangible assets is contractual rights in place associated with zoning, permitting and other rightsto access and extract aggregates reserves. Contractual rights in place associated with aggregates reserves are amortizedusing the unit-of-sf ales method based on estimated recoverable units. Other intangible assets are amortized principally bythe straight-line method.
Depreciation, depletion, accretion and amortization expense for the years ended December 31 is outlined below:
in thousandsdd 2020 2019 2018
Depreciation, Depletion, Accretion and AmortizationDepreciation $ 315,136 $ 300,613 $ 276,814Depletion 21,011 22,421 23,260Accretion 12,432 10,992 10,776Amortization of finance leases 1,616 29 472Amortization of intangibles 46,611 40,541 34,924
Total $ 396,806 $ 374,596 $ 346,246
DERIVATIVE INSTRUMENTSDuring the normal course of operations, we are exposed to market risks including interest rates, foreign currency exchangerates and commodity prices. From time to time, and consistent with our risk management policies, we use derivativeinstruments to balance the cost and risk of such expenses. We do not use derivative instruments for trading or otherspeculative purposes.
The accounting for gains and losses that result from changes in the fair value of derivative instruments depends on whetherthe derivatives have been designated and qualifyff as hedging instruments and the type of hedging relationship. Changes inthe fair value of interest rate swap cash flow hedges are recorded in accumulated other comprehensive income (AOCI) andare reclassified into interest expense in the same period the hedged items affeff ct earnings. We may also enter into contractsthat qualifyff for the normal purchases and normal sales (NPNS) exception. When a contract meets the criteria to qualifyff asNPNS, we apply such exception. Income recognition and realization related to NPNS contracts generally coincide with the������ �� �+�� �� ��� ���������� (� ������� %� ������ �� ��� 3�3� ���������� �� ���������� �� ��� �������� ��value in the consolidated financial statements is required until settlement of the contract as long as the transaction remainsprobable of occurring.
For additional information about derivative instruments see Note 5.

Part II 78
FAIR VALUE MEASUREMENTSFair value is defined as the price that would be received to sell an asset or paid to transfer a liability in an orderly transactionbetween market participants at the measurement date. The fair value hierarchy prioritizes the inputs to valuation techniquesused to measure fair value into three broad levels as described below:
Level 1: Quoted prices in active markets for identical assets or liabilitiesLevel 2: Inputs that are derived principally from or corroborated by observable market dataLevel 3: Inputs that are unobservable and significant to the overall fair value measurement
Our assets at December 31 subject to fair value measurement on a recurring basis are summarized below:
Levelvv 1 Fairii Valuein thousandsdd 2020 2019
Fair Value RecurringRabbi TrustMutual funds $ 28,058 $ 22,883
Total $ 28,058 $ 22,883
Levelvv 2 Fairii Valuein thousandsdd 2020 2019
Fair Value RecurringRabbi TrustMoney market mutual fund $ 837 $ 1,340
Total $ 837 $ 1,340
We have two Rabbi Trusts for the purpose of providing a level of security for the employee nonqualified retirement anddeferred compensation plans and for the directors' nonqualified deferred compensation plans. The fair values of theseinvestments are estimated using a market approach. The Level 1 investments include mutual funds for which quoted pricesin active markets are available. Level 2 investments are stated at estimated fair value based on the underlying investmentsin the fund (short-term, highly liquid assets in commercial paper, short-term bonds and certificates of deposit).
3�� ���� � �����> �� ��� ���� =����� ��+�������� ��� I4,469,000, $3,993,000 and $(2,741,000) for the years endedDecember 31, 2020, 2019 and 2018, respectively. The portions of the net gains (losses) related to investments still held bythe Rabbi Trusts at December 31, 2020, 2019 and 2018 were $4,140,000, $3,729,000 and $(4,386,000), respectively.
The carrying values of our cash equivalents, restricted cash, accounts and notes receivable, short-term debt, trade payablesand accruals, and all other current liabilities approximate their fair values because of the short-term nature of theseinstruments. Additional disclosures for derivative instruments and interest-bearing debt are presented in Notes 5 and 6,respectively.

Part II 79
GOODWILL IMPAIRMENTGoodwill represents the excess of the cost of net assets acquired in business combinations over the fair value of theidentifiable tangible and intangible assets acquired and liabilities assumed in a business combination. Goodwill impairmentexists when the fair value of a reporting unit is less than its carrying amount. As of December 31, 2020, goodwill totaled$3,172,112,000 as compared to $3,167,061,000 at December 31, 2019. Goodwill represents 27% of total assets atDecember 31, 2020 compared to 30% at December 31, 2019.
Goodwill is tested for impairment annually, as of November 1, or more frequently whenever events or changes incircumstances would more likely than not reduce the fair value of a reporting unit below its carrying amount. Goodwill istested for impairment at the reporting unit level, one level below our operating segments. We have four operating segmentsorganized around our principal product lines: Aggregates, Asphalt, Concrete and Calcium. Within these four operatingsegments, we have identified 17 reporting units (of which 9 carry goodwill) based primarily on geographic location. We havethe option of either assessing qualitative factors to determine whether it is more likely than not that the carrying value of ourreporting units exceeds their respective fair value or proceeding directly to a quantitative test. We elected to perform thequantitative impairment test for all years presented.
The quantitative impairment test compares the fair value of a reporting unit to its carrying value, including goodwill. I f the fairvalue exceeds its carrying value, the goodwill of the reporting unit is not considered impaired. However, if the carrying valueof a reporting unit exceeds its fair value, we recognize an impairment loss equal to that excess.
The results of the annual impairment tests perfor rmed as of November 1, 2020, 2019 and 2018 indicated that the fair valuesof all reporting units with goodwill substantially exceeded their carrying values. Accordingly, there were no charges forgoodwill impairment in the years ended December 31, 2020, 2019 or 2018.
We estimate the fair values of the reporting units using both an income approach (which involves discounting estimatedfuture cash flows) and a market approach (which involves the application of revenue and EBITDA multiples of comparablecompanies). Determining the fair value of our reporting units involves the use of significant estimates and assumptions andconsiderable management judgment. We base our fair value estimates on assumptions we believe to be reasonable at thetime, but such assumptions are subject to inherent uncertainty and actual results may differ. Changes in key assumptions ormanagement judgment with respect to a reporting unit or its prospects, which may result from a change in marketconditions, market trends, interest rates or other factors outside of our control, or underperformance relative to historical orprojected operating results, could result in a significantly different estimate of the fair value of our reporting units, whichcould result in an impairment charge in the future.
For additional information about goodwill see Note 18.
IMPAIRMENT OF LONG-LIVED ASSETS EXCLUDING GOODWILLWe evaluate the carrying value of long-lived assets, including intangible assets subject to amortization, when events andcircumstances indicate that the carrying value may not be recoverable. The carrying value of long-lived assets is consideredimpaired when the estimated undiscounted cash flows from such assets are less than their carrying value. In that event, werecognize a loss equal to the amount by which the carrying value exceeds the fair value. Fair value is determined primarilyby using a discounted cash flow methodology that requires considerable judgment and assumptions. Our estimate of netfuture cash flows is based on historical experience and assumptions of future trends, which may be different from actualresults. We periodically review the appropriateness of the estimated useful lives of our long-lived assets.
We test long-lived assets for impairment at the lowest level for which identifiable cash flows are largely independent of thecash flows of other assets. As a result, our long-lived asset impairment test is at a significantly lower level than the level atwhich we test goodwill for impairment. In markets where we do not produce downstream products (e.g., asphalt mix andready-mixed concrete), the lowest level of largely independent identifiable cash flows is at the individual aggregatesoperation or a group of aggregates operations collectively serving a local market. Conversely, in vertically integratedmarkets, the cash flows of our downstream and upstream businesses are not largely independently identifiable as the sellingprice of the upstream products (aggregates) determines the profitability of the downstream business.
As of December 31, 2020, net property, plant & equipment represents 38% of total assets, while net other intangible assetsrepresents 10% of total assets. During 2020, 2019 and 2018, we recorded no material losses on impairment of long-livedassets.
For additional information about long-lived assets and intangible assets see Notes 4 and 18, respectively.

Part II 80
REVENUES AND REVENUE RECOGNITIONTotal revenues include sales of product and services to customers, net of any discounts and taxes, and freight and deliveryrevenues billed to customers. Freight and delivery generally represent pass-through transportation we incur (including ouradministrative costs) and pay to third-party carriers to deliver our products to customers. The cost related to freight anddelivery is included in cost of revenues.
Revenues for product sales are recognized when control passes to the customer (typically occurs when finished productsare shipped/delivered). Construction paving revenues are recognized using the percentage-of-completion method.
For additional information regarding revenues and revenue recognition see Note 2.
STRIPPING COSTSIn the mining industry, the costs of removing overburden and waste materials to access mineral deposits are referred to asstripping costs.
Stripping costs incurred during the production phase are considered costs of extracted minerals under our inventory costingsystem, inventoried, and recognized in cost of sales in the same period as the revenue from the sale of the inventory. Theproduction stage is deemed to begin when the activities, including removal of overburden and waste material that maycontain incidental saleable material, required to access the saleable product are complete. Stripping costs considered asproduction costs and included in the costs of inventory produced were $90,432,000 in 2020, $86,090,000 in 2019 and$78,911,000 in 2018.
Conversely, stripping costs incurred during the development stage of a mine (pre-production stripping) are excluded fromour inventory cost. Pre-production stripping costs are capitalized and reported within other noncurrent assets in ouraccompanying Consolidated Balance Sheets. Capitalized pre-production stripping costs are expensed over the productivelife of the mine using the unit-of-sales method. Pre-production stripping costs included in other noncurrent assets were$92,880,000 as of December 31, 2020 and $92,759,000 as of December 31, 2019.
RECLAMATION COSTSReclamation costs resulting from normal use of long-lived assets are recognized over the period the asset is in use whenthere is a legal obligation to incur these costs upon retirement of the assets. Additionally, reclamation costs resulting fromnormal use under a mineral lease are recognized over the lease term when there is a legal obligation to incur these costsupon expiration of the lease. The obligation, which cannot be reduced by estimated offsff etting cash flows, is recorded at fairvalue as a liability at the obligating event date and is accreted through charges to operating expenses. This fair value is alsocapitalized as part of the carrying amount of the underlying asset and depreciated over the estimated useful life of the asset.If the obligation is settled for other than the carrying amount of the liability, a gain or loss is recognized on settlement.
To determine the fair value of the obligation, we estimate the cost (including a reasonable profit margin) for a third party toperforr rm the legally required reclamation tasks. This cost is then increased for both future estimated inflation and an estimatedmarket risk premium related to the estimated years to settlement. Once calculated, this cost is discounted to fair value usingpresent value techniques with a credit-adjusted, risk-free rate commensurate with the estimated years to settlement.
In estimating the settlement date, we evaluate the current facts and conditions to determine the most likely settlement date.If this evaluation identifies alternative estimated settlement dates, we use a weighted-average settlement date consideringthe probabilities of each alternative.
We review reclamation obligations at least annually for a revision to the cost or a change in the estimated settlement date.Additionally, reclamation obligations are reviewed in the period that a triggering event occurs that would result in either arevision to the cost or a change in the estimated settlement date. Examples of events that would trigger a change in the costinclude a new reclamation law or amendment of an existing mineral lease. Examples of events that would trigger a changein the estimated settlement date include the acquisition of additional reserves or the closure of a facility.
The carrying value of these obligations was $283,163,000 as of December 31, 2020 and $210,323,000 as of December 31,2019. For additional information about reclamation obligations (referred to in our financial statements as asset retirementobligations) see Note 17.

Part II 81
ENVIRONMENTAL COMPLIANCEOur environmental compliance costs are undiscounted and include the cost of ongoing monitoring programs, the cost ofremediation effoff rts and other similar costs. We accrue costs for environmental assessment and remediation effoff rts when wedetermine that a liability is probable and we can reasonably estimate the cost. At the early stages of a remediation effoff rt,environmental remediation liabilities are not easily quantified due to the uncertainties of various factors. The range of anestimated remediation liability is defined and redefined as events in the remediation effoff rt occur, but generally liabilities arerecognized no later than the completion of the remedial feasibility study.
When we can estimate a range of probable loss, we accrue the most likely amount. If no amount in the range of probableloss is considered most likely, the minimum loss in the range is accrued. As of December 31, 2020, the spread between theamount accrued and the maximum loss in the range for all sites for which a range can be reasonably estimated was$5,905,000 this amount does not represent our maximum exposure to loss for all environmental remediation obligationsas it excludes those sites for which a range of loss cannot be reasonably estimated at this time. Accrual amounts may bebased on technical cost estimations or the professional judgment of experienced environmental managers. Our Safety,Health and Environmental Affaff irs Management Committee routinely reviews cost estimates and key assumptions inresponse to new information, such as the kinds and quantities of hazardous substances, available technologies andchanges to the parties participating in the remediation effoff rts. However, a number of factors, including adverse agencyrulings and encountering unanticipated conditions as remediation effoff rts progress, may cause actual results to differmaterially from accrued costs.
For additional information about environmental compliance costs see Note 8.
CLAIMS AND LITIGATION INCLUDING SELF-INSURANCEWe are involved with claims and litigation, including items covered under our self-insurance program. We are self-insured forlosses related to workers' compensation up to $2,000,000 per occurrence and automotive and general/product liability up to$10,000,000 per occurrence. We have excess coverage on a per occurrence basis beyond these retention levels.
Under our self-insurance program, we aggregate certain claims and litigation costs that are reasonably predictable based onour historical loss experience and accrue losses, including future legal defense costs, based on actuarial studies. Certainclaims and litigation costs, due to their unique nature, are not included in our actuarial studies. We use both internal andoutside legal counsel to assess the probability of loss, and establish an accrual when the claims and litigation represent aprobable loss and the cost can be reasonably estimated. For matters not included in our actuarial studies, legal defensecosts are accrued when incurred. The following table outlines our self-insurance program at December 31:
dollall rs in thousands 2020 2019
Self-insurance ProgramSelf-insured liabilities (undiscounted) $ 75,570 $ 69,069Insured liabilities (undiscounted) 3,661 6,431Discount rate 0.30% 1.63%Amounts Recognized in ConsolidatedBalance SheetsOther accounts and notes receivable $ 595 $ 0Investments and long-term receivables 3,585 5,931Other current liabilities (20,707) (19,830)Other noncurrent liabilities (57,608) (51,360)Net liabilities (discounted) $ (74,135) $ (65,259)

Part II 82
Estimated payments (undiscounted and excluding the impact of related receivables) under our self-insurance program forthe five years subsequent to December 31, 2020 are as follows:
in thousandsdd
Estimated Payments under Self-insurance Program2021 $ 22,4362022 16,4532023 11,4922024 6,8572025 3,751
Significant judgment is used in determining the timing and amount of the accruals for probable losses, and the actual liabili tycould differ materially from the accrued amounts.
For additional information about claims and litigation, see Note 12 under the caption Litigation and Environmental Matters.
SHARE-BASED COMPENSATIONAll of our share-based compensation awards are classified as equity awards. We measure share-based compensationawards using fair-value-based measurement methods. This results in the recognition of compensation expense for all share-based compensation awards based on their fair value as of the grant date. Compensation cost is recognized over therequisite service period. Forfer itures are recognized as they occur.
A summary of the estimated future compensation cost (unrecognized compensation expense) as of December 31, 2020related to share-based awards granted to employees under our long-term incentive plans is presented below:
Unrecognizeii d ExpectedCompensationtt Weighted-average
dollall rs in thousands Expenxx se Recognitionii (YeaYY rs)s
Share-based CompensationSOSARs 1 $ 1,605 1.3Performance shares 10,622 1.7Restricted shares 8,362 1.7Total/weighted-average $ 20,589 1.7
1 Stock-Only Stock Appreciatiott n Rightsi (SOSARs)
Pretax compensation expense related to our employee share-based compensation awards and related income tax benefitsfor the years ended December 31 are summarized below:
in thousandsdd 2020 2019 2018
Employee Share-based Compensation AwardsPretax compensation expense $ 31,419 $ 30,067 $ 23,250Income tax benefits 4,954 7,682 5,940
We receive an income tax deduction for share-based compensation equal to the excess of the market value of our commonstock on the date of exercise or issuance over the exercise price. Tax benefits resulting from tax deductions in excess of thecompensation cost recognized (excess tax benefits) are reflected as discrete income tax benefits in the period of exercise orissuance. Net excess tax benefits were recorded as reductions to our income tax expense and reflected as operating cashflows, as follows (combined federal and state): 2020 � $8,368,000; 2019 � $21,020,000 and 2018 � $20,137,000.
For additional information about share-based compensation, see Note 11 under the caption Share-based CompensationPlans.

Part II 83
PENSION AND OTHER POSTRETIREMENT BENEFITSAccounting for pension and other postretirement benefits requires that we use assumptions for the valuation of projectedbenefit obligations (PBO) and the perfor rmance of plan assets. Each year, we review our assumptions for discount rates(used for PBO, service cost, and interest cost calculations) and the expected return on plan assets. Due to plan changesmade in 2012 and 2013, annual pay increases and the per capita cost of healthcare benefits do not materially impact planobligations.
� DISCOUNT RATES We use a high-quality bond full yield curve approach (specific spot rates for each annual expectedcash flow) to establish the discount rates at each measurement date. See Note 10 for the discount rates used for PBO,service cost, and interest cost calculations.
� EXPECTED RETURN ON PLAN ASSETS Our expected return on plan assets is: (1) a long-term view based on our����� ���� ������� �� �4> ,������� ������� �� ����� ����� ���� �� �������� � ��� ����� ��� �� ��pen���� � ��� ����� (� ��� �� ����� &������ /.� 4646� ��� �������� ���� �� � � ����� �� 5.75% for theperiod January 1, 2020 8 November 30, 2020 and 5.25% for the period December 1, 2020 8 December 31, 2020 (5.75%for 2019). The plans were remeasured at November 30, 2020 to reflect settlement accounting (due to a voluntary lump-sum settlement offeff r to certain fully vested plan participants) for the CMG Hourly Pension Plan and the Vulcan MaterialsCompany (VMC) Pension Plan (the Chemicals and Salaried Pension Plans were merged to form the VMC Pension Planeffeff ctive November 30, 2020).
Accounting standards provide for the delayed recognition of differences between actual results and expected or estimatedresults. This delayed recognition of actual results allows for a smoothed recognition in earnings of changes in benefitobligations and asset perfor rmance. The differences between actual results and expected or estimated results arerecognized in full in other comprehensive income. Amounts recognized in other comprehensive income are reclassified toearnings in a systematic manner over the average remaining service period of participants for our active plans or the averageremaining lifetime of participants for our inactive plans.
We present the service cost component of net periodic benefit cost in cost of revenues and selling, administrative andgeneral expense consistent with employee compensation costs. The other components of net periodic benefit cost arereported within other nonoperating income in our accompanying Condensed Consolidated Statements of ComprehensiveIncome.
For additional information about pension and other postretirement benefits see Note 10.
INCOME TAXESAAIn response to the COVID-19 pandemic, the Coronavirus Aid, Relief, and Economic Security Act (CARES Act) was signedinto law in March 2020. The CARES Act provides numerous tax relief provisions and stimulus measures. A temporaryfavorable change to the prior year and current year limitations on interest deductions and a temporary suspension of certainpayment requirements for the employer portion of Social Security taxes are the relief provisions that are expected to provideus the greatest benefit. In the first quarter of 2020, an expected cash tax benefit of $13,301,000 was recorded to account forthe favorable change to the prior year limitation on interest deductions.
We file federal, state and foreign income tax returns and account for the current and deferred tax effeff cts of such returnsusing the asset and liability method. We recognize deferred tax assets and liabilities (which reflect our best assessment ofthe future taxes we will pay) based on the differences between the book basis and tax basis of assets and liabilities.Deferred tax assets represent items to be used as a tax deduction or credit in future tax returns while deferred tax liabilitiesrepresent items that will result in additional tax in future tax returns.
Significant judgments and estimates are required in determining our deferred tax assets and liabilities. These estimates areupdated throughout the year to consider income tax return filings, our geographic mix of earnings, legislative changes andother relevant items. We are required to account for the effeff cts of changes in income tax rates on deferred tax balances inthe period in which the legislation is enacted.
Each quarter we analyze the likelihood that our deferred tax assets will be realized. Realization of the deferred tax assetsultimately depends on the existence of sufficient taxable income of the appropriate character in either the carryback orcarryforward period. A valuation allowance is recorded if, based on the weight of all available positive and negativeevidence, it is more likely than not (a likelihood of more than 50%) that some portion, or all, of a deferred tax asset will notbe realized. A summary of our deferred tax assets is included in Note 9.

Part II 84
We recognize a tax benefit associated with a tax position when, in our judgment, it is more likely than not that the positionwill be sustained based upon the technical merits of the position. For a tax position that meets the more likely than notrecognition threshold, we measure the income tax benefit as the largest amount that we judge to have a greater than 50%likelihood of being realized. A liability is established for the unrecognized portion of any tax position. Our liability forunrecognized tax benefits is adjusted periodically due to changing circumstances, such as the progress of tax audits, caselaw developments and new or emerging legislation.
Generally, we are not subject to significant changes in income taxes by any taxing jurisdiction for the years before 2017.While it is ofteff n difficult to predict the final outcome or the timing of resolution of any particular tax matter, we believe ourliability for unrecognized tax benefits is appropriate.
;� ������� �� �������� �� �� ��� +�� � ��� � �� �� ��� ����� ����� ��������+� � ���� ���� ���� ����� �� � �������on,or the expiration of the statute of limitations. Upon resolution of a tax position, any liability for unrecognized tax benefits willbe released.
Our liability for unrecognized tax benefits is generally presented as noncurrent. However, if we anticipate paying cash withinone year to settle an uncertain tax position, the liability is presented as current. We classify interest and penalties associatedwith our liability for unrecognized tax benefits as income tax expense.
Our largest permanent item in computing both our taxable income and effeff ctive tax rate is the deduction allowed forstatutory depletion. The impact of statutory depletion on the effeff ctive tax rate is presented in Note 9. The deduction forstatutory depletion does not necessarily change proportionately to changes in pretax earnings.
COMPREHENSIVE INCOMEWe report comprehensive income in our Consolidated Statements of Comprehensive Income and Consolidated Statementsof Equity. Comprehensive income comprises two subsets: net earnings and other comprehensive income (OCI). OCIincludes adjustments to cash flow hedges, as well as actuarial gains or losses and prior service costs related to pension andpostretirement benefit plans.
For additional information about comprehensive income see Note 14.
EARNINGS PER SHARE (EPS)Earnings per share are computed by dividing net earnings by the weighted-average common shares outstanding (basicEPS) or weighted-average common shares outstanding assuming dilution (diluted EPS), as set forth below:
in thousandsdd 2020 2019 2018
Weighted-average common shares outstanding 132,578 132,300 132,393Dilutive effect ofSOSARs 307 611 963Other stock compensation plans 360 474 570
Weighted-average common shares outstanding,assuming dilution 133,245 133,385 133,926
All dilutive common stock equivalents are reflected in our earnings per share calculations. In periods of loss, shares thatotherwise would have been included in our diluted weighted-average common shares outstanding computation would beexcluded.
Antidilutive common stock equivalents are not included in our earnings per share calculations. The number of antidilutivecommon stock equivalents for which the exercise price exceeds the weighted-average market price for the years endedDecember 31 is as follows:
in thousandsdd 2020 2019 2018
Antidilutive common stock equivalents 101 105 162
RECLASSIFICATIONSCertain items previously reported in specific financial statement captions have been reclassified to conform to the 2020presentation.

Part II 85
NEW ACCOUNTING STANDARDS
ACCOUNTING STANDARDS RECENTLY ADOPTEDDEFINED BENEFIT PLANS During the fourth quarter of 2020, we adopted Accounting Standards Update (ASU) 2018-14,�#����� �� ��� &��� ���� ��%�������� �� &������ B������ � ���� =��� '�) ����� ���+�� �� � ����� ��� ���� ����requirements for employers that sponsor defined benefit pension and other postretirement benefit plans. As a result of thisupdate, we modified our annual disclosure regarding our benefit plans as reflected in Note 10.
CREDIT LOSSES During the first quarter of 2020, we adopted ASU 2016-./� �!�������� �� #���� 0����� �� (����� -���������� �� ���������+� ����� =��� '�) ������ ��� ������� �� ��� �������� �� ������al instruments. Thenew guidance estimates credit losses based on expected losses, modifies the impairment model for available-for-sale debtsecurities and provides for a simplified accounting model for purchased financial assets with credit deterioration. Theadoption of this standard did not materially impact our consolidated financial statements.
LIBOR TRANSITION In March 2020, the Financial Accounting Standards Board (FASB) issued ASU 2020-04, "ReferenceRate Reform (Topic 848): Facilitation of the Effeff cts of Reference Rate Reform on Financial Reporting," which providedoptional expedients and exceptions for applying GAAP to contract modifications and hedging relationships that referenceLIBOR or another reference rate expected to be discontinued. The ASU was effeff ctive immediately for all entities and appliesthrough December 31, 2022. For additional information, see our LIBOR transition disclosure in Item 7, "Management'sDiscussion and Analysis of Financial Condition and Results of Operations" under "Liquidity and Financial Resources - Debt."We continue to evaluate the effeff ct that discontinuance of LIBOR will have on our contracts.
ACCOUNTING STANDARDS PENDING ADOPTIONCONVERTIBLE INSTRUMENTS In August 2020, the FASB issued ASU 2020-6F� �'��������� ��r Convertible Instruments�� #������ �� � $������� 2�� $%������ ����� ������ ��� ����� �� ���� � ���� �� ������ �� ���+���� � ����������and modifies the diluted earnings per share calculations for convertible instruments. This ASU also amends the accounting�� ����� ������� �� � �������� ��� �%���� ��� � ����� � �������� �� � ���+��+�� =�� ��� ����� �� ������ ���+� asof January 1, 2022 with early adoption permitted, but no earlier than January 1, 2021. We plan to early adopt this standardas of January 1, 2021. We do not currently have any instruments or contracts that will be impacted by the new standard.
INCOME TAXES In December 2019, the FASB issued ASU 2019-.4� ����� ������ ��� '��������� �� -����� =����� �����adds new guidance to simplifyff the accounting for income taxes and changes the accounting for certain income taxtransactions. The new standard is effeff ctive as of January 1, 2021. We do not expect this standard to have a material impacton our consolidated financial statements.
NOTE 2: REVENUESRevenues are measured as the amount of consideration we expect to receive in exchange for transferring goods orproviding services. Sales and other taxes we collect are excluded from revenues. Costs to obtain and fulfill contracts(primarily asphalt construction paving contracts) are immaterial and are expensed as incurred when the expectedamortization period is one year or less.
Total revenues are primarily derived from our product sales of aggregates (crushed stone, sand and gravel, sand and otheraggregates), asphalt mix and ready-mixed concrete, and include freight & delivery costs that we pass along to ourcustomers to deliver these products. We also generate service revenues from our asphalt construction paving business andservice revenues related to our aggregates business, such as landfill tipping fees. Our total service revenues were asfollows: 2020 $214,343,000, 2019 $234,099,000 and 2018 $198,897,000.

Part II 86
Our products typically are sold to private industry and not directly to governmental entities. Although approximately 45% to55% of our aggregates shipments have historically been used in publicly-funded construction, such as highways, airportsand government buildings, relatively insignificant sales are made directly to federal, state, county or municipalgovernments/agencies. Therefore, although reductions in state and federal funding can curtail publicly-funded construction,the vast majoa rity of our aggregates business is not directly subject to renegotiation of profits or termination of contracts withstate or federal governments.
Our segment total revenues by geographic market for the years ended December 31, 2020, 2019 and 2018 aredisaggregated as follows:
For the Year Ended December 31, 2020in thousandsdd Aggregates Asphals t Concrete Calcium Total
Total Revenues by Geographic Market 1East $ 1,198,169 $ 142,184 $ 263,661 $ 0 $ 1,604,014Gulf Coast 2,165,155 178,501 71,149 7,720 2,422,525West 580,962 471,920 48,807 0 1,101,689Segment sales $ 3,944,286 $ 792,605 $ 383,617 $ 7,720 $ 5,128,228Intersegment sales (271,402) 0 0 0 (271,402)Total revenues $ 3,672,884 $ 792,605 $ 383,617 $ 7,720 $ 4,856,826
For the Year Ended December 31, 2019in thousandsdd Aggregates Asphals t Concrete Calcium Total
Total Revenues by Geographic Market 1East $ 1,254,748 $ 166,552 $ 261,249 $ 0 $ 1,682,549Gulf Coast 2,117,526 194,367 66,628 8,191 2,386,712West 618,001 494,902 67,750 0 1,180,653Segment sales $ 3,990,275 $ 855,821 $ 395,627 $ 8,191 $ 5,249,914Intersegment sales (320,811) 0 0 0 (320,811)Total revenues $ 3,669,464 $ 855,821 $ 395,627 $ 8,191 $ 4,929,103
For the Year Ended December 31, 2018in thousandsdd Aggregates Asphals t Concrete Calcium Total
Total Revenues by Geographic Market 1East $ 1,109,489 $ 156,591 $ 257,250 $ 0 $ 1,523,330Gulf Coast 1,821,853 131,745 71,739 8,110 2,033,447West 582,307 444,846 73,010 0 1,100,163Segment sales $ 3,513,649 $ 733,182 $ 401,999 $ 8,110 $ 4,656,940Intersegment sales (274,071) 0 0 0 (274,071)Total revenues $ 3,239,578 $ 733,182 $ 401,999 $ 8,110 $ 4,382,8691 The geographic marketstt are definff ed by states as follows:ww
East market � Arkarr nsas, Delawarww e,rr Illinoill s,ii Kentucky,yy Marylandyy ,dd Northtt Carolinrr a, Pennsyls vania, Tennessee, Virgii inia,and Washington D.C.Gulf Coast market � Alabaml a, Florida,ll Georgia, Louisiii ana,ii Mexicoii , Missii issippi,ii Oklahomkk a, Southtt Carolrr inll a and TexasWest market � Arizrr ona,zz Califoii rnia and New Mexicoii

Part II 87
PRODUCT REVENUESRevenue is recognized when obligations under the terms of a contract with our customer are satisfied; generally this occursat a point in time when our aggregates, asphalt mix and ready-mixed concrete are shipped/delivered and control passes tothe customer. Revenue for our products is recorded at the fixed invoice amount and payment is due by the 15th day of thefollowing month� we do not offeff r discounts for early payment.
Freight & delivery generally represents pass-through transportation we incur (including our administrative costs) and pay tothird-party carriers to deliver our products to customers and are accounted for as a fulfillment activity. Likewise, the costrelated to freight & delivery are included in cost of revenues.
Freight & delivery revenues are as follows:
in thousandsdd 2020 2019 2018
Freight & Delivery RevenuesTotal revenues $ 4,856,826 $ 4,929,103 $ 4,382,869Freight & delivery revenues 1 (738,482) (747,862) (641,815)
Total revenues excluding freight & delivery $ 4,118,344 $ 4,181,241 $ 3,741,054
1 Includes freightrr & delivll eryrr to remote distrii ibutrr iontt sites.
CONSTRUCTION PAVIAA NG SERVICE REVENUESRevenue from our asphalt construction paving business is recognized over time using the percentage-of-completion methodunder the cost approach. The percentage of completion is determined by costs incurred to date as a percentage of totalcosts estimated for the project. Under this approach, recognized contract revenue equals the total estimated contractrevenue multiplied by the percentage of completion. Our construction contracts are unit priced, and an account receivable isrecorded for amounts invoiced based on actual units produced. Contract assets for estimated earnings in excess of billings,contract assets related to retainage provisions and contract liabilities for billings in excess of costs are immaterial. Variableconsideration in our construction paving contracts is immaterial and consists of incentives and penalties based on the qualityof work perfor rmed. Our construction paving contracts may contain warranty provisions covering defects in equipment,materials, design or workmanship that generally run from nine months to one year afteff r project completion. Due to thenature of our construction paving projects, including contract owner inspections of the work during construction and prior toacceptance, we have not experienced material warranty costs for these short-term warranties.
VOLUMETRIC PRODUCTION PAYMAA ENT DEFERRED REVENUESIn 2013 and 2012, we sold a percentage interest in certain future aggregates production for net cash proceeds of$226,926,000. These transactions, structured as volumetric production payments (VPPs):
� relate to eight quarries in Georgia and South Carolina
� ��+��� ��� ������ �� � � ���� ���������� �������� ������� �� ��� ���,��� %����� ����� ������� ���������
� contain no minimum annual or cumulative guarantees by us for production or sales volume, nor minimum sales price
� are both volume and time limited (we expect the transactions will last approximately 25 years, limited by volume ratherthan time)
We are the exclusive sales agent for, and transm�� %��� � �� ��� ������ ��� ������� ��� ��� � � ��� ��� ����������� �� ������� ���������� 2� ����� ����� ��� �+����� ��� ��� ��� �+���� ��� ��� � � �� ��� �������� ���of aggregates.
The proceeds we received from the sale of the percentage interest were recorded as deferred revenue on the balancesheet. We recognize revenue on a unit-of-� �� ���� �� �� �� ��� �������� ��� �� ���������> � ��+� �� ��� +� ���limitations of the transactions. Given the nature of the risks and potential rewards assumed by the buyer, the transactions donot reflect financing activities.

Part II 88
Reconciliation of the VPP deferred revenue balances (current and noncurrent) is as follows:
in thousandsdd 2020 2019 2018
Deferred RevenueBalance at beginning of year $ 185,339 $ 192,783 $ 199,556Revenue recognized from deferred revenue (7,377) (7,444) (6,773)Balance at end of year $ 177,962 $ 185,339 $ 192,783
Based on expected sales from the specified quarries, we expect to recognize $7,500,000 of VPP deferred revenue asincome in 2021 (reflected in other current liabilities in our December 31, 2020 Consolidated Balance Sheet).
NOTE 3: INVENTORIESInventories at December 31 are as follows:
in thousandsdd 2020 2019
InventoriesFinished products 1 $ 378,389 $ 391,666Raw materials 33,780 31,318Products in process 4,555 5,604Operating supplies and other 31,861 29,720Total $ 448,585 $ 458,308
1 Includes inventories encumbered by volumetricrr production paymeyy nts (see Note 2), as follows:ww December 31, 2020 � $2,416thousand and December 31, 2019 � $2,82 61 thousand.
In addition to the inventory balances presented above, as of December 31, 2020 and December 31, 2019, we have$10,978,000 and $7,557,000, respectively, of inventory classified as long-term assets (other noncurrent assets) as we donot expect to sell the inventory within one year of their respective balance sheet dates.
We use the LIFO method of valuation for most of our inventories as it results in a better matching of costs with revenues.Inventories valued under the LIFO method total $307,656,000 at December 31, 2020 and $309,429,000 at December 31,2019. During 2020, 2019 and 2018, inventory reductions resulted in liquidations of LIFO inventory layers carried at costsprevailing in prior years as compared to current-year costs. The effeff ct of the LIFO liquidation on 2020 results was todecrease cost of revenues by $867,000 and increase net earnings by $646,000. The effeff ct of the LIFO liquidation on 2019results was to decrease cost of revenues by $1,147,000 and increase net earnings by $854,000. The effeff ct of the LIFOliquidation on 2018 results was to increase cost of revenues by $132,000 and decrease net earnings by $99,000.
Estimated current cost exceeded LIFO cost at December 31, 2020 and 2019 by $192,974,000 and $183,181,000,respectively. In periods of increasing costs, LIFO generally results in higher cost of revenues than under FIFO. In periods ofdecreasing costs, the results are generally the opposite. We provide supplemental income disclosures to facilitatecomparisons with companies not on LIFO. The supplemental income calculation is derived by tax-affecting the change in theLIFO reserve for the periods presented. If all inventories valued at LIFO cost had been valued under first-in, first-out (FIFO)method, the approximate effeff ct on net earnings would have been an increase of $7,292,000 in 2020, an increase of$5,462,000 in 2019 and an increase of $5,223,000 in 2018.

Part II 89
NOTE 4: PROPERTY, PLANT & EQUIPMENTBalances of majoa r classes of assets and allowances for depreciation, depletion and amortization at December 31 are asfollows:
in thousandsdd 2020 2019
Property, Plant & EquipmentLand and land improvements 1 $ 3,013,327 $ 2,920,963Buildings 145,418 141,898Machinery and equipment 5,517,897 5,362,279Finance leases (see Note 7) 7,796 1,677Deferred asset retirement costs (see Note 17) 240,743 167,484Construction in progress 176,905 154,917
Total, gross $ 9,102,086 $ 8,749,218
Less allowances for depreciation, depletionand amortizrr ation 4,676,087 4,433,180Total, net $ 4,425,999 $ 4,316,038
1 Includes depletable land as follows:ww December 31, 2020 � $1,712,059 thousand and December 31, 2019 � $1,667,677 42thousand.
Capitalized interest costs with respect to qualifyiff ng construction projects and total interest costs incurred before recognitionof the capitalized amount for the years ended December 31 are as follows:
in thousandsdd 2020 2019 2018
Capitalized interest cost $ 3,487 $ 3,896 $ 3,674Total interest cost incurred beforeff recognitionof the capitalized amount 139,447 134,051 141,651
NOTE 5: DERIVATIVE INSTRUMENTSDuring the normal course of operations, we are exposed to market risks including interest rates, foreign currency exchangerates and commodity prices. From time to time, and consistent with our risk management policies, we use derivativeinstruments to balance the cost and risk of such expenses. We do not use derivative instruments for trading or otherspeculative purposes.
In February 2020, we entered into interest rate locks of a future debt issuance to hedge the risk of higher interest rates.These interest rate locks were designated as cash flow hedges. Consistent with their terms, we settled the interest rate locksin March 2020 for a cash payment of $19,863,000. Given that the related debt issuance at the end of the first quarter: a) wasnot executed, b) remained probable in the near term and c) had uncertain timing, 1/20th of the hedge was deemed ineffeff ctiveand $993,000 of the settlement was recorded to interest expense in the first quarter. The remainder of the settlement wasdeferred and recorded in AOCI. In May 2020, we issued the related debt in the form of $750,000,000 of 3.50% 10-yearnotes. The deferred hedge settlement amount in AOCI is amortized to interest expense over the term of the related debt.
In 2007 and 2018, we entered into interest rate locks of future debt issuances to hedge the risk of higher interest rates.These interest rate locks were designated as cash flow hedges. The gain/loss upon settlement of these interest rate hedgesis deferred (recorded in AOCI) and amortized to interest expense over the term of the related debt.
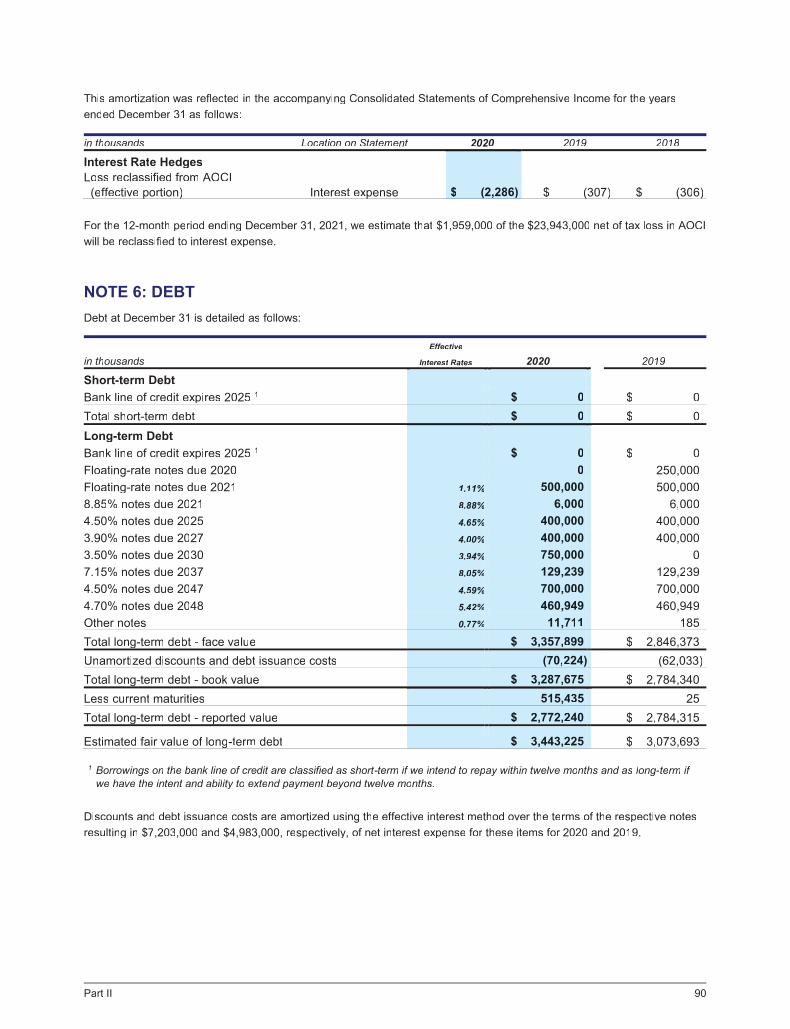
Part II 90
This amortization was reflected in the accompanying Consolidated Statements of Comprehensive Income for the yearsended December 31 as follows:
in thousandsdd Locationtt on Statement 2020 2019 2018
Interest Rate HedgesLoss reclassified from AOCI(effective portion) Interest expense $ (2,286) $ (307) $ (306)( ) ( )) ( ))
For the 12-month period ending December 31, 2021, we estimate that $1,959,000 of the $23,943,000 net of tax loss in AOCIwill be reclassified to interest expense.
NOTE 6: DEBTDebt at December 31 is detailed as follows:
Effectivff evv
in thousandsdd Interestrr Rates 2020 2019
Short-term DebtBank line of credit expires 2025 1 $ 0 $ 0Total short-term debt $ 0 $ 0Long-term DebtBank line of credit expires 2025 1 $ 0 $ 0Floating-rate notes due 2020 0 250,000Floating-rate notes due 2021 1.11% 500,000 500,0008.85% notes due 2021 8.88% 6,000 6,0004.50% notes due 2025 4.65% 400,000 400,0003.90% notes due 2027 4.00% 400,000 400,0003.50% notes due 2030 3.94% 750,000 07.15% notes due 2037 8.05% 129,239 129,2394.50% notes due 2047 4.59% 700,000 700,0004.70% notes due 2048 5.42% 460,949 460,949Other notes 0.77% 11,711 185Total long-term debt - face value $ 3,357,899 $ 2,846,373Unamortized discounts and debt issuance costs (70,224) (62,033)Total long-term debt - book value $ 3,287,675 $ 2,784,340Less current maturities 515,435 25Total long-term debt - reported value $ 2,772,240 $ 2,784,315
Estimated fair value of long-term debt $ 3,443,225 $ 3,073,693g
1 Borrowingww s on the bank lineii of credrr itdd are classifiii ed as short-term ifii we intii end to repay within twelve monthstt and as long-term ifwe have the intent and abilityll to extend paymeyy nt beyond twelve monthstt .
Discounts and debt issuance costs are amortized using the effeff ctive interest method over the terms of the respective notesresulting in $7,203,000 and $4,983,000, respectively, of net interest expense for these items for 2020 and 2019.

Part II 91
LINE OF CREDITIn September 2020, we executed a new five-year unsecured line of credit of $1,000,000,000, incurring $4,632,000 oftransaction costs. The line of credit contains affiff rmative, negative and financial covenants customary for an unsecuredinvestment-grade facility. There are two primary negative covenants: 1) a limit on our ability to incur secured debt, and 2) amaximum ratio of debt to EBITDA of 3.50:1 (upon certain acquisitions, the maximum ratio can be 3.75:1 for four quarters).As of December 31, 2020, we were in compliance with the line of credit covenants.
Borrowings on our line of credit are classified as short-term if we intend to repay within twelve months and as long-term if wehave the intent and ability to extend repayment beyond twelve months. Borrowings bear interest, at our option, at eitherLIBOR plus a credit margin ranging from 1.125% to 1.875%� � =���� B�"�� ��� �� ����� �� ��� ���� ��> � �� credit margin ranging from 0.125% to 0.875%. The credit margin for both LIBOR and base rate borrowings is determined byour credit ratings. Standby letters of credit, which are issued under the line of credit and reduce availability, are charged afee equal to the credit margin for LIBOR borrowings plus 0.175%. We also pay a commitment fee on the daily averageunused amount of the line of credit that ranges from 0.125% to 0.275% determined by our credit ratings. As of December31, 2020, the credit margin for LIBOR borrowings was 1.250%, the credit margin for base rate borrowings was 0.250%, andthe commitment fee for the unused amount was 0.150%.
In September 2020, we terminated our $750,000,000 364-day delayed draw term loan executed in April 2020. During thesecond quarter, we had borrowed and repaid $250,000,000 on this delayed draw term loan leaving $500,000,000 availablefor future borrowings prior to its termination.
As of December 31, 2020, our available borrowing capacity under the line of credit was $943,920,000. Utilization of theborrowing capacity was as follows:
� none was borrowed
� $56,080,000 was used to provide support for outstanding standby letters of credit
TERM DEBTAll of our $3,357,899,000 (face value) of term debt is unsecured. $3,346,188,000 of such debt is governed by threeessentially identical indentures that contain customary investment-grade type covenants. The primary covenant in all threeindentures limits the amount of secured debt we may incur without ratably securing such debt. As of December 31, 2020, wewere in compliance with all term debt covenants.
In May 2020, we issued $750,000,000 of 3.50% senior notes due 2030. Total proceeds were $741,417,000 (net of discountsand transaction costs). $250,000,000 of the proceeds were used to retire the $250,000,000 floating rate notes due June2020, and the remainder of the proceeds, together with cash on hand, will be used to retire the $500,000,000 floating ratenotes due March 2021.
In 2018, we completed a number of financing activities resulting in gross proceeds of $850,000,000 and payments of$892,055,000. As a result of these activities, we recognized premiums of $5,608,000, transaction costs of $1,314,000 andnoncash expense (acceleration of unamortized deferred transaction costs) of $466,000. The combined charge of $7,388,000was a component of interest expense for the year ended December 31, 2018.

Part II 92
The total scheduled (principal and interest) debt payments, excluding the line of credit, for the five years subsequent toDecember 31, 2020 are as follows:
in thousandsdd Total Princii ipal Interest
Scheduled Debt Payments (excluding the line of credit)2021 $ 639,303 $ 515,435 $ 123,8682022 122,720 457 122,2632023 122,720 459 122,2612024 122,720 461 122,2592025 513,720 400,463 113,257
STANDBY LETTERS OF CREDITWe provide, in the normal course of business, certain third-party beneficiaries with standby letters of credit to support ourobligations to pay or perfor rm according to the requirements of an underlying agreement. Such letters of credit typically havean initial term of one year, typically renew automatically, and can only be modified or canceled with the approval of thebeneficiary. All of our standby letters of credit are issued by banks that participate in our $1,000,000,000 line of credit andreduce the borrowing capacity thereunder. Our standby letters of credit as of December 31, 2020 are summarized bypurpose in the table below:
in thousandsdd
Standby Letters of CreditRisk management insurance $ 48,982Reclamation/restoration requirements 7,098Total $ 56,080

Part II 93
NOTE 7: LEASESOur portfolio of nonmineral leases is composed of leases for real estate (including offiff ce buildings, aggregates sales yards,and concrete and asphalt sites) and equipment (including railcars and rail track, barges, offiff ce equipment and plantequipment).
Lease right-of-use (ROU) assets and liabilities reflected on our December 31 balance sheets and the weighted-averagelease term and discount rate are as follows:
in thousandsdd Classifiii caii tion on the Balance Sheet 2020 2019
AssetsOperating lease ROU assets Operating lease right-of-use assets, net $ 482,513 $ 441,656Accumulated amortization (59,385) (33,467)Finance lease assets Property, plant & equipment, net 7,796 1,226Accumulated amortization (1,640) (65)Total lease assets $ 429,284 $ 409,350LiabilitiesCurrentOperating Other current liabilities $ 36,969 $ 29,971Finance Other current liabilities 2,047 430NoncurrentOperating Operating lease liabilities 399,582 388,042Finance Other noncurrent liabilities 4,139 733Total lease liabilities $ 442,737 $ 419,176Lease Term and Discount RateWeighted-average remaining lease term (years)Operating leases 9.5 9.9Finance leases 4.2 2.8Weighted-average discount rateOperating leases 3.6% 4.3%Finance leases 1.4% 3.0%
Our building leases have remaining noncancelable periods of 0 - 7 years and lease terms (including options to extend) of 0 -26 years. Key factors in determining the certainty of lease renewals include the location of the building, the value ofleasehold improvements and the cost to relocate. Rental payments for certain of our building leases are periodicallyadjusted for inflation, and this variable component is recognized as expense when incurred. Many of our building leasescontain common area maintenance charges which we include in the calculation of our lease liability (the lease considerationis not allocated between the lease and non-lease components).
Our aggregates sales yard leases have remaining noncancelable periods of 0 - 28 years and lease terms of 0 - 78 years.The key factor in determining the certainty of lease renewals is the financial impact of extending the lease, including thereserve life of the sourcing aggregates quarry. Certain aggregates sales yard lease agreements include rental paymentsbased on a percentage of sales over contractual levels or the number of shipments received into the sales yard. Variablepayments for these sales yards comprise a majora ity of the overall variable lease cost presented in the table below.
Our concrete and asphalt site leases have remaining noncancelable periods of 0 - 19 years and lease terms of 1 - 78 years.The key factor in determining the certainty of lease renewals is the financial impact of extending the lease, including thereserve life of the sourcing aggregates quarry. Rental payments are generally fixed for our concrete and asphalt sites.
Our rail (car and track) leases have remaining noncancelable periods of 0 - 4 years and lease terms of 2 - 64 years. Keyfactors in determining the certainty of lease renewals include the market rental rate for comparable assets and, in somecases, the cost incurred to restore the asset. Rental payments are fixed for our rail leases. The majoa rity of our rail leasescontain substitution rights that allow the supplier to replace damaged equipment. Because these rights are generally limitedto either replacing railcars or moving our placement on rail track for purposes of repair or maintenance, we do not considerthese substitution rights to be substantive and have recorded a lease liability and ROU asset for all leased rail.

Part II 94
Our barge leases have remaining noncancelable periods of 0 - 1 years and lease terms of 0 - 14 years. Key factors indetermining the certainty of lease renewals include the market rental rate for comparable assets and, in some cases, thecost incurred to restore the asset. Rental payments are fixed. Like our rail leases, our barge leases contain non-substantivesubstitution rights that are limited to replacing barges in need of repair or maintenance.
Offiff ce and plant equipment leases have remaining noncancelable periods of 0 - 5 years and lease terms of 0 - 5 years. Thekey factor in determining the certainty of lease renewals is the market rental rate for comparable assets. Rental paymentsare generally fixed for our equipment leases with terms greater than 1 year. The significant majoa rity of our short-term leasecost presented in the table below is derived from offiff ce and plant equipment leases with terms of 1 year or less.
Our lease agreements do not contain residual value guarantees, restrictive covenants or early termination options that wedeem material. We have not sought or been granted any material lease concessions as a result of the COVID-19 pandemic.
The components of lease expense for the years ended December 31, 2020 and 2019 are as follows:
in thousandsdd 2020 2019
Lease CostFinance lease costAmortization of right-of-use assets $ 1,616 $ 64Interest on lease liabilities (102) (4)Operating lease cost 58,489 56,546Short-term lease cost 1 30,508 35,427Variable lease cost 12,885 13,739Sublease income (2,682) (3,108)Total lease cost $ 100,714 $ 102,664
1 Our short-term leases cost includes the cost of leases with an initii alii term of one monthtt or less.
Total lease expense for the year ended December 31, 2018 was $131,015,000.
Cash paid for operating leases was $54,871,000 for 2020 and $52,660,000 for 2019. Cash paid for finance leases was$102,000 for 2020 and $4,000 for 2019.
Maturity analysis on an undiscounted basis of our lease liabilities (see Note 12 for mineral lease payments) as of December31, 2020 is as follows:
Operatingii Financii ein thousandsdd Leases Leases
Maturity of Lease Liabilities2021 $ 54,733 $ 2,1342022 48,225 1,9862023 41,206 1,0582024 36,141 7792025 36,375 349Thereafter 565,042 50Total minimum lease payments $ 781,722 $ 6,356Less: Lease payments representing interest 345,171 170Present value of future minimum lease payments $ 436,551 $ 6,186Less: Current obligations under leases 36,969 2,047Long-term lease obligations $ 399,582 $ 4,139

Part II 95
NOTE 8: ACCRUED ENVIRONMENTAL REMEDIATION COSTSOur Consolidated Balance Sheets as of December 31 include accrued environmental remediation costs (measured on anundiscounted basis) as follows:
in thousandsdd 2020 2019
Accrued Environmental Remediation CostsContinuing operations $ 25,544 $ 30,429Retained from former Chemicals business 10,971 10,972Total $ 36,515 $ 41,401
The long-term portion of the accruals noted above is included in other noncurrent liabilities in the accompanyingConsolidated Balance Sheets and amounted to $12,943,000 at December 31, 2020 and $13,567,000 at December 31,2019. The short-term portion of these accruals is included in other current liabilities in the accompanying ConsolidatedBalance Sheets.
The accrued environmental remediation costs in continuing operations relate primarily to the former Florida Rock, Tarmac,and CalMat facilities acquired in 2007, 2000 and 1999, respectively. The balances noted above for the former Chemicalsbusiness relate to retained environmental remediation costs from the 2003 sale of the Perfor rmance Chemicals business andthe 2005 sale of the Chloralkali business. Refer to Note 12 for additional discussion of contingent environmental matters.
NOTE 9: INCOME TAXESThe components of earnings from continuing operations before income taxes are as follows:
in thousandsdd 2020 2019 2018
Earnings from Continuing Operationsbefore Income TaxesDomestic $ 732,971 $ 734,025 $ 593,446Foreign 10,827 23,676 29,844Total $ 743,798 $ 757,701 $ 623,290
Income tax expense (benefit) from continuing operations consists of the following:
in thousandsdd 2020 2019 2018
Income Tax Expense (Benefit) fromContinuing OperationsCurrentFederal $ 69,180 $ 31,234 $ 21,111State and local 23,826 24,403 15,127Foreign 942 3,304 4,278Total $ 93,948 $ 58,941 $ 40,516DeferredFederal $ 50,890 $ 67,810 $ 59,216State and local 10,798 8,660 8,369Foreign 167 (213) (2,652)Total $ 61,855 $ 76,257 $ 64,933Total expense $ 155,803 $ 135,198 $ 105,449

Part II 96
Income tax expense (benefit) differs from the amount computed by applying the federal statutory income tax rate to earningsfrom continuing operations before income taxes. The sources and tax effeff cts of the differences are as follows:
dollall rs in thousands 2020 2019 2018
Income tax expense at the federalstatutory tax rate $ 156,198 21.0% $ 159,117 21.0% $ 130,891 21.0%Expense (Benefit) fromIncome Tax DifferencesStatutory depletion (24,728) -3.3% (23,006) -3.0% (21,733) -3.5%State and local income taxes, net of federalincome tax benefit 27,352 3.7% 26,119 3.4% 18,562 3.0%Share-based compensation (6,877) -0.9% (17,277) -2.3% (16,551) -2.7%Uncertain tax positions 1,380 0.2% 1,822 0.2% (6,402) -1.0%Transition tax 0 0.0% 0 0.0% 595 0.1%Research and development credit (2,650) -0.4% (9,490) -1.3% 0 0.0%Other, net 5,128 0.6% (2,087) -0.2% 87 0.0%Total income tax expense/Effecff tive tax rate $ 155,803 20.9% $ 135,198 17.8% $ 105,449 16.9%
Deferred taxes on the balance sheet result from temporary diffeff rences between the amount of assets and liabilitiesrecognized for financial reporting and tax purposes. The components of the net deferred income tax liability at December 31are as follows:
in thousandsdd 2020 2019
Deferred Tax Assets Related toEmployee benefits $ 21,874 $ 29,996Incentive compensation 58,194 66,488Asset retirement obligations & other reserves 58,327 55,033State net operating losses 67,756 67,354Other 25,362 44,169Total gross deferred tax assets $ 231,513 $ 263,040Valuation allowance (32,512) (29,650)Total net deferred tax asset $ 199,001 $ 233,390Deferred Tax Liabilities Related toProperty, plant & equipment $ 622,897 $ 590,075Goodwill/other intangible assets 252,209 238,712Other 29,945 37,642Total deferred tax liabilities $ 905,051 $ 866,429Net deferred tax liability $ 706,050 $ 633,039
Each quarter we analyze the likelihood that our deferred tax assets will be realized. A valuation allowance is recorded if,based on the weight of all available positive and negative evidence, it is more likely than not (a likelihood of more than 50%)that some portion, or all, of a deferred tax asset will not be realized. At December 31, 2020, we have Alabama state netoperating loss (NOL) carryforwarrr d deferred tax assets of $64,307,000, against which we have a valuation allowance of$29,236,000. Almost all of the Alabama NOL carryforward would expire between 2023 and 2029 if not utilized.
In February 2021, the Alabama Business Competitiveness Act (the Act) was signed into law. This Act contained a provisionthat requires most taxpayers to change from a three-factor, double-weighted sales method to a single-sales factor method toapportion income to Alabama. This provision was effeff ctive as of January 1, 2021 and likely will result in a substantialreduction in our apportionment of income to Alabama; thereby, further inhibiting our ability to utilize our Alabama NOLcarryforward. In the first quarter of 2021, we will assess the impact of the Act to our Alabama NOL carryforwarr rd and adjustour valuation allowance accordingly.
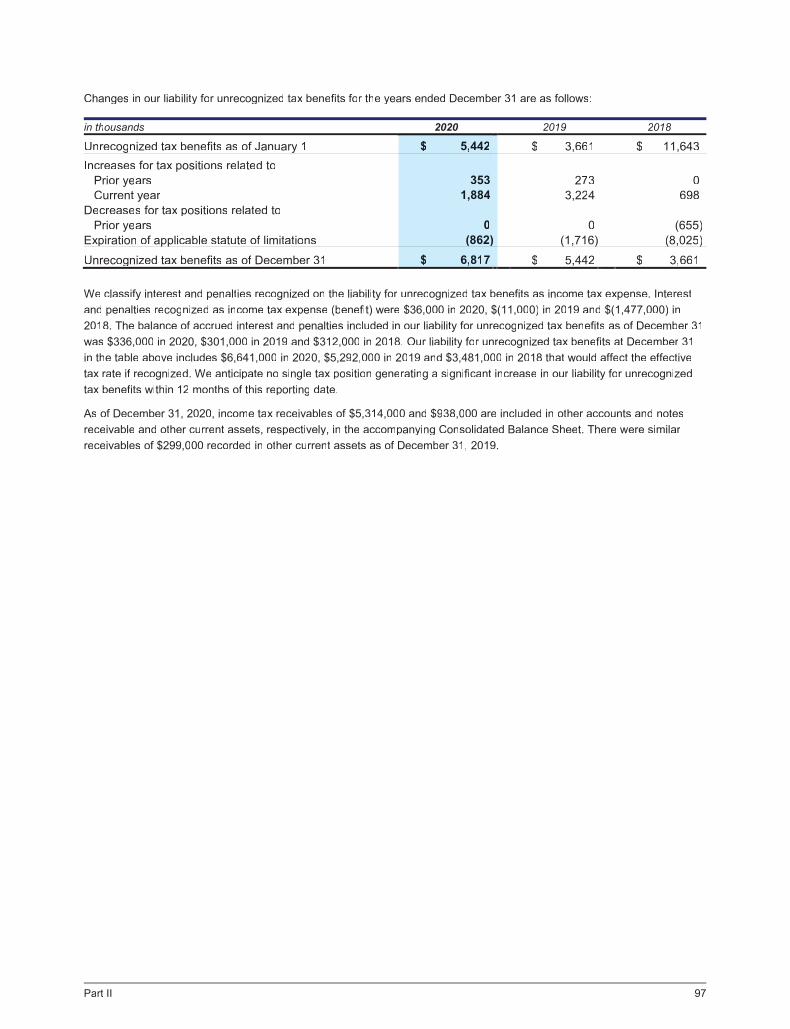
Part II 97
Changes in our liability for unrecognized tax benefits for the years ended December 31 are as follows:
in thousandsdd 2020 2019 2018
Unrecognized tax benefits as of January 1 $ 5,442 $ 3,661 $ 11,643Increases for tax positions related toPrior years 353 273 0Current year 1,884 3,224 698
Decreases for tax positions related toPrior years 0 0 (655)
Expiration of applicable statute of limitations (862) (1,716) (8,025)
Unrecognized tax benefits as of December 31 $ 6,817 $ 5,442 $ 3,661
We classifyff interest and penalties recognized on the liability for unrecognized tax benefits as income tax expense. Interestand penalties recognized as income tax expense (benefit) were $36,000 in 2020, $(11,000) in 2019 and $(1,477,000) in2018. The balance of accrued interest and penalties included in our liability for unrecognized tax benefits as of December 31was $336,000 in 2020, $301,000 in 2019 and $312,000 in 2018. Our liability for unrecognized tax benefits at December 31in the table above includes $6,641,000 in 2020, $5,292,000 in 2019 and $3,481,000 in 2018 that would affeff ct the effeff ctivetax rate if recognized. We anticipate no single tax position generating a significant increase in our liability for unrecognizedtax benefits within 12 months of this reporting date.
As of December 31, 2020, income tax receivables of $5,314,000 and $938,000 are included in other accounts and notesreceivable and other current assets, respectively, in the accompanying Consolidated Balance Sheet. There were similarreceivables of $299,000 recorded in other current assets as of December 31, 2019.

Part II 98
NOTE 10: BENEFIT PLANS
PENSION PLANSWe sponsor two qualified, noncontributory defined benefit pension plans, the Vulcan Materials Company Pension Plan(VMC Pension Plan) and the CMG Hourly Pension Plan (CMG Pension Plan). The VMC Pension Plan has been closed tonew entrants since 2007 and benefit accruals, based on salaries or wages and years of service, ceased in 2005 for hourlyparticipants and 2013 for salaried participants. The CMG Pension Plan is closed to new entrants other than through onesmall union and benefits continue to accrue equal to a flat dollar amount for each year of service.
In addition to these qualified plans, we sponsor three unfunded, nonqualified pension plans. The projected benefit obligationpresented in the table below includes $67,241,000 and $70,298,000 related to these unfunded, nonqualified pension plansfor 2020 and 2019, respectively.
At November 30, 2020, the plans were remeasured to reflect settlement accounting for the CMG Pension Plan and the VMCPension Plan as a result of voluntary lump sum distributions to certain fully vested plan participants.
The following table sets forth the combined funded status of the plans and their reconciliation with the related amountsrecognized in our consolidated financial statements at December 31:
in thousandsdd 2020 2019
Change in Benefit ObligationProjeco ted benefit obligation at beginning of year $ 1,090,893 $ 958,936Service cost 4,899 4,995Interest cost 29,335 37,640Actuarial loss 89,109 141,922Benefits paid (154,691) (52,600)Projeo cted benefit obligation at end of year $ 1,059,545 $ 1,090,893Change in Fair Value of Plan AssetsFair value of assets at beginning of year $ 949,007 $ 836,770Actual return on plan assets 141,155 155,955Employer contribution 8,819 8,882Benefits paid (154,691) (52,600)Fair value of assets at end of year $ 944,290 $ 949,007Funded status (115,255) (141,886)Net amount recognized $ (115,255) $ (141,886)Amounts Recognized in the ConsolidatedBalance SheetsNoncurrent assets $ 0 $ 9,056Current liabilities (8,060) (8,579)Noncurrent liabilities (107,195) (142,363)Net amount recognized $ (115,255) $ (141,886)Amounts Recognized in AccumulatedOther Comprehensive IncomeNet actuarial loss $ 230,452 $ 268,483Prior service cost 5,148 6,488Total amount recognized $ 235,600 $ 274,971

Part II 99
The following table sets forth the pension plans for which their accumulated benefit obligation (ABO) or projected benefitobligation (PBO) exceeds the fair value of their respective plan assets at December 31:
in thousandsdd 2020 2019
Pension plans with ABO in excess of plan assetsAccumulated benefit obligation $ 1,058,645 $ 1,009,224Fair value of assets 944,290 858,936Pension plans with PBO in excess of plan assetsProjeco ted benefit obligation $ 1,059,545 $ 1,009,877Fair value of assets 944,290 858,936
The following table sets forth the components of net periodic benefit cost, amounts recognized in other comprehensiveincome and weighted-average assumptions of the plans at December 31:
dollall rs in thousands 2020 2019 2018
Components of Net Periodic PensionBenefit CostService cost $ 4,899 $ 4,995 $ 5,716Interest cost 29,335 37,640 35,503Expected return on plan assets (48,599) (47,751) (59,188)Settlement charge 22,740 0 0Amortization of prior service cost 1,340 1,340 1,340Amortization of actuarial loss 11,845 5,433 9,826Net periodic pension benefit cost (credit) $ 21,560 $ 1,657 $ (6,803)Changes in Plan Assets and BenefitObligations Recognized in OtherComprehensive IncomeNet actuarial loss (gain) $ (3,446) $ 33,717 $ (555)Prior service cost 0 0 0Reclassification of prior service cost (1,340) (1,340) (1,340)Reclassification of actuarial loss (34,585) (5,433) (9,826)Amount recognized in other comprehensiveincome $ (39,371) $ 26,944 $ (11,721)Amount recognized in net periodic pensionbenefit cost and other comprehensiveincome $ (17,811) $ 28,601 $ (18,524)AssumptionsWeighted-average assumptions used todetermine net periodic benefit cost foryears ended December 31Discount rate PBO 3.22% 4.39% 3.72%Discount rate service cost (12/31/19 / 11/30/20) 3.49% / 2.89% 4.59% 3.90%Discount rate interest cost 2.78% 4.02% 3.35%Expected return on plan assets (12/31/19 / 11/30/20) 5.75% / 5.25% 5.75% 7.00%Weighted-average assumptions used todetermine benefit obligation atDecember 31Discount rate 2.57% 3.28% 4.39%

Part II 100
Plan assets are invested according to an investment policy that allocates investments to return seeking assets and liability������� ����� ���� �� ��� � ��� ������ ��� ��� + �� �� �����E�B2>� At December 31, 2020 and 2019, the totalpension asset allocation was approximately 50% return seeking and 50% liability hedging. Return seeking assets includeindex and actively managed mutual funds and collective investment trusts that hold public equity securities (less than 1% ofthe � ��� ����� � �� ��+�� �%���� �� ���� ��������� +� ��+�� ���������>� 0��� ��� ������� ����� ��� ��� �����market securities, inflation linked debt securities, public corporate debt securities, and government debt securities that areactivel� ����� �� ���� ��� ������ �� ��� � ��� ��� ������
At each measurement date, we estimate the net asset values and fair values of our pension assets using various valuationtechniques. For certain investments, we use the net asset value (NAV) as a practical expedient to estimating fair value. Fairvalue is defined as the price that would be received to sell an asset or paid to transfer a liability in an orderly transactionbetween market participants. The fair value hierarchy prioritizes the inputs to valuation techniques used to measure fairvalue into three broad levels as described below:
Level 1: Quoted prices in active markets for identical assets or liabilitiesLevel 2: Inputs that are derived principally from or corroborated by observable market dataLevel 3: Inputs that are unobservable and significant to the overall fair value measurement
The fair values and net asset values of our pension plan assets at December 31, 2020 and 2019 are in the tables below.The assets in the common/collective trusts and in the private partnerships consist of both return seeking and liability hedginginvestments.
FAIR VALUE MEASUREMENTS AT DECEMBER 31, 2020
in thousandsdd Levelvv 1 Levelvv 2 Levelvv 3 Total
Asset CategoryDebt funds $ 0 $ 456,238 $ 0 $ 456,238Equity funds 16 115,779 0 115,795Investments in the fair value hierarchy $ 16 $ 572,017 $ 0 $ 572,033Interest in common/collective trusts (at NAV) 367,105Private partnerships (at NAV) 5,152Total pension plan assets $ 944,290
FAIR VALUE MEASUREMENTS AT DECEMBER 31, 2019
in thousandsdd Levelvv 1 Levelvv 2 Levelvv 3 Total
Asset CategoryDebt funds $ 0 $ 435,692 $ 0 $ 435,692Equity funds 549 120,253 0 120,802Investments in the fair value hierarchy $ 549 $ 555,945 $ 0 $ 556,494
Interest in common/collective trusts (at NAV) 387,785Private partnerships (at NAV) 4,728Total pension plan assets $ 949,007

Part II 101
The following describes the types of investments included in each asset category listed in the tables above and the valuationtechniques we used to determine the fair values or net asset values as of December 31, 2020 and 2019.
The debt funds category consists of U.S. federal, state and local government debt securities, corporate debt securities,foreign government debt securities, and asset-backed securities. The fair values of U.S. government and corporate debtsecurities are based on current market rates and credit spreads for debt securities with similar maturities. The fair values ofdebt securities issued by foreign governments are based on prices obtained from broker/drr ealers and international indices.The fair values of asset-backed securities are priced using prepayment speed and spread inputs that are sourced from thenew issue market.
The equity funds category consists of a mutual fund investing in domestic equities. For investment funds publicly traded on anational securities exchange, the fair value is based on quoted market prices. For investment funds not traded on anexchange, the total fair value of the underlying securities is used to determine the net asset value for each unit of the fundheld by the pension fund. The estimated fair values of the underlying securities are generally valued based on quotedmarket prices. For securities without quoted market prices, other observable market inputs are used to determine the fairvalue.
Common/collective trust fund investments consist of index funds for domestic equities, an actively managed fund forinternational equities, and a short-term investment fund for highly liquid, short-term debt securities. Investments are valuedat the net asset value (NAV) of units of a bank collective trust. The NAV is based on the fair value of the underlyinginvestments held by the fund less its liabilities. This practical expedient is not used when it is determined to be probable thatthe fund will sell the investment for an amount diffeff rent than the reported NAV.
The private partnerships category consists of various venture capital funds, mezzanine debt funds and leveraged buyoutfunds. The NAV of these investments has been estimated based on methods employed by the general partners, includingreference to third-party transactions and valuations of comparable companies.
Total employer contributions to the pension plans are presented below:
in thousandsdd Pension
Employer Contributions2018 $ 109,6312019 8,8822020 8,8192021 (estimated) 8,060
For our qualified pension plans, we made discretionary contributions of $100,000,000 during 2018, and made nocontributions during 2020 and 2019. We do not anticipate making contributions to our qualified pension plans in 2021. Forour nonqualified pension plans, we contributed $8,819,000, $8,882,000 and $9,631,000 during 2020, 2019 and 2018,respectively, and expect to contribute $8,060,000 during 2021.

Part II 102
The following benefit payments, which reflect expected future service, as appropriate, are expected to be paid:
in thousandsdd Pension
Estimated Future Benefit Payments2021 $ 55,3332022 56,9682023 57,5582024 58,0192025 56,2172026-2030 279,537
We contribute to a number of multiemployer defined benefit pension plans under the terms of collective-bargainingagreements for union-represented employees. The risks of participating in multiemployer plans differ from single employerplans as follows:
� assets contributed to a multiemployer plan by one employer may be used to provide benefits to employees of otherparticipating employers
� if a participating employer stops contributing to the plan, the unfunded obligations of the plan may be borne by theremaining participating employers
� if we cease to have an obligation to contribute to one or more of the multiemployer plans to which we contribute, we maybe required to pay those plans an amount based on the underfur nded status of the plan, referred to as a withdrawal liability
None of the multiemployer pension plans that we participate in are individually significant. Our contributions to individualmultiemployer pension plans did not exceed 5% �� ��� � ��� ��� ������������ �� ��� ���� ��� ����� &������ /.�2020, 2019 and 2018. Total contributions to multiemployer pension plans were $10,277,000 in 2020, $10,385,000 in 2019and $10,081,000 in 2018.
As of December 31, 2020, a total of 8.2% of our domestic hourly labor force was covered by collective-bargainingagreements. Of such employees covered by collective-bargaining agreements, 14.0% were covered by agreements thatexpire in 2021. We also employed 339 union employees in Mexico who are covered by a collective-bargaining agreementthat will expire in 2021. None of our union employees in Mexico participate in multiemployer pension plans.
In addition to the pension plans noted above, we had one unfunded supplemental retirement plan as of December 31, 2020and 2019. The accrued costs for the supplemental retirement plan were $2,525,000 at December 31, 2020 and $1,069,000at December 31, 2019.

Part II 103
POSTRETIREMENT PLANSIn addition to pension benefits, we provide certain healthcare and life insurance benefits for some retired employees. In2012, we amended our postretirement healthcare plan to cap our portion of the medical coverage cost at the 2015 level (asa result, the accumulated benefit obligation equals the projected benefit obligation). Substantially all our salaried employeesand, where applicable, certain of our hourly employees may become eligible for these benefits if they reach a qualifyiff ng ageand meet certain service requirements. Generally, Company-provided healthcare benefits end when covered individualsbecome eligible for Medicare benefits, become eligible for other group insurance coverage or reach age 65, whicheveroccurs first.
The following table sets forth the combined funded status of the plans and their reconciliation with the related amountsrecognized in our consolidated financial statements at December 31:
in thousandsdd 2020 2019
Change in Benefit ObligationProjeco ted benefit obligation at beginning of year $ 41,187 $ 40,834Service cost 1,520 1,317Interest cost 969 1,388Actuarial (gain) loss (5,111) 2,677Benefits paid (4,682) (5,029)Projeo cted benefit obligation at end of year $ 33,883 $ 41,187Change in Fair Value of Plan AssetsFair value of assets at beginning of year $ 0 $ 0Actual return on plan assets 0 0Fair value of assets at end of year $ 0 $ 0Funded status $ (33,883) $ (41,187)Net amount recognized $ (33,883) $ (41,187)Amounts Recognized in the ConsolidatedBalance SheetsCurrent liabilities $ (4,471) $ (5,339)Noncurrent liabilities (29,412) (35,848)Net amount recognized $ (33,883) $ (41,187)Amounts Recognized in AccumulatedOther Comprehensive IncomeNet actuarial gain $ (19,003) $ (14,642)Prior service credit (3,656) (7,575)Total amount recognized $ (22,659) $ (22,217)

Part II 104
The following table sets forth the components of net periodic benefit cost, amounts recognized in other comprehensiveincome, weighted-average assumptions and assumed trend rates of the plans at December 31:
dollall rs in thousands 2020 2019 2018
Components of Net Periodic PostretirementBenefit CostService cost $ 1,521 $ 1,317 $ 1,358Interest cost 969 1,388 1,240Amortization of prior service credit (3,919) (3,919) (3,962)Amortization of actuarial gain (806) (1,309) (1,298)Net periodic postretirement benefit credit $ (2,235) $ (2,523) $ (2,662)Changes in Plan Assets and BenefitObligations Recognized in OtherComprehensive IncomeNet actuarial (gain) loss $ (5,168) $ 2,673 $ 835Reclassification of prior service credit 3,919 3,919 3,962Reclassification of actuarial gain 806 1,309 1,298Amount recognized in other comprehensiveincome $ (443) $ 7,901 $ 6,095Amount recognized in net periodicpostretirement benefit cost and othercomprehensive income $ (2,678) $ 5,378 $ 3,433AssumptionsWeighted-average assumptions used todetermine net periodic benefit cost foryears ended December 31Discount rate PBO 2.84% 4.01% 3.34%Discount rate service cost 3.09% 4.23% 3.56%Discount rate interest cost 2.42% 3.63% 2.90%Weighted-average assumptions used todetermine benefit obligation atDecember 31Discount rate 2.09% 2.84% 4.01%
Total employer contributions to the postretirement plans are presented below:
in thousandsdd Postrettt irtt emrr ent
Employer Contributions2018 $ 6,0992019 5,0292020 4,6822021 (estimated) 4,471
The employer contributions shown above are equal to the cost of benefits during the year. The plans are not funded and arenot subject to any regulatory funding requirements.

Part II 105
The following benefit payments, which reflect expected future service, as appropriate, are expected to be paid:
in thousandsdd Postrettt irtt emrr ent
Estimated Future Benefit Payments2021 $ 4,4712022 3,9512023 3,6882024 3,3582025 3,054202682030 11,023
Contributions by participants to the postretirement benefit plans for the years ended December 31 are as follows:
in thousandsdd Postrettt irtt emrr ent
Participants Contributions2018 $ 1,9842019 2,2392020 2,553
PENSION AND OTHER POSTRETIREMENT BENEFITS ASSUMPTIONSEach year, we review our assumptions for discount rates (used for PBO, service cost, and interest cost calculations) and theexpected return on plan assets. Due to plan changes made in 2012 and 2013, annual pay increases and the per capita costof healthcare benefits do not materially impact plan obligations.
We use a high-quality bond full yield curve approach (specific spot rates for each annual expected cash flow) to establishthe discount rates at each measurement date. At December 31, 2020, the discount rates used were as follows:
� PBO for various plans 8 ranged from 1.55% to 2.72% (December 31, 2019 ranged from 2.67% to 3.37%)
� Service cost 8 weighted average of 2.92% and 3.09%, respectively, for our pension plans and our other postretirementplans (2019 figures were 4.59% and 4.23%, respectively)
� Interest cost 8 weighted average of 2.78% and 2.42%, respectively, for our pension plans and our other postretirementplans (2019 figures were 4.02% and 3.63%, respectively)
Our expected return on plan assets is: (1) a long-term view based on our current asset allocation, and (2) a judgment������� �� ����� ����� ���� �� �������� � ��� ����� ��� �� �� ������� � ��� ����� =�� �������� ���� �� � �assets used to measure plan benefit costs was 5.75% for the period January 1, 2020 8 November 30, 2020 and 5.25% forthe period December 1, 2020 8 December 31, 2020 (5.75% in 2019). For 2021, we set the expected return on plan assets to5.25%.
DEFINED CONTRIBUTION PLANSIn addition to our pension and postretirement plans, we sponsor two defined contribution plans. Substantially all salaried andnonunion hourly employees are eligible to be covered by one of these pl��� )��� ����� � ��� �� ���� ��� ������eligible contributions at established rates. Expense recognized in connection with these matching obligations totaled$50,772,000 in 2020, $53,853,000 in 2019 and $40,718,000 in 2018.

Part II 106
NOTE 11: INCENTIVE PLANS
SHARE-BASED COMPENSATION PLANSOur 2016 Omnibus Long-term Incentive Plan (Plan) authorizes the granting of perfor rmance shares, restricted shares, Stock-Only Stock Appreciation Rights (SOSARs) and other types of share-based awards to key salaried employees andnonemployee directors. The maximum number of shares that may be issued under the Plan is 8,000,000, of which6,331,687 shares remain under this authorization.
PERFORMANCE SHARES Each perfor rmance share unit is equal to and paid in one share of our common stock, butcarries no voting or dividend rights. The number of units ultimately paid for perfor rmance share awards may range from 0%to 200% of the number of units awarded on the date of grant. Payment is based upon the outcome of perfor rmance and/ormarket conditions. Awards vest on December 31 of the third year afteff r date of grant. Vesting is accelerated upon death,disability, or change of control and the awards become non-forfeitable upon reaching retirement age all as defined in theaward agreement. Nonvested units are forfeited upon termination for any other reason. Expense provisions referable toperfor rmance share awards amounted to $17,798,000 in 2020, $18,236,000 in 2019 and $13,656,000 in 2018.
The fair value of perfor rmance shares is estimated as of the date of grant using a Monte Carlo simulation model. Thefollowing table summarizes the activity for nonvested perfor rmance share units during the year ended December 31, 2020:
Target Weighted-averageNumber Granrr t Dateof Shares Fair Value
Performance SharesNonvested at January 1, 2020 244,904 $ 113.55Granted 117,740 133.95Vested (112,302) 117.19Canceled/forfeff ited (6,483) 120.66Nonvested at December 31, 2020 243,859 $ 121.53
During 2019 and 2018, the weighted-average grant date fair value of perfor rmance shares granted was $110.39 and$117.20, respectively.
The aggregate values for distributed perfor rmance share awards are based on the closing price of our common stock as ofthe distribution date. The aggregate values of distributed perfor rmance shares for the years ended December 31 are asfollows:
in thousandsdd 2020 2019 2018
Aggregate value of distributedperformance shares $ 38,841 $ 33,169 $ 53,721

Part II 107
RESTRICTED SHARES Each restricted share unit is equal to and paid in one share of our common stock, but carries novoting or dividend rights. Awards vest on the third anniversary of the grant date. Vesting is accelerated upon reachingretirement age, death, disability, or change of control, all as defined in the award agreement. Nonvested units are forfeitedupon termination for any other reason. Expense provisions referable to restricted share awards amounted to $9,766,000 in2020, $7,789,000 in 2019 and $4,831,000 in 2018.
The fair value of restricted shares is estimated as of the date of grant based on the stock price adjusted for dividendsforegone. The following table summarizes the activity for nonvested restricted share units during the year ended December31, 2020:
Weighted-averageNumber Granrr t Dateof Shares Fair Value
Restricted Stock UnitsNonvested at January 1, 2020 211,930 $ 108.34Granted 82,271 133.95Vested (86,302) 102.12Canceled/forfeff ited (7,746) 119.63Nonvested at December 31, 2020 200,153 $ 121.11
During 2019 and 2018, the weighted-average grant date fair value of restricted shares granted was $110.39 and $117.20,respectively.
The aggregate values for distributed restricted share awards are based on the closing price of our common stock as of thedistribution date. The aggregate values of distributed restricted shares for the years ended December 31 are as follows:
in thousandsdd 2020 2019 2018
Aggregate value of distributedrestricted shares $ 12,210 $ 2,417 $ 1,345
STOCK-ONLY STOCK APPRECIATION RIGHTS (SOSARs) SOSARs granted have an exercise price equal to themarket value of our underlying common stock on the date of grant. The SOSARs vest ratably over 3 years and expire 10years subsequent to the date of grant. Vesting is accelerated upon reaching retirement age, death, disability, or change ofcontrol, all as defined in the award agreement. Nonvested awards are forfeited upon termination for any other reason.
The fair value of SOSARs is estimated as of the date of grant using the Black-Scholes option pricing model. Compensationcost for SOSARs is based on this grant date fair value and is recognized for awards that ultimately vest. The following tablepresents the weighted-average fair value and the weighted-average assumptions used in estimating the fair value of grantsduring the years ended December 31:
2020 2019 2018
SOSARsFair value $ 40.91 $ 38.90 $ 43.72Risk-free interest rate 1.50% 2.62% 2.90%Dividend yield 0.71% 0.87% 1.39%Volatility 25.74% 27.23% 31.49%Expected term (years) 9.00 9.00 9.00
The risk-free interest rate is based on the yield at the date of grant of a U.S. Treasury security with a maturity periodapproximating the SOSARs expected term. The dividend yield assumption is based on our historical dividend payoutsadjusted for current expectations of future payouts. The volatility assumption is based on the historical volatility andexpectations about future volatility of our common stock over a period equal to the SOSARs expected term. The expectedterm is based on historical experience and expectations about future exercises and represents the period of time thatSOSARs granted are expected to be outstanding.

Part II 108
A summary of our SOSAR activity as of December 31, 2020 and changes during the year are presented below:
Weighted-averageRemaining Aggregate
Number Weighted-averagevv Contracrr tual Intrinsrr ic Valueof Shares Exercise Pricrr e Lifeff (YearYY s)rr (in thousands)dd
SOSARsOutstanding at January 1, 2020 944,599 $ 76.84Granted 75,300 133.95Exercised (229,993) 48.16Forfeited or expired (1,470) 43.05Outstanding at December 31, 2020 788,436 $ 90.72 5.03 $ 44,106Exercisable at December 31, 2020 641,613 $ 82.84 4.23 $ 40,949
The aggregate intrinsic values in the table above represent the total pretax intrinsic value (the differff ence between our stockprice on the last trading day of 2020 and the exercise price, multiplied by the number of in-the-money SOSARs) that wouldhave been received by the option holders had all SOSARs been exercised on December 31, 2020. These values changebased on the fair market value of our common stock. The aggregate intrinsic values of SOSARs exercised for the yearsended December 31 are as follows:
in thousandsdd 2020 2019 2018
Aggregate intrinsic value of SOSARs exercised $ 22,273 $ 74,838 $ 49,248
The following table presents cash and stock consideration received and tax benefit realized from SOSAR exercises andcompensation cost recorded referable to SOSARs for the years ended December 31:
in thousandsdd 2020 2019 2018
SOSARsCash and stock consideration receivedfrom exercises $ 0 $ 0 $ 0Tax benefit from exercises 5,693 29,000 19,083Compensation cost 3,855 4,042 4,763
NONEMPLOYEE DIRECTOR AWARDS In addition to the share-based compensation plans for employees discussedabove, we issue a limited number of stock units to our nonemployee directors annually. Expense provisions referable tononemployee director stock units amounted to $1,572,000 in 2020, $1,776,000 in 2019 and $1,965,000 in 2018.
CASH-BASED COMPENSATION PLANSWe have incentive plans under which cash awards may be made annually. Expense provisions under these plans referableto awards to offiff cers and certain employees amounted to $42,138,000 in 2020, $40,847,000 in 2019 and $36,969,000 in2018.

Part II 109
NOTE 12: COMMITMENTS AND CONTINGENCIESWe have commitments in the form of unconditional purchase obligations as of December 31, 2020. These includecommitments for the purchase of property, plant & equipment of $6,947,000 and commitments for noncapital purchases of$46,165,000. These commitments are due as follows:
Unconditdd ionatt lPurchase
in thousandsdd Obligationsi
Property, Plant & Equipment2021 $ 6,947Thereafter 0Total $ 6,947Noncapital (primarily transportation and electricity contracts)2021 $ 16,005202282023 15,106202482025 4,054Thereafter 11,000Total $ 46,165
Expenditures for noncapital purchases totaled $87,438,000 in 2020, $87,044,000 in 2019 and $56,674,000 in 2018.
We have commitments in the form of minimum royalties under mineral leases as of December 31, 2020 in the amount of$265,560,000, due as follows:
Mineraliiin thousandsdd Leases
Minimum Royalties2021 $ 27,210202282023 43,491202482025 27,712Thereafter 167,147
Total $ 265,560
Expenditures for royalties under mineral leases totaled $81,549,000 in 2020, $84,782,000 in 2019 and $76,761,000 in 2018.
As of December 31, 2020, we were contingently liable for $835,819,000 within 522 surety bonds underwrrr itten by varioussurety companies. These bonds guarantee our perfor rmance and are required primarily by states and municipalities and theirrelated agencies. The top five in amount totaled $206,015,000 (25%) and were for certain construction contracts andreclamation obligations. We have agreed to indemnify the underwrrr iting companies against any exposure under the suretybonds. No material claims have been made against our surety bonds.
Certain of our aggregates reserves are burdened by volumetric production payments (nonoperating interest) as described inNote 2. As the holder of the working interest, we have responsibility to bear the cost of mining and producing the reservesattributable to this nonoperating interest.
As described in Note 1 under the caption Claims and Litigation Including Self-Insurance, our net liabilities for our self-insurance program totaled $74,135,000 as of December 31, 2020.
As summarized by purpose in Note 6, our standby letters of credit totaled $56,080,000 as of December 31, 2020.
As outlined in Note 7, our present value of future minimum (nonmineral) lease payments totaled $442,737,000 as ofDecember 31, 2020.
As described in Note 9, our liability for unrecognized tax benefits is $6,817,000 as of December 31, 2020.
As described in Note 17, our asset retirement obligations totaled $283,163,000 as of December 31, 2020.

Part II 110
LITIGATION AND ENVIRONMENTAL MATTERSWe are subject to occasional governmental proceedings and orders pertaining to occupational safety and health or toprotection of the environment, such as proceedings or orders relating to noise abatement, air emissions or water discharges.As part of our continuing program of stewardship in safety, health and environmental matters, we have been able to resolvesuch proceedings and to comply with such orders without any material adverse effeff cts on our business.
We have received notices from the United States Environmental Protection Agency (EPA) or similar state or local agenciesthat we are considered a potentially responsible party (PRP) at a limited number of sites under the ComprehensiveEnvironmental Response, Compensation and Liability Act (CERCLA or Superfund) or similar state and local environmentallaws. Generally we share the cost of remediation at these sites with other PRPs or alleged PRPs in accordance withnegotiated or prescribed allocations. There is inherent uncertainty in determining the potential cost of remediating a givensite and in determining any individual party's share in that cost. As a result, estimates can change substantially as additionalinformation becomes available regarding the nature or extent of site contamination, remediation methods, other PRPs andtheir probable level of involvement, and actions by or against governmental agencies or private parties.
We have reviewed the nature and extent of our involvement at each Superfur nd site, as well as potential obligations arisingunder other federal, state and local environmental laws. While ultimate resolution and financial liability is uncertain at anumber of the sites, in our opinion based on information currently available, the ultimate resolution of claims andassessments related to these sites will not have a material effeff ct on our consolidated results of operations, financial posit ionor cash flows, although amounts recorded in a given period could be material to our results of operations or cash flows forthat period. Amounts accrued for environmental matters are presented in Note 8.
We are a defendant in various lawsuits in the ordinary course of business. It is not possible to determine with precision theoutcome, or the amount of liability, if any, under these lawsuits, especially where the cases involve possible jury trials withas yet undetermined jury panels.
In addition to these lawsuits in which we are involved in the ordinary course of business, certain other material legalproceedings are specifically described below.
J LOWER PASSAIC RIVER STUDY AREA (DISCONTINUED OPERATIONS and SUPERFUND SITE) The LowerPassaic River Study Area is part of the Diamond Shamrock Superfund Site in New Jersey. Vulcan and approximately 70other companies are parties (collectively the Cooperating Parties Group, CPG) to a May 2007 Administrative Order onConsent (AOC) with the EPA to perform a Remedial Investigation/Feasibility Study (draft RI/FS) of the lower 17 miles ofthe Passaic River (River). The draftff RI/FS was submitted recommending a targeted hot spot remedy; however, the EPAissued a record of decision (ROD) in March 2016 that calls for a bank-to-bank dredging remedy for the lower 8 miles ofthe River. The EPA estimates that the cost of implementing this proposal is $1.38 billion. In September 2016, the EPAentered into an Administrative Settlement Agreement and Order on Consent with Occidental Chemical Corporation(Occidental) in which Occidental agreed to undertake the remedial design for this bank-to-bank dredging remedy and toreimburse the United States for certain response costs.
In August 2017, the EPA informed certain members of the CPG, including Vulcan, that it planned to use the services of athird-party allocator with the expectation of offeff ring cash-out settlements to some parties in connection with the bank-to-bank remedy. This voluntary allocation process is intended to establish an impartial third-party expert recommendationthat may be considered by the government and the participants as the basis of possible settlements. The final allocationrecommendations, which are subject to confidentiality provisions, were submitted to the EPA for its review andconsideration in late December 2020. It is unknown when the EPA might respond or whether it will seek furtherinformatio�� =�� ������ ������������ ���� ������ �� *� ��� �� � ����� � ������� ��� � �� ������ ��� ������ loss recorded for this matter in 2015.
In July 2018, Vulcan, along with more than one hundred other defendants, was sued by Occidental in United StatesDistrict Court for the District of New Jersey, Newark Vicinage. Occidental is seeking cost recovery and contribution underCERCLA. It is unknown at this time whether the filing of the Occidental lawsuit will impact the EPA allocation process.
In October 2018, the EPA ordered the CPG to prepare a streamlined feasibility study specifically for the upper 9 miles fofthe River. This directive is focused on dioxin and covers the remaining portion of the River not included in the $�'��March 2016 ROD.

Part II 111
Effoff rts to remediate the River have been underwarr y for many years and have involved hundreds of entities that have hadoperations on or near the River at some point during the past several decades. We formerly owned a chemicals operationnear the mouth of the River, which was sold in 1974. The majoa r risk drivers in the River have been identified as dioxins,PCBs, DDx and mercury. We did not manufacture any of these risk drivers and have no evidence that any of these weredischarged into the River by Vulcan.
The AOC does not obligate us to fund or perfor rm the remedial action contemplated by either the draftff RI/FS or the ROD.Furthermore, the parties who will participate in funding the remediation and their respective allocations have not beendetermined. We do not agree that a bank-to-bank remedy is warranted, and we are not obligated to fund any of theremedial action at this time; nevertheless, we previously estimated the cost to be incurred by us as a potential participantin a bank-to-bank dredging remedy and recorded an immaterial loss for this matter in 2015.
J TEXAS BRINE MATTER (DISCONTINUED OPERATIONS) During the operation of its former Chemicals Division,Vulcan secured the right to mine salt out of an underground salt dome formation in Assumption Parish, Louisiana from1976 - 2005. Throughout that period and for all times thereafteff r, the Texas Brine Company (Texas Brine) was theoperator contracted by Vulcan (and later Occidental) to mine and deliver the salt. We sold our Chemicals Division in 2005and transferred our rights and interest related to the salt and mining operations to the purchaser, a subsidiary ofOccidental, and we have had no association with the leased premises or Texas Brine since that time. In August 2012, asinkhole developed in the vicinity of the Texas Brine mining operations, and numerous lawsuits were filed in state court inAssumption Parish, Louisiana. Other lawsuits, including class action litigation, were also filed in federal court before theEastern District of Louisiana in New Orleans.
There are numerous defendants, including Texas Brine and Occidental, to the litigation in state and federal court. Vulcanwas first brought into the litigation as a third-party defendant in August 2013 by Texas Brine. We have since been addedas a direct and third-party defendant by other parties, including a direct claim by the state of Louisiana. Damage�������� ���������� ������ ��� �������� ��� ��� ����+��� � �������� � ��� �� ������ ����� � �� �� ��� ����of Louisiana for response costs and civil penalties, claims by Texas Brine for response costs and lost profits, claims forphysical damages to nearby oil and gas pipelines and storage facilities (pipelines), and business interruption claims.
-� ������� �� ��� � �������� � ���� �� ��� �� ���� �� ������� ��������� and comparative fault by both Texas Brineand Occidental. It is alleged that the sinkhole was caused, in whole or in part, by our negligent actions or failure to act. It isalso alleged that we breached the salt lease with Occidental, as well as an operating agreement and related contractswith Texas Brine; that we were strictly liable for certain property damages in our capacity as a former lessee of the saltlease; and that we violated certain covenants and conditions in the agreement under which we sold our ChemicalsDivision to Occidental. We likewise made claims for contractual indemnity and on a basis of comparative fault againstTexas Brine and Occidental. Vulcan and Occidental have since dismissed all of their claims against one another. TexasBrine has claims that remain pending against Vulcan and against Occidental.
A bench trial (judge only) began in September 2017 and ended in October 2017 in the pipeline cases. The trial was limitedin scope to the allocation of comparative fault or liability for causing the sinkhole, with a damages phase of the trial to beheld at a later date. In December 2017, the judge issued a ruling on the allocation of fault among the three defendants asfollows: Occidental 50%, Texas Brine 35% and Vulcan 15%. This ruling was appealed by the parties. In December 2020,the Louisiana Court of Appeal, First Circuit issued its Notice of Judgement and Disposition in one of the pipeline casesreversing in part and amending the trial court judgment to reallocate 20% of the fault from Occidental to Texas Brine, withthe result that 30% of the fault is now allocated to Occidental and 55% of the fault is now allocated to Texas Brine. TheCourt of Appeal affiff rmed the 15% fault allocation to Vulcan. The Court of Appeal made various other findings, includingfindings related to the arbitrability of certain claims between Occidental and Texas Brine. In January 2021, Texas Brineapplied to the Court of Appeal for a rehearing regarding whether Occidental waived arbitration rights. Vulcan anticipates��� ��� � ��� �� ��� ����� �� ���" �+��� �� ��� #��� �� '��� �� �������� �� ��� 0������ ������ #����� ����� ����������� �� =��� B����s rehearing application.
We have settled all except two outstanding cases, and our insurers to date have funded these settlements in excess ofour self-insured retention amount. The remaining cases involve Texas Brine and the State of Louisiana. Discoveryremains ongoing, and we cannot reasonably estimate a range of liability pertaining to these open cases at this time.

Part II 112
J NEW YORK WATER DISTRICT CASES (DISCONTINUED OPERATIONS) During the operation of our formerChemicals Division, which was divested to Occidental in 2005, Vulcan manufactured a chlorinated solvent known as1,1,1-trichloroethane. We are a defendant in 27 cases allegedly involving 1,1,1-trichloroethane. All of the cases are filed inthe United States District Court for the Eastern District of New York. According to the various complaints, the plaintiffsff arepublic drinking water providers who serve customers in seven New York counties (Nassau, Orange, Putnam, Sullivan,Ulster, Washington and Westchester). It is alleged that our 1,1,1-trichloroethane was stabilized with 1,4-dioxane and thatvarious water wells of the plaintiffsff are contaminated with 1,4-dioxane. The plaintiffsff are seeking unspecifiedcompensatory and punitive damages. We will vigorously defend the cases. At this time we cannot determine the likelihoodor reasonably estimate a range of loss, if any, pertaining to the cases.
J HEWITT LANDFILL MATTER (SUPERFUND SITE) In September 2015, the Los Angeles Regional Water QualityControl Board (RWQCB) issued a Cleanup and Abatement Order directing Vulcan to assess, monitor, cleanup and abatewastes that have been discharged to soil, soil vapor, and/or groundwater at the former Hewitt Landfill in Los Angeles.
Following an onsite and offsff ite investigation and pilot scale testing, the RWQCB approved a corrective action thatincludes leachate recovery, storm water capture and conveyance improvements, and a groundwater pump, treat andreinjection system. Certain on-site source control measures have been implemented. The groundwater treatment systemreached mechanical completion in late 2020 and is currently in a shakedown testing period. Operation testing is expectedto be completed in early 2021 and will be followed by full system operation. Currently-anticipated costs of these on-sitesource control activities have been fully accrued.
We are also engaged in an ongoing dialogue with the EPA, Honeywell, and the Los Angeles Department of Water andPower (LADWP) regarding the potential contribution of the Hewitt Landfill to groundwater contamination in the NorthHollywood Operable Unit (NHOU) of the San Fernando Valley Superfur nd Site.
The EPA and Vulcan entered into an AOC and Statement of Work having an effeff ctive date of September 2017 for thedesign of two extraction wells south of the Hewitt Landfill to protect the North Hollywood West (NHW) well field locatedwithin the NHOU. In November 2017, we submitted a Pre-Design Investigation (PDI) Work Plan to the EPA, which setsforth the activities and schedule for collection of data in support of our evaluation of the need for an offsff ite remedy. Inaddition, this evaluation was expanded as part of the PDI to include the evaluation of a remedy in light of a new project byLADWP at the Rinaldi-Toluca (RT) wellfield. PDI investigative activities were completed between the first and thirdquarters of 2018, and in December 2018 we submitted a Draftff PDI Evaluation Report to the EPA. The PDI EvaluationReport summarizes data collection activities conducted pursuant to the Draftff PDI Work Plan and provides model updatesand evaluation of remediation alternatives for offsff ite areas. EPA provided an initial set of comments on the Draftff PDIEvaluation Report in May 2019 and a final set of comments in October 2020. The final set of comments includes arequest for Vulcan to revise and develop a Final PDI Evaluation Report. The final comments further provide, if Vulcanagrees, a proposal for an alternative approach for offsff ite remediation (as opposed to installation of offsff ite extraction wells)and development of a Supplemental PDI Evaluation Report that would require the EPA to modify the remedy in the 2009ROD as it relates to the Hewitt Landfill. In December 2020, Vulcan submitted the Final PDI Evaluation Report, which��� ���� ����� �� ��� &���� �&- $+ ����� ����� �� �������� �� $�'�� ��������� )��� ��� $�'�� �+��� and approvalof the Final PDI Evaluation Report and any Supplemental PDI Evaluation Report on remedial alternative(s) is completeand an effeff ctive remedy has been agreed upon, we cannot identify an appropriate remedial action that will be requiredunder the AOC. Given the various stakeholders involved and the uncertainties relating to remediation alternatives, we����� ����� � ������� ��� �������� �� *� ���� ��������� ��� �� ����� ����� ����� �%���� �� ��� $�'�
In December 2019, Honeywell agreed with LADWP to build a water treatment system (often referred to as theCooperative Containment Concept or CCC or the second interim remedy) that will provide treated groundwater in theNHOU to LADWP for public water supply purposes. Honeywell contends that some of the contamination to be remediatedby the system it will build originated from the Hewitt Landfill, and that Vulcan should fund some portion of the costs thatHoneywell has incurred and will incur in developing the second interim remedy. During the third quarter 2020, Vulcanr������ � ������ ��� � ��� �� K������ �� ����������� � �� �� ����� ����� �� ���� ������� ;� � ��gathering and analyzing data and developing technical information to determine the extent of possible contribution by theHewitt Landfill to the groundwater contamination in the area. This work is also intended to assist in identification of otherPRPs that may have contributed to groundwater contamination in the area. At this time, we cannot reasonably estimate arange of an additional loss to Vulcan pertaining to this contribution claim.

Part II 113
Further, LADWP has announced plans to install new treatment capabilities at two City wellfields located near the HewittLandfill the NHW wellfield and the RT wellfield. LADWP has alleged that the Hewitt Landfill is one of the primary PRPsfor the contamination at the NHW wellfield and is one of many PRPs for the contamination at the RT wellfield. We aregathering and analyzing data and developing technical information to determine the extent of possible contribution by theHewitt Landfill to the groundwater contamination in the area, consistent with the parallel request by the EPA. This work isalso intended to assist in identification of other PRPs that may have contributed to groundwater contamination in the area.*� �� �� �� ���"��� ����� �� 0'&;��� ��� �� ����� '� ���� ����� �� ����� ����� � ������� ��� �� ��� ��Vulcan pertaining to this contribution claim.
J NAFTA ARBITRATION In September 2018, our subsidiary Legacy Vulcan, LLC (Legacy Vulcan), on its own behalf,and on behalf of our Mexican subsidiary Calizas Industriales del Carmen, S.A. de C.V. (Calica), served the UnitedMexican States (Mexico) a Notice of Intent to Submit a Claim to Arbitration under Chapter 11 of the North American FreeTrade Agreement (NAFTA). Our NAFTA claim relates to the treatment of a portion of our quarrying operations in Playa del#��� �#����>� !������ ����� ���� ���� ���� ������� !������� �� �� �� ���� � ���� �� � ������� <�����agreem��� �� � ��� �� ���� ����� ���� �� �������� ������ �� !������� ��+������� ���������� ������;� ���� ��� ����� ������ � �� ���� �� !������� ��������� �� ������� ���� 3'(=' �� ��������� ��
As required by Article 1118 of NAFTA, we sought to settle this dispute with Mexico through consultations. Notwithstandingour good faith effoff rts to resolve the dispute amicably, we were unable to do so and filed a Request for Arbitration, whichwe filed with the International Centre for Settlement of Investment Disputes (ICSID) in December 2018. In January 2019,ICSID registered our Request for Arbitration.
We expect that the NAFTA arbitration will take at least two years to be concluded. At this time, there can be no assurancewhether we will be successful in our NAFTA claim, and we cannot quantifyff the amount we may recover, if any, under thisarbitration proceeding if we were successful.
Item 103 of Regulation S-K requires disclosure of certain environmental matters when a governmental authority is a party tothe proceedings, or such proceedings are known to be contemplated, unless we reasonably believe that the matter willresult in no monetary sanctions, or in monetary sanctions, exclusive of interest and costs, of less than $300,000 (whichthreshold was $100,000 prior to November 9, 2020). We previously disclosed that, in June 2019, we received a draftffadministrative order from the EPA to settle alleged violations of the Clean Water Act at one of our aggregates sites. InNovember 2020, we reached a settlement with the EPA regarding this matter, under which we paid a civil penalty of$68,000.
It is not possible to predict with certainty the ultimate outcome of these and other legal proceedings in which we areinvolved, and a number of factors, including developments in ongoing discovery or adverse rulings, or the verdict of aparticular jury, could cause actual losses to differ materially from accrued costs. No liability was recorded for claims andlitigation for which a loss was determined to be only reasonably possible or for which a loss could not be reasonablyestimated. Legal costs incurred in defense of lawsuits are expensed as incurred. In addition, losses on certain claims andlitigation described above may be subject to limitations on a per occurrence basis by excess insurance, as described in Note1 under the caption Claims and Litigation Including Self-insurance.

Part II 114
NOTE 13: EQUITYOur capital stock consists solely of common stock, par value $1.00 per share, of which 480,000,000 shares may be issued.Holders of our common stock are entitled to one vote per share. We may also issue 5,000,000 shares of preferred stock, butno shares have been issued. The terms and provisions of such shares will be determined by our Board of Directors uponany issuance of preferred shares in accordance with our Certificate of Incorporation.
There were no shares held in treasury as of December 31, 2020, 2019 and 2018.
Our common stock purchases (all of which were open market purchases) and subsequent retirements for the years endedDecember 31 are summarized below:
in thousands,dd except average cost 2020 2019 2018
Shares Purchased and RetiredNumber 214 19 1,192Total purchase price $ 26,132 $ 2,602 $ 133,983Average cost per share $ 121.92 $ 139.90 $ 112.41
As of December 31, 2020, 8,064,851 shares may be purchased under the current authorization of our Board of Directors.
Dividends for the years ended December 31 were as follows:
in thousands,dd except per share data 2020 2019 2018
DividendsCash dividends $ 180,216 $ 163,973 $ 148,109Cash dividends per share $ 1.36 $ 1.24 $ 1.12

Part II 115
NOTE 14: OTHER COMPREHENSIVE INCOMEComprehensive income comprises two subsets: net earnings and other comprehensive income (OCI). The components ofother comprehensive income are presented in the accompanying Consolidated Statements of Comprehensive Income andConsolidated Statements of Equity, net of applicable taxes.
Amounts in accumulated other comprehensive income (AOCI), net of tax, at December 31, are as follows:
in thousandsdd 2020 2019 2018
AOCIInterest rate hedges $ (23,943) $ (10,953) $ (11,180)Pension and postretirement plans (157,362) (186,785) (161,035)Total $ (181,305) $ (197,738) $ (172,215)
Changes in AOCI, net of tax, for the three years ended December 31, 2020 are as follows:
Pension andInterest Rate Postrettt irtt emrr ent
in thousandsdd Hedges Benefitff Plansl Total
AOCIBalances at December 31, 2017 $ (11,438) $ (138,028) $ (149,466)
Released stranded tax effects ASU 2018-02 (2,464) (27,165) (29,629)
Balances at January 1, 2018, due to reclassification $ (13,902) $ (165,193) $ (179,095)
Other comprehensive income (loss)before reclassifications 2,496 (207) 2,289Amounts reclassified from AOCI 226 4,365 4,591Net OCI changes 2,722 4,158 6,880Balances at December 31, 2018 $ (11,180) $ (161,035) $ (172,215)
Other comprehensive income (loss)before reclassifications 0 (26,892) (26,892)Amounts reclassified from AOCI 227 1,142 1,369Net OCI changes 227 (25,750) (25,523)Balances at December 31, 2019 $ (10,953) $ (186,785) $ (197,738)
Other comprehensive income (loss)before reclassifications (14,679) 6,366 (8,313)Amounts reclassified from AOCI 1,689 23,057 24,746Net OCI changes (12,990) 29,423 16,433Balances at December 31, 2020 $ (23,943) $ (157,362) $ (181,305)
Amounts reclassified from AOCI to earnings, are as follows:
in thousandsdd 2020 2019 2018
Amortization of Interest Rate Hedge LossesInterest expense $ 2,286 $ 307 $ 306Benefit from income taxes (597) (80) (80)Total $ 1,689 $ 227 $ 226Amortization of Pension and Postretirement PlanActuarial Loss and Prior Service CostOther nonoperating expense $ 31,200 $ 1,545 $ 5,906Benefit from income taxes (8,143) (403) (1,541)Total $ 23,057 $ 1,142 $ 4,365Total reclassifications from AOCI to earnings $ 24,746 $ 1,369 $ 4,591

Part II 116
NOTE 15: SEGMENT REPORTINGWe have four operating (and reportable) segments organized around our principal product lines: Aggregates, Asphalt,Concrete and Calcium. Management reviews earnings from these reporting segments principally at the gross profit level.
The Aggregates segment produces and sells aggregates (crushed stone, sand and gravel, sand, and other aggregates) andrelated products and services. During 2020, the Aggregates segment principally served markets in twenty states,Washington D.C. and Mexico with a full line of aggregates, and thirteen additional states with railroad ballast. Customersuse aggregates primarily in the construction and maintenance of highways, streets and other public works and in theconstruction of housing and commercial, industrial and other nonresidential facilities. Customers are served by truck, rail andwater distribution networks from our production facilities and sales yards. Due to the high weight-to-value ratio ofaggregates, markets generally are local in nature. Quarries located on waterways and rail lines allow us to serve remotemarkets where local aggregates reserves may not be available.
The Asphalt segment produces and sells asphalt mix in six states: Alabama, Arizona, California, New Mexico, Tennesseeand Texas, and includes asphalt construction paving in three states: Alabama, Tennessee and Texas. We entered theAlabama asphalt market in 2018 through an acquisition (see Note 19).
The Concrete segment produces and sells ready-mixed concrete in four states: California, Maryland, Texas and Virginia, inaddition to Washington D.C. In 2020 and 2018, we exited the New Mexico and Georgia ready-mixed concrete markets,respectively, through divestitures (see Note 19).
The Calcium segment consists of a Florida facility that mines, produces and sells calcium products.
Aggregates comprise approximately 95% of asphalt mix by weight and 80% of ready-mixed concrete by weight. Our Asphaltand Concrete segments are primarily supplied with their aggregates requirements from our Aggregates segment. Theseintersegment sales are made at local market prices for the particular grade and quality of product used in the production ofasphalt mix and ready-mixed concrete. Customers for our Asphalt and Concrete segments are generally served locally atour production facilities or by truck. Because asphalt mix and ready-mixed concrete harden rapidly, delivery is timeconstrained and generally confined to a radius of approximately 20 to 25 miles from the producing facility.
The vast majoa rity of our activities are domestic. We sell a relatively small amount of construction aggregates outside theUnited States. Total domestic revenues were $4,845,863,000 in 2020, $4,912,972,000 in 2019 and $4,365,309,000 in 2018.Nondomestic Aggregates segment revenues were $10,963,000 in 2020, $16,131,000 in 2019 and $17,560,000 in 2018;there were no significant nondomestic revenues in our Asphalt, Concrete or Calcium segments. Long-lived assets outsidethe United States, which consist primarily of property, plant & equipment, were $261,574,000 in 2020, $274,439,000 in 2019and $278,520,000 in 2018. Equity method investments of $26,524,000 in 2020, $50,587,000 in 2019 and $39,395,000 in2018 are included below in the identifiable assets for the Aggregates segment and in investments and long-term receivableson the accompanying Consolidated Balance Sheets.

Part II 117
SEGMENT FINANCIAL DISCLOSURE
in thousandsdd 2020 2019 2018
Total RevenuesAggregates 1 $ 3,944,286 $ 3,990,275 $ 3,513,649Asphalt 2 792,605 855,821 733,182Concrete 383,617 395,627 401,999Calcium 7,720 8,191 8,110Segment sales $ 5,128,228 $ 5,249,914 $ 4,656,940Aggregates intersegment sales (271,402) (320,811) (274,071)Total revenues $ 4,856,826 $ 4,929,103 $ 4,382,869Gross ProfitAggregates $ 1,159,178 $ 1,146,649 $ 991,858Asphalt 75,233 63,023 56,480Concrete 44,159 43,151 49,893Calcium 2,911 3,078 2,714Total $ 1,281,481 $ 1,255,901 $ 1,100,945Depreciation, Depletion, Accretion & Amortization (DDA&A)Aggregates $ 321,127 $ 305,046 $ 281,641Asphalt 34,956 35,199 31,290Concrete 16,010 13,620 12,539Calcium 189 232 272Other 24,524 20,499 20,504Total $ 396,806 $ 374,596 $ 346,246Capital Expenditures 3
Aggregates $ 331,893 $ 383,406 $ 422,175Asphalt 19,803 9,095 38,154Concrete 11,664 11,641 12,291Calcium 0 31 22Corporate 0 175 2,587Total $ 363,360 $ 404,348 $ 475,229Identifiable Assets 4
Aggregates $ 9,459,185 $ 9,334,218 $ 8,887,749Asphalt 573,059 558,386 527,226Concrete 305,523 325,102 266,581Calcium 3,345 3,653 3,942Total identifiable assets $ 10,341,112 $ 10,221,359 $ 9,685,498General corporate assets 147,780 152,928 102,228Cash and cash equivalents and restricted cash 1,198,013 274,506 44,404Total assets $ 11,686,905 $ 10,648,793 $ 9,832,130
1 Includes prodrr uct sales, as well as freightrr & delivery costs that we pass along to our customers, and servicvv e revenuevv s (see Note2) relatll ed to aggregates.
2 Includes product sales, as well as servicvv e revenues (see Note 2) fromrr our asphalts construcrr tionii pavinvv g business.3 Capital expenditx ures include capitalizeii d replacements of and additiott ns to proprr ertyrr ,yy plant & equipment,t including renewalsw andbetterments. Capital expex nditdd uresrr exclude property,t planl t & equipment obtained by business acquisitiott ns.
4 Certain temporarily idleddd assets are included witww hintt a segment's Identifiii ablei Assets but the associated DDA&A is shownww withinOthett r in the DDA&A sectiontt above as the relatl ed DDA&A is excluded fromrr segment grosrr s profit.i

Part II 118
NOTE 16: SUPPLEMENTAL CASH FLOW INFORMATIONSupplemental information referable to the Consolidated Statements of Cash Flows is summarized below:
in thousandsdd 2020 2019 2018
Cash Payments (Refunds)Interest (exclusive of amount capitalized) $ 129,182 $ 129,224 $ 128,217Income taxes 95,934 56,812 (65,968)Noncash Investing and Financing ActivitiesAccrued liabilities for purchases of propertyrr ,plant & equipment $ 55,904 $ 57,309 $ 37,116Recognition of new asset retirement obligations 353 263 20Right-of-use assets obtained in exchange for newOperating lease liabilities 1 49,586 444,547 0Finance lease liabilities 1 6,631 1,227 0Amounts referable to business acquisitionsLiabilities assumed 5,879 4,373 5,405Consideration payable to seller 8,980 0 4,500Fair value of noncash assets and liabilities exchanged 21,213 0 0Debt issued for purchases of property, plant & equipment 2,571 0 0
1 The 2019 amount includes the initiatt l right-of-usff e assets resultingii fromrr our adoptiontt of ASU 2016-02, �Lea� ses.�
NOTE 17: ASSET RETIREMENT OBLIGATIONSAsset retirement obligations (AROs) are legal obligations associated with the retirement of long-lived assets resulting fromthe acquisition, construction, development and/or normal use of the underlying assets. Recognition of a liability for an AROis required in the period in which it is incurred at its estimated fair value. The associated asset retirement costs arecapitalized as part of the carrying amount of the underlying asset and depreciated over the estimated useful life of the asset.The liability is accreted through charges to operating expenses. If the ARO is settled for an amount other than the carryingamount of the liability, we recognize a gain or loss on settlement.
We record all AROs for which we have legal obligations for land reclamation at estimated fair value. These AROs relate toour underlying land parcels, including both owned properties and mineral leases. For the years ended December 31, werecognized ARO operating costs related to accretion of the liabilities and depreciation of the assets as follows:
in thousandsdd 2020 2019 2018
ARO Operating CostsAccretion $ 12,432 $ 10,992 $ 10,776Depreciation 8,592 7,075 6,034Total $ 21,024 $ 18,067 $ 16,810
ARO operating costs are reported in cost of revenues. AROs are reported within other noncurrent liabilities in ouraccompanying Consolidated Balance Sheets.
Reconciliations of the carrying amounts of our AROs for the years ended December 31 are as follows:
in thousandsdd 2020 2019
Asset Retirement ObligationsBalance at beginning of year $ 210,323 $ 225,726Liabilities incurred 353 263Liabilities settled (12,820) (12,457)Accretion expense 12,432 10,992Revisions, net 72,875 (14,201)Balance at end of year $ 283,163 $ 210,323

Part II 119
ARO liabilities settled during 2020 and 2019 include $2,563,000 and $3,354,000, respectively, of reclamation activitiesrequired under a development agreement and conditional use permits at two adjacent aggregates sites on owned propertyin Southern California. The reclamation required under the development agreement will result in the restoration of 90 acresof previously mined property to conditions suitable for commercial and retail development.
ARO revisions during 2020 primarily include increases in estimated costs at two aggregates locations, including reclamationactivities required under a development agreement at an aggregates site on owned property in Southern California. Thereclamation required under the development agreement will result in the restoration of previously mined property toconditions suitable for retail and commercial development.
NOTE 18: GOODWILL AND INTANGIBLE ASSETSAcquired identifiable intangible assets are classified into three categories: (1) goodwill, (2) intangible assets with finite livessubject to amortization and (3) intangible assets with indefinite lives. Goodwill and intangible assets with indefinite lives arenot amortized; rather, they are reviewed for impairment at least annually.
GOODWILLGoodwill is recognized when the consideration paid for a business exceeds the fair value of the tangible and identifiableintangible assets acquired. Goodwill is allocated to reporting units for purposes of testing goodwill for impairment. Therewere no charges for goodwill impairment in the years ended December 31, 2020, 2019 and 2018. Accumulated goodwillimpairment losses amount to $252,664,000 in the Calcium segment.
We have four reportable segments organized around our principal product lines: Aggregates, Asphalt, Concrete andCalcium. Changes in the carrying amount of goodwill by reportable segment for the three years ended December 31, 2020are shown below:
in thousandsdd Aggregates Asphals tl Concrete Calcium Total
GoodwillTotals at December 31, 2018 $ 3,073,763 $ 91,633 $ 0 $ 0 $ 3,165,396Goodwill of acquired businesses 1 1,665 0 0 0 1,665Totals at December 31, 2019 $ 3,075,428 $ 91,633 $ 0 $ 0 $ 3,167,061Goodwill of acquired businesses 1 5,051 0 0 0 5,051Totals at December 31, 2020 $ 3,080,479 $ 91,633 $ 0 $ 0 $ 3,172,112
1 See Note 19 for a summaryr of recent acquisiii tiii ons.ii
We test goodwill for impairment on an annual basis or more frequently if events or circumstances change in a manner thatwould more likely than not reduce the fair value of a reporting unit below its carrying value. A decrease in the estimated fairvalue of one or more of our reporting units could result in the recognition of a material, noncash write-down of goodwill.

Part II 120
INTANGIBLE ASSETSIntangible assets consist of contractual rights in place (primarily permitting and zoning rights), noncompetition agreements,customer relationships and trade names and trademarks. Intangible assets acquired in business combinations are stated attheir fair value determined as of the date of acquisition. Intangible assets acquired individually or otherwirr se obtained outsidea business combination consist primarily of permitting, permitting compliance and zoning rights and are stated at theirhistorical cost less accumulated amortization. Costs incurred to renew or extend the life of existing intangible assets arecapitalized. These capitalized renewal/extension costs were immaterial for the years presented.
See Note 19 for the details of the intangible assets acquired in business acquisitions during 2020, 2019 and 2018.Amortization of finite-lived intangible assets is computed based on the estimated life of the intangible assets. Contractualrights in place associated with aggregates reserves are amortized using the unit-of-sales method based on estimatedrecoverable units. Other intangible assets are amortized principally by the straight-line method. Intangible assets arereviewed for impairment when events or circumstances indicate that the carrying amount may not be recoverable. Therewere no material charges for impairment of intangible assets in 2020, 2019 and 2018.
The gross carrying amount and accumulated amortization by majora intangible asset class for the years ended December 31are summarized below:
in thousandsdd 2020 2019
Gross Carrying AmountContractual rights in place $ 1,158,966 $ 1,132,958Noncompetition agreements 5,667 7,667Permitting, permitting compliance and zoning rights 138,958 136,646Other 1 51,927 11,951Total gross carrying amount $ 1,355,518 $ 1,289,222Accumulated AmortizationContractual rights in place $ (188,953) $ (155,555)Noncompetition agreements (5,167) (6,126)Permitting, permitting compliance and zoning rights (30,180) (30,545)Other 1 (7,674) (5,521)Total accumulated amortizrr ation $ (231,974) $ (197,747)Total Intangible Assets Subjeb ct to Amortization, net $ 1,123,544 $ 1,091,475Intangible Assets with Indefinite Lives 0 0Total Intangible Assets, net $ 1,123,544 $ 1,091,475Amortization Expense for the Year $ 46,611 $ 40,541
1 Includes patents, customer relatiott nships, tradrr enames and trademrr arks.kk
Estimated amortization expense for the five years subsequent to December 31, 2020 is as follows:
in thousandsdd
Estimated Amortization Expense for Five Subsequent Years2021 $ 40,9752022 38,2002023 37,1032024 35,4292025 35,041

Part II 121
NOTE 19: ACQUISITIONS AND DIVESTITURES
BUSINESS ACQUISITIONS2020 BUSINESS ACQUISITIONS During 2020, we purchased the following operations for total consideration of$73,416,000 ($43,223,000 cash and $30,193,000 noncash):
� business to support our aggregates operations across most of our footprint
� Texas asphalt mix and recycle operations
The 2020 acquisitions listed above are reported in our consolidated financial statements as of their respective acquisitiondates. None of these acquisitions are material to our results of operations or financial position either individually orcollectively.
As a result of the 2020 acquisitions, we recognized $65,545,000 of amortizable intangible assets and $5,051,000 ofgoodwill. The amortizable intangible assets will be amortized against earnings ($25,712,000 - straight-line basis over aweighted-average 20.0 years) and $25,712,000 will be deductible for income tax purposes over 15 years. The goodwill�������� ��� � ��� �� ������ �� ��� ����� ������� ��� ����� �+� ��� �� ��� �� ���� �� ��� ����� �%����and is not deductible for income tax purposes.
2019 BUSINESS ACQUISITIONS During 2019, we purchased the following operations, none of which were material toour results of operations or financial position either individually or collectively, for total cash consideration of $45,273,000(additionally, immaterial adjustments were made to prior year acquisitions):
� Tennessee aggregates operations
� Virginia ready-mixed concrete operations
The 2019 acquisitions listed above are reported in our consolidated financial statements as of their respective acquisitiondates.
As a result of the 2019 acquisitions, we recognized $25,443,000 of amortizable intangible assets (contractual rights inplace). The contractual rights in place will be amortized against earnings on a straight-line basis over a weighted-average19.5 years and will be deductible for income tax purposes over 15 years.
2018 BUSINESS ACQUISITIONS During 2018, we purchased the following operations, none of which were material toour results of operations or financial position either individually or collectively, for total consideration of $219,863,000($215,363,000 cash and $4,500,000 payable):
� Alabama aggregates, asphalt mix and construction paving operations
� California aggregates and asphalt mix operations
� Texas aggregates rail yards, asphalt mix and construction paving operations
The 2018 acquisitions listed above are reported in our consolidated financial statements as of their respective acquisitiondates. Immaterial adjustments were recorded in 2019 including a working capital adjustment in which we received$1,122,000 and an increase to goodwill of $1,665,000.
As a result of the 2018 acquisitions, we recognized $44,163,000 of amortizable intangible assets (contractual rights inplace). The contractual rights in place will be amortized against earnings ($43,072,000 - straight-line over a weighted-average 19.9 years and $1,080,000 - units of sales in excess of 30.0 years) and $7,385,000 will be deductible for income taxpurposes over 15 years. Of the $43,990,000 of goodwill recognized, $4,863,000 will be deductible for income tax purposesover 15 years, and $31,721,000 �������� ��� � ��� �� ������ �� ��� ����� ������� ��� ����� �+� ��� �� ���tax basis in the assets acquired.

Part II 122
DIVESTITURES AND PENDING DIVESTITURESIn 2020, we sold:
� Fourth quarter a Virginia ready-mix concrete business, resulting in an immaterial loss. We retained all real propertywhich is being leased to the buyer and obtained a 20-year aggregates supply agreement
� Second quarter our New Mexico ready-mix concrete business, resulting in an immaterial gain. We retained theconcrete plants and mobile fleet and are leasing those assets to the buyer. Additionally, we obtained a 20-yearaggregates supply agreement
In 2019, we sold:
� First quarter two aggregates operations in Georgia and reversed a contingent payable related to the fourth quarter2017 Department of Justice required divestiture of former Aggregates USA operations, resulting in a pretax gain of$4,064,000
In 2018, we sold:
� First quarter ready-mixed concrete operations in Georgia resulting in a pretax gain of $2,929,000 (we retained all realproperty which is leased to the buyer, and obtained a long-term aggregates supply agreement)
No assets met the criteria for held for sale at December 31, 2020, 2019 or 2018.
NOTE 20: UNAUDITED SUPPLEMENTARY DATAThe following is a summary of selected quarterly financial information (unaudited) for each of the years ended December 31,2020 and 2019:
2020Threerr Monthstt Ended
in thousands,dd except per share data Marchrr 31 June 30 Sept 30 Dec 31
Total revenues $ 1,049,242 $ 1,322,575 $ 1,309,890 $ 1,175,119Gross profit 201,723 396,519 380,498 302,741Operating earnings 112,301 298,896 288,104 196,430Earnings from continuing operations 59,998 210,957 201,125 115,915Net earnings 60,258 209,916 199,788 114,518
Basic earnings per share from continuing operations $ 0.45 $ 1.59 $ 1.52 $ 0.87Diluted earnings per share from continuing operations $ 0.45 $ 1.58 $ 1.51 $ 0.87
Basic net earnings per share $ 0.45 $ 1.58 $ 1.51 $ 0.86Diluted net earnings per share $ 0.45 $ 1.58 $ 1.50 $ 0.86
2019Three Monthstt Ended
in thousands,dd except per share data Marchrr 31 June 30 Sept 30 Dec 31
Total revenues $ 996,511 $ 1,327,682 $ 1,418,758 $ 1,186,152Gross profit 191,675 370,502 400,643 293,081Operating earnings 104,433 276,074 303,376 193,575Earnings from continuing operations 63,935 197,907 218,066 142,595Net earnings 63,299 197,558 215,713 141,092
Basic earnings per share from continuing operations $ 0.48 $ 1.50 $ 1.65 $ 1.08Diluted earnings per share from continuing operations $ 0.48 $ 1.48 $ 1.63 $ 1.07
Basic net earnings per share $ 0.48 $ 1.49 $ 1.63 $ 1.07Diluted net earnings per share $ 0.48 $ 1.48 $ 1.62 $ 1.06

Part II 123
ITEM 9CHANGES IN AND DISAGREEMENTS WITH ACCOUNTANTS ON ACCOUNTING AND FINANCIAL
DISCLOSURE
None.
ITEM 9ACONTROLS AND PROCEDURES
DISCLOSURE CONTROLS AND PROCEDURESmaintain a system of controls and procedures designed to ensure that information required to be disclosed in reports we
file with the SEC is recorded, processed, summarized and reported within the time periods specified by the SEC's rules andforms. These disclosure controls and procedures (as defined in the Securities Exchange Act of 1934 Rules 13a - 15(e) or15d - 15(e)), include, without limitation, controls and procedures designed to ensure that such information is accumulatedand communicated to our management, including our Chief Executive Offiff cer and Chief Financial Offiff cer, to allow timelydecisions regarding required disclosure. Our Chief Executive Officff er and Chief Financial Offiff cer, with the participation ofother management offiff cials, evaluated the effeff ctiveness of the design and operation of the disclosure controls andprocedures as of December 31, 2020. Based upon that evaluation, our Chief Executive Officff er and Chief Financial Officff erconcluded that our disclosure controls and procedures were effeff ctive as of December 31, 2020.
Due to the COVID-19 pandemic, we have implemented remote work arrangements for support functions and restrictedbusiness travel effeff ctive mid-March 2020. To date, these arrangements have not materially affeff cted our ability to maintainour business operations, including the operation of financial reporting systems, internal control over financial reporting, anddisclosure controls and procedures. We are continually assessing the potential effeff cts of the pandemic on the design andoperating effeff ctiveness of our internal control over financial reporting and if necessary, will take appropriate actions.
No material changes were made during the fourth quarter of 2020 to our internal control over financial reporting, nor havethere been other factors that materially affeff ct these controls.
MANAGEMENT'S REPORT ON INTERNAL CONTROL OVER FINANCIALREPORTINGOur management is responsible for establishing and maintaining an adequate system of internal control over financialreporting as required by the Sarbanes-Oxley Act of 2002 and as defined in Securities Exchange Act Rule 13a-15(f).
Under management's supervision, an evaluation of the design and effeff ctiveness of our internal control over financialreporting was conducted based on the framework in Internal Contrott l Integratrr ed Framrr eworww krr (2013) issued by theCommittee of Sponsoring Organizations of the Treadway Commission. Based on this evaluation, management concludedthat our internal control over financial reporting was effeff ctive as of December 31, 2020.
Deloitte & Touche LLP, an independent registered public accounting firm, as auditors of our consolidated financialstatements, has issued an attestation report on the effeff ctiveness of our internal control over financial reporting as ofDecember 31, 2020. Deloitte & Touche LLP's report, which expresses an unqualified opinion on the effeff ctiveness of ourinternal control over financial reporting, follows this report.
LIMITATIONS OF EFFECTIVENESS OF CONTROLS AND PROCEDURESIn designing and evaluating our disclosure controls and procedures, management recognizes that any controls andprocedures, no matter how well designed and operated, can provide only reasonable assurance of achieving the desiredcontrol objecb tives. In addition, the design of disclosure controls and procedures must reflect the fact that there are resourceconstraints and that management is required to apply its judgment in evaluating the benefits of possible controls andprocedures relative to their costs.

Part II 124
REPORT OF INDEPENDENT REGISTERED PUBLIC ACCOUNTING FIRM � INTERNAL CONTROL OVERFINANCIAL REPORTINGTo the shareholders and Board of Directors of Vulcan Materials Company:
Opinion on Internal Control over Financial Reporting
We have audited the internal control over financial reporting of Vulcan Materials Compa�� �� ���������� ���� �#������>as of December 31, 2020, based on criteria established in Internal Contrott l Integratrr ed Framrr eworww krr (2013) issued by theCommittee of Sponsoring Organizations of the Treadway Commission (COSO). In our opinion, the Company maintained, inall material respects, effeff ctive internal control over financial reporting as of December 31, 2020, based on criteriaestablished in Internal Controlrr Integratrr ed Framrr eworww krr (2013) issued by COSO.
We have also audited, in accordance with the standards of the Public Company Accounting Oversight Board (United States)(PCAOB), the consolidated financial statements as of and for the year ended December 31, 2020, of the Company and ourreport dated February 25, 2021, expressed an unqualified opinion on those financial statements.
Basis for Opinion
=�� #������� �������� �� �������� � �� ��������� ������ ���+� ����� ����� �+� ������ ������� �� �� ���assessment of the effeff ctiveness of internal control over financial reporting, includ�� �� ��� ���������� !�������������� �� -���� #���� �+� (����� ��������� 2� ��������� ��� �� �� ������ � ������� �� ��� #������� ����� control over financial reporting based on our audit. We are a public accounting firm registered with the PCAOB and arerequired to be independent with respect to the Company in accordance with the U.S. federal securities laws and theapplicable rules and regulations of the Securities and Exchange Commission and the PCAOB.
We conducted our audit in accordance with the standards of the PCAOB. Those standards require that we plan and perfor rmthe audit to obtain reasonable assurance about whether effeff ctive internal control over financial reporting was maintained inall material respects. Our audit included obtaining an understanding of internal control over financial reporting, assessing therisk that a material weakness exists, testing and evaluating the design and operating effeff ctiveness of internal control basedon the assessed risk, and perfor rming such other procedures as we considered necessary in the circumstances. We believethat our audit provides a reasonable basis for our opinion.
Definition and Limitations of Internal Control over Financial Reporting
A company's internal control over financial reporting is a process designed to provide reasonable assurance regarding thereliability of financial reporting and the preparation of financial statements for external purposes in accordance with generallyaccepted accounting principles. A company's internal control over financial reporting includes those policies and proceduresthat (1) pertain to the maintenance of records that, in reasonable detail, accurately and fairly reflect the transactions anddispositions of the assets of the company; (2) provide reasonable assurance that transactions are recorded as necessary topermit preparation of financial statements in accordance with generally accepted accounting principles, and that receiptsand expenditures of the company are being made only in accordance with authorizations of management and directors ofthe company; and (3) provide reasonable assurance regarding prevention or timely detection of unauthorized acquisition,use, or disposition of the company's assets that could have a material effeff ct on the financial statements.
Because of the inherent limitations, internal control over financial reporting may not prevent or detect misstatements. Also,projections of any evaluation of the effeff ctiveness to future periods are subject to the risk that the controls may becomeinadequate because of changes in conditions, or that the degree of compliance with the policies or procedures maydeteriorate.
/s/ DELOITTE & TOUCHE LLP
Birmingham, Alabama
February 25, 2021

Part II 125
ITEM 9BOTHER INFORMATION
None.

Part III 126
PART IIIITEM 10
DIRECTORS, EXECUTIVE OFFICERS AND CORPORATE GOVERNANCE
On or about March 29, 2021, we expect to file a definitive proxy statement with the Securities and Exchange Commission������ �� ���� ���� .G' ��� �4641 ���� ���������>� =�� ��������� ���� ��� ������� �Proposal 1 - Election ofDirector��� �#�rporate Governance 8 Policies,� �#����� C�+����� 8 &����� 3�������� �������� �CorporateGovernance 8 #��������� �� ��� B�� �� &������� �� �&� ��%���� ������� .F�> ������� �to the extent reported therein)included in our 2021 Proxy Statement is incorporated herein by reference. See also the information about our executiveoffiff cers and governance policies set forth above in Part I of this report.
ITEM 11EXECUTIVE COMPENSATION
=�� ��������� ���� ��� ������� �#���������� &��������� �� '� ������ �&����� #������������ �$xecutiveCompensation�� �#����� C�+����� 8 #���������� #�������� -��� ��"� �� -����� ������������ ���#���������� #�������� ������ included in our 2021 Proxy Statement is incorporated herein by reference.
ITEM 12SECURITY OWNERSHIP OF CERTAIN BENEFICIAL OWNERS AND MANAGEMENT AND RELATED
STOCKHOLDER MATTERS
=�� ��������� ���� ��� ������� �������� 2������� �� #���� B������� 2���� �� !��������� and �$%����Compensation Plans� �ncluded in our 2021 Proxy Statement is incorporated herein by reference.
ITEM 13CERTAIN RELATIONSHIPS AND RELATED TRANSACTIONS, AND DIRECTOR INDEPENDENCE
The information under the headings �Corporate Governance 8 &����� -������������� �� �#����� C�+����� 8=�������� ���� �� ��� ������� included in our 2021 Proxy Statement is incorporated herein by reference.
ITEM 14PRINCIPAL ACCOUNTING FEES AND SERVICES
information under the heading �Independent Registered Public Accounting Firm� included in our 2021 Proxy Statementis incorporated herein by reference.

Part IV 127
PART IVITEM 15
EXHIBITS AND FINANCIAL STATEMENT SCHEDULES
) (1) Financial statements
The following financial statements are included herein on the pages shown below:
Page in Reportrr
Report of Independent Registered Public Accounting Firm 68 - 69
Consolidated Statements of Comprehensive Income 70
Consolidated Balance Sheets 71
Consolidated Statements of Cash Flows 72
Consolidated Statements of Equity 73
Notes to Consolidated Financial Statements 74 -122
(a) (2) Financial statement schedules
Financial statement schedules are omitted because of the absence of conditions under which they are required or becausethe required information is provided in the financial statements or notes thereto.
Financial statements (and summarized financial information) of 50% or less owned entities accounted for by the equitymethod have been omitted because they do not, considered individually or in the aggregate, constitute a significantsubsidiary.
(a) (3) Exhibits
Exhibit 3(a) Certificate of Incorporation (Restated 2007) of the Company (formerly known as Virginia Holdco,p ( ) p y ( y g ,-���>� �� �� � $������ /�. �� ��� #������� #���� ����� �� (�� 5-K on November 16, 2007 1>� � � � ,
Exhibit 3(b) Amended and Restated By-Laws of the Company (as amended through March 23, 2020) filed asy p y ( g , )$������ /�. �� ��� #������� #���� ����� �� (�� 5-K filed on March 25, 2020 1� � � ,
Exhibit 4(a) Senior Debt Indenture, dated as of December 11, 2007, between the Company and Wilmington, , , p y g=��� #������ � =������ �� �� � $������ G�. �� ��� #������� #���� ����� �� (�� 5-K on� �� � � � �December 11, 2007 1,
Exhibit 4(b) First Supplemental Indenture, dated as of December 11, 2007, between Vulcan Materialspp , , ,Company and Wilmington Trust Company, as Trustee, to that certain Senior Debt Indenture, datedp y g p y, , ,as of December 11, 2007, between the Company and Wilmington Trust Company, as Trustee, filed, , p y g p y, ,� $������ G�4 �� ��� #������� #���� ����� �� (�� 5-K on December 11, 2007 1� � � ,
Exhibit 4(c) Second Supplemental Indenture, dated June 20, 2008 between the Company and Wilmingtonpp , , p y gTrust Company, as Trustee, to that certain Senior Debt Indenture dated as of December 11, 2007,p y, , , ,filed as Exhibit 4.1 to the Company's Current Report on Form 8-K filed on June 20, 2008 1p y p ,
Exhibit 4(d) Third Supplemental Indenture, dated February 3, 2009, between the Company and Wilmingtonpp , y , , p y gTrust Company, as Trustee, to that certain Senior Debt Indenture dated as of December 11, 2007p y, , ,filed as Exhibit 10(f) to the Company's Annual Report on Form 10-K filed on March 2, 2009 1( ) p y p ,

Part IV 128
Exhibit 4(e) Fourth Supplemental Indenture, dated June 14, 2011, between the Company and Wilmington Trustpp , , , p y gCompany, as Trustee, filed as Exhibit 4.1 to the Company's Current Report on Form 8-K filed onp y, , p y pJune 15, 2011 1,
Exhibit 4(f) Fifth Supplemental Indenture, dated March 30, 2015, between the Company and Regions Bank, aspp , , , p y g ,Trustee, filed as Exhibit 4.1 to the Company's Current Report on Form 8-K filed on March 30,, p y p ,2015 1
Exhibit 4(g) Sixth Supplemental Indenture, dated March 14, 2017, between the Company and Regions Bank,pp , , , p y g ,� =������ �� �� � $������ G�. �� ��� #������� #���� ����� �� (�� 5-K filed on March 14,� � � � ,2017 1
Exhibit 4(h) Seventh Supplemental Indenture, dated as of June 15, 2017, between Vulcan Materials Companypp , , , p y�� ������� B�"� � =������ �� �� � $������ G�. �� ��� #������� #���� ����� �� (�� 5-K� � � � � �filed on June 15, 2017 1,
Exhibit 4(i) Eighth Supplemental Indenture, dated as of February 23, 2018, between Vulcan Materialsg pp , y , ,#����� �� ������� B�"� � =������ �� �� � $������ G�. �� ��� #������� #���� ����� ��� � � � � � � �Form 8-K filed on February 23, 2018 1y ,
Exhibit 4(j)(( Ninth Supplemental Indenture, dated as of May 18, 2020, between Vulcan Materials Company andpp , y , , p yRegions Bank as Trustee, filed as Exhibit 4.1 t� ��� #������� #���� ����� �� (�� 5-K filedg , � � �on May 18, 2020 1y ,
Exhibit 4(k) Indenture, dated as of May 1, 1991, by and between Legacy Vulcan Corp. (formerly VulcanMaterials Company) and First Trust of New York (as successor trustee to Morgan Guaranty TrustCompany of New York) filed as Exhibit 4 to the Form S-3 on May 2, 1991 (Registration No. 33-40284) 1
Exhibit 4(l) Supplemental Indenture No. 1, dated as of November 16, 2007, among the Company, Legacypp , , , g p y, g y*� �� #��� �� =�� B�" �� 3�� :�"� � =������ �� �� � $������ G�. �� ��� #������� #����� � � � �Report on Form 8-K filed on November 21, 2007 1p ,
Exhibit 4(m) Supplemental Indenture No. 2, dated as of June 30, 2015, between Legacy Vulcan, LLC and Thepp , , , g y ,B�" �� 3�� :�" !� �� =��� #������ 3�'�� � =������ �� �� � $������ G�> �� ��� #�������� �� � � � > � �Quarterly Report on Form 10-Q filed on August 5, 2015 1y p g ,
Exhibit 4(n) Indenture, dated as of February 23, 2018, between Vulcan Materials Company and Regions Bank,, y , , p y g ,� =������ �� �� � $������ G�. �� ��� #������� #���� ����� �� (�� 5-K filed on February 26,� � � � y ,2018 1
Exhibit 4(o) Description of Securities, filed as Exhibit 4(r> �� ��� #������� '��� ����� �� (�� .6-K filedp , ( > � � �on February 26, 2020 1y ,
Exhibit 10(a) Second Amendment to Credit Agreement, dated April 10, 2020, among Vulcan Materialsg , p , , gCompany, each of the Guarantors, the Lenders party thereto, and Truist Bank successor byp y, , p y , y���� �� ���=��� B�"� � '���������+� '����� �� �� � $������ .6�4 �� ��� #�������� � � � � �Quarterly Report on Form 10-Q filed on August 5, 2020 1y p g ,
Exhibit 10(b) 364-Day Credit Agreement, dated April 10, 2020, among Vulcan Materials Company, Truist Bank,y g , p , , g p y, ,as Administrative Agent, and the Lenders and other parties named therein, filed as Exhibit 10.1 tog , p ,��� #������� #���� ����� �� (�� 5-K filed on April 13, 2020 1� � � p ,
Exhibit 10(c) Credit Agreement, dated as of September 10, 2020, among Vulcan Materials Company, Truistg , p , , g p y,Bank, as Administrative Agent, and the Lenders and other parties named therein, filed as Exhibit, g , p ,.6�. �� ��� #������� #���� ����� �� (�� 5-K filed on September 11, 2020 1� � � p ,
Exhibit 10(d) Unfunded Supplemental Benefit Plan for Salaried Employees, as amended, filed as Exhibit 10.4 topp p y , ,the Company's Current Report on Form 8-K filed on December 17, 2008 1,2p y p ,

Part IV 129
Exhibit 10(e) Amendment No. 1 to the Unfunded Supplemental Benefit Plan for Salaried Employees filed aspp p yExhibit 10.1 to ��� #������� #���� ����� �� (�� 5-K on January 7, 2014 1,2� � � y ,
Exhibit 10(f) Deferred Compensation Plan for Directors Who Are Not Employees of the Company, as amended,p p y p y, ,filed as Exhibit 10.5 to the Company's Current Report on Form 8-K filed on December 17, 2008 1,2p y p ,
Exhibit 10(g) The 2006 Omnibus Long-Term Incentive Plan of the Company filed as Appendix C to Legacyg p y pp g y*� �� #����� 466F ���� �������� �� ������ � .G' �� �� �� '�� ./� 466F 1,2� � � �
Exhibit 10(h) Amendment to the 2006 Omnibus Long-Term Incentive Plan of the Company filed as Appendix Ag p y pp�� ��� #������� 46.. ���� �������� �� ������ � .G' �� �� !�� /.� 46.. 1,2� � � �
Exhibit 10(i) Amendment to the 2006 Omnibus Long-Term Incentive Plan of the Company dated February 9,g p y y ,46.4� �� �� � $������ .6� > �� ��� #������� '��� ����� �� (�� .6-K for the year ended� � > � � � yDecember 31, 2011 filed on February 29, 2012 1,2, y ,
Exhibit 10(j)(( Restricted Stock Plan for Nonemployee Directors of the Company, as amended, filed as Exhibitp y p y, ,10.6 to the Company's Current Report on Form 8-K filed on December 17, 2008 1,2p y p ,
Exhibit 10(k) Executive Deferred Compensation Plan, as amended, filed as Exhibit 10.1 to the Company'sp , , p yCurrent Report on Form 8-K filed on December 17, 2008 1,2p ,
Exhibit 10(l) Form of Change of Control Employment Agreement dated January 1, 2016, filed as Exhibit 10.1 tog p y g y , ,the Company's Current Report on Form 8-K filed on January 7, 2016 1,2p y p y ,
Exhibit 10(m) Vulcan Materials Company Change of Control Severance Plan for Senior Offiff cers, effectivep y g ,D��� .� 46.F� �� �� � $������ .6��> �� ��� #������� '��� ����� �� (�� .6-K filed on� � � � > � � �February 25, 2016 1,2y ,
Exhibit 10(n) Executive Incentive Plan of the Company, as amended, filed as Exhibit 10.2 to the Company'sp y, , p yCurrent Report on Form 8-K filed on December 17, 2008 1,2p ,
Exhibit 10(o) Suppleme�� $������+� ��������� '������� �� �� � $������ .6 �� 0���� *� �� #�����pp � � � �Quarterly Report on Form 10-Q for the quarter ended September 30, 2001 filed on November 2,y p q p , ,2001 1,2
Exhibit 10(p) (�� �� ����" 2����� '������� �� �� � $������ .6��> �� 0���� *� �� #����� ����� �� (�� 5-� � � > � � � �K filed on December 20, 2005 1,2,
Exhibit 10(q) Form of Director Deferred Stock Unit Agreement filed as Exhibit 10.9 to the Company's Currentg p yReport on Form 8-K filed on December 17, 2008 1,2p ,
Exhibit 10(r) Form of Perfor rmance Share Unit Agreement filed as Exhibit 10.1 to the Company's Current Reportg p y pon Form 8-K filed on March 11, 2010 1,2,
Exhibit 10(s) (�� �� �������� ��� )��� '������� �46.4> �� �� � $������ .6�. �� ��� #������� #����� � > � �Report on Form 8-K filed on February 14, 2012 1,2p y ,
Exhibit 10(t) Form of Stock-Only Stock Appreciation Rights Agreement filed as Exhibit 10(q) to Legacy Vulcany pp g g (q) g y#����� ����� �� (�� .6-K filed on February 26, 2007 1,2� � y ,
Exhibit 10(u) Stock-Only Stock Appreciation Rights Agreement between the Company and John R. McPhersony pp g g p y���� 3�+���� 7� 46..� �� �� � $������ .6�> �� ��� #������� #���� ����� �� (�� 5-K filed� � � > � � �on November 15, 2011 1,2,
Exhibit 10(v) Form of Employee Deferred Stock Unit Amended Agreement filed as Exhibit 10.7 to thep y gCompany's Current Report on Form 8-K filed on December 17, 2008 1,2p y p ,
Exhibit 10(w) Vulcan Materials Company 2016 Omnibus Long-Term Incentive Plan, filed as Exhibit 99 to thep y g ,#������� ���������� �������� �� (orm S-8 (File No. 333-211349) filed on May 13, 2016 1,2� � � ( ) y ,

Part IV 130
Exhibit 10(x) Form of Non-Employee Director Deferred Stock Unit Agreement under the Vulcan Materialsp y gCompany 2016 Omnibus Long-=�� -������+� � �� �� �� � $������ .6��> �� ��� #�������p y g � ��> � �Quarterly Report on Form 10-Q filed on August 3, 2016 1,2y p g ,
Exhibit 10(y) Form of Stock-Only Stock Appreciation Rights Award Agreement under the Vulcan Materialsy pp g gCompany 2016 Omnibus Long-=�� -������+� � �� �� �� � $������ .6�<> �� ��� #�������p y g � � > � �Quarterly Report on Form 10-Q filed on August 3, 2016 1,2y p g ,
Exhibit 10(z) Form of Restricted Stock Unit Award Agreement under the Vulcan Materials Company 2016g p yOmnibus Long-Term Incentive Plan, filed as Exhibit 10�> �� ��� #������� L��� � ����� ��g , � > � � � �Form 10-Q filed on August 3, 2016 1,2g ,
Exhibit 10(aa) Form of Perfor rmance Share Unit Award Agreement under the Vulcan Materials Company 2016g p yOmnibus Long-=�� -������+� � �� �� �� � $������ .6���> �� ��� #������� L��� � ����� ��g � � > � � � �Form 10-Q filed on August 3, 2016 1,2g ,
Exhibit 10(bb) Offeff r Letter, dated as of June 19, 2018, by and between Suzanne H. Wood and Vulcan Materials, , , y#������ �� �� � $������ .6�4 �� ��� #������� #���� ���� �� (�� 5-K filed on July 10, 2018� �� � � � y ,1, 2,
Exhibit 10(cc) Form of Perfor rmance Share Unit Award Agreement (2019) under the Vulcan Materials Companyg ( ) p y2016 Omnibus Long-=�� -������+� � �� �� �� � $������ .6�. �� ��� #������� Luarterly Reportg � � � y pon Form 10-Q filed on May 3, 2019 1,2y ,
Exhibit 10(dd) Form of Perfor rmance Share Unit Award Agreement (2020) under the Vulcan Materials Companyg ( ) p y2016 Omnibus Long-=�� -������+� � �� �� �� � $������ .6�. �� ��� #������� L��� � �����g � � � � �on Form 10-Q filed on May 6, 2020 1,2y ,
Exhibit 10(ee) Form of Stock-Only Appreciation Rights Award Agreement (2020) under the Vulcan Materialsy pp g g ( )Company 2016 Omnibus Long-=�� -������+� � �� �� �� � $������ .6�4 �� ��� #�������p y g � � �Quarterly Report on Form 10-Q filed on May 6, 2020 1,2y p y ,
Exhibit 10(ff) Form of Restricted Stock Unit Award Agreement (2020) under the Vulcan Materials Company 2016g ( ) p yOmnibus Long-Term Incentive Plan, filed as Exhibit 10.3 to ��� #������� L��� � ����� ��g , � � � �Form 10-Q filed on May 6, 2020 1,2y ,
Exhibit 10(gg) Form of Non-Employee Director Restricted Stock Unit Award Agreement under the Vulcanp y gMaterials Company 2016 Omnibus Long-Term Incentive Plan filed as Exhibit 10.3 to thep y g#������� L��� � ����� �� (�� .6-Q filed on August 5, 2020 1,2� � � � g ,
Exhibit 21 List of the Company's material subsidiaries as of December 31, 2020p y ,
Exhibit 23 Consent of Deloitte & Touche LLP, Independent Registered Public Accounting Firm, p g g
Exhibit 24 Powers of Attorneyy
Exhibit 31(a) Certification of Chief Executive Offiff cer pursuant to Section 302 of the Sarbanes-Oxley Act of 2002p y
Exhibit 31(b) Certification of Chief Financial Offiff cer pursuant to Section 302 of the Sarbanes-Oxley Act of 2002p y
Exhibit 32(a) Certification of Chief Executive Offiff cer pursuant to Section 906 of the Sarbanes-Oxley Act of 2002p y
Exhibit 32(b) Certification of Chief Financial Officff er pursuant to Section 906 of the Sarbanes-Oxley Act of 2002p y
Exhibit 95 MSHA Citations and Litigationg

Part IV 131
Exhibit 101 The following financial information from this Annual Report on Form 10-K for the year endedDecember 31, 2020 are formatted in iXBRL (Inline eXtensible Business Reporting Language): (i)the Consolidated Statements of Comprehensive Income, (ii) the Consolidated Balance Sheets, (iii)the Consolidated Statements of Cash Flows, (iv) the Consolidated Statements of Equity and (v)the Notes to Consolidated Financial Statements.
Exhibit 104 Cover Page Interactive Data File 8 the cover page from this Annual Report on Form 10-K for theyear ended December 31, 2020 is formatted in iXBRL (contained in Exhibit 101).
1 Incorporatrr ed by referff enrr ce.2 Management contrtt acrr t or compensatory plan.
Our SEC file number for documents filed with the SEC pursuant to the Securities Exchange Act of 1934, as amended, is001-33841.

Part IV 132
ITEM 16FORM 10-K SUMMARY
We have chosen not to include an optional summary of the information required by this Form 10-K.

Part IV 133
SIGNATURES
Pursuant to the requirements of Section 13 or 15(d) of the Securities Exchange Act of 1934, the registrant has duly causedthis report to be signed on its behalf by the undersigned, thereunto duly authorized on February 25, 2021.
VULCAN MATEAA RIALS COMPANY
J. Thomas HillChairman, President and Chief Executive Offiff cer
Pursuant to the requirements of the Securities Exchange Act of 1934, this report has been signed below by the followingpersons on behalf of the registrant and in the capacities and on the dates indicated.
Signature Title Date
J. Thomas Hill
Chairman, Presidentand Chief Executive Officeff r(Principal Executive Officff er)
February 25, 2021
Suzanne H. Wood
Senior Vice Presidentand Chief Financial Officff er(Principal Financial Offiff cer)
February 25, 2021
Randy L. Pigg
Vice President, Controller(Principal Accounting Officeff r) February 25, 2021
The following directors:
Melissa H. AndersonThomas A. FanningO. B. Grayson Hall, Jr.Cynthia L. HostetlerRichard T. O'BrienJames T. ProkopankoKathleen L. QuirkDavid P. SteinerLee J. Styslinger, IIIGeorge Willis
DirectorDirectorDirectorDirectorDirectorDirectorDirectorDirectorDirectorDirector
Denson N. Franklin IIIAttorney-in-Fact
February 25, 2021


Exhibit 21
EXHIBIT 21SUBSIDIARIES AS OF DECEMBER 31, 2020
State or OtherJurisdiction of
Incorporation or Organization
% OwnedDirectly or
Indirectly by Vulcan
Aggregates USA, LLCAggregates USA (Augusta), LLCAggregates USA (Macon), LLCAggregates USA (Savannah), LLCAggregates USA (Sparta), LLCArundel Company, LLCAtlantic Granite Company, LLCAzusa Rock, LLCBlack Point Aggregates, Inc.Calizas Industriales del Carmen, S.A. de C.V.CalMat Co.Chem-Marine of South CarolinaDMG Equipment Company, LLCFlorida Rock Industries, Inc.Freeport Aggregates LimitedFRI Bahamas Ltd.Harper Brothers, LLCHeritage Logistics, LLCLegacy Vulcan, LLCMaryland Rock Industries, LLCMaryland Stone, LLCMcCartney Construction Company, Inc.Mideast Division Logistics, LLCMountain West Logistics, LLCNorthr American Recycling and Crushing, LLCRancho Piedra Caliza, S.A. de C.V.Rapica Servicios Tecnicos Y Administrativos, S.A. de C.V.R. C. Smith Companies, LLCRECO Transportation, LLCS & G Concrete Company, LLCSalisbury Towing, LLCServicios Integrales, Gestoria Y Administracion, S.A. de C. V.Shamrock Building Materials, LLCSoportes Tecnicos Y Administrativos, S.A. de C.V.Southeast Division Logistics, LLCSouthern Gulf Coast Division Logistics, LLCStatewide Transport, LLCStone Creek Mira Mesa LLCTCS Materials, LLCTriangle Rock Products, LLCVGCM, B.V.Virginia Concrete Company, LLCVulcan Aggregates Company, LLCVulcan Asphalt, LLCVulcan Beaches, LLCVulcan Concrete, LLCVulcan Construction Materials, LLCVulcan Gulf Coast Materials, LLCVulcan International, B.V.Vulcan Lands, Inc.Vulcan Logistics, LLCVulica Shipping Company, Limited
DelawareDelawareDelawareDelawareDelawareDelawareSouth CarolinaDelawareNova ScotiaMexicoDelawareSouth CarolinaDelawareFloridaBahamasBahamasDelawareDelawareDelawareDelawareDelawareAlabamaDelawareDelawareDelawareMexicoMexicoDelawareDelawareDelawareDelawareMexicoDelawareMexicoDelawareDelawareDelawareCaliforniaDelawareDelawareNetherlandsDelawareDelawareDelawareDelawareDelawareDelawareNorthrr CarolinaNetherlandsNew JerseyDelawareBahamas
100100100100100100100100100100100100100100100100100100100100100100100100100100100100100100100100100100100100100100100100100100100100100100100100100100100100

Exhibit 23
EXHIBIT 23CONSENT OF INDEPENDENT REGISTERED PUBLIC ACCOUNTING FIRM
We consent to the incorporation by reference in Registration Statement No. 333-223626 on Form S-3, RegistrationStatement No. 333-227903 on Form S-4 and Registration Statements No. 333-211349, 333-182498, 333-160302, 333-148993, 333-148238, 333-147450, and 333-147449 on Form S-8 of our reports dated February 25, 2021, relating to theconsolidated financial statements of Vulcan Materials Company and subsidiaries ���� �#������>, and the effeff ctiveness of��� #������� ����� ����� over financial reporting appearing in this Annual Report on Form 10-K for the year endedDecember 31, 2020.
/s/ DELOITTE & TOUCHE LLP
Birmingham, AlabamaFebruary 25, 2021

Exhibit 24
EXHIBIT 24POWER OF ATTORNEY
The undersigned director of Vulcan Materials Company, a New Jersey corporation, hereby nominates, constitutes andappoints Denson N. Franklin III and Elizabeth H. Townsend and each of them, the true and lawful attorneys of theundersigned to sign the name of the undersigned as director to the Annual Report on Form 10-K for the year endedDecember 31, 2020 of said corporation to be filed with the Securities and Exchange Commission under the SecuritiesExchange Act of 1934, as amended, and to any and all amendments to said report.
The undersigned hereby grants to said attorneys full power of substitution, resubstitution and revocation, all as fully as theundersigned could do if personally present, hereby ratifying all that said attorneys or their substitutes may lawfully do byvirtue hereof.
IN WITNESS WHEREOF, the undersigned director of Vulcan Materials Company has executed this Power of Attorney this12th day of February, 2021.
/s/ Melissa H. AndersonMelissa H. Anderson
/s/ Thomas A. FanningThomas A. Fanning
/s/ O. B. Grayson Hall, Jr.O. B. Grayson Hall, Jr.
/s/ Cynthia L. HostetlerCynthia L. Hostetler
/s/ Richard T. O'BrienRichard T. O'Brien
/s/ James T. ProkopankoJames T. Prokopanko
/s/ Kathleen L QuirkKathleen L. Quirk
/s/ David P. SteinerDavid P. Steiner
/s/ Lee J. Styslinger, IIILee J. Styslinger, III
/s/ George WillisGeorge Willis

Exhibit 31(a)
EXHIBIT 31(a)CERTIFICATION OF CHIEF EXECUTIVE OFFICER
I, J. Thomas Hill, certifyff that:
1. I have reviewed this annual report on Form 10-K of Vulcan Materials Company;
2. Based on my knowledge, this report does not contain any untrue statement of a material fact or omit to state amaterial fact necessary to make the statements made, in light of the circumstances under which such statementswere made, not misleading with respect to the period covered by this report;
3. Based on my knowledge, the financial statements, and other financial information included in this report, fairlypresent in all material respects the financial condition, results of operations and cash flows of the registrant as of,and for the periods presented in this report;
4. =�� ��������� ���� ��������� �������� �� - � �������� � �� ���� ������ �� ��������� disclosure controls andprocedures (as defined in Exchange Act Rules 13a-15(e) and 15d-15(e)) and internal control over financial reporting(as defined in Exchange Act Rules 13a-15(f) and 15d-15(f)) for the registrant and have:
a) Designed such disclosure controls and procedures or caused such disclosure controls and procedures to bedesigned under our supervision to ensure that material information relating to the registrant including itsconsolidated subsidiaries, is made known to us by others within those entities, particularly during the period inwhich this report is being prepared;
b) Designed such internal control over financial reporting, or caused such internal control over financial reportingto be designed under our supervir sion, to provide reasonable assurance regarding the reliability of financialreporting and the preparation of financial statements for external purposes in accordance with generallyaccepted accounting principles;
c) $+ ���� ��� ������ ���+����� �� ��� ��������� ���� osure controls and procedures and presented in this reportour conclusions about the effeff ctiveness of the disclosure controls and procedures, as of the end of the periodcovered by this report based on such evaluation; and
d) Disclosed in this report an� ����� �� ��� ��������� ����� ����� �+� ������ ������� ��� ����������� ��� ��������� ���� ����� ���� %��� ���� ��������� ����� ���� %��� �� ��� ��� �� � ��� report) that has materially affeff cted, or is reasonably �"� � �� ���� � ����� ��� ��� ��������� ����� ����� over financial reporting; and
5. =�� ��������� ���� ��������� �� ������ �� �� - �+� ���� ����� ���� �� �� ���� ����� �+ ����� �� ����� ����� over financial reporting, to the ��������� ������ �� ��� ���� ��������� �� ��� ��������� ��� �� ������� ��persons perfor rming the equivalent functions):
a) All significant deficiencies and material weaknesses in the design or operation of internal control over financial������� ����� � ����� � �"� � �� �+��� � ����� �� ��� ��������� �� ��� �� ����� ������� �����<�and report financial information; and
b) Any fraud, whether or not material, that involves management or other employees who have a significant role inthe registrant's internal control over financial reporting.
Date February 25, 2021
J. Thomas HillChairman, President and Chief Executive Officer

Exhibit 31(b)
EXHIBIT 31(b)CERTIFICATION OF CHIEF FINANCIAL OFFICER
I, Suzanne H. Wood, certifyff that:
1. I have reviewed this annual report on Form 10-K of Vulcan Materials Company;
2. Based on my knowledge, this report does not contain any untrue statement of a material fact or omit to state amaterial fact necessary to make the statements made, in light of the circumstances under which such statementswere made, not misleading with respect to the period covered by this report;
3. Based on my knowledge, the financial statements, and other financial information included in this report, fairlypresent in all material respects the financial condition, results of operations and cash flows of the registrant as of,and for the periods presented in this report;
4. =�� ��������� ���� ���ifyiff ng offiff cer and I are responsible for establishing and maintaining disclosure controls andprocedures (as defined in Exchange Act Rules 13a-15(e) and 15d-15(e)) and internal control over financial reporting(as defined in Exchange Act Rules 13a-15(f) and 15d-15(f)) for the registrant and have:
a) Designed such disclosure controls and procedures or caused such disclosure controls and procedures to bedesigned under our supervision to ensure that material information relating to the registrant including itsconsolidated subsidiaries, is made known to us by others within those entities, particularly during the period inwhich this report is being prepared;
b) Designed such internal control over financial reporting, or caused such internal control over financial reportingto be designed under our supervision, to provide reasonable assurance regarding the reliability of financialreporting and the preparation of financial statements for external purposes in accordance with generallyaccepted accounting principles;
c) $+ ���� ��� ������ ���+����� �� ��� ��������� ���� ���� ����� � �� �������� �� �������� �� ���� ����our conclusions about the effeff ctiveness of the disclosure controls and procedures, as of the end of the periodcovered by this report based on such evaluation; and
d) &��� ���� �� ���� ���� �� ����� �� ��� ��������� ����� ����� �+� ������ ������� ��� ����������� ��� ��������� ���� ����� ���� %��� ���� ��������� ����� ���� %��� �� ��� ��� of an annual����> ��� �� ���� � ����� ����� � �� ����� � �"� � �� ���� � ����� ��� ��� ��������� ����� ����� over financial reporting; and
5. =�� ��������� ���� ��������� ������ �� �� - �+� ���� ����� ���� �� �� ���� ����� evaluation of internal control�+� ������ �������� �� ��� ��������� ������ �� ��� ���� ��������� �� ��� ��������� ��� �� ������� ��persons perfor rming the equivalent functions):
a) All significant deficiencies and material weaknesses in the design or operation of internal control over financial������� ����� � ����� � �"� � �� �+��� � ����� �� ��� ��������� �� ��� �� ����� ������� �����<�and report financial information; and
b) Any fraud, whether or not material, that involves management or other employees who have a significant role inthe registrant's internal control over financial reporting.
Date February 25, 2021
Suzanne H. WoodSenior Vice President and Chief Financial Offiff cer

Exhibit 32(a)
EXHIBIT 32(a)CERTIFICATION OF CHIEF EXECUTIVE OFFICER
OFVULCAN MATERIALS COMPANY
PURSUANT TO 18 U.S.C. SECTION 1350AS ADOPTED PURSUANT TO SECTION 906 OF THE SARBANES OXLEY ACT OF 2002
I, J. Thomas Hill, Chairman, President and Chief Executive Officff er of Vulcan Materials Company, certifyff that the AnnualReport on Form 10-@ ���� ������> �� ��� �� ����� &������ /.� 4620, filed with the Securities and ExchangeCommission on the date hereof:
(i) fully complies with the requirements of Section 13(a) or 15(d) of the Securities Exchange Act of1934, as amended, and
(ii) the information contained in the report fairly presents, in all material respects, the financialcondition and results of operations of Vulcan Materials Company.
J. Thomas HillChairman, President and Chief Executive Offiff cerFebruary 25, 2021
A signed original of this written statement required by Section 906, or other document authenticating, acknowledging, orotherwirr se adopting the signature that appears in typed form within the electronic version of this written statement required bySection 906, has been provided to Vulcan Materials Company and will be retained by Vulcan Materials Company andfurnished to the Securities and Exchange Commission or its staffff upon request.

Exhibit 32(b)
EXHIBIT 32(b)CERTIFICATION OF CHIEF FINANCIAL OFFICER
OFVULCAN MATERIALS COMPANY
PURSUANT TO 18 U.S.C. SECTION 1350AS ADOPTED PURSUANT TO SECTION 906 OF THE SARBANES OXLEY ACT OF 2002
I, Suzanne H. Wood, Senior Vice President and Chief Financial Offiff cer of Vulcan Materials Company, certifyff that the AnnualReport on Form 10-K ���� ������> �� ��� �� ����� &������ /.� 4620, filed with the Securities and ExchangeCommission on the date hereof:
(i) fully complies with the requirements of Section 13(a) or 15(d) of the Securities Exchange Act of1934, as amended, and
(ii) the information contained in the report fairly presents, in all material respects, the financialcondition and results of operations of Vulcan Materials Company.
Suzanne H. WoodSenior Vice President and Chief Financial Offiff cerFebruary 25, 2021
A signed original of this written statement required by Section 906, or other document authenticating, acknowledging, orotherwirr se adopting the signature that appears in typed form within the electronic version of this written statement required bySection 906, has been provided to Vulcan Materials Company and will be retained by Vulcan Materials Company andfurnished to the Securities and Exchange Commission or its staffff upon request.

Exhibit 95 8 Page 1
EXHIBIT 95MSHA CITATIONS AND LITIGATION
On July 21, 2010, the Dodd-Frank Wall Street Reform and Consumer Protection Act (the Dodd-Frank Act) was enacted.Section 1503 of the Dodd-(�" '�� �%���� �������� ��� � �������� �� ���� ��� �� ������� �� ��� (��� !���Safety and Health Act of 1977 (the Mine Act)) to disclose certain mine safety information in each periodic report to theSecurities and Exchange Commission. This information is related to the enforcement of the Mine Act by the Mine Safety andHealth Administration (MSHA).
The Dodd-Frank Act and the subsequent implementing regulation issued by the SEC require disclosure of the followingcategories of violations, orders and citations: (1) Section 104 S&S Citations, which are citations issued for violations ofmandatory health or safety standards that could significantly and substantially contribute to the cause and effeff ct of a minesafety or health hazard; (2) Section 104(b) Orders, which are orders issued upon a follow up inspection where the inspectorfinds the violation previously cited has not been totally abated in the prescribed time period; (3) Section 104(d) Citations andOrders, which are issued upon violations of mandatory health or safety standards caused by an unwarrantable failure of theoperator to comply with the standards; (4) Section 110(b)(2) Violations, which result from the reckless and repeated failureto eliminate a known violation; (5) Section 107(a) Orders, which are given when MSHA determines that an imminent dangerexists and results in an order of immediate withdrawal from the area of the mine affeff cted by the condition; and (6) writtennotices from MSHA of a pattern of violations of mandatory health or safety standards that are of such nature as could havesignificantly and substantially contributed to the cause and effeff ct of mine health or safety hazards under Section 104(e). Inaddition, the Dodd-Frank Act requires the disclosure of the total dollar value of proposed assessments from MSHA under theMine Act and the total number of mining related fatalities.
The following disclosures are made pursuant to Section 1503.
During the twelve months ended December 31, 2020, none of our operations: (i) received any orders under Section 104(b),which are issued upon a follow up inspection where the inspector finds the violation previously cited has not been totallyabated in the prescribed time period; (ii) had any flagrant violations under Section 110(b)(2); or (iii) received notice fromMSHA of a pattern of violations of mandatory health or safety standards under Section 104(e).

Exhibit 95 8 Page 2
CALENDAR YEAR 2020
The table below sets forth, by mine, the total number of citations and/or orders issued by MSHA during the period coveredby this report under the indicated provisions of the Mine Act, together with the total dollar value of proposed assessments, ifany, from MSHA, received during the twelve months ended December 31, 2020. Of our 264 active MSHA-regulated facilitiesduring the year, we received 546 federal mine safety inspections at 234 facilities during the reporting period. Of ourinspected facilities, 199 did not receive any reportable citations or orders.
Name of OperationNumber fofInspections
TotalNumb rerof S&S
Citations
MineAct
§ 104(b)Orders
Mine Act§ 104(d)Citations
andOrders
Mine Act§ 110(b)(2)Violations
MineAct
§ 107(a)Orders
Total rDollarValue fofProposed
MS AHAAssessments
(dollars inthousands)
TotalNumb rerof MiningRelatedFatalities
ReceivedWrittenNoticeund rer
Mine Act§ 104(e)(yes/no)
ALABAMA SERVICE, AL 2 1 0 0 0 0 0.1 0 NoANDERSON, SC 2 1 0 0 0 0 2.4 0 NoBARTLETT, IL 4 5 0 0 0 0 2.1 0 NoBLAIRSVILLE, GA 3 1 0 0 0 0 0.3 0 NoBROWNWOOD, TX 4 1 0 0 0 0 0.0 0 NoCALERA, AL 3 1 0 0 0 0 0.0 0 NoCHICO QUARRY, TX 3 1 0 0 0 0 0.0 0 NoCOLUMBIA SED, SC 5 1 0 0 0 0 0.0 1 NoDANLEY,TN 3 2 0 0 0 0 0.7 0 NoDAYTAA ON,TN 4 1 0 0 0 0 0.1 0 NoGOLD HILL, NC 3 1 0 0 0 0 0.0 0 NoGRAHAM VA, VA 3 3 0 0 0 0 5.0 0 NoGRAYSOAA N, GA 3 1 0 0 0 0 0.0 0 NoHANOVER, PA 1 1 0 0 0 0 0.0 0 NoHUEBNER ROAD,TX 1 1 0 0 0 0 0.0 0 NoHUNTSVILLE NORTH,AL 2 2 0 0 0 1 0.0 0 NoLAGRANGE, GA 1 2 0 0 0 0 1.7 0 NoLARAWAAA Y,AA IL 1 1 0 0 0 0 0.3 0 NoLEMONT, IL 4 1 0 0 0 0 0.0 0 NoMANASSAS, VA 3 1 0 0 0 0 0.4 0 NoMANTENO, IL 2 1 0 0 0 0 0.8 0 NoMCCOOK, IL 3 5 0 0 0 0 4.8 0 NoMIAMI, FL 4 2 0 0 0 0 0.7 0 NoNORTH TROY, OK 2 1 0 0 0 0 0.1 0 NoNORTON, VA 2 1 0 0 0 0 0.2 0 NoPOSTELL QUARRY, GA 2 1 0 0 0 0 0.0 0 NoPRIDE, AL 1 1 0 0 0 0 0.3 0 NoRIVER ROAD,TN 3 1 0 0 0 0 0.0 0 NoSAN EMIDIO, CA 2 1 0 0 0 0 0.5 0 NoSHELBYVILLE, TN 2 1 0 0 0 0 0.0 0 NoSPICEWOOD, TX 2 1 0 0 0 0 0.0 0 NoTRINITY, AL 2 1 0 0 0 0 0.3 0 NoVILLA RICA, GA 3 1 0 0 0 0 0.1 0 NoWEATHERFORD, TX 2 1 0 0 0 0 0.0 0 NoWILSON CO,TN 3 1 0 0 0 0 0.3 0 NoOTHER OPERATIONS - 199 456 0 0 0 0 0 0.0 0 NoTotal 546 49 0 0 0 1 21.2 1
The total dollar value of proposed assessments received during the twelve months ended December 31, 2020 for all othercitations, as well as proposed assessments received during the reporting period for citations previously issued, is $49,442.

Exhibit 95 8 Page 3
The table below sets forth, by mine, category of legal action and number of legal actions pending before the Federal MineSafety and Health Review Commission as of December 31, 2020.
Number of Legal Actions
Name of OperationConte tstPenalty
ContestCitations
Complaint fofDischarge,
DiscriminationBLAIRSVILLE QUARRY, GA 1 0 0GRAHAM-VIRGINIA, VA 1 0 0SOUTH RUSSELLVILLE QUARRY, AL 1 0 0
The table below sets forth, by mine, category of legal action and number of legal actions filed before the Federal Mine Safetyand Health Review Commission during the twelve months ended December 31, 2020.
Number of Legal Actions
Name of OperationConte tstPenalty
ContestCitations
Complaint fofDischarge,
DiscriminationBARTLETT UNDERGROUND QUARRY, IL 2 0 0JACK PLANT, VA 1 0 0
The table below sets forth, by mine, category of legal action and number of legal actions resolved by the Federal MineSafety and Health Review Commission during the twelve months ended December 31, 2020.
Number of Legal Actions
Name of OperationConte tstPenalty
ContestCitations
Complaint fofDischarge,
Discrimination115 QUARRY, NC 1 0 0BLACK ANGUS PLANT, AZ 1 0 0BOONE QUARRY, NC 1 0 0COOKEVILLE QUARRY, TN 1 0 0FREDERICK QUARRY, VA 1 0 0GRAHAM-VIRGINIA, VA 3 0 0HANOVER QUARRY, PA 2 0 0HAVRA E DE GRACE QUARRY,MD 1 0 0MANASSAS, VA 1 0 0MIAMI QUARRY, FL 1 0 0RIVER ROAD QUARRY, TN 1 0 0SKIPPERS, VA 1 0 0

Supplemental 1
VULCAN MATERIALS COMPANY AND SUBSIDIARY COMPANIES
SUPPLEMENTAL INFORMATION (UNAUDITED)NOT FILED IN THE FORM 10-K
INDEX
11-YEAR SCHEDULES2 Enterprise Financial Data
3 Continuing Operations� Supplementary Data
4 Consolidated Statements of Earnings and Supplementary Data
5 Consolidated Balance Sheets and Other Financial Data
6 Consolidated Statements of Cash Flows
7 Total Revenues, Net Earnings and Earnings Per Share
8 Common Stock Prices, Dividends and Related Data
9 Reconciliation of Non-GAAP Measures
OTHER INFORMATION10 Board of Directors and Committees
11 Corporate and Construction Materials Officerff srr
12 Shareholder Information

Supplemental 2
VULCAN MATERIALS COMPANY AND SUBSIDIARY COMPANIES
ENTERPRISE FINANCIAL DATAin millions 2020 2019 2018 2017 2016 2015 2014 2013 2012 2011 2010
Average Capital Employed 1
Continuing operations 9,964.2$ 9,831.2$ 9,170.0$ 8,227.0$ 7,757.3$ 7,674.3$ 7,480.6$ 7,660.6$ 7,662.4$ 7,845.9$ 8,070.5$Cash items 812.3 91.4 77.1 496.5 207.3 179.0 215.4 197.1 208.8 112.7 82.7Subtotal 10,776.5$ 9,922.6$ 9,247.1$ 8,723.5$ 7,964.6$ 7,853.3$ 7,696.0$ 7,857.7$ 7,871.2$ 7,958.6$ 8,153.2$
Discontinued operations 0.6 0.6 2.8 13.4 4.4 3.6 9.1 (1.0) (8.3) 6.9 2.2Total 10,777.1$ 9,923.2$ 9,249.9$ 8,736.9$ 7,969.0$ 7,856.9$ 7,705.1$ 7,856.7$ 7,862.9$ 7,965.5$ 8,155.4$
Capital Expenditures 2
Continuing operations 363.4$ 404.3$ 475.2$ 464.2$ 344.9$ 304.0$ 223.1$ 284.6$ 95.8$ 97.9$ 79.4$
Property, Plant & Equipmentfrom Acquisitions -Continuing Operations 11.3$ 18.1$ 148.3$ 465.6$ 15.5$ 26.6$ 194.0$ 76.2$ 0.0$ 56.6$ 51.2$
Depreciation, Depletion,Accretion andAmortirr zation fromContinuing Operations 396.8$ 374.6$ 346.2$ 306.0$ 284.9$ 274.8$ 279.5$ 307.1$ 332.0$ 361.7$ 382.1$
Increase (Decrease)in Working CapitalContinuing operations (21.8)$ 3.6$ 58.8$ 136.8$ 51.0$ (29.9)$ 15.9$ 34.6$ (12.6)$ 2.4$ (20.8)$Cash, debt and otherfinancing working capital 407.3 363.6 201.8 (164.5) (17.2) 292.4 (199.7) 69.2 104.3 263.0 351.0Total 385.5$ 367.2$ 260.6$ (27.7)$ 33.8$ 262.5$ (183.8)$ 103.8$ 91.7$ 265.4$ 330.2$
Gain on Sale of Property, Plant& Equipment and BusinessesContinuing operations 4.0$ 23.8$ 14.9$ 17.8$ 15.4$ 9.9$ 244.2$ 39.3$ 68.5$ 47.8$ 59.3$Discontinued operations 0.0 0.0 0.0 0.0 0.0 0.0 0.0 11.7 10.2 11.0 8.8Total 4.0$ 23.8$ 14.9$ 17.8$ 15.4$ 9.9$ 244.2$ 51.0$ 78.7$ 58.8$ 68.1$
Cash Proceeds from Sale ofProperty, Plant & Equipment,Businesses and VolumetricProduction Payment 3
Continuing operations 11.5$ 22.7$ 22.2$ 15.8$ 23.3$ 8.2$ 747.4$ 209.3$ 164.3$ 76.1$ 55.8$Discontinued operations 0.0 0.0 0.0 0.0 0.0 0.0 0.0 13.0 11.3 12.3 8.8Total 11.5$ 22.7$ 22.2$ 15.8$ 23.3$ 8.2$ 747.4$ 222.3$ 175.6$ 88.4$ 64.6$
1 Capital employed is the sum of interest-bearingii debt, othertt noncurrentrr liabiii liii tiii esii and equityii . Averagevv capitalii employed is a 12-month avervv age.rr2 Capitaii l expendixx turesii include capitaliii zeii d replacements of and additiii onsii to property,t plant & equipment,ii includingii renewals and betterments. Capitalii expendxx itdd uresexcludxx e property,t plant & equipmentii obtaineii d by businessii acquisiii tiii onii s.
3 Cash proceeds for 2013 and 2012 include $153.1 millii ioll n and $73.6 millii ioll n, respectively, of Volumetricrr Prodrr uctionii Payments as describedii in Note 2, Revenues.
( ) ( )

Supplemental 3
VULCAN MATERIALS COMPANY AND SUBSIDIARY COMPANIES
CONTINUING OPERATIONS SUPPLEMENTARY DATAin millii ioll ns, except per unitii data 2020 2019 2018 2017 2016 2015 2014 2013 2012 2011 2010
Total RevenuesAggregates 1 3,944.3$ 3,990.3$ 3,513.6$ 3,096.1$ 2,961.8$ 2,777.8$ 2,346.4$ 2,025.0$ 1,863.9$ 1,891.7$ 1,919.9$Asphalt 2 792.6 855.8 733.2 622.1 512.3 530.7 445.6 407.7 398.4 399.0 369.9Concrete 3 383.6 395.6 402.0 417.8 330.1 299.2 375.8 471.7 406.4 374.7 383.2Calcium 4 7.7 8.2 8.1 7.7 8.9 8.6 25.0 99.0 85.8 71.9 80.2Segment sales 5,128.2$ 5,249.9$ 4,656.9$ 4,143.7$ 3,813.1$ 3,616.3$ 3,192.8$ 3,003.4$ 2,754.5$ 2,737.3$ 2,753.2$
Aggregates intersegment sales (271.4) (320.8) (274.0) (253.4) (220.4) (194.1) (189.4) (185.4) (148.2) (142.6) (154.1)Calcium intersegment sales 0.0 0.0 0.0 0.0 0.0 0.0 (9.2) (47.3) (39.0) (30.1) (40.2)Total revenues 4,856.8$ 4,929.1$ 4,382.9$ 3,890.3$ 3,592.7$ 3,422.2$ 2,994.2$ 2,770.7$ 2,567.3$ ,$ 22,564.6 ,558.9
Average Unit Sales Priceand Unit ShipmentsAggregatesFreight-adjusted revenues 5 3,007.6$ 3,014.2$ 2,667.3$ 2,392.7$ 2,294.2$ 2,112.5$ 1,794.0$ 1,576.0$ 1,471.6$ 1,466.1$ 1,495.1$'������� ���� 208.3 215.5 201.4 183.2 181.4 178.3 162.4 145.9 141.0 143.0 147.6Freight-adjusted sales price 6 14.44$ 13.99$ 13.25$ 13.06$ 12.65$ 11.85$ 11.05$ 10.80$ 10.44$ 10.25$ 10.13$
Other products'��� � !�� ���� 11.8 12.7 11.3 10.9 9.5 9.8 7.4 6.9 6.7 7.2 7.2'��� � !�� � �� ���� 57.97$ 57.79$ 55.13$ 52.23$ 53.14$ 54.16$ 54.39$ 54.83$ 55.33$ 54.71$ 50.58$
Ready-mixed������� ����� ��� 3.0 3.1 3.2 3.6 3.0 2.8 3.7 4.8 4.2 3.9 4.1Ready-mixed������� � �� ���� 128.93$ 126.38$ 123.35$ 116.45$ 110.02$ 106.44$ 99.46$ 93.10$ 92.19$ 92.16$ 86.95$
# ���� ���� 0.3 0.3 0.3 0.3 0.3 0.3 0.3 0.3 0.3 0.3 0.3# ���� � �� ���� 27.32$ 27.85$ 28.44$ 28.26$ 27.08$ 26.70$ 26.50$ 25.44$ 24.55$ 23.80$ 28.42$
#����� ���� 0.0 0.0 0.0 0.0 0.0 0.0 0.2 1.1 0.9 0.8 0.8#����� � �� ���� 0.00$ 0.00$ 0.00$ 0.00$ 0.00$ 0.00$ 92.51$ 83.05$ 77.77$ 73.66$ 79.27$
Aggregates Sales Volumeby End Use (estimated)Highways 23% 23% 23% 24% 26% 26% 26% 27% 30% 31% 30%Other nonbuilding infrastructure 13% 14% 15% 13% 14% 16% 16% 17% 19% 19% 20%Residential construction 22% 20% 20% 21% 20% 19% 19% 19% 17% 16% 15%Nonresidential construction 40% 41% 40% 39% 37% 36% 35% 33% 29% 28% 29%Nonconstruction 2% 2% 2% 3% 3% 3% 4% 4% 5% 6% 6%Total 100% 100% 100% 100% 100% 100% 100% 100% 100% 100% 100%
Using public funds 43% 44% 44% 46% 47% 49% 50% 52% 54% 55% 55%Using private funds 57% 56% 56% 54% 53% 51% 50% 48% 46% 45% 45%Total 100% 100% 100% 100% 100% 100% 100% 100% 100% 100% 100%
1 Includes prodrr uct sales (crushed stone, sand and gravel, sand, other aggregaterr s), as well as freight & delivery costs that we pass along to our customers, and immateriarr lservicvv e revenues related to aggregates.
2 Includes product sales, as well as immaterialii serviceii revenues fromrr our asphalt constructirr onii pavingii business.ii3 Includes ready-mixeii d concrete, concrete block, precast concrete, as well as buildiii ngii materialsii purchased for resale. On March 7, 2014, we sold our concrete businessii inthe Floridrr a area.
4 Includes cement and calciumii products. On March 7, 2014, we sold our cement businessii .5 Freirr ghtii -adjusted revenues arerr Aggregates segment sales excludixx ngii freirr ghtii & delivery revenues, and other revenues related to servicvv es, such as landfillii tippiii ngii fees that arederivrr edvv fromrr our aggregrr ates business.
6 Freirr ght-ii adjusted sales priceii is calculated as freight-ii adjusted revenues dividedii by aggregates unitii shipments.ii
p p

Supplemental 4
VULCAN MATERIALS COMPANY AND SUBSIDIARY COMPANIES
CONSOLIDATED STATEMENTS OF EARNINGS ANDSUPPLEMENTARY DATAin millii ioll ns, except per share data 2020 2019 2018 2017 2016 2015 2014 2013 2012 2011 2010
Total revenues 4,856.8$ 4,929.1$ 4,382.9$ 3,890.3$ 3,592.7$ 3,422.2$ 2,994.2$ 2,770.7$ 2,567.3$ ,$ 22,564.6 ,558.9Cost of revenues 3,575.3 3,673.2 3,281.9 2,896.8 2,603.8 2,564.6 2,406.6 2,343.8 2,233.3 2,280.7 2,258.2
Gross profit 1,281.5 1,255.9 1,101.0 993.5 988.9 857.6 587.6 426.9 334.0 283.9 300.7Selling, administrative andgeneral expenses 359.8 370.5 333.4 325.0 316.8 286.8 272.3 259.4 259.1 290.0 327.5Other operating income(expense), net (26.0) (7.9) (19.9) (29.5) (6.2) (21.0) 222.8 22.9 9.9 69.6 12.3
Operating earnings 895.7 877.5 747.7 639.0 665.9 549.8 538.1 190.4 84.8 63.5 (14.5)Other income (expense), net (17.5) 9.2 13.0 13.4 14.6 (1.7) 3.1 7.5 6.7 0.0 3.0Interest income 1.6 1.2 0.6 4.4 0.8 0.3 1.0 0.9 1.1 3.4 0.9Interest expense 136.0 130.2 138.0 295.5 134.0 220.5 243.4 202.5 213.0 220.6 181.6
Earnings (loss) from continuingoperations before income taxes 743.8 757.7 623.3 361.3 547.3 327.9 298.8 (3.7) (120.4) (153.7) (192.2)Income taxexpense (benefit) 155.8 135.2 105.5 (232.1) 124.9 94.9 91.7 (24.5) (66.5) (78.4) (89.7)
Earnings (loss) from continuingoperations 588.0 622.5 517.8 593.4 422.4 233.0 207.1 20.8 (53.9) (75.3) (102.5)Earnings (loss) on discontinuedoperations, net of tax (3.5) (4.8) (2.0) 7.8 (2.9) (11.8) (2.2) 3.6 1.3 4.5 6.0Net earnings (loss) 584.5$ 617.7$ 515.8$ 601.2$ 419.5$ 221.2$ 204.9$ 24.4$ (52.6)$ $ ((70.8) 96.5)
Diluted earnings (loss) per shareContinuing operations 4.41$ 4.67$ 3.87$ 4.40$ 3.11$ 1.72$ 1.56$ 0.16$ (0.42)$ (0.58)$ (0.80)$Discontinued operations (0.02) (0.04) (0.02) 0.06 (0.02) (0.08) (0.02) 0.03 0.01 0.03 0.05Diluted net earnings (loss)per shar 4e .39$ 4.63$ 3.85$ 4.46$ 3.09$ 1.64$ 1.54$ 0.19$ (0.41)$ (0.55)$ (0.75)$
Gross profit as a percentageof total revenues 26.4% 25.5% 25.1% 25.5% 27.5% 25.1% 19.6% 15.4% 13.0% 11.1% 11.8%Net earnings (loss)As a percentage oftotal revenues 12.0% 12.5% 11.8% 15.5% 11.7% 6.5% 6.8% 0.9% -2.0% -2.8% -3.8%As a percentage ofaverage equity 10.1% 11.4% 10.2% 13.0% 9.4% 5.2% 5.0% 0.6% -1.4% -1.8% -2.4%
Effeff ctive tax rate 20.9% 17.8% 16.9% -64.2% 22.8% 29.0% 30.7% 660.5% 55.2% 51.0% 46.6%
p p
g ( ) ( ) (( ) )
p ( ) ( ) ( )

Supplemental 5
VULCAN MATERIALS COMPANY AND SUBSIDIARY COMPANIES
CONSOLIDATED BALANCE SHEETS AND OTHER FINANCIAL DATAdollarsl in millii ioll nsas of December 31 2020 2019 2018 2017 2016 2015 2014 2013 2012 2011 2010
AssetsCash and cash equivalents 1,197.1$ 271.6$ 40.0$ 141.6$ 259.0$ 284.1$ 141.3$ 193.7$ 275.5$ 155.8$ 47.5$Restricted cash 0.9 2.9 4.4 5.1 9.1 1.2 0.0 0.0 0.0 0.1 0.5Accounts and notes receivable 556.3 570.1 540.8 588.3 491.8 418.0 373.8 339.6 297.0 314.9 317.8Inventories 448.6 458.3 429.3 384.3 345.6 347.1 321.8 344.6 335.0 327.7 319.8Current deferred income taxes 18.1 17.8 0.0 0.0 0.0 0.0 39.7 40.4 40.7 43.0 54.7Other current assets 56.2 58.6 64.6 60.8 31.7 34.2 28.7 22.6 21.7 21.6 20.3Assets held for sale 0.0 0.0 0.0 0.0 0.0 0.0 15.2 10.6 15.1 0.0 13.2Total current assets 2,277.2 1,379.3 1,079.1 1,180.1 1,137.2 1,084.6 920.5 951.5 985.0 863.1 773.8
Investments and long-termreceivables 34.3 60.7 44.6 35.1 39.2 40.6 41.6 42.4 42.1 29.0 37.4Property, plant & equipment, net 4,426.0 4,316.0 4,237.3 3,918.9 3,261.4 3,156.3 3,071.6 3,312.0 3,159.2 3,418.2 3,632.9Operating lease ROU assets, net 423.1 408.2 0.0 0.0 0.0 0.0 0.0 0.0 0.0 0.0 0.0Goodwill 3,172.1 3,167.1 3,165.4 3,122.3 3,094.8 3,094.8 3,094.8 3,081.5 3,086.7 3,086.7 3,097.0Other assets 1,354.2 1,317.5 1,305.7 1,248.5 938.9 925.3 912.6 845.7 822.4 796.1 798.4Total 11,686.9$ 10,648.8$ 9,832.1$ 9,504.9$ 8,471.5$ 8,301.6$ 8,041.1$ 8,233.1$ 8,095.4$ ,$ 88,193.1 ,339.5
Liabilities and EquityCurrent maturities 515.4$ 0.0$ 0.0$ 41.4$ 0.1$ 0.1$ 150.1$ 0.2$ 150.6$ 134.8$ 5.2$Short-term borrowings 0.0 0.0 133.0 0.0 0.0 0.0 0.0 0.0 0.0 0.0 285.5Other current liabilities 532.5 535.6 469.6 401.5 372.1 353.4 301.3 298.9 285.0 271.5 291.5Liabilities of assets held for sale 0.0 0.0 0.0 0.0 0.0 0.0 0.5 0.0 0.8 0.0 0.1Long-term debt 2,772.2 2,784.3 2,779.4 2,813.5 1,982.8 1,980.3 1,834.6 2,496.2 2,495.2 2,644.5 2,427.5Operating lease liabilities 399.6 388.0 0.0 0.0 0.0 0.0 0.0 0.0 0.0 0.0 0.0All other noncurrent liabilities 1,439.9 1,319.0 1,247.2 1,279.6 1,544.0 1,513.6 1,577.9 1,499.7 1,402.7 1,350.7 1,373.9Equity 6,027.3 5,621.9 5,202.9 4,968.9 4,572.5 4,454.2 4,176.7 3,938.1 3,761.1 3,791.6 3,955.8Total 11,686.9$ 10,648.8$ 9,832.1$ 9,504.9$ 8,471.5$ 8,301.6$ 8,041.1$ 8,233.1$ 8,095.4$ ,$ 88,193.1 ,339.5
Other Financial DataAverage Capital EmployedCurrent maturities 296.4$ 0.0$ 0.5$ 49.1$ 0.1$ 60.7$ 12.7$ 58.7$ 203.4$ 15.6$ 315.7$Short-term borrowings 0.0 78.2 175.0 0.0 0.0 41.9 4.2 21.5 0.0 137.9 171.3Long-term debt 2,885.8 2,782.0 2,783.7 2,542.2 1,982.5 1,912.2 2,079.6 2,524.2 2,587.5 2,637.9 2,259.5All other noncurrent liabilities 1,795.9 1,659.8 1,242.6 1,511.4 1,506.3 1,567.2 1,505.6 1,454.0 1,315.5 1,303.5 1,417.1Equity 5,799.0 5,403.2 5,048.1 4,634.2 4,480.1 4,274.9 4,103.0 3,798.3 3,756.5 3,870.6 3,991.8Total 10,777.1$ 9,923.2$ 9,249.9$ 8,736.9$ 7,969.0$ 7,856.9$ 7,705.1$ 7,856.7$ 7,862.9$ ,$ 87,965.5 ,155.4
Capital ExpendituresCash purchases of property,plant & equipment 362.2$ 384.1$ 469.1$ 459.6$ 350.1$ 289.3$ 224.9$ 275.4$ 93.4$ 98.9$ 86.3$Accruals and other items forproperty, plant & equipment (1.4) 20.2 6.1 4.6 (5.2) 14.7 (1.8) 9.2 2.4 (1.0) (6.9)Debt issued for property, plant& equipment 2.6 0.0 0.0 0.0 0.0 0.0 0.0 0.0 0.0 0.0 0.0Total 363.4$ 404.3$ 475.2$ 464.2$ 344.9$ 304.0$ 223.1$ 284.6$ 95.8$ 97.9$ 79.4$
AcquisitionsCash paid 43.2$ 44.2$ 221.4$ 1,109.7$ 32.5$ 27.2$ 284.2$ 90.0$ 0.0$ 10.5$ 70.5$Stock issued 0.0 0.0 0.0 0.0 0.0 0.0 45.2 0.0 (0.1) 18.6 0.0Payable to seller 9.0 0.0 4.5 9.7 0.0 0.0 0.0 0.0 0.0 0.0 0.0Fair value - net assets swap 21.2 0.0 0.0 9.9 0.0 20.0 2.4 0.0 0.0 26.0 0.0Total 73.4$ 44.2$ 225.9$ 1,129.3$ 32.5$ 47.2$ 331.8$ 90.0$ (0.1)$ 55.1$ 70.5$
Working capital 1,229.3$ 843.8$ 476.6$ 737.2$ 764.9$ 731.1$ 468.6$ 652.4$ 548.6$ $ 1456.8 91.4Ratio of earnings to fixedcharges 1 5.3 5.5 4.3 2.1 4.0 2.2 2.1 1.0 0.5 0.4 0.1Total debt as a percentageof total capital 2 35.3% 33.1% 35.9% 36.5% 30.2% 30.8% 32.2% 39.0% 41.6% 42.6% 40.7%Average number of employees 9,194 9,072 8,525 8,039 7,375 7,024 6,794 7,027 6,993 7,555 7,9971 Ratiott of earningsii to fixeii d charges is the sum of earningsii from continuiii ngii operationsii before income taxes,xx minoriii tyii interest in earningsii of a consolidatedii subsidiii ary,iiamortizaii tionii of capitaliii zeii d interestrr and fixeii d charges net of interest capitaii lizaii tionii credirr ts,ii dividedii by fixeii d charges. Fixeii d charges are the sum of interest expenxx sebefore capitalizaii tionii credirr ts,ii amortizaii tionii of financiii ngii costs and one-thirdrr of lease cost.
2 Total debt as a percerr ntage of total capital is the sum of short-term borrowirr ngsii , current maturitiii esii and long-termrr debt, dividedii by total capital. Total capitalii is the sum oftotal debt and equityii .
( )

Supplemental 6
VULCAN MATERIALS COMPANY AND SUBSIDIARY COMPANIES
CONSOLIDATED STATEMENTS OF CASH FLOWSin millii ioll ns 2020 2019 2018 2017 2016 2015 2014 2013 2012 2011 2010
Operating ActivitiesNet earnings (loss) 584.5$ 617.7$ 515.8$ 601.2$ 419.5$ 221.2$ 204.9$ 24.4$ (52.6)$ (70.8)$ (96.5)$Adjustments to reconcile netearnings to net cash providedby operating activitiesDepreciation, depletion,accretion and amortization 396.8 374.6 346.3 306.0 284.9 274.8 279.5 307.1 332.0 361.7 382.1(Increase) decrease in assetsexcluding the initial effects ofbusiness acquisitions anddispositions 11.4 (113.2) (32.4) (147.9) (86.8) (33.5) (50.9) (38.4) (20.8) 4.4 (78.2)Increase (decrease) in liabilitiesexcluding the initial effects ofbusiness acquisitions anddispositions (51.1) (34.0) 25.4 (21.5) (6.0) 10.4 (42.4) (22.1) 41.2 (16.3) 98.2Other, net 128.8 139.0 (22.3) (93.1) 33.0 46.6 (130.1) 85.5 (61.3) (110.0) (102.9)Net cash provided byoperating activities 1,070.4$ 984.1$ 832.8$ 644.7$ 644.6$ 519.5$ 261.0$ 356.5$ 238.5$ 169.0$ 202.7$
Investing ActivitiesPurchases of property,plant & equipment (362.2) (384.1) (469.1) (459.6) (350.1) (289.3) (224.9) (275.4) (93.4) (98.9) (86.3)Proceeds from sale of property,plant & equipment 11.5 22.7 22.2 15.8 23.3 8.2 26.0 17.6 80.8 13.7 13.6Proceeds from sale of businesses 1.0 1.7 11.3 287.3 0.0 0.0 721.4 51.6 21.2 74.7 51.0Payment for business acquisitions (43.2) (44.2) (221.4) (1,109.7) (32.5) (27.2) (284.2) (90.0) 0.0 (10.5) (70.5)(Increase) decrease inmedium-term investments 0.0 0.0 0.0 0.0 0.0 0.0 0.0 0.0 0.0 0.0 3.6Other, net 11.4 (11.9) (12.9) (3.3) 2.1 (0.2) 0.1 0.0 1.7 1.1 0.7
Net cash provided by(used for) investing activities (381.5)$ (415.8)$ (669.9)$ (1,269.5)$ (357.2)$ (308.5)$ 238.4$ (296.2)$ 10.3$ (19.9)$ (87.9)$
Financing ActivitiesNet short-termborrowings (payments) 0.0 (133.0) 133.0 0.0 0.0 235.0 0.0 0.0 0.0 (285.5) 49.0Payment of current maturities,long-term debt and line of credit (250.0) 0.0 (892.1) (1,463.3) 0.0 (695.1) (579.8) (150.6) (134.8) (743.1) (519.2)Proceeds from issuance oflong-term debt 750.0 0.0 850.0 2,200.0 0.0 400.0 0.0 0.0 0.0 1,100.0 450.0Purchases of common stock (26.1) (2.6) (134.0) (60.3) (161.5) (21.5) 0.0 0.0 0.0 0.0 0.0Proceeds from issuance ofcommon stock 0.0 0.0 0.0 0.0 0.0 0.0 30.6 3.8 0.0 4.9 41.7Dividends paid (180.2) (164.0) (148.1) (132.3) (106.3) (53.2) (28.9) (5.2) (5.2) (98.2) (127.8)Proceeds from exercise ofstock options 0.0 0.0 0.0 0.0 0.0 73.0 23.5 9.8 10.5 3.6 20.5Excess tax benefits fromshare-based compensation 0.0 0.0 0.0 0.0 0.0 18.4 3.5 0.2 0.3 0.1 0.8Other, net (59.1) (38.6) (73.9) (40.7) (36.8) (23.6) (0.7) (0.1) 0.0 (23.0) (4.1)
Net cash provided by(used for) financing activities 234.6$ (338.2)$ (265.1)$ 503.4$ (304.6)$ (67.0)$ (551.8)$ (142.1)$ (129.2)$ (41.2)$ (89.1)$
Net increase (decrease) in cashand cash equivalents andrestricted cash 923.5 230.1 (102.2) (121.4) (17.2) 144.0 (52.4) (81.8) 119.6 107.9 25.7Cash and cash equivalentsand restricted cashat beginning of year 274.5 44.4 146.6 268.0 285.3 141.3 193.7 275.5 155.9 48.0 22.3Cash and cash equivalentsand restricted cashat end of year 1,198.0$ 274.5$ 44.4$ 146.6$ 268.1$ 285.3$ 141.3$ 193.7$ 275.5$ 155.9$ 48.0$
p g
( ) g ( ) ( ) ( ) ( ) ( ) ( ) ( ) ( ) ( )
( ) g ( ) ( ) ( ) ( ) ( ) ( ) ( ) ( ) ( )
y

Supplemental 7
VULCAN MATERIALS COMPANY AND SUBSIDIARY COMPANIES
TOTAL REVENUES, NET EARNINGS AND EARNINGS PER SHAREin millii ioll ns, exceptxx per share data 2020 2019 2018 2017 2016 2015 2014 2013 2012 2011 2010
Total RevenuesFirst quarter 1,049.2$ 996.5$ 854.5$ 787.3$ 754.7$ 631.3$ 574.4$ 538.2$ 535.9$ 487.2$ 493.3$Second quarter 1,322.6 1,327.7 1,200.2 1,030.8 956.8 895.1 791.1 738.7 694.1 702.0 736.2Third quarter 1,309.9 1,418.8 1,240.2 1,094.7 1,008.1 1,038.5 873.6 813.6 728.9 760.8 743.2Fourth quarter 1,175.1 1,186.1 1,088.0 977.5 873.1 857.3 755.1 680.2 608.4 614.6 586.2Total 4,856.8$ 4,929.1$ 4,382.9$ 3,890.3$ 3,592.7$ 3,422.2$ 2,994.2$ 2,770.7$ 2,567.3$ ,$ 22,564.6 ,558.9
Operating Earnings (Loss)First quarter 112.3$ 104.4$ 81.2$ 70.4$ 64.9$ 10.8$ 194.7$ (50.1)$ (46.3)$ (61.2)$ (36.8)$Second quarter 298.9 276.1 230.8 192.0 213.8 153.8 103.2 86.9 19.7 23.5 1.2Third quarter 288.1 303.4 249.2 227.5 227.1 212.2 140.3 99.8 55.9 106.7 50.4Fourth quarter 196.4 193.6 186.5 149.1 160.1 173.0 99.9 53.8 55.5 (5.5) (29.3)Total 895.7$ 877.5$ 747.7$ 639.0$ 665.9$ 549.8$ 538.1$ 190.4$ 84.8$ 63.5$ (14.5)$
Earnings (Loss) from ContinuingOperationsFirst quarter 60.0$ 63.9$ 53.4$ 43.5$ 42.0$ (36.7)$ 54.5$ (61.6)$ (57.1)$ (64.6)$ (44.5)$Second quarter 211.0 197.9 160.3 111.7 127.2 49.8 46.5 30.1 (17.0) (7.1) (22.5)Third quarter 201.1 218.1 179.9 110.2 145.1 126.2 67.8 42.2 15.6 22.4 10.6Fourth quarter 115.9 142.6 124.2 328.0 108.1 93.7 38.3 10.1 4.6 (26.0) (46.1)Total 588.0$ 622.5$ 517.8$ 593.4$ 422.4$ 233.0$ 207.1$ 20.8$ (53.9)$ $ ((75.3) 102.5)
Basic Earnings (Loss) Per Sharefrom Continuing OperationsFirst quarter 0.45$ 0.48$ 0.40$ 0.33$ 0.31$ (0.28)$ 0.42$ (0.47)$ (0.44)$ (0.50)$ (0.35)$Second quarter 1.59 1.50 1.21 0.84 0.95 0.37 0.35 0.23 (0.13) (0.05) (0.18)Third quarter 1.52 1.65 1.36 0.83 1.09 0.95 0.51 0.32 0.12 0.17 0.08Fourth quarter 0.87 1.08 0.94 2.47 0.82 0.70 0.29 0.08 0.03 (0.20) (0.36)Full year 4.44$ 4.71$ 3.91$ 4.48$ 3.17$ 1.75$ 1.58$ 0.16$ (0.42)$ $ ((0.58) 0.80)
Diluted Earnings (Loss) Per Sharefrom Continuing OperationsFirst quarter 0.45$ 0.48$ 0.40$ 0.32$ 0.31$ (0.28)$ 0.41$ (0.47)$ (0.44)$ (0.50)$ (0.35)$Second quarter 1.58 1.48 1.20 0.83 0.93 0.37 0.35 0.23 (0.13) (0.05) (0.18)Third quarter 1.51 1.63 1.34 0.82 1.07 0.93 0.51 0.32 0.12 0.17 0.08Fourth quarter 0.87 1.07 0.93 2.43 0.80 0.69 0.29 0.08 0.03 (0.20) (0.36)Full year 4.41$ 4.67$ 3.87$ 4.40$ 3.11$ 1.72$ 1.56$ 0.16$ (0.42)$ $ ((0.58) 0.80)
Net Earnings (Loss)First quarter 60.3$ 63.3$ 53.0$ 44.9$ 40.2$ (39.7)$ 54.0$ (54.8)$ (52.1)$ (54.7)$ (38.7)$Second quarter 209.9 197.6 159.7 120.1 124.7 48.2 46.0 28.8 (18.3) (8.1) (24.0)Third quarter 199.8 215.7 179.2 108.6 142.0 123.8 66.9 41.4 14.3 20.0 13.2Fourth quarter 114.5 141.1 123.9 327.6 112.6 88.9 38.0 9.0 3.5 (28.0) (47.0)Total 584.5$ 617.7$ 515.8$ 601.2$ 419.5$ 221.2$ 204.9$ 24.4$ (52.6)$ $ ((70.8) 96.5)
Basic Net Earnings (Loss)Per ShareFirst quarter 0.45$ 0.48$ 0.40$ 0.34$ 0.30$ (0.30)$ 0.41$ (0.42)$ (0.40)$ (0.42)$ (0.31)$Second quarter 1.58 1.49 1.21 0.91 0.93 0.36 0.35 0.22 (0.14) (0.06) (0.19)Third quarter 1.51 1.63 1.35 0.82 1.07 0.93 0.51 0.32 0.11 0.15 0.10Fourth quarter 0.86 1.07 0.94 2.47 0.85 0.67 0.29 0.07 0.03 (0.22) (0.37)Full year 4.41$ 4.67$ 3.90$ 4.54$ 3.15$ 1.66$ 1.56$ 0.19$ (0.41)$ $ ((0.55) 0.75)
Diluted Net Earnings (Loss)Per ShareFirst quarter 0.45$ 0.48$ 0.39$ 0.33$ 0.30$ (0.30)$ 0.41$ (0.42)$ (0.40)$ (0.42)$ (0.31)$Second quarter 1.58 1.48 1.19 0.89 0.92 0.36 0.35 0.22 (0.14) (0.06) (0.19)Third quarter 1.50 1.62 1.34 0.81 1.05 0.91 0.50 0.31 0.11 0.15 0.10Fourth quarter 0.86 1.06 0.93 2.43 0.83 0.65 0.28 0.07 0.03 (0.22) (0.37)Full year 4.39$ 4.63$ 3.85$ 4.46$ 3.09$ 1.64$ 1.54$ 0.19$ (0.41)$ (0.55)$ (0.75)$
p p
( )
( ) (( ) )
y ( ) (( ) )
y ( ) (( ) )
( ) (( ) )
y ( ) (( ) )
y ( ) ( ) ( )

Supplemental 8
VULCAN MATERIALS COMPANY AND SUBSIDIARY COMPANIES
COMMON STOCK PRICES, DIVIDENDS AND RELATED DATA2020 2019 2018 2017 2016 2015 2014 2013 2012 2011 2010
Common Stock Prices
First quarter High 149.05$ 120.00$ 141.20$ 136.82$ 106.78$ 86.25$ 69.50$ 59.48$ 48.09$ $ 547.18 4.36Low 65.56 95.31 110.23 108.95 78.83 64.28 57.55 49.95 38.78 39.77 41.80Close 108.07 118.40 114.17 120.48 105.57 84.30 66.45 51.70 42.73 45.60 47.24
Second quarter High 128.79 137.92 133.59 134.92 121.22 93.07 68.29 55.74 43.91 46.80 59.90Low 88.60 118.37 108.17 116.26 104.61 80.58 58.88 45.42 32.31 36.51 43.60Close 115.85 137.31 129.06 126.68 120.36 83.93 63.75 48.41 39.71 38.53 43.83
Third quarter High 136.44 152.49 131.52 130.12 127.20 102.65 66.55 54.37 49.99 39.99 48.04Low 114.33 132.51 106.10 111.77 106.42 84.10 60.20 46.21 35.69 27.44 35.61Close 135.54 151.24 111.20 119.60 113.73 89.20 60.23 51.81 47.30 27.56 36.92
Fourth quarter High 153.88 152.47 114.59 129.63 138.18 106.84 69.10 60.14 53.85 45.00 48.26Low 131.36 131.50 82.52 115.01 105.71 87.40 54.10 50.32 44.19 25.06 35.40Close 148.31 143.99 98.80 128.37 125.15 94.97 65.73 59.42 52.05 39.35 44.36
Year High 153.88 152.49 141.20 136.82 138.18 106.84 69.50 60.14 53.85 47.18 59.90Low 65.56 95.31 82.52 108.95 78.83 64.28 54.10 45.42 32.31 25.06 35.40Close 148.31 143.99 98.80 128.37 125.15 94.97 65.73 59.42 52.05 39.35 44.36
Dividends Declared Per Shareof Common Stock 1
First quarter 0.34$ 0.31$ 0.28$ 0.25$ 0.20$ 0.10$ 0.05$ 0.01$ 0.01$ 0.25$ 0.25$Second quarter 0.34 0.31 0.28 0.25 0.20 0.10 0.05 0.01 0.01 0.25 0.25Third quarter 0.34 0.31 0.28 0.25 0.20 0.10 0.06 0.01 0.01 0.25 0.25Fourth quarter 0.34 0.31 0.28 0.25 0.20 0.10 0.06 0.01 0.01 0.01 0.25Full year 1.36$ 1.24$ 1.12$ 1.00$ 0.80$ 0.40$ 0.22$ 0.04$ 0.04$ 0.76$ 1.00$
Other DataMarket value of debt (in millions) 3,443$ 3,074$ 2,696$ 2,675$ 2,243$ 2,205$ 2,275$ 2,821$ 2,917$ 2,931$ 2,564$Market value of equity (in millions) 19,653 19,060 13,018 16,987 16,562 12,623 8,622 7,722 6,752 5,085 5,703Total enterprise value (in millions) 23,096$ 22,134$ 15,714$ 19,662$ 18,805$ 14,828$ 10,897$ 10,543$ 9,669$ ,$ 88,016 ,267
Price earnings ratio (year end)High 35.1 32.9 36.7 30.7 44.7 65.1 45.1 316.5 N/A N/A N/ALow 14.9 20.6 21.4 24.4 25.5 39.2 35.1 239.1 N/A N/A N/AClose 33.8 31.1 25.7 28.8 40.5 57.9 42.7 312.7 N/A N/A N/A
Dividends paid as a percentageof diluted net earnings per share 31.0% 26.8% 29.1% 22.4% 25.9% 24.4% 14.3% 21.6% N/A N/A N/AEquity per common share 45.46$ 42.49$ 39.30$ 37.50$ 34.33$ 33.44$ 31.77$ 30.23$ 28.99$ $ 329.31 0.96Ratio of stock price to equity percommon share at year end 3.3 3.4 2.5 3.4 3.6 2.8 2.1 2.0 1.8 1.3 1.4Common shares outstandingat year end (in millions) 132.5 132.4 131.8 132.3 132.3 133.2 131.9 130.2 129.7 129.2 128.6Weighted-average common sharesoutstanding (in millions) 132.6 132.3 132.4 132.5 133.2 133.2 131.5 130.3 129.7 129.4 128.1Weighted-average common sharesoutstanding, assuming dilution(in millions) 133.2 133.4 133.9 134.9 135.8 135.1 133.0 131.5 129.7 129.4 128.1
1 Dividendsii paidii in 2020 totaled $180,216,000 as compared withii $163,973,000 paidii in 2019. On February 12, 2021, our Board of Direii ctors authorizeii d a quarterlyldividenii d of 37 cents per common share payable Marchrr 15, 2021.
y
p ( )

Supplemental 9
VULCAN MATERIALS COMPANY AND SUBSIDIARY COMPANIES
RECONCILIATION OF NON-GAAPAA MEASURESin millii ioll ns 2020 2019 2018 2017 2016 2015 2014 2013 2012 2011 2010
Reconciliation of NetEarnings to EBITDANet earnings (loss) 584.5$ 617.7$ 515.8$ 601.2$ 419.5$ 221.2$ 204.9$ 24.4$ (52.6)$ (70.8)$ (96.5)$Income tax expense (benefit) 155.8 135.2 105.5 (232.1) 124.9 94.9 91.7 (24.5) (66.5) (78.4) (89.7)Interest expense, net 134.4 129.0 137.4 291.1 133.2 220.2 242.4 201.7 211.9 217.2 180.7(Earnings) loss on discontinuedoperations, net of tax 3.5 4.8 2.0 (7.8) 2.9 11.8 2.2 (3.6) (1.3) (4.5) (6.0)EBIT 878.2 886.7 760.7 652.4 680.5 548.1 541.2 198.0 91.5 63.5 (11.5)PlusDepreciation, depletion, accretionand amortization fromcontinuing operations 396.8 374.6 346.3 306.0 285.0 274.8 279.5 307.1 332.0 361.7 382.1
EBITDA 1,275.0$ 1,261.3$ 1,107.0$ 958.4$ 965.5$ 822.9$ 820.7$ 505.1$ 423.5$ 425.2$ 370.6$
EBITDA is an acronym for Earnings Before Interest, TaxTT es,xx Depreciatiii onii and Amortizaii tion.ii Generallyll Accepted Accountingii Prinrr ciplii es (GAAP) does not defineii thisii metricrr . EBITDADDshould not be consideii red as an alternarr tive to earnirr ngsii measuresrr definedii by GAAP.
We present EBIT and EBITDADD for the convenienceii of investment professionalsii who use such metricrr s in theirii analyses and for shareholders who need to understand the metricrr s weuse to assess performanrr ce. We use EBITDADD and other such measures to assess the operatirr ngii performance of our business and for a basisii of strategrr ic planningii and forecastingiias we believeii that it closely correlates to long-term shareholder value. We do not use these metricrr s as a measure to allocate resources.

Supplemental 10
VULCAN MATERIALS COMPANY AND SUBSIDIARY COMPANIES
BOARD OF DIRECTORS AND COMMITTEES
BOARD OF DIRECTORS
J. THOMAS HILLChairman, President andChief Executive Officff erVulcan Materials Company
JAMES T. PROKOPANKOFormer President and Chief ExecutiveOfficerThe Mosaic Company
CHAIRMAN EMERITIDonald M. James
MELISSA H. ANDERSONSenior Vice President,Chief Human Resources Offiff cerAlbemarle Corporation
KATHLEEN L. QUIRKExecutive Vice President andChief Financial Offiff cerFreeport-McMoRan Inc.
DIRECTORS EMERITIMarion H. AntoniniH. Allen FranklinAnn M. KorologosDouglas J. McGregorJames V. NapierDonald B. RiceVincent J. Trosino
THOMAS A. FANNINGChairman, President andChief Executive Officff erSouthern Company
DAVID P. STEINERFormer President and Chief ExecutiveOfficerWaste Management, Inc.
O. B. GRAYSON HALL, JR.Former Chairman andChief Executive Officff erRegions Financial Corporation
LEE J. STYSLINGER, IIIChairman and Chief Executive Offiff cerAltec, Inc.
CYNTHIA L. HOSTETLERTrusteeInvesco Funds
GEORGEWILLISFormer President, U. S. OperationsUnited Parcel Service
RICHARD T. O'BRIENFormer President and Chief ExecutiveOfficerBoart Longyear Ltd.
BOARD COMMITTEES
EXECUTIVEThomas A. FanningO. B. Grayson Hall, Jr.J. Thomas Hill*����� =� 2MB���David P. SteinerLee J. Styslinger, III
COMPENSATIONMelissa H. AndersonThomas A. Fanning*James T. ProkopankoLee J. Styslinger, III
GOVERNANCEO. B. Grayson Hall, Jr.Cynthia L. HostetlerJames T. ProkopankoDavid P. Steiner*
AUDITThomas A. FanningRichard T. O'BrienKathleen L. Quirk*George Willis
FINANCEO. B. Grayson Hall, Jr.*Cynthia L. HostetlerKathleen L. QuirkDavid P. Steiner
SAFETY, HEALTH ANDENVIRONMENTAL AFFAIRSMelissa H. AndersonRichard T. O'BrienLee J. Styslinger, III*George Willis
* Chair

Supplemental 11
VULCAN MATERIALS COMPANY AND SUBSIDIARY COMPANIES
CORPORATE AND CONSTRUCTION MATERIALS OFFICERS
CORPORATE OFFICERSJ. THOMAS HILLChairman, President andChief Executive Officff er(2015/1996) Age 61
DAVID P. CLEMENTSenior Vice President(2019/2004) Age 60
RANDY L. PIGGVice President, Controller andPrincipal Accounting Officff er(2018/2005) Age 48
SUZANNE H. WOODSenior Vice President andChief Financial Offiff cer(2019/2018) Age 61
DENSON N. FRANRR KLIN IIISenior Vice President,General Counsel and Secretaryr(2019/2019) Age 57
STANLEY G. BASSChief Strategy Offiff cer(2021/1996) Age 59
JERRY F. PERKINS JR.Senior Vice President(2020/2002) Age 51
THOMPSON S. BAKER IIChief Operating Offiff cer(2019/2017) Age 62
JASON P. TETERSenior Vice President(2020/2013) Age 46
CONSTRUCTION MATERIALS OFFICERSCHRISTINA M. ALVORDPresident, Central Division(2019/2016) Age 53
JEFFREY S. MAYPresident, Mountain West Division(2019/2006) Age 48
S. MARTIN THORPEPresident, Business Development(2020/2000) Age 64
ERNESTO ENRIQUEZ-CASTILLOPresident, International Division(2015/2013) Age 46
BRIAN G. PACEPresident, Mideast Division(2020/2001) Age 42
SHELLEY R. WRIGHTPresident, Southwest Division(2020/2006) Age 44
C. BROCKWAY LODGE, JR.President, Asphalt & ConstructionDivision(2020/2001) Age 48
DAVID B. PASLEYPresident, Operations Supportr(2018/1999) Age 62
JEFFERYRR G. LOTTPresident, Business Development, South(2020/2001) Age 62
JAMES T. POLOMSKYPresident, Western Division(2020/2007) Age 44
Dates indicate year appointed to presentposition/year employed by Vulcan.
Ages are as of March 1, 2021.

Supplemental 12
VULCAN MATERIALS COMPANY AND SUBSIDIARY COMPANIES
SHAREHOLDER INFORMATIONHOW TO REACH US GENERAL INFORMATIONShareholrr der Servicvv esOur transfer agent and registrar, ComputershareShareowner Services LLC (Computershare), has a direct������� ������ �� ��� ��� ����� ���� ��%����� ����change of address, account balances, recent dividendinformation, dividend checks, reportable income anddividend reinvestment.
Notictt e of Annual Meetintt gThe annual meeting of shareholders will be held at the#������� ���%����, 1200 Urban Center Drive,Birmingham, Alabama 35242, or virtually via the internet ifwarranted due to the COVID-19 pandemic, on Friday,May 14, 2021, at 9:00 a.m., Central Daylight Time. Aformal notice of the meeting and proxy materialsaccompany this report.
Telephone(866) 886-9902(toll-free inside the U.S. and Canada)(201) 680-6578(outside the U.S. and Canada, may call collect)(800) 231-5469(TDD, hearing impaired)
EleEE ctrott nic Deposit of DividendsddRegistered holders of our common stock may have theirquarterly dividends deposited to their checking or savingsaccount free of charge. Contact Computershare personnelto sign up for this service.Telephone: (866) 886-9902Internet: www.computershare.com/investor
MailVulcan Materials Companyc/o ComputersharePO Box 30170College Station, TX 77842-3170Internet: www.computershare.com/investor
Direii ct Stock Purcharr se andDividend Reinvii esvv tment PlanllThe Computershare CIP direct purchase and dividendreinvestment plan offeff rs both existing registeredshareholders and first-time investors an affoff rdablealternative for investing in the Company, including theability to purchase additional shares of our common stock.A brochure describing this service may be obtained bycalling or visiting:Telephone: (866) 886-9902Internet: www.computershare.com/investor
Investor Relatll iott nsMark D. WarrenTelephone: (205) 298-3220E-mail: [email protected]
Community &Governmerr ntaltt RelationsJanet F. KavinokyTelephone: (205) 298-3220E-mail: [email protected]
Internetrr Addresrr sOur internet address is www.vulcanmaterials.com. Thiswebsite includes general Company information, Securitiesand Exchange Commission filings, investor information andan archive of recent news releases.
Independent AuditorsDeloitte & Touche LLPBirmingham, Alabama
Corporrr arr te Headquarterr rsVulcan Materials Company1200 Urban Center DriveBirmingham, Alabama 35242-2545Telephone: (205) 298-3000 Fax: (205) 298-2963
New Yorkrr Stock Exchx ange (NYSE) Assertiorr nsOur common stock is listed and traded on the NYSE underthe symbol VMC.On June 4, 2020, J. Thomas Hill, Chairman, President andChief Executive Offiff cer, submitted to the NYSE the WrittenAffirmff ation required by the rules of the NYSE certifying thathe was not aware of any violations by Vulcan MaterialsCompany of NYSE Corporate Governance listingstandards.The certifications of Mr. Hill and Suzanne H. Wood, SeniorVice President and Chief Financial Offiff cer, made pursuantto Section 302 of the Sarbanes-Oxley Act of 2002, havebeen filed as exhibits to our 2020 Annual Report on Form10-K.
Copyright © 2022 FDOKUMEN