VOLUME 6b: COMMISSION V: POSTER SESSIONS
420
ACAPULCO, MEXICO JULY 10-16, 1994 VOLUME 6b: COMMISSION V: POSTER SESSIONS Transactions 1 5 th World Congress of Soil Science 15 Bodenkundlicher Weltkongress 15 ème Congres Mondial de la Science du Sol 15° Congreso Mundial de la Ciencia del Suelo
-
Upload
khangminh22 -
Category
Documents
-
view
0 -
download
0
Transcript of VOLUME 6b: COMMISSION V: POSTER SESSIONS

ACAPULCO, MEXICO JULY 10-16, 1994
VOLUME 6b: COMMISSION V: POSTER SESSIONS
Transactions
15th World Congress of Soil Science 15 Bodenkundlicher Weltkongress
15 è m e Congres Mondial de la Science du Sol 15° Congreso Mundial de la Ciencia del Suelo


VOLUME 6b: COMMISSION V: POSTER SESSIONS
Transactions
15 th World Congress of Soil Science 15 Bodenkundlicher Weltkongress
15 è m e Congres Mondial de la Science du Sol 15° Congreso Mundial de la Ciencia del Suelo

Editorial Committee:
J. D. Etchevers B., Editor, Mexican Society of Soil Science
A. Aguilar S., President, International Society of Soil Science
R. Nunez E., Vice-President, International Society of Soil Science
G. Alcantar G., President, Organizing Committee 15 World Congress of Soil Science;
P. Sdnchez G., Chairman, Program Committee 15 World Congress of Soil Science
To the readers:
The Transactions of the 15 World Congress of Soil Science consist of 16 books. Volume 1 contains the Inaugural and the State of the Art Conferences. Volumes 2a to 8a contain the papers presented in the Symposia corresponding to Commissions I to VII, respectively. Volumes 2b to 8b contain the Extended Summaries of the papers presented at the poster sessions corresponding to Commissions I to VII, respectively. Volume 9 is a supplement containing papers not included in previous books.
Acknowledgments:
The International Society of Soil Science and the Mexican Society of Soil Science acknowledge the grants received from two Organizations of the Mexican Federal Government: the Instituto Nacional de Estadistica, Geografia e Informética (INEGI) and the Comisión Nacional del Agua (CNA) which made possible the publication of these Transactions.

15th World Congress of Soil Science Acapulco, Mexico, July 1994
TRANSACTIONS
Volume 6b Commission V: Poster Sessions
A ! Acapulco, México I INSTITUTO NRCIONRL D€ ESTROISTICR
G60GRRRR € INFORMRTICR
COMISION NACIONAL DEL AGUA
International Society of Soil Science

Published in 1994 by
THE INTERNATIONAL SOCIETY OF SOIL SCIENCE
and
THE MEXICAN SOCIETY OF SOIL SCIENCE
Copyright 1994
International Society of Soil Science
and
Mexican Society of Soil Science
MEXICAN SOCIETY OF SOIL SCIENCE ISBN 968-6201-15-7 (all transactions volumes)
ISBN 968-6201-24-6 (this volume)
INSTITUTO NACIONAL DE ESTADISTICA GEOGRAFIA E INFORMATICA
ISBN 970-13-0143-9 (all transactions volumes) ISBN 970-13-0140-4 (this volume)
Printed by courtesy of INEGI and CNA (Mexico) July 1994

CONTENTS
Commission V Page
Poster Session Symposium Va
Utilization of soil information in systems modelling for sustainable agriculture and global climate change 2
Poster Session Symposium Vb
Modelling soil genetic processes 42
Poster Session Symposium B
Micromorphological indicators of anthropological effects on soils 141
Poster Session Symposium ID-4
Soils and archeological research 165
Poster Session Symposium ID-8
An international framework for evaluating sustainable land management 187
Poster Session Symposium ID-13
Indurated volcanic soils: Use and management 212
Poster Session Symposium ID-15
Soil data needs for expressing land qualities at different scales 253
Poster Session Symposium ID-21
Representing soil spatial variability in geographical information systems for resource assessment and environmental monitoring 293
Poster Session Symposium ID-22
A world reference base for soil resources 250
1

Commission V. Extended Summaries. Wednesday, July 13
Symposium Va. Utilization of Soil Information in Systems Modelling for Sustainable Agriculture and Global Climate Change.
Page The ACCESS Project: Part 1, Background and the simple modelling approach. M.D.A. Rounsevell, T.R. Mayr, and P.J. Loveland. (UK) 4
The ACCESS Project: Part 2, Prediction of the influence of climate change on water requirements of crops in south france using access-II. J.P. Legros, M. Voltz, M. Bornand, L. Kling, and D. Leenhardt. (France) 6
The ACCESS Project: Part 3, models to predict the impact of climate change on the hydrology of soils using access-II. A.C. Armstrong, A.M. Matthews, and A.M. Portwood. (UK) 8
The ACCESS Project: Part 4, a submodel of bypass flow in cracking soils. C. SlawiHski, H.A. Sobczuk, R.T. Walczak, and J. Wasik. (Poland) 10
The ACCESS Project: Part 5, expert evaluation models for assessing the impacts of climate change on soil degradation. J. Crompvoets, F. Mayol, G. Aguirre, and D. de la Rosa. (Spain) 12
Utilization of soils information for assessment of climate change and mans impact. V.A. Lobanov. (Russia) 14
Use of soil information in the regional modelling of water runoff and soil erosion risks. Y. Le Bissonnais, D. King, and C. King. (France) 16
Climate change, soil hydrology and crop potential. J.P. Legros, P.J. Loveland, L. Kling, and M.D.A. Rounsevell. (France) 18
Evaluation of some desertie land in western site of Suez Canal, Egypt. O.A. Gobran, M.S. Amira, and R.B. Shehata. (Egypt) 20
Resources evaluation, environmental damage and ecological planning in land use in the Mezquital Valley, Hidalgo, Mexico. F. López, D. Munoz, A. Mendoza and A. Soler. (Mexico). 22
Edafologic regionalization in the northern region of coahulao: A rangeland overview. P. Hernandez R., A. Rodriguez G., J.A. Ortega S., E. Medina M. and E. Cuellar V. (Mexico). 24
Influences of ecological factors upon the development and functioning of soils in forest ecosystem. M. Sokolovska. (Bulgaria) 26
Ecological regionalization of the semiarid zones of the state of Zacatecas and location of areas ecologically deteriorated. R. Veyna and J.G. Bustamante. (Mexico) 27
Soil characterization of broadleaved forests in Spain. M.P. Carretero Carrero, O. Sanchez Palomares, and R.E. Rosello. (Spain) 29
2

Soils evaluation diagnosis method to elaboration of agroforestry aptitude map in a montanious zone of Cuba. F.A. Ancizar, and J. Sanchez Perez. (Cuba) 31
Reconnaissance sampling to determine the optimum number of soil observations for a detailed soil survey. M. Enriquez, and J.A. Viloria (Venezuela) 33
Some principles for classification, nomenclature and diagnostics of reclaimed lands without humus cover. M. Banov, and B. Christov. (Bulgaria) 35
Classification and land use of major soils along Lake Victoria swampland area, Kenya. V.P. D'Costa and J.P. Mbuvi. (Kenya) 37
Agroecological zoning of sorghum (Sorghum bicolor L. Moench) under rain-depending conditions in the State of Guerrero. F.F. Martinez V., R. Gonzalez M., J.M. Reyes, G. Sarabia R., and D. Pajaro H. (Mexico) 39
Integration of soil information to assess agrotechniques through models validated on true agro-ecosystems. Method and examples. M.B. Bouche. (France) 41
3

The ACCESS Project: Part 1, Background and the simple modelling approach
M.D.A. Rounsevell*, T.R. Mayr and P.J. Loveland. Soil Survey & Land Research Centre, Cranfield University, Silsoe, Beds MK45 4DT, UK.
Background. The ACCESS (AgroClimatic Change and European Soil Suitability) project is being funded by the Commission of the European Communities under the Third Framework Programme. The principle aim of the project is to assess the effects of climate change on the land-use potential of strategic European crops on a spatial basis. Because of the limitations encountered when applying models spatially, ACCESS comprises two closely related modelling components: ACCESS-I and ACCESS-II. ACCESS-I is a simpler model requiring fewer data inputs (i.e. monthly meteorological data and simple soil survey data), and ACCESS-D is a more detailed model requiring comprehensive data inputs. The principle of developing two models in parallel is that the simple model can be applied spatially more easily, but is likely to give less reliable results, whereas although we can be more confident in the output of the complex model it is difficult to apply spatially. Consequently, ACCESS-D will be applied to well documented sites or sub-regions and will be used to validate the results of ACCESS-I when applied over large geographical areas (normally regions).
A comprehensive overview of the project is being presented as a plenary paper entitled: A spatially distributed soil, agroclimatic and soil hydrological model to predict the effects of climate change within the European Community by Loveland et al. It is the purpose of this series of poster papers to outline in detail each component of the ACCESS project. In part 1, we describe the development and application of ACCESS-I. In part 2, Legro et al. explain the mechanisms of ACCESS-II. In part 3, Armstrong et al. outline attempts to improve the soil hydrological components of ACCESS. In part 4, Slawinski et al. describe the bypass flow model, and in part 5, Crompvoets et al. describe the land vulnerability sub-modules.
Methods: ACCESS-I. ACCESS-I will evaluate the productivity of the following strategic European crops; winter wheat, potatoes, sugar beet, soya and sunflower. The principle component of the model is the soil water balance. This is required to operate using monthly meteorological inputs only and so makes the following assumptions:
• The soil profile is divided using two independent criteria: the intrinsic soil physical properties (topsoil and subsoil) and the presence of the crop root system {root zone and no-root-zone). The boundary between topsoil and subsoil is established from the horizon depths of the input data. The boundary between root zone and no-root-zone changes in time according to root system development. Therefore, the percentage of topsoil and subsoil in the root zone also changes with time.
• A monthly soil water balance is calculated only for the root zone. The no-root-zone is regarded, over the simulation period, to have the same soil matric potential (water content) as at the beginning of the simulation (initial condition). Therefore, the model acts like a piston-
4

type model. The root zone is considered homogeneous with respect to the soil physical properties and root system development. Therefore, in the root-zone the soil water content for given values of soil matric potential is the weighted average between the water contents in the topsoil and those in the subsoil. The weighting factors are derived from the percentage of topsoil and subsoil depths in the root-zone.
The water balance model considers evaporation and transpiration separately and a}so defines the root front development and root density. Crop yields are estimated using the concept of water use effeciency (1). The effect of variable atmospheric CO2 concentration is modelled using the approach of Goudrian & De Ruiter (2). Soil hydraulic properties are estimated using pedo-transfer functions from simple soil survey data (particle-size distribution, organic carbon content and bulk density). Where possible other limitations to crop production are introduced into the model. This includes soil workability and thermal limit cut-offs (accumulated temperature).
Climate change assessments. ACCESS-I was developed for regional spatial application its output of yield class being illustrated on maps for different land units. The model will be applied to different European test regions representing a range of agroclimatic zones including central England, southern France, southern Spain, Hungary, and Poland. The model is flexible enough to accommodate a range of climate change scenarios or sensitivity tests depending on the specifications of the user. For demonstration purposes, the long-term average or baseline climate will be perturbed by incremental changes to the temperature and precipitation data. This will indicate the potential response of crop productivity to changes in the climate.
Conclusions. Maintaining minumum data inputs was a prerequisite of the model, but this led to certain problems. In particular, difficulties are encountered where precipitation is distributed over the month because sometimes daily properties must be considered e.g. surface runoff and workability. Further development of ACCESS-I will seek to incorporate other aspects of the crop production system into the framework of the model including management factors.
Literature cited. (1) Spiertz, J.H.J. 1974. Grain growth and distribution of dry matter in the wheat plant as
influenced by temperature, light energy and ear size. Neth. J. Agric. Sci., 22: 207-220. (2) Goudrian, J. & de Ruiter, H.E. 1983. Plant growth in response to CO2 enrichment, at two levels
of nitrogen and phosphorus supply. 1. Dry matter, leaf area and development. Neth. J. Agric. Sci. 31: 157-169.
5

The ACCESS Project: Part 2, Prediction of the influence of climate change on water requirements of crops in south
France using ACCESS-II
J-P. Legros*, M. Voltz, M. Bornand, L. Kling and D. Leenhardt. I.N.R.A. Science du Sol, Place Viala, 34060 Montpellier Cedex, France
Introduction. We present here the use of ACCESS-II, a combined water balance and crop growth model with daily calculation time steps, for simulating the effect of expected climate change on water requirements of crops up to 2050 in a test area in south France. Four different crops are considered: wheat, maize, soya and sunflower.
Methods. The soil water balance submodel is a modified version of a model developed previously (1). Its main features are as follows. The soil is represented as a collection of water reservoirs, each of them being 5 cm thick. Rainfall infiltrates the topsoil and cascades from one reservoir to the reservoir below following a rate that is a function of the water content and the saturated hydraulic conductivity of the draining reservoir. Evaporation and transpiration are simulated separately. The climatic demand, i.e potential evapotranspiration, is first partitioned into potential evaporation and potential transpiration by anlogy to Beer-Lambert's Law. the partition is a function of the leaf area index (2). Actual soil evaporation is determined empirically as a function of the degree of saturation of the surface layer. The evaporation determined in this manner is extracted from the different soil reservoirs to give account of the capillary flow from the deeper reservoirs toward the surface layer during the course of evaporation (3). The actual transpiration is simulated following an electrical analogy (4).
The crop growth submodel is extracted in part from the revised EPIC model (5). Special attention is given to leaf growth and its dependance on soil water availability for leaf area is an important factor for the separation of evaporation and transpiration. Potential leaf growth is calculated as a function of accumulated heat units during the cropping season, and the actual leaf growth is restricted in case of water stress. Evolution of maximum root depth is considered to follow a sigmoid curve.
Calibration and validation of the model were done independently on separate field experiments grown with maize, wheat and soya crops. These experiments were made available by INRA Avignon (Brisson and Delecolle, unpublished data) and INRA Toulouse (Cabelguenne, unpublished data). Calibration and validation are satisfying in most cases, although further improvements of the model are necessary for locations where water tables exist.
The test area for the study is the Languedoc plain in south France. Its climate is of Mediterranean type and exhibits, typically of this location, average annual rainfalls of 600 mm to 900 mm. However, there is a large inter-annual variability of rainfall, which ranges from 350 mm to 1200 mm. Most rainfall occurs as storms.
6

Discussion. For simulating the effect of climate change from now to 2050, it is necessary to make an estimate of the future climate. The difficulty is that meteorologists only predict changes in mean annual values of temperature and rainfall. This is insufficient because, for example, in water balance simulation changes in the intensities and in the temporal distribution of rainfall should be known. To build realistic climate change scenarios, we assume that in comparison with the present climate, the proportion of dry years will increase such as to meet on average the values predicted by the GCM models for our study area. In this way, the predicted climate remains coherent with respect to the relationships between climatic variables (T, PET, Rainfall).
Simulations have been run for maize, wheat, soya and sunflower crops, both over a collection of 30 years of the present climate and over a collection of 30 years derived from the previous one as explained above.
Literature cited. (1) Leenhardt D., 1991. Spatialisation du bilan hydrique. Thse Fxole Nationale Suprieure d'Agronomie de Montpellier, 129 pp. (2) Ritchie J.T., 1972. Model for predicting evaporation from a row crop with incomplete cover. Water resour. Res., 8(5): 1204-1211. (3) Van Keulen H., 1975. Simulation of water use and herbage growth in arid regions. Simulation Monographs, Pudoc, Wageningen, 176 pp. (4) Floret C, Pontanier R. and Rambal S., 1982. Measurement and modelling of primary production and water use in south Tunisian steppe. Journal of Arid Environments, 5: 77-90. (5) Quinones H. and Cabelguenne M., 1990. Use of EPIC to study cropping systems. II Improved simulation of the water use, growth and harvest index in corn. Agriculture Mediterraneenne, 120: 241-248.
7

The ACCESS Project: Part 3, Models to predict the impact of climate change on the hydrology of soils using ACCESS-II
A.C. Armstrong* , A.M. Matthews and A.M. Portwood. ADAS Soil & Water Research Centre, Anstey Hall, Maris Lane, Trumpington, Cambridge CB2 2LF, UK.
Introduction. Models are developed within the context of a problem that needs a solution. The choice of the appropriate model thus requires the specification of the aims and contexts of the model. The ACCESS (AgroClimatic Change and European Soil Suitability) project requires a model of soil water capable of operation within a spatially distributed context. This places two main constraints: speed of operation and availability of parameters within a GIS context. Two models are described that meet some of these needs, and the chosen model described in more detail.
Methods. The SWAP model (Soil Water Partitioning) functions as a stand alone model to predict the partitioning of incident rainfall into four components: surface runoff, drainage, matrix infiltration and macropore flow. The partition is critically dependent on the estimation of peak runoff rate, and relationships are derived between this variable and daily rainfall totals. The components can then be integrated with a simple water balance model to predict sequences for the soil moisture state. Simple calculations suggest that the impact of a climate change scenario with wetter winters, but drier summers, is to increase the amount of through drainage while not greatly affecting the amount of surface runoff or macropore flow.
The SWAP model however, relies on some simple empirical parameters to express the relationship between matrix and macropore infiltration rates. As these cannot yet be easily identified from basic soil physical parameters, the pedo-transfer functions necessary to build this model into a GIS have not yet been developed. Although it operates very rapidly it cannot yet be integrated into a G1S until suitable estimation procedures for these parameters are derived. For this reason, the model so far exists only as a single site stand alone model, and is not used directly within the ACCESS project.
For integration into a GIS, models based on parameters that are capable of estimation by pedo-transfer functions are required. Paradoxically, because more work has been done on this point it is pqssible to use models with the Richards' equation to solve the unsaturated water movement. Estimation procedures are available which give the parameters of the water release and hydraulic conductivity relationships (most commonly using the van Genuchten form of these relationships) as a function of the particle size distribution.
Consequently for integration into the ACCESS program, a model has been developed which includes the insights of the SWAP model, but which relies on the Richards equation to model the soil water behaviour. The resultant model which considers the distribution and availability of water within the profile either as a resource for the crop, and as the effect of crop root extraction, is also more easily integrated with models of crop behaviour. The main problem then lies in achieving an
8

efficient method of deriving solutions. Three major areas are available for choice:
1. Choice of the soil profile discretisation scheme. The more detail that is required, the more the computational effort, but also the easier the solutions are to derive;
2. Handling of the error terms. It is considered that for climate change modelling, that short term errors in the water distribution can be tolerated provided that overall balances are maintained;
3. Robustness over a wide range of conditions is required if the model is to function without problems over a spatially distributed set of conditions;
Discussion. A model using the Kirchoff transform to solve the Richards' equation, coupled to simple drainage models to predict water table movements, is described. Parameters for the model are derived from pedo-transfer functions. However, solution times are relatively long and so the model requires considerable resources to run in a spatially distributed context
The integration of this sub-model into the ACCESS-II detailed hydrological model is then described.
9

The ACCESS Project: Part 4, A Submodel of Bypass Flow in Cracking Soils
C. Slawinski* , H.A. Sobczuk, R.T. Walczak and J. Wasik. Institute of Agrophysics Polish Academy of Sciences, Lublin, Poland.
Introduction. We present a simple model describing crack evolution in swelling and shrinking soils, together with a water flow model through cracks. We consider a soil profile consisting of horizontal, homogenous layers with different properties. A water balance equation based on observed rainfall intensity takes into account direct entrance into the crack and run-off criteria defined by a saturated conductivity of the soil on the surface. The horizontal water flow from a partially flooded crack into the soil is assumed to be limited by the saturated water conductivity under water level and equal to zero above water level. A water redistribution process from the crack is assume to be one dimensional and horizontal. The crack width changes are calculated using mean water content in the layer employing a linear swelling-shrinking model.
The crack geometry. We approximate each crack in the soil by the network of fissures with parallel walls extended within each layer of the soil with the cross-section presented in figure 1.
Fig. 1. schematic representation of the crack cross-section.
Direct rainfall entrance
Run-off
dl
d2
Run-off
\ • /
wi H
TT Increase
in moisture content
10

Each layer is characterised by the separate set of soil parameters. The width of the crack within the layer is calculated using an assumed regular network of geometry and a total crack volume calculated from an anizotropic swelling process model based on the equation (1,2):
where AV is the total crack volume within the layer, Az is the change of layer thickness, V0 is the initial volume of the layer and rs is an experimental factor describing anizotropy of the swelling process. The measured value of a mean distance between cracks allows us to calculate approximate initial crack widths on the geometrical basis.
The water balance components. We assume that water enters cracks in two ways. Part of the rainfall enters the crack directly (in proportion to the ratio of crack to surface areas) and reaches the bottom of the crack immediately. Run-off conditions are reached when cracks are filled with water that accumulates at the bottom of the crack. The water redistribution from the crack to the soil is approximated by a one dimensional horizontal flow model with the ratio limited by the saturated hydraulic conductivity of the soil under the water level (3). The actual crack width during this process is calculated according to a linear soil swelling model (4, 5) for each layer separately. The water content taken for actual crack volume calculation is the mean value of the water content in each layer. When the whole actual volume of the crack is filled with water the excess water floods the soil surface or forms run-off out of the considered field. An excess amount of water that percolates through cracks as described by this presented simplistic model, modifies the hydrological part of the ACCESS model including the bypass flow mechanism to it.
Conclusions. The presence of cracks in the soil influences the water flow allowing part of the water to flow preferentially through the cracks. We consider a three dimensional crack structure, however, water flow, is treated in a simplistic manner. The resultant water flow and water distribution is given as a mean value for each layer of the soil profile and can be included in the one-dimensional hydrological part of ACCESS-II.
Literature cited. (1) Bronswijk, J.J.B. 1988. Modelling of water balance, cracking and subsidence of clay soils. J. Hydrol. 97: 199-212. (2) Bronswijk, J.J.B. 1990. shrinkage geometry of a heavy clay soil at various stresses. Soil Sc. Soc. Am. J. 54: 1500-1502. (3) Edwards, W.M., van der Ploeg, R.R & Ehlers, W. 1979. A numerical study of the effect of non-capillary sized pores upon infiltration. Soil Sc. Soc. Am. J. 43:851-856. (4) McGarry, D. & Malafant, K.H.J. 1987. The analysis of volume change in unconfined units of soils. Soil Sc. Soc. Am. J. 51: 290-297. (5) Yule, D.F. & Ritchie, J.T. 1982. Soil shrinkage relationships of Texas vertisols. Soil Sc. Soc. Am. J. 44: 1985-1995.
I I

The ACCESS Project: Part 5, Expert Evaluation Models for Assessing the Impacts of Climate Change on Soil Degradation
J. Crompvoets' , F. Mayol, G. Aguirre and D. de la Rosa. Consejo Superior de Investigaciones Cientificas, Instituto de Recursos Naturales y Agrobiologia, P.O. Box 1052, 41080 Sevilla, Spain.
Introduction. There is a growing realization that not only many forms of economic development degrade the environmental resources, but that at the same time environmental degradation can undermine economic development. Soil degradation, which is defined as a process which lowers the current and future capacity of the soil to produce goods or services, is recognized as a serious and widespread problem. Increased soil degradation can be a result of predicted climate change, change in land use and their interactions. Two dominant types of soil degradation are water erosion and soil contamination, both mainly caused by agricultural mismanagement.
Land evaluation techniques appear to be an appropriate way to predict the climate change impacts on soil erosion and contamination. Soil specific land evaluation approaches incorporating land management must provide sufficiently detailed information not only for policy-makers but also for decision-makers. The research activities described in this presentation are partial modules corresponding to the EC-project EV5V-CT92-0129 "ACCESS: Agro-climatic Change and European Soil Suitability". These activities were developed from previous work on the MicroLEIS system (1); and their integration into the ACCESS model has been described by Loveland et al. (2).
Basic Data. Soil surveys are considered the basic building blocks for developing the comprehensive dataset needed to drive land use planning and management. Soil series, the lowest category in Soil Taxonomy, are the most homogeneous classes and are closely related to interpretations for use and conservation of the soil. Other biophysical factors, mainly referenced to climatic parameters, are also considered as basic information. A soil database (SDB) and a climate database (CDB) were developed for the Andalucia region of Spain by using an existing soil survey and meteorological register. According to the FAO-ISRIC criteria, the SDB database makes reference to conventional morphological and analytical soil and site characteristics. Several pedotransfer functions were also developed to estimate missing physical soil properties. The CDB database has the oportunity to collect monthly and daily data, not only referred to air temperatures and amount of precipitation but also by means of the known Penman variables. An important goal has been to create interfaces between these databases and the land evaluation models.
Incorporating Land Management. Traditionally, one of the most disappointing aspects of land evaluation has been the scarce relations with other areas in soil and crop sciences. However, new land evaluation procedures must be able to predict optimum land use types and to define sustainable farming systems. For incorporating agricultural management information in land evaluation, "field units" were defined as the units of analysis, which are considered to be the total natural and technical environment within which agricultural production takes place. For the current
12

regional scenario, the management information was collected by a study of published bibliography and agricultural statistics, farmer contacts, and discussion with extention personnel. In this sense a management knowledge and database (MKB), exclusively in technical terms, was developed for the Andalucia region. Crop properties: plant height, rooting depth, leaf area index, growing season length, development stages, crop coefficient and harvest index; and cultivation practices: primary and secondary tillage, sowing, plant density, fertilizers, pesticides, harvesting, residues, irrigation, artificial drainage, conservation and rotation, are the management characteristics considered for a total of 15 strategic crops. Socio-economic attributes were not considered.
Water Erosion Model. Soil erosion represents the main soil degradation process related to displacement of soil material. The two major erosion types are soil erosion by water forces or by wind forces. The negative consequences of water erosion are loss of topsoil and terrain deformation. By using land evaluation techniques, the soil vulnerability concept as the "capability for the soil to be harmed in one or more of its ecological functions", was considered in order to assess the risks of soil degradation. The erosion risks vulnerability model, making application of expert system techniques, deals with the risks of European soils to water erosion and runs especially for agricultural lands. It predicts two types of erosion vulnerability: attainable and actual. The attainable erosion risk is dependent on stable and biophysical factors, and the actual is dependent on recent land use and management aspects. The predicted actual erosion vulnerability (sixteen classes) is a combination of the attainable and management soil erosion risk classes. Also, an explanation of the options selected by the decision trees (the most limitant land and management qualities) is summarized by the corresponding subclasses.
Agrochemical Contamination Model. Chemical soil degradation, including loss of nutrients, salinization, acidification and contamination, is mainly caused by agricultural mismanagement; contamination or pollution being the dominant type of human-induced soil degradation in Europe. The contamination risks vulnerability model was developed using a knowledge-based approach that allows estimation of the relative vulnerability of soil and groundwater to diffuse agrochemical contamination. It interpretes this vulnerability at the field scale especially from nitrate and pesticide leaching. In this expert system, soil properties and related agricultural land-features are combined with management factors. Thus, the attainable and actual contamination vulnerability prediction can be the basis for estimating the environmental impact of agricultural activities, with reference to chemical degradation of soil and water resources.
Literature Cited. (1) De la Rosa, D., J.A. Moreno, L.V. Garcia and J. Almorza. 1992. MicroLEIS: A microcomputer-based Mediterranean land evaluation information system. Soil Use and Management, 8: 89-96. (2) Loveland, P. J., M.D.A. Rounsevell, T.M. Mayr, J.P. Legros, M. Voltz, D. de la Rosa and A. C. Armstrong. 1993. ACCESS: Agro-climatic change and European soil suitability. A spatially distributed model. EC Climate-related Projects Report. (In Press).
13

u t i l i z a t i o n of So i l ' s Information for Assessment of Climate Change ana Man's Impact
v.A.LotMtnov-State Hydrological Institute, 23, Second Line, St.Petersburg, 199053, Russia
Introduction. Specifical feature of historical time series of soil's indices such as soil temperature, soil moisture and others, is their compound character and the fact they are a composition of the processes of different scales. Except that, the modern period of time is characterized of extending direct (agricultural) and nondirect (climate change) anthropogenic impact on all soil's processes and on the processes in soil, upper soil layer particularly. Another basic property of soil processes is their cyclic nature which is related with cyclic of all hydrometeorological processes in atmosphere, hydrosphere and, as a result with the rotation movement inherent to all objects in the Universe (l).
Review. Methods and models of soil physics are used when direct agricultural impacts take place and information about them are available. The problem of assessment of impact of climate change on atmospheric, hydrological and soil indices is more difficult. Brief review is adduced about factors of the climate change and climate variability and results of their estimation by using the experimental data. It is shown that long-range variations in the climate take place really and may be explained both by natural and anthropogenic reasons (2). Analysis of the modern methods of estimation of the climate change and its impact on the surface soil runoff is carried out and results of executed investigations are systematized. The interactions and intercommunications in hydroclimatic-soil system are considered. They characterize the complexity of spectrum of the modern climate variations.
Main Idea. Historical time series of soil indices in modern conditions may consist of three components at least, such as: natural component, component connected with agricultural activity and component connected with climate change. The way of assessment of every component is based on the decomposition of complex process into simple and homogeneous constituents. In this case we can realize both an analysis of every homogeneous component and a building of mathematical model for whole complex process. If we have information about all factors, decomposition of the complex process is based on the building of the physical model of the event. There are many situations, as a rule, when information about factors of non-homogeneity is absent for historical period, but is known we have a compositional process and have to do a decompositon. For this aim we use nondirect methods of decomposition. The main feature of the soil is that it is a natural filter for all processes of small scales and the deeper in soil the more processes are filtered. This property can be used both for testing of new nondirect methods of decomposition and for direct assessment of climate change, using an information about soil's indices on sufficient depth.
Theory and Methods. Proposed methods of assessment of climate change and man's activity have in their base two theories: the theory of random function and the theory of an experiment. The first theory defines a selection of realizations of random function such as: a cycle of fluctuations of soil's indices or elementary physical event. The second theory defines an algorithm of constraction of the mathematical model of the non-homogeneous composite process, using an experimental data. The existing decomposition methods ( spectral and correlation
14

analysis, different methods of smothing, etc.) have a great restrictions to the kind of the cycles function and their parameters. They require many a priori information of the model structure of the time series, which is usually unknown. Therefore new decomposition methods have been developed, such as: a truncation method and method of the poli-linear decomposition, which assume a priori only the assembly of the composition structure according to superposition principle (3). It means, that any interaction of two adjacent scales is reflected in the coefficients of the additive structure:
Y * blYl + b2Y2 + BO ( 1 ) Bl = f ( Y2 ), ( 2 )
where Tyl > Ty2, T - the process period, Yl - large-scale process, Y2 - smaller-scale process.
The algorithm of the truncation method is in the following: - all the extremes of the process are determined first; - then only those extremes are selected ( the other ones are omitted ) which are related to the process of the least scale according to the condition that the amplitude of their cycles exceeds the amplitude of the error.
- the minima of the least scale process are connected by lines the shape of which corresponds to the function of the cycle of the next greater-scale process; and differences are determined between the observed data and those lines characterizing "a pure" process of the least scale with errors;
- then the procedure is repeated to select the process of the next scale, and this is repeated until 1 or 2 cycles of the greatest-scale process are left;
The main idea of the method of poli-linear decomposition of the fields and processes - a factoral decomposition. An example of common structure of such model for hydrometeorological processes in the soil:
Y(Xl,X2,X3,X4)=C0(X4)+Cl(X4)*Yp(Xl,X2,X3)+E(Xl,X2,X3,X4), ( 3 ) where XI ,X2 - geographical co-ordinates, X3 - number of the month,
X4- number of the year, CI ,C2 - coefficients are obtained by LSM.
Results and Discussion. Application of offered methods for assessment of climate change and man's impact was considered in three case studies. The first example connects with 20-year series of air temperature and soil temperature on some levels down to 1 m depth. Climatic components were picked out for every time series by truncation method, their magnitudes in X were estimated for every soil level and intercommunications between climatic ranges of different levels were determined. The second example is about assessment of agricultural activity over sewage-farms on the base of both a physical model of balance structure and non-direct decompositional methods. The main problem, which was decide, is an estimation of irretrievable water use. In third example a poli-linear decomposition was used for land modelling of the components of water-soil cycle: annual runoff, soil temperature and precipitation over region of Upper Volga in Russia.
Literature Cited. (1) Lobanov v.A. 1992. Interpretation of stochastic concept in hydrology and
Hydraulics.Proceedings of the Sixth IAHP Symposium on Stochastic Hydraulics, Taipei, p.655-662.
(2) Lobanov v.A. 1993. Present changes in climate and the effect of these changes on river runoff ( critical review on the state of the problem ). In: "Hydrological Investigations and Computations for Ecological Validation of Uater Projects".
(3) Lobanov V.A. 1993. Computations and forecasts of runoff with changing natural conditions. Pre-conference proceedings " Stochastic and Statictical Methods in Hydrology and Environmental Engineering", p.206-207.
15

Use of Soil Information in the Regional Modelling of Water Runoff and Soil Erosion Risks
Y. Le Bissonnais *, D. King and C. King. Institut National de la Recherche Agronomique, Service d' Etude des Sols et de la Carte Pédologïque de France, Centre de Recherche d'Orléans, 45160 Olivet, France. Bureau de Recherche Géologique et Miniere, 45000 Orleans, France
Introduction. Surface runoff and soil erosion are major threats for sustainable agriculture. Regional erosion risk assessment and mapping are increasingly needed by environment agencies and government institutions (1, 2). Because erosion results from the interaction of several parameters which often vary in time, no simple models allow to account for it, particularly in cultivated landscapes where human factors are predominant. Digital Elevation Model (DEM), Geographical Information System (GIS) and numerical cartography may greatly facilitate the development and use of multivariate and statistical models for the assessment of erosion risks as well as other geomorphologic hazards (3). However, the quality of the results is limited by the quality of both data (e.g. soil characteristics, land use, rainfall and morphology) and knowledge of processes to be modelized. Recent progress in erosion processes analysis in temperate cultivated areas offer a good basis for such a task (4, 5). However, there is often a lack in the availability of soil informations that are to be put in the model. Particularly, if an extended soil survey of the studied area does not exist, it is necessary to find a way to determine and map the soil characteristics influencing erosion and there variability. Remote sensing may be a useful tools in giving for large areas a soil surface state information, that can be calibrated on test areas (6, 7).
Materials and Methods. An important research program was carried out in the region Nord-Pas de Calais (France) because of the locally strong erosion of its soils. A local study on selected representative areas, including survey of erosion features, was realized during three years. A geographical database was created, in order to develop a multiscale approach allowing to modelize and map the regional erosion risks distribution on the basis of a multivariate approach validated at local scale. Most data came from other bases, e.g. on agricultural statistics, meteorological and geological survey. New data were obtained from satellite images and a soil survey.
Results and Discussion. Local-scale research showed that erosion risk can be evaluated by studying spatial units like elementary catchment areas, which can be said to form Spatial Integration Units (SIUs). However, as such catchment areas are generally too small to be shown on a standard 1:250,000-scale map, the SIUs for regional mapping has to be larger than elementary catchments. Simulations were made with SIUs taken as watershed and as commune (smallest territorial division). Each SIU was characterized by the areal percentage of factors that local-scale work had indicated to favour runoff, i.e.primarily the soil surface texture and the vegetation cover. A class of soil credibility was attribued to each textural class. The spatial combination of these two factors determines the catchment potential runoff area which was significantly related to the measured erosion rate (r=0.53**) (fig). At regional scale, the runoff
16

risk for each SIU was then estimated, assuming that a high percentage of each of these factors creates a statistically high risk. At this scale the soil surface condition parameter (crusting stage) was estimated using multitemporal remote sensing datas from SPOT satellite, that also gave an information about soil use and plant cover.
e
• o b s e r v e d
+ p red ic ted
++
•*»*f' + + + +
taMrift^StvL?' 0 10 20 30 40 50
% of catchment potential runoff area
fig.: Relationship between erosion rate and potential runoff area
Conclusion. This study shows that the main trends of regional runoff and erosion risks may be obtained from statistical and cartographical analysis of the various factors selected in the database, after a local study on test areas. The soil informations are among the most important for the the model. They can be extracted fron regional soil survey or directly estimated from remote sensing data. A further advantage of this method is that quantitative data now are available for comparison between different areas. However, a local study of erosion processes will always be necessary before applying the methods in another area.
Literature cited. (1) Albaladejo Montoro J., Ortiz Silla R., Martinez-Mena Garcia M. 1988. Evaluation and mapping of erosion risks: an example from S.E. Spain. Soil Technology 1: 77-87 (2) Auerswald K. 1988. Erosion hasard maps for Bavaria. In "Erosion assessment and modelling". Eds.: Morgan R.P.C. and Rickson R.J., CEC, Silsoe, 41-54. (3) Madsen H.B., Hasholt B., Platou S.W. 1986. The development of a computerized erodibility map covering Denmark. In "Soil Erosion in the European Community, Impact of Changing Agriculture". Eds.: Chisci G. and Morgan R.P.C., CEC, Balkema, 143-154. (4) Auzet V., Boiffin J., Papy F., Maucorps J., Ouvry J.F. 1991. An approach for the assessment of erosion form and erosion risk on agricultural land in the northern Paris Basin, France. In: "Soil erosion on agricultural land". Eds.: Boardman J., Foster I.D.L, Dearing J.A., Wiley & Sons, Chichester. 383-400. (5) Le Bissonnais Y., Singer M., Bradford J. 1993. Assessment of soil erodibility: the relationship between soil properties, erosion processes and susceptibility to erosion. In: "Farm land erosion in temperate plains environment and hills". Ed: S. Wicherek, Elsevier, 87-96. (6) King C, Le Bissonnais Y., Daroussin J., Malon J.F. 1991. Appui de la télédétection pour 1'évaluation spatiale de la sensibilité a l'erosion hydrique des terres agricoles de la region Nord-Pas-de-Calais. Rapport BRGM-INRA, 80 p. (7) King D., Le Bissonnais Y., Hardy R. 1993. Regional assessment of runoff and erosion risk. Example of the Nord/Pas-de-Calais region, France. In: "Farm land erosion in temperate plains environment and hills". Ed: S. Wicherek, Elsevier, 191-205.
17

Climate Change, Soil Hydrology and Crop Potential
J.P. Legros1* , P.J. Loveland2, L.KIing1.and M.D.A Rounsevell2: Science du Sol, INRA, Place Viala, 34060 Montpellier, France; 2: Soil Survey and Land Research Centre, Silsoe Campus, Silsoe, Bedford MK45 4DT, UK
Introduction: The European Commission has funded laboratories in England (2), France (1) and Spain (1) to develop a soil-hydrology driven model to predict the consequences of climate change for crops within the European Community. This communication describes the methodology behind the model, the difficulties encountered, and the ways these were approached.
Objectives: The research is based on a computer simulation model which reflects the functions of the climate/soil/plant system. At present, the model concentrates on maize, wheat, soya and sunflower; crops of considerable interest within and outside the EC, for which there are large national databases, and allowing common approaches between the teams. Three natural regions, with good soil and climate data, were chosen as experimental areas: south east England, Languedoc (France), Andalucia (Spain). Lastly, we chose daily and monthly time steps, and a spatial (map) resolution of 1:250000.
Development of Simulation Tools. The general model is called ACCESS (AgroClimatic Change and European Soil Suitability), and operates at two levels: ACCESS I at the regional scale, whilst ACCESS II is site specific and also calibrates and validates ACCESS I. This paper focusses on ACCESS II for which the modelling is in four main parts, developed by the different teams: /) The Model. ACCESS II is a daily soil and water model developed from earlier work (model: MOBIDIC) at INRA (I) and elsewhere (2). It divides the 'pedological' profile into centimetric layers to ease calculation, to improve the modelling of a thin, near-surface layer, and to allow further refinements. PET (Potential evapotranspiration) (split into the two components) and crop growth variables (root length, leaf area) are either input directly, or are calculated within the plant growth model (below). Thus the model can deal with bare or partially covered soils. Drainage is simulated by water transfer from one centrimetric layer to the next, the flux calculation requiring saturated conductivity values. 2) Plant growth. Plant growth and maturation are simulated on the basis of the EPIC model (3), adapted to other conditions and plants by INRA (Toulouse) (4). 3) Improvements to the Model. 'By-pass' flow in soils likely to crack under present or drier conditions, and improvements in the flux model by use of Richard's equation, are dealt with by the Soil Water Research Unit (formerly, Field Drainage Experimental Unit), Cambridge. Improvements in the parameterisation of the Richard's equation and associated software permit its spatial application on a pixel by pixel basis in the test regions. New numerical methods to calculate improved pedo-transfer functions enable the model to pass with confidence from this site-specific to the regional situation (5). 4) Suitability. The soil water balance controls soil suitability. SSLRC (England) and CSIC (Sevilla, Spain) have developed the monthly time-step model (ACCESS I) to transfer the detail of ACCESS II (above) to the regional scale. Inherent in this is the development of routines to
18

identify 'land quality classes' in relation to the major crops (above), but as a function of local agricultural situations. Part of the 'land quality function' is based on assessments of regional agronomic inputs for specified locally acceptable yields, as well as basic soil properties. An important part of the latter has been the development of a soil erosion risk module. Data Acquisition: For regional studies, soil maps subsume soil survey data, but mapped information does not usually contain quantitative soil hydrological functions (Ksat, bulk density, water retention curves etc.) essential to the running of a numerical model. Refined methods of calculating such pedo-transfer functions from simple soil survey data have been developed (5), as have submodules for incorporating such approaches into models (6). Routines for interpolation of data between measurement points are also under development.
Climate Data: ACCESS II requires daily data (rainfall, temperature, PET) for site specific validation. Where these data are absent, a stochastic weather generator can be used, in conjunction with spatial interpolation routines if necessary. ACCESS I requires monthly rainfall and temperature data, and is calibrated against the detail from ACCESS II. Crop data: The project has assembled an agronomic database for the common crops of Europe,
in many cases at the varietal level (Mayr, pers. comm.) Soil data: These are derived from regional soil survey databases allied to digitised maps at
1:250000 scale. The overlay of such data, and the interactions with the model are made through a GIS, using standardised input and output data structures to ensure portability.
Validation and Simulation Output: The working of the model is subject to sensitivity analysis and calibration using known crop performance data from experimental sites (7). Similarly, the numerical uncertainties in the models are also being quantified, so as to compare the variation induced by these, with the variation due to anticipated climate change. The latter hypotheses are themselves crude and uncertain, but in accord with generalised circulation models for Europe i.e. mean overall temperature rise of 3^C in 100 years, 10% decrease in summer rainfall, 10% increase in winter rainfall. The partitioning of such gross changes against daily or even monthly model time-step requirements is a problem, but stochastic weather generation is one way forward.
Literature Cited: 1. Leenhardt, D. 1991. Spatialisation du bilan hydrique. These, USTL, Montpellier, p.129. 2. Ram bal, S. and Cornet, A. 1982. Simulation de 1'utilisation de 1'eau et de la production végétale. Acta Oec. Plant. 3, no.4, 381-397. 3. Sharpley, A.N. and Williams, J.R.1990. Erosion/productivity Impact Calculator. 1. Model Documentation. USDA Technical Bulletin Number L768. p. 235. 4. Cabalguenne.M, Jones, C.H., Marty, J.R. and Quinones, H. 1988. Tentative d'utilisation d'un modèle. Agronomie 8, 549-546. 5. Simota, C. and Loveland, P.J. In press. Estimation of hydraulic properties of unsaturated soils using easily measured physical properties and limited data. Journal of Soil Science. 6. Simota, C , Mayr, T.M. and Loveland, P.J. In press. A spreadsheet oriented model for the simulation of crop yield using monthly weather data and soil survey information. Computers and Geosciences. 7. Kling, L. 1993. Programmation, calibration et validation d'un modèle de bilan hydrique. DA A ENSAM. p 40.
19

Evaluation of Some Desertie Land in Western site of Suez Canal, Egypt
O. A. Gobran, M. S. Amira, And R. B. Shehata. Department of Soil Science, Faculty of Agriculture, Menouflya University, Shebin El-Kom, Egypt.
Introduct ion. The evaluation of the soils is one of the problems which gained considerable attention from many soils scientists in all countries. The various systems used in land evaluation differ according to the purpose as well as the factors of soil formation and development. Land evaluation have been early studied by meny investigators such as Storie (1937) and Sys and Verheye (1976). In the current study an approach of evaluation for the soils having different physiographic units in some desertie areas of the western site of Suez Canal, using certain soil properties and local natural environments as limiting factors in the utilization of these soils for agricultural purpose.
Material and Methods. The area under investigation is bordered from east by the Suez Canal, west by El-Sharkiya Governorate, north by El-Manzala Lake, and south by Ismaeliya Canal. According to the physiographical map, studied area is divided into the following physiographic units : fluviomarine (marshes and depressions), plains (with high ground water table and with deep ground water table), and river terraces (deltaic stage of river terraces, old river terraces, and river terraces repersented the tranzitionsal zone). Seven profiles were selected in locations representing the different land types. Morphological features of the studied profiles were recorded on the base outlined by F.A.O. (1966), and the physical and chemical analyses for profile samples were performed accordind to Black (1965) and Jackson (1967). Two quantitative systems of land evaluation were applied according to Storie (1937) and Sys & Verheye (1978).
Results and Discussion. The soils of fluviomarine marshes and plains which characterized by high ground water table are classified as Aquollic Salorthids. The soils of fluviomarine depression are Typic Salorthids. Both soils of plains with deep ground water table and deltaic stage of river terraces are Typic Torripsamment. Also, both soils of old river terraces and tranzational zone are classified as Typic Torrifluvents. The studied total area is 87147.46 feddans and according to data in Table (1) and Storie's system (1937), an area of 11062.48 feddans (12.7%) is considered as fair soils (soils of tranzational zone), an area of 7956.68 feddans (9.1%) is poor (soils of old river terraces), while an area of 47930.11 feddans (55.0%) is very poor (the soils of fluviomarine depressions, plains with deep g.w.t., and deltaic stage of river terraces), and an area of about 20198.19 feddans (23.2%) is considered as non agricultural (soils of fluviomarine marshes and plains with high g.w.t.). According to data in Table (2) and Sys & Verheye system (1978), an area of 19019.16 feddans (21.8%) is considered suitable for irrigated agriculture with slight to moderate limitations (soils of old river terraces and tranzational zone), an area of 47930.11 feddans (55.0%) is suitable for irrigated agriculture with moderate to sever limitations (soils of fluviomarine depressions, plains with deep g.w.t., and deltaic stage of river terraces), while an area of 20198.19 feddans (23.2%) is not suitable for irrigated agriculture with severe or very severe limitations (soils of fluviomarine marshes and plains with high g.w.t.)
20

Table (1): Storie's soil index used for i
Physiogra- Sub-land Profile -S
: investigated profiles
phic units (land types)
types No.
o C/5
Fluvio-marine
Marshes 1 Depressions 2
50 80
60 100
65 65
30 30
75 85
100 90
100 100
40 100 90 100
100 1.67 100 10.34
Plain with high g.w 3 with deep g.w 4
50 100
70 70
50 40
30 80
50 50
100 100
100 100
60100 100 100
95 1.50 100 11.20
River Deltaic stage 5 100 70 40 terraces Old river t.
Tranzational 6 100 100 65
zone 7 100 90 60
100 40 100 100 100 70 85 100
100 100 95 10.64 100 100 100 38.60
100 90 100 100 100 100 100 48.60
Table (2): Sys and Verheye soil index used for rating the investigated profiles
Physiogra- Sub-land Profile phic units types No. (land types) I B
X
•8 o
CO
Fluvio-marine
Marshes 1 Depressions 2
100 100
30 70
70 95
75 90
95 95
100 40 80 58
5.98 26.38
Plain with high g.w 3 with deep g.w 4
95 100
55 100
60 60
55 100
95 95
90 45 90 75
6.63 38.48
River Deltaic stage 5 terraces Old river t. 6
Tranzational zone 7
95 100 60 100 95 90 85 41.42 100 100 85 100 95 '"0 80 58.14
100 100 80 90 90 90 90 52.50
L i t e r a t u r e Ci ted .
(1)
(2) (3)
(4)
(5)
Black, C.A. 1965. Methods of soil analysis. Part II, Amer. Soc. of Agronomy, Inc., Publisher, Madison, Wisconsin, U.S.A. F.A.O. Staff. 1966. Guidelines for soil profile discription. F.A.O. Rome. Jackson, M. L. 1967. Soil chemical analysis. Constable and Co. LTD., London. Storie, R. E. 1937. An index for rating the agricultural value of soils. Berkeley, California, Bull. No. 556. Sys, C. and W. Verheye. 1978. An attempt to the evaluation of physical land characteristics for irrigation according to the F.A.O. framework for land evaluation. Int. I. Train. Cent. Post Grad. Soil Sci., Chent Belgium, pp. 66 -78 .
21

Resources Evaluation, Environmental Damage and Ecological Planning in Land Use in the Mezquital Valley, Hidalgo, Mexico.
F. Lopez*, D. Munoz, A. Mendoza y A. Soler. Eda£ology Laboratory, UNAM Campus Iztacala, 54090 Tlalnepantla, Mex., Mexico.
Introduction. The Mezquital Valley is an important region due to its ecological, social and economic caractheristics, its abundant resources, its contribution to Mexican economy and because it has the biggest irrigation district in the country, which operates with wastewaters. Nowadays it has lost its role as the principal supplier of horticultural products for Mexico City. This fact is attributed to many factors as the pollution in the irrigation district, the semiarid climate, the demographic growth and the increasement of urban and industrial centers. All these agents have provoked an evident diminution in the yield levels and in the agricultural diversity. Also they have increased continuously the environmental damage. Below this point of view it is necessary to do an actual and potential resource valuation and to look for the strategies and technologies which can increase the yield levels and reduce the environmental degradation, considering the perspectives of the resource integral use and the sustainable development. Consequently the objective of the present work was the realization of natural resources diagnosis, the evaluation of the environmental damage levels and the elaboration of an ecological planning proposal of the land use in the Mezquital Valley. The Mezquital Valley is located a 130 Km NW of Mexico City and in the SE region of Hidalgo, between the 20° 15' and 20° 47' parallels North latitude and the 99° 0' y 99° 17' meridians West long. It includes an area of 193 000 hectares (ha) with altitudes of 1900 to 2900 mosl. Its physiography is heterogeneous with a litology of cretacic limestones, miocenic basaltic and andesitic fluxes and quaternary lake deposits. Its climate is dry semiarid with a mean temperature of 17.4 °C and a mean rainfall of 450 mm.
Materials and Methods. This work followed the steps of the regional planning, natural resource evaluation (1) , environmental management and planning (2) , environmental impact assessment and ecological zoning ordinance (3) . In order to succeed these steps, the Mezquital Valley was considered as an ecoregion, in agreement with ecological and economic judgments. The general systems theory was applied to define its geographic, ecological, social and economic elements,- also the matter, energy and yield processes and flows, add to the social dynamic. The natural resource diagnosis included soil, water, agroecosystems and natural ecosystems. The ecological damage was evaluated dividing the area in 3 different regions: woodlands, scrublands and the irrigation district, in this last case the ecological impact
22

methodology was used. Finally, all the Valley was zoned considering the natural and potential land vocation, applying the ecological zoning ordinance and proposing alternatives of resource management with restoring, conserving and preserving actions for the environmental improvement. All the work was done using the remote sensing methods, LANDSAT images and pancromatic aerial photographs. In field the corresponding uprisings were done and the analysis, determinations and thematic cartography were realized in the laboratory.
Results and Discussion. The geographic elements determined in the area were-, a) physiographies, ordered in 4 land systems; b) soils, which were classified in agreement with the FAO system (1988) in 6 mayor soil groupings which are: Phaeozems, Leptosbls, Anthrosols, Regosols, Fluvisols and Luvisols, and 17 soil unites. This diversity is attributed to the climatic, geomorphologic and geologic conditions and these are the reasons of the Phaeozem and Leptosol predominance. Otherwise, the human influence is shown over the presence of Anthrosols. The ecological elements include: a) 13 agroecosystems, standing out 4 agroforestry systems, the kitchen gardens, perennial crop systems of maguey and nopal and extensive cattle raising, which are developed in a surface of 78 000 ha. b) 16 vegetable formations, excelling 5 kinds of woodlands, standing out the oak forests (Quercus spp.) and pinion forests (Pinus cembroides), 6 kinds of subdesert scrublands, tropical deciduous forest and grasslands, over a surface of 105 000 ha. They exist 300 vegetable species and 90% of them have some feeding, foraging, energetic or medicinal use. The environmental impact assessment showed that the woodlands and scrublands are disturbed by erosion, deforesting, urbanization and mining. In the irrigation district, since it was planed, constructed and operated, the elements more impacted were the soil, water, air, biodiversity, yield systems, social, economical and esthetical factors. 765 kinds of negative impacts were detected, and the biggest act over the biodiversity and soil. Also 361 kinds of positive impacts are present and they favor the social and economic elements. The heavy metals, detergents and solid residues were the principal pollutant problems. An ecological zoning ordinance in the Mezquital Valley was proposed, considering the following regions: restoring (18 026 ha.), preserving (55 524 ha.), protecting and preventing (5 422 ha.), developing (56 485 ha.) and environmental improving (56 504 ha.) .
Literature Cited.
(1) Mitchell,B. 1989. Geography and resorce analysis. John Wiley & Sons. Singapure.
(2) Lund,H. 1981. Arid land resource inventories: developing cost-efficient methods. USDA Forest Ser. Gen. Tech. Rep. ULO-28. Washington, D.C.
(3) Westman.W. 1985. Ecology, impact assessment and environmental planning. John Wiley & Sons. Singapure.
23

Edaphic Regionalization in the Northern Region of Coahuila: a Rangeland Overview
P. Hernandez R. A. Rodriguez G. J. A. Ortega S., E, Medina M, and E, Cuellar V. Campo Experimental Zaragoza, INIFAP, 26450 Zaragoza, Coahuila, México. Introduction. Northern region of Coahuila is constitued by 3.14 million ha, «here 96X are rangelands of deteriorated condition due aainly to unsuitable distribution of grazing and excessive stocking rates. Rehabilitation and improvement of this area demand practical, technical and feasible actions. Grouping areas of similar attributes is and ecological basis to generate management options in order to tranfer investigation results in arid and semi-arid environments (1). The purpose of this study is to realize an edafic characterization and then making groups with similar features in order to recommend and validate plant species with alike edafic requirements.
Material and Hethods. This study vas conducted at Zaragoza, Coahuila during 1993 using information of soil analysis fron edafologic charts scaled 1:250,000 (4). A matrix «as made using 73 sampled sites and 14 soil variables, like: depth (cm), clay, silt and sand content (X), reaction to HCL, electric conductivity EC (mmhos/cm), cationic change capability CCC, pH, organic matter content (X), Na, K, Ca and Mg content (meq/100 gr of soil), and P content (ppm). This matrix «as analized using Principal Components of the computer program Number Cruncher Statistical System (NCSS) (3).
Results and Discussion. Delimited and characterized groups are shown in Table 1, «here the groups A, C, F and G are the most representatives because of sites gathered. Their soils are usually calcareous and diversely textured. Groups A and B have clay textured soils but they differ in depth and organic matter content. Groups C, D, E and F are clay loam textured but they differ between them in depth and organic matter content. Groups H and I are sandy textured, with high P content due to lo« content in clay and calcium carbonates. At basis on results obtained, it «as concluded that dominant groups are characterized by being calcareous, of alkaline reaction, slightly deeps and clay loam textured. Furthermore they are moderately rich in content of organic matter, K and Ca, and poor in Mg and P. Finally, the implication of this work in relation to information about edafic requirements (2) of buffelgrass (Cenchrus ciliarls L.), kleingrass (Panicum coloratum L.) and Lehmann lovegrass (Eragrostis Lehmanniana Ness.) are more perceptible and objective options of rangeland improvement and rehabilitation using such plant species, and other ones whenever their requirements are kno«n.
24

Table 1. Grouping and characterization of sampled sites.
GROUP SITES/GROUP CHARACTERISTICS
A 12 Calcareous soils, highly deep, with high content of clay, K and Ca, slightly rich in 0.H. and slov - -content in P and Hg.
B 2 Calcareous soils, highly deep, vith high content--of clay, rich in 0.H., high in K and Ca content low in P and Hg.
C 11 Calcareous soils, clay loam, slightly deep, rich in 0.H. and K content, medium in Ca content and low in P and Hg, pH moderately alkaline.
D 6 Calcareous soils, clay loam, slightly deep, - - - -extremelly rich in 0.H., medium in K and Ca and low in P and Hg.
E 5 Calcareous soils, clay loam, slightly deep, slightly rich in 0.H., medium in K and Ca and low in P -and Hg.
F 16 Slightly calcareous, slightly deep, clay loam, - -extremelly rich in O.H., medium in K, high in Ca, -low in Hg and P.
G 16 Calcareous soils, slightly deep, silty clay loam, --moderately rich in 0.H., medium in K and Ca and low in P and Hg.
H 3 slightly calcareous soils, sandy loam, medium in 0. H. content, high in K, medium in Ca, low in Hg and very high in P.
I 2 Hon calcareous soils, loam, slightly deep neutral --pH, moderately poor in 0.H., medium in K and Ca content, low in Hg and very high in P.
0.H=0rganic matter; K=Potasium;Ca=Calcium;P=Phosphorus;Hg=Hagnesium.
Literature Cited. (1) Aldon, E.F. and, G. Garcia. 1971. Stoking rangelands on Rio Puerco in New México. J. Range Manage 24 (5): 344-345. (2) Cox, J.R., H.H. Hartin-R, F.A. Ibarra-F, J.H. Fourier, N.F.G. Rethman, and D.G. Wilcox. 1988. The influence of climate and soils on the distribution of four African grasses. J. Range Hanage 41 (2) :127-139. <3> Hintze, L.J. 1985. Number Cruncher Statistical System. (4.2) 865 East 480 North Kaysville, Utah.84037. (4) Secretaria de Programacion y Presupuesto (SPP). 1982 Cartas edafológicas. H 13-9, H 14-7, H 14-10. li edición. Piedras Negras, Coah., Héxico. Direcciön General de Geografia. Esc. 1:250 000 Color.
25

Influences of Ecological Factors upon the Development and Functioning of Soils in Forest Ecosystems
Maria Skolovska. Forest Research Institute of Bulgarian Academy of Sciencies, 1756 Sofia, Bulgaria.
Introduction.Every chage in climate results in a change in vegetation,and this creates a particular type of soil which reflects the influences of these two factors. Materials and methods.The investigated forest ecosystems of Alep-po pine (Pinus halepensis Müll.) with holm oak (Quercus ilex L.) as an accessory colonist,are on the semi-arid bioclimatic storey of North Africa (the Atlas Mountains).The forests formed under them are brown forest soils slightly lessivated,on marbled,slightly weathered limestones. According to their morphological structures, these soils are seldom deeper than 50 cm,of thin,but dark humus A hibrizons and unclear AB transition to their clay-mixed sandy illuvial B horizons differentiated into sub-horizons. Results and discussion.Under the conditions of a continuous air humidity deficit and unwashable water regime of the soil,the forest ecosystems were found to develop well within the optimum altitudial raago from 1,200 up iio 1,300 m.The conditions there favour the decomposition of organic matter, the aeration of soils and the reduction of the weights of soils of larger proportions of coar se skeleton and sandy fraction be at higher levels.
The alkaline nature of the soil substrata helps for the assimilation of easily hydrolizable nitrogen by the plants.The cor relations between the mean annual increment,in cu. m,and the vo-lume?in cu.m/ha, of the growing stock,on the one hand, and soil fertility (expressed through the regime ol nutrients) in accordan ce with ecological factors,on the other,were found.
The types of humus are mull and mull-moder.The biological activity in the superficial horizons does not destroy the aggregates,with the bonds available in the compouds of iron.There was no degradation of secondary clayoy minerals within profile,no washing-out of products of soil formation with the descending water flow, and no podzolozing processes.
The enrichment of the soil complex of bases has a hereditary nature,The concentrations of heavy metals,according to horizons,varied slightly because of the lack of pollution sources (local or transporting).
The Aleppo pine ecosystems investigated in their integrity and in harmony and balance with the ecological conditions,are characterized by stable vegetation and by a particular pedocli-max.
26

Ecological Regionalization and Deteriorated Areas in Semiarid Lands of Zacatecas State, México.
R. Veyna E . J.G. Bustamante. Departament of Agricultural, Investigacion, Escuela de Agronomfa, Universidad Autónoma de Zacatecas, 98000, Zacatecas, Zac. México.
Introduction. In México the arid and semiarid zones are made up of close to 30 million hectares and on them are found approximately 50% of the pupulation. In the state of Zacatecas, the semidesert occupies 22% of its territorial extension. That is a total of 7,504,000 hectares, on which live 17.33% of its population which in total is 1,276,323 inhabitants. By the use of physiographic mapping with a focus on morphological or landscape features and considering technical aspects, the Economical, Social and the Ecological conditions of the natural resources of each one of the selected regions, permited the location of deteriorated areas througt the evaluation of its actual situation, the same as the technology utilized in its development. The object of this work is to regionalize the semidesert zone of the state of Zacatecas, in order to consider with precise information the areas which present high deterioration and propose alternatives for ecological management of its natural resources.
MATERIALS AMD METHODS. The study began in 1992 in an area known as the semidesert region of the state of Zacatecas which comprises the following municipalities: Noria de Angeles, Villa Gonzalez Ortega, Loreto, Villa Garcia, Villa Hidalgo, Villa de Cos, and Francisco R. Murguia: The first six are located in the northeast part of the state and the two remainng ones in the northern part. Their coordinates are 22° 25' and 21° 55' north latitude and 101° 07' and 102° 09' west longitude respetively and an altitude of 1,700 to 2550 meters above sea level, the northern part of this region contains a surface area of 11,244 square kilometers and the northeast has 5,300 square kilometers. They are includedin the geomorphological provinces of the Central Plateau. To operate the project, satellite images were used to scale 1:500,000, aerial photographs with a scale of 1:50,000, topographical cards and thematicals elaborated by INEGI, such as the geographical synthesis of the state, edited by the S.P.P. The delimitation of the regions, were done by means of analysis of physiographic maps with a focus on morphological or landscape features utilizing the terrestial system as a cartographic unit and considering technical, social and economic aspects. This was determined by means of filling in technical cards and realizing social-economical surveys during the field season. In this way, the cartographic and photographic boundaries were checked and missing information about lithology, vegetation relief, use of soil and conditions in general about the same subject were compiled.
27

RESULTS AMD DISCUSSION.- From the analysis of the information from the data cards and applied surveys, the following results were obtained: Predominance of the tenancy "Ejidal", land in common ownership in 83% of the surface area with parcels of 8 hectares. Agriculture depending on rain in 95%, predominance of corn and beans; the irrigated zones also produce grapes and peppers principally. More than 90% of the surface area shows erosion in different degrees and the agricultural zones contain Xerosol and Lithosol soils with high guatities of stone and moderate slopes larger than 3%. The vegetal covering is low, principally in the northern part and overgrazing has produced a marked deterioration in the majority of the pasturing areas. Considering this, and the information obtained from the physiographic mapping, it was possible to delimit 12 Regions These Being: La Blanca, Ojocaliente, Noria de Angeles, Loreto, Villa Hidalgo, Villa Garcia, Espiritu Santo, El Obraje, Pinos, Villa de Cos, Nieves and Guadalupe de las Corrientes. Based on the previous data, two Ecologically deteriorated areas were identified. The first with an extension of 315 km2 located in part of the municipalities of Panfilo Natera, Villa Gonzalez Ortega, Noria de angeles, Loreto and Villa Hidalgo; with level ground, low hills, and the lower part of mountains slopes with altitudes of 1800 to 2400 meters above sea level with slopes less than 18%. In these areas laminated hydrolic erosion was present and the predominante vegetation was underbrush crasicaule and microfilous scrubdesert with a high level of deterioration.
The second deteriorated area was found in the municipalities of Villa de Cos and Francisco R. Murguia, with an extension of 3665 km2
with low hills and level ground slightly wavy with an altitude of 1750 to 1900 meters above sea level, with slopes less than 8%, presenting laminated hydrolic erosion in runoff channels furrows and aeolian erosion. The vegetation present was already secondary since the native communities have disappeared almost completely, the dominant spiecies are: "Gobernadora" Larrea tridentata and "Hojasen" Flourencia acacia. The physiographic mapping with a focus on morphological or landscape features and the information obtained in the field, made possible the regionalization study proposed for the semidesert zone of the state of Zacatecas and likewise, it permitted the delimitation of 12 regions, the same which served as the basis in order to define 2 ecologically deteriorated areas, considering principally the natural resources of soil and vegetation.
LITERATURE CITED.
(1) S.P.P. (1981) Geographical synthesis of the state of Zacatecas. S.P.P. México, D.F.
(2) H. Cuanalo de la C., C. Ortiz S. 1984 Methology of physiographic mapping. U.A. CH. Chapingo, México.
28

Soil characterization of broadleaved forests in Spain
M.P. Carretero Carrero *, O. Sanchez Pulomares & R. Elena Rossello. Departamento de Sistemas Forestries CIT-INIA, 28080 Madrid, Spain.
Introduction. Broadleaved forests cover an important portion of the Spanish forested landscapes: more than 5 millions of Ha. Spanish broadleaved tree species present highly varied ecological characteristics ranging from deciduous species such as beech (Fagus sylvatica) or oaks (Quercus robur, Quercus petreae, Quercus faginea, Quercus canariensis, among others) to marcescent species such as Quercus pyrenaica or even evergreen mediterranean species such as cork oak (Quercus suber) and elm oak (Quercus ilex). These forests have been under permanent threat as the land that they occupy were suitable for other land uses such as agricultural crops or grazing practices. Consequently their presence into their nature distribution area were highly restricted to the poorest soils and the most degraded lands. Land-use planners and policy-makers, both in Spain and in the EEC, concious of the high ecological values of the broadleaved forests, are currently encouraging the improvement of the existing forests and the establishment of new ones in recent reforestation programs for marginal agricultural lands. All the former reasons have encouraged us to undertake the autoecological study of Spanish broadleaved tree species aiming to determine quantitatively their ecological requirements. One of the most important objectives of these studies is the edaphic characterization of the habitats occupied for this kind of woodlands.
Materials and Methods. The data base used for characterizing the soil of the broadleaved woodlands was built up after surveying sample plot selected all over the Spanish forests. CLATERES land classification (1) was used as stratification tool for sample plot selection. Within each land stratum, silvicultural criteria such as cover density, management regime or yield production, were taken into account for the final sample site selection. Physiographic, climatic, floristic, silvicultural and edaphic data were recorded. The soil profile located in each plot centre was studied after taking soil samples from all its horizons. The resulting soil data allowed us to identify its soil type (2), its evolution level, as well as to calculate a series of edaphic parameter necessary for its habitat definition. According to similar criteria used in earlier studies (3), habitat definition was made considering the variance of several edaphic parameters that could be limiting for broadleaved forest existence. Consequently, Central Edaphic Habitat (HEC), Marginal Edaphic Habitats (HEM) and Extramarginal Edaphic Habitats (HEE) were determined for each broadleaved tree species under consideration. This kind of analysis were conducted at three different levels: 1) For the total broadleaved species distribution area. 2) For each land stratum used in the sampling stratification. 3) For each floristic type defined after Twinspan analysis of the flora inventories. All the soil and other ecological factor (biotic, physiographic, climatic and silvicultural) data were analysed using direct gradient multivariate techniques (4) as Canoco (5) for detecting relationships between soil and forest vegetation.
29

Results and Discussion. At the present time, the described methodology has been successfully applied at the autoecological studies of beech (Fagus sylvatica) and cork oak (Quercus subcr). As an example, results from the beech study are presented here. The main soil groups were Cambisols (53 %) and Luvisols (36 %). Other less representative groups were Arenosols, Leptosols, Regosols and Phaeozetns. Among the soil units, there were distric, haplic, gleycic, ferric, cromic, eutric and calcareous, distributed as shown in the following Figure. Therefore, Spanish beechwood soils are characterized by moderate surface stoniness, loamy texture, moderate permeability, high water field capacity, and light acidity, even where soils are built up on calcareous substrates.
CAMBI80L DISTRIBUTION LUVI80L DISTRIBUTION
The habitat analysis allowed to quantify the euroicity and stenoicity degrees of the different parameters studied. At the same time, we have detected the more discriminant edaphic parameters of the beechwood floristic types and native beech provenances. Once the edaphic habitat model for each Spanish broadleaved species is developed, it is possible to link them to CLATERES land classification system. Consequently, land suitability model for new forest plantations is completed. GIS technology is currently used in getting these models as well as mapping them. Forest managers and land-use planners will be supplied with a powerfull tool for making decisions in new reforestation programs.
Literature Cited. (1) Elena Rosselló, R., Telia Ferreiro, G., Allué Andrade, J.L., Sanchez Palomares, O. 1990. Clasificacion biogeoclimatica territorial de Espana: Definición de eco-regiones. Ecologia, Fuera de Serie N° 1 ,pp 59-79. Madrid. (2) Fao-Unesco., 1989. Mapa mundial de suelos. Roma. (3) Gandullo, J.M., Gonzalez Alonso, S., S&nchez Palomares, O. 1974. Ecologia de los pinares espafioles IV. Pinus radiata D. Don. INIA. Madrid. (4) Gauch, H.G. 1982. Multivariate Analysis in community ecology. Cambridge Studies in Ecology. Cambridge University Press. Cambridge. (5) Ter Braak, C.J.F. 1986. Canonical Correspondence Analysis: a new eigenvector technique for multivariate direct gradient analysis. Ecology. (67): 1167-1179.
30

Soils Evaluation and Diagnosis Method to Elaboration of Agroforestry's Aptitude Map in a
Mountanius Zone of Cuba F.A. Ancfzar Rodriguez and J. Sanchez Perez. Institute of Soils. Ministry of Agriculture. Cuba. F.0. Box 8022 City of Havana
INTRODUCTION. As part of an integrated study of physics-naturals factors in 11554ha appertaining to the Health's Turism Complex of Topes de Collantes, enclavement in the Mountanius System of Gua-muahaya, central region of Cuba Island, was studied both soils and proposal agroforestry land use, to be in consequence to guarantee a scientific basis for management of soils of the studied area, in order to obtain a sustaninable economic life for the local population and more of 1000 daily visitors without damage for ecologie enviroment. The studied area is located in heights between 80 and 900 m.a.s.1, with annual rainfalls that are oscilating between 1200 and 1900mm, and with topographical variation in maxim air temperatura since 34C at 80 m.a.s.1 to 2f5C at 900 m.a.s.1, in summer, and its presence at of Central plain of Cuba, determine and important role in the regulation of climate, specially in the rainfalls of whole region.
MATERIALS AND METHODS. Coming from the soils surveys of zone, classified according to 7' Genetic Soils Classification of Cuba (1), using limits adjustment of taxonomies units intervening pho-tointerpretation of aerial panchromatic photographys, original scale 1:37 000; topographies base-map, scale 1:25 000; physio-graphics units were defined, and upon this basis, the soils map scale 1:25 OOO was elaborated with high precission in units limits at level of spiece and variety. With the delimitation of soils units was possible the automatical interpretation of agricole aptitude, taking the factors as efective deepth, contents of gravels and stones, and the fertility of soils, interacting with annual rainfalls by zones. The cuban computer program Agroselect II was used (2), its program was developed and generaliced in Cuba, for agricultural land evaluation and its stablish four categories of agroproductivity, upon the basis of its limiting factors, for 14 tropicals crops as soon as roots and tubers, vegetables, bananas, pasture, fruits and coffee-tree; using this program was possible to stablish a initial discrimination of the soils units that were classified in III and IV categories (worst), interdicting there use in whole crops. To start from this initial discrimination the main areas were selec-tionated using the agroforestry management criteria, grouping by slope, type of soil and rainfalls, propounding manage's methods, derivated of researchs executed in Cuba by the Forest Research Institute, the Institute of Soils, and the available internacional information.
31

As results of evaluation a scheme of agroforestry management was created, with 8 categories, those categories of management arst I Agrosilviculture II Agrosi lvicul ture with si 1'vopastoral III Coffee production IV Intensive silviculture with conifers trees V Intensive silviculture with broad-leaf trees VI Silvopastoral VII Protection silviculture with conifers trees VIII Protection silviculture with broad-leaf trees
RESULTS AND DISCUSSION. The mains type and subtypes of soils encountered in the studied area were in correspondence of representative soils of mountains of Guamuhaya, described by A. Ancizar and E. Calzadilla (3,4), and there are the followings: Type and subtype of soils Area (ha) Red Ferralitic, typic 3392,52 (Oxisols) Red Lixiviated Ferralitic, Typic 1466,94 (Alfisols) Reddish Brown Fersialitic, Typic 2419,33 (Alfisols) Reddish Brown Fersialitic, Lixiviated 360,20 (Alfisols) Brown with Carbonates, Typic 136,30 (Inceptisols) Nature Squelethic (Stony) 3779,40 (Inceptisols) The correspondence between the type of sol is and the distribution by altitude law, and diferents geological materials that appear in the area, is high. The main general aptitude in this area, is silviculture, and its possible to apply agroforestry methods as soon as coffee under trees shadow, and agrosilviculture, and cattle management. Every agrotechnical measure, should be in order to soil's conservation . The land evaluation method employed, permits the efficient determination of edaphoc1imatic conditions and there interconnection with the productive experiences, in order to stablish a agroforestry proposal management in mountanius conditions.
LITERATURE CITED. (1) Hernandez, A., Perez Jimenez, J. M; Ascanip, 0; Ortega, F;
Avila, L., Cardenas, A; y Marrero, A 1979. II Clasifi-cación Genetica de los Suelos de Cuba. Institute de Sue los ACC.
(2) Mesa, A. Fuentes E; 1987. Programa para la clasificación agroproductiva de los suelos. Agroselect II. CNSF 40pp (Meca).
(3) Ancizar, A. , Calzadilla, E 1991. Estudio edafológico-forestal de la Cuenca Hanabanilla. CIDA (50 p)
(4) Calzadilla, E. et al 19B8. Estudio edafológico,fisiografico y agrosilvicultural del Escambray. Prov. Sancti Spiritus. CIF. MINAG (Meca,19p.).
32

Reconnaissance sampling to determine the optimum number of soil observations for a detailed soil survey
M. Henriquez', Facultad de Agroncmia, UCLA, Barquisimeto and J.A. VTJLORIA, Facultad de Agroncmia, UCV, Maracay, Venezuela.
INTRODUCTION. The planning of optimal sampling procedures for the acquisition of soil data requires a knowledge of the s tructure of the spatial variation of the soil in the survey area. The semivanogramis the most satisfactory tool to describe this structure. But the estimation of semivariograms from a limited number of sample sites presents difficulties because it is much affected by sampling errors (Webster and Oliver, 1992). That is why, the estimation of approximate semivariograms by means of a nested sampling has become increasingly accepted (Kfiesch, 1975). However, the variation of the sample spacings in geometric progression in a nested sampling does not allow to ascertain the actual form of the semrvariogram between the chosen sampling distances. This work explores new sampling designs in order to produce a closer approximation to the form of the semivariogram at the reconnaissance stage of a soil survey.
MATERIALS AND METHODS. Two different sampling designs, one nested and the other clustered, were applied in the reconnaissance samplingof a detailed soil survey in the experimental field of FÖNAIAP in Maracay (Venezuela). The nested sampling comprised 56 sample points arranged in four levels (250,125, 25 and 5 m, respectively), with seven observations at the first level and two replications at each new level. The clustered sampling included two stars of 33 sample points each. Each star was randomly located and consisted of a central point and additional observations located at 40 m, 200 m, and 400 m apart in directions E:, NW and SE, and 20 m, 40 m, 100 m, 200 m, and 400 m apart in directions E, NW, and SE, respectively. The following variables were recorded at each sample point: % sand, % clay, % organic carbon and ph at 0-20 cm and 40-60 cm depth, respectively, bulk density at 0-20 cm depth, and depth to a mottled layer. Components of variance were calculated by analysis of variance from the nested sampling, and semivariograms were estimated by the classical procedure (Journel and Huijbregts, 1978) from different combinations of the data.
RESULTS AND DISCUSSION. The results of the nested sampling (Table 1) show a large influence of the short-range variation. Thus, 58% to 87% of the variation of the recorded soil properties occurs within 25 m, and 30% to 52% of the total variation is already present within 5 m.
On the other hand, semivariograms estimated from stars 1 and 2, both separately (33 observations) and Joined (66 observations) did not show a clear structure of spatial variation. But semivariograms estimated from the star 1 plus the nested sampling (89 observations) showed a more evident structure of spatial variation for all the properties. However, the use of the two stars plus the nested sampling (122 observations) produced only irrelevant improvements to the semivariograms for most variables, as snowed in Table 2. Consequently, 89 observations seems to be an adequate sample size to estimate reconnaissance semivariograms in the conditions of this study.
The obtained semivariograms confirm the complexity of the soil pattern. Thus, the range of spatial dependence for most variables is shorter than 60 m and the % of explained variance is often less than 50 %. Hence, a definitive sampling distance equal
33

or less than 30 m would be convenient taking into account the soil pattern and experimental character of the survey area.
Table 1: Percent of total variation» at each level of the nested sampling
Depth Levels Sand Clay OC pH Depth to mottles
0-20 cm 5m 37 30 49 43 61 25m 62 61 87 67 70 125 m 100 100 92 79 88 250m 100 100 100 100 100
40-60 cm 5m 39 44 52 34 25m 58 58 67 65
• 125 m 89 % 100 71 250m 100 100 100 100
Table 2: Percent of the explained variation and range (m) of the senrivariogram
Number of Depth Sand Clay OC pH Bulk Depth to samples dens, mottles
%of explained variance1
89 0-20 cm 46 50 61 36 49 43 40-60 cm 41 59 65 61
122 0-20 cm 50 43 57 35 66 43 40-60 cm 42 59 48 50
Range (m) 89 0-20 cm 30 30 30 60 60 50
40-60 cm 50 25 50 50
122 0-20 cm 30 40 30 50 50 60 40-60 cm 40 60 40 30
1% of explained variance = (sill - nugget variance /sill) * 100
LITERATURE CITED. JOURNEL, A.G. and HUIJBREGTS, C.J. 1978. Nfining geostatistics. Academic Press, London.
MIESH, A.T. 1975. Variograms and variance components in geochemistry and ore evaluation. In: Quantitative studies in the geological sciences, edited by Whitten, E.H.T., Geol. Soc. Am., Mem 142. p.p. 333-340.
WEBSTER, R. and OLIVER, MA. 1992. Sample adequately to variograms of soil properties. J. Sou Sci. 43:177-192.
34

SOME: PRINCIPLES FOR
CLASSIFICATION, NOMENKLATURE AND
DIAGNOSTICS OF RECLAIMED LANDS
WITHOUT HUMUS COVER
M. Banov', B. Christov. N. Poushkarov Institute of Soil Science and Agroecologyr Sofia, Bulgar ia.
Introduction. The reclamation of" disturbed lands sets a number of questions to be solved, not only in the initial period of formation, but also after being a subject of weathering and soil forming changes for a certein period of time, which is in direct connection with the method of reclamation. There are generally two methods of reclamation - by spreading a humus layer of certain capacity on a technically structures areas with non-toxic materials, and by direct mastering of territories reclimed by substrata with suitable physico-chemical characteristics. Both types of reclaimed lands are subgect of long-years studies regarding their marphological and analytical characteristic, as well as their classificative determination. Despite the collected analytical and practical material, the reclaimed lands are not included in any of the national soil classifications. Most of the published classificationrefer to the grouping of materials according to the level of suitability for biological recultivation.
Materials and Methods. With regard to this, a classification has been develope for the reclaimed lands without humus cover from the "Maritza-Iztok" coal-field. The field spreads over a territory of 30000 ha, about 14000 ha have been disturbed by now. The lands which have been reclaimed without the use of a humus cover are about 2000 ha. Their classification has been developed after a complete field, morphological and analytical study of their genesis, structure and characteristics. The collected samples were analysed for the contents of total carbon, media reaction, exchangeable cations, number of soil microorganisms by physiological groups, total COz production, microbial biomass carbon and etc.
35

Results and Discussion. Havingas a starting point the fact that at present there is large material on the origin, composition and properties of the reclaimed terrains and keeping in mind that the reclaimed soils have a specific structure of the profile and the leading element of their development is the human activity, we combine the reclaimed soils into a new soil group on the highest taxonomie level - c l a s s of "ANTHROPIC SOILS". All soils which are results or derivations of the influence of the anthropic factors fall innto this class.
In the defined class of "Anthropic Soils" we include order of "RECLAIMED SOILS", in other words soils created in the process of restoration of the lands disturbed by industry or building activities.
On the level of type we divide the reclaimed soils according to the structure of the profile! created by spreading humus horizon onto non-toxic geological materials or only of suitable substrata depending on their physico-chemical characteristics and according to their level of influence of the soil-forming factors. The reclaimed soils fall into two types: 1. Reclaimed soils without humus horizon 2. Biologically reclaimed soils The first type combines all technically created terrains of substrata of suitable physical and chemical characteristics. The soil profile is of just one horizon. Basically speaking these are mineral formations for future development of soils.
The second type includes soils based on materials suitable according to their physical and chemical properties, however affected to a certain degree by the weathering and soil-forming processes. The profile of this type of reclaimed soils has two or three horizons.
On a lower taxonomie level the two types of reclaimed soils are subdivided in accordance to the content of carbonate, media reaction, level of salts, depth of the humus horizon and mechanical composition.
36

Classification and Land Use of Major Soils Along Lake Victoria Swampland Area, Kenya
V.P.D'Costa and J.P. Mbuvi. Department of Soil Science, University of Nairoby, Box 30197, Nairobi, Kenya
Introduction. The large Yala Swampland and surrounding low lands, lie along the lakeshore, covering an extent of about 24,000 ha, in Western Kenya. The swamp's eastern border begins with alluvial dischrges of Yala river channels at the head of Lake Kanyaboli, then progressing down 10 km westwards to the Lake through sand bars. The Northern border runs a short distance to the flood plains and courses of the mouth of Nzoia River. The Southern boundary runs along the main Yala River courses to the Lake, protected by main Diversion Canal and flood levees. The districts surrounding the Lake Victoria region are amongst the most densely populated areas in Kenya. The Nile Basin Resources Survey (Sir A Gibbs, 1956) commissioned by Kenya Government, identifies Yala Swamp as one of the most viable and suitable area for reclamation and settlement with irrigated agriculture. The FAO Report (1971) summarizes the progress of phased reclamation of Yala Swamp and its pilot schemes. The reclaimed Phase 1 Yala Scheme (1970) lies at the head of Lake Kanyaboli.
Materials and Methods. The Swampland proper (17,000 ha) comprises mainly of permanent papyrus swamp with seasonal swamp on its fringes including the already recalimed Phase 1 (2,300 ha). The adjoining free surface water of Lake Kanyaboli, Saru and Nuabonya cover about 5,000 ha and the remainder 2,000 ha make up the surrounding alluvial colluvial lowlands. Owing to the stages of reclamation and prevalent conditions of swamplands, the soils and land use was investigated at reconnaissance level with reclaimed and dryland plains showing semi-detailed coverage. The soils have been classified according to the USDA Soil Taxonomy (1992) and corresponding FAO - UNESCO Soil Unit Legend (1965, 88) noted. These soils are then described into Groups showing their physiognomic occurrence for practical land use consideration.
Results and Discussions. Several studies (Gibbs 1965, D'Costa & Gachene 1986) show that major soils of swamps are Hitosols. They consist of black, very acid (pH 3.5-4.5) sapric to fibrh peaty materials 30 to 200 cm thick, overlying mucky clays, from sw mp edge to middle of swamp. These soils classify as Typic Trop/saprists/hemists/fibrists (Dystric Histosols). On lower swamp near the lake several coarser textured, saline Lake beaches are seen and classifiy as Salic, Tropic Fluvaquents/Psammaquents. The seasonal swamps due to partial dry conditions, intergrade into acid clay Humic/Tropic Fluvaquents. The semi-detailed survey (Ekirapa, 1987) of reclaimed swampland shows 80% of swamp, classify as clayey Humic Gleysols (Humaqueptic Fluvaquents), while soils on recent and old fluvial courses and levees show as Dystric Fluvisols. The minor soils of colluvial slopes bordering the swampland are Lithic, Typic and Salic Troporthents. The lowland plains and scattered levees below flood plains of Nzoia River are Typic Vertic Tropaquents on flatlands and variable textured Typic/Calic Haplorthents on fluvial levees. The description and analytical data of these soils is given in the main text. The major constraints to land use of the wet swampland soils is not only proper reclamation but control of waterlogging conditions, adequate drainage, conservation measures and suitable croppin systems. Experience of reclaimed swamp area (1970) now show stabilized subsidence levels and no catclay formation. The area though not irrigated is used by locals for growing initially profitable yields of adaptable crops, maize, sorghum, beans, peas, vegetables and sugarcane with supervision on proper husbandry and management practices. With declining yields there is need for fertilizer amendments and control of floods and lateral seepage from canals and drains. The wet soils of other swampland areas and plains and river levees are suited to similar crop and management practices. The lower lake with complex sandy beach levees
37

(4,000 ha) should be left under natural conditions for fishing and domestic and livestock water use. Likewise the free surface water lakes should be left for similar use and protected from pollution. The papyrus provides suitable material for making baskets, mats and thatching material.
References cited: 1. Sir A. Gibb and Partner. 1956, Kenya Nile Basin resources Survey, Nairobi 2. D'costa V.P. and Gachene C.K. 1986 Histosols in Kenya, Int Soil Management Workshop, Thailand/Malaysia. 3. Ekirapa A.E. and Kinyanjui H, 1987. Survey of Yala Swamp Farm, KSS Nairobi. 4. FAO, 1971 Surveys and Pilot Schemes of Yala Swamp, Rome. 5. USDA, Soil Survey Staff, 1992, Keys to Soil Taxomomy, Washington DC. 6. FAO-UNESCO. 1988, Soil Map of the World Revised Legend, FAO, Rome.
38

AOROICOLOOICAI. ZONING OP SOROHDM {Sorghum bicolor L. Moench) UNDER RAIN- DEPENDING CONDITIONS IN THE STATE OP GUERRERO.
F.F. MARTINEZ V.*; R. GONZALEZ M.**; J. M. REYES**; G. S ARAB IA R. ***. ; D. PAJARO H.****.
INTRODUCTION: If agricultural problems at a municipal, regional or state level are to be related, it is necesary to carry out a climatic and edaphic inventory and to take into account the socioeconomic aspects. Studies of this nature are useful to define potential areas for growing rain-dependent grain sorghum. The State of Guerrero has an extension of 64 282 km2, including 488 km2 of water surfaces and insular land. Only 22.8% of this total extension is apt for agricultural purpose, from which 0.2% is irrigated land and rest is rain-dependent (3). About 1700 hectares are cultivated in Guerrero with rain-depending grain sorghum.
MATERIALS AND METHODS: The agroecological zoning methodology (1) was used, at a 1:250 000 scale. In the first place a climatic inventory was carried out, which consisted of: 1) Major climatic divisions which allow the evaluation of the crops thermal requirements, and; 2) The obtaining of growth periods, which are the evaluation of the number of days during the year in which rain water is available for plant development. Secondly: an edaphic inventory, which considers the dominating soil of each cartographic unit (2), determined by texture and slope. Later, the global (GAI), partial (PAD and economic aptitude index at a municipal, regional and state level, and for two levels of investment, HIGH and LOW, were estimated.
RESULT AND DISCUSSION: Climatic division: Mean monthly temperatures converted at sea level, turned out to be higher than 18°C, for which the State of Guerrero was classified as TROPICAL. However, because of the topoforms of the state, it was considered as a convenience to use topographic charts at a 1:250 000 scale. Thus, the state was divided, upon the base of altitude, as WARM TROPICAL, under 1500 m (4 985 57S.0 ha) , and TEMPERATE TROPICAL, between 1500 and 3000 m above sea level (1 442 625.0 ha).
In order to assess the growh periods (GP), the formula generated by Pajaro (1984) was used, being obtained periods that go from 90 to 305 days. The GP isolines were drawn on an isoyetics chart, with ranges of 30 days per period. The dominating GP's were those of 150-180 days, located within the warm tropical zone.
Table 1 shows the agroecological zoning for sorghum.
Table 1. Agroecological classification at a state level, with 2 levels of investment for growing grain sorghum under rain-depending conditions.
Level of Investment Tipe of aptitude land surface (ha)
percentaje
High Very Apt (VA) Apt (A) marginally Apt
(mA) Not Apt (NA)
408 222.5 820 034.5
1 259 000.0 3 937 872.5
6.35 12.76 19.60 61.29
Low Very Apt (VA) Apt (A) marginally Apt
(mA) Not Apt (NA)
715 480.0 871 297.2 865 785.0
3 972 099.3
11.14 13.56 13.48 61.82
At both levels of investment, the Not Apt (NA) ) type for growing grain sorghum is more than 61%.
39

Table 2 shows the glooal, partial and economic aptitude indexes at a regional level.
Table 2. Indexes state o
af global, partial f Guerrero for g
and economic apti rowing grain sorg
tude, by geoeconomic region in the hum at two level* of investment.
Region Level of Investment
Global Index Partial Index Economic Index
Tierra Caliente
High Low
1.95 1.99
457 840.50
470 789.00
329 815.50 355 000.00
Norte High Low
1.S6 1.55
183 187.50
175 660.50
119 387.50 134 435.50
Centro High Low
1.29 1.35
115 437.50
137 512.50
39 987.50 76 962.50
Montana High Low
1.10 1.09
39 337.50
32 500.00
12 287.50 26 875.00
Costa Grande High Low
1.72 2.03
359 200.00
491 300.00
204 675.00 423 250.00
Costa Chica High Low
2.11 2.24
412 947.10
451 537.76
359 097.10 306 462.76
The global aptitude index (GAI) is higher in the Costa Chica region at the level of low investment. With the partial aptitude index (PAD, it turned out that the Tierra Caliente region has an extension (VA, A and MA) of 457,840.50 ha. At a municipal level, the best index was that of the municipality of Coyuca de Catalan with 134,087.3 ha. For the low level of investment, the best aptitud index was that of the Costa Grande with 491,3 00.0 ha and at a municipal level, the best aptitude index was that of Coyuca de CatalSn with 137,087.3 ha.
The best economic index belongs to the very apt (VA) lands for growing grain sorghum, where the producer will have high revenues. These lands are located in the region of Costa Grande, with 423,250.0 ha and a low level of investiment.
CONCLUSSIONS: More than 61% of the state extension in considered as Not Apt (NA) for growing grain sorghum at the 2 levels of investment. The geoeconomic region of the state with the best agroecological aptitude (VA) , for the 2 levels of investiment, is the Costa Chica, and the best municipalities are Acapulco and Cuajinicuilapa.
BIBLIOGRAFIA.
1.- FAO, 1981. Report on the agroecological zones proyect. Vol. III. Methodology and results for Mexico, Central America and Sudamérica. Food Organization of the United Nations. Rome, Italy.
2.- S.A.R.H. 1982. Inventario de Areas Erosionadas y Unidades de Suelos del Estado de Guerrero. Subsecretarïa de Agricultura y Operación. Dirección General de Conservación del Suelo y del Agua. México, D. F.
3.- C.N.E.M. de la S. G. 1987. La enciclopedia de los Municipios de México. Los municipios de Guerrero. Centro Nacional de Estudios Municipales. Secretaria de Gobernacion. México, D. F.
4.- CP-SARH. 1990. Manual de la Metodologia para evaluar la Aptitud de las tierras para la producción de cultivos basicos en condiciones de temporal. Programa de Agrometeorologia. Colegio de Postgraduados. Secretaria de Agricultura y Recursos Hidraulicos. Montecillos, México.
40

INTEGRATION OF SOIL INFORMATIONS TO ASSESS AGROTECHNIQUES THROUGH MODELS
VALIDATED ON TRUE AGRO-ECOSYSTEMS. METHOD AND EXEMPLES
M. B. BOUCHE. Laboratoire de zooécologie du sol INRA/CNRS, CEFE, BP 5051, F-34033 MONTPELLIER Cedex 1 (France)
Introduction. Sustainable agriculture implies both flexibility and grounded predictability. Flexibility, because in our very quick change of economics, type of human techniques and social processes nobody can predict in middle term the soil use in a given area. Grounded predictability, because "sustainable" implies "time" : not only modelling is needed but models must be validated on true systems. Induced climate change by these changes of land use is also linked to this type of predictions. To do these predictions we must use "all" the present knowledge... and in addition to complete it by studies.
The available knowledge is scarcely fully used to assess the various agrotechniques (ploughing, pesticides, cropping choices,...) acting on soils. The various facets of assessments (economical input of crops, sustainable development, soil biodiversity, consequent on global changes, social perception) are also scarcely fully practicized and are difficult to document. The development of 1°) new concepts and method and 2°) new computer means allows a full saving and availability of knowledge. This methodology 1°) describes in full all bio-physico-chemical data related to agro-ecosystems and agrotechniques, 2°) modelizes typology and functionning of these systems and techniques and validate models on them, 3°) explains in full this models in a flexible (understandable) way to decision makers.
Materials and methods. The starting point was 1°) the study of interactions of earthworm roles on soil physics, on soil chemistry (especially nitrogen cycle, carbon storage and humification) and on soil biology (esp. root and microbial life) under 2°) various agronomical, grassland and forestal managements and 3°) in connection with socio-economical constraints. This interdisciplinary knowledge gave the material to improve a methodology which has been extended, improved and validated in agricultural machinery, agronomical performance studies (especially rice crop, vineyard, ...), forestry changes in landscape use and farm economy management. Today twelve research teams work together with this method.
Results. Our results are essentially methodological and conceptual. To be optimal, decisions at each level (choice landscape use and management ; choice of each agrotechniques by practicians ; choice of regulations, ...) must be grounded on the Exhaustive Relevant and Explicit Knowledge (EREK). "Exhaustive" needs a full availability. "Relevant" means immediate selectivity (no delay, i.e. by electronic way) to get exactly what we need to every peculiar purpose (technique, type of soil or crop, or land use, ...). "Explicit" means the expression of knowledge from general understanding to, if needed, very precise facts without technical non explained jargon and in the users tongue.
41

This EREK could be today managed by modern computer software and hardware but is impossible because our common practice in soil sciences : the prevalence of the analytico-synthetic method. In fact, three fields of knowledge must be clearly distinguished. 1) The "real", on which we observe elementary facts : each Datum Initially observed and Controlled (DIC) without any interpretation. 2) The cognition, which is the classical sector of technico-scientists making their choices for sampling, their intellectual, material and mathematical models trying to represent the real by interpretations of facts (DICs). 3) The society, asking questions often wide, unpredictable or vague which do not fit easily with results of technico-scientists. This society use more or less well the results of cognition.
The knowledge is managed and accessible in this three sectors very differently 1°) versus real, by ordering DICs from general to peculiar thanks to an open Related Relational Data Bases (1), 2°) by analytico-synthetic accretion of predicates related to descriptive or functional models (2) and 3°) by access from general to peculiarities thanks to Explained Knowledge Dispensers (3), easy to translate in various tongues.
The paper illustrates this integration by the validated models relating effects of intensive agriculture (espacially pesticide uses), on soil water infiltration and nitrogen bioavailability to plants, and gives some consequences for soil conservation (slakking, erosion) and general biota.
Discussion. The enormous knowledge acquired by the various soil technical and scientific disciplines is practically not accessible to practicians and decision makers. Today the spectacular development of computer sciences allows the full availability of knowledge. Alas, this is impossible because the maze created by the splitting of science and techniques in a myriad of insulated micro-disciplines. Environmental problems and poor land use result widely of this maze examplified by the poor state of the so-called ecology (4). Fortunatly we can, in addition to our specialist practice, adopt in soil science, not in speech but in fact, the recently available transdisciplinary integration methodology.
Literature cited (1) Soto, P. 1990. Proposition d'un système informatique ouvert pour la gestion transdisciplinaire des données dans le cadre de l'DFEN. Mémoire de fin d'étude INFI et Mémoire DPE CNAM Paris, 1-239 + Annexes. (2) Bouché, MB. 1990. Ecologie opérationnelle assistée par ordinateur Ed. Masson, Paris, 1-572. (3) Bouché, MB. in press. L'intégration éco-environnementale en agronomic, industrie, aménagement, etc.; Theorie et methode. (4) Mcintosh, R.P. 1985. The background of ecology : concept and theory. Cambridge studies in ecology. Cambridge University press. 1-383.
42

Commission V. Extended Summaries. Tuesday, July 12
Symposium Vb. Modelling Soil Genetic Processes.
Page
The concept of soil formation in tropics. l.A. Sokolov. (Russia) 46
Soil reactants and soil genesis. B.A. Browne. (USA) 47
The soil, conceptual bases for its study. R. Zuccardi. (Argentina) 49
Approaches to the soil organic profiles typization. CM. Minkowsky, and S.A. Shoba. (Russia) 51
Opinions on global soil redization and yellowization. Y. Zhongjie, and L. He. (USA), . . . 53
Fluvisol as a proposed order in Soil Taxonomy with a characteristic pedogenic process hydrochemiturbation for active flood plant soils. B.B. Mishra, CD. Choudhary, N.K. Singh, J. Mall, V.N. Singh, and R.N. Singh. (India) 55
Conditions of soil formation in the artic region (on the example of spitsberge). Z. Klimowicz, and S. Uziak. (Poland) 57
Characteristics and classification of seasonally wet soils with epi- and endo-saturation. W.H. Hundall, A.A. Szogi, W.C Lynn, J.J. Daigle. (USA) 58
Abundance, characteristics, and genesis of preferential flow paths in a soil from the piedmont of Georgia, USA. D. Franklin, L.T. West, P.F. Hendrix, and D.E. Radcliffe. (USA). 60
Hidrosequence of Cambisols derived from limestone in low tablelands in Northeastern Brazil - implications for management. N. Curi and M.S.S. Lemos. (Brazil) 62
Genesis and evolution of a mediterranean brown soil developed over granitic rock. R.O. Zappino. (Argentina) 64
Formation of mountain yelow red earths and their properties suitable for afforestation in subtropics of china. X. Chai, Z. Ye, Z. Cai, L. He. (China) 66
Two type paleosols developed from loess in the piedmont area of Beijing and their forming paleo-climate. F. Zhang, and L. Hua. (China) 68
Natural soil development along an elevational climate gradient in hawaiian montane rainforest. R. Rodenkirchen, H.M. Richter. (Germany) 70
Distribution patterns of upland soils in the Philippines. T. Hamazaki, Jr. E.P. Paningbatan. (Japan) 72
Pedogenic response along a climatic gradient in Hawaii, USA. R.T. Gavenda, O.A. Chadwick, C.W. Smith, W.E. Laird, C.C Olson. (USA) 74
43

Soil sequences in silicic environment in the Sierra Nevada mountains (Granada, Spain) statistical analysis of representative variables. MM. Sanchez, G. Delgado, J. Parraga, and R. Delgado. (Spain) 76
Morphology and characteristics of soils developed over a sequence of terraces of the river tormes in salamanca (Spain). F.F. Santos and J.B. del Arco O. (Spain) 78
Comparison between Andosols developed from Gabbros in Galicia (NW Spain) and basalts'in Massif Central (France). E. Garcia-Rodeja and BM. Silva. (Spain) 80
Characteristics and genesis of soils formed in landscapes of biotite gneiss origin from the humid tropics of Nigeria. T.A. Okusami, H.P. Blume, F. Alaily. and N. Bruhn. (Nigeria) 82
Types of pedogenesis on basic rocks in boreal regions. S.N. Sedov, and S.A. Shoba. (Russia) 84
Genetical relationships of a toposequence of soils over limestone. M.T. Taboada. and BM. Silva. (Spain) 86
Genesis and properties of cambisols over limestone (Galicia, NW Spain). BM. Silva, and M.T. Taboada. (Spain) 88
The genesis of Jamaican bauxite: New pedologic evidence of its alluvial origin. G.R. Hennemann. (The Netherlands) 90
Genesis of minerals in two kandic Ultisols derived from granitegneiss in North Easter region of India. T. Bhattacharyya, and J.L. Shgal. (India) 92
Image analysis of the main horizons of an Oxisol/Ultisol toposequence. V. Hallaire, and S.S. Castro, and P. Curmi. (Brazil) 94
Comparison of silt loams (apparent field textures) of Andisols to silt loams of other selected soil orders. S.H. Brownfield, and Jr. H.R. Sinclair. (USA) 96
Genese et diagnostic des rankers en bulgarie. M. Teokharov. (Bulgaria) 98
Characterization of soils with gypsic horizon in the province of Navarra (Spain). F.J. Arricibita Videgain, B. Barragan Landa, and P. Bescansa Miquel. (Spain) 100
Sodium and gypsum accumulation in polygenetic soils of North Central Kansas, USA. S.L. Glaze, M.D. Ransom, W.A. Wehhmueller. (USA) 101
Origin of the calcium carbonate in soil profiles of the rafta and the terraces system of the Tajo Middle Basin (Spain). E. Pardo, L. Torcal, R. Espejo, and E. Tortosa. (Spain). . 103
Soil microagregation, ferruginous cuiras and basaltic weathering in Londrina (Parana State, Brazil). J.P. Queiroz, and O.N. Fernandes. (Brazil) 105
Origin of carbonate acumulations in lacustrine soils. C. Gutierrez, and C. Ortiz-Solorio. (Mexico) 107
44

Distribution of metal microelements by genetic soil horizons as depending on profile differentiation. S.P. Gorbanov. (Bulgaria) 109
Contrasting properties of luvic versus alic and lixic versus acric soils, a pragmatic approach. J. Deckers, B. Delvaux, and R. Dudal. (Belgium) I l l
The contribution of lithogenic and pedogenic processes to the origin of fine earth fractions of soils of the Crimean Mountains. N.G. Kovalev. (Russia) 113
Statistical relationships among selected properties of Ethiopian Vertisols and associated inceptisols. S. Sahlemedhin, B.P.K. Yerima, and b. teklu. (Ethiopia) 115
Soil structure formation mechanism in soil clayey horizons, swelling anisotropy and slickenside formation. D. Tessier, J.C. Michel, B. Bouzingues, and J.C. Favrot. (France). 117
The occurrence of gilgai in Southern Africa. T.H. van Rooyen. (South Africa) 119
Topographic control of gilgai soil profile formation. I.V. Florinsky, E.A. Arlashina, Ï.V. Kovda, and E.G. Morgun. (Russia) 121
Carbonate formation in the gilgai soils: Data by carbon and oxygen stable isotopic compositions. J a. Ryskov, S. Mergel, and Ye. Morgun. (Russia) 123
Vertisols genesis and types at the Alora zone. Malaga. Spain. E. Ortega, C. Asensio, C. Sierra, and F.J. Martinez. (Spain) 125
Vertisol morphology: similarities and differences in several climates. D. Williams, and W.C. Lynn. (USA) 127
Iron sulfides and pedogenesis in alluvial soils of the late holocene in the coastal area of Buenos Aires, Argentina. M.L. Osterrieth. (Argentina) 129
Influence of vegetation on soil formation of sandy soils in Denmark. P. Nornberg. (Denmark) 131
Some characteristics of the frigid-temperate zone coniferous forest soil in Northeast China. B. Ling. (China) 133
Studies on the soils of Minicoy Island in India: modelling a pedogenetic rarity. 5. Vadivelu, and A.K. Bandyopadhyay. (India) 135
Organic matter in podzol-b horizons changes with profile development. P. Buurman, and W. Zech. (The Netherlands) 137
The main characteristics of soil formation on calcareous rocks of the Globe. D. Konyushkov. (Russia) 139
45

The Concept of Soil Formation in the Tropics I. A.Sokolov. Dokuchaev Soil Institute, 7 Pyzhevski Lane, Moscow, Russia
Introduction. At present, the traditional concept of genesis of tropical soils postulates that such features as the great thickness of loose, deeply weathered rocks, the ferralitic composition, low absorption capacity, bright red or yellow colour, the presence of latentie or plinthite horizons in them are determined by pedogenous processes under conditions of wet tropical climate. This hypothesis forms the basis of all classifications and relates to the well-known scientific 'paradox' that soils of wet tropics do not correspond to the laws of bioclimatic zonality and can be mapped with certain difficulties, as their landscape distribution often does not correlate with relief conditions. We suggest the hypothesis of hydrothermal origin of the above-mentioned properties of tropical soils. Materials and methods We studied: a) red and yellow ferralitic and lateritic soils of the Tropics and Subtropics; b) brown tropical and subtropical soils without the signs of ferralitization and lateritization; c) soils on ancient red ferralitic weathering crusts of the Boreal and Polar Zones; d) present-day hydrothermal weathering crusts and soil formation on them (Indo-China, the Caucasus, Kamchatka, Siberia, the Urals, and the Far East of Asia). We examined ecological and geographical regularities of soil formation on all levels of organisation of the soil cover, macro-, meso-, and micromorphological features of soils and clay fractions, characteristics of humus profile, including the humus composition on the fraction level, soil absorbing complex, actual and exchange acidity of soils, contents and distribution of chemically diagnosed forms of iron ('silicate', 'free' crystallised and amorphous), phase composition of oxides, mineralogical composition of coarse and fine fractions, water-physical soil properties. Results and discussion. It is ascertained that in conditions of wet Tropics on hard parent rocks of flat placors, the soils with relatively thin fine-earth profile, abruptly underlaid by plates of hard rock at a depth of 30-60 cm, occur as a result of durable (hundreds and millions of years) soil formation. Such soils are brown-coloured and do not exhibit the features which are considered to be typical for pedogenesis of wet Tropics, i.e. ferralitic composition, bright colours, lateritic or plinthite horizons, etc. Soil profile is distinguished from parent rocks by the substantially lower content of all elements, but those inherent in inert minerals with residual accumulation (Si and Ti), the loss of a great part of weatherable minerals, and amorphization of clay minerals. Homogeneous character of the loose mass enables us to distinguish it as a specific 'elueat' superhorizon, originated due to the processes of direct biogenic weathering, total eluviation and zoo-homogenization. The characteristic response time of formation of the elueat superhorizon is measured in hundreds of thousands and millions of years. The humus and rare eluvial and illuvial horizons with short characteristic times are formed to the background of the elueat superhorizon. In the existing classifications the studied soils are defined as Lithosols, Cambisols, Brown Tropical soils, etc. They are treated as 'divergences' from the 'normal' tropical soils because of the renewal of surfaces due to denudation. We found out that the brown elueat soils originated without the influence of erosion and are quite 'normal' for tropical pedogenesis. Red and yellow ferralitic , lateritic, plinthitic and other soils (Oxysols, Nitosols, Ferrasols, etc.) occur on ancient hydrothermal weathering crusts, identified by the whole set of used methods. The establishment of this fact enabled us to solve the 'paradox' of tropical pedogenesis: only lithogenic soil properties, inherited from parent material do not follow the general laws of reflectority and sensority of soils to conditions of soil formation, including the laws of bioclimatic zonality. The main theoretical consequences of the established facts are: a) the need to elaborate special methodology, adequately revealing the genetic model of soils on hydrothermal weathering crusts; b) the need to substantially improve the classification of tropical soils and methods of their mapping. The resolution of these problems is practically important because the proper lithogenic properties of most of tropical soils are of paramount agroecological significance.
46

Soil Reactants and Soil Genesis
B. A. Browne. College of Natural Resources, University of Wisconsin-Stevens Point, Stevens Point, Wisconsin 54481.
Introduction. Recent work has begun to shed light on how soluble soil reactants affect soil processes. For example, Browne and Driscoll <1) have shown that silicic acid will react with aluminum in soil solution to form soluble mononuclear and dinuclear aluminum silicates. These soluble Al-Si species may be key intermediates in the reaction of primary and secondary aluminum-silicate minerals in soils. They may affect the rate and extent of primary mineral dissolution reactions and serve as templates, or structural subunits, for secondary clay minerals. However, the full implication of the reactions of silica (and other soluble reactants) with aluminum in soil solution have yet to be factored concepts of soil genesis. Here, I examine the reactions of four major soil reactants (organic acids, water, carbonic acid and silica) with aluminum and consider the implications for soil genesis.
Materials and Methods. The reactions of carbonic acid, water (OH), organic acids and silica were studied in both synthetic (e.g. fulvic acid) and natural (soil lysimeter or stream samples) solutions. The reactions were monitored using a fluorescence probe technique (2), nuclear magnetic resonaflee Spectroscopy and potentiometric titrimetry. Reaction variable concepts (3) were used to infer stoichiometry and to quantify stability constants.
Results and Discussion. Each of the fouf soil reactants in this study are shown to form stable soluble complexes with aluminum in soil solutions. Carbonic acid binds with aluminum in soil solution at common Pco2 values. Possible side effect of this reaction are polynucleation reactions that lead to templates for secondary soil minerals. The hydroxide ion appears to be more reactive with aluminum than previously thought. Low order polynuclear hydroxy Al ions (e.g. dinclear species) are shown to be two to four orders of magnitude more stable than reported in the literature, and may therefore be prevalent in soil solution as templates for secondary minerals. Formation of these species is shown to be catalyzed by organic acids. The reactions of silicic acid with low order polynuclear hydroxy Al ions may exert fundamental control over the paths and rates of secondary mineral formation in soils. The pedogenic roles of the four soil reactants are discussed in the context of major pedogenic processes (e.g. podzolization).
Literature Cited. (1) Browne, B.A. and C.T. Driscoll. 1992. Soluble aluminum silicates: Stoichiometry, stability and implications for environmental geochemistry. Science 256:1667-1670.
(2) Browne, B.A., C.T. Driscoll and J.G. McColl. 1990. Aluminum speciation using morin: Principles and procedures. J. Env. Qual. 19:73-82.
47

(3) Rossotti, F and H. Rossotti. 1961. The Determination of Stability Constants and Other Equilibrium Constants in Solution. McGraw-Hill Book Co., New York.
•
48

The Soil, Conceptual Bases For Its Study
Ramon Zuccardi. Universidad National de Tucumón -Argentina. Parque Biológico Sierra de San Javier - 4000 - Tucumón - Argentina.
Introduction As an interphase of the earth's surface, the Pedosphere (Soilsphere) constitutes a high complexity system. New conceptual bases allow a better interpretation of its organization and its behavior.
1- The soil as a system The soil is difficult to get to know as it is a cryptosystem (Gonzalez Bernaldez) (2) wich develops its attributes beneath the earth's surface. The Pedosphere (Soilsphere) occupies a span where the Lithosphere the Hydrosphere, the Atmosphere and the Biosphere interact. This set of parts are coupled among them through flows and cycles of matter, energy and information and form an organized complex system, wich manifests a global functioning. Of the totality of the system rise emerging properties, different from those of the integrating parts (General Theory of systems, von BertalanfFy) (7). The smallest spatial unit of study wich offers a holistic vision of the systemic totality is the ecotope (Site) (Troll) (6).
2- Dissipative structures, Steady state, Regulation. The Pedosphere (Soilsphere) functions as a thermodinamically open system, under conditions of no equilibrium. Among its components there exists a generalized kinetics of irreversible process-additions, removals, tranformations and tranferences (Simonson) (5). This state of permanent reorganization-disorganization originates "dissipative structures" (Prigogine) (4) wich remain through an exchanges of matter and energy with the environment. The system in a state of no equilibrium maintains its organization through selfregularity systems which are exerted by negative feedback cybernetics loops (Wiener-Ashby) (9-1) that absorb the fluctuations and deviations provoking alterations. These self regulatory mechanisms lead to establish an "order through fluctuation" (Prigogine) (4) which keeps the system in a dinamic equilibrium or steady state. The regulated Systems preservs its identity, its structure and its functioning in a state of minimal entropy and maximun order or negentropy. 3- Homeorhesis. Evolutionary changes. The regulatory retroaction process (negative feedback) lead the Pedosphere to a state of relative invariance of its forms (a certain morphostasy) a stationary stability or homeostasia. The Pedosphere is a thermodinamically open system which presents an organizational material and energetic eco-dependence on the environment. Of this interaction emerge cybernetic process of positive feedback which determine in the system gradual and progressive changes that point out an evolutionary tendency. There appear cualitative changes and new forms (morphogenesis) that can lead to new states of the system - chronological sequences - or under certain circunstances to a change of system. This state of evolutionary stability is called Homeorhesis by Waddington (8).
49

4- Geochem ical landscapes. On the earth's surface, the circulation of chemical elements reaches a highest intensity in the zone of interaction of the Pedosphere, the Hidrosphere, the Atmosphere and the Biosphere. This circulation is done through characteristic flow patterns in which the chemical elements are ordered and are distributed vertically forming a migrat ional macrost nicture, which gives birth to the geochemical landscape thus called by Polynov (3). This structure remains in time when the system frids itself in a steady state. The concept of Geochemical Landscape is a systemic vision which results in a view of a holistic global functioning through which all the components of the system are found genetically interrelated through a historical evolution. The main cycle of the elements is done in the following sequences: weathering-absorbable nutrients - Biomass of the Fitocenosis - litter - Humus -absorbable nutrients.
5- Literature cited (1) Ashby W.P. 1972 - Introduction a la cibernética 382 p. Nueva Vision - Bs. As. (2) Gonzales Bernaldez F. 1981 - Ecologia y Paisaje. 250 p. Blume - Madrid (3) Polynov E. 1937 - The cycle of weathering 229 p. Murby - London (4) Prigogine I. 1989 - Tan solo una ilusión - 332 p. Tusquets - Barcelona (5) Simonson R. 1959 - Outline of a generalized theory of soil genesis - Soil Sc. Proc. 23:157-156 (6) Troll G. 1971 - Landscape ecology and bio-ceonology - Geoforum 8:43-46 (7) Von BertalanfFy 1993 - Theorie générale des systèmes. 308 p. Dunod - Paris (8) Waddington N. 1975 - In Nave Z and Lieberman A. - Landscape ecology - Springer - Verlag (9) Wiener C. 1985 - Cibernética - 257 p. Tusquets - Barcelona
50

Approaches to the Soil Organic Profiles Typization G.M. Minkowsky, S.A.Shoba. Moscow State University, Soil Science Department, Moscow, Russia.
Introduction. At present there are two main ways of investigating soil organic matter: biocemical and morphological- (micromorphological-) ecological (1). There are fewer works of the second direction, than the first. Morphological-ecological approach provides an opportunity to evaluate the appropriatenesses of organic matter space-structure organization with posterior genetic interpretation, and to expose stages and processes of living tissues transformation right up to humic acids production. Different terminology is used in morphological - ecological investigations (table 1). L.A.Grishina (2) was the first, who used the term "soil organic profile". The organic profile (OP) apportionment is based on the same reasons as apportionment of salty, mineralogical and other soil profiles. Soil organic profiles classifications are divided into two groups by the character of described substratum: organic - mineral and organic. The first includes mineral components in- to OP, and as a rule describes the upper soil part not below Al horizon. The second presents OP as separated from the soil profile totality of organic matter morphological units. All authors describe hierarhical levels of OP morphological organization differently. Terminology of profile, horizon-morphon and microfabric levels is mixed in many articles.
Objects and methods. The objects are OP of coniferous-desidious forests (south taiga) soils of Central Forest (Russian Plain, Tverregi«j, prevail soils - podzols (spodosols)) and Sihote-Alin (Primorsky region, Far East, prevail soils - burozems (cambisols)) State Biospheric Reserves (CFSBR SASBR). Although different in climatic conditions, relief, parent materials and drainage conditions the two regions are similar in vegetation structure. They are both coniferous and desidious forests connected with each other. The distinction of ecological conditions promote the increasing of OP structure types diversity.
Results and Discussion. Most complete description with consideration of organic and mineral soil components connection forms on different levels of structure organization is reached by a combination of two approaches. OP proper (according to Bal, Grishina, Shoba) as organogenic structure consists of humus stratotypes (OP-horizons). Humus stratotypes (HS) consist of humus micromorphotypes (HM) (table 2). In such a way OP is a totality of all soil organic matter morphological forms. Units of lower structural-hierarchical levels form units of higher levels by dint of combinations with each other. Furthermore another approach is simultaneously used to studing OP interaction with mineral compounds. This approach was realized by Kubiena, Babel and Barratt. The highest hie- rarchical unit is containing organic matter upper part of the soil, which includes OP and mineral components. The lower units are containing organic matter soil horizon (OMCSH) and a type of microfabric. Combination of two approaches is most appropriate for detailed description and typization of OP-structures. The examples of description and typization of HM and HS are shown in table 2. Each HM is marked by letter of the greek or latin alphabet. HS is expressed by a formula of micromorphotype combination. A figures before HMs symbols marked volume, which it occupyes from the total organic matter volume of HS in parts of 10. Under-litter humus-accumulative SASBR soil horizons have more thin-dispersal humus in soil plasma, than CFSBR ones. It may be connected with stronger winter freezing, which delays humus decomposition.
51

In ideal HSs typization means typization of these HS formulas. It is necessary to describe a lot of thin sections for collection of sufficiently large number of formulas. In primary stage of information collection as a basis of OP classification it may be used not HS in shape of formulas, but organic matter contained soil horizons, typized by mezomorphological signs. HS corresponded to the organic part of OMCSH and is marked by a little index of horizon, which bears a relation to organic matter. However it is necessary to take into account, that in Russian indexation system indexes of soil horizons mark soil processes as a rule. But when morphological structures typization, it allows for signed information first. It should be noted also, that because of continual space distribution of humus morphotypes HS (as typical combinations of morphotypes) does not always coincide with types of organic matter containing soil horizons. So long as HS is a combination of HMs, and OP is a combination of HSs, HS and OP - classifications may be constructed by using the principle of different diagnostic importance of lower hierarchical levels morphological elements. Presence of HS of certain degree of diagnostic importance (informativity) divides OP on corresponding taxonomical level. The presence of first importance degree HS determine the type of OP, second - subtype, etc. HS may also be classified according to different informativity degrees of different HMs. We made such classification. The presentation of OP as a combination of organic matter containing soil horizons (or HS), and as a combination of HMs gives opportunity to show an individual space and ecological connection of these morphological units. Degree of ecological and space areas (niches) superposition of OMCSH with each other is different (3). So long as morphological elements, which constitute OP, connect with each other to a different degree, it may appear that the problem of not functional, but of structural integrity of OP. It may be necessary to use not only morphological, but informational - statystical methods on the computer base for its decision.
Conclusions. 1.Organic profile is a very important soil component in functional and morphostructural aspects. Morphological - ecological description of soil organic matter structural organization on different hierarchical levels permits to understand mechanizms and ways of its transformation being based on first-hand morphological information (sign link) with posterior factor-processing interpretation. 2.The following levels of soil organic matter organization are marked out: profile (organic profile), horizon-morphon (humus stratotype), microfabric (humus morphotype). Humus stratotype (which goes into organic matter contained soil horizon) is a combination of humus morphotypes, soil organic profile is a combination of humus stratotypes. The dividing of taxonomie levels of OP and HS classification should be made according to presence of lower hierarchical structure organization levels elements (humus stratotypes and morphotypes conformally) with corresponding degree of diagnostic importance (informativity).
Literature Cited. (1) Shoba, S.A. 1988. Morphogenesis of forest zone soils. /Autosummary of thesis (post-doc. of biology degree). Moscow, 40 p. (2) Grishina, L.A. 1986. Humus formation and humus condition of soils. Moscow, MSU, 244 p. (3) Minkowsky, G.M. 1992. Interrelationship and ecological individuality of soil horisons exemplified by organic and organic-mineral horizons of soils of the Central Forest reserve.//Moscow State University inform, series 17 - Soil Science, 1992, Nl, p.39-49.
52

Opinions on Global Soil Redization and Yellowization Ye Zhongjie. Zhejiang Forestry College, Linan, Zhejiang 311300, China. Liming He. Dept. of Crop and Soil Environmental Sciences, Virginia Tech.,
Blacksbwg, VA 24061, USA
Red (7.5-5YR) and Yellow (7.5YR-2.5Y) color soils can be found all over the earth (Table )). However, there are still questions to be answered about what caused soil redization and Yellowization. In the former papers (1,2), it has been proposed that soil redization (hematitization) is a process of hydrous iron oxide dehydrating to hematite under catastrophic temperature (>200 C), which is a nonbiochemical process; Soil yellowization (goethitization) is a process of hematite converting to goethite through a redox reaction with vegetation and organic matter, which is a biochemical process. In this paper, the above viewpoints will be further discussed based on our recent research.
Table 1 Selected Black-Yellow-Red Soil Profiles over the world Country Location Soil Depth Soil Color Country Location Soil Depth
(cm} Soil Color
United States
Dona Ana, New Mexico
0 - 20 40 - 60 100 - 150
7.5YR2/2 7.5YR 5/8 5 YR5/4
China Tian-Mu Mt., East China
0 -20 20-55 55 -105
10YR 5/3 10YR 8/4 5YR5/8
United States
Greenbelt, Maryland
30-50 50-80
7.5YR 5/8 2.5YR 3/6
Italy Po Valley 0 -30 30-60 60-150+
5 YR3/3 7.5YR 4/4 5 YR4/4
Brazil Central Plateau
Upper Lower
10YR 2.5YR
Japan Kiwadajima 5-70 90-124 130-200
10YR2/1 7.5YR 7/8 2.5YR 3/4
Distribution of Red Color Soils and Redization. Parent rock which is not red originally could not weather and develop to red color soil whether through a pure geological process or biogeologic process. It has been found that red color soils exist widely n subsoil under forest and grassland vegetation. The upper layer of xerosols in the northern Kenya is yellow red and the subsoil is red. All these phenomena are hard to be explained by the conversion of ferrihydrite to hematite under low moisture and to goethie under high moisture (3). We are interested in a report about the meteorite pit near the Mexico Gulf, due to our viewpoint of high temperature. About 65 million years ago, a large number of animals and plants extinguished, which might be caused by a meteorite impacting on the earth, resulting in a high temperature catastrophe. The high temperature at that time might be the cause of formation of Crelaceous red stratum. Allitic and redization are different concepts. Allitic soils do not have to be red, and red soils do not have to be allitic (1,2), which can be validated by many examples. The clay minerals in the red color soils in Zhoukoudian, Beijing, China and in Maryland, USA (Table 2) do not show their allitic properties. The significant difference of clay minerals among red soils can be a result of the redization of parent materials originally with different weathering intensity under the same high temperature. According to the spore pollen test on the soils from Mt. Tianmu in southeastern China, the geologic age of the red soil layer is estimated to be 400 - 700 thousand years ago. High temperature could happen earlier than that time. In other words, high temperature similar to the one happened 65 million years ago occurred again sometime from early pleistocene to mid-pleistocene. Otherwise, the world wide distribution of red color soils is hard to be explained.
Distribution of yellow color soils and yellowization The distribution of yellow color soils is also world wide, and it is almost true everywhere that where there are red color soils there are
53

Table 2 Mineralogy for Clay Fraction (<0.002mm) in Maryland, USA
Location Sample No.
Soil Depth (cm)
Soil Color Ï -
Kaolinite Vermiculite Mica Quartz
Cireenbett Park Ml 2U-5U 7.5 YK 6/6 48 'li 21 8 M2 50-80 2.5YR 5/6 45 11 38 6
New Carrollton M3 20-50 7.5YR 7/4 44 36 15 5 M4 sn-xn 1 SYR S/fi .11 1Ï 32 5
(The authors acknowledge assistance from L.W. Zelazny and S.B. Feldman in Virginia Tech. to get thedata in this table) * Calculated quantitatively from DSC curves
yellowcolor soils. Yellow color soils are formed from red color soils through yellowization, i.e. goethitization. The soil profiles from different places listed in Table 1 have a common feature, i.e. three color layers, upper black, middle yellow and lower red, which means that the conditions for yellowization are similar. It has been verified by experiments that hematite in red color soils converts to goethite under the existence of organic materials and microbes (4). It can be concluded that the black and yellow layers overlying the red layer were formed from red color soils. In addition, It has been found based on analysis that the free iron and free degree of iron in the yellow color layer are lower than those in the bottom red layer, which means that organic acid reduces hematite first, rather than goethite (4). It has been reported that red color soils are formed relatively easier in dry places, and yellow color soils in wet places. This is not because low humidity helps the formation of hematite, and this is a result of whether the originally red color soils convert easily to yellow color soils. According to Mossbarer spectrum analysis for the soil clay samples from Mt. Tianmu, China, hematite was not found in the yellow layer, however, 19% of the iron compounds in the lower red layer is hematite. This illustrates that the deeper the soil is located, the less the soil is affected by organism.
The transformation of redization and yellowization According to the genetic processes of redization and yellowization, and the wide existence of black-yellow-red three layer soils over the surface of the earth, it can be proposed that redization and yellowization can be transformed with each other. Fig. 1 illustrates the transformation cycle. The conditions for yellowization can be summarized as, a) hematite, b) non-saturated soil humidity, c) organic acid and humic acid, d) microbes, e) soil environment suitable to biological activities, and f) relatively low HA/FA ratio (and high HA/FA ratio can cause the formation of black and brown color soils). The conditions for redization are as, a) hydrous iron oxide, e.g. goethite and lepidocrocite, b) high temperature.
Yellow Redization under high temperature
^ Red color color soil *•
Yellowization with biological activity soil
Figure 1 Trasformation Pattern of Redization and Yellowization
Literature Cited. (1) Ye, Zhongjie 1986. The contribution of forest and catastrophic high temperature to the formation of yellow red earths. Proc. of 13th Congress of ISSS, Germany, IV:1500-1501. (2) Ye, Zhongjie 1990. The influence of paleobioclimate on the formation and distribution of yellow red earths (containing ancient red soil). Proc. of 14th Congress of ISSS, Japan, V:412-413. (3) Schwertmann, U. 1987. Occurrence and formation of iron oxides in various pedoenvironments. Iron in Soils and Clay Minerals: 281-284. (4) Macedo, J. and Bryant, R.B. 1989. Preferential microbial reduction of hematite over goethite in a Brazilian oxisol. Soil Sci. Soc. Am. J. 53:1114-1118.
54

Fluvisol as a Proposed Order in Soil Taxonomy for Active Flood Plain Soils.
B.B. Mishra, CD. Choudhary, N.K. Singh, J. Man, V.N. Singh and R.N. Singh. Soil Survey and Land Use Planning Scheme, Sabour, 813210, India.
Introduction. Order in Soil Taxonomy is based on soil forming processes and includes soils of almost similar genesis (1). Soil Taxonomy is, by and large, biased in classifying the active floodplain soils (2). The orders may be recognised in field without recourse to laboratory analysis. A preliminary investigation was, however, undertaken to characterize these soils of Uanga river plain in Bihar.
Materials and Methods. The study area has sub-tropical humid climate with mean annual rainfall of ± 1100 mm. Flood is occurring periodically and making the soils physically and chemically dynamic. Alluvium is mostly of Himalayan origin. Based on Soil Survey Reports of Bihar, soil profiles of 120 locations were studied and samples were analysed.
Results and Discussion. Recently deposited profile exhibits clear boundary, distinct colour shades mostly of low chroma, inherited materials being mottled, single grain or faint weak structure, uneven distribution of CaC03 and organic carbon and neutral to slightly alkaline pH with fairly high bases. Diffused boundary could likely be due to mechanical mixing of finer particles. This profile represents the soil at time zero on unknown parent material. Besides, it is apparently disturbed and completely stratified with no initial sign of structure and continuum. It is soil and not parent material since it has three dimensional array and is known for growing crop. Besides hydrological cycle (Fig.1) could help the dissolved and suspended particles to move faster in the loosely held soil mass. These forces lead to mixing of solutes and suspended particles even beyond the boundaries for pedon chiefly due to existing hydrological cycle. The process is termed as Trydrocheimturbation' which differs from aquapedoturbation (3). The fact that submergence of soil ibrlong enough period inhibits horizonization (3) seems to be related with hydrochemiturbation.
A pedon developed under fluvial forces is genetically different from those developed under many other environments where soil has got continuum since inception on some well defined parent material. Obviously pedogenesis in such soils could have started on attaining the depositional equilibrium (Fig. 2). Based on specific genetic properties,
55

ES1.
Wavelength of Hydrological cycle
h Under saturation phase Second shift of cycle
amplitude](over soiT* ' of over i surface) saturation f
Point of saturation VAmplitude * (below «oil (Upper boundary of pedonj \ p f under | surface)/
^Over saturation phase ] \jsatura-i
«Jion, First shift of cycle
T- I Time i _
^ Fig.1. Theoretical wove concept of o symmetrical,
single a complete hydrological cycle.
Saturation phase Retardation
phase r
^ Equilibrium t imeT i m e
for fluvial deposit
Fig.2. Theoretical concept of pedogenic processes operating in soil deposited by fluvial action.
Fluvisol is proposed as an Order in Soil Taxonomy to characterize and classify these soils with all fairness. Its basic concept is similar to Fluvisol in FAO system
Arnold, R.W. 1982. Soil Classification. IIL Whither Soil Research. 12th. Intern Cong. Soil Sci. New Delhi, p.277-285.
Sehgal, J.L 1986. Introductory Pedology, Kalyani Pub., New Delhi.
3. Bnol, S.W., Hole, F.D. and McCracken, R J 1080, Soil Oenefitft mA Classification. Oxford &IBH Pub. Co. (P) Ltd., New Delhi.
56

Conditions of Soil Formation in the Arctic Region ( on the Example of Spitsbergen )
Z. KMmowicz, S. Uriak. Department of Soil Science, Maria Curie-Sklodowska University, 20-033 Lublin, Poland.
Introdnctioa. Studies on the contemporary soil processes in the polar region help to understand the way soil was formed in the periglacial conditions that predominant both in Poland and in other countries with the similar geographic location. It should be added that climatic conditons in the above mentioned regions were similar even though their course was a little different because of such factor as the differentiated distance from the Pole.
Study area and methods. The arctic region, in the general understanding of the term, consists of the arctic seas and islands around the North Pole, as well as northern rim of Europe, America, and Asia. On one of the islands of the above mentioned region, i. e. Spitsbergen, that belongs to the Svalbard archipelago, soil cover has been studied for several summer seasons. The geology of Spitsbergen is very complex. The youngest quaternary formations are usually found together with the areas of lower situation, and the glacial forelands. The climat of Spitsbergen is more favourable that it is usual at this geographical latitude. In the western part of island the annual mean temperature is -7° C, and the annual rainfall rate does not exceed 400 mm. Plant cover results from these climatic conditions. Two types of most common tundra plants can be distinguished: dry and mesophyllic both of mossy and lichen - like type, and wet tundra plants together with flooded mossy areas. The soils of the region were examined by means of soil pits and soil topographic sections.
Results. Three groups of factors influence the soil formation in the studied region, and probably in the whole arctic region as well. These are: cryogenic processes, soil formation processes and lithology that influences, among others, the mineralogical composition and grain size distribution, soil reaction, or the composition of exchangeable cations. Cryogenic processes are connected with climat, i. e. mainly with temperature and rainfall rate. Some of more important processes of this group are: frost segregation processes, frost and gravitational slop movements, processes of fissure formation and swelling. The process mentioned as last can be observed mainly in the heavier formations with high contents of hydrophylic colloids. A rich variety of different formations, mainly surface ones, that exert influence on the arctic soils, results from the above mentioned processes acting on the ground and on the soil. Soils that are formed from them are called the surface differentiated soils. They are mainly gley, brown, or poorly developed soils. The same soil units may also develop on not differentiated surfaces. Among the soil formation processes we can distinguish such processes as: the initial stage of development, gl eying, pit formation, browning, alluvial and deluvial processes. Hie last two processes are to a large extend also geological processes, hi arctic region both cryogenic and soil -forming processes usually influence together on soil cover and soil properties. As the consequence of the above, genetic horizons are not clearly formed, and the nutritive elements and organic matter is distributed in a different, specific for the polar region, way.
57

Characteristics and Classification of Seasonally Wet Soils with Epi- and Endo-Saturation
W. H. Hudnall , A. A. Szogi, W. C. Lynn and J. J. Daigle. LSU Agricultural Center, Louisiana Agricultural Experiment Station, Agronomy Dept., Baton Rouge, LA., USDA - ARS, Florence, SC, USDA - SCS, Lincoln, NE., and USDA - SCS, Alexandria, LA., U.S.A.
Introduction. In Soil Taxonomy, the characteristics that define soils with stagnant or perched water tables appear at different taxonomie levels. They are not explicitly defined according to the definition of the aquic moisture regime. The taxonomie placement of these kinds of soils are related to the specification of the minimum duration of saturation and reduction, definition of the soil moisture control section, verification of low chroma colors and in situ reduction. The recognition of the different problems that plagued the classification of wet and seasonally wet soils brought about the thoroughly revised definition and criteria for the aquic moisture regime. This revision proposed to use the terms "aquic conditions" rather than "aquic moisture regime". Aquic conditions are defined by three elements: 1. presence of redoximorphic features, 2. duration and depth of saturation and 3. reduction unless the soil is artificially drained. The objective of this paper is to present data that was used to test these aquic conditions criteria.
Materials and Methods. Data from two Mississippi alluvial soils (Commerce; fine-silty, mixed, nonacid, thermic, Aerie Fluvaquents and Sharkey; very-fine, montmorillonitic, nonacid, thermic, Vertic Haplaquepts) and two coastal plain soils (Verdun; fine-silty, mixed, thermic, Glossic Natraqualfs and Brimstone; fine-silty, mixed, thermic, Typic Natraqualfs) were chosen from ten soils studied to represent seasonally wet soils. The instrumentation and data recorded for each site is described by Hudnall and Wilding (1). Briefly, each soil was described and sampled for complete chemical, physical and mineralogical characterization. Tensiometers, piezometers and an open well were used to discern the soil saturation. Pt electrodes and dyes were used to describe the redox potential and the soil temperature was measured to determine the soil temperature regime.
Results and Discussion. The data of the Commerce soil support aquic conditions. Saturation, reduction and redoximorphic features occur above 50 cm and to a depth of at least 2 m. The soil did not have an unsaturated zone between 1 and 2 m when the upper 50 cm was saturated. The data support endoaquic saturation, but the soil water is oxygenated if the soil water table is being controlled by the Mississippi River and could be considered as Oxyaquic. The Sharkey soil had aquic conditions with saturation and reduction within 50 cm to below 2 m. The soil was saturated to within 25 cm of the soil's surface during the majority of the monitoring period. The soil has endoaquic saturation. The data for the Verdun soil support aquic conditions. Saturation, reduction and redoximorphic features occurred within 50 cm to below 2 m. The soil had an unsaturated zone between 1 and 2 m when the upper 50 cm was saturated during the summer months. The soil was also saturated to the surface from the ground water table during the winter. This soil has both epiaquic and endoaquic saturation. The ground water is slightly oxygenated when the soil is epiaquic saturated.
58

The Brimstone soil was saturated, reduced and exhibited redoximorphic features. Although it was difficult to determine if the gray color is relic or a result of redoximorphism. The soil saturates from the top down and is dry between 1 and 2 m when the upper 50 cm is saturated. The soil has epiaquic saturation. The classification of these soils based on the 1992 Keys to Soil Taxonomy (2) is: Commerce Fine-silty, mixed, hyperthermic, Aerie Endoaquepts Sharkey Very-fine, montmorillonitic, hyperthermic, Chromic Endoaquerts Verdun Fine-silty, siliceous, hyperthermic, Glossic Natraqualfs Brimstone Fine-silty, siliceous, hyperthermic, Typic Epiaqualfs
Literature Cited. (1) Hudnall, W. H. and L. P. Wilding. 1992. Monitoring Soil Wetness Conditions in Louisiana and Texas. In Proceedings of the Eighth International Soil Correlation Meeting (VIIIISCOM): Characterization, Classification, and Utilization of Wet Soils. USDA, Soil Conservation Service, National Soil Survey Center, Lincoln, NE.
(2) Soil Survey Staff. 1992. Keys to Soil Taxonomy. 5th edition. SMSS Technical Monograph No. 19. Blacksburg, Virginia: Pocahontas Press, Inc. 556 pages.
59

Abundance, Characteristics, and Genesis of Preferential Flow Paths in a Soil from the Piedmont of Georgia, USA
D. Franklin, L.T. West, P.F. Hendrix, and D.E. Radcliffe, Department of Crop and Soil Sciences, University of Georgia, Athens, GA 30602, USA.
Introduction. Because of public concern for potential contamination of ground and surface water, understanding of processes of water and solute movement through soils is becoming more important. While much success has be realized describing movement of water and solutes through homogeneous soil systems, many field situations have been encountered where rates of contaminant movement through soils were much faster than could be explained with basic transport and adsorption parameters. Such rapid movement of contaminants through soils has been normally attributed to flow through macropores or "by-pass" flow. Thus, to adequately describe water and solute movement through soils, abundance, characteristics, and origin of preferential flow pathways must be understood. This study was initiated with the following objectives: 1. To describe abundance and characteristics of preferential flow paths in upper horizons of a typical soil from the Georgia Piedmont, U.S.A., and 2. To characterize morphological differences between conductive and non-conductive regions in these horizons in order to propose genesis of preferential flow paths.
Materials and Methods. Forty 15 X 60 cm undisturbed columns were collected from a clayey, kaolinitic, thermic Typic Kanhapludult, near Watkinsville, Ga. Columns were slowly saturated from the bottom, and KMt determined by leaching with 0.025 N KN03 under a 2 cm head. Staining of preferential flow pathways was accomplished by leaching the columns with a 1000 ppm solution of methylene blue until complete dye breakthrough was achieved. Columns were sliced horizontally at 5 cm increments beginning approximately 2 cm below the soil surface, and dye-stained area for each horizontal face was determined by image analysis. Morphology of the slices was described and samples collected for particle size measurements. Samples of selected material were impregnated with epoxy resin containing a fluorescent dye and polished blocks and thin sections prepared by standard techniques. Pore characteristics of dyed and undyed regions were determined by image analysis of blocks and thin-sections under ultra-violet (UV) light.
Results and Discussion. Mean dye-stained area of Ap horizons was >97% suggesting that most of the horizon was transmitting water with little preferential flow. In transitional BA horizons, mean percentage of dye-stained material was similar to that observed in the Ap horizon though clay content gradually increased. At the upper boundary of the Bt horizon, mean percentage of dye-stained material decreased abruptly and reached a minimum of 66% at 55 cm (Table 1).
Ap horizons were sandy loam textured and weakly structured. Few open channels were observed in these horizons, and few morphological features were present that might indicate pathways for preferential flow. In upper BA horizons, structure was weak and few open channels were present. In lower BA horizons, structure was better expressed, abundance of open channels increased, and chambers were occasionally observed. Undyed zones in transition horizons were more clayey than the soil matrix and likely represent remnant fragments of Bt horizon. Bt horizons had the greatest amounts of undyed material, and in general, the dyed and
60

undyed material was intermixed with no characteristic pattern. A few dyed zones, however, occurred as 10-20 mm diameter circles suggestive of coarse channels that had been infilled. Dyed zones contained channels and chambers that were absent in undyed regions.
Table 1. Mean percent clay, dyed area, and macroporosity in dyed and undyed areas for selected depths in the columns.
Horizon Slice depth Clay Dyed area Macroporosity in
dyed area Macroporosity in undyed area
cm
5
%
Ap
cm
5 17 99 19 3
Ap 15 12 97 18 5
BA 25 24 98 18 3
BA 35 35 97 16 2
Bt 45 42 83 14 3
Bt 55 52 66 14 3
Mean percentage of macropores (>0.05 mm equivalent circular diameter) in dyed areas was 4-6 times greater than that in undyed areas and remained relatively constant with depth (Table 1). Mean pore size was larger in dyed areas than in undyed areas, and most pores in Bt horizons were > 1.0 mm diameter. Most pores in Ap and upper BA horizons were packing voids with few channels. Packing voids were also abundant in lower transition horizons, but the number of channels increased appreciably when compared to near surface horizons. Microfabric of dyed soil was more aggregated than undyed soil, and a few of the coarse channels in these regions were partially filled with fecal pellets. In Bt horizons, most macropores in undyed soil were small packing voids within peds and between structural units. Dyed regions in these horizons had fabric and pore characteristics similar to those in dyed soil in overlying horizons.
Percentage of dye-stained area in the upper 60 cm of this soil suggests that most of the soil matrix is transmitting water under saturated conditions. In Ap horizons, low clay contents and weak structure result in coarse packing voids that transmit water uniformly through the matrix. In BA horizons, structural characteristics and abundant channels suggest that almost the entire soil volume in these horizons has been biologically modified. Thus, even though clay content increases through this horizon, open and infilled channels and coarse compound packing voids, hypothesized to be the result of biologic reworking, transmit water through most of the volume of these horizons. Less of the soil volume contributes to flow in Bt horizons. Microfabric and pore characteristics of the water transmission regions in Bt horizons, however, are similar to those observed in overlying horizons which suggests that these regions have also been biologically modified during the course of soil development. No conclusive evidence was observed that would identify the species primarily responsible for the biologic modification of these horizons. Native forest vegetation and observation of coarse (10-20 mm) infilled channels in lower horizons, however, suggest tree roots may have initiated the biologic modification with subsequent infilling and reworking by other species of flora and fauna.
61

Hidrosequence of Cambisols Derived from Limestone in Low Tablelands in Northeastern Brazil - Implications for
Management
N. Curi and M.S.S. Lemos. Department of Soil Science, Escola Superior de Agricultura de Lavras, 37200-000 Lavras, Minas Gerais, Brazil.
Introduction. The low tablelands in Northeastern Brazil, inserted in the Dry Polygon region, are generally covered by soils with reasonable natural fertility. These tablelands are being object of important integrated government programmes for improving food production. However, the avaliable informations concerning with basic studies for appropriate use and management of these soils are relatively scarce (I).
Materials and Methods. The relief of the studied area is predominantly plain and the natural vegetation is dominated by stunted sparse small trees called "caatinga'. The climate is hot semi-arid and Cambisols are the main soils where limestone is the parent rock. The selected Cambisol profiles, which cover 3976km in Rio Grande do Norte State, were morphologically described and the samples from their horizons were submitted to physical, chemical and mineralogical analyses. Informations obtained through informal interviews with farmers were added to those data interpretation.
Results and Discussion. Despite of the apparent homogeneity of the tableland, the soils of the medium section of the landscape are Eutric Cambisols which differ very much in terms of physical and mineralogical properties (Table 1), from those of the inferior part of the landscape, Vertic Cambisols. It is important to stress that, although the analytical data (Table 1) show lower moisture values for Vertic Cambisols than for Eutric Cambisols, the first retains more water during the year as compared to the latter. This occurs because the first is in a more receptive position in the landscape. These findings emphasize the need for considering the field relations the soil samples represent (2).
Through the interpretation of the pedological and informal interviews informations, the main constraints in each soil were assessed. In the Eutric Cambisols the main constraints refer to low water storage and erosion susceptibility, while in the Vertic Cambisols the waterlogging risk and mechanization impediments are the critical limitations. For both soils, pH is above 7 and base saturation is higher than 90%. In order to ensure crop production, N, P and micronutrients have to be added as fertilizers. In conclusion, it was found that local variations in soil properties, as a function of landscape position, determine the hidrosequence. Soil properties such as color, texture and shrinkage are easily-identifiable field attributes which can t>e used for soil recognition and for management purposes, as well.
Literature Cited. (1) Ernesto Sobrinho, F. Vicpsa, UFV, 1980.133p. M.Sc. Thesis.
(2) Daniels, R.B. 1988. Pedology, a field or laboratory science? SSSAJ 52:1518-1519.
62

Table 1. Selected properties of the soils.
Soil/horizon Clay
gkg"1
Specific surface area mV1
Moisture (gkg-1) Clay mineralogy1
Clay
gkg"1
Specific surface area mV1
-0.033MPa -1.5MPa
Clay mineralogy1
EC2/A EC/Bw
VC3/A VC/Bwv
370 460
110 200
203 222
131 150
300 320
170 220
240 230
110 150
Mi-Vm, Hm
Sm
•'•/Mica, kaolinite, goethite and anatase are common to both soils. Mi-Vm=mica-vermiculite intergrade; Hm=hematite; Sm=smectite. 2'EC=Eutric Cambisols. 3'Vertic Cambisols.
63

Genesis and Evolution of a Mediterranean Brown Soil Developed Over Granitic Rock
R.O. Zappino. Consejo National de Investigaciones Cienttficas y Tecnológicas (CONICET). Cdt. de Edafologia, Fac. de Agr. y Zoot. Univ. Nac. de Tucumdn. Rep. Argentina
Introduction. The purpose of this paper is the study of mineralog of soils formed from granitic rocks through a transect composed b> three profils. It is approximately 700 m long and it is located fron north to south close to Castilblanco de los Arroyos, Province of Sevilla, Spain. Geograghically it is located in Sierra Morena Occidental (5).The petrology of the area is represented by andesitic,da-citic, and basaltic rocks associated to sedimentary rocks, with intrusive granitic rocks wich constitute the parent rock of the soils studied: Dystric Xerochrept, Typic Xerochrept and Typic Haploxeralf (2) (4).
Materials and Methods. The study was conducted starting from the modal analysis of the parent rock and of the mineralogy of the sand fraction of each of the genetic horizons described in the field, under the concept of"constant volume hypothesis"(1).Thus different alteration indexes were used,like quartz/feldspar,sphene/ferromagnesic minerals and the different textural fractions (3). The neo-formation of clay was calculated with profil 2, modal profil of the transect.
Results and Discussion. Modal analysis of parent rock: Quartz: 31.33; Feldspar: 48.60; Plagioklas: 13.20; Muscovite: 3.30; Biotite: 1.40; Zircon: 0.97; Opaque: 0.80. / \ ; Horiz. ;(profil 1)
Al ; A2 ; c
Alteration Indexes Texture (u) ; Horiz. ;(profil 1)
Al ; A2 ; c
Qz/Feld 1.290 0.710 0.790
Sph/FeMg 0.075 0.079 0.100
2000-200 37.20 31.00 36.00
200-20!20-2 i< 2u 28.00;19.00112.50 34.80;16.00;15.50 28.90117.50!15.50
(profil 2) : Al ; A2 ; AB ; Bwi ; Bw2 ; c
1.750 0.670 0.860 0.690 0.610 0.590
0.035 0.051 0.013 0.026 0.026 0.028
36.00 37.30 37.20 34.40 33.50 34.60
32.70;i9.10il2.20 33.20;i7.10!12.40 26.80;23.10;i2.90 23.70126.20;16.70 23.50;25.40;17.60 25.60126.90112.90
(profil 3) : A ! E Bwl Bw2
; c
0.150 0.130 0.080 0.160 0.500
0.022 0.013 0.011 0.075 0.016
46.00 37.80 27.50 19.00 32.00
21.90;16.00;14.00 27.00!17.00!15.00 31.70119.50!19.00 41.40!19.00!21.00 41.70;10.50J14.50
\ / 3z:quartz; Feld:feldspar; Sph:sphene; FeMg: minerals of Fe and Mg.
64

Neo-formation of clay. Profil 2 (Modal profil)
\
Horiz Feldspar K Plagioklas Minerals of Fe-Mg
a b c a b c a b c Al 6.25 2.00 -40.10 1 .29 0.53 -59.01 0.40 2.49 271.00 A2 4.18 3.14 -24.93 0 .87 0.38 -57.73 0.27 1.05 290.00 AB 6.96 3.16 -54.66 1 .44 1.09 -24.42 0.44 5.04 1025.00 Bwl 13.92 11.36 -18.40 2 .89 0.82 -71.71 0.89 2.99 243.00 Bw2 9.08 7.88 -15.27 1 .88 0.27 -85.8 0.58 1.90 225.30 C 6.25 5.55
Clay
-11.20 1 .29 18.40 13.34
References
0.40 1.24 208.90 1 .29 18.40 13.34
References
0.40 1.24
a b c a: percentage pondered in volumen 2.61 2.07 -20.70 respect to parent rock 1.74 1.53 - 12.10 b: modifications of the parent 1.92 2.25 -22.90 rock in the actual horizons 2.85 4.50 -23.10 c: percentage of absolut variation 3.78 3.29 -13.00 refered to parent rock
The analysis of these results would indicate that silicates of magnesium and iron together with potassic feldspar and plagioklas have a predominant participation in the development of these soils and they would be the main sources i>-> the neo-formation of clay.
Literature cited. (1) Brewer, R. 1964. Fabric and mineral analysis of soils.Wiley, New York, N.Y., 470 pp. (2) I.B.M.E. 1975. Mapa Geológico de Espana. Carta 940 12-38. Castilblanco de los Arroyos. Segunda serie. Primera edición (Espana). (3) Karlsson, A. 1986. Mineralogia de un Argiustol tipico. Fac Cs. Ex. F. y Nat. Univ. Nac. Cordoba. Ined.
1974. Procesos geoedaficos en la de la Tierra Parda Meridional y Biol. Apl. del Cuarto (CEBAC).
genesis, Tesis
Sevilla.
(4) Moreno Alvarez, J.L evolución y desarrollo Doctoral. Centro de Edaf Espana. (5) Paneque, G. et. al. 1970. Suelos de la Sierra Morena Occidental. An. Edaf. y Agr. XXIX, 11-12. Madrid. Espana.
65

Formation of Mountain Yellow Red Earths and Their Properties suitable for Afforestation in Subtropics of China
Xizhou Chai*. Zhejiang Forestry Institute, Hangzhou 310023, China. Zhongjie Ye. Zhejiang Forestry College, Linan, Zhejiang 311300, China. Zuren Cai. Zhejiang Geology and Minerals Institute, Hangzhou 310007, China. Liming He. Department of Crop and Soil Environmental Sciences, Virginia Polytechnic and State University, Blacksburg, VA 24061, USA.
Introduction. In consideration of the close relation of mountain soil environment to forest ecology and exploitation of mountain resources, a further investigation was conducted on the representative mountain soils in Zhejiang, Anhui, Fujian, Jiangxi, Hunan, Sichuan, and Yunnan Provinces on the basis of previous studies (1,2). The objective of this research is to illuminate the genesis of the mountain yellow red earths and their characteristics suitable to afforestation in the subtropical China.
Materials and Methods. Soil samples were taken from those profiles which have a subsoil layer of red paleosol at various altitudes between 600 and 1300 m. Rhizosphere soils were sampled under the trees of differently growing situations in golden larch (Pseudolarix amabillis Rehd.) plantation in Mt. Tianmu. The samples were analyzed for humic component, particle composition, siallitic ratio of clay, morphology and Mossbauer analysis of Fe oxides, bulk density, percolation rate, enzyme activity, and spore pollens.
Results and Discussion. Mountain yellow red earths basically developed from red paleosol parent materials. They possessed a clayey texture, low pH, ratio of HA/FA less than 0.5; higher clay siallitic ratio, degree of activity and hydration coefficient of Fe oxides in the yellow horizon than the red; lower free Fe content and free degree of Fe oxides in the yellow horizon than the red (Table 1). In the yellow horizons of Mt. Tianmu and Mt. Wulong soils no hematite was found by Mossbauer analysis in clay in which 81-93% of iron was Fe?+ with the rest of Fe2+, while the red layers underlying the yellow contained 19% of hematite.
Table 1. Properties of the selected mountain yellow red earths in the subtropical China
Location
(«) Depth (cm)
Color < 2/t clay (%)
Clay Si/Al
Free Fe (Fe„%)
Free deg. (Fed/FeJ
Fe activity (Fe0/Fed)
Hydr'n coe. (Fe0/clay)
Mt. Wuyi
(1320)
15-60
60-90
10YR7/6
5YR5/8
25
22
3.02
2.30
2.55
3.93
0.41
0.55
0.064
0.019
0.660
0.341
Mt. Jiuhua
(700)
20-40
40-70
7.5YR5/4
5YR6/6
32
24
2.48
2.43
2.62
3.74
0.37
0.45
0.049
0.014
0.403
0.213
Mt.Wulong
(670)
15-60
60-90
10YR7/6
5YR5/8
30
28
4.11
2.94
3.34
4.52
0.46
0.53
0.014
0.015
nd
0.243
66

The results of spore pollen identification on the soils of Mt. Tianmu and Mt. Wulong indicated that, at a lower altitude, spore pollens in yellow layers were predominated by pteirdophyta with a less amount of spore pollens from a mixed coniferous and broad-leaved forest, and very few spore pollens found in red layers, implying a warm climate. In contrast, at a higher altitude, although it was found in yellow layers that pteirdophyta predominated, the second was deciduous broad-leaved forest, the third mainly graminaceous herbage, and no spore pollens were found in red layers, showing a dry and warm climate. The composition of spore pollens in upper layers was similar to the modern vegetation.
The upper soil of yellow red earth was so loose, and organic matter so abundant that the activity of enzymes in rhizosphere soils of the badly growing plantation was higher than that of the well growing one. This may be relative to canopy density of the forest lands. High bulk density and low percolation rate (Table 2) of both yellow and red horizons resulted in water stagnation in rain seasons which affected growth of roots. Although golden larch grew regularly, even thrivingly during the first years, the early aging, stagnating growth, unusual deciduousness and physiological etiolation appeared after 7 or 8 years. The growth of golden larch in the yellow red earths was a half of that in the black yellow red earths (upper black layer > 60 cm) 10 years after plantation (Table 2).
Table 2. Properties of the mountain yellow red earths in relation to the growth of golden larch at an altitude of 1000 m in Mt. Tianmu of Zhejiang Province
Growth H(m) D(cm)
Soil depth (cm)
Bulk density (g cm')
Percolation rate
(mm min')
Peroxidase 1
Polyphenol-oxidase §
Sucrase t Urease t
4 6
0-25 25-52 52-84
0.96
1.44
1.39
5.82
0.03
0.11
2.569 21.606 44.081 81.412
8 12
0-30 30-55 55-85
0.76 0.86 0.87
3.74 2.18 2.10
1.555 10.860 22.549 63.302
1 0.1 N K,MnO, ml g•' soil. § 0.01 N I ml g' «oil. t C,H„0, mg per 100 g toil, 3 hr. t NH, N mg per 100 g toil. 3hr, 2TC.
Conclusions. The mountain yellow red earths in the subtropical China derived from the parent materials of red paleosols. Hematite in yellow layers has been completely converted to goethite or others. The more deeply the red layer is buried down a profile, the less the possibility for hematite to be converted to goethite by organisms. Being similar to the red reticulate soils in hills, they developed in mid-pleistocene, i.e. about 400 to 700 thousand years ago. The existence of mountain red paleosols is one of the causes for failure in plantation.
Literature cited (1) Zhongjie Ye and Xizhou Chai. 1986. Zhejiang Forest Soils. Publishing House of Zhejiang Science and Technology, 99-105. (2) Zhongjie Ye. 1990. The Influence of paleobioclimate on the formation and distribution of yellow red earths (containing ancient red soil). Proc. of the Congress of ISSS, Japan. V:412-413.
67

Two Type Paleosols Developed from Loess in the Piedmont Area of Beijing and Their Forming Paleo-
Climate Fengrong Zhang and Luo Hua. Department of Soil and Land Resource Science, Beijing Agricultural University, Beijing, 100094, PRC
Introduction. There are two type pnlaosnh developed from loess in the piedmont, area of Beijbg. Comparing with the soil developed under modem climate in this region, the two pakoenlB have strongly weathered. Research shows that the two palnrwols were developed under the much more hot and Utile more humid pnleodJmate than today's climate. Obe paleosol is named fossil hrown earth. Another paleosol is named fossfl dry red sofl. They are different sou type from the rirmamm sou which is developed under today's cbmata
Materials and Methods» The two type paleBols are distributed in the piedmont along Taihang Mountion and Yanshan Mountkn. Obe typical loess section was as studying site, which is located in Taiping village, Changping county, Bajng. This section can 1» divided into three stratums, three type soils were developed correspondingly in the three stratums. The section is described according to Guidelines for Sofl Raffle Descriptkn(FAO/Uheaco, 1S77). Analysed data are texture(pipet method), calcium carbonate (HQ treatment, gas volumetric), pH (soil siispensinnB 1: 25 OaQa), Freenese of iron oxide, Le. fed (dithxxiitB-citrats-bKarbonate). Activity ofiron oxide La Feo(ammonium oxalate), SQa/AldQs (chemical) and clay mineralogy (X-ray diffraction).
Results and Discussion. In this section, the top stratum is about 44 meters thick, the bottom stratum L6 meters thick and the middle stratum Z2 meters thick. There are many lagre carbonate concretions between the top stratum and middle stratum.
The top soil is caDed qnnarnon sofl or drab sofl. It has characteristics with greater thickness of Bw horizon, yeOpw brown( 10YR4/6) color, sflty loam, strong coarse subangular blocky structure, friable when moist, no day coatings. The clay(0.0Q2mm) content is about 21%, silica-alumina ratio of fine earth is about 422, dcmmant clay minerals are flute and chlorite, freenese of iron oxide of fine earth is about 49%, but activity of those is about 46%. The pH is 7.4 without free cabonate.
The middle sofl is one kind of paleosol. If s Bt horizon has characteristics with reddish brown (5YR4/6) color, sflty clay loam, strong coarse angular blocky structure broken moderately thick cutans on pad faces. The clay(0.002mm) content is about 30%, and aOka-alumina ratio of fine earth is 3.79 , dominant clay minerals are flute and chlorite with traces of hematite and vermicutite. The freenese of iron oxide of fine earth is about 48% but activity of those is about 6.8% The pH is 7.3, without free cabonate.
The bottom soil is another kind of pakosoL If e Bt horizon has characteristics with red (26YR4/6) color, silty clay, strong coarse angular blocky structure, broken
68

moderately thick day coatings on ped faces. The day(0.00&im)oontBnt is about 43% . The pH is 7.3, without free cabonate. The dominant day mineral ÏB iffite and dilurile with traces of hnnalitw and kaoftrrite. The freenees of iron oxide of fine earth is about 69%, but activity of those is about 8% • The aflica-alumma ratio of fine earth
»ao6. By oomppng the two paleosofe with the cfrirwmon sofl of Bei jog region and other sofls distiabuting in the other climate regions, the middle sou looks like brown earth which distributes in Shandong and Tjanning provinces. So the middle paleosol ie named fcssfl brown earth, it is devetped under utile more humid and hot paleodknate than today's climate. The bottom paleosol looks nke dry red sofl which distributes in the west of Hainan island. So the bottom paleosol is named fcssfl dry red sofl, it is devdped under little more humid but much more hot paleodimate than today's climate. The two PHIBOHOIB are largely attributable to paleo-dimalological "••ri<A»i-reflect that the climate have changed from warm to cold since the Tertiary Period in Beijing region.
The exposure of the paleceofe is the one of important reason causing differentiation of soil types in same cSmatical region. Therefore the geographical- genetic classification system and theory face the challenge.
By comparing this loess section with the loess section of Tiuocriuan of Shanxi province, the top stratum from which the dnnamon soil or drab was developed was deposited in late Pleistocene Period. At that time the climate was same as today's chmata The middle stratum from which the fossil brown earth was developed was deposited in the middle Pleistocene Period. There was warm and humid climate in that period. The bottom stratum from which the fossil dry red soil was developed was deposited in the Pliocene Tertiary Period. There was hot and humid climate in that period. So the two paleosofe shaws that they have characteristics of much more weathering or development.
The Beijing region is located eastern flank of the distributed loess region. By comparing the characteristics of the two paleosofe of Beijing with the characteristics of paleosofe in the Loess Plateau, it has been found that the development of the palecsofe in Beijing region is stronger than the development of paleosol in the Loess Plateau.
69

.
Natural Soil Development Along An Elevatio-nal Climate Gradient In Hawaiian Montane
Rainforest
R. Rodenkirchen and H.M. Richter. Department of Soil Science and Site Research, University of Munich, Frei-sing, Germany
Introduction. One approach to assess the potential long-term effects of global climatic change on forest ecosystems is to investigate climatic gradients in which the major ecological factors other than climate are constant. The seperate effect of climate on natural soil development can be successfully investigated in montane rainforests of Hawaii, which are not effected by anthropogenic air pollution or management (1). The objective of the project was to investigate the soil development along an elevational gradient on the wet east flank of the volcano Mauna Loa. We were mainly interested to analyse the amount and quality of soil organic matter, the contents of total and available nutrients and the soil acidity, which were expected to be significantly influenced by climate.
Materials and Methods. Soils on two adjacent lava flows with different age (138 and 3400 years) but same parent material (basaltic pahoehoe lava) and topography were investigated at three elevations: 700 m (19-20°C temperature; 6500 mm annual precipitation), 1160 m (17°C; 4500-5000 mm), 1660 m (14°C; 2700 mm). All sites were dominated by the native tree species Metrosideros polymorpha. 3-4 replicate soil pits per site were morphologically described, sampled by horizons and analysed for total carbon, DOC, pH, CEC, base saturation and total, H2O- and NHijCl-extractable nutrients. Selected samples were tested for andic properties and different Al/Fe-fractions.
Results and Discussion. All soils were highly organic (O-C profiles) and may be classified as Histosols (Lithic Tropofolists). The initial accumulation of organic carbon and nitrogen on the young flow was much faster at intermediate and low elevation than at high elevation (table 1); the slow accumulation at 1660m was caused by the very poor net primary production of a sparse pioneer vegetation (temperature limitation). The largest pools of total and well decomposed, humified organic matter and nitrogen were found on the 700 m-old flow site; reasons for that may be the great litter production and the stabilization of well decomposed organic matter by periodic wetness and interrelations between fine humus and clay minerals or elevated Fe/Al contents
70

See instruction on the reverse
(most intensive chemical weathering; indications for Al-comple-xes and the occurrence of ferrihydrite). There was a tendency for C:N ratios of litter and Of-horizon samples from the old flow to narrow with decreasing elevation; this corresponded to the variation of foliar nitrogen concentrations of Metrosideros leaves (1) and indicated faster nitrogen cycling with increasing temperature. The soil of the 700 m-old flow site was the only one which showed significant nitrate concentrations in water extracts. The greatest base cation depletion and Al release under acid conditions occurred at the lowest elevation, which was characterized by the most rapid chemical weathering, the largest amount of drainage and probably the highest cation uptake in biomass.
Conclusions. Relatively young soils, which are not yet in a steady state, may react to an increasing temperature (under a perhumid climate) with: a) increasing pools of well decomposed organic matter b) greater N-availability c) accelerated base cation depletion and Al-release
Literature Cited. (1) Vitousek,P.M., Aplet,G., Turner,D. and Lockwood,J.J., 1992: The Mauna Loa environmental matrix; foliar and soil nutrients. Oecologia 89, 372-382.
Table 1: Some properties of soils along the elevational gradient (means)
700 m 138 ys 3400 ys
1160 m 138 ys 3400 ys
1660 m 138 ys 3400 ys
Total solum - depth (cm) - pools (g/m^)
of: a) org. C b) total N
6,5 28,6
695 7487 20 509
8,6 10,5
1031 2303 30 72
0-3 10,1
217 4099 6 187
Of-horizon - C:N ratio
- PHH20 - 0,5 m NH4CI
extractable cations
a) Base saturation (%)
b) Ca (umolc/g) c) Al (umolc/g)
41,2 29,2 4,23 4,76
65 48
84 72 52 80
41,3 36,9 4,49 4,66
78 85
136 248 28 20
42,5 43,3 5,01 4,69
98 91
313 272 0 10
71

Distribution Patterns of Upland Soils in the Philippines
T. Hamazaki* and E. P. Paningbatan, Jr.**. * National Institute of
Agro-Environmental Sciences, Tsukuba, Japan. ** University of the Philippines
at Los Banos, Los Banos, Philippines.
Introduction. The objectives of the study were; to analyze the genesis, physico- chemical and mineralogical properties of upland soils in the Philippines; to determine their patterns of distribution in relation to parent materials, topographic position and climate; and to classify these soils according to some soil classification systems.
Materials and Methods. Nine areas all over the Philippines were selected and soil samples from 48 pedons were collected and analyzed. The primary considerations for selecting the sites and the pedons were as follows: 1. Upland soils in the Philippines which were temporarily classified into 13 soil taxa depending on the kind of parent materials and topography; and 2. Climate in the Philippines which was grouped into 3 types based on the duration of dry months; namely: 5 dry months or more (tropical monsoon climate), 2 to 4 dry months (tropical monsoon climate), and less than 2 dry months (tropical rain forest climate).
Results and Discussion. 1. Main upland soils in the Philippines consisted of Red soils, Yellow soils, Dark Brown soils, Terra Rossa- like soils, Terra Fusca- like soils, Rendzina- like soils, Brown Upland soils. Pseudogley- like soils, Andosols, Vertisols, Brown Lowland soils, and Gray Lowland soils. 2. From residual, old alluvial and volcanic mud flow, andesite and basalt materials, Red soils and Yellow soils were formed on hills, and upper and middle terraces. The Red soils were strongly acid with a low activity under climatic conditions characterized by less than 2 dry months, strongly to moderately acid with a low activity under climatic conditions characterized by 2 to 4 dry months, and moderately acid under climatic conditions characterized by more than 4 dry months. The Yellow soils were strongly acid with a low activity under climatic conditions characterized by less than 2 dry months, strongly to moderately acid under climatic conditions characterized by 2 to 4 dry months, and were hardly formed under climatic conditions characterized by more than 4 dry months. On lower terraces, only Yellow soils were formed. The Yellow soils were moderately acid with a low activity under climatic conditions characterized by less than 2 dry months, and moderately acid under climatic conditions characterlized by 2 or more dry months. These Red- Yellow soils were classified as Kandihumults, Kandiudults, Kanhapludults, Haplohumults or probably Haplustults in the Soil Taxonomy. 3. From residual, aquatic and/or eolian materials on limestone, Red soils were formed on hills, Terra Rossa- like soils on flat higher terraces, Terra Fusca- like soils on flat lower terraces, and Rendzina- like soils on recently raised coral terraces and slope of rolling terraces. Red soils were strongly to moderately acid, Terra Rossa- like soils slightly acid, Terra Fusca- like soils slightly acid to neutral, and Rendzina- like soils neutral to slightly alkaline. Terra Rossa- like soils and Terra Fusca- like soils were classified as Paleudalfs, Hapludalfs, Paleustalfe or Haplustalfs, and Rendzina- like soils as Rendolls or Haplustolls in the Soil Taxonomy. 4. Under climatic conditions characterized by more than 4 dry months, Brown Upland soils with soft powdery lime (Ustropepts) developed from residual material of calcareous shale and sandstone on hills, and Vertisols with soft powdery lime (Endoaquerts) and Calcaric Brown Lowland soils (Ustropepts) from calcareous alluvial deposit on recent plains.
72

Table 1. Relationships among parent material, land form, type of climate and soil group of upland soils in the Philippines.
Pareat lata Fori
Soil Group
Viriitioa of aoils uitk Type of Cliiate Soil lase of Surveyed litei Material
lata Fori
Soil Group (1 dry »itki 2-4 dry soitkt >4 dry soitkt HO/IIISCO •oil Taioaoiy
Aadeaite aid built ruidual, old alluvial, volcitic ltd d o . 1
•ills, upper aid •iddle terracea
led aoila Stroagly acid lo» activitey
Stroigly to soderately acid, lou activitey
Moderately acid •aplic litoaoli Gleyic icrisols Ferric Acriaole •aplic llisoli
laadihasulta (aadiudalta liaaaplodilta
Aadeaite aid built ruidual, old alluvial, volcitic ltd d o . 1
•ills, upper aid •iddle terracea Tello* aoila Stroaqly acid,
lou activitey (Stroigly to soderately acidl
•aplic litoaoli Gleyic icrisols Ferric Acriaole •aplic llisoli laplohusilts
Aadeaite aid built ruidual, old alluvial, volcitic ltd d o . 1 Loner
terracet Tellou aoila Moderately acid,
lou activitej (Moderately acidl (Moderately acid)
•aplic litoaoli Gleyic icrisols Ferric Acriaole •aplic llisoli
Piedtoit of volcato, terracea
Dark Brom soils
Koderatelj acid Moderately to «lightly acid
(Slightly acid) •aplic litoaola Isbric litoaoli
Paleudults Paleudilfa
Taffaceoua rockt
•ilia led soils Strosgly acid Stroigly to soderately acid
(Moderately acid) Gleyic nlisols laplic litoaola
•aplohustlta
[reaiduall
•ilia
Iron Iplaad soils
(Moderately acidl Moderately acid (Slightly acidl Dyatric Caabiaols Dyatropepta
Metaaorphic rocka
•ills, terracea
led soils tStroagly acid) (Stroigly to •oderately acid)
(Moderately acidl
rretidual, , 'old alliviaH
•ilia Brovt Upland soils moderately acid) (Moderately acid) (Sliqhtly acid)
Liseatoie reaidual, iquitic atd/or coliat dcpoait 01 liieatoie
Lileatone kills aid terracea
led soils (Stroagly tcidl Stroigly to soderately acid
(Moderately acid) laplic Alisols laplohuiulta Liseatoie reaidual, iquitic atd/or coliat dcpoait 01 liieatoie
Lileatone kills aid terracea terra-roaaa-
like soils Slightly acid Gleyic Luviaola
Vertic Luviaola Chronic Luviaola
Paleudalfa •apludalfa
Liseatoie reaidual, iquitic atd/or coliat dcpoait 01 liieatoie
Lileatone kills aid terracea
Terra-fuaca-like aoils
Slightly acid to teutral
Gleyic Luviaola Vertic Luviaola Chronic Luviaola Paleuatalfa
lapluatalfa
Lileatone kills aid terracea
leadiiaa-like soils
•eutral to «lightly alkaline •etdiic Leptotolt letdollt lapluatolls
Lileatone kills aid terracea
Lithosols leatral lutric Leptoaola Tropotheita Cilcireoui said-stoie aid tkale rttliduil, i
Terracea, aicieat duie
Terra-roaaa-like aoila
Slightly acid Chronic Luviaola Paleudalfa lapluatalfa
old alluvial,) 'indent duoe '
•ilia Broun Opland aoils
(Slightly acidl Slightly acid •eutral Vertic dabiaola Calcic Caibiaola
lutropepts Batropepts
lon-calcareoua aaidttote atd
Terracea led aoila (Strongly acid) Strongly to soderately acid
(Moderately acid) •aplic Alisols Paleudults
tkale rretidual, , 'old alluvial'
Terracea
Peeudogley-like soils
Moderately acid Moderately to sliqhtly acid
(Slightly acidl Dystric Planosols lutric Planosols
Ochraquulta Albaqualfa
tkale rretidual, , 'old alluvial' • ilia Broun
Opland soils (Hoderately acid) (Moderately acidl (Slightly acid)
Calcareoua alluvial deposit Irecett alluviall
Alluvial loalatd
Broun IiOtland soila
•eutral Neutral to «lightly alkaline
Slightly to •oderately alkaline
Calcic Caibiaola Dstropepts lutropepts
Alluvial loalatd
Vertiaola •eutral to «lightly alkaline
Slightly to •oderately alkaline
Calcic Vertiaola Endoaquerls
loa-calcareoua alluvial depotit
Alluvial loalatd
Aadoeole Moderately acid Moderately to aliqhtly acid
(Slightly acidl laplic Andoaola Bibric Andoaola
Dystrandepta Eutrandepti
Irecett alluvial]
Alluvial loalatd
Broun Louland soila
Moderately acid Moderately to siiqhtlv acid
(Slightly acidl Gleyic Caibiaola Bibric Caibisola
Dystropepta Eutropepts
Alluvial loalatd
Gray Louland aoils
Slightly acid Slightly acid (Slightly acid) lutric Gleyaola Tropaqueptu
Alluvial loalatd
Vertiaola (Sliqhtly acidl (Sliqhtly acidl
( ): Assumption, low activity: CEC of 16 cmol(+) or less per kg clay, strongly acid: pH< 5.0, moderately acid: pH5.0-6.0, slightly acid: pH6.0-6.6, neutral: pH6.6-7.4, slightly alkaline: pH7.4-8.0, moderately alkaline: pH8.0- 9.0.
73

Pedogenic Response along a Climatic Gradient in Hawaii, USA
R.T. Gavenda*1, O.A. Chadwick2, E.F. Kelly3, C.W. Smith1, W.E. Laird*, DM. Hendricks*, and C.G. Olson*. USDA-SCS, Honolulu, Hl, UÉA*. JPL-Caltech, Pasadena, CA, USA2- Colorado State University, Ft. Collins, CO.USA3-University of Arizona, Tucson, AZ, USA4;USDA-SCS, Lincoln, NE, USAS
Introduction. The soils of Kohala Mountain offer an opportunity to study the formation of volcanic ash-derived soils under extremes in rainfall. Although some of these soils currently are in arid climates, they retain the imprint of the wetter climates that they experienced for most of their history.
Materials and Methods. Soils at 11 sites along a 10 km transect on Kohala Mountain, Island of Hawaii, were examined. The sites are on an a'a lava flow complex with a K-Ar age of about 140 ka. The soils developed primarily in a series of thin volcanic ash deposits but are also influenced by basalt lava fragments, especially in the lower solum. At the southwest end of the transect, the lowest and driest site is at 77 m elevation, receives 16 cm median annual rainfall, and has mean annual temperature of 23°C. The sites to the northeast are progressively higher and wetter and culminate at 1254 m elevation with about 300 cm median annual rainfall and 17°C mean annual temperature. Paleorainfall estimates, evaluation by how eustatic sea level fluctuations and island subsidence may have modified present rainfall patterns, are presented as time-weighted median (TWM) rainfall. Soil analyses were done according to standard SCS methods (1). Data are presented as the weighted means of the upper 75 cm of soil for the comparison of mainly ash-derived soil.
Results and Discussion. TWM rainfall estimates indicate wetter climates predominated in Kohala for most of the past 140 ka. The current rainfall along the transect is the estimated minimum rainfall. The present rainfall averages 40% of the estimated maximum paleorainfall. At the three lowest elevation sites, however, current rainfall is only 29% of the maximum. At the thre highest sites current rainfall is 49% of the estimated maximum. Various lines of evidence indicate that glacial climates in Hawaii were wetter than interglacial climates (2).
The content of quartz, a component of Asian aerosolic dust, in surface horizons increases from about 4% to 8% between 18 and 162 cm TWM rainfall, and increases to about 20% at 350 cm TWM rainfall. This distribution reflects the greater degree of "scrubbing" of quartz from the atmosphere at higher rainfall. The depth distribution of quartz indicates buried soils in several profiles.
Former climatic regimes are reflected in the type and amount of pedogenic minerals found in aridic soils (3). Poorly crystalline aluminosilicates and crystalline sesquioxides decrease with increasing rainfall then plateau above 160 cm TWN rainfall (Fig. 1). These minerals comprise about 40% of the soils at the lowest rainfall sites but decrease to about 15% at the highest rainfall site. Halloysite content steadily decreases from about 20% at 18 cm TWM rainfall to about 2% at 350 cm TWM rainfall. Noncrystalline minerals steadily increase along the length of the transect from about 15% to about 60% (Fig. 1). The increase in noncrystalline minerals is reflected in the marked increase in 1500 kPa water from 25% to 85%, and decrease in bulk density from 1.03 to 0.59 Mg nr3 (Fig. 2).
Both PHH2O (PH 7-6 t 0 pH 4.3) and base saturation (75% to 2%) decrease with increasing rainfall, whereas CEC7 [20 to 60 cmol(+)/kg soil] and exchangeable acidity [10 to 75 cmol(+)/kg soil] increase (Fig. 3).
Below 100 cm TWM rainfall the soils classify as Torrands and Ustolls. Between 100 and 150 cm TWM the classify as Ustands. At TWM rainfall greater than 150 cm, the soils classify as Udands. There is not a clear threshold TWM rainfall for the appearance of
74

andic properties. Andic properties apparently developed in situ at the driest site but are most likely found above 100 cm TWM raiinfalL
Literature Cited
(1) Soil Survey Laboratory Staff. 1992. Soil Survey Laboratory Methods Manual. Soil Survey Investigations Report No. 42, Version 2.0. USDA Soil Conservation Service.
(2) Gavenda, R.T. 1993. Hawaiian Quaternary Paleoenvironments: A review of geological, pedological and botanical evidence. Pacific Science, 46(3):295-307.
(3) Chadwick, O.A.. C.G. Olson, D.M. Hendricks and E.F. Kelly. 1994. Quantifying climatic effects on mineral weathering and neoformation in Hawaii. Abstract, ISSS 15th World Congress of Soil Science, Acapulco, Mexico.
Figure 1. Poorly crystalline and noncrystalline soil components plotted against TWM rainfall.
Figure 2. 1500 kPa H20 and 33 kPa Bulk Density plotted against TWM rainfall
E SO.0
g 37.0
0 100 200 300 400 Tima-Waightad Madian Rainfall (cm)
90.0 • • • c af 0
1 ** " <>-« 0
0 * • •
. 0 •O 55.0
* . ' 0 ' -
i • * - . * • • • * - .
a 37.5
• ' • • ISOOkPa o ,V • Buk OanMy
0.. J
I 0.7 I
0 75 150 225 300 Tlim-WaighMd Madlan Rainfall (cm)
Figure 3. Cation Exchange Capacity and pH plotted against TWM rainfall
0 100 200 300 400 Tlma-Walghtad Madlan Rainfall (cm)
75

Soil Sequences in Silicic Environment in the Sierra Nevada Mountains (Granada, Spain)
Statistical Analysis of Representative Variables
M. Sanchez-Maranón, G. Delgado, J. Parraga, R. Delgado. Departamento de Edafohgia y Quimica Agricola. Facultad de Farmacia. Campus Cartuja. Universidad de Granada. 18071 Granada. EspaAa. Tf: 34-58-243835. Tfax: 34-58-243832
Introduction. The Sierra Nevada Mountains are a Mediterranean range located in southern Spain between 36°54' and 37° 11' north latitude. The range of altitudes from 500 to 3482 m (highest peak in the Iberian Peninsula) gives these mountains peculiar environmental features. Annual precipitation oscillates between 789 and 1400 mm, and mean annual temperature is 11°C to -1.7°C. Typical plant climaxes consist of Quercus rotundifolia and Quercus pyrenaicae (< 2000 m), Juniperus sabina, Juniperus communis and Genista sp. (2000 - 2600 m), and Festuca sp. pasture (> 2600 m). Human activity has added crops and species used in reforestation to the plant cover. The terrain is moderately to steeply sloped. The soils belong to two pedogenic environments: a) The silicic zone is larger and located at higher altitudes, and contains soil parent materials derived from periglacial colluvium of mica-schist and quartzite. b) The calcareous zone is located at lower altitudes, and contains soil parent materials derived from limestone and dolomite.
In the silicic environment, many soils reflect the influence of altitude and slope as the main pedogenic factors (3,4,6). The soil system in the Sierra Nevada Mountains can thus be interpreted by looking at the climosequences and toposequences (2). Many examples of these series have been described in other mountainous zones.
Analysis of variance (AV) determine whether the differences between samples are random or reflect different populations (1).
Our goal was to determine the degree to which information on the climosequences and toposequences of soils in the silicic environment of the Sierra Nevada Mountains -according to an available soil map- were statistically reproducible with AV.
Materials and Methods. The 62 soils studied were sampled, analyzed and classified according to Soil Taxonomy guidelines (7). We used AV to test 11 analytical (from the top 20 cm) and morphological variables: altitude, slope, thickness of the solum, hue, value, chroma, sand, silt, clay, organic carbon and pH in water. The population was grouped according to four criteria: Subgroup-type in Soil Taxonomy (as an evolution pattern), Great group (Soil Taxonomy), altitude and slope. AV was done with the ANOVA1 program (5).
Results and Discussion. Soil maps allowed us to established two sequences of soils: a) an altitude-influenced climosequence, and b) a slope-influenced toposequence. The first sequence could be divided into two subsequences: one defined by typic Xerumbrept (< 2200 m), typic Cryumbrept (2200 - 2800 m) and dystric Cryochrept (> 2800 m), and the other by entic Xerumbrept (< 2200 m), entic Cryumbrept (2200 - 2800 m) and typic Cryorthent (> 2800 m), in the absence of a Bw horizon. The toposequence could also be divided into two subsequences: one characterized by typic Xerumbrept (<30% slope), entic Xerumbrept (30-50% slope) and typic Xerorthent (>50% slope), and the other by typic Cryumbrept (<30% slope), entic Cryumbrept (30-50% slope) and typic
76

Cryorthent (>50%) when the temperature regime was cryic. For the Great group criteria, we found significant differences (SD) for all variables except
those relating to texture (Table 1). Analyses with Student's t test showed SDs in mean values (± standard deviation) for altitude and slope between Xerumbrept (x = 1897 m, 54%), Cryumbrept (x = 2466 m, 43%), Cryochrept (x = 2757 m, 28%) and Cryorthent (x = 2860 m, 43%); the last two soils showed SDs in comparison with the other two types, but not when compared against each other. The slopes for Xcrorthent (x - 59%) and Xerumbrept (x = 54%) did not differ significantly. On the basis of subgroup-type criteria, no SDs were found (Table 1).
When altitude was the grouping variable, SDs were found for most other variables, suggesting that altitude influences the properties of the soils we studied. Three thresholds were found. The first threshold was at 2000 m, above which slope, texture and pH changes markedly. The threshold for solum thickness was at 2500 m, and that for organic carbon content was at 2750 m. These limits approximately matched the mean altitudes at which Xerumbrept, Cryumbrept and Cryochrept/Cryorthent appeared. Moreover, in the environment we sampled, the features noted above were those that distinguished between Great groups.
Slope was inversely related to altitude, and directly related to soil pH. Analyses with Student's / test showed SDs between slopes larger and smaller than 55 % only for altitude.
Table 1. Results of analysis of variance
G.group S-type Altitude Slope G.group S-type Altitude Slope
Variable» F S F S F S F s Variable* F S F ! ' S F s
Altitude 34.» eee 0.3 3.3 • • Send 2.0 . 1.6 2.7 • 0.8 . Slope 4.9 ee* 1.1 6.1 • e* Silt 2.2 - 1.1 3.4 • # 1.7 -
Thick. 4.7 •ee 2.0 4.0 •• 0.i - CUy 2.1 - 1.3 2.3 • 0.6 • Hue 4.2 e* 1.1 3.0 •Ü 2.4 - C O . 6.0 • *• 2.5 3.9 • * 2.5 -
Velue 4.9 ee* 3.0 3.8 •• 0.4 - PH 13.1 •*e 1.1 13.S *•• 4.8 • • Chroma 2 4 • 0.6 0.4 - 0.6 -
Significance(S): •-".- not «ignificint, *.- 5%, *•.- 1 %, • • • . - 0 .1 X. Greet Group criteria (G.group): Xerorthent, Cryorthent, Xerumbrept, Cryumbrept. Xerochrept, Cryochrept, Haploxeroll. Subgroup-type criteria (S-type): Typic, entic, dyitric, pachic, ultic. Altitude criteria (m): < 1500, 1500-1750, 1750-2000,2000-2250,2250-2500,2500-2750,2750-3000, >3000. Slope criteria (* ) : 12-25,25-37,37-55, > 5 5
Conclusions. AV is a useful statistical technique for defining and establishing soil sequences. In the silicic environment of the Sierra Nevada Mountains, AV did not completely support the presence of the sequences identified in the soil maps. However, the Great group did show corresponce with altitude and, to a slightly lesser degree, with slope. The statistically significant climosequence showing significant correspondence with the soil map consisted of Xerumbrept, Cryumbrept and Cryochrept/Cryorthent. Differences in slope per se did not reflect the toposequence.
Literature Cited. (1) DAVIS, J. 1973. Statistics and Data Analysis in Geology. John Wiley & Sons, New York, 550 pp. (2) DELGADO, R., E. BARAHONA & J. UNARES. 1982. An. Edaf. y Agrobiol., 41:441-473. (3)DELGADO, R. etal.(6 authors). 1988. Mapadesuelos 1:100000 Güejar Sierra (1027). LUCDEME/1CONA. 110 pp. (4) HOYOS, A. & A. M. MEDINA. 1951. An. Edaf. y Agrobiol., 10:19-49. (5) IRIARTE, A. 1990. Tesis Doctoral, Universidad de Granada. 385 pp. (6) RAYA, J. 1959. Tesis Doctoral, Universidad de Granada, 293 pp. (7) SANCHEZ, M. 1992. Tesis Doctoral, Universidad de Granada 974 pp.
77

Morphology and characteristics of soils developed over a sequence of terraces of the River Tormes
in Salamanca (Spain) F. Santos Frances and J.B. del Arco Ortiz. Area de Edafologia, Facultad
de Farmacia. Universidad de Salamanca. Avda. Campo Charro, sin. 73007 SALAMANCA
Introduction. The present work studies a chronosequence of soils developed over Quaternary terraces with the main aim of determining the relationship between the relative age of the terraces and the morphology, characteristics and genetic processes of the soils.
Owing to the differences between the degree of development and the evolution of soil, terrace sequences are often used for carrying out edaphological studies; these soils can be related with the age of the geomorphological surfaces (1 and 2).
The relationship between soils and the age of the geomorphological surfaces is represented graphically with the aid of a geological section and several schemes of soil profiles
Materials and methods. Geologically, the sector studied is located on the southwestern edge of the Duero basin. This Tertiary basin of the Spanish Meseta is filled with continental and lacustrine rocks which towards the west and southwest rest directly over folded and strongly eroded Paleozoic rocks belonging to the Central Iberian Zone (3) of the Iberian System.
The structure of the Duero basin is simple, since the rocks are tabular or horizontal. The Tertiary sandstones and conglomerates form the basement over which the fluvial rocks
belonging to the terraces of the River Tormes (conglomerates, gravels and sands) have been deposited; these are of Quaternary age.
To determine the analytical data of the profiles studied the experimental techniques described in Soil Survey Investigations Report N°l (4) were followed.
The soils were classified according to their morphology and analytical data according to the FAO (5) and Northamerican taxonomies (6).
Results and Discussion. The main features of the soils studied are as follows: Upper terraces.- This level rests at varying heights between 35 and 80 m above the present course of the River Tormes. Within this physiographic level, three or more terraces can be found; these are quite eroded and are formed of the same lithology (gravels and conglomerates). Owing to the similarity and degree of development of the soils on them, they have been considered jointly. The best conserved of the three is the lower one (between 35-40 m) which is situated in the neighbourhood of Pelabravo.
These terraces show a predominance of well developed soils (Palexeralfs, Rhodoxeralfs or Calcic and Chromic Luvisols) with a sharp textural jump between the A and B horizons and a clearly expressed and very thick argillic horizon, with frequent slickensides and hydromorphic properties in the lower part of the B horizon and with a thick, continuous and nodular calcic horizon located at a depth of 80-90 cm from the surface. In the soils of this unit, the eluvial horizons have disappeared owing to the past and present influence of areolar erosion, deforestation and agricultural activities.
The upper subhorizon of the argillic (Bt) horizon is formed of of gravel and conglomerate deposits and the lower subhorizon of the residue of weathering of the underlying sandstones (2Bt2). Middle terraces.- These terraces are situated at a height ranging between 15 and 30 m above the present course of the river. Their soils display a moderate degree of development and they should be classified as Haploxeralfs, according to the Soil Taxonomy, since they have a much less well defined argillic horizon (with a less patent degree of illuviation) than the Alfisols of the upper terraces; the colours of the Bt horizon do not fulfill the necessary requisites for them to be considered with Rhodoxeralfs and, furthermore, they do not exhibit the sharp textural jump between the A and B horizons.
78

The argillic horizon is clayey and in it is possible to differentiate two subhorizons; the upper is red with yellowish mottles and the lower one is greenish-grey or yellowish, with grey and red mottles. The calcic horizon is discontinuous, quite shallow and, at some places, nodular and, at others, it is powdery. Lower terraces.- These are situated some 5-10 m above the current course of the river. In this physiographic unit there is a clear predominance of Cambisols (Xerochrepts) over Luvisols (Haploxeralfs).
The Chromic Luvisols have an argillic horizon some 35 cm thick; this is reddish-brown and has a sandy clay loam texture with a slight illuviation of clay (it gives the impression that it has more characteristics typical of a cambic horizon than an argillic one). These can be considered as an integration towards the Cambisols.
The Chromic Cambisols have a B horizon 31 cm thick. They are reddish-brown and have a loamy sand texture and often display very fine clayey lamellae (less than 1 cm thick); the C horizon is formed of an alternation of sands (coarse and fine) and gravels, with frequent clayey lamellae 1.2-0.8 cm in thickness. River Tormes Flood Plain.- This physiographic unit corresponds ot the lowest terrace of the River Tormes, at a height of 1.5 - 5 m above the current course of the river. The dominant soils are Eutric or Distric Cambisols (Xerochrepts) with a water table level situated at a depth of 55 cm during winter and between 1-2 m during summer. Current channel of the River Tormes.- In this unit the soils show the typical morphology and properties of Fluvisols (Xerofluvents); that is, the stratification and absence of edapahic organization because they are developed over very recent alluvial deposits. There is a predominance of Calcaric and Eutric Fluvisols. The only diagnostic horizon is an ochric epipedon that is light-brown to yellowish-brown in colour; the C horizon is formed of an alternation of coarse sands, fine sands and loam to silty clay loam material. The organic carbon decreases irregularly throughout the profile.
The following may be stated in conclusions: Along general lines, the thickness of the solum is seen to gradually decrease from the upper terraces to the present course of the River Tormes. However, on the flood plain it is thicker than would be expected because in this physiographic unit there is a predominance of hydric accumulations and phenomena of overthickening of horizons. In the rest of the terraces there is a predominance of erosive surface phenomena. There is a relationship between the red colour of the B horizons and the age of the surfaces. The older soils are redder than the younger ones. According to Birkeland (7), a very warm paleoclimate would be the main factor responsible for the redder colouring of the soils.
Literature cited. (1) Stevens.P.R. and Walker.P.H. (1970). The chronosequence concept and soil formation. Q. Geol. Assoc., 72: 415-426. (2) Chittleborough, D.J.; Walker, P.H. and Oades, J.M. (1984). Textural Differentiation in chronosequences from eastern Australia. I: Description, chemical properties and micromorphology of soils. Geoderma, 32: 125-146. (3) Julivert, M ; Fontboté, J. M.; Riveiro, A. y CONDE, L. (1974). Mapa tectónico de la Penfnsula Ibérica y Baleares y Memoria explicativa. Serv. Publ. Ministerio de Industria. I. G. M. E. Madrid. (4) Soil Conservation Service. (1972). Soil survey laboratory methods and procedures for collecting soil samples. USDA. Washington. (5) FAO (1988). Soil map of the world. Revised legend. World Soil Resources. Report 60, FAO. Roma. (6) Soil Survey Staff. (1975). Soil Taxonomy: a basic system of soil classification for making and interpreting soil surveys. Agriculture Handbook No. 436. U. S. Government Printing Office, Washington. (7) Birkeland, P.W. (1977). Pedology, Weathering and Geomorphological Research. Oxford University Press. New York.
79

Comparison between Andosols Developed From Gabbros in Galicia (NW Spain) and Basalts in Massif Central (France).
E. Garcfa-Rodeja and B.M. Silva . Departamento de Edafologia y Q. Agrtcola, Universidad de Santiago, 15706 La Corufla, Espatla.
Introduction. The term Andosol is generally applied to soils derived from volcanic materials. However, the adoption of criteria based on soil properties and/or components to define both Andosols in the FAO classification (1) and Andisols in the USD A classification (2), has led to the inclusion of soils derived from non-volcanic materials in these "andic" categories. In this study we compared soils with andic properties developed from a volcanic (basalt) and a plutonic rock (gabbro) of similar composition.
Materials and Methods. Three soils developed from basalts in Cantal (Massif Central, France) (3) and four from gabbros in Galicia (NW Spain) (4) were studied. Parent materials are similar in composition, although the basalts have somewhat higher Fe, Na and K content and somewhat lower Si and Al content. Annual precipitation in the two regions is similar (about 2000 mm), although seasonal variation in precipitation is more marked in Galicia. Temperature is lower throughout the year in the Massif Central. The vegetation in the area of gabbros is heath, sometimes reforested with pines, while in the area of basalts is grassland.
Soils were analysed following standard methods for the FAO and USD A classifications (1,2) and more specific methods for the characterization of Andosols (5).
Results and Discussion.
Soil morphology and properties. In both study areas, profiles may be AR, AC or ABwC, with poorly developed cambic horizons, and overlie fresh or scarcely weathered rock or colluvial deposits containing numerous fragments of fresh rock. Andic properties appear mainly (soils over basalt) or exclusively (soils over gabbros) in the A horizons. These horizons are deep, dark in colour, organic matter rich (organic C content 7 - 16%), with a well-developed crumb structure and a loamy texture (the predominant fraction being fine silt). The pH in water of the A horizons is about 5.0, though generally slightly higher in soils from basalts than from gabbros; in both cases, variable charge is predominant (> 80%), effective cation exchange capacity is low ( 2 - 8 cmolc kg"1) and Al is the principal exchangeable cation.
As regards those A-horizon parameters which are taken to be indicators of andic properties: a) Al + 0.5 Fe (oxalate-extractable) was greater in soils over basalts (3.2 - 4.5%) than in soils over gabbros (2.3 - 3.4%,), b) phosphate retention was similar (> 90%), and c) bulk densities were low (< 90 mg m"5) in both soil types, this being attributable to the high organic matter contents. Both pH in NaF (> 10.8) and 15-bar water content (20 - 40%) were similar in the two soil types. However, fluoride reactivity in the clay fraction^ was higher in soils over basalts (> 800 cmol kg"1) than in soils over gabbros (250-800 cmol kg"1).
The Bw horizons of the soils from basalts met all the standard criteria for classification as andic except as regards bulk density. The Bw horizons of the soils from gabbros did not meet any of the relevant criteria.
Classification. All soils had umbric epipedons, and the more developed profiles a cambic B horizon. The epipedons cannot be classified as melanic on the basis of colour and of melanic
80

index (the value 1.7 was exceeded in all cases, although it tended to be lower in soils from gabbros than in soils from basalts). The soils from both regions are thus Umbric Andosols on the FAO classification (1) and Lithic, Alk or Pachic Fulvudands on the USD A classification (2).
The ratio of pyrophosphate- to oxalate-extractable Al (AlpiALj) was greater than 0.6 in the A horizons of soils over gabbros, indicating that these are non-allophanic soils (i.e. soils in which most Al is in the form of Al-humus complexes). In soils over basalt, the Alp: Al0 ratio was as low as 0.5 in some A horizons and less than 0.3 in B horizons, indicating that these are allophanic soils; allophane content (as estimated from oxalate-extracted Si content) exceeded 10% in these cases.
Discussion. The convergence of processes in the soils from both basalts and gabbros can be attributed to the abundance of readily weatherable minerals and to environmental conditions favouring the stabilization of non-crystalline intermediate products of weathering. Basalts are more readily weatherable than gabbros, but in the present study this may have been offset by the more aggressive weathering conditions (higher temperatures and vegetation cover, leading to organic matter with greater complexing capacity) for the Galician gabbros (6).
Though sufficient rainfall, good drainage and high production and accumulation of organic matter are required for the development of andic soils from volcanic materials (5), from non-volcanic ones, however, more aggressive weathering conditions are necessary, and even when this is the case the andic properties are restricted to organic-matter-rich horizons (4). In the present study, only the A horizons of the soils over gabbros displayed andic properties, which can be attributed to the abundance of Al-humus complexes; the Bw horizons, with low organic matter content, did not present andic properties.
Literature cited.
(l)FAO-UNESCO. 1989. Soil Map of the World - Revised Legend. Roma.
(2)Soil Survey Staff. 1992. Keys to Soil Taxonomy. SMSS Technical Monograph No 19. Pocahontas Press, Inc. Virginia, US.
(3)Chesworth, W.; Dejou, J.; De Kimpe, Ch.; Larroque, P.; Macias, F.; Garcia, C. & Garcia-Rodeja, E. 1983. Etude comparative des processus de fersiallitisation et d"andosolisation développés sur basaltes du Massif Central Franchise. C.R. Acad. Sc. Paris 296:1651-1654.
(4)Garcfa-Rodeja, E.; Silva, B.M. & Macias, F. 1987. Andosols Developed from Non-volcanic Materials in Galicia, NW Spain. J. Soil Science 38:573-591.
(5)Mizota, C. & Van Reeuwijk, L.P. 1989. Clay Mineralogy and Chemistry of soils Formed in Volcanic Material in Diverse Climatic Regions. ISRIC. Wageningen, The Netherlands.
(6)Garcfa-Rodeja, E. & Macias, F. 1984. Caracterizacion de suelos acidos (Podsoles-Andosoles-Suelos Aluminicos) de Galicia. Relación con los Procesos Edafogeoquimicos. Actas I Congreso Nacional de la Ciencia del Suelo 2:589-602. Madrid, Espana.
81

Characteristics and Genesis of Soils Formed in Landscapes of Biotite Gneiss Origin from the Humid Tropics of Nigeria.
T. A. Okusami", H-P. Blume2», F. Alaily3*, and N. Bruhn2). 'ObafemiAwolowo University, Ile-Ife, Nigeria., 2 Christian-Albrechts-University, Kiel, Germany., and 3Technical University, Berlin, Germany.
Introduction. Continuous studies into the soils of most of tropical ecosystems are needed to satisfy the physical, chemical and mineralogical data needs for deducing information on sustainable land management evaluation criteria; the soils present status and paleo history; and their classifications for appropriate agrotechnological transfer. This paper provides data on some general properties and mineralogy of soils formed on landscapes of biotite gneiss origin; it evaluates the weathered status of soils relative to the base line geologic material; and classifies the soils into international systems.
Materials and Methods. Two toposequences (viz. TS13, TS7, TS14, TS2, TS3; and TS6, TS5 and TS4) on adjacent watersheds were studied in Ile-Ife (7.30N/4.31E) of southwest Nigeria. Ile-Ife belongs to humid tropical climate with annual average rainfall of 1400mm spread within March/April and October and an annual average temperature of 27°C. The site is formed in pre-Cambrian rocks that are predominantly biotite schist/gneiss. Pedons were examined at the crest, shoulder or upper slope, middle slope and valley bottom positions. Particle size analysis, exchangeable cations, organic carbon (0C) and pH were all determined on <2mm soil fraction. X-ray diffractometer analysis was made on the silt (63-2jum) and clay (< 2/am) fractions. Total elemental analysis by the XRF method was also estimated for selected horizons/pedons and rock samples.
Results and Discussions. Rock samples, Rl (below TS7 profile) and R2 (from adjacent outcrop), contain the following dominant minerals; Quartz > > > Biotite > Magnetite > Orthoclase; and Quartz > > > Biotite > Orthoclase > Magnetite respectively; and total elements (Table 1).
Table 1. Elemental Composition (%) and Silica: Sesquioxide ratio (Ra) Si02 A120, Fe203 Mn02 MgO CaO Na^ K20 Ti02 Zr Ra
Rl: 64.41 15.44 7.65 0.18 4.62 2.89 2.71 1.97 1.12 189 2.79 R2: 71.90 11.37 6.67 0.16 3.23 1.85 2.40 1.93 0.91 138 3.99
All surface horizons have 10YR hue attributable to higher organic matter content. The B horizons in upland pedons are mostly of 5 YR hue with higher chromas. The C horizons are 2.5YR, 10YR, 5YR/7.5YR and in an instance a 10R hue. The red hues reflect the influence of mafic and iron primary mineral weathering. Soils in valley bottom have 10YR hue with high value and low chroma indicative of a reduced system which is in contrast to observed upland pedon colours. A more reddish hue (7.5 YR) in the hydromorphic soil indicates water table fluctuation zone. Soil sola in general are distinctly separated from the saprolite through their colour and fabric and in addition by stone lines that could be as thick as 134cm (TS14) or thin as 5cm (TS2) on the crest or upper slope and middle
82 \

slope positions respectively. Coarse quartz gravels/stones/cobbles and concretions dominate the former and concretion the latter stone lines. Surface soil horizons share loamy property with the saprolites for different reasons of higher organic matter content and lower physical communition respectively. Fragmentary and thin cutans with a typic clay buldge strongly indicate illuviation.
Soil horizons are moderately acid (pH5.6-6.0) to slightly acid (pH 6.1-6.5) in water and with negative delta pHs that indicate dominant net cation exchanger. Exchange sites are dominated by Ca2+ and Mg2+ ions. Upland pedons have low clay activity minerals as indicated by the low E C E C ^ and corroborated by a dominant kaolinite clay mineralogy. Moderately high ECEC,^ of upland soils is related to OC content (when > 0.2%). Organic carbon decreases with depth except in pedons with significant textural changes attributable to pedogenesis or lithological discontinuity.
In contrast, TS4 - a hydromorphic pedon - has a mixture of kaolinite and smectite clay minerals. Other minerals identified are illite and/or muscovite on sloping positions in addition to feldspars, goethite and anatase that are common to all. Vermiculite. occurs only in the hydromorphic pedon. The silt fraction is dominated by quartz, kaolinite, feldspars, muscovite and iron oxides. Smectites occur only in the valley bottom.
Total elemental composition of the upland regoliths indicate a substantial increase in Fe and Al values in subsoil horizons relative to the composition of the rock samples. A comparison of the parent material, C horizon, to the rock samples indicates a closer Ra ratios (see pedons TS2 and TS4 in Table 2). This closeness suggests a more intense
Table 2. (SiO^AljOj+FejOj)) (Ra) ratios for selected horizons. TS 13 TS7 TS2 TS6 TS4
CB2 = 0.97 Bt2 » 1.03 2C2 = 1.36 CB = 1.10 2B3 = 1.78 C = 0.96 C - 1.07 2C3 = 1.46 C - 1.09 C = 2.07 chemical weathering (through leaching) relative to physical weathering (translocation). TS13 and TS6 occupy stable positions conducive to a continuous/deeper translocation and thus making the sampled saprolites atypical C horizon. Leaching in TS4 has been minimal compared to upland pedons. The clay mineralogy suite (stage 8/9 of (1)) therefore supports a profile that is least weathered. TS7 has Rl below it at a shallow depth (75 + cm), nevertheless its C horizon indicates an intensely weathered regolith. Results shave shown that intensely weathered soils of the tropics will have B or even C horizons with greater leaching (chemical) and translocation resulting in an Ra ratio of 1±0.5. Topsoils (A and E horizons) are impoverished in Al, Fe (and also Ti). Their loss could be attributed to illuviation since the clay minerals are templates on which these elements occur as oxides. Topsoil horizons have higher silica content in consonance with high sand size fraction of the pedons. A horizons of all pedons are typically richer in Zr and except in TS2, all C horizons indicate a common origin with the parent rock. The high Zr content of the A horizons may be additional inputs from the atmosphere. All upland soils belong to the Kandic or Plinthic great groups of the Ultisols (Acrisols) while the valley bottom soils are Tropaquepts (Fluvisols).
Literature Cited. (1) Jackson M. L., and G. D. Sherman. 1953. Chemical weathering of minerals in
soils. Advan. Agron. 5: 219-318.
83

Types of Pedogenesis on Basic Rocks in Boreal Regions S.N.Sedov, S.A.Shoba'. Moscow State University, Soil Science Department,Moscow, Russia.
Introduction. At the present time podzols formed on acid rocks,sands and coarse till are the most profoundly studied soils in taiga sone.This soils became a sort of symbol of taiga pedogenesis. However it's known that the soils on basic igneous rocks and tuffs differ widely from podzols.This soils were studied in several boreal regions and they turned out to be diverse in properties and even profile construction. In general these soils attracted less attention and in particular we encountered no exact opinion of the reasons of their diversity .We suggest this diversity to be caused by the peculiarities of composition of some basic rocks resulted from their post-magmatic transformation.The soils formed on basic rocks altered by hydrotermal process or low-temperature metamorphism differ grately from those on "fresh" rocks which were not subjected to these processes.The soils of the second group are relatively well studied whereas the information about pedogenesis on altered basic rocks is deficient.
Materials and Methods. We carried out the research of 20 profiles of soils formed on basic rocks which had been transformed to some extent by metamorphic or metasomatic processes (altered gabbro, dolerites and tuffs,propilites,greenstone rocks).The objects are disposed in different parts of Taiga zone of Russia (Far East,Middle Sibiria,Karelia).Besides usual chemical analyses micro- and submicromorphological investigations were carried out and mineralogical composition of coarse and fine fractions was studied.
Results and Discussion. The results of the research permit to conclude that the differences in soil formation are caused by specific features of intrasoil weathering.'Tresh" rocks which consist of primary magmatic minerals usually contain no/or small ammounts of layer silicates.The weathering in the acid taiga soils result in the dissolution of all components,primarily the most unstable Ca-plagioclases and volcanic glass (in the effusive rocks) .The secondary components that form fine material of the mineral horizons consist mostly of organo-sesquioxide compounds, allophane and metahalloysite. The altered basic rocks contain phyllosilicates (chlorite, micas,etc.) of hydrotermal or metamorphic origin very often. Being subjected to weathering they suffer comminution and chemical transformation.lt results in accumulation of clay minerals
84

(vermiculite,smectite,interlayered minerals) in soils.In many cases cambisols are formed on this rocks.Their morphologic features may be similar to those of brown forest soils formed on "fresh" basic rocks,but the difference in composition of fine material cause the divergence of their properties such as agregation,cation exchange capasity,etc.If the parent rock contains big ammounts of phyllosilicates (40-50 % and more) the accumulation of fine clay material may result in diminishing of permeability and thus give start to g leyzation.dispersion and illuviation of clay materiaLThese processes lead to formation of luvisols with well developed bleached eluvial horisons;the signs of Al-Fe-humus illuviation are sometimes observed.The formation of such soils on "fresh" basic rocks is considered to be of little probability (2). Formerly A.G.Chernyakhovsky (1) established the profound divergence of weathering on "fresh" and altered basic rocks. His conclusions were based on the results of investigation of mature weathering crusts of humid tropic and subtropic regions.The results of our research expose the manifestation of this divergence in boreal regions;they lead to the conclusion that variations in post-magmatic alteration will influence the composition of soil cover in the regions were basic rocks are spread.
Literature Cited. (1) Chernyakhovsky, A.G. 1991. Recent weathering crusts. Moscow,Nauka,208 p. (2) Targulian, V.O. 1971. Soil formation and weathering in cold humid regions. Moscow,Nauka,268 p.
85

Genetica! Relationships of a Toposequence of Soils over Limestone.
M. T. Taboada and B. M. Silva. Departamento de Edafologia y Quimica Agricola, Facultad de Farmacia. Untversidad de Santiago de Compostela. 15706 Santiago de Compostela, Espana.
Introduction. The soils studied are situated in Galicia (NW Spain), in an area with abundant yearly rainfall (1000-2000 mm) and moderate average temperatures (8-14°C). Soil moisture regime is udic and soil temperature regime is mesic. The limestones are found within a metamorphic complex formed essentially by Palaeozoic schists, slates and quartzites. The differential erosion phenomena originate a stepped topography, with steep slopes and large areas of bare rock, and the development of the soils is strongly allied to the topographical factors. The genetical relationships of a toposequence of soils formed over these materials is studied in this paper.
Materials and Methods. Five profiles with different degrees of development were selected from a representative toposequence. In accordance with the FAO (1989), they were classified as Rendzic Leptosol (AR profile), Calcaric Regosol (AC profile), Chromic Cambisol (ABwR profile), Luvic Phaeozem and Ferric Alisol (ABtR profiles). They have been characterized according to their physicochemical, mineralogical and micromorphological perspective (1).
Results and Discussion. Within the sequence, the following types of soils were differentiated: On summits and steep slopes the soils are thin, with an epipedon mollic over a lithic contact (AR profile), and are decarbonated. In small areas of accumulation on the slope or in piedmont positions, where calcareous colluvials are deposited, AC profile soils are formed containing important quantities of carbonates. In the more stable areas, such as certain plateaus, shelters in the rocks, or in level areas, the soils have a B horizon. In some cases this is barely developed, with a typical sequence of ABwR and low quantities of carbonates, and in other cases the B horizon is very deep and well developed, showing profiles with a morphology of ABtR which are decarbonated and at times desaturated.
The A horizon is characterized by its high content of organic matter (3-12%) and good C/N ratio (9-12), even when the epipedon does not meet all the requisites of the mollic as occurs in AC profiles and in most of the profiles wit B horizons. In these cases they tend to be considered ochric because of their colour (too light) and/or depth (too shallow). Their structure tends to be crumb (except in the Ferric Alisol which is granular) and the average texture, predominately silt loam.
With respect to the B horizons, the alteration horizons (Bw) (with a thickness of 30 cm on average) have a brownish colouring, subangular block structure and a complex microstructure consisting of granular aggregates and subangular blocks. The Bt horizons are deep, with diffused divisions between subhorizons, more or less red in colour (hue of 5YR-7.5YR), a granular aggregate or polyhedral block structure, tending towards prismatic in the more developed ones, and a granular or subangular block microstructure. In both ABwR and ABtR profiles, fine textured B horizons are frequently with a higher clay content then A horizons. In the first case, the ratio of total
86

clay in B/total clay in A is less than 1.2 and does not evidence illuvial clay in thin sheets, for this reason Bw is characterized as cambic.
In the first stages of development (AR, AC and ABwR profiles), the soils show a neutral or basic pH (7-8) and a saturated change complex, principally by calcium. As development advances (Luvic Phaeozem) a slight desaturation of the change complex appears, very acute in the Ferric Alisol which has an acid pH. In all the soils the free iron forms are abundant, fundamentally integrated of oxides or crystallines oxihydroxides.
The mineralogy differs very little from one soil to another, despite the differences in the degree of development. Most of the clays are inherited (illite) or slightly transformed, due to processes of vermiculation; this transformation being more evident in the decalcified soils. The primary minerals predominate in the sand, with carbonates in the slightly decarbonated soils and quartz and feldspars in the rest. In the dense fraction the iron compounds: magnetite, goethite and/or hematite stand out.
The processes that have originated the topsequence soils are: Humification, decarbonation, browning and illuviation of the clay. The humification, an important process in the formation of the A horizons, is common to all these soils that have a high level of biological activity, although it can be seen most clearly in the AR profiles which contain large amounts of organic matter, well mixed with the mineral, giving rise to a crumbly microstructure. The fundamental paper in this process is attributed to the calcium from the limestone.
The decarbonation, which is total in the ABtR profile soils, can be seen clearly in those with an AR profile. The abundant rainfall, high level of biological activity and their topographical position (subject to erosion) provokes the dissolution and washing of the carbonates out of the profile. This process is reduced in the AC profiles due to the colluvial input of limestone and the proximity of the original colluvial material.
The formation of the cambic horizon is linked to the abundance of free iron in the ABwR profile soils. This is why browning is considered to be the principal edaphic-genetic process, ruling out the illuviation of clay as there are no traces of illuvial clay. The higher content of clay present in the B horizons with respect to the A horizons, is attributed to the loss of clay from these horizons through lateral washing due to their topographical position. This phenomena is frequent in Galicia, because the high content of organic material in the superficial horizon tends to favour the dispersion of minerals present in the clay.
The process of illuviation of clay is found in the ABtR profile soils. In function of the contribution of this process to the formation of the B horizons, two evolutive grades are differentiated. In the less developed, represented by the Luvic Phaéozem, it is difficult to determine the importance of this process in the formation of these horizons. The illuvial features are scarce (<1% of the thin section) and are degraded which, at the best, indicates the existence of an ancient illuviation process. The second grade of evolution (Ferric Alisol) is that of decalcified soils, in which two cycles of clay illuviation have been recognized. This phenomena is therefore the cause of the notable increase in clay content found in the Bt horizon.
Literature cited. (1) Taboada, M. T., Silva, B. M. y Villar, M.C. 1992. Mineralogi'a de suelos formados sobre calizas
en Galicia. Suelo y Planta 2:81-100.
87
Genesis and Properties of Cambisols over Limestone (Galicia, NW Spain)
B. M. Silva and M. T. Taboada. Departamento de Edafologia y Quimica Agricola. Facultad de Farmacia. Universidad de Santiago de Compostela. 15706 Santiago de Compostela. Spain.
Introduction. Cambisols are widely distributed in Galicia. There have been previous studies of Cambisols formed over a range of substrates (basic rocks, schists, slates, gneisses and granites), but not of Cambisols formed over limestone. We aimed to investigate the genesis and properties of Cambisols formed over limestone in Galicia.
Materials and Methods. Physicochemical, mineralogical and micromorphological analyses were carried out on three representative profiles, all formed over highly recrystallized metamorphic limestone in slope positions (on shelves or in crevices in the rock). The climate is humid temperate, with annual precipitation of 1458 mm and mean annual temperature of 10.8°C. Soil moisture and temperature regimes are udic and mesic respectively.
Following the FAO (1989), two profiles (7 and 9) are Calcaric Cambisols and one (8) a Chromic Cambisol. Following the Soil Taxonomy (1990), profile 7 is a Typic Eutrochrept and profiles 9 and 8 Lithic Eutrochrepts.
Results and Discussion. The three profiles are moderately developed, with an ABwR or ABCR horizon sequence.
The A horizons, despite organic matter content ranging from 1.33 to 4.90%, are ochric by the FAO (1989) criteria, since they are too pale (chroma 4, value 4-5 when wet; chroma 3-4, value 4-6 when dry) and, in two of the profiles, too thin (20 cm or less) to be mollic. Texture in these horizons is fine to medium, with the fine silt fraction predominant and clay content ranging from 20 to 39%.
The B horizons are weathered horizons, with a brownish coloration and granular or subangular blocky structure. Texture ranges from fine to medium. Clay content in the B horizon is frequently higher than in the A horizon, but in no case does the ratio exceed 1.2 (thus the B horizons are cambic). We did not observe any signs of illuvial clay in thin sections, and the slight difference in clay content between horizons can thus be attributed to losses from the A horizon due to lateral leaching, as expected given the topographical position of these profiles. This phenomenon occurs frequently in Galicia, where the characteristically high organic matter content of surface horizons tends to favour the dispersion of clay minerals (2). The microstructure is complex, with a mixture of granular aggregates and subangular blocks.
Chemical analysis revealed a low to moderate carbonate content in these soils (1.4-11% equivalent CaC03 content, 1-5% active CaC03 content), implying a moderate degree of soil evolution. These carbonate contents are sufficient to maintain the exchange complex saturated, with Ca^+ being the dominant cation. Cation exchange capacity is moderate to high, which is in accordance with the
88

mineralogical composition of the clay fraction. pH is neutral to weakly alkaline (7.2-8.6 in water, 6.2-7.2 in KG). Free iron compounds, largely in crystalline form, are much more abundant than free aluminium compounds.
The moderate weathering of the B horizons and of the profiles in general is reflected in their mineralogy. In the sand fraction, primary minerals such as carbonates, quartz, feldspars, and in some cases tremolite, predominate. The clay fraction is made up of illite and/or talc inherited from the underlying limestone or from adjacent materials. Small amounts of illite transformation products (interstratifiedillite-vermiculite, vermiculite, smectite-type minerals) are also present and, in some cases, kaolinite.
Our results suggest that three processes have been critical in the formation of these soils: humification (particularly affecting the epipedon), carbonate removal and browning. In the A horizons, organic matter is intimately associated with the mineral fraction, giving rise to a crumb structure and microstructure; on the basis of the low C/N ratio (between 10-11), the weakly alkaline pH and the presence of active carbonates, the humus can be considered a calcic mull (1).
The low levels of carbonate are a consequence of the high rates of precipitation and infiltration to which these soils have been subjected. That extensive carbonate removal has occurred is confirmed by micromorphological examination, which reveals the presence of calcite grains and of limestone fragments showing signs of dissolution.
The abundance of free iron and the scarcity of free aluminium suggests that iron has played a key role in the formation of the cambic horizons of these soils. In most Galician soils the opposite is true, with aluminium being the most important clay-humus ligand.
In view of the abundance of iron, we consider browning to have been the most important process in the formation of these soils.
Literature Cited. (1) Duchaufour, Ph. 1975. Précis de Pédologie. Masson. Paris. (2)Silva, B. M., Garcfa-Rodeja, E & Macfas, F. 1988. Caracterización y genesis de los suelos sobre
esquistos de las marinas (La Coruna). An. Edaf. Agrob. 43: 523-546.
89

THE GENESIS OF JAMAICAN BAUXITE: NEW PEDOLOGIC EVIDENCE OF ITS ALLUVIAL ORIGIN
G.R. Hennemann. International Instititute for Aerospace Survey and Earth Sciences, Enschede, The Netherlands.
Introduction. Since the discovery of bauxite in Jamaica in the 1930s many investigations have been undertaken by geologists to identify the parent material of this aluminous deposit. Three theories have been proposed to explain the widespread occurrence and remarkable purity of the Jamaican bauxite deposits. These theories are as follows: 1) The residual theory of origin which postulates that the dissolution of limestones left a silicate-rich residue which was subsequently transformed into bauxite as a result of intense tropical weathering (Sinclair 1966). 2) According to the alluvial theory of origin argillaceous material was eroded from the inliers and transported largely by subsurface streams down into the karst areas. Continued uplift elevated these alluvial deposits after which they were converted into bauxite through a process of desilication (Zans 1959). 3) The volcanic ash theory of origin states that the principal parent material of bauxite is volcanic ash of Miocene age which was deposited directly onto the limestones and subsequently weathered into bauxite (Comer 1974). During the 1980s extensive soil investigations were undertaken by the Jamaica Soil Survey Project (JSSP). These investigations revealed the presence of alluviated tuffaceous deposits originating from Cretaceous rocks in some of the limestone depressions (poljes) in Central Jamaica. In addition, there were indications that some of the 'terra-rossa' soils over both karstic as well as non-karstic limestones in Central Jamaica had actually been developed from this alluvium. Consequently, it was decided to carry out additional research into the spatial distribution of both alluviated tuffaceous deposits and bauxitic deposits in relation to the overall landscape pattern.
Materials and methods. Most of the investigations were carried out within the framework of JSSP's soil survey programme. One of the aims of this programme was to make a semi-detailed inventory (scale 1:50,000) and assessment of the country's soil resources for multipurpose planning. Two key areas in Central Jamaica were selected for the study: 1) Northern Manchester covering the western fringe of the Central Inlier and the Lluidas Vale - the Riverhead Basin area in St Catherine located on the eastern side of the inlier. Additional micro-morphological and mineralogical analyses were carried out on one key soil profile in the Lluidas Vale Basin. Systematic soil correlation at national level was used to identify the taxonomie relationship between the various soils.
Results and discussion. The main findings can be summarized as follows: 1) Wide distribution of acid pre-weathered tuffs originating from the Central Inlier over surrounding limestone areas. Large as well as small poljes appeared to be floored by these loose and easily erodible deposits. 2) Remarkable weatherabilitv of the Central Inlier tuffs. Most of the soils developed in-situ from tuffs on the steeply dissected, mountainous topography of the Central Inlier are (relatively deep) Oxisols. 3) Wide range of weathering conditions to which in general deposits overlying the limestones have been subjected. This range is mainly a function of differences in permeability of the underlying limestone and (relative) distance from the karst base level: In the larger limestone depressions the acid andesitic tuffs in combination with the limited permeability of the underlying younger (dolomitic) limestones and the low
90

topographical position appear to have led to the formation of acid, prominently mottled clayey soils rich in kaolinite but with appreciable amounts of 2:1 lattice clay minerals (smectite-chlorite and smectite). In smaller depressions, however, less prominently mottled, more strongly weathered, kaolinitic soils prevail as a result of the more intense weathering environment. Also, these soils tend to less acidic as result of the relatively close proximity of the surrounding limestones.
•oil series and their general physiograpala position
foil Taxonomy (Suborder)
CIColey (ae/100g)
pa-nel Alset.
Wirefenee Var. X series developed ln-sltu on tuffs of Central Inlier
Rhodic Hapludoxs B-hor: 11 C-hors 35-40
3.8 3.5
60-65 90-95
Kosemere Ver. X series developed on alluvlated tuffs in medium to large, low-lying limestone basins
Typic Paledults
B-hon 16-25 C-hor. 35-55
3.7-3.8 3.2-3.7
40-75 65-80
Lucky Kill aorles developed on alluvlated tuffs in small, somewhat elevated limestone basins
Typic Kandiudults B-hori 8-12 4.5-6.0 10-30
Bllby sories developed in depressions of moderately elevated inter-basin (karstic) limestone areas
Rhodic Eut rudoxs
B-hor. 3-6 6.5-7.5 0
Norway series developed in depressions of strongly elevated inter-basin (karstic) limestone areas
Eutric Acrudoxs
B-hori 1-4 7.3-7.5 0
Table 1 Relationship between toposequential development of soils and weathering environment
Table 1 shows the full range of weathering conditions present in the limestone area surrounding the Central Inlier as reflected by the toposequence of major soil series in the area. Striking is the lowering of the CECclay concurrent with a reduction of the Al-saturation under increasingly intense weathering conditions.
Concluding remarks: The findings provide pedologic evidence that upon the formation of the Central Inlier tuffaceous deposits have covered both karstic and non-karstic limestones surrounding the inlier and have been subjected to a differential weathering regime. Under the more extreme weathering conditions this has led to the formation of bauxite.
References
Comer, J.B. 1974. Genesis of Jamaican Bauxite, Economic Geology, Vol. 69, pp. 1251-164. Hennemann, G.R. Ferric Acrisol (Typic Paleudult), ISRIC Soil Monolith JMC4, ISRIC
Wageningen, The Netherlands. Sinclair, I.G. 1966. Estimation of the thickness of limestone required to produce the Jamaican
bauxites by the residual process, Geol. Soc. Jamaica Journal, Vol. 8, pp. 24-31. Zans, V.A. 1958. Recent Views on the Origin of Bauxite. Geonotes, Vol. 1 Kingston,
pp. 123-132.
91

Genesis of Minerals in Two Kandic Ultisols Derived From Granitegneiss in North Eastern Region of India
T. Bhattacharyya* and J.L. Sehgal. National Bureau of Soil Survey and Land Use Planning (ICAR), NERC, AAU Campus, Jorhat, India, 785013
Introduction. Ultisols are common in the hilly terrain of the North Eastern Region (NER) of India. Generally such soils occur on the strongly sloping eroded escarpments otherwise protected by luxuriant vegetative growth. Not much is known about the genesis of minerals is such soils with specially of those with positive delta pH value.
Materials and Methods. The Ultisols were selected from the central gneissic highland of West K hasi hills of the Meghalaya state of India NER at an elevation of 1200-1300 m above mean sea level with mean annual air temperature of 16.7°C and mean annual rainfall of more than 4000mm. Pedon 1 was identified on nearly level hill top susceptible to moderate erosion with excessive drainage while pedon 2 on moderately steep hills at 3-8% slope with moderate erosion and excessive drainage. Both the pedons were founds in the forest of mixed vegetation with pines (Pinus so) dominating the site of pedon 2. The mineral in silt (50-2 ), total clay (<2 u) and fine clay (<0.2 u) fractions were identified by x-ray diffraction (XRD) procedures.
Results and Discussions. The soils are acidic (pH 4.5 to 5.1) and gravelly sandy clay loam to sandy clay loam. Pedon 1 rest on hard gneissic rock while the other pedon was identified on lithologically discontinuous sandy C horizon. Kandic horizons were identified in both the pedons. Taxonomically pedons 1 and 2 are grouped into Typic Kandihumult and Typic Kanhapludult respectively.
The XRD patterns from the Mg satured silt and total clay of pedon 1 showed a strong peak, at 1.4 mm alongwith 0.7, 0.48 and 0.356mm without any change in position and/or intensity cm ethylene glycol solvation. K saturation and gradual heating from 25 to 300°C leads to a partial collapse of 1.4 nm and on further heating upto 550°C a part of this peak collapses to 1.0 nm indicating the presence to hydroxy-interlayered vermiculite (HIV) while the persistence of a part of 1.4 nm peak confirmed the presence of chlorite. This peak at 1.4 nm is weak in silt and total clay of pedon 2 although the behavior towards glycolatoin and K saturation and thermal treatment remains same. The intensity of this in both the pedons decrease with depth. In the fine clay fractions of both the pedons the behaviour of 1.4 nm peak towards Mg solvation, K saturation and treatment confirmed the presence of HIV.
The peak at 1.2 nm is strong in the silt and weak in total clay of pedon 2. With solvation of Mg samples and K saturation (heating even upto 110°C) this peak does not change its position indicating the presence of a mineral with alternate interlayering of a 1.0 and 1.4 nm minerals. This peak, however, shifted to 1.1 nm and gradually merged with 1.0 nm component on heating K sample from 300°C to 550°C. The 1.4 nm component in the inter-strattified mineral was thus nonswelling type with the characteristics of collapsing at K saturation and subsequent heating indicating that the 1.4 nm component is HIV and the mineral is an interstratification of mica-HIV (M-HIV).
Kaolinite ang gibbsite are the dominant minerals in silt and total clay fractions of both the soils. The other minerals are chlorite, M-HIV, mica, quartz and traces of feldspars. Kaolinite is the dominant mineral in fine clay fractions of both the pedons with gibbsite as subdominant minerals. Kaolinite tends to become depleted in subsurface soils in clay and silts fractions and
92

the relative abundance of gibbsite followed a trend opposite to that of kaolinite. It indicates that the weathering is relatively advanced in the subsurface horizons which is unlike the normal weathering trend of Ultisols (1). This appears to be due to antigibbsite effect as indirectly evidenced by relatively more content of HIV in the surface layers (2).
Literature cited. (1) Dixon J.B. 1977. Kaolinite and serpentine group minerals. In. Minerals in soils environments (Ed. J.B. Dixon), pp. 357-403.
(2) Jackson M.L. 1963. Interlayering of expansible layer-silicates in soils by chemical weathering. Clays and clay minerals. 11: 29- 46.
93

Image Analysis of the Main Horizons of an Oxisol/Ultisol Toposequence in Sao Paulo State (Marilia, S.P., Brazil)
V. Hallairc1, S.S. Castro2 and P. Curmi1*. xlnstitut National de la Recherche Agronomique, Labo. Science du Sol, 65 rue de Saint Brieuc, 35042 Rennes cedex, France, 2 Univ. de Sao Paulo, Depto de Geogrqfta CP 8105, Sao Paulo, S.P., Brazil
Introduction. Detailed structural analysis of an Oxisol/Ultisol toposequence in the humid tropics showed it corresponded to a lateral pedological transformation system from Oxisols to Ultisols (1). These transformations included a bulk density increase from Bl to Bt horizons, development of hydromorphic conditions in the upper part of the Bt horizon and drastic eluviation in the superficial A2 horizon. All these transformations affect horizons macroporosity. Therefore, we propose a quantitative analysis of the macroposity of the main horizons in relation to their micromorphological characteristics.
Material and Methods. The toposequence, located near Marilia (S.P., Brazil) has developed from cretaceous sandstone. The Oxisol, at the top of the plateau, is composed of a clayey sandy microgranular Bl horizon. Along the slope, this horizon gradually turns into an Ultisol composed, from base to surface, of a clayey sandy microgranular Bl horizon, a sandy clay polyedric Bt horizon with increasing hydromorphy and a sandy A2 horizon with sandy clay red centimetric bands. Micromorphological descriptions were performed on large thin sections (16 cm x 9 cm) from undisturbed soil samples embedded in a fluorescent resin in order to quantify macroporosity. Ten levels from the Oxisol and the Ultisol were analysed: representative of the Bl, the Bt, the A2 horizons and of the centimetric bands. Images of the macroporosity were captured by ultra-violet reflected light, so the pore space shows up bright on a dark background. 48 images were digitized in a hexagonal grid of 512*512 pixels, with a spectral resolution of 256 grey levels and a spatial resolution of 25 urn per pixel. The grey level histogram (Fig. 1) allowed the images to be segmented according to three thresholds, corresponding to: (i) solid, dark; (ii) interaggregate macropores resulting from the microgranular structure of the soil, dark grey; (iii) packing voids and vughs (biological or dissolution voids), light grey. For this third class, a shape index (2) allowed elongated cracks and rounded vughs to be distinguished. For each pore class, an individual quantification was established with a size parameter (pore surface area).
r 0 50 100 150 200
Fig. 1. Grey levels histogram of an image in Bt horizon
1 grey levels 250
94

Results and Discussion. Light microscopy examination showed that micropeds of the Bl horizon were formed by the association of sandy quartzeous skeleton and an asepic kaolinitic plasma. Loose arrangement of these micropeds in Bl horizon become denser at the base of Bt horizon. Structure of the latter were polyedral with interaggregate polyconcave voids loosely interconnected. Dluvial clay cutans occurred along planar voids between peds and in large channels and vughs. Top of Bt horizon were affected by hydromorphic proccesses. Plasma become yellower and rich in opaque oxide punctuations. Moreover large dissolution vughs occurred which contained individual quartz particles. Eluvial A2 horizon showed a monic fabric of sand size quartz with a scarce punctuated brownish plasma. Roots of the centimetric bands showed an organization similar to the top of the Bt horizon while it changed into a chitonic fabric near the surface where relictual plasma formed cutans between sandy particles. Evolution of the different classes of macropores in this Oxisol/Ultisol toposequence as quantified by image analysis is resumed in Fig. 2. In the Bl horizon of the Oxisol, macropores represent 25-30% of total surface area. They are especially composed of interaggregate pores (20%), with little vughs and without any cracks. In the Ultisol, from base of Bt to the top of A2 horizons macroporosity varies from 10% to 80% and interaggregate pores gradually increase from 3% to 60% up to the top of the profile, i.e. with the increasing degree of hydromorphy and eluviation of the horizons. The bands within A2 horizon present the same pore characteristics than the transition A2/Btg and confirm therefore its relictual origin. Vughs are more abundant at the transition between Btg and A2 horizons. They consist of biological pores in the deepest horizons, and of dissolution voids in the upper ones. Cracks are only present in Bt horizon and at the transition A2/Btg. They are not related to the degradation process within the sequence.
]
• interaggregate pores O vughs E31 cracks
1 1 1 60 70 80 pore surface area (%)
Fig. 2. Macroporosity in the Oxisol/Ultisol toposequence
Conclusions. Quantification of macroporosity by image analysis emphasizes the genetic transformation in the Oxisol/Ultisol toposequence: (i) evolution of microstructure from Bl to Bt corresponds to a decrease in interaggregate porosity; (ii) structural and mineralogical transformation from Bt to A2 which result from surface water activity that induces hydromorphy and eluviation processes, correspond to an increase in vugh porosity and interaggregate porosity.
Literature cited. (1) Castro, S.S. 1990. Sistemas de transformacao Pedologica em Marilia, SP: B latossolicos e B texturais. Tese de Doutoramento DG/USP 274 p. (2) Hallaire, V and Cointepas, J.P. 1993. Caractérisation de la macroporosité d'un sol de verger par analyse d'image. Agronomic 13, 155-164.
95
Oxisol
Band (top)
Band (base)
A2 (near band)
A2 (middle)
A2/Btg/Band
A2/Btg
Btg (top)
Bt (middle)
Bt (base)
Bl

Comparison of Silt Loams (apparent field textures) of Andisols to Silt Loams of Other Selected Soil Orders
Shelby H. Brownfield, H. Raymond Sinclair, Jr., and John M. Kimble. Consultant, Boise, Idaho, United States, and United States Department of Agriculture, Soil Conservation Service, Lincoln, Nebraska, United States.
Introduction. This poster is a synthesis of generalized concepts for the Andisol group as a whole; however, there are certain soils included in Andisols that may lack or differ from these soils in a particular property. This is mainly a generalized synopses of the information about the properties of Andisols. A comparison of properties is made between Andisols, Midwest loess, and Columbia Basin loess. The literature on soils with Andic properties is very large. Only selected works are cited. More literature citations will be available with the poster.
Materials and Methods. These soil properties estimates are based on literature review, discussions with soil scientists, foresters, agronomists, engineers, review of laboratory data, and personal observations.
Results and Discussion. Table 1 makes comparison of silt loam soils by composition and family. Table 1 makes only a few comparisons. The poster will make more comparisons.
Table 1. Comparisons of Silt Loam Soils in the Midwest and Columbia Basin with Andisols (All figures are approximations and are used to illustrate comparisons and relationships)
Selected Criteria
Soil Properties of
Selected Criteria
Other Aeolian Deposits
Andisols
Soil moisture regimes
Midwest Columbia loess Basin
loess
udic xeric
ashy medial hydrous
xeric udic udic-perudic
Allophane content
Crystalline clay
trace- some none likely
main main
Allophane content
Crystalline clay
trace- some none likely
main main some + little none
96

Selected Criteria
Soil Properties of
Selected Criteria
Other Aeolian Deposits
Andisols
Surface Organic Matter
Bulk Density Mg m-3
Permeability
AWC cm/cm
Phosphorus Retention
Exchange Complex Charge
Cation Exchange Capacity
<6% <6%
1.2- 0.95-1.4 1.3
moderate moderate
0.18- 0.20-0.20 0.24
low low
perm- permanent anent
low low
<5% 35% Surface Organic Matter
Bulk Density Mg m-3
Permeability
AWC cm/cm
Phosphorus Retention
Exchange Complex Charge
Cation Exchange Capacity
<6% <6%
1.2- 0.95-1.4 1.3
moderate moderate
0.18- 0.20-0.20 0.24
low low
perm- permanent anent
low low
0.90 0.30 decreases >
mod. rapid v. rapid increases >
0.24 0.40
Surface Organic Matter
Bulk Density Mg m-3
Permeability
AWC cm/cm
Phosphorus Retention
Exchange Complex Charge
Cation Exchange Capacity
<6% <6%
1.2- 0.95-1.4 1.3
moderate moderate
0.18- 0.20-0.20 0.24
low low
perm- permanent anent
low low
mod high v. high increases >
vari. & variable perm.
(pH dependent) high increases >
The unique physical properties of Andisols are mostly related to the amorphous constituents. They have a stable structure: high water holding characteristics, with water held at low tension; high 1500 kPa water; smeariness or slippery nonsticky consistency; high liquid and plastic limits with a very low plastic index; low bulk density; high void ratios; anomalous compaction behavior; high intake of water; and high permeability with 'good drainage. Chemically, Andisols contain large amounts of stable organic matter; have a pH dependent cation and anion exchange capacity; high phosphate retention and; a pH ranging from 5.5 to 6.5 - low base saturation relationships; typically formed in tephra parent material; and are in a humid or perhumid environment. Amorphous clays in soils derived from parent material other than volcanic ash may be different from those in volcanic ash soils.
Literature Cited. (1) Geist, J. M. and P. H. Cochran. 1990. Influences of volcanic and pumice deposition
on productivity of western interior forest soils. Proceedings, management and productivity of Western-Montane forest soils. USDA - Forest Service. Intermountain Research Station. General Tech. Rep. INT-280, 82-89.
(2) Kinloch, D. I., S. Shoji, F.H. Beinroth, and H. Eswaran. 1988. Proceedings of the Ninth International Soil Classification Workshop, Japan, July 20 - August 1, 1987. Japanese Committee for the 9th International Soil Classification Workshop, Soil Management Support Services, Washington D.C.
(3) Maeda, T., H. Takenaka, and B. P. Warkenton. 1977. Physical properties of allophane soils. Advances in Agronomy 29:229-264.
(4) Tan, K. H. Andisols. 1984. Benchmark papersin soil science series. Van Nostrand ReinholdCo., p. 418.
97

GENESE ET DIAGNOSTIC DES RANKERS EN BULGARIE
METHODITEOKHAROV Institut de pédologie et d'agro-écologie
"N. Pouchkarov" — Sofia, Bulgarie
I. INTRODUCTION Les premières recherches portant sur 1'écologie, la genese, la classification et la
repartition géographique des rankers en Bulgarie datent du début des années 80 (Ninov et Teokharov, 1980; Teokharov, 1981; Ninov et Teokharov, 1982; Yolevski et al., 1982). Avant ces recherches, les sols de ce type étaient classes dans le niveau taxinomique inférieur des types zonaux (Koïnov, 1965). Certaines écoles pédologiques en font mention avant cette date (Kubiena, 1950; Duchaufour, 1965; FAO, 1977), la dernière version de la FAO les incluant dans le groupe des leptosols.
Les rankers ont été recensés presque dans toutes les regions du pays, a 1'exception de la sous-zone des tchernozems, des provinces a vertisels, des regions de sols cannelle, gris et pseuodopodzolisés, constitués sur des roches tendres. Leur repartition est le résultat de la spécificité et de 1'interaction des facteurs jouant sur la situation écologique. Ils sont constitués sur des roches acides et un relief tres accidenté exposé au soleil. Indépendmment du climat general, cela crée d'importantes differences dans le régime hydrothermique, 1'altération, le développement du facteur biologique et sa productivité, dans la manifestation du processus de formation des sols, par rapport aux sols environnants. Leur formation et leur diffusion ne dependent pas des conditions écologiques générales, mais de la spécificité du biotope, de 1'éco- et de 1'édaphotope, c'est-a-dire du complexe synergique et des interactions dans les géosystémes et ècosystèmes (Ninov et Teokharov, 1991).
II. MATIERES ET METHODES Les recherches sur la genese et le diagnostic des rankers ont porté sur les profils et des
échantillons de tout les pays. Les methodes appliquées sont la methode caténaire (Gansen, 1958), la methode géographique comparée (Polinov, 1962) et les methodes de laboratoire utilisées a 1'Institut "N. Pouchkarov": granulométrie (Katcninsky, 1958), micromorphologie (Kubiena, 1967), composition et contenu humique (Turine, 1965 et Kononova-Beltchikova, 1971), reaction potentiométrique du sol, capacité d'échange cationique, cations échangeables et degré de saturation basique (Ganev, 1965), fer "mobile" d'aprés Tamm (1971), composition chimique générale (Arinouchkina, 1970), minéraux primaires et secondairex (Sabanine, 1963, Gorbounov et Jacksov, 1965).
III. RESULTATS ET ANALYSE Les rankers sont des sols de faible profondeur, a profil simple de type A-AC-C/D/,
n'atteignant pas plus de 50—55 cm de profondeur et avec un ensemble incoplet d'horizons genétiques. Le diagnostic de leur horizon humique a une coloration caractéristique plus claire et une épaisseur de 25 cm, variable sur faible espacement, selon I'exposition des
98

versants. Leur contenu humique augmente avec la diminution de 1'ensoleillement et 1'augmentation de 1'altitude. Les rankers sont des sols légers, fragmentaires a structure peu solide et a grande perméabilité. Dans la zone médiane du profil, on n'observe pas 1'argilation caractéristique des sols a horizon de texture B La formation d'argile est plus active dans la partie supérieure du profil et la teneur en particules fines ne présente pas une repartition illuviale (Teokharov, 1981). La quantité peu importante ou la faible formation plasmique expliquent 1'absence ou la petite quantité de nudoles et papules et 1'absence de concretions férromanganésiques. (Staïkov et al., 1982). Les rankers sont des sols acides, ne présentant pas de processus d'accumulation de carbonates, de migration prononcée de CaO et de formation de zones d'accumulation de carbonates. lis ont une faible teneur basique (moins et aux environs de 50 %) et une capacité d'échange cationique dont les valeurs sont proches de celles des limites inférieures des sols environnants. Le comportement du fer "mobile" prouve le faible niveau ferrugineux et une synthese difficile des produits ferreus et minéralogiques. La composition chimique et minéralogique indique que les processus de formation des sols sont a un stade initial. La presence des micas hydrosolubles dans les minéraux argileux, le contenu élevé d'oxyde de silicium et la repartition presque identique des autres oxydes dans le profil confirment cette conclusion. La quantité dominante de minéraux primaires sur les secondaires (argileux) prouve que 1'altération physique domine les processus de la formation d'argile et indique un processus de formation des sols peu évolué. Ces sols sont classes dans trois sous-types: semimontagneux (pseudopodzolisés), montagneux (bruns) et subalpins (humiques). Les derniéres recherches permettent de considérer qu'il existe un quatriéme sous-type — dess rankers alpins (histik) que 1'on trouve dans les zones de grande altitude des massifs du Rila et du Pirin.
IV. CONCLUSION La spécificité de la genese et du diagnostic des rankers est une preuve de leurs
differences essentielles des sols climax. La classification bulgare les place a juste titre dans un type indépendant et ils sont définis comme des sols peu profonds et peu évolués, formés sur des terrains en pente et des roches siliceuses.
V. REFERENCES 1. Ganev S., Rastenievadni naouki, Mb 7, S., 1965 2. Gansen R., Geografia potchv, M., 1962 3. Katchinski N. A., Mekhanitchen sastav, M., 1958 4. Koïnov V., Potchvena karta na Balgaria, S., 1965 5. Ninov N., M. Teokharov. De la constitution d'un nouveau type de sols rankers en
Bulgarie, Hle Conférence nationale de pédologie, II partie, S., 1982 6. Teokharov M., These de doctorat, S., 1981 7. FAO, Unesco. Soil of the world, 1 : 500.000, vol. 1, legend, Rome, 1977
99

Characterization of Soils with Gypsic Horizon in the Province of Navarra (Spain)
F. J. Arricibita Videgain, [E. Barragan Landa[and P. Bescansa Miquel. Departamento de Ciencia y Tecnologia del Medio Natural. E.T.S.I. Agrónomos. Universidad Publico de Navarra, 31006, Pamplona, Espatia.
Introduction. Navarra lies between the Western Pyrenees and the foothills of the Cantabrian Range. This Province shows strong climatic contrasts within its 140 km. North-South span, as no other one in Spain. According to Thornthwaite's climatic criteria (6), there is a gradient from a perhumid, microthermal climate on the Pyreneam tops to a dry, semiarid one in Bardenas Reales. The climatic aridity and, on occasion, the high salinity, determine the apparition, in South of Navarra, of Aridisols (5).
Material and Methods. Macro (1) and micromorphologycal (2), chemical (4) and clay mineralogy data from four soil profiles are presented here. The studied soils were located in the South of the Province, at about 400 m. above sea level. They were developed over gypsum or gypsum-enriched materials, the topography being flat or with a slight slope. The soil moisture regime is aridic.
Results and Discussion. The above-mentioned characteristics determine the peculiar soil evolution, with a development of gypsic horizons, sometimes accompanied by calcic or cambic horizons. The weathering of primary minerals is restricted, as reflected by the scarce clay fraction evolution. Organic matter acumulation and its transformation are important, due to the presence of bivalent cations.. Two of the soils are classified as Typic Gypsiorthids, another as Cambic Gypsiorthids, and the fourth as Aridic Calcixerolh (5). They are Calcic Gypsisols, Haplic Gypsisols and Gypsic Kastanozems according to FAO (3).
Literature Cited. (1) Arricibita Videgain, F.J. 1987. Tipologfa de Suelos Salinos de Navarra. Tesis Doctoral. Universidad de Navarra. Espana. (2) Bullock, P. et al. 1985. Handbook for soil thin section descrption. Pub. Waine Research. (3) FAO/UNESCO. 1989. Mapa Mundial de Suelos. Leyenda Revisada. Roma. (4) Soil Conservation Service. 1972. Soil Survey Laboratory Methods and Procedures for Collecting Soil Samples. Washington. (5) Soil Survey Staff. 1990. Keys to Soil Taxonomy. Agency for International Development United States Department of Agriculture. Soil Management Support Services. Virginia. (6) Thornthwaite, C.W. 1948. An aproach toward a rational classification of climate. Geographic Rew. 38.
100

Sodium and Gypsum Accumulation In Polygenetic Soils of North Central Kansas, U.S.A.
S. L. Glaze, M. D. Ransom*, and W. A. Wehmueller. Department of Agronomy, Kansas State University and USDA Soil Conservation Service, Manhattan, Kansas, USA
Introduction. The Bluestem Hills land resource area of the Central Great Plains region (Soil Conservation Service, 1981) includes almost 20,000 km2 of tall grass prairie in east central Kansas. The climate is continental with a normal annual precipitation of 800 mm and a mean annual air temperature of about 13°C. Elevations range from 300 to 500 m, and the dissected topography features many narrow divides and steep side slopes. Soils on more stable landscape positions have a thin loess mantle and are polygenetic with a welded paleosol developed in colluvium over residuum from Permian limestones and shales (Wehmueller et al., in press). Soils on the summit are moderately well drained, contain pedogenic gypsum in the paleosol, and have an argillic horizon with exchangeable sodium contents that are borderline for a natric horizon. Three pedons of these polygenetic soils were investigated using soil characterization and micromorphological techniques. The objectives were to determine if the soils have a natric horizon and to evaluate the effect of the paleosol on the accumulation of Na and gypsum.
Materials and Methods. Three representative pedons on the summit position were selected near Manhattan in north central Kansas. A pit was dug at each site, and samples were collected from each horizon and analyzed for routine soil characterization and clay mineralogy by the methods described by the Soil Survey Laboratory Staff (1992). Undisturbed, oriented clods from selected horizons were air-dried and impregnated with polyester resin. Thin sections were cut, polished to a thickness of 30 ^m, and described using the nomencla'-ire of Brewer (1976).
Results and Discussion. All three pedons were fine, montmorillonitic, mesic Udertic Paleustolls and had a mantle of Wisconsin loess ranging from 58 to 72 cm thick over a welded, composite paleosol. The paleosol in pedons 1 and 2 formed in hillslope sediment (colluvium) over residuum from Permian cherty limestone. The paleosol in pedon 3 formed in pre-Wisconsin loess over hillslope sediment. The following table includes data for selected horizons of pedons 2 and 3. Although all three pedons exhibited morphology typical of a natric horizon including coarse prismatic or columnar structure in the upper Bt, none of the pedons met the sodium absorption ratio (SAR) requirements of a natric horizon (Soil Survey Staff, 1992). The SAR values for pedons 1 and 3 were < 13 for all horizons, and the SAR of 13 in the 3Bt3 horizon of pedon 2 occurred too deep in the argillic to meet natric horizon requirements. In all three pedons, clusters of pedogenic, lenticular gypsum were identified in the paleosol formed in hillslope sediment. The horizons in which gypsum occurred also exhibited high SAR and electrical conductivity (E.C.) values and contained the highest concentration of water-soluble S04
2". Water-soluble CI" and HCOj" were also present in lower concentrations in these horizons. For pedon 3, SAR values and S04
2" concentrations were lower, and their maximum values occurred deeper
101

in the profile as compared to the other two pedons. The paleosol foimed in hillslope sediment occurred at a greater depth in pedon 3, and apparently the clayey paleosol formed in cherty limestone residuum was truncated.
Horizon Depth (cm)
>2mm (%)
Sand Clay (%)
pH H20
E.C. (mmhos/cm)
S042
(meq/L) SAR
Pedon 2:
Al 0-10 0 7.2 26.0 6.3 0.73 0.7 1
Btl 17-33 <1 3.7 48.9 6.9 0.53 0.4 4
2Btk2 58-71 7 7.1 32.1 8.2 1.29 3.0 9
2Btky 71-86 3 9.1 34.3 7.6 5.73 70.0 11
2Btl 86-97 4 9.0 39.1 7.7 5.06 36.0 11
3Bt3 107-127 58 11.0 54.2 7.7 3.17 24.6 13
3Bt4 127-148 75 3.8 69.1 7.7 1.34 7.5 9
3R 148-150 - - - - 0.94 6.0 6
Pedon 3:
A 0-15 2 6.4 34.5 6.5 0.38 0.46 <1
Bt2 29-43 <1 2.4 50.3 7.2 0.34 1.09 4
2Btk2 72-86 1 4.5 36.2 8.2 0.81 2.48 8
2Btk3 99-119 <1 8.8 31.0 7.9 2.60 14.01 9
3Btk4 119-135 6 11.1 30.5 7.8 3.37 22.79 8
3Bty2 151-165 11 13.7 31.0 7.7 3.20 30.74 8
4R 165-170 - - - - - - -
Literature Cited. (1) Brewer, R., 1976. Fabric and Mineral Analysis of Soils. Robert E. Krieger Publishing Company, Huntington, New York. (2) Soil Conservation Service, 1981. Land Resource Regions and Major Land Resource Areas of the United States. Agriculture Handbook 296, USDA-SCS, Washington, D.C. (3) Soil Survey Laboratory Staff, 1992. Soil Survey Laboratory Methods Manual. Soil Survey Investigations Report no. 42. National Soil Survey Center, Lincoln, Nebraska. (4) Soil Survey Staff, 1992. Keys to Soil Taxonomy, 5th Edition. SMSS Technical Monograph no. 19, Pocahontas Press, Inc., Blacksburg, Virginia. (5) Wehmueller, W.A., M.D. Ransom, and W.D. Nettleton. In press. Micromorphology of polygenetic soils in a small watershed, north central Kansas, U.S.A. Proceedings of the 9th International Working Meeting on Soil Micromorphology, Townsville, Australia.
102

Origin of the Calcium Carbonate in Soil Profiles of the Rana and the Terraces System of the Taj o Middle Basin (Spain)
Pardo, E. ; Torcal, L.; Espejo, R.; Tortosa, E. Dpto de Edafologia, Escuela Técnica Superior de Ingenieros Agrónomos. Universidad Politécnca de Madrid
Introduction and Study Area. The study area is located in the Tajo Basin (Central Spain) wich is filled with Paleogene, Neogene and Quaternary materials. The paleozoic materiales are mainly shales and quarzites with granitic intrusions rich in plagioclases and form in many cases the substratum of the tertiary and quaternary series. The Quaternary area is mainly represented by the fluvial terrace deposits of the Tajo river and the piedmont of Montes de Toledo, it's shaped up for several rana surfaces, which make up the glacis type characteristic of the surfaces. Some ranas have received calcareous materials, whose origin is not very clear. The purpose of this paper is to stablish the permanence during Quaternary period of the pedological and non-pedological processes that here contributed to soil evolution and formation (specially the origin of calcium carbonate and the importance of eolic contribution) from the characterization of the soil physical, chemical, mineralogical and exoscopical properties.
Materials and Methods. In order to under take this work we have studied soil profile developed on the rana (distal area, +260 m and proximal area, +365 m a.l.r.) and some terrace levels (+5,+ 8,+35,+ 115,+ 190 m a.l.r.) in a normal cross-section to Tajo river. Descriptions of soils profiles in the field were accomplished according to (1) and soil cassification was accomplished by using Soil Taxonomy (5) and are included partially in (3,4). The soil samples collected from horizons were analysed according to (6) for texture, organic matter, CaC03, pH, total soluble salts, CEC and exchangeable bases. Mineralogical analysis of the silt and sand fraccion were realized with thin sections with petrographic microcopy. The Quarz Exoscopy (QE) was realized with Scanning Electron Microscope (SEM). X-Ray Diffraction (XRD) diagrams were obtained by using a Philips PW1710 instrument with Ni-filtered Cu-Ka radiation for clay and silt minerals. Perkin-Elmer TGS-2 apparatus was used to record thermogravimetric (TG) and differential thermal analysis (DTA) curves.
Results and Discusion. The rana has a character of a conglomerate with quartz elements and quartz inlay in a psammopelithic matrix. The medium size of the coars elements and their weathering degree decreases as the origin area distance increases (2), from south (Profile 1683) to north (Profile 3655). The rana formations have been subject to the action of very active weathering proccesses, that have affected to depths of 10-12 m, and the materials of their proper formations as the basement are involved. The edaphogenetic proccesses identified on rana soils (3,4) which modify the initial conditions of sedimentations appear related to development of the profiles (Xeralf tendency) and erosion and accumulation proccesses (thapto and cumulic/pachic character), age and argilluviation (paleic character and argilic horizon), rubification (rhodic character) and the saturation of the exchange complex an the calcification (Xerult suborder, ultic and alfic character and calcic horizon). About terraces system, the natural evolution of the edaphogenesis towards the formation of calcic and argillic horizons is determined by time of formation and stability levels so that *uose levels can be correlated as the following sequence: (C)-Ck-Bk-Btk-Bt-Bt(abruptic).
103

One of the main problems is the origin and distribution of the calcium carbonatebecause of its importance on fertility and management. In the eastern zone of the rana soils, the base saturation is over 50 % (Alfisol), while towards the west soils appear with and ultic character and even ultisols. Within the profil we can see clearly two tendences: an increased of saturation towards the surface and another with depth; so the decrease in the base saturation is formed in the central zone of the profil. We may also see differences within the formation so that the maximun base saturation is reached on the furthest zones, towards the Nort (Profile 14656) which it starts with the calcium carbonate accumulation whic convect with the ones observed on the terrace system. The justification is related to the possible source of calcium (CaC03): the cambric limestones, the granodiorites from sustratum and the accumulation of fluvial and eolic contribution There are three elements that favor limestone as a source of the calcium carbonate which accumulate in these soils; their relative situation (altitude over the rana and so over the terraces) their structural orientation (favored the calcification from southeast to north west) and the direction , encasement of the hidrographic netword. The stalactite morphology (cupped pebble) of the profile 14656 lime accumulation could be considered and additional confirmation (leaching per descensum). At the same time, two other signs confirme the origin of calcium carbonate from plagioclases of the substratum in one way, even in the susperior part of the altered zone of profile 2684 (the roots of the rana at 800 m altitude over altitude of the limestone) and so higher to the bigger part of the formation, there is calcium carbonate and in a second way in some places near the upper limit to the substratum give a light reaction to HC1. Finally, laying aside fluvial accumulation on ranas due to their origin, eolic accumulation could have been important if it would had worked throughout Quaternary. Precisely, by the exoscopy of quartz eolic accumulation has been detected in the recent terraces (T+5, T+8, T+35) but from this moment the characters could have been destroyed. To confirm these outstands that in the lower parts of the terrace profiles the edaphogenesis has canceled these signs. As a conclusion we can confirm that the three sources of calcium carbonate formed in the rana formation have influence in the carbonatation process of these soils, although we have not enough data to make any precisions about the relative importance of each one.
Literature Cites. (1) FAO 1977: Gufa para la descripción de perfiles de suelo. Organización de las Naciones Unidas para la Agriculture y la Alimentación, Roma 70 p. (2) Gehrenkemper.J. 1978: Ranas und reliefgenerationen der Montes de Toledo in Zentralspanien. Berliner Geographische Abhandlungen. Heft. 29, 81 p. (3) Pardo, E., J. Gallardo, A. Pérez-Gonzalez, V. Gómez-Miguel 1992: Variabilidad morfologica de suelos en las formaciones de rana de la vertiente norte de los Montes de Toledo. Simposium sobre la Rana. Madrid (4) Pardo, E., E. Espejo, E. Roquero, V. Gómez-Miguel 1993: Los suelos de la zona proximal de las formaciones de rana de la vertiente norte de los montes de Toledo. Congreso Latinoamericano. Salamanca. Espana (5) USDA.SCS 1972: Soil survey laboratory methods and procedures for collecting soil samples. Soil Survey Investigations Report n° 1, Soil Conservation Service U.S. Departament of Agriculture. Washington, D.C., 63 p. (7) USDA.SSS 1992: Keys to soil Taxonomy. SMSS Technical Monograph No. 19. Pocahontas Press 541 pp. Virginia
104

Microagregation des Sols, Cuirasse Fermgineuse et Alterations des Basaltes a Londrina (Etat de Parana, Bresil)
J. P. Queiroz Neto et O. N. Fernandes Barros. Dep. Geografia, Universidade de Sao Paulo, SP., et Dep. Goeciencias, Universidade Estadual de Londrina, Londrina, PR., Bresil. 86051-970/Londrina/PR, Brasil. ABSTRACT
The soils with microaggregated structure (Latosol Roxo) on the summit surface from Londrina region are associated with ferruginous cuirass(petroplinthite) and basaltic weathering. The reconstruction and mapping of the pedological organisation, the mineralogical analysis and the micromorphological observations point out that the microaggregation are directly derived from basalt and/or cuirass weathering; other wise, a hydromorphic condition on the top of the basalt substratum are responsible of cuirass desintegration. INTRODUCTION
Les couvertures pédologiques a microagregats originaires de 1' alteration des basaltes (Latossolo Roxo) couvrent une surface impor tante (1455) de 1'Etat du'Parana (1). Sur la surface somnitale de la region de Londrina, ces sols sont associés a des cuirasses férrugi-neuses de bas de pente (2). MATERIEL ET METHODES
L'analyse structurale bi et tridimensionnelle (3) a permis de reconstituer 1'organisation de la couverture pedologique tout en situant la position de la cuirasse et de 1'alteration du basalte.
La composition minéralogique a été deterninée par difraction des rayons X et les lames minces ont été examinees en loupe binocu-laire et au microscope optique. RESULTATS ET DISCUSSION
Sur les versants convèxes a. pente douce la couverture pedology que est tres homogene jusqu'a la rupture de pente de bas de ver-sant, ou affleurent des blocs d'une cuirasse férrugineuse pisoli-thique et, a contre-bas, de basalte. Il s'agït d'un sol tres argi-leux, rouge foncé (2.5YR3/4) qui, en dessous de 40 cm et jusqu'a tres grande profondeur, présente une structure microagregée avec des nodules et pisolithes millimétriques tres fonces; la quantité de ceux-ci augmente en profondeur et dans la direction de la cuirasse de bas de pente. Celle-ci apparaït sur Ie basalte altere sous la forme d'un horizon a. blocailles pisolithiques entourees par Ie materiel rouge microagrege;les vides a 1'interieur de la cuirasse sont remplis par des microagregats rouges originaires d'une alteration jaunatre. Immédiatement a 1'aval, la cuirasse fait place aux bloes du basalte; 1'alteration de la roche se fait sous des conditions d'hydromorphie, il se forme une argile compacte qui, a son
105

tour, se transforme en materiel microagregé contenant toujours des nodules et pisolithes.
L'analyse aux rayons X montre une compositions assez uniforme de la cuirasse ou de la roche en alteration vers Ie materiel microagregé (kaolinite, gibbsite et goethite).
Les lames minces montrent la transformation progressive du ba-salte altere vers un plasma avec taches arrondies qui vont s'indi-vidualiser (glébules). L'alteration de la cuirasse suit un chemin similaire, passant par une structure porphirique vers la granulaire d'assemblage de microagregats; ; dans ce cas, les vides interagre-gats peuvent etre partiellement remplis par des ferriargilanes.
La formation des microagregats, ainsi, peut se faire par deux voies: par 1'alteration de la cuirasse ou du basalte. L'alteration du basalte produit des nodules lithorelictuels et des pisolithes. Sous des conditions plus oxydantes, les nodules et pisolithes sont pris en masse par férruginisation pour former la cuirasse. Par 1' alteration de celle-ci les microagregats se forment en mime temps que Ie nodules et les pisolithes sont liberés ; leur presence dans la masse du sol semble témoigner que la cuirasse a toujours éte présente dans la genese de la couverture pédologique, sous un mécanisme de formation/alteration plus ou moins continu dans Ie temps. Sous des conditions plus réductrices, Ie basalte peut pro-duire des microagregats a partir d'une argile compacte d'alteration; sous ces conditions, la cuirasse s'altère aussi.
La distribution spatiale des différents horizons montre des discordances entre eux et avec la topographie, qui semblent indi-quer que 1'hydromorphie serait postérieure a la formation de la cuirasse . BIBLIOGRAPHIE (1)EMBRAPA/IAPAR.1984. Levantamento de reconhecimento dos solos do Estado do Parana. EMBRAPA Bol.Teen. 57 & IAPAR Bol.Técn.16, 414 p. (2)FERNANDES BARROS, O.N.1991. Distribution spatiale et caractéris-tique des organisations pedologiques sur basalte dans Ie bassin versant du CÓrrego Unda, Cambé (Etat du Parana). Centre de Géomor-phologie CNRS, Caen, Table Ronde "Organisation et dynamique interne de la couverture pédologique" (extended abstract). (3)B0ULET, R.1987. Analise estrutural da cobertura pedologica e car tografia. Campinas, Anais XXI Congr.Brasil.Ci.Solo:79-90.
106

Origin of Carbonate Accumulations in Lacustrine Soils C. Gutierrez C , and C, Ortiz-Solorio. Centro de Edafologia, Colegio ed Postgraduados, 56230 Montecillo, México. Introduction
In arid and semiarid zones the most important pedogenic process is the calcium carbonates of calcareous or not calcareous parent materials. Dress and Wilding (1), reported that the soil developed from weakly or no calcareous parent materials and the identification of soil carbonates as pedogenic accumulations can be made with certainty.
This study was made in the area of Texcoco ex-lake. In this area, many types of carbonate accumulations, and many calcitic pedofeatures are found. The objetives of this research were: Identify and to know the pedofeatures genesis that have been developed under sedimentation and moisture-drying conditions. Materials and Methods
In orden to obtain information about the genesis of the carbonate accumulations, 26 soil profiles were sampled in Texcoco, State of México. Physical, chemical and micromorphological analysis, and the identification of carbonates minerals by staining methods were carred out (2). Results and Discussion
Three types of carbonate accumulations with different calcic pedofeatures were identified in soils of lacustrine origin.
Geogenic- The soils of Texcoco ex-lake are located in a close basin and all secondary products of igneous rocks of high mountains were transported and accumulated on the alluvial plain. The calcium was originated of weathering of andesitic rocks and the C02 by the high biological activity present in the lake. Then, the CaC03 was precipitated slowly as micritic froms with parallel distribution.
When the lake was dryed, it was increasing the salinity and the carbonates were precipited mainly as concentric nodules, they occur a wide variety of compond forms as geodic, nucleic and halo. Frequently these nodules are compose by micritic and sparitic crystals, and less common microsparitic. This nodules contains a great amount of Mg. Folk (3), proposed that Mg prevent flushing removes this Mg-charge, and allows recrystallization to coarse microsparitic (figure lb).
Biogenic- The high Ca (OH) 2 concentrations in the lake water produced good conditions for the developing of certain microorganims (mainly ostracods) and other species. When this animals died, their cover were sedimented and thick layers were formed (figure lc).
107

Pedogenic- When the lake was drained and the sediments were exposed the weathering, the CaC03 start to dissolve( as biogenic as geogenic accumulations) and ascending toward surface by the intense evaporations present in this place. The continuos dissolutions and precipitations originated other pedofeatures such as hypo-coating, diffuse nodules, and crystallitic b-fabrics near the surface (Figure Id).
S U R F A C E
• • ' , '
a . C o n c e n t r i c
b . t i p i c
N o d u 1 e s w i t h m l c r l t l c
o r s p a r i t i c c r y s t a l s
M i c r i t i c w 1 t h
p a r a l l e l d l s t r i b u t l o n
^=0 o—O o s t r a c o d s w i t h p a r a l l e i d i s t r i b u t i o n
Cr y s t a 1 1 1 t i c
b - f a b r 1 c
H^p o - c o a t I n g
N o d u l e s d i f f u s e
a. Geogenic b. Biogenic c. Pedogenic
Figure 1. Different types and sequences of carbonate accumulations
Conclutions
In soils originated by igneous rocks sediments it is possible to find all types of calcium carbonate accumulations.
References
1. Dress, L.R. and Wilding, L.P. 1987. Micromorphic record ana interpretation of carbonate forms in the Rolling Plains of Texas. Geoderma, 40:157-176.
2. Morras H.L. 1976. L' identification des matériax carbonatées par coloration différentielle. Technical note No 1. Rijksuniversiteit Gent. Geologish Instituut, België.
3. Folk, R.J. 1974. The natural history of crystalline calcium carbonate: effect of magnesium contend and salinity. J. Sediment. Petrol,. 44: 40-53.
108

Distribution of Metal Microelements by Genetic Soil Horizons as Depending on Profile Differentiation
S.P.Gorbanov. Department ofAgrochemistry, Agricultural University, 4000 Plovdiv, Bulgaria
Introduction. The content and distribution of metal microelements in the various soil types have thoroughly been studiedby a number of authors. The regularities in the distribution of the different elements by the soil profile and the factors affecting this distribution have been established. Few are the generalized results about the profile distribution of metal microelements and their relation to the mineralogical and chemical soil composition, as well as about the interrelations in the vertical dispersion of metals. Therefore, by using the data reported by some Bulgarian authors about the different elements in the Bulgarian soils, as well as our own results about the most metals in the soils of Bulgaria and all metals in the soils of Cuba, we made it our aim to establishing the regularities in the metal distribution and its relation to the processes of soil formation, both known and described by a number of authors.
Materials and Methods. To realize the aim of the study, we used the knowledge of the weathering type and the distribution of the main building elements: silicon, aluminium, calcium and other alkali-earth elements (2,3,4) and the data for the contents of the metals: iron, manganese, titanium, copper, zinc, cobalt, nickel, and chrome (1).
Results and Discussion. The results for the metal microelement contents by genetic soil horizons in Bulgaria and Cuba show definite regularities depending on the profile differentiation. In soils with undifferentiated profiles, the metal distribution is mainly conditioned by the properties of the soil type. The alkaline reaction, the high organic matter content and the absence of illuvial horizons in the rendzinas are the principal reasons determining the favourable conditions for enriching the surface horizons with metal microelements, mainly at the expense of the C-horizon. The character of the soil-forming rock exerts also a definite influence on the profile distribution of metals. Both in the cinnamon-siallitic and the mountain-meadow soils with no differentiated profiles, i marked regularity was established in the depth leaching of some elements in soils formed on rocks rich in metals, and the accumulation in A horizon in soils, formed on soil-forming rocks poor in the investigated elements. In soils with insignificant leaching of chemical elements at the process of weathering and soil formation, the profile distribution of metal microelements is determined by different factors. Thus, in the chernozems distributed in the North Bulgaria, the profile distribution of almost all metal microelements is connected with the leaching of carbonates in depth. The deeper the carbonates are leached, the more intensive the metal leaching is, the accumulation taking place on the border with carbonates. That is mainly connected with metal ion precipitating in the presence of-carbonates and increased values of pH. A lower mobility is typical for molybdenum, titanium and cobalt, and a better one for iron, manganese, vanadium and copper. The profile distribution of metal microelements in the typical cinnamonic forest soils is affected by the presence of profile differentiation, even if slightly expressed, and in the ferrite tropical soils - mainly by the richness of the soil-forming rock. Irrespective of the conditions under which the soils with slight profile differentiation have been formed - the temperate
109

climatic conditions or tne high temperatures and intensive rainfalls ot the tropics - the metal microelement distribution depends chiefly on the carbonate leaching and the profile differentiation. The deeper the carbonates are removed and the better the profile differentiation is expressed, the bigger the microelement differentiation by genetic horizons is. Thus, the leached cinnamonic soils can be considered as a transitional type between soils with slight profile differentiation, such as the podzolic and pseudopodzolic soils. The same conclusions can be made for some tropical fersiallitic soils, too. The investigated different-in-origin soils with well-differentiated profiles allow the assertion that the depth leaching of the tested metals is typical for all soils of the group, the speed of moving being determined both by the clay leaching and the profile reaction. Of the tested elements the highest mobility was observed in copper, and the lowest in titanium. In soils formed under hydromorphic conditions in the past or present, a clearly expressed accumulation is observed in the upper horizons and enrichment of the gleyic Bg horizon with almost all metal microelements. In the saline soils of the solonchak type, the enrichment with metals is mainly accomplished through biological accumulation in the surface horizons, and that with zinc could be due to its leaching from the lower horizons to the surface ones in the form of zincates.
Irrespective of the peculiarities in the metal microelement distribution by the genetic horizons of soils with different profile differentiation, there is a moderate to high positive correlation between the total soil content and the richness of the soil-forming rock. This correlative dependence is highest in the humus-calcareous soils, chernozems, hydromorpho-gleyic and saline soils, and lowest in soils with a strong profile differentiation. Of all the tested elements in the soils of Cuba and Bulgaria, manganese was characterized with the best biological accumulation, its coefficient of accumulation in soils reaching 1.77. A clearly expressed zinc enrichment of the surface horizons was observed in all calcareous soils irrespective of the conditions of their formation and the type of the soil-forming rock: calcareous chernozems, calcareous vertisol (smolnitza), calcareous tropical cinnamonic soils )r rendzina. A similar regularity was observed in nickel, too. No accumulation of copper was established in the surface horizons except in some profiles. In all soils, a significant iron resistance to migration in depth was established. Only in soils with well-differentiated profiles, a great part of iron moved to the illuvial horizon and accumulated in it. This phenomenon was less expressed in the fersiallitic tropical soils, and better expressed in the yellow podzolic and light grey forest soils of Bulgaria and the tropical ferrallitic soils. The vertical distribution of metal microelements is closely related to the processes of profile differentiation and could be used as a diagnostic index at the determination of the rate of profile differentiation and the carbonate removal, together with the conventional indices used so far.
Literature Cited.
(l)Gorbanov, S. 1985. The Microelement metals in the soil forming rock-soil-plant system. D.Sc. Dissertation. Sofia. (2) Gorbanov, S.,I. Atanassov. 1983. Characterization of fine-disperse minerals in the major soils in Cuba. Soil Sc. and Agrochemistry, Sofia, 4:11-23. (3) Soils of Bulgaria. 1960. Sofia. (4) Suelos de Cuba. 1975. La Habana.
110

Contrasting properties of Lovic versas Afóc and of Lixic versus Acric Soils, a Pragmatic Approach
J. Deckers*, B. Delvaux** R. Dudal*. Institute for Land and Water Management KULeuven, Vital Decostertraat, 102, B-3000 Leuven, Belgium*, Unite des Sciences du Sol, Université Catholique de Louvain, Place Croix du Sud, 2, Bte 10, B-1348 Louvain-la-Neuve, Belgium Introduction. The paper deals with the classification of the soils having an argic horizon which do not key out as Nitisols. As key to subdevide these soilss was largely based on the findings in the soil surveys of Brasil. In the Amazone forest and it the savannahs of Brazilian shield it became clear that natural eco-systems the clay activity and the base saturation are of major importance. The revised FAO Legend for soil classification 1), has applied this reasoning toward the distinction of Luvisols, Alisols, Lixisols and Acrisols on the basis of the cation exchange capacity (CEC) and the base saturation as shown in Table 1.
Table 1. Distinction between Luvisols, Alisols, Lixisols and Acrisols on the basis of base saturation and cation exchange capacity.
Cation Exchange Capacity of the clay fraction < 24 cmol(+)/kg >24 cmol(+)/kg
Base < 50% Acrisols Alisols Saturation
> 50% Lixisols Luvisols
Material and methods. During the discussions of the World References Basis for Soil Resources meeting at Silsoe in 1991, concern was voiced about using the base saturation as a criterion for soil separation at the highest categorical level. It was argued that the base saturation is too variable in time and can be changed over too short a period through extensive liming. A proposal was formulated to test as a consequence the merger at the hightest level between Luvisols and Alisols as the soils with high activity clays as reflected by a high CEC in the argic horizon. The lixisols would then be grouped under the soils with an argic B horizon with predominance of low activity clays. A further separation of these units on the basis of the base saturation could then be made at sub-unit level. The criteria for making this second level separation should apply to greater soils depths than is the current FAO practice for base saturation distinctions, the Silsoe meeting aslo recommended to describe and /or define an Eluvial horizon (in addition of a diagnostic Albic E horizon), which should help to describe the soils with an Argic horizon. Further it was suggested that the diagnostic Argic horizon be replaced by adefinition of Argic properties and a diagnostic Argillic horizon. The Argic properties would cover the broader 1990 FAO concept of the genesis of an Argic B horizon, whereas the diagnostic Argillic horizon should show evidence of clay illuviation in the form of clay skins. A distinction between Luvisols with a diagnostic Argillic horizon and those with other Argic properties could then be made at the second categoric level. The meeting thought it neccesary to specify depth limits for the Argic B horizon or Argic properties.
Results and Discussion. As the merger between respectively Luvisols-Alisols and Lixisols-Acrisols was implemented, some important consequences emerged. It appeared to be very inappropiate to lump together major soil groups of entirely different pedogenetic origin, geographic coverage and agricultural potential(l,3). The issue was taken up again in the WRB meeting hosted by FAO in Rome, April 1993. It was concluded that the reintroduction the old Argillic horizon and Argic prperties would be a step backwards. A recommendation was made to possibly use the presence of coating at the third categorical level.
H I

As for the Luvisol/Alisol and Lixisol/Acrisol separation, the meeting decided to keep this separation at the highest cathegorical level. Separation criteria! to be used are: 1/ A CEC of the clay of 24 cm!(->-) which distinguishes Luvisols/Alisols from Lixisols/Acrisols. 2/ Aluminium saturation to be used to separate Luvisols and Alisols. The limit is still open for discussion. 3/ A base saturation of SO % for separating the Lixisols and the Acrisols, awaiting better criteria. The meeting recognised the important differences in the management, the geographic and climatic zonation of these four groups, which is one of major arguments to keep them separate as four major units. The paper highlights the arguments which led to the controversy and the eventually throws light on the reasons why the four major soils groups are maintained as distinct entities at the highest level in the World Reference Base for Soil Resources. Important linkages with other related soils units are highlighted in order to reflect spatial and temporal linkages in the soil continuum.
Literature Cited. (1) Driessen, P. and Dudal, 1991. The Major Soils of the World, Agricultural University, Wageningen and Kuleuven, 310 pp (2) FAO, 1990, FAO-UNESCO Soil Map of the World, Revised Legend. World Soil Resou ces Report 60. 199 pp. (3) FAO, 1991, World Soil Resources. World Soil Resources report No. 66, 58 pp.
112

The contribution of lithogenic and pedogenic processes to the origin of fine earth fractions of soils of the Crimean Mountains N.G. Kovalev. Dokuchaev Soil Institute, 7 Pyzhevski Lane, Moscow, Russia
Introduction. The territory of the Crimea is considered as an area of pedogenically argillized Brown and Cinnamonic soils (Humic and Chromic Cambisols). However, the origin of the soils of the Crimean Mountains is not so clear, and their age is conjectural, because the problem of the Pleistocene mountain glaciation in the Crimea is controversial, the data on periglacial lithogenesis on the verge of the Pleistocene and Holocene is limited, and there is a lot of features in soils and soil combinations which cannot be reasonably explained by the concept of pedogenic argillization of soils. Over the recent decades pedology has recognised that many of soil features, originally considered as pedogenic, actually are of lithogenic origin. Our studies in the Crimea make it possible to discuss this problem as applied to the most important soil parameter, i.e. to the soil fine-earth fractions.
Materials and methods. The data was obtained by means of field soil-geographical methods during the four-year studies (1989-1993). Field works were performed on all chains of Crimean Mountains - the Main, the Inner and the Outer, and in mountain depressions and river valleys, and on the foothill plains. The primary attention was focussed on soil sampling along landscape profiles (catenas), and on the investigation of facial composition of loose Quartenary deposits and their vertical and horizontal contacts with hard rocks.
Results and discussion. The massive plateaus of the Main and the highest chain of Crimean mountains, composed of Mesozoic and early Cainozoic limestones with different contents of silicate admixture, are covered by dense networks of karst holes. Primitive and not fully developed soils, impoverished in fine earth fraction, prevail in the soil cover of this territory. Most of the karst holes are "closed". Their bottoms and walls are lined by stone free and non-calcareous loams and clays. Similar deposits occur at the bottom of large relief depressions. The composition of deposits, the lack of fine-earth products from the weathering of limestone on their surface, and the undisturbed character of soil and plant cover on the slopes of holes and depressions, as well as the absence of buried soils at the bottom, support the hypothesis of aeolian origin of such deposits and attest to the absence of erosional processes on the surfaces of plateaus since the end of sedimentation. The contact between loose deposits and hard rocks has an abrupt character and there are no features of paleopedogenic alterations in hard rocks. This bulk of evidence draws us to conclude, that the soil-vegetation cover on plateaus was completely destroyed before the beginning of aeolian sedimentation. In some profiles we observed the features of cryoturbations in loose rocks near the contacts. It testifies, that the accumulation of loose material was taking place in conditions of cold dry climate and ice-enriched permafrost. The ice of the permafrost layer provided for periodical water-logging of deposits, thus facilitating the further intensive adhesion of aeolian substances. Because of this, some small depressions were completely filled in and changed into positive elements of the relief. The net of small and large fissures in the eluvium of the main parts of plateaus is filled up by similar material of, probably, the same origin. Calcareous loamy-clay deposits occur only within the fault-zones and on weathering crusts locally altered by hydrothermal processes. Examination of the soil cover on plateau-like surfaces of the Main ridge assures us, that Crimean Mountains experienced a series of Pleistocene glaciations, which destroyed the previous soil and plant cover. The end of the Pleistocene epoch was characterised by periglacial sedimentation. As a result, the present-day soil cover is of relatively young, Holocene age. The results of field works on the lower and geochemically subordinated (at present or in the past) territories confirm this statement. The top surfaces of the Inner and Outer ridges have the debris of rocks, which are known only within the Main ridge. The evidence of moraine and
113
aeolian deposits were found within the intermountain and river valleys. Aeolian sediments in depressions are not covered by deluvial (colluvial) slope deposits. Therefore, the erosional processes under natural vegetation did not substantially influence soil cover formation in the Holocene. We can state that different components of soil cover have similar age. This makes possible the evaluation of "the input" of pedogenic processes in formation of the fine earth fractions during Holocene. The content of fine earth fraction in soils on hard rocks is low, and a considerable part of it has an aeolian genesis. Simple soils with not fully developed profiles occur in such places. However, such soils should be ascribed to the mature soils of the whole Holocene age, and they have undergone a durable transformation by hypergenic processes 'in situ'. The lithological, petrographical and texture composition of Quartenary deposits is very diverse. The multi-layered litho-profiles of soils, including the analogues of the so-called "texturally-differentiated" soils of the Russian Plain, are widespread in the Crimea. Such soils can occur in irregular combinations with non-differentiated soils under common plant cover. The content of clay may have the maximum value within any part of the soil profile or within the subsoil and we failed to detect the signs of migration of clay. The degree of weathering of debris fragments does not depend on the depth of their location in profiles. In any soil horizon debris can have any degree of weathering - from non-weathered rock to saproliths, and does not have the autochtonous "weathering films", and is always clearly separated from the fine earth. All these features testify that the fine earth fractions, including clay fraction, are inherited by the soil since the epoch of glacial and periglacial sedimentation, and have not substantially accumulated during the Holocene period. The characteristic time of pedogenic formation of fine earth fractions in conditions, similar to the present-day conditions of the Crimean Mountains, is very long. The fine-earth fractions cannot be reproduced by pedogenic processes under such conditions within the time, comparable in duration with the Holocene epoch.
114

Statistical Relationships Among Selected Properties of Ethiopian Vertisols and Associated Inceptisols.
S.SahlemedhiiT, B.P.K. Yerima and B. Teklu. National Soil Service Project, ETH/87/010, FAO, P.O. Box 5536, Addis Ababa, Ethiopia.
Introduction. Soil characterization data provide necessary information for conception of judicious agronomic management strategies. Predictive models developed from physical and chemical properties enhance the understanding of a soil system. These models can be developed from available soil survey data or from parameters that are easy to determine at little cost. Due to the relationships that exist between soil physico-chemical properties these models can be used in cross-checking the reliability and consistency of laboratory analytical data.
Despite the large amount of work done in this area in temperate regions (Wilding and Rutledge, 1966) very little information exists for similar studies in the tropics where fewer functional laboratories exist and where cost constraints limit soil characterization.
The objectives of this study were to develop regression relationships among physico-chemical data of some Ethiopian vertic Cryochrepts and Vertisols as a means to evaluate laboratory data quality and the unfavorable nutrient conditions.
Materials and Methods. Samples were collected from Vertic Xerochrepts, Cryochrepts and Pelloxererts which occupy undulating mountain foot slopes and flat plains in the Bale mountain area of Ethiopia; they have developed from basaltic and alluvial material on 0-10% slopes under an usticsoil moisture regime (mean annual precipitation of 800-1200 mm) and mesic soil temperature regime (mean annual soil temperatures approximately 8-14°C). The original vegetation on the mountain slopes and plains are Juniperus woodland savanna and various types ofacasia. Profiles were excavated to 1.5 m to 2 m. Pedons were described using standard terminology (FAO, 1990; Soil Taxonomy, 1975). Air-dried bulk samples were crushed to pass through the 2mm sieve. Particle-size distribution, CEC, exchangeable bases, EC, CaC03 percent, and pH were determined on the fine earth fraction by standard procedures (Soil Conservation Service, 1984). Organic carbon was determined according to Walkley andd Black. Total N was by the Kjeldhal method. Available-P was determined both by the Bray II and Olsen methods. Statistical analysis were done using Microstat(Ecosoft Inc. 1984).
Results and Discussion. Studies were done on 7 profiles, but only physical and chemical properties of representative profiles are presented in Table 1. The A horizons have dark brown colors due to the influence ofO.M contents, which systematically decrease with depth (Table 1). Calcium and Magnesium dominate the exchange complex. CaCO, contents occur at low profile depths indicative of
Table 1. Selected Characteristics of Representative Ethiopian Soils Studied Hori- Depth Clay OC N —CEC— Exch. cations BS Ca- EC —Avail-P— —pH 2:5— zon (cm) <2 urn Clay Total Na* K+ Ca-»» Mg++ C03 mS/ Bray Olsen KCl H,0
X cmol/c(-OKg' X X cm ppm— All - PELLOKERERT
Ap 0-30 42 2.02 0.168 70 36.5 0.57 2.31 13.18 3.36 52 0 0.18 1.68 1.62 4.56 5.94 AC1 30-95 72 0.70 0.083 70 52.9 1.50 2.94 21.44 7.63 63 0 0.32 1.16 0.68 4.68 6.36 AC2 95-165 73 0.12 0.014 66 48.8 1.80 2.40 25.62 9.11 80 4.2 0.40 1.76 0.51 5.11 6.97
AGARPA - CRYOCHREPT Ap 0-25 45 2.23 0.250 64 36.3 0.62 2.88 14.78 4.35 62 0 0.23 3.43 2.41 4.42 5.97 B1 25-50 70 1.16 0.117 67 50.6 1.22 3.98 26.14 7.74 77 0 0.29 0.99 0.81 4.52 6.14 B2 50-86 83 0.78 0.093 63 55.3 1.82 3.92 27.99 9.07 77 3.8 0.42 0.81 0.58 4.92 6.98 B3 86-160 57 0.46 0.060 91 53.5 1.73 2.42 31.90 8.60 100 3.0 0.39 0.84 0.27 5.38 7.18
lower leaching potential. Electrical conductivity and pH generally increase with depth probably associated with the CaCOj distribution. Available P-Olsen and P-Bray II and total Nitrogen for these soils generally decreased with depth suggesting that they may be associated with organic carbon content and distribution.
115

Statistical correlations among selected parameters are shown on Table 2. The dependent variables P-Olsen, P-Bray, pfi-KCl, TN, Base saturation and CaC03 are very important parameters for agronomic praaices. The regression models developed indicate that these parameters can easily be predicated from soil properties such aspH-HjO, EC, organic carbon and clay which can be found in most soil survey data or which can be determined at minimal cost. P-Bray is not highly correlated with organic carbon. This indicates that for base-rich soils this method is inappropriate. CEC was not highly correlated with clay or organic carbon which is strange. This may be due to variable mineralogical suit of these soils as indicated by the CEC/100 g clay values which range from 24 to 115 meq/100 g.
Table 2. Multiple and simple linear regression equations between P-Olsen, P-Bray, pH-KCl Nitrogen (TN). Base saturation (BS) and CaCO, and selected independent soil properties Soils'
Total of Ethiopian
Dependent Var. Intercept Coefficient Variable N r2
Linear (a) P-Olsen " 0.024 1.045 0C 24 0.773'
= -0.113 11.228 TN 24 0.698" P-Bray * -0.281 3.058 P-Olsen 24 0.423"
= 8.789 -0.097 Clay 24 0.317" pH-KCl • -0.0887 0.7738 pH-H20 24 0.921"
= 3.9287 0.3234 EC 24 0.698" « 4.5066 0.2825 Ca"03 24 0.645"
TN = 0.0201 0.0875 OC 24 0.898" BS =-34.5148 21.5364 pH CI 24 0.623'
=-47.699 18.3733 p' .0 24 0.697" CaCO, =-10.8436 1.9197 F 0 24 0.700"
= -9.6453 2.2835 1 I 24 0.645" Dependent Var. Intercept Coeff.CXD Var Coeff.(X2)
Multiple L )
Var.(X2) n P.* Var. Intercept Coeff.CXD Var Coeff.(X2)
Multiple L )
Var.(X2) n
P-Olsen = -0.042 0.879 0.079 B-Bray 24 .945" = 7.802 -0.028 0.753 pH-HjO 24 .575" = -1.590 0.019 1.216 OC 24 .845"
P-Bray -13.111 0.165 3.527 P-Olsen 24 .716" pH-KCl = 4.0192 2.164 0.159 CaCO, 24 .81...
= 3.4959 0.1738 BS 24 .750" CaCO, = -8.5297 1.6489 PH-H,0 -0.5486 OC 24 .727" *OC = Organic carbon; TN=Total nitrogen; EC= electrical conductivity; BS=I »se saturati .. = signi ficant at the 0.01 level; n=number of observations.
Conclusions. Given the well established relationships that exist among soil physico-chemical properties and the distribution of some with depth, development of regression models can be used as a tool to cross-check the reliability and consistency of analytical data in the laboratory. Development of predictive models illustrated in this paper provides a useful means to estimate agronomic properties of soils from existing and generally sparse physical and chemical data. This can serve as a means for technology transfer for established characterization data bases in developing countries with limited incomes.
Literature cited. Ecosoft, Inc. 1984. Interactive Statistics Package. North Sydney, 2060, Australia.
FAO, 1990. Guidelines for soil profile description. 3* Ed. FAO-ISRIC, Rome.
Soil Conservation Services. 1984. Soil survey lab. methods and procedures for collecting soil samples. Soil Survey Invest., Rep. No. 1. U.S.Gov. Print Office, Washington, D.C.
Soil Survey Staff. 1975. Soil Taxonomy Agri. Hb. No. 436. U.S. Gov. Print. Office, Washington, D.C.
Wilding, L.P., and E.M. Rutledge. 1966. CEC of soil as a function of organic matter, total clay, and various clay fractions in a toposequence. Soil Sci. Soc. Am. Proc. 30: 782-288.
116

Soil Structure Formation Mechanism in Clayey Horizons. Swelling Anisotropy and Slickenside Formation.
D. Tessier', J.C. Michel1, B. Bouzigues2 and J.C. Favrot2
'INRA, Science du sol, 78026 Versailles, France 2INRA-ENSA, Place Vialla, 34000 Montpellier, France
Introduction. The genesis of the structure of clayey soils, and consequently their hydrologie behaviour, are not very well understood. This paper aims at showing how the genesis of the vertic structure of soil clayey horizons of south-west France can be interpreted.
Materials and Methods. In south-west France, soils developed from old alluvial deposits of the Garonne river basin are frequently affected by hydromorphic conditions and soil survey studies have shown a large variety of facies distinguished mainly by the texture and structure of the clayey horizons. These soils are leached with a marked enrichment in clay at about 50 cm (B2tg horizon) and have a temporary perched water table [1]. Two main types of structure were observed associated with soil depth and with very small relief undulations (< 50 cm). The prismatic structure type occurs on the higher ground and the vertic type lower in the microrelief. The classical methods showed that the clay content of the argillic horizons ranges between 36 and 55 %. The nature of the clay is comparable i.e. interstratified illite-smectite clays with a slightly more smectitic character for the vertic facies. Exchangeable cations are mainly Ca and Mg with Ca/Mg between 2 and 4 for the two facies. The clay fraction and undisturbed fragments of the soils were embedded with an epoxy resin and microtomic sections were prepared for TEM examination [2], Oriented cores (200 cm3) were sampled in the B horizons of the soils for wetting and drying curves Wetting curves were carried out with water content ranging from air dry to saturation. The apparent volume and the water content were measured using a triaxial testing system designed to control both lateral and axial deformations as a function of the water content. During experiments an isotopic constant pressure of 10 kPa was applied at the sample periphery. Resolution of measurements was 1 mm3 and 0.1 kPa for volume change and lateral pressure, respectively. The change in the total pore volume can be followed in terms of either the void ratio (e) that is the ratio of volume of voids (Vv) to volume of solids (Vs), by the water ratio (9) which is the ratio of volume of water (Vw) in the pore space to volume of solids (Vs). The curves were complete after 1 week. Shrinkage curves were also made and the results were compared to wetting curves.
Results. In the vertic facies the variation in water content of the clods was accompanied by normal swelling in a large range of water contents (Fig. la). The volume change reached 25 % Similar behaviour was obtained with the shrinkage curve. In the prismatic soil there is no normal swelling (Fig. la) and the volume change does not exceed 3 to 5 %. The differentiation of the facies was also interpreted on the basis of the anisotropic character of the swelling-shrinking curves. In the vertic facies the magnitude of the total radial deformation was 10 % while the axial deformation did not exceed 5 %. After full hydration a fracture plane was systematically observed and its angle was close to 30° with regard to the horizontal. In the prismatic facies the deformation was also radial but very small (-1.5 %) and its axial component was absent No shear plane was found The observation of microtomic sections with TEM showed crystal aggregates, up to 2 urn in diameter, randomly oriented in the prismatic horizons. Iron oxides (goethite) sandwiching the clay
117

crystals were also clearly shown [2]. By contrast, iron oxides partly disappeared in the clay mass of the vertic horizon but the aggregate size remained close to that of the prismatic horizon. On the contrary, in the slickensides, clay crystal aggregates and even crystal units, strongly oriented face to face, were observed and iron oxides disappeared. Fracture planes crossing the clay matrix were also systematically present as seen through the TEM.
0,00
0.00 0.20 0,40
Water ratio
0.60 -10 J
Radial deformation (%)
Fig 1: (a) Swelling curves of the vertic and prismatic facies and (b) radial and axial deformation of the vertic facies during wetting and drying.
Discussion and Conclusion. The results described above clearly showed, that the presence of prismatic horizon was associated with different features: (1) little swelling and small horizontal deformation, (2) presence of iron oxides cementing clay aggregates and (3) an isotropic clay particle orientation as seen through the TEM. This organization gave rise to rigid like structures with small lateral volume change. The resulting soil structure was prismatic. By contrast the vertic horizon was characterized by (1) a partly deferrificated clay mass, (2) a large swelling and shrinking and, (3) large radial deformation but also a substantial vertical deformation This evolution from vertic to prismatic could be correlated to the micro-relief undulations of the soils Temporarily hydromorphic conditions appeared mainly in small depressions. As a consequence, iron oxides were dissolved. The resulting effect was the aptitude of the clay material to be compact in dry conditions and to absorb more water and thus to swell to a large extent in wet conditions Thus the swelling of the material was sufficient to provoke its rupture Because shear zones contained very small clay particles compared to those of the hole sample, shear effects appeared enough to cause clay particle division. Thus the passage from prismatic to vertic facies and the correlative hydraulic properties were mainly due to a change in the clay particle size and arrangement more than a change in mineralogy.
Literature Cited. [1] Favrot J.C., Bouzigues R, Tessier D., and Valles V. 1992 Contrasting structures in the subsoil of the boulbènes of the Garonne river basin (France). Geoderma, 53:125-137 [2] Tessier D., Bouzigues R., Favrot J.C., and Valles V. 1992. Influence of decimetric micro-relief on clay texture evolution of hydromorphic soils of the Garonne river Differentiation of vertic and prismatic structures. Comptes Rendus Acad. Sci. Paris, 315-11:1027-1032.
118

The Occurrence of Gilgai in Southern Africa
Theo H van Rooyen, Department of Geography, University of South Africa, Pretoria, South Africa
Introductioa Gilgai micro-relief, a repetitive pattern of mounds and depressions is a common feature of many clay soils of the seasonally-dry, warm-temperate to tropical regions of the world.
Various types of well developed gilgai occur extensively in parts of Australia, but have not hitherto been well studied or documented in southern Africa, although small isolated occurrences have been observed in South Africa, Zimbabwe, Botswana, etc. Two main forms of gilgai occur in southern Africa, viz the linear or wavy type and the normal or round gilgai. Only one occurrence of the linear type was studied and documented in southern Africa (Verster, de Villiers & Scheepers, 1973). In this study it has been shown that morphological, chemical and vegetational differences exist between crest and through situations in the micro-relief. The formation of this gilgai is ascribed to the swell and shrink properties of the predominant clay mineral viz montmorillorite.
Objectives. The objectives of the study of gilgai in southern Africa were: (i) to study the morphological, chemical physical and some engineering properties of the soils of the soils of the crests (mounds) and through (depressions) of an occurrence of well developed normal or round gilgai at Nylsvlei Nature Reserve: (ii) to establish relationship between soil-site characteristics of the linear type which occur on sloping land and the round gilgai which occur on level land of valley bottom situations; (iii) to compile a map indicating the occurrence of the different types of gilgai and associated soils in southern Africa; and (iv) to give some explanations for the development of the types of gilgai.
Materials and methods. Two pairs of soil profiles of which one pair was sited on a crest and the other in adjacent throughs at the Nylsvallei Nature Reserve. The soil materials were morphologically described and soil samples were taken and subjected to standard methods for chemical, physical and mineralogical analysis. Some engineering properties were also established to characterize the soil plasticity of mounds and throughs. Micro-relief difference between crests and throughs were measured in the field.
A questionnaire on the types and occurrences of gilgai and associated soils and its effect on cultivated crops was sent to experienced pedologists. This information was used to show the geographical distribution of gilgai in southern Africa.
Results and discussion. While the soils associated with both mound and trough sites of the round gilgai are vertic clays with several common features, the profiles of crests and troughs differ in some respect and can be readily distinguished by characteristic morphological, chemical, physical and some engineering properties. Soil-sit relationships clearly indicate that linear gilgai are always associated with vertic clay soils of very gentle mid- or footslopes whereas round gilgai can also develop on these slopes but reach maximum development in valley bottom situations. Apart from the influence of slope difference between the two types of gilgai it can also be concluded that the thickness of the vertic soil plays an important role in determining the type and degree of gilgai development.
The linear gilgai on sloping land is usually associated with dark coloured vertic horizons of the Arcadia soil form according to the South African Soil Classification System (Soil
119

Classification Working Group, 1991). The round gilgai of flat valley bottoms are
Credominantly associated with the Rensburg soil form which is a vertic topsoil underlain y a hydromorphic gley subsoil.
Notwithstanding the fact that soil and other conditions are seemingly favourable in so many situations, it is not clear why gilgai are so rare in southern Africa. It can only be speculated that a combination of factors involving specific temperature and rainfall characteristics, depth of soil, clay and water content, mineralogical composition of the clay fraction among others, are required. In the development of the two types of gilgai in southern Africa, the importance of slope and the age of the landscape cannot be neglected or underestimated.
Literature
1. Verster, E., de Villiers, J.M., Scheepers, J.C. 1973. Gilgai in the Rustenburg area. Agrochemophysica 4. 57-62.
2. Soil Classification Working Group. 1991. Soil classification - A taxonomie system for South Africa. Soil and Irrigation Research Institute, Department of Agriculture Development, Pretoria.
120

Topographic Control of Gilgai Soil Profile Formation I. V. Florinsky, E. A. Arlashina, I. V. Kovda, and E. G. Morgun. Institute of Mathematical Problems of Biology, and Institute of Soil Science and Photosynthesis, Pushchino, Moscow Region, Russia.
Introduction One of the most important factors of gilgai soil cover formation along with parent material and climate is mierore-lief. The temporal stability of gilgai miororelief has been found in previous genetio investigations (1,2). The formed mounds, mioro slopes and depressions keep their displacement for a long time. Redistribution of surfaoe water promotes to 1)formation of complex Boil and vegetation cover; 2) decreasing of vertio properties in soils of mounds and depressions. The depth of C and AC horizon has one of the most expressed morphological variations in
filgai soils. The depth of hor. C varies from 150 om in depression o 105 om in the mound; the depth of horizon AC - from 11 Oom to 20om respectively.
The study of miororelief influenoe on soil thiokness formation was undertook to establishing the main faotors determining the pedogenesis on gilgai.
Materials and Methods. Research was carried out in the Central Preoauoasus (Russia). Normal gilgai with an amplitude of 30-50 om and a wavelength of up to 3 m were studied. The soil oomplex included vertio meadow-bog soil in depressions, vertisol in slopes and vertio ohernozem in mounds. 13 surfaoe profiles were examined on the parcel 4 x 12 m with mioro topographic measurements in 20 om intervals. The depth of AC and C horizons was estimated by means of augering.
Methods of the quantitative topographio analysis (3) and the mathematical statistics were used for determination of mioro topography role in a gilgai soil oomplex formation.
Initial data were two digital elevation models (DEM) of the land surfaoe and parent material surfaoe (horizon C). Digital models of soil profile thiokness (M), horizontal (K, ) vertioal (K ) mean (H) and total aooumulation (K ) curvatures or C horizon sör-faoe were produced by processing o¥ these DEMs to estimate conditions of the lateral subBtanoe transport by gravity.
Results and Discussion. Signifioant linear correlation between M and K. , K , H, K of C horizon surfaoe was established. Correlation ooeffroients were* -0.79, -0.60, -0.73, 0.73 respectively. Relation ships between M and these land surfaoe oharaoteristios are less expressed. Therefore an internal substanoe movement in soil profiles is of considerable importance in gilgai soils thiokness formation. The Bolid substanoe redistribution along land surfaoe and other soil profile formation prooesses are of less signifioanoe.
The analysis of digital models of K,,K , H, K^allow to determine areas oharaoterizing by various trend! and intensity of geo-ohemioal prooesses.
121

Literature Cited. (1) Kovda I.T., Morgun E.G., Alekseeva T.V. 1992. Development of Abstr. 9th Int. Working Meeting on Soil Mioromorphology, Gilgai Soil Cover in the Central Preoauoasus. Eurasian Soil Soi. 24/6:28-45. (2) Kovda I.V., Morgun E.G. 1992. Mioromorphologioal Peculiarities of Vertisols in the Depressions, Mioroslopes and Mounds of Gilgai. Townsville, Queensland, Australia, p.61. (3) Evans I.S. 1980. An Integrated System of Terrain Analysis and Slope Mapping. Zur. Geomorfologie. Suppl. Bd. 36:274-285.
Acknowledgment8.This work was sponsored by Russian Foundation of Fundamental Researohes.
122

Carbonate Formation in the Gilgai Soils: Data by Carbon and Oxygen Stable Lsotopic Compositions
Ja. Roskov, s. Mergel, Ye. Morgun. Institute of Soil Science and Photosynthesis, Pushchino, Moscow Region, Russia.
Introduction. Stable carbon- and oxygen-isotope variations in the pedogenic carbonates reflect the different mechanisms and conditions of their formation (1). Our intent was to reconstruct the conditions and possible mechanisms controlling the CaC03 formation in the gilgai soils using 13C/12C and i»0/1B0 ratios.
Materials and methods. The investigations was carried out in the North-Caucasus (Russia) on the south slope of Stavropol upland, a region with a semi-arid climate. The soils along miorocatena of gilgai were examined. According to different moisture regime vertic chernozem was formed in the micromound, vertisol in the slope and meadow-bog soil in the microdepression. The parent material was marine clay deposits. Carbonate regime varies considerably along the transect: the accumulation ooours at the mound and the leaching takes place in the depression. Some part of carbonates were mechanical transported during1 pedoturbation. We examined the next carbonate forms: soft spots (I) consisting of some hard nuclei and loose material; soft spots (II) consisting of loose material; . hard hollow nodules; carbonate efflorencence inside mouse hole; small limestone clasts; soil with disseminated carbonate. We determined 13C/12C and 1B0/1B0 ratios of carbonate materials and 13C/12C ratio of plant organic matter. C02 for mass-spectrometry analyses was prepared from the carbonate samples by treatment with 100% H3P0^ at 25°C. Plants were pyrolized at 600DC in the presence of CuO (2). The isotopic composition is reported as Ö13C and Ö1B0 (per mil) relative to PDB and SMOW, respectively.
Results and discussion. Several generations of carbonates were distinguished by morphological evidences and isotopic composition (Table): A - soft spots (I), soft spots (II), disseminated carbonate, as well as hard nodule from the depth of 60 om; B -hard nodules, limestone clasts; C - carbonate efflorescence inside the mouse hole. Carbonates display average ö13C values substantially lighter then average for lithogenic carbonates (-1 to + 2 % o ) and much the same for plants in this site, reflecting the pedogenic origin of CaC03. The hard nodule replaced by pedoturbation in mound soil is more depleted in *-B0 and enriched in 13C with respect to hard nodules placed in situ deeper in other soils and its isotopic composition is similar to one of soft spots at a given depth. These facts suggest that replaced hard nodule was reorystallized at the surface conditions. The resemblance between the isotopic composition of limestone clasts and pedogenic CaC03 makes us believe that the first was reorystallized too. To reconstruct conditions and mechanisms of CaC03 formation we compared the experimental and theoretical data. Fractionation factors of isotopes for the freezing, evaporation and
123

Table. Isotopio composition of soil carbonates.
Samples Depth, cm
öi»0, / oo °/oo
Samples Depth, cm
ö«0, °/oo
öi3C, /oo
Hlcromound Soft spot I 13 26,0 -10,0
Mi oros lope Soft spot I 118
Soft spot II Soft spot II
28 55 90 Soft spot II
Soft spot II 110 Soft spot II 120 Soft spot II 143 Hard nodule 20 Hard nodule 60
25,3 25,5
32,2 24,3
31,3 Efflorescence 28 Disseminated carbonate 55 25,4
-8,8 -9.5 -10,2 -10,5 -9,7 -9,5 -11,6 -9,3
-12,6
-10,0
Soft spot I
Hard nodule
150
118
23,2 24,5 26,2 2~6TT
31,4
Soft spot I Hard nodule
Clasts
Uicrodepression 25,6 24,8
115 31,1
140
-11,5 -11,3 -10.1 -9,9
-11,2
-10,2 -10,0 -11 ,8
180 31,1 -10,3
Note: numerator - isotonic composition of loose material; denominator - isotopio composition of hard nuclei
transpiration (t=0,7,15, and 25°C) were calculated from equations (1). The 5i3C values of soil C02 were assumed to be the atmosphere (-7°/oo) in winter and a plants (-22,7 to -24,9°/oo) in summer; ö180 of soil moisture were assumed to be the weighted mean annual meteoric water (-9,0°/oo). The calculated limits on pedogenio CaC03 Ö«C are -14,9 to +7,4°/oo; the ö«0 are 21.0 to 30,8°/oo. A comparison of measured and theoretical data for C and 0 isotopes indicates that the CaOO, precipitation ïesults from dewatering due to evapotranspiration m isotopic equilibrium with soil CO- and water. The carbonate efflorescence was formed under conditions with more intensive evaporation of soil solution. The A-carbonate generation represents the modern stage of accumulation, whereas the B-generation was formed in equilibrium with isotopically heavier meteoric water. Perhaps, B-generation represents a relic. In the mound it is partially recrystallized under modern conditions after replacement during pedoturbation. Thus, 3 carbonate generations are distinguished. The most part of carbonate store has pedogenio origin. All generations were formed during evapotraspiration. There were at least 2 stages of carbonate accumulation.
References 1 .Marion G.M. e.a. The stable isotope geochemistry of CaC03 on the Tanana River floodplain of interior Alaska, USA: composition & mechanism of formation. Chem.Geol. (Isotope Geosci. Sect.),1991,86, p.97-110. 2.Swerhone G.. e.a. An economical method for the preparation of plant and animal tissue for Ö13C analysis. Commun. in soil sci.& plant anal. 1991, 22,3-4, p.177-190.
Present report was supported by Russian Foundation of Fundamental Sciences. Grant 93 04 6134.
124

Vertisols genesis and types at the Alora zone. Malaga. Spain.
E. Ortega, C. Asensio, C. Sierra, F.J. Martinez. Department of Edaphology and Agricultural Chemistry, Faculty of Pharmacy, University of Granada, Campus Universitario de Cartuja, 18071 Granada . Spain.
Introduction. The soils with a vertic nature in Andalusia (1),(2),(3) are distributed following the Guadalquivir river journey, from its source in Cazorla (Jaen province), to arrive the coast of Malaga, Cadiz, Seville and Huelva provinces, but we cannot omit its important distribution in the inner provinces such as Jaen, Cordoba or Granada.
The vertic soils distribution in the province of Malaga, according to the last published data by the Commission of the European Comunities (4), is not surveyed, neither studied, under detail. In this province (Fig n° 1), the vertic soils are located in three main areas: the first one is to the central part of the province, between Alora and Teba; the second area is located to the West of the province, between Estepona and the province limit with Cadiz and Seville; the third one, to the East, in the zone of Colmenar and Zafarraya. /v C ^ - ^ Q
Fig n° 1.- Distribution of vertic soils in the province of Malaga
Malaga
Materials and Methods. We made a photointerpretation over aereal photographs, escale 1:18.000, from CETFA, by using the Army Geographic Service maps (page 1.052, escale 1:50.000 from Alora). For the geologic data, we used a geologic map from I.G.M.E.(5).
Sixteen soil profiles with vertic characteristics were sampled in the area of Alora, according to the stratified method at random, Bridges and Davidson (6). For the classification, the F.A.O. system (7) and Keys to Soil Taxonomy (8) have been used. The soil analysis has been done following Métodos Oficiales de Andlisis del Ministerio de Agricultura (9) and Soil Conservation Service, USD A, (10).
Results and Discussion. With the idea of showing the vertic soil distribution, either for the neighbouring soil types, as a function of their topogaphic position, three transects have been done: the first one, with SW-NE direction. We located ten soil profiles, four of them show vertic characteristics ( orti-vertic Cambisol, sali-eutric Vertisol and two orti-eutric Vertisol) and they're developed on marls, clays and sandstones. The rest of profiles correspond to eutric Leptosols, calcaric Regosols and calcaric Cambisols.
The second transect has SSE-NNW direction, and we sampled seven soil profiles; two of them show vertic characteristics, but they belong to quite different soil types, due to their genetic characteristics. In front of an orti-eutric Vertisol, we found a verti-calcaric Regosol which is developed under aluvial fans such as a buried Vertisol, but its substratum is consumed by the same material type than the one for the orti-eutric Vertisol. Besides both vertic soils, there are represented calcic Luvisols, calcaric Regosols and calcaric Cambisols, keeping the calciric Fluvisols for the ones developed on Quaternary materials.
In the third transect ( S-N ), we located eight soil profiles, three of them present vertic characteristics (an orti-eutric Vertisol and two grumi-eutric Vertisols), developed again on the same materials. The other soil types are coincidences with the ones for the further transects.
125

The soils with vertic characteristics, which are present in the studied area, are developed in the greatest part on materials from the Aljibe unit (marls, clays and sandstones). They're Older Terciary materials, which are occupying low lands, and over them there is a deposition of Younger Terciary rests (Flysch). The materials which generate vertic soils belong to the Paleogene.
It's remarkable the salts presence in the central part of the area, which have conditioned the genesis of the developed soils on them, in a direct way. In the second transect, it appears a Quaternary material type (aluvial fans) that is doing a modification of the soils, more than generating them (Fig. n° 2) . . , v A__ ^
Oca.
M e m
• I ma 1
m 105 cm frr Entic Chromoxererts
Fig. n° 2.- Genesis of buried Vertisols T y p i c chromoxeret Thapto crhromoxercrtic
In the third transect, there are not vertic soils developed on aluvial fans, however a new material appears which becomes into a material able to generate soil with vectic characteristics; such a new substratum is constitued by clays and/or fosilifcrous marls. These materials, from the Lower Pliocene, are able to permit the Vertisols development in another zones as real edaphogenetic materials for those soils. This is the case of the developed Vertisols near the Estación de Cdrtama, belonging to the third transect, or the ones located in the Souther part (S and SE) of the studied area, where the main edaphogenetic material for vertic soils is clays and/or fosiliferous marls, in front of marls, clays and sandstones.
Literature Cited. (1) Commission of the European Communities. 1985. Soil Map of the European Communities. Scale 1:1.000.000. Directorate General for Agriculture, Office of Official Publication of the European Communities, pp. 85 - 96. Luxemburg. (2) Junta de Andalucia. 1984. Católogo de suelos de Andaluci'a. Boletin Oficial de la Junta de Andaluci'a. pp. 271. Sevilla. (3) Ortega, E; P&rraga, J; Fernandez, J. y Mann, G. 1983. Factores formadores de los suelos del sector Salar-Alhama (Granada). Rev. An. de Edaf. y Agrobiol. T. XLII. n° 11-12. p. 2.029-2.050. (4) Commission of the European Communities. 1991. Soil Survey: A basis for European Soil Protection. Soil and Groundwater Research Report I.Ed. J.M. Hodgson.. Directorate General for Agriculture, Office of Official Publication of the European Communities, pp. 214. : 85 -96.Luxemburg. (5) I.G.M.E. 1978. Mapa Geológico de Espafia. E. 1:50.000. Hoja 1052. Alora.Servicio de Publicaciones Ministerio de Industria. pp.71. Madrid. (6) Bridges, E.M., Davidson, D.A. 1982. Principles and applications of soil geography. Lougnan Group. Ltd. New York.U.S.A. (7) F.A.O. 1988. "Soil Map of the world 1:5.000.000". Food and Agriculture Organization the United Nations. Report 60. Roma. Italia. (8) Soil Survey Staff 1990. Keys to Soil Taxonomy. 4* Ed. SMSS Technical Monograph n°.19. Blackburg, Virginia. pp.422.USA. (9) Ministerio de Agriculture 1982. Métodos Oficiales de Analisis de Suelos y Aguas . Servicio de Publicaciones del M.A.P.A. pp.182 . Madrid. (10) Soil Conservation Service 1972. Soil Survey Laboratory. Methods and procedures for collecting soil samples. U.S.D.A. Dpto. Agric. Washington.U.S.A.
126

Vertisol Morphology: Similarities and Differences in Several Climates
D. Williams and W.C. Lynn. U.S. Department of Agriculture, Soil Conservation Service, Ft. Worth, Texas and Lincoln, Nebraska, USA.
Introduction. Vertisols have certain properties that are similar worldwide. They swell as they wet and shrink as they dry. They have at least 30 percent clay, nearly always dominated by smectites. The key process is swelling pressure generated and the clays wet (Lynn and Williams, 1992). If swelling pressure exceeds the shear strength of the material, shear failure occurs as one mass of soil overrides another. The shear surface, termed a slickenside, is the key diagnostic morphological feature. Its shape is concave upward as viewed from above.
Materials and Methods. Soils were studied in pits up to 20 meters long and up to 2.5 meters deep. Morphological segments (polygons) were identified and outlined with string on the pit wall. The pattern was copied to graph paper and subsequently entered into a Geographic Information System (GIS). Each polygon was described and sampled according to SCS standards and procedures (Soil Survey Staff, 1951; Soil Survey Laboratory Staff, 1992). Soils were studied across aquic, udic, ustic, and xeric soil moisture regimes and on landforms over bedrock on slopes exceeding 30 percent. Total clay, fine clay, and calcium carbonate equivalent were used as index properties for comparison. Photographs and GIS techmques were used to illustrate similarities and differences in morphology and corresponding soil properties for this poster paper.
Morphological model. Processes that result in characteristic Vertisol morphology start because water concentrates locally. Downward movement of water leaches carbonates if present, a non-swelling component, and thereby concentrates the swelling components. Deep percolation of water enhances swelling of clays. The pressure is relieved by shear failure as sections move upward and outward from the locus of swelling, analogous to a thrust fault in geology. The greater the wetting, the greater the swelling, and the greater the contraction upon drying; thus more and wider cracks tend to form in areas that were wet. The first rains after a dry period feed down cracks, particularly in the microlows, and wet the soil at the base of the cracks. More water means enhanced plant growth and accumulation of organic matter. Growing plants hasten the drying. Weight of the material causes the soil to settle as it dries. As the wetting and drying processes continue, material is pushed upward and outward to form microhighs. Microlows form in areas of maximum volume change. Ultimately, a gilgai microreliéf develops.
In a well-developed Vertisol, major slickensides form a bowl under the locus of water collection in the microlow. Major slickensides are horizontal in the center of the bowl and curve upward into the highs. As water moves down the cracks, it is diverted along slickensides that the cracks intersect and re-lubricates the shear surface. The configuration of major slickensides provide another mechanism to concentrate water in the bowl center or microlow. On level ground, a round bowl is probably a good approximation of the slickenside configuration. On sloping landforms, a system of
127

parallel ridges and troughs up and down slope may better approximate microhighs and microlows.
Results and Discussion. The bowl morphology first became apparent to the authors in a Perry soil, a wet Vertisol in Louisiana, where a major slickenside was exposed from a depth of 40 cm down to a horizontal base at 2 meters and up the opposite side. Trenches across cycles of gilgai in a Lake Charles soil (udic moisture regime in southeast Texas) and in a Leeray soil (ustic moisture regime in central Texas) illustrated the connection between the gilgai microrelief on the surface and the subsurface bowl morphology. The Sehorn sou in California developed on slopes up to 30 percent over mudstone that dipped at a steep angle and was highly fractured at the top. A trench on the contour showed cycles of shallow and deep soil development over the fractured bedrock. A trench up and down slope showed the effect of gravity on the shape of morphological segments (large structural units) and down slope movement of rock fragments at the base of the clayey materials.
A basic theme of subsurface bowl morphology carried through the entire suite of soils. The wet Vertisol had deep, steep sided bowls, with thrust shear clearly evident by smears of a lower red clay upward along a master slickenside into an upper gray clay. In the Udic soil, bowls were somewhat wider relative to depth than in the wet Vertisol, and the outline of bowls was accentuated by the re-distribution of carbonate. Round bowl morphology aligned with microlows in the surface gilgai. In the ustic soil, bowls were wide relative to their depth. In the xeric soil on slopes, the morphology indicated a ridge and trough configuration running up and down slope, rather than round bowls.
References. Lynn, W., and D. Williams. 1992. The making of a Vertisol. Soil Survey Horizons, 33:45-50.
Soil Survey Staff. 1951. Soil Survey Manual. USDA-SCS Agric. Handb. 18. U.S. Gov. Print. Office, Washington, DC.
Soil Survey Laboratory Staff. 1992. Soil survey laboratory methods manual, Soil survey investigations report No. 42. National Soil Survey Center, Lincoln, Nebraska.
128

Iron Sulfides and Pedogenesis in Alluvial Soils of the Late Holocene in the Coastal Area of Buenos Aires, Argentina
Margarita L. Osterreth. Centro .de Geologia de Costas y del Cuaternario, CC 722, C. Central, 7600 Mar el Plata, Argentina.
NTRODUCTON. i r on sul f ides a re common in sedementary rocKs, sediments, and soils associated with
fundamentally reductive t o weaKly oxidizing environments o f coasta l a reas, t idal marshes, bogs, and carbon beds, in Argentina, studies on irons sul f ides a re scarce. These sulf ides along with framboidal and polyframboidal p y r i t e in the sediments and fossil soils o f the Quaternary have merely been mentioned by Os te r r i e th (1998).
The object ive o f this paper is t he descr ip t ion o f the mineralogical cha rac te r i s t i cs and paleoenviron-mental implications o f the i ron sulf ides p resen t m coastal sedimentary sequences and their relationship with va r ia t i ons in the coasta l line o f the la te Holocene.
MATEFW.S AND METHODS. The sequence analyzed is found in the p resen t
abrasion shelf which occupies a 20 km extent ion and is a f f e c t e d by intense erosive p rocesses closely re la ted to shoreline encroachment ( O s t e r r i e t h and Schnack, 1984). (Fig.1). Cur ren t l y , th is sequence is partially o r enterely covered with dunes and/or sand.
The morphological character izat ion was completed following the c r i t e r i a establ ished by Soil Taxonomy F I G . 1 - Location mop of »tudy area (1975). Routine physicochemical methods were applied as well as mineralogical analyses by means of scanning electronic microsopy (SEM), d ispersal (ricroanalysis (EDAX), and d i f f ract ion X - ray o f powder samples.
RESULTS AM) DISCUSSION. SEM observation permits a clear visualization o f the morpholgical fea tu res o f iron sulfides.
Three types o f predominant morphologies were seen: a) massive irregular aggregates o f S t o 15 yumm diameter, b) framboidal i rregular aggregates, 10 t o 4 0 / i m in diameter, c) sub-c i rcular and elongated polyframboids, 50 yum wide and 120 yum long. All o f these a re r e l a t e d t o plant debris, either total ly or partially decomposed, silt, sand, and mic rocrys ta ls o f py r i t e . The microcrystals tha t compose these framboids are mainly octahedral and, t o a lesser ex ten t , cubical, bo th o f which measure between 0.5/jm and ^um. Most of the framboids are covered with a film tha t can be interpreted as remnants o f plant tissues, coinciding with observations made by Miedema et al (1974). Massive irregular aggregates appear f r e e o f film.
Results obtained by X - r a y s o f 3Ab2 level, show ref lect ions, barely defined, a t t r i b u t e d t o the py r i t e , o t h e r t o gre ig i te , a metastable s t a t e o f p y r i t e (Schoenen and Barnes, 1991). Quartz and feldspars are abundant, the l a t t e r , t o a lesser ex ten t . (Fig.2).
The semiquantitative chemical study (EDAX) per formed on the aggregate material registers between 28/ and 427.
55 50 45 40 35 30 Q-Quartz — P-Pyrite — G-Greigite
F - Feldspar FIG.2-X ray ditfroctlon Cu Koc
radiation (degree 2 6 )
129

o f t o t a l su l fu r , and between 65.6 and 58.r/. o f iron.(Fig.3) The re la t i ve est imate indicates a g r e a t e r abundance o f
framboidal p y r i t e a t t he 3Ab2 level, coinciding with t h e larger plant debris content. The presence and conservation o f p lant debr is in t he middle and lower sect ions o f the sequence (3Ab2 t o 4Cgb2) indicate t h e pers is tence o f a brack ish, reducing t o sl ightly oxidizing environment where massive irregular aggregates and iron sulfide framboidals a re generated, the l a t t e r being o f secondary origen (Pons, 1964).
The ox idat ion o f i ron sul f ides would be quant i ta te ly p rogress ive with t h e passing f r o m a b rack ish t o a f r e s h water environment f r om the bot tom t o the top o f the sequence, t o which t he presence o f iron oxides observed a t the 3Ab2 level are added, a process which f a v o r s t he t r a n s f e r o f oxides by means of ptent r oo t s , bioturbations, s torms, e tc , in regressive phases.
The relationship between origin, evolution, and presence o f i r regu la r aggregates o f i ron sulf ide and environemental evolution o f the sequence analyzed f o r t he la te Hoiocene is presented in the following char t :
L
HORIZONS ENVIRONMENT SHORELINE» SULFDES i FRAMBODAL PYRITES
L Present Beach/beach sed. Weak oxlc Advance Oxidation o f p y r i t e in 3Ab2 A cover sequence Precipitation via: SFe amorph.» T greig i te-»fram. pyr i te sec. & E tere. m 3Ab2 & 3ACgb2.
2Ab1 Pedogenesis Oxic Recede Oxidizing o f p y r i t e m 3Ab2 H &3ACgb2 O 2Cb1 Coastal lake Anoxic Formation o f sec. & let-.pyri te L O C
Erosion Weak oxic Advance Oxidizing o f p y r i t e in 3Ab2 L O C 3Ab2 Pedogenesis+Veg. Weak oxic Recede Formation o f pyr.via: Amor ph. E N E
3ACgb2 •Filling SFe-»gr eigite-^sec.pyri te E N E 4Cgb2 Coastal lake- Anoxic Advance Primary pyr i te(?)
swamp
*S Shoreine: Advance upon continent . regressive beach phase. Recede - sea withdraws
LITERATURE CfTED MEDEMA, R., JONGMANS, A.G. & S. SLAGER, 1974. Micromorphological observat ions on p y r i t e and i ts oxidation products in f ou r hoiocene alluvial soils in t h e Nether lands. G. R. R u t h e r f o r d and The Limestone Press. 772-794. OSTERRETH, M. & E. SCHNACK, 1984. El per f i l de Mar de Cobo (part ido de Mar Chiquita, Buenos Aires). Caractertst icas de sus paleosuelos y posibles corre lac iones. Simp. Oscilaciones del nivel del mar du ran te el ultimo hemiciclo deglacial. Actas: 101-117. OSTERRETH, M.L.,1992. Pirita framboidal en secuencias sedimentarias c o s t e r as del Holoceno tardto en Mar Chiquita, Buenos Aires, Argent ina. IV Reunion Arg . de Sedimentol. T.ll: 73-80. PONS, L.J., 1964. A quantitative microscopical method o f p y r i t e determinat ion m soils. Proc. Micromorph. Symp. Arnherm A. Jorgerius, Ed.: 401-409. SOL TAXONOMY. 1975 . Agric. Handbook: 436. 754 p. SCHOONEN, A. k L.H BARNES., 1991. Reactiond forming p y r i t e and marcasi te f r o m solut ion : I. Nucleation o f FeS2 below lOOoC. Geochimica e t Cosmochimica Acta. 55: 1495-1504.
• - S u l p h u r * — F - I r o n
F I G . 3 - E O A X
130

Influence of vegetation on soil formation of sandy soils in Denmark.
N0rnbcrg, P., Department of Earth Sciences, University of Aarhus, DK-8000 Aarhus C, Denmark.
Introduction. Already in 1884 P.E. Muller (2) described the differences between soils developed under oak shrub (brown forest soil) in Denmark, and the soil developed under the surrounding "sea of Calluna" (podzol). The present paper shows that changes in vegetation at Hjelm Hede, Denmark produced marked alterations in well-developed podzolic soils (Haplorthods) after only 60 to 70 years. Fluvioglacial sand mainly covered by heather Calluna vulgaris and crowberry Empetrum nigrum was invaded by oak Quercus robur and a few aspen Populus tremula. Other heath areas not taken over by the natural succession of deciduous trees were afforested with Norway spruce Picea abies and sitca Picea sitchasis. Field evidence and basic laboratory data reveal a "depodzolisation" of the soil under oak and an increased podzolisation and change in the podzolisation process under spruce.
Materials and Methods The Hjelm Hede area is a fluvioglacial sandy mcltwater plain from the late Weichsel (10.000 B.P.). The mean annual precipitation is 650-700 mm yrv and actual evapotranspiration about 375 mm yr"1. Mean annual air temperature is 7.5° C. The area belongs to the northern type of Calluna-Vaccinium heathland described by Gimmingham (1).
Results and Discussion Visible soil changes related to the transition from heather to oak, also reported by Nielsen ei al. (3), were as follows: decomposition of the Oa horizon, which can no longer be distinguished, a less distinct E horizon under oak due to biological mixing of organic matter, and the almost total obliteration of the Bh horizon. The transition from heath to spruce resulted in an increased accumulation of organic matter in the O horizon and a resultant 15 cm thick layer of needles. The E horizon was disturbed because of the ploughing before the trees were
Figure 1 Figure 2 Figure 3 pH H20 Organic carbon % C/M-ratio
- • - Oak — Haa*-< -•*- ©puca | I -—- 0*k — - Haathar-*»-3pruca | | " • - Oak —*~ H—Ww*»-- Spruoa \
131

planted. The Bh horizon had developed tongues down into the Bs, which was cemented in its upper part. This was the only profile in which a placic horizon was found. The texture of the parent material in all profiles was mainly sandy. The pH had increased 0.8 of a unit in the top horizon under oak and decreased almost a whole unit in the top horizon of the spruce profile (Fig. 1). The organic carbon content is now only 10 % in the top horizon under oak as against heather 29 %, and more than 42 % under spruce (Fig. 2). The carbon content in the E horizon under oak is 1.3 % due to the biological mixing as against 0.7 % under heather. It is 1.8 % under spruce but this can be related to ploughing before planting. However, it is remarkable that the carbon contents in the B horizons under oak and heather are almost identical, whereas it is significantly higher in the B horizons of the spruce soil. The C/N-ratio decreased under oak, but increased significantly under spruce (Fig. 3). The pyrophosphate extractable iron content is concentrated in the Bhsm horizon of the spruce profile, but is very evenly distributed under oak. The pyrophosphate extractable aluminium, though high in Bhsm, is significantly lower in the B horizons of the spruce soil than under oak or heather.
It is remarkable that the content of Table 1. Total content of iron, aluminium and organic pyrophosphate extractable iron and carbon. aluminium is so low in the B horizon of the spruce soil (Table 1). Probably the aluminium was lost under spruce because the tH was below the pK of most of the carboxylic groups of the organic matter. Soil water analyses show that most of the iron is repre-cipitated in the profile, whereas there is quite an important net loss of aluminium. Mineralogical analyses of the soils show that the three profiles are all strongly weathered. However, although the period of 60-70 years was long enough to let the vegetation cause visible and measureable changes of the soil profiles, the period was not long enough produce a similarly clear mineralogical response.
Literature Cited
(1) Gimmingham, C.H. (1972). Ecology of Heathlands. Chapman and Hall, London. 266 pp. (2) Miiiler, P.E. (1884). Studier over skovjord, som bidrag til skovdyrkningens theori. II: Om muld og mor i egeskovene og pa heder. Tidsskrift for Skovbrug. 7: 1-232. (3) Nielsen, K.E., Dalsgaard, K. and N0rnberg, P. (1987). Effects on Soil of an Oak Invasion of a Calluna Heath, Denmark, I. Morphology and Chemistry. II. Changes in Organic Matter and Cellulose Decomposition. Geoderma 41: 79-106.
Vegetation
Pyroph. extr. below E horizon
DCB extr. below E horizon
Org .C tod. O horizons
Org.C below E horizon
Vegetation
Fe Al Fe Al
Org .C tod. O horizons
Org.C below E horizon
k g n . '
Oak 1.3 2.0 3.» 2.5 14.S 6.4
Heather 1.2 2.1 3.7 2.7 19.6 6.2
Spruce 0.6 as 4.3 3.2 72J 7.2
132

Some Characteristics of the Frigid-Temperature Zone Coniferous Forest Soil in Northeast China
Bo-Qun Lin. Forest Soil Research Laboratory Box 317, Hexing Road # 8, Harbin 150040, P.R. China.
INTRODUCTION. The frigid-temperate coniferous forest region is located in the northeast part, of Great Xinganling mountains ( geographical situation N 51-54 , E 120-127°), which is above the sea leavel 300-1400 meters. Over there the permafrost; table exists under the soil surface at the depth of 0.3m or more. The weather is bitter cold. The forest soil has dark brown to brown color profile and with a peaty 0 horizon ( 10cm), shallow solum ( 100 cm), stony, pH «5, large amount of Pe+2. This soil used to be called Mt. Podzolic soil (1930-1951), Brown podzolic soil (1956), Podzolic soil (1978) by some soil scientists as it was not deeply studied and well recongnized. So it is necessary to study on 1. The soil genetic characteristics; 2. The main factor of soil podzolization; 3. The coniferous forest soil region of northeast China in comparison with the corresponding region ±ïi northeast part of north America where the Podzol is widespread.
EXPERIMENTAL DESIGN. 1.Studies on the dynamic variations of the soil properties under the coniferous forest in northeast. China. 2. A laboratory leaching experiment was used to simulate natural soil forming process under coniferous forest. 3. Comparative study on the Podzol region in upper Michigan forest of USA using pairing method.
RESULTS AND DISCUSSION. 1.According to the dynamics studies of the Brown coniferous forest soil site, there is a special translocational pattern of materials, that is free iron oxide reversible migration. The free R203 varies with the soil temperature as shown in the Figure. The total amount of R203 in each horizon differentiated from Spring to Autuman. But there is a translocation tendency of R203 to accumulate"; at the upper layer in October. At that, time the soil surface began to freeze. So the free R203 was dehydrated from the soil sal-nfcian andraccumulate at the soil subsurface.
0.0 10.0 20.0 30.0 * / 3 0 7 / 3 0 t / M 9 / 2 3
•Mta/daM
0.0 2.0 4.0 CO 1.0 10.0 « /30 7 /1» 1 / 4 1/27 9 /17 10/13
• M k / d a M
Fig. Dynamic* curvet of Soil Temperature (C) and R203(%) in Tree Growth Period in Brown Coniferous Forest Soil
133

The chemical analysis showed that the main composition of the R203 is Fe, but the Al is more stable in the soil. 2. The simulating experiment showed that after 42 months, two artificial soil columns have developed into two different, soil 'profiles'. The original soil color (7.5YR3/2) of the soil aoJLiamn covered by mosses was changed to gray (10YR4/1) in the epipedon at 0-3cm depth, while the subsoil (3-18cm depth) became red (2.5 YR4/6). The spheroidal structure of the soil in this column also disappeared. In the other soil columncovered by the coniferous needle no change in soil color and soil structure was observed. All chemical analysis data of soil column leacheato; soils; plant tissues; free Si, Fe, Al; X-ray diffractioii pattern and electron-microscope of clays minerals; organic functional groups of aqueous extracts of needles and mosses proved that the lower plant, mosses layer had stronger cheluviation effects on the soil and greater leaching losses of Al than the coniferous needle. 3. The results of comparative studies showed that, the soil forming condition and the soil properties of this soil region are different from that of WE America upper Michigan forest region. The important soil forming factors are listed in the following table.
location Annual average
T°C
Average Frost-free ppt. season
arm summer (mm) (days)
Permafrost layer
Parent material
SB China -4.5 Daxingling (mountainous)
435 399 82 yes rock weatheri] deposite
ÏTE America 7.2 upper Michigan (plain)
791 127 no glacial sand
The diagnostic horizon of Podzol is spodic horizon; but the Brown coniferous forest soil has no this horizon. The diagnostic properties of Brown coniferous forest soil is that in soil solumn has a large amount of soluble ferrous compounds; but these compounds could not be found in Podzol.
LITERATURE CITED. (1). Lin Bo-Qun 1992.The Main Forest Soil Geography of China.
"Modern Forest Management and Forest Soil Potential",p.78-95, International Academic Publishers.
(2). Lin BO-Qun, Wang Zhen-Quan 1986. The effects of Forest Floor and Mosses under A Coniferous Forest on the Soil Forming Process. "Tracsactions, XIII Congress of the ISSS",p.1190-1191, volume III.
(3). Lin Bo-Qun 1990. The Characteristics of Forest Soils and Forest Productivity in the Main Forest Regions of China. Proceedings of 1st International Symposium on Forest Soil, p.86-92.Publishing House of Northeast Forestry University.
134

Studies on the Soils of Minicoy Island in India -Modelling a Pedogenetic Rarity
S.Vadivelu and A.K.Bandyopadhyay, Central Agricultural Research Institute, Port Blair 744 101, India.
Introduction. Dokuchaev gave a genetic definition to soils. Later on, Jenny (2) proposed a factorial model for soil system as: S = f (cl, o, r, p, t....). Since then pedologists world over had been developing models to explain the processes operative in soil system (1, 3). All these models explain the processes acting on commonly occurring mültimineral parent rocks of various ages and recent alluvial deposits to produce soil. But, what happens when the parent material is of single mineral, that too coral sand of organogenic calcium carbonate with very low quantity of elements like Si, Al, Fe and K. One such natural system existing in Minicoy is taken for the present investigation to develop a pedogenetic model.
Materials and Methods. Minicoy is one of the atoll islands of the Lakshadweep group in the Indian Ocean. It lies between 8° 15' - 8° 20' north and 73° 01' - 73° 05' east with 4.4 km2 spread. The island is flat rising 2 to 3 m above the sea level with no drainage channels. The climate is tropical with an annual rainfall of 1728 mm. The top of the island is built of coral reefs from late tertiary time to the present. Seven soil profiles were studied in a transect from west to east to represent the soils differentiated visibly by plant communities. The soil samples collected horizonwise were analysed for organic carbon, CaC03, Si02, R2O3 and K2O.
Results and discussion. In the western part of the island (pedon 1 & 2) where the deposition of coral sands is active the soils are light coloured and sandy throughout the profile (Table). When we proceed eastward, the colour of the surface soils darkens due to addition of organic matter. The texture of surface soils changes to loamy sand in the central part (pedon 3 & 4) and sandy loam in the eastern part (pedon 5,6 & 7) while the subsoils remain mostly sandy. In addition, formation of weak structural aggregates was observed in the surface soils of the eastern part. Besides these changes in morphological characteristics, there is a general increase in the content of organic carbon with concomitant reduction in CaC03. The content of Si02, R2O3 and K2O, though very low, correspond to the distribution of organic carbon explaining their origin through plant remains. The plants growing in the CaC03 medium can get these elements only from the shallow (90 -150 cm) ground water whose ionic composition is greatly influenced by the laterally permeating sea water during high tides. These alterations in the suface soils, progressing from west to east, are taken for pedogenesis because they lead to horizon differentiation and change in composition of soil solution. Not many, but a few processes like additiion of organic matter, loss of CaC03 and soluble salts and addition of elements other than calcium are involved in making these changes. The factors that contribute to these processes are organism and water (rain water + laterally seeping sea water). The soi Is, therefore, are a function of organism (o) and water (w). The pedogenetic model can be expressed as: S = f (o, w). Though the model resembles Runge's energy model (3) the soils
135

Characteristics of the soils of Minicoy
Pedon Colour 10 YR Texture Structure CaCCb
(%) o.c. (%)
S1O2
(%) R2O3 (%)
K2O (ppm)
1. a 7/3 sand sg 100 0.45 0.94 0.81 55 b 7/3 sand sg 99.5 0.26 1.05 0.65 49
2. a 5/3 sand sg 98.3 0.63 1.08 1.07 50 b 7/3 sand sg 98.9 0.40 0.82 1.15 51
3. a 4/3 Is sg 92.3 0.73 3.07 1.88 55 b 7/3 sand sg 98.3 0.54 1.68 0.82 52
4. a 4/3 Is sg 95.0 0.98 2.72 2.95 87 b 7/3 sand sg 95.9 0.62 1.86 1.59 54
5. a 4/3 si l f sbk 96.1 1.06 2.79 3.76 114 b 7/3 Is sg 96.1 0.84 1.85 1.60 68
6. a 3/3 si l f sbk 91.3 2.01 2.20 3.88 161 b 7/3 sand sg 95.2 1.19 2.19 1.84 53
7. a 4/3 si l f sbk 92.3 1.59 3.55 3.76 136 b 7/3 sand sg 95.3 1.00 2.41 1.59 54
(a: surface horizon; b : mean of subsoil horizons; ls : l oamy sand; s i : sandy loam; ; sg: single grain;
of Minicoy present a unique pedogenetic environment different from those commonly observed. Soil formation in Minicoy is a pedogenetic rarity dominated by the two factors, namely, organism and water. The soil characteristics and the pedogenetic environment do not substantiate the contribution of other factors, namely, parent material, relief and time to any extent.
Literature Cited
(1). Chesworth, W., 1973. The residua system of chemical weathering : A model for the breakdown of silicate rocks at the surface of the earth. J. Soil Sci. 24 : 69 - 81.
(2). Jenny, H., 1941. Factors of Soil Formation. McGraw-Hill, New York, N.Y., 281 pp.
(3). Runge, E.C.A., 1973. Soil development sequences and energy models. Soil Sci. 115 :183 -193.
136

Organic matter in podzol-B horizons -changes with profile development
P. Buurman and W. Zech. Dept. of Soil Science and Geology, Agricultural University, P.O. Box 37, 6700 AA Wageningen, The Netherlands, and Dept. of Soil Science and Soil Geography, University of Bayreuth, P.O. Box 10 12 51, W-8580 Bayreuth, Germany Introduction. Podzols on sandy parent materials in the Netherlands and Belgium show the following changes with time in the upper B horizons: a) and increase in the C/sesquio: > ratio in the pyrophosphate extract; b) an increase in the Al/(A1+Fe) ratio in the paryphospha^ extract; c) a decrease in pH. In addition, the exotherms of untreated samples, observed in Differential Scanning Calorimetry have maxima that shift to higher temperatures with increasing Al/(A3+Fe) ratio (Mokma & Buurman, 1982; Buurman, 1987; Buurman et al., 1992). The question arises whether the changes in complexation of metal ions and the change in the relative amounts of Al and Fe bound to the organic matter, are accompanied by changes in organic matter chemistry.
Materials and Methods. 6 Bh and Bs horizons from 3 well-drained podzol profiles (NL 101, NL 104 and NL 110) and 6 Bhl and Bh2 horizons from 3 hydromorphic podzols (B 102, NL 103 and NL 108) of different development stages, that were used in the publications cited above were extracted with NaOH (lOg of sample to 50 ml 0.5M NaOH). The suspension was sonicated for 1 minute, after which the suspension was centrifuged for 1 hr at 5000 rpm. After decantation of the solution, the residue was extracted with 20 ml 0.5 M NaOH. The combined extracts were dialyzed against deionized water and freeze dried. The freeze-dried material was analyzed by liquid state 13C NMR and 'H NMR. Samples from Ah, E, and B horizons of one hydromorphic (B 105; horizons Ah, E, Bh, Bs, BC) and one well-drained profile (NL 110; horizons Ah, El, E2, Bhl, Bh2, Bhs, B, Bh3) were analyzed in the same way.
Results. The extracted carbon of the various B horizons was between 34 and 87% of the total carbon. Lowest values were obtained in the Bhs horizons. In the complete profiles, the extracted carbon was between 35 and 40 % for the Ah and E horizons, and between 62 and 84 % for the Bh horizons. Both the hydromorphic and the well-drained podzols show an increase in aromaticity and a decrease in carboxylic C and H with increasing C/sesquioxide ratio of the pyrophosphate extract, and thus with increasing profile development. The r2 values of the relations were: C/sesq versus aryl-C, 1^=0.52 in dry podzols, 0.89 in hydromorphic podzols; versus aromatic-H, 1^=0.81 in dry podzols, 0.86 in hydromorphic podzols; versus carboxyl-C, 1 =51 in dry podzols, 0.26 in hydromorphic podzols; versus carboxyl-H, r=0.81 in dry podzols, 0.84 in hydromorphic podzols. The increase in aromaticity in both cases matches the decrease in carboxylic groups, although the level is different in well-drained and hydromorphic profiles. The other C- and H- groups so not show any great changes or consequent behaviour.
13C NMR and 'H NMR of the well drained podzol (NL 110, see table) show a marked increase in aromatic C, and especially aromatic H in the B horizon, with a maximum in the upper Bh. The aromaticity in the Bs is at the same level as in the Ah and E horizons.
137

Polysaccharide-C and H were lowest in the Bh2 and had a maximum in the Bhs. Carboxylic-H decreased slightly from the Ah to the Bhl horizon and had a maximum in the lower B (B, Bh3). In the hydromorphic profile (B 105, sec table), trends were similar to those in NL 110, but aliphatic carbon and hydrogen are more important in this profile and aromatic structures less dominant. This is especially clear in the hydrogen distributions.
Conclusions. In the organic matter of podzol-B horizons, aromatic structures increase with (time of) development, while carboxyl groups decrease. Aromatic substances are especially abundant in the upper Bh horizons, while carboxylic groups show a maximum in the lower B. Trends in well-drained and hydromorphic podzols are similar, but aliphatic carbon and hydrogen is more abundant in hydromorphic podzols, while aromatic groups are more important in the well-drained ones.
Table. Carbon and hydrogen distributions in profiles NL 110 and B 105 (NMR)
carbon distribution hydroRen distribution
horizon sample alkyl o-alkyl aryl o-aryl COOH CH2/CH3 COOH polysach atom.
NL 110
Ah 212 12 20 41 7 21 33 18 25 25 El 213 IS 16 44 6 20 28 17 27 28 fiber 214 13 17 43 6 22 27 IS 26 33 E2 215 . . . Bhl 216 8 9 47 10 25 17 12 17 54 Bh2 217 8 8 54 8 22 24 17 11 48 Bhi 218 10 14 40 7 29 21 23 29 26 B 219 16 19 36 6 24 25 29 19 27 Bh3 220 13 12 44 7 24 24 24 17 35
B 105
Ah 234 19 17 36 6 22 41 16 27 16 E 23S 22 21 33 7 18 44 22 19 15 Bh 236 17 18 39 6 20 33 19 19 29 Bhs 237 16 14 32 7 30 27 29 22 21 BC 238 20 21 29 5 25 34 30 19 17
Literature Cited. Buurman, P., 1986. pH-Dependent character of complexation in podzols. In: D. Righi & A.
Chauvel: Podzols et Podzolisation, 181-186. Inst. Nat. Rech. Agron/AFES.
Buurman, P., J.D.J, van Doesburg & M.L. Fernandez Marcos, 1993. Changes in thermal properties of podzol-B organic matter with profile development. Proceedings 6th Int. Meet. Int. Humic Substances Society (Bari, Italy, 1992), in press.
Mokma, D.L., & P. Buurman, 1982. Podzols and podzolization in temperate regions. International Soil Museum Monograph 1:1-137. Wageningen.
138

The main characteristics of soil formation on calcareous rocks of the Globe
D.Konyushkov. Dokuchaev Soil Institute, 7 Pyzhevski Lane, Moscow, Russia.
Introduction. Soils on calcareous bound parent rocks are widespread throughout the Globe, and are studied in a broad spectrum of bioclimatic conditions - from humid tropics to polar deserts. In our studies we tried to clarify the main regularities of bioclimatic diversity of soils on calcareous bcund rocks.
Materials and methods. The review of published materials and the original data on calcareous soils of permafrost affected landscapes of Middle Siberia were put as the basis of the general scheme of ecology of calcareous soils. The lithological component of the scheme encompasses not only the class of calcareous sedimentary rocks proper, but also the other genetic types of rocks, which contain calcarccus minerals in amounts sufficient to be easily detected in field visually or by simple chemical tests. To elaborate there was the preliminary classification of calcareous bound rocks, applicable in penological studies, based on such substantive characteristics of rocks, (instead of primarily genetic approach to geological classifications), which enable us to predict the peculiar features of pedogenically induced alterations of rock composition under certain bioclimatic conditions. The following criteria were used to determine the taxonomy of calcareous bound soil parent material: Classes - % of calcareous minerals in 'fine fraction or in rock fragments (for skeletal and fragmental soils): 'calcareous'(>95%), 'silicate-calcareous'(50-95%), 'calcareous-silicate'(5-50%); Subclasses - mineralogical composition of calcareous minerals: 'calcitic', 'dolomitic', 'mixed calcitic-do:; mine'; Groups - predominant grain size (texture): 'sandy', 'clayey'; Subgroups - mineralogy of silicate compounds and the content of fine minerals in them: 'rich' (polimictic sands; hydromicas-smectitic, chlorite-smectitic, ashy-allophane clays), 'poor' (quartz, quartz-K,Na-feldspar, quartz-siliceous sands; hydromicas-caolinitic clays); Types - content and composition of non-calcareous and non-silicate minerals: 'salty'.'ferritized','carbonized'; Subtypes and lower taxa can be distinguished according to specific petrographic features of rocks (porosity, bulk density, plasticity, the character of crevices, etc.). Bioclimatic component of the matrix presents the information on thermal resources and the degree of humidity /or aridity/ of climate. Biotic peculiarities are reflected in the names of the main types of vegetation. The matrix also accounts for relief and drainage conditions, the sources of additional supply of soil with water (springs), the presence and the character of permafrost.
Results and discussion. The analysis of the matrix enables us to formulate the main laws of soil formation on calcareous bound rocks as follows.
1) The degree of bioclimatic reflectority (the ability of soils to reflect in their properties the ifferences of bioclimatic conditions) depends upon the character of rocks. The minimal reflectority is inherent in soils on 'pure' monomineral calcareous rocks which do not exhibit the pedogenetic alterations of their mineral composition and can be differentiated only on the basis of their organic profile and the character of organo-mineral interactions. However the latter substantially vary -from surface accumulation of weakly and semidecomposed plant tissues in humid and relatively cold conditions, to the formation of Ca-humus microaggeregates in landscapes with the optimal ratio of moisture and heat supply, and to the specific 'xeromorphic' organic accumulation in forms of intra-soil accretion of phytodetrites, Ca-humus compounds and inert coal-like mineralized particles in arid continental climates. The maximum reflectority is observed in soils on calcareous-silicate rocks, enriched with weatherable minerals. The processes of weathering, esp. in humid climate, can substantially change the initial composition of rock due to the leaching of soluble compounds, mobilization of iron out of Fe-containing minerals and its accumulation in oxalate-dissoluble amorphous forms in humid conditions or in dehydrated, predominantly dithionite-dissoluble forms in arid conditions, etc. Therefore, the ecological spectrum of such soils is larger, than that of the previous group, and the pedogenically induced changes in their mineral
139

composition together with the character of organic profile should be obligatory taken into account when classifying these soils. 2) The maximum diversity of autonomous soils, associated with the initial composition of rocks is observed in humid conditions. Pedogenically induced alterations of different rocks in arid conditions have similar accumulative trends and are expressed to a smaller degree, due to the lack of water movements, which can be termed as 'drive forces' of any changes in soils. However, the alterations of rocks in arid climates can be markedly expressed in soils, influenced by additional water supply. Usually these alterations have the character of accumulation of dissoluble mineral components on evaporation barriers. The type of secondary accumulations depends on the character of soil-forming and subsoil rocks within the drainage basins. Therefore, the heteronomous soils of arid landscapes have the greater variability llian the autonomous ones.
3) The specificity of pedogenic functions of calcareous minerals inherent in rocks, considerably varies and depends on bioclimatic conditions, as demonstrated by the following table.
Pedogenic functions of calcareous minerals Soil regions
humid subarid arid
Neutral-alcaline buffering
Restraining of the eluviation
Geochemical barrier
Saturation of soil absorbing complex
Stabilization of colloid complex
Structurization of the soil mass
Conservation of plant residues
Formation of Ca-humus complexes
Cementation of the soil mass
Surface crust formation
Inhibiting of gley processes
Protection of nutrient-containing
+++++ ++ +/-+++++ ++ +/-+++++ ++ +/-+++++ + -
+++ +++ ++
+++ ++ +/-+++++ ++ +/-+++++ ++ +
- +++++ ++
- +++++ +++
+/? ? ?
+/? +++ ++
Such negative from the agro-ecological point of view functions as crust formation and the cementation of the soil mass result in scarce plant cover and the lower bioproductivity of soils with high content of calcareous minerals within subarid and arid landscapes..
4) In general, the presence of calcareous minerals in rocks attributes for the accumulative trend of soil formation. The most important geographical consequence of this fact can be termed as 'aridization' of pedogenesis on calcareous rocks, i.e. the formation of such classes of soils in definite hydro-thermal conditions, which can occur on non-calcareous silicate rocks within more arid conditions.
Usually calcareous bound rocks are considered as soils with relatively uniform properties in different soil forming conditions, and are grouped together at the high taxonomical levels of soil classification (Rendzinas, Calcisols, Sod-calcareous soils). We should also identify the genetic type of rocks and describe the character of their 'uneveness', inherited from the period of sedimentation and/or induced by various geomorphologic processes (e.g. cryoturbations) and evaluate the probable duration of exposure of rock to pedogenic processes.
140

Commission V. Extended Summaries. Thursday, July 14
Symposium B: Micromorphological Indicators of Anthropological Effects on Soils.
Page Micromorphology of Canadian chernozem ah horizons. S. Pawluk, A. Gjadostik, and S.A. Abboud. (Canada) 142
Erosion-induced microstructural changes in a loess-derived fragipan soil. F.E. Rhoton, and D.L. Lindbo. (USA) 144
Micromorphological indicators of coal mining effects on soils. M.I. Gerasimova, N.P. Solntseva, and N.Ye. Rubilina. (Russia) 146
Micromorphological investigations on some soils in South Sinai. M.Z. Salem. (Egypt). • • • 148
Changes in micromorphology of reclaimed upland in clay and peaty soil. T. Ishiwata, and Y. Okita. (Japan) 150
Phytoliths as indicators of the biogeochemical turnover of Si in equatorial reinforest. A.E. Alexandre, F. Colin, and J.D. Meunier. (France) 152
Microvariability of the main characteristics of swell shrink clay soils from the Western Romanian Plain. I. Seceleanu, I. Mauteanu, and C. Simota. (Rumania) 154
Micromorphologic study of the soils of Teotihuacan Valley. S.G. Alfaros. (Mexico) 155
Macropore space morphology by image analysis: Its realtionships with mass transfers during weathering. Z. Sanfo, V. Hallaire. F. Colin, P. Curmi, and B. Boulange 157
Morphological changes in the latosoils of the semiarid region of the State of Bahia-Brazil. L.P. Ribeiro, and I.G. Carvalho. (Brazil) 159
Mineralogical and micromorphological interpretation of the genetic profile of soils being developed on looss like and deposite of Byelorussia. V.D. Lisitsa, N.I. Smejan, V.T. Sergeenko, G.S. Tsytron, and T.V. Bubnova. (Russia) 161
Micromorphological analysis of the archeological site "La Cueva del Raton" (San Francisco de la Sierra, Muluge, Baja California Sur, Mexico). M.M. Bergada. (Spain) 163
141

Micromorphology of Canadian Chemozemic Ah Horizons
S. Pawluk*1, A. Gjadostik1, and S. A. Abboud2. Dept. of Soil Science, University oj A Ibertd,and Alberta Res. Council2, Edmonton, Canada.
Introduction. Earlier investigations of Chemozemic soils throughout the Prairie and Parkland regions of Alberta, Canada revealed considerable differences in the macro- and micromorphological features of the surface A horizons (mollie epipedons) within the different biophysiographic regions and when compared to mollic epipedons from similar ecosystems in different regions throughout the world. The foregoing strongly suggest that differences in the genetic origin for die surface layers closely reflect variations in ecological factors. A study was therefore undertaken to document the structural features of these surface soils, to analyze the factors that contribute to their stability and to determine the processes responsible for their formation. This report deals with the micromorphological aspects of the study.
Materials and Methods. Surface horizons of Chemozemic soils developed from medium textured glacial till parent material were sampled in triplicate from well drained sites within the Brown, Dark Brown, Black and Dark Gray soil zones of Alberta representative of the mixed Prairie, Prairie-Parkland transition, Parkland and Parkland-Woodland transition vegetative zones, respectively. Soil monoliths from the upper pedon at each site were collected and used in thin section preparation. Soil thin sections were described according to terminology proposed by Brewer and Sleeman (1988). Interactive image analyses were conducted with the aid of a Zeiss Videoplan image analyzer.
Results and Discussion: The Chemozemic soils investigated have surface A horizons formed through different arrangements of discrete units that generally fall within the granic and fragmic physical fabric sequences. The basic units in some cases are compound structures composed entirely of humic material that may be amorphous (humo-),fibrous (fibro-),or complexed with clay minerals as mull-like material (mullo-) or they may occur largely as mineral material (pegro-); in other cases they may be discrete plant fragments (phyto-) or mineral grains (mino-). Most compound units are entire or disintegrated fecal pellets (modexi) of soil mesofauria. The size, shape and arrangements of units and the void space within and between them vary considerably among the four soil zones in which soils were sampled. Distribution patterns within and among soil structural units suggest both biological and mechanical forces are active in their development.
Microarthropod modexi from 50-100um in size were observed largely as well developed modexotubules throughout the Ah and AB horizons of the Dark Gray and Black Chernozems and in the upper Ah of the Dark Brown and Brown Chernozems. Other small mesofauna such as small fly and beetle larvae and millipedes contributed humo-and mullo-type modexi ranging in size from 100-450um and were also capable of forming tunnels. They were most evident in the upper layers of the Dark Gray and Black Chernozems. The modexi often formed loosely bound compound fabric units of variable composition and mull-like moder humus type. Earthworm activity strongly influenced fabric development in the Dark Gray Chernozems and had a minor influence on fabrics of the Black Chernozems. Earthworms produced dense mullo-type welded casts of strongly homogenized humic and mineral components that formed stable granular aggregates from l-2mm size. The Ah horizons of the Black Chernozems also had many coarse (200um-2mm) aggregates of mineral material
142

(pegrules) brought up from below by burrowing and tunnelling fauna. The most evident mechanical processes were freeze -thaw and wetting-drying. Their role was
in the development of structural features recognized by the presence of coarse planar voids and in the development of coarse compound physical fabric units through the segregation of finer humo-, mino-,pegro- and mullo-type elements. These elements showed variable degrees of coalescence that gave rise to different interaggregate fabric arrangements within the granic and metafragmic sequences that varied considerably among the soils investigated. Turbation by earthworms completely obliterated ail evidence of physical modification in die Dark Gray Chernozems. The Black Chernozems showed marked segregation of fine and coarse physical fabric elements to form coarse and very coarse (lmm+) granular aggregates throughout the Ah horizon. These features were only weakly evident very near the surface of the Dark Brown and were absent in the Brown Chernozems. The granular aggregates were relatively unstable with weak interaggregate binding and were likely formed by wetting and drying. The most evident effect of freezing and thawing was the segregation of fabric elements into well developed banded fabrics in the Ah of the Brown Chernozems; banded fabrics were less evident in the Dark Brown Chernozems. Chlamydic coatings and cappings of fabric elements onto coarse and very coarse mineral grains and well developed coarse pegrogranic and metafragmic physical fabric units in the lower Ah and AB horizons were other features reflecting frost action in these soils. Similar features have been attributed to freeze-thaw processes in Arctic and paleo-paraglacial soils.
In conclusion, there appeared to be two levels of soil fabric formation. The finer compound units composed of organic and organic- mineral material were of biological origin. These were the humo- and mullo-type physical fabric elements of 50-75um size that dominated old root channels and were mostly modexi. Since these features were observed only in the most recently formed channels, the modexi appeared to be encorporated into the fabric of the soil on a seasonal basis through physical processes that kept the soil structure in a fairly dynamic state. The presence of root channels filled with fine humo-mullogranic modexi in contrast to the remaining unaltered pegroporphyric fabrics in the AB horizons suggest that these biological vectors initiated development of the Ah horizon. The modexi served as substrate for the growth of bacteria and fungi upon which other larger mesofauna foraged and left behind coarser faecal material (250-lOOOum) that was better decomposed but often only loosely bound as aggregates of the finer components. Earthworms and potworms were exceptions in that they produced well homogenized, compact and very stable coarse and fine mull, respectively, as observed in the Black and especially Dark Gray Chernozems. Mechanical processes contributed to the formation of coarse and very coarse aggregates and these processes were quite varied. Moles and ants tunnelled in the soil and moved subsoil material from below into the surface horizons as coarse granular aggregates..Frost processes also produced similar physical fabric elements. The structural units were composed in most cases of smaller biologically generated and variably coalesced physical fabric elements that were quite porous but also in some instances consisted of dense pegro-type material. In the Ah and AB horizons of the Brown and Dark Brown Chernozems where biological activity was feeble or absent frost processes restructured the soil material into a dense horizontally banded configuration and turbation formed dense fine f-matrix coatings and caps on realigned coarse mineral grains. Structural units were relatively unstable and weakly developed. Wetting and drying also resulted in the development of weakly bound coarse granular aggregates There was no evidence that mechanical processes break down the finer physical fabric elements
References. Brewer, R. and J. R Sleeman. 1988. Soil Structure and Soil Fabric. CSIRO, Adelaide, S. R Frankland Ply. Ltd. Australia.
143

Erosion-Induced Microstructural Changes in a Loess-Derived Fragipan Soil
F. E. Rhoton* and D. L. Lindbo. USDA-ARS, National Sedimentation Laboratory, Oxford, MS 38655, USA.
Introduction. Surface soil characteristics are a function of aggradation and degradation processes acting upon a soil body. In this regard, accelerated erosion associated with man's activities is the primary cause of soil degradation in much of the southern United States. The loess-derived fragipan soils in the upland areas of the southern Mississippi River Valley are among the most erosive in the USA. Progressive erosion of entire soil horizons above the water and root restricting fragipans has adversely affected their behavior in terms of erodibility and productivity (2, 3, 4). The modifications in soil properties most responsible for these changes are decreased organic matter contents, aggregate stability, and available water content coupled with increased clay contents, bulk density, and modulus of rupture. Although these effects of erosion on soil properties have been demonstrated in both laboratory and field settings, there have not been any attempts to use micromorphology to better explain differences in soil response to erosion. Thus, our objective was to determine how the microstructure of a fragipan soil changed as depth of erosion progressively increased.
Materials and Methods. Micromorphology samples were collected from four Grenada silt loam (fine-silty, mixed, thermic, Glossic Fragiudalf) pedons that represent different degrees of erosion. These included an uneroded, and three previously cultivated, eroded pedons that represented slightly, moderately, and severely eroded phases of the soil. Erosion classes were assigned on the basis of relative depth to the fragipan (3). A hydraulically driven, split tube sampler (5) was used to obtain 7.6 cm diameter cores down to the fragipan surface. The cores were cut into 7.6 cm long segments and air-dried in the laboratory before impregnation with Spurr low-viscosity resin under vacuum. The specimens were then cured overnight in an oven at 70° C, cut and polished to 30 im, described (1) and analyzed by a polarizing petrographic microscope and image analysis.
Results and Discussion. Accelerated erosion of this fragipan soil resulted in the loss of the entire B horizon at the severely eroded site. The gradual loss of this horizon and the incorporation of ever-increasing amounts of B horizon materials into the Ap horizons resulted in several changes in micromorphology. As the degree of erosion increased; crumb structure in the surface was eventually replaced by platy structure, porosity decreased in the surface 10 cm, depth of bioturbation and finely disseminated organic mater decreased, size and frequency of Fe-Mn nodules in the surface horizons increased, and mangans and redoximorphic features appeared closer to the surface.
Previous work (4) has shown that soil losses peak at the slightly eroded phase and then decrease at the severely eroded phase to a level approximately 1.5 times that of the uneroded soil. Runoff steadily increased from the uneroded to the severely eroded phase. The observed
144

changes in microstructure are responsible for the soil loss and runoff changes through its influence on infiltration rates, aggregate size and stability.
Literature Cited. (1) Bullock, P., N. Fedoroff, A. Jongerius, G. Stoops, T. Tursina, and U. Babel. 1985. Handbook for Soil Thin Section Description. Waine Research Publications. Wolverhampton, UK. 152 p.
(2) Rhoton, F. E. 1990. Soybean yield response to various depths of erosion on a fragipan soil. Soil Sci. Soc. Am. J. 54:1073-1079.
(3) Rhoton, F. E., and D. D. Tyler. 1990. Erosion-induced changes in the properties of a fragipan soil. Soil Sci. Soc. Am. J. 54:223-228.
(4) Rhoton, F. E., L. D. Meyer, and D. D. Tyler. 1990. Effects of past erosion on the interrill erodibility of a fragipan soil. J. Soil and Water Cons. 45:660-663.
(5) Rhoton, F. E., and D. S. McChesney. 1991. System for collecting undisturbed cores from surface soils for micromorphological analysis. Soil Sci. Soc. Am. J. 55:1796-1797.
145

Micromorphological Indicators of Coal Mining Effects on Soils
Gerasimova M.I., Solntseva N.P., Rubiliaa N.Ye. Moscow State University, Faculty of Geography, 119899, Russia.
Introduction. Micromorphological indications of agricultural activities effects on soils are rather known (Jongerius, 1981; Tursina, 1988), much less attention was paid to changes in soils induced by mining and other branches of industry. Our long-term investigations may contribute to filling in this gap.
Materials and Methods. Micromorphological data on sod-podzolic soils (Podzoluvisols) and leached chernozems (Luvic Chernozems) occurring in Moscow and Kizel (the Pre-Urals) coal-fields with sulphidic brown coal mined by underground methods. Soils were compared in terms of micromorphology with similar soils outside the coal-fields (standard profiles).
Results and Discussion. Two groups of soil transforming agents may be specified: acid solutions with pH ranging from 2 to 4.5 and high concentration of S04 ions due to sulphides oxidation, and deluvial material enriched in coal particles and waste rocks fragments.In accordance with soil profile location within the zone of waste heap influence the depth of technogenic deluvium varies from l-2cm to 0.5m. The combined effect of both agents (with some by-effects) produces conspicuous transformations sola, which may be specified in the following way: a) changes in the humus profile due to almost complete destruction of soil biota and neoformation of carbonic substances akin to soils; b) de- and re-structurization alongside with compaction; c) alteration of migration capacity and migrants composition; d) development of neoformations. These processes are common to both podzolic and chernozemic soils, whereas their results and intensity are different, being detennined by original microfabrics and by the "adjustment" of the transforming agents to environmental conditions. Thus, in sod-podzolic soils the most conspicuous changes occur in the upper horizons: the depletion in humus is strong, and it produces a peculiar effect of higher plasma anisotropy as compared to standard soils. One more unusual property of the Al horizon -" mummified" organic remains, which are reddish-brown isotropic; black with glass lustre in the reflected light. Microstructures are weakly changed;coprolites are conserved, and new rounded (salt effected?) aggregates appear in albic horizons. Rather intricate cutanic systems proper to argillic horizons of sod-podzolic soils become still more complicated: frequent argillans, ferriarillans, ferrans and siltans are interstratified, with a distinct maximum of illuviation features in the middle part of Bt horizon, while in its lower part a
146

strong bleaching of coatings is noted (2). Some coatings and ped interiors have admixtures of very fine coal particles. High intensity of current migration is proved by deep occurrence of a "label" - specific red coal mineral grains at a depth of 2m. Iron neoformation are common, with a maximum in the upper horizons, they are various, nodules and impregnations predominating. The effect of acid solutions on leached chernozems is revealed micromorphologically in the removal of carbonates from BCa horizon, development of striated forms of b-fabric in Bw(Bt) horizon alongside with few to frequent illuviation cutans of different size and composition,some of them with fine coal material. Locally plasma depletion zones occur there. Acid solutions promote the deterioration of perfect "chernozemic" microstructres in the A horizons, which tend to subangular; vertic properties may also appear. Admixture of coal particles does not strongly change the micromass characteristics of the A and AB horizons(l). Most peculiar are the neoformations in acidified chernozems: prismatic gypsum crystals in voids and in the groundmass, both single and in clusters. They occur in humus horizons all over the zone of waste heaps influence, while in soils adjacent to waste heaps they are restricted to middle and lower horizons. Gypsum neoformations are thought to be produced by exchange reactions and display indications of recrystallization and corrosion. One more pedofeature improper to standard soils -iron segregations and nodules in Al horizons.
Literature Cited. (1) Solntseva N.P.,Rubilina N.Ye.,Gerasimova M.I.,Alistratov S.V. 1992. Morphological transformations of leached chernozems in coal mining areas. Pochvovedeniye 1:17-29. (2) Solntseva N.P., Rubilina N.Ye.1987. On the morphology of soils transformed in the course of coal mining. Pochvovedeniye 2:105-118.
147

Micromorphological Investigtions on the some soils in South sinai
Salem, M.Z. National Research Centre, Soils and Water Use Dept.,
Cairo, Egypt.
Introduction. The soils of the South Sinai peninsula have recieved
special attention over the last few years.
A number of authors Nir (1970) and Bruce (1989) have studied the origin
of lake deposits in South Sinai. They ascribed its origin to one facies of a
thick late pleistocene aggradation that occurred throughout wadi system
in the igneous and metamorphio province of Southern Sinai.
This study provides an increasingly precise knowledge is necessary to the
characterization, classification and to understanding of their genesis and
properties.
Material and Methods. Four soil profiles were chosen for this study to
represent wadis depsits in South Sinai. Thin sections were prepared from
undisterbed soil samples using the method described by Altemuller
(1962), Brewer's terminology (1964) was generally used with additional
terms after Stoops (1976).
Results and Discussion. From the micromorphological investigations of
the studied soil samples it can be concluded that these soils are
characterized by plasmic fabric which is silasepic (No plasma separation),
may be due to the nature of these soils which are young, with fittle
development processes. The microstructure is porous and weakly to
moderately developed peds, the coarse material (Skeleton grains) is
composed to sand Saized grains of angular and subangular shape. Low
content of organic matter.
Packing voids are the dominant and some irregular ortho-vuglis are
observed. Generally the voids are greater in the surface horizons and
decrease with depth. No cutanic features are observed but some fine
148

calcitic noducles and Fe-Mn concertions are found especially in lower horizons of profiles 3 and 4.
References. AltemuUer, H.J. (1962) Improvement of impregnation hardening and
grinding techniques for the preparation of thin sections cf soil samples with vestopal. Z. Pflanzenernaht., Dung., Bodenkunde, vol.99, p. 146.
Brewer, R. (1964) "Fabric and Mineral Analysis of soils" John Wiley and Sons, New York, London, sidney, p.470.
Bruce, G.G. (1989) Late pleistocene lakes within the mountains of southern Sinai: observations at the Tarfat Oasis. Bulletin De la Societe De Geographie D'Egypte, Tomes LXI-LXII, pp.29-52.
Nir, D. (1970) "Les lacds Quaternaires dans la region de feiran (Sinai Central), "Revue de Geographie Physique et de Geologie Dynamique (2), XII (4) : 335-346.
Stoops, G.Ü976) "The Fabric Analysis of Soil Thin Sections. Concepts, Terminology and Description Schemes. Notes of Lectures in Soil micromorphaology." International Training Centre for postgraduate soil scientists. State Univ., of Ghent, Belgium.
149

Changes in Micro-morphology of Reclaimed Upland in Clayey and Peaty Soil
T. Ishiwata* and Y. Okita. Civil Engineering Research Institute, Hokkaido Development Bureau, 1-3, Hiragishi, Toyohira-ku, Sapporo C, Japan
Introduct ion. In Japan, land rec lamat ion projects are executed with large scale renovat ion as fol lows. l ) In the r e c l a m a t i o n of t o p o g r a p h i c a l l y a g g r a v a t e d a r e a , af ter s t u m p i n g and s t u m p d i s p o s a l , the su r f ace soi l l a y e r s (A and B horizons) are piled up, and then backslope cutt ing and foreslope filling (BCFF) are executed to create a flatter and larger foundation. The piled surface soil is then spread out to make a 30 to 40 cm-th ick p lowed layer. These p rocedures are cal led surface soil t rea tment (SST) . B C F F conver ts the s teep and rugged virgin land into flatter farmland, so mechan i zed farming prac t ices can be per formed accura te ly and efficiently. 2)In the rec lamat ion of peaty land, dra inage and mineral soil dress ing of the peaty soil are executed to improve the traff icabil i ty. After r ec l ama t ion , the pea ty layer benea th the d ressed soil d e c o m p o s e d gradual ly. We inves t iga ted soil changes caused by these t echn iques .
Mater ia l s and Methods . l )Soi l type 1: Acid brown forest soil (clayey soil) Immedia te ly after SST, subsoi l ing was conduc ted with pan-breaker to soften the S S T soil , and the rec la imed upland was then p lowed . The physica l proper t ies and mic ro -morpho logy of the soil , de te rmined from the samples taken jus t after SST, 43 days after p lowing , and 5 years after rec lamat ion , were measured . 2)Soil type 2: Trans i t ional moor peat soil The phys i ca l p rope r t i e s and m i c r o - m o r p h o l o g y of the pea t layer , de te rmined from samples taken 3 and 6 years after rec lamat ion , were measured .
Results and Discuss ion . l )So i l type 1 By S S T p r o c e d u r e , the bulk dens i t y ( B D ) of the S S T l aye r was decreased , and the crude-s ize pore vo lume (CPV: p F below 1.8) and the easi ly avai lable water ho ld ing pore vo lume ( E A W : p F 1.8-3.0) were drast ical ly decreased (Fig. 1). Micro-morphologica l study of the S S T l aye r s h o w e d tha t it was c o m p r e s s e d and s m e a r e d d u r i n g conveyance . By subsoi l ing, the BD of the soil near the chisel t racks was decreased and the C P V was increased, but, E A W was not. Nei ther BD, CPV nor E A W of soil be tween the chisel t racks were changed. By f i rs t p l o w i n g , the B D of the so i l w a s d e c r e a s e d , the C P V was increased, but E A W was nei ther . Micro-morpholog ica l study showed
150

that the compressed soil mass was c racked by p lowing . Five years after rec lamat ion , BD, CPV and E A W were recovered to equal the A or B hor izons of virgin soil . These facts indicate that the CPV of compressed soil mass can easily be increased by p lowing , but the E A W can not. The E A W increases only gradual ly . 2)Soil Type 2 The BD of the 3-year-old peat layer (T3) was less than that of the 16-year-old layer (T16) . The CPV of T3 was more than that of T16 , and the E A W of T 3 w a s a l s o m o r e t h a n t h a t of T 1 6 ( F i g . 2 ) . Morphologica l ly , T3 consis ted of both soft and hard t issues , but T16 consis ted mainly of hard t issue. These facts indicate that soft t issue d e c o m p o s e d f a s t e r t h a n h a r d t i s s u e , a n d tha t c o m p r e s s i o n h a s deve loped . These changes caused the CPV and BD of peat layer to increase.
Literature Cited. (1) I s h i w a t a , T. and Sa i to , M. 1992. Soi l phys i ca l p r o p e r t i e s of up lands with backs lope cut and foreslope fill. J apanese J. of Soil Sc ience and Plant Nutr i t ion (Japanese with Engl ish summary) , 6 3 : 669-676
Virgin soi
Pore Volume (%) 0 20 j . Bulk densJty
_ T (s/arf)
Virgin soi Virgin soi A hor*on V//////A | 0.78
Reclaimed Soil
MtsT VA \ 1.12
0.94
0.78
Fig 1
Pore Volume (%) XI 40 60
3 * - ^ :
16 Years W//A I CPW RAW
Bulk density
. (9/erf)
0 14
0.22
Bulk density and pore size distribution of virgin and reclaimed soil
Fig 2 Bulk density and pore size distribution of
reclaimed peat soils after 3 and 16 years
(a):Virgïn soil A horizon
(b):Reclai«ed soil just after SST
(c):Soil 43 days after plowing Scale:lei
Photo.1 Micro-iorphology of virgin and reclaimed soils
151

Phytoliths as Indicators of the Biogeochemical Turnover of Si in Equatorial Rainforest
A.E. Alexandre, F. Colin and J.D. Meunier. Laboratoire de Géosciences de l'Environnément, VRA 132 C.N.R.S. Faculté des Sciences et Techniques de St Jerome, 13397 Marseille, Cedex20, France.
Introduction. The role of the biosphere in controlling both formation and erosion of soils has been poorly documented. Tropical forests are among the most efficient vegetal cover in recycling silicium (Si), with 300 kg/ha/year (1). Once absorbed by roots of many living higher plants, Si returns to litter and soil as opal particles called phytoliths, of one to about ten [im in size. A forest of Si-accumulator species, averaging 2% of Si, and 15 tons dry weight new growth per hectar and per year, would extract 0,3 t of Si/ha/year or the equivalent of the Si content in 1 metre of quartzite during 13 000 years. Therefore, the biological turnover of Si involves a significant input on equatorial topsoil (2). However, the geochemical behaviour of phytoliths in tropical environment is poorly understood. Here, we present the results of a preliminary study of phytoliths in the course of their turnover from the living plant to litter and soil. Phytoliths are produced by the leaves of Trichillia (Meliaceae), which is one of the dominant species of the Mayombe equatorial forest (Congo). Si content in leaves and the amount of biogenic Si in soil were determined in order to estimate the residence time of phytoliths in the top latosol.
Materials and methods. The study area is located on the west slope of the Mayombe Range. Latosols have been formed at the expense of Proterozoic schist and quartzite. The climate is equatorial, with an average annual rainfall of 1 500 mm. Three samples were analysed, 1) senescent leaves of Trichillia from upper litter, 2) decomposed leaves of Trichillia from lower litter, 3) upper layer of the latosol. The phytoliths were extracted from leaves by wet oxidation, using HC1, HNO3, HCIO4 and H2O2. Extraction from soil were performed using fractionation, oxidation and densimetric separation from quartz particles in a bromoform solution with a density of 2,3. The morphology of phytoliths was studied under optical microscope and S.E.M. equiped with an E.D.S. The Si content of 400 mg of senescent leaves was analysed by I.C.P.-A.E.S. Data are given with an analytical error of 5%.
Results and discussion. 1-Morphology of phytoliths in litter and soil : In senescent leaves, polymerization of opaline silica occurs in epidermic tissues, in mesophyll and in vessels. On the cellular level, phytolith may result from silicification of cell walls, cell lumens and intercellular spaces (fig. 1). Typical forms have been identified, resulting from the silicification of undifferentiated unicell lumens, stomates, hair cells, vessels, mesophyll cells and epidermic cells. The sizes range from a few yun (unicellular phytoliths) up to about 100 ^m (pericellular phytoliths). Vessels and pericellular phytoliths are the most abundant. In the lower litter, unicellular phytoliths are the most abundant. They originate from the decomposition of silicified stomates and tissues (fig. 2. a). The thinner cell walls found in senescent leaves are lacking (fig. 2. b) and most of the phytolith surfaces are stippled. In the upper layer of the latosol. the size of phytoliths is lower than 50 nm. The typical phytoliths described in the litter are not found here. Surfaces are rugulose, irregularly pitted by cavities of a few Jim in diameter (fig. 3). Such features may reflect biogenic and/or nonbiogenic dissolution (3, 4). These observations show that dissolution of phytoliths is selective and rapid. 2-Estimation of the biogenic Si flux and mean residence time of phytoliths in the soil: The leaves of Trichillia contain 1,9% Si (dry weight). This value is consistent with the average amount of Si commonly estimated in literature for tropical species (1, 5). Trichillia is therefore representative of other tropical trees. The amount of biogenic Si (i.e.phytoliths) reaches 0,43% of the bulk material of the topsoil. Taking into account the soil density (1,6 t/m3), the amount of biogenic Si is 9,9 103 t/m3. For the upper five cm of the topsoil, biogenic Si accounts for 4,9 104 t/m2 or 4,9 t/ha of dry matter weight. The flux of Si from leaves is the product of the flux of leaves in tropical forest (from 3,6 to
152

4,8 t/ha/year; 6), and the Si content of leaves (1,9%). It accounts for 6,8 to 9,1 102 t/ha/an and represents about 3/4 of the total Si productivity of the forest wich consequently reaches 9 to 12 10-2
t/ha/year. The mean residence time of phytoliths in the latosol compartment is the ratio of the biogenic Si stock to the annual biogenic Si flux and ranges from 40 to 53 years. Our data show that biogenic Si supplied to the upper part of the latosol is quickly available, compared to geological events and soil formation time scale. Thus, phytoliths dissolve in topsoils and the resulting Si solute may be either directly recycled by plants and tree roots, or remobilized in situ in supergene minerals, i.e. kaolinite, or removed out of the profile. Phytoliths may also be mechanically exported toward regional watersheds by surface washing processes (7), in the equatorial forest of Gabon. Therefore, phytoliths may be used as paleoenvironmental indicators.
Fig. 1. Silicification of intercellular space and cell walls. Observed under S.E.M. Fig. 2. Weathered pluricelluiar phytoliths observed under S.E.M: (a) Silicified cells detached, (b) Thinner cell walls dissolved. Fig. 3. Soil phytolith, observed under S.E.M., caracterized by rugulose surface pitted by cavities of a few pjn in diameter.
Literature Cited. (1) BARTOLI, F., 1981 Le cycle biogéochimique du Silicium sur roche acide. Application a deux systèmes forestiers tempérés (Vosges), these de doctoral., Université de Nancy I, 187p. 2) LUCAS, Y., LUrZAO, F.J., ROUILLER, J. et NAHON, D., 1993. The relationship between the biological activity of the rain forest and the mineral compsition of the soils, Science, 260, pp. S21-S23. (3) BERNER, R.A., 1978. Rate control of mineral dissolution under earth surface conditions, American Journal of Science, 278, pp.1235-1252. (4) CALLOT, G., MAURETTE, M., POTTIER, L. et DUBOIS, A., 1987. Biogenic etching of microfractures in amorphous and crystalline silicates. Nature, pp. 328-329. (5) LOVERING, T.S., 1959. Significance of accumulator plants in rock weathering, Geol. Soc. of America Bull., 70, pp. 781-800. (6) SCHWARTZ. D., 1993 communication orale. (7) COLIN, F., BRIMHALL, G.H., NAHON, D., LEWIS C.J., BARONNET, A. et DANTI, K., 1992. Equatorial rain forest lateriti mantles: a geomembrane filter. Geology, 20, pp.523-526.
153

MICROVARIABILITY OF THE MAIN CHARACTERISTICS OF SWELL SHRINK CLAY SOILS FROM THE
WESTERN ROMANIAN PLAIN
I. S e c e l e a n U , I. M u n t e a n U , C. S i m o t a . Research Institute for Soil Science
and Agrochemistry, A . S . A . S . Buckarest - ROMANIA
I n t r o d u c t i o n . The problem of the homogenety of the soil mapping units constitues an old preoccupation in the field of soil survey. Generally it has been considered that in the some time with the increasing of the work scale and consequently the density of the observation s i t e s , the assurance degree of uniformity of the separated soil mappings grows, too. That is true in c a s e i n which the other environmental elements conditioning the development of the soil cover have the same tiendency of variation. It is so called ecosystemical spacial variability of soil cover that changes at the same time when one or more pedogenetical factors have been modified.
M a t e r i a l s a n d M e t h o d s . The re sea rch accomplished by us aimed to establish the degree of spacial variability regarding some morphological, physical and chemical features,throughout the soil volumes precesely delimited soils representing a • equence of vert isols and soils with vertic features. It is known that spacial mic ro -variability of morphological features of vert isols and soils with vertic features the lenghth of control section was taken into consideration at a value of 3.10 m. The diggeH soil profiles had the shape of a r ight angle with the sides of 3 .10 /3 .10 m and 2 m in depth. The examined soil were 9.61 m in surface and 19.22 m^ in volume. The sides of the profiles were devided in portions for cropping in describing with the width of 20 cm and were , disposed at a distance of 30 cm The degree of variability of the thickness of the horizons, the colour, the content of different particle size fractions, humus content soil pH, spacial microvariability of considered features , degree of taxonomical purity of the examined soil samples a re presented.
R e s u l t s a n d u i s c u s s i o n B . Optained resul t s emphasize the idea that there is an association between spacial variability of soil propert ies takeainto consideration on genetical horizons and soil forming p rocess . The determined variability for the deeper horizons keeps more features s imilar with those of lithological substratum of the examined so i l s .The dynamical processes implied in soil forming process lead to homogeneity of soil mass , involving the reduction of the distances of self-correlat ion for B horizons. At the soil surface as a resul t of homogeneties following agricultural works practically the determined propert ies a re not self correla ted (for the considered distance of minimum 1 m). The basic idea coming to light was the heigh degree of ageing of vert isols in this a rea that was materialised by advanced stage of stratification.
L i t e r a t u r e C i t e d . (1) Seceleanu I . and colab. 1990, Microvariabili tatea carac ter i s t ic i lor principale ale vert isoluri lor §i solurilor vertice din Campia Romana - Raport final ICPA
154

Micromorphologic Study of the Soils of Teotihuacan Valley Gloria Alfaro-Sénchez. Instituto de Geografia, Departamento de Geografia Fisica , UN AM, 04510 México DF.
Introduction. Teotihuacan valley has been the subject of numerous studies of different disciplines, mainly because it was the site of the teotihuacan culture, one of the most important prehispanic cultures of Latin America. The objective of the present study is to find some micromorphologic features which can be used to reconstruct the environmental conditions in the Valley during the Holocene, particularly after 3000 yr B.P., when the teotihuacan culture started developing. Micromorphology allows to relate characteristics of the micromorphologic structure with pedologic properties linked to environmental conditions. On this basis, an hypothetic definition of the pedogenetic processes and their causal factors is established in this study. The Teotihuacan valley is located in the central-northern part of the basin of Mexico, an area where intense volcanic activity has taken place during the Tertiary and the Quaternary. Because of this, the related distribution between the coarse and the fine particles of the soils of the valley still shows a strong influence of the primary structure (fabric) of the geologic parent materials.
Materials and Methods. Fourteen profiles were sampled along a transect across the valley, from Cerro de la Cruz to Cerro de Patlachique. Morphologic descriptions were also made for each profile. A total of 52 undisturbed samples from nine profiles were prepared following the procedure described by Brewer (1) . A Zeiss optic microscope with enlargements of 25-250 was used. The description was carried out as suggested by Bulloch et al. (2).
Results and Discussion. A related distribution was observed between the particles of porphyric type, in which the primary minerals float in an expanded matrix (3) . This indicates an incipient degree of development of the soil. This condition is determinant in promoting the formation and dominance of birefringence fabrics of poro-striated type and grano-striated type, in which the particles agglutinate under the influence of molecular forces. The results reveal a low degree of weathering of the primary materials. This applies even to minerals such as feldspars and volcanic glass, which are characterized by a rapid alteration. Moreover, the surfaces of the minerals have few faces of friction, attrition or fracture, which indicates only little mechanic reworking. The dominance of primary mineral structures with an apparent cementation by silica and hydroxides considerably reduces the porosity, which varies between 35-25% in the samples of
155

the surface (generally A) horizons, and decreases up to 15 points in the lower (C) horizon. The latter consists of a Duripan ("tepetate") formed by indurated tuffs whose hardness is probably caused by the segregation of silicic acid during their cooling and solidification, (propilitization) . This has been very important for the preservation of the minerals since its strongly limits the penetration of water into the soil matrix. Due to the low porosity and to the relatively dry climates of the area, the formation of secondary minerals has been rare, which explains the poor definition of clay forms like coatings and infillings. However, the presence of nodules and mottles of iron and manganese together with their low frequency and poor development suggest short periods of climate more humids than the present one (563 mm). In conclusion, the soils of the Teotihuacan valley are characterized by a low degree of pedogenetic development, due to low rates of weathering related to environmental factors. This suggest dominantly arid and dry conditions, which is in agreement with former studies of the basin of Mexico (4) . The micromorphologic detail has revealed the importance of a sealing, probably of silicic origin, which has diminished the porosity and the pore size. This has caused a decrease of the active surface of the soil matrix particles, thus reducing the possibility of their transformation into secondary minerals and limiting the enrichment of the soil plasma.
LITERATURE CITED. (1) Brewer.R.1964. Fabric and mineral Analysis of Soil. John Wiley and Sons. New York. (2) Bullock, p.,A. Jongerius N. Fedoroff, G. Stoops, T.Tursina. 1985. Hand book for Soil thin Section Description. Waine Research.Publication. 152 p. (3) Eswaran, H. and Banos C. 1974. Related Distribution Patterns in Soils and Their Significance. Anales de Edafologla y Agrobiologla. 35, 33-45. (4) Cervantes, B.J.F. 1983. Genesis Morfologia y Clasificación de los Suelos de la Cuenca de México. Tesis Doctoral, Facultad de Ciencias, de la UNAM.
156

Macropore space morphology by image analysis: Its relationships with mass transfers during weathering.
Z. SANFOd), V. HALLAIRE(2), *F. COLINC1), P. CURMI») and B. BOULANGEO) (1): ORSTOM, UM GECO, URA CNRS 132, Laboraloire de géosciences de l'environnement, universitó Aix-Marseille III. F- 13397 marseille cedex 20, (2): INRA sciences du sol, 65 rue de saint-Brieuc, 35042 Rennes Cedex, FRANCE.
INTRODUCTION The relationships between pore sizes / shapes and mass transfers of elements during weathering has been established during conversion of upper Archean lithosphere to latentie mantle under equatorial rainforest conditions [1]. In the sub-sahelian environment of Burkina Faso, lateral connected ironcrust derive from the tertiary to present day, can be observed. The aim of this paper is to study the distribution of the different type of macropores in relation to translocation paths within subsahellan surfacial latentie system.
Material and Methods. The weathering profile (fig. 1) can be divided in three main layers from surface to base. The sandy-clayey and gravelly layer (HI), 0.1- 0.25 m thick, consists of goethitic/hematic nodules scattered in a sandy-clayey matrix. The nodular layer (H2), 0.6 - lm thick, is strongly indurated and consists of goethitic/hematitic nodules. The saprolite, 1 - 5m thick (H3) consists of kaolinite, illite and quartz. While at the bottom, the parental schistosity is well preserved with successive thin beds of quartz, illite and kaolinite, in the upper part (0.5m thick), the texture is strongly disturbed. Macroporosity quantification was performed on large sections (16 * 9 cm) of undisturbed samples embedded in a fluorescent resin. Six samples were collected. For each sample, 5 to 10 images were digitized by ultra-violet reflected light, so the pore space appears bright on a dark background. Images were digitized in a hexagonal grid of 512 * 512 pixels with a spatial resolution of 10 um per pixel. A shape index (Perimeter 2 / 4.7tArea) allowed rounded poroids (A), intermediate poroids (B) and elongated poroids (C) to be distinguished [2]. For each class of shape, porosity and Feret diameter distribution were determined.
Results and Discussion. Macroporosity measurements and corresponding Feret diameter given in figure 2 show that the elongated and the intermediate poroids account for the mpst part of the total macroporosity. These macropores are develop mainly in H2 and in the upper part of H3, which are the non preserved texture layers (with respect to the parental schist). In the isotextural part of the profile (Base of H3), the amount of both elongated and intermediate poroids decrease strongly. Within the whole profile, rounded poroids, essentially of small size are constant within the H2 layer. The top of H3 their proportion strongly increases before decreasing again in the isotextural saprolite. - Concurrently, the evolution of the Feret diameter of every type of pores show that the largest diameters characterize essentially the elongated poroids, and secondary the intermediate ones. In the nodular layer (H2), the mediane value is 750 um while the maximum size decreases from 3900 um in the upper part to 2600 um in the bottom. For the intermediate poroids and the elongated poroids, the same tendency is observed with very low values of mediane for the rounded poroids.Within the saprolite, the diameters of the elongated poroids decrease and range from 1000 um 250 um with a medium value of 500 um. The intermediate and the rounded poroids are more homogeneous, with values of mediane ranging from 250 um to 180 um for the intermediate ones and 25 um to 45 um for the rounded ones, from the top of H3 to the base of the profile. - Penological study and the distribution of heavy minerals such as zircon along the profile (fig 2) show in situ euhedral zircons and rounded zircons with mechanical scratched feature. The amount of euhedral zircons increases slowly from the base to the top, according to natural collapse of the regolith. Rounded zircons are irregularly distributed from the top of H2 layer to the limit of the preserved texture in H3. This limit, cracked and infilled by a quartz and kaolinitic material shows a high value of rounded zircons. From the nodular layer (H2) to the top of the saprolite (H3), the matrix exhibits vesicles infilled with components similar to the matrix material, crosscut by millimetric channels or pores. The channels are
157

covered by Fe-hydroxide and kaolinite. These channels and pores correspond to elongated poroids and to the intermediate ones. ALthe base of (H3), where the texture of the schist, is well preserved the macroporosity is expressed essentially as alignments of small pores in kaolinite and illite thin beds of the schist. These pores are for the essential the rounded poroids and correspond mainly to dissolution voids Conclusion Image analysis enable us to study the weathering pores paths in laterites and demonstrates that the distribution of heavy minerals such as rounded zircon is linked to the path of elongated and intermediate poroids along the profile. In addition, cutanes resulting from illuvial processes in the biopedoturbated unit, are mainly associated with those poroids. References. [1] Colin F. and al (1993): Equatorial rain forest lateritic mantles: a geomenbrane filter.geology, V. 20,p. 523-526, June 1992. [2] Hallaire V.and Cointepas J.P. (1993): Caractérisation de la macroporosité d'un sol de verger par analyse d'image. Agromonie,13, 155 - 164.
2 3 4
Figure 1: Sketch schowing the main weathering pattern of the profile P7 (Q: quartz; K: kaolinite;G: goethite; H: hematite; I: Illite) by X-ray diffraction
Zirconium attribution (ppm)
Rounded poroids Intermedial, poroids (Ooaentsd ««raid» diameter (pm) diameter (urn) diameter (Jim) Porosity ( » )
•O—
{ft
•ra-•flH
to—
"-f®-10 Ai Mlalam
C: M a t a H
nv Rounded poroids (V) •a Intermediate poroids (%) an Elonialed poroida ( « )
Figure 2: Evolution of zircon distribution through the weathering profile, the Feret diameter evolution and the contribution of poroids to the total macroporosity.
158

Morphological Changes in the Latosoils of the Semiarid Region of the State of Bahia - Brazil
L.P. Ribeiro and I. G. Carvalho. Pos-Graduation Curse of Geosciences. Geochemistry Department, UFBA. R. Caetano Moura, 123 - Federacao - 40170-290 -Salvador, Bahia, Brazil.
Introduction. The semiarid region in the state of Bahia, Brazil, is extensively cover by latosoils, which are equivalent to the ferralitic soils of the French literature and to the American oxisols. The studies made by Ribeiro (1982 & 1986) determined that most of these soils have elements which exhibit a darker colour than the matrix, a greasy brightness, a consistent, hard and masive texture and a not organized structure. Such elements were provisionally termed of hard bright elements codified as EBE that is the abbreviation of its correspondent term in Portuguese In the soil profile, the EBE normally appear from the AB and BA horizons to increase considerably at the base of the Bw horizon and may disappear in the C horizon. This type of distribution of the EBE gives away to the morphological transformations that is pointed out by a cohesive (compact) mass that normally presents cracks and zones of remmants fragmentary structures. The generation of this cohesive mass changes the porosity and the hydric properties of the soil profile maily at the level of the B and C horizons and its primordial consequences are to make them difficult to the development (penetration) of the roots and to facilitate the action of the erosive processes. In this paper a profile of this type of soil is studied aiming to discuss the processes which are believed to be responsible for its evolution.
Material and Methods. The selected soil profile to be discussed in this paper is located in the region of Irecê, central part of the state of Bahia. It presents the following sequence of horizons: Aj, A2, AB, BA, Bwi, Bw2, Bw, Ccf and Cgc. Samples were collected from the horizons and from the source rock (limestone) that appears below the saprolite at depth of 355 cm. The regional pluviometry is of about 570 mm, that is concentrate mainly in the period between November and May. The type of vegetations is hyperxerophytic (step type) termed "caatinga". The source rock is the limestone of the Upper Pre-cambrian Bambui Group. The collected samples were submited to chemistry analyses following the method recommended by EMBRAPA (1969). The mineralogical studies were basically made by X-Ray Diffractometry; for the clay components by using oriented specimens of this fraction and treatment with hydrazine. Micromorphological study was perfomed for some samples.
Results and Discussions. The studied profile shows two cohesive levels: the superior, between the 35 and 100 cm from the surface, does not present EBE and the inferior, between the 210 and 280 cm at depth, where the EBE occur and amounts of 60 to 80% of the bulk material of the correspondent soil horizon. The presence of the EBE is also observed in the BW2 and Cgc horizons where they occur dispersed in the not cohesive material. The chemical analyses of the total material of the profile and of the EBE is shown in Table 1. The comparison of the mineralogical results and of the chemical data shows that the EBE have high concentrations (about 19%) of natural clay (dispersed in water), of total clay (about 46%), of organic material and of calcium and magnesium. The clayish material (Fig. 1) is maily compond of kaolinite, goethite and quartz. However in the diffractogrammes from the EBE the peaks of quartz are conspicuous and those of caolinite are not sharp and not well defined as those exhibited in the diffractogrammes for the rest of the soil material. This fact suggests a process of degradation. After the treatment with hydrazine, the EBE exhibits a peak of 9,9A°.
159

Although this peak is not sharp it is important to indicate the presence of well crystallized caolinite. The micromorphological studies indicated that, in opposition to the structured horizons, the peds in the EBE are compact in a framework pattern like honeycomb with recristallized silica in the interior. The above discussed results suggest that the morphological degradation of the profile seems to be related to the decay of the clay minerals and to the consequent disorder of the soil structure. The instability of the soil structure is in fact associated to the translocation (eluviation of the elements) and degraded clay to the lower horizons The high content of fulvic acid recorded by Cunha (1992) in these soils is important in this process. It is a typical pedobioclimatic and geochemical disequilibrium.
Literature Cited. CUNHA, T.J.F. - Materia Organica de Alguns Solos de Irecê-Bahia. IGUFBa. Salvador-Ba., 1992.
(These). 215 p. EMBRAPA/SNLCS. Método de Analise de Solos. Rio de Janeiro, 1969; 24p. (Boletim Técnico, 7). RTOEIRO, L.P. - Ferralitizacao no Nordeste Semi-Arido. FFLCH-USP. Sao Paulo, 1992. (These).
306 p. RIBEIRO, LP. - Silica em Horizontes Coesos de Solos da Bahia. Rev Univesitas. UFBA. Salvador,
1986, 38:59-80.
Table 1 - Some chemical characteristics and clay contents of the studied soil profile.
Sorption Complex c N Horiz. Depth Total Natural pH Ca++ Mg""- K+ Na+ Mgg-1 Mgg-1
(cm) Clay Clay H20 Cmol(+)Kg-(%) (%)
Al 0-18 35 04 4.6 4.30 3.06 0.04 0.06 0,81 0.06 A2
35 38 04 4.8 3.37 1.75 0.03 0.04 0.23 0.06 AB 70 37 00 4.7 2.97 1.33 0.04 0.04 0.26 0.02 Bwi 100 40 00 4.5 2.31 1.19 0.04 0.04 0.22 0.02 Bw2 180 38 00 4.3 1.66 0.84 0.04 0.03 0.29 0.02 Bf 210 35 00 4.1 1.85 0.95 0.03 0.04 0.26 0.02 BwCcf 280 14 03 4.1 2.78 1.43 0.04 0.04 0.18 0.02 Cgc 314 18 08 4.9 2.90 1.50 0.02 0.04 0.18 0.02 EBE 240 46 19 4.6 14.72 7.58 0.06 0.06 0.38 0.03
EBE
EBE + H i d r a z .
Bw2
-f— 29 30 20 ,(
Fig. 1. X-ray difractogram (Coke) of the clay fraction in Bw horizon and the EBE normal and hydrazined CS - Kaolinite Christalized; C - Kaolinite; G - Goethite and Q - Quartz.
160

Mineralogical and Micromorphological Interpretation of the Genetic Profile of Soils Being Developed on Loess-
Like and Sandy Deposits of Byelorussia Lisitsa V.D., Smejan N.I., Sergeenko V.T., Tsytron G.S., Budnova T.V. Department of Soil Micromorphology, Byelorussian Research Institute of Soil Science and Agrochemistry, Kazintsa Str. 62, 220108 Minsk, Republic of Byelorussia
Introduction. On the territory of the Republic of Byelorussia there occur the soils being develped on loess-like and sandy deposits in the profile of which of there exist the pronounced brown zebra - like formations known as "ortzands", "stria like ortzands", "filamentary ortzands" and "pseudofibres" in our literature on pedology.
Materials and Methods. By present the properties and processes of these soils have been well studied by means of using visual observations, chemical and grade analyses, identification of water physical properties (1, 2). The soil investigations was made by mineralogical and micromorphological methods (microscopic, electron-microscopic, X-radiodifractometric and etc.).
Results and Discussion. According to these and other investigations one can suppose that all brown zebra - like formations of soil have been resulted from the podzol- forming process. As a result of our studies (3, 6), based on the complex of different investigations it is found that in the soils being developed on sandy and loess - like deposits two groups of brown zebra - like interlayers alike in form and color but completely different in composition, structureand genesis are present. One group represents the areas of arenaceous rock cemented with ferric sesquioxides (classic ortzands and pseudofibres) and the other one - the areas of arenaceous rock, cemented with hydromicaceous plasma having a high degree of the optical orientation of individual crystals covering partially or completely the skeleton grains. These interlayers as distinct from the classic ortzands and pseudofibres are proposed to be named as clayfibres (4, 5). In the profile of these soils there always exist two horizons, Bj and B2, ocurring as rule depth of 40-90cm and 90-200cm. It is difficult to give satisfactory explanation to them from the positions of podzolic and shoddy - podzolic processes in their traditional understanding. What kind of phenomen are these horizons at different levels of a structural organization of the soil? From a visual point of view the B| horizon is a brightly collared brown compressed layer that abruptly transists into the lower B2 horizon differing from the Bl horizon in the sense that there exist rhythmic brown interlayers occurring parallel and subparallel to aday surface (sandy deposists) or parallel to a slope (loessial loams). Quartz (90%), fieldspars (10%) appear to be the basic component of the skeleton of genetic horizons and interlayers (clayfibres), rare minerals occur (percent fractions, single grains). The textural mosaic of plasma that is represented by the vermiculitized to a certain degree dioctahedrical hydromica is a peculiar feature of the illuvial horizon. One part of it has random scaly texture, the other one is more highly organized as concerns the texture. It forms fibrous - scaly, spherolithoidal and stream -like aggregates of different sizes.
Based on the material reported above we may present the following soil profile formation scheme, where the soils concerned are those being developed on clay - fibrous deposits. The primary parent rocks: water - glacial sands and deluvial loessial loams were originally clay -fibrous. After ground stabilization and surface colonization with vegetation there occurred the intensive transformation of clay - fibrous interlayers as a result of their disintegration by plant roots, cryogenic processes, washout withdescending water flows. Under the influence of gravitation and soil water the clayey particles released from the clayfibres were washed out from the upper part
161

of the profile into the lower horizons of soil. The wash out of clayey particles effected the skeleton of the interlayers and it suffered a certain shrinkage. This has result in dieappearance of clayfibres in the upper part of the modern profile and formation of eluvial horizons in it. Simultaneously with the formation of eluvial horizons there took place the process of forming of the brown compressed B^ horizon due to deposition of the clay particles both inwashed and released from the clayfibres that were included in this horizon. The clayey particles introduced and the relicts of the clayfibres partially present caused density, color and weak water permeability. After formation of the B horizon the lower clayfibrous interlayers were "preserved" by it and did no suffer the significant effect of the subsequent soil forming processes. Formation of the eluvial - illuvial layer appears to be the first stage in the evolution of these soils. On the second stage of soil development exist different processes: alteration of reduction -oxidation processes, resulting in clarification of the horizon A2 in contact with the horizon B, redistribution of iron and formation of orsteins, hydrolsysis and degradation of skeleton and plasma seeds and formation of humus. Duration of this stage is about IS thousand years and itis still going on. As a result a specific profile has formed, containing four horizons: Aj - A2 - Bj - C. Distribution of these soils on the territory of Byelorussia depend mainly upon water - ice sandy sediments and deluvial loess - like loams on the zone of the last glaciation period.
Lisitsa, V.D., Smejan.N.I., Sergeenko, V.T., Tsytron, G.S., Bubnova, T.V. Department of soil micromorphology, Byelorussian Research Institute of Soil Science and Agrochemistry, Kazintsa Str. 62, 220108 Minsk, Republic of Byelorussia.
Literatur cited 1. Arinuschkina E.V. Chemical nature and conditions of formation of the ortzands. Scientific
writers MSU. Moscow. 1939. Vol. 27 (in Russ.) 2. Afanasjev J.N. About soils in the Chech Republic. Pochvovedenije. 1926 Nr,2,-p 84-86. (in
Russ.). 3. Lisitsa V.D., Smejan N.I., Sandovich L.S. Zebra - like formation in the Byelorussia soils. Soil
of Byelorussia and her productivity. Minsk 1977. (in Russ.) 4. Lisitsa V.D., Sandovich L.S. Kurstak L.L. Material structure and genesis sandy soils of
Byelorussia. Thesis symposium of soil scientists USSR. Taschkent. 1985 (in Russ.). 5. Lisitsa V.D.. Matusevich N. A. About zebro-like interphases dernopodzolic soils, developed on
loamy loeses - like soils in Byelorussia. Soil investigations und fertilizers uses. Vol. 17. Minsk. 1986. (in Russ.)
6. Lisitsa, V.D., Sergeenko, V.T., Kurstak L.L., Matusevich N. A. Vischniakova N.N., Materials structure ortzands and clay fibrous of sandy soils in Byelorussia. Soil investigations und fertilizer uses. Vol. 21. Minsk. 1991. (in Russ.)
162

Micromorphological Analysis of the Archaeological Site "La Cueva del Raton" (San Francisco de la Sierra,
Mulegé, Baja California Sur, México)
M.M.Bergada. Departament de Prehistöria, Histöria Antiga i Arqueologia. Universitat de Barcelona. Baldiri Reixac, s/n.08028 Barcelona, Spain.
Introduction. This study is part of the research project "Sociocultural Study of the Pre-hispanic
Communities in the Baja California Peninsula" directed by Dr. Josep Maria Fullola and Dra. Maria
Angels Petit of the Department de Prehistöria, Histöria Antiga i Arqueologia de la Universitat de
Barcelona, in collaboration with U.N.A.M. -- Universidad Nacional Autónoma de México — and
I.N.A.H. — Instituto Nacional de Antropologia e Histöria - of México. The goal of the project is to
combine the analysis of cave paintings found at the site with a series of archaeological excavations, the
first ever to have been conducted in the Sierra de San Francisco.
Material and Methods. In this project we are analyzing, from a micromorphological point of
view, the sediments found in the Raton Cave. Two previous archaeological interventions were carried
out at this site in the years 1991 and 1992, at which time an occupation level was located. Radiocarbon
methods date this occupation level back to the 320 to 700 B.P.
Several soil samples were taken from one of the stratigraphic profile as well as from combustion
area located in the south-western sector of the cave. The samples were placed in boxes covered in
plaster, thereby protecting them from any perturbation.
The thin-sections were prepared using the techniques developed by the Département des Sols de
1'Institut National Agronomique de Plaisir-Grignon (France) and the Departament de Medi Ambient i
Ciències del Sol de la Universitat de Lleida (Spain).
Results and Discussion. The application of micromorphological analysis, until now little used
in the field of archaeology, has yielded optimal results in the reconstruction of the evolutionary history
of the sedimentary sequence at an archaeological site. The study of sediments on a microscopic scale
allows for a deeper examination of the genesis and nature of sedimentary transformations, including
superficial water circulation, chemical phenomena and anthropic activity, all of which will have acted
upon the sedimentary deposits either during the process of formation or during the post-deposition.
163

Although definitive results of the present study are still pending, there are strong indications that the
sedimentary processes observed at the Raton Cave are result of action by the Cantil Blanco stream. As
far as anthropic processes are concerned, the greatest effect on the site is associated with the
combustion areas. Finally, with reference to post-depositional processes, the alterations produced by
biological activity --roots and organisms- are noteworthy.
164

Commission V. Extended Summaries. Wednesday, July 13
Symposium 1D-4. Soils and Archaecologlcal Research.
Page Soil weathering a tool for datation in archaeology. Ph. Walter, L. Charlet, and M. Menu. (France) 166
Archaeological soil science: the new trend of integral investigations. V.A. Demkin, and L.S. Pesochina. (Russia) 168
Phytolith analysis in archeological soils from the Montsant Valley (Tarragona, NE Spain). J.J. i Tresserras. (Spain) 170
Soil interpretation of some roman archaeological sites in Italy and Tunisia. J.E. Foss, M.E. Timpson. R.J. Lewis, and C.A. Stiles. (USA) 172
Soils of archaeological monuments as indicators for environmental conditions in ancient times. I.V. Ivanov. (Russia) 174
Reconstruction of salt production methods using sedimentary and geochemical features in an archaeological context: example of the ancient saltworks in the Sayula Basin (Jalisco, Mexico). C. Liot. O. Grunberger, and J.L. Jeanau. (Mexico) 176
Der EinfluB tropischer Paleoböden auf die rezenten Bodeneigenschaften in einem deutschen Mittelgebirge, am Beispiel des Vogelsbergs. K.M. Emmerich, K. Moldenhauer, and Th. Vorderbrügge. (Germany) 178
Complex paleosoils in mediterranean conditions. R. Jimenez B., R. Garcia J., and J.A. Gonzalez M. (Spain) 179
Reflection of former environmental conditions and human F ^tivity in soil properties. Gy. Fiileky, and M. Takacs. (Hungary) 181
Anthropogenesis and pedogenesis at Indian Black Earth archaeological sites of Amazonic Brazil. N. Kamp f, and D.C. Kern. (Brazil) 183
A pre-hispanic period of accelerated soil erosion in Huesca area State of Hidalgo, Central Mexico. L. Vazquez S., and J. A. Zinck. (Mexico) 185
165

Soil weathering : a tool for datation in archaeology
Ph. WALTER (1), L. CHARLET (2), M. MENU (1) (1) Laboratoire de Recherche des Musees de France,
Palais du Louvre, 75041 Paris Cedex 01, France. (2) LGIT, University of Grenoble (UJF) Environmental Geochemistry Group,
BP 53X, 38041 Grenoble Cedex 9, France.
Introduction :
Lost or abandoned, the man-made objects remain buried in sediments until they are rediscovered by an archaeologist. During that period, numerous alteration phenomena occur. Some of them are, like for natural soil particles, related to how long the artefacts have been staying insoil. Studies about hydrogen and fluorine incorporation in various materials used by the prehistoric man, bring to archaeological stratigraphies important informations about chronology, and contribute to the authentication of museum objects.
Method :
Ion beams methods of analysis, such as the ones available now with AGLAE (Accélérateur Grand Louvre d'analyse élémentaire) in the Laboratoire de recherche des Musées de France provide depth resolution together with high detection sensitivity. They allow a none invasive study of archaeological artefact to pursue researches most often without sampling. In that way, the resonance nuclear reactions, produced by protons and nitrogen 15 nuclei, allow the measurement of fluorine and hydrogen concentration profiles in the outer micrometer of the surface. As examples, the obsidian hydration and the fluorine penetration in flint (1) or paleontological remains (2) show the interest of those approaches which complement the traditional methods of absolute dating such as thermoluminescence and radiocarbon.
Result and discussion :
This method has been applied to several archaeological sites from France. For example, at Fort-Harrouard, near Paris, we undertook a systematic study of flint of various ages. Fort-Harrouard is a prehistoric site witch was occupied from the Neolithic (4500 BC) until the Roman period (500 AD). Both bronze and flint arrowheads of the same particular form are found side by side in the same strata. The measurement of fluorine profile is achieved by means of l9F(p,ocy)160 nuclear resonant reaction at 872 keV. We were able to demonstrate the relationship between the depth of fluorine penetration defined as the FWHM of diffusion profile and the age estimated by the stratigraphic context (figure 1).
166

The geochemical study of the mechanisms of fluorine uptake in silica shows the competition? in archeological soils between two main phenomena :
1 - a dissolution of the surface, particularly in basic soil or with high fluorine content, 2 - a diffusion of fluorine at grain boundaries (saturation of this phenomena after several
years) and through lattice defects in the silicate mineral (at soil temperature, fluorine diffuses in ca one micrometer after 5000 years).
When the dissolution can be neglected, the results are consistent with the theory, which is the case at Fort-Harrouard.
The principles of this archaeometric research are common with those used in soil science : the alteration of geological and prehistorical object is similar nature. The present work stresses the usefulness of resonant NRA to study the diffusion of light elements in minerals. The narrow resonances are particularly useful to provide both good sensitivity and good depth resolution, thus allowing the detection of very small elemental migration within the investigated minerals.
Literature cited.
(1) WALTER P., MENU M. & DRAN J.C. (1992) - Dating of archaeological flints by fluorine depth profiling : new insights into the mechanism of fluorine uptake. Nucl. Instr. and Meih.MM, pp. 494-498. (2) ElSENBARTH P. & HlLLE P. (1977) - A non destructive method for age determination of fossile bone. Journal of Radioanalylical Chemistry, 40, pp. 203-211.
x 3 h u Z -400 < v_ z 0 p < E z u
I.A
BRONZE AGE fE MIDDLE EARLY
NEOLITHIC LATE
300
MM)
MIDDLE
n
- aa
-B
B m
a a a a D •
- 0 s
1 i
900 1400 1900 2500 4000 ESTIMATED ARCHAEOLOGICAL ACE (years 1!C)
Figure 1: Relationship between the depth of fluorine penetration defined as the FWHM of diffusion profile and the age estimated by the stratigraphic context
167

Archaeological Soil Science: the New Trend of Integral Investigations
V.A.Demkfn and L.S.Pesochina. Institute of Soil Science and Photosynthesis RAS, 142292 Pushchino Moscow Region,Russia
Introduction. The direction of attention toward complex investigation of archaeological monuments may be one of the perspective ways of considerable increase of effectiveness of paleosoil researches. Receiving with that chance of direct comparative analysis of state of soils and soil cover in different historical epochs permits to consider peculiarities of their space-time dynamics in very detail.
On the other hand, the complex investigation of archaeological monuments supplements and specifies noticeably the existing ideas of spiritual and economical activities of ancient people and the role of natural conditions in their life.
Materials and Methods. The pedoarchaeological method was used to solve the problem of the history of soil formation. The gist of this method is to compare paleosoils of archaeological monuments of various age, in particular, funeral religious constructions -barrows. Dating of monuments and, consequently, time of soil burial were carried out in accordance with the archaeological chronology and the divition into periods of cultures.
The morphological, chemical, physical, microbiological, mineralogical and other methods applying in pedology were used too. Ground burial complexes of various age, including embankment soil-ground material, paleosoils burried under them, some ritual attributes and modern background soils were the explorative objects. Investigated archaeological monuments were constructed by different cultural-historical societies in the Bronze Age (the second half III-II millenium B.C.), Early Iron Age (the V centuries B.C. - IV centuries A.D.) and in the Middle Ages (VIII-XIV centuries A.D.).
Results and Discussion. The paleopedological and archaeological problems were realized to some degree for the region of arid and desert Steppes of the Eastern Europe.
Soils and soil cover were characterized by the most changeability in the III-II millenium B.C., which had the single direction and different scales and as a rule was irreversible. During the last II millenium these soils are mainly in quaziequilibrium state. Forming of modern soil-geographic zones occured in the middle and late Holocene and was completed at the end of the I millenium B.C. In this region the alloevolution took leading place during the Bronze Ages while the autoevolution - from the Middle Ages. The thickness of humus horizon (AI + B(BD) of investigated soils increased negligibly. The rate of this process was only 0.5-1.5 mm per 100 years. During the observed chronointerval the descending migration of watersoluble components, predominated. The maximum intensity of this migration was in the II, seldom in the I millenium B.C. The redistribution of carbonates from the upper part of the profile to the middle one, forming
168

accumulative zones was mainly observed. In the most cases the stores of CaCC>3 in 0-2 m layer remained constant, sometimes decreasing a little. The rate of the lowering of the effervescence level was 0.04-0.08 in loamy soils, and 0.14-0.30 mm per year in sandy soils. Intensity of the carbonate leaching from the upper 0.5 m - layer varied within 3-15 g/m2 per year. The reserves of easily soluble salts and gypsum in 0-2 m layer decreased from 60 (on the North) to 90% (on the South), consequently the difference between soils of arid and desert Steppes was dimished noticeably. The average rate of their leaching from 0-2 m layer was respectively 0-8 and 0-12 g/m2 per year increasing in some periods to 10-20 and 20-40 g/m2 per year. Average rates of the lowering of the depth of salt accumulative horizon were 0.1-0.8 mm and of gypsum horizon - 0.1-1.8 mm per year. Maximum rates were 1.3-1.4 and 3-4 mm per year respectively.
Changes of soil forming stages coincided as a rule with chronological boundaries of archaeological cultures. The maximum variety of soil-landscape conditions occured during the existence of frame-grave ("srubnaja") cultural-historical society (the second half of II millenium B.C.) that was the most powerfull and numerous with highly developed complex economy. The appearance of the nomad cattle-breeding (I millenium B.C.) was synchronous with the formation of arid and desert Steppe landscapes all over the territory. The use of field and laboratory methods of soil science to study barrow constructions allowed us to carry out not only natural but also historical - sociological reconstructions. The technology of building and architectural peculiarities of archaeological monuments, their relative and absolute dating, the role of separate attributes of funeral ceremony, problems of economical and social lifes of ancient people were elucidated by these methods.
Conclusions. The complex investigations of archaeological monuments are the most effective to solve the problem of geography and evolution of soils and soil cover in the Holocene, to define the rate and direction of proceeding of elementary soil processes, to reveal the roal of soil-landscape conditions in economical and ritual-mythological activities of the ancient people.
The original and novelty of applied approaches, solved problems and received information in the study of archaeological monuments give ground to determine the new direction of scientific investigations as archaeological soil science or pedoarchaeology.
169

Phytolith analysis in archaeological soils from the Montsant Valley (Tarragona, NE Spain)
Jordi Juan i Tresserras. Seminari d'Estudis i Recerques Prehistöriques, Area de Prehistdria, Facultat de Geografia i Histöria, Universitat de Barcelona, C/Baldiri i Reixac, s/n Torre B pis 11, 08028 Barcelona, Spain
Introduction
Phytolith analysis are included in the archaeobotany as an efficacious technique for an historical reconstruction of the landscape and as a new instrument of the paleoethnobotany in order to know what kind of plants had been used by man and the finality of this use.
This paper presents the preliminary results of the investigation of calcium oxalate and opal phytoliths in Epipaleolithic levels at the Abric del Filador as a part of an interdisciplinary project in the Montsant Valley. These results are evaluated in relation with a diverse set of paleoecological issues (1).
Materials and Methods
The Abric del Filador is an archaeological site situated in the Middle Montsant valley (Tarragona, NE Spain), in an eroded Stampien and Sannosien Oligocene area (conglomerates and Tertiary sandstone) in the Margalef Formation, on the bank of the lower Montsant River, a tributary of Ebro river (2).
Soil samples from the Epipaleolithic levels were collected from the bottom of the profile upward in the stratigraphic columns and additional samples were taken in current excavation from ash layers or fireplaces.
Phytoliths were extracted in the sand fraction and in the three silt fractions obtained by a sedimentary process according to Stokes method (3). The plant remains were sorted under a scanning electron microscopy. Phytoliths were identified with the help of the reference collection in our laboratory.
Results and Discussion
The radiocarbon dating analysis of the charcoal pieces from the levels 4 and 7 indicate the association of these levels with the Pre-Boreal (10150-8750 B.P.), a transition climatic phase between the Last Glacial and the Postglacial. The clime of this period can be defined as cold and wet, enabling the definition by cold winter and by an important ameliorating climate and certain wetness on summer.
170

The phytolith record is dominated by conifers in the arboreal taxa (Pinussp. and Juniperus sp.). These species, indicators of an open landscape, must have occupied the slopes and the highlands. Quercus sp. were situated in the wettest and the most temperate areas of the valley. Some investigators suggest the existence of vegetation refuges during Glacial and Late Glacial periods , probably corresponding to the existence of the water table, in response to dry conditions (4). We note also the appearance of thermophilic taxa (Olea sp. and Phillyrea sp.). Other species like Salix, Ulmus ,Corylus and Prunus grow by the river bank. Non arboreal taxa are dominated by Poaceae, Asteraceae tubliflorae and Filicalia.
A comparative study of another records from Catalonia and the South of France confirms the vegetation patterns and the biochronological model in the northwestern Mediterranean (5)
Literature cited
(1) Juan, J. 1993. Analisis de fitolitos en suelos arqueológicos: el Abric del Filador (Margalef de Montsant, Priorat, Tarragona). Nuevas aportaciones paleoetnobotanicas. Degree Thesis. University of Barcelona.
(2) Garcia-Argüelles, P. 1990. Las industrias epipaleolfticas del sur de Catalufia: antecedentes, desarrollo y evolution hacia nuevas formas neoliticas. Colección de Tesis Microfibradas n° 625. University of Barcelona Press.
(3) Garci'a-Calderón, N.E.; Juan, J.; Pinilla, A. & Galicia, S. 1993. Aportación de los analisis fitolitológicos al estudio de un andosol en el Nevado de Toluca o Xinantécatl, México D.F. Resultados preliminares. XII Congreso Latinoamericano de la Ciencia del Suelo. Salamanca, pp. 1498-1506.
(4) Yll, R. & Pérez-Obiol, R. 1992. Instalación de los bosques deducida a partir del analisis polinico de un sondeo marino del Delta del Ebro (Tarragona, Espana). Orsis 7: 21-30. Barcelona.
(5) Vernet, J-L. 1973. Étude sur 1'histoire de la vegetation du Sud-Est de la France au Quaternaire, d'après les charbons de bois principalement. Paléobiologie Continenrale 4: 1-90. Montpellier.
Heinz, C. 1991. Upper Pleistocene and Holocene vegetation in the south of France and Andorra. Adaptations and first ruptures: new charcoal analysis data. Review of Paleobotany and Palinology 69: 299-324. Amsterdam.
171

Soil Interpretations of Some Roman Archaeological Sites in Italy and Tunisia
J.E. Foss*, M.E. Timpson, R.J. Lewis, and C.A. Stiles, Department of Plant and Soil Science, Knoxville, 77V, and Oak Ridge National Laboratory, Oak Ridge, 77V, USA.
Introduction. The application of soil science techniques in the study of archaeological sites has increased substantially in the past decade in the U.S. This team effort with archaeology and other associated disciplines has helped develop Holocene history and to better understand the rate of soil weathering processes. Roman sites are of special interest because of the known chronology and the opportunity to evaluate human impact on the environment. The objectives of this study were: (1) determine the morphological, physical, and chemical characteristics of major soils occurring in the gardens and agricultural areas of some Roman archaeological sites and (2) develop the environmental history associated with each site.
Materials and Methods. The sites involved in this study included Pompeii, Boscoreale, Villa Oplontis, Herculaneum, and Hadrian's Villa in Italy and Thuburbo Majus in Tunisia. In all sites except Hadrian's Villa, the Roman level was buried by more recent sediments; those at Pompeii, Boscoreale, Villa Oplontis, and Herculaneum were buried by the A.D. 79 eruption of Mt. Vesuvius and later eruptions. The Thuburbo Majus site was buried by local rubble and possibly some eolian sediment. Profile descriptions were prepared and samples collected from a number of locations at each site; the number of sampling locations varied depending on the objectives of the study. At Hadrian's Villa, for example, some 49 locations were sampled to determine elemental distribution in soils. Laboratory analyses included particle size, total carbon, pH, and elemental distribution (Al, As, B, Ba, Ca, Cd, Co, Cr, Cu, Fe, K, Mg, Mn, Mo, Na, Ni, P, Pb, S, Sr, Ti, and Zn). The elemental distribution was determined using an extracting solution of HC1-HN03 acid of 0.61 and 0.16 molarity, respectively and analyzing the extract using ICP-AES.
Results and Discussion. The identification of the Roman levels at the buried sites was possible by observing paleosol development. Paleosols generally showed Ab horizons and sometimes associated Bwb horizons. Soils in the Pompeii and Herculaneum area correlated with the Roman level gardens and agricultural areas generally had a series of Ab horizons sometimes extending to depths of one meter; this has resulted from incorporation of reoccurring volcanic sediments into the soil matrix. In the Pompeii area, paleosols were identified from the A.D. 79 period and also major surfaces associated with stable periods when Mt. Vesuvius was inactive. The Avellino (3360 YBP), Mercato (7900 YBP), Lagno (11,400 YBP) and Green (15,500 YBP) paleosols were identified at various locations.
An interesting method developed in this project was the identification and correlation of paleosols based on Ba/Pb ratios. This method was possible with the Avellino, Mercato, Lagno and Green paleosols at Pompeii, Boscoreale, Villa Oplontis, and several sites in local quarries.
172

Soil chemical analyses made on Roman period gardens and agricultural areas show elevated concentrations of a number of elements; these generally include extractable As, Cu, Mn, Ni, P, Pb, and Zn. Table 1 gives the ratio of these elements in a control soil to that from specific sites in Hadrian's Villa. The Roman site had between 2.7 to 8.8 fold increase in Cu and a 1.5 to 5.0 fold increase in Zn in comparison to off-site contents. The Pb content in the Villa soils ranged from 47 to 953 mg/kg whereas off-site the range was 19 to 29 mg/kg. At Thuburbo Majus in Tunisia, the Roman level showed consistently high concentrations of As, Cr, Cu, Fe, Ni, P, Pb, and Zn when compared with the off-site location. The increased Pb content in the Roman levels is of special interest, but the anthropogenic source(s) of the Pb have yet to be identified.
Soil science has a great opportunity to contribute to archaeological studies, but in addition we can learn a great deal about weathering rates and human impact on the soil environment. The use of paleosols for identifying Roman levels is effective, and the laboratory analyses provide more detailed data for the interpretation of the environmental history of archaeological sites.
Table 1. Ratio of selected extractable elements in control soil to that from specific sites within Hadrian's Villa, Tivoli, Italy.
Profile1
Element P-l P-2 P-7 P-8 P-9
As 1.82 1.0 2.6 2.4 1.0
Cu 4.4 3.2 8.8 7.0 2.7
Mn 2.7 1.4 2.6 2.5 1.6
Ni 1.8 0.9 1.9 1.8 1.1
P 1.9 1.1 4.3 2.8 1.1
Zn 3.8 2.7 5.0 5.0 1.5
1. Profiles were sampled in several gardens and olive groves. 2. Ratio of mean extractable element in control soil to mean of specific site, not weighted for
horizon or profile thickness.
173

Soils of Archaeological Monuments as Indicators for Environmental Conditions in Ancient Times
I.V.Ivanov. Institute of Soil Science and Photosynthesis Russsian Academy of Sciences, 142292 Pushchino, Moscow Region, Russia
Introduction. When studying archaeological monuments, indicating human activity in the past, paleopedological methods can be applied for the reconstruction of environmental conditions. The use of paleosols as evidence for environmental changes is based on the tight relationship between soil properties, soil processes and soil forming factors. Soils are the landscape mirror and they reflect the history of environmental evolution.
Materials and Methods. The research, launched in 1975, has been performed in the arid and semi-arid regions of the Former Soviet Union (1). Chernozems, chestnut, brown semi-desertic, fluvial soils and solonetzes were examined in the basins of Volga, Dnjepr, Don and Ishym. Buried soils from different epoches (mesolithic, neolithic, eneolithic, bronze, iron and middle-ages are compared with recent background soils.
Among the archaeological monuments we will highlight the ancient city Arkaim (1700 B.C.), situated in the South Ural. Arkaim is considered to be one of the ancient centers for the development of the arian race. The monument is characterized by wood-ground architecture with concentric circles, segment and sector construction, the presence of ditches, banks and habitation. About 200 archaeological objects were analysed.
Soils which were found below loamy clay banks (1 meter high) are characterized by a satisfactory preservance of soil properties. Soils of ditches and depressions make it possible to study processes which are typical for hydromorphic conditions. Soils on banks make it possible to study primary soil formation. Studying buried surfaces results in information about wind and water erosion and about anthropogenic impacts. The author has formulated different methods for studying evolution and age of soils (2), such as the soil archaeological method, the chronological linkage method (with horizontal and vertical soil chronosequences) and others.
Results and Discussion. The evolution of automorphic soils on dissected clay loamy plains with a deep ground water level is called meso-xeromorphic. It reflects the increase or decrease of climatic humidity through changes in the depth, composition and level of salts, humus accumulation, the level of exchangable sodium and the taxonomie soil unit (south chernozem = ordinary chernozem, chernozem = chestnut soil).
Soils of the slightly dissected clay plains with low ground water levels (less than 7-10 m) are characterized by a hydromorphic and automorphic type of evolution. They are very sensitive for climatic changes. An increase in annual precipitation results in the rise of water table, while aridization of the climate causes a fluctuating decrease of the ground water level, an increase in their mineralization as well as in salinization and alkalinization of soils (zonal soil types meadow soils, meadow soils solonetz, solonetz zonal soil types).
Sandy soils of eolian plains are characterized by a discontinuous deflation type of evolution which is controlled by the climatic factor in a different way than the above mentioned evolution types, and which also depends on cattle density or human activity in the area. Under aridization the deflation of soils takes place in major parts of sandy plains. It leads to the formation of eolian pits and poles and to burial of soils by eolian
174

with vegetation. Forest ecosystems become dominant in some areas of eolian plains. This leads to the formation of sod-speppe soils with thick, carbonate-free A-horizons, characterized by a moderate humus content and recognizable structure development. The deflation phases show a synchronisity with Kaspian sea regressions, while stages of soil formation fall within Kaspian sea transgressions.
The formation of fluvial soils is dependent on alluvium deposition rates deposits. Sedimentation which took place during 4000 years in the highest floodplains of lowland rivers has lead to the formation of 20-30 cm thick alluvial deposits. Solonetzes occuring in floodplains and in clayey lowlands are dated as being 3000 years old.
Evidence of the coldest continental climatic conditions is shown by the occurrence of cryogenic features like the presence of polygonality, cracks and the translocation of soluble organic matter. Climatic changes, resulting in a higher temperature and humidity, can be seen in soil profiles as the leaching of soluble salts, precipitation of carbonate mycelium in surface horizons and the presence of abundant worm channels. The age of the studied soils and the elapsed time since the appearance of relict soil features have been determined. The following climatic fluctuations have been identified for the Northern Black Sea steppes:
Humid climatic conditions with warm winter periods occured 5500 years ago, accompanied by transgression of the Black Sea (carbonate mycelium, chernozems with gypsum on a deep level in the soil profile, abundant worm channels). A dry continental climate occurred 4000 years ago which resulted in lowering of the sea level (southern chernozems with a gypsic horizon and accumulation of calcite close to the soil surface, dessication cracks, rather high levels of exchangable sodium, translocation of organic matter, rare occurrence of worm holes). A more humid, less continental climate occurred 3000 years ago (ordinary chernozems, thicker A-horizons, accumulations of gypsum deep in the soil profile). A dryer climatic period occurred 2500 years ago, with weak and short sea regressions (ordinary chernozems, occurrence of a gypsic horizon closer to the surface, stable depth of calcium carbonate precipitation). 2000 years ago the climate became again more humid. Since that time no further distinct climatic changes occurred. The sea level is stable (ordinary chernozems with the accumulation of gypsum deep in the soil profile, weak fluctuations of the calcite precipitation zone).
When studying buried and present day steppe soils (chernozems, dark chestnut soils) an important relationship between the soil formation rhythm during the last 5000 years (changes in A-horizon thickness) and the periodicity of solar activity has been found (3). Intensive soil formatiom with increasing thickness of A-horizon and favorable ecological conditions fall within epoches of minimum solar activity, which can last from 150 to 500 years. Processes of water erosion, extensive deflation, decrease in A-horizon thickness and deterioration of ecological conditions coincide very closely with epoches of maximum solar activity, which also extend over 150-500 years.
Literature (1) Ivanov, I.V., 1992. Evolution of steppe soils in the Holocene (Russia). (2) Ivanov, I.V. & Alexandrovskiy, A.Z., 1987. Methods for the study of the evolutions of soils. Soviet Soil Science, N 3. (3) Eddy, J.A., 1977. The case of missing sunspots. Scientific American, N 3.
175

Reconstruction of salt production methods using sedimentary and geochemical features in an archaeological context : example of the ancient saltworks in the Sayula basin (Jalisco, Mexico)
C. Liot, O. Grunberger, J.L. Janeau. Orstom, 609 calle Cicerón, col. Los Morales, 11530 Mexico D.F.
Introduction. The study of production systems associated with salt development, shows that the production line is controled by chemical, physical or geographical natural parameters. These factors, sometimes very confined, impose suited technical replies ; this underlines the necessity of a contextual analysis. Otherwise, by characterizing modes of salt production, we can find a great diversity of technological combinations in a set of few manufacturing units. This induces the limits of the archaeological materials and structures study. Infact, the saline activity is characterized by a specific fitting out, inscribed in the morphology of the site, and by physico-chemical processes which migth leave traces in the sediment. On account of their large mobility in the environment, salts not seem to be well suited to an archaeological research ; however, the recent age of the sites, the climate (semi-arid with two oppposite seasons) and the nature of the Sayula basin (endoreic, presence of a temporal lake during the rainy season, and relief of a playa during the dry season), represent a favourable context to study the geochemical signs of the saline activity. The object of the study is on the one hand to identify the geochemical and sedimentary features linked to the saline development, on the other hand to characterize stages of production, from the extraction area (quality of the brine), to the manufacturing techniques (geochemical and sedimentary datas associated with archaeological and ethnological information).
Materials and methods. The Sayula basin is a graben, located in the transmexican Neovolcanic line. The saline development occured near the playa, where runoff waters arrive, containing soluble salts from rocks weathering. During the dry season, salts are accumulated at the playa surface, by the capillary rising of the groundwater table evaporation, forming a saline layer named salitre. The saline exploitation stopped about fifty years ago, in Poncitlan. on the east side of the basin : the salitre was harvested and filtrated on a trellis made with wood and plants, the resulting brine was collected in vats and concentrated by solar evaporation. Three archaeological sites have been located : Cerritos colorados. in the north, is constituted by mounds of a few meters, presenting a divers material which lets us assume of a multifunctionality of the site ; however, the ceramic material shows a high density of uniform shards corresponding to salt moulds fragment meet in other sites ; Carmelita is a large site, on mounds in the west side, surrounding the playa, containing numerous lithic and ceramic materials. In those areas, the purpose was to make out sequences of chemical concentration and underline discontinuities (pH, conductivity and distribution of main salts), then correlate them with natural or anthropic features characterized in thin sections. We have proceeded to a sampling in stratigraphy. In Cerritos colorados and Carmelita, several profiles have been digged out along a section going from the playa to the site. Samples have been taken in the accumulations of filtration scraps (leached soils) of Poncitlan. The geochemical measures have been carried out on 1/5 soil extracts in water, in the soil science laboratories of INAPG (Institut National Agronomique de Paris-Grignon) and ORSTOM in Paris : sodium and potassium on atomic absorption spectrometer, calcium and magnesium on atomic emissing spectrometer, carbonates and bicarbonates on acidometry of HC1, sulphates on ionic chromatography in liquid phase, and chlorides on colorimetry with a Technicon. Moreover, we have carried out an evaporation simulation with the program AQUA (soil science laboratory of INRA, Rennes), basing on the geochemical datas of the waters sampled in the lake and the groundwater table beyond the playa, in order to assess the theoritical chemical concentration sequences (nature of the brine). Thin sections have been
176

made with indurated soil samples, and examined on a petrographic microscope at the laboratory of micromorphology at INAPG. The purpose was to identify diagnostic features of sedimentary processes, using the study of elemental components : size, shape, arrangement, mineralogical determinations (1). The anthropic layers have been characterized by the presence of anthropogenic constituents, and compaction and aggregation features (2).
Results and discussion. The pH is high, it varies between 9 and 10, without characteristic changing. We are in a carbonate-sodic environment with an importance of chlorides in some layers. During the simulated evaporation, the minerals precipitate according to a gradient of ionic concentration and solubility (3). Carbonates and sodium are dominant in the playa deposits, so nahcolite (NaHC03) precipitate first, then halite (NaCl), at the end of the concentration some mirabilite (Na2S04) precipitate. From those datas, variable filtration and settling times can be implemented, in order to collect only nahcolite or halite or sulphates, as it is done in other areas (4). The relation between geochemical and micromorphological datas enables to distinguish natural layers from anthropic layers undifferentiated or linked to the saltworks, and to characterize stages of the production line. In Cerritos colorados. the playa sediments show high saline values. The site section presents an anthropic morphology, containing important layers of leached soils similar to the filtration scraps of Poncitlan. No associated structures have been recognized, for this stage of filtration. These filtration scraps contain numerous traces of straw which, by increasing the porosity of the sediment, facilitates the water infiltration and so the leaching of salts. Otherwise, this section shows layers with carbonate aggregations of several hundred micrometers, containing mumerous fragments of gasteropodes shells and phytolithes. These layers present high grade of salts with a dominance of chlorides and sodium, they correspond to anthropic layers probably associated with a salt processing. Beyong the archaeological material, the fragments of salt moulds, inform us about the manucfacturing stage consisting in drying and packaging the salt by firing. In Carmelita. the playa sediments have lowest salt contents. The profiles of the site section show important aeolian deposits, and some lake deposits situated up to one meter over the current playa lake. Some aeolian sediments are characterized by a high salt grade, mainly in carbonates and sodium, due to playa supplies in form of salt-pellets (5). In those profiles, we can also identify some anthropic layers, presenting low salt contents, which underline an occupation of the site without specifying its function. On the site heights, we identify a layer in beds with vesicular porosity (sign of a rapid evaporation), containing numerous anthropogenic constituents (little shards of ceramic and charcoals) and phytolithes. This layer corresponds to an anthropic activity area with textural and structural characteristics of settling, associated with the first stages of the production line, which consist in impurities elimination from the brine without salts precipitation. In conclusion, the saline development leaves geochemical and sedimentary specific features in the archaeological layers. The crossed study of geochemical and sedimentary datas of the site and its environment, provides supplementary information for the reconstruction of ancient salt manufacturing methods.
Literature cited. (1) Bullock P., Fedoroff N., Jongerius A., Stoops G., Tursina T., Handbook for soil thin section description, Waine Research Publishers, Woverhampton, 1985. (2) Courty M. A., Goldberg P., Macphail R., Soils and micromorphology in archaeology. Cambridge University Press, 1989. (3) Eugster H. P., Hardie L. A., Saline lakes, in Lakes : chemistry, geology, physics, ed. A. Lerman, New York, 1978, pp 238-293. (4) Gouletquer P., Fabriquer du sel. in JATBA (Journal dAgriculture Traditionnelle et de Botanique Appliquée), vol XIII, Paris, 1984. (5) Cooke R., Warren A., Goudie A.. Desert geomorphologv. University college, London, 1993, pp 50-67 and 202-219.
177

Der EinfluB Tropischer Palaoböden auf die Rezenten Bodeneigenschaften in einem Deutschen
Mittelgebirge, am Beispiel des Vogelsbergs K.-H. Emmerich, k. Moldenhauer, Th. Vorderbrügge. Hessisches Landesamt für Bodenforschung, leberberg 9, 65193 Wiesbaden
lm Rahmen des vom Umweltbundesamt geförderten Forschungsvorhabens der geolo-gischen Landesamter "Empfindlichkeit der Boden gegenüber Schwermetallen unter Berücksichtigung geogener Grundgehalte sowie anthropogener Zusatzbelastung" wurden vom Hessischen Landesamt für Bodenforschung umfangreiche bodenkundliche Untersuchungen in Boden über verschiedenen Ausgangsgesteinen durchgeführt, urn so Gesetzmafiigkeiten der Schwermetallverteilung in typischen Bodenlandschaften des Mittelgebirges zu erfassen. In den drei hierfür ausgewahlten Projektgebie-ten Taunus, Vogelsberg und Spessart wurden ausgewShlte Testflachen engmaschig sondiert und jeweils rund 300 Bodenprofile im Abstand von ca. 10 - 15 cm horizontbezogen beprobt. So liegen aus jedem Gebiet rund 2000 Proben vör, die von der BGR auf ihren Schwermetallgehalt hin untersucht wurden. ErgSnzend hierzu erfolgte unmittelbar im Gelande an jeder Probe eine quantitative Abschatzung der petrographischen Zusammensetzung des Augangsmaterials und eine detaillierte Aufnahme der pedogenen Überpragung.
Im folgenden wer-den- d4» wichtigsten Erfeonis-se für d»s--Basa4tgebtet (Vogelsberg) dargestellt.
Die Boden sind genetisch eng mit der Verbreitung der pleistozanen Soli-fluktionsschuttdecken und den darim aufgearbeiteten Paiaobodenresten ver-knüpft. Sie weisen infolge der historischen Landnutzung vielfaltige Ero-sionsstadien auf, woraus sich ein kleinraumig sehr rasch wechselndes Boden-typenmuster ergibt.
Die unterschiedliche Verwitterungsintensitat der Paiaobodenreste spiegelt sich nicht in den geogenen Grundgehalten der Schwermetalle wider.
Die Schwermeta11gehalte der Boden entsprechen denen ihrer Ausgangsgesteine. Im pleistozanen Periglazialraum sing die Boden in pleistozanen Deckschich-ten entwickelt. Diese bilden das Ausgangsgestein und bestimmen somit den Schwermetallgehalt.
Für die vertikale Verteilung der Schwermetallgehalte im Bodenprofil ist die lokale Abfolge und lithologische Zusammensetzung der periglazialen Deckschichten bedeutsamer als pedogenetische Translokationsprozesse.
Boden aus Deckschichten über Basalt weisen teilweise sehr hohe geogene Schwermetallgehalte auf.
178

C O M P L E X I> A L E O S O I L S I N M E D I T E R R A N E A N C O N D I T I O N S
R. Jimenez Ballesta *, R. Garcia Jimenez * and J. A. Gonzalez Martin **. (*) Dt" Quimica Agricola, Geologia y Geoquimica. (**) Dts Geografia Fisica. Univ. Autónoma. Madrid 28049. Spain
Introduction The identification of paleosoils present numerous obstacles, like the superposition of horizons, paleosoils development on eroded horizons etc. In the Spanish central region there are extensive flat areas of limestones occupying one of the landscapes most representatives of Mediterrnean relief; the lime plateau, in which Terras Rossas (cromic Luvisols) developed. In this paper, paleopedological paradigm of a well developed soil profile, formed during several pedogenetic stages, is studied.
The sequential profile. Localization : near Colmenar de Oreja (Madrid). Coordinates : 3a23x-40a06x. Lithologic material: pleteau limestone. Climate: mediterranean continental xerofitic. Sequence of red calcareous paleosoils subdivided into:
Ap-Bw-Ckm-2Bk-3Btl-4Bt2-4Ckm2-5Bt3-5Ckm3-6Bt4-6Ckm4-7Bt5-7C-8Bt6-8Btkl-8Ckm5-8Ckm6.
The profile has been severely truncated by several erosional surface periods with the development of red argillic and petrocalcic horizons. Boundaries frequently coccur between horizons resemble layering. These changes are parallel to the surface of truncated paleosoils. The clay rich paleoargillic horizons display a higher degree of ped organization.
Results and discussions Pedogenetic evolution of clay minerals, macromorphology and, especially, micromorphologic features identify these horizons as paleosoils. These horizons, whose thickness varies between 90 and 150 centimetres, have moderate calcium carbonate contents; little content of organic matter and offer neutral to moderate pHs.
Table 1. Results (in %) of clay minerals and iron. -
Horizon Ca CaNaF KF Q Filo I K S SE FeL FeT
0.08 2.16 0.23 2.16 0.44 9.57 0.45 3.19 0.71 11.31
0.78 12.06 0.43 6.30 0.17 3.26
179
Ap 41 b Bw 6 9 6Bt4 44 10 6Ck4 70 3 7C 46 2 8Bt6 16 4 8Btkl 5 3 8Ck5 69 8Ck6 100
51 9 33 24 43 46 39 70 6 4 20 33 13 42 26 32 18 9 28 20 57 23 34 23 22 21 43 49 57 24 19 16 15

Ca=calcite, CaNaF=CaNa feldspar, KF=K feldspar, Q=quartz, Filo=Phyllosilicates, I=illite, K=kaolinite, S=smectite, SE=sepiolite, FeL=free Fe203, FeT=total Fe203.
Clay mineral analyses display vertical variations including changes in illite/smectite/sepiolite. Dominant vertical variations were established before and during complex paleosoil formation. But paleoweathering conditions are largely analogy with modern Terra Rossas.
Thick red interformational paleoargillic horizons represent longer periods of exposure where drainage was good and pedogenesis proved similar to actual Terra Rossas formations. These horizons reflect a nearly complete leaching of carbonate but the major factor was a moisture deficient Mediterranean climate, which effectively immovilized carbonates in soils. These phases were interrupted by others of pedological instability. This is how moments of recarbonation and others of decarbonatation occurred. Calcium carbonate accumulations proved to be by physical/chemical origin in semiarid Mediterranean conditions. Exposure of these conditions would have enabled supersatured solutions to be formed that are neccesary for displacive crystalization, Wats 1978. According to Feodoroff and Courty 1993, accrection of calcite is independent of rubification and iluviation processes, as well as dissolution of carbonates.
The genesis and evolution of the complex profile is associated with a complex synclinal, in which successive eroded phases cause gradual increments of sediments/soils, that cause accumulative horizons (Birkeland 1984).
Processes
Limestone dissolution argilluviation + rubefaction erosion and/or accumulation with phases of humification and decarbonatation-recarbonation in différents intervals.
In summary, soil genesis is attributed to local paleomicrotopography setting, tectonic and/or climate change.
Literature Cited
(1) Birkeland P. 1984. Soils and Geomorphology. Oxford Univ. Press. 372 pp. Nuew York. (2) Feodorof N. and Courty M. 1993. Relationship between calcite accretion and other soil forming processes in red Mediterranean soils. 2nd Int. Meeting on "Red Mediterranean Soils ". Adana Turkiye.pg 36-37. (3) Watts N. 1978. Displacive calcite :Evidence from recent and ancient calcretes. Geology 6, 699-703.
180

Reflection of former environmental conditions and human activity in soil properties
*Gy. Füleky, and 2M. Takacs. ^-Department of Soil Science and Agricultural Chemistry, University of Agricultural Sciences Gödöllö, H-2103 Gödöllö, Hungary, -Department of Soil Science and Agricultural Chemistry, University of Horticulture and Food Industry, H-1118 Budapest, Hungary.
Introduction. In the Carpatien Basin, as a consequence of lowland character, the level of water of rivers and lakes, as well as of soils and the type of vegetation are principally influenced by the amount of precipitation and by the temperature. The periodical changes of these conditions are caused by the change of climate. For thousands of years the higher hills between the permanent and temporary rivers and lakes have been the only possibilities for settle down. In rainy period people had to move to the higher places on the hill while in long dry period to the lower places. The changes of environment and circumstances of life are supported both by archeological findings and by the observations of soil scientists.
Since Arrchenius it is known that the phosphorus content of soil indicates the place of one-time settlement. It is supposed that phosphorus content shows the intensity of human activity (duration and magnitude) on a given place, as well. Phosphorus compounds are favorable in this respect while the rate of their accumulations and transformations are slow enough to follow the changes of the environment and the human impact. Thus the consequences of former conditions could be determined by the phosphorus content of soil for thousands of years.
This paper presents some examples of both phenon ajia from the recent results of the Hungarian archeology.
Results and Discussion. Analysis of soil morphological data 1. At Budapest beside a former narrow branch of Danube a trace of Roman granary was excavated. In the 1 st century AD the branch was flooded and practically embanked. On the place of the branch a peat soil started to form. This can be seen very well 4 m below the surface. In the peat soil a Roman coin from the 1 st century AD was found indicating the continuous commerce of cereals. Other findings prove that the surface of the former river branch was already dryland in the beginning of 2 nd century AD. It shows that the formation of a peat soil continued for 50-70 years. 2. A small hill rounded by a former river at the river Körös was inhabited since the Stone Age. The findings of this age were excavated from the 50-70 cm depth. The thickening of humus layer was about 50-70 cm in the last 6-7 thousand years. The growth of the humus layer, mainly from above direction, amounted about 10 cm per thousand year. 3. At Ménföcsanak, at the flooded area of Marcal and Raba rivers is a small hill inhabited also
181

for thousands of years. If the places of former settlements are put on a map, can be seen, that they moved simultaneously with the actual water level between the top of hill and the river. The time to time high water level can be proved by the shells found on the higher places of the hill in holes of waste and by the lime accumulation of the meadow soil forming process. 4. At river Tisza in a Bronze Age cemetery at PolgaY the bones were cemented together with a hard layer. It was also a lime accumulation following the meadow soil forming process resulted by the high water level. 5. There is an example for the temporary sinking of water level as well. There are some symptoms of former forest soil formation on a hill rising from the flooded area of Répce river. The reddish color can be found at 50-70 cm depth below the surface. In the same depth some findings of the Stone Age were excavated. It proves that in that time the water level was deep enough, and the soil forming conditions preferred the forest soil and not the meadow soil formation. Soil phosphorus-an indicator of human activity 1 At Endród on the place of a supposed former settlement there was close correlation between the phosphorus content of soil samples and the number of fragments collected from the same area. Both methods indicated well the place of the settlement. 2. At Babarc located on a hilly area in Transdanubia both the magnetic measurements and soil phosphorus content indicated correctly the place of a Roman farm. Soil phosphorus content showed the right situation despite of a long grazing period and the large-scale farming practice in the recent decades. 3. At Endród not far from the river Körös on the above mentioned hill the phosphorus accumulation was in the soil layer below 70 cm. The archeological findings of Stone Age and the high phosphorus content of this layer prove the intensive use of this area in the Stone Age. 4. At Tisza river in a Bronze Age cemetery at Polgar there were huge soil phosphorus contents measured comparing with the undisturbed soils. In a tell of Stone Age at the same area the soil samples from the holes of waste accounted also some thousands of ppm P. 5. At Üjszentmargitta on a salt affected area on the Hungarian Lowland some deviations were found from the usual relationship between the inorganic phosphorus fractions of soil and pH. This deviations can be explained by the fact, that the inorganic phosphorus compounds of soil indicated not the present situation but a certain extent the effects of former meadow soil formation which existed many years ago.
Conclusions. Deviations in the morphological characteristics of soils indicating the presence or lack of certain soil forming processes give the possibility to reconstruct the former environmental conditions. The analysis of deviations is especially effective if a reference soil exists. Soil phosphorus analysis is an excellent tool in the examination of impact of men on the environment. Sometimes it helps to show the changes resulted by the environmental effects, too. Phosphorus compounds are stable enough to exist unchanged in the soil for a long time and labile enough to follow the changes of human activity and environmental conditions, as well.
182

Anthropogenesis and Pedogenesis at Indian Black Earth Archeological Sites of the Amazonic Brazil
N. Kampf, and D. C. Kern. Departamento ed Solos, Facultade de Agronomia-UFRGS, CP 776, Porto Alegre, RS 90001-970, and Museu Paraense Emilio Goeldi, Belém, PA, Brazil
Introduction. Indian black earths occupy small patches scattered within amazonic upland soils, they commonly are found near waterstreams, and a.re identified by unusual features for these soils: dark matrix colors of the toplayer, presence of potsherds and lithic artifacts, and a high chemical fertility.
The more widely accepted theory of black earth genesis is based on anthropic activity developed at Precolumbian indian settlement areas, and interrupted in early-Columbian times due to the gradual disappearance of the indigenous population. Thus, according to radiocarbon dates of different sites they Are not older than 2000 years. As the evolution of black earth soils continued further by pedogenesis they represent a poligenetic system influenced by ancient anthropogenic and by previous plus actual pedogenic processes.
This study reports the effects of the ancient anthropic action and the evolution of amazonic black earth soils by using pedogenic concepts to complement archaeological data.
Materials and Methods. Three archaeological sites (PA-0R-73:Colonia; PA-TR-2:Area 11; and PA-MP-l:Tres Ilhinhas) were selected in the region of Cachoeira-Porteira, Oriximina County, in northeastern of Para State, Brazil. The catena concept was used to locate transects along the steepest slope gradients, and for sampling of soil profiles at regular intervals of 10m. The fine earth fraction (<2 mm) was analysed for: pHCHaO); Ca, Mg , K, and Na, extracted with IN pH7 NrU-acetate; Al extracted with IN KC1; organic C by the Walk ley-Black method; P extracted with Mehlich-1; Nl-U-oxalate extractable Fe, Mn, and Zn. These elements are used as chemical indicators of anthropogenesis and pedogenesis at the black earth sites.
Results and Discussion. The chemical indicators occur correlated along the transects, with a trend to accumulate at the shoulder position of the main slopes, suggesting that the ancient settlers had an established pattern of refuse discharge. The higher amounts of organic C (up to 91 g/kg soil in Al horizons) in the black earth areas are related to the striking dark color of their topsoil, thus supporting this usual archaeological field criteria for the survey and delimitation of sites.
Manganes and phosphorus were not detected in the surrounding soils, but reached up to 1200 mg Mn/kg and 650 mg P/kg soil in the black earths A horizons. Both Mn and P levels confirm the sites
183

extension previously established by the soil color. Otherwise, occurrences of zinc (up to 60 mg/kg), calcium (up to 20 cmol/kg), magnesium (up to 8 cmol/kg), sodium (up to 0.15 cmol/kg), and potassium (up to 0.23 cmol/kg) take place over shorter distances, being more concentrated toward the waterstreams. The higher concentrations of these elements at some spots seems to indicate places of preferential refuse discharge.
The present stage of pedogenic development at black earths was evaluated, in comparison to the unaffected surrounding reference soils (kaolinitic isohyperthermic Xanthic Hapludoxes), according to the thickness of the anthropic A horizons, and of the transitional (AB and BA) horizons, as well as from the depth functions of the chemical indicators.
Along the transects the anthropic epipedon comprises one to four A horizons, whose thickness and ondulated horizon boundaries is related to the accumulation spots, but is unrelated to the level of the land surface. These features support the hypothesis that black earth layers have also grown within depth by pedogenic modification of the original soil horizons, as no evidence of accretion of succesive layers was found. In our concept, lessivage of weathered anthropogenic refuse converted the original transitional (AB and BA) horizons to lower A-horizons (A2, A3, and A4), as well as the upper part of the original B-horizons to transitional horizons. Thus, up to 10 g C/kg soil, >3 cmol Ca/kg, and up to 130 mg P/kg are found at 1.2m depth in the Colonia site, whereas the unaffected soils have <5 g C/kg soil, and no calcium or phosphorus. These deepening processes are also confirmed by the higher phosphorus levels occuring in the lower A2 and A3 horizons whereas the other chemical indicators decrease within soil profiles. Similar depth functions are found at the other sites. Consequently, the use of average discarded refuse data and thickness of anthropic layers to estimate the ancient population densities would be unreliable for the present sites.
Conclusions. The occurrence of superposed anthropogenic and pedogenic pathways must be considered when interpreting data of archaeological black earth sites. The depth functions of the chemical indicators, and the morphological modifications of the original soil horizons, give evidence of pedogenetic processes overprinting the ancient anthropic formation. Thus, the depth of black earth layers may be related to the length of time the sites were inhabited, to the presence of preferential spots of refuse accumulation, and to the intensity of the further acting pedogenic processes.
At the three analysed sites the spatial variability and the localized concentration of the chemical indicators at the landscape inflexions suggest that refuse was mainly discharged at the areas perifery, toward the rivers and floodplains,
184

A Pre-Hispanic Period of Accelerated Soil Erosion in Huasca area, State of Hidalgo, Central Mexico
Lorenzo Vazquez-Selem1, and J. Alfred Zinck2
1 Institute de Geogrqfia, UNAM, Ciudad Universitaria, 04510 México, D.F., México. 2 International Institute for Aerospace Survey and Earth Sciences (ITC), P.O. Box 6, 7500 AA, Enschede, The Netherlands.
Introduction. Accelerated soil erosion related to human impact on the environment, and in particular to agriculture, has occurred since pre-hispanic times in central Mexico. It has been documented for the Puebla-Tlaxcala basin (1, 2), and for several lake basins in the states of Michoacan, Guanajuato and México (4). In the context of a soil survey and an erosion survey in the basaltic piedmont of Sierra de las Navajas and the adjacent plateau of San Miguel Regla, Huasca area, evidences were found of a phase of widespread truncation of Alfisols prior to intense gully formation. Radiocarbon dating was used to determine the age of some erosion features.
Materials and Methods. A general soil survey using a geopedologic approach was carried out over an area of ca. 80 km2. Soil map units were defined by photointerpretation and fieldwork, and the spatial relationships between sheet/gully erosion and soils were determined. Representative soil profiles were described and sampled both in the eroded areas of the piedmont (Alfisols) and in the depositional areas of the plateau, where reworked Alfisol material locally buried Mollisols. Charcoal fragments from the colluvial cover of two truncated profiles of the piedmont, and soil material from a buried humiferous horizon of a complex profile of the plateau were sampled for MC dating. Sherds were also collected from the colluvial cover for archaeological identification and dating (6).
Results and Discussion. The soils of the piedmont developed on basaltic flows, which probably originated in the Mid Pleistocene. Most of this landscape unit consists of gently sloping lava flow tops, intercalated with elongated colluvial depressions (swales). Both landforms are characterized by consociations of Typic Paleustaifs (very fine clayey, kaolinitic, isomesic) with similar inclusions of Typic Haplustalfs on slightly steeper areas. Most of the observed Ustalf profiles are truncated and covered by 20-45 cm of dark reddish brown reworked soil material, containing 50-60% clay, on which Ap and AB horizons can be differentiated. The colluvial cover often consists of sand-size aggregates of clay-iron complex, forming thin layers with cross-bedding. The underlying truncated dark reddish brown Bt horizons contain more than 60% clay in the upper part and more than 70% in the subsoil. Conspicuous manganans and a strong to very strong, medium, angular blocky structure occur below 100 cm depth. The colluvial cover locally contains pottery sherds, obsidian artifacts and traces of fireplaces, including charcoal and in situ burned soil surfaces. Charcoal from the bottom of the colluvial cover of two different profiles gave 14C ages of 2410 + 40 yr B.P. and 1670 + 120 yr B.P. Reddish soil materials eroded from the Ustalfs of the piedmont were found on the swales of the plateau, covering brownish black Ustolls. A 14C age of 2010 + 80 yr B.P. was obtained from a mollic horizon buried by reworked Ustalf material. Summarizing, by 2400 yr B.P. took place the onset of a period of strong colluviation related to accelerated soil erosion on the Ustalfs of the piedmont. Truncation by sheet erosion probably started in the lower, gently sloping
185

the piedmont. Gullies are younger than this last date since they cut through the colluvial cover.
Conclusions. The data presented here support the hypothesis that accelerated soil erosion is not a recent process in central Mexico (2, 3, 4). In the Huasca area, profile truncation followed by coUuviation in the Paleustalfs and Haplustalfs of the piedmont, is an evidence of intense phase(s) of erosion in the past. Radiocarbon dates indicate that soil erosion had started before 2400 yr B.P and was still active around 1670 yr B.P. This period approximately coincides with periods of intense anthropically induced erosion that have been reported for other areas of central Mexico: 800 B.C-100 A.D.in the Puebla-Tlaxcala basin (2, 3); ca. 3500-1400 yr B.P. in several lake basins in Michoacan and Guanajuato (4); and 2500-1200 yr B.P. in the Patzcuaro basin (5). The presence of archaeological materials within the colluvial deposits suggests a link between human disturbance and extensive soil erosion in the area. The nature of that link can probably be precised by archaeologic means.
Literature Cited. (1) Garcia Cook, A. 1986. El control de la erosion en TIaxcala: un problema secular. Erdkunde 40:251-262. (2) Heine, K. 1976. Schneegrenzdepressionen, Klimaentwicklung, Bodenserosion und Mensch im zentralmexikanischen Hochland im jüngeren Pleistozan und Holozan. Zeitschrift fur Geomorphologie, Suppl-Bd. 24:60-176. (3) Heine, K. 1978. Mensch und geomorphodynamische Prozesse in Raum und Zeit im Randtropischen Hochbecken von Puebla/Tlaxcala, Mexiko. p. 390-406. In 41. dt. Geogr.-Tag Mainz, Tagunsberichte und wissenschaftliche Abhandlungen, Wiesbaden. (4)Metcalfe, S.E., FA. Street-Perrott, R.B. Brown, P.E. Hales, R.A. Perrott, and M. Steininger. 1989. Late Holocene human impact on lake basins in Central Mexico. Geoarchaeology 4:119-141. (5) O'Hara, S., Street-Perrott, F.A., and T.P. Burt. 1993. Accelerated soil erosion around a Mexican highland lake caused by prehispanic agriculture. Nature 362:48-51. (6) Vazquez-Selem, L. Gully erosion, soils and landforms in a volcanic area of central Mexico. Unpubl. MSc Thesis, ITC, Enschede, The Netherlands.
186

Commission V. Extended Summaries. Friday, July IS
Symposium ID-8. An international framework for evaluating sustainable land management
Page Conservation farming and sustainable agriculture on sloping land in Asia: A network approach. A. Sajjapongse, Z. Eusof, and E.P. Paningbatan. (Thailand) 188
Assessing biophysical and soil climate constraints to sustainable agriculture in Africa. R.A. Almaraz, E. Van der Berg, and H. Eswaran. (USA) 190
Physical suitability assessment of rubber cultivation in peninsular thailand using. E. Van Rast, H. Tang and S. Sinthurahat. (Belgium) 192
Land evaluation and yield reliability: a national case study from Botswana. D.J. Radcliffe, and J.L. Tersteeg. (Botswana) 194
Sustainable development in agriculture and sustainable land use in Bangladesh. A.K.M. Habibullah. (Bangladesh) .' 196
An expert system for analyzing the sustainability of land use systems in the context of land evaluation. D.G. Rossiter. (USA) 197
Long-term trials in a framwork for evaluating sustainable land management. A. Cabrera and R. Villegas. (Cuba) 199
A simple and rapid land evaluation system for land use planning with soil conservation practices in Costa Rica. P.L.A. van Enckevort, and M.A. Ugalde. (Costa Rica) 201
Land use and management requirements in relation to FAO topsoil types. A. Hebei, T. Caiser, K. Stahr, and F.O. Nachtergaele. (Italy) 203
Agroecological land evaluation of benchmark soils from Huelva, Spain. Aplication and validation of microleis. B.E. Corres, and D. De la Rosa. (Spain) 204
Land use planning in the mediterranean area. Methodology. C. Aüó V., and J. Sanchez D. (Spain) 206
Fertility consideration of indigenous land use systems in Alfisol under hilly terrain of Meghalaya. B.P. Singh. (India) 208
Long term effects of cropping system on soil properties in agriculturally modified forest land. R.N. Prasad. (India) 210
187

Conservation Farming and Sustainable Agriculture on Sloping Lands in Asia: A Network Approach
A. Sajjapongse, Z. Eusof, and E. P. Paningbatan. IBSRAM, Bangkok, Thailand; RRIM, Kuala Lumpur, Malaysia; and UPLB, Laguna, Los Banos, Philippines, respectively.
Introduction. To meet the increasing demand for food in Asia, sloping lands were encroached upon and opened for cultivation. When fanning on this type of land farmers generally plant their crops up-and-down slope and cultivate the soil with minimal concern for soil erosion. This causes serious soil erosion and the siltation of valleys and dams, a precess which is increasingly threatening the environment of the area. The International Board for Soil Research and Management (IBSRAM), with the cooperation of agricultural research centres from six countries, has embarked on a network approach for developing land managements to conserve soil resources on sloping lands in the region with the aim of alleviating these problems and of achieving a sustainable form of agriculture.
Materials and methods. Against the diversified socioeconomic background of Asia, different improved soil management technologies were validated in China, Indonesia, Malaysia, Philippines, Thailand, and Vietnam. These technologies included alley cropping, grass strips, intercropping, and hillside ditches The technologies were validated on slopes ranging from 5-50%. Individual plot sizes varied from 150-1892 m2 and were delimited by small cemented walls or galvanized sheets as part of a soil loss and runoff collection system. A split-plot design was employed for a two-factor experiment, and a randomized complete block design was used with a single-factor experiment. Data on soil loss and runoff, changes in the chemical and physical properties of the soil, crop yields, and economic returns were analyzed to identify technologies which are economically sound, aceptable to farmers, and sustainable.
Results and discussion. At all sites, soil loss under the farmers' practice ranged form 3-69 t ha-1 in 1990, from 2-224 t ha"1 in 1991, and from 1-147 t ha-1 in 1992, which was significantly higher than soil loss under the improved practices. The reduction in soil loss as affected by alley cropping in comparison with soil loss under the farmers' practice ranged from 33 to 99% in 1990, from 60 to 99% in 1991, and from 50 to 100% in 1992.
The effects of the different improved technologies on crop yield over time as compared to those of the farmers' practice are presented in Table 1. Most of the improved technologies gave yields higher than those from the farmers' practice. In Indonesia, alley cropping gave yields higher than those of the farmers' practice throughout the three-year period, although the cropping area was only 4/5 of the farmers' practice treatment. The yield difference (yield gap) was more obvious in 1992. Similar responses were observed in the Philippines. Yields from alley cropping were higher than those of the farmers' practice in all years. It is interesting to note that the corn yields from the alley cropping with low input (where no fertilizer was applied and only biomass cut from the hedgerows was applied as mulch and served as organic fertilizer) were much higher than those of the farmers' practice. In Thailand, most of the improved technologies gave yields at least as high as those from the fanners' practice.
A simple costs and returns analysis was done for the various sites of the network. In general, annual net returns from the improved technologies were less than those from the farmers' practice for the first two years of the trial. In later years, the economic advantage of the improved technologies over the farmers' practice was
188

more obvious, as shown by the example from the Philippines (Table 2). In the first year of the experiment (1989), all the improved technologies had higher negative net returns than the farmers' practice, due to the additional cost of establishing the hedgerows. From the second year onwards, the net returns from all the alley-cropping treatments were higher than those of the farmers' practice The highest net returns came from T4, due to the additional income generated by the banana hedgerows.
Table 1 Crop yields as affected by different technologies at various network sites
Site Crop Treatment Yield (t ha-1)
1990 1992 1993
070 0.40 0.26 1.10 0.80 0.54 1.30 0.97 0.39 2.10 0.34 0.86 3.06 0.98 1 51 4.54 1 36 245 0.80 1.67 0.87 0.78 1.49 0.90 0.64 1.17 0 75 0.85 1.18 077
Indonesia Upland (Site IV) nee
Philippines Green corn
Thailand Upland nee
Farmers' practice Alley cropping Residue incorporated Farmers' practice Alley with low input Alley with high input Farmers' practice Alley cropping Bahia grass strips Hillside ditches
Table 2. Net returns (US$ ha-1) from the different technologies evaluated at the Mabini site in the Philippines
Technology* Year Tl T2 T3 T4
1989 -180.8 -284.4 -267.2 -961.7 1990 1242.6 1387.5 17747 1991.2 1991 -72.0 84.8 187.3 14.85.2 1992 722.5 704.5 953.4 1767.2
Tl = Fanners' practice T2 = Alley cropping with Gliricidia+napier as hedgerows + low input T3 = Alley cropping with Gliricidia+napier as hedgerows + high input T4 = Alley cropping with banana+natural grass as hedgerows + high input
Based on the results discussed above, it was obvious that the alley-cropping technique could dclivci sustainable agriculture on sloping lands and was likely to be accepted by farmers. In the next phase of thi network, all the cooperators plan to carry out the on-farm research, in which the trial will be managed by fanners before extension work takes place.
189

Assessing Biophysical and Soil Climate Constraints to Sustainable Agriculture in Africa
R.A. Almaraz*, E. Van den Berg, and H. Eswaran. World Soil Resources, USDA-Soil Conservation Service, Washington DC, USA.
Introduction. Africa is a vast continent with a tremendous resource endowment and great potentials for increased agricultural productivity. If the agricultural performance is measured in terms of per capita food production, there is an alarming decline in the last few decades. There are many reasons for this including political and socioeconomic but the consequence is also a decline in the quality of the land resources base in many countries. Many assessments have been made of the land resource base of Africa. The present study presented in this poster, uses recent information and a much larger database than previous studies. The purpose of the study is to demarcate areas in the continent that are subject to specific kinds of stresses. This serves as a basis for developmental assistance. The analysis is also used to arrive at preliminary conclusions on the sustainability of agriculture, based purely on the biophysical resource base.
The Poster depicts several maps at scale of 1:15 million, a Soil Taxonomy map, Soil Climate Domain map, and six other maps showing major biophysical constraints to sustainable agriculture.
Materials and methods. The thematic maps were prepared using digital data derived from the database developed by the USDA/World Soil Resources and from the U.N. Food and Agriculture Organization's Soil Map of Africa, UNEP/GRID, 1992 at 1:5 million scale. Attribute analysis and map generation were performed on the PC ARC/INFO version 3.4D+ GIS platform. Attributes for the GIS evaluation were developed based on the soils and soil climate databases of the World Soil Resources (USDA-SCS) and other published information.
The procedure utilized for producing the Soil Taxonomy and Soil Climate Domain maps merged soil climate point data from more than 2,000 weather stations over a GIS coverage having more than 6,000 soil polygons. These polygons were individually analyzed for Soil Taxonomy classification criteria. The analysis considered the FAO classed soil properties, soil phase, data derived from the Revised Newhall Climatic Model (Newhall, 1972) derived soil climate data and SCS generated lab data from African soil samples. Soil constraints were determined by assessment of the inferred soil quality as indicated by the available data. The level of soil's inherent sustainability is classified to provide a visual perspective of the regional patterns of distribution.
Results and Discussion. The thematic maps derived from Soil Taxonomy provide for improved visualization and facilitates
190

assessment of the potentials of biophysical constraints to soil sustainability. Interpretive reliability is enhanced with the additional layer of environmental classifications which are verifiable to similar globally distributed soil climates. Soil sustainability for regions lacking sufficient soil/climate information can thus be inferred with a greater degree of reliability based on similar environmental conditions in regions having more diversified data.
At the map scale of 1:15 million, observation of the climate domains show similarity in equilateral distribution that correspond to the latitudes north and south of the equator. The similar occurrence of the ecologically fragile semi-arid regions bordering the northern and southern deserts are prominently visualized. These regions are where the biophysical constraints are especially severe due to a combination of drought susceptibility and increasing human pressures on the land resulting in the spread of desertification. The potential for agricultural sustainability is marginal without heavy inputs and management which is beyond the capability of many developing countries. Social degradation is a factual threat in these stressed ecosystems as evident by political instability, communal/tribal conflict and by the impairment of regional food production and distribution infrastructure.
Further analysis and measurement is needed to determine the biophysical constraints of the soil resource in the context of agriculture sustainability and land utilization intensity by a rapidly growing population.
Conclusion. This study uses information to show the distribution of areas subject to specific areas of biophysical stress. Identification of these areas are important for developing targeted conservation and agricultural management strategies.
Further analysis and measurement is needed to determine the biophysical constraints of the soil resource in the context of agriculture sustainability and land utilization intensity by a rapidly growing population.
References
Newhall, F. 1972. Calculation of soil moisture regimes from climatic records. Unpublished. Soil Conservation Service, USDA. Rev. 4. Washington D.C. 30 pp.
United Nations Food and Agriculture Organization, 1991. Soil Map of the World, digital format. Rome, Italy
191

Physical Suitability Assessment of Rubber Cultivation in Peninsular Thailand Using Fuzzy Logic
Eric Van Ranst*, Huajun Tang & Somyot Sinthurahat. Laboratory for Soil Science, Geological Institute, University of Gent, Krijgslaan 281-S8, 9000-Gent, Belgium. Introduction. The development of a physical land suitability classification is always a prime requisite for land-use planning and development. In this paper, another approach using the fuzzy set theory under the FAO-Framework for Land Evaluation (1) is proposed and applied in assessing the physical land suitability for rubber in Peninsular Thailand.
Materials and methods. The study area covers 60 % of Peninsular Thailand. 28 soil units (Kandiudults and Paleudults), representative for different rubber plantations, were selected.
The fuzzy set theory (2) proposes that a membership in a set is not measured as 0 or 1, like in the conventional set theory, but as a value ranging from 0 to 1. With a fuzzy set, there is a gradual transition from membership to non-membership, so that the concept of "the degree of belonging" can be represented by a characteristic function called "membership function". Any fuzzy set can be represented by this membership function, which makes a quantitative representation of an abstract intention possible (3). Seven land qualities (available foothold for roots, nutrients availability, oxygen availability, water availability, corrected temperature regime, workability and resistance to erosion) influencing rubber cultivation in the study area were considered in the evaluation. The applied methodology is schematically summarized in figure 1:
crop requirements based on land qualit ies
establishment of membership functions for land qualit ies
principal components and multiple regression analysis:
yields vs land quali t ies
calculation of membership values: matrix (R)
weight matrix: (W)
f inal evaluation matrix (E): E - W o R. where "o" is an operator that works as a Triangular Norm and Triangular Conorm
Fig. 1: Graphical representation of the applied methodology
192

Results and discussion. The proposed approach is tested against other land evaluation methods. Correlations between the land indices, obtained with the maximum limitation method (4), the parametric - Storie method (5), the parametric - square root method (6) and the fuzzy set approach, and the actual rubber yields are given in figure 2.
2500
2200
1900
1600
1300
1000
700
400
(a) Y « - 963.23 + 30 X R~2 - 0.48 n » 2 8
40 50 60 70 80 90 100 land Index (maximum limitation method)
p (b) Y =-144.71 + 27.53 X
b R~2»0.90
ra 2000 n = 28 /
i
•X-f» 1500
•D
r / r f s M
>• 1000' i / m •
i •
500 20 30 40 50 60 70 80 90 100
tand index (parametric-Storie method)
% 2000
e X O)
I * 1500
(c) Y =-119.03 + 27.21X R~2 = 0.93 n = 28
30 40 50 60 70 80 90 100 land Index (square root method)
B
(d) Y = 115.78 +22.57 X R~2 = 0.97 X*
2000 n = 28 s *
r *
1500-
1000
500-
* i » - •
30 40 50 60 70 80 90 100 land index (fuzzy set approach)
Fig. 2: Correlations between the land indices obtained with different methods and observed mean rubber yields.
The best correlation is obtained with the fuzzy set approach, which means that this methodology is promising for further development and application in the field of land evaluation.
Literature Cited. (1) FAO, 1976. A framework for land evaluation. FAO Soils Bulletin 32, Rome.
Zadeh, L.A., 1965. Fuzzy sets. Information and Control 8: 338-353. Tang, H.J. & Van Ranst, E., 1992. Testing of fuzzy set theory in land suitability assessment for rainfed grain maize production. Pedologie, XLII 2: 129-147. Zheng, P., 1988. A methodology for land evaluation. Land Resources (Beijing) No. 4:29-34. Storie, R.E., 1976. Storie index soil rating (revised 1978). Spec. Publ. Öiv. Agric. Sci. No.3203, Uni. of Calif., Berkeley. Khiddir, S.M., 1986. A statistical approach in the use of parametric system. Ph.D. thesis, University of Gent, Belgium.
2
(3)
(4) (5)
(6)
193

Land Evaluation and Yield Reliability: a National Case Study from Botswana
D. J. Radcliffe and J.L.Tersteeg. Botswana.
FAO/Ministry of Agriculture, Gaborone,
Introduction. For the smallholder farmer in semi-arid environments such as Botswana, minimization of risk is commonly a more important consideration than maximization of production or returns. To be relevant for planning and extension in such areas, land evaluation must therefore assess yield reliability and the risks of failure, as well as land performance under average conditions.
Figure 1. CYSLAMB Structure Materials and Methods. A map of Land Suitability for Rainfed Crop Production was prepared for Botswana to guide planning and extension at national level. Mapping units are based on the Soil Map of the Republic of Botswana (1), and each unit is assigned to a climatic reference station. A simulation model, CYSLAMB, (Crop Yield Simulation and Land Assessment Model for Botswana) (2), illustrated in Figure 1, was used to evaluate the potential productivity of land use systems. CYSLAMB was run to simulate potential yields of sorghum, maize, millet, cowpea and groundnut under a defined improved traditional management system for each land unit over the 30 year period 1959-1989. For each land use system, the results of CYSLAMB are displayed as a list of predicted yields per planting opportunity for each cropping year, and a table of summary statistics. Therefore, by running the model for a standard period, the results can be stochastically compared and used as a basis for classifying land units according to yield reliability and risk of crop failure.
Results and Discussion. The results of this national land evaluation are a series of median and lower quartile yields for the five crops evaluated on each land unit. This data is presented in full in the map legend. The lower quartile yield, exceeded in 75% of years, is considered most relevant to the small farmer as it corresponds to a dependable yield on which he can rely for
Land Unit
Soil Type Climatic ref. station
Land Use
Production System MVT MTA
Soil characteristics Rainfall/Synoptic data
Crop characteristics Management specifications
1 | 1 Radiation and Temperature
Limited Biomass Yield
Moisture Balance Module:
Pre-planting
Identify planting opportunity
Post-planting
i Drainage Module
crsuve
Nutrient Module
MOOULCS
1
Toxicity Module:
Sal ini ty
Sodicity
A lka l in i ty
Potential Crop Yields ~\ OUTPUTS
194

household food security. To simplify map presentation, a non crop specific parameter, the dependable yield index, is derived to reflect classes of potential rainfed crop production which are colour coded on the map. The yield index is rated on a scale from 0 to 1000 and is calculated from proportionately weighted yields averaged over the five crops.
The proportion of productive land within the mapping unit, is used to subdivide classes. Many land mapping units contain a proportion of land, comprising rocky areas or soils which are very shallow or saline, which is unsuitable for crop production but cannot be delineated separately at the present map scale. Additional land constraints and hazards are indicated as a separate overlay on the map.
The map shows an overall trend of increasing potential production from the south and west to the north and east of Botswana, which broadly reflects the pattern of rainfall distribution. Slightly over half of the country comprises land which is not suitable or unreliable for rainfed crop production, or has very low productivity. Four histograms illustrate the yield distributions, dependable and median yields and probabilities of crop failure on land units which are representative of different zones of the country. The deep Vertisol and Lixisol at Pandamatenga and Gaborone respectively have apparently good yield reliability, although dependable and median yields are higher at the former location. The petric phase of the chromic Luvisol at Mahalapye has lower potential yields and a substantially higher risk of failure, while the A-renosol at Tshabong is in the zone that is clearly unreliable for rainfed cropping.
The methodology used in this study is suggested as a model for smallholder farming systems in other semi-arid environments. It is not scale specific and can be applied from farm to national levels, given the basic data on soils, climate and production systems, and provided reasonable assumptions can be formulated on the interrelationships between management practices and physical variables. The model used should always be validated locally prior to routine application.
Literature Cited
(1) De Wit and Nachtergaele. 1990. Explanatory Note on the Soil Map of the Republic of Botswana. Project FAO/AG:BOT/85/011. Field Document 30. Ministry of Agriculture, Gaborone.
(2) De Wit, Tersteeg and Radcliffe. 1993. CYSLAMB Manual. Project FAO/TCP/BOT/0053 Field Document 2, Ministry of Agriculture, Gaborone.
195

Sustainable Development in Agriculture and Sustainable Land Use in Bangladesh
A.K.M. Habibullah. Consultant, CIDA 4/30, Kalwalapara B-F, Section-1 Mirpur, Dhaka 1216 Bangladesh
Sustainable Agriculture concept has emerged in the highly developed industrial countries of the world where surplus agricultural production has been a concern for the last decades or so. In the developing countries where food production could not match the population growth rate sustainable agriculture means high input high yield agriculture to increase the food production feed the increased population. Efficient crop production is largely dependant on soil quality. In the developing countries soil degradation has ocurred due to non-replenishment of nutrients removed with the harvested crops for centuries. This and the physical disturbance led to several types of soil degradation affecting soil quality seriously. Global soil chemical degradation (loss of nutrients and loss organic matter) study indicates affected areas to be of the order of 68 m ha in South America, 45 m ha in Africa and soil salinization accounting for 76 m ha of which 53 m ha in Asia. The third type of chemical degradation is from the pollution and the area affected by this is 22 m ha of which Europe has 19 m ha. In many of the countries in the countries in the tropics and sub tropics further degradation of soil resources need to be arrested and population also need to be contained to bring benefits to the people from social and economic development. Bangladesh soils have been affected by both physical and chemical degradation but these soils are of resilient type contrary to 124 m ha in Africa and 106 m ha in Asia, which are not reclaimable unless majot investments and enginee-ring intervetions are introduced.
Soil resilience and sustainable land use are the two most important issues which need inmediate attention in Bangladesh if the soil resources are to be protected and increased population is to be ensured with food and healthy environment in the coming de- cades.
196

An expert system for analyzing the sustainability of land use systems in the context of land evaluation
David G. Rossiter1. Department of Soil, Crop and Atmospheric Sciences, Cornell University, Ithaca NY 14853 USA
Introduction. In response to the need for more 'sustainable' agricultural systems as variously defined (Brklacich et al. 1991, Huffman 1990, Keeney 1990), applied research scientists have developed components of such systems. Like all land use systems, these will be more or less successful depending on the type of land on which they are implemented, hence the need for land evaluation (FAO 1976, Dent & Young 1981) to determine the suitability of each system for each land area. The essential conceptual advance in land evaluation methodology is the realization that land use systems can causechanges in land characteristics, eitherpos/r/ve (e.g., continued incorporation of manures leading to improved physical and chemical properties) or negative (e.g., erosion leading to loss of soil fertility and deteriorating physical properties). The change in the land resource due to the land use, i.e., the feedback inherent in the land - land use relation, must be explicitly included in the conceptual model and evaluation results, which must be considered over time rather, than at a single moment. This advance has been incorporated into the ALES computer program, which is demonstrated along with this poster.
The ALES computer program. The Automated Land Evaluation System (Rossiter 1990, Rossiter & Van Wambeke 1993), abbreviation ALES, is a computer program that allows land evaluators to build expert systems to evaluate land, more or less following the method presented in the Food and Agriculture Organization's "Framework for Land Evaluation" (FAO 1976) and subsequent guidelines (FAO 1983, 1984, 1985). Each model is built to satisfy local needs, so that there is no fixed list of land use requirements by which land uses are evaluated, nor of land characteristics from which land qualities are inferred. These lists are defined by the evaluator to suit local concepts, data sources and objectives. The program is available in English, French and Spanish. Applications of earlier versions of ALES have been reported by van Lanen et al. (1992), van Lanen & Wopereis (1992) ind Johnson & Cramb (1991).
An ALES model is not a dynamic simulation model of the environment, but rather a representation of the knowledge of the land use expert about the relation between land use and environmental response. The expert system representation used in ALES allows qualitative and semi-quantitative (approximate) knowledge to be used, as well as fully quantitative knowledge. This is particularly important in data-poor or knowledge-poor environments.
Susi aina bility analysis in ALES. Four components of ALES are affected by sustainability analysis:
1) Knowledge base: The effect of each land use on the resource base (the set of land characteristics) may be represented by expert judgment captured in the knowledge base, which describes proposed land uses in both physical and economic terms.
2) Data base: The data base of evaluation units and their land characteristics can be dynamically altered as the land use system is followed over time.
3) Inference mechanism: As the land use system is evaluated over time, land characteristics in the data
197

base can change according to the expert judgment in the knowledge base. These land characteristics may affect land qualities that in turn may affect physical suitability, yields, and levels of inputs. Thus, physical and economic suitability can change as the land becomes improved or degraded.
4) Report generator: Various sustainability indices may be calculated from the performance of a land use/land unit combination over time.
Literature cited
Brklacich, M., Bryant, C.R., & Smit, B. 1991. "Review and appraisal of the concept of sustainable production systems". Environmental Management 15: 1-14.
Dent, D. & A. Young. 1981. Soil survey and land evaluation. George Allen and Unwin, London, England.
Huffman, E. 1990. "Workgroup issue paper: Indicators and assessment of agricultural sustainability: Methods of assessing agricultural sustainability". Environmental Monitoring and Assessment 15: 303-305.
Food and Agriculture Organization of the United Nations. 1976. A framework for land evaluation. Soils Bulletin 32, FAO, Rome, Italy.
Food and Agriculture Organization of the United Nations. 1983. Guidelines: land evaluation for rainfed agriculture. Soils Bulletin 52, FAO, Rome, Italy.
Food and Agriculture Organization of the United Nations. 1984. Land evaluation for forestry. Forestry Paper 48, FAO, Rome, Italy.
Food and Agriculture Organization of the United Nations. 1985. Guidelines: land evaluation for irrigated agriculture. Soils Bulletin 55, FAO, Rome, Italy.
Johnson, A. K. L. and R. A. Cramb. 1991. "Development of a simulation-based land evaluation system using crop modelling, expert systems and risk analysis". Soil Use & Management 7(4): 239-245.
Keeney, D. 1990. "Sustainable agriculture: definitions and concepts". J. Production Agriculture 3: 281-285.
van Lanen, H. A. J., Hack-ten Broeke, M. J. D. , Bouma, J., & de Groot, W.J.M. 1992. "A mixed qualitative/quantitative physical land evaluation methodology". Geoderma 55: 37.
van Lanen, H. A. J. and H. Wopereis. 1992. "Computer-captured expert knowledge to evaluate possibilities for injection of slurry from animal manure in the Netherlands". Geoderma 54: 107.
Rossiter, DG. 1990. ALES: A framework for land evaluation using a microcomputer. Soil Use & Management 6(1): 7-20.
Rossiter, D. G. and A. R. Van Wambeke. 1993. Automated Land Evaluation System (ALES) Version 4 User's Manual. SCAS Teaching Series T93-2. Ithaca, NY, Cornell University, Department of Soil, Crop & Atmospheric Sciences.
198

Long-Term Trials in a Framework for Evaluating Sustainable Land Management.
A. Cabrera* and R. Villegas. Department of Soil Fertility and Plant Nutrition, National Sugarcane Research Institute, Ave. Van Troi No. 17203, Boyeros CP 19200, C. Habana, Cuba.
Introduction. Land use has always had effects on the environment. Nutrients biogeochemical cycles have been modified(3); a very important annualy increase of soil erosion has been exposed(2); the enviropmental pollution has increased(l,4); some soil situation are ecotonal and slight changes in the environment have could trigger detrimental soil processes(5). Mantenaince of the quality of the land is an important goal for the humankind and it will be possible if a sustainable land management is achieved.
International Framework. Although in several International Programs soil study is considered (as IGBP, TSBF, MAB), the scale spatial used could be very wide. This aspect impose the use of scale spatial more small and for that, an International Framework for evaluating sustainable land management would be necessary. For an International Framework development the following matter can be considered:
- Argument - Short-Term and Long-Term objectives - Hypothesis - Organization - Research Questions - Collaboration with International Programs.
Though the above matter could be modified, the Network development is very important in the context of an International Framework. Long-Term Trials with crops that have a great economic effect, as sugarcane in Cuba (TABLE 1), play decisive role. The main aim of cuban trials is to determine the effects of different levels of N, P and K on the ecosystems at short, medium and long term; moreover the residual effect of P and K applied with fertilizer is evaluated. Modification of these trials allows the evaluation of different agronomical practices (e.g. crop rotation, intercropping, minimun tillage, manures uses) on the soil.
Long-Term Trials Advantages. Some advantages of Long-Term Trials are that they allow: - carry out interdisciplinary studies in the time to both local and global scales - correct adecuation for technology transfer - sistematic and integral studies of crop agricultural management moreover: - they can be modified in the ligh of contemporary agriculture without alter very much the primary treatments
199
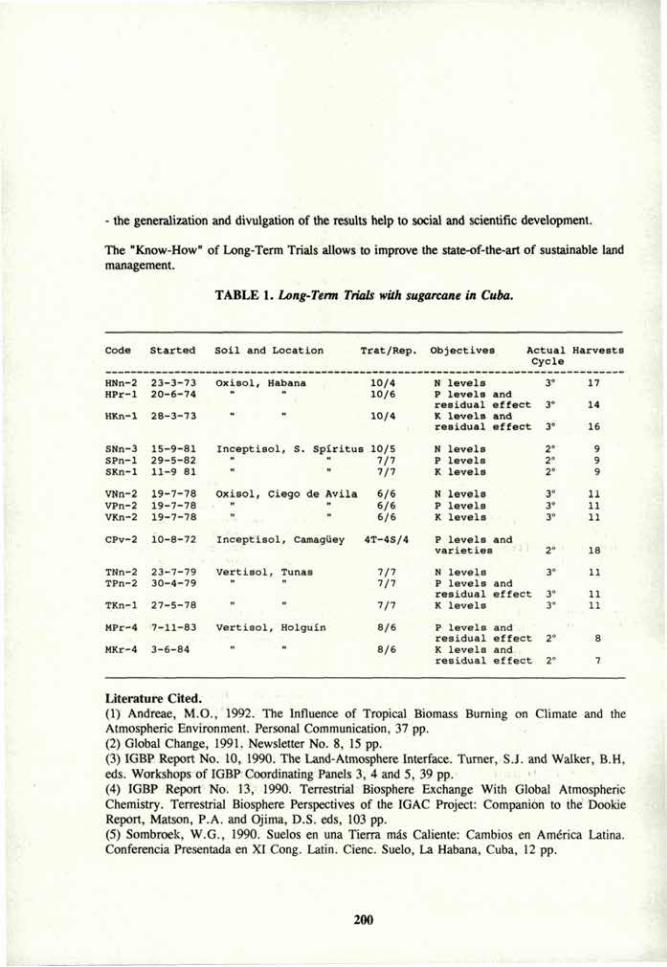
- the generalization and divulgation of the results help to social and scientific development.
The "Know-How" of Long-Term Trials allows to improve the state-of-the-art of sustainable land management.
TABLE 1. Long-Term Trials with sugarcane in Cuba.
Code Started Soil and Location Trat/Rep. Objectives Actual Harvests Cycle
HNn-2 23-3-73 Oxisol, Habana 10/4 N levels 3° 17 HPr-1 20-6-74 " 10/6 P levels and
residual effect 3° 14 HKn-1 28-3-73 " 10/4 K levels and
residual effect 3° 16
SNn-3 15-9-81 Inceptisol, S. Spiritu s 10/5 N levels 2° 9 SPn-1 29-5-82 If n 7/7 P levels 2° 9 SKn-1 11-9 81 ti n 7/7 K levels 2° 9
VNn-2 19-7-78 Oxisol, Ciego de Avila 6/6 N levels 3° 11 VPn-2 19-7-78 ti H 6/6 P levels 3° 11 VKn-2 19-7-78 „ n 6/6 K levels 3° 11
CPv-2 10-8-72 Inceptisol, Camagüey 4T-4S/4 P levels and varieties 2° 18
TNn-2 23-7-79 Vertisol, Tunas 7/7 N levels 3° 11 TPn-2 30-4-79 " 7/7 P levels and
residual effect 3° 11 TKn-1 27-5-78 H H 7/7 K levels 3° 11
MPr-4 7-11-83 Vertisol, Holguin 8/6 P levels and residual effect 2° 8
MKr-4 3-6-84 " 8/6 K levels and residual effect 2° 7
Literature Cited. (1) Andreae, M.O., 1992. The Influence of Tropical Biomass Burning on Climate and the Atmospheric Environment. Personal Communication, 37 pp. (2) Global Change, 1991. Newsletter No. 8, 15 pp. (3) IGBP Report No. 10, 1990. The Land-Atmosphere Interface. Turner, S.J. and Walker, B.H, eds. Workshops of IGBP Coordinating Panels 3, 4 and 5, 39 pp. (4) IGBP Report No. 13, 1990. Terrestrial Biosphere Exchange With Global Atmospheric Chemistry. Terrestrial Biosphere Perspectives of the IGAC Project: Companion to the Dookie Report, Matson, P.A. and Ojima, D.S. eds, 103 pp. (5) Sombroek, W.G., 1990. Suelos en una Tierra mas Caliente: Cambios en America Latina. Conferencia Presentada en XI Cong. Latin. Cienc. Suelo, La Habana, Cuba, 12 pp.
200

A Simple and Rapid Land Evaluation System for Land Use Planning with Soil Conservation Practices in
Costa Rica
P.L.A. van Enckevort and M.A. Ugalde. MAG/FAO Soil Conservation Project, Directorate of Land Use Planning and Soil Conservation, Ministry of Agriculture and Livestock, San José, Costa Rica.
Introduction. The Republic of Costa Rica is a small, tropical mountainous country in Central America, in which about 60% of its total area is used for agriculture. A study (1) showed that in 1984 approximately 42% of the country's agricultural land was suffering from moderate, severe or very severe water erosion. Actually this situation is expected to be worse, due to a large scale change in land use, towards an increased crop production and livestock keeping, causing higher risks of soil degradation.
History of Soil Conservation in Costa Rica. Costa Rica already has a considerable history of soil conservation, however the rapid increase of soil erosion problems, in the 1980's, made the government more aware of its importance. This ultimately resulted in the establishment of a Directorate for Land Use Planning in 1992 within the Ministry of Agriculture and Livestock. With the experience of the past, in Costa Rica like many other countries, soil conservation strategies and techniques are changing from executing mainly physical and often very expensive ones to simple, cheap, economically and socially acceptable practices geared to increased soil cover and using a participative approach (2).
Methodology. A second phase soil and water conservation project has been started in November 1992 with support of the FAO, which aims at soil conservation with implementation on a participative basis, in 8 pilot areas with small groups of farmers. With the experience obtained herewith a national soil conservation policy for implementation will be developed.
Land evaluation often is a complicated large scale activity done by specialists, collecting a great variety of data. The project actually elaborates a simple and rapid land evaluation system, which can be used on a farm level by extensionists and/or regional land use planning officers. These officers collect most of the data together with the farmer and plan in close consultation the most appropriate land use and soil conservation practices. To keep the land evaluation system simple, only a small number of data is used, which can be collected by technicians and extensionists with very simple equipment, but which are sufficient for proper land use planning and the determination of adequate soil conservation practices on farm level.
The most important land characteristics mainly are selected from general soil surveys on national scale and detailed studies of, the already mentioned, pilot areas representing the majority of the agroecological zones of Costa Rica.
201

The land characteristics areselected on basis of their importance as limiting factor for cultivation in Costa Rica, their easiness to measure or estimate them in the field and their relationship with other limiting factors which are of importance as well but difficult to measure in the field (for instance the physical and chemical characteristics which are related to the taxonomy of the soil). Among the most important land characteristics of Costa Rica are slope, actual erosion, rooting depth, stoniness, texture, compaction, infiltration rate, thickness and the organic matter content of the A-horizon and the climatic factors length of the. growing season and wind intensity.
In the process of land evaluation and land use planning the regional officer starts with collecting data about the socio-economic situation of the farmer and the actual productivity of his land. Subsequently he collects the required land characteristics and makes a simple map with the actual situation of the farmer's land and distinguishes the different mapping units. With the collected land characteristics the officer determines the suitability of the different mapping units for different land uses, using a simple table (3). Finally, he produces, together with the farmer, a land use plan with the most appropriate soil conservation practices, with help of a manual (4), and makes a second map with the proposed land uses and soil conservation practices.
Literature cited. (1) Jeffery, P., P.M. Dercksen and B.G.J.S. Sonneveld, 1989.
Assessment of the Levels of Water Erosion Intensities of Soils of Costa Rica. Techn. Rep. no. 2-E, Project GCP/COS/009/FAO/MAG/ITA.
(2) Dercksen, P.M. and L. Demetrio Monge, 1992. Costa Rica's New Approach to Soil Conservation Implementation; Making Use of Lessons from the Past. Paper presented at the 7th International Soil Conservation Conference, Sidney, Australia, 18.9/4.10.92
(3) MAG/MIRENEM, 1991. Metodologia para la Determinacion de la Capacidad de Uso de las Tierras de Costa Rica. 51 pp. San José, Costa Rica.
(4) MAG/FAO, 1989. Manual de Conservation de Suelos y Aguas. Proyecto de Conservación de Suelos, GCP/COS/009/ITA. 243 pp. + 11 anexos. San José, Costa Rica.
202

Land Use and Mo^gement Requirements in Relation to »**o T u p
A. Hebel1^, T. Gaiser2), K. Stanr3*, and F.0. Nachtergaeie1)
•*/ Food and A^~ UuftO' *-" t o . Nations, Rome, Itaty 2t University of Hohenheim, Institute for Soil Science and Land Evaluation, Stuttgart, Germany
Summary
As a res? . rue to the demand of agronomists, field technicians and other scientist. FAO has developed a ic^oü classification system, which can be used alone or togetl with the traditional soil c^ ' cation system, in order to provide more -:cific information on the fertility status of soils B- i to facilitate the establishment of m&na; nt reccmmendadons for sustainable land use.
The present paper aims at the : -ssessment of management options with respect to topsoil types identified LA FAQ'S draft "Frame- ork for characterization and classification of topsoils in the world" (FAO 1992 and Purnell et at 1994). A universally ..pplicable methodology is being developed. In a pilot study land uu'izatian types such as rainfed agriculture and grassland/pasture in different agroclirci (c z >acs la the warm tropics are considered in relauon to topsoil <vpes being tost releva ;se zones. The suitability of the selected topsoil types for.: nuige of land u--« is :;-.• .paring lard characteristics/qualities like moisture availaeility, nutrient avt.",».', ..y md • *a?jAiiy wiJi crop requirements. The identified suitability constraints allov fonoulauon 01 appropriate management options for suitability enhancement and conservation measures. Resv'.cs of this pilot study are presented in a. poster tb* is complementary to that of PURNELL et at. 1' 1994).
References
FAO (L992); Framework for characterization and dassification of topsoils in the world. By O.C Spaargaren. FAO, Rome, 1992.105p. (Draft).
Purnell, M.F., Naehtergaele, F.O., Spaargaren, O.C & Hebei, A (1994): Practical topsoil classification • FAO proposal Poster presented at the ISSS conference 1994. Acapulco, Mexico.
203

Agroecological Land Evaluation of Benchmark Soils from Huelva, Spain. Aplication and Validation of
Microleis Corres,* B.E. y De la Rosa, D.** Department of Sotany, Universidad Autónoma de Guadalajara, 44100 Guadalajara, Jalisco, México*. Instituto de Recursos Naturales y Agrobiologia. Av. Reina Mercedes sin, Sevilla, Espana
INTRODUCTION. Biophysical land evaluation is the most appropiate way for predicting potential and limitations of land for selected uses. The major aims are natural resources sustainability and environmental quality. Land evaluation is an interface between land resources survey and land use planning. For this interpretative process, land characteristics, such as soil, climate, hidrology and topography factors, are considered diagnostic criteria. Computer-based land evaluation methods, along with land databases, geographical information systems, and remote sensing techniques, are being widely developed. MicroLEIS is a PC computer-based land evaluation information system for optimal allocation of agricultural and forestry land use systems under Mediterranean conditions.
MATERIALS AND METHODS. In this work 17 soil units were evaluated representing eight benchmark natural areas from Huelva province. The global outline of this methodology, which is in general accordance with FAO-Framework for Land Evaluation, integrates several land capability, suitability and yield prediction methods.
RESULTS AND DISCUSSION. This work contains the results of MicroLEIS referring application in the eight benchmark natural areas from Huelva province. Input data referring to the most representative relief, climate and soil units was used. The soil data from existing soil survey reports was previously re-estructured and computerized according to the FAO-ISRIC soil database. The evaluation results were finally compared with dominant present uses in the benchmark areas. Six unit soils located in the benchmark areas Condado Campina, Condado Litoral and Costa were evaluated as agricultural lands, whereas another 10 unit soils were evaluated as forestry lands, these 10 units are located in benchmark areas Andévalo Occidental, Andévalo Oriental, Costa, Sierra Morena and Sierra de Aracena. Finally, the unit H-06 located in the benchmark area of Marismas was the unique unit that presented nonagricultural and forestry land. Therefore, the current version of MicroLEIS system appears to be a useful tool to predict suitable agricultural and forestry uses. Refining of evaluation models and interfacing to other computerized land information systems are future recommendations to improve MicroLEIS. Although this methodology developer for Mediterranean regions cannot be transferred directly to other regions of the world, the principles are considered universal.
204

LITERATURED CITED. (1) Beek, K.J. 1978. Land evaluation for agricultural development, international Institute for Reclamation and Improvement/ILRI.Vol 23. (2) De la Rosa, D; Cardona, F y Paneque,G. 1977. Evaluación de suelos para diferentes usos agricolas. An. Edaf. y Agrob. 36: 1100-1112. (3) De la Rosa, D; Cardona,F; Naranjo, J y Almorza, J. 1978. Aplicaciones de la informatica en el reconocimiento y evaluación de suelos. An.Edaf. y agrob. 9-10:36-40. (4) De la Rosa, D. y Almorza, J. 1979. Modelación matematica y evaluación agricola de suelos. An.edaf. y Agrob. 38: 1421-1425. (5) De la Rosa, D. y Carliste, V.W. 1979. An Approach to the classification of agricultural and nonagricultural soil evaluation systemas. An. Edaf. y Agrob. 11-14: 5-15. (6) FAO. 1990. FAO-ISRIC Database.World Soil Resources Reports. No.64 Roma. 1-89.
205

Land Use Planning in the Mediterranean Area. Methodology.
C. Afló Vidal and J. Sanchez Diaz. Dpto. Biologia Vegetal. Facultat de Farmacia. Universitat de Valencia. 46100 Burjassot (Valencia). Spain. Introduction. Land evaluation consists of an assessment of the land potential resources for one or more alternative uses, by taking into account the physical and socio-economic factors (1). We distinguish between two different types of land evaluation: physical and integrated evaluation (2). The former is mainly concerned with the soils physical and ecological features by measuring its capability, suitability, vulnerability and/or productivity in the general or specific land uses. The integral evaluation combines the information obtained by the previous procedure with the suitable social and economic factors. The integration of these factors in the land-use evaluation is presently underrated, even though it represents and improvement in the evaluating process. In any case, the physical resources can be regarded as the natural stable elements, whereas the socio-economic factors present a varied nature in time and space. Moreover, socio-economic factors depend on particular decisions, which are biased by political or market conditions. Therefore, it seems more logical that land evaluation should focus on the permenent and potential resources of the physical factors. Later studies might be able to integrate the social and economic factors of a particular geographic area in the evaluation. The physical data should constitute the basis for any type of socio-economic land evaluation. This allows the integration of the evaluating process in the ordering of the territory (3).
The land evaluating system we proposed by us has been designed according to the characteristics of the Mediterranean ecosystems and landscapes and it intends to assist the land-use planning within the territorial area. Methodology. Our proposed methodology was firstly applied in Valencia (Spain) and it assesses both the intrinsic and extrinsic characteristics of the soil. At the same time it allows a quantitative and qualitative approach to the edaphic potential soils and their limitations. In addition, this methodology includes all the selected parameters which show the value of the soil limitation and the environment whitin their ranges. On the whole, this methodology allows to assess the potential use and productive capacity in a cartographic unit in relationship to a wide range of agrarian land uses: agricultural, pasture, forest and natural uses.
The selected soil characteristics are clustered in eleven parameters: Slope (P) which assesses the presence or lack of terraces, limited according to their size; Outcrops rocks (R), which defines the distance between the outcrops rocks in small letters; Stoniness (G); Hidromorphy (H); Depth (X); Climate conditions (C) assessed by measuring the frost risk and thermic and humidity regimes (according to Papadakis); Actual (Ea) and Potential (Ep) risk of hidric erosion, along with a qualitative assessesment of the erosive morphology; Chemical properties (Q); Textural classes (T); Potential salinity (S) and Contamination vulnerability (V). The assessment and distribution of respective ranks to these parameters can be found in previous works (4).
This set of parameters wich are measured according to the Mediterranean environmental circunstances have been clustered in the following factors:
Mechanization and cultivation: Slope. Outcrops rocks. Stoniness. Hidromorphy. Depth. Nutrient availability: Textural classes. Chemical properties. Climate conditions Soil vulnerability: Actual and potential erosion. Potential salinity. Contamination risk.
206

Mechanization and cultivation, nutrient availability and climate conditions form the CAPABILITY INDEX. This has been defined as the set of soil and environment parameters wich allows an agrarian use. The limitation level of these parameters determines the agricultural, pasture, forest or natural uses. The soil vulnerability factor determines the FRAGILITY INDEX. This consists of a set of limitations which prevent certain land uses. In the Mediterranean area the human transformation of nature is limited by the soil characteristics and the environment in some cases.
The capability index establishes LAND USE RECOMMENDATIONS categories (5), and they are the following: intensive agricultural use (A); forest exploitation (F); natural regeneration (R); pasture (N) and protection (P). The type of use is established according to the obtained values in each parameter and the use restrictions are assessed by a maximum value in the various parameters: moderate agricultural use (a); restricted agricultural use (/a/); forest exploitation with restrictions (f); forest exploitation with many restrictions (/f/); afforestation (r) and afforestation with many restrictions (/r/). The fragility index determines the causes of USE LIMITATIONS: erosion risk, potential salinity and contamination risk.
Finally, several examples of the parameter values and their respective use recommendations and limitations are shown bellow:
CAPABILITY FRAGILITY
Cultivation Nutrients Climate Vulnerability
P X R G H T Q C Ea Ep S V
A PI XI Rl Gl HI Tl Ql CI Eal Epl SI VI
/a/ P3 X3 R3b G3 H3 T3 Q2 C3 Ea3 Ep3 S3 V
F P3 X3 R3a G4 — — — Ea2 Ep2 -- —
/f/ P4 X3 R4b G4 — — — Ea3 Ep4 — —
R P5 X4 R5c G5 — — — Ea4 Ep5 — —
/r/ P5 X3 R4b G5 — — — Ea6 Ep6 -- —
N P3 X3 R5 H2 T4 — *- Ea3 Ep3 — —
P P5 — Ea3 Ep6 S4/5 — P P5 — Ea3 Ep6 S4/5 —
23.
Literature Cited. l)Sys,I.C.;Van Ranst,E. y Debaveye,I.J.1991.Land evaluation I I.T.estate University of Ghent.Agricultural Publications n27.Bruselas 2)Beek,W.J.1978.Land evaluation for agricultural development. I.L.R.I. Wageningen. 3)Vink,A.P.A.1983.Landscape ecology and land use.Longman.Londres 4)Sanchez,J. y Anó,C.1993.Metodologia de Capacidad de Uso para la planificación de usos del suelo en el ambito mediterraneo. XII C.L.C.S. 1391-1398.Salamanca 5)Rubio,J.L.;Molina,M.J. y Sanchez,J.1989.Land Use Recommendations for soil conservation planning in mediterranean environments.207-216.Soil Technology Series 1.
207

Fertility Consideration of Indigenous Land Use Systems in Alfisol Under Hilly Terrain of Meghalaya, India
B.P. Singh. Division of Soil Science, Umroi Road, Barapani, 793 103. Meghalaya, India.
In t roduc t i on . Shif t ing c u l t i v a t i o n i s s t i l l widely p r a c t i s e d under slopy land condi t ions in the whole North Eastern H i l l Region of India due to i t s i n t e r l inkage with the s o c i o - c u l t u r a l l i f e of t r i b a l peoples . In Meghalaya, i t i s known as ' Reo Shvrt i ' and was found to be the major hurdle in tne maintenance of so i l f e r t i l i t y for sus t a inab le a g r i c u l t u r e due to shortened Jhum cyc le (Bcrthakur e t al 1985). Notably, some p o t e n t i a l land use systems have a l so been evolved by the loca l farmers which a re resource based and well adapted (Singh e t a l 1992). The paper p r e sen t s the evaluat ion of so i l f e r t i l i t y under those land uses in acid A l f i s o l s .
Mate r i a l s and Methods. Soil samples were c o l l e c t e d a t 0-20 cm ( topsc i l ) and 20-40 cm (subsoi l) depths from d i f f e r e n t indigenous land use systems of Meghalaya ( 4 500 m, above mean sea l e v e l , s lopes 25.3 to 42.8 per cent and so i l depth 0.5 to 1.25 m) for evaluat ion of so i l c h a r a c t e r i s t i c s .
Resul t s and Discussion. A spec tacular decrease in s o i l pH; organic carbon; exchangeable Ca, Kg and K; and hot water so luble B content was not iced on the topso i l in maize cropping system within 10 years than the adjoining grass land, while these v a r i a b l e s increased g r ea t l y under t r e e land use system between 15-20 years (Table 1) . The maximum organic carbon content was found in arecanut + black pepper + j a c k f r u i t (2.22%), followed by arecanut + b e t e l leaf + j a c k f r u i t (2.15%) and c i t r u s + a recanu t+ j a c k f r u i t + black pepper + b e t e l leaf (1.95%) land use systems. This was mainly a t t r i b u t e d to the l i t t e r f a l l and incorpora t ion of weeds which conserve s o i l moisture, suppress weed growth and subsequently serves as manure. I t i s worth mentioning here t h a t these land use systems a re n i ce ly maintained with complete absence of chemical f e r t i l i z e r s under ra infed condi t ions , except b e t e l l ea f /b l ack pepper c u l t i v a t i o n where Bamboo Drip I r r i g a t i o n i s in p r a c t i c e over a per iod of 200 years (Singh 1988). This i s the cheapest system of i r r i g a t i o n as bamboo a re in abundance and secondly, coopera t ive and community harmony of the soc ie ty have p o s i t i v e inf luence on successful running of the system. The exchangeable Al content was r a i sed by 2 folds in maize cropping whereas i t reduced by 4 , 3 , / 2 . 3 , 2.1 and 1.8 times under bamboo + pineapple + broom grass ; a recanut + black pepper + j a c k f r u i t ; arecanut + b e t e l leaf + j a c k f r u i t ; broom grass + Schima and c i t r u s + arecanut + j a c k f r u i t + black pepper /be te l l e a f in t h a t order . There was/dequate b u i l t up of a v a i l a b l e P, a major reason
208

f o r low p r o d u c t i v i t y under t h e s e l a n d u s e s y s t e m s . The d i f f e r e n t i a l e f f e c t s en s o i l c h a r a c t e r i s t i c s of d i f f e r e n t l a n d u s e s were p r i m a r i l y due t o v a r i a t i o n in t h e amount and q u a l i t y of l i t t e r i n p u t s in c c n j u n c t i c n wi th r e t r i e v a l b e h a v i o u r of t h e r o o t s . S l o p e s and s o i l dep th a l s o appea red t o have p ro found i n f l u e n c e on t h e r e s t o r i n g c a p a c i t y of t h e s e s y s t e m s . The h i g h v a r i a b i l i t y wi th r e g a r d s t o s u b - s u r f a c e s o i l p r o p e r t i e s was a l s o e v i d e n t b u t t h e magni tude d i f f e r e d wide ly from one l a n d u s e t o a n o t h e r . Under s i m i l a r s i t e c o n d i t i o n s , bamboo + p i n e a p p l e + broom g r a s s ; a r e c a n u t + b l a c k p e p p e r / b e t e l l e a f + j a c k f r u i t and c i t r u s + a r e c a n u t + b l a c k p e p p e r / b e t e l l e a f + j a c k f r u i t c c u l d be t h e most u s e f u l l a n d u s e sys tems f o r r e s t o r i n g s o i l f e r t i l i t y and long term s u s t a i n a b i l i t y th rough e f f e c t i v e r e c y c l i n g mechanism.
Tnus, f a r m e r s ' r i c h e x p e r i e n c e and e x p e r t i s e c c u l d b e u t i l i z e d fo r p l a n n i n g of e f f i c i e n t f e r t i l i t y management p r a c t i c e s in d e v e l o p i n g s u s t a i n a b l e food p r o d u c t i o n sys tems en h i l l s l o p e s .
T a b l e 1. Chemical c h a r a c t e r i s t i c s of t o p s o i l
Land u s e sys tem C h a r a c t e r i s t i c s pH Organ ic 'Exch . Exch. 3 r a y ' s • Hot °
ca rbon Al* Ca* Po-P w a t e r {%} i s o l u b l e B
1. N a t u r a l g r a s s l a n d 5 .1 1.45 0 .47 0 .64 2 .51 1.55 2. Maize c r o p p i n g 4.4 0 .95 3. Bamboc+pineapple+ 5 .1 1.75
broom gna*&e line 4. ftrecarrut+toetel 5.5" 2.15
l e a f + j a c k f r u i t 5. Arecanu t+b lack 5.7 2 .22
peppe r+ j ackf r u i t 6. Ci* t rus+arecanut+ 5 .3 1.95
b l a c k p e p p e r / b e t e l l e a f
7. Broom. g r a s s + 5 .5 1.41 Schima S D (+) 0 .43 0 .46
L i t e r a t u r e C i t e d .
(1) B c r t h a k u r , D.N., Singh, A. and P r a s a d , R.N. 1985. S h i f t i n g c u l t i v a t i o n in Nor th E a e t I n d i a and a s t r a t e g y f o r l a n d and w a t e r r e s o u r c e management. B e i t r a g e t r o p . L a n d w i r t s c h V e t r . NarmeÖ. 23 : 147-158
(2) S ingh, A. 1988. Bamboo Drip I r r i g a t i o n System. ICAR Research Complex f o r N . E . H . Region, S h i l l o n g . I n d i g e n o u s Systems S e r i e s B u l l e t i n No. 1.
(3) Singh, B .P . , ' Das, Madhumita and P r a s a d , R.N. 1992. E f f e c t of d i f f e r e n t l a n d u s e sys tems on n u t r i e n t a v a i l a b i l i t y in h i l l y t e r r a i n of Meghalaya, I n d i a . I n t e r . Symp. on N u t r i e n t Management fo r S u s t a i n e d P r o d u c t i v i t y Vo l . I I , pp 6 0 - 6 2 .
0 .93 0 .39 1.87 0 .55 0 .11 1.35 21 .54 1.25
0'. 20" 1.-20 11.5-9 0.7-5
0 .12 1.27 13.55 0 .85
0 .25 1.05 8 .57 0 . 7 1
0 .22 1.24 9 .93 1.05
0.29 0 .36 6 .74 0 .35
') kg" 1 0 mg xg"1
209

Long Term Effects of Cropping System on Soil Properties in Agriculturally Modified Forest Land
R.N. Prasad. ICAR Research Complex for N.E.H. Region, Umroi Road, Barapani 793 103, Meghalaya, India
In t roduc t ion . Removal of fo res t vegeta t ion a l t e r s the biogeochemical cycle and g r ea t l y modifies the phys ica l c h a r a c t e r i s t i c s of the s i t e , expecia l ly under a g r i c u l t u r e land use due to increased human in t e r f e r ences (Johnson et a l 1991). But t h e r e i s a l im i t ed information a v a i l a b l e on s o i l f e r t i l i t y changes in a g r i c u l t u r a l l y modified fo re s t so i l which i s e s s e n t i a l for developing sus ta inab le a g r i c u l t u r e under i d e n t i c a l s o i l and c l ima t i c cond i t ions . I n v e s t i g a t i n g long term e f fec t s of d i f f e r e n t cropping systems on so i l c h a r a c t e r i s t i c s was considered an important component of research e f fo r t s t o explore s u i t a b l e cropping systems for su s t a inab l e p r o d u c t i v i t y .
Ma te r i a l s and Methods. Long term f i e l d t r i a l s were undertaken a t IOiR Research Complex Farm, Barapani (980 m above msl, 26°N and 92°E) in 1984 on acid Al f i so l s to evaluate tne e f f ec t s of d i f f e r e n t land use systems under slopy and t e r r aced land condi t ions on crop p roduc t i v i t y . At the 9th year , so i l samples (0-20 cm depth) were co l l ec t ed from d i f f e r e n t cropping systems v i z . p ine fo res t , n a t u r a l grass land, maize based, r i c e based, c i t r u s , s i l v i - p a s t r u e and forage, and evaluated for some important so i l c h a r a c t e r i s t i c s .
Resul t and Discussion. Soi l pH increased by 0.3 to 0.6 u n i t in t r e e s and forage land use systems over adjoining p ine fo re s t land, whereas i t decreased by 0.5 u n i t in r i c e and maize cropping systems (Table 1) . Notably, a much spec tacu la r decrease in so i l pH (l .fl uni ts ) was no t iced in these cropping systems compared to na tu ra l grass land. This was mainly due t o marked r i s e in exchangeable Al (2.5 folds) as well as d r a s t i c reduct ion in exchangeable Ca con ten t s (2.5 folds) of the s o i l s . On the cont ra ry , dec l ine in exchangeable Al and inc rease in Ca s t a t u s were observed in the t r e e land use which eventual ly caused r i s e in so i l pH. Singh and Prasad (1991) reported s i m i l a r f indings while evaluat ing the lone term e f fec t s of d i f f e r e n t land use systems on the r e s t o r a t i o n of s o i l f e r t i l i t y . An accumulation of organic carbon content was observed in t r e e land use through l i t t e r f a l l , while i t declined in maize, r i c e and forage cropping systems. The fu lv ic carbon content of the s o i l s was e f f ec t ive ly inf luenced under d i f f e r e n t cropping systems. I t was minimum in r i c e and maize cropping and maximum under well managed c i t r u s orchards followed by s i l v i - p a s t u r e land use systems. The a v a i l a b l e P conten t was g r e a t l y enhanced in the s o i l s , e s p e c i a l l y under c i t r u s (well managed cond i t i ons ) ; and maize and r i c e
210

cropping systems, owing to the jud ic ious appl ica t ion of p through organic and inorganic sources coupled with l i t t e r inputs in the orchard, while in ma ize / r i ce cropping, P was appl ied so le ly through inorganic source as s ing le source as s i ng l e super phosphate (52 kg P/ha/year) .
The f a s t e r deple t ion of Ca, fulvic carbon and appearance of excess ive amount of exchangeable Al in the s o i l s r e su l t ed in low s o i l pH under maize and r i c e cropping which led to Ca, Mg and Zn d e f i c i e n c i e s in the c rops . On t h e o ther hand, bu i l d un of Ca, P, fu lv ic carbon and reduction in exchangeable Al evident ly proved b e t t e r r e s t o r a t i o n capaci ty of s o i l s under t r e e land use systems. Thus, t r e e land use systems were found more s u i t a b l e for the maintenance of sus ta ined so i l p roduc t i v i t y under slopy and t e r r a c e land cond i t i ons .
Table 1. Effect of a g r i c u l t u r a l l y modified fo res t land on s o i l c h a r a c t e r i s t i c s
Cropping system b o n c n a r a c t e r i s t i c s Cropp ing system pH F u l v i c Exen. A I üxcn. ua ts r a y ' s
carbon 3. a P 0 - P (%) 2
P i n e f o r e s t 4 . 9 0 .46 0 .55 0 . 4 4 1.2
N a t u r a l g r a s s l ando 5 . 4 0 . 5 4 0 .33 0 .69 3 .33 Maize b a s e d 4 . 4 0.35 0 . 9 3 0 .25 27.00 R ice b a s e d 4 . 4 0.38 0 .95 0 .29 2 4.58 C i t r u s ( w e l l man aged)5 .5 0 .95 0 .29 0 .20 33 .33 C i t r u s (poorly 5 . 1 0.38 0 .39 0 .72 5.00
managed) S i l v i - p a s t u r e 5 . 5 0.70 0 . 2 4 1.22 7 .78 Fo rage 5 . 1 0.60 0 .37 0 .37 12 .33 S D (+) 0 .49 0 .20 0 .29 0 .37 11 .53
a = C mol (P ) /kg , b = mg/kg, C = Control for s i l v i - p a s t u r e , c i t r u s and forage, and d = Control for ma ize / r i ce cropping.
L i t e r a t u r e Cited
(1) Johnson, Chris K, Johnson Arthur H. and Thomas, G. Siccama 1991. Whole t r e e c l e a r c u t t i n g e f fec t s on exchangeable ca t ions and so i l a c i d i t y . Soil Sc i . Am. J . SS, 502-508.
(2) Singh, B.P. and Prasad, R.N. 1990. Influence of d i f f e r e n t farming systems on n u t r i e n t balance in ac id A l f i s o l s . Annual Report, ICAR Research Complex for N.E.H. Region, Barapani, Meghalaya, p 69-71.
211

Commission V. Extended Summaries. Thursday, July 14
Symposium ID- 13. Indurated Volcanic Soils: Use and Management
Page Induration of air-dried volcanic ash soil in Aso area of Japan. H. Kubotera, and I. Yamada. (Japan) 214
Les formations volcaniques indurées des Andes de Colombie: une distribution et des processus géochimiques lies a des conditions climatiques sèches. P. Faivre, et S. Gaviria. (France) 216
Indurated horizons in poorly drained volcanic soils. W. Luzio, and T. Palma. (Chile). . . 218
Formation of petrocalcic horizons in soil from basic pyroclastics under the semiarid climate of Lanzarote (Spain). R. John, and K. Stahr. (Germany) 220
Micromorphology of placic horizons of andosols of the azores. J. Pinheiro and A. Rodriguez. (Spain) 222
Characterization and agricultural assessment of two "talpetate" profiles in Nicaragua. A.W. Vogel. D. Creutzberg and J.H. Kauffman. (The Netherlands) 224
The talpetate of the Central-Pacific region of Nicaragua: a palagonitized tuff from the Masaya volcano. C. Prat and P. Quantin. (France) 226
Utilisation de différentes formes d'amendements organiques pour la restauration de sols volcaniques degrades par erosion anthropique au El Salvador (Amérique Centrale). J. Collinet. (Costa Rica) 228
Dorbank, a reddish brown hardpan of South Africa - A proto-silcrete?. F. Ellis, and J.J.N. Lambrechts. (South Africa) 230
Relation géométrique et variations minéralogiques des différents termes d'une sequence d'altération de tufs pyroclastiques de la region de Texcoco (Mexique). J. Bertaux, et P. Quantin. (France) 232
Les sols a tepetate de la region de xalapa-coatepec, mexique. Caractérisation, degradation et conservation. J.P. Rossignol. (France) 234
Une étude "microstructurale" des traits pédologiques de sols volcaniques indurés ("tepetates") de la vallée de Mexico. C. Hidalgo, F. Elsass, and P. Quantin. (France). . . 236
Premiers résultats d'essais agronomiques visant a la rehabilitation agricole du tepetate U (Texcoco, Mexique): I cas de I'orge et de la vesce. A. Baéz, C. Prat, A. Mdrquez et B. Chora. (Mexico) 237
212

Premiers résultats d'essais agronomiques visant a la rehabilitation agricole du tepetate N (Texcoco, Mexique): II essais agronomiques. B. Chora, A. Marquez, C. Prat et A. Bacz. (Mexico)
Premiers résultats du suivi de 1'erosion hydrique et de l'hydrodynamique des sols a tepetate (Texcoco, Mexique). A. Marquez, C. Prat, E. Huerta, E. Carrillo, and J.L. Janeau. (Mexico)
La rehabilitation agricole de la cangahua en Equateur. C. Trujillo, E. Custode, G. De Noni, M. Viennot and C. Lopez. (Ecuador)
Variabilite de la productivité du Mai's selon l'aptitude de ses ressources phytogenetiques dans un sol indure. H. Navarro et D. Flores. (Mexico)
Utilisation agricole des sols volcaniques indures. M.A. Perez et H. Navarro. (Mexico). . .
Determination of microbial biomass and its fluctuation on base of agroecological management of tepetate. M. Crisostomo S. and R. Frrara-Cerrato. (Mexico)
Agronomics practices for soil conservation. J.D. Rios, J.L. Oropeza and M.R. Martinez. (Mexico)
213

I n d u r a t i o n o f a i r - d r i e d - v o l c a n i c a s h s o i l i n A s o a r e a off J a p a n .
H.Kubotera and I.Yamada. Kyushu National Agricultural Experiment station. Suya, Nishigoushi, Kumamoto. Japan.
Introduction. Physical properties of volcanic ash soils are usually suitable for plant growth. However, in Kumamoto prefecture of Japan, there are buried soil layers in Andisols derived from Aso volcanic tephra, which shrink and become irreversibly very hard when dry. These layers inhibit the production of crops and are called "Nigatsuchi"(niga;bitter, tsuchijsoil). It is important for establishing suitable management of Nigatsuchi to study their characteristics and mechanism of induration.
Materials and methods. Soil survey and sample collection were conducted at the profile in Oozu town of Kumamoto prefecture. The depth of the studied profile was 420cm and it was divided into fifteen horizons. According to ' *C analysis, 3Ab, horizon was formed 10000 Y.B.P., 4Ab was formed 15000 Y.B.P., and 8Ab was formed 25000 Y.B.P.. A corn penetrometer test showed that there is no horizon which is hard in moist condition in this profile.
Particle size analysis, three phase analysis, measurement of pH,total carbon, oxalate-extractable Si,Al,Fe,pyrophosphate-extractable Al,Fe, were conducted.
Undisturbed soil blocks were collected from A,B,3Ab,,3Ab2,4Ab,4Bwb,6Ab,8Ab, 9Bwb,and lOAb horizons, and their shear strength with various moisture contents were determined by an unconfined compression test. Their volume reduction with air-drying were also measured.
Four horizons with different degrees of hardening (A:no hardening, 3Ab,: moderate degree, 4Bwb:high degree, 6Ab:low degree) were selected from the result of the unconfined compression test, and the microraorphology was observed in thin section.
Results. Physical and chemical properties of the profile are presented in Table 1. Particle size analysis showed that clay contents of the upper three horizons are smaller than the lower horizons. Among the lower horizons, 9Ab and 9Bwb had relatively low clay content, which is probably due to the particle size of their parent material(tephra). In all horizons, bulk density was between 0.41 and 0.53, and the ratio of solid phase was lower than 20%. This result shows that Nigatsuchi is very porous in field condition. PH value are in the standard range for Andisols in Japan. The amounts of total carbon are over 10% in A and 3A, horizon, and over 3% in other horizons except llBwb. Phosphate retention are over 96% in all horizons. Oxalate-extractable Al is low in 3A, and 9Bwb as compared with adjacent horizons, the amounts of pyrophosphate-extractable Al(Alp) and Fe(Fep) are correlated with total carbon, but in 3A, the ratio of Fep to total carbon is higher than other horizons.
Shear strength of each horizon in various water contents are presented in Figure 1. Results are shown by regression lines in the tested range, excluding the B horizon whose shear strength was reduced in highly dry condition. Shear strength, which is used as an index of hardening here, increased in proportion with drying, except for the A horizon which did not harden and the B horizon. Degree of hardening with drying of each horizon differed from one another. 4Bwb was the highest, 6Ab and 9Bwb were relatively low.
As presented in Figure 2, volume of soil block showed similar linear reduction with drying in all horizons used for the strength test, excluding the A horizon and the 9Bwb horizon whose volume reduction was relatively low in comparison with other horizons. The volume of shrunken air-dried soil blocks did not return to the original state before drying in all horizons.
Micromorphology of the air-dried state is shown in Figure 3. 4Bwb(high degree of hardening) had a continuous matrix with a small amount of pores, whereas A(no hardening) had a large amount of pores, and particles and peds were separated from one another.
214

Table 1. Physical and chemical properties of the studied profile.
horizoi l depth color sand s i l t clay bnlk PH total phosphate oxalate- pyrophosphate- degree of* (aoist) (2-0.02 (0.02- (0.002> density (H,0) -C retention extractable extractable hardening
*•) 0.002sa: •a) Si Al Fe Si Fe M m. m TO P) TO m TO TO TO . TO .
A 0-24 7.5W1.7/1 34.6 30.4 34.9 N.D. 5.8 12.7 97 2.45 9.87 2.98 1.05 0.54 N
e 2 k 60 7.5R3/2 53.6 19.2 27.3 0.48 5.6 7.1 99 3.84 15.77 4.20 0.69 0.10 R 2A 60-80 7.5YR3/1 35.0 33.7 31.2 N.D. 5.6 8.0 99 3.83 13.33 3.94 0.76 0.18 N.D. 3A,b 80-108 7.5YR1.7/1 10.7 22.3 67.0 0.45 5.5 11.7 99 2.36 7.40 4.35 1.68 1.89 M 3A,b 108-130 7.5YR3/3 5.0 29.7 65.4 0.49 5.6 6.6 99 3.81 16.43 3.93 0.89 0.13 M 4Ab 130-182 7.5YR2/1 1.9 31.3 68.7 0.46 5.7 5.8 99 3.56 14.74 3.79 0.92 0.17 M 4BT> 182-220 7.5YR4/6 9.4 23.7 67.1 0.42 5.6 3.0 99 3.49 17.58 3.85 0.61 0.66 H SAb 220-238 7.5YR3/3 N.D. N.D. N.D. N.D. N.D. N.D. 99 N.D. N.D. N.D. N.D. N.D. N.D. 6Ab 238-270 7.7YR2/2 21.1 23.4 55.5 0.51 5.8 5.4 99 3.12 11.95 2.18 0.75 0.20 L 7Ab 270-285 7.5YR3/3 32.1 18.0 49.8 0.52 5.8 4.5 99 3.51 13.64 2.14 0.53 0.08 N.D. 8Ab 285-303 7.5YR2/2 10.1 25.4 64.5 0.44 5.8 4.9 99 3.63 14.22 2.52 0.78 0.08 M 9Ab 303-327 7.5YR3/3 30.0 34.8 35.2 0.46 5.9 3.5 99 3.20 17.53 2.63 0.55 0.05 N.D. 9Bwb 327-350 8.75YR3/4 27.3 29.6 43.1 0.45 5.9 3.1 99 3.57 8.04 2.74 0.51 0.04 L
lOAb 350-410 10YR2/1 12.0 25.0 63.0 0.41 5.9 4.8 99 3.13 19.08 3.25 0.68 0.08 M 11 Bvb 410-420* 10YR4/6 18.0 35.6 46.4 0.53 5.8 1.6 98 3.48 29.82 2.77 0.64 0.03 N.D.
1 Hi high, M; Moderate, L low, R ; strength reduced under highly dry condition, N no hardening.
a m
* A A : «
A : other horizons
t + A A
' i
V i V \^
A V
%
100 so
Water content |\1
Figure 1. Water content and shear strength.
Water content (\|
Figure 2. Water content and volume of soil block (V; volume of soil block, Vd; volume of air-dried soil block)
Figure 3. Hicromorphology of air-dried soils (left; 4Bwb(high degree of hardening), right; A(no hardening) ).
215

Les formations volcaniques indurées des Andes de Colombie :
une distribution et des processus géochimiques lies a des conditions climatiques sèches.
Pierre FAIVRE* - Sergio GAVIRIA **
*Université de SAVOIE - CISM - 73376 Le Bourget du Lac - Cédex -France * VNGEOMINAS - Diagonal 53#34-53 - BOGOTA - Colombie.
Introduction. Les formations volcaniques indurées présentes en Colombie sont toujours localisées dans les regions internes du massif Andin, a des altitudes tres variées. Elles n'occupent que des surfaces limitées surtout si on les compare avec les tres vastes extensions occupées par ce même type de formations dans de nombreux autres pays d'Amérique latine. Cette rareté relative explique sans doute qu'elles n'aient pas comme ailleurs regu de nom vemaculaire et que même ceux de Cancahua ou de Talpetete qui les caractérisent respective ment en Equateur et Amérique centrale ou au Mexique y soient inconnus. Elles occupent des positions particulières a l'intérieur du massif et marquent fortement le paysage des regions oü elles sont présentes.
Caractères généraux du massif andin colombien. Les Andes de Colombie (1 a 7N) torment un ensemble puissant d'orientation pratiquement méridienne qui s'étend sur plus de 1000km et qui dans sa plus grande largeur dépasse les 500km. La forme générale de l'ensemble est grossièrement celle d'un trident : étroit (150 km) et constitué d'une cordillère unique au sud , il s'élargit et se divise rapidement en trois branches, trois hautes cordillères (Oriëntale, Centrale et Occidentale), encadrent deux grandes vallées de basses altitudes (Cauca et Magdalena). Les Cordillères sont elles mêmes fortement compartimentées par des accidents (bassins ou vallées) également d'orientation N-S. Cette conformation n'est pas sans incidence sur la climatologie interne du massif: les hautes cordillères externes bloquent la penetration des alizées et laissent sous la dépendance de circulations venteuses locales les nombreux compartiments internes du massif. Ces phénomènes amènent a l'intérieur de chaque compartiment des variations d'humidité importantes et tres rapides : alors que leur fond beneficie de conditions sèches voire franchement xériques les versants qui les dominent deviennent de plus en plus humides en altitude. Les nombreux appareils volcaniques qui dominent la cordillère centrale ont émis des projections importantes qui ont ennoyé sous d'épais depots pyroclastiques les 2/3 sud du massif, y compris les cordillères latérales. Si les dépöts situés a proximité des appareils sont souvent tres récents ceux qui couvrent les cordillères latérales sont beaucoup plus anciens et se sont majoritairement mis en place entre - 20 000 et -10 000 ans. Ces dépöts sont essentiellement andésitiques et daci-andésitiques dans la partie médiane du massif, ils deviennent plus basiques vers le sud.
216

Formations pyroclastiques meubles ou indurées. Le caractère des formations pyroclastiques dépend étroitement des conditions climatiques qui président a leur alteration. Alors que dans les zones humides elles se présentent sous forme d'ensembles qui restent meubles et de couleur a dominante brune ou jaunatre celles qui se sont déposées dans des zones de climat a tendance sèche sont indurées plus ou moins fortement (mais généralement doivent être rompues au marteau) et possèdent une couleur claire qui varie du gris au blanc. II n'est pas rare de pouvoir suivre le long d'un même versant le passage d'un état a l'autre en fonction de l'assèchement progressif du climat. Ces observations expliquent que d'une fagon générale dans la partie du massif recouverte par des depots pyroclastiques Ie bas des versants et le fond des vallées ou bassins soient occupéspar des formations indurées alors que Ie haut de ces mêmes versants est recouvert par depots meubles. La confrontation de l'age des depots et des études paléoclimatologiques indique que lorsque les formations pyroclastiques ont été déposées et altérées primitivement sous climat humide elles restent meubles même si postérieurement il se produit un assèchement general du climat.
Aspect et composition des matériaux indurés. La stratification des depots est conservée dans ces formations indurées. Chaque niveau se présente sous la forme d'un ensemble homogene qui sur le terrain ne diffère de ces voisins le plus souvent que par la granulométre. Localement des amas de concretions ferrugineuses peuvent rompre cette homogéneité. L'observation micromorphologique indique que l'altération des minéraux (ou verres) primaires est faible, surtout si on la compare avec celle des mêmes formations altérées sous conditions humides. Ces minéraux sont unis par des ciments siliceux parfois calcaires. Des concretions ou des veines de carbonates et de gypse peuvent exister. Des cutans argileux ou siliceux se manisfestent localement. La porosité d'ensemble est toujours tres faible.
Sols associés. II s'agit soit de sols vertiques noirs (Torrerts) soit de Planosols eutriques (Apbrutic Haplustalfs, Durustalfs) alors que dans les zones humides les formations meubles sont associées avec des sols a caractères Andiques.
Hypotheses sur le mode d'induration. Dans ces zones sèches l'étude expérimentale de la dynamique hydrique montre que les bilans sont tres déficitaires et que les volumes d'eau qui peuvent percoler a travers ces formations sont tres faibles voire nuls. Seul quelques elements tres solubles libérés par l'altération parviendraient a être évacués les autres silice, calcium, fer se trouveraient rapidement bloqués pratiquement in-situ formant ciments et glébules. La presence de soufre dans ces milieux confines rendrait les solutions d'altération primitives tres agressives et expliquerait une certaine mobilité du fer antinomique de conditions sèches. La porosité faible qui résulte de la cimentation rend postérieurement ces milieux peu perméables done peu évolutifs sur Ie plan minéralogique.
217

Indurated Horizons in Poorly Drained Volcanic Soils
W. Luzio and T. Palma. Faculty of Agronomy, University of Chile Casilla 1004, Santiago, Chile.
Introduction. Some poorly drained volcanic soils show indurated horizons at different depth in the profiles, seldom deeper than 1 meter. They are normally located between the layer of ashes and the glacifluvial deposit underneath. These constraining horizons take different forms: from a thin iron-rich layer strongly cemented to a thick ( > 10 cm) ferrugineous sandstone with a weak cementation.
Materials and Methods. To study the various forms of these limi-ting horizons and some of its properties, about 15 horizons were described and sampled in the cold perhumid region of southern Chile (from 41° S.L., to 42°30' S.L.). Five of them were selected as representative of the different types of indurated horizons: ferrogineous sandstones (Alerce and Maullin); thin iron cemented horizons (Chepu and Calonje) and massive rock-like horizon (Quilanto).
Some physical and chemical properties were measured, according to the methods described in Soil Survey Laboratory Methods (Soil Conservation Service, 1982). Chemical properties measured were: organic carbon (O.C.), iron and aluminum fractions extracted with dithionite-citrate, acid ammonium oxalate and 0,1 M pyrophosphate solutions; silicium fractions extracted with dithionite-citrate and acid ammonium oxalate solutions and manganese extracted with dithionite-citrate solution. All elements were measured by atomic absorption spectrometry.
Results and Discussion. The translocation of iron, as iron-organic complexes or as non crystalline oxides, throughout the soil profiles, has been mentioned as the main process involved in the formation of these indurated horizons.
Barros (1988) studying ftadi soils demostrated that the non crystalline iron increased from 0.35%, in the fine earth fraction, to 9.7% in the indurated horizon, while the organic carbon decreased from 13.6% to 3.1% in the same horizon.
As expected, iron is the most abundant element in these horizons. Because of the volcanic origin of the entire landscape, one should expect that the amorphous iron fractions would be by far the dominant cementing agent. However, the results shown in Figure 1 make it difficult to state that cementation is mainly due to amorphous iron oxides, since the crystalline iron oxide fraction represents an important percentage of the total iron fractions. Only in Quilanto horizon cementation may be attributed to crystalline iron oxides which represent 70% of the total iron fractions.
In relation to aluminum fractions, the results show that these are considerably lower than the iron fractions. Therefore we do not believe aluminum is responsible for the cementation and induration in the horizons studied.
The organic carbon is comparatively high if we consider that they are subsurface cemented horizons. Barros (1988) found 3,1% in some cemented horizons from Chiloe Island and Besoain (1985) states that these cemented horizons are free from organic compounds. Our results indicate the O.C. goes from 1.1% to 5.6% which is considered very high. Nevertheless the high amount of
218

E ó n £ w uS ° n l V h e C O l ° r b u t n 0 t h e " N a t i o n . In the same way the amount of Mn (dithionite) is so low that it has no influence in the hardness of the horizons Only the cementation from Quilanto horizon may be due, partially, to manganese.
Finally Si (dithionite) is very low while Si (oxalate) is only slightly significant in the ferrugineous sandstones, A.erce and Mau.lin. These result, confirm t h o V o ^ n e d b>C.ayden et
From our results we conclude that in the horizons studied, iron is the main comnonpnt „„H cementing agent. A.uminum, manganese, silicium and organicCarbon p . a ' " ü in
c r v T i i r i r o n 6 T V 0 ' d e C i d e ° n , h C b 3 S i S ° f ° U r r e S u l t s whether^hVanTphous or the emark tha n u ' Z T \ "i '"T** r e S p o n s i b l e f o r t h e cementation observed. We shouW
morphology ° " " ° d e f i n h e , e n d 6 n C y d u e , 0 i tS v e ^ d i f f e r e n <
Literature cited. Barros, C. 1988. Clasificación y
caracterización de algunos suelos de nadi de la X Region de Chile. Fac. Cs. Agr. y For. U de Chile. 124 p.
Hesoain, E. 1995. Los suelos. En: Tosso, J. (ed). Los suelos volcanicos de Chile MINAGRI-INIA. pp:25-106.
Clayden, H., Daly, B.C., Lee, R. and Mew , G. 1990. The nature, occurrence and genesis of Placic horizons. In: Kimble J. M. and Yeck, R. D. (eds). USDA, SCS, Lincoln, N.E. 438 p.
FIGURE 1. IRON (%)
219

Formation of Petrocalcic Horizons in Soils from Basic Pyroclastics under the Semiarid Climate of Lanzarote (Spain)
R. Jahn and K. Stahr. Department of Soil Science, 75093 University of Hohenheim, Germany.
Introduction. The Island of Lanzarote (800 km2, 29 °N) consists of eruptive rocks, which originate from six different eruptive phases (miocene to holocene) and offers a unique opportunity to study soils in different landscapes of different age. The geochemistry of the rocks is basic to ultra-basic with minor variations. The prevailing moisture regimes according to Soil Taxonomy are ustic tending to aridic at low elevations and xeric at higher elevations. The corresponding temperature regimes are hyperthermic and thermic. A conspicuous feature of the north-eastern Canary Islands and the drier parts of the others is, that the older landsurfaces are dominantly covered with thick carbonate accumulations. Due to erosion of the upper part of the soils, the calcrete has been exposed in these vast areas. The soils of all steps within the chronosequence under investigation show a distinct increase of development and even of lime enrichment with age. The purpose of this paper is to describe the extend, morphology and origin of the carbonate accumulation.
Material and Methods. The analyzed profiles (methods comp. (2), (3), (4)) were selected from the data, collected after mapping of two areas in each of six different landscapes of Lanzarote. The main criterion for selection was the maximum stage of soil development within every landscape. Very young soils, one Eutric Regosol and one Eutric Leptosol (IVB-101, -313) developed from 260 years old lapilli and cinders and a Mollic Andosol (IVA-660) from about 6,000 years old lapilli and cinders are studied as well as a Luvic Calcisol (111-510) and a Chromic Luvisol (111-570) developed from younger pleistocene lapilli and cinders and from basalt, respectively, and a fairly old soil, a polygenetic Chromic Luvisol (1-800) resting on pliocene basalt. The soils of the older series are characterized by severe erosion and accumulation of soil material (e g. profile 1-800) (5). The more recent soils are less or not affected by erosion (2).
Results and Discussion. In the youngest soils IVB about 1 kg/m2 carbonate has been accumulated, mainly in some cm thick Ck-horizons, about 10 cm below the surface, where pyroclastic layers are finer in texture than in the average. The Ck-horizons are only slightly hardened. The carbonate forms microcalcite in the soil matrix and microsparites and sparites in enclosed pores of the lapilli. In the soils IVA up to about 10 kg/m2 carbonate has been accumulated in numerous thin (2-5 cm) Ckm-horizons between 30 to 300 cm depth. Vertical pipes of carbonate accumulation, 5-15 cm in diameter, are frequent from 30 to 150 cm depth. The carbonate also forms microcalcite in the soil matrix and microsparites and sparites in enclosed pores of the lapilli. The lapilli are fresh to nearly fresh, the alteration being katamorphous, pellicular and dotted. In the soils III from pyroclastics up to more than 100 kg/m2 carbonate has been accumulated in Bwk-, Btk-horizons, in a consolidated thick Cwkm-horizon, and also in numerous thin (2-5 cm) Ckm-horizons to more than 300 cm depth as in IVA. The main accumulation is in the Cwkm-horizon, which has a coarse laminar to blocky structure. The big structural units frequently have a fine laminar shell on the surface and usually show a horizontal layering where carbonate-rich soil and carbonate impregnated lapilli alternate. In soils III from massive basalt, carbonate has been accumulated in greater depth than in soils from pyroclastics within Bt-horizons and as crack filling in the basalt. On older landsurfaces carbonate has been accumulated in often very thick Bkm-horizons and as filling material in cracks of relictic Vertisols. In Profile I-800, for which a polygenetic development in 8 steps is assumed (5), about 1,700 kg/m2 carbonate has been accumulated down to 450 cm depth, mainly in a 170 cm thick Bwkm-horizon. A smaller part of the carbonate in profile IVA-660 and most of the carbonate in III-510, III-570 and of 1-800 is found to be low- and high Mg-calcite by chemical extractions as well as by a shift of the d (112) (X-ray) spacing to around 3,02 A (1). The l4C-age of carbonate from a pipe (100 cm depth) of profile IVA-660 is 1,850 y, of two laminar crusts at 260 and 280 cm depth 11,000 and 6,000 y respectively (3). The age of the latter two samples seems too old for an in situ precipitation, and
220

Soil Depth Ca bound Ca loss from Quartz Ca in Calcite Cafrom cm in soil-carb prim, material (Quartz accomp.) seaspray
IVB-101 0-100 0.6 >0.01 1.0 0.4 0.03 IVB-313 0- 17 0.5 >0.16 1.2 0.5 0.03 IVA-660 0-100 1.4 11 17 7 0.7
100-324 4.2 n.d. 0.0 0.0 — III-510 0- 81 50 23 51 20 5 III-570 0-140 7 47 89 35 5 1-800 0-450 600 n.d. 516 206 -
i8(yi6Q isotope ratios of these samples indicate a formation at about 10 °C higher than other carbonates from the Island (3). Samples from older soils have an age which confirms the general idea of soil development in Lanzarote and age of parent material (2): 8,000 and 14,500 y for Bwk and Cwk in III-516, 12,000 and >35,OO0 y in Btk and Bwkm of 1-800.180/160 ratios in these samples are in the same range. In general, the increase of carbonate accumulation follows the increase of soil development, e. g., as expressed by the formation of clay and oxides. Nevertheless some differences make different sources of Ca probable. Since all soils under investigation are far from the groundwater, Ca-sources can only be the parent rock, eolian additions as indicated by quartz (the parent rock is free of quartz, a "Levante-dust" sample have a quartz/calcite ratio of 1/1) and from seaspray which is taken into account with 0.3 l/m2«a (calculated from K-uptake for illitization (2)) (Tab. 1). For profile III-510 and 1-800 due to the slope position an addition of Ca by lateral water movement appears possible but can not be quantified.
Tab. 2: Quantities in kg/m2
of Ca in carbonate, loss from primary material, of quartz, Ca from accompanying calcite and of Ca from seaspray
For younger soils the biggest source of Ca is the parent material, which contains about 8 % Ca (lm3
lapilli = 80 kg Ca, lm3 basalt = 190 kg Ca) but for the youngest soils IVB the time for weathering was obviously too short to mobilize the Ca for carbonate from the parent material. The amounts of Ca bound in carbonates are about equal to the import of Ca from eolian dust, but have partly been repre-cipitated as micromorpological observations indicate. In the IVA soil the carbonate can be explained as Ca-loss from the parent material by weathering and precipitation as CaC03. Part of the soil-carbonate seems to be of eolian origin. This can be recognized by the age of the carbonate in deeper Ck-horizons as well as of the 180/160 Isotope ratios which indicate a higher precipitation temperature which may have been realized within the Sahara area. All carbonate horizons of IVB soils and most horizons of the IVA soil show under X-ray observation the same position of the d (112)-reflex as the calcite from the Levante-dust (with no or very low Mg-substitution). The carbonates of the older soils have a higher Mg-substitution and the age of the carbonates corresponds with the age of the soil. For III-510 the carbonate can be explained by weathering and eolian addition. Nevertheless, this profile is eroded, which means the Ca source from the parent material was originally higher and the amount of carbonate may have been increased by lateral addition. In general, in the soils of landscape III the carbonate Ca should originate from the rock and from eolian additions. Ca- addition from seaspray seems to be negligible for all soils. Profile 1-800 has been eroded and buried several times, partly with fresh material, partly with already weathered material maybe also with carbonatized soil material. The composition of elements as well as of clay minerals indicates for the whole soil about 70 % of volcanic parent material and about 30 % of eolian material. Therefore we assume for this polygenetic soil a similar situation as for landscape III.
Literature Cited (1) ARNAUD, R.J.ST. & HERBILLON, A.J. (1973): Occurrence and genesis of secondary magnesium-bearing calcites in soils. Geoderma 9, Amsterdam, p. 279-298. (2) JAHN, R. (1988): Boden Lanzarotes - Vorkommen, Genese und Eigenschaften von Boden aus Vulkaniten im semiariden Klima Lanzarotes (Kanarische Insein). Hohenheimer Arbeiten. Ulmer, Stuttgart, 257 p. (3) MAG-ARITZ, M. & JAHN, R. (1992): Pleistocene and holocene Soil carbonates from Lanzarote, Canary Islands, Spain: Paleoclimatic Implications. Catena 19, Cremlingen, p. 511-519. (4) SCHLICHTING, E. & BLUME, H.-P. (1966): Bodenkundliches Praktikum. Parey, Hamburg, Berlin, 209 p. (5) SCHÜLE, J., STAHR, K., ZAREI, M. & JAHN, R. (1989): Basaltverwitterung und Bodenentwick-lung seit dem mittleren Tertiar auf Lanzarote, Kanarische Insein (Profil Malaya Chica). Zeitschrift fiir Pflanzenernahrung und Bodenkunde. 152. Weinheim, p. 105-113.
221

Micromorphology of Placic Horizons of Andosols of the Azores
J. Pinheiro*, Departamento de Ciências Agrdrias, Universidade dos Agores, 9700 Angra do Heroismo, Portugal; and A. Rodriguez, Departamento de Edafologia, Universidade de La Laguna, Tenerife, Spain.
Introduction. A placic horizon is a common feature of the soils of the Azores archipelago that develop at higher altitudes, under a hiperhumid climatic condition, in general above 500 m. These soils, although sharing with Andisols their characterise andic properties aditionally exibit a quite distinct behavior imposed by the ironpan. In this study the micromorfological characteristics of these soils are described and discussed.
Materials and Methods. This study is referred to eight representative pedons of Terceira island of the Azores archipelago whose genesis and properties are discussed elsewhere (1). Thin sections of the most representative horizons (OA, AC, BE and Bsm-placic) were examined under a petrographic microscope and micromorphological characteristics were described following the methodology proposed by Bullock et al. (2).
Results and Discussion Soil morphology Parent materials are piroclasts of acid (pumice and ash) or basaltic nature. The soil profiles have an organic surface layer 5 to 15 cm thick and can by monogenic, developed from one single material or, more frequently, stratified, with buried horizons reflecting intermitent eruptive fases. At a variable depth, in general between 10 and 30 cm, a thin cemented and relatively impermeable illuvial horizon rich in iron develops (Bsm). In monogenic profiles the placic horizon sistematically develops in the transition between a highly moisture retentive organic rich horizon, peaty at surface, and the better aereared course material of the BC horizon. In poligenic profiles the placic horizon occurs in the transition of two mineral layers of diferent ages and textures, or yet in the inferior contact with a buried organic horizon. Micromorphological description The micromorphology of the most representative horizons can be summarized as follows: — the organic horizons are dominated by vegetal remains in general little decomposed mixed with vitric course fragments, highly porous. Few granular microagregates in a spongy microstructure may be present. The more frequent pedofetures are spheroidal excrements; — the AC and BE horizons consist of loosely packed coarse mineral grains mainly vitric mixed with polymorphic organic metter, less abundant in the BE horizon, which forms either partial coatings on the vitric fragments or isotropic micro-agregates in the intergranular spaces. Organic remains at various stages of decomposition also occur specially in tha AC horizons; — the Bsm-placic horizons are defined by an intense and progressive acumulation of an Fe-oxides plasma filling intergranular spaces and impregnating the surface of the vitric fragments of the mineral skeleton, forming a yellowish red to dusky red non-stratified isotropic mass. Genetic interpretation These characteristics show a relatively incipient evolutive process taking into account the incipient weathering stage of the parent material and the absence of crystalline clay minerals. Nevertheless the interaction of climatic conditions and parent material favours the development of specific characteristics that strongly affect the agronomical use of these soils.The dominant process involved, concerning iron oxide acumulation and the development of a placic horizon, is a selective movement of dissolved iron into the thin ironpan, which is best explained by reduction and mobilization of ferrous ions above the pan, as inferred from chemical data (1) and supported by micromorphological evidence.
222
Literature Cited (1) Pinheiro, J. 1990. Estudo dos principals tipos de solos da ilha Terceira (Acores). Tese de doutoramento. Universidade dos Acores, 9500 Ponta Delgada, Portugal. 212 pp. (2) Bullock, P. 1985. Handbook for soil Thin section description. Waine Res. Pub., Wolverhampton, England. 152 pp.
223

Characterization and Agriculture Assessment of Two "Talpetate" Profiles in Nicaragua
A.W. Vogel, D. Creutzberg and J.H. Kauffman. International Soil Reference and Information Center, P.O. Box 353, 6700 AJ Wageningen, The Nederlands.
Introduction. In about 15% of the soils in the Pacific Region of Nicaragua a process of cementation within the soil profile is active. This has resulted in a duripan like layer, which in Nicaragua is called "talpetate". Prat (1) presents evidences that the talpetate is a kind of volcanic tuff layer, deposited ± 2,000 years ago, which was changed by weathering processes. In 1992 two talpetate soils of the Pacific Region were studied for incorporation in the Central American Soil Reference Collection and Database. Description and sampling of the soils was carried out by the "Centro Agronómico Tropical de Investigation y Ensenanza", Turrialba, Costa Rica and the "Universidad Nacional Agraria" of Nicaragua, in collaboration with the International Soil Reference and Information Centre (ISRIC), Wageningen, The Netherlands. The samples were studied and analyzed, and the results, including also a characterization and evaluation of the agricultural potential of these soils, are presented in this paper.
Methodology. A detailed description of both soils was made (3), and samples were analyzed at ISRIC's soil laboratory. Large undisturbed monoliths were taken for soil expositions in Costa Rica, Nicaragua and The Netherlands. A micromorphological and microchemical study of the talpetate were carried out and agricultural potential of the soils was evaluated with a crop simulation model.
Results. The first soil (NI010) is located at about 17 km from the Pacific coast. The topography is undulating to rolling; the parent material consists of volcanic deposits. Actual land use is restricted to grazing land. In the past the land was used for maize, beans and tomatoes, but without good production. The soil is a shallow, moderately well drained, dark (yellowish) brown, silty clay loam to silt loam, mixed in the topsoil with fresh talpetate fragments. The soil material has a weak to moderate structure and is moderately porous. Below 23 cm there is a thick strongly cemented, platy layer, locally called "talpetate". The soil is classified as a Haplic Phaeozem, duripan phase and as an Entic Durustoll. The immediacy of a continuous hard layer can cause damage to agricultural machinery. Only few roots can pass through fissures in the talpetate, and plants cannot benefit from nutrients and moisture available in the subsoil. For most crops the amount of water stored above the talpetate is not sufficient for high and sustainable yields (AWC= 48 mm/23 cm soil). Irrigation is required but is difficult to acquire in view of the undulating topography, the lack of surface water and the deep groundwater level. Potential rainfed agricultural production is reduced in comparison to soils without a talpetate. Calculations with the crop simulation model WOFOST (2) showed 10% yield reduction for maize for this soil with a talpetate at 23 cm, no reduction for soils with a talpetate at 40 cm and 25% for soils which are extremely eroded and present the talpetate at 10 cm for a growing season with an average rainfall. Larger reductions are to be expected in growing seasons with less than average rainfall.
224

The second soil (NI011) is located at 2 km from the Pacific coast. As part of a fluvio-lacustrine plain, the topography is level to very gently sloping. The parent material is unconsolidated and has a mixed composition consisting of pyroclastic and sedimentary rocks, which have been reworked. The actual land use is arable farming, with a moderate level of inputs. The present crop is sugar-cane, seasonally irrigated. The soil is a deep, moderately well drained, dark brown to dark reddish brown loam, mixed with fresh talpetate fragments. It is strongly to moderately structured and highly porous. Below about 42 cm, a strongly cemented discontinuous platy talpetate layer is found of variable thickness. In the subsoil, below the talpetate, the soil material shows evidence of high biological activity and also strong thixotropic characteristics. Like the first soil (NI010) this soil keys out as a Haplic Phaeozem, duripan phase and as an Entic Durustoll. The talpetate is discontinuous and fine roots can pass by. The amount of water stored above the talpetate is limited (AWC= 99 mm/42 cm soil), so crops have to use water stored in deeper layers. Taking into account the high water needs of sugar-cane, additional water has to be provided, in order to guarantee sustainable yields. Potential agricultural production as calculated with WOFOST is reduced in comparison to comparable soils without a talpetate. Sugar-cane yields decline with 11% for soils with a talpetate at 42 cm, 6% for soils with a talpetate at 60 cm and 16% for soils which are eroded and present the talpetate at 30 cm. Examination of thin sections show that the talpetate is compacted with very few pores, except in a few zones where soil fauna has been active. The micromass of the talpetate is optically isotropic with common inclusions of silicate clay minerals produced by weathering of the ash. X-ray diffraction confirms the presence of halloysite. The larger particles are identified as volcanic glass, feldspars, pyroxenes, and fragments of volcanic rock. High percentages of oxalate extractable aluminium and silicon, and high percentages of aluminium as measured by SEM-EDAX were found. The ratio of extracted amounts of Al and Si of the talpetate is 1.2 and therefore all Si is bound by the allophane. It is postulated that the isotropic micromass consists dominantly of allophane, which acts as a cementing agent after irreversible dehydration. This does not coincide with the findings of Prat (1). The talpetate does not meet the requirements of a duripan because silica is not the main cementing agent.
Conclusions. Rooting conditions, nutrients and moisture availability and the potential for mechanization of the soil can be negatively affected when the talpetate is continuous and at shallow soil depth. Calculations with the crop simulation model WOFOST give first estimations of the yield reductions. Evidence exist that allophane in these soils acts as a main cementing agent of the talpetate and not silica as is normally presumed.
Literature Cited. (1) Prat, C , 1991. Etude du talpetate, horizon volcanique induré de la region Centre-
Pacifique du Nicaragua. Genese, caractérisation morphologique, physico-chimique et hidrodynamique, son röle dans 1'érosion des sols. Université Paris VI, Paris, France.
(2) Pulles, J.H.M., J.H. Kauffman and J. Wolf, 1991. A user friendly menu and batch facility for the crop simulation model WOFOST v4.3. ISRIC's Working paper and preprint 91/09. ISRIC, Wageningen, The Netherlands.
(3) Vogel, A.W. and E. Acuna Espinales, 1993. Talpetate reference soils of the Pacific Coastal Plain, Nicaragua. ISRIC Soil Monolith NI010 and NI011. Soil Brief NI010/011. ISRIC, Wageningen, The Netherlands.
225

The Talpetate of the Central-Pacific Region of Nicaragua: a Palagonitized Tuff from the Masaya Volcano
Christian Prat* and Paul Quantin**. *ORSTOM, Col. Los Morales, A.P. 57297, 06501 México, Mexique; **ORSTOM, 93143 Bondy CEDEX, France.
Abstract: In the Central Pacific area of Nicaragua, a talpetate (an indurated horizon) was studied through field morphological observations of soils profiles along toposequences, microscopy of thin sections, mineralogical, physical, and chemical analyses. The results of this study show that this talpetate is a volcanic tuff spread over 2 500 km2, mainly west of the Masaya caldera. This tuff is composed of basaltic andesite ashes with labrador and pigeonite of the tholeiitic series.. Most of the basaltic glasses were "palagonitized" when the tuff was deposited, or shortly afterwards, thus leading to the formation of ferriferous smectites. However, a subsequent meteoric weathering was superimposed on this primary one. As a result halloysite was formed under a tropical climate characterized by a well-pronounced dry season. Under a more humid climate and with Andisols over the talpetate, gibbsitans, mangans, and allophans were formed on the surface and in the cracks of the talpetate. This tuff is the result of one or several piroclastic surges that took place during the phreato-magmatic explosions in the caldera of Masaya some 2000 years ago. We propose a change from the ambiguous term talpetate by "palagonitized tuff of Masaya" in order to name this indurated horizon of the Central-Pacific area of Nicaragua.
Introduction. In some volcanic soils of Nicaragua and in other countries of Latin America, there is an indurated horizon called "talpetate" which makes agriculture difficult and whose origin is controversial (Terra, 1992). The word talpetate comes from tepetate a néhuatl word (tetl = rock and petatl = bed). In spite of the fact that its etymology indicates that it is an indurated horizon, it does not give more information about its characteristics. Until the work of Prat (1991), there were two opposite points of view on the origin and the characteristics of talpetate. According to geologists, this horizon is the equivalent of a tuff called "Masaya tuff' or "Retiro tuff', which has as its origin a pyroclastic flow from a phreato-magmatic explosion (Williams, 1983) or could be an aerial volcanic deposit (the "triple layer" of Bice, 1980). In both cases, the Masaya caldera is identified as the source of this material. On the other hand, pedologists consider talpetate as an aerial deposit of fine volcanic ashes cemented later by lixiviation and accumulation of clay, silica and oxides of iron and aluminium, such as what happens in a B horizon (Marin et al., 1971; Rodriguez, personal communication, 1985). However Prat (1991) clearly showed that it is a tuff emitted by the Masaya volcano with a phreato-magmatic origin, which under some special conditions suffers changes due to pedogenic processes.
Our purpose is to detail some aspects which clearly show the origin and the characteristics of talpetate as well as its presence in the soils of the Central-Pacific region of Nicaragua.
Materials and Methods. Through its spatial distribution and its characteristics, it is possible to deduce the volcanic origin of the talpetate. However, differences in climate between the banks of the lake of Managua and those of the Pacific coast, and the heights of the Sierras of El Crucero-Las Nubes, have as a result different soil performances. On the other hand, it is sometimes difficult to determine with precision talpetate from all the others horizons more or less indurated. That's why we study the spatial distribution of the talpetate whether at the profile, toposequence or regional level. We complet this work through macro and microscopic observations (optical microscopy, SEM with a Castaing probe, TEM, XRD), as well as physical-chemical analysis of the characteristics of some indurated horizons from a series of profiles distributed along a northeast - southwest cross-section of the Central Pacific region of Nicaragua.
226

Results. Talpetate is made of andesite with pigeonite and labrador, this means it is a volcanic product whose composition borders between basalts and andesites. It belongs to the series of the tholeiites, which indicates that the magma had it's origin in the fusion of the oceanic plate but was a little bit "contaminated" when passing through the tephra crust. The primary minerals prevailing in the soldered cinders and the "triple layer" (Bice) are essentially dark basaltic glasses and, to a certain extent, andesitic and dacitic glasses. There are also plagioclases (labrador, andesite), augite, magnetite, and traces of cristobalite, quartz and hematite. In the case of the secondary minerals, the palagonitization of glasses (Honnorez, 1967) led mainly to the formation of ferriferous smectites. Under humid tropical climate and Andisol, there are processes of illuviation-concentration around the voids and formation of gibbsite, allophane and halloy-site. Under dry tropical climate and brown soils with andic features there is halloysite but little allophane. The presence in talpetates and in soldered cinders of products such as magnetite, microlites of glasses, palagonite, armoured nodules (Fisher and Schmincke, 1984) among others, prove the volcanic origin of these materials. The difference between them is not due to a meteorical weathering, but to a geological one. That means talpetates are a phase of a phreato-magmatic eruption where the conditions at the moment of the explosion (specially the water/solid ratio) were different. In one case weathering of the glasses by water resulted in palagonite and later in ferriferous smectites, whereas in other cases, this kind of weathering did not happen. Nevertheless, in all cases, the fusion and/or weathering of the glasses soldered them together, which is the main cause of the induration of talpetates. The physical-chemical and microscopic characterization of talpetates and soldered cinders confirm the field observations. So, through them, we could define the source and possible development of events which generated these materials. Talpetates, also called "Masaya tuff' or "The Retiro tuff' (whereas the soldered cinder is the "triple layer" of Bice) are volcanic tuffs deposited 2,000 years ago during one or several phreato-magmatic explosions of the Masaya volcano as a precolombian pottery prooves it (Prat, 1991). These kinds of explosions are the result of the contact between the phreatic water supplied by the lakes of Managua and Nicaragua with the magma of the volcano. These explosions generated devastating surges of semi-liquid material destroying and molding the vegetation and people. They formed also clouds of dust, cinders, and sand and inside them, the armoured nodules were formed (Fisher and Schmincke, 1984). These surges and aerial deposits covered 2,500 km2 mainly west of the Masaya caldera. This orientation is partly due to the orientation of the winds blowing from east to west the main part of the year. Due to their physical-chemical and morphological characteristics as well as their origin, we propose to call the talpetates that we studied "palagonitized tuff of Masaya". We must not forget that this product appears a few years after Christ, which means yesterday in geological time. It also covers the richer and more crowded region of Nicaragua. The Masaya volcano is still active-Literature cited. Bice, D. C. 1980. Tephra stratigraphy and physical aspects of recent volcanism near Managua, Nicaragua. Ph. D., Univ. California, Berkeley, California, 420 pp. Fisher, R. V. and H. U. Schmincke. 1984. Pyroclastic rocks. SpringerVerlag, Berlin, RFA. Honnorez, J. 1967. La palagonitisation: 1'altération sous-marine du verre volcanique basique de Palagonia (Sicile). These, Université Libre, Bruxelles, Belgique, 227 p. Marin Castillo, E. J., E. Ubeda Gonzales y J. Viramonte Otero. 1971. Contribución al conocimiento de la genesis del "talpetate". San José, Costa-Rica. Febrero de 1971. 31 p. Prat, C. 1991. Etude du talpetate, horizon volcanique induré de la region Centre-Pacifique du Nicaragua. Genese, caractérisation morphologique, physico-chimique et hydrodynamique, son röle dans 1'érosion des sols. These de Doctorat, Univ. Paris 6, Paris, France. 320 p. Sheridan, M. F. y K. H. Wohletz. 1983. Hydrovolcanism: basic considerations and review. J. Vole. Geotherm. Res. 17: 129. Williams, S. N. 1983. Geology and eruptive mechanisms of Masaya caldera complex, Nicaragua. Ph. D., Dartmouth College, Hanover, New Hampshire, 170 p.
227

Utilisation de différentes formes d'am en dements organiques pour la restauration de sols
volcaniques degrades par erosion anthropique au El Salvador (Amérique Centrale)
J. Collinet. Programme d'Aménagement Intégré des Ressources Naturelles, Centre Agronomique Tropical de Recherche et d'Enseignement (CATIE), 7170 Turrialba, Costa Rica
Abstract. Use of different types of organic fertilizers for the restoration of volcanic soils degraded by anlhropic erosion in El Salvador (Central America).
The soils over volcanic ashes of cultivated slopes of the mountains of El Salvador have almost disapeared due to erosion. Among the actions taken for rehabilitation we propose the reconstruction of soils by incorporating different types of organic fertilizers. This reconstruction is controlled experimentally over seven plots of 400m2 installed on farmers land. The results are analysed by considering together corn yield, the erosion, and the pre-soils evolution following the amount of organic matter and the capacity of cationic exchange. The most efficient treatment over the corn yield is the incorporation of 15t/ha/year of chicken manure. The most profitable treatment for the farmer, still acceptable for the erosion, the best for reconstructing the adsorbing complex is an incorporation of 18^a/year of fresh vegetative matter coming from the residuals of Gliricidia sepium.
Introduction. Le concept de "sustainability" reste encore souvent une abstraction en de nombreux pays d'Amérique Centrale qui connaissent ainsi de graves problèmes de degradation des milieux. On présentera dans ce papier une operation de recherche expérimentale entrant dans le cadre d'un programme plus general de rehabilitation d'un bassin versant dont les eaux alimentent un grand barrage hydroélectrique dans le nord du El Salvador, et dans lequel on observe une erosion généralisée liée a une surexploitation d'un milieu déja vulnerable en son état naturel. Parmi la série des mesures prises pour réhabiliter le milieu (reforestation, correction de torrents, fosses d'infiltration, actions sociales), 1'on exposera ici une reconstruction de sols a partir de quasi non-sols recevant des amendements organiques.
Dispositif et Methode. La methode consiste (i) en un suivi de 1'évolution des cultures de I'association traditionnelle maïs + haricots en analysant les stades phénologiques et le rendement, (ii) en un suivi des sols sur 7 parcelles expérimentales de 400m2 installées en 1991 en milieu paysan. Deux parcelles servent de témoins (TEST = testigo), deux recoivent du fumier de poule (ESTI = estiércol), deux autres, des fragments de Gliricidia sepium (plante arborescente légumineuse fixatrice d'azote) enfouis par le labour (MVFE = material vegetal fresco enterrado), enfin, une parcelle recoit les mêmes fragments épandus en surface après les semis (MVFS = material vegetal fresco superficial). Le milieu experimental a été retenu parmi la zone la plus
228

dégradée du bassin. Il comporte en effet, sur des pentes de 20 a 35%, une majorité de Regosols eutriques (taxonomie FAO) ou Ustorthents (Taxonomie USDA) ou Sols peu évolués d'érosion (taxonomie franchise) sur des cendres, ponces volcaniques et parfois sur des horizons organiques enterrés légèrements indurés. Tous sont cultivées en billons isohypses obtenus par traction animale. Les caractéristiques initiales des sols étaient les suivantes (valeurs médianes sur 0/10cm et 20/30cm): argiles (<0,002mm) de 14 a 16%, carbone organique de 4,64 a 2,90 mgC g', capacité d'échange cationique (CEC) de 7,5 a 9,0 cmol(+) kg"1, Ie Phosphore (methode Olsen) de 13 a 5ppm. L'objectif est une amelioration espérée en trois étapes: (a) au court terme portant sur la fertilité chimique, (b) au moyen terme pour reconstruire un complexe d'échange, (c) au long terme pour la restauration d'une structure done pour une amelioration hydrodrodynamiques des sols.
Résultats et discussions. Les premiers résultats concernent 1992 et 1993: a) Les effets a court terme s'inscrivent dans les rendements et 1'érosion. Sur les parcelles ESTI Ie rendement du maïs augmente de 50%, cette amelioration est liée a une montaison plus rapide allongeant d'autant Ie temps de maturation avant la saison sèche. Sur ces mêmes parcelles ESTI, on note 7 a 8 fois moins de mobilisation de terres en interbillons grace a une protection plus rapide du couvert végétal. b) Les effets a moyen terme concernent plus strictement une evolution des sols qui est, cette fois, analysée en suivant les taux de matière organique (MO) et les variations de la capacité d'échange cationique (CEC). On note sur les parcelles MVFE et ESTI des taux de MO respectivement de 1,2 a 1,6 fois plus élevés que sur les parcelles témoins TEST en début de cycle du maïs, 1'on remarque cependant, en fin de cycle, une degradation plus rapide de cette MO par mineralisation sur les parcelles ESTI, par contre, on note une augmentation des taux par humification sur les parcelles MVFE. Le remaniement textural, resultant du labour, a évidemment un effet positif sur la CEC de ces sols tres sableux en surface. Si 1'on isole eet effet des colloïdes argileux, 1'on note encore un effet positif de I'enfouissement du fumier (ESTI) sur la CEC mais 1'on constate par contre un effet négatif sur cette même CEC des résidus de Gliricidia sepium enfouis (MVFE). Ceci mérite d'etre confirmé pendant les 2 autres cycles prévus. Cette difference de comportement s'interprète comme une saturation des sites minéraux d'échange par des composes humiques précurseurs sur les parcelles oü 1'on apporte du materiel végétal frais (MVFE) alors qu'il se construirait un complexe organo-minéral augmentant les sites d'échange avec des composes humiques plus évolués dans les parcelles oü 1'on fournit du fumier (situation ESTI). c) Les effets a long terme ne sont pas encore tous explorables, cependant des determinations structurales codifiées montrent un développement préférentiel d'agrégats d'origine biologique dans les situations MVFE et MVFS. Dans un bilan ou 1'on considère, de fatjon concomitante, les effets (bénéfiques, neutres, négatifs), la faisabilité et le coüt actuel en milieu paysan salvadorien de ces différents traitements, 1'on obtient finalement le classement d'amélioration suivant:
MVFE1 > ESTI2 > ESTI1 > MVFE2 > MVFS2 > TEST1 = TEST2. .. ce qui, dans 1'état actuel de notre information, nous amène a opter pour le traitement "matériaux végétaux frais enfouis" (MVFE) pour recontruire des sols sur ces pentes érodées.
229

Dorbank, a Reddish Brown Hardpan of South Africa - a Proto-Silcrete?
F. Ellis3 & J J.N. Lambrechts.b Faculty of Forestry* & Dept. Soil & Aerie. Water Sciences" University of Stellenbosch, Stellenbosch 7600, Republic of South Africa
Introduction. In South Africa two distinct hardpan formations, namely dorbank (derived from "dor" meaning "dry" and "bank" meaning "hard pan") and silcrete occur, sometimes in the same landscape, although on different erosion surfaces, with silcrete on oldest. Both hardpans consist of soil material that have been cemented by silica, although their colour and general morphology differ. In this paper all available data on dorbanks and silcretes have been used to explain the genetic link that may exist between the two materials. Brief reference will also be made to the importance of dorbank for soil management and land use.
Materials and Methods. Published data1 on dorbanks in South Africa and data gathered by the authors on soils and terrain forms where dorbanks occur, were used. Data on silcretes have been, apart from own observations, compiled from published literature2'3. Analytical methods used on dorbank materials include a slaking experiment, particle size determination, CBD extractable Fe, exchangeable cations, CEC, pH, electrical resistance of saturated soil pastes, organic carbon, petrographic studies, and XRD and XRF determinations of selected samples.
Results and discussion. Dorbanks are related to the duripan of other classification systems. They are hard subsurface horizons, generally with red or reddish brown colours. It ranges in thickness from as thin as 300 mm to more than four metres and occurs at shallow depths (<500 mm) below the soil surface. It occurs extensively on level to slightly sloping land, mainly footslopes, in the arid (mean annual rainfall < 250mm) Karoo where it covers an area of approximately 1,93 million ha, and other semi-arid parts of South Africa (e.g. Western & Eastern Cape; Northern Transvaal. Outside South Africa it is known to occur in Southern Namibia and Botswana, but their distribution have not been mapped. Dorbank is associated with soils developed from unconsolidated parent materials. Two morphological types occur, i.e. a massive type and those with a platy or laminated structure. The platy types occur predominantly in the southern, south-western and south-eastern parts and the massive types in the northern and north-western parts of the Karoo. The layers in the platy type can vary in thickness from a few millimetres to about 300 mm, and may show vertical cracks. Often coatings or thin layers of lime (calcium carbonate) is present between the plates. The massive type of dorbank varies in thickness from 100 - 500 mm, and thicker. A typical dorbank soil profile consists of a red coloured, non-calcareous (rarely calcareous) orthic A horizon4 (Ochric epipedon according to Soil Taxonomy5), approximately 300 mm thick. It is followed by a red apedal B, a weakly structured (red) neocutanic B or a neocarbonate B horizon4 (argillic or cambic horizons5) are found. Unconsolidated material underlying the dorbank is generally weakly structured and highly calcareous (as concretions or as powdery lime) or gypsic. In some profiles the material immediately below the dorbank is calcareous, followed by a gypsic horizon. Dorbank soils generally occupy level to gently sloping (slopes <5%) midslope or footslope terrain positions. The main physico-chemical characteristics of dorbank soil profiles are as follows: sandy (clay content < 10%); alkaline (pH >8,3) A and B horizons; less alkaline dorbank layer; sharp decrease in electrical resistance and increase in soluble salts from A to B and dorbank horizons; high exchangeable sodium percentage; low carbon and citrate bicarbonate dithionite extractable iron content in almost all horizons. In the dorbank, compound grain and planar cutans, consisting of reddish sesquans underlying pale argillans, are fairly common. Pale, finely crystalline secondary silica accumulations (silans) are very common. Based on slaking tests, silica appears to be the dominant cementing agent. In the Karoo, dorbanks were only found in well drained, mainly light textured soils developed from transported materials (pedisediment, colluvium
230

aeolianite, etc.)- The red soil colour, as well as the presence of relict sesquans under pale argillans in the dorbank, confirm the well drained nature of dorbank soils. The high pH of the A-and B- horizons may increase the solubility and mobility of silica, while the high exchangeable sodium may contribute to clay dispersion. Under the prevailing low rainfall conditions, the soluble silica will however not leach through the profile but rather accumulate in the subsoil. Carbonates being more soluble than silica, will under the same conditions, move further down and accumulate in a position below the silica cemented horizon (dorbank), while gypsum will accumulate still deeper.
Silcrete occurs at or near the soil surface and can range in thickness from less than a metre to up to 5 metres. In South Africa silcretes are characteristically associated with Tertiary erosion surfaces and occur as remnant cappings (flat topped mesas) in the landscape, and are therefore of palaeoenvironmental significance. Silcretes are usually associated with pale coloured deeply weathered saprolite, up to 20 m thick, and is referred to as pallid zone material. Pallid zone material is composed primarily of kaolinite and illite, with variable amounts of detrital quartz. In eroded landscapes pallid zone material is usually found on high-lying midslope positions in close proximity to silcrete cappings. These pallid zone materials are usually more saline with a higher ESP (> 12%) than lithic horizons on similar rocks.
In regions where both silcrete and dorbank are found, silcretes occur as cappings on the oldest landscape positions, with dorbanks on lower lying erosion surfaces. In an attempt to determine the relationship between present climate and the distribution of dorbank and silcrete, aridity indices (ratio between annual rainfall and American class A pan evaporation), were calculated for 38 localities. In contrast to silcrete (r2 = 19%), the high correlation (r2 = 63%) between dorbank distribution and aridity index may indicate that dorbank developed under present arid climates.
Conclusions. Although both dorbank and silcrete are the result of silica cementation, their general morphology and genesis differ greatly. The conditions under which silcrete was formed are not clear, but their pale colour point to silica accumulation and cementation under hydromorphic conditions in sandy materials. Dorbank formation appears to be related to present arid climates, or similar paleoclimates, with silica accumulation in well drained, unconsolidated material. Because of the low prevailing rainfall, dorbank soils are mostly used for extensive agriculture. However, in areas where irrigation water is available (e.g. Vredendal, Robertson & Oudtshoorn areas), the dorbank layers are mechanically broken by deep cultivation to increase the rooting depth. After leaching of the soluble salts, they are considered as moderate high potential irrigation soils.
Literature.
1 Ellis, F.1988. Die gronde van die Karoo. Unpublished PhD thesis, University of Stellenbosch, Stellenbosch. 2 Lambrechts, J.J.N. 1983. Soils, soil processes and soil distribution in the Fynbos Region: An introduction. In: Fynbos palaeoecology: A preliminary synthesis. (Eds. H.J. Deacon, G.B. Hendey & J.J.N. Lambrechts) South African National Programmes Report No. 75, CSIR, Pretoria. 3 Partridge, T.C. & Maud, R.R. 1987. Geomorphic evolution of Southern Africa since the Mesozoic. S. Afr. J. Geol. 90(2), 179-208. 4 Soil Classification Working Group, 1991. Soil Classification. A Taxonomie System for South Africa. Memoirs Agric. Nat. Resources S. Africa No 15, Dept. Agric. Development, Pretoria. 5 Soil Survey Staff, 1975. Soil Taxonomy. A Basic System of Making and Interpreting Soil Surveys. U.S.D.A. Agric. Handbook No. 436.
231

Relation Géométrique et Variations Minéralogiques des i Différents Termes d'une Sequence d'Altération de Tufs
Pyroclastiques de la Region de Texcoco (Mexique)
J. Bertaux et P. Quantin. ORSTOM - Bondy, 72 route d'Aulnay, 93143 Bondy cedex - France.
Abstract. Tepetates appear among pyroclastic deposits near Texcoco, on the western slopes of the Sierra Nevada. A stratigraphic and mineralogical study shows their relation with the soils developped above them, and with non-altered pyroclastic tufs. A complete sequence of alteration can be defined, the different terms being pyroclastic tuf -> tepetates -> soil. This increasing order of alteration is mainly revealed by the transformation of volcanic glasses into clays (halloysite and smectite), and by the incorporation of phytoliths and diatoms among the volcanic elements.
Introduction. Les "tepetates" sont pour une part des horizons de sols a consistance de fragipan développés sur des emissions pyroclastiques acides. us sont bien représentés sur le piedmont de la Sierra Nevada a 1'est de Mexico, element de 1'axe néovolcanique qui traverse tout le centre du Mexique. L'étude presentee dans ce poster concerne des niveaux de pyroclastites de la region de San Miguel Tlaixpan, prés de Texcoco, è environ 40 km au nord-est de Mexico. Elle s'inscrit dans un projet visant a caractériser les niveaux appelés "tepetates" et a comprendre leur origine (1),
Le Problème des Tepetates. Cette denomination vernaculaire désigne au Mexique des matériaux varies; ils ont en commun de toujours apparaïtre au sein de séries pyroclastiques, en position superficielle avec presence de figures d'altération d'origine pédologique, et en alternance avec des matériaux similaires mais moins "consolidés". Des études récentes ont montré que différents types d'altération peuvent y apparaïtre, pas toujours d'ordre pédologique, et conduisant a diverses propriétés physiques pour des matériaux dont les origines semblent tres proches (2). L'intérêt du site de San Miguel Tlaixpan est de pouvoir suivre plusieurs niveaux de tepetates sur quelques centaines de metres, et surtout de révéler au sein même de ces niveaux des lentilles de tuf pyroclastique peu ou pas altéré. Une approche stratigraphique permet de préciser les relations entre les différents facies rencontres, en définissant une sequence complete d'altération, dont les tepetates ne sont qu'un terme. Des analyses minéralogiques (microscopie, diffraction X, spectrométrie infrarouge) de tous les facies précisent la nature des transformations resultant de 1'altération.
Les Différentes Séries Pyroclastiques. A San Miguel de Tlaixpan, une première série de pyroclastites T3 datée a plus de 20 000 ans (3), caractérisée par sa couleur rouge, surmonte un niveau pyroclastique è bloes d'andésites et de dacites, plus ancien et altéré. Elle est surmontée par une série T2, datée approximativement a 13 500 ans (3), qui a raffleurement montre quatre niveaux, de couleurs gris a ocre:
- a la base, une séne T2b, avec un niveau inférieur plus induré, grossièrement prismé, surmonte par un niveau tres meuble.
- au sommet une série T2a, constituée aussi de deux niveaux avec les mêmes caractéristiques que T2b.
L'étude présentée ici porte sur la série T2.
Relations Entre les Différents Facies. Dans chaque série (T2a et T2b) les deux facies (tepetates grossièrement prismé et niveau tres meuble) constituent des couches, dans le sens
232

géologique du terme, qui se suivent sur plusieurs centaines de metres, toujours parallèles entre elles et au sommet du T3 qui représente Ie substrat au moment du depot de T2. L'épaisseur de ces quatre niveaux du T2 est variable, généralement comprise entre 20 et 80 cm. Les facies de tufs inaltérés apparaissent toujours au sein et a la base des "tepetates" T2a ou T2b, en lentilles d'une épaisseur maximale de 80 cm, que 1'on peut suivre sur un maximum de 4 a 5 metres. Ces lentilles ont toujours un contact net a la base (T3 pour les lentilles dans Ie T2b, T2b pour les lentilles dans Ie T2a) et plus progressif vers Ie sommet, oü un petit niveau de tepetate les sépare toujours des niveaux meubles.
Ainsi les relations entre ces différents facies suggèrent la mise en place successive de deux flux pyroclastiques, chacun ayant a la base un niveau plus "consolidé", grossièrement prismé, qui contient par endroits des reliquats de tufs inaltérés. Ce site présenterait done une sequence d'altération complete, Tuf -> Tepetate -> niveau meuble.
Mineralogie des Différents Facies. La mineralogie confirme pleinement les observations de terrain:
- Les lentilles de tufs sont constituées essentiellement de verre volcanique, plus des phénocristaux de plagioclase, amphibole et pyroxene.
- 1'altération se traduit dans les tepetates et les niveaux meubles par la transformation du verre volcanique en argiles (halloysite et smectite) et par rapparition a tous les niveaux de phytolithes et diatomées. Il subsiste toujours des verres volcaniques et des phénocristaux de même nature que ceux des tufs inaltérés, confirmant la parenté de tous les facies.
Conclusion. Sur la base des relations de terrain et des observations minéralogiques, les tepetates de San Miguel Tlaixpan semblent représenter un stade intermediaire de 1'altération de tufs pyroclastiques. Cette alteration, probablement d'origine mixte météorique et pédologique, peut être mieux caractérisée par reference a son "degré zéro", Ie tuf inaltéré. D'autre part, Ie fait que la disposition des tepetates sur ce site paraït exactement refléter la morphologie de dépöt des pyroclastites, incite a lier l'observation de leur extension a l'étude plus générale du volcanisme pyroclastique acide dans cette region.
Bibliographie
(1) Hidalgo, C , Bertaux, J. et Quantin, P. 1993. Forms of silica in indurated volcanic soils of the Mexico Valley. Paper presented at the 10th international clay conference, Adelaide, Australia.
(2) Quantin, P. 1992. L'induration des matériaux volcaniques pyroclastiques en Amérique latine: processus géologiques et pédologiques. Terra, Vol 10, pp. 24 - 33.
(3) Pena, D.H. et Zebrowski, C. 1992. Caracterizacion fisica y mineralogica de los tepetates de la vertiente occidental de la Sierra Nevada. Terra, Vol 10, pp. 156 -163.
233

Les Sols a Tépétate de la region de Xalapa-Coatepec, Mexique. Caractérisation, Degradation et Conservation
J.P. ROSSIGNOL. Laboratoire de Science du Sol, E.N.I.T.H.P., 49045 Angers, France.
Abstract: Tepetate soils in the Xalapa-Coatepec Region, Mexico: Characterization, degradation and preservation.
Tepetate soils present a hard-pan (duripan) at weak depth (20 to 50 cm), cemented by silicea. They are found in subtropical climate with 4 or 6 dry months. The soils contain halloysite (7A°) and ferromanganic nodules and present hydromorphic conditions. They are developed in rhyolitic and pyroclastic materials. The erosion phenomena are intense; numerous forms of erosion are observed: laminar, in channels and gullies. Pastures are the most exposed to erosion because animal load and treading are high. Coffee plantations preserve soils, better than sugar cane or maize. It is necessary to develop soil preservation methods.
Introduction. Les sols a tépétate de la region de Xalapa-Coatepec, Veracruz, présentent des couches dures a faible profondeur, géneralement inférieure a 50 cm. Dans les coupes, on peut observer des couches horizontales de 10 a 30 cm d'épaisseur, reposant sur des couches a structure polygonale dont les fissures sont remplies d'oxyde de fer et de silice. Ces sols font partie d'une sequence topoclimatique de sols volcaniques, de 4500m a 300m d'altitude, disposée le long du versant Est du coffre de Perote (5). Les tépétates sont situés a la partie basse de la sequence, dans la zone de climat subtropical a saison sèche bien marquee. Ds apparaissent entre 1200m et 900m d'altitude.
Mater iels et methodes. La cartographie morpho-pédologique a LVSOOO6"16 (3) a mis en evidence les différentes unites de paysage, par leurs composants: physiographic et relief, lithologie, géomorphologie et erosion, pédologie, vegetation et cultures, et facteurs limitants de la production agricole (2). Le paysage de la zone des tépétates est compose de planèzes fortement disséquées par 1'érosion. Le substratum est constitué de flux pyroclastiques rhyolitiques recouvrant des coulees tres altérées de laves et de brèches. Un dépöt de cendres volcaniques récentes a recouvert la plus grande partie de la region. Le climat est subtropical semi-humide avec une période sèche de 4 a 6 mois; la temperature moyenne annuelle est de 23°C, les precipitations sont comprises entre 1000 et 1400 mm/an; 1'évapotranspiration calculée est de 1600 mm/an
Résultats et discussion. Les sols présentent les caractéristiques suivantes: Morphologie: Le tépétate apparaït géneralement sous des sols peu a moyennement profonds,
de 20 et 50 cm. Les sols ont une texture de limon argilo-sableux, une structure polyédrique de faible stabilité structurale, ils sont moyennement poreux. La partie inférieure, entre 20 et 50 cm, présente un horizon éluvié (Eg) rédoxique, grisatre, avec de nombreuses taches ocres et grises et des nodules ferro-manganiques. Le tépétate sous-jacent de couleur gris clair a brun clair, géneralement dur, parfois plus friable présente une structure polygonale de 20 cm de large et de 50 cm de haut et une faible porosité constituée de cavités, vacuoles, vésicules et pores. Les parois des vides sont recouvertes de revêtements d'argile grises et de silice, parfois colorés par les oxydes de fer: c'est un horizon de duripan. L'hydromorphie des sols est tres marquee, d'autant plus que le tépétate est proche de la surface et peu poreux. Un horizon tres fin (millimétrique) et blanchi de degradation peut apparaïtre a la surface du tépétate supérieur.
234

Physico-chlmie: Les données analytiques des sols sont les suivantes: Le taux d'argile varie de 20 a 30%, celui des limons de 40 a 55% et celui des sables de 15 a 30%. Le taux de matière organique est de 2 a 4% dans 1'horizon A, et inférieur a 1% en dessous. Le pH eau est acide prés de la surface (4 a 5), il remonte vers 5 a 6 en profondeur. La capacité d'échange cationique est de 15 a 20 meq/100g de sol; la saturation en cations alcalins et alcalino-terreux est faible de 15 è 30%. Le phosphore assimilable est en faible quantité (3 a 4 ppm). La fertilité chimique du sol est tres faible.
Mineralogie: Les diagrammes de Rayons X de la fraction inférieure a 2u.m montrent que les argiles de type halloysite a 7A° sont prédominantes et que les minéraux siliceux comme la cristobalite et le quartz sont abondants; il y a aussi un peu d'illite, de smectite et d'hématite.
Géochimie: Les analyses totales effectuées sur la terre fine permettent de préciser la composition minéralogique des sols: Les minéraux primaires (residu) représentent environ 30% du sol et sont composes de 70% de quartz et de cristobalite et 30% de feldspaths et de ferro-magnésiens. Les minéraux siliceux augmentent faiblement avec la profondeur, ce qui démontre le rajeunissement du sol en surface par de fins depots de cendres volcaniques. Les produits d'altération sont riches en oxydes de fer et de titane; le rapport SiCtyA^C^ molaire de la partie soluble de 2,5 a 2,9 suggère 1'existence de silice libre en addition a 1'halloysite, avec un peu de smectite et d'illite.
Problèmes agronomiques: La zone des tépétates est fortement affectée par les phénomènes d'érosion. Ceux-ci peuvent commencer sur des pentes de faible inclinaison. La forêt tropicale a feuilles caduques a été remplacée par des prairies a ensemencement naturel et par quelques cultures de maïs, de canne a sucre et de caféiers. De nombreuses formes d'érosion ont été observées (1): érosion laminaire, en rigoles et en ravines; il y a aussi des glissements de terrain qui peuvent affecter des volumes importants de terre. Ces phénomènes sont exacerbés par le gradient de la pente; ils couvrent des surfaces importantes. Dans les zones de paturage, la trop forte charge en animaux et leur piétinement sont a 1'origine de 1'érosion par suite de 1'arrachement du sol par les sabots et du surpaturage. Les zones de paturage sont actuellement les plus exposées a 1'érosion. Les cultures de caféiers qui couvrent complètement le sol toute 1'année en plusieurs strates végétales le préservent parfaitement. La protection offerte par les cultures de canne a sucre et de maïs est moins bonne, en effet la couverture végétale n'est pas complete tous les ans, la culture en courbe de niveau n'est pas respectée partout. Les sols sont fragiles et les processus d'érosion intenses, il est done nécessaire de développer les methodes de conservation des sols.
Bibliographie citée. (1) Campos A., Rossignol J.P., 1987. Dinamica de la erosión en una unidad morfoedafológica sobre tepetates en el Municipio de Cosautlan, Ver., pp. 85-92. In J.F. Ruiz (ed.). Uso y manejo de los tepetates para el desarrollo rural. UACH, depto Suelos,México.222p. (2) Geissert D., Rossignol J.P. (coord.), 1987. La morfoedafologia en la ordenación de los paisajes rurales, conceptos y primeras aplicaciones en México.INIREB-ORSTOM, Xalapa, Ver., México. (3) Rossignol J.P., Geissert D., Campos A., Kilian J., 1987. Mapa morfoedafológico del area Xalapa-Coatepec, 1/75000. ORSTOM-INIREB, Xalapa,Ver.,México. (4) Rossignol J.P., Campos A., 1987. Los tepetates de la zona centro de Veracruz, pp 38-49. In J.F. Ruiz (ed.). Uso y manejo de los tepetates para el desarrollo rural. UACH, depto Suelos,México.222p. (5) Rossignol J.P., Campos A., Quantin P., 1992. Las condiciones regionales de desarrollo de los tepetates en la zona Xalapa-Coatepec, Veracruz, México; localización, condiciones ambientales y caracteristicas generales. pp210-220. In Suelos Volcanicos Endurecidos, Terra, numero especial. Vol 10, 572 p.
235

Une étude "microstructurale" des traits pédologiques de sols volcaniques indurés ("tepetates") de la Vallée de
Mexico. C. Hidalgo, F. Elsass* et P. Quantin. ORSTOM, 72 route d'Aulnay 93143 Bondy.cedex, France* INRA, Stat. Science du Sol, 78026 Versailles, cedex, France.
Introduction. Ce travail s'inscrit dans Ie cadre general d'une étude des horizons indurés, appelés "tepetates", de la Vallée de Mexico dont 1'induration semble due a une silicification. Les études conduites par Hidalgo et al. (1993), sur des horizons de sol et des "tepetates" montrent dans ceux-ci la presence de différents formes de silice libre -des phytolites et de l'opale- lesquelles se localisent dans la matrice, dans les revêtements et dans les remplissages des vides et des fissures. Notre recherche a pour but d'étudier "in situ", en employant la microscopie électronique a haute resolution (HRTM), la structure et la composition de différents types de remplissages et de revêtements afin de mettre en evidence les intercalations éventuelles de silice ou d'autres matériaux entre les argiles.
Matériels et Methodes.
Deux elements, sur lame mince, ont été sélectionnés pour mener cette étude : a) un remplissage d'argile microlaminé d'une échantillon de "tepetate", avec deux zones a comportement optique différent*, b) Ie remplissage d'une fissure par un matériau jaune-clair-limpide d'un horizon de sol (Hidalgo, 1991). Les coupes ultraminces faites a partir du micro-prélèvement des zones sélectionnées ont été étudiées au microscope électronique en transmission (MET). Parallèlement, les différents composants minéralogiques ont été caractérisés au moyen de la micro-analyse X (EDS) et la micro diffraction.
Résultats et Discussion.
D'après les observations faites par MET, la difference d'organisation structurale des zones étudiées apparait avec evidence. Les parties jaune-claire qui paraissent silicifiees correspondent a un plasma ou bien a un gel parfois siliceux qui n'a pas d'organisation; dans celui-ci se trouvent noyés de petits cristaux, de l'opale ainsi que des plaquettes d'argile. En ce qui concerne les parties microlaminées, elles correspondent bien a des dépöts d'argile illuviée. Ces depots argileux épais présentent en inclusion des microlites de feldspaths et de plagioclases, du verre volcanique, des oxydes de fer et de titane ainsi que de la silice Ie plus souvent amorphe (opale) mais assez rarement cristalline. Les argiles se présentent assemblees en fuseaux.
Bibliographic
Hidalgo C, 1991. Contribution a 1'étude des sols volcaniques indurés ("tepetates") de la region de Mexico (cimentation, induration). D.E.A. de Pédologie Université de Nancy I. Hidalgo,C, J. Bertaux and P. Quantin. 1993. Forms of silica in the indurated volcanic soils of the Mexico Valley. 10th International Clay Conference, Adelaide South Australia.
236

Premiers Résultats d'Essais Agronomiques Visant a la Rehabilitation Agricole du Tepetate t3 (Texcoco, Mexique): I. Cas de l'Orge et de la Vesce A. Baéz*, C. Prat**, A. Marquez" et B. Chora*. *Colegio de Postgraduates de Montecillo-UNAM, Cuautitldn, Edomex, Mexique.**ORSTOM, Col. Los Morales, AJ>. 57297,06501 México, Mexique.
Abstract: First results of agronomical field-trials in view to the agricultural reclamation of the (j tepetate (Texcoco, Mexico): I. Barley and vetch case. Usually, tepetates in Mexico are reclaimed on the wrong way. Based on results of an international research program, we shall give in 1996 recommendations to improve this reclamation. On a tepetate ripped in march 93, we tested during the same year, 7 kinds of preparation of terraces and agricultural systems based on barley, with or without vetch. In spite of a very dry season and infertile tepetate, we overpass in some of the test, the national productivity level. Manure, medium granulo-metry and medium mineral fertilisation are the best way to guarantee and improve the productivity.
Introduction. Au Mexique, les horizons indurés volcaniques (tepetates) couvrent plus de 170,000 km2 (1) dont la moitié affleurent, provoquant une forte erosion et 1'abandon des terres par les paysans. Ceux qui arrivent a cultiver les tepetates rippés, ne commencent a obtenir des rendements acceptables qu'au bout de plusieurs années de cultures du fait d'une recuperation inadécuate de ces terres et de leur mauvaise gestion. Sur la base des résultats (1,2) obtenus au cours du programme de cooperation (1988-1992) entre 1'ORSTOM, Ie Colegio de Postgraduados, la CEE et 1'Université de Giessen (Allemagne), un second programme d'une durée de 3 ans a débuté en 1993. Son principal objectif est d'arriver a proposer aux paysans et aux entre-prises chargées de réhabiliter les tepetates, une methode basée sur des données de terrain, permettant une recuperation bio-physico-chimique rapide et durable de ces nouveaux sols et économiquement rentable a court/ moyen terme (4 a 8 ans). Cet article conceme les premiers résultats obtenus en 1993, première année de rehabilitation d'un hectare de tepetate t3 situé prés de Texcoco (Etat de Mexico), cultivé en orge et/ou vesce.
Matériels et methodes. Le tepetate t3 remis en culture est de couleur marron, tres épais (> 1.50 m) et présente les caractéristiques physiques d'un fragipan (3). ü est légèrement calcaire (CaCÜ3 < 6%), a un pH de 7.7 et n'est pas fertile d'un point de vue biologique et chimique (mat. org. <0.2%, racines tres rares, P assimilable <2.5 ppm, N <0.02 ppm ). Le terrain a été échantillonné avant et après rehabilitation. Le rippage a été effectué par un bulldozer (Caterpilar D7) muni de 2 dents mais ne fonctionnant qu'a la moitié de sa puissance. Le rippage s'est fait en 2 passages croisés, suivi de l'aménagement de terrasses en courbes de niveaux. Deux hersages au tracteur ont achevé la preparation du tepetate. Les différents paramètres étudiés sont les suivants (Tab. 1): profondeur du rippage (40-60 cm), taille des agrégats (preparation fine ou moyenne), pente de la terrasse (10, 5 et 1%), effet d'engrais organique (fumier de bovins 0 ou 13.6 t/ha de mat. sèche), d'engrais vert (vesce) et d'association (orge avec ou sans vesce). A titre de reference, une parcelle possèdant un sol brun vertique a également été cultivé avec 1'association orge -vesce. Les semis ont été effectués a la volée a raison de 150 kg/ha pour 1'orge seule, 105 kg d'orge et 21 kg de vesce pour 1'association. La variété d'orge "esmeralda" est résistante a la rouille, a la sécheresse et aux gelees. En parcelles expérimentales, son rendement en grains est de 3.7 t/ha (moyenne nationale < 2 t/ha). La fertlisation a été fractionnnée: 80 kg/ha de sulfate d'ammonium, 60 kg/ha de super phosphate triple au moment du semis puis 40-0-0 kg/ha 45 jours plus tard. Chaque terrasse a fait 1'objet d'un suivi agronomique classique sur 4 parcelles de 1 m2. Les plantes de 8 parcelles de 0,25 m2 sur chaque terrasse ont été récoltées afin de determiner la production en fourrage. Les récoltes des grains ont eu lieu du 15/11 au 15/12.
Résultats et discussions. Les valeurs des mesures physico-chimiques du tepetate prélevé avant et après sa preparation, montrent peu de variations. En ce qui concerne la distribution granulométrique moyenne (tranches de 20 cm) des terrasses, (Fig. 1), on constate que la T6 possède la granulométrie la plus grossière (36% d'agrégats < 2 mm) de toutes les terrasses. Celle de T7 en surface est comparable a celle des autres terrasses mais en profondeur, elle devient plus grossière. La granulométrie de T2 et T6 diminue légèrement de la surface en profondeur (41 è 32%) alors que celle de T3, T4 et T5 reste sensiblement identique tout au long du profil (40-47 a 39-47%). Enfin, la terrasse T5 mais aussi T3, ce qui n'était pas initialement prévu, présentent la granulométrie la plus fine (5% d'agrégats < 2 mm de plus que les autres terrasses). En ce qui concerne la profondeur du rippage, T2 présente un tepetate ameubli jusqu'a 60 cm en moyenne contre 40-45 cm pour T3, T4, T5 et T6, et 53 cm pour T7. Sur chaque terrasse, une bande de 2 a 3 m en amont est moins profonde de 10 cm que le reste du sol, alors qu'en aval, elle est au contraire plus profonde de 10 cm.
237

Figure 1. Granulométrie moyenne des terrasses en fonction de la profondeur.
s 7 " 5 3 2
| Profondeur (cm) 0-20 n 2fr40 S i l ' «*I1
40-60
« t ^ ^ f H ^
ï i j v " 5 3 3 v
Taille tamis a mailles carrees (mm)
Les precipitations en 1993, tres en dessous de la normale (400 mm au lieu de 620 mm), sont arrivées tardivement et étaient tres irrégulières. Ainsi Ie premier semis effectué Ie 10 juin a germé... pour mourir desséché nous obligeaht a resemer Ie 29 juin. Pendant pratiquement toute la saison des pluies, il y a eu un équilibre hydrique extrêmement précaire. Les résultats, en termes de rendements (Tableau 1) montrent des differences significatives entre chaque traitement et entre methodes d'échantillonnage. Tableau 1: Caractéristiques des terrasses étudiées et rendements des cultures.
Caractérisüques des terrasses
Ref Taille Substrat Culture Fumier Prof. Pente
m2 t/ha m %
7-8/09/1993 (a) 30/11/1993 Caractérisüques
des terrasses Ref Taille Substrat Culture Fumier Prof. Pente
m2 t/ha m %
Orge Vesce O + V Vesce (b) Orge Orge(c) grain
Caractérisüques des terrasses
Ref Taille Substrat Culture Fumier Prof. Pente
m2 t/ha m % Fourrage Paille grain
Orge(c) grain
Taille Substrat Culture Fumier Prof. Pente
m2 t/ha m % Effet profondeur de lippage T2 470 Tep. rippé O + V 0 0,60 <5 3,65 238 13,0 034 2,11 1,45 139 Reference système de T3 773 id. Orge 0 0,46 <5 3,93 1,28 13,4 0,23 3,38 2,33 1,97 culture (sans engrais vert) Effet apport de fumier T4 732 id. O + V 13,6 0,43 <5 4,39 3,14 18,5 0,87 2,94 2,65 2,60 Effet preparation terrasse T5 792 id. O + V 0 0,44 <1 4,42 3,12 16,9 1,48 3,33 2,53 2,18 Reference culture T6 1152 id. O + V 0 0,40 <10 4,66 4,67 17,1 1,82 3,38 2,81 3,12 Reference sol argileux T7 713 Sol O + V Sans 0,53 <10 5,68 2,35 18,3 0,49 2,27 1,98 2,50 (a): Moyennes de 8 parcelles de 0.25 m.2; (b): Moyennes de 4 parcelles de 1 nfi; (c): Récolte par terrasse. En italique: valeurs de rendement les plus faibles; en gras: valeurs de rendement les plus fortes. Excepté pour T4, les valeurs moyennes des parcelles présentent des differences par rapport a celles des terrasses sur lesquelles elles ont été installées: +14% pour T3 et T5 contre -26% pour T7 et -10% pour T2 et T6. Ces differences sont liées au fait que les parcelles étant situées dans des endroits différents et ayant peu de repetitions, on doit faire une analyse fine cas par cas et non une moyenne qui gommc les disparités. Si 1'on considère Ie sol argileux (T7) comme reference, on constate que T7 possède bien des rendements les plus forts avec T4 en ce qui conceme la production de fourrage, mais est dominee par ceux de T6 pour Ie grain. Dans ce cas, T6 a produit 20% de plus que T7 etT4. L'apport de fumier a done un róle significatif sur les rendements puisque ceux-ci sont du même ordre que ceux d'un sol ne provenant pas de tepetates. Plus important encore est Ie róle d'une granulométrie en surface (voire en profondeur) oü les agrégais < 2 mm ne dépassent pas 35%. Les rendements de T3 sont légèrement inférieurs a ceux de T5. La granulométrie plus fine de ces deux terrasses a eu un effet relativement négatif sur les cultures, mais reste au niveau des moyennes de production nationale. De plus, 1'effet association vesce-orge favorise la production. Malgré les faibles precipitations, la vesce n'a pas concurrence 1'orge. L'effet profondeur de rippage n'a eu aucun impact sur les rendements dans la mesure oü les faibles precipitations n'ont pas permis de remplir la réserve en eau du sol, facteur qui aurait pu faire la difference en année pluviométrique normale. D'autre part, dès la germination, il y a eu prés de 30% de plantules en moins par rappoit aux autres essais, ce qui expliquerait les bas rendements tant pour 1'orge que pour la vesce.
Bibliographie citée. (1) Zebrowski C, C. Prat, J.D. Etchevers B., H.M. Arias R., M.E. Miranda M. (Eds). 1992. Actas del primer simposio international sobre los suelos volcanicos endurecidos, México. Vol. 10, Numero especial, 572 p. (2) Quantin P. 1992. Etude des sols volcaniques indurés "tepetates" des bassins de Mexico et de Tlaxcala, en vue de leur rehabilitation agricole. Rapport scientifique final. CEE # TS2.A.212.C. 77 p. (3) Pefia D. y C. Zebrowski. 1992. Informe del mapa morfopedológico de la vertiente occidental de la Sierra Nevada. CP-ORSTOM-CEE-Univ. Giessen. lOlp.
238

Premiers Résultats d'Essais Agronomiques Visant a la Rehabilitation Agricole du Tepetate U (Texcoco, Mexique): II. Essais Agronomiques.
B. Chora*, A. Marquez**, C. Prat** et A. BaézVCo/egj'o de Postgraduados de Montecillo-UNAM, Cuautitldn, Edomex, Mexique. **ORSTOM, Col. Los Morales, A.P. 57297,06501 México, Mexique.
Abstract: First results of agronomical field-trials in view to the agricultural reclamation of the <j tepetate (Texcoco, Mexico): 11 Agronomic field-trials. On a tepetate ripped in march 93, we tested during the same year on 36 m2 plots, 13 agricultural systems: corn (yellow, blue and white) associated with string and marrow beans: medic intercalated with amarant, white corn or barley; corn, amarant, bean and vetch alone. These treatments were tested on 3 terraces: T4 with cow manure, T5: plan.e with fine granulometry and T6 with a medium granulometry. In spite of a very dry season and except for the amarant wich needs a high fertilisation, we can rise a normal production level for the green material for all crops and a normal one for seeds of string and marrow beans, medic and vetch. Manure, medium granulometry and mineral fertilisation are the best way to guarantee and improve the productivity of crops during the first year of reclamation of tepetate.
Introduction. Dans le cadre des études (1) menées au sein du programme de rehabilitation des tepetates au Mexique, nous nous proposons de foumir des recommandations agronomiques sur les types de rotation, de cultures et de fertilisation destinées aux paysans venant de réhabiliter les tepetates dans une perspective économiquement rentable a court/moyen terme (5 & 8 ans), prenant en compte 1'élevage et aboutissant a un développement durable. Cet article conceme les premiers résultats obtenus en 1993, première année de rehabilitation d'un peu moins d'un hectare de tepetate t3 situé a Texcoco (Etat de México) et qui ont été cultivés selon différents systèmes agronomiques et types de rehabilitation du tepetate.
Matériels et methodes. 9 systèmes de cultures ont été testes sur les terrasses T4, T5 et T6: maïs jaune ou bleu associés avec courgette et fève (Vicia faba); une luzerne locale (Medicago polymorfa) intercalée avec de 1'amarante (Amarantus hypochondriacus var. Nepal), ou du maïs jaune ou de 1'orge (var. esmeralda) et enfin des cultures seules: maïs jaune, bleu, amarante et vesce. Sur T6, nous avons pu également cultiver du maïs blanc, seul et associé è de la fève et a la courgette, du haricot jaune (Phaseolus vulgaris), de la fève (Tab. 1). Nous avons done suivi 30 parcelles de 36 m2. Les caractéristiques du tepetate t3, les conditions de rippage et d'aménagement des terrasses ont été décrites dans 1'article precedent (2). Les terrasses ont une profondeur de 40 a 45 cm. T5 possède une granulomere fine et une pente de 1%. Celle de T6 est plus grossière et la pente plus prononcée (<10%). T4 possède des caractéristiques intermédiaires entre celles de T5 et T6. Toutefois, c'est la seule a avoir recu une dose de fumier de bovins (13,6 t/ha de mat. sèche).
Tableau 1: Caractéristiques culturales des essais agronomiques. Cultures Maïs jaune, bleu, blanc Courgette Fève Fève Amarante Luzerne Haricot Vesce Orge Système A IetS A S A IetS IetS S S I N°parceUes 1,2,10 3,4,7,11 1,2,10 12 1,2,10 5,8 7,8,9, Tl 13 6 9 Densité semis Ecartement des sillons: 0.8 m
5 graines éclaircies a 3
poquet 1 m entre 0,4 m entre
poquet 1 m entre poquet
3 graines 0,4 m poquet
1 m poquet
4 kg/ha En ligne + 2 éclaircis
13 kg/ha volée
5 graines 0,4 m poquet
70 kg/ha volée
150 kg/ha volée
Système de cultures: A: associées; I: intercalées; S: seules.
Les graines de nos essais sont rustiques et originaires des villages voisins sauf la vesce, 1'orge (1NIFAP), 1'amarante (Dr. Trinidad, Col. Postgrad.) et la luzerne (Dr. Vivar, CIMMYT). Chacune des parcelles correspondant aux 30 essais a fait 1'objet d'un suivi agronomique détirillé a travers 3 zones d'échantillo-nage de 0,25 m2 ou par lignes. Ce suivi comprend les mesures suivantes: densité de semis, taille des plantes, comptage des feuilles (maïs) et des fleurs pour determiner leur vitesse d'émergence (toutes cultures sauf amarante), pesées poids frais et sec, composants du rendement (nombre de fruits, nombre de graines, poids pour 100 graines, poids total...), etc. Ces mesures ont été effectuées de une a cinq fois par semaine, en function de 1'espèce de la plante, de sa période de vegetation et du type de données. Toutefois. nous ne présenterons ici que les rendements, les autres résultats étant encore en cours d'analyse.
Résultats et discussions. Rappelons que les precipitations en 1993 étaient tres en dessous de la normale (400 mm au lieu de 620 mm), tardives et tres irrégulières, repoussant les semis au ler juillet au lieu de debut mai. Pendant pratiquement toute la saison des pluies, il y a eu un équilibre hydrique précaire qui s'est souvent rompu en période critique pour la plupart des cultures. C'est pourquoi celles-ci ont toutes
239

présenté un retard dans leur cycle de croissance. Les tepetates réhabilités en première année présentent 1'avantage d'etre dépourvus de maladies et de graines d'adventices: nous n'avons appliqué qu'un seul traitement insecticide (19/09) contre Ie puceron de la fève et de la courgette et aucun herbicide, fongicide, nématicide... Deux applications d'engrais (sulfate d'ammonium et super triple phosphate) ont été effectuées: au moment du semis (40-60-0) puis 45 jours plus tard (40-0-0). Semis en lignes: Les maïs en association ont eu des rendements en grains et en matière sèche presque nuls, alors que ces mêmes cultures seules, ont eu une bonne production de matière sèche, mais pratiquement pas de grains. La competition pour 1'eau entre courgettes, fève et maïs accentuée par les densités de semis trop élevées s'est faite en défaveur du maïs, dans la mesure oü les conditions pluviométriques ne permettaient pas de satisfaire les besoins en eau de toutes ces cultures. De plus, les comparaisons avec Ie maïs sur sol vertique de nos voisins, montrent que les sécheresses a repetition et en pleine floraison, période critique, sont les principales causes de ces résultats. Les differences de rendements en grains entre variétés de maïs s'expliquent par les differences de longeur de cycle: court pour Ie jaune et Ie bleu, long pour Ie blanc et peut-être a une nicilleure resistance a la sécheresse du jaune par rapport au bleu. Les résultats concernant la courgette sont proches de ceux du maïs: tres bonne production de feuillage et de fleurs mais pratiquement aucun fruit. Les fèves ont eu un comportement intermediaire: beaucoup de matière verte et un rendement faible de graines que ces cultures aient été seules ou associées. Le haricot a obtenu un rendement supérieur a la moyenne régionale (0,8 t/ha) confirmant que les mauvaises productions des années antérieures étaient dues aux fortes precipitations et non a un problème lié stricto sensus aux tepetates.
Semis a la volée: le terrain billonné a 1'origine a été aplani au rfiteau afin de semer a la volée. Mais du fait des sécheresses et de 1'humidité s'accumulant dans les sillons comblés, les cultures ne se sont développées pratiquement qu'a ces endroits. Malgré tout, les rendements obtenus en orge, luzerne et vesce ont dépassé largement les moyennes rationales. L'amarante fut la culture la moins productive car la plus exigeante.
Tableau 2: Rendements des cultures en fonction des systèmes de cultures et des terrasses (Premier chiffre = poids sec de grains, deuxième chiffre = poids sec de matière sèche en t/ha).
Cultures associées Cultures associées Cultures associées T Mais jaune Courgene Fève Maïs bleu Courgette Fève Maïs blanc Courgette Fève
Ref. 1 1 1 2 2 2 10 10 10 T4 0,04 + 1,4 2,3 + 1,8 0,3 + 0,7 0,03 + 1,0 0,3 + 2,2 0,2 + 0,7 T5 0,10 + 1,9 0,8 + 0,8 0,5 + 1,3 0,03 + 1,1 1,9 + 1,3 0,6 + 1,3 T6 0,06+1,4 3,4+1,2 1,5 + 1,6 0,02 + 0,7 2,2+1,5 0,5 + 1,4 0 + 2,4 1,5+1,2 0,2 + 0,5
T Cultures seules Cultures intercalées M. jaune M. bleu M. blanc Ama. Vesce Fève Haricot M. jaune Luzerne Ama. Luzerne Orge Luzerne
Ref. 3 4 11 5 6 12 13 7 7 8 8 9 9 T4 0,12+4,7 0,01+5,4 - 2,0 0,5+3,9 - - 0+4,7 1,3+3,5 1,4 1,0+2,9 4,0+4,3 1,8+3,5 T5 0,24+6,3 0,05+5,1 - 1,3 1,1+3,1 - - 0+3,5 1,6+2,2 0,3 2,2+3,9 2,9+3,2 1,6+2,8 T6 0,05+3,0 0,05+3,7 0+2,9 1,5 1,2+3,2 1.2+? 1+1,2 0+5,8 1,6+3,6 1,2 2,0+2,9 3,0+5,3 1,8+1,9
Comparaison entre terrasses: La comparaison des comportements et des rendements des cultures entre les parcelles, présentent des hétérogénéités et des differences relativement faibles, Toutefois, on peut globale-ment considérer que les résultats les moins bons concernent T5 (sauf n°8), bien que dans le cas des systèmes 1, 2 et 3 les rendements en maïs soient les plus forts. T6 possède des résultats proches de ceux de T4, tout en les dépassant parfois. De plus, les cultures sur T6 contrairement a celles sur T4 tendent a produire plus de grains que de matière verte. Bien qu'il reste a affiner ces données, elles semblent bien confirmer les analyses précédentes qui montraient que la M.O. et une granulométrie grossière favorisent les cultures. En effet, en limitant la formation de croüte de battance, elles augmentent 1'infiltration et done la recharge de la réserve hydrique de ce sol. Les écoulement latéraux n'existant pas en conditions "normales" (3) et 1'eau étant le facteur limitant en particulier en 1993, on comprend que les terrasse T6 et T4 en captant le plus d'eau, soient également celles qui aient produit le plus.
Bibliographie citée. (1) Zebrowski C , C. Prat, J.D. Etchevers B., H.M. Arias R., M.E. Miranda M. (Eds), 1992. Actas del primer simposio international sobre los suelos volcanicos endurecidos, México. Vol. 10, Numero especial, 572 p. (2) Baéz A., C. Prat , A. Marquez et B. Chora. 1994. Premiers résultats d'essais agronomiques visant a la rehabilitation agricole du tepetate t3 (Texcoco, Mexique): I. Cas de 1'orge et de la vesce. Dans ce volume. (3) Marquez A., C. Prat, E. Huerta, E. Carrillo et J.L. Janeau. 1994. Premiers résultats du suivi de 1'érosion hydrique et de l'hydrodynamique des sols a tepetates (Texcoco, Mexique). Dans ce volume.
240

Premiers Résultats du Suivi de PErosion Hydrique et de 1'Hydrodynamique des Sols a Tepetates (Texcoco, Mexique)
A. Marquéz*, C. Prat*, E. Huerta**, E. Carrillo** et J.L. Janeau*. *ORSTOM, Col. Los Morales, AF. 57297,06501 México, Mexique; **Colegio de Postgraduados de Montecillo, Edomex, Mexique.
Abstract: First results of study of water erosion and hydrodynamics in tepetate soils (Texcoco, Mexico). The main part of the tepetates in Mexico appears on the surface of the ground due to the erosion process and do not permit agriculture. We study the runoff and soil erosion on a indurated non cultivated tepetate as a reference, and on various improved tepetate. We study also the hydrodynamics of soils with tepetate. The first results show that the tepetate in natural condition produces a high runoff due to the lack of infiltration meanwhile the soil erosion is limited (10 tlha in 1992 and the half part in 1993). This runoff generate a drastic regresive erosion downstream. In the case of cultivated tepetate, there an accep-table rate of soil loss in the case where the terrace system is well made.
Introduction. Au Mexique, les horizons indurés volcaniques (tepetates) couvrent de 35 a 170,000 km2 (1) dont la moitié affleure, provoquant une forte erosion et 1'abandon des terres par les paysans. Dans des études antérieures, en particulier le programme de recherche CEE-ORSTOM-CP-UAT-JL Liebig (2) de 1988 a 1992, les différents types de tepetates de la region de Mexico et de Tlaxcala ont été identifies et caractérisés d'un point de vue physico-chimique, pétrographique et minéralogique, mais leur fonctionne-ment hydrodynamique n'a pas été mis en evidence. D'autre part, les travaux portant sur 1'érosion au Mexique y compris le programme sur les tepetates de Texcoco, se sont focalisés sur les parcelles de type Wischmeier dont la taille ne correspond qu'imparfaitement a la réalité. Afin de comparer et de completer ces données ainsi que celles obtenues sur parcelles de 1 000 m2 depuis 3 ans a Tlaxcala, nous avons équipe une série de terrasses dont le tepetate a été rippé en 1993. De plus, deux toposéquences ont fait l'objet d'un suivi hydrodynamique hebdomadaire. L'objectif de notre étude est de determiner 1'impact de différentes pratiques de recuperation des tepetates sur les propriétés et le fonctionnement hydrique ainsi que sur 1'érosion des tepetates réhabilités. La plupart des données étant encore en phase d'analyse, nous nous limiterons a présenter les premiers résultats.
Matériels et methodes. Erosion: Une parcelle de 100 m2, 7 parcelles de 700 a 1000 m2 et un bassin versant de 1800 m2ont fait l'objet d'aménagements et de suivis de 1'érosion (3). Afin de mesurer en continu le ruissellement, chaque site a été équipe d'un limnigraphe au niveau d'un déversoir. Celui-ci se vide dans une cuve de 800 1 permettant de récupérer les sediments et de jouer le róle de répartiteur d'eau. L'aliquote (1/20) se déverse dans un second répartiteur identique, qui se vide (1/20) dans un troisième de faible capacité (1001). Du fait des volumes d'eau tres importants, la parcelle sur tepetate nu possède une cuve de plus. Afin de connaitre la dynamique et les quantités d'éléments solides et dissous transportés au cours de 1'érosion, un échantillon d'eau chargé de sediments a été récupéré et analyse après chaque pluie. De même le contenu des cuves et les sediments ont été récupérés, séchés et pesés. Les différentes variables prises en compte dans 1'étude de 1'érosion et du ruissellement sont: profondeur du rippage (40-60 cm), taille des agrégats (preparation fine ou moyenne), pente de la terrasse (10, 5 et 1%), effet d'engrais organique (fumier de bovins 0 ou 13.6 t/ha de mat. sèche), d'engrais vert (vesce) et d'association (orge avec ou sans vesce). A titre de reference, une parcelle possèdant un sol brun vertique a été cultivé avec 1'association orge-vesce, un petit bassin versant et une parcelle type Wischmeier de tepetate nu non rippé ont été également suivis. Hydrodynamique: Deux toposéquences ont été sélectionnées: a) San Pablo Ixtayoc sert de "reference andosols" et marque le début de la formation des tepetates avec des sols plus ou moins en place, terrasses. Le climat est humide a saison sèche atténuée, et se situe entre 2 800 et 3 200 m d'altitude. Cinq sites de mesure situés au sommet d'un lahar, s'échelonnent sur une longueur d'environ 1 000 m. b) San Miguel Tlaixpan comporte des tepetates bien marqués, dont les sols généralement encore en place, ont été mis en terrasses il y a plusieurs années. Le climat est subaride a saison sèche marquée (6 mois) et les sols sont a caractères cambiques ou vertiques, avec presence de tepetates t2 et t3 carbonates et non carbonates. Cinq sites de mesure se répartissent sur moins de 500 m et se localisent a 2 550 m d'altitude. Chaque site est équipe d'un tube d'aluminium de 3,50 m de profondeur afin d'effectuer les mesures a 1'aide d'une sonde neutronique, une fois par semaine, tous les 10 cm, avec un prélèvement d'échantillon de 0 a 40 cm de la surface afin de determiner directement 1'humidité. Dans la toposéquence de S. Miguel, une batterie de tensiomètres (0,3 -0,5 -1,0 -1,5 - 2,0 - 2,5 - 3,0 m de profondeur) a été installée autour de chaque tube afin de determiner la disponibilité de 1'eau dans les sols. Un tensiomètre électronique portable (DTE 10000 de Nardeux) nous permet de faire une lecture immediate.
24J

Result ais et discussions. Erosion:
En 1992, les données concement Ie bassin versant de tepetate nu. Sa superficie d'environ 1 800 m2. est occupée a 70% par Ie tepetate café (t3), a 10% par Ie tepetate t2 carbonate et Ie reste, soit moins de 20% par des zones de sedimentation oü se développe la vegetation. Des 68 pluies qui sont tombées au cours de l'année, 55 ont provoqué un ruissellement globalement inférieur a 50% de la quantité d'eau tombée sur Ie sol, et les 13 restantes ont provoqué un ruissellement supérieur a 50%, dont 3 dépassent les 70% (4). En fait, Ie ruissellement apparatt pour des pluies dépassant les 4 mm, confirmant ainsi les données obtenues a Tlaxcala (2). En terme de moyenne pour chaque pluie, Vlx présente des valeurs tres variables pour les pluies dont Ie ruissellement dépasse les 50% puisqu'il est compris entre 25 et 80 MJ.mm/ha.h. Quant aux 3 pluies ayant entrainé un ruissellement supérieur a 70%, clles présentent un I30 sup a 80 MJ.mm/ha.h. La quantité totale de sediments arrachés au cours de l'année dépasse les 10 t/ha, soit a peine moins du double de la quantité mesurée sur Ja parcelle de Wichmeier dans les années précédentes.
En 1993, les pluies ont été rares, éparses, faibles en quantité (400 mm) et en intensité. Ainsi, la pluie la plus forte ne dépasse pas les 25 mm. Dans ces conditions, Ie ruissellement et 1'érosion sur les terrasses de tepetate réhabilité ont été extrêmement réduits. Seul, Ie tepetate nu a présenté une erosion plus significative de quelques tonnes de sediments transportés.
Bien que les valeurs moyennes obtenues soient intéressantes, elles masquent de tres nombreuses disparités et s'avérent parfois trompeuses. C'est pourquoi, nous sommes en train d'effectuer 1'analyse des caractéristiques de 1'intensité-durée-fréquence des phases de chaque pluie ainsi que la comparaison entre ces phases et 1'hydrogramme correspondant. Une des consequences sera d'abandonner l'1,0 au profit d'intensité de durée plus courtes: 15, 10 et 5 minutes. De plus, si 1'érodibilité des tepetates (en particulier t3) est limitée, Ie ruissellement est tres important: plus de 85% de 1'eau ruisselle pour des pluies > 4 mm et d'intensité >10 mm/h. La consequence est qu'il se développe en aval, une erosion regressive catastrophique et oü des dizaines, voir des centaines de tonnes de matériaux sont arrachés et transportés dans les vallées. Il est done important d'étudier ce phénomène, qui n'a pas été pris en compte jusqu'a maintenant. Hydrodynamique:
Globalement, il semble que les profils au sein d'une même toposéquence aient un comportement assez proches les uns des autres au cours de l'année. Par contre, la toposéquence de San Pablo a un comportement différent de celui de San Miguel. Dans Ie cas de S. Pablo, c'est tout Ie profil qui reste humide au cours de la saison humide. Après chaque pluie, 1'eau traverse progressivement 1'ensemble du profil. Pendant la saison sèche, seul Ie premier mètre semble affecté par la sécheresse. Les tepetates ne semblent done pas jouer ici un role dans la limitation de la penetration de 1'eau. En ce qui concerne S. Miguel, au cours de la saison des pluies, ce sont principalement les horizons de surface et Ie premier tepetate (t2 carbonate) qui s'humidifient, les autres horizons (au dela d'un mètre de profondeur environ) ont une teneur en eau faible et relativement constante tout au long de l'année. Le tepetate t2 semble done bien limiter la penetration de 1'eau en profondeur. En ce qui conceme 1'existence d'écoulement latéraux internes, rien ne nous permet actuellement de penser qu'il existe de tels phénomènes au cours d'une saison a pluviométrie "normale". Toutefois, il reste a le verifier dans le cas de saison particulièrement humide et de pluies particulièrement importantes. 1993 ayant été une saison trop sèche et peu érosive, nous espérons pouvoir faire ce type de suivi en 1994. A partir de 1994, des suivis seront effectués sur les terrasses de tepetate réhabilités, afin de determiner 1'influence des traitements du tepetate sur 1'hydrodynamique et la capacité de retention en eau des sols.
Bibliographie citée. (1) Zebrowski C, C. Prat, J.D. Etchevers B., H.M. Arias R., M.E. Miranda M. (Eds), 1992. Actas del primer simposio international sobre los suelos volcanicos endurecidos, México. Vol. 10, Numero especial, 572 p. (2) Quantin P., 1992. Etude des sols volcaniques indurés "tepetates" des bassins de Mexico et de Tlaxcala, en vue de leur rehabilitation agricole. Rapport scientifique final. CEE # TS2.A.212.C. 77 p. (3) Baéz B., C. Prat, A. Marquez et A. Chora. 1994. Premiers résultats d'essais agronomiques visant a la rehabilitation agricole du tepetate t3 (Texcoco, Mexique): I. Cas de 1'orge et de la vesce. Dans ce volume. (4) Prat C, J.L.Oropeza y J.L. Janeau. 1993. Resultados del primer afio de investigación del programa ORSTOM-CP sobre la rehabilitación de los tepetates (suelos volcanicos endurecidos) de México. In: J. F. Gallardo L. (Eds). Actes du XII Congres latinoaméricain de la science du sol, Espagne, Vol. 3, p 1367-1371.
242

La rehabilitation agricole de la cangahua en Equateur G. Trujillo, E. Custode, G. De Noni, M. Viennot et C. López. DNA, MAG. Amazonas y Shyris, Quito, Ecuador.
Abstract. The agricultural reclamation of the cangahua in Ecuador. The cangahua reclamation in Ecuador is a recient event. The reclaimed areas are still very small. According to the socio-economical context, reclamation and soil conservation practices are différents. The yields crops are always very low.
Introduction. La cangahua, formation volcanique indurée, couvre dans la region septentrionale des bassins inter-andins, entre 2 500 et 2 800 m d'altitude, une superficie d'environ 1 000 000 ha, parmi lesquels 150 000 ha sont erodes. La rehabilitation agricole de ces zones est pratiquée depuis le début du siècle en milieu paysan traditionnel, mais ce n'est que depuis le début des années 70 que 1'Etat s'est préoccupé de ce problème. Les methodes de rehabilitation sont differentes selon qu'elles sont pratiquées dans le milieu paysan traditionnel, sans aide de 1'Etat, ou au sein d'institutions para-publiques.
Methodologie. Enquêtes de terrain et auprès des institutions para-gouvemementales.
Résultats. La superficie des zones érodées réincorporées a 1'agriculture est encore tres faible, inférieure a 2 000 hectares (Tabl.1). Mais d'après la Direction des forêts du Ministère de 1'agriculture (DNF) les surfaces reforestées ne seraient que de 200 ha, alors que De Noni et al. (1992) les estiment a 15 000 ha.
Tableau 1. Surfaces de cangahua rehabilitee par differentes Institutions Contexte Nom du projet But Surface (ha)
Institutions para-publiques DNF Proyecto MAG-CARE INERHI Autres projets
Reforestation 200 200 70 210
Institutions para-publiques DNF Proyecto MAG-CARE INERHI Autres projets
Mise en culture
200 200 70 210
Milieu paysan traditionnel - Mise en culture 1000
La reforestation, essentiellement en eucalyptus, a été réalisée par la Direction des forêts du Ministère de 1'agriculture et quelques rares agriculteurs privés. Les jeunes plants ont été mis dans des trous de 20x20x20 cm.
La mise en culture de la cangahua met en jeu des techniques differentes selon qu'elle est effectuee par des paysans de faibles ressources économiques, avec ou sans aide de 1'Etat, ou dans le cadre de projets gouvernementaux. Le défoncage de la cangahua est manuel, a 1'aide du pic chez les petits paysans, mécanisé chez quelques grands propriétaires ou lorsqu'il est realise par certaines institutions para-publiques. Il comporte alors un sous-solage compris entre 30 et 80 cm de profondeur, suivi de plusieurs passages croisés de pulvériseurs a disques. L'apport d'intrants, fertilisation et enfouissement de fumier, est faible chez les petits agriculteurs, plus élevé ailleurs. L'incorporation d'engrais vert est pratiquée dans le cadre de projets officiels. L'irrigation a été employee lors de la rehabilitation de la cangahua réalisée par 1'INERHI (Instituto Nacional de Recursos Hidraulicos) et 1'est actuellement dans toutes les realisations menées dans le cadre du "Proyecto MAG-CARE". Les cultures implantées sur la cangahua rehabilitee sont le maïs et 1'orge dans les regions les plus sèches, mais sont beaucoup plus vaiïées dans les regions plus humides oü maïs et orge voisinent avec de nombreuses cultures maraïchères, la pomme de terre et la luzerne, toujours d'un excellent rapport.
243

Les mesures de conservation n'ont été employees de facon systématique que dans Ie cadre du "Proyecto MAG-CARE". Les terrasses, soutenues par des bloes de cangahua, sont construites è la main. Les rendements, toujours faibles, dependent du climat local ainsi que de 1'emploi ou non d'intrants mais surtout de 1'irrigation. Les plus faibles sont obtenus dans les regions sèches non irriguées et sont de l'ordre de 400 - 600 Kg/ha pour Ie maïs et de 350 - 500 Kg/ha pour 1'orge. Dans les regions plus humides, les rendements en orge triplent et ceux en pomme de terre peuvent atteindre 20 t/ha.
Littérature citée. De Noni G., Trujillo G., Viennot M. 1992. Analisis histórico, social y económico de la cangahua. Terra 10: 503-514.
244

Variabilite de la Productivité du Maïs selon 1'Aptitude de ses Ressources Phytogenetiques dans un Sol Induré
Variability of Corn Production Acording to the Fitogenetic Resource in a Indurated Soil
H. Navarro et D. Flores. CEDERU, Colegio de Postgraduados, 56230 Montecillo, Estado de México, Mexigue.
Abstrac. In the second year of production of rotated "tepetate" a wheat- corn rotation, five creole local materials and a hybrid recently released in the market, were characterized of evaluating the diferenciated productivity of the "tepetate" according to the potencial production of the crop utilized. For it's evaluation, the parameters of growth, development and productivity were used. The production of "big white" creole was 30 % superior to the rest of the materials in which the hibrid was found. It is also to take note that the hibrid's and two Creoles risk to the first frost is 20 % superior than that of other Creoles, considering that it requeries 10 or more days for flowering which in turn means more days until harvest.
Introduction. La culture du mals è des fins d'auto-consommation, ainsi que la recuperation agricole des sols volcaniques indurés, sont deux elements de la strategie agro-économique des agriculteurs de la region occidentale de 1'Etat de Tlaxcala (Mexique). Notre but est d'une part evaluer la production de mais culture, implantée aprés un blé, sur un "tepetate" de seconde année de rehabilitation agricole et d'autre part, comparer les rendements et la productivité de cinq variétés régionales et un hybride de mais.
Materiele and Methodes. Selection des 5 variétés locales les plus répandues de maïs dans la region: "Grand blanc", "Grand jaune ","Petit jaune", "Palomero" et "Noir". L'hybride est Ie H-23. Aprés la récolte du blé, aport de 20 t/ha de fumier de bovin. La fumure du maïs a été de 70 u d' azote et de 60 u de phosphore par hectare. Pour chaque variété les observations ont élé réalisées dans cinq lots de 8 m2 chacun. L'analyse de la productivité du "tepetate" a été faite grace a des indicateurs de croissance et de développement. On a privilegie tout spécialement 1'analyse des composants du rendement, 1'indice d'efficience de la matière séche, la durée semis-floraison femelle et Ie rapport bénéfice/cöut.
245

Résultats. La variabilité des rendements moyens de maïs grain (tableau 1) sont compris entre 1.9 a 2.5 t/ha, soit 30 % de difference entre Ie "Petit jaune" qui a donné les rendements les plus faibles et Ie "Grand blanc" pour lequel les rendements sont les plus élevés.
Tableau No. 1. Caractéristiques agro-économiques.
Variété Indice de Indice de No.jours è Rendement Valeur B/C reproduction recolte floraison ton/ha (pesos)
H-23 74 0.28 Grand blanc 94 0.43 Palomero 77 0.25 Grande jaune 92 0.29 Petit jaune 86 0.31 Noir 92 0.39
Les variétés "palomero" et 1'hybride H-23 présentent 1'aptitude productrice la plus basse du fait d'une faible efficience dans 1'indice de récolte (matière sèche utile / matière sèche totale) et dans 1'indice de reproduction (nombre des epis / nombre de pieds). Les variétés plus tardives sont 1'hybride H-23, Ie "palomero" et Ie "Grand blanc. Du point de vue du risque agro-économique, 1'emploi des variétés les plus tardives est done è déconseiller dans les regions exposées aux gelees tardives.
Conclusion. D'aprés les résultats on peut remarquer 1'existance d'une aptitude productive différente entre les variétés de maïs, en consequence une variabilité interieure dans les résultats de production du sol induré, dans Ie deuxième année d' utilisation pour la production agricole.
2 .02 1428 0. ,68 2. .46 1720 1, .03 1 .99 1393 0 .64 2 .04 1224 0 .44 1 .90 1140 0. .34 2 .05 1224 0 .44
246

Utilisation Agricole des Sols Volcaniques Indures Agricultural Utilization of Indurated Volcanic Soils
M. A. Perez et H. Navarro. CEDERU, Colegio de Postgraduados, 56230, Montecillo, Edo de México, Mexique.
ABSTRACT. The evaluation of the importance of "tepetate" as an economic resource, with interest in the practices of the farmers for it's recuperation and management in Tlaxcala, Mex. An agricultural (follow -up) study of 96 plots, some in non "tepetate" material as a matter of comparison, reported findings that the usage pattern for these layers and the work processes present perceptible variations. Comparatively with the values obtained in normal soil, the "tepetate" is less productive and rentable during the first five years of farming, however, it can get to equalize the soils with an adequate management and strategy of soil recuperation. According to the social-economic type of farmers, the rentability of this layer presents variations depending also on the crop utilized the climatic years and the crop management.
Introduction. Les faibles rendements obtenus sur sol volcanique induré (tepetate) sont bien connus. L'evaluation de la productivité sur ce type de formation pédologique en fonction du temps de remise en culture, a fait 1'objet d'un travail multidisciplinaire entre pédologues et agronomes. Elle a été determinée chez les agriculteurs représentatifs du milieu rural traditionel de 1'Etat de Tlaxcala (Mexique).
Materiele and Methodes. Dans la region ouest de 1' etat de Tlaxcala, on a sélecctionné 96 parcelles paysannes en fonction du type de sol (tepetate réhabilité et sol non induré) et de 1'age de rehabilitation du tepetate. Les principales caractéristiques pédologiques de ces parcelles ont été déterminées. Les suivis effectués ont comporté des mesures d'humidité, de developpement et de croissance des plantes et une analyse des composants du rendement. Les rendements ont été mesurés par échantillonage dans des lots de 16 m2 de surface
247

Resultats. La recuperation agricole du tepetate est une pratique répandue chez tous les agriculteurs quelque soit la taille de leur exploitation. La productivité du tepetate est faible les premières annés de culture, surtout pour Ie maïs, ce qui conduit les paysans a pratiquer la rotation suivante: blé ou orge la première année; maïs associé a une légumineuse ou blé la deuxième année; et maïs ou encore Ie blé en trosième année. Les itinéraires techniques sont tres semblables sur Ie sol non induré et sur Ie tepetate. La preparation du sol comporte néanmoins un passage de pulvériseur è disques suplémentaire sur tepetate et Ie désherbage semble plus frequent sur tepetate que sur sol non induré. Les doses de fertilisation sont tres variables et ne prennent pas en compte la nature du substrat (tepetate ou sol induré). Tout au début du suivie des parcelles, on a remarqué les rendements semblables entre les anciennes parcelles de tepetate mises en culture depuis plusieurs années, en comparaison avec ceux des parcelles dans "sol normal". Au cours de la première année de production agricole d'un "tepetate" on peut avoir entre 300-400 kg/ha de grain de maïs, et de 1300 è 2000 kg/ha pour Ie blé. Es derniers augmentent avec la temps et dès la cinquième année deviennent tres proches de ceux observes sur sol non induré. Le tableau 1 nous montre les moyennes obtenues en fonction des caractéristiques agronomiquesN et économiques dans les systèmes de production, sur les sols non indurés et les tepetates.
Tableau No. 1 Caractéristiques agronomiques et analyse économique.
surface rendement cÖut B-C (%) (ton/ha) (pasos/ba)
SUSTRATO M B O H B O M B O M B O
• o l 18 33 18 1 . 4 2 . 5 2 . 5 721 788 784 1 . 2 1 . 9 2 . 0
t a p 8 19 4 1 . 1 2 . 3 2 . 4 675 708 725 1 . 0 2 . 2 1 .7
M-maïs B - b l o 0 » o r g o
Conclusion. La surface du tepetate dans les unites d'explotation représente 31 % de la surface totale. On peut remarquer une difference faible des rendements moyens, des cöuts de production et du rapport bénéfice/cöut. La strategie des agriculteurs est basée sur une logique d'augmentation de la surface des terres au sein du système de production. Ceci explique que les agriculteurs n'hésitent pas a réhabiliter les tepetates dans le but d' augmenter la surface de leurs terres agricoles et dans 1'attente d'une plus value de tepetate grêce SI'augmentation de sa productivité a long terme.
248

DETERMINATION OF MICROBIAL BIOMASS AND ITS FLUCTUATION ON BASE OF AGROECOLOGICAL MANAGEMENT OF TEPETATE
Matias Crisóstomo S. and Ferrera-Cerrato R. Section of soil Microbiology. Center of Edaphology, Colegio de Postgraduados. Montecillo, 56230, State of Mexico. Proyecto 0280-N9107 CONACYT.
INTRODUCTION. Soil is considered as a dynamic environment for underground inhabitants, as well as a place where substances which are not available for higher plants change into available substances through microbial agents (Alexander, 1977). The living portion of soil (including small animals and microorgansms) makes up less than 1% of the total volume; even so, this portion is undoubtedly essential for crop production and land fertility. Physical and chemical characteristics of soil determine the nature of the environment in which microorganisms are found. These characteristics have an effect on the composition of microbial community, both qualitatively and quantitatively. The determination of microbial biomass is important in the study of the soil nutriment cycle and is used as an ecological indicator (Smith and Paul, 1990). Frequently, the amount of microbial biomass is related with the contents of organic carbon of soil. For this reason, through the determination of microbial biomass, it is intended to have an indicator of soil fertility which is reliable and makes its interpretation easy. The objective of this research was to quantify the microbial biomass in Tepetate (hardened soil layer) and its fluctuation according to agroecological management. MATERIALS AND METHODS. The experiment was carried out under field and unirrigated conditions in a newly broken up Tepetate area of the Community of Tlalpan, Municipality of Hueyotlipan, Tlaxcala. The hardening and apparent infertility characteristic of Tepetate (hardened soil layer) in its nature state practically make it unproductive from an agricultural point of view. The area is located between 19°29' N latitude and 98°20' W longitude, at an altitude of 2600 m and in a Cb (w2)(w)(i' )g climate which is defined as temperate subhumid with a mean annual temperature between 12 and 18°C with a rainfall regime in summer (Garcia, 1988). The methodology used in the determination of microbial biomass of soil was: Fumigation-Incubation (Jenkinson and Powlson, 1976). The samples of Tepetate of the different treatments were moistened at 30%, were incubated at 25°C for 7 days, then were introduced into a glass desiccator in which a container with chloroform was put, and vacuum was applied until the solvent boiled. After 24 hours they were taken out of the desiccator and were incubated at 25°C for 10 days putting into each sample NaOH at a known concentration to be titrated with H2S04 later on. An extract with solution of K2S041:4 was obtained from the Tepetate to determine nitrates and ammonium. The tested treatments were: 1. Corn-Bean-Broad bean with organic matter, 2. Corn-Bean-Broad bean, 3. Corn-Bean-Broad bean inoculated with Azospirillum, Rliizobium and Mycorrhiza with organic matter, 4. Corn-Bean-Broad bean inoculated with Azospirillum, Rhizobium and Mycorrhiza, 5. Corn-Bean-Broad bean with chemical fertilization (120-60-00, farmer type management), 6. Wheat inoculated with Azospirillum with organic matter, 7. Wheat inoculated with Azospirillum, 8. Tepetate whitout crop. The utilized experimental design was a randomized block design with four replications and a 16 m2 plot. RESULTS AND DISCUSSION. The results of the total biomass are shown in Figure 1. The
249

obtained data clearly show the influence of the agroecological management on the microbial activity in Tepetate, which is represented by the total biomass (biomass of carbon and nitrogen). The Corn-Bean-Broad bean treatment inoculated with Azospirillum, Rhizobium and Mycorrhiza with organic matter was that which showed a total biomass higher than the other treatments, especially if it was compared with the control. According to Jenkinson and Powlson (1976), the amount of total biomass found in a soil is related to the content of the nitrogen and organic carbon. On this basis, it turns out that 50 days after sowing (DAS) the total biomass did not change significantly among the treatments, while 100 DAS its increment and its variation are clear in all the treatments. This increment is the result of the activity of several microbial groups in the decomposition and transformation of the nutiiments, which accelerate the growth of the various microorganisms living in tepetate. The more microbial biomass a soil has, the more the process of biotransformation increase and, thus, the availability and content óf nutrments for plants are higher. That is why, the determination of the total biomass is an indicative parameter of soil fertility and of the process of rehabilitation of the marginated soils.
250
w
2 0 0
S 150
~ 100
50
EH
C H 50 DDS MOO DDS
m
Pi r 1
M I -I 1 H I I
1 2 3 4 5 6 7 8 Figure 1. Effect of the agroecological management on the total microbial biomass in Tepetate. 1. Corn-Bean-Broad bean with organic matter, 2. Corn-Bean-Broad bean, 3. Corn-Bean-Broad bean inoculated with Azospirillum, Rhizobium and Mycorrhiza with organic matter, 4. Corn-Bean-Broad bean inoculated with Azospirillum, Rhizobium and Mycorrhiza, 5. Corn-Bean-Broad bean with chemical fertilization (120-60-00, farmer type management), 6. Wheat inoculated with Azospirillum with organic matter, 7. Wheat inoculated with Azospirillum. 8. Tepetate whitout crop. CITED LITERATURE Alexander, M. 1977. Introduction to soil microbiology. Second edition. New York. Garcia, E. 1988. Modificaciones al sistema de clasificación climatica de Koppen. 4a. Edición. Instituto de Geografia. Universidad Autónoma de México. México, D.F. Jenkinson, D.S. and Powlson, D.S. 1976 The effects of biocidal treatments on metabolism in soil. V.A. method for measuring soil biomass. Soil Biol. Biochem. 8:209-213. Smith, J.L. and Paul, E.A. 1990. The significance of the soil microbial biomass estimations. In. J.M. Bollag and G. Stotsky (Eds.) Soil Biochemistry. Mercel Dekker, New York. Vol. 6, pp. 357-396.
250

Agronomics Practices for Soil Conservation
J.D.Rios, J.L.Oropeza, and M.R.Martinez. Edafology Center. Colegio de Postgraduados, 56230 Chapingo, Méx. México.
INTRODUCTION. One requisit forget in soil conservation programs is what the practices user have been cheap for the farmer and effective for reduce the soil erosion. The programs of soil conservation have include tree types of practices: MECHANICS, VEGETATTVES and AGRONOMICS practices. Differences between that practices are the cost, the effective time for control erosion, the productivity and the subprocess of soil erosion what affect every practices. The MECHANICS PRACTICES for soil conservation has influence only the transportation subprocess erosion, while the more, VEGETATIVES and AGRONOMICS PRACTICES affect the transportation and remove subprocess erosion, for which reason are more effective on the control erosion. In the present time for México, the vegetative and agronomics practices for soil conservation represent one option for reduce the erosion and increase the lavel of productivity, all this without additional costs. In this paper are reported some results of several agronomics practices and soil management options for soil conservation with the objetive of demostrate and explain the goodness on the soil protection and increase the productivity.
MATERIALS AND METHODS. Nine plots of 2.0 m wide and 25.0 m long were stablished parallel to the slope , for measured the soil erosion, runoff and production, in différents experiments with agronomics practices and soil management options, conducted in several years in the fields of the Universidad Autónoma Chapingo, at Chapingo,Mexico.The agronomics practices in study were: the induction of productivity lavel, through changes in the number of plants per hectare in crop maize and soybeand; other practices was différents period for weeds control in crop maize; tillage systems; cover crop and use residue. The soil in the experimental site is classified as entisol under agricultural use. The texture of soil is sandy loam, with 40 cm of depth and 2 percent of slope. The total rainfall varies from 350 mm to 600 mm annually with modal distribution and the erosivity varies from 800 MJ mm / ha hr per year to 3400 MJ mm / ha hr per year. The rainfall date was measured in the record rain and the runoff* and soil loss date were measured daily in the runoff-collecting structure at the lower end. The ground cover was determined each 15 days by the method described by Rios (l).The crop production was evaluated at the end of vegetative cycle.
251

RESULTS AND DISCUSSION. In the research project with name " THE SOIL AND COVER MANAGEMENT FOR REDUCE THE SOIL EROSION " its has evaluated some agronimics practices what are easy, single and productive, which it has demostrated efficience for reduce the runoff and soil erosion beside this project has been complement of basic studies , for to analyse, describe and prediction erosion process.One preliminary analysis of the information of the Table 1, was the starter for propose agronomic alternative for soil conservation.
Table 1.- Variation of soil loss with production of maize forage in Chapingo, Méx. (Ventura y Rios,1989) (2).
Year Maize forage production Soil loss ( t / year) ( t / year)
1987 40.0 8.22 1987 48.3 3.93
1988 44.8 4.27 1988 47.5 2.33
In this information do show that increase in the maize forage production lavel resulted in decreased the soil loss.
LITERATURE CITED.
(1) Rios B.,J.D. 1987. Efecto de la cobertura vegetal en el proceso erosivo Tesis de Maestria en Ciencias. Centro de Edafologia, Colegio de Postgraduados,Chapingo, Méx., México.
(2) Ventura R., E.Jr. y J.D. Rios. 1989. El nivel de producción de los cultivos y la erosion del suelo. Memorias del XXII Congreso Nacional de la Ciencia del Suelo.Montecillo, Méx,. México.
252

Commission V. Extended summaries. Friday, July 15
Symposium ID-IS. Soil Data Needs for Expressing Land Qualities at Different Scales.
Page Assessing hydrodynamic land qualities using less-than-perfect tools. J. Van Orshoven, J.A. Deckers, and J. Feyen. (Belgium) 255
Capabilities and risks of agricultural land use of river lowland soils in a temperate, weak humid climate. L. Mueller, R. Dannowski, U. Schindler, and J. Quasi. (Germany). . .. 257
Fuzzy logic and risk assessment a futuristic approach to soil interpretations. M.D. Mays, I. Bogardi, A. Bardossy, L. Duckstein, and M.J. Mausbach. (USA) 259
SOTER methodology used for the evaluation of amazonian forest and savanna lands. T.T. Cochrane, S. Laguna, M.A. Beek, and T.A. Cocchrane. (The Netherlands) 261
Use of attribute databases for generating soil interpretations. L.A. Daniels. (USA). . . . 263
Short-term changes in soil quality in response to a grass community established on marginal croplands. G.E. Schuman, J.D. Reeder, and R.A. Bowman. (USA) 265
Abiotic soil indicators for arid ecosystem assessment. T.G. Reinsch, and R.P. Breckenridge. (USA) 267
Research of a methodology for the appraisal of soils potentialities. D. Palma-López, L. Florentin, and F. Jacquin. (France) 269
A system of soil-ecology and soil-conservation maps and the problems of their compilation. Ye. M. Naumov. (Russia) 271
Soil information for solving land use conflicts in urban fringes. A case study of Western Caracas, Venezuela. O. Rodriguez P., and J.A. Zinck. (The Netherlands) 273
Establishment of land suitability grouping system for sweet persimmon orchard in Korea. Y. Jung, and E. Yun. (Korea) 275
Characteristics,classification and quality of urban and industrial soils of the Ruhrarea, Germany. W. Burghardt. (Germany) 277
An assessment of the fertility capability soil classification (FCC) system for arabica
coffee (I-III). A.R. Owaiye, and A. Fagbami. (Nigeria) 279
The language of soil maps. L.A. van Sleen. (The Netherlands) 281
Photo-interpretation key for peasant land cartography. J.F. Martinez M. (Mexico) 283
25.-1

Preliminary evaluation of AVHRR data for delineating regional soil patterns. C.A. Vettorazzi, I. Bayramin, and M.F. Baumgardner. (Brazil) 285
Applications of remote sensing in soil science: Soil-lithology-relief relationship in Central Western Spain. F.Santos F. (Spain) 287
Multivariate prediction of values of soil properties at unsampled sites by means of matrix cokriging. L. Rangel, J.A. Viloria, and A. Garcia. (Venezuela) 289
Soils under indigenous agroforestry in the amazon estuary. A.M.G.A. Winklerprins. (USA). . 291
254

Assessing Hydrodynamic Land Qualities Using Less-than-perfect Tools
J. Van Orshoven*, J.A. Deckers and J. Feyen. Institute for Land and Water Management, Katholieke Universiteit Leuven, Belgium
Introduction. In order to assess, compare and evaluate the physical performance of land units, hydrodynamic land qualities (HDLQ) are useful as they provide quantitative information on functional aspects of the soil-moisture regime and its temporal variability. HDLQ are generally assessed by simulation of vertical water flow in the unsaturated soil zone. The soil hydraulic input data needed to characterize the water flow domain, are often estimated using transfer functions (TF). Both the water flow simulation model and the TF are less-than-perfect tools for the assessment of HDLQ. They introduce uncertainty about the validity of the simulation output which can be expressed as the variance of an average simulation result. By comparing these 'instrumental' variances with the magnitude of the variability due to climate and spatial soil variation, the fitness of the TF and simulation model to be used in real-world problems can be evaluated.
Materials and Methods. Two HDLQ, (transpiration deficit (TDEF) and drainage through a horizontal plane at 90 cm of depth (CFL90), both simulated for a permanent grass cover and cumulated over a civil year), have been assessed for three land units, defined as map units (series) of the Belgian soil map (scale 1:20,000). Spatial soil variability within the land units is described by using several observed geomatching (i.e. including impurities) soil profile descriptions for each map unit. For each of them, simulations for a 30 year period (1962-1991) have been carried out to address temporal variability. Seven different TF have been used for the seven parameters of the h-6 curve and the K-h curve. Using the TF and simulation model in a deterministic approach, the studied land units were found to behave statistically (95 % level) different regarding TDEF and CFL90. The magnitude of the uncertainty generated by TF and model, has been assessed from a dataset of residual values between measured (optimized) and estimated (using the TF) hydraulic parameters and between measured and simulated (using the model) land qualities.
A dataset of parameter residuals derived from 187 h-8 curves and 127 K-h curves was used to derive the vector of means U and the variance-covariance matrix V of the parameter residuals after transformation to normal. Using U and V, a conditional residual for each of the seven parameters was generated, i.e. a residual which accounts for its own variance and for the covariance with the residuals for the other parameters. The conditional parameter residuals were then used as random parameter perturbations and added to the deterministically obtained parameters by using a random number generator according to equations [1] and [2]:
Yi - Yt + e i [1] ei - ei(c) + CTei(c)*Rn A [2]
in which Yi is the true hydraulic parameter i, Y, the estimated value, e, the residual term, Mej/C\ the conditional mean, of parameter i, a
ei(c) t n e
conditional standard deviation and R a random number with lRn - 0 and <7Rn - 1.
255

For each map unit, 30 (years) * n (profiles) * 20 (sets of parameter perturbations) simulations have been done. As years and profiles are members of theoretically infinite populations, following random model [3] could be analysed to asses the variance components:
TDEF/CFL90hi,k - MAP UNITh + PROFILE(MAP UNIT)hi + YEARi + YEAR*PROFILE(MAP
™;T )hxj + <hi J k
in which the error term e fully incorporates the variance caused by the uncertain parameter estimates.
TDEF and CFL90 have been measured on 5 undisturbed soil columns in unweighed lysimeters, 80 cm in diameter and 100 cm of length, and exposed to natural field conditions. Data have been collected during the years 1990 and 1991. As a result, a dataset of measured TDEF and CFL90 values was available, which together with simulated values, provided mean residual values and their variances for both land qualities. Those model related variances have been accounted for by adding them to the results of the preliminary variance component analysis.
Results and Discussion. Using the outlined approach no significant differences between mean TDEF an CFL90 persists between the three land units. Following table displays the relative variance components for TDEF an CFL90.
PROFILE(MAP UNIT) YEAR YEAR*PROFILE(MAP UNIT) TF MODEL
0.66 0.08 0.14 0.26
The unprecision of the TF accounts for the largest part of the variance on TDEF. Improvement of the precision is necessary for adequate use in predicting crop transpiration and yield. Soil variability is more important than climate. The inaccuracy of the simulation model is more important than the unprecision of the TF for the assessment of CFL90. Here climatic variability dominates, by far, the total variance of CFL90. Soil variability has a small effect. These results lead to the general recommendation to evaluate land evaluation tools with respect both to the land quality and the type of land unit.
Reference. Van Orshoven, J., 1993. Assessing hydrodynamic land qualities from soil survey data. PhD-thesis, Katholieke Universiteit Leuven, Belgium: 264 pp.
'
TDEF 0 . 2 0 0 . 0 6 0 . 0 0 CFL90 0 . 0 2 0 . 5 7 0 . 0 1
256

Capabilities and Risks of Agricultural Land Use of River Lowland Soils in a Temperate, Weak Humid Climate
L. Mueller, R. Dannowski, U. Schindler, and J. Quast. Institut fuer Hydrologie im Zentrum fuer Agrarlandschafts- und Landnutzungsforschung (ZALF), 15374 Muencheberg, Germany.
Introduction. In the New German Bundeslaender large river lowland areas (about 590 Thousands of hectares) occur (3). Most of them are heavy soils with shallow water tables. Information is required wether agriculture will lead to increased risks of water pollution in those regions with their relatively shallow water tables. The aim is to obtain methods and parameters for thematic maps, and to get information on soil hydrologie development with time.
Materials and Methods. Soil hydrologie studies have been conducted over more than ten years by analyses of more than 100 soil profiles and water table observations. Soil profile descriptions and physical analyses were done according to the FAO, ISSS and DIN guidelines ( 2 , 1). Trafficability and water table relationships have been studied over six years by a method according to (4). This method is combined from an assessment of the soil consistency state at different depths and penetrometer measurements. Estimations of crop yields under different substrates and water tables were carried out on different field sections over ten years. The crop rotation mainly consisted of cereals. The climatic conditions are characterized by annual rainfall of 450 to 550 mm and a mean temperature of about 8.3 °C. Potential annual evapotranspiration amounts 500 to 560 mm. All soils are Eutric Fluvisols and Eutric Gleysols after FAO classification. The areas are protected by dams against flooding and predominantly in arable use. Temporary wetness of the sites is mainly caused by groundwater recharge from the rivers. Regionally available soil water supply and seepage rates were calculated after a modified algorithm based on regressions (5).
Results and Discussion. Water regime, soil functions and land use capabilities are closely correlated. Soil physical parameters, trafficability and crop yields depend on medium-term drainage status. Parameters of water permeability, such as saturated conductivity and infiltration rate, are important for water balance models, to assess the need of site improvements and to choose hydrologie measures. Subsoils with high swelling status show mainly coherent structure with very low saturated hydraulic conductivity and infiltration rate (< 0.1 m/day), low dry bulk density (0.7 - 1.0 Mg/m3), consistency index < 0.5, and potential volumetric shrinkage of 40 - 70 % on drying. The saturated conductivity or infiltration rates are soil structure parameters characterizing the medium-term soil drainage status (Fig. 1). Conductivities and infiltration rates are correlated with macromorphologic soil structure. Land use influences biogene pore systems. On grassland higher saturated conductivities and infiltration rates are measured than on arable land. Most regions are overdrained due to missing water table control and precipitation deficit during several years. The current water tables deeper than 140 cm tend to declines in yield and long-term soil damages. The regional available soil water supply amounts of 100 to 160 mm per year. Due to overdrainage of the soils during the last decades, the current groundwater supply is mostly less than 25
257

mm/year. Both trafficability and crop yield are closely related to drainage status. Medium-term springtime water tables of 90-110 cm below the surface are suitable for arable farming. Further lowering of water table does not improve the trafficability and crop yield. There is a significant correlation between available water supply and crop yield. The correlation is closer considering the occurrence of wild plants.
Extremely low
3 4 5
Class of infiltration rate 7
Extremely high
Figure 1: Initial infiltration rates at different drainage states
The soil degradation and water pollution potential by agrarian land use depend on the amount of vertical seepage resp. discharge water. Seepage rates range about 50 to 100 mm/year. Compared with other sites they are very low due to low precipitation and the retention capacity of the soils and the landscape. From that fact the risks of water pollution by agrarian land use are relatively small. Monitoring and control of soil structural parameters as a result of changes in water table level is a task of further research.
Literature Cited. (1) Deutscher Normenausschuss. 1977. DIN 19683, 1-19, Landwirtschaftlicher Wasserbau, Phy-
sikalische Laboruntersuchungen. (2) FAO - Guidelines for soil description, Third Edition (Revised), Rome 1990, 70 p. (3) Lieberoth, I. and R. Schmidt. 1982. Ueberblick ueber die Verbreitung der Standortgruppen
und Standorttypen in der DDR. Arch. Acker- Pflanzenbau Bodenkd. Berlin, 26, 1, 1-8. (4) Mueller, L., P. Tille and H. Kretschmer. 1990. Trafficability and workability of alluvial clay
soils in response to drainage status. Soil & Tillage Research, Amsterdam, 16, 273-287. (5) Renger, M. and O. Strebel. 1980. Jaehrliche Grundwasserneubildung in Abhaengigkeit von
Bodennutzung und Bodeneigenschaften. Wasser und Boden 8, 362-366.
258

Fuzzy Logic and Risk Assessment -A Futuristic Approach to Soil Interpretations
M.D. Mays*, I. Bogardi, A. Bardossy, L. Duckstein, and M.J. Mausbach. USDA-Soil Conservation Service, Lincoln, Nebraska; Univ. ofNE, Lincoln, Nebraska; Inst, of Hydrology and Water Resources, Univ. of Karlsruhe, Karlsruhe, Germany; Univ. ofAZ, Tucson, Arizona; USDA-Soil Conservation Service, Washington, D. C.
Introduction. A risk-based system of soil interpretations is proposed to account for the uncertainty in ratings in soil surveys using fuzzy logic. User decisions can be based on "what if scenarios" and are dependent on the risk-to-cost relationship that the user is willing to accept. The uncertainty is expressed as risk, a numerical result that reflects the consequences of the decision. The methodology has been adapted to a user-friendly PC (personal computer) environment. The obtained "risk-based" rating evaluations can be used to minimize the economic losses and social discomfort associated with soil interpretative management decisions.
Materials and Methods. The methodology was applied to four different ratings in one map unit, Yutan-Judson complex, 5 to 11 percent slopes in Saunders County, Nebraska (USA). The optimum set of each interpretive criteria is expressed as an imprecise (fuzzy) number. Then the actual set of corresponding data representing the map unit is calculated. These distances are combined using composite programming matrices to obtain a rating evaluation measure over data influencing a rating (Bardossy, et al., 1985). Fuzzy soil interpretation risk analyses are based on an engineering risk approach (Dobuis and Prade, 1980).
Results and Discussion. Using the methodology presented in this study, the degree of uncertainty in data used to make soil interpretations is reflected in the fuzzy ratings (Table 1). Interaction of soil properties can be reflected in the ratings. The risk related to a rating is influenced by the property evaluation measure, expressed as a fuzzy number and by the adverse consequence of a property evaluation of less than one. The fuzzy ratings in this study compare favorably with the conventional method of soil interpretations used by the National Cooperative Soil Survey and the USDA-Soil Conservation Service.
Table 1. Fuzzy Means (R) of Rating Evaluation Measures Compared to Field Ratings.
Ratings Fuzzy Mean
with interaction without interaction Field Rating
Dwellings with Basements 0.633 (slight) 0.577 (moderate) slight
Dwellings without Basements 0.516 (moderate) 0.494 (moderate) moderate
Shallow excavation 0.449 (moderate) 0.449 (moderate) moderate
Septic tank adsorption field 0.568 (moderate) 0.545 (moderate) moderate
259

Remark: Categories chosen for R are:
0.0 - 0.3 Inappropriate (severe) 0.3 - 0.6 Fair (moderate) 0.6 - 1.0 Appropriate (slight)
Literature Cited. (1) Dobuis, D., and H. Prade. 1980. Fuzzy sets and systems: Theory and Applications.
Academic Press, New York. (2) Bardossy, A., I. Bogardy, and L. Ehickstein. 1985. Composite programming as an
extension of compromise programming, p. 375-408. In. P. Serafmi (ed), Mathematics of multiple objective optimization. Spring Verlag, Wien.
260

SOTER Methodology Used For the Evaluation of Amazonian Forest and Savanna Lands. T.T. Cochrane*, 8. Laguna, M.A. Beek and T.A. Cochrane, DHV CONSULTANTS BV, Amersfoort, The Netherlands.
Introduction. In recent years, public awareness has been focused on the Amazonian forest and savanna lands of tropical South America, due to concern over the effects of accelerating deforestation on the earth's climate, loss of bio-diversity and regional soil erosion. Unfortunately, the lack of a comprehensive benchmark study of Amazonia's land resources has often led to conflicting opinions concerning the relative gravity of deforestation and soil degradation throughout this region. The authors consider that the sustained development of Amazonia and the conservation of its biological resources, would be greatly enhanced if a digitized land resource study were carried out over its entire extent, to form the technical base for proper land use zoning and long term agricultural and forestry development. In keeping with this contention, they tested the World Soils and Terrain Digital Database (SOTER) methodology developed by the International Soil Science Society ISSS (1), as a possible methodology for such an endeavor, in both Amazonian forest and savanna lands. Consequently, the objective of this paper is to report on the suitability of the SOTER methodology for the survey envisaged.
Materials and Methods. The World Soils and Terrain Digital Database (SOTER) methodology identifies areas of land with "distinctive, often repetitive patterns of land form, lithology, surface form and soil" (1). Effectively, SOTER units delineate areas of similar lands where the same type of farming or forestry might succeed. The work to describe SOTER units followed the sequence: literature revision, preliminary imagery interpretation, soil profile sampling in the field, the description of the SOTER unit attribute properties, soil analyses, the definitive delineation of SOTER units on satellite imagery, final map and attribute digitization, data analyses, thematic map compilation and report compilation. The hardware chosen for the task of digitization consisted of a 33 MHZ, 486DX, Personal Computer with a 140 MB hard disk, a 12 inch SummaSketch II digitizing tablet and a 24 pin dot matrix printer, all of which cost less than $US 3,000. The software selected for setting up the SOTER digital database, was simply a combination of the relational database management system PARADOX for WINDOWS for the compilation and management of the SOTER database file sets as detailed in the SOTER manual, with the Geographical Information System IDRISI V.4.1, developed by Eastman et al. (2), for digitizing and quantifying the mapped soil units and producing thematic maps. These commercially available and inexpensive software packages (IDRISI costs $US 65 for students and PARADOX for WINDOWS $US 180), were inter-
261

linked by the simple expedient of preparing ASCII files as needed. The following diagram illustrates the SOTER digital database.
THEMATIC MAP OUTPUT: rotcsw
-Land Use -Zoning
TABULAR OUTPUT: e.g. for
i« U»«
| LAND [SOTER) UNIT MAP FILE |
I SATELLITE IMAGE FILES
MAP UNIT / ATTRIBUTE DATA FILES
TERRAIN.DB :
|L.nd U«e«le«|
IForetry flleo
(Sode-goo. tile "I
|oiL«:r pe l . rTC~|
-|TERRCOMP.DB | [TCOATA.PB |
| SOH.COMP.OB
| PROFILE.PB | IHORIZONS.PB |
FAO-1SF0C SOIL (pnrflle) DATABASE. SOB
REFERENCE FLES
THE WORLD SOILS AND TERRAIN DIGITA1 DATABASE (SOTER)
In addition to the basic programs used for the SOTER digital database, the soil (profile) database program SDB2, available from FAO (FAO-ISRIC, 1989), was used as an input device to incorporate soil profile data into the SOTER database. The spreadsheet program QuattroPro 5.0 (update price $US 80), was used for the statistical analysis of soil chemical data.
Results and Discussion. The test studies now extend over 24 million ha of both Amazonian forest and forest margin savanna lands. This work has been carried out at an average scale of 1:500,000, and includes a substantial area of western Amazonia, specifically the Pando Department of Bolivia, and the Geo-Economic region of Brasilia. In both cases the work was carried out to provide a digitized geographical land resource base for the sustained development of those regions. In the case of the Pando study a Land Use Zoning map was prepared as an additional output to identify extractive reserves for non-timber forest products including Brazil nuts, national parks and other uses, to be put into effect by local government. Both of the studies were carried under rigid time-limited, international consultancy contract conditions; the study of the Geo Economic Region of Brasilia was completed in 8 months by the senior author working alone, and the Pando study, one of the most remote areas of Amazonia, in 4 months with the help of 2 junior soil surveyors. It is concluded that the SOTER methodology as used by the authors, is both cost effective and well suited for carrying out an Amazon-wide land resource survey.
Literature cited. (1) ISRIC. 1993. Global and national soils and terrain digital databases (SOTER): procedures manual. (Ed. V.W.P. van Engelin et al.) ISRIC, Wageningen, Holland. 115p. (2) Eastman, J.R. IDRISI version 4.1. Clark University, Graduate School of Geography, Worcester, Massachusetts, U.S.A.
262

Use of Attribute Databases for Generating Soil Interpretations
X.i AuS*aaieki.\i Northeast* National Technical Center, Soil Conservation Service, U.S. Department of Agriculture^, Chester, PA, USA.
Introduction. A database of attribute soil information is used to generate soil interpretations for agriculture, grazing land, forestry, construction, waste disposal, and water quality.
Materials and Methods. Since the early 1970's, the Soil conservation service, U.S. Department of Agriculture, has used a soil attribute database to generate soil interpretations. Soil attribute data is stored by soil series. Map unit attribute data is stored in the Map Unit Use File. This attribute data and computer generated soil interpretations are stored on a main frame computer at a central location. Map Unit Interpretations Records, which consist of soil property data and interpretations by map unit, are down-loaded to each state's State Soil Survey Database (SSSD) (2). The data in the SSSD is placed in technical guides and soil survey publications. The information is used by Soil Conservation Service Field Offices to provide resource information and planning assistance to farmers, ranchers, foresters and others such as units of federal, state and local government that have natural resource planning responsibilities.
Since 1989, a system for attribute data storage has been under development to replace the current system. The fus* phase of the new system, the National Soil Information System (NASIS), is scheduledtbr release in October, 1994.
The main concepts of NASIS are:
- The soil series as a component of a map unit is the basic data building block. Components are soils or miscellaneous areas in a map unit. They are not delineated but their extent and location in relation to landscape features is defined.
- Detailed primary soil property data, by component, is available.
- A representative or expected value is used for each soil property. (1).
Soil interpretations in NASIS are generated by comparing component data to standardized or user defined interpretive criteria.
Results and Discussion. The system currently used to store and retrieve attribute soil data and generate interpretations has several limitations which will be overcome by NASIS. The main limitations of the current system and the way in which NASIS addresses them are as follows:
- A large portion of the data collected during a soil survey is not published or available in a permanent record. In NASIS, all field and laboratory data will be stored electronically and made available.
263

- Interpretations are fully developed for named taxonomie units only. Limited information is available for map unit inclusions. In NASIS, information collected from the soil survey area will be available for all components of a map unit.
- Many data elements are only available as an upper and lower limit of a range. This restricts the usefulness of the interpretations. In NASIS, data will be available in terms of high value, low value and representative value. It will be possible to select one of these values or the full range for making interpretations.
- The addition of new data elements is difficult An important feature of NASIS is that new data elements are easily added in response to user needs.
- Interpretations are, in some cases, based on classed data or on other interpretations. In the future, interpretations will be made on basic component properties.
- Non-standard interpretations are not automated. In the future, both standard and user defined interpretations will be available electronically.
- No information about data reliability or variability is available. In the future, this information will be available (1).
In conclusion, NASIS provides the capability for making standard and non-standard interpretations based on soil property data for all components in a map unit.
Literature Cited. (1) Soil Survey Staff. 1991. National Soils Information System, Soil Interpretations and Information Dissemination Subsystem, Draft Requirements Statement. National Soil Survey Center, Soil Conservation Service, United States Department of Agriculture, Lincoln, NE.
(2) Soil Survey Staff. 1992. National Soils Handbook, Draft. National Soil Survey Center, Soil Conservation Service, United States Department of Agriculture, Lincoln, NE.
264

Short-Term Changes In Soil Quality In Response To A Grass Community Established
on Marginal Croplands
G.E. Schuman* , J.D. Reeder, and R.A. Bowman. Agricultural Research Service, USDA, 8408 Hildreth Road, Cheyenne, Wyoming 82009, USA.
introduction. Long-term dryland cropping in the Central Great Plains has resulted in significant reductions in soil carbon, nitrogen, and phosphorus (1, 2, 3). Reestablishing grass communities on these marginal highly erodible lands, through the Conservation Reserve Program (CRP), is intended to reduce erosion and encourage soil regeneration. The CRP is a voluntary land retirement program wherein land considered highly erodible or otherwise environmentally sensitive could be enrolled.
Materials and Methods. Studies were initiated in Wyoming, USA, in 1987 to assess the rate and degree of soil quality regeneration that can result from seeding marginal croplands to grass. The study was designed to also enable evaluation of rate of soil quality degradation upon plowing native grasslands and establishing wheat-fallow production. Field plots were established at three sites that had been farmed using wheat-fallow, stubble mulch cultural practices for at least 60 years. Precipitation at the three field sites ranges from 356 to 402 mm. Two of the sites had sandy loam soils (Aridic Argiustoll and Aridic Haplustoll) and the other site was a clay loam (Ustollic Haplargid). Treatments include: continued wheat-fallow, long-term wheat-fallow cropland planted to a native grass mixture, native rangeland, and native rangeland plowed and wheat-fallow cropping established. The reestablished grass treatment was subdivided and one-half of the plots had 34 kg N/ha (NH4N03) applied annually. Soil samples are collected annually at depth increments of 2.5 cm for the first 15 cm and a single sample taken from 15 to 36 cm. Forage production estimates are also collected annually on the grass and native rangeland treatments. Wheat yield are determined on the years wheat is grown.
Results and Discussion. Within 3 years after reestablishing a grass community on the marginal cropland treatment, total nitrogen, nitrogen mineralization potential, respired carbon dioxide, and organic carbon showed significant increases in the surface 2.5 cm of the sandy loam soils compared to the continuous wheat-fallow treatment. Organic carbon, respired carbon dioxide, inorganic phosphorus and nitrogen mineralization potential exhibited significant increase in the seeded grass plots compared to the continuous wheat-fallow treatment on the clay loam soil. Some improvement was also evident in the 2.5 to 5.0 cm soil depth. The addition of nitrogen fertilizer to the reestablished grass
265

community had no effect on the rate of soil quality improvement. The improvements of soil quality was greater in the sandy loam soils because of their inherently lower quantities of these constituents compared to the clay loam soil. The short-term improvements exhibited in soil quality suggest that these marginal soils can be improved by the establishment of a grass community and restored to productive sustainable lands.
Plowing native grasslands and initiating wheat-fallow cropping resulted in significant decreases in soil total nitrogen, inorganic phosphorus, nitrogen mineralization potential, respired carbon dioxide, and soil organic carbon of the surface 5 cm. In most cases, within two wheat-fallow cycles, these soil quality parameters had decreased to those found in the continuous wheat-fallow treatments that had been farmed for 60 years.
Forage production of the reestablished grass treatment ranged from 2-6 Mg/ha. Economic analysis of the regions historic wheat yields and the forage produced on these research plots suggest that the value of the forage for hay or grazing is competitive with that received from wheat and provides an alternative use of these lands that can more readily ensure the protection of the soil resource.
Literature Cited. (1)Bowman, R.A., J.D. Reeder, and R.W. Lober. 1990. Changes in soil properties in a central plains rangeland soil after 3, 20, and 60 years of cultivation. Soil Science. 150:851-857.
(2)Haas, H.J., C.E. Evans, and E.F. Miles. 1957. Nitrogen and carbon changes in Great Plains soils as influenced by cropping and soil treatments. USDA Tech. Bull. No. 1164. U.S. Government Printing Office, Washington, D.C.
(3)Salter, R.M. and T.C. Green. 1933. Factors affecting the accumulation and loss of nitrogen and organic carbon in cropped soils. Agron. J. 25:622-630.
266

Abiotic Soil Indicators for Arid Ecosystem Assessment
T.G. Reinsch* and R.P. Breckenridee. USDA-SCS, National Soil Survey Center, Lincoln, Nebraska 68508, USA, and Idaho National Engineering Laboratory, Idaho Falls, Idaho 83415, USA.
Introduction. The U.S. Environmental Protection Agency, in collaboration with the USDA-Soil Conservation Service and other agencies, is developing the Environmental Monitoring and Assessment Program (EMAP) to periodically document the ecological resources at a regional and national scale. The goal of the EMAP Arid resource monitoring and research group is to provide an unbiased estimate with known confidence, of the current and changing conditions of natural resources in arid ecosystems and their extent at the regional and national level (Kepner and Fox, 1991).
The soil component of the natural resource interacts with and influences the vegetation and hydraulic components. Hence, selected abiotic soil indicator candidates are explored that fulfill the goal to monitor status and trends of the soil resource in arid ecosystems. Abiotic soil indicators are physical and chemical properties which change over time periods of 1 to 10 years. Accelerated erosion is a primary indicator of ecosystem degradation (FAO, 1979) as are changes in soil-water relationships and the organic carbon pool.
Materials and Methods. The abiotic soil indicators in macroplots of the Colorado Plateau Region of southeast Utah were investigated. Data were collected for surface features, soil profiles, and vegetation in desert scrub and pinyon-juniper formations. Soil samples were analyzed using methods described by Soil Survey Laboratory Staff (1992). Water erosion indices were estimated using RUSLE.
Results and Discussion. Cumulative distribution functions of the indices and comparisons to standards such as soil loss tolerance are used to evaluate the status and trends of the arid ecosystem. Cumulative distribution functions were chosen as a nonparametric statistic to represent the central tendency and extreme values in an easily interpreted graphical form (Kepner and Fox, 1991). Expected soil loss tolerance of a soil series is used as a comparative standard.
Conceptual models are presented that show linkages of the abiotic soil indicators to the and ecosystem. Surface soil attributes such as soil structure, bulk density and porosity, organic matter, and crusting are the first to respond to natural and anthropogenic stress. Soil degradation is often proceeded by changes in the vegetative community (Wood, 1988). Changes in surface soil attributes influence soil-water relationships, infiltration rates, runoff, and erosion. The soil profile is the long term result of interactions of climate, organisms, topography, and parent material (Jenny, 1941). Modification of these factors would cause a change in soil profile characteristics but typically at a rate undetectable within 10 years.
267

Literature Cited. FAO. 1979. A provisional methodology for soil degradation assessment. United Nations, Food and Agriculture Organization, Rome, Italy.
Jenny, H. 1941. Factors of soil formation. McGraw-Hill, New York.
Kepner, W.G., and GA. Fox, eds. 1991. Environmental Monitoring and Assessment Program. Arid ecosystems strategic monitoring plan. EPA 600.4-91/018. U.S. Environmental Protection Agency, Washington, DC.
Soil Survey Laboratory Staff. 1992. Soil survey laboratory methods manual. USDA-SCS Soil Survey Investigative Report No. 42. U.S. Government Printing Office, Washington, DC.
Wood, M.K. 1988. Rangeland vegetation - hydrological interactions. In Tueller, P.T., ed., Handbook of vegetation science, Vol. 14, Vegetation Science Applications for Rangeland Analysis and Management. Kluwer Academic Pub., pp. 469-491.
268

Research of a methodology for the appraisal of soils potentialities
D. Palma-Lopez1-2, L. Florentin' and F. Jacquin1.1) Science du sol, ENSAIA, 2.avenue de la Forêt de Hay e, B.P.172 54500 Vandoeuvre ; FRANCE
2) Ceicades-Col. de Post. A.P.24; 86500 Cardenas, Tab. MEXICO
Introduction. In Lorraine region of France the soil survey at 1/250000 showed some little natural regions determined essentially by the lithology ; this permitted the choice of reference sectors which mapped at 1/25000 put in evidence different types of soil, distributed in an heterogenous manner over the landscape ; this heterogeneity may appear in the same plot production, resulting in important productivity differences under identical agro-systems and for similar cropping techniques. Our goal consists to make a methodologie research in order to determine the soils agronomical potentialities with a double care of the productivity and the environmental preservation.
Materials and methods. As an exemple, we started from a detailed study of existing soils in the references sector of Barrois. We have observed a production plot situated on the limestone plateau belonging to Portlandien formation, with three different soil types, which were classified from the viewpoint of their characteristics and their natural potentialities. Finally, we have compared these classifications to the agronomical yields obtained during several years of culture.
Results and discussion. The taxonomy of the observed soils was defined accordingly to three systems : the French Pedological Reference Base (1), the Soil Taxonomy (7) and the FAO-UNESCO soil map of the world (3).
Soil 1). RENDOSOL - Lithic Rendoll - Rendzic Leptosol Soil 2). CALCISOL - Typic Eutrochrept - Chromic Cambisol Soil 3). NEOLUVISOL - Typic Hapludalf - Haplic Luvisol
As far as the potentialities evaluation is concerned, we have utilised two methods. The first method is the land use capability system developed by the Soil Conservation Service of the USA (5), which calls five factors that can limit production : erosion (E), drainage (D), topography (T), soil (S) and climate (C). In our case the only factor retained is S and to it will be assigned a numerical index, expressing the soil's constraints ; these constraints will be hierarchically classified, the first index determining the class. The second method applied in the Central Region of France (5) uses a parametric approach based upon the note of the cultural value of the soil ; it refers to seven hierarchical parameters with a maximal grade of 100 points ; these parameters are : texture (25 points), hydromorphy (20 points), soil depth (15 points), calcic and organic status (15 points), useful reserve of water (10 points), stoniness (10 points) and carbonates content (5 points). Results are presented in Table 1.
Table 1: Evaluation of soils potentialities SOILS Land use capability system* Parametric approach**
RENDOSOL IIIS2S5S6S1 20+5+3+0+2+20+15=65 CALCISOL IIS5S1 20+3+10+10+6+20+12=81
NEOLUVISOL IIS8 25+0+15+10+9+18+7=84 *S1 = texture ; S2 = soil depth ; S5 = profile stoniness ; S6 = superficial stoniness; S8 = potential fertility (CEC) ** The seven parameters notation is presented in the same order as in the text.
The obtained agronomical yields from the above mentioned production plot during 3 years with potential non-limiting cropping techniques are presented in Table 2. One notices that the two utilised soils evaluation systems give the same hierarchy for the three soils ; results differ mostly for the weight attributed to the limiting factors than by the limiting factors in themselves. This
269

allowed us to put in evidence three principal factors which can intervene on agricultural production : parental geological material, exploitable land volume by roots (stoniness, soil depth) and profile development (texture, carbonatation).
Years/ cultures 1991/ fodder corn (t M.S. ha'1) 1992/ spring barley (qx ha'1) 1993/ winter barley (qx ha-1)
Table 2 : Obtained yields on the production plot CALCISÖL NEQLUVISOL
— r e s — RENDOSOL
T3T 61,3 66,0
52,9 58,8
63,6 70,0
Obtained yields are in conformity with established classification ; nevertheless, for a vegetal species, the intra and interannual climatic variations can involve important potential yield variations, as confirmed by the results related to several RENDOSOLS (fig. 1).
YIELDS (qx/ha) 100-90-80
Kl= accessible yield 1 year over S RM= accessible yield 1 year over 2 R4= accessible yield 4 years over R9= accessible yield 9 years over
O yields 88 0 yields 89
• yields 90 • yields 91
* yields 92
5 10
I • 1 • 1
300 350 400 I ETP-P > 0
Fig. 1 Wheat yields of RENDOSOLS
For a given soil type, the observed yields are assigned with a corresponding climatic index recognized as determinant for a given culture. Beginning from a frequential study of this climatic index, one can define an accessible yield potential for a chosen risk level (* fig 1). This determination of agronomical potentialities by soil type and for a given culture and climate should permit the proposal of a potentialities planning taking into account terrain's heterogeneity (2, 4). The farmer will be confronted to three possibilities :
- The plots are homogeneous or present a dominant soil type and can be treated in an uniform manner;
- The plots are heterogenous and can be subdivided because the distribution of soils permits then to practice differential cropping techniques on certain sub-plots;
- The plots are heterogenous with a particular geometrical configuration ; the farmer will be obliged to adopt the best possible compromise from the point of view of their management.
Literature cited. (1) AFES. 1992. Référentiel Pédologique (principaux sols d'Europe). INRA Ediüons. Paris,France.222p. (2) CRAL-ENSAIA. 1993. Connaitre les sols lorrains et leur potentiel de production. CRAL. Nancy .France. 42p. (3) FAO. 1989. FAO-UNESCO:Carte Mondiale des sols, Légende revisée. Rapport sur les ressources en sols du monde, No 60. FAO. Rome.Italie. 125p. (4) Jacquin F., Florentin L. & Limaux F. 1993. Pour une gestion de 1'exploitation agricole respectueuse de 1'environnement. C. R. Acad. Agr. Fr. Vol. 79(5): 51-59. (5) IMTA. 1989. Manual de clasificacion, cartografia e interpretacion de suelos con base en el sistema de taxonomia de suelos. IMTA-SARH. México. 230p. (6) Lafrechoux, M. et al. 1983. Notice explicative de la carte des sols de Selles-sur-Cber (carte des sols de la Region Centre 1/50000). Chambre d'Agriculture de 1'Indre. France. 161p. (7) Soil Survey Staff. 1987. Keys to soil taxonomy (third printing). SMSS technical monograph No. 6 . Ithaca, New York.USA. 280p.
270

A system of soil-ecology and soil-conservation maps and the problems of their compilation
Ye.M. Naumov. Dokuchaev Soil Institute, 7 Pyzhevski Lane, Moscow, Russia.
Introduction. The rational economic management and the protection of environment is one of the most important problems of our time. A constantly increasing anthropogenic and technogenic pressure on the ecosystems results in serious and even catastrophic disturbances of such essential component of nature as soil cover.The optimal use of soils in combination with the preservation of environment can be achieved only on the basis of the maximal adaptation of economic management of soils to the peculiarities of the soil cover. Soil cover is one of the most unstable, sensitive, durably recovering and hardly reproduced component of ecosystems. In this report we discuss the methodology and the techniques of compilation of soil-ecologic, soil management and soil-conservation maps of special designation, forewarning about the possible (predominantly -negative) consequences of poor management of soils. The extremely sensitive to various natural and man-induced impacts, easily disturbed and unstable soil cover of the North-East of Eurasia is taken as an example for the discussion.
Materials and Methods. To tackle the problem, we used the original data of the 35-year period of soil studies on the vast territory of the North-East of Eurasia. The comparative geographical method, the modern methods of soil cartography and the expert qualitative and semi-quantitative . assessments of various ecologically meaningful functions of soils form the basis of our concept.
Results and Discussion. Soil maps of higher information content are necessary to solve the soil-genesis, soil management and soil conservation problems. The methodology of compiling this kind of map is based on the introduction of additional information into the map content, which enables one to transform the basic soil map into applied maps of special designation. For permafrost affected landscapes of the North-East of Eurasia, this information should certainly include the data on the influence of cryogenic processes and hydromorphic conditions on soils. The cartographic realisation of the elaborated ecologic-genetic and geographical concept of soil formation in the North-East of Eurasia enabled us to compile the highly informative soil maps. The peculiarities of environmental conditions were reflected on the basis soil map by means of such additional, non-standard indices as the soil cover structure, geocryological conditions, the content of ice in rocks, etc. We distinguished the groups of non-frozen and durably frozen soils and separated the latter into subgroups of soils with dry and ice-enriched permafrost and the subgroups of deep-frozen and high-frozen soils. This information makes it possible to evaluate the energy stocks of soils, the resistance capacity of soils under construction, the possible degree of assimilation of nutritional elements by plants and the biologic activity of soils, the necessary amounts of fertilisers, the need in heat meliorations and in other farming measures to ensure the sustainable agriculture and the protection of environment in this region.
The series of applied maps, based on the original (basic) soil map includes:
1) The Map Forecasting Disturbances of Soil Cover, on which the territory is subdivided into regions.subregions and districts with specific combinations of soil disturbances.lt reflects the already existing deterioration of soils (actual disturbances) and forecasts the potential disturbance of soils under economic management of the-particular territories. A total of 12 different types of disturbances is presented on the map.
2) The Map of Complex Economic and Ecologie Characteristics of Soils depicts the possibilities of rational management of soils and the ecological functions of the latter by means of the three groups of parameters: a) the factors limiting the use of soils; b) the biological productivity of soils; c) the need of soils for meliorative measures. The legend of the map is designed in a matrix form; the whole territory is subdivided into several types of regions with specific requirements to economic management which are characterised by particular spectrums of soil types.
271

3) The Map of Cryogenic Disturbances of Soil Cover represents the geographical distribution of the main types of cryogenic disturbance of soils, such as thermal karst, frost, heaving cryogenic cracking and formation of cryogenic spots, cryogenic solifluction, cryoturbation, frost creep, etc. The map is used as a basis for forecasting soil disturbance under man-induced impacts, and for the planning of intelligent economic management of the territory.
It seems reasonable to elaborate the systems of similar maps, based on our methodological approach, for the territory of various regions and continents of the Globe.
272

SOIL INFORMATION FOR SOLVING LAND USE CONFLICTS IN URBAN FRINGES. A CASE STUDY OF WESTERN CARACAS (Venezuela).
O. Rodriguez P. and J. A. ZInck. International Institute for Aerospace Survey and Earth Sciences, Enschede, The Netherlands.
Introduction. City growth is a global process which started long ago and reached its maximum expression in the industrial and postindustrial era. Areal expansion of cities has sprawled at the expenses of prime farmland and environmental amenities and commodities, thanks to steadily growing communication and transport facilities. Eventhough this expansion does not significantly affect or remove large areas of land from agricultural production at an aggregate level, i.e. national or global, concern for preserving open space and environment as well as protecting the local and regional economies and social structures has increased in recent years (Bryant, 1984; Deslauriers et al., 1992; Hart, 1991; Rickard, 1992).
Main land use changes due to urban expansion occur in the rural-urban fringe, a dynamic space which separates the urban area proper from the countryside and shows chaotic mixtures of land uses (Hill, 1986). Urban fringes are subdivided into more or less concentric belts called inner fringe and outer fringe. Fringe expansion is essentially radial but not necessarily circular as stated by Sinha (1980). The inner fringe is characterized by land in advanced stages of transition from rural to urban uses (Bryant et al., 1982). The presence of subdivision lots, social fallow, non-rural land uses, together with particular features like disinvestments from farm enterprises, high land prices, non-farmer property ownership characterizes this zone. The outer fringe is an area still dominated by rural land uses but where the infiltration of urban-oriented elements is clear (Bryant et al., 1982). Intensification and diversification of agricultural enterprises, off-farm employment and other urban controlled activities are common.
Land use conflicts generated by uncontrolled and often undesirable land use changes occurring in periurban areas, have to be solved in such a way that the land resource in its multiple use options is optimized. Otherwise, the urban expansion may cause additional conflicts because of putting at risk future alternatives and benefits for the urban population.
The main objective of this paper is to describe a method to use soil information for detecting, assessing and solving land use conflicts in urban fringes within a comprehensive land use planning framework. An example from the west-side periurban expansion area of Caracas (Venezuela) is used to show how land use conflicts between urban expansion, intensive mountain agriculture, nature conservation and recreational activities can be controlled by promoting land uses on the basis of land physical and economic suitabilities, but taking also into account relevant social and political considerations.
Materials and Method. A geopedological survey of the study area has been performed using a landscape classification approach (Zinck, 1989). The suitabilities of each land unit for specific land uses previously selected (urban, agriculture, recreation, nature conservation) were assessed according to the FAO framework (FAO, 1976) and implementing the ALES software (Rossiter and Van Wambeke, 1993). A current land use map was compared to the multipurpose land suitability maps to detect on-going land use conflicts. Past land use
273

evolution was analyzed from multi-temporal land use maps to distinguish between weaker and more aggressive land uses. Socio-economic criteria were introduced in the evaluation scheme using LESA (Steiner et al., 1986). General land use policies were formulated and implemented through the LUPIS software (Ive, 1992) to generate land use scenarios taking into account the weighted opinions of different land users. Main cartographic operations and displays were performed using the ILWIS geographical information system software (ITC, 1993).
Results and Discussion. Preliminary results show the disappearance of extensive coffee plantations and increasing occurrence of horticultural farming systems in the outer fringe of Caracas and dependent satellite towns. In the inner fringe, horticultural systems are being displaced by urban uses and agricultural economic viability is affected by high land values. Subsistence crops precede either horticultural crops in the outer fringe or scattered settlements in the inner fringe. Current land uses and suitabilities fit rather well in already developed areas but new land uses tend increasingly to occupy marginal land due to scarcity of the land resource. Land use scenarios show the possibility for alternative developments satisfying the different interest groups. Agriculture and nature conservation scenarios need governmental support to resist urban pressure.
References Bryant, C.R. 1984. The recent evolution of farming landscapes in urban-centred
regions. Landscape Planning, 11:307-326. Bryant, C.R., RUSWURM, L.H. and A.G. McLELLAN. 1982. The city's countryside.
Land and its management in the rural-urban fringe. Longman Inc., New York. Deslauriers, P., Bryant, C. and C. Marois. 1992. Farm business restructuring in the urban
fringe:The Toronto and Montreal regions. In: Bowler, I.R., Bryant, C.R. and M.O. Nellis (eds.). Contemporary rural systems in transition. Vol. 1. C.A.B. International, UK.
FAO. 1976. A framework for land evaluation. Soils Bulletin 32, FAO, Rome.
Hart, J.F. 1991. The perimetropolitan bow wave. The Geographical Review, 81(1): 35-51.
Hill, R.D. 1986. Land use change on the urban fringe. Nature and Resources, Vol XXII (1 & 2):24-33.
ITC. 1993. ILWIS 1.4 The Integrated Land and Water Information System. User's Manual. International Institute for Aerospace Survey and Earth Sciences. Enschede, The Netherlands.
Ive, J.R. 1992. LUPIS: Computer assistance for land use allocation. Resource Technology 92 Taipei: Information Technology for Environmental Management. Taipei, Taiwan.
Rickard, T. 1992. Agricultural policies for urban fringes in the United States. In: Bowler, I.R., Bryant, C.R. and M.D. Nellis (eds.). Contemporary rural systems in transition. Vol. 1. C.A.B. International, UK.
Rossiter, D. and A. Van Wambeke. 1993. ALES. Automated Land Evaluation System. Version 4 user's manual. Cornell University, Ithaca, NY.
Sinha, M.M.P. 1980. The impact of urbanization on land use in the rural-urban fringe. Naturang Rai Concept Publishing Company, Rajdhani Press, New Delhi, India.
Steiner, F., Dunford, R. and N. Dosdali. 1987. The use of the Agricultural Land Evaluation and Site Assessment System in the United States. Landscape Planning, 14:183-189.
Zinck, J. A. 1989. Physiography and soils. Soil survey courses lecture notes K6. ITC. Enschede, The Netherlands.
274

Establishment of Land Suitability Grouping System for Sweet Persimmon Orchard in Korea
Yeun-Tae Jung* and Eul-Soo Yun. Yeongnam Crop Experiment Station, RDA, Milyang 627-130 Korea (ROK).
Land Suitability Grouping Systems(LSGS) of reductive models are mainly based on inferred soil characteristics which could govern the productivities. Economic cultivation of some fruit crops, e. g. sweet persimmon (Diospyros kaki T. ) kiwi berry (Actinidia chinensis P. ), citron (Citrus junos S. ) etc. , in the humid temperate regions like in Korea is limited by the local climatic conditions even if the soils have the same temperature regime. Moreover, drawing a sharp boundary between soil temperature regimes such as "Thermic" and "Mesic" is very difficult since soils are continuum in altitudes and in aspects of slopes or other micro-topography in the landscape.
Sweet persimmon grows in the regions of marginal subtropics to warm temperate and it is sensitive to coldness. Mean annual air temperature for the trees of sweet persimmon should be above 13"C and its freezing damage occurs below -ICC in winter. There are about 10, 000 ha of sweet persimmon orchards in Korea and the area increases 10-15% yearly for the last decade. Cold damages to the tree and deterioration of the fruit quality are foreseen with expansion of acreage toward unsuitable northward. Thereupon, a LSGS combined by the meteorological conditions as well as soil characteristics was studied.
The detailed soil mapstscale 1:25,000) and meteorological data in each county were used in this study with carrying out field survey of sample area in the main producing districts.
First of all, suitable area based on meteorological conditions was decided by the following rating criteria(see Table 1).
Table 1. Suitable area rating criteria for sweet persimmon orchard in Korea
Scores to be added in each factor Mean air temperature Remark
(t) 0.5 0.4 0.3 0. 1
. Annual > 13 12.9—12.0 11.9~11. 0 < 10.9 Coastal area will be subtracted 0. 3
. Jan. minimum > -2.4 -2.5'—3.4 -3.5—4.4 < -4.5 point from the total
. Sept. -Nov. > 15 14.9-14.0 13.9-13.0 < 12.9 score
Suitable area rating : Above 1.4 : Well suited area, 1.3—1.2 : Suited area, criteria (Total score) : 1.1 — 0.9 : Possible area, Below 0.8 : Unsuited area
And, the scores of soils based on soil properties were derived from the following criteria(see Table 2)
275

Table 2. Soil characteristics with scores and weights for the grouping of suitability of sweet persimmon orchards in Korea
Soil characteristics and handling methods of weights
Scores to each soil characteristics Soil characteristics and handling methods of weights 10 7 5 3
• u o U-P
3§
Texture family Drainage class Slope (%)
Fine loamy Well < 15
Coarse loamy Somewhat exc. 15 - 30
Silty(Fi. ,Co. ) Mod. wel 1
30 - 45
Clay. , Sandy Imperfect. 45 - 60
CWeight) (2) C2) __ _ fl) (1) o
C O Gr. water table (cm) Fragifan(cm)
> 100 None & >80
100 - 80 80 - 60
80 - 40 60 - 40
< 40 < 40
3 (Weight) (-0. 5) (-1) (-2) (-4)
O 0) (0 u
*• O u
0) m > +
•P u •* o •o u -O 0]
Avail, depth (cm) Hardness (sub., mm) Gravel content (%) Land forms
Coarse fragment (Surface)
> 100 16 - 19 10 -35
Plains or flat areas None
100 - 50 19 - 22 0 - 1 0
Hilly & Fans
Stony & bouldery
50 - 20 22 - 25 35 - 50
Mt. foot slope, Dilu. terraces Rocky
< 20 >25, <16
> 50 Mountains & Valleys Very rocky
Calculation of final scores and rating criteria of land suitability classes for sweet persimmon in Korea were as below formula and in Table 3.
Z meteorological score X E soil factor score o Final score =
2
Table 3. Classes and rating criteria of LSGS for sweet persimmon orchards in Korea
Suitability classes
I High. Suit
II Suitable
III Margin. Suit.
IV Unsuitable
Fineal score > 50 49 - 40 39 - 30 < 29
As results, the same soil could be grouping to different suitability classes, and the yields of persimmon fruit or frost damages of trees were well matched with the LSGS(see Table 4).
Table 4. The result of suitability grouping and yields for sample areas surveyed
Suitly. classes I II III PV Mean & Sum
Yield (t/ha) (sample size)
11.72 (7)
8.65 (9)
7.94 (5)
6.07 (2)
8.60 (23)
Extent (ha) (%)
1,433 (26. 6)
1,864 (34. 7)
1,767 (32. 8)
315 (5.9)
5,379 (100. 0)
276

Characteristics, classification and quality of urban and industrial soils of the Ruhrarea, Germany
W. Burghardt, Department of Soil Technology, Institute of Ecology, University of Essen, UniversitatsstraSe 4, 45117 Essen, Germany.
In t roduct ion. Urban areas are growing rapidly. In 1980 about 40% of the population of the world lived in towns. This will rise to over 50% in the year 2000. E.g. Mexico City had a growth rate from 1970 to 1985 of 113%. A rise of population of 18 billion in 1985 to 30 billion in the year 2000 (Deutsches MAB Nationalkomitee, 1991) has been assumed. With the enlargement of towns obviously the soil functions, until now fulfilled by the surroundings of the towns, has to be taken over by the towns themselves. This is the reason why we must have a serious Interest and a thorough knowledge of the characteristics and quality of urban and industrial soils.
Mater ia ls a n d M e t h o d s . Research activities started in the Ruhrarea in 1985. Some 150 soil profiles in urban and industrial areas have been examined. For soil horizon description a recommendation was developed by the "German Working Group of Urban Soils" (Arbeitskreis Stadtböden der Deutschen Bodenkundlichen Gesellschaft, 1989). This recommendation was used as basic instruction of soil horizon description. Of special interest were the technological materials, e.g. rubble, ashes, slag, refuse, sludges. First of all standard laboratory methods were used (Schlichting and Blume, 1966). These had to be supplemented by a wide range of different adapted methods. Especially for the analysis of organic carbon in technological substrates new methods have been developed (Burghardt, 1989).
Results and Discussion. The soils of urban and industrial areas show partly their natural morphology, partly their profiles have seriously altered. The factors of soil genesis have changed. The lowering of ground-water for example is a common feature. The results of which are relictic soils, e.g. relictic Gleysols. Results of man's social-economic activities are streams of natural and technological materials. They are ending on parcels as deposits changing the nature of the ground, immissions, refuse dumps or residues of industrial production. New soils from man-made substrates are formed (Hollis, 1992). The man-made substrates of the Ruhrarea have the following characteristics. The pH-value ranges from 6 to 12 (table 1).
Table 1: Frequency distribution (%) of pH-values
pH 4,1-5,0 5,1-6,0 6,1-7,0 7,1-8,0 8,1-9,0 9,1-10,0 n
Cambisols 2 18 80 0 0 0 61
Deposols 0 11 23 59 5 2 150
The abundance of stones is high. Organic carbon as well as contamination with toxic substances occur in the total man-made profile. The profile can have a loose structure or be strongly compacted. The man-made substrates form a sequence of often small layers or an arbitrary mixture with extremely different characteristics of material composition and structure. First steps of soil formation of man-made substrates are increase of organic carbon in the top soil, development of structure, generation of perched water-table over compacted layers, oxidation and reduction processes and accumulation of dust in the spaces between stones and on the surface. In the German soil nomenclature the man-made Lithosols and Regosols are named Deposols. They are further classified in Allosols from natural materials, Technosols from technological materials and Phyrosols from mixtures of natural and technological materials. For a great number of processes a more distinct classification is needed.
277

The special characteristic of quality of man-made substrates with regard to structure, porosity and organic carbon content is an increased C.E.C. and field-capacity (table 2,3,4). Stone content reduces these features. A serious problem of urban and industrial soils is the high and disproportionately distributed content of toxic substances. Hence the quality of urban soils differs from the quality of natural soils in some aspects.
Table 2: Frequency distribution (%) of organic matter content (combustion loss)
Combustion loss,%
< 2,1 2,1-4,0 4,1-8,0 8,1-15,0 15,1-30 > 30 n
Cambisols 13 35 26 22 4 0 23
Deposols 13 16 18 29 22 2 62
Table 3: Frequency distribution (%) of C.E.C.
C.E.C. m.e./kg < 30 31-80 81-120 121-180 > 180 n
Cambisols 29 63 8 0 0 24
Deposols 20 33 20 12 14 90
Table 4: Frequency distribution (%) of field-capacity
Field-capacity Vol.%
< 7 7-12 13-18 19-24 25-30 n
Cambisols 4 24 50 11 11 26
Deposols 0 13 35 52 0 23
Literature Cited. (1) Arbeitskreis Stadtböden der Deutschen Bodenkundlichen Gesel Ischaft, 1989. Empfehlungen des Arbeitskreises Stadtböden der Deutschen Bodenkundlichen Gesellschaft für die bodenkundliche Kartieranleitung urban, gewerblich und industriell überformter Flachen (Stadtböden). Umweltbundesamt, Texte 18/89, 171 p.
(2) Burghardt, W., 1989. C-,N- und S-Gehalte als Merkmale der Bodenbildung auf Bergehalden. Mitteilgn. Dtsch. Bodenkundl. Gesellsch., 59, 851-856.
(3) Deutsches MAB-Nationalkomitee (Ed.) 1991. Der Mensen und die Biosphere. Herbert Wichmann Verlag, Karlsruhe, 183 p.
(4) Hollis, J.M., 1982. Proposals for the classification, description and mapping of soils in urban areas. English Nature, Peterborough, 41 p.
(5) Schlichting, E. & H.-P. Blume, 1966. Bodenkundliches Praktikum. Paul Parey, Stuttgart, 193 p.
278

An Assessment of the Fertility Capability Soil Classification (FCC) System For Arabica Coffee (I-III) A.R. Owaiye* and A. Fagbami**. Cocoa Research Institute ofNegeria, Ibadan, Nigeria*. Agronomy Dept. University of Ibadan, Ibadan, Nigeria**
Introduction, Soils on which arabica coffee (Coffea arabica L.) grows correspond to a small group of mostly, mountaneous, humic tropical soils requiring a unique set of management practices (3,1) for which the FCC system (3^2) is yet to be adapted. Besides, it is not known with any certainty, as has been demonstrated with annuals (4,2), if the FCC system lends itself for successful agrotechnology transfer in pernnial, tree crops, including arabica coffee, especially important in the mostly agrarian economies of the tropics. This study offered a simultaneous evaluation of both objectives.
Materials and Methods. Fertilizer response data were obtained from 15 sites of an own farmers field, adult, arabica coffee, NPKMg simple fertilizer trial conducted on the Mambilla Plateau of Nigeria from 1989 to 1992. These sites had previously been classified at the subgroup level of soil Taxonomy and converted to FCC. We used compeslte assessors as previously reported (2) as well as discriminant assessors, including C.V. (%) and C.I.95 with set limits for acceptance or rejection of entity homogeneity or distinction, respectively, to evaluate the reliability of the FCC system. A multiple, linear, stepwise regression of coffee yield on sites parameters, on the other hand, provided insight into coffee - soils relationships.
Results and Discussion. Marked differences in coffee yield responses were observed between the FCC units. Use of the FCC system, in delimiting the landscape, resulted in a reduction in the composite, yield variance term of 73% compared to the total variance in the unclassified landscape. Average returns from NPKMg fertilizing had also increased from #484 (S25)/ha for a "blanket recommendation" to N709 ($36.5)/ha for FCC-based recommendation, or 46.5%. Aggregate scores for entity homogeneity and distinction were 87% and 63% respectively. These indices confirm that FCC units show high levels of internal consistency within themeselves, and will provide reliable basis for fashioning quantitative, agrotechnology transfer in arabica coffee and perenniel tree crops in general.
On the humus-richsoils of the study area, however, the incorrect association of absence of "e" modifier with decreased coffee yield, and vice versa, suggest that not all the relevant fertillity constraints operative were predicted by use of FCC. For the FCC to be valid for these soils it was necessary to add new components. These included a separation of the "C" subsurface type into two subtypes of "C" (clayey) or *C+" (heavy clayey) to distinguish between significantly different, drainage—imparted, fertility reactions of the subtypes. New condition modifiers include a pH (NKC1) and base saturation (pH 8.2) criteria for recognising the "a" and new "1" (low soil acidity) modifiers. Two new subordinate modifiers
279

denoted as '<am and *m » describing soil acidity associated managanese toxicity and deficiency, respectively, completes the list. Lastly, the «rlgi-M l "h" modifier (acid) which corresponds to optimum acidity for these soils has been omitted.
Literature cited. (1) Miller, L. 1966. Coffee nutrition, p. 685-776. In: N.F. Childers
(ed), Temperate to Tropical Fruit Nutrition. Horticultural Publications. Rutgers - The State University. New Jersey
(2) Sanchez, P. A.f W. Cuoto and S. W. Buol. 1982. The fertility capability soil classification system: Interpretation, applicability and modification. Geoderma 27: 283-309.
(3) Smith, C. W. 1989. The fertility capability classification system -3rd approximation: A technical soil classification system relating pedon characterization data to inherent fertility characteristics. pH.D. Thesis, N. C. State Univ., Raleigh.
(4) Smith, C. W., S. W. Buol and P. A. Sanchez. 1989. Utilization of the fertility capability classification system, p. 128-131. In'.Tropsoils Tech. Rept., 1986-1987. N. C. State Univ., Raleigh.
280

THE LANGUAGE OF SOIL MAPS
L.A. van Sleen. International Institute for Aerospace Survey and Earth Sciences, Enschede, The Netherlands.
Introduction. The main purpose of a soil map is to store and to communicate its spatially referenced information. The soil legend is the key to interpreting the soil map. However, depending on how and on what base or background the soil boundaries are drawn, more or less information can be obtained directly from the soil map. Therefore, the configuration of soil boundaries (and units) and all other topographic symbols shown, are forming a map language between the author and the user. The power of expression of these lines (and units) may be strengthened by distinguishing boundaries resulting from erosion and those resulting from deposition and also by giving emphasis on typical boundary-combinations and boundary junctions. Such line enhancements could be called the soil boundary punctuation marks. Obviously the most communicative soil maps are those where the interpreted photographic aerospace images are also used as a base for the final map. Any experienced map user can use such a map for reinterpretation and thus judge and evaluate its correctness and accuracy as well. But such maps are expensive and in case of photomosaics as a base they will have all sorts of system related scale variation and relief distortions. Therefore the next best solution will be the supeiporition of the soil boundaries (or image interpretation lines) on a topographic map. Such a base presents among others, relief and drainage patterns, land cover or parcelling etc. which are often relevant for soil map interpretation and also other (often cultural) features, like villages and roads useful for orientation. Fortunately in many countries, soil maps are produced in this way. Three aspects are then very important to be clearly communicated to the cartographic draughtsman in charge of the final drawing of the soil map: 1. clear discrimination of the soil boundaries from all other lines on the map by increasing its
thickness. 2. accurate location of the soil boundaries and in such a way that they logically fit within the
topographic base information. 3. use of the above mentioned boundary punctuation marks, providing on themselves important
clues for map interpretation.
This last aspect is the more so of importance when the map has to be drawn on a blank base. In that case it may be also advisable to add some suitable symbols for relevant topographic information to the soil map, such as hill-crests and drainage patterns etc. as well as roads showing access and facilitating orientation. This all of course requires a proper dialogue between the map maker (soil scientist) and the cartographer who will have his contribution to graphic design and to solve the representational problems involved. Soil maps drawn a blank paper and without making use of boundary prunctuation marks and additional information derived from the imagery used for visual interpretation, will be hard to evaluate and hardly convincing.
Materials and Methods. Relevance of the above mentioned methods and aspects of soil map production for communication and interpretation will be demonstrated by means of soil maps of areas surveyed by the author. They will include the rift valley in Ethiopia, a humid tropical area in Thailand or Sri Lanka and an arid area in Mauretania or Mali.
281

Existing soil maps drawn on blank paper, on a topographic base and on an aerospace images, will be shown for each area. All without an explanatory legend.
Each map of the same area will have the same units each with a number. Below these maps the unit numbers are listed followed by questions concerning the prevailing pedogeomorphic process, type of landscape or landform, predominant factors of soil formation and about the possible predictability of certain soil properties or condition of the units concerned.
Results and Discussion. The possibility to answer the questions for each map, indicate that the interpretability and readability of soil maps increases with increasing additional surface information. Especially relief is an important attribute to soil formation and thus also for map interpretability. Drainage pattern and drainage condition are likewise important clues for soil map communication and convincibility. Therefore soils maps should preferably be drawn on a topographic base. If such is not available, the use of additional topographic information as well as of so-called boundary punctuation marks is to be strongly recommended. Such additional information may be derived from the imagery used for interpretation.
References Coulson, M.R.C. and E.A. Eliehoj. 1993. Soil Map Legends as tools of cartographic
communication, Catena, Vol. 20, pp 257-271, Catena Verlag, Cremlingen, Germany. Farshad, A. 1989. Cartography for Soil Surveyors, ITC Lecture notes SOL34, Enschede, The
Netherlands. Keats, J.S. 1989. Cartographic Design and Production, Longman - John Wiley & Sons, Inc., New
York. Sleen, L.A. van. 1989. Physiography and Soils of the Haykoch & Butajira and Yerer &
Kereyu awrajas (Shewa), Field doc. 37, FAO-LUPRD, Addis Ababa, Ethiopia. Sleen, L.A. van. 1984. Analysis of MSS Landsat Data for Small-Scale Soil Surveys in the humid
Tropics, ERIM, Proc. Eighteenth Intern. Symposium on Remote Sensing of Environment, Paris, France.
Zinck, J.A. 1988/89. Physiography and Soils, ITC lecture notes SOL41, Enschede, The Netherlands.
282

Photo-interpretation Key for Peasant Land Cartography J. F. Martinez M. Regional Center for Arid and Semiarid Land Studies, Colegio de Postgraduados, 78600 Salinas, San Luis Potosi, México.
Introduction. The agriculturists have knowledge very important from their farm, for example they know its differentiation, appropriate use, problems and improvement. However, this knowledge is not understand it and as consequence it is not considered in governmental politics, in investigation, in technic advising, etc. For this motive it is necessary to rescue and to divulge this knowledge to the regional level. For the first case the appropriate method already exists (Ortiz et al., 1991) and for its diffusion to regional level it is a useful technic necessary for land cartography with peasant approach. In this point the aerial photograph has been utilized with satisfactory results (Licona et al., 1990 and Licona, 1991), but it is necessary much research to respect yet. For this reason the goal in this study was to generate a photo-interpretation key, PIK, for peasant land cartography to regional level.
Materials and Methods. The study area is located in Ahualulco and Mexquitic de Carmona Municipality, San Luis Potosi State. With 22° 16' 37'' - 22° 34' of Latitude north and 101° - 101° 20' of Longitude west of cartesian coordinates. The method consisted in to locate four pilot areas for detecting all variability with respect to soils, vegetation, etc. Then the cartography was done in the four places in accordance with Ortiz et al., (1991). It was generated a photo-interpretation key for each land type. This photo-interpretation key was used to map all the study zone using scale 1:25 000 aerial photograph.
Results and Discussion. The producers in the four pilot places know eight land classes "arenosa", "de cuerpo", "enlamada", "salina", "jaboncillo", "delgada", "polvosa" and "calichuda". They differentiate the lands with base to texture, color, porosity, depth, etc. The typic photographic traits ( PT) was associated with geology, parceling, photographic tone and texture, etc. With the photographic traits it was generated the photo-interpretation key for six land types "arenosa", "de cuerpo", "enlamada", "salina", "polvosa" and "calichuda". For "delgada" and "jaboncillo" lands, PIK were not generated because the first no presented typic photographic traits and the surface of the second was not sufficient for photo-interpretation.
With the photo-interpretation key all the study zone was surveyed. Because the improvement of the land with manure the
283

salinity problem was minimized and more sites of "salina" land were not founded. At the moment of the extrapolation there was problem with the "enlamada" and 'arenosa" lands, these cartographic units presented likeness photographic traits, and it was not attained to detect dams in gullies, distinctive characteristic for the "enlamada" land. These dams in gullies were hidden for vegetation or these were situated outside of the surface covered for the photographs. As consequence, some places were mapped in the office work as "arenosa" lands when these really were "enlamada" lands. For this reason the non parametric statistic test (Ji-square and Ó = 0.01) showed that the occurrence probability of at least one land class varied in significative form after field verification.
Because the confusion between "enlamada" and "arenosa" lands, the cartography accuracy obtained in office only was of 60 %, and after field checking the accuracy ascended to 98 %. The results obtained were lower in comparison with those gotten by Licona et al., (1990) and Licona (1991), whose exactness was of 80 and 86 % respectively.
For subsequent jobs in areas with similar lands like those in this study it is recommendable to consider as "enlamada" land the surfaces where confusion with "arenosa" land exists.
It was concluded that the photo-interpretation key obtained in pilot areas is of great utility on making surveys at the region level in agreement to the peasant knowledge. And the generated map is of very much aid to divulge the rescued information with the method proposed by Ortiz and collaborators (1991).
Literature cited
Licona V.A.; Carlos A. O.S. y David P.H. 1990. El uso de la fotointerpretación en la cartografia de tierras campesinas CEDAF-CP, Montecillo, México. Escrito mimeografiado.
Licona V.A. 1991. Metodologia para el levantamiento de tierras campesinas a nivel regional y la técnica de producción agricola en Ejidos del Centro de Veracruz, México. Tesis de Maestria, CEDAF-CP, México.
Ortiz S.C.A., David P.H. y Victor O. Ch. 1991. Manual para la cartografia de tierras campesinas. Cuadernos de Edafologia No 15, CEDAF-CP, México.
284

PRELIMINARY EVALUATION OF AVHRR DATA FOR DELINEATING REGIONAL SOIL PATTERNS
C. A. Vettorazzi (1), I. Bayramin (2), and M. F. Baumgardner (3). University of Sao Paulo (USP/ESALQ), Piracicaba, SP, Brazil (I), University of Ankara, Ankara, Turkey (2), and Purdue University, West Lafayette, IN, USA (3).
INTRODUCTION. The FAO/Unesco World Soil Map, at a scale 1:5M, has made a valuable contribution, especially in developing countries, in providing the best inventory of soils available to them. However, in this era of global change concerns and increasing pressure on soil resources of the world, there is critical need for a more accurate and detailed soils and terrain map of the world (1). Satellite images from land-oriented systems, such as Landsat and Spot, have proved to be efficient in soil mapping at small scales, but their high costs have lead to a search of new sources of data for such surveys. In this work, data from the NOAA-10 Advanced Very High Resolution Radiometer (AVHRR) were evaluated regarding their usefulness in soil mapping on a regional scale.
MATERIALS AND METHODS. Data from the NOAA-10 AVHRR obtained over the State of Indiana, U.S.A., for the 1987 and 1988 growing seasons were selected for this study. The 1987 growing season was one of the best on record in Indiana, whereas 1988 was a year of extreme drought conditions (3). The hypothesis of this work is that the images from 1988 can be more useful in soil mapping than those from 1987, since the drought conditions affect differently crops in different soils. The bands used were the two optical bands of the sensor, i.e., 1 (0.58-0.68um) and 2 (0.72-1.10 um). One additional band ( 3 ) was produced through the Normalized Difference Vegetation Index (NDVI) transformation, and used in the creation of RGB (red, green, blue) color composites. For each year studied, images from three different dates were selected: April, July, and September, respectively the beginning, middle,and end of the growing season. Two color composites (RGB) were generated for each date: one 2/1/1 (that is, band 2 assigned to red, band 1 to green, band 1 to blue) and one 3/1/2. These two band combinations were chosen through a previous visual analysis of the several possible combinations. After a histogram equalization, the twelve images (2 for each date, for each year) were visually compared to a soil associations map and a soil regions map of Indiana (2, 4). According to the capability in showing differences among soil regions or soil associations, one image out of the set was selected and the next step of the work was a digital unsupervised classification using that image. The result of this classification was compared to the soil maps ( associations and regions) of Indiana. All the visual evaluations were performed by three people.
285

RESULTS AND DISCUSSION. The results of the first comparison, between the band combinations 2/1/1/ and 3/1/2, among the three different dates for the two years, showed that in all cases the best band combination was the 2/1/1. This result was unexpected, because the combination with band 3 (NDVI) was expected to improve the results, by the sensitivity of the NDVI image to phytomass on the ground. The second evaluation was performed for each band combination, through the comparison among the three different dates for the two years. For the two band combinations the results were the same: the images of April and July were considered better for 1988 than for 1987. For September, the images from 1987 were considered better than those for 1988. Images from April and July (1988) were considered the two best ones for this study. If only one date were chosen, the choice would be April. Of the images considered it is concluded that the image from April 1988 was the best one for identifying soil regions in Indiana, followed very closely by July 1988, both images in the band combination 2/1/1. The result of the unsupervised classification was not as good as the color composite in showing differences among the soil regions. This is understandable due to the complexity of the scene in relation to land use/land cover. This is a preliminary evaluation of AVHRR data for delineating regional soil patterns. It is part of a long-term project. A better understanding and improvement of these results are expected as the project proceeds.
LITERATURE CITED. (1) BAUMGARDNER, M. F. 1993. Biennial Report of ISSS to CODATA. Bulletin of
the International Society of Soil Science, No.82/83, p.80-83.
(2) FRANZMEIER, D. P.; J. E. YAHNER; G. C. STEINHARDT; D. G. SCHULZE. 1989. Understanding and Judging Indiana Soils. Purdue University Cooperative Extension Service, West Lafayette, Indiana. I.D.-72, 71p.
(3) LOZANO-GARCIA, D. F.; R N. FERNANDEZ; C. J. JOHANNSEN. 1991. Assessment of Regional Biomass-Soil Relationships Using Vegetation Indexes. IEEE Transactions on Geoscience and Remote Sensing, 29(2):331-339.
(4) USDA/SCS-PURDUE UNIVERSITY. 1982. Map of the Soil Associations of Indiana. U.S. Dept. Agriculture/ Soil Conservation Service and Purdue University Agricultural Experiment Station, Rep. AY-209.
286

Applications of Remote Sensing in Soil Science: Soil-Lithology-Relief relationship in Central Western
Spain F. Santos Frances. Area de Edafologia, Facultad de Farmacia, Universidad de
Salamanca. Avda. campo Charro sin, 37007, Salamanca (Spain)
Introduction.The profile of a soil cannot be appreciated in aerial photographs nor in remote sensing images; with these techniques is it only possible to obtain information about the surface horizon.
All soil classifications (Soil Taxonomy, FAO, etc.) are principally based on the internal or subsurface horizons (argillic, cambic, calcic, spodic, etc.) and, in this way, soils are classified as Alfisols-Luvisols, Inceptisols-Cambisols, Spodosols-Podzols, etc.
Accordingly, the methodology that should be used in cartographic or regional studies of soils should be based on the differentiation of physiographic units or homogeneous landscapes with respect to the main parameters of the physical medium (geology, relief, age of surfaces, vegetation, etc.) since the lines limiting different landscape units are usually lines of separation among different cartographic soil units.
Fortunately, the limits of separation among different soils tend to coincide with the geographic Units imposed by one or more formation factors (rock, relief, age of surfaces, etc.). The soil scientist must make efforts to describe the relationships among soil, lithology and relief with a view to improving mapping precision since a given cartographic unit or association of soils generally corresponds to each physiographic unit.
Soil science studies using digital images (remote sensing) complement the information obtained by the interpretation of aerial photographs (1 and 2).
The following step to be carried out to complete a regional soil study is to compile an inventory of the soils of each physiographic unit delimited, together with a description of profiles, sample collection and laboratory analysis.
Materials and Methods. From a geological point of view, the central-western zone of Spain belongs to two very different structural units of the Iberian Peninsula: the Central Iberian Zone of the Hesperian Massif and the Duero basin (3). The basement ( Central Iberian Zone) is formed of slates, schists, granites and quartzites of Precambrian-Cambrian-Ordovician age that were intensely folded during the hercynian orogeny and that have given rise to a more or less scarped relief. The Duero basin is a large cenozoic depression formed by the sinking of the hercynian basement, during alpine folding, and filled during the Tertiary by sediments of continental origin, mainly detritic in character (conglomerates, sandstones and clays) and arranged horizontally to give a relief that is flat or slightly undulated (tabular). Over these rocks (dated as belonging to the Paleocene and Miocene) the river course has become emplaced and has developed a series of stepped terraces and recent alluvial deposits, of Quaternary age, formed of gravels and sands.
In the present work, several scenes of 512 x 512 pixels, were chosen as the most representative of the different lithologies, reliefs and soils present in Central Western Spain. The following processes were performed on each of the images: contrast enhancement and improvement of the images belonging to bands 1, 2, 3, 4, 5 and 7 of the Themic Mapper sensor, visual analysis by different combinations of bands, arithmetic operations among channels (subtraction, division, etc), unsupervised and supervised classification (using the maximum probability algorithm) and principal component analysis.
The information was completed with that obtained by photointerpretation, geological maps, field work and laboratory analysis of samples following the experimental techniques of the Soil Conservation Service (4). The soils were classified according to the taxonomies of the FAO (5) and Soil Taxonomy (6).
287

Results and Discussion. The study was conducted in three very different stages: 1) Scarped relief over quartzites, slates and granites (Sierra de Francia). 2) Undulated relief over granites and slates (Zamora-Salamanca peniplain) 3) Flat relief over rocks of Tertiary-Quaternary age (Duero basin). The relationship among the soils, lithology and relief is expressed graphically with the aid of
aerial photographs; different combinations of bands from Landsat-5, in false colour; classified images and geological sections with schemes of soil profiles and a summary table in which the physiographic units, the lithology, the slopes, dominant soils and the colour assigned to the image classified are indicated.
On the scarped relief (Sierra de Francia), resting on quartzites, slates and granites there is a predominance of Litic-distric Leptosols (Litic and Distric Xerorthents), Umbric Leptosols and Humic Cambisols (Typic Xerumbrepts).
On the Zamora-Salamanca peniplain, formed over a granite substrate, there is a predominance of Litic-distric Leptosols (Litic and Distric Xerorthents) and Distric Cambisols (Distric Xerochrepts). In areas where the peniplain has developed over slates there is an association of soils formed by Regosols, Leptosols and Eutric Cambisols (Typic Xerorthents and Xerochrepts).
The flat (tabular) relief developed over rocks of Tertiary and Quaternary age is formed of a large variety of geological materials (sandstones, marls, clays, sands and conglomerates)arranged in horizontal strata and forming geomorphological surfaces of different ages. Because of this the soils of this sector display greater morphological variety: Chromic and Calcic Luvisols (Calcic, Typic and Vertic Palexeralfs, Calcic and Typic Rhodoxeralfs and Ultic, Typic and Vertic Haploxeralfs), Eutric Cambisols (Typic Xerorthents), Eutric and Calcaric Regosols (Typic Xerochrepts and Litic-xeric Torriorthents), Calcic Vertisols (Entic Chromoxererts) and Distric, Eutric and Calcaric Fluvisols (Typic Xeroflu vents).
The combinations of bands (false colour) that proved to be the most useful in this study were as follows: (3, 2, 1), (4, 3, 2) and (5,4,3), visualized in red, green and blue, respectively.
Principal component analysis was conducted on each of the sectors studied; the correlation matrices, eigenvalues and the percentage of variance explained and charge matrix are shown.
The spectral signature of the different physiographic units that were considered in the supervised classifications was calculated.
In order to check the discriminatory power of each channel of the remote sensor and the separatability among the different physiographic units, the Fisher distance matrices were studied.
Additionally, the matrices of confusion among the classified images were compiled together with those corresponding to terrain reality ("mask image"). It was seen that the greatest confusion was generally caused by the plant covering of the soil.
The results obtained indicate that remote sensing techniques are of great value for soil scientists in the recognition, interpretation and classification of homogeneous cartographic units of soils and for checking the relationships among soils, rocks and relief.
Literature cited. (1) Bordds V. (1993). Caracterización y cartograffa de sectores y unidades ambientales discriminadas a partir de information del sensor (TM) del Landsat-5 en la comarca del Valle de Ayora-Cofrentes. In: 'Teledetección y Medio Ambiente". Edit. J.M. Moreira (AMA). 134-139. (2) Chuvieco E (1990). Fundamentos de Teledetección espacial. Edit. Rialp. 453 pp. (3) Julivert, M.; Fontboté, J. M; Riveiro, A. y CONDE, L. (1974). Mapa tectónico de la Penfnsula Ibérica y Baleares y Memoria explicativa. Serv. Publ. Ministerio de Industria. I. G. M. E. Madrid. (4) Soil Conservation Service. (1972). Soil survey laboratory methods and procedures for collecting soil samples. USDA. Washington. (5) FAO (1988). Soil map of the world. Revised legend. World Soil Resources. Report 60, FAO. Roma. (6) Soil Survey Staff. (1975). Soil Taxonomy: a basic system of soil classification for making and interpreting soil surveys. Agriculture Handbook No. 436. U. S. Government Printing Office, Washington.
288

Multivariate Prediction of Values of Soil Properties at Unsampled Sites by Means of Matrix Cokriging
L. Range) Facultad de Agronomic*, UCLA, Barquisimeto, J .A. VILORIA, and A. GARCIA, Facultad de Agronomia, UCV, Maracay, Venezuela.
INTRODUCTION. Since data sets generated by soil surveys are usually multivariate, the prediction of values of soil properties at unsampled points could be improved considering not only the spatial covanance between sampled values of the same variable, but also the multivariate relationship between variables. Up to now, two different approaches had been followed in the development of the multivariate geostatistic field. One is the multivariate extension of the coregionalized linear model of Journel and Huijbregts (1978). The other, called here matrix cokriging, entails a matrix extension of kriging and the estimation of the cross-covariograms or cross-semivanograms by sums of variables (Myers, 1982). The second approach seems to be easier to execute than the first, for it does not require a knowledge of the additive components of the coregionalized linear model. Moreover, the use of the coregionalization information could, theoretically, improve the quality of predictions compared with ordinary kriging or cokriging. This work explores the use of matrix cokriging to yield multivariate predictions of soil properties, comparing the quality of its predictions with those of ordinary kriging.
THEORY. Matrix cokriging supposes a multivariate regionalized vector Z(xi), at the sample point xi. Such a vector is formed by a set of regionalized variables which are second-order stationary. The kriging matrix, is formed by submatrices containing the direct semivariograms in the main diagonal, and the cross-semivariograms out of the diagonal. When the cross-semivariograms are zero, the method is equivalent to ordinary kriging (Myers, 1982).
MATERIALS AND METHODS. Three sets of simulated data and one set of actual data were employed. The simulated data consisted of linear additive combinations of independent spherical simulations obtained by the turning band method (Journel and Huijgregts, 1978). The weights of the independent simulations were adjusted to generate the following data sets:
Completely independent data: all components different, Partially independent data: some components in common and some different, and Completely coregionalized data: all components in common.
The set of actual data consisted of values of percent of sand, and organic carbon recorded at a 100 m grid in the Tucutunemo Valley, Aragua State, Venezuela. The matrix calculation were realized by means of the IML/SAS version 6.04 in a PC IBM compatible. Semivariogram models were fitted through non-linear weighted least squares, using the NLIN procedure (Marquardt method) of SAS. The condition number, k(A) was computed as the ratio between the higher and the lower eigenvalues of the kriging matrix (O'Dowd, 1991), for each prediction. The quality of prediction was measured by the following parameters: The Mean Prediction Error, MPE= (l/n)Z[Z8(x)-z(x)], as a measure of bias. The Mean Quadratic Error, MQE= (1/n) Tr{[Z*(x)-z(x)]' [Z*(x)-z(x)], as a measure of efficiency, and The Variance Quotient, VQ= MQE/theoretical prediction variance, as a measure of the deviations from the expected efficiency of the prediction (Seo et al, 1990)
289

RESULTS AND DISCUSSION. The results (Table 1) show that matrix cokriging does not improve the quality of predictions of ordinary kriging. On the contrary, the prediction error of matrix cokriging is considerably higher than that of ordinary kriging for the coregionalized data.
T a b l e I t R a t i o be tween t h e p r e d i c t i o n e r r o r s of m a t r i x c o k r i g i n g and o r d i n a r y k r i g i n g , r e s p e c t i v e l y .
DATA MPË MQË VQ k(A)
1.00 1.87 2 . 6 4 4 3 9 . 1 7
3 4 . 6 7 9 4 4 . 4 3 1.16 4 5 . 0 6
The results also show a high association between the condition number k(A) and the prediction quality The higher the ratio between the condition number of the matrix of cokriging and the one of ordinary kriging, the worse the performance of matrix cokriging. This reveals that the use of matrix cokriging in presence of a high coregionalization yields matrices which are ill-conditioned, producing instability of the predictions. The ill-conditioning does not occur in ordinary kriging because the matrix is diagonal. Thus, the advantages of using the additional information from coregionalization are invalidated by the ill-conditioning of the matrix cokriging. It is concluded that the application of matrix cokriging does not seem to be an adequate alternative for the interpolation of values of soil properties, in presence of a high coregionalization that could follow a linear additive process.
LITERATURE CITED.
JOURNEL, AG. and HUIJBREGTS, C.J. 1978. Mining Geostatistics. Academic Press, London.
MYERS, DE. 1982. Matrix formulation of cokriging. Math. Geol. 14:249-257.
O'DOWD, R.J. 1991 Conditioning of coefficient matrices of ordinary kriging. Math. Geol. 23:721-739.
SEO, D. KRAJEWSKY, W.F AZIMI-ZONOOZ, A and BOWLES, D.S. 1990. Stochastic interpolation of rain gages and radar using cokriging. 2. Results. Water Resources Research 26:915-924.
F u l l y I n d e p e n d e n t 0 . 9 9 1.00 P a r t i a l l y C o r e g i o n a l i z e d 1.21 2 . 4 2 F u l l y C o r e g i o n a l i z e d 6 .55 3 5 . 4 7 Tucutunemo V a l l e y 1 .01 1 .16
290

Soils under Indigenous Agroforestry in the Amazon Estuary
A. M. G. A. WinklerPrins. Department of Geography, University of Wisconsin-Madison, Madison, WI 53706, USA.
Introduction There are few small-scale studies of soils in the Amazon Basin, especially of .floodplain (vdrzea) soils. Such soils are usually overgeneralized and assumed to be homogeneously fertile, but more in-depth soil investigations are demonstrating that soils in the Amazon basin are actually very diverse (1). This diversity is a function of the multitude of local conditions and the extensive anthropogenic manipulation of the soil. This study investigated soils under indigenous agroforestry along a tributary to the Rio Para (southern estuary of the Amazon River), describing a low fertility floodplain soil and how local people have found productive use of such a limiting environment.
Material and Methods. The study region is heavily influenced by freshwater tides. Twice daily tides flood the floodplain forest leaving only about 10% of the region unflooded at some time during the year. Tides are strongest and highest during full and new moons, the rainy season, and during the flood stage of the Amazon as a whole (June).
The climate of the region is classified as Am (tropical monsoon in the Koppen system), the dry season coming from May to November, the wet season from December through April. Vegetation of the region is dominated by species which tolerate high water conditions such as Euterpe oleracea and Mauritia flexuosa palms. Species composition has been affected by centuries of forest management by local inhabitants, which continues to this day. The flat relief of the area is broken by tree-induced microtopography. Sediment and organic material accumulates around aerial roots of trees and persists over time, becoming small islands in the flooded forest. The parent material of these soils is silty alluvium derived from a mixture of sediments from all up-river sources. Nutrient rich Andean sediments are diluted with sediments from other tributaries, especially the Rio Tocantins, a nutrient poor river deriving its sediments from the Brazilian shield which joins the Rio Para less than 50 km upstream from the study site. These materials are in constant flux, different temporal and spatial flood pulses contributing to the continual deposition and erosion of sediments in this area, yielding a minimally developed soil.
A detailed soil survey was conducted of a 10 ha plot under agroforestry along the Rio Maracapucu-Miri, a tributary to the Rio Para in the Ilhas de Abaetetuba, Para, Brazil during January and February 1992. From 16 sampled cores (augured) I selected 3 that represent the high, low and intermediate positions on the landscape. The soils were described in situ and analyzed in the laboratory for pH, particle size, organic carbon, and CEC. The clay mineralogy was examined using X-ray diffraction.
291

Results and Discussion. Although there are depth differences due to location on the landscape, the three sampled soils show similar horizonation. A thin to moderate A horizon overlies a mottled horizon (C) followed by gleyed horizons (Cg) and underlain by a buried peat (Oeb). The mottled zone reflects small daily and larger seasonal fluctuations of the top of the water table. The gleyzation of this part of the soil is very strong, oxidizing rapidly upon exposure to air, reflecting the continually saturated conditions of the lower horizons.
Soil textures range from clay to silty clay loams, as well as hemic material making up the buried peat. The CEC and pH values of the mineral soil are relatively low, 8-31 meq and 3.9-5.9 respectively, a reflection of the low nutrient composition of the parent material and the anaerobic conditions which prevail in this flooded forest. The clay mineralogy of the soil consists primarily of kaolinite, with some illite. This is suggestive of the highly weathered Brazilian shield from which the soil derives most of its parent material. Organic carbon values (LOI) range from 5.47% to 1.05% in the mineral soil, and 12.15% to 35.64% in the buried peat. Given the morphology and chemical analysis of the soil, it has been classified as a Thapto-Histic Tropic Fluvaquent using the United States Department of Agriculture's Soil Taxonomy.
Despite statements declaring floodplain soils in the Amazon Basin as the most fertile and with the highest agricultural potential (2, 3), soils at this site reflect low nutritive status. Studies in the Upper Amazon have shown great discrepancies in nutritive status of floodplains depending on source material (4), and this study supports those findings. Therefore broad generalizations regarding the fertility of the Amazon floodplain should be considered cautiously because many types of floodplains exist, especially on a local scale. Of course the severe hydromorphic conditions of the soil also limit agricultural production, but large drainage schemes have been proposed to remove the excess moisture and to capitalize on the assumed 'fertility' of the underlying soil (3).
Despite the poor soils and waterlogged conditions, local inhabitants have devised a system of land use that allows for the use of this difficult environmental setting. Their economic activities are based on the extraction of products from agroforests. Both the vegetation and soils are actively managed by the deliberate sparing and planting of desired species, the weeding of undesired species, mulching, favorable use of the microtopographic conditions, and the creation of soil from forest-derived organic material and household compost. This has yielded a forest in which almost all species have some form of economic or subsistence utility. The active management of the soil reflects non-static nature of soils as a component of the environment and indicates that people are important positive factors of soil formation. Local people are aware of soil limitations but do not simply react to those limitations, instead they actively change them, reflecting a dialectic between people and their environment.
Literature Cited (1) Sombroek, W. 1984. Soils of the Amazon Region. In The Amazon, ed. H. Sioli, 521-535. Dordrecht: W. Junk Publishers. (2) Junk, W.J. 1984. Ecology of the vdrzea, floodplain of the Amazonia white-water rivers. In The Amazon, ed. H. Sioli, 215-243. Dordrecht: W. Junk Publishers. (3) Lima, R.R. 1956. A Agricultura nas Varzeas do Estuario do Amazonas. IAN Boletim Tecnico 33:1-64. (4) Hoag, R.E. 1987. Characterization of Soils on Floodplains of Tributaries Flowing into the Amazon River in Peru. Unpublished Ph.D. Dissertation, North Carolina State University.
292

Commission V: Extended Summaries. Friday, July 15
Symposium ID-21. Representing Soil Spatial Variability in GIS for Resource Assessment and Environmental Monitoring.
Page Soil information system (FISBo BGR) and a new soil map 1:1,000,000 for soil protection in Germany. W. Eckelmann, G. Adler, J. Behrens, R. Hartwich, and W. Stolz. (Germany) 295
Conception of soil spatial organization model and soil functioning unit in G.I.S. for land use and conservation. J. Chretien, D. King, M. Jamagne, and R. Hardy. (France). . . . 296
A multipurpose soil information system for integrated land use management. R. Rasio. (Italy) 298
Theory of topographical variables and its applications in soil science. P.A Shary. (Russia) 300
Kriging electrical conductivity determinations for detailed study of soil thickness variability. A case study using GIS tools in Beauce area (France). P. Chery, M. Dabas, A. Bruand, and D. Arrouays. (France) 302
Spatial variability of soil humidity in edge areas of Galicia (NW Spain). A. Castelao, M.A. Gonzalez, and X. Neira. (Spain) 304
Taxonomy and spatial variability of Mollisols with petrocalcic horizon and udic soil moisture regimen. M.S. Pazos and M. Fittipaldi. (Argentina) 306
Spatial variability of fertilizer nitrogeno distribution in lateritic soil under rainfed rice and irrigated wheat. S.K. Sharma and S. Kar. (India) 308
Variographic an exploratory study of salinity and fertilit" levels of a feozem soil. A. Jimenez, M.C. Olmedo B., R. Zulbardn, and L.J. Cajuste. (Mexico) 310
Soil survey based on sampling scheme adjusted to local heterogeneity. M. Kertész, and T. Tóth. (Hungary) 312
Using soil heterogeneity to improve selection efficiency. M.A. Bell, H.R. Lafitte, and J. Corbett. (Mexico) 314
Choosing theoretical semivariogram for soil water content. R.D. Valdez-Cepeda, J.D. López-Martinez, and E. Martinez-Rubin. (Mexico) 316
Good perspectives in crop research on highly variable soils. W. Gandoy B. (Mexico). . . . 318
Spatial distribution of loamy soils related to the topography in a smooth relief region. D. King, H. Bourennane, J. Daroussin, and M. Isambert. (France) 320
Soil assessment proceedings using a geographical information system for ecological planning. U. Schleub, E.-W. Reiche, U. Heinrich, D. Scholle, and R. Zólitz-Moller. (Germany) 322
293

GIS application in the delimitation and description of land units in La Malintzin, Tlaxcala. /. Dominguez, C. Olivares, S. Avelar. (México) 324
Applying GIS for use planning and conservation of the esteppe landscapes in Central Ebro Valley (NE Spain). A. Navas, and J. Machin. (Spain) 326
Influence of terrain on temporal/spatial variability of ground water in semi-arid areas. G. Saved K., and M. Ikram. (Pakistan) 327
Evaluation of soil buffer capacities using geostatistical techniques and GIS in an area under wastewater irrigation in Mexico. J.L. Palacio-Prieto, Ch. Siebe, and L. Luna Dominguez. (Mexico) 329
Description of Tabasco, Mexico soils, using geographic information systems. A. Bravo, G. Medina G., R. Martinez P., and V. Gonzalez. (Mexico) 331
Analyse spatialisée des potentialités agricoles de la RH36. Ch. Bouvier, et J. Estrada A. (Mexico) 333
Assessment of ground water pollution using a geographic information system. J.M. Hamlett, G.W. Petersen, S. Harrison, G.M. Baumer, L.A. Deichert, S.R. Messier and M.C. Anderson. (USA) 335
Micro-soil survey of the El Verde liter-hurricane recovery grid Commonwealth of Puerto Rico. H.R. Mont, W.C. Lynn, R.L. Wick. (Puerto Rico) 337
Geographical information system approach to environmental modeling of small rural catchements. R. Moussa, P. Andrieux, M. Voltz, R. Bouzigues, and P. Lagacherie. (France). 339
Land resource information system and its application to classifly and importance in Taiwan. C. Lin, Y.W. Lin, T.H. Tsai, and T.S. Liu. (Taiwan) 341
Land degradation assessment in a GIS and evaluation of remote sensing data integration. D.P. Shrestha. (The Netherlands) 343
Data integration of soil survey with geological and geomorphological information by means of TM - Landsat image for environmental analysis in Marumbi Park in Parana - Brazil. H.O. da Rocha, N.L.. Ghani, D. Schmidlin, M.R. Nanni and CH. Rocha. (Brazil) 345
Uses of ground-penetrating radar in soil investigations. J.A. Doolittle. (USA) 347
The representation of soil moisture variability using variograms with data derived from an airborne thematic mapper (ATM). D.A. Davidson and A.I. Watson. (UK) 348
294

Soil information system (FISBo BGR) and a new soil map 1:1,000,000 for soil protection in Germany
W. Eckelmann *, G. Adler, J. Behrens, R. Hartwich, W. Stolz Federal Institute for Geosciences and Natural Resources, Stilleweg 2,D- 306SS Hannover, Germany Soil Information Sytem. The Federal Institute for Geosciences and Natural Resources has started to establish a soil information system (FISBo BGR). This information system is intended to contain all data relevant to soil protection. It will then be possible to recall and interpret the data according to scientific or regional criteria. Additionally, methods and criteria shall be developed for the recognition and assessment of soil contamination.
FISBo BGR consists of the following components:
- an areal data bank containing all small-scale soil maps produced by or in cooperation with the geological surveys of the Lander, to be used e.g. as an extensive data set to create thematic maps,
- a laboratory data bank containing the results of analysis of soils, i.e. basic chemical and physical data (soil properties), as well as inorganic and organic contaminants,
- a method bank to document and select standardized methods, e.g. for the derivation of the filtering capacity, the groundwater recharge or the soil productivity from soil maps and the relevant basic pedological data.
Soil Map 1:1,000,000. As a first result of working with the soil information system a new soil map on the scale of 1:1,000,000 for Germany has been created. It is the basis for all future works on soil protection. For cooperations with other countries a second version using the FAO-nomenclature has been established beside the version with German nomenclature. The basis for thematic maps is a laboratory data base which has been established with all chemical and physical data for all units of the soil map.
Technical Cooperation with Developing Countries. The structure of this soil information system can be used for technical cooperation with developing countries. At present the required key and parameter lists for geographic information systems (GIS) are established and tested on technical cooperation projects as the one in Parguay.
Literature Cited.
ECKELMANN, W. & G. H. ADLER (1994): Soil Information System. The digital information system for soil protection in Germany (FISBo BGR). - Quaterly Bull. Int. Agric. Information Specialists; (in porgress).
HARTWICH, R. & J. BEHRENS et al. (1993): Das Fachinformationssystem Bodenkunde der BGR. IV. Bodenübersichtskarte der Bundesrepublik Deutschland i. M. 1:1,000,000. -Mitt. Dtsch. Bodenkundl. Ges., 72, II; Oldenburg.
295

Conception of Soil Spatial Organization Model and Soil Functioning Unit in G. I. S. for Land Use and Conservation
J. Chretien, D. King, M. Jamagne and R. Hardy. National Institute for Agronomic Research, Orleans, France.
Introduction - Knowledge and use of soils needs to make researches on the management of spatialized pedological informations. The actual way of organizing the collected knowledge is a rational structuration of the different components of the soil cover. We note the emergency of better defined concepts then earlier, based on different typologies : concepts of soil horizons, soil typological units, soil mapping and "functioning units", and finally "pedolandscapes" and "terrain units" (1). Computerization allows now to combine permanent data of the environment with conjonctural ones, leading to a more dynamic data processing, giving so numerous possibilities of modelizations and simulations.
Necessity of more dynamic knowledge of Pedological Landscapes - Important spatialized databases have been elaborated for a long time at national and regional levels. We took first reference to the works made in the framework of the European Soil Geographical Data Base (2). Effectively, the Task Force of the European Environment Agency asks recently for studies dealing with the possibilities to use the existent data base to give answers to soil and environment degradation processes. To be able to answer to those types of questions, an important point to elucidate is the main orientations of the hydric fluxes in the different landscapes units. To do that we need elaboration of "Pedotransfer functions" and "Expert Systems" (3).
Spatial Organization Models and Soil Functioning Units - We can observe that most of models used for describing the pedological information are strictly linked with a traditional cartographic representation. From a general point of view, very few informations are available with conventional soil maps about the geographic organization of the different types of soils, or "Soil Typological Units (STUs) within the soils associations, or "Soil Mapping Units" (SMUs) : only the surface ratio STU/SMU is sometimes given. However, it is known that many SMUs correspond to "soils systems" or pedological ones (4), in which STU distribution is not random but according to pedogenetic laws of varying complexity. So that, the recognized different types of soils are not entities independant one of each others, but their relative geographical position indicates pedogenetic relations in the organization of the soil cover. That organization influences the actual functioning, that means the orientations and importance of fluxes, verticals or laterals, particularly important to know for pollution problems. A methodological research has been made on that theme. It consists to study the possibility to describe the relations between the different soil types of a landscape unit in a so called "Relational" base, including specific attributes concerning the "neighbourhood" relations: -percentage of occupied surface - steps of variation - limits transitions and contrasts -morphogenetic linkages. That leads us to the concepts of "Spatial Organization ModeF' (SOM) and of "Soilfunctioning Unit" (SFU). This is actually proposed through a specific software: DONESOL. It allows to group the STUs into SFUs in order to propose a data model translating the concepts of "sequences" (1) or "pedological systems" (4). We can illustrate that with some concrete cases, one of them appears on the joint figure. This is an example of introduction of a SOM from a pedological loamy landscape (Beauce - France) in a relational data base, the "vector" of the SFU beeing there runoff and erosion.
296

— - Onhic Luvttol
(ZJE K*a**T<C Ml
In the data base, the attributes describing the SMUs, so as those that are common for the STUs belonging to the same SMU, are written in a table. The organization of the STUs within the SMUs would be written in another "relational" table giving for each SMU the list of the STUs described by attributes indicating their type of geographic distribution. So, the attributes of the relationships between STUs within an SFU can be shown.
Conclusions - Before thinking about cartographic representation at a defined scale, a soil surveyor must draw up, on a first step, a semantic representation model of his knowledge. This model should show, as exhaustively as possible, the spatial relat ionships between the various recognized soils. The proposed framework is based on widely used concepts for conventional map making, but other solutions are possible with the help of geostatistics, and/or by introducing geographic data that are not strictly pedological, but are systematically known for a given region, like remote-sensing data or digital elevation models. The relational data model, here presented as Spatial Organization Model, was designed on the basis of an analysis of the EC Soil Map (5). This map is a typical case of a general approach at a small scale, but the method can logically be adapted to other more detailed spatialized databases. Methodological research is thus in progress on the following two main subjects: (i) -improvement of the structuration of geographical soil data bases with a more dynamic orientation, (ii) - elaboration of pedotransfer rules starting from the parameters stored in the data bases and leading to the possibility to give answers to landscapes management and conservation problems, mostly in terms of risks forecasts.
Literature cited (1) JAMAGNE M., KING D., GIRARD M.C. et HARDY R., 1993. Quelques conceptions actuelles sur 1'analyse spatiale en pédologie. Science du Sol. (in press) (2) KING D., DAROUSSIN J. and TAVERNIER R., 1992. Development of a soil geographic database from the soil map of the European Communities. CATENA, (under press). (3) BOUMA J. and VAN LANEN H.A.J., 1986. Transfer functions and threshold values : from soil characteristics to land qualities. In Proceedings of the international workshop on quantified land evaluation procedures. 27/04 - 2/05/1986, Washington D.C. 106-110. (4) BRABANT P., 1989. La cartographie des sols dans les regions tropicales, une procédure a 5 niveaux emboités. Science du Sol, 27 (4), 369-394. (5) EEC, 1985. Soil Map of the European Communities 1:1,000,000. Luxembourg. 124 p.
«X.., ~ ™ .
,.J.j: "ii
zz:
Pwlouinifer Rules
-Selection* £ > - EïtracUons I
- Combi rue out
297

A Multipurpose Soil Information System for Integrated Land Use Management
R. Rasio. Soil Office, ERSAL, 20090 Segrate (MI), Italy.
Introduction. Soil maps and soil interpretations are currently produced in Lombardy (Northern Italy) and soil surveyors have shown their usefullness in land use policy and decision - making. Growing the number of customers of soil data, is increasig the demand of new soil surveys, but also the needing of manipulating the results in different, specific and creative manners. A soil information system appears as the natural evolution of the soil survey program in Lombardy, trying to satisfay the following purposes: to be usefull for customers with different needings concemig soil management and its interaction with other components of ecosystems; to make possible an integration at different scales for different levels of decision - making; to give ideas on variability of soil properties and its importance for effective resources assessment and land use planning.
Materials and Methods. The basic information source of the system is given by soil surveys, and is represented with point observation (profiles, auger - holes) and soil polygons. The soil inventory is strongly connected with the official Regional Topographic Map /RTM/: in this way the system is integrated with the Lombardy Geographic Information System, builded up by Regional Government, and the soil map is the first thematic map available in the network. Soil surveys, RTM, commercial software (ORACLE and ARC - INFO) are the basic tools of the system. Soil database is formed by two related components. In the alphanumeric component we can find point observations, taxonomie units and mapping units descriptions; the cartographic component is made by soil polygons (originally at scale 1:50,000), their topological features, couples of coordinates for each point observation based on RTM reference system. Soil variability is expressed using mapping units and their delineations on the cartographic component; mapping units are identified and named by families of Soil Taxonomy (3) and are mainly consociations. Data analysis was conducted by an interdisciplinary working group, with the cooperation of soil scientists and information technology specialists; this work was supplemented by interviews and experimental training with present and potential users of the system. The main purpose of this work was to make formal the different steps, going from data description and entry to their practical validation and utilization: users are both soil scientists (working on data quality, soil correlation and interpretation, modelling) and peoples implementing soil information in their current job and decisions. The conceptual model used during data analysis is based on Entity/ Relationship /GEOER/ (2), and it is the reference to design the framework of the system.
Results and Discussion. Integration of soil information system in the Regional GIS is designed, in an unambiguous way, by a conceptual framework, structured following GEOER model. The soil layer of GIS is interactive with other layers, and this connection improves reliability of geographical data. Soil mapping units (consociations, associations, complexes and undifferentiated groups) are the most important building block of the framework; miscellaneous areas (urban land, rock outcrop, water) should be consistent with entities of RTM not covered by soils. For each soil mapping unit the system describes important soil properties and landscape features,
298

such as soil depth, drainage, permeability, slope, physiographic position; several relevant properties, such as pH, organic matter content, texture, are stored according to functional horizons and layers (1), typical of each mapping unit in different soil survey areas. Properties of mapping units run on interpretive models, available and updated in the system, generating interpretive maps and tables requested following users' needings. Some users want to know pH distribution for topsoil of their district; some others are interested in soil suitability for sugarbeet: for both the system can give an answer, more or less easy and quick; this answer is anyway strictly connected with RTM and other layers of GIS, so it is interactive with an enormous amount of data, such as population, pollution, roads and water. The pattern of the cartographic display is related to soil mapping units and soil polygons; they are the basic tool for representing spatial soil variability in the system. The mapping units are identified and named using taxa of Soil Taxonomy; the framework describes the relationships among sampling units (pedon), taxonomie units and mapping units. Representative profiles and correlated point observations are the mean to infer, at an expert judgement level (1), the properties related to mapping units and their functional horizons and stored in the system. Since now more than 1500 pedons and 4000 soil polygons have been stored and digitized; four interpretive models are operating in the network. Multipurpose use is shown by different Departments of Regional Government, such as Environment, Public Health, Agriculture, Land; Regional Agencies, such as Forestry; research institutes operating in Lombardy, such as International Centre for Pesticide Safety (4). This use is also integrated, as different users work on soils resources with different perspectives; this integration is active also at different scales of using and needings, being available three different layers describing soil cover (scales 1:50,000; 1:250,000; 1:500,000). This is the first stage in developing a soil information system, to expand among users with increasing of interactive capabilities. The representation of soil variability, as now based on mapping units, is to improve, suggesting sharp, discrete transitions of soil properties; a geostatistical approach is planned for the second stage of system development.
Literature Cited. (1) Bouma, J. 1988. Land qualities in space and time. Proc. of Int. Symp. "Land qualities in space and time":3-13. (2) Pelagatti, G. 1993. GEO-ER - The Conceptual Model of Lombardy GIS. Edited by Lombardy Regional Government, in italian. (3) Soil Survey Staff 1975. Soil Taxonomy. USDA Handbook 436. (4) Strada, L., C. Riparbelli, R. Rasio, A.M.A. van der Linden, M. Maroni 1993. Sensitivity of soil to the leaching of atrazine in an area of the Region of Lombardy. Proc. IX Int. Symp. on Pesticide Chemistry:719-728.
299

Theoiy of Topographical Variables and its Applications in Soil Science
P. A. Shary. Institute of Soil Science and Photosynthesis, Pushchino, Moscow Region, Russia.
The fundamental theory o-f topographical variables have been developed which allows to calculate ob jecti vi zed geomorpholagical maps. Variables determined by the land surface portions immediately surrounding a point o-f interest are termed local variables (e.g., gradient); variables which need extended portions of the landsurface for their definition are termed global ones. Some variables are invariant with respect to gravity, others; have no sense without it. So, all variables which describe the landsurface at a given point are grouped into four classes:
Variables: local global which have no sense without gravity Class A Class B which are gravity invariant Class C Class- D
Variables of classes A and B describe precautions of substances flows (water, soils and their components) along the landsurface under the gravity influence, variables of classes C and D describe landforms. A complete system of curvatures of classes A and C have been introduced and studied (the completeness has been proved) which include 7 known and 5 new curvatures (Shary, 1992!):
Class A, curvatures: Class C, curvatures: horizontal (kh), vertical (kv), minimal (knnin), horizontal excess (khe) - new, maximal (kmax), vertical excess (kve) - new, mean (H), difference (E) - new, unsphericity (M), total ring (KR) - new, total Gaussian (K) total accumulation (KA) - new
The classification of land surface points based on signes of these curvatures has been suggested, and proved that 46 possible types of points form hierarhical system, in which 34 types have neglidgibly small probability to meet them in real terrains, and 12 types have approximately equal probability to meet them in a 1 andscape.
Curvatures are used to extract new information on forms and flows from data on elevations. Appropriate algorithms are developed and program FIELD is written in C language for IBM-compatible computers by the author. The software allows by treatment of topographic maps, digital elevation models or stereo aero- cosmic photos calculate the following maps.
* Maps of slope gradient and aspect. Can be used for intensity and direction of fluvial processes.
* Maps of insolation (for given Sun position) and daily Sun radiation daze (for given latitute and date). Allow to estimate thermal regimes of slopes.
300

* Maps o-f horizontal and vertical curvatures o-f the landsur-face. Describe 2 major accumulation mechanisms: by -flows convergence and by -flows relative deceleration. Theorems are proved on the relationship between kh and 1-st accumulation mechanism and between kv and the second one (Shary, 1992). Structurally, these s,re maps o-f spurs and terraces, respectively.
* Map o-f mean curvature demonstrate largest among curvatures correlation with soil moisture content (Kurjakova et al., 1991).
* Maps o-f relative accumulation and relative de-flection zones. Areas, where both the accumulation mechanisms act simultaneously a.re termed relative accumulation zones; where the both do not act Ar<a termed relative de-flection zones. Usually they look like a set of spots on maps. It has been shown by several authors that enlarged soil moisture corresponds to relative accumulation zones. Method of potential landscape instability estimation has been suggested on the basis of relative accumulation zones determination for the state Ohio (Lanyon, Hall, 1983). Introduction of KA allowed to determine the extent of expression of these zones in relief.
* To extract informatoion on landforms, maps of kmin and kmax are used which reveal valley and ridge forms (defined in the class C ) , respectively. Maps of khe and kve allow to decode catena forms masked (e.g., by denudation processes) near footslope and summit of a hill, maps of KA and K eliminate general bending of surface, allowing extract information on bedrock forms from elevation data, maps of KR allow to demask radially symmetrical forms, maps of E distinguish two natural systems of directions: that marked by gravity (by flows) and by tectonical processes.
* The relative position of soils in relief is taken into account in maps of specific catchment area (the class B ) . Published algorithms (e.g., Martz, de Jong, 1988) unsufficiently correctly reflect the first accumulation mechanism and omit the second one; so, accumulation zones Are absent in them. Corresponding corrections make maps more realistic.
Introduction of system of variables of classes B and D would allow to obtain correct quantitative description of soils relative position in relief, which plays an important role in processes of formation and functioning of the soil cover, hydrogeological processes (the class B) and to introduce a first fundamental classification of landforms (the class D ) . Literature cited. 1) Kurjakova G.A., Florinsky I.V., Shary P.A. (1991). On the correlation between soil moisture and some topographic variables. In "Geography and Cartography of Soils", Ail-Union Conference. Moscow: Soil Sci. Inst., 70-71. 2) Lanyon L.T., Hall B.F. (1983). Land - surface morphology: 2. Predicting potential landscape instability in eastern Ohio. Soil Sci. 136(6):.382-386. 3) Martz L.W., de Jong E. (1988). CATCH: a Fortran program for measuring catchment area from digital elevation models. Computers %>. Beosci., 14(5): 627-640. 4) Shary P.A. (1992). Landsurface in Gravity Points Clsssification by Complete System of Curvatures. Preprint. Poushchino: PSC. 18pp. - Mathematical Geology, to be published.
301

Kriging electrical conductivity determinations for detailed study of soil thickness variability. A case study using GIS
tools in Beauce area (France)
P. Chery(l)*, M. Dabas(2), A. Bruand(l), D. Arrouays(l). (I) Institut National de la Recherche Agronomique, Service d'Etude des Sols et de la carte Pédologique de France, 45160 Ardon, France. (2) Centre National de la Recherche Scientifique, Centre de Recherches Géophysiques, 58150 Garchy, France.
Introduction. Soil thickness is an important characteristic to know, especially for predicting water storage properties and their consequencies on by-pass flow occurence and water transferts down to aquifer. However, accurate mapping of this parameter remains difficult because of its large spatial variability. Several studies have shown that electrical conductivity measurements may improve the prediction of this parameter (1, 2, 3). In the Beauce area (France), intensive cropping leads to rising levels of nitrogen concentrations into the aquifer (4). In this context, soil thickness has been shown to be one of the most important characteristic influencing by-pass flow (5). Therefore, this study aims at testing the combination of electrical conductivity (EC) data and kriging techniques (6) into a GIS tool to improve detailed mapping of soil thickness on an area of 100 ha.
Materials and methods. Soils are calcareous loamy soils on a cryogenic calcareous bed-rock, with local karstic areas. From surface to observed maximal depth, three major layers occur: A loamy clay brown layer (LC), a cryogenic layer (CL), and the calcareous rock (C). Locally, karstic areas including sandy clays layer (SC) are observed. On an area of 100 ha, a systematical network of 100 auger borings was conducted, in order to determine the depth of these layers, from the surface to the calcareous rock. On an independant sampling set, the resistivity of 42 samples of each layer was determined. On a smaller area (30 ha) systematical EC transects were performed on a regular grid of 75 m x 3 m, involving 1700 determinations of EC. On 30 points of this grid, depth of calcareous bed-rock was determined by auger borings. A regression between calcareous depth and EC was calculated, and a model predicting soil depth using EC deduced. This model was tested with a new set of 16 field data. Then, cokriging enabled to produce a map of isolinear soil depth values. Validation of the results was realized using cross-validation technique.
Results, (i) On the systematical network of 100 auger borings, the variogram shows that the spatial variability of the soil thickness is halfly explained by a nugget effect in which half of the total variance (46 %) is due both to measurement variance (16 %) and to structures of variabilities at distances less than the smallest distance considered in the sampling scheme (30 %). Therefore, EC transect were performed in order to increase the observations by reducing the lag spacing.
302
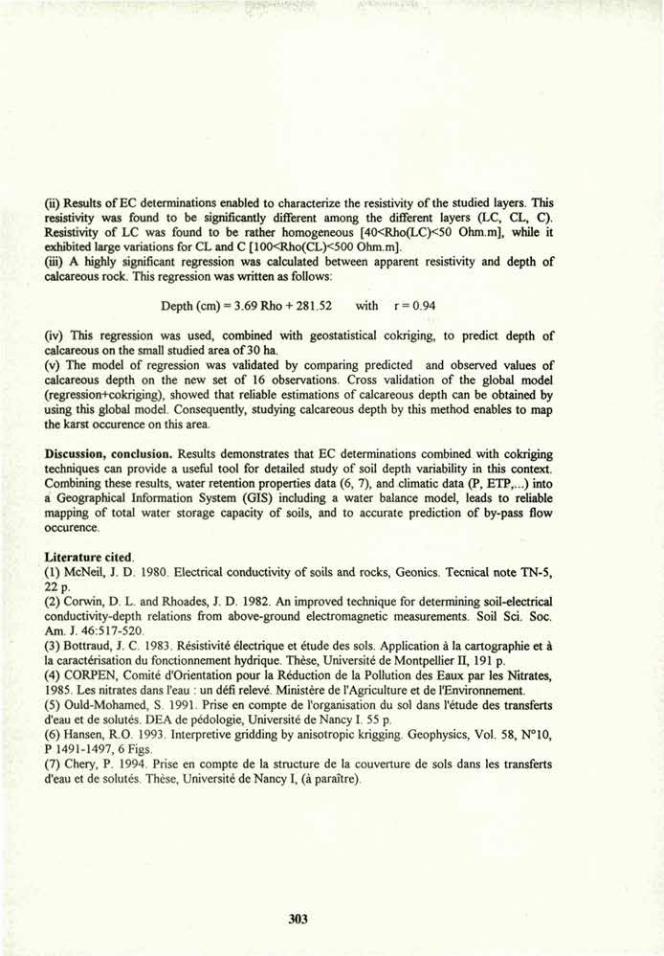
(ii) Results of EC determinations enabled to characterize the resistivity of the studied layers. This resistivity was found to be significantly different among the different layers (LC, CL, C). Resistivity of LC was found to be rather homogeneous [40<Rho(LC)<50 Ohm.m], while it exhibited large variations for CL and C [100<Rho(CL)<500 Ohm.m]. (iii) A highly significant regression was calculated between apparent resistivity and depth of calcareous rock. This regression was written as follows:
Depth (cm) = 3.69 Rho +281.52 with r = 0.94
(iv) This regression was used, combined with geostatistical cokriging, to predict depth of calcareous on the small studied area of 30 ha. (v) The model of regression was validated by comparing predicted and observed values of calcareous depth on the new set of 16 observations. Cross validation of the global model (regression+cokriging), showed that reliable estimations of calcareous depth can be obtained by using this global model. Consequently, studying calcareous depth by this method enables to map the karst occurence on this area.
Discussion, conclusion. Results demonstrates that EC determinations combined with cokriging techniques can provide a useful tool for detailed study of soil depth variability in this context. Combining these results, water retention properties data (6, 7), and climatic data (P, ETP,...) into a Geographical Information System (GIS) including a water balance model, leads to reliable mapping of total water storage capacity of soils, and to accurate prediction of by-pass flow occurence.
Literature cited. (1) McNeil, J. D. 1980. Electrical conductivity of soils and rocks, Geonics. Tecnical note TN-5, 22 p. (2) Corwin, D. L. and Rhoades, J. D. 1982. An improved technique for determining soil-electrical conductivity-depth relations from above-ground electromagnetic measurements. Soil Sci. Soc. Am. J. 46:517-520. (3) Bottraud, J. C. 1983. Résistivité électrique et étude des sols. Application a la cartographie et a la caractérisation du fonctionnement hydrique. These, Université de Montpellier II, 191 p. (4) CORPEN, Comité d'Orientation pour la Reduction de la Pollution des Eaux par les Nitrates, 1985. Les nitrates dans 1'eau : un défi relevé. Ministère de 1'Agriculture et de rEnvironnement. (5) Ould-Mohamed, S. 1991. Prise en compte de 1'organisation du sol dans 1'étude des transferts d'eau et de solutés. DEA de pédologie, Université de Nancy I. 55 p. (6) Hansen, R.O. 1993. Interpretive gridding by anisotropic krigging. Geophysics, Vol. 58, N°10, P 1491-1497, 6 Figs. (7) Chery, P. 1994. Prise en compte de la structure de la couverture de sols dans les transferts d'eau et de solutes. These, Université de Nancy I, (a paraïtre).
303

SPATIAL VARIABILITY OF SOIL HUMIDITY IN EDGE AREAS OF GALICIA (NW SPAIN)
Castelao, A.; Gonzalez, M.A. and Neira, X. E.T.S.E. Agrónomos. Universidad de Santiago.27002. Lugo. Spain.
Introduction. The fragmentation of autochthonous forest in favour of the creation of agricultural space is a long process beginning in Galicia around the year 1200 AD. At present, the surface area is divided into equal parts: forests atlantic, thickets and agricultural areas. The landscape is characterized by the pressence of masses of forest and clearcuts, either nonproductive or dedicated to agriculture. The land is divided into small farms which brings forth mosaic of heterogeneous plots. As a consequence of this, an important part of the territoty is subject to edge effects whose impact on productivity is widely recognized (Chen et al., 1992; Chen et al., 1993), while their importance in maintaining biodiversity has recently been demostrated (Hansen and Horvah, 1990). Within the frame of study of the variation microclimatic conditions between the center and the edge of small plots of land, we mean to present an example of the variability of volumetric humidity on the soil's superficial horizon.
Materials and methods. The plots in which the study was performed are located in the region of Terra Cha (Lugo, Galicia, NW Spain), one of which had a mixed plantation of Pinus radiata and Betuia celtibehca, while the other, adjoining, plot contained a crop of Zea mays, at present lying fallow. A total of 200 measurements was performed (100 in each plot following a 10x10 m network at intervals of 1 m.) on the superficial horizon of a soil with a sandy texture and 7-8 organic matter. The volumetric humidity of the surface was determined through time domain reflectometry (TDR), the dielectric constant (Ka) having been calculated previously. The equipment used for this was a Trase System model 6050X1, manufactured by Soil Moisture, with 15 cm deep waveguides.The measurements were taken in October 1993, with the soil near field capacity, with slight evapotranspiration
Results and discussion. Humidity values found in the field lying fallow, for averages of 10 measurements oscillate between 28.1 and 32.5%, while those in the forested plot went from 13.2 to 31.2% and in the edge between 10.8 and 35.4%. The absolute minimum value found was 7.5% and the maximum was 36.6%. The rates of variation analyzed in rows of 10 measurements oscillate between 9 and 16% in the clearcut, 14 and 45% in the forest and between 15 and 21% in the edge. The variance is 53 in the forested plot, 14.8 in the clearcut and 26.1 in the edge. A geostatistical analysis was made fro these values, and it was found that the semivariograms obtained in the clarcut and the forest, along with the 50 central values (those belonging to the edge between the two plots), fit the models shown in Table 1
304

with the range, nugget and sill values. Figure 1 (a, b and c) show the corresponding semivariograms.
Table 1. Model parameters for the semivariograms of the soil humidity. Plot Range Nugget Sill Model type Forest 7 20 45 Spherical Clearcut 2 10 5 Spherical Edge 2.8 17 11.8 Spherical The spatial dependence of the measurements taken in the clearcut coincides with the results of a study on the spatial variability of soil humidity performed previously (Castelao et al ,1993) in Galician plots used as meadows or agricultural fields. The results of semivariograms taken in the forest and in the edge zone reveal also the existence of spatial dependence, which permits us to differentiate the area within the agricultural field that lies nearest the forest. This study focused on the soil moisture variability at edges, the boundary line between clearcut and adjacent forest, one of the critical landscape elements in the highly fragmental agricultural and forest landscapes of NW Spain. Using geostatistical tools patterns of variability apparently different for the different landscape units were found.
Figure 1. Semivariograms and the bestyüting spherical model for soil humidity in a) Foresf, b) Clearcut and c) Edge.
Literature cited (1) Castelao, A. et al. 1993. Aplicación {Ie la técnica de reflectometria en el tiempo a la medida del contenido hidrico del suelo. Riegos y Drenajes XXI. (2) Chen, J. et al. 1992 Vegetation responses to edge environments in old-growth Douglas-fir forest. Ecol.Appl., 2(4):387-396. (3) Chen, J. et al. 1993. Constrating microclimates among clearcut, edge, and interior of old-growth Douglas-fir forest. Agricultural and Forest Meteorology, 63:219-237. (4) Hansen, A. and Horvah, E. 1990. Widlife abundance and biodiversity in managed upland forest landscapes. Adaptive COPE Annual Report, Oregon State University.
305

Taxonomy and Spatial Variability of Mollisols with Petrocalcic Horizon and Udic Soil Moisture Regime
Buenos Aires Province - Argentina
M. S. Pazos and M. Fittipaldi. Facultad de Agronomia, Universidad National del Centro de la Provincia de Buenos Aires, C.C. 178, 7300 Azul, Argentina.
Introduction. The Petrocalcic Paleudolls appear as a new subgroup in the last version of the Keys to Soil Taxonomy (4). They include besides other Udolls, those with a petrocalcic horizon having its upper boundary within 150 cm of the mineral soil surface. According to this definition, a good part of the 60 000 square kilometres of Buenos Aires province which are covered by Udolls and underlined by an almost continuous caliche should be classified as Petrocalcic Paleudolls, while in previous versions of the Soil Taxonomy the presence of Udolls with petrocalcic horizon was not foreseen. This caliche has a strong variability in depth, degree of induration and calcium carbonate content Both the caliche and the upper soil are developed on loessic sediments, Pampian and Postpampian respectively, and they are the result of successive sedimentation events and climatic changes during the Pleistocene.
Two sites were chosen in Buenos Aires Province to exemplify this subject and discuss the alternatives of classification, one in Balcarce and the other one in Azul. The site in Balcarce has been previously studied (2) with respect to detailed morphology of the calcareous materials as well as some interpretations about fossil and presently active pedological processes on the basis of macro- and micromorphological evidences. The soil above the caliche, in equilibrium with present climatic conditions, is free of calcium carbonate. Depth of the caliche, when it is shallow, represents a limiting factor for crop production, both for shallow rooting depth and reduced water holding capacity.
Materials and Methods. Two sampling areas were chosen, one in Azul in the central part of Buenos Aires Province, and the other one in Balcarce, 200 km to the southeast In both sites, the depth of the caliche was registered at different points evenly distributed throughout the sampling area Table 1 indicates some characteristics of the sites and sampling density. The results were plotted in a three dimensional diagram in order to visualize the strong variability in depth of the caliche
Site Azul Balcarce
South Latitude 36° 45' 37° 45' West Longitude 59° 30' 58° 18' Geomorphic unit Piedmont of Sierras de Tandil Piedmont of Sierras de Balcarce Relief Subnormal Normal Sampling area (m2) 3500 3000 Number of observations 250 170
Table 1 - Characteristics of the sites, size of sampling area and amount of observations
In addition, soils and caliche of Balcarce were sampled for characterization of sand mineralogy and particle size distribution in order to check the homogeneity of the parent materials. In Azul the pH of the B horizons was determined as a quick way to separate argillic from natric horizons
Results and Discussion. All soil profiles in Balcarce present mollic epipedon and argillic horizon, while depth of the caliche varies between 55 cm and more than 180 cm. The sand mineralogy is homogeneous between all horizons and the caliche itself. The comparative particle size distribution index (1) was
306

applied to the size distribution of particles bigger than 20 urn and a high similarity was found between the caliche and the different horizons of the upper soil. As a consequence, both materials are highly homogeneous with respect to sand mineralogy and particle size distribution. As there are clear evidences (2) that the caliche has been exposed at the surface during a dry climatic period, the upper boundary of this horizon represents a chronological discontinuity, reason for which a number 2 is placed before the horizon nomenclature
In Azul there are differences in soil drainage associated with differences in topography and depth of the caliche, the latter ranging from 25 cm to more than 200 cm in depth. As a result, soils of the depressions, usually associated to shallow depth to the petrocalcic horizon, are moderately well drained but still qualify for udic soil moisture regime and present natric horizon, while the soils in higher topographic positions are well drained with argillic horizon.
A scheme of the variability of horizon sequences found along both sampling areas can be represented as in figure 1. All profiles in which the upper boundary of the caliche is within 150 cm of the mineral soil surface, represented with a dotted line, regardless of the presence or absence of argillic or natric horizons or even cambic horizon, should be classified as Petrocalcic Paleudolls if the new version of the Soil Taxonomy is applied. In this way, all the information about the upper soil, the one that is utilized for growing plants, is completely lost. On the other hand, considering that "the subgroup is the lowest category in which we consider genesis in forming our definitions" (3), and as an analogy with the lithic subgroups of Mollisols with udic soil moisture regime, it is proposed that the upper soil should be classified in the way that is indicated in italics below on figure 1.
Depth (cm )
50
1 00
1 50
2 0 0 ';:C
A BA — Bt
BC
C
2Ckm
-Bt-
C
' # * & A & ® * A
'fiiil Bt i i i s t AC —i..f.i.vA" ^^"" "^.vi-v.^.. .} . ••••• •" I.
PRkn U P 2Ckm ! 2Ckm T* 2Ckm 3 5 2 2Ckm
3£p.
-B tn -
C
' S K 2Ckm
- . . , . . 1 . - 1 . ,
Soil Taxonomy 1992: Typic
Argiudoll Petrocalcic Paleudoll
This proposal:
Typic Argiudoll Petrocalcic Argiudoll
Petrocalcic Hapludoll
Petrocalcic Natrudoll
Typic Natrudoll
Figure 1 - Soil variabi l i ty in the studied areas and proposed t axonomy .
Literature Cited. 1. Langohr, R., C. Scoppaand A. VanWambeke. 1976. The use ofa comparative particle size distribution
index for the numerrical classification of soil parent materials. Application to Mollisols of the Argentinian Pampa. Geoderma, 15:305-312.
2. Pazos, M.S., 1989. Genesis y clasificación de los Argiudoles con horizonte A2 incipiente en la region pampeana. Cienciadel Suelo, 7(1-2): 87-95.
3. Smith, G.D., 1986. The Guy Smith interviews: Rationale for concepts in Soil Taxonomy. SMSSTech. Mon. n° l l .
4. Soil Survey Staff. 1992. Keys to Soil Taxonomy. 5th Edition. SMSS Tech. Mon. n° 19. Blacksburg, Virginia: Pocahontas Press, Inc., 556 pages.
307

Spatial Variability of Fertilizer Nitrogen Distribution in Lateritic Soil under Rainfed Rice and Irrigated Wheat
S. K. Sharma and S. Kar. Department of Agricultural Engineering, Indian Institute of Technology, Kharagpur 721302, India. Introduction
Quantification of fertilizer nitrogen (N) use in cropped fields requires a knowledge on spatial variability of its distribution which undergoes large variations in coarser Alfisols of humid subtropics. Since little is known about the spatial variability of applied N distribution, a controlled field investigation was undertaken on a lateritic sandy loam soil (Oxic-Haplustalf) to characterise it along with that of soil water at different stages of rainfed rice and irrigate wheat crops
Methods an.) Materials
A controlled study on spatial variability was conducted for two consecutive years on a 10m x 100 m field transect where rainfed rice, cultivar MW-10 followed by irrigated wheat, cultivar SONALIKA, were grown during monsoon and post-monsoon (winter) seasons receiving 865 mm and 23 mm average rainfall respectively. The wheat crop was irrigated with 6 cm water timed at 1.0 ratio of irrigation water to cumulative pan evaporation. The crops were fertilized with 100 kg N/ha, 50 kg P205/ha and 50 kg K20/ha by band placement to 5 cm soil depth. While P and K were applied basally, N was applied in two equal splits as Ammonium sulphate (21 % N) 21 (seedling) and 59 (booting) days after sowing (DAS) for rice and as Calcium ammonium nitrate (26% N) 21 (CRI) and 64 (booting) DAS for wheat. The transect was divided into 50 grids at an interval of 2m. At all grid points soil solution extract was collected with the help of soil water samplers from 15, 30 and 60 cm depths 0, 20, 40, 60, 80 and 100 DAS under rice and 0, 20, 21, 44, 45, 64, 65, 75, 76 and 100 DAS under wheat for the estimation of NH4+ - N and N03" - N by Colorimetric methods using Nesseler reagent for NH4
+ - N and Phenol disulphonic acid -NaOH-EDTA for NO3-N. At the same soil depths and time intervals soil moisture was also estimated with the help of a Hydroprobe. Probability density functions were prepared to ascertain the type of distribution of the measured parameters along the transect. Spatial variability of soil water and N were analysed by both Classical and Geostatistical parameters.
Results and Discussion
In lateritic sandy loam soil the distributions of soil water and N under both rainfed rice and irrigated wheat crops, were generally normal irrespective of soil depth when the parameters were measured at short intervals of 2 m. The variability of soil moisture was generally low under both crops but it increased with the advancement of growth period and drying of soil. Higher variability of soil moisture at intermediate (30 cm) and deeper (60 cm) soil depths was allied with high variability in clay and bulk density at these depths. In correspondence to the variability of soil water, NH4
+ - N and N03" - N under both rice and wheat crops had higher variability at intermediate and deeper soil layers than surface layer. Variability of N was generally low at the
308
beginning of fertilizer cycle and high at the end of fertilizer cycle. In wet soil the variability of N was higher than that in dry soil. Dispersion of NH4
+ - N and NO3" - N from their mean values was highest during the peak growth stage (booting) when the rate of N use by both rice and wheat crops was at its maximum. With a spacing of 2 m the sample requirement under rice was 5 for NH4
+ - N and 17 for N03" - N at 15 cm depth while under wheat it was 14 for NH4+ - N and 9 for NO3" - N at the same depth. The sample size increased with increase in soil depth and period of fertilizer cycle. The distance of mutual dependence varying with the concentration of N and soil moisture was on an average 21 m under rainfed rice and 17 m under irrigated wheat.
Conclusions
In lateritic soil higher spatial variability of soil water and fertilizer N at subsurface depths is allied with greater variability of clay and bulk density at these depths. Variability of N, which was higher in wet than dry soil, is relatively high at the end of fertilizer cycle. The «ample requirement for estimating N increases with increase in soil depth and period of fertilizer cycle.
309

VARIOGRAPHIC AN EXPLORATORY STUDY OF SALINITY AND FERTILITY LEVELS OF A FEOZEM SOIL.
A. Jimenez, M. C. Olmedo B.1*, R. Zulbaran, and L. J. Cajuste. Departament of Soil Science, Colegio de Postgraduados, 56230 Montecillo, Mex., México.
I n t r o d u c t i o n . T h e s o i l p h y s i c a l a n d o r c h e m i c a l characteristics variability is a common problem for the agriculture researchers. This can be understood as a pronounced change into the soil characteristics, according to the soil shape, geomorfologic constituents, soil-forming factors, which can easily mask the difference of treatments. The spatial variability acknowledgement used as map purpose set out together with the geoestatistical to suply the mathematics support to know the soil variables spatial distribution, through isoline map achievement, making variable unbiased evaluation in an unsampled locations, (1, 2). The purpose of this research was to confer a distintion on the chemical characteric spatial variation in a temporary land used for farming, with the purpose of use this variation as a reference point to the best land use.
Materials and Methods. The present research was developed in a Feozem soil at El Carrizo common, San Juan del Rio, Qro. The meterings were systematic made, using a three side net and sampled into the net intersection, at two depths (0 to 8 in, and 8 to 16 in). The variables studied were pH, C.E. C0 3 - , HC03-, CI", S04
2\ Ca2+, Mg2+, Na+, K+ soluble, resoluting beginning with the saturating extract account soil-water 1:1, O M, C.I.C., exchangeable cations, extractable phosphorus and total nitrogen. Some standard tests were made using the Kolmogorov-Smirnov test, with a 95% significant; to settle the spatial structure, the GEO-EAS program system was used, thus both the working out of a Pascal program to level the semivariance to shape the semi-variogram and analysis its established boundaries.
Results and Discussion. In accord with results observed in statistical measured, the variability of the properties, changed from high to low, through the variation coefficient statistical (C.V.). The variables with high variability were Cl", S04
2+, Ca2+, Mg2*, Na+ and K+ solubles, Mg2+ exchangeable and phosphorus; with medium variation C.E., HC03 , O M, exchangeable cations and total nitrogen; pH always had low measurement; this clasification show up in both depths. By analysisng the standard test to this variable results indicate that all the studied variables except soluble sodium (8 in to 16 in depth) are closer to the normal distribution. By analysing the spatial structure across the studying of the semi-variance, it was proved that there was a big similarity between the studied variables semi-variograms, because they did not show up the existence of sheltered structures on short distances indicating a scarce display of little attashes* into the big attaches; it was detected a sharp spatial structure to the pH, HC03 , CI", Ca2+, and Mg2+ solubles, and O. M. Total nitrogen, showed up tendencies exponential and linear (Table 1 and Fig. 1) to other variables, this spatial structure was random, essentialy due to uniform behavior that the semi-variance showed up. Those variables which showed up and absence of spatial structure, this is due to the effect of the measurement scale used in samples; in these cases the results can be used to analyze qualitatively the datum variography and alternative to propose a sample relied in conduct of semi-variance levels.
310

Table 1. Geostatics parameter of the fitted models (0-8 in)
Variable Model* Nugget Sill Range
PH Lineal 0.020 0.156 120 HCO, Exp 0.011 0.102 90 CI Exp 0.100 0.615 78 Ca sol Exp 0.069 0.163 95 Mg sol Exp 0.035 0.079 95 0. M. Exp 0.005 0.145 95 Kint. Exp 0.020 0.046 90 Na Exp 5 e-A 32e-3 90
a) Semi-vanogram model: Lin: Lineal; Exp: Exponential
u
1 > I
a on
Lags (m)
Figura 1. Experimental semi-variogram (*) and fitted models (-) of organic matter a) 0-8 and b) 8rl6 in
Conclusions. In general, it can be observed that they are a few those cases showing up structures and this one changes to a some variable, in accord with the sampled (lags) within points and depth.
The lot chemical properties variation can be used to select homogeneus statistical areas and/or the treatment experimental settlement to status of field experiments, the blocks direction fitting in the property variation direction to the establishment of better efficacy of the applied technology to agriculture. Literatured Cited. (1) Trangmar B.B., R.S. Yost, and G. Uehara, 1985. Application of Geostatistics to spatial studies of soil properties. Adv. Agron. 38:45-94. (2) Samra S., Sharma K.N.S., and Tyagi N.K., 1988. Analysis of spatial vatiability in sodic soils-I Structural analysis. Soil Sci. 145:180-187.
311

Soil Survey Based on Sampling Scheme Adjusted to Local Heterogeneity
M. Kertész, T. Tóth. Research Institute for Soil Science and Agricultural Chemistry of the Hungarian Academy of Sciences Budapest, Hungary,
Introduction. A novel approach of mapping has been developed and tested in an extremely heterogeneous area with semi-natural vegetation. This area cannot be considered to be spatially stationary, so we assumed that the relationship between estimation accuracy of the studied parameters and spatial scale is changing from place to place.
The basis of the mapping procedure applied is an optimization of expected accuracy of the resultant map through varying spatial resolution of sampling at fixed expenditures. The expected accuracy of the map is designed to be homogeneous throughout the mapped area.
The sampling scheme was designed in that way that the variation is shared among the sampling points (blocks) evenly. Therefore it is indispensable to have previous information on the local variation from existing records such as available maps, survey data. If the vegetation reflects the soil conditions remotely sensed images can be used for that purpose (Tóth et al. 1991).
After such a sampling the interpolation technique used in the survey should take into consideration that the variation of the sampled properties is dependent on the local sampling resolution, i.e. the local density of sampling points.
Materials and Methods. The sample area is located inside the Hortobagy National Park in Eastern Hungary representing the most characteristic place of the Central European solonetz soils. The sampling was carried out inside a 5120 x 5120 m square, that comprises various vegetation types ranging from anthropogenic plots (Anth), such as artificial forests, croplands and old-fields to steppe-like vegetation (Ste), slightly alkaline grassland (AchF), severely alkaline grassland (ArF), alkaline meadow (Mead) and alkaline wetland (Wetl).
The basic record for the pieparation of the sampling scheme was a SPOT panchromatic
• ; image with 10 m nominal resolution. Quadtree '• '.'... decomposition of the image was driven by
minimalization of the variation inside the resultant tiles, i.e. starting from the image
• • : : ' ' . consisting of four tiles at each step the most heterogeneous tile was divided into four
. . subtiles until the predefined number of tiles has been reached (Csillag et al., 1992). The sampling points are located in the centres of the resultant tiles (see figure). The efficiency of
• • • • . . . . t n e s a n lpiing algorithm in terms of prediction • • • • • • • • • • accuracy was tested by reconstructing the . . • • • • ' . . . . ' ' remotely sensed image.
. . . . The sampled variables comprised the ; . . . ; ; • " • ..'.'.'.'. ecologically relevant properties of the soil,
sodicity, alkalinity and salinity at the surface ' . ' . • • • and in bored samples from 0-10, 10-20 and 20-• • • • • • • • 30 cm samples.
312

Results and Discussion. The correlation of soil properties and the vegetation is tight and generally is the foundation of the mapping of solonetz soils (Ballenegger, 1929). Due to the ongoing processes the tightness of the correlation is not the same in every location. The differing dynamics of plant succession and soil degradation is the main reason for the discrepancy in the ideal soil - vegetation correspondence. From the view point of ecological monitoring these cases of discrepancy constitute the spots that are expected to be the most sensitive for changes in the environment.
The heterogeneity of the region was manifested in the distribution of the vegetation types among the tile size classes (see table). The largest tiles cover the alkaline grassland types, the most typical and abundant types of vegetation in the area. The smallest tiles were allocated to the surroundings of one small temporary saline lake, because of the high contrast between the dense marsh vegetation and shiny dry bottom of the lake. The medium size tiles cover all the occurring vegetation types. The anthropogenic types are more frequent in the smaller tile size, due to the relatively high contrast to the surrounding vegetation.
The means of the chemical data in the tile size classes reflect the distribution of the vegetation types. The largest and smallest tiles showed mostly significantly different values of salinity and alkalinity (see table). The values and the depth distribution of the chemical properties are in good agreement with the tendencies expected based on vegetation cover.
Tile size
Vege' Anth
bation type Ste AchF
percentage ArF Mead Wetl
EC (mS/cm) 0-10cm -20 -30
PH 0-10 -20 -30
640m 320m 160m 80m
1 15 38 0
2 4 8 0
27 15 5 0
42 30 24 5
22 33 20 4
6 3 5
91
1.06 1.83 2.54 0.95 1.51 2.04 0.87 1.25 1.54 1.02 1.11 1.22
6.7 6.5 6.6 7.7
7.5 7.2 7.0 7.9
7.8 7.8 7.4 8.2
Total 20 5 13 28 26 8 0.94 1.45 1.91 6.6 7.2 7.7
The lack of stationarity implies that geostatistical methods may not be used for interpolation. Indeed, the variograms calculated in the different tile size classes differ markedly from each other. The variogram structures of the studied variables are very similar. Nevertheless the overall variograms disregarding the size classes show good structure in terms of nugget/sill ratio and shape. Seemingly the variograms of the size classes constitute subsequent intervals of the overall variogram. Consequently the geostatistical methods might still be used successfully for interpolation.
Literature Cited. Ballenegger, R. 1929. Les methodes de la cartographie des sols alcalins (salins). Transactions of the Alkali-Subcomission of the International Society of Soil Science. Volume A. Budapest, pp. 9-12.
Csillag, F., A. Kummert and M. Kertész. 1992. Resolution, accuracy and attributes: Approaches for environmental geographical information systems. Computer Environment and Urban Systems 16:289-298.
Tóth, T., F. Csillag, L. L. Biehl and E. Michéli. 1991. Characterization of semivegetated salt-affected soils by means of field remote sensing. Remote Sensing of Environment 37:167-180.
313
Using soil heterogeneity to improve selection efficiency
M.A. Bell*, H.R. Lafitte and J. Corbett. CIMMYT, Lisboa 27, Apdo. Postal 6-641, 06600, Mexico, D.F. Mexico.
Introduction. Selection for improved genotype performance in the field is regularly confounded by soil heterogeneity. Experimental variability arising from such soil variability results in loss of experimental efficiency. This yield variation can be particularly problematic under conditions of reduced fertility, where yield variation can be enormous. Such variation is daunting given that plant improvement goals are often of the order of 1.5-2 % cycle"'. A number of statistical methodologies (e.g., Lattice designs and covariates) and robust interpolation methods now exist for reducing such variation and improving research efficiency (i.e., lowering the error mean square). With advances in computer software technology in particular, software now exists for predicting yield for every point within a field from check plots throughout that field - saving the labour intensive exercise of collecting covariate data on every plot. These predicted plot yields can then be used as yield covariates in the analysis. The use of these tools is helping improve the efficiency of plant breeding (e.g., Ball et al., 1993).
The objective of this study was to evaluate the improvement in research efficiency (i.e., reduction in error mean square) when trials were analyzed using (1) simple yield adjustments and (2) covariates of predicted yields from check plots.
Materials and Methods.
Field experiment Nonconventional maize (Zea mays L.) hybrids were sown in single row plots (5 m
by 0.75 m) in the winter season in Poza Rica, Veracruz, Mexico. Plots were overplanted and thinned to achieve a harvest density of 53,000 plants ha"'. No fertilizer N was applied There were 140 entries in three replications, and a check hybrid (KSX-2301) was sown every seven rows throughout the trial.
Analysis The trial was subjected to standard analysis of variance using unadjusted data, and
also with data adjusted based on the yields of the adjacent check rows. In addition, two methods to generate covariate values using Laplacian splines (Hutchinson, 1991) were evaluated, namely: (1) use of the entire check data set (i.e., 81 plots) (referred to as Hutchinson 1), and (2) use of a reduced data set (71 check plots) (referred to as Hutchinson 2) in which the ten check yields with the largest deviations between predicted and observed yields were omitted.
314

Results and discussion.
Enormous yield variation was apparent across the field, with check yields varying by as much as 560% (range 817 to 4570 kg ha"'). When adjusted yields and covariates were used in the analysis, the error mean square (EMS) of the analyses decreased by 9, 42 and 48%, respectively (Table 1). The decrease in EMS was associated with a concomitant decrease in the standard error of the difference (SED). The decreases in the SED were 4, 24 and 28% for the adjusted, and Hutchinson 1 and 2 covariates, respectively. Due to the covariate adjustments, a number of changes in the order of entry performances were observed. In addition, yield estimates varied based on the form of the adjustment. For example, the yield of the top entry was 6210 and 5760 kg ha"' for unadjusted and Hutchinson 2 adjusted data, respectively.
Table 1. Analysis of variance components and standard error of the difference (SED) for four types of data presentation.
EMS %of F SED Data unadjusted (kg ha"1)
Unadjusted 15119 100 2.22 1000 Linear adjusted 13760 91 2.22 960 Covariate adjusted
Hutchinson 1 8702 58 5.28 760 Hutchinson 2 7853 52 6.07 720
Conclusions: The use of a covariate, estimated using Laplacian splines to predict yields
throughout a field from check yields, led to large reductions in the error mean square, and thus an improvement in experimental efficiency. Not only were covariate adjusted yields a better indication of the genetic potential of an entry, but the ability to separate entries on the basis of yield was improved (i.e., lower SED).
References. Ball, ST., D.J. Mulla, C.F. Konzak (1993). Spatial heterogeneity affects variety trial
interpretation. Crop Sc. 33:931-935.
Hutchinson, M.F. (1991). The application of thin plate smoothing splines to continent-wide data assimilation. In: J.D. Jasper (ed.) Data Assimilation Systems, BMRC Research Report No. 27, pp 104-113. Melbourne: Bureau of Meteorology.
315

Choosing Theoretical Semivariogram for Soil Water Content
R. D . Valdez-Cepeda , J. D. Lopez-Martinez and E. Martinez-Rubin de Celis. Dir.
Centros Regionales, Univ. Aut. Chapingo; Fac. Agric. y Zootecnia, Univ. Juarez Edo.
Dgo.; Centro de In v. y Graduados Agropecuarios, IT A #10.A dually, Graduate Students,
Fac. Agron., Univ. Aut. Nuevo Leon, Apdo. Postal358, San Nicolas de los Garza, N. L.,
México.
Introduction. Spatial or temporal variation of soil properties contains systematic and random components. Such variability is the product of soil-forming factors operating and interacting over a continuum of spatial and temporal scales. Geostatistics takes into account both the random and sistematic or structured characteristics of spatially or temporally distributed variables to provide quantitative tools for their description and optimal, unbiased estimation within the domain. The semi-variogram describes the spatially or temporally dependent component (through its general form, magnitude and scale) of any random function; however the shape of the experimental semi-variogram may take many forms. It is important to choose the appropiate model for estimating the semi-variogram because each model yields quite different values for the nugget variance and range (4, 2), both of which are critical parameters for interpolation. In other words the semi-variogram is the key to describing variation quantitatively to understanding and to prediction (1). This short note uses weekly data of soil water content registered gravimetrically at a peach orchard under rainfed condition for construct the one dimensional semi-variogram, and shows some criterion for choosing the theoretical semi-variogram.
Materials and Methods. The soil water content (0-30 cm depth) data were collected weekly during 1984 at a experimental peach orchard located in Palmas Altas, Jerez, Zac., México (5). The data were transformed to head (mm) by considering the bulk density (1.56 g cm"3). The data set was also tested for normality using the Shapiro-Wilk statistic (3). The linear, spherical, exponential and Gaussian transitive models were fitted by nonlinear weighted least squares approximation (3).
Results and Discussion. In order to choose the best model we plotted the behavior of the most commonly statistics of regression: the standard error of the model's coefficient, S, the R2 and the F. This simple procedure permits to the user avoid to spent more time in compute other statistic [i. e. Akaike information Criterion (1)] and enables to the investigator to discuss easily the theoretical reasoning for the models by using the computer output. In the present case, only the exponential model not show convergence; this means that exponential model alone is not enough to identify the soil water content as seasonal process. The spherical model gives a
316

higher S and lower R2 than the linear and Gaussian models, moreover it is eliminated because rises more steeply from the interception (nugget variance) showing a discrepancy with the experimental semi-variogram; McBratney and Webster (1986) suggested that spherical model is less relevant for one and two dimensional distributions. Linear model shows major R2 and F and lower S than the Gaussian model but the difference is not great. Then we choose the Gussian model as the best theoretical semivariogram because it is intrinsically nonlinear as the soil water during the year. The values for the parameters nugget variance, sill and range are 55 mm2, 382 mm2 and 86 days, respectively.
Literature Cited (1) McBratney, A. B. and R. Webster. 1986. Choosing functions for semi-variograms of soil properties
and fitting them to sampling estimates. J. Soil Sci. 37:617-639. (2) Ovalles, F. A. and M. E. Collins. 1988. Evaluation of soil variability in Northwest Florida using
geostatistics. Soil Sci. Soc. Am. J. 52:1702-1708. (3) SAS Institute. 1985. SAS user's guide: Basics; Statistics. Version 5 ed. SAS Inst. Cary, NC, USA. (4) Trangmar, B. B., R. S. Yost and G. Uehara. 1985. Application of geostatistics to spatial studies of
soil properties. Adv. Agron. 38:45-94. (5) Valdez-Cepeda, R. D. 1991. Estimation of soil water. TERRA 9(2): 114-121.
317

Good Perspective in Crop Research on Highly Variable Soils William Gandoy-Bernasconi. Department of Soil Science, Universidad Autónoma Chapingo, 56230, Chapingo, México.
INTRODUCTION. In some agricultural experimental fields two facts can occur : 1) differentiated crop responses are not obtained as an effect to quite-different physical treatments applied to soil, and/or 2) plant responses, highly dependent on soil properties, are generated, but independent from the experimental treatments applied to a supposedly uniform soil. The statistical focus does not generate good results in these cases, and it would need many years of observations in order to reach to this conclusion. This means,to invest a lot of money to maintain the research along the time, without obtaining a reliable conclusion from those agricultural researchs. This situation seems to be disheartening, however, a valuable opportunity exists if the researcher changes to a new point of view. Scale problems can be observed. The scale is considered a characteristic length; then, the scale definition starts at the pore level, it continues at the pore system in the soil unit, and at last it proceeds at the system of soil units. We, then would have the scales 1) submicroscopic; 2) microscopic; 3) macroscopic or Darcian scale and 4) watershed scale, with characteristic lengths from 10e-10 to 10e-8; 10e-6 to 10e-3; 10e-l to lOeO ana 10e2 to 10e4 or more meters, respectively. (1). On the otner hand, the concept of "representative elementary" volume is utilized for handling, representatively, the pore-and-fracture properties of soil and subsoil. Hence, a volume smaller than required, generates failures in the research and a volume too big, produces the same and increases the costs, as well. Then a question arises is the plot "elementary" size, utilized in agricultural experimentations, adequately selected to represent the soil bodies in highly variable regions due to erratic 1) volcanic ashes discharges, 2) lacustrine depositions and/or 3) antropogenic processes?. Hence, the importance of this research carried out on two experimental fields, located into the Mexican neovolcanic axis.
MATERIALS AND METHODS. The experimental fields were Xaltepa, in Chapingo, Méx. and Villa Ouietud located at México DF. The procedure developed, was the same in the two fields. A preliminary run was made, to estimate the global variability and to select the properties considered the most important. The next step was to take a pre-sampling of 10 simple samples. These samples let to describe the variables in terms of classical statistics, and to know quantitatively, how variable these properties were. If the required (calculated)number of samples, in order to represent the properties on evaluation, was much greater than the quantity of samples handled in the pre-sampling, and their processing exceeded the available facilities in time and money, then the research was driven through Kriging. (2). This preliminary evaluation let to define the interval or characteristic length among samples, arranged in a square grid. Krieingi is a w«?l 1 ripnrr-ihori «othnHni ngy (2) and it was applied witn the popular software SURFER. In Xaltepa
318

: organic matter, exchangeable cations, pH, aggregate stability and texture (clay, silt, sand); and in Villa Quietud : pH, electrical conductivity (EC), field capacity (FC) and permanent wilting point (PWP) were evaluated, respectively.
RESULTS AND DISCUSSION. A) In Xaltepa, soil properties could be studied at two depths : 0-5 cm and 25-30 cm. Organic matter required 38 and 53 samples, respectively, in order to be statiscally well represented. Exchangeable cations calcium, magnesium, potassium and sodium required (first layer) 96,80, 274 and 117 samples and (second layer) 164, 204, 1050 and 339 samples, respectively. An additional product obtained from this work, was due to tillage along many years, the first layer was homogenizea; however, it was necessary to apply Kriging for distributing, in space, the existing punctual differences in each of these variables . pH has extreme values 5.5 and 8.3 with mean 7. There was a pH gradient according to its lacustrine origin, even though its variability is low and the extreme values correspond, rather, to punctual observations. Then Kriging results, let to locate these extreme points. With respect to sand, its minimum percentaje is under 10 % and its maximum greater than 80 X; requiring 250 samples to represent it statistically. Clay ranges from values under 5 % to 50 X with mean 20 X . Silt is equally variable. Aggregate stability ranges from 4.98 to 80 X therefore it is necessary to represent this property through Kriging. Then, with these high variabilities, the process of field description was attained with 280 samples arranged in a square 50-m-side grid. B) In the case of Villa Quietud, the next results were obtained : pH from 6.6 to 8.5 with mean 7.5 requiring 4 repetitions; EC from 0.2 to 6.7 with mean 1.89 mmho/cm needing 666 samples; FC from 23 to 81 X with mean 52 X and 84 repetitions and at last PWP from 11 to 42 X with mean 24 X needing 132 repetitions. In this field, 100 samples were taken in a square 10-m-grid; then Kriging was applied including pH, in order to locate other possible peaks affecting crops.
CONCLUSIONS. The pH is the most stable variable, but the two fields showed peak pH values. This suggests, after verifying the data, and if available time and resources let it, to develop a procedure Kriging over this variable. The other variables require, obligatoryly, to be handled with Kriging. After having the interpolation process, it is easy to define the plot "representative elementary" size in order to carry out the agricultural researchs without any troubles. Thus, with plots uniform enough inside themselves, the soil can be watched as a variable, comparing e.g. the plant behaviours on a clay and a sand in short distances, having the same wheather in the experimental design because the place is small enough with respect to the atmospheric phenomena.
LITERATURE CITED. (1) Kutilek, M. (1990) Scale problems : Introductory remarks. IN 14th. International Congress of Soil Science, Vol I: Commission I 1-5 Scale problems in evaluation of the soil processes, pag. 1-177. (2} Klute, A. (1986). Agronomy # 9, Part 1 2nd. ed A3AE.
319

Spatial Distribution of Loamy Soils Related to the Topography in a Smooth Relief Region
D. King, H. Bourennane, J. Daroussin and M. Isambert. Sou Survey Staff of France (SESCPF), Centre de Recherches INRA d'Orleans, 45160 Olivet FRANCE
Introduction. Soil maps are often drawn by taking into account existing relationships between the soil characteristics and other physical variables, such as surface morphology. The objective of the work was to test this approach with numerical methods in an area of smooth topography. The region of Beauce was chosen for its morphometrical characteristics. It is a limestone plateau partially covered with decarbonated loam and having low slopes ranging from 0 to 2%. This region is located in the South-West of the Paris Basin and is cultivated with cereals. This intensive agriculture leads to alarming pollution of the water table.
Materials and Methods. The study focused on relationships between morphometrical parameters and the decarbonated loamy cover which we called "Silty clay loam" volume (SCL) (1). 541 auger holes were described using conventional pedological attributes in a limited test field area of 3300 hectares. The presence of the SCL volume is given by a simple boolean classification using the texture (granulometrical clay content between 22 and 32%), the effervescence (absence), and calcareous stones (absence). Elevation contour lines of the test area were digitized and a Digital Elevation Model (DEM) was computed using the TIN method (2). Morphometrical parameters were derived from this DEM : slope, aspect, curvature, planform curvature, profile curvature and flow accumulation (3). The circular variable Aspect was converted to Sine(Aspect) and Cosine(Aspect). The morphological parameters were assigned as attributes to the described auger holes. Statistical analyses were used to search for the relationships between these morphological parameters (independant variables) and the Presence/Absence of the SCL volume (dependant variable). Firstly, a cross-correlation table between the variables was established. This allowed [i] detection of the strongest links between independant variables, which would be redundant, and [ii] the identification of independant variables that related well to the dependant variable. Secondly, a discriminant analysis was carried out. The discriminant function involving the most relevant variables, provided a predicted model of Presence/Absence of SCL on any location from morphometrical parameters.
Results and Discussion. The most relevant variable to retain for futher analysis was Sine(Aspect) (r=-0.39 with 541 plots). A correlation coefficient smaller than 0.11 was not significant at the level of 1% of probability with 500 degrees of freedom. The second retained variable is the Profile Curvature (r=0.16). The link between Aspect and presence of the SCL volume is shown in the figure on which the relative frequency of the SCL volume is drawn for each orientation. The highest frequencies are centered around the direction 70°. This corresponds to the inverse direction of dominant winds. This link does not give information on the origin of the loamy cover to be known. Other studies such as micromorphological analysis will be necessary to confirm this hypothesis. A discriminant analysis was calculated by using these correlated variables in order to classify the presence/absence of the SLC volume. The discriminant function is : Di = 0.0175 + 1.4463 Sine(Aspect) - 75.76 Prcu where Dj is the discriminant function,
Aspect is the slope aspect Prcu is the profile curvature
320

The number of misclassified observations were 30% for the presence of SCL and 31% for its absence. This was due to the DEM which was not sufficiently accurate for such a study. This could also have been due to the very slow slopes, particularly at the "hill" tops. In such morphological cases, computation of Aspect is very sensitive. A small error in elevation can lead to a large error in the Aspect, up to +180° or -180°. Futhermore, in the framework of the above wind hypothesis, the model of deposition may greatly change with a small change of the wind direction. The discriminant function was applied on each cell of the DEM grid. Presence and absence of SCL are respectively noted for Dj>0 and Dj<0. This provided a map which was then compared with a conventional soil map (1). The results showed many similarities for more than 75% of the area. The poorest coincidences between information delivered by conventional soil mapping units and Presence/Absence of SCL mostly occur at the hill tops. This supports the theory that such hill tops have a very high variability. Our future work will now focus (i) on determination of the thickness of the silty-clay-loamy volume when present and (ii) on validation of the model beyond the test area mainly by using easy available data such as remote sensing.
W'
Figure: Relative frequency of the presence of the silty-clay-loamy volume according to slope aspect. The two circles indicate a 40% frequency for the smallest and a 60% frequency for the largest.
Literature Cited. (1) Duval, O. and Isambert, M., 1992. Notice explicative et Carte Pédologique de Villamblain,
échelle 1:10000. INRA, SESCPF (OrléansJFRA). (2) ESRI, 1991. Reference Manuals and User Guides for GRID and TIN Arc/TNFO, revision
6.1. ESRI, Redlands, CA, USA. (3) Moore, L.D., Grayson, R.B. and Lason, A.R., 1991. Digital terrain modelling : a review of
hydrological, geomorphological, and biological applications. Hydrological Processes, 5 : 3-30.
321

Soil Assessment Proceedings Using a Geographical Information System for Ecological Planning
U. SchleuB, E.-W. Reiche, U. Heinrich, D. Scholle & R. Zölitz-Möller, Projektzentrum Ökosystemforschung, Universiteit Kiel, Schauenburger Str. 112, D-24118 Kiel, Germany
Introduction. Soils have various ecological functions. Their properties differ greatly in a landscape. Increasing soil contamination risks require a foreseeing soil protection policy. To access and predict potential contamination risks for planning purposes it is necessary to know the most important soil parameters and climatic characteristica. Geographical Information Systems, databanks and models are necessary tools for assessments of environmental qualities.
Materials and Methods. The Research Project 'Ecosystem Research in the Bornhoeved Lake District' deals mainly with the determination of biological structures and fluxes of energy and matter in and through ecosystems, the modelling of structure and dynamics of ecosystems and the extrapolation of these results onto larger areas . The research area is situated southwest of Kiel (Germany) and represents a great number of characteristical ecotopes of the younger morainic region (2). The landscape consist mainly of forest, arable and pasture land and lakes. The soils (following the FAO- classification mainly Cambisols, Arenosols, Luvisols, Gleysols, Histosols, Planosols and Anthrosols) developed from till, fluvioglacial sand, peat, colluvial deposits and limnic sediments (4). They are investigated by field and laboratory measurements. The spatial data base has been set up by using the GIS-software 'ARC-INFO' (5). For the spatial investigations there is a hierarchy of scale levels: the fairly heterogenic 'total research area' (52 km2) consisting of the watersheds of 6 lakes, part of this area inside the watershed of Lake Belau (4,5 km2), inside this the main research area (0.6 km2) composed of agricultural and forestry sites, and part of this area inside a beech forest (0.2 km2). The GIS allows to combine different layers (e.g. topography, landuse, vegetation, soil units and geology), depending on the precise question. On the other hand model results can be described spatially.
Results and Discussion. For several ecological planning scenarios soil data have been used. One scenario deals with the assessment of the potential linkage capacity and the potential hazard of groundwater contamination by the heavy metal cadmium for the 'main research area'. The relevant parameters for linkage and transport in the soil are taken by field and laboratory measurements. The model for the assessment is based on laboratory investigations (1) and is only applicable for a moderate charge with heavy metals (e.g. application of sludge), but not for a high point charge (e.g. accidence). Main input parameters entered in the model are pH-value, textural class, contents of organic matter and sesquioxides, climatic water balance, groundwater level, relief, landuse and soil unit. The data are available in the data base ORACLE and can be jointed to ARC-INFO by the
322

profile number. Using the model results it is possible to ascertain a coarse value of the potential hazard of groundwater contamination. In the main research area we found different soil units. The soils of the beech forest are characterized by a low linkage capacity for cadmium in the upper soil horizons due to the soil acidification (pH-values in the upper horizons 2.9- 3.2). The arable and pasture land, characterized by higher pH- values (4.5-6.0), showed an increasing linkage capacity. The potential hazard of groundwater contamination depends on soil properties of the lower horizons and the groundwater level. Gleysols and Histosols show a high potential hazard for groundwater contamination due to their high groundwater level. The dystric soils of the beech forest show a low and medium potential hazard due to soil properties in the lower horizons (e.g. increasing pH-value up to 7-8 in 4 m depth) and the low groundwater level, while the soils under agricultural use can be characterized by a very low to low potential hazard . These data could be used to construct a map, which is placed in the central map library (5).
The water and nitrogen dynamics for the catchment of Lake Belau are calculated by the model system WASMOD & STOMOD (3). This model system consists of a number of submodels, combined in a hierarchical way. Model simulation shows a great spatial variation due to the different landuse and crop rotation. For the period 1989/90 nitrogen residues of arable and grassland in the catchment are similiar, but the nitrogen losses caused by leaching differ in a significant range.
The overlaying of soil and vegetation informations allows to ascertain the spatial distribution of selected vegetation information due to the soil distribution. This is for a special interest of nature protectior. policies. On several maps the exampled analysis of vegetation formation 'Alnion' and 'Phragmition' shows the dependence on soil water regime..
Literature cited
1. Blume, H.-P. & Brümmer, G. (1991): Prediction of Heavy Metal Behaviour in Soil by Means of Simple Field Tests, Ecotoxicology and Environmental Safety, 22, 164-174 2. Leitungsgremium (Hrsg.,1992) : Ökosystemforschung im Bereich der Bornhöveder Seenkette, Arbeitsbericht 1988-1991, EcoSys, 1, 1-338, Kiel 3. Reiche, E.-W. (1991): Entwicklung, Validierung und Anwendung eines Modellsystems zur Beschreibung und flachenhaften Bilanzierung der Wasser- und StickstofTdynamik in Boden, Kieler Geographische Schriften, 79, 1-150 4. SchleuB, U. (1992): Boden und Bodenschaften einer Norddeutschen Moranenlandschaft, EcoSys Suppl. Bd. 2, 1-185, Kiel 5. Zölitz-Möller, R, SchleuB, U., Reiche, E.-W. & U. Heinrich (1993): Integration of GIS, Data Bank and Simulation Models for Ecosystem Research and Environmental Assessment, in: HartsJ., Ottens, H., Scholten, H. (Eds., 1993): EGIS 93, Conference Proceedings, Genova, 1230-1238
323

GIS Application in the Delimitation and Description of Land Units in La Malintzin, Tlaxcala
I. Dominguez, C. Olivares and S. Avelar. Departamento El Hombre y su Ambiente, Universidad Autonoma Metropolitan*! - Xochimilco, Coyoacdn, O4960 D.F. México.
Introduction. National Parks in our country were decreeted to avoid the human impact in Areas which had to be protected due to their special beauty, scenic and forestry value and the presence of endemic species.
The planification for the use of this areas is essential. Therefore, as a first step, it is necessary to have a zonification where each unit includes the group of factors that compose it. In the case of the National Park of La Malinche, the ILWIS (1) software, which allows to overlay cartographic information, was used. The objective of the study was to define the limits of each land unit and describe their natural attributes.
The volcano La Malintzin forms part of the Neo volcanic Axis, and it's highest peak is 4,461 meters above sea level (masl). The National Park covers 45,711 hectares. Of these, 12,679 belong to the Estate of Puebla and 30,032 to the Estate of Tlaxcala (2). The weather is temperate and rainy, with temperatures from -3° C to 18° C. The mean annual precipitation ranges from 800 to 1,200 millimeters. Frost is frequent (from 140 to 160 days of the year).
From a geological perspective, La Malintzin is a volcanic ruin from the Tertiary, because it began it's activity in the Pleistocene and ended it during the Holocene. The geomorphology is that of an isolated volcanic cone. It's interior lower slopes extend in a circumference with soft slopes. On the other hand, it's central hillsides, above 3,300 masl, are very steep (3). The soils were described by Werner (4) as Litosols at the crest, in the volcanic cones and in the ravines. The Cambisol-Andosol association (from 3,500 to 3,800 masl) presents deep and developed humic soils on Andesite and volcanic ashes. The Andosol is developed on volcanic ashes of diverse texture (from 2,800 to 3,500 masl). Those are well developed soils, deep, humic and adequate for forest use.
Materials and Methods. The base map was elaborated with existing cartography (5) and aerial photographs at scale 1:20 000 and 1:35 000. Published information on geology, soils and vegetation was gathered (3,4). Together with data collected by the authors from 1991 to 1993 (6), a geographical data base was generated to digitize and edit the final maps.
The sequence for the maps overlay was the following:
1. Geology + Soils = Geopedologic 2. Slopes + Geopedologic = Intermediate (first zonification) 3. Intermediate + Vegetation = Land Units
324

From this overlay we can visualize the attributes and their interactions in a sequence where the zones of convergence become evident. Also, the areas of conflict, such as those with high fragmentation, are also made clear. This allows for an impartial and objective delimitation of land units.
Results and Discussion. From the synthesis of attributes, four different land units were clearly defined: Unit I. This unit contains volcanic cones and steep slopes (25°) with Andesite as parent material with Regosol and Litosol. The altitudinal range covered by this unit goes from 3,400 to 4,400 masl and it has as the dominant vegetation the subalpine prairie. Unit II. It is distributed in the deepest ravines (Pilares, Huetzial, Axal y Briones) with andesitic Tuff and volcanic ashes. The ravines provide a good microclimate for the growth of a fir forest. The soil in the slopes of the ravines is Regosol and in their bottom, Fluvisol. This is a zone with forest potential and high risk of erosion. Unit III. (Estate of Tlaxcala) This unit is on moderate hillsides (from 10° to 25°) of andesitic Tuff and volcanic ashes. It ranges in altitude from 3,300 to 3,700 masl with Andosol (vitric, humic and molic) which has andic characteristics with a well developed organic horizon. The Pinus hartwegü forest covers the higher parts (3,400 to 3,500 masl) and Pinus montezumae is present on lower altitudes and slopes (2,900 to 3,500 masl). It is recommended to introduce silviculture and to exclude grazing because of the propension of the soil to erosion. Unit IV. (Estate of Tlaxcala) In soft slopes (from 5° to 10°) around the volcano, with Andesite and andesitic Tuff. Altitudes from 2,900 to 3,300 masl and Andosol soils (vitric, humic and ocric). Also some regosol, both in P. montezumae, P. leiophylla and mixed forests. This unit has been the most stressed by cutting, burning and grazing. The soil is sandy and highly erodible. It is recommended to reforest, protect the soil and introduce perennial cultures. Some gullies are forming due to the erosion.
Conclusion. The methodology was adequate and helpt"' to distinguish a bonification with objective criteria. Each Unit reflects the different conditions (biotic and abiotic) that are present in the Park.
literature Cited. (1) International Institute for Aerospace Survey and Earth Sciences. 1992. ILWIS: The Integrated Land and Water Information System. Version 1.3. The Netherlands. (2) Comisión "La Malinche", 1977. Realizaciones en la Montana de "La Malinche". Universidad Autónoma de Chapingo. México. (3) Von Erf fa A., 1976. Geologia de la Cuenca Alta de Puebla, Tlaxcala y sus Contornos. Comunicaciones Vol.13. (4) Werner, G. 1976. Los suelos del volcan "La Malinche", altiplanicie central mexicana. Comunicaciones 13. Proyecto Puebla-Tlaxcala. (5) DETENAL. 1976. Cartas Tematicas 1:50,000. Secretaria de Programación y Presupuesto. (6) Donünguez R.. V.I.; S. Avelar; A. Buendia, J.L. Gutierrez. 1993. Avances en el estudio del suelo y bosque en el volcan La Malintzin, Tlaxcala. Memorias I Congreso sobre Parques Nacionales.
325

Applying GIS for use planning and conservation of the esteppe landscapes in central Ebro Valley (NE Spain)
A. Navas* and J. Machfn. U.E.I, de Edafologia. Estación Experimental de Aula Del CSIC Apartado 202. 50080 Zaragoza. Spain.
Introduction. In Central Ebro valley, the esteppe landscape of the Litigio area (3011 ha) is underla-yed by Tertiary gypsiferous materials The landscape is characterized by badlands strongly disected by a dense gully network. The soil types are mainly Leptosols and Gypsisols They are poorly developed and texture is light. They have alkaline pH, gypsum contents of around 60%, EC values of 2 7 dSm-1 and organic matter content of 1.5%. Cambisols occupy a reduced flat area that holds a small salty pool.
Their xerophitic vegetation cover of small shrubs is scarce and it is composed of different phyto-sociological communities, with Helianthemum squamati and Ononis tndentatae on Leptosols, and Gypsophila Hispanica and Colygeum spartium on Gypsisols, but anthropic activity has destroyed much of the original vegetation.
These soils are prone to erosion and also the semiarid climate is unfavourable Overgrazing on the Leptosols and intensive agricultural use of the Gypsisols is actually causing important soil losses, that are leading to land desertification Conservation of these fragile steppe landscapes requires first ot all to identify the more sensitive areas in order to design effective land use planning and conservation strategies.
Materials and Methods. The geographical information system "IDRISI" has been used to integrate physiographic and soil parameters information IDRISI is linked to a digital elevation model (Surfer). The topography of the Litigio area is digitized at 1/5000 scale. Land use cartography is also at 1/5000. Geology, Geomorphology and Soil cartographies have been made at 1/25000 scale Soil parameters analysed on 86 soil samples include pH, texture, stoniness, organic matter,carbona-
tes, salts, gypsum, cations and anions. From this information isolines maps of the most relevant soil parameters have been made. The thematic maps produced are landscape, slopes, aspect, georpholo-gy, soil types, land use, erosion risks.
Results and discussion. Three main different land uses have been identified: shrublands (63%), cultivated land for cereals (35%) and fallow land (2%) Also 400 ha have been afforestated with Pi-nus halepensis on Leptosols, modifying the topography and destroying the vegetation, although the final result of this afforestation remains unclear
Land capability for agriculture and forestry use have been assessed and several thematic maps have been produced Results obtained have shown that both land uses should be restricted to few areas (below 5° slope) such as valley bottoms and glacis To identify the more sensitive areas, a map of erosion risks has been produced In order to avoid undesired environmental impacts leading to increase erosion, land use of this esteppe should be restricted to the areas specified in the thematic maps
Conservation measures should consider abandonning the agricultural use of the more improduc-tive (less than 1 t/ha of cereals) and marginal lands and to recover the original vegetation of shrubs. The use of IDRISI has proved to be costly efficient and a very useful technique to process a large database and to produce thematic maps.
326

INFLUENCE OF TERRAIN ON TEMPORAL/SPATIAL VARIABILITY OF GROUND WATER IN SEMI-ARID AREAS
G. Saeed Khan and M. Ikram, Soil Survey of Pakistan, Lahore - Pakistan
Introduction. In the arid and semi-arid areas, where irrigation is necessary for successful agriculture salinity and/or sodicity are of common occurrence through out the world and Pakistan is no exception. Ground water depth and quality have been widely reported to have a significant role in the salinization/sodication of soils in such areas. Seasonal fluctuation of water tables in these soils is one of the most important characteristics, influencing their use and management. Furthermore rising water table limits natural drainage and hinders leaching of salts. The problem of drainage, a pre-requisite for amelioration of such soils, is quite complex mainly due to unfavourable terrain conditions, fine textures and/or poor structures resulting in reduced drainable pores (Khan et al, 1992). The present study was undertaken to find out: salt and depth dynamics of ground water; quantitative relationship of the ground water (quality/depth) both temporal/spatial and characterization of the soils with respect to its relevant physical and chemical properties.
Methods and Materials: The study was initiated in 1989 and is till continuing. More than six hundred auger holes, upto the ground water depth, were made along six traverses in different landforms of (Late) Pleistocene to Recent terraces and different textural units in three typical seasonal cycles of the year i.e. Autumn Pre-monsoon (Summer rain) and Post-monsoon. Ground water and soil samples were analysed according to standard procedures.
Results and Discussion: The main landforms/textural units covered were: Pleistocene terrace:. A. Silty+clayey (Plains.Bar/Levee Remnants, Indistinct Basins and Basin Margins, Distinct Basins) B. Loamy (Plains, High Bars and Levees) Subrecent flood plains:
Silty (Plains, Bars and Levees) Recent flood plains:
Silty (Meander Bars and Levees)
Data of ground water depth (Table la and b) showed a great heterogeneity in all the above mentioned landforms and textural units. The relative ground water depths in the different landforms were as follows: In Pleistocene Terrace:
Level Plains > Basin/Channel Margins > Basin/Channel Fills Bar/Levee Remnants > Plains > Distinct and Indistinct Basins.
In Subrecent and Recent Flood Plains: Subrecent flood plains > Recent flood plains.
In general water table remained deepest in Pleistocene terrace followed by Subrecent and Recent flood plains. Tht above pattern followed natural catenary sequence. The data also indicated a great seasonal variation in both depdi and quality of ground water (Fig. I) due to temporal/spatial variation. High significant variation in ground water depths affected the land capability differendy in premonsoon, postmonsoon and Autumn seasons. So great care should be taken in assessing the land capability and crops suitability in such areas. Correlation studies showed a significant influence of distance from canals/rivers and drains in the area on ground water depth.
Ground water quality data revealed that major portion of the ground water was unfit for irrigation, especially in Basin and Channel Margins/Fills. The electrical conductivity (EC) ranges were higher in Postmonsoon than Premonsoon season showing highly significant variation. Generally increase in EC was found with the increase in water
327

table depth. This might be due to the local influence of saline/saline sodic soils as also reported by Khan et al, 1991. The sodicity was also high and followed similar trends as that of salinity (EC).
The excess of the Mg2+ in ground water under all landforms/textural units indicated the presence of minerals containing Mg2+ which was released on weathering. Similar observation was also made by Khan et al. 1991. continuous use of this water had been found to be harmful to the soil properties and plant growth.
Conclusion: The study showed variable temporal and spatial fluctuation/cariation in ground water in various landforms. Most of the ground water were saline/saline sodic, hence its indiscriminate use would result inland degradation. Water table depth was found to be controlled by the physiographic position, texture/structure of soils, precipitation/evaporation, lime concretion's depth, lamination of layers, if present, and land use of the area.
Table la.
Landforms/Textural Units Ground Water Depth (Cm)
Landforms/Textural Units Premonsoon Range Postmonsoon Range Autumn Range
- Pleistocene terrace - Subrecent flood plaias - Recent flood plains
162-465 192-386 229-306
58.9-354 174-337 241-299
73-355 16-350
220-292
Table lb.
Landforms/Textural Units Salt Concentration (EC dS m.,)
Landforms/Textural Units Premonsoon Range Postmonsoon Range Autumn Range
- Pleistocene terrace - Subrecent flood plaias - Recent flood plains
(0.59-3.22) (0.68-1.27) (0.44-0.54)
(0.44-3.59) (0.80-1.78) (0.43-0.64)
(0.48-3.30) (0.82-2.05) (0.45-0.58)
Figure 1 Heterogeneity in Ground Water Depth/Quality in Different Landforms/Textural Units.
Literature Cited Khan, G.S., M. Ikram and M.T. Afzal, 1992. Temporal/spatial variability of ground water tables in drainage of problematic soils. Proc. 5th Inter. Drainage Workshop, ICID. Pakistan.
328

Evaluation of Soil Buffer Capacities Using Geostatistical Techniques and GIS in an Area Under Wastewater
Irrigation in Mexico J.L. Palacio-Prieto2 Ch. Siebel, and L. Luna Dominguez2. Institute de Geologia 1) Jnstituto de Geografla 2), Universidad Nacional Autónoma de México, México
Introduction. In the Irrigation District 03, 80 km North of Mexico City, untreated sewage effluent is used to irrigate of 85 000 ha since the beginning of this century. Recent studies demonstrated that heavy metal contents of the soils have been increa-sing significantly with time under irrigation, mainly in the upper 30 cm (1). Of the added metals to the soils through wastewater irrigation less than 0.3% are immediat-ly mobile, and more than 50% are associated to soil organic matter. In order to prevent future mobilization of heavy metals, the buffer capacity of the soils in the Irrigation District should be improved, for instance by addition of organic matter and liming. The aim of the present investigation was to elaborate a cartography of selected soil parameters, and to create a map showing areas with relatively low, medium and high soil buffer capacities in order to facilitate future planing and assesment to prevent contamination of groundwater and agricultural products.
Materials and Methods. A soil data base facilitated by SARH (Mexican Ministcry of Agriculture and Water Resources) containing annual routine analysis of the upper 30 cm of soils at 204 sites from 1976 till 1989 was used to determine the spatial variability and distribution of selected physical and chemical soil parameters. Minimum and maximum distances between sampling sites were of 450 m and 6 2850 m respectively. Semivariograms were estimated to describe spatial dependence of pH and organic matter. Based on the results of the semivariograms, a cartography of these parameters was prepared through interpolation using "kriging". Additionally a cartography refered to percentage of clay was prepared using an interpolation "wheighted moving average" procedure. Maps showing soil textural classes and areas differenciated according to time under irrigation and irrigation water quality, as well as distance to the actual groundwater table were obtained by processing data using a Geographical Information System (GIS). Results and Discussion. The semivariogram of pH resulted to be directional (direction: 45°; tolerance: 22,5°), and showed a pure nugget effect, indicating that
329

significative variations occur at distances below 450 m. The semivariogram of organic matter was omnidirectional and fitted best to an exponential modell. The nugget effect is also present, but spatial dependece exists up to distances of 4 015 m. The resulting maps after kriging interpolation show areas with pH higher than 8, and areas with pH between 7 and 8. Also areas with organic matter contents lower than 3%, between 3 and 4% and higher than 4% can be delineated. With respect to clay contents 3 areas can be differenciated: lower than 20% clay, between 20 and 40% clay and more than 40% clay. Through overlapping of these 3 maps in a GIS, 24 zones differenciated by these 3 characteristics can be localized. These were simplified by introducing factors wheighting the contribution to soil buffer capacity according to the following:
factor: 0 1 2
PH <7 7-8 >8 organic i natter [%] <3 3-4 >4 clay [%] <20 20-40 >40 The resulting map shows an area of relatively high soil buffer capacity in the Central East of the Irrigation District, and areas with relatively low buffer capacities in the Western part of the District. Additionally, a map showing distances to groundwater table marks 3 areas highly endangerd by groundwater pollution A comparison with the maps of time under irrigation and water quality used for irrigation shows that the area of highest relative soil buffer capacity is coincident with the area being longest under irrigation with untreated wastewater. This supports the findings of earlier investigations, that soil buffer capacities are increased by irrigation with raw v astewater mainly due to the input of organic matter and sodium, which indirectly increases the pH of the soils. Nevertheless wastewater pretreatment has become emminently necessary in order to prevent actual health risks (2) and further heavy metal accumulation (1). The cartography done by this investigation provides an important tool for future management of the Irrigation District 03. Literature cited: (1) Siebe, Ch. (1994, in press): Akkumulation, Mobilitat und Verfiigbarkeit von Schwermetallen in langjahrig mit stadtischen Abwassern bewasserten Boden in Zentralmexiko. Dissertation. Hohenheimer Hefte, Institut fiir Bodenkunde unc Standortslehre, Universitat Hohenheim, 227 S. (2) Cifuentes, E., U. Blumenthal, G. Ruiz-Palacios & S. Bennett (1991/92): Health impact evaluation of wastewater use in Mexico. Public Health Rev. 1991/92; 19. 243-250.
330

DESCRIPTION OF TABASCO, MEXICO SOILS ,USING GEOGRAPHIC INFORMATION SYSTEMS
A.Bravo*, G. Medina G., R. Martinez P. and V. Gonzalez. Institute National De Investigaciones For estates y Agropecuahas. Apdo. Postal 18, Cater a de V.R., Zacatecas, México.
Introduction. The agriculture of Mexico is restricted by climatic and soil factors. This represents an important challenge for researchers to locate geographical zones with the best yield potential and to apply the convenient technology. In this sense, it is necessary to know the geographical conditions where some characteristic factors are repeated at regional cultivable areas. This study is part of the National Project of Growth Potential of Plant Species, to reorganize the use of soil, and produce each specie with higher advantage. In this paper is used as example Tabasco state, México. The objectives of this study were: 1) To establish a geographical database of soils, with flexibility to generate specific products. 2) To identify and select soils type, with high growth and yield potential for plant species, and high potential of soil degradation. 3) Offer actions to reorganizate the use of the soil, based on an increment of crop productivity. A Geographic Information System (GIS) is a database management system for map-oriented data. For any region, a set of maps can be added to the database as digitized images to represent different data topics describing the region. Within each data topic, homologous regions are identified, and attributes describing those regions are stored in tables that reference the map of the data. GISs then offer several features for manipulation of the graphical and tabular data. For instance, if data for field boundaries, crop and soil type, was included in a GIS for a given farm, GIS could quickly calculate and display on a map all regions within selected cotton planted in heavy clay soils. Alternatively, if weed histories were available in a map form, all cotton field planted with high risk nutsedge areas could be displayed to help farmers in early weed control decisions. However, like any database, a GIS is static and contains no domain specific knowledge to help its users manipulate their database. Recently, researchers have attempted to integrate GISs with expert systems to make them much more powerful (1,2 ).
Materials and Methods. Topographic information was used from the Digital Elevation Model of Institute Nacional de Estadistica Geografia e Informatica (INEGI). Elevation information was taken every 30 arc seconds for latitude and longitude. A grid, with an elevation value every 900 x 900 meters was made. A digital elevation model was used to determine the slope of the land. The edaphic information of a map (scale 1:250,000) of INEGI was digitized by the Geographic Information System (GIS) ARC/INFO. The first database was used to obtain images of each states with altitude and slope. The second was used to obtain images by state with soil units, physical and chemical phases, texture and soils depth. All images were handled with the IDRISI GIS. The database in the system permits to change the criterion of regional data and encounter new relations among variables, this can determine potential areas for any specie. For each species a map was generated with the geographic position and areas in hectares. The Hadware used was: 1- GTCO Roll-Up Digitizer (16 button cursor). It converts the position of the transducer into data for computer processing. Data output from the digitizer is in the form of an XY coordinate pair pinpoint the location of the cursor on the tablet surface.
331

2.- Computer PC 80486, 50Mhz, 8 Mb en RAM y 1.3 Gb in Hard Disk. 3.- Color Graphics Printer, HP PaintJet XL. The Software used was: 1 - The Geographic Information Systems (GIS), ARC/INFO., For the digitizer of edaphologic information map. 2.- The Geographic Information Systems (GIS), IDRISI. For the entry, storage, management and display of raster images. 3 - dBASE III Plus. To create the database of polygon outlet the digitizer. 4 - DPAINT, for edit the outlet images. Results and Discussion. The results of elevation and edaphic database in Tabasco state are presented. The most frequent elevation in Tabasco state, are less than 100 msnm (96.6%) and the slope is less than 4% in the 96.43 %. The clay texture soil is the most frequent with the 69.66 % the state's area. Eighty two percent of state's area has deep soil and the rest of the state has physics phase and litosol soil. Thirty seven soil units for the primary soil was registrated and the predominate soil unit, is Gleysoles with 645327 hectares, (26.87%). The requirements of soil units for the rice are: gleysoles, vertisoles and fluvisoles, and Tabasco state have 681210 hectare (28.36%). This study can be important to order the soil resources in Tabasco state, and to take this as start point of sustainable development. These results are important in the conversion of areas and crops to better use of soil conditions.
Literature Cited. (1) Robinson.V.B..A.U.Frank and HA. Karimi. 1987. Expert systems for geographic information systems in resource management. Al Applications in Natural Resource Management 1 (l):47-57.
(2) White, W.B. and B.W.Morse. 1987. Aspenex: An expert systems interface to a geographic information systems for Aspen management. Al Applications in Natural Resource Management 1 (2):49-53.
332

Analyse spatialisée des potentialités agricoles de la RH36
Ch. Bouvier, J. Estrada Avalos, ORSTOM, Ciceron 609, 11510 Mexico DF, Mexico, CENID-RASPA, A.P. 225B, 35078 Gomez Palacio (Dgo), Mexico-.
Abstract : In order to perform maps of landscape use planning, the geographic and climatic datas of the Mexican Hidrological Region 36 (RH36) were integrated into a GIS. The soils, the geomorphology and the climatic balance lead to a first evaluation of landscape use abilities. A basic map is shown to highlight the method and the results in case of seasonal agriculture.
Introduction : La region hydrologique n°36 couvre une superficie de 90.000 km2, dans le nord du Mexique. La representation spatialisée des sols, des variables climatiques et géomorphologiques permet de définir un premier niveau des potentialités agricoles, établi a 1'échelle d'une zone test définie par un carré de 5500 km2.
Données et methodes : Les cartes de potentialités agricoles ont été établies a l'aide des données de sols provenant de la carte thématique de 1'INEGI au 1/1.000.000, de données d'altitudes et de pentes obtenues a l'aide du MNT fourni par 1'INEGI, a 1'échelle de mailles carrées de 92 m de cöté, de données climatiques recueillies sur un ensemble de stations couvrant 1'ensemble de la RH36.
Les données climatiques ont fait 1'objet d'un travail de régionalisation, permettant de définir les relations entre les altitudes d'une part, les pluies et les temperatures mensuelles d'autre part (1)(2)(3). On a ensuite calculé les ETP mensuelles, a l'aide de la formule de Thorntwaite (5), exprimées en fonction des altitudes a l'aide des relations régionales entre climat et relief. On obtient finalement une evaluation spatialisée du bilau climatique mensuel en fonction des altitudes, que 1'on peut représenter a l'aide du MNT. Les potentialités liées aux sols ont été classées en 3 niveaux - bon, moyen, médiocre - en fonction des types de sols et des phases physiques.
L'élaboration des cartes des potentialités agricoles consiste ensuite a superposer ces différents plans d'information a l'aide d'un SIG (4), après avoir défini les critères correspondant a chaque type de culture. Il y a done lieu de fournir autant de cartes qu'il y a de types de cultures différenciés.
Résultats et discussion : La methodologie est illustrée par un exemple représentant le cas d'une culture saisonnière associée a des caractéristiques moyennes définies par 1) un bilan climatique positif pour au moins 3 mois consécutifs, 2) des pentes inférieures a 5%, 3) des sols suffisamment profonds et riches en matière organique, sans encroutement ni pierrosité.
Sur la zone de test, les sols ont fait 1'objet d'une classification définissant leur potentialité propre. On a ainsi associé (fig. 1) les Litosol, Planosol, Solonchak, Regosol, et les sols peu profonds (phase physique lithique) a des conditions défavorables; les Feozem, Xerosol et Rendzine encroutés ou conglomérés (phases physiques petrocalcique et pierreuse) a des conditions moyennes; les Feozem, Xerosol et Yermosol sans phase physique a des conditions favorables.
333

Le bilan climatique mensuel, exprimé en fonction des altitudes, est minimal en mai (tab. 1). La période optimale sur 3 mois correspond a ju'11- t, aout et septembre. On déduit des altitudes fournies par le MNT une representation spal.'tilis.'ï de ce bilan. Les pentes sont également déterminées r - ^ j ^ ^ ^ ^ j ^ - j — j—j J^J{ g^j ^ ^ j ^ r directement par 1 3 0 0 _ 1 9 7 .3 1 7 . 5 3 9 _79R . 1 0 4 5 . 9 1 7 _ 6 2 6 . 5 4 1 _26 8 -26.8 -39 6 -22.3 le MNT. 1800 -16.7 -29.9 -49.6 -67.0 -79.8 -41.0 1.3 11.9 18.1 -10 3 -33.1 -18.8 La superposition 2300 -13.2 -27.5 -44.8 -55.1 -57.7 5.6 62.2 75.3 62.9 6.8 -26.0 -14.6 des différents Tab. 1 : Relation entre bilan climatique mensuel ,en mm. et altitudes, en m plans d'information permet d'élaborer la carte des potentialités relative a eet exemple (fig. 2). A partir de eet exemple, la methodologie doit maintenant être étendue a l'ensemble de la RH36. et ce pour différents types de potentialités : différentes cultures saisonnières, mais aussi agriculture irriguée, voire élevage. Etant évident que la qualité des documents dépend de la qualité des données intégrées dans le SIG, mais aussi du nombre de facteurs pris en compte, on cherchera maintenant a améliorer les relations régiónates etttre taliof at climat? a affiner le calcul des ETP; a caractériser les sols a une échelle plus fine; a intégrer de nouveatix"faCfcurs>, aussi kien physiques que socio-économiques; a préciser les risques climatiques lies a telle ou telle activité; dans le cas d'activités faisant intervenir des flux hydrologiques, a caractériser et intégrer les potentialités de stockage de 1'eau, 1'impact sur les zones situées en aval.
Fig.l : Localisation et potentialités des sols Fig.2 : Exemple des potentialités agricoles
En conclusion, la multiplicité et la diversité des potentialités agricoles montrent qu'il est indispensable de disposer d'une methodologie puissante pour élaborer ces documents, methodologie pour laquelle les différents outils d'analyse spatialisée s'avèrent tres précieux.
Littérature citée. (1) Loyer J.Y., Estrada A. J., Jasso R. I., Moreno. D. L. Editores. 1993. Estudio de los factores que influencian los escurrimieBtos en la Region Éïidrolo&tca 36. ORSTOM - CENID RASPA. Gómez Palacio, Dgo. México, M%<. (2) Estrada A. J., Bouvier Ch.. Descroix L. 1993. Regimen pluviométrico. bn : Loyer et al. (3) Garcia H. G. 1993. Variabilidad de los elementos del clima. En : Loyer et al.. (4) ORSTOM. 1989. SIG SAVANE, documentation de 1'utilisateur, guide de 1'utilisateur, exemples d'applications. Editions de 1'ORSTOM, 120p. (5) Roche, M. 1963. Hydrologie de surface. Gauthier-Villars Editeur, Paris, 430p.
334

Assessment of Ground Water Pollution Using a Geographic Information System
J.M. Hamlett, G.W. Petersen*, S. Harrison, G.M. Baumer, L. A. Deichert, S.R. Messier, and M.C. Anderson. College of Agricultural Sciences and the Environmental Resources Research Institute, The Pennsylvania State University, University Park, PA, USA
Introduction. Ground water has become increasingly important for domestic, commercial, and industrial uses in Pennsylvania and the United States. Over one-third of Pennsylvania's population depends on quality ground water for its daily needs (USGS, 1986). Across rural America, ground water has been documented as the prime source (more than 95%) of drinking water supply. The quantity and quality of these subsurface water supplies depend on activities occurring at, or near, the land surface. Efforts must be directed at assessing the potential deterioration/degradation of those subsurface supplies and protecting ground water from excessive pollution.
The study reported herein evaluated the relative ground water pollution potential for the 478 ground water subbasins in Pennsylvania. Specific objectives were: to acquire/develop appropriate statewide data layers to allow a subsurface pollution potential assessment; to conduct a statewide screening of agricultural nitrate ground water pollution potential; and to assess the relative agricultural pesticide pollution potential of ground water. Such an assessment allows an identification of those ground water subbasins that are most susceptible to potential pollution from agricultural activities, thereby assisting in targeting control programs and/or more specific assessments.
Materials and Methods. A statewide GIS database (at 100-m resolution) to allow an initial assessment of ground water pollution potential was developed through efforts of this study and a previous statewide surface water ranking (Hamlett et al., 1992). The database includes data layers such as precipitation (probability based by month and annually), hydrography, soils, topography, geology, animal type and distribution, land cover, ground water subbasins, pesticide use by crop, minor civil subdivisions, depth to water, average net recharge, etc. All data layers are registered to the 100-m resolution digital database. Attribute data for soils, geology, ground water quality, chemical-nutrient use, cropping, etc. are also incorporated in the database. Data for this database were acquired from various sources.
An indexing model to rank the relative nitrate pollution potential of the ground water subbasins was developed. The model considered the potential for nitrate pollutant generation and the relative susceptibility of nitrate movement from the surface through the soil and vadose zone to the subsurface aquifers. The initial indexing was conducted using the available statewide data (scale of 1:250,000), the modified DRASTIC model (see Aller et al., 1987), and ARC/INFO and ERDAS software. DRASTIC uses a numerical ranking system to assess the ground water pollution potential for hydrogeological settings. A statewide map from observed data from approximately 3,000 wells was produced showing the nitrate-N levels across the state. Those data were then compared with the DRASTIC rating of potential nitrate pollution.
The statewide ranking of ground water susceptibility to pesticides considers factors such as depth of soil, soil type, geology, depth to water, precipitation, percolation, topography, crop type and
335

pesticide type and use. The assessment consisted of two parts, a soil and hydrogeologic pollution attenuation potential and a rating of leachability of pesticides used with the subbasins. Pesticide DRASTIC (Aller et al., 1987) was used as the basis for determining the relative hydrogeologic vulnerability of the ground water subbasins to pesticide contamination. The soil leaching component from the SCS Soil-Pesticide Interaction Screening Procedure (SPISP) (Goss and Wauchope, 1990) was incorporated to strengthen the soil factor in the Pesticide DRASTIC model. The Groundwater Ubiquity Score (GUS), a pesticide screening model (Gustafson, 1989), was used to develop a relative ranking of pesticides according to their potential leachability. GUS assesses pesticide leachability according to persistence and mobility of the pesticides and relies on physical properties of the pesticide. The statewide pesticide use data (estimated from crop acreage and recommended pesticide use) linked with GUS and the modified Pesticide DRASTIC were combined to provide an overall assessment of groundwater subbasin pesticide pollution susceptibility.
Results and Discussion. A statewide database useful for resource assessment has been compiled and used for initial ground water nitrate pollution potential. Data layers (at a 100-m resolution, 1:250,000 scale) include watershed boundaries, land use, soils, topography, precipitation, animal density, and geology. Additional and updated data are being added to this database as they become available. Such a regional or statewide database will prove extremely valuable in identifying critical areas that are most susceptible to ground water pollution and for other resource assessments.
The relative ranking of nitrate pollution potential of ground water in Pennsylvania was conducted. Areas of Pennsylvania were rated as low, medium, or high relative to nitrate pollution potential. Regions under the most intense agriculture, with the shallowest ground water aquifers, and with Karst topography are most susceptible to nitrate pollution. Initial model results, on a relative basis, compared favorably with nitrate concentrations in well water. Additional nitrate assessments and revisions are ongoing. The pesticide pollution potential ranking, has not been completed at this time but initial results should be available early in 1994.
Literature Cited (1) Aller, L., T. Bennett, J.H. Lehr, R.J. Petty, and G. Hackett. 1987. DRASTIC: a standardized system for evaluating ground water pollution potential using hydrogeologic settings. EPA 600/2-87/035. (2) Goss, D. W. and D. Wauchope. "The SCS/ARC/CES Pesticide Properties Database: II. Using It with Soils Data in a Screening Procedure." In Pesticides in the Next Decade: The Challenges Ahead, Diana L. Weigman, Editor. Virginia Water Resources Research Center. Blacksburg, VA, 1990. pp. 471-493. (3) Gustafson, D.I. 1989. Groundwater Ubiquity Score: A Simple Method for Assessing Pesticide Leachability. Environmental Toxicology and Chemistry 8:339-357. (4) Hamlett, J.M., D.A. Miller, R.L. Day, G.W. Petersen, G.M. Baumer, and J. Russo. 1992. Statewide GIS-based ranking of watersheds for agricultural pollution prevention. Journal of Soil and Water Conservation 47(5):399-404. (5) United States Geological Survey. 1986. National Water Summary, Ground-Water Quality: Pennsylvania. Harrisburg, PA.
336

Micro-Soil Survey of the EI Verde LTER - Hurricane Recovery Grid, Commonwealth of Puerto Rico
H. R. Mount, W. C. Lynn, and R. L. Vick. U.S. Department of Agriculture, Soil Conservation Service, Lincoln, Nebraska and Hato Rey, Puerto Rico, USA.
Introduction. To understand, classify and map in detail the soils on the El Verde Long Term Ecological Research (LTER) Hurricane Recovery Grid, soil properties have been identified and recorded. The 16 hectare grid has been a subject of intensive study since its establishment following the forest destruction from the landfall of Hurricane Hugo in September 1989. All woody vegetation larger than 1 centimeter in diameter at breast height has been measured and located on the "Big Grid" by LTER personnel. This soil survey project fills the void of data needed by researchers examining the ecosystem processes of the "Big Grid".
Materials and Methods. The soil survey of the Caribbean National Forest, mapped at a scale of 1:20,000, identified the soils of the LTER as Zarzal-Cristal complex, 20 to 60 percent slopes. The 16 hectare El Verde "Big Grid" is surveyed and marked in cells five meters square. A detailed micro-soil survey using this grid as reference and base was prepared at a scale of 1:1575. A random sampling also was made on 64 of the 6400 five meter grid cells. Stone and boulder cover was measured on these cells to estimate the extent for the "Big Grid" and to support the phase names for the map units. Along one side of each sampled cell, binomial measurements were performed at 25 centimeter intervals to estimate coarse fragment content (2 millimeters to 25 centimeters) and nonliving plant residue on the soil surface. A total of 17 sites were sampled from pits 30 centimeters square, excavated to a depth of 1 meter. Auger samples were taken below that depth. Descriptions were prepared and samples were collected and analyzed according to SCS standards (Soil Survey Staff, 1951 Soil Laboratory Staff, 1992). Sites were selected to represent each of the soils present and to get a scatter on the grid to aid in estimating areal extent of soil properties, particularly organic carbon.
Results and Discussion. The micro-soil survey was consistent with the 1992 survey of the Caribbean National Forest. A total of 76 map delineations consisting of 23 map units were made. The soils map was digitized for analysis in a GRASS GIS system. Climate conditions of 2500 mm of precipitation and the high content of clay in the volcanic saprolite has resulted in the development of freely drained Oxisols and Ultisols with epiaquic soil conditions. The dominant soils were of the Zarzal series (very-fine, kaolinitic, isohyperthermic Typic Kandiudox) at 67 percent, and the Cristal series (clayey, kaolinitic, isohyperthermic Aquic Haplohumults) at 23 percent. Minor soils sampled and mapped included the Prieto series (fine, mixed, nonacid, isohyperthermic Typic Tropaquepts), the Coloso series (fine, mixed, nonacid, isohyperthermic Aerie Tropic Fluvaquents) and unnamed Fluvaquents soils occurring along the two perennial stream channels dominated by boulders. A toposequence examining the wetness relationships of the Zarzal, Cristal and Prieto soils was examined along a 10 meter line. Results of laboratory analysis was provided by the National Soil Survey Laboratory, Lincoln, Nebraska.
On the 64 grid cells, 25.0 percent of the surface area was covered by stoned and boulders. Results were used in supporting the naming of map units for stone and boulder classes. The
337

binomial count on coarse fragments on the soil surface averaged 13.4 percent. The binomial count on nonliving plant residue on the soil surface averaged 77.0 percent.
References. (1) Huffaker, Loren. 1992. Soil Survey of the Caribbean National Forest and Luquillo
Experimental Forest, Commonwealth of Puerto Rico. USDA-Forest Service. Unpublished manuscript.
(2) Soil Survey Staff. 1951. Soil Survey Manual. USDA-SCS Agric. Handb. 18. U.S.Gov.Print. Office, Washington DC.
(3) Soil Survey Laboratory Staff. 1992. Soil Survey Laboratory Methods Manual, Soil Survey Investigations Report No.42. National Soil Survey Center, Lincoln, Nebraska.
338

Geographical information system approach to environmental modeling of small rural catchments
R. Moussa*, P. Andrieux, M. Voltz, R. Bouzigues and P. Lagacherie. Institut National de la Recherche Agronomique, U.R. Science du Sol, 2 place Pierre Viala, 34060 Montpellier Cedex 1, FRANCE.
Introduction. Direct surface runoff, channel flow and consequent effects of erosion, sedimentation, chemical and nutrient transport, are affected by the spatial variability of soils, topography, land use and cover, climate, and human-induced changes and management. Because contaminants are transported by runoff to surface waters and by infiltration and deep percolation to groundwater, hydrologie processes are often at the core of water quality and quantity concerns (1). Water quality and quantity is dependent on spatially distributed attributes of a catchment. The integration of the spatial data handling capabilities of Geographical Information System (GIS) with a distributed hydrologie model offers the advantages associated with utilizing the full information content of the spatially distributed data to analyse the hydrologie processes (2). An advantage of this approach is the ease with which it will be possible to investigate how the runoff may have changed over a modification of land-use and to estimate the efect of proposed future developments. A central issue in this approach is how to deal with the problems of scale and spatial variability, particularly for physically based distributed models (3). This paper focuses on the linkage between distributed hydrological process models and Geographical Information System. The general objective is to understand the spatial and temporal variability of hydrochemical processes that is imposed by the spatial variability of soils and the temporal variability of rainfall regimes and the agricultural practices. Experimental and modeling approach are conducted at field and catchment scales (1 km2) and forms part of an interdisciplinary research project supported by the french National Institute for Agricultural Research (INRA). They aim i) to identify the main hydrological processes, ii) to define terrain-based rules for stratifying the catchment into hydrological response units, iii) to provide local and global data sets for developing and validating a distributed modeling approach and iv) to interface water and contaminant transport processes.
Materials and Methods. The study of a rural catchment was started in 1992. The Roujan catchment is located at Roujan about 60 km west of Montpellier (South France). It is almost entirely covered by the vineyards and has a surface of 91 ha. The catchment is equiped by one meteorological station, four rain gauges, one streamflow recorder at the outlet of the catchment, two streamflow recorders at the outlet of fields (surface of 1300 m2 and 3600 m2), eight tensio-neutronic sites, seventeen piezometers and twenty monitoring sites of water geochemistry. These preliminary investigations were designed to identify the magnitude and the spatio-temporal variability of the main hydrological processes and to optimize the sampling designs. It also allowed to test the accuracy and the reliability of the equipments. Geographic Information System, here ARC-INFO, is designed to store, manipulate, and display geographic information and spatial data such as maps of soils, channel network, subcatchments, slopes, topography and land cover. Digital Elevation Models (DEM) are used to automatically map the drainage network and divide catchment into subcatchments. GIS allows both the integration of spatial data into hydrologie units and the determination of relations between
339

these units through the drainage network. This form of discretization of a catchment produces natural units for problems involving water flow as either a surface or subsurface flow phenomenon. The spatial database that is constructed by these techniques forms the basis for an efficient hydrologie information system for any environmental phenomenon.
Results and Discussion. The first step is to analyse hydrological processes : precipitation, evapotranspiration, runoff, infiltration, groundwater storage and channel outflow. Figure 1 shows, for example, the hydrographs observed for runoff at two scales : a single field and the catchment. When the rate of rainfall exceeds a threshold, direct runoff is produced. Runoff transfer from the fields to the outlet of the catchment is fast (mean response time of two hours) due to the existence of a dense network of ditches.
outflow (!/•) T h a Roujan catchment : event of 24-25 May 1992. Runoff characteristics
(11 h to 18 h)
Zone Field Catchment Area (ha) 0.133 91 Rainfall "R" (m3) 62.5 43 240 Outflow "0" (m3) 16.6 3 146 Q/R (%) 27 7
Tlrrm (hour»)
Figure 1 : Analysis of a runoff event.
The second step is to form hydrologically homogeneous units based on the soils, land cover and topography. Four topographical domains were distinguished within the catchment using a DEM resolution of 20 m : central depression, glacis, terraces and plateau. The basic information on soil type was the INRA 1:2000 soil map. Soils and geological outcrops differ markedly between these topographical domains. A group of field parts condtitutes the hydrological units. The runoff from each unit is estimated using a deterministic model and then routed through the ditches network to the downstream outlet to give the full hydrograph. The hydrological model is still undergoing development. At this time, the algorithms for the analysis of the drainage characteristics have been developed, the soil classification has been made, and a hydrograph resulting from incident rainfall has been calculated.
Literature Cited. (1) DeCoursey D.G., 1991 Environmental features important in nonpoint-source models -Crop growth and influence of management on soil properties. In : Recent advances in the modeling of hydrologie systems, Ed. D.S. Bowles and P.E. O'Connell, NATO ASI Series, Vol. 345, Kluwer Academic Publishers, London, pp. 241-268. (2) Vieux BE., 1992. Geographic Information System and non-point source water quality and quantity modelling. In : Terrain analysis and distributed modelling in hydrology, Ed. K.J. Beven and ID. Moore, Wiley & Sons, Chichester (G.B.), pp. 169-181. (3) Beven K.J., 1989. Changing ideas in hydrology : the case of physically-based models. J. Hydrol., 105 (1/2), pp 157-172.
340

Land Resource Information System and Its Application to Classify Land Importance in Taiwan
C. Lin , Y. W. Lin, T. H. Tsai, and T. S. Liu. Department of Soil Science, National Chung Hsing University, Taichung, Taiwan 40227, ROC.
Introduction. Land use policy have always been an intense issue in Taiwan, a country with population density ranked no. 2 in the world and notably for its successful economic blooming in recent decades. In the country of about 36,000 km2 of land area, detailed soil survey, intensive collection of climatic data, agricultural facility layouts, and productional records are well established or documented. These informations had been helpful in agricultural production, being highly intensive with two to three crops in a year all over the arable lands in the area. Land use planning and management were very much subjected to the rice-production oriented tradition in the past. Now, the less consumption of rice and more demands on vegetables, fruits and other high quality products by the people, in addition to the dramatic change in the social and economic sectors to request the releasing of agricultural lands for urban and industrial developments have brought the issue of land utilization to a complicated and sensitive one. The development of a geographical information system to support decision making for agricultural land policy became timely and urgent. It is the purpose of this study to show how a computer information system has been set up and, as an example of its application, to show how the system integrated some basic informations to classify the importance of each pieces of arable land, such that further release and transformation of the lands can be evaluated.
System Analysis. Configuration of the computer information system can be illustrated in Fig. 1. The functions of the system are shown in Fig. 2.
Problem Soii|
Suitability Map|
OBJECTIVES
OUTPUT DEV/ Printers Plotters
Fig. 1. Land resources information system
341

To classify land importance, FAO(1976,1984)suitability classification of the soil mapping units for 132 kinds of crops was followed and processed by GRASS(USA-CERL, 1991)in the computer information system, with the diagnostic factors being modified by local criterions(COA, 1980). The suitability classes of each mapping unit were then summed up and further divided into 10 classes serving as the bases for determining the importance of the mapping units. Subsequently, each soil mapping unit was checked by the conditions of irrigation systems, agricultural zoning, availability of machinery and planting services, and distance away from the center of products collection, quality check, and distribution for marketing. Each mapping unit would be upgraded its class as many times as a criteria of one of above conditions had been satisfied.
Results and Discussion. Results can be easily drawn from the established information system to show each class of land importance at every geographic area in Taiwan. Since the originally digitized maps have the scale at 1:25,000, the results are well applicable to township, county or national level. The number of crops been used to classified the land suitability as the bases for the assessment of land importance, can be adjusted according to the purpose or major agricultural productions in an area. As an example, Table 1. shows the statistics of hectare of each important class for different group of crops in Tainan county, one of the major agricultural counties in Taiwan. The data in class 1 and other higher classes reveal
Table 1: Area in hectare of each class of land importance for different type of land use in Tainan county
Type of Crops Class of Land Importance for Land Use 1 2 3 4 5 6 7 8 9 10
hood "SOTTT 156f6. 18261 m/4 6287 4635 3775 3951 2926 li Vegetable 29857 21993 24/46 6I4yO 75436 81290 74284 32174 14998 4159
1-ruit 630 9897 21579 52349 56830 35056 15784 3894 7037 3781 Mixed 533 4326 12690 21556 23113 21912 12309 41990 3719 72
the importance of foods and vegetables productions in this county. Similar types of data are available for other areas in the country. The land information system could be an effective tools and is almost matured for various applications in Taiwan as has been shown in Fig. 2.
Literature Cited. (1) COA. 1980. Farmer's handbook. Good Harvest Pub. Co., Council of Agriculture,
Taipei. (2) FAO. 1976. A framework for land evaluation. FAO Soils Bulletin, No. 32, Rome. (3) FAO. 1984. Guidelines: land evaluation for rainfed agriculture. FAO
Soils Bulletin, No. 52, Rome. (4) USA-CERL. 1991. Users and programmers manual for the geographical
resources analysis support system. USA-CERL ADP Report. N-87/22, Champaign.
342

Land degradation assessment in a GIS and evaluation of remote sensing data integration
D. P. Shrestha. Soil Science Division, International Institute For Aerospace Survey and Earth Sciences (ITC), Enschede, The Netherlands.
Abstract. The introduction of computerized database and geographic information system (GIS) has made the analysis of natural resources easier by making it possible to update and incorporate data in various analysis procedures. On the other hand, many systems are available commercially and the user is often confronted with a difficult decision in selecting the best system to solve his problem. A case study on the use of Arc/Info (ESRI, 1990) for a land degradation assessment is presented, including an assessment of remote sensing data integration.
Introduction. Land degradation was mapped in an area in Bangladesh. The area lies within Hathazari Thana, Chittagong district, and is occupied by Tertiary hills, piedmont and river valley. The folded hills run from north to south in several parallel ridges. The climate is tropical monsoon type, characterized by hot and wet summers (March to October) with an average monthly temperature of 26.7°C, followed by cool and dry winters (November to February) with an average temperature of 19.4°C. Annual rainfall is more than 2300 mm and occurs mostly during the monsoon season (June to October). Because of high precipitation, hill soils are very much leached, resulting in low fertility which can not support dense vegetation cover. This, in combination with steep slopes causes erosion. Land slides are also common. The dominant land use is rice cultivation in the valleys and rainfed agriculture in the hills. Shifting cultivation is also common. The forest is of mixed evergreen and deciduous type.
Materials and methods. The work was based on: (a) soil map of Hathazari Thana (SRDI, Bangladesh), (b) topographic map sheets (1:50,000), (c) Landsat TM data (6/4/1990), (d) IR aerial photos (Feb/Mar 1983) and (e) field studies. Arc/Info was used for data entry and processing. Maps were digitized and attribute data were entered. The Earth Resources Data Analysis Systems (Erdas Inc., 1991) was used for processing the Landsat TM data, where information related to cover was derived. Finally the data were converted into Arc/Info format for further analysis.
The main factor associated with the displacement of soil material through loss of top soil and land slides seems to be deforestation in the hilly areas, which is continuing at an alarming rate. Forest is cleared for either firewood collection or timber. This results in loss of top soil and destabilization of the hill slopes, hence inducing landslides. Field verifications indicated that lighter textured soil is more vulnerable to erosion and land slide risk than heavier textured soil, possibly because of reduced cohesion of the soil aggregates. Organic matter content also plays a role in making the soil resistant to erosion by improving the structure. These factors, in combination with slope gradient, seem to affect the land degradation process. Considering such attributes as slope gradient, soil texture class and organic matter content, an initial degradation assessment was made. On the basis of field studies, it was assumed that if the slope was steep and soil texture was loamy with low organic matter content (<1%), then the hazard class was high. No hazard was assumed for the conditions gentle slope, heavy-textured soil (clay to clay
343

loam) with high organic matter content. Intermediate classes were similarly defined.
Field studies indicated that where the vegetation cover was still intact (>75% cover), land degradation was not noticeable, but with decreased vegetation cover the problem was common. A green vegetation index (GVI) was computed using the sum normalized difference of near infrared and red bands of Landsat TM data. Finally, by level slicing, five cover classes (0-25%, 26-50%, 51-75% and >75% cover) were generated. The result was geo-referenced and converted into Arc/Info format to become one of the maps (coverages) for analysis. Field work also revealed that the intensity of deforestation was a function of distance from the settlements, brickfields or main roads, which in turn relate to soil degradation. Although the deforested area was within 2 km of settlements or roads, the villagers seemed to travel up to 5 km to collect firewood. To bring the proximity information into the data analysis, three buffer zones were computed (0-2km, 2-5km and >5km). In Arc/Info, analysis was carried out by map overlay procedures, and an initial degradation assessment was compiled. Finally the buffer zones were introduced in the degradation assessment. The result was plotted as a map at scale 1:50,000 by creating a plot file.
Results and discussion. Since most GISs work on the same principles, the result obtained by using one system is not necessarily different from the result derived from other systems. The main difference lies in the principle associated with vector- and raster-based systems. The main advantage of vector-based systems is that less hard disk memory is required; this is the main limiting factor in raster-based systems. Certainly, Arc/Info is a powerful system having many capabilities, and its precision must be appreciated. There are also various possibilities for plotting high-quality maps, which are lacking in other systems. But integration of remote sensing data in Arc/Info is not an easy task. Raster data need to be converted into vector format for analysis. The Landsat GVI image was converted into polygons in Arc/Info, which is not only time-consuming but also imposes a software limitation. If the number of arcs exceeds 5000 in a polygon, data conversion will not take place. After polygon conversion, the raster data require much space in the hard disk, which can be considered a major limitation in vectorising the remote sensing data in Arc/Info. Building the topology for the polygons also takes a larger space, often many times the space needed to store it. However, remote sensing data, which come in raster format are one of the main sources of data input for natural resource surveys and assessment. If remote sensing data play a major role in analysis procedures such as monitoring land resources, etc. where multi-temporal, multi-seasonal data become important, it may be preferable to work on a raster-based system.
References. - Erdas Inc. 1991. Image processing and multivariate image analysis, Erdas version 7.5, USA. - ESRI, 1990. PC overlay users guide, PC Arc/Info. Environmental Systems Research Institute, Redlands, CA, USA. - ESRI, 1990. PC data conversion users guide, PC Arc/Info. Redlands, CA, USA.
Acknowledgement. The author is grateful to SPARRSO, Bangladesh, for the opportunity to carry out the work. Sincere thanks go to Mr. M. A. Jabbar and Mr. Atiar Rahman from SPARRSO and Mr. S. Islam from SRDI, Bangladesh, for their contribution. Dr. Robert Vincent is gratefully acknowledged for his help in data processing.
344

Data integration of Soil Survey with Geological and Geomorphological information by means of TM - Landsat Image for Environmental Analysis in Marumbi Park in Parana - Brazil
H. O. da ROCHA*, N. L. B. GHANI**, D. SCHMIDLIN**, M. R. NANNI**, C. H. ROCHA**. *Departamento de Solos. Universidade Federal do Parana. **Curso de Pós-Graduaqao em Agronomia - Ciência do Solo. Cx. Postal 672, Curitiba - PR -Brasil.
Introduction. Orbital images and aerial photographs have been used for many goals especially for soil studies, as it can be checked in many papers. In this one soil occurrence was analysed by means of aerial photographs an TM-Landsat orbital images, for evaluating the spatial distribution, risky areas and environmental fragility as well in Parque Estadual Pico do Marumbi which is located in Morretes city in Parana, Brazil, at the geographical coordinates of southern latitude 25° 25' - 25° 30' and longitude 48° 53' - 48° 58'. The park area is mostly made up of Marumbi granite and also by homogeneous migmatite, and cut by many diabasio dykes (CORDAM & GIRARDI, 1967) (MAACK, 1961). The hill is made up of many peaks which give way to a mountaineous steep area where there is Marumbi which is 1,547 meters high. According to Koeppen classification the climate is Cfa. The vegetation if mostly made up of Ecological Refugees in areas which are over 1,200 -1,400 meters high and Dense Ombrófila Forest.
Materials and Methods. Aerial photographs (1:25.000), topographic maps (1:10.000), soil map at the recognition level (1:600.000), Morretes geological chart (1:75.000), pocket and mirror stereoscopic, a compass, GPS (Global Positional System), clinometer, altimeter, bionculars, a camera, a dutch auger, a pedological hammer and MUNSELL chart.
Image interpretation by means of adaptation of de phisiographic analysis described by BURINGH (1960). The Geoprocessing and the SGI (Geographical Information System) of SITIM-340 (System of Interative Treatmente of Image) allowed information interface. The coloured composition 5R-4G-3B in a codified image was interpreted directly from the monitor. For the evluation of soil aptitude we used EMBRAPA 1983. (fig. 1)
Results and Discussion. Two dominant soil groups are present. They are Litolic Soils and Cambissoil. Rock zones are very often associated with these two groups and stone groups were represented by granite material in the eastern side and migmatites in the west. There are some other rocks which are intrusive such as diabasios which are very few.
The highest erosion level is related to Pd3 level, which corresponds to a highly topographic area of Marumbi, which is dissected due to better developed soils in interfluvios. In surfaces of pediplanated - Pd2 erosion there are soils which are predominantly litolic and containing granites and there are Cambissoils in plain valleys. In Pdl surfaces there are soils which are derived from migmatites, where there are bad weathers very often and so fragile areas are formed. In areas of Sao Joao River watersheds it is very common for us to face reptation occurrence. The coluvios, either in soils derived from granites or migmatites, occur in areas which are formed by more developed soils
345

which have nonetheless very little expression. These areas are very fragile and instable. The soils in these areas are alic with A horizon preeminent, humic or peaty in pediplane areas, especially in Pd2 and Pd3 with medium clay texture or little clay activity. More developed cambissoils may also be observed with latossoil or podzolic tendencies.
The integration result of pedologic, geologic and geomorphologic aspects show that the areas are very dangerous, especially the ones close to Litolic soils which are derived from migmatites and areas in which Cambissoil are very thick, due to granite material.
Fig. 1 - Fluxogram of metodology
Estereoscopic Analisys Aerial fotographs (1:25.000)
Sample Field Preliminary Legend nary J
Treatment System of Image + Geographical Information System 5R4G3B Codificated Image
Environmental Units
Analisys and Interpretation of results - Database
Soil Classification + Legend
Geology Geomorphology Drainage MNT
SGI SOIL MAP APTITUDE LAND MAP
VALUATION OF RISKY AREAS AND ENVIRONMENTAL FRAGILITY
INTEGRATION SOILS + AGRICULTURAL APTITUDE + GEOLOGY GEOMORFOLOGY + DECLIVITY + DRAINAGE
Literature Cited. CORDANI, V. S.; GIRARDI, V. A. V. 1967. Geologia da Folha de Morretes. Curitiba: Boletim
UFPR, n. 26,p.6-9,jul. MAACK, R 1961. Sobre a ocorrência de granitos alcalinos no Estado do Parana e sua posicao
dentro das fases orogenéticas algonquianas. Curitiba: Boletim UFPR, n. 4, fev. EMBRAPA, 1984. Levantamento de Reconhecimento dos Solos do Estado do Parana. Tomo I e II e
Mapa de Solos escala 1:600.000. EMBRAPA, 1983. Sistema de Avaliacao da Aptidao Agricola das Terras.
346

Uses of Ground-Penetration Radar in Soil Investigations
J. A. Doolittle. United States Department of Agriculture - Soil Conservation Service, Chester, Pennsylvania, United States.
Introduction. Ground-penetrating radar (GPR) is an impulse radar system designed to penetrate earthen materials. As a geophysical tool, GPR provides rapid, high resolution, and real time interpretations of the subsurface. However, GPR is not suitable for use in all soils. Results are dependent upon the system used, the attenuation characteristics of soils, the reflective properties of subsurface interfaces, and the experience of the operator.
Materials and Methods. The radar systems used are the SIR System-3 and SIR System-8. Center frequency of antennas varied from 80 to 900 Mhz.
Results and Discussion. The United States Department of Agriculture - Soil Conservation Service has used GPR since 1981 to assess properties of soils which affect their use, management, and classification. Ground-penetrating radar techniques have been used most effectively in areas of coarse and moderately-coarse textured soils. These techniques are generally inappropriate for use in most fine-textured or saline soils.
Principal uses of GPR have been to estimate the taxonomie composition of soils, evaluate variations in soil properties, enhance sampling efficiency, extend the depth of observation, and increase the quality and quantity of soil data. In addition, GPR and computer processing techniques have been used to improve the understanding of soil-landscape relations and assess directions of local subsurface water flow. Examples from several studies conducted in areas having intricate soil patterns, diverse topography, or anisotropic subsurface conditions are discussed.
347

The Representation of Soil Moisture Variability using Variograms with Data Derived from an Airborne Thematic
Mapper (ATM) Donald A. Davidson and Alistair I. Watson. Department of Environmental Science, University of Stirling, Stirling FK9 4LA, UK.
Introduction. The importance of soil moisture estimation needs no emphasis given its relevance to crop water stress, evapotranspiration, hydrological modelling, denitrification, weathering, biological activity, geotechnical properties and land management. Field investigation of soil moisture has been seriously constrained by the conventional process of sampling soils to determine moisture content. The results are inevitably measurements at points in space and time. The monitoring of soil moisture is widely done using tensiometers and neutron probe techniques while increasing use is also being made of methods based on time domain reflectrometry and soil moisture capacitance. If concern is with spatial variability, these field techniques yield insufficient data given the limited sampling. As a result there has been considerable research interest in the use of remote sensing techniques to provide estimates of soil moisture. Through the use of such techniques after validation, estimates can be made of soil moisture for a large area which can then be analyzed using spatial analytical tools.
Methods. The aims of this project were first to investigate the extent to which soil moisture could be predicted using airborne thematic mapper data, and second to analyze the spatial pattern in soil moisture availability. Considerable advantages accrue if soil moisture can be satisfactorily predicted from imagery. If digital data from particular wavebands can be shown to correlate with experimentally derived soil moisture values, then the considerable dataset offers scope for applying geostatistical techniques to characterise spatial variability. In this study of soil moisture variability on alluvial land in the Tay valley, Scotland, use was made of imagery derived from the Daedalus AADS 1268, an Airborne Thematic Mapper (ATM) which generates data for 11 wavebands.
Transect lines were laid out in three sample fields to include maximum variability in soil moisture conditions. Marker boards (1.0 x 1.0m) were laid at the ends of the transects to ensure that the transects could be precisely located on the imagery. Samples were collected along these transects during the afternoon following the flight on June 12, 1992.
348

Results and Discussion. The outstanding result is the high correlation between waveband 11 values and soil moisture content; no other waveband produces a statistically significant relationship. Thus the image from waveband 11 digital numbers is taken to represent variation in moisture content and spatial analysis was undertaken using geostatistical methods. Model variograms were fitted to the experimental data. These models express the nature of spatial dependency in waveband 11 values and thus in moisture content. The range expresses the distance over which there is spatial dependency. Within the range, the closer together the sites, the more similar they are likely to be. The ranges for fields 1 and 3 are virtually identical and different from the result from field 2. The range values from the three fields in this study indicate average spacing of the areas with higher waveband 11 values - the areas of drier soil which are associated with the interfluves between the palaeochannels and where there are occurrences of coarser textured material adjacent to palaeochannels. The range value can be taken to indicate the size of objects in scenes. In this study, the objects correspond to areas of soil of low moisture content. The ranges for the three transects also indicate the distances over which soil moisture is inter-related. In other words, the ranges can be considered as expressing spatial frequency of tonal change, often called texture. Tonal change on the image results from soil moisture contrasts which are strongly influenced by old river channels and associated deposits. The interesting result is that the range value quantifies the frequency of tonal change and thus the nature of channels on this alluvial land. Contrasts are achieved between fields of very recent fluvial origin with braided palaeochannels and a field dominated by one older palaeochannel. An interpretation of sill values in terms of contrast can be applied to the transects from the three fields. The variogram for field 1 has a lower sill than the variograms for fields 2 and 3. The sill values mirror the pattern of variation in moisture content. Such a result validates the interpretation of the sill values in terms of expressing contrast in soil moisture. Fields 2 and 3 are distinguished in having more distinct palaeochannels which result in greater contrasts in moisture content between these channels and adjacent areas compared to field 1.
The results from this project in the Tay valley using ATM data thus indicate an innovative way of quantifying palaeochannel characteristics through the characterization of soil moisture variation.
349

Commission V. Extended Summaries. Tuesday, July 12
Symposium ID-22, A World Reference Base for Soil Resources.
Page Soil taxonomy - the changes and their rationale. R.J. Ahrens, and R.J. Engel. (USA). . . . 352
Soil taxonomy - an expert system prototype. J.M. Galbraith, R.B. Bryant, and M.C. Saunders. (USA) 354
Maintenance of soil survey information in the united states. L.F. Ratliff, and T.E. Reedy. (USA) 356
Evolution of russian and american approaches to soil classification: stages of convergency and divergency. A.N. Gennadiyev, and M.J. Gerasimova. (Russia) 357
Chernozems of Russia: Past, present and future. A.P. Sherbakov, V.M. Volodin, and V.D. Mukha. (Russia) 359
Practical topsoil classification - FAO proposal. M.F. Purnell. F.O. Nachtergaele, O.C. Spaargaren, and A. Hebel. (Italy) 360
Biophysical resource considerations related to food security in India. H. Eswaran, I.P. Abrol, and SM. Virmani. (USA) 361
A computer based biophysical resource appraisal support system (BRASS) program. E. Van den Berg, J. Russo, and H. Eswaran. (USA) 363
Research on soil cover structure systems of the Lithuania to adopt FAO-UNESCO soil clasification. V. Buivydaite. (Lithuanian) 365
Organisation de la couverture pedologique des espaces intertropicaux ouest-africains.
R. Bertrand. (France) 367
Soil resources of Albania. P. Zdruli, W. Bowen, R. Almaraz, H. Eswaran. (USA) 368
General soil map of Indonesia. M. Soekardi, P. Reich, H. Eswaran, T. Forbes. (Indonesia). 370 The 1994 soil map of Thailand. P. Vijarnsorn, L. Moncharoen, T. Vearaslip, and H. Eswaran. (Thailand) 372
100 years of knowledge about argentine soils. L.A. Gomez, and C.O. Scoppa. (Argentina). . 374
Anthrosols in the world reference base (WRB). A. Kosse. (USA) 376
Revised scheme of taxonomie classification of Xinjiang Aridisol. L. Shugang, and X. Jun. (China) 378
350

Aspects of the element budget of fen soils. A case study of selected fens in North West Germany. N. Asche. (Germany) 380
Soil of Casey, Antarctica. H.-P. Blume. (Germany) 382
Chernozemes et Luvisols en Bulgarie. T.G. Boyadgiev. (Bulgarie) 384
Problèmes de classification des sols rouges fersiallitiques (typic rhodoxeralf) a al province de Seville (Espagne). L. Clemente, J.L. Mudarra, et J. Pascual. (Spain) 386
The classification of tropical greyzems in Kenya. W.N. Wamicha. (Kenya) 388
On geometrical basis for database for soil classification. A.E. Kovaleva, and Z.F. Povetoukhina. (Russia). 390
Establishment in Cuba of the National Soil Collection and its database within NASREC programme. R. Chang, R. Villegas, S. Kauffman, R. Marin, C. Balmaseda, F. Arcia, and D. Ponce de L. (Cuba) 391
Elaboration and use of the european soil geographical data base. M. Jamagne, D. King, C. Le Bas, J. Daroussin, P. Vossen, and A. Burril. (France) 393
A land resource data base for mexico. L. Cajuste, E. Ojeda, G.A. Arevalo, and R. Ponce. (Mexico) 395
A E G I S. A systems-based tool for landuse planning. F.H. Beinroth, J.W. Jones, L.R. Perez Alegria, and J.P. Calixte. (USA) 397
Testing a modified FAO land evaluation method in Burundi. P. Hennebert, E. Tessens, B. Belvaux, and D. Tourenne. (Belgium) 398
A large scale soil information system (SIS) for the structural analysis of agriculture in Flanders (Belgium). J. Desmet. (Belgium) 400
The capacity for agricultural use of the soils in the coy area (Murcia, Spain). R. Ortiz S., J. Alvarez R., and A. Faz C. (Spain) 402
Characteristics and classification of seasonally wet soils with epi- and endo-saturation. W.H. Hudnall, A.A. Szogi, W.C. Lynn and J.J. Daigle. (USA) 404
Making selected interpretations for soils with andic properties. Jr. H.R. Sinclair, and S.H. Brownfielf. (USA) 406
Behavior of soil distribution in a watershed in the State of Michoacan, Mexico. A. Cabrera, J.M. Ayala, J.M. Ortega, and A.J. Far/an. (Mexico) 407
Soil climate regimes of the Southern States, Puerto Rico and the United States Virgin Islands. D.L. Newton, H.R. Mount, and R.L. Haberman. (USA) 409
Type interferences in soil. G. Reuter. (Germany) 410
351

Soil Taxonomy - The Changes and Their Rationale
R. J. Ahrens* and R. J. Engel, Soil Conservation Service, National Soil Survey Center, Lincoln, Nebraska, U.S.A.
Any system of soil classification reflects the prevailing state of knowledge about soils. A prime characteristic of soil science is the continuing search for more knowledge. As the science grows, that growth will bring to light flaws in the present classification system. Since its publication in 1975, Soil Taxonomy has undergone numerous changes. It is the purpose of this poster to describe some of these changes and the reasons behind them. Many of these changes are the result of recommendations from seven international committees.
The first committee to be established was the International Committee on Low Activity Clays (ICOMLAC). The recommendations of this committee were approved in 1986 and incorporated into the 1987 edition of the Keys to Soil Taxonomy. The main contribution of ICOMLAC was the introduction of the kandic horizon and the establishment of the kandi and kanhapl great groups to Ultisols and Alfisols. (Kandic horizons also occur in some Oxisols). Basically, the kandic horizon is one with low-activity clay and a clay bulge. It is quite similar to an argillic horizon, but clay films are not among its required criteria.
The International Committee on the Classification of Oxisols (ICOMOX) was the next committee to be established. ICOMOX recommended changes in all categories. The definition of the oxic horizon was changed, and a separate key for mineralogy was added.
The International Committee on Andisols (ICOMAND) was the third committee to complete its mandate. Its final recommendations were submitted in 1988, and an amendment to Soil Taxonomy established the 11th soil order. It was included in the 1989 edition of the Keys to Soil Taxonomy.
The International Committees on Vertisols (ICOMERT), Aquic Moisture Regime (ICOMAQ), and Spodosols (ICOMOD) submitted their reports in 1992. Their recommendations were incorporated into the 1992 edition of the Keys to Soil Taxonomy. ICOMERT recommended two new suborders, the Aquerts and Cryerts; new great groups and subgroup criteria to provide better interpretive groupings; elimination of pell and chrom great groups because of questionable value of the classes; and redefinition of the vertic subgroup criteria. ICOMAQ introduced the terms aquic conditions and redoximorphic features, and defined saturation in terms of zero or positive pressure rather than the presence of water in an unlined borehole. ICOMOD introduced spodic materials and separated Andisols and Spodosols based on the presence of an albic horizon. The "Al" great groups were recommended to separate soils low in amorphous iron from those higher in amorphous iron.
The 1994 edition of the Keys to Soil Taxonomy includes the recommendations from the International Committee on Aridisols (ICOMID). ICOMID recommended increasing the number of suborders from two to seven. The Cryids were introduced to accommodate the cold, arid soils. The other new suborders include Salids, Durids, Gypsids, Argids, Calcids, and Cambids.
The International Committee on Families (ICOMFAM) has made its final recommendations, but the changes will not be incorporated into Soil Taxonomy until a later date. Some of the significant improvements include adding clay activity as a stand alone family criterion for mixed and siliceous classes of loamy and clayey families, and defining a lower limit of five percent iron oxide plus gibbsite for oxidic mineralogy classes.
352

Three committees are still active: the International Committee on Soil Moisture and Temperature Regimes (ICOMMOTR), the International Committee on the Classification of Anthropogenic Soils (ICOMANTH), and the International Committee on Permafrost-Affected Soils (ICOMPAS).
353

Soil Taxonomy - An Expert System Prototype
J.M. Galbraith*, R.B. Bryant, and M.C. Saunders. Dept. of Soil, Crop, and Atmospheric Sciences, Cornell University, Ithaca, NY 14853 U.S.A., and (Saunders) Dept. of Entomology, Penn State University, University Park, PA 16802 U.S.A.
Introduction. Soil Taxonomy (1) is a pedon classification system with six categories. The class limits at the lowest category are used as maximum limits allowed in definitions of soil series. The classification keys have undergone frequent revision since publication in 1975, and are published periodically as the Keys to Soil Taxonomy (Keys) (2). Many taxonomies of natural objects have been translated into expert system computer programs (3). A prototype computer program has been developed to access information stored in database format for the purpose of providing pedon classification at the highest (order) level.
Materials and Methods. The logic used to distinguish five soil orders in the Keys has been translated into decision diagrams (Fig. 1). The diagrams represent the dependency of individual decisions to the overall separation of soils at the order level. The diagrams mimic the logic in an orderly fashion, first as directly required in the Keys. If the Keys provide alternative routes to the same result, it is added to the diagram. If required information is missing, substitute information allowed in Soil Taxonomy is added to the diagrams to strengthen the probability
C connects to MSM J>
""'T'";" + = (1) The horizon contains mineral soil material if... — = The horizon contains organic soil material.
(2) the horizon has less than 12% OC
r^sq7o?
NÖ1 OC •
(2a)
Fig. 1. Example decision diagram. The column OC (organic carbon) is queried first, the column OM (organic matter) is queried second. The expert rule to query the horizon name is invoked if data is missing in both OC and OM columns.
;M2b (OM/1.724) < 12 s@MSM2b
(2b)
;.N.o. .Yes j Horizon Nome Icontains " 0 "
(2c)
354

of a successful decision. In case substitute information is missing also, expert rules based on human expertise are added to the diagrams to prevent indecision. Indecision is also prevented by definition of a minimum set of information in the database before evaluation. A public domain expert system shell was used to build dependency networks from the decision diagrams. The shell converts the networks into a primary set of code which is augmented by a programmer into the final program code. The code is written in ANSI C language and the program is object-oriented. The pedon data is similar to that stored in the lab and Pedon Description Program database at NSSL in Lincoln, NE. Following program execution, the decisions and the pedon data are graphically presented on the screen for evaluation by experts. The decision process can be reviewed and a substitute decision result can be forced by the expert in order to investigate the consequences. The frequency of decisions that could not be made because of missing information is recorded. The final soil order identification is presented in bar-graph format with both positive and negative poles.
Results and Discussion. Translation of the logic has provided a critique of the flow of decision-making in the Keys. It was found to be necessary to make separations at the second-lowest level (family) in order to complete a separation at the highest (order) level. Review of the frequency of missing data allows improved efficiency if the expert appends data to the data set before reevaluation. The most frequently queried property that is often missing is an estimate of clay content by horizon. Soil pedons grade into adjacent and similar pedons. Some have different classifications even at the highest level. The bar-graph format identifies degree of correctness for the classification as well as a visual idea of alternative classifications. The program has many uses to current soil experts, to new users and non-English-speaking users of Soil Taxonomy.
Literature Cited. 1. Soil Survey Staff. 1975. Soil Taxonomy. USDA Ag. Handbook No. 436. U.S. Govt.
Printing Office, Washington, D.C. U.S.A.
2. Soil Survey Staff. 1992. Keys to Soil Taxonomy, Fifth edition. SMSS technical monograph No. 19. Pocahontas Press, Blacksburg, VA. U.S.A.
3. Peart, R.M. 1989. Applications of expert systems in agriculture. In: Knowledge engineering in agriculture. J.R. Barrett and D.D. Jones, Ed. ASAE Monograph No. 8. St. Joseph, MI. U.S.A.
355

Maintenance of Soil Survey Information in the United States
L.F. Ratliff*, T.E. Reedy, and Soil Survey Quality Assurance Staff. United States Department of Agriculture, Soil Conservation Service, National Soil Survey Center. Lincoln, Nebraska, United States.
Introduction. This poster exhibition will demonstrate the current status of soil surveys in the United States. A procedure to augment and maintain these data will be presented. Maintenance projects being planned or in progress will be shown.
Discussion. About 90 percent of the private lands of the United States have been soil surveyed, and more than one-half of the data are available in published reports. These data have been gathered over the last 40 years by many different scientists, mostly on a county-by-county basis, and reflect what was known about soils at the time of survey. The surveys remain excellent sources of information but are becoming outdated to varying degrees as new knowledge about soils becomes available and as technologies, environmental questions, and land uses change.
There is a need to bring the soil surveys to a uniform standard, to build on the existing information, and to develop a coordinated database for use in electronic display systems. The approach advocated is to augment and maintain soil survey information by Major Land Resource Area (MLRA). An MLRA is an area composed of land units having similar climate, topography, water resources, land use, and soils. The similarity of these factors suggests that a common soil map scale, map legend, map unit design, and database will provide soil information at a level meeting most user needs.
Guidelines for planning and conducting MLRA project soil survey updates have been developed and are being tested. About 10 projects have been planned and approved and are in progress.
356

Evolution of Russian and American Approaches to Soil Classification: Stages of Convergency and Divergency A.N. Gennadiyev, M.I. Gerasimova. Moscow State University, Faculty of Geography, 119899, Russia.
Introduction. The conceptual background of soil classifications was initially different in two countries; nevertheless, in the course of soil science development there were periods when the ideas of soil genesis became dominant, and criteria for the highest taxonomie levels tended to merge, whereas periods of divergency in ideas resulted in increasing gaps between two classification systems.
Material and Methods. The analysis of approaches was done by purposeful examination of consecutive issues of Russian and American soil classifications; the basic among the former being those of Dokuchaev (1900), Glinka(1931), Ivanova (1956), official version of 1977, Fridland (1982), Shishov with co-authors (1990) . For American systems we used the reviews of Cline (1979) and Simonson (1987); the systems of Marbut (1935), Baldwin with co-authors(1938) were considered, as well as the 7-th Approximation (1960) and Soil Taxonomy (1975).
Results and Discussion. In the last decades of the 19th century two important events happened in two countries and predetermined the further development of soil classifications there. First soil surveys were finalized in 1884 in Russia and in 1899 in the USA, and the first soil classification was proposed by Dokuchaev in 1886. Although it could not entirely avoid the influence of geological approach to soils, popular among European scientists, zonal concepts, fully outlined by Dokuchaev 13 years later, were present in this scheme. As it is well known, zonal soil-geographic regularities became real guidelines for Russian pedologists for many years. They were frequently reproached by their Western colleagues for overestimating soil forming factors, he»ce, zonality in their classification schemes. All of them had been constructed "from above" and rarely descended to lower levels. Contrary to this, American pedologists had started "from below" - from soil series. M. Whitney is known to develop a system with soil genesis as an important ingredient, which was interpreted more as rock weathering than soil formation. Reasons of the difference in approaches are cf natural and socioeconomic character. The period between the two World Wars seems to be a time of convergency between two scientific schools working with soil classifications. Moreover, soil groupings coined during this time span, have a very distinct imprint of "zonal" and even of "factor-genetic" mentality. It happened due to worldwide expansion of Dokuchaev's ideas and to discovering new soils. The best proofs of such convergency are schemes of Marbut and of Baldwin, Kellogg and Thorp with their landscape or zonal categories.
The advance of "zonal" or "factoral" philosophy in soil classification reached its maximum in the USSR in the 60-ies : zonal soil types as nuclei of the system, world groups of classes specified by the geographic belts, subdivision into automorphic, hydromorphic and semihydromorphic soils (Ivanova, 1956). The underestimation of soil properties was felt by a number of scientists, and very active discussions took place in those Limes. The ufflcial "ClaaalfluaLlon.-.~.~~ published tn' Y977 aB a guidebook
357

for soil survey is, however, rather "factoral" in terms of its mentality and criteria for some categories (f.e. facies subtypes). The 7-th Approximation may be regarded as an evident protest against "zonal" mentality and was, therefore, severely criticized by prominent Soviet soil scientists in 1964. Thus, this period is a period of strong divergency in approaches to soil classification (as, unfortunately, in other spheres of human activities) and it originated more of the evolution of concepts themselves, than of practical demands or any other reasons. The authors of this paper were the first who started making a hole in Russian "iron curtain" around American soil classification (Gennadiyev, Gerasimova, 1981; Gennadiyev, 1982). Assuming a number of its advantages we tried to show features produced by "genetic" mentality that could reconcile both schools.
The present-day period in the development of conceptual background for soil classification - a period of convergency, is manifested by conspicuous changes in approaches in Russia and very mild "factoral" and/or "genetic" shifts in Soil Taxonomy . The new Russian approach consists in the emphasis on Boil properties, accepting the idea of diagnostic horizons, formalization of differentiating criteria. The first draft of such an integrated system combining genetic ideas and assessment of soil properties was proposed by Fridland (1982) and continued by Dokuchaev Soil Institute in Moscow (Shishov, Sokolov,1990). Thus, periods of convergency partially originate due to exchange of ideas, while divergency is a consequence of information deficit or of any kinds of contradictions.
Literature Cited.
(1) Gennadiyev A.N. 1982. General soil maps of the United States. Sov. Soil Sci., No.4.
(2) Gennadiyev A.N., Gerasimova M.I. 1981. Some present soil classification trends in the United States. Sov. Soil Sci., No.5.
(3) Gerasimov I.P., Glazovskaya M.I. 1960. Fundamentals of Soil Science and Soil Geography. Moscow (in russian).
(4) Ivanova E.N. 1956. An experience of the general soil classification. Soil Science, No.6 (in russian).
(5) Simonson R.W. 1987. Historical aspects of soil survey and soil classification/soil horizons reprint. Soil Science Society of America. Madison.
(6) Smith G. 1986. The Guy Smith interviews: Rationale for Concepts in Soil Taxonomy. SCS-USDA and Cornell Univeiuity.
358

Chernozem of Russia: Past - Present - Future
A.P. Sherbakov*, V.M. Volodin and V.D. Mukha. Russian Research Institute for Farming and Soils Erosion Control. 305021, Kursk, Russia
Introduction. The specific conditions of chernozemic soil formation in Russia resulted in the highest natural level of soil fertility, energy content and soil energy capacity. The energy content in the organic matter of chernozems levels from 3*10 to 4*10 Kcal/ha. This type of soils occupies about 120 million hectars or 7 % of the total area. However it is almost a half of the arable area where 80% of crop products are produced (1). The aim of this review is to evaluate some data on the changes in soil biological, chemical and physical properties of chernozem induced by intensive and continuous cultivation.
Materials and methods. Our investigation was carried out in 1991-1992 years in the wooded steppe and the steppe regions of Russia. The main goal of the expeditions, held in 1991-92 years, was to conduct soil and agroecological researches in the 83 localities which had been observed a century ago by professor V.V. Dockuchaev and to compare the data, obtained by the author of the famous theory of the genetic pedology, with the modern indecies of soil properties. In our investigations there were applied a comparative-geographical method, an analytical method and soil erosion modelling. There were sampled about 2.000 soil and plant specimens. The sample from the soil horison were analysed for total humus content, nutrients, mobile huminic matter and biomass off microorganism. An attempt has been made to identify the effects of soil management systems on organic matter energy transformation. The energy content in each category of the organic matter was calculated considering its mass content at heat value.
Results and Discussion. The results obtained illustrate broad-scale changes in the properties of the chernozomic soils. Comparing the nowaday information with that, gained 30, 60 and 100 years ago we have come to conclusion that the chernozems undergo humus and biota depletion, acidification and structural damage over time. Humus losses in chernozems level from 24 to 43% as compared to the initial humus content. An annual loss of humus averages 1 t/ha, but only 0,3 to 0,4 t/ha can be complemented. The ratio between erosion losses and soil development averages ( 3 to 4 t/ha ): 1 t/ha . The energy content of the mobile part of the organic matter in arable soils levels 12.5 to 13.7 % of its total quantity and in virgin soils it is twice as large. The energy content in all the categories of the organic matter in moderately erored chernozems is by 27 to 42% less than in non-erored soils. Soil erosion and soil losses decline the levels of energy capacity and energy content of chernozems. Degradation of chernozems is a complex process in which physical, chemical and biological factors contribute to the loss of the soil's productive capacity. To control adverse factors and to balance inlet/outlet energetic and nutrient flows would become possible through developing landscape farming systems. The efficiency of landscape farming bases on a system approach, zoning, crop ecoclimatic adaptation, environmental interests, etc.
Literature cited. Shcherbakov A.P., Rudai I.D. Soil fertility and nutrient cycling. Moscow, Kolos, 1983.
359

Practical Topsoil Classification - FAO Proposal
M.F. Purnell*, F.O. Nachtergaele, O.C. Spaargaren, and A. Hebel. Food and Agriculture Organization of the United Nations, Rome, Italy
Introduction. A common criticism of soil taxonomie classifications is that they are of little value to other scientists because they are mainly based on the subsoil and pay less attention to the topsoil which is what the farmer, botanist and forester see, and which is most important for the growth of seedlings and for management and soil degradation control. It is therefore proposed to make a comprehensive classification of topsoils, essentially for the practical purposes of monitoring fertility status and making management recommendations. This could be used alone but would usually be an adjunct to the traditional soil classification to provide more complete information on soil conditions.
Materials and Methods. The Land and Water Development Division of the Food and Agriculture Organisation of the United Nations has prepared a draft Framework for characterization and classification of topsoils (1992), the main features of which are illustrated in this poster. A format for describing the management requirements of specific topsoils is suggested in another poster (FAO/University of Hohenheim - to be specified by authors).
Results and Discussion. About sixty main properties of topsoils suitable for a worldwide classification are defined based principally on organic matter status, biological activity, soil surface characteristics, physical and chemical conditions, moisture conditions, and past and present management. These topsoil descriptions can be added to the usual classification of any of the soil units; some examples are given. Seven classes of texture, three classes of soil reactions and two classes of coarse fragments are suggested to complete the description of the topsoils.
This first step can be followed up by field testing of the definitions, establishment of a topsoil database including management criteria, and ultimately a widely useful classification of topsoils for practical application in the characterization and management of the world's soils. Comments and suggestions would be welcomed by the Director, Land and Water Development Division, FAO, 00100 Rome, Italy.
Literature Cited FAO. 1992. (Draft) Framework for characterization and classification of topsoils in the world. By O.C. Spaargaren. FAO, Rome, 1992. 105p.
FAO. 1994. (In Press). Characterization, classification and management of topsoils in the world. FAO Soils Bulletin. FAO, Rome.
360

BIOPHYSICAL RESOURCE CONSIDERATIONS
RELATED TO FOOD SECURITY IN INDIA
H. Eswaran*, I.P. Abrol, and S.M. Virmani. USDA - Soil Conservation Service, Washington DC, USA; Indian Council for Agricultural Research, New Delhi, India, and the International Crops Research Institute for the Semi-Arid Tropics, Hyderabad, India, respectively.
Introduction. India has a population of about 850 million people with an annual growth rate of about 10 million; The population is expected to reach a billion in the year 2000 and about 1.5 billion in 2025. A recent study suggests that about 82% of the children suffer from mild to severe malnutrition and about 8% are severely malnourished. This is not completely due to lack of availability of food but rather due to the inability to purchase and also food distribution and marketing problems. However, in the context of future needs, it is evident that unless the present rate of food production is substantially increased, the country may not be able to meet the demands of the projected population. The solution is of course a deceleration of population growth and an acceleration of food production. The former is confronted with a whole range of socioeconomic problems while the latter is more amenable to change. In this paper, the biophysical aspects are considered bearing in mind the socioeconomic backdrop of the challenge.
Recent accomplishments. A prediction in 1950, when central planning commenced in India, that India's population would more than double in less than 40 years, was often met with disbelief. The doomsdayers were convinced that such a drastic rise in population would place intolerable pressure on India's agroecosystem and that the system would self-destruct. That this unbelievable situation has come to pass and that the demands of a vastly increased population are being met today - at least minimally - is perhaps one of the great achievements of Indian agriculture. The battle may well be won but the war may yet be lost. The benefits of the 'green revolution' have not come without environmental costs and agricultural resources in several areas have been severely degraded. Signs of agroecosystem stress and even breakdown are abundant. It is estimated that 90 million ha of land suffers from water erosion, 50 million ha from wind erosion, 7 million ha are affected by salinity and alkalinity, and 20 million ha suffer from flooding. This represents a total of 167 million ha or 51% of total land surface suffering from soil degradation. In addition about 20 million ha of canal irrigated areas (the mainstay of the Green Revolution in India) run the risk of becoming degraded.
Results and discussion. India is a vast country with different agroclimatic regions. About 70% of the 144 million ha of arable land depends entirely on rainfall for crop production, and the practice of agriculture here is best described as dryland
361

farming. Large-scale irrigation projects of the kind seen in other parts of the world in major river valley systems are nonexistent. The resource endowment of the dry farming areas is poor by most standards. The land is suitable to grow only one crop per year, at best. Crop failures are common due to drought. The poster shows maps depicting some of the constraints to increased production. Some important considerations to food security include: Land — There has been no significant change in area under food grains in the last two decades and so further increases in production must result from increased productivity. Irrigation — Of the 142 million hectares of cultivated land only 43 million is irrigated with few potentials for increased irrigation. The irrigated areas have the greatest potential to increase production. Response to fertilizers — Better nutrient management, with attention to micronutrients is needed in both the irrigated and rain-fed sectors. Environment — In the absence of an economically viable agriculture, it is not pragmatic to request farmers to protect the environment. Sustainability from this point of view is still elusive.
Approaches to food security. The analysis suggests that the present land resource can support the increased population and the considerations are: (1) the rainfed regions must receive priority attention in soil and crop management to enhance productivity; (2) soil management and particularly, fertilizer use and efficiency of use must be improved to support specifically the new high yielding cultivars being made available; (3) since water and soil fertility are the two major constraints to increased and stabilized agricultural production in the dryland-farming, every effort must be made to conserve both water and soil resources. Rainwater management and the implementation of soil conservation programs hold the key to an ecologically-balanced improvement in the quality of rainfed lands. (4) the optimal use of land requires that land resources be well characterized, their spatial relations be delineated, and their capacities for all likely uses, at various levels of management, be determined and implemented; (5) some mechanism of transferring resources to ecologically maintain dryland farming areas must be underwritten by the highly productive irrigated agriculture. According to Swaminathan (1986), "We have now the technical capability to build enduring national and global nutrition security systems based on sound principles where the short and long-term goals of development are in harmony with each other. What we often lack is the requisite blend of political will, professional skill, and farmers' participation. If farmers are helped to produce more, agriculture will not go wrong. If agriculture goes right, every thing else will have a chance for success."
References: Swaminathan, M.S. 1986. Building national and global nutrition security systems. In: (Swaminathan, M.S. and S.K. Sinha, Eds.) Global Aspects of Food Production. Tycooly Int., Oxford, England. 417-449.
362

A computer based Biophysical Resource
Appraisal Support System (BRASS) program
E. Van den Berg*, J . Russo, and H. Eswaran (World S o i l Resources , DSDA S o i l Conservat ion S e r v i c e , P.O. Box
2890, Washington DC, 00013, USA)
IX
INTRODUCTION
Technology transfer demands changes not only in the way materials and people are used in production, but also in the way information is managed. Decision makers, in particularly environmentally-sensitive countries with limited natural resources, are expected to make technical decisions that are ecologically, economically, and socially acceptable. The information sources for making such decisions must be easily available, organized, timely, accurate and dependable. One approach for structuring and judging the value of information for decision making is a "decision support system (DSS)". The first version of the decision support system presented here, is referred to as 'Biophysical Resource Appraisal Support System — BRASS". BRASS (in its final version) integrates modern sources of information and "user" can confidently make strategic and short-range decisions. BRASS is the result of an expanding computer industry which increasingly offers the decision maker more electronic sources of information. A fully-developed BRASS is a software package that permits a user to access through his or her fingertips, global, state, and local sources of information for decision making.
Since the development of a DSS is in its nascent stage, there are many designs for integrating the various kinds of information necessary for a decision. Some designs are very general with only a few avenues for a user to customize his or her information needs for a particular location. Others are very specific requiring the user to enter a large amount of local data before providing any support for a decision. Still others require nothing more than an ensemble of computer programs and databases which have mixture of relevancy and accuracy for supporting decisions.
This study illustrates tne database component of BRASS. The eventual BRASS is modular in design to take advantage of the proven features of previous systems, and to be able to incorporate future sources of information. It is sensitive to the changing computer hardware requirements for information-related software, and to the training demands placed on the user.
Materials and methods. The two main databases in Version 1.0 are soils and climate. The rasterized FA0-UNESC0 global soils database provides the spatial distribution. The database is converted to Soil Taxonomy using an expert system. About 6,000 georeferenced pedons (1,000 from outside the US) give actual soil
363

property information. For the climate, weather records (14,000 climatic stations) from several sources are used to compile the soil moisture and temperature regimes and derived information, including moisture and temperature severity indices. Using a spherically-based interpolation algorithm, weighted averages for mean monthly temperature and precipitation on a centroid-registered 5-minute grid was made. A Graphic User Interface for the databases was developed which enables easy access to data and simple spatial analysis. Thematic maps are created using specially structured transformation matrices. These generalized maps at scale of about 1:15 million are useful to present patterns of features. Their reliability is a function of the databases and the interpretations attached to the data.
Results and discussion. The proposed research to develop an operational BRASS would have many beneficial results for a decision maker in a developing country. First, the operational BRASS would be designed to, "run" on a desktop personal computer. A second result of the proposed research is the ability of a user to choose the spatial and temporal scales of an event for which a decision is going to be made. A user could look spatially at output for an event at scales ranging from a continent down to a local site if input data were available in to run the appropriate models. A third result, which follows from the ability of the BRASS to recognize different scales, is the scheme for default values. The operational BRASS is designed always to provide a data input for any event reguests of the user. A fourth result of the proposed operational BRASS is the development of a risk measure to be assigned to the output data. The measure will be in the form of a numerical interval with one end representing a low risk value and the other end representing a high risk value. The last result of the BRASS is its ease of use from the perspective of the user. The interface program by which a user chooses a location, event and decision scales is limited to three interface screens containing easy-to-use, pull-down menus.
Conclusion. The justification for developing the proposed BRASS is that timely and accurate information makes for better decisions. And better decisions make for the efficient use of natural and human resources. One justification for the particular BRASS design proposed for this study is that it provides an easy-to-use interactive program for the user. By accessing three screens, a user can make all the necessary choices to run a simulation of a particular event. This risk measure allows the user to choose the level of confidence he or she wants to be associated with a decision. Another justification of research support for the proposed BRASS is its open modular architecture which encourages third party development of databases and models, thus speeding the transfer of technical information. When fully implemented in the field, the proposed BRASS will represent a long-term investment by the user to ensure that the information needed for decision will be both up-to-date, timely and relevant. The computer demonstration presents the first Version of BRASS.
364

Research on Soil Cover Structure Systems of the Lithuania to Adopt FAO-UNESCO Soil Classification V. Buivydai tc . Department of Soil Science. Lithuanian Academy of Agriculture, Akademija - Kaunas, 4324, Lithuanian Res public.
Introduct ion. Soil is the most important resource of Lithuania, over the past decades in our country some work has been done on the research of soil properties. But soil is an ever-changing system. The needs for new methods of soil research, for new information to be integrated, socially responsible for sustainable development of our country has not only theoretical but also practical sense. In Lithuania there are areas where from point to point in accordiance with conditions of drainage and erosion and parant material soils vary very much. In such areas it is not enough to use geographic methods of soil cartography. This work deals with systematic and structural approach which foresees division of land surface into integral territorial units (systems) and investigation of their structure. A systematic and structural approach enables to get a more complete characteristics of soil and soil cover and to determine cause and effect links among its components. In case of using relief plastics' method toposequences of soil would be used not only as soil classification and explanation of the development of soil profile, but also for making and correcting soil maps on different scale.
Study Area and Methods. The Lithuanian Republic is situated between 53° 54' and 56° 27' north latitude, and between 20° 56' and 26° 51' east longitude in the basin of the Nemunas river on the western border of the largest East European plain. The mean annual temperature is 6° C. Going to the east of Lithuania from the Baltic sea climate changes to the continental. Annual precipitation varies from 800 mm on the south-western slopes of Zemaitija hig-land to less then 550 mm on the northern part of the in-land plain. Lithuania covers 65 303 km2, soil cover is 58 794 km2
(State Land Survey Institute, 1985) 28 % of the soil cover is under forests. Soil varies very much even in very small areas. It is because of that the border of the last ice sheet, which has covered central Europe and identified as Valdaj, goes trough Lithuania. There are geomorfological contrasts. They are responsible for the big variation of the landscape of the territory. There prevail moraine deposits, glacial outwash plains and glacial lake deposits. 1 127 km are covered by clay and clay loom, 18 115 km - loam and sandy loam, 17 533 km2 - loamy sand, 13 301 km2 - sand and gravel, in depresions 8 718 km are peats. According to soil classification (which are used in Lithuana from 1953) 45.3 % of area the soils are derno-podzolic, 4.2 % - podzols, 7.8 % - sod carbonate soils, 17.6 % - sod-gleyic and gley, 18.4 % -derno-podzolic gleyic and gleyed, 5 % - bog soils and 1.4 % - alliuvial soils. According to the map, World Soil Resources, FAO 1990, scale (aprox) 1:25 000 000, in Lithuania there predominate Pod-zoluvisols, Luvisols, Gleysols, Histosols and Fluvisols. Broad soil patterns in the whole world are mostly controlled by climate. As far as
365

Lithuania is concerned local patterns soils are controlled mostly by topography. Because of that and also very complicated soil cover the research of the Lithuanian soil cover systems is based on geostructural analysis of topography by using relief plastics' (flow structures') method.The flow structures' method (the second derivative topographic method) according to the established regularities allows to draw the borders between divergence and convergence areas. The borders can be named zero horizontal morphoizograph. The relief plastics' method was worked out in the Soil and Photosynthesis Institute of the Russian Academy of Sciences and can be successfuly, applied on the scale from 1:2 000 to 1:500 000.
Discussion. During the soil investigations in fields and when making up soil maps, working with topographic maps before, we did only mental separation of the topographic surface and it was done not always successfully. It is much easier to solve questions of landscape research metodol-ogy on the basis of topograpic relief plastics' method. The cartograpic recognition of natural borders and generalization of land surface structures of Lithuania has been done on the Morphoisograpic Map of the Land-Surface of Lithuania, 1993, on scale 1:300 000. According to the sketch of the map contours of geometrical similarity of individual systems are being detected. The structural units show all geosystem of the area. The hypothetical soil cover structure systems are shown on the map. The further research is based on the soil data of the Lithuanian soil research institutions. The main task is to show similarity of soils according soil texture and other soil properties. Examination of the soils of Lithuania according to the indicated soil cover systems on the Mor-phoirograpic Map of the Land-Surface of Lithuania will alow to inden-tify the characteristic features of soil toposequences to investigate and estimate soil property changes in time and space the under effect of natural and antropogenic factors. The contours of the Morphoisograpic Map of the Land-Surface of Lithuania can be used as a basis for series of the new quality maps - geomorfological, hydrological and soil erosion-maps with more information. The Morphoizograhic map will be used for working up soil map with adopted FAO - UNESCO soil classification.
Conclusions. The research on soil and soil cover systems in Lithuania is based on the geostructural analysis of the area. Morphoisographic Map of the Land-Surface of Lithuania on the scale 1:300 000 with the mor-phoizograps as basic contours is worked out for ecology and soil mapping and first of all for using the Revised Legend (FAO) with amendments based on soil information of Lithuania. At that moment of integration of Lithuanian soil scientists to the modern Western soil science this work is the firt step for adopting FAO - UNESCO soil classification in our country. All work is focused on improving the knowledge, for future communications and mostly for better understanding and describing the nature of soil development as a dynamic system, environmental changes and help for social changes in our country. We need new knowledge about our soils not only for solving current problems of the day which are never ending, but also for perspective.
366

ORGANISATION DE LA COUVERTURE PEDOLOGIQUE DES ESPACES
INTERTROPICAUX OUEST-AFRICAINS
Bertrand Roger * 1
Résumé de communication au 15léme congres de sciences du sol (Mexique)
L'approche morphopédogique, est fondée sur Ie fait que Ie paysage est toujours ordonné par son relief : a chaque facettes géomorphologique correspond non seulement un type de sol ou une association de types de sols (une sequence par exemple), mais aussi une vegetation caractéristique. Ainsi, Ie relief, contitue une donnée première du paysage bioclimatique. Les unites morphopedologiques sont limitées par des ruptures de pentesz.
L'avantage de ceci, c'est que ces unites sont faciles a identifier sur Ie terrain et que leur cartographie est aisée par utilisation des photographies aériennes en stéréoscopie. Les cartes ainsi obtenues montrent une relation assez fidele avec la réalité. Elles provoque ainsi, chez Ie lecteur, un phénomène de reconnaissance.
Cette approche peut être approfondie. Ainsi en allant vers Ie détail, la position topographique permet de distinguer ce que l'on appelera "des écotopes". On pourrait aller plus dans Ie détail: niveau du pédon ou du volume pédologique unitaire.
En allant vers des niveaux de perception plus élevés, on constate que les unites morphopedologiques sont organisées d'une maniere univoque Ie long de la toposéquence. Cette succession d'unités est vue comme un modèle d'organisation qui permet de caractériser un interfluve. Ainsi. I'interfluve constitue la maille élémentaire des espaces intertropicaux. Lorsque plusieurs interfluves, montrant Ie même modèle d'organisation morphopédologique, sont jointifs, on parlera de paysage morphopédologique. Ces paysages ne sont pas, eux-mêmes, répartis au hasard. lis se répartissent suivant diverses lois en liaison avec la presence d'accidents géologiques ou en fonction de Taction et du positionnement géographique des paléoclimats.
367

SOIL RESOURCES OF ALBANIA
Pandi Zdruli*, Walter Bowen, Russell Almaraz, and Hari Eswaran. Department of Pedology, Institute of Soil Studies, Tirana, Albania; International Fertilizer Development Center, Muscle Shoals, Alabama, and World Soil Resources, USDA-SCS, Washington DC, USA.
Introduction. The Republic of Albania is located in the Balkan Peninsula, between 39° 38' and 42° 39' N latitude, and 19° 16' and 21° 40' E longitude. The north and north east part of the country, is bordered with the former Republic of Yugoslavia, in the south with Greece, and in the west with the Adriatic and Ionian Seas. Total surface area is 28,748 square km and of this area, only 16,2 % is below 100 m sea level. Agriculture is well distributed within the country, but most intensively in the western coastal lowland. Albania has a total agriculture land surface of about 700,000 hectares. Because of the differences in climate, natural vegetation, elevation, slope and parent rocks, soils are highly diverse.
Materials and Methods. The first Soil Map of Albania, at a scale of 1:200,000, was compiled in 1958 (Bajraktari (1959, 1961), Veshi and Spaho, 1973). The soil classification system used was adapted from the Russian system. Later, (using the same soil classification system), in 1971 and 1980, two complete soil surveys for all the agricultural land of the country at scales of 1:50,000 and 1:10,000 were completed. Each district has its own soil map and soil reports with some analytical data for each parcel of land. We are presenting the digitized Soil Map of Albania at scale 1:500,000 with a legend according to Soil Taxonomy (Soil Survey Staff, 1992). The soil map was generated using a Geographic Information System (PC ARC/INFO).
Results and Discussion. In Eastern Albania, occurring at elevations of 1800-1900 m and above, are Umbrepts of the subalpine belt, Rendolls and Lithic Hapludolls on calcareous rocks and, to the south are the Dystrochrepts. Under high mountain beech forest the soils are an association of Cryochrepts, Haplumbrepts, and locally, Haplorthods. At 1000-1500 meters, Dystrochrepts associated with Haplumbrepts are present on serpentines and on limestones; their modal profile consists of forest litter (2-3 cm) , a humus horizon up to 40 cm thick of dark brown color and often clay-like texture and/or with coarse granular structure. The profile is reddish on red rocks. Brown forest soils of red color are weakly acid and are slightly saline due to Mg. The belt of mountain brown forest soils are comprised of Rendolls and Hapludolls with a distinctly darker profile, well defined structure, greater thickness of the humus horizon, higher base saturation, and higher pH. Less widely distributed are the mountain Dystrochrepts which are the leached soils, having heavy texture and coarse granular structure. These soils are rich in
368

humus, N, K, and Fe and poor in P, and are generally highly eroded.
In the intermontane valleys and coastal lowlands, Vertisols, Aguepts, and some Agualfs characterized by Mg salinity are present. Recent riverine deposits are characterized by Fluvents and Aquepts. In the latter, salinity is high and so some of these soils are Halaquepts. On the more undulating coastal plains, Xeralfs and Udalfs predominate. Peat formation is active in middle elevations and lowland depressions. The areal distribution of these agriculturally important soils is presented below.
Albanian Legend Soil Taxonomy equivalents Type Explanation Area—
^ 'OOP Ha
LM Mountain meadow 0.5 3.2 Cryochrepts, Cryumbrepts MP Dark mountain forest 3.0 20.2 Haplumbrepts LMP Dark meadow forest 0.6 3.4 Hapludolls KM Cinnamon mountain 17.7 121.3 Dystrochrept,Eutrochrepts KL Cinnamon meadow 5.4 37.0 Hapludalfs, Hapludolls LK Meadow cinnamon 7.5 51.3 Hapludolls, Hapludalfs HK Gray cinnamon 25.7 176.2 Haploxeralfs, Xerochrepts HKL Gray cinnamon meadow 6.4 50.7 Hapludolls, Hapludalfs LHK Meadow gray cinnamon 18.5 127.1 Haplaquerts, Haplaquepts
AL Fluviatile soils 11.8 80.9 Udifluvents, Xerofluvents T Boggy soils 1.4 10.0 Medisaprists, Humaquepts K Solonchak, solonetz 1.4 9.7 Natraqualfs, Natrudalfs P Undeveloped soils 0.1 0.4 Udorthents, Xerorthents
TOTAL 100.0 691.4
1 Area refers to total agricultural land in the country.
Literature cited.
Bajraktari, F. 1959. [Investigation on soils of Albania]. Mezhd. s. Kh. Zh. No.4, 93-101. [R].
Bajraktari, F. 1961. [Short outline of soils of Albanian People's Republic]. Cercet. pedol. Bucuresti Acad. RPR. 125-137. [R. rm. g.].
Soil Survey Staff. 1992. Keys to Soil Taxonomy. SMSS Technical Monograph No. 19. Fifth Edition. 541 pp.
Veshi, L. , S. Spaho. 1973. Pedologjia. Publication of the High Agricultural Institute of Tirana, Albania. (In Albanian). 568 pp.
369

General Soil M a p of Indonesia
M. Soekardi, p. Reich, H. Eswaran, T. Forbes. II. H. Juanda No. 98 Bogor, Indonesia, USDA-Soil Conservation Service P.O. Box 2890 Washington D.C. 20013. NRI P.O. Box 4811 Ithaca, New York 14852.
Introduction. With a 1990 human population of close to 180 million, Indonesia's natural resources are under great stress. To relieve some of this stress, Indonesia has implemented a transmigration program where people from the densely populated island of Java are voluntarily moved to less densely populated islands areas such as Sumatera and Kalimantan. As more people are moved to less developed regions, it will be important to have sound land management techniques in use. Sustainable development must be promoted in these areas in order to maintain the viability of limited resources for future generations.
Comprehensive soil data is a necessary component of the natural resources data used in determining appropriate land uses for a particular area. The soil map presented in this poster provides an excellent base for identifying major areas having constraints to sustainability and can identify areas where research should be focused.
Indonesia is comprised of thousands of islands distributed throughout an area within 7°N to 11°S latitude and 95 to 141°E longitude. The soil moisture regime is mostly udic with some areas of ustic, and the temperature regime is isohyperthermic with isothermic occurring in the high altitudes.
Methods and Materials. There are four levels of soil survey mapping in Indonesia: exploratory, reconnaissance, semi-detailed, and detailed. Table 1 identifies the current status of the soil survey program in Indonesia.
Table 1. Soil Survey Activity in Indonesia
Stage of Soil Survey
Scale of map
Area covered 1000 x Ha % of total
. 1
133,134 69,757 14,850
57
1 69.2 36.3 7.7
<.01
Exploratory <1:500,000 Reconnaissance 1:100,000-250,000 Semi-detailed 1:50,000 Detailed 1:10,000-25,000
Total land mass = 192 million ha.
The soil map of Indonesia at a scale 1:250,000 was produced by the Soils and Agroclimatic Research Institute, Bogor, Indonesia using soil survey data at these varied levels. The soil map was digitized using Geographic Resource Analysis Support System
370

(GRASS) geographic information system (GIS). Attributes for each map unit was entered into a data base and is accessed by the GIS.
Results and Discussion. A soil map of Indonesia based on Soil Taxonomy will be presented in the poster. The most common soil orders are Inceptisols and Ultisols. Table 2, identifies the distribution of each order.
The soil map in digitized form has even greater value because of the enhanced analytical capabilities provided by a GIS.
Table 2. Approximate dist:
1
ribution of soil ordei rs.
| 1 No. Soil Order
Approximate area
(; 1
< 1000 Ha) Percentaqe 1
1 Soil association dominated
by: 1
1. Histosols 12,170 6.6 2. Entisols 19,247 10.4
- Aquents - Psamments
13,610 4,070
- Orthents 1,567 3. Vertisols 832 0.5 4. Andisols 3,541 1.9 5. Inceptisols
- Aquents - Ustropepts - Eutropepts - Dystropepts
6. Mollisols
4,226 20,767 8,724
38,502
82,219
3,380
44.6
1.8 7. Spodosols 8. Alfisols
2,310 2,734
1.3 1.5
9. Ultisols 42,347 23.0 10. Oxisols 15,446 8.4
Total 184,226 100.0
The poster shows the 1994 draft of the Soil Map of Indonesia. As there are still large parts of the country with inadequate soil resource information, this map is still only considered as an approximation of the nation's soil resources.
Reference
CSAR, 1993. Generalized soil maps of Indonesia at a scale of 1:2,500,000. Unprinted, internal document of the Center for Soils and Agroclimatic Research, Bogor, Indonesia.
371

The 1994 Soil Map of Thailand
P. Vijarnsorn*, L. Moncbaroen, T. Vearaslip, and H. Eswaran. Department of Land Development, Bangkok, Thailand, and World Soil Resources, USDA Soil Conservation Service, Washington D.C., USA.
Introduction. The Kingdom of Thailand covers an area of approximately 550,000 Km2. It has a population of about 52 million persons with an annual growth rate of about 1.7%. Thailand is an agricultural country with agricultural exports accounting for more than 70% of its earnings. Despite the fact that the technology applied by the farmers is low and the plantation sector is small, the country has attained the capability of exporting food, particularly rice. This is attributed to the national strategy of agriculture development, a component of which is the attention given to the soil resources of the country. Large areas of the country have been mapped at the detailed scale. Based on this and other information, the Department of Land Development periodically prepares national assessment in the form of the Soil Map of Thailand (Vijarnsorn et al, 1980) and other supporting data.
Methods and materials. The most recent soil map was prepared in 1987, using an international legend developed by the World Soil Resources of USDA-SCS (Moncharoen et al, 1987) . This map was digitized using a PC ARC-INFO which is a commercially available software, since 1987, significant changes have been made to Soil Taxonomy, the US system of soil classification. Thus, corresponding changes were made to the 1987 soil map and this is presented here. Tabular information was also structured for other properties of the map units. This information is employed to develop different kinds of constraint maps. Such derivative maps are useful for national planning. Complimentary to the spatial analysis, a database of all available soil profile descriptions and supporting analytical data was also compiled. These are the prerequisites for a National Soil Information System.
Results and discussion. About 300 soil series and an equal amount of variants have been identified in the soil survey of the country. The poster shows the distribution of the soils and the area occupied by each legend component.
The Entisols account for about 4.1% of the total area. They are most extensive in the low lying areas of the coastal zone, along the Gulf of Thailand. In this terrain, the Aquents predominate. Vertisols occupy about 1.4% of the country. They are dominant in the eastern part of the South Central Plains adjacent to the Central Highlands, where they are developed on marls. The Inceptisols are moderately extensive and cover approximately about 9.1% of the country. They are most extensive in the Central Plains where they are mapped as Aquents. However, some of these soils may belong to the new suborder of Aquerts as suggested by preliminary investigations. On the steep uplands,
372

Tropepts are to be found. These are general subject to shifting cultivation and so are heavily eroded.
Mollisols, once thought to be absent in the tropics, account for about 1.3% of the land mass. They occur in association with the Vertisols and are also formed on the marls. Some of the Ustolls and Aguolls may be vertic intergrades. Spodosols occur sporadically on the raised beach ridges on sandy deposits. They occupy about 1.3% of the area and are dominant in Peninsular Thailand. They have the morphology of Spodosols with an albic and spodic horizons and also have the chemical properties of such soils. However, they do not have the same genesis of their temperate counterparts. The spodic horizon is due to an upward movement of the organic matter rich ground water by capillary rise. These soils occur or have occurred in association with coastal peat deposits. From a management point of view, they are most problematic and consequently the communities living on these soils are generally poor.
The Alfisols are the second most extensive soils in the country. They account for 9.4% of the country and are subject to a variety of uses. The most extensive soils are the Ultisols, occupying about 44.5% of the country. They are present on different geomorphic conditions. Some are deep and friable and so have few problems for agriculture. Others are lateritic and coupled with an ustic soil moisture regime, they are some of the poorest and most problematic soils of the country. Many of them have aluminum toxic conditions which are accentuated when the surface organic matter rich layers are lost through erosion. Much of the upland agriculture are on these soils.
The OxisoJo occupy small patches in the country, particularly on basic and intermediate rocks. They only occupy about 0.3% of the country. These soils are poor, highly weathered and so nutrient depleted, have phosphorous management problems and are also very droughty. Despite these constraints, they support large populations which have traditionally tried to eke out a living. The Histosols or the organic soils occupy less than 0.2% of the area in Southern Peninsular Thailand. Due to burning for land clearing, much of these soils are decimated. The subsoil in these systems are acid sulfate and so much of the land is abandoned after initial cultivation attempts.
Reference
Moncharoen, L, T. Vearaslip, and H. Eswaran. 1987. Benchmark soils of Thailand. Publ. Department of Land Development, Bangkok, Thailand.
Vijarnsorn, P, and C. Jongpakdee. 1987. General Soil Map of Thailand. Publ. Department of Land Development, Bangkok, Thailand.
373

100 Years of Knowledge About Argentine Soils L.A. Gomez and CO. Scoppa. Institute of Soil CIRN-INTA. Las Cabanas y Los Reseros-Villa Udaondo. 1712 Castelar Province of Buenos Aires, Argentine.
Introduction. The knowledge about argentine soils has evolved in five stages in the last 100 years, Is is supported by a series of investigations carried out by the continuous effort of several generations, by means of which the understanding of the mechanisms in the soils of our country improved in a satisfactory manner.
Materials and Methods. Compilation of argentine publications, refered to soil science; study of these materials, analysis and classification according to topics.
Results and Discussion. At the end of the XIX t h century begins the first stage, whose tendency concentrates on the study of soils for colonization, the first works being primarily analytical, physico-chemical and mineralogical determinations, carried out by C. R. Gallardo and E. Suarez, 1892. in the Department of Lands ("Direccion de Tierras"), whose objective was the localization of areas for the installation of agricultural colonies with, in their majority, european immigrants, to be settled mainly in the pampean region. Later on, the analytical studies were continued in the Division of Agricultural Chemistry ("Division de Quimica Agricola") which were preceded by quidelines on analyis and principles about interpretation and classification of soils. Important names of this period are P. Lavenir, A. Mormes, C. Negri, and A. Sabatini. In the first quarter of the XX1 century the second stage develops, with the study of soils with relation to agronomical problems. P. Lavenir (1902), studies "black" and "white" alkali; (1904), phosphatic fertilizers; (1905), influence of sodium chloride and carbonate on alfalfa; G. Bondenbender (1906), notes for the completion of a geological-agronomical map; P.J. Huergo (1908), publication of the book "The Soil in Agriculture", a volume of 292 pages; Bovet and H. Mistello (1915) study dunes and their fixation; and other numerous examples of studies in the ambit of this disclipline. In the second quarter of the XXth century a third stage evolved, during which studies of soils at specific points are performed, with great amount of works of different kind and furthermore, various groups are created in several argentine regions, some of these being; Province of Corrients:G. Bonarelli and E. Longobardi (1929), Geo-Agrological and Mining Map. Eleven units are recognized, based on texture, color and parent material. Province of Santa Fe: Creation of the Experimental Institute of Investigation and Support of Agriculture and Livestock Production ("Instituto Experimental de Investigacion y Fomento Agricola Ganadero"), J. Gollan, D. Lachaga, V.
Nicollier, O. Mallea, J. Cruellas (1937), cartography and soils genesis. Province of Buenos Aires: Creation of the soils division, "Division de Suelos", by A. Arenas et al. (1939), with emphasis on soil cartography, study of methodologies, analyses of water for irrigation. In 1943 it changes its name to Institute of Soils and Agrotechnology ("Instituto de Suelos y Agrotecnia -ISA"), and the studies now include climatic and agro-climatic investigations, soil fertility, cartography of areas affected with erosion by water and wind, and a generalized soil map of Argentine A. E. Riggi et al (1945); A. G. Vessel (1946); J. Papadakis (1951)
During the third quarter of the XXth censtury the fourth stage takes place: regional and systematic studies are perfomed, with an inventory of the resource soil. In 1956, data of the creation of CIRN-INTA, study tours along the total territory of the Republic were organized. In
374

the work "Soils and Erosion in the Semiarid Pampean Region" (1953) the modern concept of series was employed as taxonoic unit, and the series Pellegrini, Rivadavia, General Villegas, General Pintos, Espartillar, Quemü-Quemü, Alpachiri, Rufino and Carlos Tejedor were defined. D.A. Cappannini et al (1962) in the work "The Soils of the Lower Valley of the Colorado River", employ the methodology of photointerpretation for the delineation of cartographic units, establishing 11 units and classifying the soils according to the american system of 1949. In 1964, the initiation of the Plan of the Map of Soils of the Pampean Region marks the beginning of the systematic inventories of the resource soil and the evaluation of the lands, covering at first an area of 550.000 km2 on scale 1:50.000. The soils were classified according to the Soil Taxonomy system, the productive potential of the lands according to the Lands Capability system, and yield predictions following the parametric Index of Productivity developed by INTA: In 1958 we had our first contacts with the american aproximations ("5th Approximation"), and we began to apply them to some soils in Argentina, and in 1960 we received the 7th Approximation. Soil cartography of Argentina in this contest: L. Farstad (1958); N. Mikemberg (1959 y 1960), D.A. Cappannini y O. Dominguez (1959); J. Papadakis et al. (1960, 1963); ISA-INTA (1960, 1962, 1968); C.R. Miazyniski (1961); P.H. Etchevehere (1971); A. Van Wambeke y CO. Scoppa (1976); A. Pineiro et al. (1962); CIRN-INTA et. al. (1986, 1990); CO. Scoppa et al. (1990). During the decade of the 70s, satellite images began to be used, with visual interpretation. In 1985 another great project was carried out, on scale 1:500.000 which up-dated and/or studied new areas which conduced to the completion of the reconnaissance of the entire national territory. Regional working groups were formed, and other organizations, which have carried out inventories of soil resources, in different areas and scales. The Argentine Soil Science Association, which assembles soil specialis in the country has organized several events (National Congresses): I Buenos Aires 1959. II Mendoza 1962. Ill La Plata 1965. IV Tucuman 1967. V Santa Fe 1969. VI Cordoba 1971. VII Bahia Blanca 1975. VII Buenos Aires 1978. IX Parana 1980. X Mar del Plata 1983. XI Neuquén 1986. XII Corrientes 1988. XIII Bariloche 1991. XIV Mendoza 1993. The last decade of the XXth century corresponds to the fifth stage, whose tendency is directed towards soil data information and electronic systems. CIRN-INTA (1990) organized working groups who specialized in digital processing of satellite images, implementing geographic information systems, incorporating soil data and information into soil data banks. The electronic media will permit a more efficient use for attending the growing demands for information about soils, for the purpose of planning and for applying it in economical (Marketing), production oriented, and ecological councelling.
Conclusions. The development of knowledge about argentine soils accompanied the advance of the science of soil, and the specialists utilized it to improve food production. The problems involved were recognized and several inventories of the resources soil were made, contributing to the development towards production planning which has among its prevalent objectives the conservation of the environment.
References.
(1) Anales del Ministerio de Agricultura. 1903, 1903, 1912. Sección Quimica. Bs. As.
(2) Instituto de Suelos y Agrotecnia. 1945. Publication No. 1. Bs. As.
(3) Instituto de Suelos CIRN - INTA. 1993. Trifolio. (4) Plan Mapa de Suelos de la Region Pampeana. 1969. Actas 5*h Reunion Argentina de la Ciencia
del Suelo. Santa Fe.
375

Anthrosols in the World Reference Base (WRB) A. Kosse. Bureau of Indian Affairs, Gallup, New Mexico, USA
Introduction. Previous attempts to define Anthrosols in the FAO system did not made a distinction between "anthropedogenesis" and anthropogeomorphology (2). Current proposals to modify the FAO system as part of WRB are designed to emphasize the unique nature of pedogenic processes in this major soil group. Anthrosols include those soils which have been so transformed by anthropedogenic processes that the original soil is no longer recognizable or survives only as a buried soil. Anthropogenic soil materials as defined for WRB refer to unconsolidated or organic materials resulting largely from anthropogeomorphic processes and considered to be "non-soil" unless modified by subsequent pedogenesis.
Diagnostic Horizons. Several diagnostic horizons for Anthrosols have been recognized, including hortic, plaggen, terric and irragric horizons (Table 1). A hydragric horizon is also proposed to accommodate soils developed under wet cultivation where subsoil properties have been considerably altered. Definition of the hortic horizon represents a return to the original concept of the anthropic epipedon although archaeological sites are specifically excluded (3). . Base saturation is used to differentiate plaggen and terric horizons, and it should be stressed that color differences are attributable to source materials or substrate. Definition of the terric horizon has been heavily influenced by recent Chinese work (1), while the present definition may mean that most Irish plaggen soils would be included as Terric-Cumulic Anthrosols. Recognition of the irragric horizon seems long overdue, and it should be possible to define this more rigorously with the help of soil scientists in the Middle East and central Asia.
Tabic 1. Diagnostic soil horizons in Anlhrosols.
Hortic horizon Same properties as mollic epipedon (3) except for moisture requirements (no restrictions) and
depth (> 30 cm). Citric acid soluble P > 250 ppm P2O5 . Horizon is thoroughly mixed with original strata usually not preserved. Artifacts and cultural debris commonly occur, often much abraded and finely comminuted. Earthworm casts > 25 percent by volume. Indications of tillage or mixing of soil may be present; buried soils may be preserved but arc usually incorporated in horizon.
Plaggen horizon Same as plaggen epipedon except for depth (> 30 cm); horizon built up gradually by addition of
sods or earthy manures, either as compost or litter (3). Black and brown variants may be recognized; horizon is thoroughly mixed with color attributable to source materials or substrate. Base saturation < 50 percent. Artifacts and cultural debris commonly occur, usually much abraded and finely comminuted. Indications of tillage, such as spade marks, may occur as well as old cultivation layers; plaggen horizons often overlie buried soils although surface horizons may be mixed. Micromorphological investigations may be necessary for proper identification
Terric hvTJftPn Similar to plaggen epipedon with depth > 30 cm; horizon built up gradually by addition of
earthy manures or compost. Horizon is thoroughly mixed with color attributable to source materials or substrate. Base saturation > 50 percent. Artifacts and cultural debris commonly occur, often much abraded and finely comminuted. Buried soils may be present at base of horizon although contact may be obscured by mixing.
Irragric horizon Surface horizon developed under conditions of long-continued irrigation; similar to horitic
horizon except for mollic color. Depth > 30 cm. Artifacts and cultural debris occur commonly, often much abraded and finely comminuted. Horizon thoroughly mixed with original stratification usually not preserved; irrigation deposits may be present below horizon. Earthworm casts > 25 percent by volume. Micromorphological investigations may be necessary for proper identification.
376

Soil Units and Subunits. Anthrosols are usually found in areas of old cultivation where traditional agriculture is of considerable age. Several soil units are recognized, having hortic, plaggen, terric, or irragric horizons > 50 cm; hydragric horizons are also included if the effects of wet cultivation extend below 50 cm. A key for the various soil units is presented below with tentative definitions for each soil unit.
Hydragric Anthrosols
Cumulic Anthrosols
Hortic Anthrosols
Irragric Anthrosols
Anthrosols developed under wet cultivation with a hydragric horizon; usually underlies an anthrohydric horizon.
Anthrosols built up gradually by anthropedogenic processes and having hortic, plaggen, terric or irragric horizons. Evidence for "raised" anthropogenic soils consists of buried soil horizons > 50 cm in depth; differences in heavy mineral content, composition of sand fraction, fine clay content, etc. resulting from the introduction of extraneous materials; and the presence of finely comminuted and abraded artifacts and cultural debris.
Anthrosols having hortic horizon > 50 cm.
Anthrosols having irragric horizon > 50 cm.
According to the present scheme, many of the more common anthropogenic soils would only be recognized at the subunit level. Most of these occur in Cumulic Anthrosols, but it may also be worthwhile to recognize deeply worked horticultural soils where the hortic horizon extends below 75 cm.
Plaggic-Cumulic Anthrosols
Hortic-Cumulic Anthrosols
Irragric-Cumulic Anthrosols
Rigolic-Hortic Anthrosols
Cumulic Anthrosols having plaggen horizon >50cm.
Cumulic Anthrosols having hortic horizon >50cm.
Cumulic Anthrosols having irragric horizon > 50 cm.
Hortic Anthrosols having hortic horizon > 75 cm.
Literature Cited. (1) Chinese Soil Taxonomie Classification Research Group. 1990. Chinese Soil Taxonomie
Classification (First Proposal). Institute of Soil Science, Academia Sinica. (2) FAO-Unesco. 1988. Soil map of the world, revised legend. World Soil Resources Report 60.
Rome, FAO. (3) Soil Survey Staff. 1992. Keys to Soil Taxonomy, 5th edition. SMSS Tech. Monograph No.
19. Blacksburg, Virgina, Pochahantas Press, Inc.
377

Revised Scheme of Taxonomie Classification of Xinjiang Aridisol Ll Shugang Cheng Xin Jim
(Xinjiang Institute of Biology,Pedology,and Ddesert Research.CAS ,Urumqi,China)
According to the recent research on Aridiaol Taxonomie classification of Soils of China * l > , based on the lst.Scheme l z i and our many years' application in arid region , we suggest an another revised scheme of taxonomie classification of Aridisol for further inspection , discussion and application ,in order to improve the classification scheme.
The Aridisol of Xinjiang are forming a vast Aridisol sone in mid- Asia with Kazakstan, Uibeckstan and Turkmenistan, thus in the classification system, it must take into consideration of the common features of the whole inland arid region.
The conception of Aridisol is a set of sous which lacking available moistune in a long term or during plant-growth Beason.consisting of ochric surface layer, secondary argillic or cambic subsurface layer, or at the same time at least possessing the diagnostic residual salic,
gypaic or calcic horizon.In the meantimes,they possess the desert features ( spongy crust layer and platy layer, and with a desert rainish pavement on the surface.and takyric feature.
These diagnostic layers and diagnostic feature would be discussed in another paper 1 3 1 .and only explain the sub-order and great soil groups here.
1. Differentiated and Retrieval of Sub-order. The retrieval of sub-order is differentiated according to whether it ppurossmi a temperate,
hot summer and cold winter or high elevation and cold regimes. Temperate ia denoting mid-Asia YiLi Tacheng.Alma Ata and other places,where the weather is temperate, winter and summer temperature deviation is smalleBt.Hot summer and cold winter is typically continental,denoting the vast plain of Xinjiang where the summer ia hot and winter is cold and with a largest temperature deviation.Altocryic is denoting the high elevation mountaneous region.cold in all four seasons sequentially distributing calcic orthic altocryic three sub-order of Aridisol, In consideration of the same climate change history as the west part of U.S as Xinjiang . We suggest to devide and argillic sub-order in Aridisol. u '
Gl. There is cold in temperature regime Altocryic Aridisol
G2. The other aridisols :There is an upper limit of sub-surface layer to 100cm a calcichorixon. Calcic Aridisol
03. the other Aridisols :There is an upper limit of sub-surface layer to 100cm a luvic argillic or alkalic argillic layer.
Argillic Aridisol G4. the other Aridisol : at least possess one of the following layer : secondary argillic layer, haplo layer,residual salic layer.gypsic and gypsic layer.
Orthic Aridisol Some illustration on revising the Aridisol sub-order:
(1).Firstly search out Calcic Aridisol .and then Argillic Aridisol and Orthic Aridisol , collect the desert soils togather as far as possible and separate with semi-desert soils.
(2).Because the movement and collection of soluble substances is in diagnostic horizon of Aridisol ought to be under sub-surface layer.so the inspecting index has to be corrected that the upper limit ia from beneath the sub-surface to 100cm limit. It is more in coineidence with the practial situation .
(3).The set of soils with typical desert soils diagnostic layer and diagnostic features such as secondary arillic layer.haplo layer residual salic layer and gypsic layer, and desert takyric features are tilled with sub-order Orthic Aridisol.
2.Trxonomic Classification of Xinjiang Aridisol system This is first time we list the common name and international nomenclature of great soil
groups togather ,for the convinent use in transitional period
378

sub-order soil group soil group(intemational) diagnostic feature
Cryo Aridisol Cold desert caic soil
Cold desert so:l
Calcic altocryic aridisol
Altocryic aridisol
Cold temperature regime calcic evidence Cold temperature regime gypaic evidence
Calcic Aridisol
Brown calcic soil sierozem
Calcic aridisol
Weakly devoloped calcic Aridisol
Calcic layer the hue is 2.6YR or more red
Calcic layer.the hue is 7.6YB or mare yellow
Argillic aridisol
Deeert calcic soil
Alkalized deeert calcic soil
Strongly devoloped orgillic aridisol Alkalic argillic aridisol
with reddish brown argillic layer, calcic evidence Alkaliaed argillic layer calcic evidence
Orthic aridisol
Grey desert soil
Brown desert soil
Haplo desert soil
Takyr soils
Salic aridisol
Gypaic aridisol
Haplo aridisol
Takyric aridisol
Residual salt accumulation layer secondary argillic layer Gypaic layer or residual salic layer and secondary argillic layer simultaneously Haplo layer, residual salic layer desert features Haplo layer, typical takyric feature

ASPECTS OF THE ELEMENT BUDGET OF FEN SOILS —
A CASE STUDY OF SELECTED FENS IN NORTH WEST GERMANY
N. Asche Dept of Forest Site Classification, LÖLF, D-45 659 Recklinghausen, Germany
Introduction
Covering about three million km2 in maritime and boreal climates between 50° N and 80° N, fens represent specific ecosystems absorbing considerable amounts of carbon. While adequate data are available on the fen types and their vegetation, little is known of the element budget of fen soils. To contribute to a better understanding of fen soils, the element concentration and supply of peat has been studied in selected fens of North West Germany.
Materials and Methods
The fens investigated are located in different parts of the German federal state of North Rhine Westphalia (fig. I). Climatic conditions of the sites studied are characterized by mean annual precipitation rates of 900 to 1,300 mms and mean annual temperatures from 6" C to 7,5° C. The geological situation is bedrock of Cretateous and Devonic sandstone (fens nos 4, and 3, 2, respectively) and Cambrian quarzites and phyllites (fen no 1). Peat layer thickness of the fens under investigation ranges between 30 to 60 cms. Mixed peat samples (3 for each fen and depth, respectively) were taken at all sites at a depth of 0-5 cms, 5-15 cms and 15-30 cms for further chemical analysis. To determine the dry content of peat, additional samples of a defined peat volume were taken and dried at 60" C until a constant weight had been reached. On the basis of standardized soil analysis methods (1), detailed chemical analyses of the peat samples were carried out by the Soil Ecology Institute at Bohlsen.
Results and Discussion
Results of the analyses can be summarized as follows:
• pH values of the peat suspension showed no marked difference, whereas the amount of acid (per kg peat) varied significantly in the fens investigated.
Fig. 1: Location of sites under investigation
GERMAN STATE OF NORTH • RHINE - WESTFALIA
Graphik: Fuhrmann
380

Fig. 2: Element concentration of peat in diffent fens in meq/kg
Legend
s K
§51 Na
m Mg
(32 Ca
m Al
5 Fe
m Mn
1 - Wollerscheider Venn 2 - Kleines Moor 3 - Nasse Wiess 4 - Schwarzes Bruch
• Element concentration of peat is given in fig 2. It will become evident that element content of the peat differs in the four fens. In this context, high Al concentration indicates an influence of soil water on the fens' water and element regime. Ca values are very high in fen no 1, although this fen is situated on poor Ca quarzite.
• The vegetation of the fens, however, does not reflect the different element concentration of peat soils (2).
Ac kno wle dg em c nt s
Many people have contributed to the development of ideas contained in thes paper. Special thanks are due to Dr Anita Scharfmeister for the vegetation survey.
Literature Cited
(1)
(2)
Meiwes, K.-J. et al. 1984. Chemische Untersuchungsverfahren fur Mineralboden, Auflage,Humus und Wurzeln zur Charakterisierung und Bewertung der Versauerung von Waldböden.Ber. Forsch.-Zentr. Waldökosysteme/Waldsterben Bd. 7: 1 -67. Asche, N. 1992. Einblicke in den Stoffhaushalt oligotropher Ubergangsmoore im Ebbege-birge und ihre Berticksichtigung bei der Waldkalkung. Allg. Forst- u. Jagd-Zeit. Jahrg. 163, H. 10: 177-182.
381

Soils of Casey, Antarctica
H. -P. Blume. Institute of Plant Nutrition and Soil Science, University of Kiel, Germany The soils of an 6.5 ha area directly South of Australian Casey station (Budd Coast, 66' 17,5'N, 110* 32'E) were described. The parent rock consist of a layered sequence of gneisses with shist and migmatites, partly covered with boulders and finer grained morainic materials without carbonates. The mean annual temperature is -9.3°C. January is the warmest month (+0.2°C). Most of the annual precipation of 176 mm is snow. Lower landscape positions are generally covered with snow around the year. Stones and soil surfaces of higher parts are partly covered by lichens and in small depressions by mosses.
All soils are frozen most of the year. The top 30 to 60 cm of the soils thaw during the summer. Therefore the soils are mainly formed since 6000 years by cryoturbation and cryoclastic weathering. But most of them are influenced by biotic structure formation, humus accumulation, chemical weathering together with brownification and some of them by podzolization in addition. Polygons (o 0.3 - 10 m) with stone circles and higher clay contents in subsoil (table 1) were formed by cryoturbation. Quartz rich leucogneisses weathered to gravelly sands but shists to loams. The main texture of moraines are stony loamy sands. All soils were acid (pH KC1 4-4.5) and some showed brownification. Organic matter content in the first 1-5 cm was often 0.5- 2%. Peat was accumulated in small depressions. The first cm especially of sandy soils were enriched with airborne salts (perhaps accumulated after the sublimation of snow), and show vesicular structure. Sandy soils were podzolized (Table la).
The soils were classified after FAO-Unesco (1988) but with modifications as Lithic and Dystri-gelic Leptosols. Dystri-gelic Regosols; Lithic (< 10 cm), Lepti-gelic (10-30 cm)Hapli-gelic (> 30 cm solum) and Gravelly-gelic (> 70% gravels incorporated by birds) Ppdzols; Fibri-, Terri- and Lithi-gelic Histosols; rock outcrops and boulders with lichens on and algae in (2-4 cm) stones were mapped as Lithosols: the mineral soils often with gelundic and/or salic phase (Table 1).
Between soils and vegetation cover strongly correlations could be observed: Podzols were covered by stone and soil lichens together with mosses in all cases. On silty Regosols and loamy Leptosols no soil lichens but algae could be observed: it seems that strongly cryoturbation restrict a cover of long livinq lichens on silty to loamy soils.
I gratefully acknowledge the logistic support provided by the Australian National Antarctic Research Expeditions, my collegue M. Bolter and the 1991 Casey personnel. The project was supported by the DFG; lab. analysis were done by Mrs. Kneesch.
382

Table 1: Typical soils near Casey, Antarctica texture: stones, sand, si.lt, clay; e.c. electrical conduct, of 1: 2.5 soil: water; p pyrophosph.-, o oxalate-,d dith./citr.-, a lactat-extr.;ODO(P)E optical density of oxal.(pyrophosph.) extr. a ) Sandy Lepti-gelic Podzol w. salic and gelundic ph. on acid gneiss with lichens
hor. cm sto. PH e.c. sa si < cl Corg C/N % KC1 as % % % %
AE 0-1 44 5.0 375 95 3 2 2.9 7.6 Bh -5 38 4.2 17 90 7 3 2.1 5.0 Bhs -26 28 4.4 8 66 29 5 2.9 5.0
hor. FeP IT
F eo Fe d o:d MnQ Aid. mg/g
ODOE Eh mg/kg
FeP IT g/g mg/kg
Aid. mg/g mV mg/kg
AE 0.5 0.5 1.2 0.4 5 0.3 48 17 Bh 1.5 2.0 2.9 0.7 8 0.7 213 460 130 Bhs 2.2 2.3 4.1 0.6 17 1.6 329 670 350
b) Loamy Dystri-gelic Leptosol w. gelundic ph . on basic gneiss to shist with alqae hor. cm sto. PH e.c. sa si cl Corg C/N
% KC1 ^S % % % %
Ah i 0-1 33 4.4 150 63 22 15 1.5 12 Ac -5 20 4.4 92 36 31 34 1.0 10 Cw -20 13 4.3 47 33 29 38 1.4 10 Cgw -30 10 4.4 53 31 24 45 0.6 9
hor. Fe p F e o F ed o:d Mn Q Al d ODOE Eh pa Fe p
mg/g — mg/kg mg/g mV mg/kg
Ah 1.4 0.6 3.5 0.2 22 3.3 57 AC 6.6 1.6 8.8 0.2 26 17.6 490 100 Cwl 5.7 2.0 7.0 0.3 30 16.1 670 258 Cw2 7.3 1.8 14.6 0.1 23 18.6 420 165
C) Loamy Dystri-gel ic Regosol w gelundic and salic ph. on moraine with some algae; very long snow cover
hor. cm sto. PH e.c. sa si cl Corg C/N CaCl2 JJS % % % %
Az 0-1 54 4.6 660 66 33 1.' 4 0. 2 7 Cw -30 41 4.4 38 67 28 4.' 7 0. 2 6 Ciw -70 64 4.1 33 83 11 6.: 3 0. 4 7
hor. Fe p Al p
mg/g ODPE Fed Al d Mn d Eh Pa. Fe p Al p
mg/g mg/g mg/g mg/kg mV mg/kg
Az 0.5 0.5 18 3.0 0.5 2.6 650 131 Cw 0.7 0.6 27 3.0 0.6 3.6 640 154 Ciw 0.9 0.6 40 2.6 0.5 2.7 600 168
383

Chernozemes et Luvisols en Bulgarie Todor G. Boyadgiev. Institut de pédologie et d^agroécologie "N.Pouchcarov", Sofia, Bulgarie.
Les chernozems et les luvisols sont largement repandus en Bulgarie. Les chernozems occupent surtout la plaine danubienne tandis que les luvisols a couleur gris,considére's en Bulgarie comme Sols gris forestiers, predominent dans Ie piemont Nord de la chaine montagneuse de Balkan et les sols a couleur marron, classes comme Sols canelles forestiers, se rencontrent dans la partie meridionale du pays.
En tenant compt des traditions et des methodes analitiques utilises en Bulgarie, nous avons adapté les caractéristiques diagnostiques suivantes: - Pour les chernozems: épesseure de Phorizon humifère superieur de 40 cm., clartés humide et sèche respectivement inférieure de 4 et 6, saturation en base (methode Ganev) >80%, pH >6.0 et matière organique >1.5%; ils peuvent avoir une épesseure de 18 a 40 cm. si les clartés humide et sèche sont respectivement egale ou inférieure a 3 et 4, la pureté humide est inférieure a 3 et la teneur en matière organique est >1.5% dans les premiers 18 cm. et >1.0% jusqu au 40 cm. de la surface; la teneur en matière organique a 75 cm. de profondeure e >1.0%; PIndice de la Differenciation Texturale (ITD) est inférieur a 1.4; la couleur de P horizon cambique ou argilique est moins rouge que 7.5 YR et differe dune unitée de celle des matériaux parantales. - Pour les luvisols: ils ne pocédent pas les caractéristiques des chernozems par raport de la couleur et de la teneur en matière organique et ont ITD supérieur a 1.2; la saturation en base dans P horizon cambique ou argilique est inférieure a 35% et la capacité d'échange est >24 me. pour 100 g. dargile.
Les chernozems et les luvisols sont subdivisés au deuxieme niveau comme suite: Chernozems: gleyiques, luviques, vertiques, calciques, kastaniques, entiques et hapliques; Luvisols: degrades (glossiques), gleyiques, nitiques, aliques, chromiques, rhodiques, krasniques, vertiques, calciques, molliques et hapliques.
Dans la partie septentrionale de la plaine danubienne sur loess et regime pedoclimatique thermo-xerique sont développés des chernozemes calcaires (d'après la classification bulgare), qui corespondent aux Haploxerolls
384
entiques (Taxonomie des sols) et Kastanozems hapliaques (FAO). Ces sols sont classes actuellement comme Chernosems kastaniques. Les premiers pédologes bulgares ont egalement utilise ce nom.
La distinction entre les Chernosems luviques et les Luvisols molliques est basee sur V epaisseur de V horizon humifere, la repartition de la matière organique dans Ie profil, la couleur de Phorison argilique et 1TD.
Les Nitosols sont bien connus en Bulgarie, mais ils n'etaient jamais considerés a un niveau plus éleve dans la classification. Pour cette raison ils sont classe's ici comme Luvisols nitiques.
Les Alisols sont connus en Bulgarie comme Jeltozems podzoliques. Toutefois on rencontre des sols lessives avec une saturation en base comprise entre 35 et 65 %, qui sont classe's comme Luvisols aliques.
Les sols rouges sont tres different quand ils sont developpes sur des roches calcaires dures et sur des gneiss. La difference concerne la texture, PITD, la capacite d" adsorption, la saturation en base, les formes du fer mobile, etc. Pour cette raison nous avons separe les Luvisols rhodiques, developpes sur calcaire dure de Luvisols krasniques, developpes sur gneiss.
Abstract. An attempt is made to characterize and subdivise the Chernozems and Luvisols in Bulgaria. The Chernozems and Luvisols are subdivised respectively into 7 and 11 subunits. The new subunits are Kastanic Chernozems and Nitic, Alic, Rhodic and Krasnic Luvisols.
Literature Cited. FAO, 1990. Soil map of the World. Revized Legende, FAO, Rome. US Dept. of Agriculture, 1990. Keyito Soil Taxonomy.
385

Problèmes de classification des sols rouges fersiallitiques (Typic Rhodoxeralf) a la province de Seville (Espagne)
L. Clemente, J. L. Mudarra et J. Pascual. Instituto de Recursos Naturales y Agrobiologia del C.S.I.C, 41080 Sevilla, Espaha.
Introduction. La rubéfaction est un processus pédogénétique caractérisé par une forte liberation du fer, teignant Ie sol dune couleur rouge tres vive (1). Ds sont tres nombreux les auteurs qui ont étudié ce processus, surtout a partir de matériaux calcaires, et ils semblent être d'accord sur la nécessité dun fort contraste stationnel, eest a dire, une alternance d'humectation profonde et dessiccation accentuée du sol (2) Dans ce sens, on peut dire que Ie climat méditerranéen est favorable a la rubéfaction si les facteurs locaux ne 1'empêchent pas (3, 4). Malgré la diversité géographique de la province de Seville, on peut affirmer que son climat est de type méditerranéen avec un exces d'eau en hiver et une forte évapotranspiration en été. Alors, la rubéfaction est toujours possible sur des matériaux calcaires, a conditions normales de drainage, et frequente a partir des matériaux acides (5). Dans ce travail on étude 13 profils de sols rouges fersiallitiques développés a partir de matériaux originels tres différents.
Matériaux et methodes. Les sols rouges sont tres étendus dans la province de Seville. D'entre eux on a élu 13 profils développés a patir de matériaux tres divers: gres calcaire, calcaire cristallin, roches intrusives, granit, vulcanite, lave, espilite et ardoise. Leurs caractéristiques morphologiques (6) et physico-chimiques (7) des sols permettent les classifier tous comme Typic Rhodoxeralf, malgré leur variabilité.
Résultats et Discussion. On a sélectionné les profils a patir de 1'étude de différentes catenas de sols développés sur les matériaux cités ci-dessus. En general, sur des roches ou sediments calcaires 1 evolution finale correspond au Calcic Rhodoxeralf, mais quand la perméabilité est suffisante on peut atteindre Ie Typic Rhodoxeralf. Sur des matériaux acides, Ie Typic Rhodoxeralf constitue un pas intermediaire vers 1'Ultic Palexeralf, quand 1 evolution est ancienne, et même vers 1'Ordre Ultisol dans des conditions d'acidité extreme. De toutes facons, Ie résultat est 1 'existence de sols classifies Typic Rhodoxeralf qui présentent une forte variabilité physico-chimique: pH 4,5 jusqu'a 8.0, horizon argilique avec une teneur en argile de 20 - 60%, taux de saturation du complexe absorbant comprise entre 20 et 100%, etc... Cette grande diversité ne devrait pas être reprise dans Ie même sousgroupe Typic Rhodoxeralf (8).
Bibliographic (1) Duchaufour, Ph. 1981 Manual de Edafologia. Edit. Toray-Masson. Barcelona. (2) Lamouroux, M. 1967. Contributions a 1'étude de la pédogénèse en sols rouges méditerranéens Science du Sol, 2: 55. (3) Clemente, L; Paneque, G. et Garcés, W 1976 Rubefacción e hidromorfismo en suelos de terrazas del Guadalquivir. An. Edaf. y Agrobiol., XXXV: 405-430. (4) Clemente, L.; Pascual, J.; Siljeström, P. y Garcia, L. 1993. Rubefacción sobre materiales acidos: Formas y distribución del hierro. Actas XII Cong. Latioamer. Ciencia del Suelo, II: 942-950.
386

(5) Pascual, J. 1990. Rubefacción sobre materiales acidos. Tesis Doctoral. Facultad Quimicas Sevilla (Espafla). 650 p. (6) FAO 1968. Guia para la descripción de perfiles de suelos. Dir. Fom. Tierras y Aguas. Roma (Italia). 70 p. (7) Clemente, L. 1973. Propiedades, genesis y clasificación de suelos de terrazas del Guadalquivir. Tesis Doctoral. Facultad Quimicas Sevilla (Espafla). 300 p. (8) Soil Survey Staff 1985. Soil Taxonomy. US. Gov. Print. Off. Washington DC.
387

The Classification of Tropical Greyzems in Kenya
W. N. Wamicha. Dept. of Geography, University of Nairobi, P. O. Box 30197 Nairobi, Kenya.
' E X T INTRODUCTION. The word Greyzem is derived from both colour grey (English) and zealya
(Russian) interpreted as earth (FAO-Unesco, 1974). FAO-Unesco (op cit.) went on further to define Greyzems as; having a Mollic-A horizon with a moist chroma of 2 or less to a depth of at least 15cm. And below this, there is an A/E-horizon contact showing bleached qoatings (Albic-E horizon) on structural ped surfaces.
When the soil taxonomie classification (SSS, 1975, 1990) is followed all these soils fall in the Mollisol order. Those Mollisols with hydromorphic properties separate into the Aquaolls and then Haplaquolls suborder and great group respectively (Wamicha, et al. 1990). While concerning those without hydromorphic properties, the suborder is that of Albolls connoting the Albic-E horizon. According to Wamicha (1990) the classification into the great groups, of these Tropical Albolls which are characterized by a Cambic-B horizon is problematic for they were not accommodated in the SSS (op cit.) "Soil Taxonomy". This is because they have neither an Argillic-B horizon to classify as Argial<bodU:s,lvinor do they have a Natric-B horizon to fit into the flatralbolls Great Group (Wamicha, et al. op cit.)i
Still from the soil classification point of view, the Greyzems in Kenya have now been surveyed at a larger scale of 1:100,000 (Wamicha, et al., 1984). At such large scales of mapping the two units (Haplic or Orthic and Gleyic), as separated in the FAO-Unesco (1974, 1988) "Legends", were found rather inadequate. Coupled with the problem of the classification following the "Soil Taxonomy" (SSS, op cit.), as mentioned above, the question of developing a more precise system was therefore raised.
MATERIALS AND METHODS Four toposequences of the Greyzems were, described and sampled in the
field following the FAO (1977) guidelines. At the same time other environmental data like geology, climate and vegetation were collected (Wamicha, 1990). The soil samples were analyzed for chemical, physical and mineralogical properties (Hinga, et £1, 1980). Both the soil field and laboratory data were used during the classification of these Greyzems as outlined by FAO (1974, 1988) and Soil Survey Staff (1975, 1990).
CLASSIFICATION OF TROPICAL GREYZEMS The FAO-Unesco "Legend" classification These soils, which have Mollic+A horizon underlain by A/E transition
with bleached ped surfaces, then by Albic-E horizon and finally lower down is a Cambic-B-horizon, classify as Greyzems (FAO-Unesco, 1974, 1988). The Haplic-and Gleyic- Greyzem units per se are as described by the FAO-Unesco (op cit). Additionally, in this study a ' Vertic* Greyzem unit has been defined to cater for those soils that: (i) Have many slickensides in the E and B-horizons. (ii) Clay . mineralogy in the E and B-horizons dominated by 2:1 clay mineral (smectites), (iii) Lack cracks >lcm and gilgai microrelief on the surface.
388

2
' Lithic' Greyzem unit, as introduced in this study, has all the characteristics diagnostic for the Greyzems, but the soil depth ranges from 25 to 50cm. Finally, those Greyzems with ESP of 6 or more in a horizon between 0 to 100cm have a sodic phase (FAO-Unesco, op cit.).
The 'Soil Taxonoay' classification Since these soils have a Mollic-epipedon they key out in the Mollisol
order SSS (1975, 1990). The first suborder of Aquolls has included the Mollisols with hydromorphic properties which were further separated into Typic Haplaquolls. The second suborder with an Albic-E separates to Albolls for which the diagnostic-B horizons are used during the separation of the different Great Groups. These include; the Argialbolls and the Natralbolls having an Argillic- and a Natric-B horizon respectively.
For the soils studied Cambic-B has been identified, because, these soils generally do not have an ESP of more than 15% and clay illuviation has not been observed (Wamicha, 1990). So neither a Natric-B nor an Argillic-B horizon could be identified. The author has therefore suggested that these soils would separate as Cambialbolls with the following subgroups; Typic-, Vertic-, and Lithic- Cambialbolls.
REFERENCES FAO, 1977: Guidelines for soil profile description. 2nd Edt. FAO-Rome. FAO-Unesco, 1974: Soil Map of the world. Vol 1, Legend; Scale 1:5(106).
Unesco-Paris. FAO-Unesco, 1988: Soil map of the world. Vol 1, Legend 21"1 Edt.; Scale
1:5(106). Unesco Paris, FAO-Rome. Hinga, G, Muchena, F:N. and Njihia, CM. (edts), 1980: Chemical and
physical methods of soil analysis. National Agric Labs, Nairobi, Kenya. Soil Survey Staff, 1975: Soil Taxonomy, basic system for making and
interpreting soil Survey. Hbook No-436. Soil Conservation Service. US Dept. of Agric, US Printing Office, Washington DC.
Soil Survey Staff, 1990: Keys to Soil Taxonomy, 4tk edition. SMSS technical monograph no.6. Blacksburg, Virginia. USA.
Wamicha, W.N., 1990: The Genesis and Agroiorestry Land Use possibilities of Tropical Greyzems in the Oloololo-Migori area, Wilaya ya Narok, S.W. Kenya. Ph.D. Thesis University of Giessen, Federal Republic of Germany.
Wamicha, W.N., Okoth, P.F. and Kiome, R.L.M, 1984: Soil map of the Transmara Division, Narok District, Kenya. Kenya Soil Survey, Nairobi.
389

On Geometrical Basis for Database for Soil Classification A. E. Kovaleva, and Z. F. Povetukhina. Institute of Soil Science and Photosynthesis, Pushchino, Moscow Region, Russia.
Soil units may have various dimensions. For example, separate samples may be considered as zero—dimensional units, Dokuchaev's soil profile may be considered as one-dimensional unit. Modern state of knowledges allows to apply two-dimensional classi f i cational models o-f soils. Mostly important -from them are plan models which are -fixed on soil maps using contour lines of topographic maps. Traditional topographic map usage is restricted by elevation and gradient.
Soil scientists know the conditional nature of soil taxon boundaries and the absence of well-defined rules for these boundaries mapping. This gives rise to difficulties in soil areals usage for data base formalized procedures.
To eliminate (diminish) arbitrariness in boundaries positions, we use cartographical second derivatives method. The sense is that zero curvature paints of contour lines are connected by special isolines. Such isolines separate soils onto that subjected to soil loss and destroying (divergence areas) and that with soil accumulation (convergence ares). Essentially, they correspond to soil areas with landsurface convexity and concavity. The spatial pattern drown by these areas is formed by a gravitational field. Each line of the resulting geometrical image is defined as mathematically strict by concrete variable (plan curvature) which may have negative, zero and positive values. Such discretization of soil space makes it two-dimensional.
Together with the geology and climate, the relief is one of fundamental factors of soil development, and we suggest to take this factor into account during classification schemes selection by usage of the developed spatial soil units.
390

Establishment in Cuba of the National Soil Collection and its Database within NASREC Programme.
Regla Chang, R. Villegas, S. Kauffman, R. Marin, C. Balmaseda, F. Arcia and D. Ponce de Leon. National Sugarcane Research Institute, Cuba,
Ave. Van Troi # 17203, CP 19210, Boyeros, C. Habana, Cuba
Introduction. Since 1966 the International Soil Reference and Information Centre (ISRIC) with the auspices of the International Society of Soil Science (ISSS) has built up a worldwide collection of soils, by prepared soil specimens (monoliths) and a database. The programme that support this project is NASREC, by this way ISRIC provides assistance and financial support for the development of the National Collections. This work started in Cuba in 1991. The national responsible institute is the national sugarcane research institute of the sugar ministry of Cuba. The venue is the provincial sugarcane experiment station of Villa Clara, in the center of the country. At present it is concluded a Core Collection of 22 monoliths taken through the country (Fig. 1). These show significant variation among the different soil types and the degradation status in each site, as well as their characterization and classification. It also shows the qualitative evaluation and land use of the different ecosystems studied.
Fig. 1. Profiles distribution throughout of Cuba.
391

Materials and Methods. The work was carried out following the scheme that appears in Fig. 2 and the technical and methodological principles stated by ISRIC (van Baren and Bower, 1982; van Waveren and Bos, 1988; and van Reeuwijk, 1992).
Results and Discussion. The Collection consists of 22 reference monoliths which are presented with their database, and supplement information on other similar profiles of the country. The aperture of the Collection has benefit all those interested in enlarging their knowledge about soil management with a scientific foundation, especially university students and Agricultural Institutes placed near the Villa Clara Station, promoting discussions on the subject and improving the communication among soil specialist and visitors. In occasion of the Technical Tours Pre and Post Congress, this Collection will be the final point of the participants. This visit is expected to offer the participants an ample information on the soil resource and its use in the greater Caribbean Island.
Reception Main Cuban soils climatics variation through out the country Specific characteristics of the different region
of general information
Main Cuban soils climatics variation through out the country Specific characteristics of the different region
t
Main Cuban soils climatics variation through out the country Specific characteristics of the different region Selection of the sites
Main Cuban soils climatics variation through out the country Specific characteristics of the different region
Field work •
Laboratory analyses
Cabinet
work
Data collection Data processing
Draw of monoliths Sampling
Soil and place description
Photograph of the crop, landscape, profiles and vegetation
Laboratory workshop
Chemical Physical Micromorphological
Mineralogie
Drying Inpreganting Pasting Carving Varnishing
Soil collection
Reference
Fig. 2 . WORK STAGES OF THE SOIL PROFILES COLLECTION
VAN BAREN, J.H.V. and BOWER, W., 1982. Procedures for the Collection and Preservation of Soil Profiles. Technical Paper No. 1. ISRIC. Wageningen, The Netherlands..
VAN REEUWIJK, L.P., 1992. Methodology LABEX. Procedures for Soil Analysis. Technical Paper No. 9. ISRIC. Wageningen, The Netherlands.
VAN WAVEREN and BOS, A.B., 1988. Guidelines for the Description and Coding of Soil Data. Technical Paper No. 14. ISRIC. Wageningen, The Netherlands.
392

•
Elaboration and Use of the European Soil Geographical Data Base
M. Jamagne, D. King, C. Le Bas, J. Daroussin, P. Vossen and A. Burrill. National Institute for Agronomic Research - Orleans - France, and Joint Research Centre of EC - Ispra - Italy.
Introduction - As part of the activities of the Commission of the European Communities, the soils knowledge, their use and their protection concern mainly the Directorate General of Agriculture (DG VI), of Environment (DG XI) and of Research (DG XII). The agronomical research was organized, during many years, in different Programs Committees with precise objectives, and the one attending to Soil Science was called "Land and Water Use and Management". It worked successively on the following points :- Elaboration and publication of the Soil Map of the European Communities.- Resources assessment of physical medium for Europe.- Analysis of rational management of these resources.
The EC Geographical Data Base for the Pedological Landscapes - The Soil Map of EC, published in 1985 (1), and that of Middle Europe, in 1986 (2), were elaborated using elements from the FAO European mapping program started in the 70's and never finished. The data collected by this FAO program, and composed of national documents (cartographical drafts and descriptive tables of soil units), were re-used by the CEC in 1980 for the European Communities countries. An harmonization was necessary and therefore some data were given up for the publication, but kept in archives. The CORINE (Coordinated Information on European Environment) program (DG XI) realized the computerization of the Soil Map of the EC in 1986, constituting the first spatialized soil database (7.0 Version). Some applications of that first version of the data base were soon made, using parameters combinations. A first project (CORINE) tried to make a zoning of the meridional part of EC in terms of susceptibility of soils to Erosion associated with another zoning dealing with Land qualities (3). Other projects were : a zoning about "Buffering" capacity and susceptibility to acid rains, and the elaboration of a Water Storage Capacity map (Monitoring Agriculture by Remote Sensing : MARS Project - DG VI). However, the data coming from the digitization of the map appeared insufficient to answer satisfactorily the presented problems. The improvement of this database consisted first of its enrichment using a lot of data found in the archives, parent material and percentage of occupation for example, and so it yielded to a better version of the data base (2.0 Version) (4). In a further stage, the database has been improved by the addition of new attributes, which permit a better characterization of the mapping and the typological units : texture of the subsoil, presence of impermeable layer, hydric regime,... (3.0 Version). Moreover, an analytical database of soils profiles (5), for the most representative units of the European territory, has been created, and Pedotransfer functions were also developed in order to answer given thematical problems (erosion, pollution, etc..) (6). The whole, managed by a Geographical Information System, is progressively elaborated by a Support Group of the CEC called "Soil and GIS".
Extension to Central and Eastern European countries - The CEC (Joint Research Centre -Ispra) then wished to integrate progressively in the same program the data from the Central and Eastern European countries , including Austria and Switzerland. This extension began early in 1992, on the same base as for EC countries, and is at present nearly finished (7). A number of new codes have been of course added, particularly for soil names and parent materials.
393

Activities (of a Soil Map of Europe ai 1:1 M scale
FAQ- 1970- 1974
Inmal National Daia Mapping drafts ai 1:1 M s e
Descriptive tables (Univtrtitv of Ghent)
Map Elaboration I 1971 • 1912 I
Soil Map of the EC
1915
Soil Map of Middle Europe
1 « 6
X I Notice | I Map I
L ) | L e « n d |
[Compulcnzatio 19U
DataBase I 0 version
Enrichmenc 1990-1991
Soil and CIS Support Grcu?
DataBase Central and Eastern Europe
l a t rmon in pfOJrest
Updating and complements from
countries 1992
Pedotransfer functions
Program 1992 Eastern pan of Germany
Poland Bulgaria
1993 Hungary Czech and Slovak Republic Rumania
Profiles Data Base
Conclusions - The final aim was, in fact, the elaboration of a spatialized soils database for the whole European territory. This data base would be able to give sufficiently good answers to the different kinds of problems important for the agricultural production (DG VI - MARS) or those concerning the protection of the European environment (DG XI - European Environment Agency),and also for "Global Change" simulations. In a world context, different works have been made or are in progress under the auspices of large international organisms such RAO or UNEP: GLASOD and SOTER programs, GEMS and GRID organizations,... It is obvious that an harmonization with those main world programs appears to be more and more important to organize and develop. The rational stmcturation of the whole knowledge concerning the principal soils of Europe, so provided in a computerized form, would lead to a better management of the patrimony of the European soil resources.
Literature cited. (1) EEC, 1985. Soil Map of the European Communities 1:1,000,000. Luxembourg. 124 p. (2) EEC, 1986. Soil Map of Middle Europe 111 M. Luxemburg - 124 p. (3) EEC - CORINE, 1992. Soil erosion risk and important land resources in the southern regions of the European Community - EEC publications DG XI Luxemburg - 97 p. (4) KING D., DAROUSSIN J. and TAVERNIER R., 1992. Development of a soil geographic database from the soil map of the European Communities. CATENA, (under press). (5) MADSEN H.B., 1989. Elaboration of a soil profile and analytical data base connected to the EC-Soil Map. In: EC-Workshop on application of computerized EC Soil Map and climate data. Wageningen. CEC-DGVI, Luxembourg. 119-132. (6) BOUMA J. and VAN LANEN H.A.J., 1986. Transfer functions and threshold values: from soil characteristics to land qualities. In Proceedings of the international workshop on quantified land evaluation procedures. 27/04-2/05/1986. Washington D.C. 106-110. (7) JAMAGNE M., LE BAS C, KING D., 1992. Elaboration of a Geographical Data Base for the Pedological Landscapes of Central and Eastern Europe . INRA - JRC Ispra - EEC. 23 p.
394

A LAND RESOURCE DATA BASE FOR MEXICO
L. Cajuste*, E. Ojeda, G.A. Arévalo, and R. Ponce. Colegio de Postgraduates, Montecillos, México 56230, MÉXICO.
INTRODUCTION. Land Assessment plays a basic role, as to determine under constraints of an environmental, economical and social context, the best set of agricultural uses for a given region or set of cartographic units. In achieving this goal, a number of stages must be worked out, according to a previously settled framework. The Land Resource Data Base (LRDB) is the first result of such effort. The construction of such a data base was intended to provide information at different scales about land (climate and soil at this stage) attributes that would give to the technician an environmental description of the different agricultural areas. From here, it should provide to the users (agricultural technicians) a baseline to perform decision making on land planning activities. OBJECTIVES. LRDB had as its main objectives the following points: a) to concentrate in a tool all the information describing natural resources under a digital format;and, b) to provide a tool for performing land use planning through AI and GIS applications.
MATERIALS and METHODS. The structure of LRDB can be described as a five-level-five-thematic-files data base. The five levels included comprises the following scales: national.- 1:1000 000 state.- 1:500 000
district- 1:250 000 municipal- 1:50 000 farm unit- 1:10 000.
At each scale, land resources is described with the five following inventories themes: - fisiography, - climate, - soil, - land use, and
- agroclimatology. Depending on the scale, sources of information included:
- maps - satellite imagery - meteorological stations - aerial imagery - laboratory data - tabulated data - field data - descriptive data
Before carrying out input process, spatial information was validated as to ensure that features and units present in smaller-scale maps would occurred in large-scale maps. This fact would enforce some data integrity in LRDB. Non-spatial information was treated in the same fashion; furthermore, some attributes that were expressed in nominal and ordinal terms, were coded so as to reduce the size of files containing such information. Data input was performed using the GIS application known as ILWIS. Spatial attributes were entered with a Calcomp Drawing-Board-III digitizer; and non-spatial data was captured in a low level DB application. Both information, spatial and non-spatial were stored in ASCII files to provide data independency.
RESULTS and DISCUSSION. Since LRDB should operate with GIS and AI technology, the information contained in it is divided into two groups:
Spatial information
395

- Coasts - Frontiers - Islands - Lakes -Rivers - Fisiographic boundaries - State boundaries - Highways and urban centers - Rural centers
Non-spatial information - Fisiography - Climatic data - Soils - Agroclimatic data - Land cover
As it can be seen, the fisiographic survey is the thematic base information that connects the spatial data with the non-spatial data. Other aspect is that each inventory is in a sense, an individual proper data base, since beside the main file containing the attributes of each theme, there are other files describing relations between such attributes, and attributes of other themes . In this sense LRDB can be considered as a MDB. Since the model selected for describing information in LRDB is the Entity-Relation model, LRDB is a relational DB; although the whole information describing land resources has a hierarchical structure. The fact above was an important constraint and a priority goal to construct LRDB in a way that loss of information and disk space would be minimal, and data retrieval and processing could be straight forward. ASCII files of spatial attributes consisted of the following objects:
- points - segments - polygons. Topology files not only contained relations within these objects, but also relations with other features as highways, states, fisiographic units, rivers, lakes, islands, coasts, and frontiers. ASCII files for non-spatial attributes included five main relational tables in 2NF and other tables that describe more specific relations and other elements as land cover, land topography, and geology, among others. These three attributes in the future will be transformed in individual separate inventory data bases within LRDB, as the other themes, so as to facilitate the manipulation of these data sets. At this stage, query and retrieval of information is performed mainly through GIS (ILWIS). Hence, results of such processes are expressed in forms of maps, displayed on screen, stored in ASCII or binary files, or output through hardcopy devices (printer or plotter). Queries (basic and advanced) on spatial attributes are performed using the segments file as the start point of data. Queries on non-spatial attributes is possible with basic DB operations (SELECT, PROJECT, JOIN). Data manipulation and model building is also mainly done through GIS (ILWIS) through the map-algebra module, and outputs are similar as data retrieval.
LITERATURE. (1) Borland International. (1993). Turbo C++ user guide. Palo Alto, California. (2) Cajuste, L. (1991). Zonagro guia del usuario. CONACYT-CP. México. (3) Date, C.J. (1977). An introduction to database systems. Addison-Wesley. Mass. (4) Dumanski, J. (1993). The Hierarchy theory approach in land inventories. A C , Ontario. (5) INEGI (1978). Carta edafológica nacional 1:1000000. México. (6) ITC, (1993). ILWIS user guide. Wageningen Agricultural University, Wageningen. (7)Litwin, W. (1986). Multidatabase interoperability. Computer Vol 19(12): 10-18. (8) Ojeda, E; A. Santos; HE. Cuanalo & C.A. Ortiz; (1990). El levantamiento
fisiografico de la repüblica Mexicana. Colegio de Postgraduados, Montecillo. (9) Small, C. (1991). Default databases and incomplete information. Comp. J. 34:239-244.
396

A E G I S . A Systems-based Tool for Landuse Planning
F.H. Beinroth, J.W. Jones, L.R. Perez Alegria, and J.P. Calixte. Dept. of Agronomy and Soils, University of Puerto Rico, Mayaguez, PR 00680, USA, and Agric. Engineering Dept., University of Florida, Gainesville, FL 32611, USA.
Introduction. AEGIS, the Agricultural and Environmental Geographic Information System, was developed in realization of the fact that the practice of agriculture and the management of ecosystems take place in time and space. It is a prototype of a decision support system that integrates spatial soil, weather and landuse data bases; the Decision Support System for Agrotechnology Transfer (DSSAT) of the International Benchmark Sites Network for Agrotechnology Transfer (IBSNAT); a soil erosion model (Universal Soil Loss Equation, USLE); a simple expert system for bean production; a relational data base management system (dBASE IV); and a geographic information system (pc-ARC/INFO v3.4D).
Development of AEGIS. AEGIS was developed using digitized soil, weather and landuse data for three 3,800-ha areas of western Puerto Rico (Mayaguez, Isabela, Lajas). The 1:20,000 USDA/SCS soil maps of these areas differentiate 88 map units, mostly phases of 38 soil series that exemplify 7 of the 11 orders of Soil Taxonomy. The soil parameters required to run the IBSNAT crop models were derived from soil survey reports and series-specific analytical data available for 28 of the 38 series. For the remaining series, surrogate data were estimated using analogue procedures. Combining the field and laboratory data, soil data files were created for each of the 67 agriculturally suitable polygons. The climate in the region ranges from humid to subhumid to semiarid tropical. Historical weather data (daily precipitation and maximum and minimum temperature) recorded at four representative stations were used. Long-term solar radiation data were not available but time sequences were estimated with a stochastic default procedure developed for Puerto Rico. Landuse coverage of AEGIS was generated by processing LANDSAT imagery with the Earth Resources Data Analysis System (ERDAS).
AEGIS Functions. AEGIS was linked to DSSAT and thus provides direct access to the functions that reside in that system. More than 250,000 runs, representing various combinations of management practices and production strategies, were made with BEANGRO vl.01. In addition, soil erosion under various conservation practices was estimated for each map unit with the USLE. The results were statistically analyzed and stored in the system for instant recall. Using these data, or information generated interactively, AEGIS can predict crop performance and soil loss, aggregate polygon attributes over space and time, estimate production and resource requirements for different agricultural strategies, assess potential environmental impact, generate tables and develop production plans for a region.
Conclusion. We consider AEGIS a significant step forward in the development of a decision tool that incorporates contemporary geographic, environmental and agricultural systems technology. A novel attribute of AEGIS is that it expands the scope of analysis of DSSAT from a site to ~n area by linking it to a geographic information system (GIS).
397

Testing a Modified Fao Land Evaluation Method in Burundi P. Hennebert*, E. Tessens, B. Belvaux, and D. Tourenne. Département Aménagement du Milieu, FACAGRO, Bujumbura, Burundi, Programme de Pédologie, ISABU, Bujumbura, Burundi Sciences du Sol, UCL, Louvain-La-Neuve, Belgique.
Introduction. A simple land evaluation method is proposed for Burundi. Is it able to predict the mean regional on-farm food crops yield for this traditionnal low-input agriculture ? Materials and Methods. Land evaluation. The FAO proposed a land evaluation method based on basic caracteristics of photosynthesis, climatic and soil data, and land utilization type. It was later further developped by Sys, in a predicted range of yield. Tessens adapted it to the data available in Burundi. Yields data. Yields from three geographical scale were compiled: a regional on-farm liming trial of the agricultural extension service of the Mugamba (mean altitude 1900 m asl) (100 sites, ± 1200 data), a multilocal on-station fertilizer trial of the extension society of the region of the Kirimiro (1600 m asl) (4 sites, ± 400 data) , and a 2 year on-station one-site lime and fertilizer trial of the Département Aménagement du Milieu of the FACAGRO in the region of the Bututsi (1910 m asl) (1 site, ± 60 data). Soil data. Chemical analysis of the 0.2 m topsoil of the 100 sites of the on-farm trial were performed. Climatic data. The monthly values were extracted from a local database. Crops. The crops were wheat, pea, bean, maize and potato. Results and Discussion. A check of the calculated climatic yield against the best published observed yield in Burundi gave very good agreement for wheat, pea and bean, overestimation (14 versus 7.8 Mg hm~2 !) for maize, and underestimation (23.8 versus >30 Mg hm-2) for potato. The comparisons between observed and predicted yields for the on-farm trial are given partly at figure 1. The frequences between the mean of the observed yield by evaluation class and the predicted range of yield are:
Yield Potato Beans Peas Wheat Maïze Total obs/pred. 4/4 1/2 1/2 2/2 1/2 9/12
As can be seen in figure 1, the variability of the observed yield on farm exceeds the predicted range of the method. The variances of the yields in regional (in the farms), local (in controlled sites) and on station (1 site) trials were compared, to assess the factors of variability. Excepted for maïze and potato, no statistical differences of variances of the yields among those three very different geographical scale of trial were founded. The influence of the year, the season, and the altitude on the yields and the variability of the yields are discussed. The method seems therefrom satisfactorily predict the mean regional yield.
398

POTATO
"2DRR8SSï8BSSPCStf!J!8SeïSRSSSS8R
°"5S8RSSS!88S5RÉisiiRÉ?É*ÉS?8É?É
SI Cl T l
™rRESR?58R3SSE8m8S2gSSSR8ï8R
S2 Cl T l
"SÏ8R8SSS883!!SE8S8t!|S5=8RSSS;8R
«iMMMwièi«giMiïi*W*4*** "5rRE8R?S8RSS£K8S8R8J°"SKSBSS8R
SI C2 T l S2 C2 T l
BEAN
I Ï R R 8 B S S R R S S P P 8 E 8 R 8 1 ? S E C S R S ï 8 R 3 S F ." 8 E S S'
H •
' E C a G S ï S R S S S C S C S R g
S I C2 T2 S2 C2 T2
Fig 1: Frequencies of observed yields (barchart) and predicted range of yields (vertical lines) of potato and bean for the on-farm trial, expressed as percentage of the potential climatic yield, for different soil (S), climate (C) , and land utilization type (T) classes.
399

A Large Scale Soil Information System (SIS) for the Structural Analysis of Agriculture in Flanders (Belgium).
J. Desmet Work Group "Research on Land Management", Research Station for Agricultural Engineering, Van Gansberghelaan, 115, B-9820 Merelbeke, Belgium
Introduction. Belgium is the only country in the European Community that has surveyed its sous in such a detail viz. on a scale of 1/5,000 and that has published those on maps on a scale of 1/20,000. The Work Group "Research on Land Management" has witnessed the revaluation of these Belgian soil maps from close by. These detailed maps lay dormant during the seventies and the beginning of the eighties but are now experiencing an unusual interest, not only in agricultural circles but also among environmentalists. Undoubtedly the appearance on the market of Geographical Information Systems (GIS) at reasonable prices has contributed to this renewed interest. The potential of information contained in the soil maps has not been fully exploited, the time-consuming work to link soil data on the analogue maps to other environmental data was largely responsible for this (1,2). In the soil research, that was largely based on those soil maps, at the Research Station for Agricultural Engineering, an important evolution could be observed from planimetry (1980-1985) to digitizing (from 1985 onwards). In this transitional stage the need for user-friendly cartographic computer programs was seriously felt (3). Several attempts were made to write such computer programs but it never got beyond attempts and soon afterwards the first commercial GIS-packages were introduced onto the market (Arc/Info e.g.). Not only the storage of the coordinates of the polygons of the soil series was an important advantage, also the automation of the projection of the various maps onto each other (such as the regional zoning maps with scale 1/25,000 onto the soil maps with scale 1/20,000) and the automation for calculating the areas of the soil series within a given coverage. Additional map layers with the boundaries of among others the municipalities or parcels can always be added in overlay (4). With regard to the EC-directives concerning the set-aside policy of agricultural land a map was developed on the soil suitability for afforestation with poplar, willow and alder. Soils suited for afforestation were quantified and localised with the aid of a detailed soil information system (5).
Materials and Methods. The application of such a Soil Information System (SIS) requires a large-scaled digital base map. This base map is a very detailed, metrically corrected cadastral map (scale: 1/2,000). The cadastral maps, which are on transparents, are fitted into the corresponding rectified aerial photographs or orthophotographs. The boundaries on the aerial photographs corresponding with the cadastral boundaries are then digitized. Boundaries which cannot be seen on the photograph but which can be deducted from the cadastral plan (e.g. by processing the various parcels as a whole) are then copied from the cadastral plan. A digital register of the parcels is subsequently made by linking the digital datafHes of the cadaster with those of the large scale base map. The other layers in this Soil Information System were built up by digitizing the soil maps (scale 1/20,000), the
400

biological assessment maps (scale 1/25,000), the regional zoning maps (scale 1/25,000) and the "Green Main Structure" (scale 1/100,000).
Results and Discussion. Based on the digital soil maps and because of the straightforward structure of the soil legend, thematic maps were drawn by carrying out a selection on one of the three basic characteristics viz. texture class, drainage class, profile development. By linking the drainage characteristics to the attributes of the digital soil map it is possible to work out a map with the artificial drainage requirements. After projection of the network of roads, derived from the topographic map, it becomes fairly easy to situate these soils. By means of digital overlay techniques, applied to the zoning maps, it becomes possible to judge the claims made by the various sectors (among others agriculture and nature conservation). To establish the agricultural value of the land it is essential to determine its potentiality at reconversion to other crops. This may open new perspectives for an intensification of agriculture. It is here that the physical soil suitability from matrixes fits in for all the soil series of the various cultivation groups. The different suitability classes in both the morpho-genetic and geomorphologic classification system should make it possible to link the individual suitability to a digital soil map. From the derived suitability maps for the various cultivation groups and through thematic processing an agricultural and horticultural map is obtained that can serve as a basis to balance the agricultural against the environmental interests (Yellow Main Structure).
Conclusions. By implanting the results of a municipal questionnaire on agriculture in a large scale Soil Information System several interesting agricultural applications became possible. The local councils have with this relatively new technique a powerful instrument in their striving towards a maximum protection of the remaining rural sites enabling in this way a coexistence between agriculture and nature conservation.
Literature Cited (1) Maes, J. 1988. The concept of an Integrated Soil Information System in Belgium, Proceedings of an International Workshop on the Structure of a Digital International Soil Resources Map annexe Database, Wageningen, The Netherlands, 68-71. (2) Vandenbroucke, D. and Van Orshoven, J. 1991. From soil map to Land Information System using GIS, Proceedings Second European Conference on Geographical Information Systems, Brussels, Belgium. 1157-1164. (3) Desmet, J. 1991. De inventarisatie van gronden met wateroverlast in Vlaanderen, Mededelingen van het Rijksstation voor Landbouwtechniek, Merelbeke, Belgium. 20 pp. (4) Desmet, J. and De Jonghe, K. 1992. The application of a Soil Information System in reallotment projects, Proceedings of the European Conference on Integrated Research for Soil Protection and Remediation, Maastricht, The Netherlands. September 6-12, 4 pp. (5) Desmet, J. and Maton, A. 1989. A quantitative study of the possibility of afforestation, with poplar, willow and alder on arable land and grassland in West and East Flanders, Soil Technology, Belgium. 2, 91-100.
401

The Capacity for Agricultural Use of the Soils in the Coy area (Murcia, Spain)
R. Ortiz Silla, J. Alvarez Rogd y A. Faz Cano. Dpto. de Quimica Agricola, Geologia y Edafologia. Univ. de Murcia. 30100 Murcia. Espana.
Introduction. The study area is included on sheet 932 (25-37) of the 1:50,000 National Topographical Map of Spain and is bounded by longitudes l^ l ' lO"^ and lfi51'10",8 West and latitudes 37fi50'04",6 and 38Q00'04",6 North. The climatic data provided by local metereological stations, and according to Papadakis (1980), point to a thermal regime between warm subtropical and warm maritime with a dry Mediterranean moisture regime. The vegetation is principally composed of successive stages of the Rhamno lycioidis-Querceto cocciferae Sigmetum series very degradaded by felling, turning and excessive grazing. The humid zones of the mountain ranges sometimes contain stands of kermes oak (Bupleuro rigidi-Quercetum rotundifoliae), which are replaced by open copses of Junipero thuriferae-Quercetum rotundifoliae in the highest parts. The western half of the sheet belongs geologically to the SubBetic Zone, while the southeastern quarter lies in the Betic Dominion, with outcrops of Malaguide Complexes. Among these materials, recent postorogenic sediments are abundant, as are Quaternary superficial formations. The soil types, mapped by Alias et al. (1987) using the FAO-UNESCO (Unesco, 1974) system, are as follows: Calcic, Petrocalcic, Gypsic and Luvic Xerosols, Lithosols, Ortic and Aridic Renzinas, Calcic Cambisols, Calcaric and Litorrodic Regosols, Calcaric Fluvisols and Calcic Luvisols.
Material and Methods. The evaluation method used was that established by Aguilar and Ortiz (1992), based on the FAO (1976) guidelines and the system of Riquier, Bramao and Cornet (1970). The method establishes a hierarchy of orders, classes, subclasses and units. The limits between the orders and different classes are established by the presence of limiting factors: slope (i), useful depth (e), rockiness (r), stoniness (p), drainage (d), granulometry (g), salinity (s), toxicity (t) and useful humidity (h). The subclass is indicated by the principal limiting factor, while the unit establishes differences within the subclass according to the recommended use. The uses which were considered are: intense agricultural use with no improvement (A), intense agricultural use with improvement (B); pasturage (C); reafforestation (D); trees adapted to dry climates (E); revegetation with autochthonous scrub (F) and conservation (G).
Results and Discussion.
Class SI lands comprise those used for cultivation and which need very little conservation to maintain their productivity. The soils in this class are Calcaric Fluvisols and Calcic Cambisols.
Class S2 lands include agricultural land which permit the cultivation of a limited range of crops and which need a moderate degree of conservation. They can be divided into three subclasses. Subclass S2i: appears on Calcic Cambisols and Calcaric Fluvisols. The unitS2i-B
402

and S2i-D can be distinguished. Subclass S2g are Calcic Xerosols and Calcaric Fluvisols with a very heavy texture as principal limiting factor. They can be included in unit S2g-A. Subclass S2h: the only important limitation is the absence of an established irrigation; appears in different types of soils; the unit S2h-E can be distinguished.
Class S3 are lands which can be tilled occasionally due to several limiting factors, which reduce their productive capacity and make them more difficult to cultivate than the previous classes. Four subclasses have been established. Subclass S3i: there soils show a high risk of erosion, which would increase considerably with careless or unsuitable cultivation. They are made up of Calcaric Regosols and Fluvisols, Calcic Xerosols and some Calcic Cambisols. The units S3i-B, S3i-D and S3i-E belong to this class. Subclass S3e: appears in Petrocalcic Xerosols, whose crust is usually found at a depth of about 50 cm. This subclass includes the unit S3e-E. Subclass S3p: this appears in Petrocalcic Xerosols and the presence of stones is due to the fragmentation of the calcareous crust by turning. Units S3p-B and S3p-E can be distinguished. Subclass S3h is principally constituted of Calcaric Regosols with a very heavy texture, which together with the low rainfall, makes it difficult for plants to take up moisture, and Petrocalcic Xerosols. Unit S3h-E is included in this subclass.
The lands belonging to class Nl have such serious limitations that they do not permit sustained use and although they can be improved with time by technical means, the cost of doing this is excessive. Four subclasses have been identified. Subclass Nli shows a high risk of hydric erosion, which has been aggravated by unsuitable cultivation. It is formed of Calcaric Regosols, Calcic Xerosols and Calcaric Fluvisols. Includes the units Nli-D and Nli-F. Subclass Nle: this subclass has very little useful depth of soil, only 10-30 cm, and according to its present state, the unitsNle-F and Nle-G have been identified. Subclass Nip appears in Calcic Cambisols, Ortic Rendzinas and Petrocalcic Xerosols. It includes the unit Nlp-F. Subclass Nig is found in Gypsic Xerosols with a deficient granulometry and substantial accumulations of gypsum which sometimes form a crust, so limiting useful depth. Includes unit Nlg-F.
Class N2 lands have such limitations that they prevent any sustained satisfactory use. Subclass N2i is found in various soils and on slopes which prevent any agricultural use of the land. At the present time there is a well preserved natural plant cover and so the soils arc included in unit N2i-G. Subclass N2e: this usually appears in eroded zones in which the top soil horizon is of little depth. The predominat soils are Lithosols, Rendzinas and Petrocalcic Xerosols. Based on present plant cover, units N2e-F and N2e-G can be distinguished.
Literature cited Aguilar Rujz, J. y Ortiz Silla, R. 1992. Metodologia de capacidad de uso agricola de suelos.
Ill Congreso Nacional de la Ciencia del Suelo. Conferencias y comunicaciones, 281 — 286. Soc. Esp. Ciencia del Suelo. Pamplona.
Alias, L.J., Ortiz, R. y Lopez, J. 1987. Mapa de Suelos, Escala 1:100.000. Coy (932) Proyccto LUCDEME. ICONA-Universidad de Murcia.
FAO. 1976. Esquema para la evaluación de tierras. Bol. 32. Roma. Papadakis, J. 1980. El clima. Ed. Albatros, Buenos Aires. Argentina. Riquier, J., Bramao, L. y Cornet, J.P. 1970. A new system of soil appraisal in terms of actual
and potencial productivity. FAO AGL, TESR/7016. UNESCO. 1974. FAO-UNESCO Soil Map of the World. Vol. 1. Legend. UNESCO. Paris.
403

Characteristics and Classification of Seasonally Wet Soils with Epi- and Endo-Saturation
W. H. Hudnall , A. A. Szogi, W. C. Lynn and J. J. Daigle. LSU Agricultural Center, Louisiana Agricultural Experiment Station, Agronomy Dept., Baton Rouge, LA., USD A - ARS, Florence, SC, USD A - SCS, Lincoln, NE., and USD A - SCS, Alexandria, LA., U.S.A.
Introduction. In Soil Taxonomy, the characteristics that define soils with stagnant or perched water tables appear at different taxonomie levels. They are not explicitly defined according to the definition of the aquic moisture regime. The taxonomie placement of these kinds of soils are related to the specification of the minimum duration of saturation and reduction, definition of the soil moisture control section, verification of low chroma colors and in situ reduction. The recognition of the different problems that plagued the classification of wet and seasonally wet soils brought about the thoroughly revised definition and criteria for the aquic moisture regime. This revision proposed to use the terms "aquic conditions" rather than "aquic moisture regime". Aquic conditions are defined by three elements: 1. presence of redoximorphic features, 2. duration and depth of saturation and 3. reduction unless the soil is artificially drained. The objective of this paper is to present data that was used to test these aquic conditions criteria.
Materials and Methods. Data from two Mississippi alluvial soils (Commerce; fine-silty, mixed, nonacid, thermic, Aerie Fluvaquents and Sharkey; very-fine, montmorillonitic, nonacid, thermic, Vertic Haplaquepts) and two coastal plain soils (Verdun; fine-silty, mixed, thermic, Glossic Natraqualfs and Brimstone; fine-silty, mixed, thermic, Typic Natraqualfs) were chosen from ten soils studied to represent seasonally wet soils. The instrumentation and data recorded for each site is described by Hudnall and Wilding (1). Briefly, each soil was described and sampled for complete chemical, physical and mineralogical characterization. Tensiometers, piezometers and an open well were used to discern the soil saturation. Pt electrodes and dyes were used to describe the redox potential and the soil temperature was measured to determine the soil temperature regime.
Results and Discussion. The data of the Commerce soil support aquic conditions. Saturation, reduction and redoximorphic features occur above 50 cm and to a depth of at least 2 m. The soil did not have an unsaturated zone between 1 and 2 m when the upper 50 cm was saturated. The data support endoaquic saturation, but the soil water is oxygenated if the soil water table is being controlled by the Mississippi River and could be considered as Oxyaquic. The Sharkey soil had aquic conditions with saturation and reduction within 50 cm to below 2 m. The soil was saturated to within 25 cm of the soil's surface during the majority of the monitoring period. The soil has endoaquic saturation. The data for the Verdun soil support aquic conditions. Saturation, reduction and redoximorphic features occurred within 50 cm to below 2 m. The soil had an unsaturated zone between 1 and 2 m when the upper 50 cm was saturated during the summer months. The soil was also saturated to the surface from the ground water table during the winter. This soil has both epiaquic and endoaquic saturation. The ground water is slightly oxygenated when the soil is epiaquic saturated.
404

The Brimstone soil was saturated, reduced and exhibited redoximorphic features. Although it was difficult to determine if the gray color is relic or a result of redoximorphism. The soil saturates from the top down and is dry between 1 and 2 m when the upper 50 cm is saturated. The soil has epiaquic saturation. The classification of these soils based on the 1992 Keys to Soil Taxonomy (2) is: Commerce Fine-silty, mixed, hyperthermic, Aerie Endoaquepts Sharkey Very-fine, montmorillonitic, hyperthermic, Chromic Endoaquerts Verdun Fine-silty, siliceous, hyperthermic, Glossic Natraqualfs Brimstone Fine-silty, siliceous, hyperthermic, Typic Epiaqualfs
Literature Cited. (1) Hudnall, W. H. and L. P. Wilding. 1992. Monitoring Soil Wetness Conditions in Louisiana and Texas. In Proceedings of the Eighth International Soil Correlation Meeting (VIIIISCOM): Characterization, Classification, and Utilization of Wet Soils. USDA, Soil Conservation Service, National Soil Survey Center, Lincoln, NE.
(2) Soil Survey Staff. 1992. Keys to Soil Taxonomy. 5th edition. SMSS Technical Monograph No. 19. Blacksburg, Virginia: Pocahontas Press, Inc. 556 pages.
405

Making Selected Interpretations for Soils with Andic Properties
H. R. Sinclair, Jr. and S. H. Brownfleld. USDA-SCS, Lincoln, NE and Consultant, Boise, ID.
There is a large amount of literature pertaining to the properties of soils formed in volcanic soil materials. In comparison little has been written on the use and management of these soils. The information presented on use and management is based on a literature review; discussion with soil scientists, foresters, agronomists, and engineers; and personal observations. In making interpretations for use and management of Andisols and soils with andic soil properties, the unique properties that separate them from soils of other taxonomie classes must be considered. Some of these properties are anion retention, variable pH dependent charge, high liquid and plastic limits with low plastic index, low rupture resistance of coarse fragments, low bulk density, high stable organic matter and stable structure, compacting characteristics, high porosity, high available water, low erosion potential and high delivery of eroded soil particles, and stratification of layers with contrasting textures.
406
BEHAVIOR OF SOIL DISTRIBUTION IN A WATERSHED IN THE STATE OF MICHOACAN, MEXICO
A. CABRERA, J.M. AYALA, J.M. ORTEGA, A.J. FARFAN. Laboratório de Edafologfa, Escuela de Biologfa, Universidad Michoacana, Morelia, Mich., México.
INTRODUCTION. The present study looks at a watershed the state of Michoacan and its relationship to environmental factors. The purpose of doing a soil inventory, using the criteria of watershed, is that such an inventory will allow us to establish behavior patterns in soils of the region, and that it will serve as a prototype for relating and characterizing a large percentage of the zones in the state of Michoacan which lie within a similar behavioral area in the physiographic Province of the Eje Neovolcanico Transversal.
DESCRIPTION OF THE AREA OF STUDY. The area studied is located in the Hydrological Region No. 12, Lerma-Santiago River Basin, sub-basin of Cuitzeo Lake, with a surface of 1550 km2. The area constitutes 90% of the Municipio of Morelia in the state of Michoacan, between the parallels 19° 51' and 19° 23' and the meridians 101° 32' and 101° 00'. Physiographically it is located in the Province of the Eje Neovolcanico Transversal and part of the Province of Sierras y Bajios Michoacanos. The climate is temperate and sub-humid with summer rains. Altitudes vary from 1800 to 3400 meters above sea level. Predominate rocks are of extrusive igneous origin and the principal currents are from the Rio Grande of Morelia and the Rio Chiquito.
METHODOLOGY. The first phase of the work was cartographic study and photo-interpretation. Topographic, geological and edaphological maps published by DETENAL at a scale of 1:50,000 were analyzed. Aerial photographs (taken from a SINFA flight in 1990) at a scale of 1:25,000 were interpreted to determine the present soil use as well as the geomorphological characteristics and the network of flows that allowed us to establish the relationship rock-soil. From the topographic map, we derived hypsometric maps (of altitude intervals), slope maps, parametric maps (cartographic units) and drainage maps. The parametric plan served as the basis for selection of sites in the sample. The characteristics of these sites were determined according to Madrigal's criteria (1). Each site was described and a sample soil profile was taken (2). Physical and chemical properties were analyzed and the soils were classified according to the FAO-UNESCO (3) system.
The relationship between the environmental characteristics of the watersheds and the characteristics of their soils is established; all the information gathered is later integrated.
RESULTS AND DISCUSSION. For the south of the sub-basin of Cuitzeo, in the portion corresponding to the Eje Neovolcanico Ttransversal, nine soil groups were identified: luvisol, alisol, andosol, vertisol, leptosol, phaeozem, cambisol, regosol, and arenosol.
In the mountainous zone the lithology is conformed of only one material that may be
407

basic or intermediate, for that reason there is little variety in soils and these are characterized by normally having an acidic composition (andosol, luvisol and alisol). The andosols occur in the highest parts of the watershed in volcanic cones always at altitudes over 2,000 meters and up to 3,400 meters above sea level with slopes that vary from moderate to extreme. The natural vegetation is pine-oak forest although great extensions of land have been opened up to seasonal farming. Descending in altitude, alisols and luvisols are found from 2,100 to 2,500 meters above sea level, with varying slopes since they are located on hillsides, as well as on cliffs and in valleys. Vegetation is pine-oak forest, subtropical shrubbery and seasonal farming.
As the slopes decrease another characteristic type of soil is formed: phaeozem. These are found normally at what constitutes the agricultural border in sites that allow for the accumulation of organic material and a larger concentration of cations. Its use is seasonal farming.
Finally in the lowest parts of the area studied, where there are no slopes and where the run-offs converge and movement of water is barely perceptible (which propitiates the dissolution and retention of minerals present), there are adequate conditions for the formation of dynamic clays with a high cationic exchange capacity which is typical of the vertisols. The vegetation is subtropical shrubbery, grasslands and agriculture generally of irrigation.
The leptosols are found in areas with steep slopes with subtropical shrubbery and lava beds, a typical structure of the Eje Neovolcanico Transversal, whose hydrology is represented by ephemeral currents. The soils are scarcely developed given that the infiltration impedes the maintenance of water in contact with minerals. Vegetation is tropical deciduous forest.
The regosols occur in places were the material of origin is not consolidated. The arenosols are associated with acidic rocks which due to the difficulty of
intemperateness result in soils rich in quartz and, as logically follows, are of large particles. The cambisols are not found with frequency. They are found in transitional sites
between leptosol and alisol or luvisol in process of development of Horizon B. The above demonstrates that from the zonal point of view, the region's soil is alisol and
luvisol, with natural vegetation of pine-oak forest. From the non-zonally view point, the material of volcanic origin in the highlands leads to andosols; the steep slopes in some cases and in other the rock surfaces of the lava beds have not permitted a development beyond the leptosols, the material of origin that is not consolidated produces regosols and arenosols and, intra-zonally, in the lowlands vertisols appear.
Literature Cited (1) Madrigal S., X. 1981. Instructivo para el estudio fitoecológico del Eje Neovolcanico. Boletin Divulgativo Institute Nacional de Investigaciones Forestales. No. 45. México. 29 pp. (2) Cuanalo C , H. 1981. Manual para la description de perfiles de suelo en el campo. ENA. México. (3) FAO-UNESCO. 1989. Sistema de clasificación. Mapa mundial de sueios. Segunda Leyenda. Roma. Italia.
408

Soil Climate Regimes of the Southern States, Puerto Rico and the United Sates Virgin Islands
D. L. Newton, H. R. Mountm, and R. L. Haberman. USD A, SCS, Nashville, Tennessee and Lincoln, Nebraska, United Sates of America.
Introduction. The soil climate of the southern states, Puerto Rico and the United States Virgin Islands (USVI) is extremely varied. Seven soil temperature regimes and six moisture regimes occur, resulting in 19 distinct soil climate zones in the southern states. Puerto Rico and the USVI have three soil temperature regimes and four soil moisture regimes, resulting in six soil climate zones. A soil climate regime map has been prepared exhibiting these distinct zones.
Materials and Methods. The soil climate regime map was prepared using climatic data, primarily soil temperature data. Soil climate boundaries were designated using the soil climate definitions in Soil Taxonomy (Soil Survey Staff 1975).
Results and Discussion. The soil climate map is important for use in understanding the development and formation of soils, to consistently classify and map soils, and to apply this knowledge to the use and management of soil-plant-atmosphere systems.
Literature Cited. (1) Agricultural Experiment Station Staff 1973, Soils of the Southern States and Puerto Rico, Agricultural Experiment Stations and USDA-SCS.
(2) Soil Survey Staff 1975, Soil Taxonomy, USDA, SCS, Agricultural Handbook 436, Washington, DC.
409

Type Interferences in Soil G. Reuter. Department of Soil Science, Universiteit Rostock, D-18051 Rostock,
Germany. INTRODUCTION With the establishment of modern soil science the concept of typification according to genetically-relevant characteristics (e.g. eluvial and illuvial horizons) was introduced and found general acceptance. Genetic soil types (1) form the basis of systems of soil classification. However, it was also remarked that in large areas of the world many soils do not conform to only one of the defined types but combine attributes of at least two of the types. This fact renders the classification and mapping of soils difficult. Consequently, in several recent systems the classical concept has been abandoned and genetic typology more or less neglected. In opposing this trend the author offers the concept of "type interferences" as means of clarifying complicated soil characteristics. This problem relates not only to whole soils but also to some soil properties (e.g. interference between fabric types). 1. Static soil type interferences The co-occurence of characteristics inherent in different soil types within one profile (= soil type interference) can be caused simultaneously by substrate-specific conditions at a site. Example A: Gley-Brown Earth: Ah - Bv - Go - Gr
Soil horizon designations according to (2). The characteristics of both the hydromorphic type "Gley" and the non-hydromorphic type "Brown Earth" develop simultaneously. Their specific peculiarities continue without change (= static).
2. Dynamic soil type interferences Dynamic interferences are caused by the types changing. This can happen under constant climatic and/or hydrological conditions (= harmonic) as well as through changes in them (= disharmonie). The terms are used according to PASSARGE (3).
2.1. Harmonic soil type interferences The change in soil types is caused by alterations in the soil and vegetation, without any change in climatic and hydrological environmental factors. Example B: Ranker » Brown Earth-Ranker > Brown Earth
Ah - C AhBv - C Ah - Bv - C 2.2 Disharmonie soil type interferences The horizons are partly of relic character. This should be noted through the prefix r. Example C: relic Gley-Brown Earth: Ah - Bv - rGo - rGr - Go - Gr In this case the changing of types is caused by the sinking of the ground-water level. The distinction between this dynamic type interference and the static type interference (Example A) is of
410

importance for specific measures of amelioration. In Central Europe as in some states of the USA soils with co-occuring characteristics of the types "Lessivé" (Luvisol) and "Brown Earth" (Cambisol) are to be found. In Germany they are called "Parabraunerde" (4). Investigations carried out by the author show that the process of lessivation (= downward migration of clay particles) depends on warmer climatic conditions. In the temperate regions mentioned above the process matches an earlier period of the Holocene (Atlanticum). Therefore, the distinctive marks of the soil type "Lessivé" now are most probably of relic character (5).
Example D: Brown Earth-relic Lessivé: Ah - Bv - rAl - rBt - C. Example E: Podzolic Brown Earth- pseudogleyed relic Lessivé: (Attributes of 4 soil types !) Aeh - Bv - rAl - rBtSg - C. Disharmonie dynamic type interferences are doubtless to be found in Europe where recent soil development characteristics have been superimposed on a relic soil from the Tertiary period. Example F: From investigations on quarz sand deposits of the Upper Senon the co-occurence and interaction of illuvial horizons from a recent extreme podzolization and the iron oxide and silica containing precipitates from a relic lateritic soil (Acrisol) are shown with the poster.
3. Soil fabric interferences The typological principle was also introduced to characterize soil fabric properties. The established fabric types (Germ. Gefügeformen) do not appear so often in the "typical" as in "transitional" forms. We call these "soil fabric interferences". A scheme to distinguish between the nuances has been published (6). Example G: Coherent. weakly coagulated fabric: Cohlcoa.
Example H: Coagulated, strongly crumby fabric: Coa3cru.
CONCLUSIONS. Soil type and fabric interferences are often
complicated. Investigations of the causal relationships and
related characteristics are of scientific interest and in certain
cases of great practical importance,
LITERATURE (1) Ramann,E. 1911. Bodenkunde, 3.Aufl. Berlin (2) Bodenkundliche Kartieranleitung, 3.Aufl. 1982. Hannover (3) Passarge,S. 1912. Physiologische Morphologie. Hamburg (4) MUckenhausen,E. 1977. Entstehung, Eigenschaften und Systema-
tik der Boden der Bundesrepublik Deutschland. Frankfurt (5) Reuter,G. 1991. Disharmonische Bodenentwicklung auf glaziaren
Sedimenten unter dem EinfluQ der postglazialen Klima- und Vegetationsentwicklung in Mitteleuropa. Hohenheimer Arb., Tag.Bd.Ernst-Schlichting-Gedachtnis-Kolloquium: 771-785.
(6) Reuter,G. & E.Schreiber. 1969. Makromorphologische Gefüge-interferenzen im Boden. Thaer Archiv 13: 771-785
411

Esta publicación consta de 3 000 ejemplares y se terminó de imprimir en el mes de abril de 1994 en los talleres gréfïcos del Instituto Nacional de Estadistica, Geografia e Informatica Av. Héroe de Nacozari Nüm. 2301 Sur, Acceso 11, P.B. Fracc. Jardines del Parque, CP 20270 Aguascalientes, Ags. México


INSTITUTO NRCIONRL DC 6STRDISTICR. GÊOGRRFIR € INFORMRTICR MEXICO