Vodafone Group Plc Annual Report - Post und ...
176
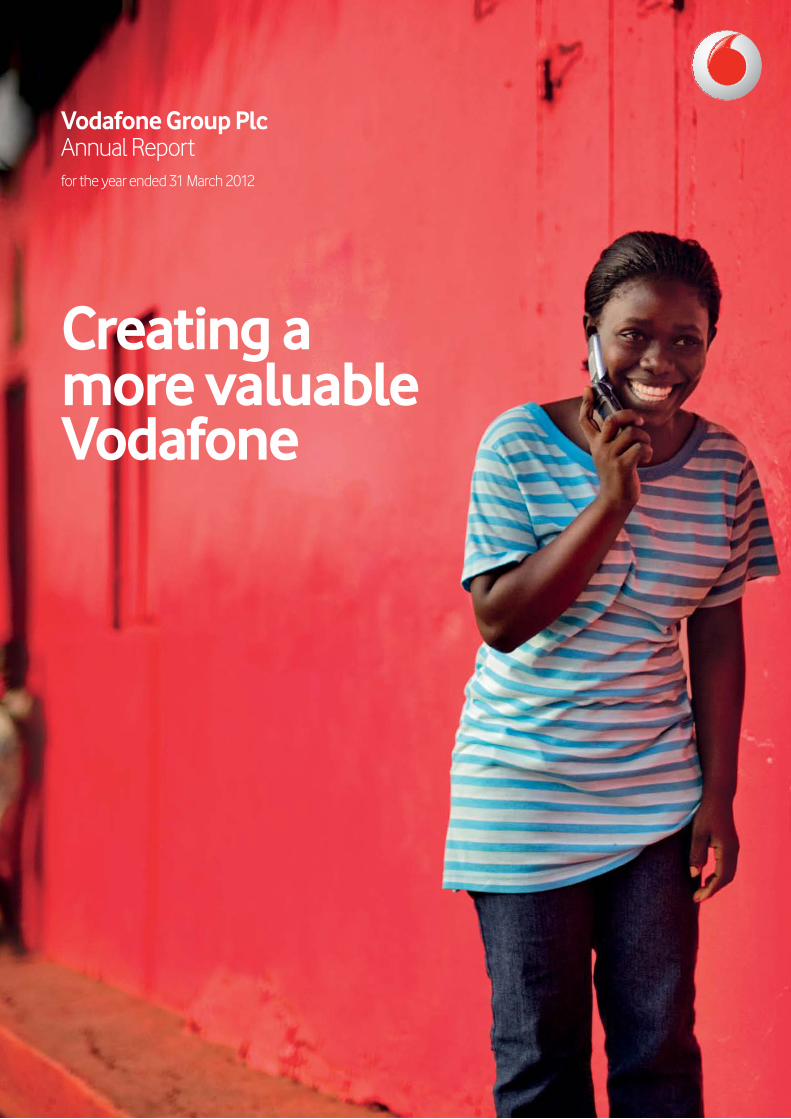
Creating a more valuable Vodafone Vodafone Group Plc Annual Report for the year ended 31 March 2012
-
Upload
khangminh22 -
Category
Documents
-
view
0 -
download
0
Transcript of Vodafone Group Plc Annual Report - Post und ...
Creating a more valuableVodafone
Vodafone Group Plc
Registered Office: Vodafone House The Connection Newbury Berkshire RG14 2FN England
Registered in England No. 1833679
Telephone: +44 (0) 1635 33251Fax: +44 (0) 1635 238080
www.vodafone.com Contact details:
Registrars shareholder helpline Telephone: +44 (0) 870 702 0198 (In Ireland): +353 (0) 818 300 999
Investor Relations Email: [email protected] Website: www.vodafone.com/investor
Media Relations Telephone: +44 (0) 1635 664444 Email: [email protected] Website: www.vodafone.com/media
Sustainability Email: [email protected] Website: www.vodafone.com/sustainability
Vodafone Group PlcAnnual Reportfor the year ended 31 March 2012
Vodafone Group Plc Annual Report for the year ended 31 M
arch 2012
Access our online Annual Report at:vodafone.com/ar2012

We are creating a more valuableVodafoneOur strategy is focused on four areas of growth potential and founded on strong capital and cost discipline. This is delivering results: we have outperformed our key competitors in most major markets, and returned over £10 billion to shareholders in the last 12 months.
£46.4bnGroup revenue increased 1.2% to £46.4 billion with a strong demand for data services and further voice penetration in emerging markets.
£11.5bnAdjusted operating profit was £11.5 billion, slightly down on last year (up 2.5%* on an organic basis) supported by a good performance from our US associate, Verizon Wireless.
£6.1bnFree cash flow of £6.1 billion, decreased due to the sale of our interests in China and France and a lower working capital benefit.
9.52pTotal ordinary dividends per share of 9.52 pence, up 7.0% in line with our dividend per share growth target. We also paid a special dividend of 4.0 pence per share and our £6.8 billion share buyback programme is almost complete.
£6.4bnCapital expenditure increased by 2.3%, as we continued to maintain our high level of investment to support our network strategy.
14.91pAdjusted earnings per share of 14.91 pence, down 11.0% on last year, resulting from the loss of income following the sale of several businesses and higher financing costs.
Business reviewPerform
anceG
overnanceFinancials
Additional inform
ation
173Vodafone Group Plc Annual Report 2012
Vodafone, the Vodafone logo, Vodacom, M-Pesa, the M-Pesa logo, OfficeNet, Vodafone One Net, Vodafone Discover, Vodafone Cloud, Vodafone Protect, Vodafone Guardian, Vodafone Farmers’ Club, Vodafone mHealth Solutions, Justtextgiving by Vodafone, The Vodafone Way and Bluefish are trade marks of the Vodafone Group. Moyo, Ricarica Insieme and Mobile for Good are trade marks of the Vodafone Foundation. Other product and company names mentioned herein may be the trade marks of their respective owners.
The content of our website (www.vodafone.com) should not be considered to form part of this annual report or our annual report on Form 20-F.
© Vodafone Group 2012
Text printed on amadeus 75 silk which is made from 75% de-inked post-consumer waste and 25% virgin fibre. The cover is on amadeus 100 silk, made entirely from de-inked post-consumer waste. Both products are Forest Stewardship Council (‘FSC’) certified and produced using elemental chlorine free (‘ECF’) bleaching. The manufacturing mill also holds ISO 14001 accreditation for environmental management.
Designed and produced by Radley Yeldar ry.com

Performance
Governance
FinancialsAdditional inform
ationBusiness review
01Vodafone Group Plc Annual Report 2012
Business review#
02 Overview
02 Who we are 04 What we do and how we do it 06 Where we do it 08 Where we are heading 10 How we’re doing
12 Chairman’s statement
14 Chief Executive’s review
18 Industry trends
20 How we do business
22 Strategy
22 Mobile data 26 Emerging markets 28 Enterprise and total
communications 30 New services32 Core strengths
34 Our people
36 Sustainable business
38 Mobile for Good
39 Risk overview
Performance#
40 Operating results
50 Guidance
51 Principal risk factors and uncertainties
54 Financial position and resources
Governance#
60 Board of directors and Group management
63 Corporate governance
74 Directors’ remuneration
Financials88 Contents
89 Directors’ statement of responsibility#
90 Audit report on internal controls
91 Critical accounting estimates
93 Audit report on the consolidated financial statements
94 Consolidated financial statements
142 Audit report on the Company financial statements
143 Company financial statements
Additional information149 Shareholder information#
157 History and development#
158 Regulation#
162 Non-GAAP information#
165 Form 20-F cross reference guide
168 Forward-looking statements
170 Definition of terms
172 Selected financial data
# These sections make up the directors’ report.
In this year’s report
The terms “Vodafone”, the “Group”, “we”, “our” and “us” refer to the Company and, as applicable, its subsidiaries and/or interests in joint ventures and associates.
Unless otherwise stated references: to “year” or “2012” mean the financial year ended 31 March 2012; to “2011” or “previous year” mean the financial year ended 31 March 2011; to the “third quarter”, “previous quarter” or “Q3” are to the quarter ended 31 December 2011; and to the “fourth quarter” or “Q4” are to the quarter ended 31 March 2012.
All amounts marked with an “*” represent organic growth as defined on page 171.
Definitions of terms used throughout the report can be found on page 170.
Further information on non-GAAP measures used in the report can be found on page 162.
This report is dated 22 May 2012.
As you’d expect from such a customer-focused business, we’ve created an online reporting suite which works for your specific needs:
vodafone.com/ar2012 e

02Vodafone Group Plc Annual Report 2012
Who we areWe are a global communications business giving people the power to connect with each other – and to learn, work, play, be entertained and broaden their horizons – wherever and however they choose.
The numbers speak for themselves. At the last count, over 404 million customers use our services in more than 30 countries around the globe. They choose Vodafone because we stand for great coverage, a reliable connection and good value – as well as a passion for improving the customer experience.
View our year in conversation online: vodafone.com/ar2012

Performance
Governance
FinancialsAdditional inform
ation03Vodafone Group Plc
Annual Report 2012Business review

04Vodafone Group Plc Annual Report 2012
What we do and how we do itWe want to be admired for empowering people – making their lives simpler, easier and a good deal richer and more rewarding. These are the four pillars of the Vodafone Way which forms the foundation of our culture:
Customer obsessedWe are passionate about exceeding customer expectations, understanding their needs and earning their increasing loyalty.
Innovation hungryWe promote a climate that fosters innovation and calculated risk taking to develop new services and ways of working.
Ambitious and competitiveWe bring energy and passion to our work, setting ourselves high standards. We measure our success compared to our competitors not just to our plans.
One company, local rootsWe operate as one company across diverse teams and markets to achieve the best outcome for our customers. We have an international brand and values, but are part of the local community.
View our year in conversation online: vodafone.com/ar2012

Performance
Governance
FinancialsAdditional inform
ation05Vodafone Group Plc
Annual Report 2012Business review
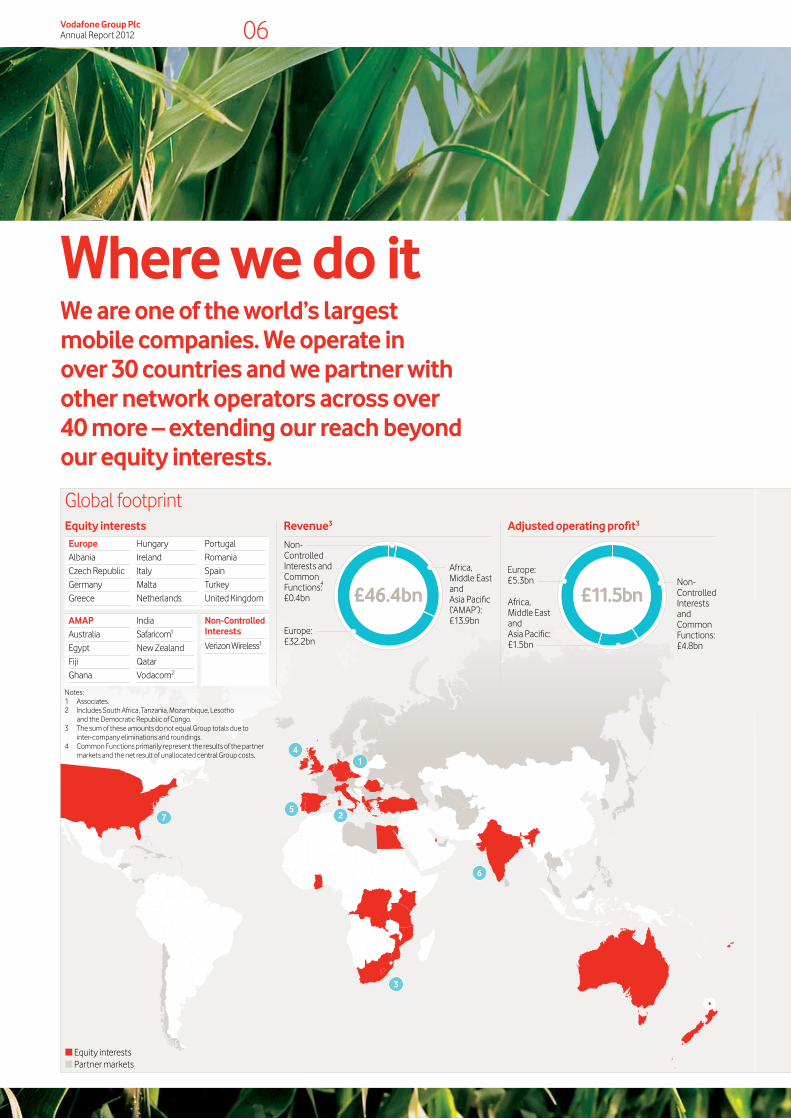
06Vodafone Group Plc Annual Report 2012
n Equity interestsn Partner markets
6
41
2
3
75
Notes:1 Associates.2 Includes South Africa, Tanzania, Mozambique, Lesotho
and the Democratic Republic of Congo.3 The sum of these amounts do not equal Group totals due to
inter-company eliminations and roundings.4 Common Functions primarily represent the results of the partner
markets and the net result of unallocated central Group costs.
Revenue3
Non-Controlled Interests and Common Functions:
4
£0.4bn £46.4bn
Africa, Middle East and Asia Pacific (‘AMAP’): £13.9bn
Europe: £32.2bn
Adjusted operating profit3
Europe: £5.3bn
£11.5bnNon-Controlled Interests and Common Functions: £4.8bn
Africa, Middle East and Asia Pacific: £1.5bn
EuropeAlbania Czech Republic Germany Greece
Hungary Ireland ItalyMalta Netherlands
PortugalRomaniaSpainTurkeyUnited Kingdom
AMAPAustralia Egypt FijiGhana
India Safaricom1 New Zealand QatarVodacom2
Non-Controlled Interests
Verizon Wireless1
Global footprintEquity interests
Where we do itWe are one of the world’s largest mobile companies. We operate in over 30 countries and we partner with other network operators across over 40 more – extending our reach beyond our equity interests.

Performance
Governance
FinancialsAdditional inform
ation07Vodafone Group Plc
Annual Report 2012
3 Vodacom
57m mobile customers
Growing strongly in AfricaWe own 65% of Vodacom which covers five countries in Southern Africa – including South Africa which is the largest business, accounting for about 85% of revenue, Tanzania, Lesotho, Mozambique and the Democratic Republic of Congo. In South Africa we are the market leader and continue to deliver strong revenue growth due to the rapid take up of mobile data services.
4 UK
19m mobile customers
Our first marketWe made the first UK mobile phone call in 1985 and we were the first UK mobile network operator to launch commercial 3G services in 2001. Our business has expanded rapidly and today we account for 26% of the UK market (measured by revenue) and have a market leading 37% share of the mobile enterprise market.
6 India
150m mobile customers
Our largest market by customersWe acquired a controlling stake in India in 2007. Since then we have grown the customer base from 28 million to over 150 million and increased our revenue market share from 16% to 21%. Through our investments in 3G technology and low cost handsets we are bringing mobile internet services to this fast growing market.
7 Verizon Wireless
93m1mobile customers
A leading US operator We own 45% of Verizon Wireless, the largest mobile operator in the United States measured by revenue. During last year Verizon Wireless achieved 7.3%* service revenue growth driven by good customer growth and the strong take-up of mobile data services. Its leading 4G network now covers two-thirds of the US population.
1 Germany
36m mobile customers
Our largest market by revenueWe are the leading mobile operator in Germany, with a revenue market share of 35%. In 2010 we became the first operator in Germany to launch super fast 4G mobile data services with peak data download speeds of up to 50 Mbps. Germany is our largest market for fixed broadband customers with 3.4 million users.
5 Spain
18m mobile customers
Challenging market conditions The economic recession is extremely harsh in Spain, with unemployment at 24% leading to significant declines in organic revenue as customers cut back on spending. We remain confident of Spain’s longer term prospects and therefore we recently invested around £500 million in new spectrum which will be used to rollout 4G services.
2 Italy
30m1mobile customers
We are the largest mobile operator in ItalyWe acquired operations in Italy in 2000. In 2011 we became the largest mobile operator and now have a 37% revenue market share. While the economic recession led to a fall in revenue during the year, our flexible cost structure, due to low handset subsidies, has ensured that overall profitability remains high.
Note:1 Represents 100%. The Group’s share based on
its equity interests are 23 million in Italy and 42 million in Verizon Wireless.
Business review
08Vodafone Group Plc Annual Report 2012
Sustained cash flowShareholder returns Reinvestment
Growth driversData services Emerging markets Enterprise and total communications New services
Core strengthsCapital discipline Cost efficiency
Read more Pages 32 and 33
Controlled and jointly controlled operations
Shareholder returns Reinvestment
Liquidity and cash flowRead more Pages 55 and 56
Non-controlled operations
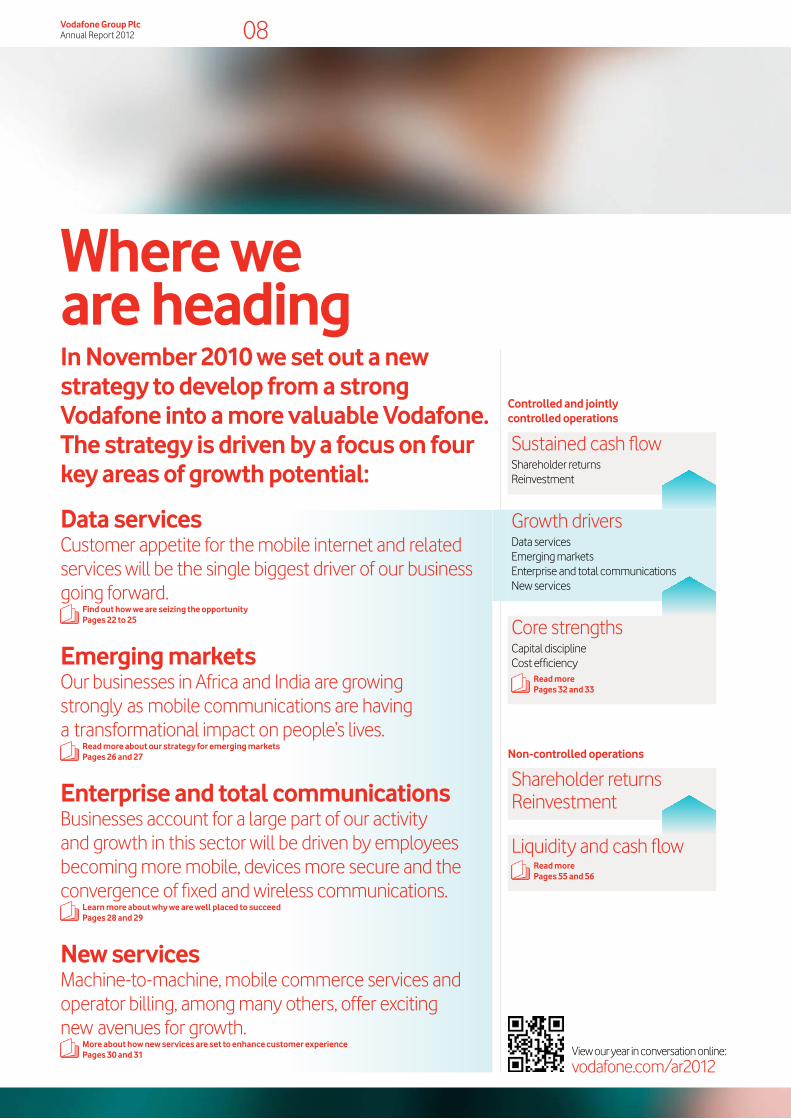
Where we are headingIn November 2010 we set out a new strategy to develop from a strong Vodafone into a more valuable Vodafone. The strategy is driven by a focus on four key areas of growth potential:
Data servicesCustomer appetite for the mobile internet and related services will be the single biggest driver of our business going forward.
Find out how we are seizing the opportunity Pages 22 to 25
Emerging marketsOur businesses in Africa and India are growing strongly as mobile communications are having a transformational impact on people’s lives.
Read more about our strategy for emerging markets Pages 26 and 27
Enterprise and total communicationsBusinesses account for a large part of our activity and growth in this sector will be driven by employees becoming more mobile, devices more secure and the convergence of fixed and wireless communications.
Learn more about why we are well placed to succeed Pages 28 and 29
New servicesMachine-to-machine, mobile commerce services and operator billing, among many others, offer exciting new avenues for growth.
More about how new services are set to enhance customer experience Pages 30 and 31 View our year in conversation online:
vodafone.com/ar2012

Performance
Governance
FinancialsAdditional inform
ation09Vodafone Group Plc
Annual Report 2012
View our year in conversation online: vodafone.com/ar2012
Business review

10Vodafone Group Plc Annual Report 2012
Organic service revenue growthGrowth in the top line demonstrates our ability to grow our customer base and stabilise or increase ARPU. It also helps to maintain margins.
Target: 1 –4% per year to March 2014.
% of European network with 3G (14.4 Mbps or better)Faster, more reliable networks with wider coverage stimulate data usage and create a clear point of difference over other operators.
Target: 99% by March 2015.
EBITDA marginTrends in our EBITDA margins demonstrate whether our revenue growth is generating a good return on our investment in customer acquisition, and whether we can offset underlying cost pressures in our business with cost efficiencies elsewhere.
Target: EBITDA margin to stabilise by March 2014.
Adjusted operating profit (‘AOP’)Because of the significant contribution made to our overall profitability by our US associate, Verizon Wireless, AOP is a better determinant of overall profitability than EBITDA.
Target: £11.0 – £11.8 billion in 2012 financial year.
82%of European 3G network at least 14.4 Mbps, up from 66% in 2011
How we’re doingWe track our performance against 12 key financial, operational and commercial metrics which we judged to be the best indicators of how we’re doing.
–1.6% 2010
2011
2012
2.1%
1.5%33.1%2010
2011
2012
32.0%
31.2%
£11.5bn2010
2011
2012
£11.8bn
£11.5bn
Returns to shareholdersConsistent and balanced returns to shareholders demonstrate our commitment to capital discipline.
Target: Dividend per share growth of at least 7% per year to March 2013 (excluding special dividends).
+6.9%2010
2011
2012
+7.1%
+7.0%
on-track
Relative market share performanceWe track our relative performance by measuring the change in our mobile market share against our competitors.
Target: Gain or hold mobile service revenue market share in most of our main markets against our principal competitor.
5/7We gained mobile service revenue market share in 5 out of 7 of our main markets.on-track
achievedachieved
achievedachieved

Performance
Governance
FinancialsAdditional inform
ation11Vodafone Group Plc
Annual Report 2012
Smartphone penetrationSmartphones are the key to giving our customers access to the mobile internet; the more our customers have them, the bigger our data opportunity becomes.
Target: To significantly increase each year.
Free cash flowOur regular dividend is paid out of free cash flow, so maintaining a high level of cash generation (even after significant continued investment in capex) is key to delivering our dividend growth target.
Target: £5.5 – £6.5 billion per year to March 2014.
% of consumer contract revenue from integrated tariffsOur strategic push towards integrated tariffs allows us both to defend our revenue base from voice/SMS substitution, and to monetise future data demand growth.
Target: To significantly increase each year.
Employee engagementThe employee engagement score measures employees level of engagement, a combination of pride, loyalty and motivation.
Target: Maintain top quartile.
Share ownership by senior leadership team (‘SLT’)We have recently introduced share ownership targets throughout the SLT, to more closely align operational management’s goals with those of external shareholders.
Target: 14 million shares.
% of women in the senior leadership teamThis is one measure of the diversity in our business which brings us a more balanced range of skills and management styles.
Target: To improve each year.
77up from 75 in 2011
19%of the SLT are women up from 17% in 2011
European smartphone penetration at March 2012, up from 19% in 2011
of European contract revenue from integrated tariffs at March 2012, up from 27% in 2011
43%
£7.2bn2010
2011
2012
£7.0bn
£6.1bn
18mShares owned by SLT; equivalent to 128% of goal.
achieved
achieved achieved achieved
achievedachieved
27%
Business review

12Vodafone Group Plc Annual Report 2012
Chairman’s statement
What have been your main impressions of Vodafone after your first year?The Group is well positioned. It has strong franchises in most of its markets, attractive global exposure, a core product that has become a vital part of people’s lives and a number of exciting opportunities for growth. Combined with its substantial cash flow, low leverage and management strength in depth, there are plenty of reasons for optimism.
However, throughout Vodafone I see what I would describe as a restless dissatisfaction: a sense that we are doing well and have significantly improved our commercial performance over recent years, but that we could do much better still.
People at Vodafone are their own toughest critics but this creates a highly energetic and strongly collaborative environment aiming at constant improvement.
How is the strategic focus of the company evolving?The last two years have seen significant proceeds realised from the sale of non-controlled stakes and the income dividend from Verizon Wireless, which means that the external focus will now inevitably turn more to our operational execution. From our perspective, this is no more than business as usual and the Group’s strategy continues to be clear: to pursue our growth opportunities in data, enterprise and emerging markets in a disciplined and efficient way, and give shareholders a healthy return on their investment in the process. All of these elements are discussed in much more detail elsewhere in this report.
A world of opportunityGerard Kleisterlee succeeded Sir John Bond as Chairman of Vodafone at the AGM in 2011. Previously he was CEO of Philips for ten years. Here he gives his view on his first impressions of Vodafone, the key governance issues facing the Board, his interactions with management, and the approach to management and shareholder remuneration.
Summary of key pointsaa Our strategy is working well to deliver superior operational performance, a high level of free cash flow and significant returns to shareholders
aa We have strength in depth in the management team and a Board comprised of business leaders with a wide range of business expertise
aa Strong returns to shareholders with total dividends for the year of 13.52 pence (including the 4.0 pence special dividend) and the majority of the £6.8 billion share buyback programme now complete

Business reviewPerform
anceG
overnanceFinancials
Additional information
13Vodafone Group Plc Annual Report 2012
Explore in more detail
More on GovernancePages 63 to 73
More on Risk managementPage 39
More on Director’s remunerationPage 74 to 87
More on Mobile for GoodPage 38
How is the Board currently functioning?The Board’s primary focus is to support and advise the executive management on the delivery of the Group’s strategy within a clear and transparent governance framework, and I believe we are currently fulfilling that role. Our annual survey on Board effectiveness has prompted some minor modifications but no major overhaul.
With respect to expertise, my predecessor made excellent progress in assembling a broad diversity of talents and outlooks. The Board currently comprises business leaders from sectors as wide-ranging as financial services, retail, venture capital, accountancy, technology and regulated industries, as well as far-reaching geographical knowledge. I would be keen to build our experience of internet-based business models, as well as a detailed knowledge of Asian markets. We also aim to bring further gender balance over the coming years as we reach our goal of 25% of Board members being women by 2015.
How do you approach shareholder remuneration?Our shareholder remuneration strategy is focused on total shareholder return, through a combination of growing the value of the Company by investing in opportunities that earn a return in excess of our cost of capital, and a consistent dividend policy. Our dividend per share growth target, put in place two years ago, sets out to give shareholders a growing dividend stream comfortably covered by expected annual free cash flow. We are also nearing the end of a £6.8 billion share buyback programme and this year paid an additional special dividend of 4.0 pence per share out of the proceeds of our income dividend from Verizon Wireless.
Taking ordinary dividends, this year’s special dividend and the buyback programme together, total cash returns to shareholders have been equivalent to approximately 30% of our market capitalisation over the last four years. Furthermore, in the period from 1 April 2011 to 21 May 2012, our share price has outperformed the MSCI European Telecoms index by 19.6% and the FTSE 100 by 3.7%.
And what about management remuneration?The executive management team should be paid well to the extent that they create value for shareholders. Our incentive schemes have a bias towards long-term, share-based plans, which incentivise our leaders to prioritise multi-year investment decisions and align their interests closely with those of institutional shareholders. We have deepened this alignment this year by introducing shareholding requirements throughout the senior leadership team.
How is Vodafone addressing its broader social responsibilities?Mobile telecommunications have played a significant role in the development of emerging market economies, not only through the investment in infrastructure but also through allowing people to connect with each other cheaply and easily for the first time. Vodafone and Vodacom have clearly played their part in this, particularly in India and southern Africa.
We are also taking a step further, introducing mobile financial services platforms across many of our markets, and developing mobile health initiatives. These, of course, stand to benefit our business through enhanced customer loyalty, but they also bring wider social benefits to the countries in which they are deployed.
Finally, we can also use the resourcefulness and dynamism of our employees to help raise funds to target specific medical issues that compromise thousands of lives in emerging markets. This year we launched our Moyo challenge, to raise £7 million through our employees for the Vodafone Foundation partner Comprehensive Community Based Rehabilitation (‘CCBRT’) to eradicate obstetric fistula (a maternal health condition) in Tanzania, which has affected 24,000 women since 2000. We are well on our way to reaching our target by June this coming year, aided by the generosity of our employees, suppliers and partners.
Gerard KleisterleeChairman
“ Our share price has outperformed the MSCI European Telecoms index by 19.6% and the FTSE 100 by 3.7%”
2009
2010
2011
1.0
2.1
4.0
4.1
4.5
2012 2.03.64.6
Cash returns to shareholders
Ordinary dividends paidShare buybackSpecial dividends paid
£bnVodafone share price vs FTSE 1001 April 2011 to 21 May 2012
200
160
120
7000
5500
4000
Jun 11 Aug 11 Oct 11 Dec 11 Feb 11 Apr 12Vodafone (share price in pence) FSTE 100 index
For legal reasons it should be noted that past performance cannot be relied on as a guide to future performance.
e

14Vodafone Group Plc Annual Report 2012
Chief Executive’s review
View our year in conversation online:vodafone.com/ar2012/conversation
Financial review of the yearOur overall financial performance this year has been steady. Our major emerging markets operations have had a very strong year. In addition, Verizon Wireless (‘VZW’), our 45% owned associate in the United States, combined continued good revenue growth with substantial cash flow. On the other hand, the tough macroeconomic and regulatory environment in much of Europe has made revenue growth in that region increasingly challenging.
However, on a relative basis, we have held or gained share in most of our major markets, continuing last year’s trend. The quality of our network continues to improve, with high speed data now available across a growing proportion of our voice network in our European markets, and low frequency spectrum for 4G/LTE services now secured in Italy and Spain. Cash flow generation and shareholder remuneration, even after sustained network investment, continue to be significant.
Group revenue for the year was up 1.2% to £46.4 billion, with Group organic service revenue up 1.5%* and data revenue up 22.2%*. Group EBITDA margin fell 0.8 percentage points, as a result of continuing high levels of commercial costs associated with the migration to smartphones, and the difficult trading environment in Spain in particular. Group EBITDA was £14.5 billion, down 1.3% year-on-year, but flat organically before restructuring costs.
Continued strategic progress
“ Our focus on the key growth areas of data services, emerging markets and enterprise is positioning us well in a difficult operating environment.”
Summary of where we are now…aa Our commercial performance continues to be strong, enabling us to gain or hold market share in most of our major markets
aa Group revenue increased by 1.2% to £46.4 billion driven by strong performance in data services and continued penetration of mobile services in emerging markets
aa We continue to generate a strong level of free cash flow of £6.1 billion, while increasing our capital expenditure to £6.4 billion in order to maintain our leading network quality

Business reviewPerform
anceG
overnanceFinancials
Additional information
15Vodafone Group Plc Annual Report 2012
Group adjusted operating profit was £11.5 billion, down 2.4% year-on-year but at the top of our guidance range of £11.0 billion – £11.8 billion based on guidance exchange rates. The decline in adjusted operating profit was due to the sale of our interest in SFR at the start of the year; on an organic basis, adjusted operating profit was up 2.5%*, as a result of the good performance at VZW.
We recognised £3.5 billion of net gains on the disposals of our interests in SFR and Polkomtel, and we recorded impairment charges of £4.0 billion relating to our businesses in Italy, Spain, Portugal and Greece primarily driven by lower projected cash flows within business plans and an increase in discount rates, resulting from adverse changes in the economic environment.
Free cash flow was £6.1 billion and within our guidance range of £6.0 billion – £6.5 billion for the year. The year-on-year decline reflected the loss of dividends from China Mobile Limited, the reduction in dividends from SFR, and the conclusion of our prior year working capital programme. Capex was up 2.3% at £6.4 billion, as we continued to maintain our significant level of investment to support our network strategy. In addition to our reported free cash flow we received an income dividend of US$4.5 billion (£2.9 billion) from VZW.
Adjusted earnings per share was 14.91 pence, down 11.0% on last year. The decline was driven by the loss of our share of SFR and Polkomtel profits, the loss of income from our interests in China Mobile Limited and SoftBank, and higher finance charges as the result of our decision to take advantage of low prevailing interest rates to fix a higher proportion of our debt.
The Board is recommending a final dividend per share of 6.47 pence, to give total ordinary dividends per share of 9.52 pence, up 7.0% year-on-year. During the year we also paid a special dividend of 4.0 pence per share, paid out of the income dividend we received from VZW. Total dividends per share were therefore up 51.9%.
EuropeOrganic service revenue in Europe was down 1.1%* year-on-year. Excluding the impact of regulated cuts to mobile termination rates (‘MTRs’), service revenue grew by 1.4%*. As in the prior year, we saw a broad divide between the more stable major markets of northern Europe, with Germany, the UK and the Netherlands all growing; and the much weaker markets of southern Europe, with Italy and Spain suffering from strong competition and a very poor macroeconomic environment.
Data revenue growth was strong at 20.2%*, with smartphone penetration on contract customers of 44.9%, up 11.5 percentage points during the year. We have continued our major commercial push towards integrated voice, SMS and data tariffs, so that in the final quarter, 43.2% of consumer contract service revenue in our major European markets came from customers on integrated tariffs.
Organic EBITDA was down 4.5%*, and the EBITDA margin fell 1.5* percentage points. The decline in EBITDA margin was almost entirely driven by margin erosion in Spain, where we put through significant price cuts during the year. Elsewhere, we benefited from increased cost efficiency.
AMAPOrganic service revenue growth in AMAP was 8.0%*. Our two major businesses, India and Vodacom, reported growth of 19.5%* and 7.1%* respectively. In India, pricing showed clear signs of stabilisation after a prolonged price war. In South Africa, growth continued to be strong, despite significant price cuts on data tariffs. In Australia, revenue declined sharply as our network perception continued to suffer after service issues experienced more than a year ago.
Organic EBITDA was up 7.8%* with EBITDA margin down 0.1* percentage points. EBITDA margins in our two biggest AMAP businesses, Vodacom and India, increased, but this positive impact was offset by a significant decline in the EBITDA margin in Australia.
Verizon WirelessOur share of the net income of VZW represented 42.2% of our Group adjusted operating profit. VZW enjoyed another very strong year, with organic service revenue up 7.3%* and EBITDA up 7.9%*. Our share of profits from VZW amounted to £4.9 billion, up 9.3%* year-on-year. In December 2011 VZW announced the proposed acquisition of 122 Advanced Wireless Services spectrum licenses, covering a population of 259 million, from SpectrumCo for US$3.6 billion (£2.3 billion).
For a detailed analysis of our financial performance for the year, please turn to page 40.
+1.5Group
Data
Emerging markets
+22.2
+13.2
Enterprise +2.2
Service revenue growth 2012* %
Service revenue by type 2012
Fixed: 8%Other: 5%
Messaging:12%
Data: 15% Voice: 60%

16Vodafone Group Plc Annual Report 2012
Chief Executive’s review (continued)
PrioritiesAll the elements of our Group strategy are covered in detail elsewhere in the annual report. In this section, therefore, I think it is more useful to give you some deeper insight into what I see as the key priorities for the business over the year ahead, and where Vodafone’s leadership team will be focusing their energies. Some of these priorities are, indeed, specific constituents of our strategy; others reflect our ability to influence the markets in which we operate or the resources we have at our disposal to execute our strategy.
DataAfter many years of investment and technological development, the customer experience of mobile data services in developed markets has now generally reached very good levels, with for example, high quality streamed video now widely available. However, operators in Europe have three significant challenges when it comes to data services: pricing, commercial costs and customer usage.
Our progress on pricing is inconsistent. In the best markets we are successfully generating incremental ARPU of €10 a month as we migrate customers to smartphones and data packages. However, in others the uplift is more marginal, often driven by the level of competition in the market. Our goal over the next 12 months is to achieve a more consistent revenue return from data – through faster, more reliable networks, significantly enhanced customer service, and a range of new and differentiated services accessible through the handset.
Unfortunately, almost all of the incremental ARPU we are generating ends up being invested in commercial costs. The smartphone market is still skewed to the high end, which has driven significant increases in average customers acquisition and retention costs over recent years. Looking ahead, we see scope for more competition in the handset market as new vendors seek to enter the market and more established players look to grow in the mid-tier. This should drive down our customer investment costs.
The pressure on our top line, particularly in Europe, is intense and we need to protect profitability through better cost discipline. Commercial costs are the biggest single cost in our business and we will not successfully stabilise margins unless we manage these acquisition and retention costs more rigorously.
Finally, we need to find a way to stimulate customer consumption of data. Average data usage on a smartphone in Europe is around a third of that in the US and less than a fifth of that in some parts of Asia. We have to work more effectively at showing customers they can use data more freely while still controlling their spend, and also helping them understand what they can actually use data services for. The ongoing upgrade to our European network, creating a platform which offers high speed data services everywhere we provide a voice connection, will in itself breed additional demand.
RegulationThe telecoms industry continues to experience intense regulation on mobile termination rates (‘MTRs’), and voice and data roaming. In addition, auctions of new spectrum are often structured to favour new entrants at low prices. The consequence of these actions is to suppress investment in next generation mobile and fixed networks, and thus to limit our ability to provide high speed data across a broad footprint. This universal access to high speed connectivity is a key goal of regulators across Europe, and will not be achieved if the current onerous level of regulation continues. I see it as a major priority to continue to work with my industry peers and local and EU regulators to find a fairer balance which protects customers while encouraging investment and competition.
I have been very vocal in my objection to this ongoing regulation, much of which has not produced the results intended by regulators. For example, reductions in mobile termination rates since 2009 have not meant that prices fall faster for mobile consumers and have not encouraged fixed line customers to make more calls to mobiles. If anything, the opposite has happened. I believe regulators should avoid auto pilot regulation that does not check whether regulation has achieved its purpose.’
“ We have continued to stimulate data adoption by encouraging customers to upgrade to smartphones, and offering a broad portfolio of these handsets across a range of price points.”
Our strategic priorities:
aa Mobile data
aa Emerging markets
aa Enterprise and total communications
aa New services
Customer experienceOur retail stores around the world are being reconfigured to ensure customers leave the store with their smartphone ready to use with technical experts available to resolve customers’ questions and device problems. By May 2012 4,400 of our stores provided these services and during this year we will further expand the roll out.
More detail Page 25

Business reviewPerform
anceG
overnanceFinancials
Additional information
17Vodafone Group Plc Annual Report 2012
Talent and diversity We continue to have high standards for talent and to strengthen our senior leadership population. Last year we promoted 20 internal talents to the senior team, of which 30% were female, and we hired 15 external candidates of which 20% were female. We continue to rotate top talents during their Vodafone careers. This not only stimulates the cross-pollination of ideas and best practices between markets, it also develops the cultural sensitivities that will be key in our future senior management.
As with many large companies, we have a disproportionate representation of men in our middle and senior management. I strongly believe that women have a range of skills and insights that are often different from, but complementary to, those of men, and management teams that do not reflect a better balance are the worse for it. Currently 19% of our senior leadership team is female, up from 17% in the prior year. We have set a target of increasing the percentage year-on-year.
Organisational changeBig organisations inevitably have a tendency towards bureaucracy, complexity and caution. Often the right option does not get pursued because of fear of failure or a desire not to “rock the boat”, or the time between decision and execution is too long and the opportunity has passed.
Over the last three years, we have embarked on a cultural change programme called The Vodafone Way which is designed to engender a cultural shift in how we do business, both internally and externally. The key building blocks of The Vodafone Way are speed, simplicity and trust. I believe we are already beginning to see the benefits of this in more personal accountability and better decision-making, but we need to drive this throughout the Group and our leaders must be responsible for exhibiting the right behaviours. There is more on this on pages 34 and 35.
Summary of the yearaa Our focus on the key growth areas of data, emerging markets and enterprise is positioning us well in a difficult operating environment.
aa Our commercial performance and our ability to leverage scale continue to be strong, enabling us to gain or hold market share in many of our key markets.
aa Our robust cash generation and the income dividend received from Verizon Wireless have enabled us to translate this operational success into good returns for shareholders.
aa Our goal over the next three years is to continue to strengthen our data networks and to enrich customers’ experience.
Prospects for the 2013 financial yearVodafone is well positioned for the coming year. We have continued to gain revenue share in many of our markets, as we lead the migration to smartphones and the adoption of data services by the mass market. Our exposure to the enterprise segment and our emerging market assets will continue to be strategic drivers of our performance and, with VZW set for another strong year, our overall geographical exposure is a positive differentiator. We have a strong balance sheet and will continue our major focus on shareholder remuneration, while reinvesting substantially in our network to enhance the customer experience.
Nevertheless, the environment in Europe is set to remain very difficult. Weak consumer demand from poor macroeconomic conditions, a harsh regulatory backdrop and ongoing competition create material barriers to growth. MTRs alone will have a negative impact, similar in percentage terms to the 2012 financial year, on service revenue growth in the 2013 financial year.
On an underlying basis, excluding foreign exchange rate movements, we expect growth in adjusted operating profit, and stability in free cash flow, compared with the 2012 financial year.
Adjusted operating profit is expected to be in the range of £11.1 billion to £11.9 billion.
We anticipate free cash flow for the coming year of £5.3 billion to £5.8 billion. The loss of dividends from SFR following the sale of our 44% stake, as well as a weaker euro year-on-year, are the main differences from the 2012 financial year. We expect capital expenditure to remain broadly steady on a constant currency basis.
We expect the Group EBITDA margin decline to continue its improving trend, supported by continued strong growth and operating leverage in our AMAP region, and improving control of commercial costs in Europe.
We remain committed to continuing to deliver a good return to our shareholders through the achievement of our targets for free cash flow and dividend growth; our focused investment in profitable growth areas; and our ongoing capital discipline.
.
Vittorio ColaoChief Executive
Employee talent and diversityOur goal is to achieve a broad employee base in terms of gender and nationality, and specifically target increased representation of women and emerging market talent at senior management level.
More detail Page 34

18Vodafone Group Plc Annual Report 2012
Industry trends
ScaleThe mobile industry is one of the largest communication sectors in the world with over six billion users across the globe. In contrast there are only 1.2 billion people with fixed line phones. The mobile industry generates around US$960 billion of annual service revenue, 80% of which comes from people making standard voice calls and sending texts. Over the last ten years the share of telephone calls via mobile has increased from 20% to 74%, reflecting the benefits of mobility. In 20111, 4.3 trillion text messages were sent (about 136,500 every second).
Growth The demand for mobile services continues to grow. In the last five years the number of users has increased by an average of 17% each year driven by rising living standards, population growth and cheaper mobile services and handsets. In 20111 86% of the world’s population has a mobile phone, whereas ten years ago this was only 16%. Most of the new demand for mobile services is from emerging markets such as India and Africa.
In India for example, the number of phone users increased by over 140 million in just one year, 20111, which is more than twice the size of the UK population. Emerging markets are growing quickly, and account for over 70% of the world’s mobile users. The rest live in developed markets such as Europe and the United States, where demand is growing more slowly as most people already have a device – in Europe for example there is already an average of 1.3 SIM cards per person.
CompetitionThe telecommunications industry is highly competitive, with typically at least four national mobile network operators, such as Vodafone, and one national fixed line operator in each country. In addition, there can be numerous companies that rent capacity from mobile operators and sell their own mobile services to customers. In some countries there can also be several independent distribution companies that compete with the mobile network operators’ own stores. Advances in technology are bringing in newer suppliers, such as internet based companies and software providers offering converged services such as voice over internet protocol (‘VoIP’). Against this background, consumers have a wide choice of providers.
RegulationThe mobile industry is very heavily regulated by both national, European and other regional and international authorities. Regulators continue to impose policies to lower the cost of access to mobile networks through setting lower mobile termination rates (the fees mobile companies charge for calls received from other companies’ networks) and to limit the amount that operators can charge for mobile roaming services. These two areas represent 12% of service revenue for Vodafone.
In an environment of intense competition and significant global regulatory pressures, industry voice prices have tended to reduce over time – and in 20111 fell 14%. However, with more mobile phone users and some customers using their devices ever more frequently, global industry revenue remains on a positive trend and expanded 5% in 20111.
Where the industry is nowThe mobile industry is a large and important sector with six billion global users. Customer growth over the last five years has been rapid, driven by the benefits of mobility, falling prices and rising penetration in emerging markets. However, pressures on revenue growth from competition and regulation are significant and are likely to remain.
aa 86% of the world’s population use a mobile phone
aa Competition is intense with typically at least four mobile operators in each country and numerous additional alternative communications providers
aa Regulators continue to impose policies to lower the cost of access to mobile networks
–222010
2011
2012
–21
–16
Outgoing voice prices per minute (year-on-year change)Vodafone data
%
106
Europe
US
Turkey 91
74India
China 74
Mobile penetration 2011Industry data calendar year
%
130
Mobile phone users by market 2011Industry data calendar year
Europe 18%
Developed marketsEmerging markets
US 7%
Other 4%
Other 19%Other Asia 14%
India 18%
China 20%
The industry data on pages 18 and 19 is sourced from Strategy Analytics, IDC and Merrill Lynch Wireless Matrix.
Note:1 Refers to calendar year.

Business reviewPerform
anceG
overnanceFinancials
Additional information
19Vodafone Group Plc Annual Report 2012
Growing revenue streamsThe share of industry mobile revenue from traditional voice and messaging services in developed markets is declining due to relative market maturity, ongoing competitive and regulatory pressures leading to lower prices for mobile calls, and a slow pace of economic growth. In contrast the demand for data services, such as internet on the mobile, is growing rapidly. In 20061 data services accounted for 6% of industry mobile service revenue, in 20111 it reached 20%, and it is expected to rise further over the medium term.
Demand is being driven by a combination of higher smartphone penetration, significant enhancements to network data speed and coverage, and an increased range of mobile applications. Smartphones now represent 39% of all handset sales compared to 8% in 20061.
Emerging markets, such as India and Africa, represent the regions with the most potential for future revenue growth driven by strong economic growth and low mobile penetration. For example, only 74% of India’s 1.2 billion population have a mobile phone implying good potential future market growth. According to external estimates by 20151 there will be 1.5 billion new mobile users, and the vast majority will be from emerging markets.
Technological innovationToday’s mobile networks in Europe are typically a combination of 2G networks for traditional voice, text and basic data services, and 3G networks for high speed mobile internet access and application downloads. 3G maximum data downlink speeds are already up to 43 Mbps (with typical user speeds of up to 6 Mbps). 4G, or long-term evolution (‘LTE’), the next stage of mobile network development, is already in place in some countries – providing maximum user speeds of up to 150 Mbps (typical user speeds up to 12 Mbps). Going forward, further network upgrades are expected to significantly enhance the user experience through a combination of both faster networks and wider high speed network coverage.
Innovation in services is also critical to enhance customer experience. Vodafone, together with a number of other leading operators, has developed the next wave in personal mobile communications known as rich communication services which will enable data services such as instant messaging or chat, live video sharing and file transfer across any device and on any network, in much the same way as voice and SMS. Vodafone is also developing a range of new services to generate additional revenue and enhance the customer experience such as mobile commerce, machine-to-machine and operator billing, which are discussed in more detail on pages 30 and 31.
Where the industry is headingThe pace of change in the mobile industry is significant with growing sources of revenue from data services such as internet usage; new users from emerging markets; rising take-up of smartphones and tablets; and major advancements in network technology to deliver faster and better services.
aa Data services and emerging markets represent the largest opportunity as traditional voice and text services in developed countries reach maturity
aa The shift towards smartphones and away from feature phones continues with smartphones representing nearly 40% of devices shipped in the last year
aa Significant technological improvements have led to faster data networks and product innovation to improve the customer experience
82006
2010
2011
21
39
Smartphone share of handset shipmentsIndustry data calendar year
%
492010
2011
2012
43
38
28
30
33
23
27
29
Service revenue from key areasVodafone data
Emerging marketsMature market data, fixed and otherMature market mobile voice
%
–4.0Voice
Messaging
Data
+4.4
+22.2
Fixed +5.4
Service revenue growth 2012*Vodafone data
%
14.4 (3G)
2007
2008
2009 28.8 (3G)
150 (4G)2010
2011 150 (4G)
Maximum mobile data downlink speedsIndustry data calendar year
Mbps
7.2 (3G)
43.4 (3G)

20Vodafone Group Plc Annual Report 2012
How we do business
A simple business modelWe buy licences that give us rights to spectrum bands and we build networks over which we provide calls, SMS and mobile internet services to customers.
Customers pay for the services and we use the cash flow generated to reinvest in the business and provide a good return to our shareholders.
Our reinvestment in the business allows us to make continuous improvements to our network, strengthen our brand, and develop our stores and websites to attract new customers and retain existing ones.
1. AssetsNetworksWe aim to have the best mobile network in each of our markets. This means giving our customers far-reaching coverage, a very reliable connection, and increasing speeds and data capacity. We believe that over time, offering a superior network experience will enable us to secure a premium positioning in most of our markets.
Our network investment is enhanced by our ongoing acquisition of mobile spectrum as it becomes available. For more information on our network build-out, see page 24.
DistributionWe operate around 14,000 stores across the Group, and have extensive networks of exclusive distribution partners and third party retailers. We will develop our distribution further to stay close to our customers, making it easy for them to join us from our competitors, upgrade their existing contract or just seek help with the services we offer. In addition, the internet is becoming an increasingly important part of our sales and service mix, and we have significantly upgraded our online shop and online service capabilities over the last three years.
Supplier relationships We work closely with our suppliers to build robust networks, develop innovative services and offer the widest range of the latest devices. In many cases these are partnerships, where we will approach a supplier with an idea or a problem that needs solving, and then work together to bring a solution to market.
From the customer perspective, the global reach and scale of Vodafone means that we will often be the destination for exclusive or first-to-market products.
2. Customers1. Assets
Networks
Distribution
Supplier relationships
People
Brand

Business reviewPerform
anceG
overnanceFinancials
Additional information
21Vodafone Group Plc Annual Report 2012
3. Revenue 4. Cash flow
5. Shareholder remuneration
6. Reinvestment into the business
PeopleWe place significant emphasis on the calibre of the people we recruit, how we develop them and the importance of our interface with our customers. We are working hard to build a more diverse workforce that is more representative of our customer base. We also believe it is important for our people to be the biggest champions of our own products and services, so that we all become natural Vodafone advocates. See pages 34 and 35 for more information on our people.
BrandVodafone is ranked as the number nine brand globally with an attributed worth of US$30 billion (source: Brand Finance), and the most valuable telecoms brand in the world. The strength of the brand raises the profile of our distribution channels and is a major driver of purchasing decisions for consumers and enterprise customers alike. During 2012 we continued our title partnership with the Vodafone McLaren Mercedes Formula One Team to give ongoing global exposure for our brand.
2. CustomersWith 404 million customers globally, Vodafone is one of the biggest mobile operators in the world. Mobile communications are now a way of life, connecting people, stimulating commerce, offering entertainment and providing security.
Our customers also include many of the world’s biggest companies: over 23% of our Group service revenue comes from the enterprise segment (see pages 28 and 29 for further details).
What all our customers have in common is the expectation of a great experience in what has become an essential service.
3. RevenueWe generate our service revenue through the supply of calls, text messaging, data and other services over our networks. Consumers pay for these services either via contracts (typically up to two years in length) or through buying their airtime in advance (prepaid or pay as you go). Enterprise customers often have longer contracts.
These revenue models give us excellent visibility of our business. In addition, we are not reliant on single large contracts, with the top ten biggest corporate accounts representing less than 1% of annual revenue. Secondly, the majority of our services are sold in advance – reducing credit risk and generating an attractive working capital profile. Finally, our services have become such a part of our customers’ everyday lives that they have become non-discretionary in nature.
4. Cash flowOur track record of converting revenue into cash flow is strong. Firstly, we run highly efficient networks where we seek to minimise costs, thus supporting a strong gross margin. Secondly, our market share position in many markets is strong and growing, with this in-market scale being a key driver of cost efficiencies and EBITDA margin.
5. Shareholder remunerationThe cash generated from operations allows us to sustain a generous shareholder returns programme while also investing in the future prosperity of the business. Our annual regular dividend per share, which we have targeted to grow by at least 7% to March 2013, is comfortably covered by our free cash flow guidance.
In addition, we have paid out a special dividend from the income dividend from Verizon Wireless, and are close to completing a £6.8 billion buyback programme financed through recent asset disposals. We have returned over 30% of our market capitalisation to shareholders over the last four years.
6. Reinvestment into the businessWe have maintained a high and consistent level of capex in recent years, to support wider coverage, higher speeds and deeper capacity in our networks. Through our IT investment we are enhancing our customer relationship capability and providing new customer billing services. In addition, we have continued to invest in our stores, our internet and social media presence and spectrum licences to support future services and growth. We have successfully balanced the ongoing capital requirements of the business with attractive shareholder remuneration.

22Vodafone Group Plc Annual Report 2012
Focusing on growth in:
The demand for mobile data services is growing rapidlyData is already our fastest growing segment, with data revenue up by 22.2%* over the financial year, compared to a 4.4%* rise for messaging revenue and a 4.0%* fall for voice revenue. This demand is being driven by three key factors – a widening range of powerful and attractive smartphones and tablets, significant improvements in mobile network quality and capability, and an increased choice of user friendly and useful applications for business and social use.
+19.32010
2011
2012
+26.4
+22.2
Data revenue growth* %
We have already seen significant growth in the number of customers using smartphones, with 27% of customers in Europe using these devices today, compared to 19% last year, and this is expected to grow rapidly in the next few years.
522010
2011
2012
81
108
Data users Millions
We are growing data revenue through enhancing technology and improving the customer experienceWe are continuing to refocus our business on data to capture the significant expected growth in customer demand for data services.
We aim to deliver a market-leading network experience to our customers. To compare our performance against our major competitors we conduct regular benchmark tests using reputable third parties. The latest results show that we have leading data service performance in 13 out of 18 markets with data downlink speeds on average around 6% better than our next best competitor.
5.6Downlink
Uplink
5.3
1.4
1.8
Typical user data speeds 2012 Mbps
VodafoneNext best competitor
More on how we’re driving data through technology and customer experience Pages 24 and 25
The mobile industry started less than 30 years ago with a single service – making and receiving calls. Today our customers enjoy a range of services including simple voice calls, text and picture messaging, and data services such as mobile internet browsing, social networking sites, downloading applications (‘apps’) and sending emails via smartphones.
Market context: According to industry analysts, data is expected to be the fastest growing segment of the mobile industry. It is estimated that between the 2011 and 2016 calendar years worldwide mobile data revenue is set to grow by US$142 billion, compared to a US$27 billion decline in voice revenue over the same period.1
Goals: We aim to have the best mobile network in all of the markets in which we operate, supported by leading IT systems. This means giving our customers far-reaching coverage, a very reliable connection and increasing speeds and data capacity.
Strengths: We have more than 238,000 base station sites transmitting wireless signals – making us one of the largest mobile operators in the world.
Actions: We are investing around £6 billion a year to deliver a high quality mobile data experience for our customers.
Progress: In 2012 nearly one trillion minutes of calls were carried and more than 216 petabytes of data were sent across our networks – in other words enough data for 2.8 trillion emails.
34%of our customers use data.
Mobile data servicesOur goal is to become the provider of choice for customers wanting to use data services. The opportunity is huge as we believe that over time all customers will want to use data internet services on their mobile devices.
Note:1 Sourced from Strategy Analytics.
Strategy

Performance
Governance
FinancialsAdditional inform
ation23Vodafone Group Plc
Annual Report 2012
Enhancing the UK networkOver the last 18 months we have been upgrading our network in the UK, and particularly London, to cope with the expected extra demand from the 2012 summer Olympic Games and to deliver a much enhanced smartphone data experience.
We have reconfigured our 3G network to run on 900 MHz frequency spectrum instead of 2100 MHz, which enables the radio signal to travel longer distances and provides better indoor coverage. We’ve also increased the number of base station sites in the UK over the last year by around 1,300, bringing the total to more than 14,600 nationally, which will boost capacity by around a third. Customers will see major benefits with improved coverage and accessibility to the network together with faster data speeds.
In order to deliver on the growth opportunity in mobile data we are focused on improving the user data experience through two key areas – technology and customer experience.
You can read about these in more detail on the following pages…
Business review

24Vodafone Group Plc Annual Report 2012
Strategy (continued)
Our goal is to provide the best data network
aa Today 99% of the population in our European markets can make a call across our network. We want the same level of reach for data users so that customers can use data almost everywhere they want, whether at work in big cities, relaxing in the countryside or on holiday by the beach. We already have a strong data network as a result of significant investment in 3G technology, with over 89% 3G data population coverage. We aim to increase coverage further to enhance the number of locations where customers can use data services.
aa We are building faster and more reliable data networks that either meet or exceed the capabilities of leading smartphones for headline data downlink speeds. At present some 82% of our 3G footprint in Europe is capable of maximum data speeds of 14.4 Mbps or better and by 2015 this is expected to be nearly 100%. We will continue to upgrade our capability of both 21.6 Mbps and 43.2 Mbps in anticipation of the latest generation of smartphones and tablets.
aa To support high speed data capability being introduced across our network we continue to upgrade our backhaul and backbone transmission capabilities, which connect our base stations to the latest technology. High capacity backhaul using ethernet, microwave and optical fibre transmission equipment is now in about 41% of our sites in Europe compared to 20% a year ago.
We continue to manage our cost base carefully
aa The increase in demand for data has meant that data traffic has more than doubled in the last two years and as a result, data now accounts for 67% of the total traffic on our network. Despite the significant cost pressures that this adds, we have managed to keep our technology operating costs, broadly stable over the same period by investing in cost efficient equipment. For example over 70% of the new radio sites deployed across the Group during the year were shared with other mobile operators which reduces the cost of renting or building new sites. We are also deploying more single radio access network (‘RAN’) base station sites which comprise 2G, 3G and 4G technology in one single unit as opposed to three different, and hence more expensive units. Single RAN units are now present in 24% of our sites and deliver energy operating cost savings of up to 40% compared to traditional RAN units.
Our goal is to maintain robust IT systems to provide the platform for enhancing the ways we manage our customer relationships
aa We are developing a number of tools to improve the ways we interact with customers. We are investing to create a “single view” of our customers across the Group which links together all customer activity and information on our various sales channels – online, retail and contact centres. So, for example, if a customer calls a contact centre or participates in web chat online this information would be available to our in-store staff.
aa We are also investing in new ways of billing customers to make tracking spend easier, including one bill for voice, data and fixed services.
Long-term evolution (‘LTE’) technology While 3G provides a mobile data user experience comparable to traditional fixed broadband services based on copper technology, the development of 4G services, sometimes called long-term evolution (‘LTE’) technology, will significantly enhance the user experience providing user speeds of up to 12 Mbps, compared to up to 6 Mbps on 3G. In Germany, our first market to launch LTE, we have already deployed the capability on 12% of our radio sites, and as a result we can provide market leading coverage to 14 million German households, one-third of the total.
Mobile data:
TechnologyWe want to have the best data network and IT systems to provide the platform for our products and services. At the same time we will continue to carefully manage our cost base to deliver profitable data services.
aa We want to provide the best data network in terms of coverage, speed and capability.
aa At the same time we will continue to carefully manage our cost base to deliver profitable data services.
aa Our goal is to provide robust IT systems to provide the platforms and tools for managing customer relationships for our products and services.
89% £304mof the European population where we operate is covered by our 3G network.
invested in research and development during the year to ensure we continue to develop innovative services.
992G
3G
4G
91
351
Network population coverage in Germany 2012
%
952010
2011
2012
161
216
Data volume Petabytes
Note: 1 Household coverage.

Performance
Governance
FinancialsAdditional inform
ationBusiness review
25Vodafone Group Plc Annual Report 2012
We want our customers to enjoy the experience when they interact with us
aa Our traditional voice and text messaging services are relatively simple to use and understand, however mobile data can be more difficult to understand – for example setting up your smartphone, email account or accessing internet applications. We are taking a number of steps to improve our service to make it easier for our customers. Our retail stores around the world are being reconfigured to offer customers a better experience with services which ensure customers leave the store with their smartphone fully running, and technical support experts to resolve customers’ questions or problems with their devices. By May 2012 4,400 of our stores provided these services and during this year we will further expand the roll out.
aa We are also using more online capabilities so that 57% of our customers in Europe now receive an electronic bill which saves us money and also helps the environment. We have extended the online self-care service from PC to smartphones and tablets in 17 of our markets and now have eight million customers who can view their billing information, their usage and information about their price plan, across any of their connected devices.
aa We are evolving our contact centre strategy to encourage the use of social media which is simple and attractive to use for some customers. Last year we received 64 million contacts through our social media contact centres such as Vodafone Facebook, YouTube and customer forum.
Our goal is to offer our customers the most attractive and innovative range of mobile devices
aa Our strategy is to leverage our devices portfolio to both differentiate as well as drive data usage in the market. 27% of our customers in Europe use a smartphone, compared to 19% a year ago. Among consumer contract customers that pay a regular fee the figure is even higher at 47%. We continuously work with our strategic partners to have the most attractive smartphone portfolio, including both high-end devices and prepaid handsets such as the value-focused Vodafone 858 Smart.
We aim to provide services that help our customers access their digital life in an easier and safer way and to build customers’ trust
aa We have established a range of integrated voice, SMS and data plans. Within these plans, customers are able to use whatever services they wish – from simple calls and text messaging to all the applications that the internet provides. 27% of our customers in Europe are already on these plans, up from 13% last year.
aa In order to keep customers’ information safe and secure, Vodafone has launched a range of services designed to support data usage on smart devices and build longer term relationships with customers. Key examples are Vodafone Cloud, Vodafone Contacts, Vodafone Protect and Vodafone Guardian. Vodafone Cloud automatically uploads or saves customers’ photos and videos to the cloud which can then be retrieved from any device. Vodafone Contacts, another cloud based solution, backs up customers’ phone contacts, so all their numbers are always safe. Vodafone Protect enables us to locate lost or stolen phones and laptops, and wipes the content to keep them secure. Vodafone Guardian is a service to help protect children with smartphones against unwanted communication, promoting responsible use of mobile technology, and helping parents control how their children’s smartphones are used.
Vodafone 858 Smart The Vodafone 858 Smart is our Vodafone branded Android smartphone positioned to accelerate mobile data mass market adoption, with a retail price of around £55 in the UK. We are giving access to the mobile internet with a high quality experience to the mass market, and have sold around one million units since its launch in June 2011.
Mobile data:
Customer experience We aim to differentiate from our competitors by smart and continued investments in technology, capabilities and distribution, providing both a great customer experience and competitive value to our customers.
aa We want our customers to enjoy the experience when they interact with us, through providing the best retail stores, the easiest online experience and most accessible expert advice when needed.
aa Our goal is to offer customers the most attractive and innovative range of mobile devices, from smartphones to tablets, USB sticks and connected devices.
aa We aim to provide services that help our customers access their digital life in an easier and safer way and to build customers’ trust .
14,000 1stWe are among the world’s largest retailers with around 14,000 retail stores.
Our brand is rated as the most valuable telecoms brand in the world.
102010
2011
2012
19
27
Share of European customerswith a smartphone
%
2011
2012
13
27
Share of European consumer contractcustomers on integrated price plans1
%
Note: 1 Integrated tariffs were introduced to our markets during the 2011
financial year.

26Vodafone Group Plc Annual Report 2012
Focusing on growth in:
Emerging marketsEmerging markets such as India and Africa represent a significant opportunity for growth. Last year the Indian mobile market added 140 million customers – over two times the size of the UK population.
The attraction of emerging marketsOver 70% of the world’s six billion mobile phone users are in emerging markets, where incomes are generally lower than mature markets such as Europe. Emerging markets tend to have stronger growth prospects than mature markets, as a smaller share of the population in these countries have mobile phones and the pace of economic and population growth tends to be higher. During the year mobile service revenue growth in our emerging markets increased by 13.2%*, including 19.5%* in India and 25.1%* in Turkey. This was driven by continued strong economic growth and rising mobile penetration. In contrast revenue growth in Europe declined 1.1%*.
+7.92010
2011
2012
+11.8
+13.2
Emerging market servicerevenue growth*
%
The data opportunity in emerging marketsMobile data is increasingly popular in emerging markets given the lack of alternative fixed line infrastructure. For many people in emerging markets their first internet experience has been on a mobile device and we expect this to be the case going forward. The demand for data is expected to grow strongly as only around 29% of our customers in these markets currently use data services, compared to about 42% in Europe. At 31 March 2012 over half of our mobile data users were from emerging markets.
Our money transfer service, M-Pesa, supports economic development in emerging marketsMobile services are a key driver of economic development in emerging markets. According to a World Bank study, a 10% increase in mobile penetration can add 1.2% to annual economic growth in an emerging economy. Our Vodafone money transfer service, M-Pesa, is also contributing to economic growth in countries that lack banking services. It enables millions of people who have a mobile phone, but with limited or no access to a bank account, to send and receive money, top-up airtime and make bill payments. We now have just over 14 million active M-Pesa customers, who transfer up to £600 million per month. The service is established in Kenya, Tanzania, South Africa, Afghanistan, Qatar and Fiji. During the financial year, we launched M-Pesa on a trial basis in Rajasthan, India, in preparation for a full launch later this year across the country.
29%of our service revenue is from emerging markets.
£600mtransferred person to person over our M-Pesa platform per month.
Emerging markets represent around 29% of our service revenue and the share is likely to grow over the medium to longer term driven by continued strong economic growth and the increase in mobile penetration towards mature market levels.
Market context: Almost all of the 1.5 billion new mobile phone users over the next four years are expected to come from emerging markets.1
Goals: We are steadily increasing our exposure to emerging markets given the stronger growth prospects that they offer relative to developed markets.
Strengths: We operate mobile networks in a number of emerging markets including India, Vodacom, Egypt, Turkey, Ghana, Qatar and Fiji – in which we hold either a number one or two revenue market share position.
Actions: Our high quality networks combined with low cost devices and innovative services such as mobile payments and mobile health solutions help to support economic development in underdeveloped communities (see below and “Sustainable business” on page 36 for more information).
Progress: Emerging markets represent our fastest growing geographies, delivering service revenue growth of 13.2%*, compared to a fall of 1.1%*, for our Europe region.
Note:1 Sourced from IDC.
Strategy (continued)

Performance
Governance
FinancialsAdditional inform
ation27Vodafone Group Plc
Annual Report 2012
Managing scale in IndiaIndia is our largest market measured by customers with over 150 million phone users. We added 16 million customers last year, which is equivalent to two times the population of London. Every month we handle 43 million calls to our call centres and have the capability to deal with a diverse customer base given the 22 languages and 100 dialects in the country. With our broad distribution reach, customers can top up at over 1.4 million recharge outlets.
Our contribution to mHealth solutionsMobile technologies offer significant opportunities to improve the accessibility and effectiveness of health services. In Tanzania our SMS for Life project uses SMS to track and manage the supply of malaria drugs so patients do not have to go without. During a six month pilot, the number of clinics without supplies reduced from 26% to almost zero. The SMS for Life project has since expanded to cover all 5,000 health facilities across Tanzania.
Business review
28Vodafone Group Plc Annual Report 2012
Enterprise and total communicationsContinued globalisation of marketplaces and the growth of small businesses looking for more productive ways of communicating has created growth opportunities for Vodafone in all enterprise segments from micro-businesses to multinationals.
Focusing on growth in:
Leading in enterpriseThe core criteria our enterprise customers use when choosing a communications service provider are speed, simplicity, flexibility, cost and security. We are well placed to offer enterprise customers all of these through our mobile and fixed converged services, applications and secure solutions.
Vodafone Global EnterpriseVodafone Global Enterprise serves the needs of Vodafone’s largest multi-national corporate (‘MNC’) customers. MNCs demand a consistent multi-country offer from Vodafone across our global footprint. Vodafone Global Enterprise simplifies operations for these customers by providing them with a single account and service team, a single contract, single pricing structures and a single portfolio of products and services. Vodafone Global Enterprise has created a market leading portfolio of Managed Mobility Services providing capabilities such as mobile email or device security as a chargeable managed service in addition to providing the underlying connectivity and devices. By providing a broader range of services Vodafone Global Enterprise extends its core value proposition of integrating, managing and simplifying global communications services for MNC customers.
During the financial year Vodafone Global Enterprise achieved revenue of £1.3 billion, with growth of 11%* across the Group, 12%* in Europe and 8%* growth in our AMAP region.
Total communicationsEnterprise customers are embracing flexible and remote working to improve business efficiency. Vodafone’s fixed and mobile converged solutions and reliable mobile data services are increasingly vital to our customers’ business operations.
Vodafone One Net offers customers a single telephone number which rings on both their fixed desk-phone and mobile handset. One Net users have complete control over where and when they take their calls. Businesses have the flexibility to change the number of users depending on their needs. As a result we help improve business efficiency, flexibility and cost control. Vodafone One Net users generate higher revenue and lower churn than mobile-only customers.
Consistent with our Group strategy of continuing to develop services in Europe and enhance our efficiency and realise scale benefits, in April 2012 we announced a recommended cash offer for Cable & Wireless Worldwide plc, a leading UK fixed line business. If our offer is successful our combined business will create a leading integrated fixed and mobile operator in the UK, opening up attractive opportunities in the unified communications space.
Enterprise mobile dataVodafone’s device management solutions help customers manage the rapidly increasing number of mobile devices, such as smartphones and tablets, used in their business. Our reliable and secure data networks allow our customers to make full use of the mobile internet for business. Enterprise data revenue grew 18.2%* this year driven by smartphone penetration of 40%, as the use of the internet on smartphones has increased.
Our enterprise customers range from small-office-home-office (‘SoHo’) businesses and small-to medium-sized enterprises (‘SME’), through to large domestic and multi-national corporates (‘MNC’). Across the Group we have over 30 million mobile enterprise customers accounting for around 8% of all customers and around 23% of service revenue.
Market context: Enterprises spend €86 billion in total in areas where Vodafone provides its services: mobile voice, messaging and data.1
Goals: We want to confidently connect businesses using our expertise in converged services, delivering unmatched customer experience and real value for money. We aim to continue to gain market share and exploit opportunities across our geographic footprint.
Strengths: Our geographic footprint in Europe allows us to enhance efficiency and realise scale benefits, allowing us to offer customers both fixed and mobile converged solutions.
Actions: Our Vodafone One Net proposition offers customers one number which can be answered on their desk phone or mobile phone and is the foundation of our unified communications strategy.
Progress: 40% of our enterprise customers now have a smartphone or tablet across Europe, pushing enterprise data revenue growth of 18.2%*.
Note:1 Sourced from IDC, MZA and Vodafone estimates.
Strategy (continued)
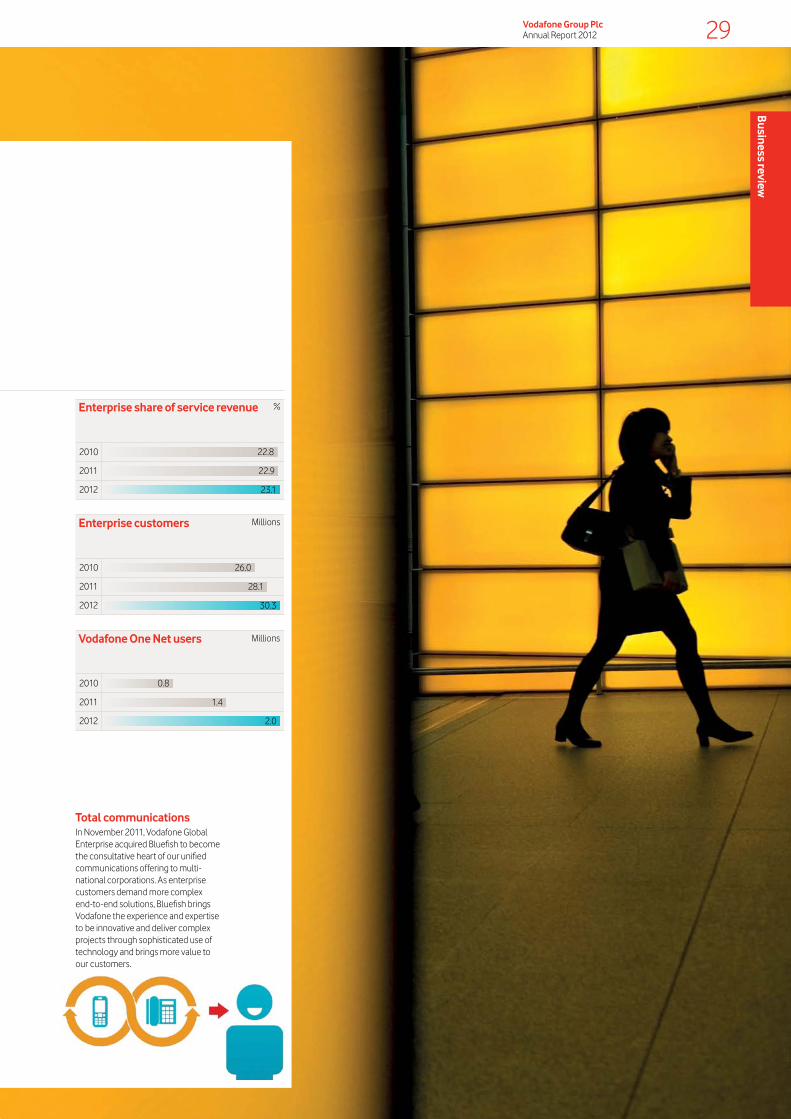
Performance
Governance
FinancialsAdditional inform
ation29Vodafone Group Plc
Annual Report 2012
Total communicationsIn November 2011, Vodafone Global Enterprise acquired Bluefish to become the consultative heart of our unified communications offering to multi-national corporations. As enterprise customers demand more complex end-to-end solutions, Bluefish brings Vodafone the experience and expertise to be innovative and deliver complex projects through sophisticated use of technology and brings more value to our customers.
22.82010
2011
2012
22.9
23.1
Enterprise share of service revenue %
0.82010
2011
2012
1.4
2.0
Vodafone One Net users Millions
26.02010
2011
2012
28.1
30.3
Enterprise customers Millions
Business review

30Vodafone Group Plc Annual Report 2012
Focusing on growth in:
New servicesWe are supplementing our core communications services of voice, data and texts with a range of new services to generate additional revenue and enhance the customer experience. These new services comprise three key areas – mobile commerce services, machine-to-machine (‘M2M’) services and operator billing.
Mobile commerce servicesMobile financial services are today at the core of our mobile commerce services and M-Pesa is our main service, a mobile payment service that enables millions of people to transfer money electronically even when they have no access to a bank (see page 26 for more details). We are also developing a global mobile wallet service whereby customers with suitably equipped smartphones can use them to pay for goods and services. Earlier this year we announced a worldwide partnership with Visa to enable customers to simply wave their phone in front of a payment terminal to make simple everyday purchases such as train tickets, newspapers or their morning coffee.
7.22010
2011
2012
11.2
14.4
M-Pesa active customers Millions
Machine-to-machine M2M connections allow machines to communicate with one another via built-in mobile SIM cards. It is our vision to transform lives and businesses by providing the most innovative M2M products and services for our customers. Smart metering, automotive and logistics are currently the key growth sectors with the potential market increasing from €3 billion in 20113 to €6 billion by 20151 3. We are now serving around 7.8 million M2M connections globally, up from 5.3 million last year.
An increasing number of global businesses are incorporating M2M communications into their core operations, leading to greater productivity, enhanced customer service, lower energy use and decreased carbon dioxide emissions.
3.72010
2011
2012
5.3
7.8
Machine-to-machine connections
Millions
Operator billingAcross the globe around 28 billion apps are downloaded every year; most are free but an increasing number are paid for. To build on this opportunity we are partnering with leading companies such as Google and Facebook to enhance their service with a simple solution that allows our customers to pay for apps and games directly and simply on their Vodafone monthly phone bill. We were the first operator to launch the service in Europe for the Android market and the service today also works on BlackBerry and Nokia. Early results have shown that around 80% of apps bought through BlackBerry App World are paid for via operator billing. These recently launched services provide a great customer experience and we had over 130,000 active users at the end of the financial year.
2011
2012
205
1,563
Apps paid through Vodafone operator billing2
Thousands
People are using data more and more in their everyday lives driven by fast, reliable mobile data networks and continual improvements in devices such as handsets and tablets. We are also seeing increased interest from customers in new data-based services like mobile payments via handsets and mobile data devices for homes and cars.
Market context: New services account for a small portion of our revenues today but the potential market opportunity is significant.
Goals: We want to expand our presence in attractive new growth segments to capture the incremental opportunity and enhance customer service through the provision of new and useful services that add value to our customers’ lives.
Strengths: Our global network reach, leading brand and strong service platforms make us well placed to become the partner of choice and capture the revenue growth opportunity.
Actions: We are developing new services in partnership with leading companies from all relevant industries, including financial institutions, retailers, software producers and handset manufacturers.
Progress: During the year we saw strong growth in the take up of new services, adding 3.2 million active M-Pesa customers and 2.5 million new M2M connections.
Notes:1 Consensus of leading M2M market analysts for global M2M
connectivity (excludes hardware, software, applications and system integration services).
2 Data for 2010 is unavailable as the service was launched in 2011.3 Refers to calendar year.
Strategy (continued)

Performance
Governance
FinancialsAdditional inform
ation31Vodafone Group Plc
Annual Report 2012
+€3bnThe machine-to-machine market (SIM to SIM communication without human intervention) is expected to grow from €3 billion in 20113 to €6 billion by 20153.
BMW uses Vodafone’s machine-to-machine SIMsIn March we announced that Vodafone’s new SIM chip, which is based on machine-to-machine technology and allows different devices to communicate with each other, has been selected by BMW.
Starting later in 2012, new BMW vehicles will be fitted with specially adapted Vodafone SIM chips which will provide drivers with access to innovative in-car services such as the BMW online service, a 24/7 personal concierge service for drivers and emergency call functions.
The Vodafone SIM chip has a lifespan of more than ten years and can withstand temperatures from minus 40 to plus 85 degrees centigrade.
Business review

32Vodafone Group Plc Annual Report 2012
Core strengths
Maintaining our leading market positionVodafone is a high performing company with a leading market position. We are either the number one or number two mobile operator, when measured by revenue market share, in 14 out of 18 countries we operate in. We have outperformed our competitors by increasing market share in most of our key markets over the last year.
Our business is highly cash generative and in the last four years we have returned over 30% of our market capitalisation to shareholders in the form of dividends and share buybacks, while still investing around £6 billion a year in our networks and infrastructure.
Our leading performance is based on three core strengths:
Mobile service revenue market share in key markets March 2012
35%
Ger
man
y
37%
Italy
60%
Voda
com
1
The successful implementation of our strategy to generate
liquidity or free cash flow from non-controlled
interests
Our global scale advantage and close attention to
cost efficiency
The application of rigorous capital discipline to investment decisions
Notes:1 Market share information relates to total revenue for South Africa
which is Vodacom’s largest business.2 India: December 2011.
26%
UK
31%
Spai
n
21%
Indi
a2

Performance
Governance
FinancialsAdditional inform
ationBusiness review
33Vodafone Group Plc Annual Report 2012
Discipline of regular business reviewsWe regularly review the cash needs of each of our existing businesses across the globe, taking into account their performance and competitive position. We make capital investments, such as for new equipment or spectrum, in our businesses to improve their performance and drive organic growth.
Returns to shareholdersWe thoroughly review the best ways to provide returns to our shareholders. We have a target of increasing dividends per share by at least 7% a year until the financial year ending 31 March 2013. When we have surplus funds we consider additional returns to shareholders through special dividends or share buyback programmes.
Selective acquisitionsWhen managing capital we also consider whether to strengthen the Group by acquiring other companies to increase our operations in a particular market. All potential acquisitions are judged on strict financial and commercial criteria, especially whether they would provide meaningful scale in a particular segment, the cost of the acquisition and the ability to enhance the Group’s free cash flow.
£0.9bn In the last two years we have taken out some £0.9 billion from the cost base which has been used in part to offset inflationary pressures or cope with the volume of extra traffic on our networks. The net saving has been around £0.3 billion, which has been partly used to invest in commercial activities.
Deliver value and efficiency from scale
Vodafone is one of the world’s largest mobile companies. Our networks support 404 million customers and carry nearly one trillion minutes of calls and 324 billion texts each year. Our scale enables us to secure considerable unit cost savings in various ways including purchasing, standardisation of processes, off-shoring activities to lower cost locations, outsourcing non-core activities to third parties and sharing common resources with other operators.
Generate liquidity or free cash flow from non-controlled interests
In 2010 we identified six non-controlled assets in which Vodafone was the minority partner, that would either be sold or from which we extract additional cash flow in order to fund profitable investment or enhance shareholder returns. Since 2010 we have made considerable progress in this strategy by raising a total of £17.7 billion from the sale of assets and additional dividends.
Apply rigorous capital discipline to investment decisions
We are focused on enhancing returns to our shareholders and are therefore careful how we invest shareholders’ money. We apply rigorous commercial analysis and set demanding investment criteria to ensure that any investment, whether in existing businesses or acquisitions, will enhance value for shareholders. We remain committed to our target credit rating of low single A for long-term debt as this provides us with a low cost of debt and good access to liquidity.
Purchasing We use the Vodafone Procurement Company, the central Group procurement function based in Luxembourg to leverage our scale and to achieve better prices and more value.
Standardisation We have developed one integrated data centre cloud across Europe and Africa and are well underway to extending it to Asia this year which enables us to operate highly resilient services and to be faster to market with our new services.
Off-shoringWe use shared service centres in Hungary, India and Egypt to provide financial, administrative, IT, customer operations and human resource services for our operations in over 30 countries which helps us to standardise and optimise the way we run our businesses.
OutsourcingWe have outsourced day-to-day network maintenance in ten countries enabling significant scale economies for the chosen supplier which are passed on to us in the form of lower costs.
SharingOver 70% of the new radio base station sites deployed this year were built as shared sites with other operators to reduce costs.
Businesses we have recently soldIn September 2010 we sold our 3.2% stake in China Mobile Limited for £4.3 billion.
In November 2010 we agreed to sell our remaining interest in SoftBank of Japan for £2.9 billion and the transaction was completed in April 2012.
In June 2011 we sold our 44% holding in SFR of France for £6.8 billion.
In November 2011 we sold our 24.4% share of Polkomtel in Poland for £0.8 billion.
Dividends received from our non-controlled assetsIn January 2012 we received a £2.9 billion income dividend from our 45% interest in Verizon Wireless in the US. £2.0 billion of this was paid to Vodafone shareholders in the form of a special dividend. This was the first income dividend received since 2005.
Remaining non-controlled interestsWe retain an indirect 4.4% interest in Bharti in India.
The proceeds raised from non-controlled interests are being used to fund the current £6.8 billion share buyback programme, of which £5.7 billion was completed at 31 March 2012.
2010
2011
2012
5.7
7.6
0.5
0.5
3.0
Dividends and sale proceedsfrom non-controlled interests
£bn
Income dividend from non-controlled interestsCash received from the sale of non-controlled interests
4.6Ordinary dividends paid
Share buyback
Special dividend paid
3.6
2.0
Returns to shareholders 2012 £bn

34Vodafone Group Plc Annual Report 2012
Our people
The Vodafone WayThe Vodafone Way is about a consistent way of working, with speed, simplicity and trust. The aim is to be an admired organisation which delivers through being customer obsessed, innovation hungry, ambitious and competitive, and one company with local roots.
Organisation effectiveness and changeWe employed around 86,400 people worldwide during the year. Efficiency gains and related headcount reductions in Europe were partly offset by selective insourcing of customer call centres to improve customer experience, by our acquisition of Bel Company in the Netherlands to strengthen our retail and distribution and due to growth in emerging markets. We are also continuing to move some transactional and back office activities to our shared services centres in Hungary, Egypt and India.
Employment policies and employee relationsOur employment policies are developed to reflect local legal, cultural and employment requirements. We aim to be recognised as an employer of choice and therefore seek to maintain high standards and good employee relations wherever we operate.
Our goal is to create a working culture that is inclusive for all. We believe that having a diverse workforce helps to meet the different needs of our customers across the globe. An inclusive culture and environment is one which respects, values, celebrates and makes the most of the individual differences we each bring to Vodafone, to the benefit of our customers, employees, shareholders, business partners and the wider communities in which we operate. We do not condone unfair treatment of any kind and offer equal opportunities in all aspects of employment and advancement regardless of race, nationality, gender, age, marital status, sexual orientation, disability, religious or political beliefs. This also applies to agency workers, the self-employed and contract workers who work for us. In our latest people survey, 88% of employees agreed that Vodafone treats people fairly, regardless of their gender, background, age or beliefs.
The main emphasis of our global diversity strategy has been on gender diversity and to increase the number of women in top senior management positions which has risen to 19.4% from 16.5% last year. We are committed to increasing the representation of women at all levels and to increase the representation of emerging markets talents in our group function and senior leadership population. During the year we deepened our commitment to diversity through, for example, running diversity and inclusion training workshops for our middle and senior managers and helping our markets to better embed female consumer preferences in our products and services through the MWomen programme.
Health, safety and wellbeingIn 2011 we introduced our new safety plan to significantly reduce fatalities and create an injury free workplace. As a result we’ve seen a reduction in fatalities to zero in some of our countries (Turkey, the Democratic Republic of Congo and Mozambique). Sadly however, 211 people died in the course of Vodafone doing business around the world. Vehicle related incidents remain our number one cause of fatalities and we’re addressing this through several interventions in local markets. In Ghana, for example, we set up a programme that uses vehicle simulators to assess driver competence, and a weekly analysis of driving activities through a GPS tracking system to improve driver safety.77
Employee engagement score, up from 75 in 2011
86,400Average employees
Living The Vodafone WayWe want everyone to live The Vodafone Way as a customer obsessed ambassador for Vodafone so we’ve created a global online portal where all employees can learn about our products, get close to our customers and answer the question “Why Vodafone?” by understanding our strategy, priorities and differentiators.
Our people are integral to building and sustaining our success.
Market context: We are a global company, with operations in over 30 countries and with around 29% of our service revenue from emerging markets. In order to meet our customers’ different needs we aim to build a diverse workforce that reflects the various societies in which we operate.
Goals: We strive for a broad employee base in terms of gender and nationality, and specifically target increased representation of women and emerging market talent at senior management level.
Strengths: With around 86,400 employees we have a wealth of talent to draw from to drive our business forward.
Actions: We invest nearly £60 million annually in training.
Progress: According to our latest staff survey our employees’ level of engagement, a combination of pride, loyalty and motivation, is in line with other high performing global organisations.
Note:1 While there were 21 fatalities involving contractors and employees,
overall fatalities have reduced due to a decrease in fatal incidents involving members of the public.

Performance
Governance
FinancialsAdditional inform
ationBusiness review
35Vodafone Group Plc Annual Report 2012
Culture, communications and engagementOur culture is based on The Vodafone Way which is about a consistent way of working, with speed simplicity and trust. All of our senior leadership team (227 people) attended a CEO led culture change programme in the 2011 financial year and are now returning for a practical hands-on reinforcement of the leadership skills and habits we believe we need to equip our leaders and teams with in order to make The Vodafone Way an everyday reality. Our Group functions and local markets have rolled out a similar programme for all their managers.
Regular, consistent and open communication is fundamental to high levels of employee engagement. This year we launched Vodafone Circle, an online social network and collaboration tool for all our employees making it easier to connect and share expertise on a company wide basis. Our people have access to information about our business through a global intranet, with local translations and content where appropriate. The Chief Executive communicates directly with all employees through regular team meetings, email, video and webchat, and this is reinforced by local chief executive communications in all of our markets. Relevant performance and change issues are also discussed with our employees through team meetings, round table discussions or through elected representative bodies in some of the European countries.
Talent and capability developmentDuring the year our employees continued to perform at a high level and we strengthened our senior leadership team with 53% of the vacancies being filled by internal talent. Our global graduate and recruitment programme, Discover, continued to grow with over 400 recruits this year. In addition, we partnered with nine leading MBA schools in Europe, the US, Africa and India to recruit 15 MBA graduates for key management roles. We continued to encourage international assignments in our talent pipeline and introduced the Columbus programme designed for graduate recruits to gain international experience two years after joining Vodafone.
We are committed to helping our people perform at their best and achieve their full potential through ongoing training and development. People review and agree development objectives during their annual performance dialogue with their manager. During the year we invested around £60 million in training programmes. 75% of our people agreed that they had opportunities to learn the skills that they need to do their job well based on the 2011 people survey.
We continue to develop and strengthen Academies to build expertise in our core functional areas of technology, marketing, finance, human resources and supply chain. We have invested in a new learning management system which will be rolled out to all markets over the next 18 months, enabling more training to be delivered online and on demand.
Leadership development is an important priority for us. For the past five years we have been developing our next generation of leaders through Inspire, an 18 month programme for high potential managers. This year, 82 high potential managers from over 30 countries joined the programme, attending leadership development workshops, leading business challenges, and receiving coaching sessions and mentoring from senior leaders.
Performance, reward and recognitionWe reward employees based on their performance, potential and contribution to the success of the business. We benchmark roles regularly on a total compensation basis to support our aim to provide competitive and fair rates of pay and benefits in every country where we operate. We also offer competitive retirement and other benefit provisions which vary depending on conditions and practices in local markets.
Global short-term incentive plans are offered to a large percentage of employees and global long-term incentive plans are offered to our senior managers. Individual and company performance measures are attached to these plans which give employees the opportunity to achieve upside for exceptional performance as well as ensuring that as a business we do not reward failure.
An ownership mentality is a cornerstone of our reward strategy and senior executives are expected to build up and maintain a significant holding in Vodafone shares within a few years of joining the company. In addition, all UK employees are able to build up an ownership in shares through our Sharesave scheme and Share Incentive Plan.
Notes:1 Represents the average number of employees in our controlled
and jointly controlled markets during the year.2 Based on our controlled markets and our joint venture in Italy.
Employee engagementIn October 2011 we carried out our seventh annual global people survey. The survey measures employees’ level of engagement, a combination of pride, loyalty and motivation and 90% of those surveyed responded. We increased our overall employee engagement score by 2 points to 77 and remain in line with other high performing global organisations.
132010
2011
2012
15
15
Employee turnover rates2 %
262010
2011
2012
29
25
Nationalities in top senior management roles
84,9902010
2011
2012
83,862
86,373
Number of employees1
14.52010
2011
2012
16.5
19.4
Women in top senior management roles
%
Employees by location 2012
Germany:14%
Other:43%
Spain: 5%
UK: 9%
India: 13%
Vodacom: 9%
Italy: 7%

36Vodafone Group Plc Annual Report 2012
Sustainable business
Our visionThe Executive Committee has overall ownership of the sustainability strategy, and the Board receives annual progress updates. Local markets develop their own strategies that address the primary opportunities and risks in their countries whilst supporting the Group’s overall vision.
Throughout the year, we have kept abreast of the material issues through contact with customers, investors, employees, suppliers and governments. The Vodafone Sustainability Expert Advisory Panel met twice during the year and gave insight about our revised strategy.
Delivering transformational servicesWe aim to deliver products and services which can transform people’s lives and contribute to more sustainable living.
M-Pesa60% of the world’s population do not have access to basic financial services such as a bank account or insurance. In addition to the challenges this presents for employment and education, efficient remittances to rural relatives rely on secure money transfer. The M-Pesa mobile money transfer platform and mobile contactless payments are the result of our focus on the development and deployment of innovative financial services. Further information is contained in “Emerging markets” on page 26.
Connected agricultureBy 2050 the world will need to produce 70% more food to satisfy a global population of nine billion1. We can help farmers meet this challenge by using mobile technology to improve productivity and increase efficiency throughout the agricultural value chain. Our Connected Agriculture research report, published in 2011 with Accenture, found that mobile technology could boost farmers’ productivity enough to increase agricultural income by US$138 billion by 2020 across our markets, primarily in India, Africa and the Middle East.2
We are piloting services with some of our corporate customers to improve information sharing across their supply chains. For consumers we have established information services for farmers in several local markets which are paid for through special tariffs. More than 600,000 farmers in Turkey now subscribe to Vodafone Farmers’ Club.
They receive SMS alerts with weather forecasts, crop prices and other information tailored to their local area. We estimate this has increased Turkish farmers’ productivity by €100 million.
mHealthThe projected growth in the number of people over 55 years old will lead to an increase in public expenditure on healthcare especially for the treatment of chronic illness. In the European Union, spend on healthcare is projected to jump from 8% of GDP in 2000 to 14% by 20303. Vodafone mHealth Solutions is focused on delivering services that cover remote care services, access to medicine and clinical research, such as our collaboration with Boston Scientific Corporation to develop remote mobile health monitoring products. Further information is contained in “Emerging markets” on page 26.
Enabling sustainable living for allOur products and services make a real difference to people’s lives around the world. This year we developed and launched a new vision that builds on our longstanding commitment to sustainability which will help more people to improve their lives.
Notes:1 UN Food and Agriculture Organization, How to feed the world, 2009.2 Vodafone and Accenture, Connected Agriculture: The role of mobile
in driving efficiency and sustainability in the food and agriculture supply chain, 2011.
3 According to World Bank figures.4 Sourced from IDC.
Our vision is to unleash the power of Vodafone to transform societies and enable sustainable living for all.
Market context: Many of the challenges faced in today’s world demand a change in thinking and behaviour. In various different markets, our customers face pressure from food shortages, ageing populations and economic crises.
Goals: We have a unique opportunity through our services to transform societies and enable sustainable living for all.
Strengths: We have strong foundations and our technology is becoming ubiquitous, giving access to digital communications, and the services that we have developed, to people in many parts of the world.
Actions: This year we developed and launched a new vision that builds on our longstanding commitment to sustainability which will help more people to improve their lives.
Progress: Our Connected Agriculture research report, published in 2011, specifically identifies the opportunities for mobile to address challenges in world food supplies. Our 7.8 million machine-to-machine connections can lead to a dramatic reduction in carbon emissions, whilst improving business efficiency.

Performance
Governance
FinancialsAdditional inform
ationBusiness review
37Vodafone Group Plc Annual Report 2012
ClimateClimate change represents one of the biggest global challenges and remains a key concern of our business and stakeholders. Our machine-to-machine (‘M2M’) services enable reductions in carbon emissions from logistics, manufacturing processes and office energy use, whilst improving business efficiency and increasing quality of services.
In our African operations we are investigating Community Power, which uses excess electricity from our solar-powered mast sites in off-grid rural areas to power community facilities. We envisage Community Power will support local economic and social development by bringing green energy to rural communities.
Smart workingIt is forecast that remote mobile workers will number 1.3 billion by 20154. Creating better ways of working can deliver efficiency and productivity benefits, but there are also sustainability and life enhancing benefits to smart working.
A study which was carried out across Vodafone’s operations in the UK was completed in 2011. The study, which compared figures from financial year 2011 with those of 2007, showed:
aa 45% decline in carbon emissions from travel;
aa 37% drop in CO2-equivalent emissions from building energy use within five years;
aa a saving of 24,000 tonnes of CO2-equivalent emissions every year (this is equal to the average annual CO2 emissions associated with the energy use of 4,000 UK households).
Responsible and ethical wherever we do businessTo transform societies, we need our stakeholders’ trust and co-operation. To earn that trust we must manage the issues that matter to them and behave ethically in everything we do.
Operating responsiblyIn 2012 we signed up to industry principles of the ICT Coalition for a Safer Internet for the development of products and services which help keep children safe online.
In 2011 we joined with seven other telecom operators to collaborate in auditing the working conditions of our common suppliers, as well as requiring all our suppliers to sign up to our Code of Ethical Purchasing.
Environment We have launched an eco-rating for mobile phones in the Netherlands, as part of our commitment to raising standards across our range of devices, and providing information to customers.
We co-chair the Global e-Sustainability Initiative (‘GeSI’) working group to develop long-term solutions for the management of electronic waste within the ICT industry, particularly in emerging markets.
We have modernised our network by installing new, more efficient single Radio Access Network (‘RAN’) technology that operates 2G, 3G and LTE networks. Single RAN units are now present in 24% of our base station sites, saving up to 40% energy compared to traditional RAN units.
Based on better and more complete data this year our energy use increased by 8.2%, with greater consumption by our network being partially offset by network modernisation and energy efficiencies.
This has impacted our CO2 emissions which have risen by 12.1%. In addition, there have been changes to the conversion factors used to calculate CO2 from electricity particularly in Germany, Spain and Italy. This year we sourced 18% of our electricity from renewable sources. This was primarily from purchasing green tariff energy from the grid in mature markets.
In 2012 we opened the Vodafone Site Solution Innovation Centre in South Africa, a joint venture with Vodacom, to develop and field test innovations such as solar foil and hybrid power solutions. Examples of innovations at the Centre include a next-generation hybrid generator, known as a ‘power cube’, that improves efficiency by 40% and significantly lowers installation and operating costs.
Smart meteringIn New Zealand, ASB Bank used smart meters to monitor and modify its energy use, leading to carbon savings of 2,200 tonnes CO2-equivalent (27%) and cumulative cost savings of £1.6 million in the first three years of use.
Note:1 The charts above on energy use and carbon emissions are
calculated using actual or estimated data collected by our mobile operating companies. The data is sourced from invoices, purchasing requisitions, direct data measurement and estimations where required. The 2012 data includes India, Ghana, Qatar and South Africa but excludes all other Vodacom markets. Our joint venture in Italy is included in all years.
1.212010
2011
2012
1.96
2.20
Carbon�dioxide emissions1 Millions of tonnes
Network3,946
Energy use 20121
Retail83
Office425
4,454
GWh
Vodafone sustainability reportOur 12th annual sustainability report, which is assured by Ernst & Young LLP using the International Standard on Assurance Engagements (‘ISAE 3000’) to check adherence to the AA1000 AccountAbility Principles Standard (‘AA1000APS’), is available at www.vodafone.com/sustainability. 16 local markets publish their own sustainability reports.
600,000Subscribers to Vodafone Farmers Club Turkey. Part of the Connected Agriculture programme.
7.8mMachine-to-machine connections can lead to a dramatic reduction in carbon emissions, whilst improving business efficiency.
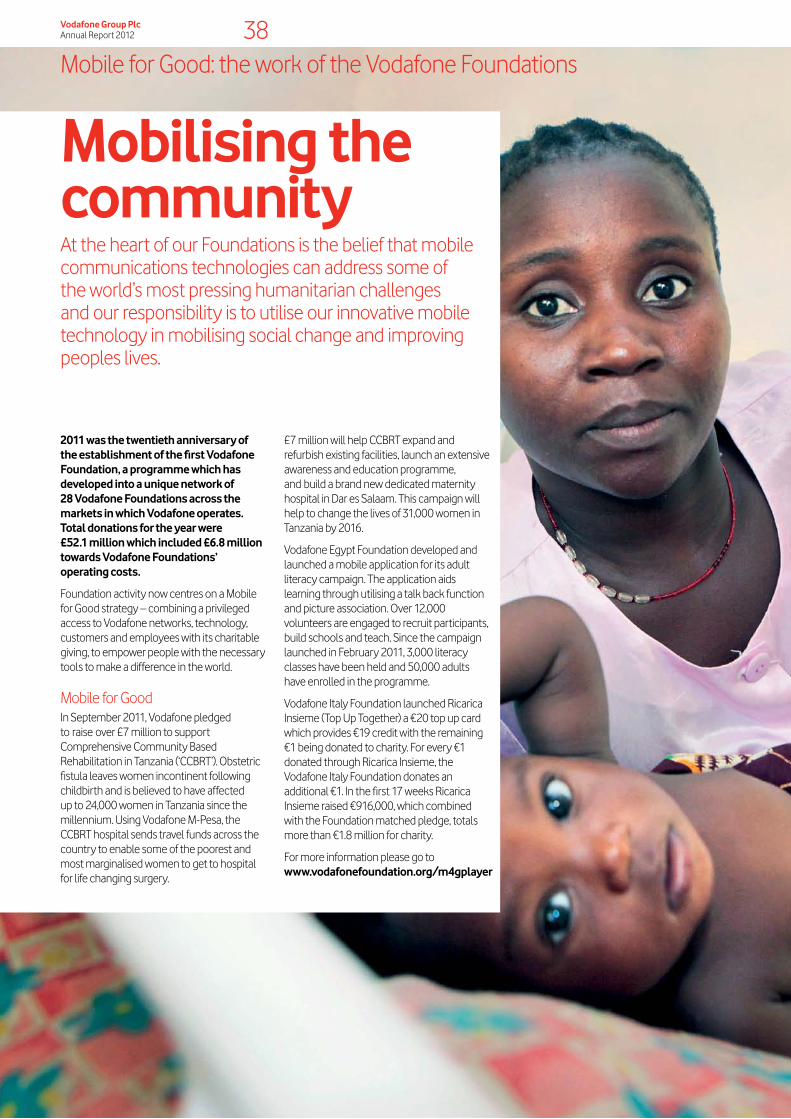
38Vodafone Group Plc Annual Report 2012
Mobile for Good: the work of the Vodafone Foundations
Mobilising the communityAt the heart of our Foundations is the belief that mobile communications technologies can address some of the world’s most pressing humanitarian challenges and our responsibility is to utilise our innovative mobile technology in mobilising social change and improving peoples lives.
2011 was the twentieth anniversary of the establishment of the first Vodafone Foundation, a programme which has developed into a unique network of 28 Vodafone Foundations across the markets in which Vodafone operates. Total donations for the year were £52.1 million which included £6.8 million towards Vodafone Foundations’ operating costs.
Foundation activity now centres on a Mobile for Good strategy – combining a privileged access to Vodafone networks, technology, customers and employees with its charitable giving, to empower people with the necessary tools to make a difference in the world.
Mobile for Good In September 2011, Vodafone pledged to raise over £7 million to support Comprehensive Community Based Rehabilitation in Tanzania (‘CCBRT’). Obstetric fistula leaves women incontinent following childbirth and is believed to have affected up to 24,000 women in Tanzania since the millennium. Using Vodafone M-Pesa, the CCBRT hospital sends travel funds across the country to enable some of the poorest and most marginalised women to get to hospital for life changing surgery.
£7 million will help CCBRT expand and refurbish existing facilities, launch an extensive awareness and education programme, and build a brand new dedicated maternity hospital in Dar es Salaam. This campaign will help to change the lives of 31,000 women in Tanzania by 2016.
Vodafone Egypt Foundation developed and launched a mobile application for its adult literacy campaign. The application aids learning through utilising a talk back function and picture association. Over 12,000 volunteers are engaged to recruit participants, build schools and teach. Since the campaign launched in February 2011, 3,000 literacy classes have been held and 50,000 adults have enrolled in the programme.
Vodafone Italy Foundation launched Ricarica Insieme (Top Up Together) a €20 top up card which provides €19 credit with the remaining €1 being donated to charity. For every €1 donated through Ricarica Insieme, the Vodafone Italy Foundation donates an additional €1. In the first 17 weeks Ricarica Insieme raised €916,000, which combined with the Foundation matched pledge, totals more than €1.8 million for charity.
For more information please go to www.vodafonefoundation.org/m4gplayer
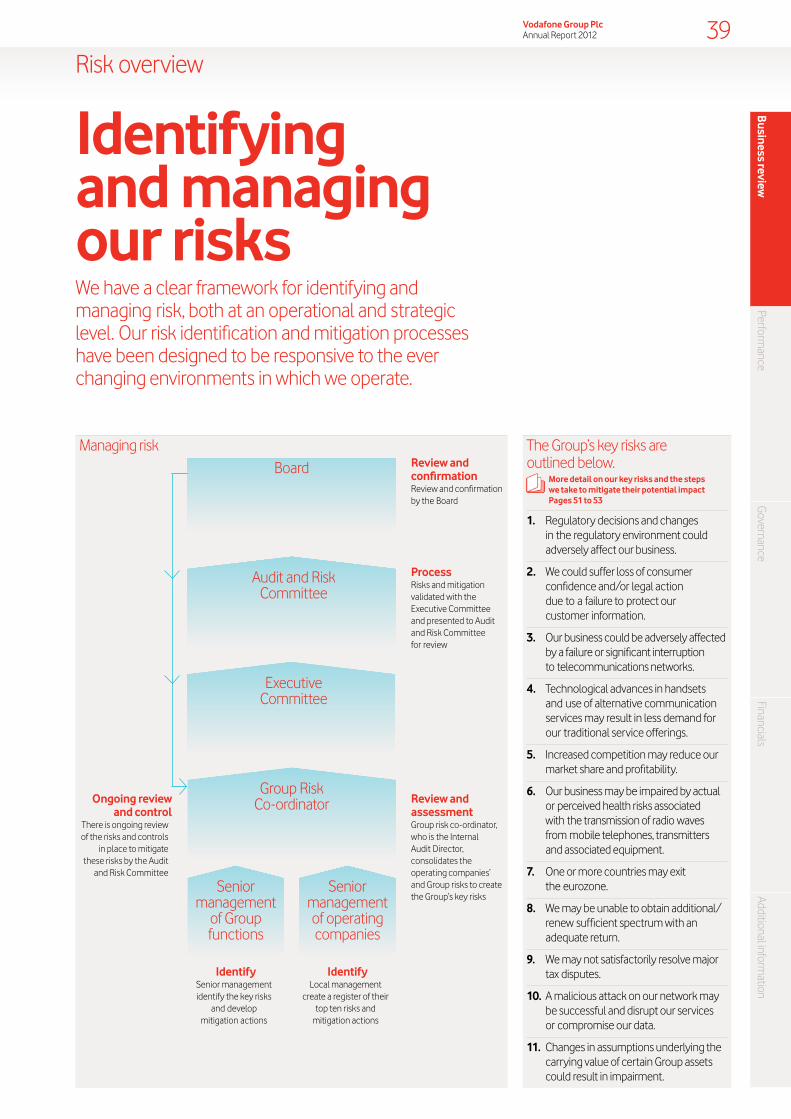
Performance
Governance
FinancialsAdditional inform
ationBusiness review
39Vodafone Group Plc Annual Report 2012
Risk overview
Identifying and managing our risksWe have a clear framework for identifying and managing risk, both at an operational and strategic level. Our risk identification and mitigation processes have been designed to be responsive to the ever changing environments in which we operate.
Managing risk
IdentifySenior management identify the key risks
and develop mitigation actions
IdentifyLocal management
create a register of their top ten risks and
mitigation actions
Review and assessmentGroup risk co-ordinator, who is the Internal Audit Director, consolidates the operating companies’ and Group risks to create the Group’s key risks
ProcessRisks and mitigation validated with the Executive Committee and presented to Audit and Risk Committee for review
Review and confirmationReview and confirmation by the Board
Executive Committee
Senior management
of Group functions
Group Risk Co-ordinator
Board
Audit and Risk Committee
Senior management of operating companies
Ongoing review and control
There is ongoing review of the risks and controls
in place to mitigate these risks by the Audit
and Risk Committee
The Group’s key risks are outlined below. 1. Regulatory decisions and changes
in the regulatory environment could adversely affect our business.
2. We could suffer loss of consumer confidence and/or legal action due to a failure to protect our customer information.
3. Our business could be adversely affected by a failure or significant interruption to telecommunications networks.
4. Technological advances in handsets and use of alternative communication services may result in less demand for our traditional service offerings.
5. Increased competition may reduce our market share and profitability.
6. Our business may be impaired by actual or perceived health risks associated with the transmission of radio waves from mobile telephones, transmitters and associated equipment.
7. One or more countries may exit the eurozone.
8. We may be unable to obtain additional/renew sufficient spectrum with an adequate return.
9. We may not satisfactorily resolve major tax disputes.
10. A malicious attack on our network may be successful and disrupt our services or compromise our data.
11. Changes in assumptions underlying the carrying value of certain Group assets could result in impairment.
More detail on our key risks and the steps we take to mitigate their potential impact Pages 51 to 53
40Vodafone Group Plc Annual Report 2012
Operating results
This section presents our operating performance, providing commentary on how the revenue and the EBITDA performance of the Group and its operating segments within Europe, Africa, Middle East and Asia Pacific, and Non-Controlled Interests and Common Functions have developed in the last three years.
2012 financial year compared to the 2011 financial year
Group1
Europe
£m
Africa, Middle East
and AsiaPacific
£m
Non-Controlled Interests and
Common Functions2
£mEliminations
£m2012
£m2011
£m
% change
£ Organic
Revenue 32,181 13,868 423 (55) 46,417 45,884 1.2 2.2Service revenue 29,914 12,751 272 (52) 42,885 42,738 0.3 1.5EBITDA 10,445 4,115 (85) – 14,475 14,670 (1.3) (0.6) Adjusted operating profit 5,260 1,472 4,800 – 11,532 11,818 (2.4) 2.5 Adjustments for: Impairment loss (4,050) (6,150) Other income/(expense)3 3,705 (72) Operating profit 11,187 5,596 Non-operating (expense)/income4 (162) 3,022Net (financing costs)/investment income (1,476) 880Profit before taxation 9,549 9,498Income tax expense (2,546) (1,628)Profit for the financial year 7,003 7,870
Notes:1 Current year results reflect average foreign exchange rates of £1:€1.16 and £1:US$1.60.2 Common Functions primarily represent the results of the partner markets and the net result of unallocated central Group costs.3 Other income/(expense) for the year ended 31 March 2012 includes a £3,419 million gain on disposal of the Group’s 44% interest in SFR and a £296 million gain on disposal of the Group’s 24.4% interest in Polkomtel.
The year ended 31 March 2011 included £56 million representing the net loss on disposal of certain Alltel investments by Verizon Wireless. This is included within the line item “Share of results in associates” in the consolidated income statement.
4 Non-operating (expense)/income for the year ended 31 March 2011 included £3,019 million profit arising on the sale of the Group’s 3.2% interest in China Mobile Limited.
RevenueGroup revenue was up 1.2% to £46.4 billion, with service revenue of £42.9 billion, an increase of 1.5%* on an organic basis. Our overall performance reflects continued strong demand for data services and further voice penetration growth in emerging markets, offset by regulatory changes, ongoing competitive pressures and challenging macroeconomic conditions in a number of our mature markets. As a result of the leap year, service revenue growth of 2.3%* in Q4 benefited from the additional day by around 1 percentage point.
AMAP service revenue was up by 8.0%*, with a strong performance in India, Qatar, Ghana and Vodacom and a return to growth in Egypt offset by a decline in Australia.
In Europe, service revenue was down by 1.1%* reflecting challenging macroeconomic conditions in Southern Europe partially offset by growth in Germany, the UK, the Netherlands and Turkey.
EBITDA and profit
Group EBITDA was down 1.3% to £14.5 billion, as revenue growth was offset by higher customer investment due to increased smartphone penetration.
Adjusted operating profit was down 2.4% to £11.5 billion, driven by a reduction in our share of profits from associates following the disposal of our 44% interest in SFR in June 2011. Our share of profits of Verizon Wireless grew by 9.3%* to £4.9 billion.
Operating profit increased by 100% to £11.2 billion, primarily due to the gain on disposal of the Group’s 44% interest in SFR and 24.4% interest in Polkomtel, and lower impairment losses compared to the prior year.
An impairment loss of £4.0 billion was recorded in relation to Italy, Spain, Portugal and Greece, primarily driven by lower projected cash flows within business plans and an increase in discount rates, resulting from adverse changes in the economic environment.
Net (financing costs)/investment income2012
£m2011
£m
Investment income 456 1,309Financing costs (1,932) (429)Net (financing costs)/investment income (1,476) 880
Analysed as: Net financing costs before income
from investments (1,642) (852) Potential interest credit/(charges) arising on
settlement of outstanding tax issues1 9 (46) Income from investments 19 83 Foreign exchange2 138 256 Equity put rights and similar arrangements3 – 95 Interest related to the settlement of tax cases – 872 Disposal of SoftBank Mobile Corp. Limited
financial instruments – 472(1,476) 880
Notes:1 Excluding interest credits related to a tax case settlement.2 Comprises foreign exchange rate differences reflected in the income statement in relation to certain
intercompany balances and the foreign exchange rate differences on financial instruments received as consideration on the disposal of Vodafone Japan to SoftBank in April 2006.
3 The year ended 31 March 2011 included foreign exchange rate movements, accretion expense and fair value charges.
Net financing costs before income from investments increased from £852 million to £1,642 million, primarily due to the decision to increase the fixed rate debt mix, which is expected to result in lower interest in future periods, and the subsequent recognition of mark-to-market losses. Income from investments decreased by £64 million as a result of the disposal of the Group’s 3.2% interest in China Mobile Limited and the Group’s interests in SoftBank Mobile Corp. Limited during the 2011 financial year.
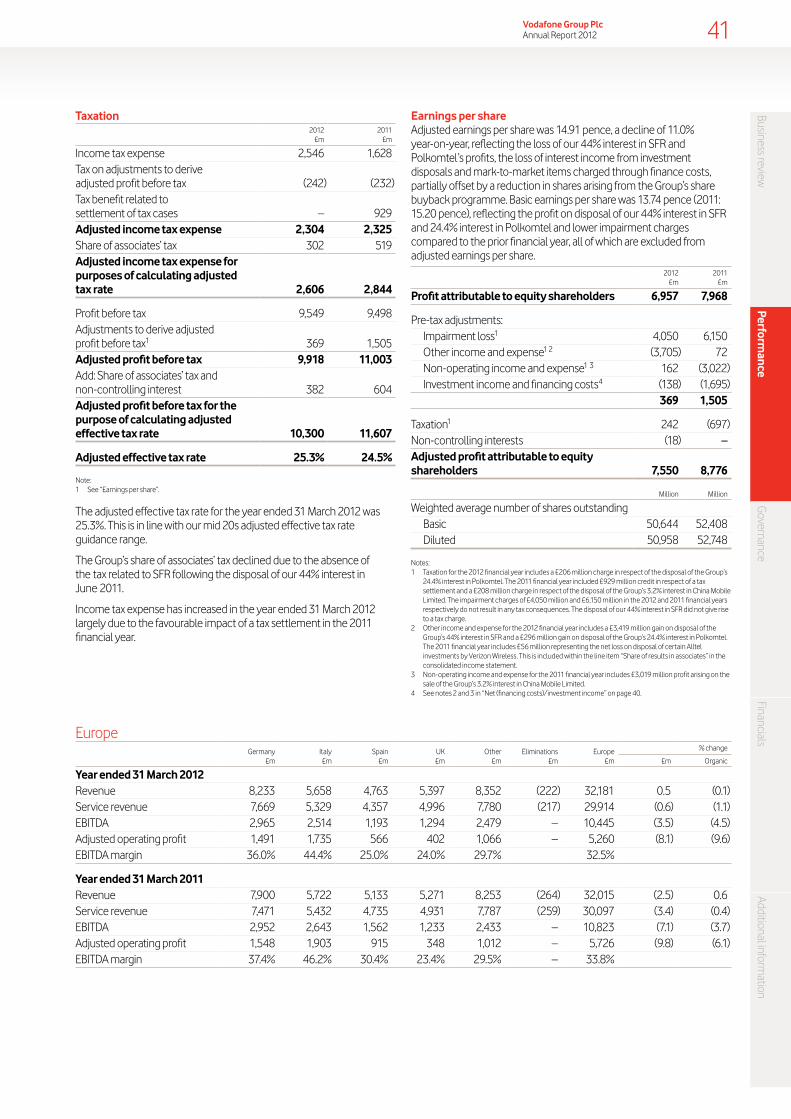
Business reviewPerform
anceG
overnanceFinancials
Additional information
41Vodafone Group Plc Annual Report 2012
Taxation
2012
£m 2011
£m
Income tax expense 2,546 1,628Tax on adjustments to derive adjusted profit before tax (242) (232)Tax benefit related to settlement of tax cases – 929Adjusted income tax expense 2,304 2,325Share of associates’ tax 302 519Adjusted income tax expense for purposes of calculating adjusted tax rate 2,606 2,844
Profit before tax 9,549 9,498Adjustments to derive adjusted profit before tax1 369 1,505Adjusted profit before tax 9,918 11,003Add: Share of associates’ tax and non-controlling interest 382 604Adjusted profit before tax for the purpose of calculating adjusted effective tax rate 10,300 11,607
Adjusted effective tax rate 25.3% 24.5%
Note:1 See “Earnings per share”.
The adjusted effective tax rate for the year ended 31 March 2012 was 25.3%. This is in line with our mid 20s adjusted effective tax rate guidance range.
The Group’s share of associates’ tax declined due to the absence of the tax related to SFR following the disposal of our 44% interest in June 2011.
Income tax expense has increased in the year ended 31 March 2012 largely due to the favourable impact of a tax settlement in the 2011 financial year.
Earnings per share Adjusted earnings per share was 14.91 pence, a decline of 11.0% year-on-year, reflecting the loss of our 44% interest in SFR and Polkomtel’s profits, the loss of interest income from investment disposals and mark-to-market items charged through finance costs, partially offset by a reduction in shares arising from the Group’s share buyback programme. Basic earnings per share was 13.74 pence (2011: 15.20 pence), reflecting the profit on disposal of our 44% interest in SFR and 24.4% interest in Polkomtel and lower impairment charges compared to the prior financial year, all of which are excluded from adjusted earnings per share.
2012 £m
2011 £m
Profit attributable to equity shareholders 6,957 7,968
Pre-tax adjustments: Impairment loss1 4,050 6,150 Other income and expense1 2 (3,705) 72 Non-operating income and expense1 3 162 (3,022) Investment income and financing costs4 (138) (1,695)
369 1,505
Taxation1 242 (697)Non-controlling interests (18) –Adjusted profit attributable to equity shareholders 7,550 8,776
Million Million
Weighted average number of shares outstanding Basic 50,644 52,408 Diluted 50,958 52,748
Notes:1 Taxation for the 2012 financial year includes a £206 million charge in respect of the disposal of the Group’s
24.4% interest in Polkomtel. The 2011 financial year included £929 million credit in respect of a tax settlement and a £208 million charge in respect of the disposal of the Group’s 3.2% interest in China Mobile Limited. The impairment charges of £4,050 million and £6,150 million in the 2012 and 2011 financial years respectively do not result in any tax consequences. The disposal of our 44% interest in SFR did not give rise to a tax charge.
2 Other income and expense for the 2012 financial year includes a £3,419 million gain on disposal of the Group’s 44% interest in SFR and a £296 million gain on disposal of the Group’s 24.4% interest in Polkomtel. The 2011 financial year includes £56 million representing the net loss on disposal of certain Alltel investments by Verizon Wireless. This is included within the line item “Share of results in associates” in the consolidated income statement.
3 Non-operating income and expense for the 2011 financial year includes £3,019 million profit arising on the sale of the Group’s 3.2% interest in China Mobile Limited.
4 See notes 2 and 3 in “Net (financing costs)/investment income” on page 40.
EuropeGermany
£mItaly£m
Spain£m
UK£m
Other£m
Eliminations£m
Europe£m
% change
£m Organic
Year ended 31 March 2012Revenue 8,233 5,658 4,763 5,397 8,352 (222) 32,181 0.5 (0.1)Service revenue 7,669 5,329 4,357 4,996 7,780 (217) 29,914 (0.6) (1.1)EBITDA 2,965 2,514 1,193 1,294 2,479 – 10,445 (3.5) (4.5)Adjusted operating profit 1,491 1,735 566 402 1,066 – 5,260 (8.1) (9.6)EBITDA margin 36.0% 44.4% 25.0% 24.0% 29.7% 32.5%
Year ended 31 March 2011Revenue 7,900 5,722 5,133 5,271 8,253 (264) 32,015 (2.5) 0.6 Service revenue 7,471 5,432 4,735 4,931 7,787 (259) 30,097 (3.4) (0.4)EBITDA 2,952 2,643 1,562 1,233 2,433 – 10,823 (7.1) (3.7)Adjusted operating profit 1,548 1,903 915 348 1,012 – 5,726 (9.8) (6.1)EBITDA margin 37.4% 46.2% 30.4% 23.4% 29.5% – 33.8%

42Vodafone Group Plc Annual Report 2012
Operating results (continued)
Revenue increased by 0.5% including a 0.5 percentage point impact from favourable foreign exchange rate movements. On an organic basis service revenue declined by 1.1%* primarily due to the impact of MTR cuts, competitive pricing pressures and continued economic weakness, partially offset by growth in data revenue. Growth in the UK, Germany, the Netherlands and Turkey was offset by declines in most other markets, in particular, Italy, Spain and Greece.
EBITDA declined by 3.5% including a 1.1 percentage point favourable impact from foreign exchange rate movements. On an organic basis EBITDA decreased by 4.5%*, resulting from higher customer investment due to the increased penetration of smartphones, and a reduction in service revenue in most markets, partially offset by direct cost efficiencies.
Organic change
%
Other activity1
pps
Foreign exchange
pps
Reported change
%
Revenue – Europe (0.1) 0.1 0.5 0.5
Service revenueGermany 1.2 (0.1) 1.6 2.7Italy (3.4) – 1.5 (1.9)Spain (9.4) (0.1) 1.5 (8.0)UK 1.6 (0.3) – 1.3Other Europe 1.7 (0.2) (1.6) (0.1)Europe (1.1) – 0.5 (0.6)
EBITDAGermany (1.1) – 1.5 0.4Italy (6.4) – 1.5 (4.9)Spain (24.9) (0.2) 1.5 (23.6)UK 5.0 (0.1) – 4.9Other Europe 1.7 (0.1) 0.3 1.9Europe (4.5) (0.1) 1.1 (3.5)
Adjusted operating profitGermany (5.3) 0.1 1.5 (3.7)Italy (10.4) – 1.6 (8.8)Spain (39.2) (0.3) 1.4 (38.1)UK 15.7 (0.2) – 15.5Other Europe 3.0 (0.6) 2.9 5.3Europe (9.6) (0.2) 1.7 (8.1)
Note:1 “Other activity” includes the impact of M&A activity and the revision to intra-group roaming charges from
1 October 2012. Refer to “Organic growth” on page 171 for further detail.
GermanyService revenue increased by 1.2%* as strong growth in data and enterprise revenue more than offset the impact of an MTR cut effective from 1 December 2010 and increasing competitive pressures. Data revenue grew by 21.3%* driven by a higher penetration of smartphones, an increase in those sold with a data bundle and the launch of prepaid integrated tariffs. Enterprise revenue grew by 5.6%* driven by significant customer wins and the success of converged service offerings. A number of innovative products were launched during the second half of the 2012 financial year, including OfficeNet, a cloud based solution.
The roll out of LTE has continued, following the launch of services in the prior financial year. Nearly 2,700 base stations had been upgraded to LTE at 31 March 2012, providing approximately 35% household coverage.
EBITDA declined by 1.1%* as the higher revenue was offset by restructuring costs and regulation changes.
ItalyService revenue declined by 3.4%* as a result of weak economic conditions, intense competition and the impact of an MTR cut effective from 1 July 2011. Strong data revenue growth of 16.8%* was driven by mobile internet which benefited from a higher penetration of smartphones and an increase in those sold with a data bundle. From Q3, all new consumer contract customers are now on an integrated tariff. Enterprise revenue grew by 5.1%* with a strong contribution from Vodafone One Net, a converged fixed and mobile solution, and growth in the customer base. Fixed line growth benefited from strong customer additions although slowed in Q4 due to intense competition.
EBITDA decreased by 6.4%*, and EBITDA margin fell by 1.9* percentage points resulting from the decline in service revenue partially offset by operating cost efficiencies such as site sharing agreements and outsourcing of network maintenance to Ericsson.
SpainService revenue declined by 9.4%* impacted by intense competition, continuing economic weakness and high unemployment during the year, which have driven customers to reduce or optimise their spend on tariffs. Data revenue increased by 18.4%* benefiting from the penetration of integrated voice, SMS and data tariffs initially launched in October 2010. Improvements were seen in fixed line revenue which increased by 7.3%* resulting from a competitive proposition leading to good customer additions. Mobile customer net additions were strong as a result of our more competitive tariffs and a focus on improving the retention of higher-value customers.
EBITDA declined by 24.9%*, with a 5.5* percentage point fall in EBITDA margin, primarily due to lower revenue with sustained investment in acquisition and retention costs. This was partially offset by operating cost efficiencies.
UKService revenue increased by 1.6%* driven by an increase in data and consumer contract revenue supported by the success of integrated offerings. This was partially offset by the impact of an MTR cut effective from 1 April 2011 and lower consumer confidence leading to reduced out-of-bundle usage. Data revenue grew by 14.5%* due to higher penetration of smartphones and an increase in those sold with a data bundle.
EBITDA increased by 5.0%* and EBITDA margin improved by 0.6* percentage points, due to a number of cost saving initiatives, including acquisition and retention efficiencies.
Other EuropeService revenue increased by 1.7%* as growth in Albania, Malta, the Netherlands and Turkey more than offset a decline in the rest of the region, particularly in Greece, Portugal and Ireland, which continued to be impacted by the challenging macroeconomic environment and competitive factors. Service revenue in Turkey grew by 25.1%* driven by strong growth in consumer contract and data revenue resulting from an expanding contract customer base and the launch of innovative propositions. In the Netherlands service revenue increased by 2.1%*, driven by an increase in the customer base, partially offset by MTR cuts, price competition and customers optimising tariffs.
EBITDA grew by 1.7%*, with strong growth in Turkey, driven by a combination of service revenue growth and cost efficiencies, partially offset by declines in the majority of the other markets.

Business reviewPerform
anceG
overnanceFinancials
Additional information
43Vodafone Group Plc Annual Report 2012
Africa, Middle East and Asia Pacific
India£m
Vodacom£m
OtherAfrica,
Middle Eastand
Asia Pacific£m
Eliminations£m
Africa, Middle East
and Asia Pacific
£m
% change
£m Organic
Year ended 31 March 2012Revenue 4,265 5,638 3,965 – 13,868 4.2 8.4Service revenue 4,215 4,908 3,628 – 12,751 3.7 8.0EBITDA 1,122 1,930 1,063 – 4,115 2.9 7.8Adjusted operating profit 60 1,084 328 – 1,472 15.7 22.4EBITDA margin 26.3% 34.2% 26.8% 29.7%
Year ended 31 March 2011Revenue 3,855 5,479 3,971 (1) 13,304 20.0 9.5 Service revenue 3,804 4,839 3,650 (1) 12,292 20.0 9.5 EBITDA 985 1,844 1,170 – 3,999 20.7 7.5 Adjusted operating profit 15 827 430 – 1,272 55.5 8.6 EBITDA margin 25.6% 33.7% 29.5% 30.1%
Revenue grew by 4.2% after a 4.2 percentage point adverse impact from foreign exchange rate movements. On an organic basis service revenue grew by 8.0%* driven by customer and data growth, partially offset by the impact of MTR reductions. Growth was driven by strong performances in India, Vodacom, Ghana and Qatar and a return to growth in Egypt, offset by service revenue declines in Australia and New Zealand.
EBITDA grew by 2.9% after a 4.8 percentage point adverse impact from foreign exchange rate movements. On an organic basis, EBITDA grew by 7.8%* driven primarily by strong growth in India and Vodacom and improved contributions from Ghana and Qatar, offset in part by declines in Egypt and Australia.
Organic change
%
Other activity1
pps
Foreign exchange
pps
Reported change
%
Revenue – Africa, Middle East and Asia Pacific 8.4 – (4.2) 4.2
Service revenueIndia 19.5 (0.1) (8.6) 10.8Vodacom 7.1 – (5.7) 1.4Other Africa, Middle East and Asia Pacific (1.8) (0.1) 1.3 (0.6)Africa, Middle East and Asia Pacific 8.0 – (4.3) 3.7
EBITDAIndia 22.9 (0.2) (8.8) 13.9Vodacom 11.3 – (6.6) 4.7Other Africa, Middle East and Asia Pacific (9.1) (0.1) 0.1 (9.1)Africa, Middle East and Asia Pacific 7.8 (0.1) (4.8) 2.9
Adjusted operating profitIndia 389.3 (40.6) (48.7) 300.0Vodacom 41.1 – (10.0) 31.1Other Africa, Middle East and Asia Pacific (22.4) (0.2) (1.1) (23.7)Africa, Middle East and Asia Pacific 22.4 (0.3) (6.4) 15.7
IndiaService revenue grew by 19.5%,* driven by an 11.8% increase in the customer base, strong growth in incoming and outgoing voice minutes and 51.3%* growth in data revenue. 3G services were available to Vodafone customers in 860 towns and cities across 20 circles at 31 March 2012. Growth also benefited from mobile operators starting to charge for SMS termination during the second quarter of the 2012 financial year. At 31 March 2012 the customer base had increased to 150.5 million, with data customers totalling 35.4 million, a year-on-year increase of 81.5%. This was driven by an increase in data enabled handsets and the impact of successful marketing campaigns. Whilst the market remains highly competitive, the effective rate per minute remained broadly stable during the year, with promotional offers offsetting headline price increases.
EBITDA grew by 22.9%* driven by the increase in revenue and economies of scale, partially offset by higher customer acquisition costs and increased interconnection costs. Full year EBITDA margin increased 0.8* percentage points to 26.3%, driven by cost efficiencies and scale benefits.
VodacomService revenue grew by 7.1%,* driven by service revenue growth in South Africa of 4.4%*, where strong net customer additions and growth in data revenue was partially offset by the impact of MTR cuts (effective 1 March 2011 and 1 March 2012). Despite competitive pricing pressures, data revenue in South Africa grew by 24.3%,* driven by higher smartphone penetration and data bundles leading to a 35.4% increase in active data customers to 12.2 million at 31 March 2012.
Vodacom’s mobile operations outside South Africa delivered strong service revenue growth of 31.9%*2, driven by customer net additions and the simplification of tariff structures in Mozambique and Tanzania. M-Pesa, our mobile phone based money transfer service, continues to perform well in Tanzania with over 3.1 million active users.
EBITDA increased by 11.3%* driven by robust service revenue growth and continued focus on operating cost efficiencies. Notes:1 “Other activity” includes the impact of M&A activity and the revision to intra-group roaming charges from
1 October 2012. Refer to “Organic growth” on page 171 for further detail.2 Excludes Gateway and Vodacom Business Africa.

44Vodafone Group Plc Annual Report 2012
Operating results (continued)
Other Africa, Middle East and Asia PacificOrganic service revenue, which now includes Australia, declined by 1.8%* with both New Zealand and Australia being impacted by MTR cuts effective from 6 May 2011 and 1 January 2012, respectively. In Australia, despite improvements in network and customer operations performance, service revenue declined by 8.8%* driven by the competitive market and weakness in brand perception following the network and customer service issues experienced from late 2010 to early 2011 and further accelerated by MTR cuts. On 22 March 2012, Vodafone Hutchison Australia appointed Bill Morrow as its new CEO. In Egypt service revenue was suppressed by the challenging economic and political environment, however, organic growth of 1.4%* was achieved as a result of an increased customer base and strong data usage. In Qatar an increase in the customer base delivered service revenue growth of 27.1%*, despite a competitive pricing environment. Service revenue in Ghana grew by 29.2%* through strong gains in customer market share.
EBITDA margin declined 2.2* percentage points, driven by the service revenue decline in Australia and the challenging economic and competitive environment in Egypt, partially offset by growth in Qatar and Ghana.
Safaricom, Vodafone’s associate in Kenya, grew service revenue by 13.6%*, driven by increases in customer base, voice usage and M-Pesa activity. EBITDA margin improved in the second half of the 2012 financial year through a tariff increase in October, operating cost efficiencies and a strengthening of the local currency to take the margin for the 2012 financial year to 35.0%.
Non-Controlled InterestsVerizon Wireless1 2 3
2012£m
2011 £m
% change
£ Organic
Service revenue 18,039 17,238 4.6 7.3Revenue 20,187 18,711 7.9 10.6EBITDA 7.689 7,313 5.1 7.9Interest (212) (261) (18.8)Tax2 (287) (235) 22.1Group’s share of result in Verizon Wireless 4,867 4,569 6.5 9.3
In the United States Verizon Wireless reported 4.6 million net mobile customer additions bringing its closing mobile customer base to 93.0 million, up 5.2%.
Service revenue growth of 7.3%* continues to be driven by the expanding customer base and robust growth in data ARPU driven by increased penetration of smartphones.
EBITDA margin remained strong despite the competitive challenges and macroeconomic environment. Efficiencies in operating expenses and customer acquisition costs resulting from lower volumes have been partly offset by a higher level of customer retention costs reflecting the increased demand for smartphones.
Verizon Wireless’ net debt at 31 March 2012 totalled US$6.4 billion4 (31 March 2011: net debt US$9.8 billion4), after paying a dividend to its shareholders of US$10 billion on 31 January 2012.Notes:1 All amounts represent the Group’s share based on its 45% equity interest, unless otherwise stated.2 The Group’s share of the tax attributable to Verizon Wireless relates only to the corporate entities held by
the Verizon Wireless partnership and certain state taxes which are levied on the partnership. The tax attributable to the Group’s share of the partnership’s pre-tax profit is included within the Group tax charge.
3 Organic growth rates include the impact of a non-cash revenue adjustment which was recorded to defer previously recognised data revenue that will be earned and recognised in future periods. Excluding this the equivalent organic growth rates for service revenue, revenue, EBITDA and the Group’s share of result in Verizon Wireless would have been 6.8%*, 10.1%*, 6.7%* and 7.5%* respectively.
4 Net debt excludes pending credit card receipts. Comparatives are presented on a comparable basis.

Business reviewPerform
anceG
overnanceFinancials
Additional information
45Vodafone Group Plc Annual Report 2012
2011 financial year compared to the 2010 financial year
Group1
Europe
£m
Africa, Middle East
and AsiaPacific
£m
Non-Controlled Interests and
Common Functions2
£mEliminations
£m2011
£m2010
£m
% change
£ Organic3
Revenue 32,015 13,304 659 (94) 45,884 44,472 3.2 2.8Service revenue 30,097 12,292 412 (63) 42,738 41,719 2.4 2.1EBITDA 10,823 3,999 (152) – 14,670 14,735 (0.4) (0.7) Adjusted operating profit 5,726 1,272 4,820 – 11,818 11,466 3.1 1.8 Adjustments for: Impairment losses (6,150) (2,100) Other (income)/expense4 (72) 114 Operating profit 5,596 9,480 Non-operating income/(expense)5 3,022 (10)Net investment income/(financing costs) 880 (796)Profit before taxation 9,498 8,674Income tax expense (1,628) (56)Profit for the financial year 7,870 8,618
Notes:1 2011 results reflect average exchange rates of £1:€1.18 and £1:US$1.56.2 Common Functions primarily represent the results of the partner markets and the net result of unallocated central Group costs.3 Organic growth includes Vodacom at the 2011 level of ownership but excludes Australia following the merger with Hutchison 3G Australia on 9 June 2009.4 Other income and expense for the year ended 31 March 2011 included £56 million representing the net loss on disposal of certain Alltel investments by Verizon Wireless. This is included within the line item “Share of results in
associates” in the consolidated income statement.5 Non-operating income and expense for the year ended 31 March 2011 includes £3,019 million profit arising on the sale of the Group’s 3.2% interest in China Mobile Limited.
RevenueGroup revenue increased by 3.2% to £45,884 million and Group service revenue increased by 2.4% to £42,738 million. On an organic basis Group service revenue increased by 2.1%*, with a 0.8 percentage point improvement between the first and second half of the 2011 financial year as both Europe and AMAP delivered improved organic service revenue trends.
In Europe service revenue fell by 0.4%* with a decline of 0.3%* in the second half of the 2011 financial year. Both the UK and Germany performed well delivering full year service revenue growth of 4.7%* and 0.8%* respectively. Spain continued to experience economic pressures which intensified competition leading to a 6.9%* decline in service revenue. Service revenue also declined by 2.1%* in Italy driven by a challenging economic and competitive environment combined with the impact of MTR cuts. Our improved commercial offers in Turkey delivered service revenue growth of 28.9%*, despite a 52% cut in MTRs which was effective from 1 April 2010. Challenging economic and competitive conditions continued in our other central European businesses where service revenue growth was also impacted by MTR cuts. European enterprise revenue increased by 0.5%* with improved roaming activity and important customer wins.
In AMAP service revenue grew by 9.5%*. Vodacom continued to perform well, with strong data revenue growth from mobile broadband offsetting weaker voice revenue which was impacted by two MTR cuts during the year. In India service revenue increased by 16.2%*, driven by an increase in the mobile customer base and a more stable pricing environment towards the end of the 2011 financial year. In Qatar the customer base reached 757,000 by 31 March 2011, with 45% of the population actively using Vodafone services less than two years after launch. On an organic basis, service revenue in Egypt declined by 0.8%* where performance was impacted by the socio-political unrest during the fourth quarter of the 2011 financial year.
EBITDA and profitEBITDA decreased by 0.4% to £14,670 million with a 1.1 percentage point decline in both the reported and organic EBITDA margin.
In Europe EBITDA decreased by 3.7%*, with a decline in EBITDA margin of 1.7 percentage points, primarily driven by a reduction in service revenue in most markets and higher investment in acquisition and retention costs, partially offset by operating cost efficiencies.
In AMAP EBITDA increased by 7.5%*, driven primarily by growth in India, together with improvements in Vodacom, Ghana, New Zealand and Qatar, partially offset by a slight decline in Egypt. The EBITDA margin fell 0.6* percentage points, the two main factors behind the decline being higher recurring licence fee costs in India and the change in regional mix from the strong growth in India.
Adjusted operating profit grew by 3.1% as a result of an increase in the Group’s share of results of Verizon Wireless partially offset by the decline in Group EBITDA. The Group’s share of results in Verizon Wireless, the Group’s associate in the United States, increased by 8.5%* primarily due to the expanding customer base, robust data revenue, efficiencies in operating expenses and lower acquisition costs partially offset by higher customer retention costs reflecting the increased demand for smartphones in the United States.
The Group recorded other net income of £5,342 million, primarily in relation to a £2.8 billion net gain on the sale of the Group’s interest in China Mobile Limited, £1.8 billion on the settlement of a tax case and £0.5 billion from the disposal of investment in SoftBank Mobile Corp. Limited.
Operating profit decreased by 41.0% primarily due to higher impairment losses compared to the prior year. Impairment losses totalling £6,150 million were recorded relating to our businesses in Spain (£2,950 million), Italy (£1,050 million), Ireland (£1,000 million), Greece (£800 million) and Portugal (£350 million) primarily resulting from increased discount rates as a result of increases in government bond rates together with lower cash flows within business plans, reflecting weaker country-level macroeconomic environments. The impairment loss in the 2010 financial year was £2,100 million.
Profit for the year decreased by 8.7%.

46Vodafone Group Plc Annual Report 2012
Net investment income/(financing costs)2011
£m2010
£m
Investment income 1,309 716Financing costs (429) (1,512)Net investment income/(financing costs) 880 (796)
Analysed as: Net financing costs before income
from investments (852) (1,024) Potential interest charges arising on settlement
of outstanding tax issues1 (46) (23) Income from investments 83 145 Foreign exchange2 256 (1) Equity put rights and similar arrangements3 95 (94) Interest related to the settlement of tax cases4 872 201 Disposal of SoftBank Mobile Corp. Limited
financial instruments 472 –880 (796)
Notes:1 Excluding interest credits related to a tax case settlement.2 Comprises foreign exchange rate differences reflected in the income statement in relation to certain
intercompany balances and the foreign exchange rate differences on financial instruments received as consideration on the disposal of Vodafone Japan to SoftBank in April 2006.
3 Includes foreign exchange rate movements, accretion expense and fair value charges. 4 The £872 million in the year ended 31 March 2011 relates to the settlement of a tax case and the
£201 million in the year ended 31 March 2010 relates to the settlement of the German tax loss claim.
Net financing costs before income from investments decreased from £1,024 million to £852 million primarily due to a reduction in net debt, partially offset by an increase in average interest rates for debt denominated in US dollars. In addition, £138 million of interest was capitalised compared to £1 million in the prior year. At 31 March 2011 the provision for potential interest charges arising on settlement of outstanding tax issues was £398 million (31 March 2010: £1,312 million), with the reduction primarily reflecting the settlement of a tax case.
Taxation
2011
£m 2010
£m
Income tax expense 1,628 56Tax on adjustments to derive adjusted profit before tax (232) (39)Tax benefit related to settlement of tax cases1 929 2,103Adjusted income tax expense 2,325 2,120Share of associates’ tax 519 572Adjusted income tax expense for purposes of calculating adjusted tax rate 2,844 2,692
Profit before tax 9,498 8,674Adjustments to derive adjusted profit before tax2 1,505 1,890Adjusted profit before tax 11,003 10,564Add: Share of associates’ tax and non-controlling interest 604 652Adjusted profit before tax for the purpose of calculating adjusted effective tax rate 11,607 11,216
Adjusted effective tax rate 24.5% 24.0%
Notes:1 The £929 million in the year ended 31 March 2011 relates to the settlement of a tax case and the
£2,103 million in the year ended 31 March 2010 relates to the settlement of the German tax loss claim.2 See “Earnings per share”.
The adjusted effective tax rate for the year ended 31 March 2011 was 24.5%. This is in line with the adjusted effective tax rate for the year ended 31 March 2010 of 24.0%. Tax on adjustments to derive adjusted profit before tax includes tax payable on the gain on the disposal of the Group’s 3.2% interest in China Mobile Limited.
Income tax expense includes a credit of £929 million arising as a result of the settlement of a tax case in July 2010.
Earnings per share Adjusted earnings per share increased by 4.0% to 16.75 pence for the year ended 31 March 2011 due to growth in adjusted earnings and a reduction in shares arising from the Group’s share buyback programme. Basic earnings per share decreased to 15.2 pence primarily due to the £6,150 million of impairment charges partially offset by a gain on disposal of the Group’s 3.2% interest in China Mobile Limited and the settlement of a tax case.
2011 £m
2010 £m
Profit attributable to equity shareholders 7,968 8,645
Pre-tax adjustments: Impairment loss1 6,150 2,100 Other income and expense2 72 (114) Non-operating income and expense3 (3,022) 10 Investment income and financing costs4 (1,695) (106)
1,505 1,890
Taxation1 (697) (2,064)Adjusted profit attributable to equity shareholders 8,776 8,471
Million Million
Weighted average number of shares outstanding Basic 52,408 52,595 Diluted 52,748 52,849
Notes:1 Taxation for the 2011 financial year included £929 million credit in respect of a tax settlement and a
£208 million charge in respect of the disposal of the Group’s interest in China Mobile Limited. The 2010 financial year included £2,103 million arising from the German tax authorities’ decision that €15 billion of losses booked by a German subsidiary in 2001 were tax deductible. The impairment charges of £6,150 million and £2,100 million in the 2011 and 2010 financial years respectively did not result in any tax consequences.
2 The year ended 31 March 2011 includes £56 million representing the net loss on disposal of certain Alltel investments by Verizon Wireless. This is included within the line item ‘Share of results in associates’ in the consolidated income statement.
3 The year ended 31 March 2011 includes £3,019 million representing the profit arising on the sale of the Group’s 3.2% interest in China Mobile Limited.
4 See notes 2, 3, and 4 in “Net investment income/(financing costs)”.
Operating results (continued)

Business reviewPerform
anceG
overnanceFinancials
Additional information
47Vodafone Group Plc Annual Report 2012
EuropeGermany
£mItaly£m
Spain£m
UK£m
Other£m
Eliminations£m
Europe£m
% change
£m Organic
Year ended 31 March 2011Revenue 7,900 5,722 5,133 5,271 8,253 (264) 32,015 (2.5) 0.6 Service revenue 7,471 5,432 4,735 4,931 7,787 (259) 30,097 (3.4) (0.4)EBITDA 2,952 2,643 1,562 1,233 2,433 – 10,823 (7.1) (3.7)Adjusted operating profit 1,548 1,903 915 348 1,012 – 5,726 (9.8) (6.1)EBITDA margin 37.4% 46.2% 30.4% 23.4% 29.5% 33.8%
Year ended 31 March 2010Revenue 8,008 6,027 5,713 5,025 8,357 (297) 32,833 Service revenue 7,722 5,780 5,298 4,711 7,943 (295) 31,159 EBITDA 3,122 2,843 1,956 1,141 2,582 – 11,644 Adjusted operating profit 1,695 2,107 1,310 155 1,084 – 6,351 EBITDA margin 39.0% 47.2% 34.2% 22.7% 30.9% 35.5%
Revenue declined by 2.5% reflecting a 3.2 percentage point impact from unfavourable foreign exchange rate movements. On an organic basis service revenue declined by 0.4%* reflecting reductions in most markets offset by growth in Germany, the UK, the Netherlands and Turkey. The decline was primarily driven by lower voice revenue resulting from continued market and regulatory pressure on pricing and the challenging economic climate, partially offset by growth in data and fixed line revenue.
EBITDA decreased by 7.1% including a 3.5 percentage point impact from unfavourable exchange rate movements. On an organic basis EBITDA decreased by 3.7%*, with a 1.7 percentage point decline in EBITDA margin resulting from a reduction in service revenue in most markets and higher customer investment, partially offset by operating cost savings.
Organic change
%
M&A activity
pps
Foreign exchange
pps
Reported change
%
Revenue – Europe 0.6 0.1 (3.2) (2.5)
Service revenueGermany 0.8 – (4.1) (3.3)Italy (2.1) – (3.9) (6.0)Spain (6.9) – (3.7) (10.6)UK 4.7 – – 4.7 Other Europe 0.5 0.5 (3.0) (2.0)Europe (0.4) 0.1 (3.1) (3.4)
EBITDAGermany (1.5) – (3.9) (5.4)Italy (3.1) – (3.9) (7.0)Spain (16.8) – (3.3) (20.1)UK 8.0 – – 8.0 Other Europe (2.4) 0.2 (3.6) (5.8)Europe (3.7) 0.1 (3.5) (7.1)
Adjusted operating profitGermany (4.9) – (3.8) (8.7)Italy (5.9) – (3.8) (9.7)Spain (27.3) – (2.9) (30.2)UK 125.1 – – 125.1 Other Europe (2.0) 0.3 (4.9) (6.6)Europe (6.1) 0.1 (3.8) (9.8)
GermanyService revenue increased by 0.8%* driven by strong data and messaging revenue growth. Data revenue grew by 27.9%* as a result of increased penetration of smartphones and Superflat Internet tariffs. Mobile revenue remained stable in the fourth quarter of the 2011
financial year despite an MTR cut effective from 1 December 2010. Enterprise revenue grew by 3.6%* driven by strong customer and data revenue growth.
EBITDA declined by 1.5%*, with a 1.6 percentage point reduction in the EBITDA margin. This decline was driven by increased customer acquisition and retention, contributed to by the launch of the iPhone in the third quarter, partially offset by operating cost efficiencies.
During the 2011 financial year we acquired LTE spectrum in Germany and launched LTE services towards the end of the year, initially targeting rural areas underserved by fixed broadband.
ItalyService revenue declined by 2.1%* primarily driven by the challenging economic and competitive environment, the impact of MTR cuts and customer tariff optimisation. The average contract customer base grew by 12.6% enabling the partial offset of these pressures. Data revenue growth remained strong at 21.5%* driven by the high level of customers migrating to smartphones and taking advantage of data plans. There was continued investment to improve quality and coverage of the network. Fixed line revenue continued to grow with the broadband customer base reaching 1.7 million at 31 March 2011 on a 100% basis.
EBITDA decreased by 3.1%*, with a fall in the EBITDA margin of 1.0 percentage point, as a result of the decline in service revenue and higher investment in acquisition and retention costs partially offset by a reduction in operating expenses.
SpainService revenue declined by 6.9%* impacted by continued intense competition, general economic weakness and the penetration of lower priced tariffs into the customer base. New integrated plans were introduced in the third quarter in response to the demand for combined voice and data tariffs driven by the increase in smartphones. Data revenue grew by 14.8%* driven by mobile broadband and mobile internet. One-off items contributed to a 1.8* percentage point
improvement to service revenue growth for the fourth quarter of the 2011 financial year.
EBITDA declined 16.8%*, with a 3.8 percentage point fall in the EBITDA margin, due to lower service revenue and proportionately higher acquisition and retention costs, partially offset by a reduction in operating expenses.
UKService revenue increased by 4.7%* driven by data revenue growth due to increasing penetration of smartphones and mobile internet bundles and strong net contract customer additions, which more than offset continued competitive pressures and weaker prepaid revenue. The MTR cuts announced in March 2011 were expected to have a significant negative impact on revenue growth during the 2012 financial year.

48Vodafone Group Plc Annual Report 2012
Africa, Middle East and Asia Pacific
India£m
Vodacom£m
Other£m
Eliminations£m
Africa, Middle East
and Asia Pacific
£m
% change
£m Organic1
Year ended 31 March 2011Revenue 3,855 5,479 3,971 (1) 13,304 20.0 9.5 Service revenue 3,804 4,839 3,650 (1) 12,292 20.0 9.5 EBITDA 985 1,844 1,170 – 3,999 20.7 7.5 Adjusted operating profit 15 827 430 – 1,272 55.5 8.6 EBITDA margin 25.6% 33.7% 29.5% 30.1%
Year ended 31 March 2010Revenue 3,114 4,450 3,526 (1) 11,089 Service revenue 3,069 3,954 3,224 (1) 10,246 EBITDA 807 1,528 977 – 3,312 Adjusted operating (loss)/profit (37) 520 335 – 818EBITDA margin 25.9% 34.3% 27.7% 29.9%
Note:1 Organic growth includes Vodacom at the 2011 level of ownership and excludes Australia following the merger with Hutchison 3G Australia on 9 June 2009.
Revenue grew by 20.0% with an 8.5 percentage point benefit from foreign exchange rate movements and the full year impact of the consolidation of Vodacom results from 18 May 2009 partially offset by the impact of the creation of the Vodafone Hutchison Australia (‘VHA’) joint venture on 9 June 2009. On an organic basis service revenue grew by 9.5%* despite the impact of MTR reductions and difficult economic environments. The growth was driven by a strong performance in India and continued growth from Vodacom and the rest of the region, other than Egypt where performance was impacted by the socio-political unrest during the fourth quarter of the 2011 financial year.
EBITDA grew by 20.8% with foreign exchange rate movements contributing 8.0 percentage points of growth. On an organic basis EBITDA grew by 7.5%* driven primarily by growth in India, together with improvements in Vodacom, Ghana, Qatar and New Zealand, partially offset by a decline in Egypt following pricing pressure and socio-political unrest.
Organic change
%
M&A activity
pps
Foreign exchange
pps
Reported change
%
Revenue – Africa, Middle East and Asia Pacific 9.5 2.0 8.5 20.0
Service revenueIndia 16.2 – 7.7 23.9 Vodacom 5.8 6.7 9.9 22.4 Other Africa, Middle East and Asia Pacific 7.2 (0.9) 6.9 13.2Africa, Middle East and Asia Pacific 9.5 2.2 8.3 20.0
EBITDAIndia 15.1 – 7.0 22.1Vodacom 4.9 4.9 10.9 20.7Other Africa, Middle East and Asia Pacific 5.1 10.6 4.1 19.8Africa, Middle East and Asia Pacific 7.5 5.3 8.0 20.8
Adjusted operating profitIndia 134.0 – 6.5 140.5Vodacom 5.7 38.2 15.1 59.0Other Africa, Middle East and Asia Pacific 2.2 29.2 (3.0) 28.4Africa, Middle East and Asia Pacific 8.6 39.9 7.0 55.5
Operating results (continued)
EBITDA increased by 8.0%* with the EBITDA margin increasing by 0.7 percentage points, reflecting higher service revenue partially offset by higher customer acquisition and retention costs.
Other EuropeService revenue increased by 0.5%* with growth in Turkey and the Netherlands being partially offset by declines in other markets due to the challenging economic environment and intense competitive factors. In Turkey service revenue grew by 28.9%* driven by strong
growth in both data and voice revenue, despite a 52% cut in MTRs effective from 1 April 2010. In Greece service revenue declined by 19.4%* with intense competition driving a reduction in prepaid revenue and economic factors leading to customer tariff optimisation.
EBITDA declined by 2.4%*, with declines in all markets except Turkey and the Netherlands, due primarily to lower service revenue and higher acquisition and retention costs partially offset by operating cost efficiencies.
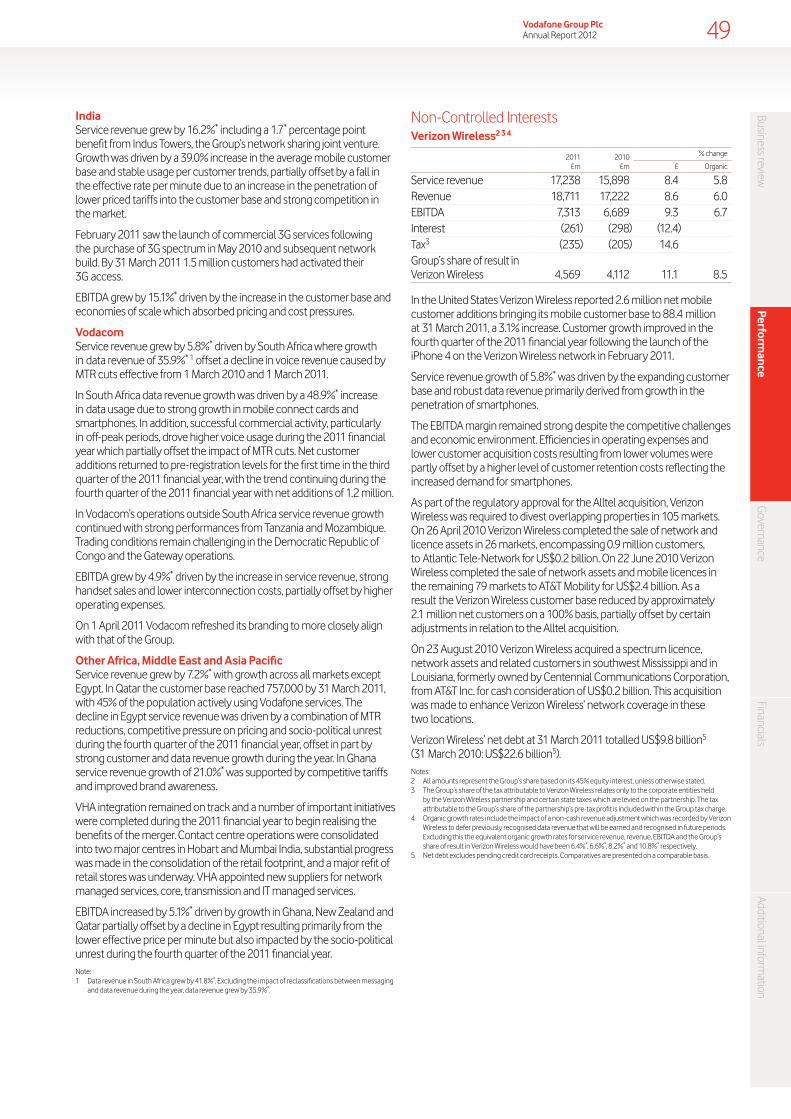
Business reviewPerform
anceG
overnanceFinancials
Additional information
49Vodafone Group Plc Annual Report 2012
IndiaService revenue grew by 16.2%* including a 1.7* percentage point benefit from Indus Towers, the Group’s network sharing joint venture. Growth was driven by a 39.0% increase in the average mobile customer base and stable usage per customer trends, partially offset by a fall in the effective rate per minute due to an increase in the penetration of lower priced tariffs into the customer base and strong competition in the market.
February 2011 saw the launch of commercial 3G services following the purchase of 3G spectrum in May 2010 and subsequent network build. By 31 March 2011 1.5 million customers had activated their 3G access.
EBITDA grew by 15.1%* driven by the increase in the customer base and economies of scale which absorbed pricing and cost pressures.
VodacomService revenue grew by 5.8%* driven by South Africa where growth in data revenue of 35.9%* 1 offset a decline in voice revenue caused by MTR cuts effective from 1 March 2010 and 1 March 2011.
In South Africa data revenue growth was driven by a 48.9%* increase in data usage due to strong growth in mobile connect cards and smartphones. In addition, successful commercial activity, particularly in off-peak periods, drove higher voice usage during the 2011 financial year which partially offset the impact of MTR cuts. Net customer additions returned to pre-registration levels for the first time in the third quarter of the 2011 financial year, with the trend continuing during the fourth quarter of the 2011 financial year with net additions of 1.2 million.
In Vodacom’s operations outside South Africa service revenue growth continued with strong performances from Tanzania and Mozambique. Trading conditions remain challenging in the Democratic Republic of Congo and the Gateway operations.
EBITDA grew by 4.9%* driven by the increase in service revenue, strong handset sales and lower interconnection costs, partially offset by higher operating expenses.
On 1 April 2011 Vodacom refreshed its branding to more closely align with that of the Group.
Other Africa, Middle East and Asia PacificService revenue grew by 7.2%* with growth across all markets except Egypt. In Qatar the customer base reached 757,000 by 31 March 2011, with 45% of the population actively using Vodafone services. The decline in Egypt service revenue was driven by a combination of MTR reductions, competitive pressure on pricing and socio-political unrest during the fourth quarter of the 2011 financial year, offset in part by strong customer and data revenue growth during the year. In Ghana service revenue growth of 21.0%* was supported by competitive tariffs and improved brand awareness.
VHA integration remained on track and a number of important initiatives were completed during the 2011 financial year to begin realising the benefits of the merger. Contact centre operations were consolidated into two major centres in Hobart and Mumbai India, substantial progress was made in the consolidation of the retail footprint, and a major refit of retail stores was underway. VHA appointed new suppliers for network managed services, core, transmission and IT managed services.
EBITDA increased by 5.1%* driven by growth in Ghana, New Zealand and Qatar partially offset by a decline in Egypt resulting primarily from the lower effective price per minute but also impacted by the socio-political unrest during the fourth quarter of the 2011 financial year.Note:1 Data revenue in South Africa grew by 41.8%*. Excluding the impact of reclassifications between messaging
and data revenue during the year, data revenue grew by 35.9%*.
Non-Controlled InterestsVerizon Wireless2 3 4
2011£m
2010 £m
% change
£ Organic
Service revenue 17,238 15,898 8.4 5.8Revenue 18,711 17,222 8.6 6.0EBITDA 7,313 6,689 9.3 6.7Interest (261) (298) (12.4)Tax3 (235) (205) 14.6 Group’s share of result in Verizon Wireless 4,569 4,112 11.1 8.5
In the United States Verizon Wireless reported 2.6 million net mobile customer additions bringing its mobile customer base to 88.4 million at 31 March 2011, a 3.1% increase. Customer growth improved in the fourth quarter of the 2011 financial year following the launch of the iPhone 4 on the Verizon Wireless network in February 2011.
Service revenue growth of 5.8%* was driven by the expanding customer base and robust data revenue primarily derived from growth in the penetration of smartphones.
The EBITDA margin remained strong despite the competitive challenges and economic environment. Efficiencies in operating expenses and lower customer acquisition costs resulting from lower volumes were partly offset by a higher level of customer retention costs reflecting the increased demand for smartphones.
As part of the regulatory approval for the Alltel acquisition, Verizon Wireless was required to divest overlapping properties in 105 markets. On 26 April 2010 Verizon Wireless completed the sale of network and licence assets in 26 markets, encompassing 0.9 million customers, to Atlantic Tele-Network for US$0.2 billion. On 22 June 2010 Verizon Wireless completed the sale of network assets and mobile licences in the remaining 79 markets to AT&T Mobility for US$2.4 billion. As a result the Verizon Wireless customer base reduced by approximately 2.1 million net customers on a 100% basis, partially offset by certain adjustments in relation to the Alltel acquisition.
On 23 August 2010 Verizon Wireless acquired a spectrum licence, network assets and related customers in southwest Mississippi and in Louisiana, formerly owned by Centennial Communications Corporation, from AT&T Inc. for cash consideration of US$0.2 billion. This acquisition was made to enhance Verizon Wireless’ network coverage in these two locations.
Verizon Wireless’ net debt at 31 March 2011 totalled US$9.8 billion5 (31 March 2010: US$22.6 billion5).Notes:2 All amounts represent the Group’s share based on its 45% equity interest, unless otherwise stated.3 The Group’s share of the tax attributable to Verizon Wireless relates only to the corporate entities held
by the Verizon Wireless partnership and certain state taxes which are levied on the partnership. The tax attributable to the Group’s share of the partnership’s pre-tax profit is included within the Group tax charge.
4 Organic growth rates include the impact of a non-cash revenue adjustment which was recorded by Verizon Wireless to defer previously recognised data revenue that will be earned and recognised in future periods. Excluding this the equivalent organic growth rates for service revenue, revenue, EBITDA and the Group’s share of result in Verizon Wireless would have been 6.4%*, 6.6%*, 8.2%* and 10.8%* respectively.
5 Net debt excludes pending credit card receipts. Comparatives are presented on a comparable basis.
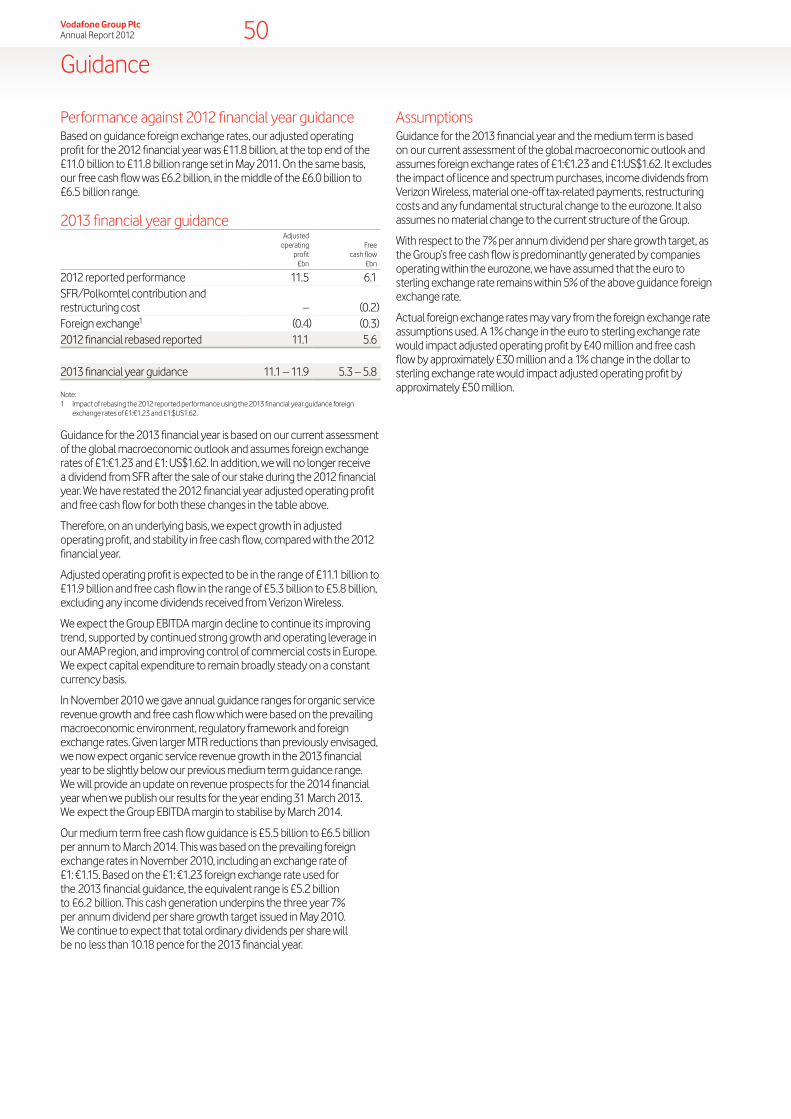
50Vodafone Group Plc Annual Report 2012
Guidance
Performance against 2012 financial year guidanceBased on guidance foreign exchange rates, our adjusted operating profit for the 2012 financial year was £11.8 billion, at the top end of the £11.0 billion to £11.8 billion range set in May 2011. On the same basis, our free cash flow was £6.2 billion, in the middle of the £6.0 billion to £6.5 billion range.
2013 financial year guidance Adjusted
operating profit
£bn
Free cash flow
£bn
2012 reported performance 11.5 6.1SFR/Polkomtel contribution and restructuring cost – (0.2)Foreign exchange1 (0.4) (0.3)2012 financial rebased reported 11.1 5.6
2013 financial year guidance 11.1 – 11.9 5.3 – 5.8
Note:1 Impact of rebasing the 2012 reported performance using the 2013 financial year guidance foreign
exchange rates of £1:€1.23 and £1:$US1.62.
Guidance for the 2013 financial year is based on our current assessment of the global macroeconomic outlook and assumes foreign exchange rates of £1:€1.23 and £1: US$1.62. In addition, we will no longer receive a dividend from SFR after the sale of our stake during the 2012 financial year. We have restated the 2012 financial year adjusted operating profit and free cash flow for both these changes in the table above.
Therefore, on an underlying basis, we expect growth in adjusted operating profit, and stability in free cash flow, compared with the 2012 financial year.
Adjusted operating profit is expected to be in the range of £11.1 billion to £11.9 billion and free cash flow in the range of £5.3 billion to £5.8 billion, excluding any income dividends received from Verizon Wireless.
We expect the Group EBITDA margin decline to continue its improving trend, supported by continued strong growth and operating leverage in our AMAP region, and improving control of commercial costs in Europe. We expect capital expenditure to remain broadly steady on a constant currency basis.
In November 2010 we gave annual guidance ranges for organic service revenue growth and free cash flow which were based on the prevailing macroeconomic environment, regulatory framework and foreign exchange rates. Given larger MTR reductions than previously envisaged, we now expect organic service revenue growth in the 2013 financial year to be slightly below our previous medium term guidance range. We will provide an update on revenue prospects for the 2014 financial year when we publish our results for the year ending 31 March 2013. We expect the Group EBITDA margin to stabilise by March 2014.
Our medium term free cash flow guidance is £5.5 billion to £6.5 billion per annum to March 2014. This was based on the prevailing foreign exchange rates in November 2010, including an exchange rate of £1: €1.15. Based on the £1: €1.23 foreign exchange rate used for the 2013 financial guidance, the equivalent range is £5.2 billion to £6.2 billion. This cash generation underpins the three year 7% per annum dividend per share growth target issued in May 2010. We continue to expect that total ordinary dividends per share will be no less than 10.18 pence for the 2013 financial year.
AssumptionsGuidance for the 2013 financial year and the medium term is based on our current assessment of the global macroeconomic outlook and assumes foreign exchange rates of £1:€1.23 and £1:US$1.62. It excludes the impact of licence and spectrum purchases, income dividends from Verizon Wireless, material one-off tax-related payments, restructuring costs and any fundamental structural change to the eurozone. It also assumes no material change to the current structure of the Group.
With respect to the 7% per annum dividend per share growth target, as the Group’s free cash flow is predominantly generated by companies operating within the eurozone, we have assumed that the euro to sterling exchange rate remains within 5% of the above guidance foreign exchange rate.
Actual foreign exchange rates may vary from the foreign exchange rate assumptions used. A 1% change in the euro to sterling exchange rate would impact adjusted operating profit by £40 million and free cash flow by approximately £30 million and a 1% change in the dollar to sterling exchange rate would impact adjusted operating profit by approximately £50 million.
Business reviewPerform
anceG
overnanceFinancials
Additional information
51Vodafone Group Plc Annual Report 2012
Principal risk factors and uncertainties
1. Regulatory decisions and changes in the regulatory environment could adversely affect our business.
Risk: We have ventures in both emerging and mature markets, spanning a broad geographical area including Europe, Africa, Middle East, Asia Pacific and the United States. We need to comply with an extensive range of requirements that regulate and supervise the licensing, construction and operation of our telecommunications networks and services. Pressure on political and regulatory institutions both to deliver direct consumer benefit and protect consumers interests, particularly in recessionary periods, can lead to adverse impacts on our business. Financial pressures on smaller competitors can drive them to call for regulators to protect them. Increased financial pressures on governments may lead them to target foreign investors for further taxes or licence fees.
Mitigation: We monitor political developments in our existing and potential markets closely, identifying risks in our current and proposed commercial propositions. Regular reports are made to our Executive Committee on current political and regulatory risks. These risks are considered in our business planning process, including the importance of competitive commercial pricing and appropriate product strategies. Authoritative and timely intervention is made at both national and international level in respect of legislative, fiscal and regulatory proposals which we feel are not in the interests of the Group. We have regular dialogue with trade groups that represent network operators and other industry bodies to understand underlying political pressures.
2. We could suffer loss of consumer confidence and/or legal action due to a failure to protect our customer information.
Risk: Mobile networks carry and store large volumes of confidential personal and business voice traffic and data. We host increasing quantities and types of customer data in both enterprise and consumer segments. We need to ensure our service environments are sufficiently secure to protect us from loss or corruption of customer information. Failure to adequately protect customer information could have a material adverse effect on our reputation and may lead to legal action against the Group.
Mitigation: Both the hardware and software applications which hold or transmit confidential personal and business voice and data traffic include security features. Security related reviews are conducted according to our policies and security standards. Security governance and compliance is managed and monitored through software tools that are deployed to all local markets and selected partner markets. Our data centres are managed to international information security standards. Third party data security reviews are conducted jointly with our technology security and corporate security functions.
3. Our business could be adversely affected by a failure or significant interruption to telecommunications networks.
Risk: We are dependent on the continued operation of telecommunications networks. As the importance of mobile communication in everyday life, as well as during times of crisis, increases, organisations and individuals look to us to maintain service. Major failures in the network may result in service being interrupted resulting in serious damage to our reputation and consequential customer and revenue loss.
Mitigation: Specific back-up and resilience requirements are built into our networks. We monitor our ability to replace strategic equipment quickly in event of failure, and for high risk components, we maintain dedicated back-up equipment ready for use. Dedicated access network equipment is installed on trucks ready to be moved on site if required. Network contingency plans are linked with our overall business continuity and crisis management plans. A crisis management team and escalation processes are in place both nationally and internationally, and crisis simulations are conducted annually.
4. Technological advances in handsets and use of alternative communication services may result in less demand for our traditional service offerings.
Risk: Strategic handset and technology suppliers are developing mobile content and services. Advancements in smartphone branding and technology places more focus on devices rather than the underlying services provided by mobile operators. The development of applications which make use of the internet as a substitute for some of our more traditional services, such as messaging and voice, could erode revenue. Reduced demand for our core services of voice, messaging and data and the development of services by handset suppliers could significantly impact our future profitability.
Mitigation: We have developed strategies which strengthen our relationships with customers, including the development of our own branded products, offering a broad selection of handsets and devices from a variety of manufacturers and providing our own alternatives to our more traditional services. We have accelerated the introduction of integrated voice, messaging and data tariffs to minimise customers reducing their out-of-bundle usage through substitution.
5. Increased competition may reduce our market share and profitability.
Risk: We face intensifying competition; in particular competing with established competitors in mature markets and competing with new entrants in emerging markets, where all operators are looking to secure a share of the potential customer base. Competition could lead to a reduction in the rate at which we add new customers, a decrease in the size of our market share and a decline in our average revenue per customer, as customers may choose to receive telecommunications services or other competing services from alternate providers. Competition can also lead to an increase in customer acquisition and retention costs. The focus of competition in many of our markets has shifted from acquiring new customers to retaining existing customers, as the market for mobile telecommunications has become increasingly mature.
Mitigation: We will continue to promote our differentiated propositions by focusing on our points of strength such as network quality, capacity and coverage, quality of customer service and the value of our products and services. We are enhancing distribution channels to get closer to customers and using targeted promotions where appropriate to attract and retain specific customers. We closely monitor and model competitor behaviour, network builds and product offerings to understand future intentions to be able to react in a timely manner.
6. Our business may be impaired by actual or perceived health risks associated with the transmission of radio waves from mobile telephones, transmitters and associated equipment.
Risk: Concerns have been expressed that the electromagnetic signals emitted by mobile telephone handsets and base stations may pose health risks. We are not aware that such health risks have been substantiated, however, in the event of a major scientific finding supporting this view this might result in prohibitive legislation being introduced by governments (or the European Union), a major reduction in mobile phone usage (especially by children), a requirement to move base station sites, significant difficulty renewing or acquiring site leases and/or major litigation. An inadequate response to electromagnetic fields (‘EMF’) issues may result in loss of confidence in the industry and Vodafone.
Mitigation: We have a global health and safety policy that includes standards for radio frequency fields that are mandated in all our operating companies. We have a Group EMF board that manages potential risks through cross sector initiatives and who oversee a coordinated global programme to address and reduce public concern. We have close engagement with EU institutions, in coordination with an international policy team in Brussels, to ensure early warning and advocacy related to possible precautionary legislation. We are engaged with relevant bodies to ensure that the scientific research agenda set by the World Health Organization is fully funded and executed as fast as reasonably possible.

52Vodafone Group Plc Annual Report 2012
Principal risk factors and uncertainties (continued)
7. One or more countries may exit the eurozone.
Risk: In light of recent economic conditions in Europe, there is a possibility of one or more countries exiting the eurozone, causing currency devaluation in those countries and possibly leading to a reduction in our revenue and impairment of our financial and non-financial assets. This may also lead to adverse economic impacts elsewhere.
Mitigation: We are closely monitoring the eurozone situation. Executive Committee briefings have been provided with specific actions identified to reduce the impact of the risk. We have developed a detailed business continuity plan in the event of a country leaving the eurozone, which could lead to a banking system freeze and a need to transition to a “cash based” operating system for a number of months.
Given the significance of the Group’s operations in Europe it was felt appropriate to outline in more detail the risks, and the action taken to reduce these risks, in the annual report, as set out on page 53.
8. We may be unable to obtain additional/renew sufficient spectrum with an adequate return.
Risk: The spectrum we use for the delivery of our services is regulated in each of our markets. The regulators supervise the allocation of frequency spectrum and monitor and enforce regulation and competition laws which apply to the mobile telecommunications industry. Decisions by regulators regarding the granting, amendment or renewal of licences, to us or to third parties, including the implementation of unsustainable cost and revenue models, could adversely affect our future operations in these geographic areas. Our mobile data strategy and roll out of 4G/LTE services is dependent upon us being able to renew and obtain additional spectrum licences.
Mitigation: Local executives and regulatory staff manage negotiations with local regulators on renewal of spectrum licences. In the event of a failure to renew, we could migrate traffic onto other frequencies. To date, all licences have been renewed but it is possible that political or competitor influences may create significant complications or uncertainty in some markets.
9. We may not satisfactorily resolve major tax disputes.
Risk: We operate in many jurisdictions around the world and from time to time have disputes on the amount of tax due. In particular, in spite of a recent positive India Supreme Court decision relating to an ongoing tax case in India, as set out on pages 138 and 139, the Indian government is proposing retroactive tax legislation which would in effect overturn the court’s decision.
Such or similar types of action in other jurisdictions may expose us to significant additional tax liabilities which would affect the results of the business.
Mitigation: We maintain constructive but robust engagement with the tax authorities and relevant government representatives, as well as active engagement with a wide range of international companies and business organisations with similar issues. Where appropriate we engage advisors and legal counsel to obtain opinions on tax legislation and principles.
10. A malicious attack on our network may be successful and disrupt our services or compromise our data.
Risk: There is a risk that an attack by a malicious individual or group could be successful on our networks. This could lead to a loss of confidential customer data or availability of critical systems. Our network is also susceptible to interruption due to a physical attack and theft of our network components as the value and market for network components increases (for example copper, batteries, generators and fuel).
Mitigation: Our critical infrastructure has been designed to prevent unauthorised access and reduce the likelihood and impact of a successful attack. Business continuity and disaster recovery plans are in place to cover residual risk that cannot be mitigated. We also manage the risk using our global security operations centre that provides 24/7 monitoring of our network in many countries.
11. Changes in assumptions underlying the carrying value of certain Group assets could result in impairment.
Risk: Due to the substantial carrying value of goodwill under International Financial Reporting Standards (‘IFRS’), revisions to the assumptions used in assessing its recoverability, including discount rates, estimated future cash flows or anticipated changes in operations, could lead to the impairment of certain Group assets. While impairment does not impact reported cash flows, it does result in a non-cash charge in the consolidated income statement and thus no assurance can be given that any future impairments would not affect our reported distributable reserves and, therefore, our ability to make dividend distributions to our shareholders or repurchase our shares.
Mitigation: We review the carrying value of the Group’s goodwill at least annually, or more frequently where the circumstances require, to assess whether carrying values can be supported by the net present value of future cash flows derived from such assets. This review considers the continued appropriateness of the assumptions used in assessing for impairment, including an assessment of discount rates and long-term growth rates, future technological developments, and the timing and quantum of future capital expenditure. Other factors which may affect revenue and profitability (for example intensifying competition, pricing pressures, regulatory changes and the timing for introducing new products or services) are also considered. Discount rates are in part derived from yields on government bonds, the level of which may change substantially period to period and which may be affected by political, economic and legal developments which are beyond our control. Further details are provided in “Critical accounting estimates” on page 91.

Business reviewPerform
anceG
overnanceFinancials
Additional information
53Vodafone Group Plc Annual Report 2012
Eurozone riskCountry and currency riskRecent conditions in the eurozone have resulted in a higher risk of disruption and business risk from high currency volatility and/or the potential of an exit of one or more countries from the euro.
As part of our response to these conditions we have reviewed our existing processes and policies, and in places, evolved them with the aim of both minimising the Group’s economic exposure and to preserve our ability to operate in a range of potential conditions that may exist in the event of one or more of these future events.
Our ability to manage these risks needs to take appropriate account of our needs to deliver a high quality service to our customers, meet licence obligations and the significant capital investments we may have made and may need to continue to make in the markets most impacted.
Currency related risksWhile our share price is denominated in sterling, the majority of our financial results are generated in other currencies. As a result the Group’s operating profit is sensitive to either a relative strengthening or weakening of the major currencies in which it transacts.
The “Operating results” section of the annual report on pages 40 to 49 sets out a discussion and analysis of the relative contributions of the Group’s Europe and AMAP regions and the major geographical markets in each, to the Group’s service revenue and EBITDA performance. Our markets in Italy, Ireland, Greece, Portugal and Spain have been most directly impacted by the current market conditions and in order of contribution, represent 17% (Italy), 8% (Spain), 3% (Portugal) and 3% (Ireland and Greece combined) of the Group’s EBITDA. An average 3% decline in the sterling equivalent of these combined geographical markets due to currency revaluation would reduce Group EBITDA by £0.1 billion. The Group’s foreign currency earnings are diversified through its 45% equity interest in Verizon Wireless, which operates in the United States and generates its earnings in US dollars. Verizon Wireless, which is equity accounted, contributed 42% of the Group’s adjusted operating profit for the year ended 31 March 2012.
The Group employs a number of mechanisms to manage elements of exchange rate risk at a transaction, translation and economic level. At the transaction level our policies require foreign exchange risks on transactions denominated in other currencies above certain de minimis levels to be hedged. Further, since the Company’s sterling share price represents the value of its future multi-currency cash flows, principally in euro, US dollars and sterling, we aim to align the currency of our debt and interest charges in proportion to our expected future principal multi-currency cash flows, thereby providing an economic hedge in terms of reduced volatility in the sterling equivalent value of the Group and a partial hedge against income statement translation exposure, as interest costs will be denominated in foreign currencies.
In the event of a country’s exit from the eurozone, this may necessitate changes in one or more of our entities’ functional currency and potentially higher volatility of those entities’ trading results when translated into sterling, potentially adding further currency risk.
A summary of this sensitivity of our operating results and our foreign exchange risk management policies is set out within “Financial risk management – Market risk – Foreign exchange management” within note 21 to the consolidated financial statements.
Operational planningWe have worked to develop operational plans to use as a basis for continuity planning across the Group in the event of significant exchange rate volatility and/or the withdrawal of one, or a small number of countries, from the euro. We have categorised “at risk” countries into three categories based on risk profile and identified three broad areas of operational risks for the Group where work has been focused, being:
Financial/investment risk: Our activities are focused on counterparty risk management and in particular the protection and availability of cash deposits and investments. Exposures in relation to liquid Group investments have been reviewed and actions have been taken to reduce counterparty limits with certain financial institutions and to convert a significant proportion of euro denominated holdings and deposits into sterling and US dollar investments. Existing Group policy requires cash sweep arrangements, to ensure no operating company has more than €5 million on deposit on any one day. Further, the Group has had in place for a number of years collateral support agreements with a significant number of its counterparties to pass collateral to the Group under certain circumstances. The Group has a net £980 million of collateral assets in its statement of financial position at 31 March 2012. Further information is provided within “Financial risk management – Credit risk” within note 21 to the consolidated financial statements.
Trading risks: We have investigated the structure of existing procurement contracts and we have started the process of amending certain contractual clauses to place the Group in a better position in the event of the exit of a country from the eurozone.
Business continuity risks: We have identified a number of key business continuity priorities which are focused on planning to allow migration to a more cash-based business model in the event banking systems are frozen, developing dual currency capability in contract customer billing systems or ensuring the ability to move these contract customers to prepaid methods of billing, and the consequential impacts to tariff structures. We have also put in place contingency plans with key suppliers that would assist us to continue to support our network infrastructure, retail operations and employees.
The Group continues to maintain appropriate levels of cash and short-term investments in many currencies and, with a carefully controlled group of counterparties, to minimise the risks to the ongoing access to that liquidity and therefore to the ability of the Group to settle debts as they become due. Further information is provided within “Financial risk management – Liquidity risk” within note 21 to the consolidated financial statements.
Risk of change in carrying amount of assets and liabilitiesThe main potential short-term financial statement impact of the current economic uncertainties is the potential impairment of non-financial and financial assets.
The Group has significant amounts of goodwill, other intangible assets and plant, property and equipment allocated to, or held by, companies operating in the eurozone. We have performed impairment testing for each country in Europe as at 31 March 2012 and identified aggregate impairment charges of £4.0 billion in relation to Vodafone Italy, Spain, Greece and Portugal. Further detail on this exercise together with the sensitivity of the results of this assessment to reasonably possible adverse assumptions is set out in note 10 to the consolidated financial statements.
Our operating companies in Italy, Ireland, Greece, Portugal and Spain have billed and unbilled trade receivables totalling £2.0 billion. IFRS contains specific requirements for impairment assessments of financial assets. We have a range of credit exposures and provisions for doubtful debts that are generally made by reference to consistently applied methodologies overlaid with judgements determined on a case-by-case basis reflecting the specific facts and circumstances of the receivable. Detailed disclosures made in relation to provisions against loans and receivables as well as disclosures about any loans and receivables that are past due at the end of the period, concentrations of risk and credit risk more generally as set out in “Financial risk management – Credit risk” within note 21 to the consolidated financial statements.

54Vodafone Group Plc Annual Report 2012
Consolidated statement of financial position2012 2011
£m £m
Non-current assetsIntangible assets 59,514 68,558Property, plant and equipment 18,655 20,181Investments in associates 35,108 38,105Other non-current assets 6,274 7,373
119,551 134,217Current assets 20,025 17,003Total assets 139,576 151,220
Total equity shareholders’ funds 76,935 87,555Total non-controlling interests 1,267 6Total equity 78,202 87,561
LiabilitiesBorrowings Long-term 28,362 28,375 Short-term 6,258 9,906Taxation liabilities Deferred tax liabilities 6,597 6,486 Current taxation liabilities 2,148 2,262Other non-current liabilities 2,140 1,373Other current liabilities 15,869 15,257Total liabilities 61,374 63,659Total equity and liabilities 139,576 151,220
AssetsIntangible assetsAt 31 March 2012 our intangible assets were £59.5 billion (2011: £68.6 billion) with goodwill comprising the largest element at £38.4 billion (2011: £45.2 billion). The decrease primarily resulted from impairment losses of £3.9 billion, amortisation of £3.5 billion and unfavourable foreign exchange rate movements of £4.2 billion partially offset by £2.9 billion of additions. Refer to note 10 to the consolidated financial statements for further information on the impairment charge.
Property, plant and equipmentProperty, plant and equipment decreased to £18.7 billion at 31 March 2012 from £20.2 billion at 31 March 2011 predominantly as a result of £4.4 billion of depreciation charges and unfavourable foreign exchange rate movements of £1.3 billion partially offset by £4.7 billion of additions.
Investments in associatesInvestments in associates decreased to £35.1 billion at 31 March 2012 from £38.1 billion at 31 March 2011 primarily due to a reduction of £4.0 billion in relation to the sale of our 44% interest in SFR and £4.0 billion of dividends received partially offset by our share of the results of associates, after deductions of interest, tax and non-controlling interest, which contributed £5.0 billion, mainly arising from our investment in Verizon Wireless.
Other non-current assetsOther non-current assets decreased to £6.3 billion at 31 March 2012 (2011: £7.4 billion) mainly due to other investments which totalled £0.8 billion at 31 March 2012 compared to £1.4 billion at 31 March 2011.
Current assetsCurrent assets increased to £20.0 billion at 31 March 2012 from £17.0 billion at 31 March 2011 due to an increase in cash and short-term investments resulting from the element of the proceeds from the disposal of our 44% interest in SFR not yet utilised for the share buyback programme, and an increase in other receivables due to the second tranche of the proceeds from the sale of our interest in SoftBank Mobile Corp. Limited which was received in April 2012.
Total equity and liabilities Total equityTotal equity decreased to £78.2 billion at 31 March 2012 from £87.6 billion at 31 March 2011. The profit for the year of £7.0 billion was more
than offset by equity dividends of £6.7 billion, other comprehensive loss of £4.7 billion, share buyback of £4.7 billion and £1.9 billion in relation to the acquisition of non-controlling interests, primarily in India. Total non-controlling interests have increased by £1.3 billion primarily as a result of the exercise of put options over non-controlling interests during the year.
BorrowingsLong-term borrowings and short-term borrowings decreased to £34.6 billion at 31 March 2012 from £38.3 billion at 31 March 2011 mainly as a result of foreign exchange rate movements, bond repayments during the year and settlement of certain put options held by the Essar Group.
Taxation liabilitiesCurrent tax liabilities decreased to £2.1 billion at 31 March 2012 from £2.3 billion at 31 March 2011 mainly as a result of the resolution and payment of longstanding tax disputes.
Other current liabilitiesOther current liabilities increased to £15.9 billion at 31 March 2012 from £15.3 billion at 31 March 2011. Trade payables at 31 March 2012 were equivalent to 43 days (2011: 37 days) outstanding, calculated by reference to the amount owed to suppliers as a proportion of the amounts invoiced by suppliers during the year. It is our policy to agree terms of transactions, including payment terms, with suppliers and it is our normal practice that payment is made accordingly.
Contractual obligations and contingenciesA summary of our principal contractual financial obligations is shown below. Further details on the items included can be found in the notes to the consolidated financial statements. Details of the Group’s contingent liabilities are included in note 29 to the consolidated financial statements.
Payments due by period £m
Contractual obligations1 Total <1 year 1-3 years 3-5 years >5 years
Borrowings2 42,079 6,266 11,419 10,400 13,994Operating lease commitments3 6,141 1,110 1,633 1,152 2,246Capital commitments3 4 2,018 1,798 195 25 –Purchase commitments 5,138 3,237 1,081 446 374Total 55,376 12,411 14,328 12,023 16,614
Notes:1 The above table of contractual obligations includes commitments in respect of options over interests
in Group businesses held by non-controlling shareholders (see “Option agreements and similar arrangements”) and obligations to pay dividends to non-controlling shareholders (see “Dividends from associates and to non-controlling shareholders”). The table excludes current and deferred tax liabilities and obligations under post employment benefit schemes, details of which are provided in notes 6 and 23 to the consolidated financial statements respectively. The table also excludes the contractual obligations of associates.
2 See note 22 to the consolidated financial statements.3 See note 28 to the consolidated financial statements.4 Primarily related to network infrastructure.
Equity dividendsThe table below sets out the amounts of interim, final and total cash dividends paid or, in the case of the final dividend for the 2012 financial year, proposed, in respect of each financial year.
Pence per ordinary share
Year ended 31 March Interim Final Total
2008 2.49 5.02 7.51 2009 2.57 5.20 7.772010 2.66 5.65 8.312011 2.85 6.05 8.902012 7.051 6.472 13.52
Notes:1 Includes the 4.0 pence special dividend paid in February 2012.2 The final dividend for the year ended 31 March 2012 was proposed on 22 May 2012 and is payable on
1 August 2012 to holders on record as of 8 June 2012. For American depositary share (‘ADS’) holders the dividend will be payable in US dollars under the terms of the ADS depositary agreement. Dividend payments on ordinary shares will be paid by direct credit into a nominated bank or building society account or, alternatively, into the Company’s dividend reinvestment plan.
Financial position and resources

Business reviewPerform
anceG
overnanceFinancials
Additional information
55Vodafone Group Plc Annual Report 2012
We provide returns to shareholders through dividends and have historically paid dividends semi-annually, with a regular interim dividend in respect of the first six months of the financial year payable in February and a final dividend payable in August. The directors expect that we will continue to pay dividends semi-annually.
In November 2011 the directors announced an interim dividend of 3.05 pence per share representing a 7.0% increase over last year’s interim dividend. In addition a special, second interim, dividend of 4.0 pence per share was paid in February 2012 following the receipt of a US$4.5 billion (£2.9 billion) income dividend from Verizon Wireless. The directors are proposing a final dividend of 6.47 pence per share. Total dividends, excluding special dividends, for the year increased by 7.0% to 9.52 pence per share.
In May 2010 the directors issued a dividend per share growth target, excluding special dividends, of at least 7% per annum for each of the financial years in the period ending 31 March 2013, assuming no material adverse foreign exchange rate movements. We expect that total ordinary dividends per share will therefore be no less than 10.18 pence for the 2013 financial year. See page 50 for the assumptions underlying this expectation.
Liquidity and capital resourcesThe major sources of Group liquidity for the 2012 and 2011 financial years were cash generated from operations, dividends from associates, disposal of investments and borrowings through short-term and long-term issuances in the capital markets. We do not use non-consolidated special purpose entities as a source of liquidity or for other financing purposes.
Our key sources of liquidity for the foreseeable future are likely to be cash generated from operations and borrowings through long-term and short-term issuances in the capital markets as well as committed bank facilities.
Our liquidity and working capital may be affected by a material decrease in cash flow due to factors such as reduced operating cash flow resulting from further possible business disposals, increased competition, litigation, timing of tax payments and the resolution of outstanding tax issues, regulatory rulings, delays in the development of new services and networks, licence and spectrum payments, inability to receive expected revenue from the introduction of new services, reduced dividends from associates and investments or increased dividend payments to non-controlling shareholders. Please see the section titled “Principal risk factors and uncertainties” on pages 51 to 53.
We are also party to a number of agreements that may result in a cash outflow in future periods. These agreements are discussed further in “Option agreements and similar arrangements” at the end of this section.
Wherever possible, surplus funds in the Group (except in Albania, Egypt, India, Qatar and Vodacom) are transferred to the centralised treasury department through repayment of borrowings, deposits, investments, share purchases and dividends. These are then loaned internally or contributed as equity to fund our operations, used to retire external debt, invested externally or used to fund shareholder returns.
Cash flowsCash generated by operations decreased by 3.7% to £14.8 billion primarily driven by working capital movements and lower EBITDA.
Free cash flow decreased by 13.4% to £6.1 billion primarily due to increased cash capital expenditure, working capital movements and lower dividends from associates1, offset by lower payments for taxation.
Cash capital expenditure increased by £0.8 billion, driven by a reduction in working capital creditors and increased investment, particularly in Vodacom and Germany.
Payments for taxation decreased by 24.2% to £2.0 billion primarily due to accelerated tax depreciation in the United States and the timing of tax payments in Italy.
Dividends received from associates and investments1 decreased by £0.3 billion due to the loss of dividends resulting from the disposal of the Group’s interest in SFR and China Mobile Limited. Net interest payments were stable at £1.3 billion.
2012 2011£m £m %
EBITDA 14,475 14,670 (1.3)Working capital 206 566Other 143 156Cash generated by operations 14,824 15,392 (3.7)Cash capital expenditure2 (6,423) (5,658)Capital expenditure (6,365) (6,219)Working capital movement in respect of capital expenditure (58) 561
Disposal of property, plant and equipment 117 51Operating free cash flow 8,518 9,785 (12.9)Taxation (1,969) (2,597)Dividends received from associates and investments1 1,171 1,509Dividends paid to non-controlling shareholders in subsidiaries (304) (320)Interest received and paid (1,311) (1,328)Free cash flow 6,105 7,049 (13.4)Tax settlement3 (100) (800)Licence and spectrum payments (1,429) (2,982)Acquisitions and disposals4 4,872 (183)Equity dividends paid (6,643) (4,468)Purchase of treasury shares (3,583) (2,087)Foreign exchange 1,283 709Income dividend from Verizon Wireless 2,855 –Disposal of the Group’s 3.2% interest in China Mobile Limited – 4,269Disposal of the Group’s SoftBank Mobile Corp. Limited interests – 1,409Other5 2,073 542Net debt decrease 5,433 3,458Opening net debt (29,858) (33,316)Closing net debt (24,425) (29,858) (18.2)
Notes:1 Dividends received from associates and investments for the year ended 31 March 2012 includes
£965 million (2011: £1,024 million) tax distribution from our 45% interest in Verizon Wireless and a final dividend of £178 million (2011: £383 million) from SFR prior to the completion of the disposal of our 44% interest. It does not include the £2,855 million income dividend from Verizon Wireless received in January 2012.
2 Cash capital expenditure comprises the purchase of property, plant and equipment and intangible assets, other than licence and spectrum payments, during the year.
3 Related to a tax settlement in the year ended 31 March 2011.4 Acquisitions and disposals for the year ended 31 March 2012 primarily includes £6,805 million proceeds
from the sale of the Group’s 44% interest in SFR, £784 million proceeds from the sale of the Group’s 24.4% interest in Polkomtel and £2,592 million payment in relation to the purchase of non-controlling interests in Vodafone India Limited.
5 Other for the year ended 31 March 2012 primarily includes £2,301 million movement in the written put options in relation to India and the return of a court deposit made in respect of the India tax case (£310 million). Other for the year ended 31 March 2011 primarily includes £356 million in relation to a court deposit made in respect of the India tax case.
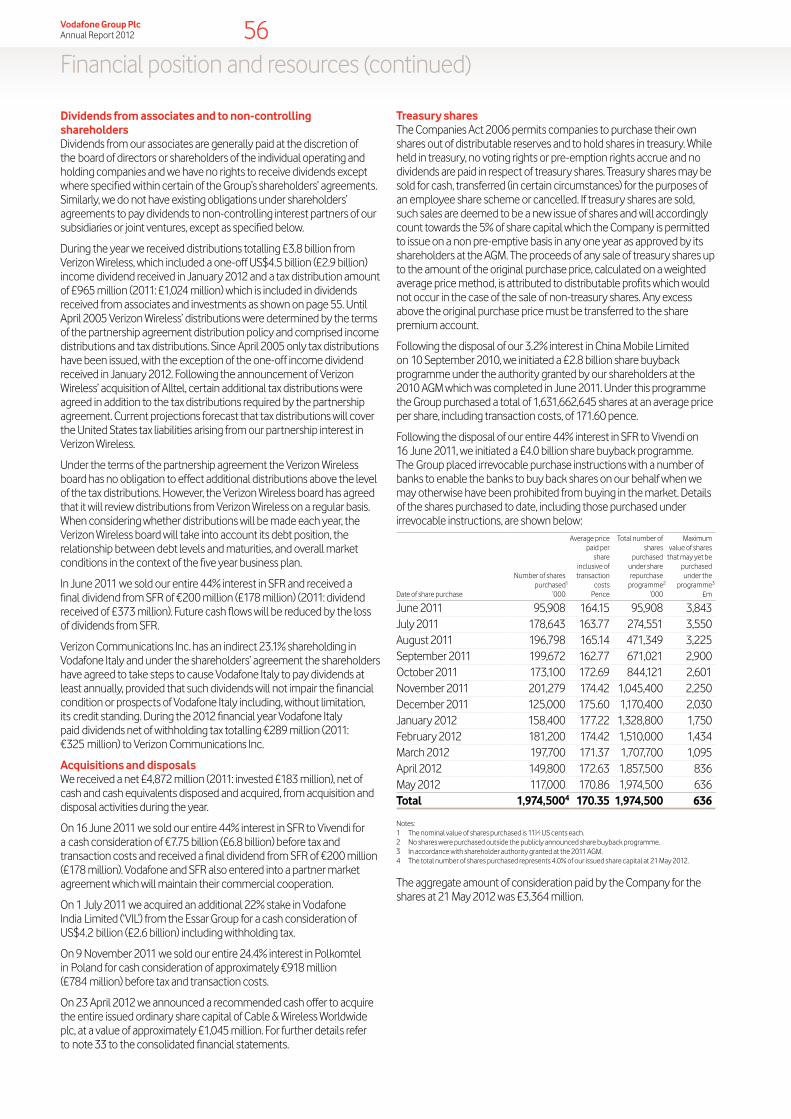
56Vodafone Group Plc Annual Report 2012
Dividends from associates and to non-controlling shareholdersDividends from our associates are generally paid at the discretion of the board of directors or shareholders of the individual operating and holding companies and we have no rights to receive dividends except where specified within certain of the Group’s shareholders’ agreements. Similarly, we do not have existing obligations under shareholders’ agreements to pay dividends to non-controlling interest partners of our subsidiaries or joint ventures, except as specified below.
During the year we received distributions totalling £3.8 billion from Verizon Wireless, which included a one-off US$4.5 billion (£2.9 billion) income dividend received in January 2012 and a tax distribution amount of £965 million (2011: £1,024 million) which is included in dividends received from associates and investments as shown on page 55. Until April 2005 Verizon Wireless’ distributions were determined by the terms of the partnership agreement distribution policy and comprised income distributions and tax distributions. Since April 2005 only tax distributions have been issued, with the exception of the one-off income dividend received in January 2012. Following the announcement of Verizon Wireless’ acquisition of Alltel, certain additional tax distributions were agreed in addition to the tax distributions required by the partnership agreement. Current projections forecast that tax distributions will cover the United States tax liabilities arising from our partnership interest in Verizon Wireless.
Under the terms of the partnership agreement the Verizon Wireless board has no obligation to effect additional distributions above the level of the tax distributions. However, the Verizon Wireless board has agreed that it will review distributions from Verizon Wireless on a regular basis. When considering whether distributions will be made each year, the Verizon Wireless board will take into account its debt position, the relationship between debt levels and maturities, and overall market conditions in the context of the five year business plan.
In June 2011 we sold our entire 44% interest in SFR and received a final dividend from SFR of €200 million (£178 million) (2011: dividend received of £373 million). Future cash flows will be reduced by the loss of dividends from SFR.
Verizon Communications Inc. has an indirect 23.1% shareholding in Vodafone Italy and under the shareholders’ agreement the shareholders have agreed to take steps to cause Vodafone Italy to pay dividends at least annually, provided that such dividends will not impair the financial condition or prospects of Vodafone Italy including, without limitation, its credit standing. During the 2012 financial year Vodafone Italy paid dividends net of withholding tax totalling €289 million (2011: €325 million) to Verizon Communications Inc.
Acquisitions and disposals We received a net £4,872 million (2011: invested £183 million), net of cash and cash equivalents disposed and acquired, from acquisition and disposal activities during the year.
On 16 June 2011 we sold our entire 44% interest in SFR to Vivendi for a cash consideration of €7.75 billion (£6.8 billion) before tax and transaction costs and received a final dividend from SFR of €200 million (£178 million). Vodafone and SFR also entered into a partner market agreement which will maintain their commercial cooperation.
On 1 July 2011 we acquired an additional 22% stake in Vodafone India Limited (‘VIL’) from the Essar Group for a cash consideration of US$4.2 billion (£2.6 billion) including withholding tax.
On 9 November 2011 we sold our entire 24.4% interest in Polkomtel in Poland for cash consideration of approximately €918 million (£784 million) before tax and transaction costs.
On 23 April 2012 we announced a recommended cash offer to acquire the entire issued ordinary share capital of Cable & Wireless Worldwide plc, at a value of approximately £1,045 million. For further details refer to note 33 to the consolidated financial statements.
Treasury sharesThe Companies Act 2006 permits companies to purchase their own shares out of distributable reserves and to hold shares in treasury. While held in treasury, no voting rights or pre-emption rights accrue and no dividends are paid in respect of treasury shares. Treasury shares may be sold for cash, transferred (in certain circumstances) for the purposes of an employee share scheme or cancelled. If treasury shares are sold, such sales are deemed to be a new issue of shares and will accordingly count towards the 5% of share capital which the Company is permitted to issue on a non pre-emptive basis in any one year as approved by its shareholders at the AGM. The proceeds of any sale of treasury shares up to the amount of the original purchase price, calculated on a weighted average price method, is attributed to distributable profits which would not occur in the case of the sale of non-treasury shares. Any excess above the original purchase price must be transferred to the share premium account.
Following the disposal of our 3.2% interest in China Mobile Limited on 10 September 2010, we initiated a £2.8 billion share buyback programme under the authority granted by our shareholders at the 2010 AGM which was completed in June 2011. Under this programme the Group purchased a total of 1,631,662,645 shares at an average price per share, including transaction costs, of 171.60 pence.
Following the disposal of our entire 44% interest in SFR to Vivendi on 16 June 2011, we initiated a £4.0 billion share buyback programme. The Group placed irrevocable purchase instructions with a number of banks to enable the banks to buy back shares on our behalf when we may otherwise have been prohibited from buying in the market. Details of the shares purchased to date, including those purchased under irrevocable instructions, are shown below:
Date of share purchase
Number of sharespurchased1
’000
Average price paid per
share inclusive of transaction
costs Pence
Total number of shares
purchased under share repurchase
programme2
’000
Maximum value of shares
that may yet be purchased under the
programme3
£m
June 2011 95,908 164.15 95,908 3,843July 2011 178,643 163.77 274,551 3,550August 2011 196,798 165.14 471,349 3,225September 2011 199,672 162.77 671,021 2,900October 2011 173,100 172.69 844,121 2,601November 2011 201,279 174.42 1,045,400 2,250December 2011 125,000 175.60 1,170,400 2,030January 2012 158,400 177.22 1,328,800 1,750February 2012 181,200 174.42 1,510,000 1,434March 2012 197,700 171.37 1,707,700 1,095April 2012 149,800 172.63 1,857,500 836May 2012 117,000 170.86 1,974,500 636Total 1,974,5004 170.35 1,974,500 636
Notes:1 The nominal value of shares purchased is 113⁄7 US cents each.2 No shares were purchased outside the publicly announced share buyback programme.3 In accordance with shareholder authority granted at the 2011 AGM.4 The total number of shares purchased represents 4.0% of our issued share capital at 21 May 2012.
The aggregate amount of consideration paid by the Company for the shares at 21 May 2012 was £3,364 million.
Financial position and resources (continued)
Business reviewPerform
anceG
overnanceFinancials
Additional information
57Vodafone Group Plc Annual Report 2012
Shares purchased are held in treasury in accordance with sections 724 to 732 of the Companies Act 2006 and are cancelled in accordance with the Association of British Insurers guidelines. The movement in treasury shares during the year is shown below:
NumberMillion £m
1 April 2011 5,234 8,171Reissue of shares (166) (277)Purchase of shares 2,101 4,671Cancelled shares (3,000) (4,724)31 March 2012 4,169 7,841
Funding We have maintained a robust liquidity position throughout the year thereby enabling us to service shareholder returns, debt and expansion through capital investment. This position has been achieved through continued delivery of strong operating cash flows, cash receipts from investment disposals, issuances of short-term and long-term debt, and non-recourse borrowing assumed in respect of the emerging market businesses. It has not been necessary for us to draw down on our syndicated committed bank facilities during the year.
Net debtOur consolidated net debt position at 31 March was as follows:
2012 2011£m £m
Cash and cash equivalents 7,138 6,252
Short-term borrowings: Bonds (1,289) (2,470) Commercial paper1 (2,272) (1,660) Put options over non-controlling interests – (3,113) Bank loans (1,635) (2,070) Other short-term borrowings2 (1,062) (593)
(6,258) (9,906)
Long-term borrowings: Put options over non-controlling interests (840) (78) Bonds, loans and other long-term borrowings (27,522) (28,297)
(28,362) (28,375)
Other financial instruments3 3,057 2,171Net debt (24,425) (29,858)
Notes:1 At 31 March 2012 US$1,689 million was drawn under the US commercial paper programme, and
€1,226 million and US$309 million were drawn under the euro commercial paper programme.2 At 31 March 2012 the amount includes £980 million (2011: £531 million) in relation to cash received under
collateral support agreements. 3 Comprises i) mark-to-market adjustments on derivative financial instruments which are included as a
component of trade and other receivables (2012: £2,959 million; 2011: £2,045 million) and trade and other payables (2012: £889 million; 2011: £548 million) and ii) short-term investments primarily in index linked government bonds included as a component of other investments (2012: £987 million; 2011: £674 million).
At 31 March 2012 we had £7,138 million of cash and cash equivalents which are held in accordance with our treasury policy.
We hold cash and liquid investments in accordance with the counterparty and settlement risk limits of the Board approved treasury policy. The main forms of liquid investment at 31 March 2012 were money market funds, UK index linked government bonds and bank deposits.
Net debt decreased by £5.4 billion to £24.4 billion primarily due to cash generated by operations, the proceeds from the sale of the Group’s 44% interest in SFR and 24.4% interest in Polkomtel, and the £2.9 billion income dividend from Verizon Wireless, partially offset by share buybacks and dividend payments to equity holders.
Net debt represented 28.6% of our market capitalisation at 31 March 2012 compared to 32.8% at 31 March 2011. Average net debt at month end accounting dates over the 12 month period ended 31 March 2012 was £25.6 billion and ranged between £22.3 billion and £29.6 billion during the year.
The cash received from collateral support agreements mainly reflects the value of our interest rate swap portfolio which is substantially net present value positive. See note 21 to the consolidated financial statements for further details on these agreements.
Commercial paper programmesWe currently have US and euro commercial paper programmes of US$15 billion and £5 billion respectively which are available to be used to meet short-term liquidity requirements. At 31 March 2012 amounts external to the Group of €1,226 million (£1,022 million) and US$309 million (£193 million) were drawn under the euro commercial paper programme and US$1,689 million (£1,056 million) was drawn down under the US commercial paper programme, with such funds being provided by counterparties external to the Group. At 31 March 2011 €1,490 million (£1,317 million) was drawn under the euro commercial paper programme and US$551 million (£343 million) was drawn under the US commercial paper programme. The commercial paper facilities were supported by US$4.2 billion (£2.7 billion) and €4.2 billion (£3.5 billion) of syndicated committed bank facilities (see “Committed facilities”). No amounts had been drawn under either bank facility.
BondsWe have a €30 billion euro medium-term note programme and a US shelf programme which are used to meet medium- to long-term funding requirements. At 31 March 2012 the total amounts in issue under these programmes split by currency were US$13.3 billion, £2.5 billion, €8.9 billion and £0.2 billion sterling equivalent of other currencies.
In the year ended 31 March 2012 bonds with a nominal value equivalent of £0.7 billion at the relevant 31 March 2012 foreign exchange rates were issued under the US shelf and the euro medium-term note programme. The bonds issued during the year were:
Date of bond issue Maturity of bond
Nominalamount
Million
Sterlingequivalent
Million
22 August 2011 22 August 2012 US$100 6520 March 2012 20 March 2017 US$1,000 625
On 11 July 2011 we also raised US$850 million (£543 million) through a US private placement with a maturity of 11 July 2016.
At 31 March 2012 we had bonds outstanding with a nominal value of £18,333 million (2011: £20,987 million).
58Vodafone Group Plc Annual Report 2012
Committed facilitiesThe following table summarises the committed bank facilities available to us at 31 March 2012. Committed bank facilities Amounts drawn
1 July 2010€4.2 billion syndicated revolving credit facility, maturing 1 July 2015
No drawings have been made against this facility. The facility supports our commercial paper programmes and may be used for general corporate purposes including acquisitions.
9 March 2011US$4.2 billion syndicated revolving credit facility, maturing 9 March 2016, US$4.1 billion of this facility has been extended by one year, maturing 9 March 2017
No drawings have been made against this facility. The facility supports our commercial paper programmes and may be used for general corporate purposes including acquisitions.
16 November 2006€0.4 billion loan facility, maturing 14 February 2014
This facility was drawn down in full on 14 February 2007.
28 July 2008€0.4 billion loan facility, maturing 12 August 2015
This facility was drawn down in full on 12 August 2008.
15 September 2009€0.4 billion loan facility, maturing 30 July 2017
This facility was drawn down in full on 30 July 2010.
29 September 2009US$0.7 billion export credit agency loan facility, final maturity date 19 September 2018
This facility is fully drawn down and is amortising.
8 December 2011€0.4 billion loan facility, maturing on the seven year anniversary of the first drawing
This facility is undrawn and has an availability period of 18 months. The facility is available for financing a project to increase the service availability of the UMTS (3G) mobile network in Italy.
20 December 2011€0.3 billion loan facility, maturing on the seven year anniversary of the first drawing
This facility is undrawn and has an availability period of nine months. The facility is available for financing a project to upgrade and expand the mobile telecommunications networks in Turkey and Romania.
Under the terms and conditions of the €4.2 billion and US$4.2 billion syndicated committed bank facilities lenders have the right, but not the obligation, to cancel their commitments and have outstanding advances repaid no sooner than 30 days after notification of a change of control. This is in addition to the rights of lenders to cancel their commitment if we commit an event of default; however, it should be noted that a material adverse change clause does not apply.
The facility agreements provide for certain structural changes that do not affect the obligations to be specifically excluded from the definition of a change of control.
The terms and conditions of the €0.4 billion loan facility maturing on 14 February 2014 are similar to those of the €4.2 billion and US$4.2 billion syndicated committed bank facilities with the addition that, should our Turkish operating company spend less than the equivalent of €0.8 billion on capital expenditure, we will be required to repay the drawn amount of the facility that exceeds 50% of the capital expenditure.
The terms and conditions of the €0.4 billion loan facility maturing 12 August 2015 are similar to those of the €4.2 billion and US$4.2 billion syndicated committed bank facilities with the addition that, should our Italian operating company spend less than the equivalent of €1.5 billion on capital expenditure, we will be required to repay the drawn amount of the facility that exceeds 18% of the capital expenditure.
The loan facility agreed on 15 September 2009 provides €0.4 billion of seven year term finance for the Group’s virtual digital subscriber line (‘VDSL’) project in Germany. The terms and conditions are similar to those of the €4.2 billion and US$4.2 billion syndicated committed bank facilities with the addition that should the Group’s German operating company spend less than the equivalent of €0.8 billion on VDSL related capital expenditure, we will be required to repay the drawn amount of the facility that exceeds 50% of the VDSL capital expenditure.
The Group entered into an export credit agency loan agreement on 29 September 2009 for US$0.7 billion. The terms and conditions of the facility are similar to those of the €4.2 billion and US$4.2 billion syndicated committed bank facilities with the addition that the Company was permitted to draw down under the facility based on the eligible spend with Ericsson up until the final drawdown date of 30 June 2011. Quarterly repayments of the drawn balance commenced on 30 June 2010 with a final maturity date of 19 September 2018.
The terms and conditions of the €0.4 billion loan facility agreed on 8 December 2011 are similar to those of the €4.2 billion and US$4.2 billion syndicated committed bank facilities with the addition that, should our Italian operating company spend less than the equivalent of €1.3 billion on capital expenditure, we will be required to repay the drawn amount of the facility that exceeds 50% of the capital expenditure.
The terms and conditions of the €0.3 billion loan facility agreed on 20 December 2011 are similar to those of the €4.2 billion and US$4.2 billion syndicated committed bank facilities with the addition that, should our Turkish and Romanian operating companies spend less than the equivalent of €1.3 billion on capital expenditure, we will be required to repay the drawn amount of the facility that exceeds 50% of the capital expenditure.
Furthermore, certain of our subsidiaries are funded by external facilities which are non-recourse to any member of the Group other than the borrower due to the level of country risk involved. These facilities may only be used to fund their operations. At 31 March 2012 Vodafone India had facilities of INR 396 billion (£4.9 billion) of which INR 340 billion (£4.2 billion) is drawn. Vodafone Egypt has partly drawn EGP 1.2 billion (£126 million) from a syndicated bank facility of EGP 4.0 billion (£414 million) that matures in March 2014. Vodacom had fully drawn facilities of ZAR 11.2 billion (£912 million), US$94 million (£59 million) and TZS 115 billion (£45 million). Vodafone Americas has a US$1.4 billion (£875 million) US private placement with a maturity of 17 August 2015 as well as a US$850 million (£532 million) US private placement with a maturity of 11 July 2016. Ghana had a facility of US$240 million (£150 million) of which US$203 million (£127 million) was drawn with a final maturity of 15 March 2018.
In aggregate we have committed facilities of approximately £17,304 million, of which £7,865 million was undrawn and £9,439 million was drawn at 31 March 2012.
We believe that we have sufficient funding for our expected working capital requirements for at least the next 12 months. Further details regarding the maturity, currency and interest rates of the Group’s gross borrowings at 31 March 2012 are included in note 22 to the consolidated financial statements.
Financial position and resources (continued)

Business reviewPerform
anceG
overnanceFinancials
Additional information
59Vodafone Group Plc Annual Report 2012
Financial assets and liabilitiesAnalysis of financial assets and liabilities including the maturity profile of debt, currency and interest rate structure are included in notes 18 and 22 to the consolidated financial statements. Details of our treasury management and policies are included within note 21 to the consolidated financial statements.
Option agreements and similar arrangementsPotential cash outflowsIn respect of our interest in the Verizon Wireless partnership, an option granted to Price Communications, Inc. by Verizon Communications Inc. was exercised on 15 August 2006. Under the option agreement Price Communications, Inc. exchanged its preferred limited partnership interest in Verizon Wireless of the East LP for 29.5 million shares of common stock in Verizon Communications Inc. Verizon Communications Inc. has the right, but not the obligation, to contribute the preferred interest to the Verizon Wireless partnership diluting our interest. However, we also have the right to contribute further capital to the Verizon Wireless partnership in order to maintain our percentage partnership interest. Such amount, if contributed, would be US$0.8 billion.
In respect of our interest in Vodafone India Limited (‘VIL’), Piramal Healthcare (‘Piramal’) acquired approximately 11% shareholding in VIL from Essar during the 2012 financial year. The agreements contemplate various exit mechanisms for Piramal including participating in an initial public offering by VIL or, if such initial public offering has not completed by 18 August 2013 or 8 February 2014 respectively or Piramal chooses not to participate in such initial public offering, Piramal selling its shareholding to the Vodafone Group in two tranches of 5.485% for an aggregate price of between approximately INR 70 billion (£0.8 billion) and INR 83 billion (£1.0 billion).
Off-balance sheet arrangementsWe do not have any material off-balance sheet arrangements as defined in item 5.E.2. of the SEC’s Form 20-F. Please refer to notes 28 and 29 to the consolidated financial statements for a discussion of our commitments and contingent liabilities.
Quantitative and qualitative disclosures about market riskA discussion of our financial risk management objectives and policies and the exposure of the Group to liquidity, market and credit risk is included within note 21 to the consolidated financial statements.
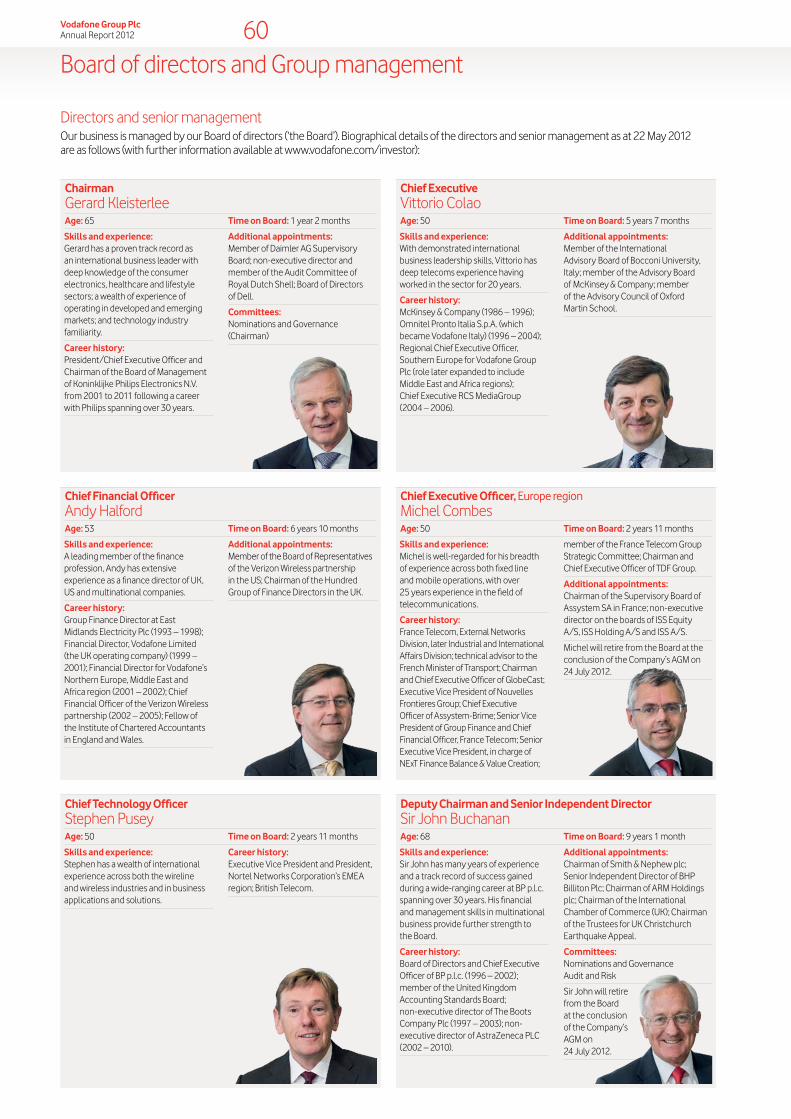
60Vodafone Group Plc Annual Report 2012
Board of directors and Group management
ChairmanGerard KleisterleeAge: 65 Time on Board: 1 year 2 months
Skills and experience: Gerard has a proven track record as an international business leader with deep knowledge of the consumer electronics, healthcare and lifestyle sectors; a wealth of experience of operating in developed and emerging markets; and technology industry familiarity.
Career history: President/Chief Executive Officer and Chairman of the Board of Management of Koninklijke Philips Electronics N.V. from 2001 to 2011 following a career with Philips spanning over 30 years.
Additional appointments: Member of Daimler AG Supervisory Board; non-executive director and member of the Audit Committee of Royal Dutch Shell; Board of Directors of Dell.
Committees: Nominations and Governance (Chairman)
Chief Financial OfficerAndy HalfordAge: 53 Time on Board: 6 years 10 months
Chief Technology OfficerStephen PuseyAge: 50 Time on Board: 2 years 11 months
Skills and experience: A leading member of the finance profession, Andy has extensive experience as a finance director of UK, US and multinational companies.
Career history: Group Finance Director at East Midlands Electricity Plc (1993 – 1998); Financial Director, Vodafone Limited (the UK operating company) (1999 – 2001); Financial Director for Vodafone’s Northern Europe, Middle East and Africa region (2001 – 2002); Chief Financial Officer of the Verizon Wireless partnership (2002 – 2005); Fellow of the Institute of Chartered Accountants in England and Wales.
Additional appointments: Member of the Board of Representatives of the Verizon Wireless partnership in the US; Chairman of the Hundred Group of Finance Directors in the UK.
Skills and experience: Stephen has a wealth of international experience across both the wireline and wireless industries and in business applications and solutions.
Career history: Executive Vice President and President, Nortel Networks Corporation’s EMEA region; British Telecom.
Chief ExecutiveVittorio ColaoAge: 50 Time on Board: 5 years 7 months
Chief Executive Officer, Europe regionMichel CombesAge: 50 Time on Board: 2 years 11 months
Deputy Chairman and Senior Independent DirectorSir John BuchananAge: 68 Time on Board: 9 years 1 month
Skills and experience: With demonstrated international business leadership skills, Vittorio has deep telecoms experience having worked in the sector for 20 years.
Career history: McKinsey & Company (1986 – 1996); Omnitel Pronto Italia S.p.A. (which became Vodafone Italy) (1996 – 2004); Regional Chief Executive Officer, Southern Europe for Vodafone Group Plc (role later expanded to include Middle East and Africa regions); Chief Executive RCS MediaGroup (2004 – 2006).
Additional appointments: Member of the International Advisory Board of Bocconi University, Italy; member of the Advisory Board of McKinsey & Company; member of the Advisory Council of Oxford Martin School.
Skills and experience: Michel is well-regarded for his breadth of experience across both fixed line and mobile operations, with over 25 years experience in the field of telecommunications.
Career history: France Telecom, External Networks Division, later Industrial and International Affairs Division; technical advisor to the French Minister of Transport; Chairman and Chief Executive Officer of GlobeCast; Executive Vice President of Nouvelles Frontieres Group; Chief Executive Officer of Assystem-Brime; Senior Vice President of Group Finance and Chief Financial Officer, France Telecom; Senior Executive Vice President, in charge of NExT Finance Balance & Value Creation;
member of the France Telecom Group Strategic Committee; Chairman and Chief Executive Officer of TDF Group.
Additional appointments: Chairman of the Supervisory Board of Assystem SA in France; non-executive director on the boards of ISS Equity A/S, ISS Holding A/S and ISS A/S.
Michel will retire from the Board at the conclusion of the Company’s AGM on 24 July 2012.
Skills and experience: Sir John has many years of experience and a track record of success gained during a wide-ranging career at BP p.l.c. spanning over 30 years. His financial and management skills in multinational business provide further strength to the Board.
Career history: Board of Directors and Chief Executive Officer of BP p.l.c. (1996 – 2002); member of the United Kingdom Accounting Standards Board; non-executive director of The Boots Company Plc (1997 – 2003); non-executive director of AstraZeneca PLC (2002 – 2010).
Additional appointments: Chairman of Smith & Nephew plc; Senior Independent Director of BHP Billiton Plc; Chairman of ARM Holdings plc; Chairman of the International Chamber of Commerce (UK); Chairman of the Trustees for UK Christchurch Earthquake Appeal.
Committees: Nominations and Governance Audit and Risk
Sir John will retire from the Board at the conclusion of the Company’s AGM on 24 July 2012.
Directors and senior managementOur business is managed by our Board of directors (‘the Board’). Biographical details of the directors and senior management as at 22 May 2012 are as follows (with further information available at www.vodafone.com/investor):
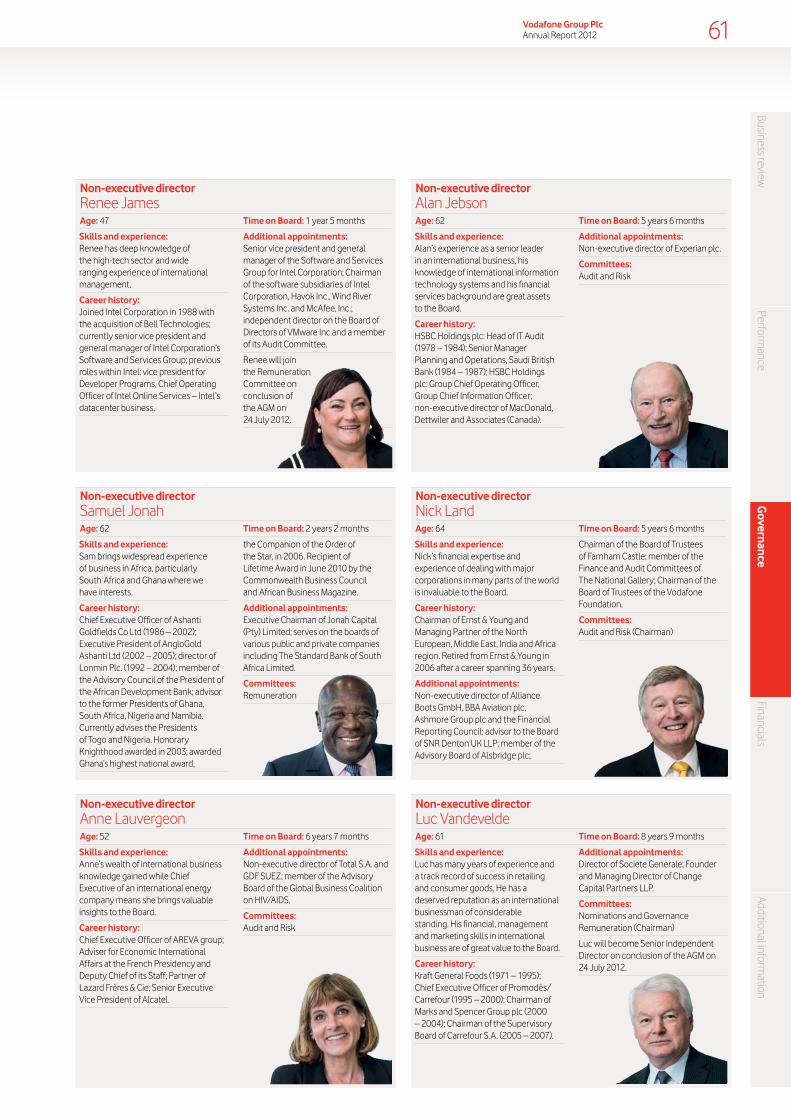
Business reviewPerform
anceG
overnanceFinancials
Additional information
61Vodafone Group Plc Annual Report 2012
Non-executive directorRenee JamesAge: 47 Time on Board: 1 year 5 months
Skills and experience: Renee has deep knowledge of the high-tech sector and wide ranging experience of international management.
Career history: Joined Intel Corporation in 1988 with the acquisition of Bell Technologies; currently senior vice president and general manager of Intel Corporation’s Software and Services Group; previous roles within Intel: vice president for Developer Programs, Chief Operating Officer of Intel Online Services – Intel’s datacenter business.
Additional appointments: Senior vice president and general manager of the Software and Services Group for Intel Corporation; Chairman of the software subsidiaries of Intel Corporation, Havok Inc., Wind River Systems Inc. and McAfee, Inc.; independent director on the Board of Directors of VMware Inc and a member of its Audit Committee.
Renee will join the Remuneration Committee on conclusion of the AGM on 24 July 2012.
Non-executive directorSamuel JonahAge: 62 Time on Board: 2 years 2 months
Non-executive directorAnne LauvergeonAge: 52 Time on Board: 6 years 7 months
Skills and experience: Sam brings widespread experience of business in Africa, particularly South Africa and Ghana where we have interests.
Career history: Chief Executive Officer of Ashanti Goldfields Co Ltd (1986 – 2002); Executive President of AngloGold Ashanti Ltd (2002 – 2005); director of Lonmin Plc. (1992 – 2004); member of the Advisory Council of the President of the African Development Bank; advisor to the former Presidents of Ghana, South Africa, Nigeria and Namibia. Currently advises the Presidents of Togo and Nigeria. Honorary Knighthood awarded in 2003; awarded Ghana’s highest national award,
the Companion of the Order of the Star, in 2006. Recipient of Lifetime Award in June 2010 by the Commonwealth Business Council and African Business Magazine.
Additional appointments: Executive Chairman of Jonah Capital (Pty) Limited; serves on the boards of various public and private companies including The Standard Bank of South Africa Limited.
Committees:Remuneration
Skills and experience: Anne’s wealth of international business knowledge gained while Chief Executive of an international energy company means she brings valuable insights to the Board.
Career history: Chief Executive Officer of AREVA group; Adviser for Economic International Affairs at the French Presidency and Deputy Chief of its Staff; Partner of Lazard Frères & Cie; Senior Executive Vice President of Alcatel.
Additional appointments: Non-executive director of Total S.A. and GDF SUEZ; member of the Advisory Board of the Global Business Coalition on HIV/AIDS.
Committees: Audit and Risk
Non-executive directorAlan JebsonAge: 62 Time on Board: 5 years 6 months
Non-executive directorNick LandAge: 64 Time on Board: 5 years 6 months
Non-executive directorLuc VandeveldeAge: 61 Time on Board: 8 years 9 months
Skills and experience: Alan’s experience as a senior leader in an international business, his knowledge of international information technology systems and his financial services background are great assets to the Board.
Career history: HSBC Holdings plc: Head of IT Audit (1978 – 1984); Senior Manager Planning and Operations, Saudi British Bank (1984 – 1987); HSBC Holdings plc: Group Chief Operating Officer, Group Chief Information Officer; non-executive director of MacDonald, Dettwiler and Associates (Canada).
Additional appointments: Non-executive director of Experian plc.
Committees: Audit and Risk
Skills and experience: Nick’s financial expertise and experience of dealing with major corporations in many parts of the world is invaluable to the Board.
Career history: Chairman of Ernst & Young and Managing Partner of the North European, Middle East, India and Africa region. Retired from Ernst & Young in 2006 after a career spanning 36 years.
Additional appointments: Non-executive director of Alliance Boots GmbH, BBA Aviation plc, Ashmore Group plc and the Financial Reporting Council; advisor to the Board of SNR Denton UK LLP; member of the Advisory Board of Alsbridge plc;
Chairman of the Board of Trustees of Farnham Castle; member of the Finance and Audit Committees of The National Gallery; Chairman of the Board of Trustees of the Vodafone Foundation.
Committees: Audit and Risk (Chairman)
Skills and experience: Luc has many years of experience and a track record of success in retailing and consumer goods. He has a deserved reputation as an international businessman of considerable standing. His financial, management and marketing skills in international business are of great value to the Board.
Career history: Kraft General Foods (1971 – 1995); Chief Executive Officer of Promodès/ Carrefour (1995 – 2000); Chairman of Marks and Spencer Group plc (2000 – 2004); Chairman of the Supervisory Board of Carrefour S.A. (2005 – 2007).
Additional appointments: Director of Societe Generale; Founder and Managing Director of Change Capital Partners LLP.
Committees: Nominations and Governance Remuneration (Chairman)
Luc will become Senior Independent Director on conclusion of the AGM on 24 July 2012.

62Vodafone Group Plc Annual Report 2012
Board of directors and Group management (continued)
Executive CommitteeChaired by Vittorio Colao, this committee focuses on our strategy, financial structure and planning, financial and competitive performance, succession planning, organisational development and Group-wide policies. The Executive Committee membership comprises the executive directors, details of whom are shown on page 60, and the senior managers who are listed below.
Senior management Members of the Executive Committee who are not also executive directors are regarded as senior managers of the Company.
Non-executive directorAnthony Watson cbeAge: 67 Time on Board: 6 years 1 month
Skills and experience: Tony’s depth of experience in the City and in investment and asset management are invaluable to the Board.
Career history: Hermes Pensions Management Ltd: Chief Investment Officer, later Chief Executive. Managing Director of AMP Asset Management plc; Chief International Investment Officer, Citicorp Investment Management; Chairman of the Strategic Investment Board in Northern Ireland; member of the Advisory Board of Norges Bank Investment Management; Chairman of Marks & Spencer Pension Trust and the Asian Infrastructure Fund; member of the Financial Reporting Council. In January 2009, Tony was awarded a CBE for his services to the economic redevelopment of Northern Ireland.
Additional appointments: Senior Independent Director of Hammerson plc and Witan Investment Trust; non-executive director of Lloyds Banking Group plc; member of the Board of the Shareholder Executive.
Committees: Nominations and Governance Remuneration
Tony will step down from the Remuneration Committee and join the Audit and Risk Committee on conclusion of the AGM on 24 July 2012.
Group Strategy and Business Development DirectorWarren FinegoldAge: 55
Time on Executive Committee: 6 years 2 months
Career history: Executive in the Corporate Finance department of Hill Samuel & Co. Limited (1981 – 1985); Executive Director Goldman Sachs International (1985 – 1995) holding positions in New York and London; Managing Director of UBS Investment Bank and most recently head of its Technology team in Europe (1995 – 2006).
Group Chief Commercial OfficerMorten LundalAge: 47
Time on Executive Committee: 3 years 7 months
Career history: Chief Executive Officer at Vodafone for the Africa and Central Europe region; various senior positions with Nordic mobile operator, Telenor (1997 – 2004), including Chief Executive Officer for the Internet Division and Telenor Business Solutions, as well as the position of Executive Vice President for Corporate Strategy; Chief Executive Officer of Telenor’s Malaysian subsidiary, DiGi Telecommunication (2004 – 2008).
Chief Executive Officer: Africa, Middle East and Asia Pacific regionNick ReadAge: 47
Time on Executive Committee: 3 years 7 months
Career history: Various senior roles in Vodafone Limited (the UK operating company), including Chief Financial Officer, Chief Commercial Officer and Chief Executive Officer (2002 – 2008); senior global finance positions with United Business Media plc (1998 – 2002) and Federal Express Worldwide Inc. (1995 – 1998).
Group External Affairs DirectorMatthew KirkAge: 51
Years on Executive Committee: 3 years 3 months
Career history: Group Director of External Relationships, Vodafone Group Plc; member of the British Diplomatic Service for more than 20 years; British Ambassador to Finland (2002 – 2006).
Group General Counsel and Company SecretaryRosemary MartinAge: 52
Time on Executive Committee: 2 years 3 months
Career history: Chief Executive Officer of the Practical Law Group (2008); Reuters Group Plc in various company secretarial and legal roles, with the last five years as Group General Counsel and Company Secretary (1997 – 2008); partner with Mayer, Brown, Rowe & Maw (1990 – 1997).
Group Human Resources DirectorRonald SchellekensAge: 48
Time on Executive Committee: 3 years 5 months
Career history: Executive Vice President Human Resources for Royal Dutch Shell Plc’s global downstream business (2003 – 2008), various international senior human resources roles at PepsiCo (1994 – 2003); human resources roles at AT&T Network Systems in the Netherlands and Poland.
Non-executive directorPhilip YeaAge: 57 Time on Board: 6 years 9 months
Skills and experience: Philip brings to the Board his considerable experience as a leader of public and private businesses (as Chief Financial Officer, Chief Executive Officer and as Chairman) and, as a private equity investor, deploying his financial and strategic skills. He also has experience of business and financial turnarounds.
Career history: Finance Director of Guinness PLC, becoming Finance Director of Diageo plc upon the merger of Guinness and Grand Metropolitan Public Limited Company in 1997 (1993 – 1999); Managing Director at Investcorp (1999 – 2004); Chief Executive at 3i Group plc (2005 – 2009); non-executive directorships of HBOS plc and Manchester United plc.
Additional appointments: Advisor to HRH The Duke of York; member of the Advisory Board to PricewaterhouseCoopers in the UK; member of the Advisory Board of Bridges Ventures LLP; Chairman of the Trustees of the British Heart Foundation; independent director and trustee on the Board of The Francis Crick Institute; Chairman of The Rose Partnership, Executive Search.
Committees: Remuneration
Philip will join the Nominations and Governance Committee on conclusion of the AGM on 24 July 2012.

Business reviewPerform
anceG
overnanceFinancials
Additional information
63Vodafone Group Plc Annual Report 2012
Corporate governance
Compliance with the UK Corporate Governance CodeThroughout the year ended 31 March 2012 and to the date of this document, we complied with the provisions and applied the Main Principles of the UK Corporate Governance Code (the ‘Code’). The Code can be found on the FRC website (www.frc.org.uk). We describe how we have applied those Principles in this annual report, notably, in the following section together with the “Directors’ remuneration” section on pages 74 to 87. The Financial Reporting Council has announced that a revised version of the Code incorporating changes regarding boardroom diversity will be published in 2012, to take effect for financial years beginning on or after 1 October 2012. We are voluntarily reporting on these changes in this annual report (see “Performance evaluation” on page 67 and “Nominations and Governance Committee” on page 68).
Corporate governance statementWe comply with the corporate governance statement requirements pursuant to the FSA’s Disclosure and Transparency Rules by virtue of the information included in this “Corporate governance” section of the annual report together with information contained in the “Shareholder information” section on pages 149 to 156.
Chairman’s overview
“ Strong governance ensures Vodafone conducts its business responsibly, safeguarding our assets while promoting business growth.”
Dear ShareholderSound corporate governance is critical to our business integrity and to maintaining investors’ trust in us. Responsibility for good governance lies with your Board and the directors and I spend quality time at Board and committee meetings and in our discussions with executives to ensure there is a strong and effective governance system in place throughout the Group.
In this section we describe the way corporate governance works in Vodafone. It is embedded both in the way we organise our business, with local boards and audit committees having responsibility for our operations in local markets, overseen by regional governance teams for Europe and for the Africa, Middle East and Asia Pacific region, as well as in the way we expect our people to behave, with every employee required to comply with our Code of Conduct and encouraged to work in the Vodafone Way (see page 34 for more information).
We strive to continuously improve the effectiveness of our Board, our Board committees and our Executive Committee and we undertake annual reviews to assess our performance. The review for the 2012 financial year is described on page 67.
The Nominations and Governance Committee monitors developments in corporate governance to ensure we remain aligned with best practice. In view of the increased focus on diversity in the boardroom, I would like to take this opportunity to set out our approach to this topic. Joining me on your Board are four executive directors and nine non-executive directors representing seven different nationalities reflecting the international nature of our business. Your Board acknowledges the importance of diversity, including gender, to the effective functioning of the Board and commits to supporting diversity in the boardroom. It is our aspiration to have a minimum of 25% female representation on your Board by 2015. We also value diversity of business skills and experience because directors with diverse skills sets, capabilities and experience gained from different geographic and cultural backgrounds enhance your Board by bringing a wide range of perspectives to the business. More information can be found about our boardroom diversity policy under the report of the Nominations and Governance Committee on page 68.
Looking ahead, we will strive to maintain our high standard of corporate governance as it is central to our continuing success. We will continue to balance the use of our time in Board meetings between discussion of strategy, review of financial and operational performance, oversight of risk management and internal controls, ensuring the safeguarding our assets, and keeping Board and executive succession plans refreshed.
Gerard Kleisterlee Chairman
22 May 2012

64Vodafone Group Plc Annual Report 2012
Corporate governance (continued)
The role of the Board is outlined in greater detail below. The Executive and Operating Committees sit below the Board for the management of the business.
The executive directors, together with certain Group functional heads and regional chief executives, meet 11 times a year as the Executive Committee under the chairmanship of the Chief Executive. The Executive Committee is responsible for our competitive and financial performance, reviewing strategy and new business opportunities including major acquisitions and disposals, the management of our capital structure and funding, and key organisational and policy decisions. The members of the Executive Committee and their biographical details are set out on pages 60 to 62 (or at www.vodafone.com/investor).
In April every year a Group level strategy review is conducted with the members of the Executive Committee along with the chief executives of the major operating companies. This review identifies key strategic issues for further investigation, following which the Group strategy is updated for presentation to the Board in September.
Individual operating companies review and update their strategies and present to their respective regional chief executives in the autumn. The agreed strategy is used as a basis for the development of the upcoming budget and three year operating plans. Final reviews of the operating company strategies, budgets and three year plans are held in March.
The Policy and Compliance Committee is a sub-committee of the Executive Committee, appointed to assist the Executive Committee fulfil its accountabilities with regard to policy compliance. Each Group policy is owned by a member of the Executive Committee so that there is clear accountability and authority for ensuring the associated business risk is adequately managed. Local market chief executives and the senior leadership team member responsible for each Group function have primary accountability for ensuring compliance with all Group policies by all our markets and entities. Our Group Compliance team and policy champions support the policy owners and local markets in implementing policies and monitoring compliance.
The Vodafone Code of Conduct, applicable to all employees and those who work for or on behalf of Vodafone, is a unified policy document that sets out the standards of behaviour expected in relation to areas such as insider dealing, bribery and raising concerns through the whistle blowing process (known internally as “Speak Up”).
The Disclosure Committee, appointed by the Chief Executive and Chief Financial Officer to ensure the accuracy of external reporting, reviews and approves controls and procedures concerning the public disclosure of financial and related information.
The role of the BoardThe Board is responsible for the overall conduct of the Group’s business and has powers and duties pursuant to the relevant laws of England and Wales and our articles of association. The Board:
aa is responsible for setting the Group strategy and for the management, direction and performance of our businesses;
aa is accountable to shareholders for the proper conduct of the business;
aa is responsible for the long-term success of the Company, having regard for the interests of all stakeholders; and
aa is responsible for ensuring the effectiveness of and reporting on our system of corporate governance.
The Board has a formal schedule of matters reserved for its decision and these include:
aa Group strategy and long-term plans;
aa major capital projects, acquisitions or divestments;
aa annual budget and operating plan;
aa Group financial structure, including tax and treasury;
aa annual and half-year financial results and shareholder communications; and
aa system of internal control and risk management.
The schedule is reviewed annually. It was last formally reviewed in March 2012 at which time it was determined that no amendments were required.
Other specific responsibilities are delegated to Board committees, details of which are given on pages 68 to 71.
Our governance
Remuneration CommitteeKey objectives: responsibility to the Board for the assessment and recommendation of policy on executive remuneration and packages for the individual executive directors
Audit and Risk CommitteeKey objectives: to provide effective financial governance over the appropriateness of the Group’s financial results, the performance of the internal audit function the external auditor, and the management of the Group’s systems of internal control, business risks and related compliance activities
Nominations and Governance CommitteeKey objectives: to ensure the Board comprises individuals with the requisite skills, knowledge and experience to ensure that it is effective in discharging its responsibilities
Executive CommitteeKey objectives: to focus on the Group’s strategy, financial structure and planning, financial and competitive performance, succession planning, organisational development and Group-wide policies; to review the Group’s financial and competitive performance
Operating CommitteeKey objectives: responsible for operational decisions, such as for key marketing and technology initiatives
Chief ExecutiveKey objectives: responsible for the management of the business and implementation of Board strategy and policy
ChairmanKey objectives: the leadership, operation and governance of the Board, ensuring effectiveness, and setting the agenda for the Board
More detail: Page 68
More detail: Page 69
More detail: Page 71
The Board of Vodafone Group PlcKey objectives: responsible for the overall conduct of the Group’s business and setting the Group’s strategy

Business reviewPerform
anceG
overnanceFinancials
Additional information
65Vodafone Group Plc Annual Report 2012
Key roles and responsibilities
Biographical details of the Chairman, Chief Executive, Senior Independent Director and Company Secretary can be found on pages 60 to 62 or at www.vodafone.com/board. The appointment or removal of the Company Secretary is a matter for the Board as a whole.
The ChairmanGerard KleisterleeThe role of the Chairman is set out in writing and agreed by the Board. He is responsible for:
aa the effective operation, leadership and governance of the Board;
aa ensuring effectiveness of the Board;
aa setting the agenda, style and tone of Board discussions; and
aa ensuring the directors receive accurate, timely and clear information.
The Deputy Chairman and Senior Independent DirectorSir John BuchananThe Senior Independent Director is responsible for:
aa acting as a sounding board for the Chairman;
aa serving as an intermediary for the other directors;
aa being available to shareholders if they have concerns which they have not been able to resolve through the normal channels of the Chairman, Chief Executive or other executive directors or for which such contact is inappropriate; and
aa conducting an annual review of the performance of the Chairman and, in the event it should be necessary, convening a meeting of the non-executive directors.
The Chief ExecutiveVittorio ColaoThe role of the Chief Executive is set out in writing and agreed by the Board. He is responsible for:
aa management of the Group’s business;
aa implementation of the Company’s strategy and policies; and
aa maintaining a close working relationship with the Chairman.
The Company SecretaryRosemary MartinThe Company Secretary acts as Secretary to the Board. In addition, she:
aa assists the Chairman in ensuring that all directors have full and timely access to all relevant information;
aa assists the Chairman by organising induction and training programmes;
aa is responsible for ensuring that the correct Board procedures are followed and advises the Board on corporate governance matters; and
aa administers the procedure under which directors can, where appropriate, obtain independent professional advice at the Company’s expense.
How the Board operatesBoard balance and independenceOur Board consists of 14 directors, all of whom served throughout the year. At 31 March 2012, in addition to the Chairman, Gerard Kleisterlee, there were four executive directors and nine non-executive directors. Sir John Bond was a member of the Board until his retirement at the AGM on 26 July 2011.
Balance of non-executive and executive directors
Non-executive directors:64%
Chairman:7%
Executive directors:29%
The executive and non-executive directors are equal members of the Board and have collective responsibility for the Company’s direction. In particular, non-executive directors are responsible for:
aa bringing a wide range of skills and experience, including independent judgement on issues of strategy, performance, and risk management;
aa constructively challenging the strategy proposed by the Chief Executive and executive directors;
aa scrutinising and challenging performance across the Group’s business;
aa assessing risk and the integrity of the financial information and controls; and
aa determining the Company’s broad policy for executive remuneration, and the remuneration packages for the executive directors and the Chairman.
We consider all of our non-executive directors to be independent. The Board is aware of the other commitments of its directors and is satisfied that these do not conflict with their duties as directors of the Company. Changes to the commitments of all the directors are reported to the Board. The directors are required to complete a conflicts questionnaire initially on appointment and annually thereafter. In the event of a potential conflict being identified, details of that conflict would be submitted to the Board (excluding the director to whom the potential conflict related) for consideration and, as appropriate, authorisation in accordance with the Companies Act 2006 and the articles of association. Where an authorisation is granted, it would be recorded in a register of potential conflicts and reviewed periodically. On an ongoing basis directors are responsible for notifying the Company Secretary if they become aware of actual or potential conflict situations or a change in circumstances relating to an existing authorisation. No conflicts of interest have been identified during the financial year. Copies of the service contracts of the directors and terms and conditions of appointment of all non-executive directors are available for inspection at our registered office.
Board meetings The Board meets at least seven times a year. Certain matters are considered at all Board meetings including the Chief Executive’s business report; the latest available management accounts/Chief Financial Officer’s report; business updates; an operations update (covering commercial, technology and operations matters); an investor relations report and, where applicable, reports from the Nominations and Governance Committee, Audit and Risk Committee, and Remuneration Committee. In addition to standing agenda items, there may be discussions on “deep-dive” topics. During the year “deep-dive” presentations have included commercial strategy, technology strategy, spectrum auctions, talent and succession, our enterprise business and our partner markets business.

66Vodafone Group Plc Annual Report 2012
Corporate governance (continued)
Directors unable to attend a Board meeting because of another engagement are provided with the briefing materials and can discuss issues arising in the meeting with the Chairman or the Chief Executive. In addition to scheduled Board meetings, there are a number of other meetings to deal with specific matters.
Attendance at scheduled meetings of the Board and its committees in the 2012 financial year
Director Board
Nominations and
Governance Committee
Audit and Risk
CommitteeRemuneration
Committee
Gerard Kleisterlee (Chairman)1 7/7 3/3 – –Sir John Bond2 2/2 – – –Sir John Buchanan 6/7 2/3 3/4 –Vittorio Colao 7/7 – – –Michel Combes 7/7 – – –Andy Halford 7/7 – – –Renee James 7/7 – – –Alan Jebson 7/7 – 4/4 –Samuel Jonah 7/7 – – 5/5Nick Land3 7/7 – 4/4 –Anne Lauvergeon 7/7 – 4/4 –Stephen Pusey 6/7 – – –Luc Vandevelde4 7/7 3/3 – 5/5Anthony Watson 7/7 3/3 – 5/5Philip Yea 6/7 – – 5/5
Notes:1 Appointed as a director of the Board 1 April 2011 and became Chairman of the Board and Chairman of the
Nominations and Governance Committee at the conclusion of the Company’s AGM on 26 July 2011. 2 Chairman of the Board and Chairman of the Nominations and Governance Committee until he retired on
26 July 2011. 3 Chairman and financial expert of the Audit and Risk Committee.4 Chairman of the Remuneration Committee.
Board activities in the 2012 financial yearBoard activities are structured to assist the Board in achieving its goal to support and advise executive management on the delivery of the Group’s strategy within a transparent governance framework. The diagram below shows the key areas of focus for the Board which appear as items on the Board’s agenda at relevant times throughout the financial year. Concentrated discussion of these items assists the Board in making the right decisions based on the long-term opportunities for the business and its stakeholders.
Gaining valuable industry insightIn January, the Board held its meeting at Xone, Vodafone’s Innovation Centre in California. Whilst there, the Board had the opportunity to meet with senior representatives of a number of leading technology companies including Facebook, Google, Intel, Oracle, Microsoft, Nokia, Qualcomm and Samsung. These meetings provided the Board with valuable insight into views on our industry and its likely developments.
Key areas of focus for the Board
Business strategy
Discussion of main strategic issues (commercial,
technological, geographic, structural)
Strategy away day
Diversity and talent
Boardroom diversity policy
Succession planning
Business performance
Board performance
Commercial performance in local markets
Net promoter score
Business awareness
Chief Executive’s business report
Business development reports
Operations updates
Board committee reports
Financials
Financial results
Long range plan/forecasts
Management accounts/
Chief Financial Officer’s report
Sustainability
Delivering transformational
products and services
Being responsible and ethical
wherever we do business
Vodafone Foundation
Shareholder focus
Returns to shareholders
Review of investment thesis
Shareholder engagement
Being responsible
Health and Safety
Compliance
Business risks
Review of evaluation
processes and controls for
strategic and operational risks
Monitoring and review of
effectiveness
Areas of focus
Business reviewPerform
anceG
overnanceFinancials
Additional information
67Vodafone Group Plc Annual Report 2012
Board effectivenessBoard compositionThe Board has due regard for the benefits of diversity in its membership on the Board, including gender, and strives to maintain the right balance. Our Board comprises individuals with deep knowledge and experience in core and diverse business sectors within local, international and global markets.
Information and professional developmentKeeping up-to-date with key business developments is essential for the directors to maintain and enhance their effectiveness. From time to time the Board receives presentations from executives in our business on matters of significance. Financial plans, including budgets and forecasts, are regularly discussed at Board meetings. The directors also have the opportunity to learn the views of major investors at planned events throughout the financial year (see “Shareholder engagement” on page 71).
Our directors periodically visit different parts of the Group. The visit to Vodafone’s Innovation Centre in California (see page 66) in January presented an important opportunity for the non-executive directors to learn more about industry trends. In addition, the non-executive directors are provided with briefings and information to assist them in performing their duties. Throughout their period in office, directors are regularly updated on the Group’s businesses and the regulatory and industry specific environments in which we operate. Updates are by way of written briefings and meetings with senior executives and, where appropriate, external sources.
The Chairman is responsible for ensuring that induction and training programmes are provided and the Company Secretary organises the programmes. As part of the performance evaluation, Gerard Kleisterlee has meetings with each Board director (see “Performance evaluation” below) during which directors are given the opportunity to discuss training and development needs. Individual directors are also expected to take responsibility for identifying their training needs and to take steps to ensure that they are adequately informed about the Company and their responsibilities as a director. The Board is confident that all its members have the knowledge, ability and experience to perform the functions required of a director of a listed company.
Director induction programme On appointment, directors undergo a personalised induction programme covering amongst other things:
aa the business of the Group;
aa their legal and regulatory responsibilities as directors;
aa briefings and presentations from relevant executives; and
aa opportunities to visit business operations.
If appropriate the induction will also include:
aa briefings on the scope of the internal audit function and the role of the Audit and Risk Committee; and
aa meetings with the external auditor and other areas deemed appropriate considering the director’s area of responsibility.
During the year, the induction programmes of Gerard Kleisterlee and Renee James have followed structured timetables enabling them to meet key personnel within the Group including the executive and non-executive directors, the chief executives of local markets (visiting local markets where possible) and partner markets, key external advisors and key suppliers.
Performance evaluation Performance evaluation of the Board, its committees and individual directors takes place on an annual basis and is conducted within the terms of reference of the Nominations and Governance Committee (see www.vodafone.com/governance). Every three years the performance evaluation is conducted by an external advisor. The last external evaluation took place in respect of the 2010 financial year.
This year, Board members were asked to consider and comment on the performance of the Board as a whole as well as to reconsider the report of the Board’s self-assessment in the 2011 financial year. The Chairman led the assessment of the directors. He held one-to-one interviews with each director and these discussions were facilitated by the directors being asked to consider a number of questions in advance. Amongst other things, directors were asked for their views on company strategy; key challenges for the business; the mix of skills, experience, independence, knowledge and diversity on the Board (including gender); effectiveness of the Board’s engagement with shareholders; and how well the Board operates. The output of the interviews were discussed with the Board at the March Board meeting following a review by the Nominations and Governance Committee.
Each Board committee undertook a detailed self-assessment questionnaire and the respective chairman reported feedback to the Board at the Board meeting in March. The Senior Independent Director led the review of the performance of the Chairman.
The Board found the performance of each director to be effective and concluded that the Board provides the effective leadership and control required for a listed company. The evaluations found the Board committees were working well. As a result of recommendations made in this year’s Board performance evaluation, each Board meeting is now preceded by a meeting of the Chairman and non-executive directors; more time is being given during Board meetings to discuss organic growth opportunities; and more opportunities are being given to directors to visit local markets and various Group businesses. The Board will continue to review its procedures, its effectiveness and development in the financial year ahead.
Annually, the Nominations and Governance Committee reviews performance of the Executive Committee and reports the output to the Board.
Re-election of directorsWith the exception of Sir John Buchanan and Michel Combes who are retiring from the Board, all the directors submit themselves for re-election at the AGM to be held on 24 July 2012. The Nominations and Governance Committee confirmed to the Board that the contributions made by the directors offering themselves for re-election at the AGM in July 2012 continue to be effective and that the Company should support their re-election.
Independent adviceThe Board recognises that there may be occasions when one or more of the directors feels it is necessary to take independent legal and/or financial advice at the Company’s expense. There is an agreed procedure to enable them to do so which is managed by the Company Secretary.
Indemnification of directorsIn accordance with our articles of association and to the extent permitted by the laws of England and Wales, directors are granted an indemnity from the Company in respect of liabilities incurred as a result of their office. In respect of those matters for which the directors may not be indemnified, we maintained a directors’ and officers’ liability insurance policy throughout the financial year. Neither our indemnity nor the insurance provides cover in the event that a director is proven to have acted dishonestly or fraudulently.
Board committeesThe Board has a Nominations and Governance Committee, an Audit and Risk Committee and a Remuneration Committee, each of which has formal terms of reference approved by the Board which can be found on our website at www.vodafone.com/governance or obtained from the Company Secretary. Further biographical details of the members of each of the committees can be found on pages 60 to 62 or at www.vodafone.com/board.
The committees are provided with all necessary resources to enable them to undertake their duties in an effective manner. The Company Secretary or her delegate acts as secretary to the committees. The minutes of committee meetings are circulated to all directors.

68Vodafone Group Plc Annual Report 2012
Nominations and Governance Committee
“ The Nominations and Governance Committee continues its work of ensuring the Board composition is right and that our governance is effective.”
Chairman: Gerard Kleisterlee (Company Chairman)
Members:Sir John Buchanan (Deputy Chairman and Senior Independent Director) Luc Vandevelde (Independent non-executive director)Anthony Watson (Independent non-executive director)
Key objective: to ensure the Board comprises individuals with the requisite skills, knowledge and experience to ensure that it is effective in discharging its responsibilities.
Responsibilities:aa leads the process for identifying and making recommendations to the Board regarding candidates for appointment as directors, giving full consideration to succession planning and the leadership needs of the Group;
aa makes recommendations to the Board on the composition of the Nominations and Governance Committee and the composition and chairmanship of the Audit and Risk, and Remuneration Committees;
aa regularly reviews and makes recommendations in relation to the structure, size and composition of the Board including the diversity and balance of skills, knowledge and experience and the independence of the non-executive directors;
aa oversees the performance evaluation of the Board, its committees and individual directors (see page 67);
aa reviews the tenure of each of the non-executive directors; and
aa is responsible for the oversight of all matters relating to corporate governance, bringing any issues to the attention of the Board.
MembershipThe Committee which I chair comprises a majority of independent, non-executive directors. Effective from the conclusion of the AGM on 24 July 2012, Sir John Buchanan will retire and Philip Yea will join the Committee. No one other than a member of the Committee is entitled to be present at its meetings; however, other non-executive directors, the Chief Executive and external advisors may be invited to attend.
In the event of matters arising concerning my membership of the Board, I would absent myself from the meeting as required and the Board’s Senior Independent Director would take the chair.
Main activities of the Committee during the yearDuring the year the Committee met three times.
The Committee leads the process for appointments to the Board. There is a formal, rigorous and transparent procedure for the appointment of new directors to the Board. Candidates are identified and selected on merit against objective criteria and with due regard to the benefits of diversity on the Board, including gender.
In July a review of executive succession plans was undertaken. In addition, the Committee received a commentary from the Chief Executive concerning the performance of the senior executives.
In March the Committee reviewed the output from the evaluations of the Board and committees’ performance in the 2011 financial year (see “Performance evaluation” on page 67 for further information).
A boardroom diversity policy was introduced during the financial year. The Board acknowledges that diversity extends beyond the boardroom and supports management in their efforts to build a diverse organisation throughout the Group. It endorses the Company’s policy to attract and develop a highly qualified and diverse workforce; to ensure that all selection decisions are based on merit and that all recruitment activities are fair and non-discriminatory. The policy acknowledges the importance of diversity, including gender, to the effective functioning of the Board and focuses on our aspiration to have a minimum of 25% female representation on the Board by 2015. Subject to securing suitable candidates, when recruiting additional directors and/or filling vacancies which arise when directors do not seek re-election, we will seek to appoint new directors who fit the skills criteria and gender balance that is in line with the Board’s aspiration. We continue to focus on encouraging diversity of business skills and experience, recognising directors with diverse skills sets, capabilities and experience gained from different geographic and cultural backgrounds enhance the Board. (Further information, including the proportions of women in senior management, is shown in “Our people” on pages 34 to 35, and within the organisation overall, is contained in our 2012 sustainability report at www.vodafone.com/sustainability).
This year, when reviewing the re-election of directors at the AGM in July, the Committee took account of the fact that Luc Vandevelde will have served nine years as of 31 August 2012. The Code suggests that length of tenure is a factor to consider when determining the independence of non-executive directors. The Board has considered the matter carefully and considers that Luc Vandevelde remains independent. His length of service and resulting high degree of knowledge and understanding of the Company, are of great benefit to shareholders and add significantly to the strength of the Board.
In the year ahead the Committee will continue to assess what enhancements should be made to the Board’s and committees’ composition and will continue to monitor developments in corporate governance to ensure the Company remains at the forefront of good governance practices.
Gerard Kleisterlee On behalf of the Nominations and Governance Committee
22 May 2012
Corporate governance (continued)

Business reviewPerform
anceG
overnanceFinancials
Additional information
69Vodafone Group Plc Annual Report 2012
Audit and Risk Committee“ Having broadened our scope during the year, the
Committee will focus on risk management in addition to its existing role in relation to the integrity of the Group’s financial reporting, the external audit process and the appropriateness of the Group’s system of internal controls. It will continue to evolve its activities in light of guidance from regulators and market conditions.”
Chairman and financial expert: Nick Land (Independent non-executive director)
Members:Sir John Buchanan (Deputy Chairman and Senior Independent Director)Alan Jebson (Independent non-executive director)Anne Lauvergeon (Independent non-executive director)
Key objective: to provide effective financial governance over the appropriateness of the Group’s financial results, the performance of both the internal audit function and the external auditor, and the management of the Group’s systems of internal control, business risks and related compliance activities.
Responsibilities:aa reviewing our financial results announcements and financial statements;
aa monitoring compliance with relevant statutory and listing requirements;
aa reporting to the Board on the quality and acceptability of our accounting policies and practices including critical accounting policies and practices;
aa overseeing the relationship with the external auditor;
aa reviewing correspondence from regulators regarding our financial reporting;
aa reviewing the scope, extent and effectiveness of the activity of the Group internal audit department;
aa playing an active role in monitoring our compliance efforts in respect of section 404 of the Sarbanes-Oxley Act;
aa consider and make recommendations to the Board on the nature and extent of the significant risks the Group is willing to take in achieving its strategic objectives;
aa overseeing the Group’s compliance processes; and
aa performing in-depth review of specific areas of financial reporting, risk and internal controls, as determined by the Committee.
MembershipThe Committee comprises independent non-executive directors under my chairmanship and meets at least four times during the year. The Committee members have been selected to provide the wide range of financial and commercial expertise necessary to fulfil the Committee’s duties. The Board considers that I have recent and relevant financial experience, as required by the Code, and has designated me as its financial expert on the Committee for the purposes of the US Sarbanes-Oxley Act. With effect from the close of the AGM in July, Sir John Buchanan will retire and Anthony Watson will join the Committee.
Meetings are attended by the independent non-executive directors and, by invitation, the Chief Executive, the Chief Financial Officer, the Group Financial Controller, the Group Financial Reporting Director and the Group Audit Director. The Group Compliance Director and other relevant people from the business are also invited to attend certain meetings in order to provide insight and enhance the Committee’s awareness of key issues and developments. I also invite our external auditor, Deloitte LLP, to each meeting. The Committee regularly meets separately with Deloitte LLP, the Chief Financial Officer and the Group Audit Director without other management being present.
Main activities of the Committee during the yearThe Committee assists the Board in carrying out its responsibilities in relation to financial reporting requirements, risk management and the assessment of internal controls. It also reviews the effectiveness of the Company’s internal audit function and manages the Company’s relationship with the external auditor.
Following agreement with the Board in July 2011, the scope of the Committee’s work was broadened and it is now responsible for considering and making recommendations to the Board on the nature and extent of the significant risks the Group is willing to take in achieving its strategic objectives. Its role in relation to the review of risk management processes has also been extended. Here the Committee aims to focus both on monitoring the Company’s approach to the management of existing risks together with emerging risks that arise by virtue of the dynamic markets in which the company operates. In addition, the Committee’s activities in the year have placed additional focus on the Group’s processes for monitoring and sustaining compliance with the laws and regulations applicable to the Group as well as its own internal policies. As a result of the above, the Committee’s terms of reference have been updated and can be found on our website www.vodafone.com/governance.
At its four meetings during the year, the Committee focused on:
Financial reportingThe primary role of the Committee in relation to financial reporting is the review with both management and the external auditor of the appropriateness of the half-year and annual financial statements concentrating on, amongst other matters:
aa the quality and acceptability of accounting policies and practices;
aa the clarity of the disclosures and compliance with financial reporting standards and relevant financial and governance reporting requirements;
aa material areas in which significant judgements have been applied or there has been discussion with the external auditor; and
aa any correspondence from regulators in relation to our financial reporting.
To aid our review, the Committee considered reports from the Group Financial Controller and the Group Financial Reporting Director and also reports from the external auditor on the outcomes of their half-year review and annual audit. As a Committee we support Deloitte LLP in displaying the necessary professional scepticism their role requires. The primary areas of judgement considered by the Committee in relation to the 2012 accounts were:
aa the assumptions underlying impairment testing of the Group’s goodwill and intangible assets, particularly in relation to the Group’s interests in southern Europe;
aa in relation to taxation, both the provisioning for potential current tax liabilities and the appropriateness of deferred tax asset recognition in relation to accumulated tax losses; and
aa the level of provisioning appropriate for contingent and other liabilities in a number of our markets.
70Vodafone Group Plc Annual Report 2012
Internal control and risk management During the year we reviewed the process by which the Group evaluated its control environment, its risk assessment process and the way in which significant business risks were managed. The agenda was driven primarily by the Group’s assessment of its principal risks and uncertainties, as set out on pages 51 to 53. The Committee also received regular updates from the Group’s Compliance Director on compliance related activities where throughout the year the Group has continued to expand its work to formalise a more centralised approach to the co-ordination of these activities. Further we also considered the Group Audit Director’s reports on the effectiveness of internal controls, significant identified frauds and any identified fraud that involved management or employees with a significant role in internal controls. Oversight of the Group’s compliance activities in relation to section 404 of the Sarbanes-Oxley Act also fell within the Committee’s remit.
The Committee conducted a number of in-depth reviews in the year covering the control environments and risk management processes in a number of our markets, the appropriateness of the Group’s whistle blowing procedures, ensuring arrangements are in place for the independent investigation and follow up of such matters, corporate security and two sessions on information security. In light of recent economic conditions in the eurozone the Committee also undertook a detailed review of the country and currency risks facing the business and the plans in place to mitigate the Group’s exposures. We have summarised the main elements of this review on page 53 in view of the significance of the Group’s operations in Europe. We view these reviews as being critical to the role of the Committee as they allow us to meet key business leaders responsible for these areas and provide independent challenge to their activities.
Internal auditA substantial agenda item at each Committee meeting is the monitoring and reviewing of the scope, extent and effectiveness of the activity of the Group Internal Audit department. Reports from the Group Audit Director usually include updates on audit activities, progress of the Group audit plan, the results of any unsatisfactory audits and the action plans to address these areas, and resource requirements of the internal audit department. Further we receive summaries of investigations into known or suspected fraudulent activities by both third parties and employees. We hold private discussions with the Group Audit Director as necessary throughout the year and I also meet with the Group Audit Director outside the formal committee process.
External auditThe effectiveness of the external audit process is dependent on appropriate audit risk identification and at the start of the audit cycle we receive from Deloitte LLP a detailed audit plan, identifying their assessment of these key risks. For 2012 the primary risks identified were in relation to goodwill impairment, provisioning for current tax liabilities and deferred tax asset recognition due to the inherent management judgement required in these areas. These risks are tracked through the year whenever we receive reporting from Deloitte LLP.
We hold private meetings with the external auditor at each Committee meeting to provide additional opportunity for open dialogue and feedback from the Committee and the auditor without management being present. Matters typically discussed include the auditor’s assessment of business risks and management activity thereon, the transparency and openness of interactions with management, confirmation that there has been no restriction in scope placed on them by management, independence of their audit and how they have exercised professional scepticism. I also meet with the external audit partner outside the formal committee process throughout the year.
Appointment and independenceThe Committee considers the reappointment of the external auditor, including the rotation of the audit partner, each year and also assesses their independence on an ongoing basis. The external auditor is required to rotate the audit partner responsible for the Group audit every five years. The current lead audit partner has been in place for three years.
Deloitte LLP have been the Company’s external auditor since its stock market listing in 1988; as part of the Committee’s review of the objectivity and effectiveness of the audit process an assessment was undertaken in 2011 as to whether the Group should consider putting the audit engagement out to tender. This process included the re-proposal by Deloitte LLP of their audit approach. After extensive discussion, the Committee felt a tender was not necessary at present and provided the Board with its recommendation to the shareholders on the reappointment of Deloitte LLP as external auditor for the year ended 31 March 2012. This position will be kept under annual review.
In accordance with section 489 of the Companies Act 2006, a resolution proposing the reappointment of Deloitte LLP as our auditor will be put to the shareholders at the 2012 AGM. There are no contractual obligations restricting the Committee’s choice of external auditor and we do not indemnify our external auditor.
In its assessment of the independence of the auditor and in accordance with the US Public Company Accounting Oversight Board’s standard on independence, the Committee receives details of relationships between the Company and Deloitte LLP that may have a bearing on their independence and receives confirmation that they are independent of the Company within the meaning of the securities laws administered by the SEC.
During the year Deloitte LLP and member firms of Deloitte Touche Tohmatsu Limited charged the Group £8 million (2011: £9 million, 2010: £9 million) for audit and audit related services. The Committee approved the fees for audit services for 2012 after a review of the level and nature of work to be performed and after being satisfied by Deloitte LLP that the fees were appropriate for the scope of the work required.
Non-audit servicesAs a further safeguard to help avoid the objectivity and independence of the external auditor becoming compromised, the Committee has a formal policy governing the engagement of the external auditor to provide non-audit services. This policy precludes Deloitte LLP from providing certain services such as valuation work or the provision of accounting services. This policy was extended in December 2011 and now sets the presumption that Deloitte LLP should only be engaged for non-audit services where there is no legal or practical alternative supplier.
For certain specific permitted services the Committee has pre-approved that Deloitte LLP can be engaged by management, subject to the policies set out above, and subject to specified fee limits for individual engagements and fee limits for each type of specific service. For all other services, or those permitted services that exceed the specified fee limits, I as Chairman, or in my absence another member, can pre-approve permitted services.
During the year Deloitte LLP and member firms of Deloitte Touche Tohmatsu Limited charged the Group £1 million (2011: £1 million, 2010: £1 million) for non-audit assignments. An analysis of the fees paid to Deloitte LLP, for both audit and non audit services, can be found in note 4 to the consolidated financial statements. Non-audit services performed during the year by Deloitte LLP were primarily in relation to non-audit related compliance matters, corporate finance activities and debt issuance.
Committee evaluationThe Committee conducts a formal review of its effectiveness annually and concluded that its performance was effective. A number of changes have been agreed to be implemented for the forthcoming year. Details of the Board and Committee evaluation process can be found under “Performance evaluation” on page 67.
Nick Land On behalf of the Audit and Risk Committee
22 May 2012
Corporate governance (continued)

Business reviewPerform
anceG
overnanceFinancials
Additional information
71Vodafone Group Plc Annual Report 2012
Remuneration Committee“ Our remuneration policies and executive
pay packages are designed to be competitive and drive behaviour in order to achieve long-term strategic goals. When making decisions we are mindful of the wider economic conditions and shareholder feedback.”
Chairman: Luc Vandevelde (Independent non-executive director)
Members:Samuel Jonah (Independent non-executive director)Anthony Watson (Independent non-executive director)Philip Yea (Independent non-executive director)
Key objective: responsibility to the Board for the assessment and recommendation of policy on executive remuneration and packages for the individual executive directors.
Responsibilities:aa determining, on behalf of the Board, the policy on the remuneration of the Chairman, the executive directors and the senior management team;
aa determining the total remuneration packages for these individuals including any compensation on termination of office;
aa operating within recognised principles of good governance; and
aa preparing an annual report on directors’ remuneration.
MembershipThe members of the Committee are independent non-executive directors. Following the AGM in July, Renee James will join and Anthony Watson will step down from the Committee. The Chairman and Chief Executive may attend the Committee’s meetings by invitation but they do not attend when their individual remuneration is discussed. No director is involved in deciding his or her own remuneration.
Main activities of the Committee during the yearThe Committee met five times during the year.
A detailed report to shareholders from the Committee on behalf of the Board in which, amongst other things, I have included a description of the Committee’s activities during the year, is contained in “Directors’ remuneration” on pages 74 to 87.
Luc Vandevelde On behalf of the Remuneration Committee
22 May 2012
Shareholder engagementWe are committed to communicating our strategy and activities clearly to our shareholders and, to that end, we maintain an active dialogue with investors through a planned programme of investor relations activities.
Investor relations programmeThe programme includes:
aa formal presentations of full year and half-year results, and interim management statements;
aa briefing meetings with major institutional shareholders in the UK, the US and in Continental Europe after the half-year results and preliminary announcement;
aa regular meetings between institutional investors and analysts, and the Chief Executive and Chief Financial Officer to discuss business performance;
aa meetings between major shareholders and the Chairman on an ongoing basis;
aa hosting investors and analysts sessions at which senior management from relevant operating companies are present;
aa attendance by senior executives across the business at relevant meetings and conferences throughout the year;
aa analysing and approaching new geographies to actively market the business to new investors;
aa responding to enquiries from shareholders and analysts through our Investor Relations team; and
aa www.vodafone.com/investor which is a section dedicated to shareholders on our website.
Overall responsibility for ensuring that there is effective communication with investors, and that the Board understands the views of major shareholders on matters such as governance and strategy, rests with the Chairman who makes himself available to meet shareholders for this purpose. The Senior Independent Director and other members of the Board are also available to meet major investors on request.
The principal communication with private investors is via the website, annual report and through the AGM, an occasion which is attended by all of our directors and at which all shareholders present are given the opportunity to question the Chairman, the Chairmen of the Committees and the rest of the Board. After the AGM shareholders can meet informally with directors. A summary presentation of results is given at the AGM before the Chairman deals with the formal business of the meeting. The AGM is broadcast live on our website (www.vodafone.com/agm) and a recording of the webcast can subsequently be viewed on our website. All substantive resolutions at our AGMs are decided on a poll. The poll is conducted by our registrars and scrutinised by Electoral Reform Services. The proxy votes cast in relation to all resolutions, including details of votes withheld, are disclosed to those in attendance at the meeting and the results of the poll are published on our website and announced via the Regulatory News Service. Financial and other information is made available on our website (www.vodafone.com/investor) which is regularly updated.
A summary of our share and control structures is set out in “Shareholder information” on pages 149 to 156.

72Vodafone Group Plc Annual Report 2012
Political donationsNo political donations under the Companies Act 2006 have been made during the year. It is our Group policy not to make political donations or incur political expenditure as those expressions are normally understood.
Internal control and risk management The Board has overall responsibility for the system of internal control. A sound system of internal control is designed to manage rather than eliminate the risk of failure to achieve business objectives and can only provide reasonable and not absolute assurance against material misstatement or loss.
The Board has established procedures that implement in full the Turnbull Guidance “Internal Control: Revised Guidance for Directors on the Combined Code” for the year under review and to the date of approval of the annual report. These procedures, which are subject to regular review, provide an ongoing process for identifying, evaluating and managing the significant risks we face. See page 89 for management’s report on internal control over financial reporting.
Monitoring and review activitiesThere are clear processes for monitoring the system of internal control and reporting any significant control failings or weaknesses together with details of corrective action. These include:
aa a formal annual confirmation provided by the Chief Executive and Chief Financial Officer of each Group company certifying the operation of their control systems and highlighting any weaknesses, the results of which are reviewed by regional management, the Audit and Risk Committee, and the Board;
aa ongoing review of the appropriateness of disclosures undertaken by the Group’s Disclosure Committee, on behalf of the Chief Executive and the Chief Financial Officer, and an annual report from the Group’s Disclosure Committee to the Chief Executive and the Chief Financial Officer regarding the effectiveness of the Group’s disclosure controls and procedures; and
aa periodic examination of business processes on a risk basis including reports on controls, throughout the Group, undertaken by the Group Internal Audit department which reports directly to the Audit and Risk Committee.
In addition, the Board reviews any reports from the external auditor presented to the Audit and Risk Committee and management in relation to internal financial controls.
Any controls and procedures, no matter how well designed and operated, can provide only reasonable and not absolute assurance of achieving the desired control objectives. Management is required to apply judgement in evaluating the risks we face in achieving our objectives, in determining the risks that are considered acceptable to bear, in assessing the likelihood of the risks concerned materialising, in identifying our ability to reduce the incidence and impact on the business of risks that do materialise, and in ensuring that the costs of operating particular controls are proportionate to the benefit.
Review of effectivenessThe Board and the Audit and Risk Committee have reviewed the effectiveness of the internal control system including financial, operational and compliance controls, and risk management in accordance with the Code for the period from 1 April 2011 to 22 May 2012 (the date of approval of our annual report). No significant failings or weaknesses were identified during this review. However, had there been any such failings or weaknesses, the Board confirms that necessary actions would have been taken to remedy them.
Disclosure controls and proceduresWe maintain “disclosure controls and procedures”, as such term is defined in Rule 13a-15(e) of the Exchange Act, that are designed to ensure that information required to be disclosed in reports that we file or submit under the Exchange Act is recorded, processed, summarised and reported within the time periods specified in the SEC’s rules and forms, and that such information is accumulated and communicated to management, including our Chief Executive and Chief Financial Officer as appropriate, to allow timely decisions regarding required disclosure.
The directors, the Chief Executive and the Chief Financial Officer have evaluated the effectiveness of the disclosure controls and procedures and, based on that evaluation, have concluded that the disclosure controls and procedures are effective at the end of the period covered by this document.
Going concernThe going concern statement required by the Listing Rules and the Code is set out in the “Directors’ statement of responsibility” on page 89.
Risk managementAn overview of the Group’s framework for identifying and managing risk, both at an operational and strategic level, is set out on page 39.
Annual reportThe directors are responsible for preparing the annual report.
Corporate governance (continued)

Business reviewPerform
anceG
overnanceFinancials
Additional information
73Vodafone Group Plc Annual Report 2012
US listing requirementsAs Vodafone’s American depositary shares are listed on the NASDAQ Stock Market LLC (‘NASDAQ’), we are required to disclose a summary of any material differences between the corporate governance practices we follow and those of US companies listed on NASDAQ. The corporate governance practices of the Company are primarily based on UK requirements but substantially conform to those required of US companies listed on NASDAQ. The material differences are as follows:
Independenceaa Different tests of independence for Board members are applied under the Code and the NASDAQ rules.
aa The Board is not required to, and has not explicitly taken into consideration, NASDAQ’s detailed definitions of independence as set out in the NASDAQ rules.
aa In accordance with the Code, the Board has carried out an assessment based on the requirements of the Code and has determined in its judgement that all of the non-executive directors (who make up the majority of the Board) are independent within those requirements.
Committeesaa The NASDAQ rules require US companies to have a nominations committee, an audit committee and a compensation committee, each composed entirely of independent directors, with the nominations committee and audit committee required to have a written charter that addresses the committees’ purpose and responsibilities.
aa Our Nominations and Governance Committee is chaired by the Chairman of the Board and its other members are independent non-executive directors. Our Remuneration Committee is composed entirely of independent non-executive directors.
aa The Audit and Risk Committee is composed entirely of non-executive directors, each of whom the Board has determined to be independent, as set out above, and who also meet the requirements of the Exchange Act.
aa We have terms of reference for our Nominations and Governance, Audit and Risk and Remuneration Committees, which comply with the requirements of the Code and are available on our website (www.vodafone.com/governance). These terms of reference are generally responsive to the relevant NASDAQ rules but may not address all aspects of these rules.
Code of conductUnder the NASDAQ rules, US companies must adopt a code of conduct applicable to all directors, officers and employees that complies with the definition of a “code of ethics” set out in section 406 of the Sarbanes-Oxley Act. We have adopted a Code of Ethics that complies with section 406 which is applicable only to the senior financial and principal executive officers, and which is available on our website (www.vodafone.com/governance). We have also adopted a separate Code of Conduct which applies to all employees.
QuorumThe quorum required for shareholder meetings, in accordance with our articles of association, is two shareholders regardless of the level of their aggregate share ownership, while US companies listed on NASDAQ are required to have a minimum quorum of 33.33% of the shareholders of ordinary shares for shareholder meetings in accordance with the NASDAQ rules.
Related party transactionsaa In lieu of obtaining an independent review of related party transactions for conflicts of interests in accordance with the NASDAQ rules, we seek shareholder approval for related party transactions that meet certain financial thresholds or where transactions have unusual features in accordance with the Listing Rules issued by the FSA in the UK (the ‘Listing Rules’), the Companies Act 2006 and our articles of association.
aa Further, we use the definition of a “transaction with a related party” as set out in the Listing Rules, which differs in certain respects from the definition of “related party transaction” in the NASDAQ rules.
Shareholder approvalaa We comply with the Listing Rules and the NASDAQ rules, when determining whether shareholder approval is required for proposed transactions.
aa Under the NASDAQ rules, whether shareholder approval is required for transactions depends on, among other things, the percentage of shares to be issued or sold in connection with a transaction. Under the Listing Rules, shareholder approval is required, among other things, when the size of a transaction exceeds a certain percentage of the size of the listed company undertaking the transaction.

74Vodafone Group Plc Annual Report 2012
Letter from the Remuneration Committee Dear shareholderThe subject of executive reward has been, and continues to be, an issue of concern both to shareholders and the wider public. In September the department of Business Skills and Innovation (‘BIS’) issued two consultative papers on the subject and although Vodafone shareholders seem satisfied with the present remuneration report, we have incorporated a number of amendments to it to respond to some legitimate concerns. Specifically we have divided the report into the following discrete sections to make it clearer and easier to understand:
aa Page 75. The composition and activities of the Remuneration Committee.
aa Pages 76 to 77. A summary of remuneration for the 2012 financial year including a table that shows a single figure for total remuneration paid during the year along with a detailed justification of any incentive payments.
aa Pages 77 to 81. A forward-looking statement setting out our reward philosophy, details of our current reward packages and a table that sets out the value of these packages under different performance scenarios.
aa Pages 82 to 87. All other disclosures currently required by statute or best practice guidelines.
Summary of key decisions on remunerationOur remuneration policies and executive pay packages are designed to be competitive and drive behaviour in order to achieve long-term strategic goals such as the £20.9 billion in adjusted free cash flow produced over the last three year period and rewarded under our long-term plan. When making decisions we are mindful of the wider economic conditions and shareholder feedback as well as the need to adapt to our market and competitive environment. The Remuneration Committee receives regular updates on corporate governance as well as pay increase budgets and incentive plan payouts in our local markets.
We also consider the total amount spent on executive pay (as detailed on page 76) in relation to the dividends and profit for the financial year. As can be seen from the enclosed chart for 2012, in both cases executive pay at Vodafone was very small in comparison.
Total cost of executive pay in relation to dividends and adjusted profit attributable to equity shareholders
7,000
8,000
6,000
5,000
4,000
3,000
2,000
1,000
0
Dividends Profit Executive pay
£m
The key decisions and rationale made during the year are described in more detail on the following pages but in summary were:
aa Awarding no pay increases for the executive directors in the coming year;
aa Continuing our practice of setting stretching performance targets thus ensuring pay is firmly linked to performance;
aa Approving an annual bonus payment for the year of 93.4% of target;
aa Approving the vesting of the 2008 share award (that vested in July 2011) at 30.6% of maximum;
aa Reducing the value of the maximum possible payments on future long-term incentive awards from four times the target value to three times the target value; and
aa Further strengthening the share ownership culture. As at 31 March the Executive Committee collectively owned shares with a value of £22 million. Vittorio Colao personally held shares with a value of just under six times his salary and, by committing to hold the shares that vest in July 2012, this will be further increased to over ten times.
Consultation with shareholdersAs in previous years the Remuneration Committee has had dialogue with its shareholders – the largest shareholders are invited to meet with me in person or by video conference and all letters or emails from other shareholders are always replied to. The Remuneration Committee continues to take an active interest in investors’ views and were delighted that last year the remuneration report received a 96.12% vote in favour. We sincerely hope to receive your continued support at the AGM on 24 July 2012.
Luc VandeveldeChairman of the Remuneration Committee
22 May 2012
Directors’ remuneration
Business reviewPerform
anceG
overnanceFinancials
Additional information
75Vodafone Group Plc Annual Report 2012
Remuneration CommitteeIn this section we give details of the composition and activities of the Remuneration Committee.
The Remuneration Committee is comprised to exercise independent judgement and consists only of the following independent non-executive directors:
Chairman Luc VandeveldeCommittee members Renee James (from 24 July 2012)
Samuel JonahAnthony Watson (until 24 July 2012)Philip Yea
The Remuneration Committee regularly consults with the Chief Executive and the Group HR Director on various matters relating to the appropriateness of awards for executive directors and senior executives, though they are not present when their own compensation is discussed. In addition, the Group Reward and Policy Director provides a perspective on information provided to the Committee, and requests information and analyses from external advisors as required. The Deputy Group Company Secretary advises the Committee on corporate governance guidelines and acts as secretary to the Committee.
External advisors PricewaterhouseCoopers LLP (‘pwc’)pwc were appointed by the Remuneration Committee in 2007. During the year they provided advice on market practice, governance, performance analysis and plan design. pwc also provide a range of services to Vodafone globally including international mobility, tax, technology, finance, operations and compliance.
As noted in his biographical details on page 62 of this annual report, Philip Yea sits on an advisory board for pwc. In light of their role as advisor to the Remuneration Committee on remuneration matters, the Committee continue to consider this position and have determined that there is no conflict or potential conflict arising.
Towers WatsonTowers Watson were appointed by the Remuneration Committee in 2007. During the year they provided the Committee with market data on executive rewards. They also provide pensions and benefit administration, and reward consultancy services to the company.
Meetings
The Remuneration Committee had five meetings during the year. The principal agenda items were as follows:
aa a review of the total compensation packages of the executive directors and the most senior management of the company;
aa approval of the 2012 Global Short-Term Incentive bonus (‘GSTIP’) framework and targets;
aa approval of the GSTIP payout for the 2011 performance period;
aa a review of the design of the Global Long-Term Incentive plan (‘GLTI’) as well as setting the framework and target levels for the 2012 grant;
aa approval of the July 2008 GLTI vesting levels;
aa approval of the granting of share awards to other levels of management;
aa a review of the directors’ remuneration report;
aa a review of the share ownership targets within the company;
aa a review of the UK corporate governance environment, the implications for Vodafone and our response to Government consultations on executive remuneration;
aa a risk assessment of the design of incentive plans; and
aa a review of the Chairman’s fees.
On an annual basis, the Committee’s effectiveness is reviewed as part of the evaluation of the Board.

76Vodafone Group Plc Annual Report 2012
Summary of remuneration for the 2012 financial yearIn this section we summarise the pay packages awarded to our executive directors for performance in the 2012 financial year versus 2011. Specifically we have provided a table that shows all remuneration that was received by the individual during the year. In response to the debate on simplifying remuneration disclosure we have included a single total remuneration value for the year. Although there are some technical difficulties in arriving at a single value, particularly concerning the timing and valuation of awards which may not be aligned with the financial year end, we have attempted to provide the data in a logical format along with accompanying explanatory notes. Specifically we have included the value of the short-term incentive (‘GSTIP’) that was earned during the year but paid out in the following year and the value of long-term incentive (‘GLTI’) that vested and paid out during the year. For completeness the GLTI that vests in the following year has also been included in a separate table below although in the case of the award vesting in June 2012, the value can only be estimated at this stage.
Total remuneration for the 2012 financial yearVittorio Colao Andy Halford Michel Combes Stephen Pusey
2012 2011 2012 2011 2012 2011 2012 2011 £’000 £’000 £’000 £’000 £’000 £’000 £’000 £’000
Salary/fees 1,099 1,043 700 694 785 763 569 538GSTIP 1,037 1,323 654 869 728 745 537 683GLTI vesting during the year 1 3,745 590 2,289 451 1,776 – 758 186Cash in lieu of GLTI dividends2 545 92 333 70 326 – 110 29Cash in lieu of pension 330 313 210 208 236 229 171 161Benefits /other 3 24 55 30 27 25 22 21 31Total 6,780 3,416 4,216 2,319 3,876 1,759 2,166 1,628
Notes:1 The value shown in the 2012 column is for the award which vested on 29 July 2011 and is valued using the closing share price on that day of 171.7 pence; the value shown in the 2011 column is for the award which vested on
24 July 2010 using the closing share price on the first trading day after the award vested (26 July 2010) of 151.5 pence. Michel Combes’ award did not vest until 12 February 2012 and is valued using the closing share price on that day of 174.5 pence.
2 Under the GLTI rules, participants receive a cash award equivalent to any dividends that would have been paid on the matching shares during the performance period.3 Includes amounts in respect of cost of living allowance, private healthcare and car allowance.
GLTI awards with a performance period ending on the 31 March of the year under review but that do not vest until the following financial year 1:
2012Vittorio Colao
2011 2012Andy Halford
2011 2012Michel Combes
2011 2012Stephen Pusey
2011
GLTI base shares 4,564,995 1,262,735 2,524,934 698,428 2,771,771 792,473 1,872,818 288,292GLTI matching shares 1,817,866 918,353 1,676,756 634,935 533,854 225,497 510,879 153,258Total value of GLTI awards £’000 10,991 3,745 7,235 2,289 5,692 1,776 4,105 758
Note:1 The awards summarised in this table represent those that vested after the close of the financial year, but are based on the three-year performance period ended at 31 March 2012 for the awards shown in the 2012 column,
and 31 March 2011 for the awards shown in the 2011 column. The awards listed under 2012 will not vest until 30 June 2012. We valued the award using a closing share price on 31 March 2012 of 172.2 pence, however, the final award value will not be certain until the award vests.
In light of the high value of the award that will vest in June, Vittorio Colao has committed to hold 100% of the shares that vest (net of those sold to cover tax) for an additional two years. Similarly the other executive directors have all agreed to hold 50% (net of those sold to cover tax) for the same period.
Below we summarise our performance over the financial year, and three-year performance period ended 31 March 2012, which resulted in the remuneration disclosed in the above tables.
Details of the GSTIP payoutIn the table below we describe our achievement against each of the performance measures in our annual bonus plan (‘GSTIP’) and the resulting total incentive payout level for the year ended 31 March 2012 of 93.4%. Vittorio Colao, Andy Halford and Stephen Pusey were measured purely on Group performance whilst Michel Combes was measured on a combination of Group and Europe region performance. The corresponding total incentive payout for Michel Combes was 92.1%. Details of how this works can be found on page 79.
Performance measure
Payout at target performance
100%
Payout at maximum performance
200% Actual payout Commentary
Service revenue 25% 50% 25.8% Organic service revenue up 1.5% in the year.EBITDA 25% 50% 24.8% In-line with market guidance for the year.Adjusted free cash flow 20% 40% 8.5% Within the range of market guidance.Competitive performance assessment 30% 60% 34.3% Outperformance of key competitors in most markets.
Ranked first or second for net promoter score in over 70% of our markets.
Total incentive payout level 100% 200% 93.4%
Directors’ remuneration (continued)

Business reviewPerform
anceG
overnanceFinancials
Additional information
77Vodafone Group Plc Annual Report 2012
Details of the GLTI vesting in July 2011Adjusted free cash flow for the three-year period ended on 31 March 2011 was £16.9 billion which compares with a target of £17.5 billion and a maximum of £19.5 billion. The graph below shows that our TSR performance against our peer group for the same period resulted in an outperformance of the median by 3.9% a year. Using our combined payout matrix, this performance resulted in a payout of 30.6% of the maximum. These shares vested on 29 July 2011.
2008 GLTI award: TSR performance (growth in the value of a hypothetical $100 holding over the performance period)
110
100
90
80
70
60
50
03/08 09/08 03/09 09/09 03/10 09/10 03/11
Vodafone Group Median of peer group Outperformance of median of 9% p.a.
10093
88
84 72
6356
85
73
63
95
78
72
94
76
74
109
94
83
Details of the GLTI vesting in June 2012Adjusted free cash flow for the three-year period ended on 31 March 2012 was £20.9 billion which compares with a target of £18.0 billion and a maximum of £20.5 billion The graph below shows that our TSR performance against our peer group for the same period resulted in an outperformance of the median by 18.5% a year. Using our combined payout matrix, this performance will result in a payout of 100% of the maximum. These shares will vest on 30 June 2012.
2009 GLTI award: TSR performance (growth in the value of a hypothetical $100 holding over the performance period)
200
180
160
140
120
100
80
03/09 09/09 03/10 09/10 03/11 09/11 03/12
Vodafone Group Median of peer group Outperformance of median of 9% p.a.
100114
111110
134
128125
134
128
114
167
151
129
171
161
133
181
142
110
In both cases the adjusted free cash flow performance is approved by the Remuneration Committee. The performance assessment in respect of the TSR outperformance of a peer group median is undertaken by pwc. Details of how the plan works can be found on page 79.
Summary of remuneration and performance for the 2013 financial yearIn this forward-looking section we describe our reward principles along with a description of the elements of the reward package and an indication of the potential future value of this package for each of the executive directors.
Principles of reward The principles of reward, as well as the individual elements of the reward package, are reviewed each year to ensure that they continue to support our Company strategy. These principles are set out below.
Competitive reward assessed on a total compensation basisVodafone wishes to provide a level of remuneration which attracts, retains and motivates executive directors of the highest calibre. Within the package there needs to be the opportunity for executive directors to achieve significant upside for truly exceptional performance. The package provided to the executive directors is reviewed annually on a total compensation basis i.e. single elements of the package are not reviewed in isolation. When the package is reviewed it is done so in the context of individual and Company performance, internal relativities, criticality of the individual to the business, experience, and the scarcity or otherwise of talent with the relevant skill set.
The principal external comparator group (which is used for reference purposes only) is made up of companies of similar size and complexity to Vodafone, and is principally representative of the European top 25 companies and a few other select companies relevant to the sector. The comparator group excludes any financial services companies. When undertaking the benchmarking process the Remuneration Committee makes assumptions that individuals will invest their own money into the long-term incentive plan. This means that individuals will need to make a significant investment in order to achieve the maximum payout.
Pay for performance A high proportion of total reward will be awarded through short-term and long-term performance related remuneration. This is demonstrated in the charts below where we see that at target payout over 70% of the package is delivered in the form of variable pay, which rises to over 86% if maximum payout is achieved. Fixed pay comprises base salary and pension contributions, while variable pay comprises the annual bonus and the long-term incentive opportunity assuming maximum co-investment and no movement in current share price.
Fixed Variable
Chief Executive Target 27.8% 72.2%
Maximum 12.5% 87.5%
Other Executive Directors Target 29.5% 70.5%
Maximum 13.5% 86.5 %
Fixed (Base salary + Pension) Variable (Bonus + LTI)

78Vodafone Group Plc Annual Report 2012
Equally important as the package design is the setting of the performance targets. The Remuneration Committee consistently set stretching targets which can be seen from the following table of historic payments under both the short- and long-term plans, and ensures that maximum or near maximum payouts are only delivered for exceptional performance.
Year GSTIP % of max GLTI % of max
2009 49% 0%2010 64% 25%2011 62% 31%2012 47% 100%
Alignment to shareholder interestsShare ownership is a key cornerstone of our reward policy and is designed to help maintain commitment over the long-term, and to ensure that the interests of our senior management team are aligned with those of shareholders. Executives are expected to build and maintain a significant shareholding in Vodafone shares as follows:
aa Chief Executive – four times base salary;
aa other executive directors – three times base salary;
aa other Executive Committee members – two times base salary; and
aa senior leadership team members (227 members) – one times base salary.
In all cases executives have been given five years to achieve these goals.
Current levels of ownership, and the date by which the goal should be achieved, are as shown below. These values do not include the value of the shares that will vest in June but which the directors have committed to hold for the next two years.
Goal as a % of salary
Current % of salary
held1% of goal achieved
Value of shareholding
(£m)1Date for goal
to be achieved
Vittorio Colao 400% 581% 145% 6.5 July 2012Andy Halford 300% 653% 218% 4.6 July 2010Michel Combes 300% 301% 100% 2.4 June 2014Stephen Pusey 300% 263% 88% 1.5 June 2014
Note:1 Based on a share price at 31 March 2012 of 172.2 pence and includes the post tax value of any unexercised
options.
Collectively the Executive Committee including the executive directors own 13 million Vodafone shares, with a value of £22 million at 31 March 2012.
Incentive targets linked to business strategyWhen designing our incentives, performance measures are chosen that support our strategic objectives as shown below:
Strategic objectives Supported by
Aiming to deliver organic service revenue growth of 1 – 4% a year until the year ended 31 March 2014, focusing on key areas of growth potential: mobile data, emerging markets, enterprise, total communications and new services.
Revenue and relative performance targets in the GSTIP.
Delivering value and efficiency from scale – continuing to drive benefit from the Group’s scale advantage and maintain our focus on cost.
EBITDA, adjusted free cash flow and relative performance targets in the GSTIP.
Generate liquidity or free cash flow from non-controlled interests – aim to seek to maximise the value of non-controlled interests through generating liquidity or increasing free cash flow in order to fund profitable investments and enhance shareholders returns.
The use of TSR as a performance measure in GLTI as well as the value of the underlying shares.
Apply rigorous capital discipline to investment decisions – continuing to apply capital discipline to our investment decisions through rigorous commercial analysis and demanding investment criteria to ensure any investment in existing businesses or acquisitions will enhance value for shareholders.
Adjusted free cash flow targets in both the GSTIP and GLTI as well as the TSR target in the GLTI.
Assessment of riskVodafone seeks to provide a structure of rewards that encourages acceptable risk taking and high performance through optimal pay mix, performance metrics and calibration, and timing. With that said, it is prudent practice to ensure that our reward programmes achieve this and do not encourage excessive or inappropriate risk taking. On a regular basis, the Remuneration Committee has considered the risk involved in the incentive schemes and is satisfied that the following design elements and governance procedures mitigate the principal risks:
aa the heavy weighting on long-term incentives with overlapping performance periods which reward sustained performance;
aa the proportionately higher incentive opportunity paid in shares rather than in cash;
aa the need for a significant annual investment in company shares in order to fully participate in the long-term arrangements;
aa the considerable weighting on non-financial measures in the short-term plan which provides an external perspective on our performance by focusing on customer satisfaction and performance relative to our competitors;
aa the fact that executives do not participate in sales commission or uncapped incentive schemes; and
aa the fact that the Committee has the ability to exercise discretion in determining the outcome of awards paid out or vesting.
The Remuneration Committee will continue to consider the risks involved in the incentive plans on an ongoing basis.
Directors’ remuneration (continued)
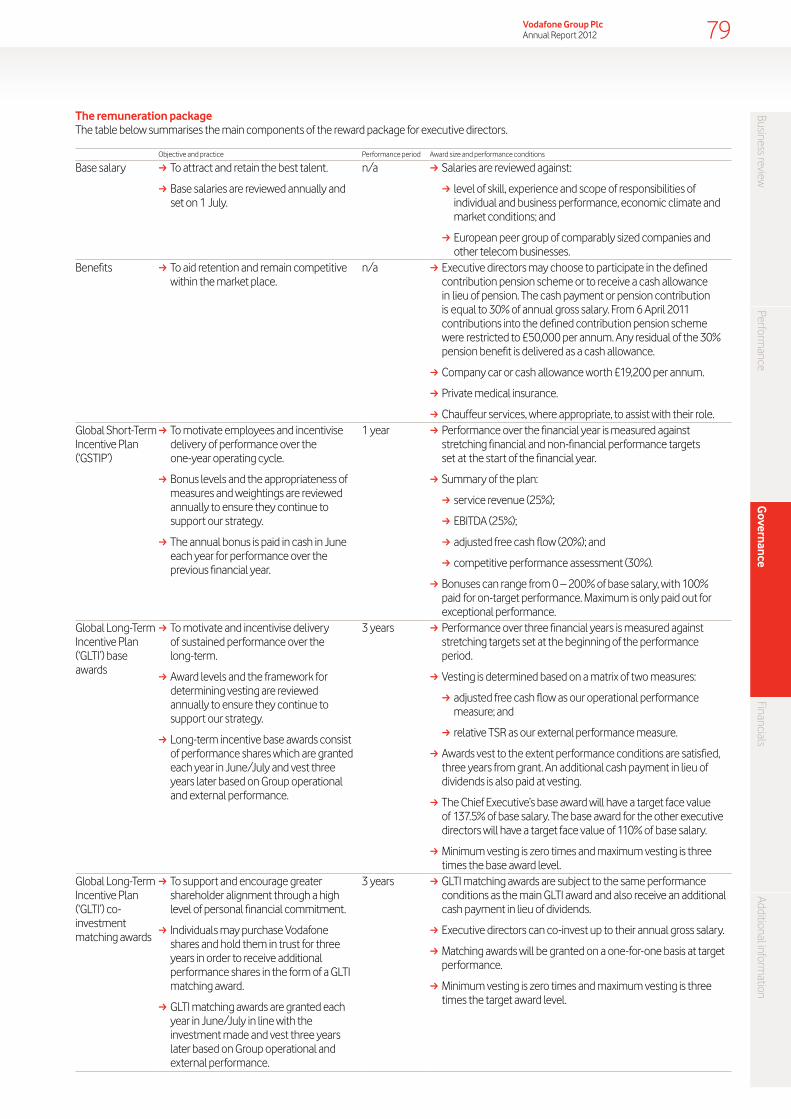
Business reviewPerform
anceG
overnanceFinancials
Additional information
79Vodafone Group Plc Annual Report 2012
The remuneration package The table below summarises the main components of the reward package for executive directors.
Objective and practice Performance period Award size and performance conditions
Base salary aa To attract and retain the best talent.
aa Base salaries are reviewed annually and set on 1 July.
n/a aa Salaries are reviewed against:
aa level of skill, experience and scope of responsibilities of individual and business performance, economic climate and market conditions; and
aa European peer group of comparably sized companies and other telecom businesses.
Benefits aa To aid retention and remain competitive within the market place.
n/a aa Executive directors may choose to participate in the defined contribution pension scheme or to receive a cash allowance in lieu of pension. The cash payment or pension contribution is equal to 30% of annual gross salary. From 6 April 2011 contributions into the defined contribution pension scheme were restricted to £50,000 per annum. Any residual of the 30% pension benefit is delivered as a cash allowance.
aa Company car or cash allowance worth £19,200 per annum.
aa Private medical insurance.
aa Chauffeur services, where appropriate, to assist with their role.Global Short-Term Incentive Plan (‘GSTIP’)
aa To motivate employees and incentivise delivery of performance over the one-year operating cycle.
aa Bonus levels and the appropriateness of measures and weightings are reviewed annually to ensure they continue to support our strategy.
aa The annual bonus is paid in cash in June each year for performance over the previous financial year.
1 year aa Performance over the financial year is measured against stretching financial and non-financial performance targets set at the start of the financial year.
aa Summary of the plan:
aa service revenue (25%);
aa EBITDA (25%);
aa adjusted free cash flow (20%); and
aa competitive performance assessment (30%).
aa Bonuses can range from 0 – 200% of base salary, with 100% paid for on-target performance. Maximum is only paid out for exceptional performance.
Global Long-Term Incentive Plan (‘GLTI’) base awards
aa To motivate and incentivise delivery of sustained performance over the long-term.
aa Award levels and the framework for determining vesting are reviewed annually to ensure they continue to support our strategy.
aa Long-term incentive base awards consist of performance shares which are granted each year in June/July and vest three years later based on Group operational and external performance.
3 years aa Performance over three financial years is measured against stretching targets set at the beginning of the performance period.
aa Vesting is determined based on a matrix of two measures:
aa adjusted free cash flow as our operational performance measure; and
aa relative TSR as our external performance measure.
aa Awards vest to the extent performance conditions are satisfied, three years from grant. An additional cash payment in lieu of dividends is also paid at vesting.
aa The Chief Executive’s base award will have a target face value of 137.5% of base salary. The base award for the other executive directors will have a target face value of 110% of base salary.
aa Minimum vesting is zero times and maximum vesting is three times the base award level.
Global Long-Term Incentive Plan (‘GLTI’) co-investment matching awards
aa To support and encourage greater shareholder alignment through a high level of personal financial commitment.
aa Individuals may purchase Vodafone shares and hold them in trust for three years in order to receive additional performance shares in the form of a GLTI matching award.
aa GLTI matching awards are granted each year in June/July in line with the investment made and vest three years later based on Group operational and external performance.
3 years aa GLTI matching awards are subject to the same performance conditions as the main GLTI award and also receive an additional cash payment in lieu of dividends.
aa Executive directors can co-invest up to their annual gross salary.
aa Matching awards will be granted on a one-for-one basis at target performance.
aa Minimum vesting is zero times and maximum vesting is three times the target award level.
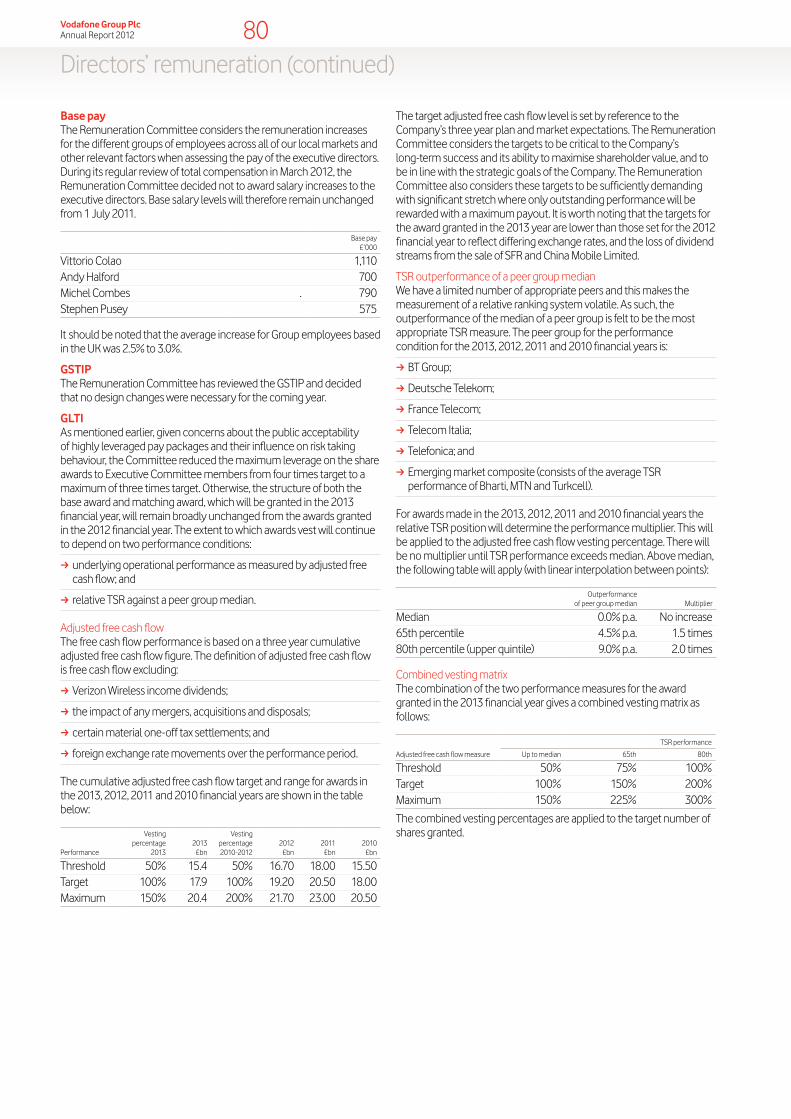
80Vodafone Group Plc Annual Report 2012
Base payThe Remuneration Committee considers the remuneration increases for the different groups of employees across all of our local markets and other relevant factors when assessing the pay of the executive directors. During its regular review of total compensation in March 2012, the Remuneration Committee decided not to award salary increases to the executive directors. Base salary levels will therefore remain unchanged from 1 July 2011.
Base pay£’000
Vittorio Colao 1,110Andy Halford 700Michel Combes . 790Stephen Pusey 575
It should be noted that the average increase for Group employees based in the UK was 2.5% to 3.0%.
GSTIPThe Remuneration Committee has reviewed the GSTIP and decided that no design changes were necessary for the coming year.
GLTIAs mentioned earlier, given concerns about the public acceptability of highly leveraged pay packages and their influence on risk taking behaviour, the Committee reduced the maximum leverage on the share awards to Executive Committee members from four times target to a maximum of three times target. Otherwise, the structure of both the base award and matching award, which will be granted in the 2013 financial year, will remain broadly unchanged from the awards granted in the 2012 financial year. The extent to which awards vest will continue to depend on two performance conditions:
aa underlying operational performance as measured by adjusted free cash flow; and
aa relative TSR against a peer group median.
Adjusted free cash flowThe free cash flow performance is based on a three year cumulative adjusted free cash flow figure. The definition of adjusted free cash flow is free cash flow excluding:
aa Verizon Wireless income dividends;
aa the impact of any mergers, acquisitions and disposals;
aa certain material one-off tax settlements; and
aa foreign exchange rate movements over the performance period.
The cumulative adjusted free cash flow target and range for awards in the 2013, 2012, 2011 and 2010 financial years are shown in the table below:
Performance
Vesting percentage
20132013
£bn
Vesting percentage 2010-2012
2012 £bn
2011 £bn
2010 £bn
Threshold 50% 15.4 50% 16.70 18.00 15.50 Target 100% 17.9 100% 19.20 20.50 18.00 Maximum 150% 20.4 200% 21.70 23.00 20.50
The target adjusted free cash flow level is set by reference to the Company’s three year plan and market expectations. The Remuneration Committee considers the targets to be critical to the Company’s long-term success and its ability to maximise shareholder value, and to be in line with the strategic goals of the Company. The Remuneration Committee also considers these targets to be sufficiently demanding with significant stretch where only outstanding performance will be rewarded with a maximum payout. It is worth noting that the targets for the award granted in the 2013 year are lower than those set for the 2012 financial year to reflect differing exchange rates, and the loss of dividend streams from the sale of SFR and China Mobile Limited.
TSR outperformance of a peer group medianWe have a limited number of appropriate peers and this makes the measurement of a relative ranking system volatile. As such, the outperformance of the median of a peer group is felt to be the most appropriate TSR measure. The peer group for the performance condition for the 2013, 2012, 2011 and 2010 financial years is:
aa BT Group;
aa Deutsche Telekom;
aa France Telecom;
aa Telecom Italia;
aa Telefonica; and
aa Emerging market composite (consists of the average TSR performance of Bharti, MTN and Turkcell).
For awards made in the 2013, 2012, 2011 and 2010 financial years the relative TSR position will determine the performance multiplier. This will be applied to the adjusted free cash flow vesting percentage. There will be no multiplier until TSR performance exceeds median. Above median, the following table will apply (with linear interpolation between points):
Outperformance of peer group median Multiplier
Median 0.0% p.a. No increase65th percentile 4.5% p.a. 1.5 times80th percentile (upper quintile) 9.0% p.a. 2.0 times
Combined vesting matrix The combination of the two performance measures for the award granted in the 2013 financial year gives a combined vesting matrix as follows:
TSR performance
Adjusted free cash flow measure Up to median 65th 80th
Threshold 50% 75% 100% Target 100% 150% 200% Maximum 150% 225% 300%
The combined vesting percentages are applied to the target number of shares granted.
Directors’ remuneration (continued)

Business reviewPerform
anceG
overnanceFinancials
Additional information
81Vodafone Group Plc Annual Report 2012
Estimates of total future potential remuneration from 2013 pay packagesThe tables below provide estimates of the potential future remuneration for each of the executive directors based on the remuneration opportunity granted in the 2013 financial year. Potential outcomes based on different performance scenarios are provided for each executive director.
Vittorio Colao, Chief Executive
10,000
12,000
8,000
6,000
4,000
2,000
0
Minimum Target Maximum
£’000 Salary and benefits GSTIP GLTI base award GLTI matching awardAndy Halford, Chief Financial Officer
10,000
12,000
8,000
6,000
4,000
2,000
0
Minimum Target Maximum
£’000 Salary and benefits GSTIP GLTI base award GLTI matching award
Michel Combes, Regional CEO Europe
10,000
12,000
8,000
6,000
4,000
2,000
0
Minimum Target Maximum
£’000 Salary and benefits GSTIP GLTI base award GLTI matching awardStephen Pusey, Chief Technology Officer
10,000
12,000
8,000
6,000
4,000
2,000
0
Minimum Target Maximum
£’000 Salary and benefits GSTIP GLTI base award GLTI matching award
The assumptions underlying each scenario are described below.
All scenariosaa Other benefits reflect those which were paid in the year to 31 March 2012, plus pension.
aa Each executive is assumed to co-invest the maximum allowed under the GLTI, 100% of salary, and the GLTI matching award reflects this.
aa The amounts shown for the GSTIP and GLTI are based on the salary disclosed on page 80. The actual amounts for the GLTI will be based on the share price on the date the award vests in 2015. They do not include an estimate of dividend equivalents which accumulate on the vested shares and are paid in cash to the executive after the award vests.
Below thresholdaa No pay for performance is payable.
Targetaa The target award opportunity for the GSTIP is 100% of base salary.
aa The target levels of performance for the GLTI are discussed in detail on page 80. We assumed that TSR performance was at median.
Maximumaa Two times the target award opportunity is payable under the GSTIP.
aa The maximum levels of performance for the GLTI are discussed in detail on page 80. We assumed that TSR performance was at or above the 80th percentile.

82Vodafone Group Plc Annual Report 2012
Cascade to senior management The principles of the reward policy for executive directors are cascaded, where appropriate, to the other members of the Executive Committee as set out below.
Cascade of policy to Executive Committee – 2012 financial year
Total remuneration and base salaryMethodology consistent with the executive directors.Annual bonusThe annual bonus is based on the same measures. For some individuals these are measured within a region rather than across the whole Group.Long-term incentiveThe long-term incentive is consistent with the executive directors including the opportunity to invest in the GLTI to receive matching awards. In addition, Executive Committee members have a share ownership requirement of two times base salary.
Service contracts of executive directorsThe Remuneration Committee has determined that after an initial term of up to two years’ duration executive directors’ contracts should thereafter have rolling terms and be terminable on no more than 12 months notice.
The table below summarises the key elements of their service contract:
Provision Detailed items
Notice period 12 monthsRetirement date Normal retirement date
Termination payment
Up to 12 months salaryBonus paid up to termination dayEntitlements under incentive plans and benefits that are consistent with the terms of such plans
Remuneration Salary, pension and benefitsCompany car or cash allowanceParticipation in the GSTIP, GLTI and the employee share schemes
Non-competition During employment and for 12 months thereafter
Date of service agreement
Vittorio Colao 27 May 2008Andy Halford 20 May 2005Michel Combes 1 June 2009Stephen Pusey 1 June 2009
Additionally, all of the Company’s share plans contain provisions relating to a change of control. Outstanding awards and options would normally vest and become exercisable on a change of control to the extent that any performance condition has been satisfied. The Remuneration Committee may also decide that the extent to which an award will vest will be further reduced pro-rata to reflect the acceleration of vesting.
Fees retained for external non-executive directorshipsExecutive directors may hold positions in other companies as non-executive directors. Michel Combes was the only executive director with such positions held at Assystem SA and ISS Group, and in accordance with Group policy he retained fees for the year of €24,545 from Assystem SA and DKK 407,292 from ISS Group (£66,112 in total).
All-employee share plansThe executive directors are also eligible to participate in the all-employee plans.
Summary of plans
SharesaveThe Vodafone Group 2008 Sharesave Plan is an HM Revenue & Customs (‘HMRC’) approved scheme open to all staff permanently employed by a Vodafone Company in the UK as of the eligibility date. Options under the plan are granted at up to a 20% discount to market value. Executive directors’ participation is included in the option table on page 85.Share Incentive PlanThe Vodafone Share Incentive Plan is an HMRC approved plan open to all staff permanently employed by a Vodafone Company in the UK. Participants may contribute up to a maximum of £125 per month (or 5% of salary if less) which the trustee of the plan uses to buy shares on their behalf. An equivalent number of shares are purchased with contributions from the employing company. UK-based executive directors are eligible to participate.
DilutionAll awards are made under plans that incorporate dilution limits as set out in the guidelines for share incentive schemes published by the Association of British Insurers. The current estimated dilution from subsisting executive awards is approximately 3.1% of the Company’s share capital at 31 March 2012 (3.1% at 31 March 2011), whilst from all employee share awards it is approximately 0.3% (0.3% at 31 March 2011). This gives a total dilution of 3.4% (3.4% at 31 March 2011).
FundingA mixture of newly issued shares, treasury shares and shares purchased in the market by the employee benefit trust are used to satisfy share-based awards. This policy is kept under review.
TSR performanceThe following chart is included in order to be compliant with the requirements of the large and medium sized companies and Groups (Accounts and Reports) Regulations 2008. Data was provided by FTSE and DataStream and shows performance of the Company relative to the FTSE 100 index over a five year period, of which we were a constituent throughout the year. It should be noted that the payout from the long-term incentive plan is based on the TSR performance shown in the graph on page 77 and not on the graph below.
Five year historical TSR performance growth in the value of a hypothetical £100 holding over five years
175
150
125
100
75
50
03/07 03/08 03/09 03/10 03/11 03/12
Vodafone FSTE 100 FTSE 100 comparison based on spot values
100116
94100
67
132
101
162
109
170
110
Directors’ remuneration (continued)
Other considerationsIn this section we include all other disclosures that are currently required by statute or good practice guidelines.

Business reviewPerform
anceG
overnanceFinancials
Additional information
83Vodafone Group Plc Annual Report 2012
Audited information for executive directorsRemuneration for the year ended 31 March 2012This table1 shows the remuneration of the executive directors during the year in the currently prescribed format. The table on page 76 includes a value for GLTI payments. All other numbers are identical.
Vittorio Colao Andy Halford Michel Combes Stephen Pusey 2012 2011 2012 2011 2012 2011 2012 2011
£’000 £’000 £’000 £’000 £’000 £’000 £’000 £’000
Salary/fees 1,099 1,043 700 694 785 763 569 538GSTIP 2 1,037 1,323 654 869 728 745 537 683Cash in lieu of GLTI dividends 545 92 333 70 326 – 110 29Cash in lieu of pension 330 313 210 208 236 229 171 161Benefits /other 3 24 55 30 27 25 22 21 31Total 3,035 2,826 1,927 1,868 2,100 1,759 1,408 1,442
Notes:1 The information in this table is audited.2 Payments are made in June following the end of the financial year. 3 Includes amounts in respect of cost of living allowance, private healthcare and car allowance.
The aggregate remuneration we paid to our Executive Committee (other than our executive directors) for services for the year ended 31 March 2012 is set out below.
2012 2011 £’000 £’000
Salaries/fees 2,822 3,151 GSTIP1 2,758 4,081 Cash in lieu of GLTI dividends 490 89Cash in lieu of pension 747 456 Benefits/other 169 799 Total 6,986 8,576
Note:1 Comprises the incentive scheme information for the Executive Committee members on an equivalent basis to that disclosed for executive directors at the beginning of the report. Details of share incentives awarded to
directors and other members of the Executive Committee are included in footnotes to “Directors’ interests in the shares of the Company – Long-term incentives” on page 84.
PensionsVittorio Colao, Andy Halford, Michel Combes and Stephen Pusey take a cash allowance of 30% of base salary in lieu of pension contributions.
The Executive Committee, including the executive directors, are provided benefits in the event of death in service. They also have an entitlement under a long-term disability plan from which two-thirds of base salary, up to a maximum benefit determined by the insurer, would be provided until normal retirement date.
Pension benefits earned by the director in the year ended 31 March 2012 were:
Total accrued benefit at
31 March 20121
£’000
Change inaccrued
benefit overthe year1
£’000
Transfervalue at
31 March 20112
£’000
Transfervalue at
31 March 20122
£’000
Change intransfer valueover year less
membercontributions
£’000
Change inaccrued
benefit inexcess ofinflation3
£’000
Transfer valueof changein accruedbenefit netof member
contributions£’000
Employerallocation/
contributionto defined
contributionplans £’000
Andy Halford 18.7 0.9 701.2 846.9 145.7 (0.1) (4.8) –
Notes:1 Andy Halford took the opportunity to take early retirement from the pension scheme due to the closure of the scheme on 31 March 2010 (aged 51 years). In accordance with the scheme rules, his accrued pension at this date
was reduced with an early retirement factor for four years to reflect the fact that his pension is being paid before age 55 and is therefore expected to be paid out for a longer period of time. In addition, Andy Halford exchanged part of his early retirement pension at 31 March 2010 for a tax-free cash lump sum of £118,660. The pension in payment at 31 March 2010 was £17,800 per year, and this increased on 1 April 2011 by 5%, in line with the scheme rules, to £18,700 per year and remained so at 31 March 2012, as shown above. No member contributions are payable as Andy Halford is in receipt of his pension.
2 The transfer value at 31 March 2012 has been calculated on the basis and methodology set by the trustees after taking actuarial advice, as set out in the papers entitled “Calculation of cash equivalent transfer values” dated January 2011 and “Sex-specific actuarial factor” dated March 2011. No director elected to pay additional voluntary contributions. The transfer value disclosed above does not represent a sum paid or payable to the individual director. Instead it represents a potential liability of the pension scheme.
3 Inflation has been taken as the increase in the retail price index over the year to 30 September 2011.
In respect of the Executive Committee, the Group has made aggregate contributions of £100,000 (2011: £508,600) into defined contribution pension schemes.

84Vodafone Group Plc Annual Report 2012
Directors’ interests in the shares of the Company – long-term incentivesPerformance sharesGLTI conditional share awards granted to executive directors for the relevant financial years are shown below. It is important to note that the figures shown in the first two columns represent the maximum amount which could vest at the end of the relevant three year performance period. In order to participate in these plans, executives have had to invest personal shares with a combined value of: £3,342,473 (Vittorio Colao); £2,035,516 (Andy Halford); £1,118,582 (Michel Combes); and £762,856 (Stephen Pusey). The total value is calculated using the closing mid-market share price on 31 March 2012 of 172.2 pence.
Total interest in performance shares
at 1 April 2011or date of
appointment
Sharesconditionally
awardedduring the 2012
financial year1
Sharesforfeited
duringthe 2012
financial year2
Sharesvested during
the 2012financial year2
Total interestin performance
shares at31 March 2012 Total value
Marketprice at date
awardsgranted Vesting date
Number of shares
Numberof shares
Numberof shares
Numberof shares
Numberof shares £’000 Pence
Vittorio Colao2008 – Base award 4,126,587 – (2,863,852) (1,262,735) – – 129.95 Jul 20112008 – Match award 3,001,154 – (2,082,801) (918,353) – – 129.95 Jul 20112009 – Base award 4,564,995 – – – 4,564,995 7,861 117.47 Jun 20122009 – Match award 1,817,866 – – – 1,817,866 3,130 117.47 Jun 20122010 – Base award 4,097,873 – – – 4,097,873 7,057 142.94 Jun 20132010 – Match award 2,980,271 – – – 2,980,271 5,132 142.94 Jun 20132011 – Base award – 3,740,808 – – 3,740,808 6,442 163.20 Jun 20142011 – Match award – 2,720,588 – – 2,720,588 4,685 163.20 Jun 2014Total 20,588,746 6,461,396 (4,946,653) (2,181,088) 19,922,401 34,307
Andy Halford2008 – Base award 2,282,447 – (1,584,019) (698,428) – – 129.95 Jul 20112008 – Match award 2,074,952 – (1,440,017) (634,935) – – 129.95 Jul 20112009 – Base award 2,524,934 – – – 2,524,934 4,348 117.47 Jun 20122009 – Match award 1,676,756 – – – 1,676,756 2,887 117.47 Jun 20122010 – Base award 2,154,750 – – – 2,154,750 3,710 142.94 Jun 20132010 – Match award 1,958,863 – – – 1,958,863 3,373 142.94 Jun 20132011 – Base award – 1,887,254 – – 1,887,254 3,250 163.20 Jun 20142011 – Match award – 756,036 – – 756,036 1,302 163.20 Jun 2014Total 12,672,702 2,643,290 (3,024,036) (1,333,363) 10,958,593 18,870
Michel Combes2008 – Base award 2,589,782 – (1,797,309) (792,473) – – 129.95 Feb 20122008 – Match award 736,919 – (511,422) (225,497) – – 129.95 Feb 20122009 – Base award 2,771,771 – – 2,771,771 4,773 117.47 Jun 20122009 – Match award 533,854 – – – 533,854 919 117.47 Jun 20122010 – Base award 2,370,225 – – – 2,370,225 4,082 142.94 Jun 20132010 – Match award 1,144,116 – – – 1,144,116 1,970 142.94 Jun 20132011 – Base award – 2,129,901 – – 2,129,901 3,668 163.20 Jun 20142011 – Match award – 876,531 – – 876,531 1,509 163.20 Jun 2014Total 10,146,667 3,006,432 (2,308,731) (1,017,970) 9,826,398 16,921
Stephen Pusey2008 – Base award 942,132 – (653,840) (288,292) – – 129.95 Jul 20112008 – Match award 500,844 – (347,586) (153,258) – – 129.95 Jul 20112009 – Base award 1,872,818 – – – 1,872,818 3,225 117.47 Jun 20122009 – Match award 510,879 – – – 510,879 880 117.47 Jun 20122010 – Base award 1,693,018 – – – 1,693,018 2,915 142.94 Jun 20132010 – Match award 571,097 – – – 571,097 983 142.94 Jun 20132011 – Base award – 1,550,245 – – 1,550,245 2,670 163.20 Jun 20142011 – Match award – 612,745 – – 612,745 1,055 163.20 Jun 2014Total 6,090,788 2,162,990 (1,001,426) (441,550) 6,810,802 11,728
Notes:1 The awards were granted during the year under the Vodafone GIP using the closing share price on the day before the grant which was 163.2 pence. These awards have a performance period running from 1 April 2011 to
31 March 2014. The performance conditions are a matrix of adjusted free cash flow performance and relative TSR. The vesting date will be in June 2014.2 Shares granted on 29 July 2008 vested on 29 July 2011. The performance conditions on these awards were a matrix of adjusted free cash flow performance and relative TSR, and the resulting vesting was 30.6% of maximum.
The share price on the vesting date was 171.7 pence.
The aggregate number of shares conditionally awarded during the year to the Executive Committee, other than the executive directors, was 10,865,023 shares. The performance and vesting conditions on the shares awarded in the year are based on a matrix of adjusted free cash flow performance and relative TSR.
Directors’ remuneration (continued)

Business reviewPerform
anceG
overnanceFinancials
Additional information
85Vodafone Group Plc Annual Report 2012
Share optionsNo share options have been granted to directors during the year. The following information summarises the executive directors’ options under the Vodafone Group 2008 Sharesave Plan (‘SAYE’), the Vodafone Group Plc 1999 Long-Term Stock Incentive Plan (‘LTSIP’) and the Vodafone Global Incentive Plan (‘GIP’). HMRC approved awards may be made under all of the schemes mentioned. No other directors have options under any of these schemes.
Options under the Vodafone Group 2008 Sharesave Plan were granted at a discount of 20% to the market value of the shares at the time of the grant. No other options may be granted at a discount.
At1 April 2011
or date ofappointment
Optionsgranted
during the2012 financial
year
Options exercisedduring the
2012 financialyear
Optionslapsed
during the 2012 financial
year
Optionsheld at
31 March 2012Option
price Date from which
exercisableExpiry
date
Marketprice onexercise
Grant date
Numberof shares
Numberof shares
Numberof shares
Numberof shares
Numberof shares Pence1 Pence
Vittorio ColaoGIP Nov 2006 3,472,975 – – – 3,472,975 135.50 Nov 2009 Nov 2016 –GIP2 Jul 2007 3,003,575 – – – 3,003,575 167.80 Jul 2010 Jul 2017 –SAYE Jul 2009 16,568 – – – 16,568 93.85 Sep 2014 Feb 2015 –Total 6,493,118 – – – 6,493,118
Andy HalfordLTSIP Jul 2001 152,400 – (152,400) – 151.56 Jul 2004 Jul 2011 163.3LTSIP Jul 2005 1,291,326 – – – 1,291,326 145.25 Jul 2008 Jul 2015 –GIP2 Jul 2007 2,295,589 – – – 2,295,589 167.80 Jul 2010 Jul 2017 –SAYE Jul 2009 9,669 – – – 9,669 93.85 Sep 2012 Feb 2013 –Total 3,748,984 – (152,400) 3,596,584
Michel CombesSAYE Jul 2009 9,669 – – – 9,669 93.85 Sep 2012 Feb 2013 –Total 9,669 – – – 9,669
Stephen PuseyGIP Sep 2006 1,034,259 – – – 1,034,259 113.75 Sep 2009 Aug 2016 –GIP2 Jul 2007 947,556 – – – 947,556 167.80 Jul 2010 Jul 2017 –SAYE Jul 2009 9,669 – – – 9,669 93.85 Sep 2012 Feb 2013 –Total 1,991,484 – – – 1,991,484
Notes:1 The closing mid-market share price on 31 March 2012 was 172.2 pence. The highest mid-market share price during the year was 183.9 pence and the lowest price was 154.0 pence.2 The performance condition on these options is a three year cumulative growth in adjusted earnings per share. The options vested at 100% on 24 July 2010.
Non-executive directors’ remunerationThe remuneration of non-executive directors is reviewed annually by the Chairman following consultation with the Remuneration Committee Chairman. Our policy is to pay competitively for the role including consideration of the time commitment required. In this regard, the fees are benchmarked against a comparator group of the FTSE 15 companies. Following the 2012 review there will be no increases to the fees of non-executive directors.
Position/roleFee payable (£’000)
From 1 April 2012
Chairman1 600 Deputy Chairman 175 Non-executive director 115 Chairmanship of Audit and Risk Committee 25 Chairmanship of Remuneration Committee 25
Note:1 The Chairman’s fee also includes the fee for the Chairmanship of the Nominations and Governance Committee.
In addition, an allowance of £6,000 is payable each time a non-Europe based non-executive director is required to travel to attend Board and committee meetings to reflect the additional time commitment involved.
Details of each non-executive director’s remuneration for the 2012 financial year are included in the table on page 86.
Non-executive directors do not participate in any incentive or benefit plans. The Company does not provide any contribution to their pension arrangements. The Chairman is entitled to use of a car and a driver whenever and wherever he is providing his services to or representing the Company.

86Vodafone Group Plc Annual Report 2012
Chairman and non-executive director service contractsGerard Kleisterlee became Chairman on the 26 July 2011, succeeding Sir John Bond who stepped down following the AGM.
Non-executive directors, including the Deputy Chairman, are engaged on letters of appointment that set out their duties and responsibilities. The appointment of non-executive directors may be terminated without compensation. Non-executive directors are generally not expected to serve for a period exceeding nine years. For further information refer to “Nomination and Governance Committee” on page 68.
The terms and conditions of appointment of non-executive directors are available for inspection at the Company’s registered office during normal business hours and at the AGM (for 15 minutes prior to the meeting and during the meeting).
Date of letter of appointment
Date ofelection/re-election
John Buchanan 28 April 2003 AGM 2012Renee James 1 January 2011 AGM 2012Alan Jebson 7 November 2006 AGM 2012Samuel Jonah 9 March 2009 AGM 2012Gerard Kleisterlee 1 April 2011 AGM 2012Nick Land 7 November 2006 AGM 2012Anne Lauvergeon 20 September 2005 AGM 2012Luc Vandevelde 24 June 2003 AGM 2012Anthony Watson 6 February 2006 AGM 2012Philip Yea 14 July 2005 AGM 2012
Audited information for non-executive directors serving during the year ended 31 March 2012 Salary/fees Benefits Total
2012 £’000
2011£’000
2012£’000
2011£’000
2012£’000
2011£’000
Chairman Sir John Bond (retired 26 July 2011) 200 600 1 3 201 603 Gerard Kleisterlee 438 – – – 438 –Deputy Chairman John Buchanan 175 162 – – 175 162 Non-executive directors Renee James1 139 35 – – 139 35 Alan Jebson1 145 151 – – 145 151 Samuel Jonah1 139 151 – – 139 151 Nick Land 140 140 – – 140 140 Anne Lauvergeon 115 115 – – 115 115 Luc Vandevelde 140 135 – – 140 135 Anthony Watson 115 115 – – 115 115 Philip Yea 115 115 – – 115 115 Former non-executive directors Simon Murray (retired 26 July 2010) – 38 – – – 38Total 1,861 1,757 1 3 1,862 1,760
Note:1 Salary/fees include travel allowances.
Directors’ remuneration (continued)

Business reviewPerform
anceG
overnanceFinancials
Additional information
87Vodafone Group Plc Annual Report 2012
Beneficial interestsThe beneficial interests of directors and their connected persons in the ordinary shares of the Company, which includes interests in the Vodafone Share Incentive Plan, but which excludes interests in the Vodafone Group share option schemes, and the Vodafone Group short-term or long-term incentives, are shown below:
21 May 2012 31 March 2012
1 April 2011 ordate of appointment
John Buchanan 239,361 239,361 222,223Vittorio Colao 3,354,896 3,354,896 2,307,663Andy Halford 2,527,943 2,527,649 2,335,622Michel Combes 1,379,398 1,379,104 670,297Stephen Pusey 698,264 698,264 544,733Renee James 50,000 50,000 50,000Alan Jebson 82,340 82,340 82,340Samuel Jonah 55,350 55,350 55,350Gerard Kleisterlee1 100,000 100,000 –Nick Land 35,000 35,000 35,000Anne Lauvergeon 28,936 28,936 28,936Luc Vandevelde 90,478 90,478 89,030Anthony Watson 115,000 115,000 115,000Philip Yea 61,249 61,249 61,249
Note:1 Non-executive directors appointed to the Board during the financial year are as follows: Gerard Kleisterlee 1 April 2011.
At 31 March 2012 and during the period from 1 April 2012 to 21 May 2012, no director had any interest in the shares of any subsidiary company. Other than those individuals included in the table above who were Board members at 31 March 2012, members of the Group’s Executive Committee at 31 March 2012 had an aggregate beneficial interest in 4,274,128 ordinary shares of the Company. At 21 May 2012 the directors had an aggregate beneficial interest in 8,818,215 ordinary shares of the Company and the Executive Committee members had an aggregate beneficial interest in 4,274,716 ordinary shares of the Company. None of the directors or the Executive Committee members had an individual beneficial interest amounting to greater than 1% of the Company’s ordinary shares.
Interests in share options of the CompanyAt 21 May 2012 there had been no change to the directors’ interests in share options from 31 March 2012 (see page 85).
Other than those individuals included in the table above, at 21 May 2012 members of the Group’s Executive Committee held options for 2,592,271 ordinary shares at prices ranging from 115.3 pence to 167.8 pence per ordinary share, with a weighted average exercise price of 162.2 pence per ordinary share exercisable at dates ranging from July 2008 to July 2017.
John Buchanan, Renee James, Alan Jebson, Samuel Jonah, Gerard Kleisterlee, Nick Land, Anne Lauvergeon, Luc Vandevelde, Anthony Watson and Philip Yea held no options at 21 May 2012.
Directors’ interests in contractsNone of the current directors had a material interest in any contract of significance to which the Company or any of its subsidiaries was a party during the financial year.
Luc VandeveldeOn behalf of the Board
22 May 2012

88Vodafone Group Plc Annual Report 2012
Contents
89 Directors’ statement of responsibility
90 Audit report on internal controls91 Critical accounting estimates93 Audit report on the consolidated
financial statements94 Consolidated financial statements
94 Consolidated income statement 94 Consolidated statement
of comprehensive income95 Consolidated statement
of financial position96 Consolidated statement
of changes in equity 97 Consolidated statement
of cash flows
98 Notes to the consolidated financial statements:98 1. Basis of preparation98 2. Significant accounting policies106 3. Segment analysis108 4. Operating profit109 5. Investment income and
financing costs109 6. Taxation112 7. Equity dividends112 8. Earnings per share113 9. Intangible assets114 10. Impairment117 11. Property, plant and
equipment118 12. Principal subsidiaries119 13. Investments in joint ventures120 14. Investments in associates120 15. Other investments121 16. Inventory121 17. Trade and other receivables122 18. Cash and cash equivalents122 19. Called up share capital122 20. Share-based payments124 21. Capital and financial risk
management128 22. Borrowings133 23. Post employment benefits135 24. Provisions 136 25. Trade and other payables136 26. Disposals137 27. Reconciliation of net cash
flow from operating activities137 28. Commitments138 29. Contingent liabilities139 30. Directors and key
management compensation140 31. Related party transactions141 32. Employees141 33. Subsequent events
142 Audit report on the Company financial statements
143 Company financial statements of Vodafone Group Plc
144 Notes to the Company financial statements:144 1. Basis of preparation144 2. Significant accounting policies145 3. Fixed assets146 4. Debtors146 5. Other investments146 6. Creditors146 7. Share capital147 8. Share-based payments147 9. Reserves and reconciliation
of movements in equity shareholders’ funds
148 10. Equity dividends148 11. Contingent liabilities

Business reviewPerform
anceG
overnanceFinancials
Additional information
89Vodafone Group Plc Annual Report 2012
Financial statements and accounting recordsCompany law of England and Wales requires the directors to prepare financial statements for each financial year which give a true and fair view of the state of affairs of the Company and of the Group at the end of the financial year and of the profit or loss of the Group for that period. In preparing those financial statements the directors are required to:
aa select suitable accounting policies and apply them consistently;
aa make judgements and estimates that are reasonable and prudent;
aa state whether the consolidated financial statements have been prepared in accordance with International Financial Reporting Standards (‘IFRS’) as issued by the IASB, in accordance with IFRS as adopted for use in the EU and Article 4 of the EU IAS Regulations;
aa state for the Company financial statements whether applicable UK accounting standards have been followed; and
aa prepare the financial statements on a going concern basis unless it is inappropriate to presume that the Company and the Group will continue in business.
The directors are responsible for keeping proper accounting records which disclose with reasonable accuracy at any time the financial position of the Company and of the Group and to enable them to ensure that the financial statements comply with the Companies Act 2006 and Article 4 of the EU IAS Regulation. They are also responsible for the system of internal control, for safeguarding the assets of the Company and the Group and, hence, for taking reasonable steps for the prevention and detection of fraud and other irregularities.
Directors’ responsibility statementThe Board confirms to the best of its knowledge:
aa the consolidated financial statements, prepared in accordance with IFRS as issued by the International Accounting Standards Board (‘IASB’) and IFRS as adopted by the EU, give a true and fair view of the assets, liabilities, financial position and profit or loss of the Group; and
aa the directors’ report includes a fair review of the development and performance of the business and the position of the Group together with a description of the principal risks and uncertainties that it faces.
Neither the Company nor the directors accept any liability to any person in relation to the annual report except to the extent that such liability could arise under English law. Accordingly, any liability to a person who has demonstrated reliance on any untrue or misleading statement or omission shall be determined in accordance with section 90A and schedule 10A of the Financial Services and Markets Act 2000.
Disclosure of information to auditorHaving made the requisite enquiries, so far as the directors are aware, there is no relevant audit information (as defined by section 418(3) of the Companies Act 2006) of which the Company’s auditor is unaware and the directors have taken all the steps they ought to have taken to make themselves aware of any relevant audit information and to establish that the Company’s auditor is aware of that information.
Going concernAfter reviewing the Group’s and Company’s budget for the next financial year, and other longer term plans, the directors are satisfied that, at the time of approving the financial statements, it is appropriate to adopt the going concern basis in preparing the financial statements. Further detail is included within liquidity and capital resources on pages 55 to 59 and notes 21 and 22 to the consolidated financial statements which include disclosure in relation to the Group’s objectives, policies and processes for managing its capital; its financial risk management objectives; details of its financial instruments and hedging activities; and its exposures to credit risk and liquidity risk.
Management’s report on internal control over financial reportingAs required by section 404 of the Sarbanes-Oxley Act management is responsible for establishing and maintaining adequate internal control over financial reporting for the Group.
The Group’s internal control over financial reporting includes policies and procedures that:
aa pertain to the maintenance of records that, in reasonable detail, accurately and fairly reflect transactions and dispositions of assets;
aa are designed to provide reasonable assurance that transactions are recorded as necessary to permit the preparation of financial statements in accordance with IFRS, as adopted by the EU and IFRS as issued by the IASB, and that receipts and expenditures are being made only in accordance with authorisation of management and the directors of the Company; and
aa provide reasonable assurance regarding prevention or timely detection of unauthorised acquisition, use or disposition of the Group’s assets that could have a material effect on the financial statements.
Any internal control framework, no matter how well designed, has inherent limitations including the possibility of human error and the circumvention or overriding of the controls and procedures, and may not prevent or detect misstatements. Also projections of any evaluation of effectiveness to future periods are subject to the risk that controls may become inadequate because of changes in conditions or because the degree of compliance with the policies or procedures may deteriorate.
Management has assessed the effectiveness of the internal control over financial reporting at 31 March 2012 based on the Internal Control – Integrated Framework, issued by the Committee of Sponsoring Organizations of the Treadway Commission (‘COSO’). Based on management’s assessment management has concluded that the internal control over financial reporting was effective at 31 March 2012.
Management has excluded from its assessment the internal control over financial reporting of entities which are accounted for under the equity method, including Verizon Wireless, because the Group does not have the ability to dictate or modify the controls at these entities and does not have the ability to assess, in practice, the controls at these entities. Accordingly, the internal controls of these entities, which contributed a net profit of £4,963 million (2011: £5,059 million) to the profit for the financial year, have not been assessed, except relating to controls over the recording of amounts relating to the investments that are recorded in the Group’s consolidated financial statements.
During the period covered by this document there were no changes in the Group’s internal control over financial reporting that have materially affected or are reasonably likely to materially affect the effectiveness of the internal controls over financial reporting.
The Group’s internal control over financial reporting at 31 March 2012 has been audited by Deloitte LLP, an independent registered public accounting firm who also audit the Group’s consolidated financial statements. Their audit report on internal control over financial reporting is on page 90.
By Order of the Board
Rosemary MartinCompany Secretary
22 May 2012
Directors’ statement of responsibility

90Vodafone Group Plc Annual Report 2012
Report of independent registered public accounting firm to the members of Vodafone Group Plc We have audited the internal control over financial reporting of Vodafone Group Plc and subsidiaries and applicable joint ventures (the ‘Group’) as of 31 March 2012 based on criteria established in Internal Control – Integrated Framework issued by the Committee of Sponsoring Organizations of the Treadway Commission. As described in management’s report on internal control over financial reporting, management has excluded from its assessment the internal control over financial reporting of those entities that are accounted for under the equity method, including Verizon Wireless, because the Group does not have the ability to dictate or modify controls at these entities and does not have the ability to assess, in practice, the controls at these entities. Accordingly, the internal control over financial reporting of these entities, which contributed a net profit of £4,963 million to the profit for the financial year, have not been assessed, except relating to the Group’s controls over the recording and related disclosures of amounts relating to the investments that are recorded in the consolidated financial statements.
The Group’s management is responsible for maintaining effective internal control over financial reporting and for its assessment of the effectiveness of internal control over financial reporting, included in the accompanying management’s report on internal control over financial reporting. Our responsibility is to express an opinion on the Group’s internal control over financial reporting based on our audit.
We conducted our audit in accordance with the standards of the Public Company Accounting Oversight Board (United States). Those standards require that we plan and perform the audit to obtain reasonable assurance about whether effective internal control over financial reporting was maintained in all material respects. Our audit included obtaining an understanding of internal control over financial reporting, assessing the risk that a material weakness exists, testing and evaluating the design and operating effectiveness of internal control based on the assessed risk, and performing such other procedures as we considered necessary in the circumstances. We believe that our audit provides a reasonable basis for our opinion.
A company’s internal control over financial reporting is a process designed by, or under the supervision of, the company’s principal executive and principal financial officers, or persons performing similar functions, and effected by the company’s board of directors, management, and other personnel to provide reasonable assurance regarding the reliability of financial reporting and the preparation of financial statements for external purposes in accordance with generally accepted accounting principles. A company’s internal control over financial reporting includes those policies and procedures that (1) pertain to the maintenance of records that, in reasonable detail, accurately and fairly reflect the transactions and dispositions of the assets of the company; (2) provide reasonable assurance that transactions are recorded as necessary to permit preparation of financial statements in accordance with generally accepted accounting principles, and that receipts and expenditures of the company are being made only in accordance with authorisations of management and directors of the company; and (3) provide reasonable assurance regarding prevention or timely detection of unauthorised acquisition, use, or disposition of the company’s assets that could have a material effect on the financial statements.
Because of the inherent limitations of internal control over financial reporting, including the possibility of collusion or improper management override of controls, material misstatements due to error or fraud may not be prevented or detected on a timely basis. Also, projections of any evaluation of the effectiveness of the internal control over financial reporting to future periods are subject to the risk that the controls may become inadequate because of changes in conditions, or that the degree of compliance with the policies or procedures may deteriorate.
In our opinion, the Group maintained, in all material respects, effective internal control over financial reporting as of 31 March 2012, based on the criteria established in Internal Control – Integrated Framework issued by the Committee of Sponsoring Organizations of the Treadway Commission.
We have also audited, in accordance with the standards of the Public Company Accounting Oversight Board (United States), the consolidated financial statements of the Group as of and for the year ended 31 March 2012, prepared in conformity with International Financial Reporting Standards (‘IFRS’), as adopted by the European Union and IFRS as issued by the International Accounting Standards Board. Our report dated 22 May 2012 expressed an unqualified opinion on those financial statements.
Deloitte LLPLondon United Kingdom
22 May 2012
Please refer to our Form 20-F to be filed with the Securities and Exchange Commission on 1 June 2012 for the audit opinion over the consolidated financial statements of the Group as of 31 March 2012 and 2011 and for each of the three years in the period ended 31 March 2012 issued in accordance with the standards of the Public Company Accounting Oversight Board (United States).
Audit report on internal controls

Business reviewPerform
anceG
overnanceFinancials
Additional information
91Vodafone Group Plc Annual Report 2012
The Group prepares its consolidated financial statements in accordance with IFRS as issued by the IASB and IFRS as adopted by the EU, the application of which often requires judgements to be made by management when formulating the Group’s financial position and results. Under IFRS, the directors are required to adopt those accounting policies most appropriate to the Group’s circumstances for the purpose of presenting fairly the Group’s financial position, financial performance and cash flows.
In determining and applying accounting policies, judgement is often required in respect of items where the choice of specific policy, accounting estimate or assumption to be followed could materially affect the reported results or net asset position of the Group should it later be determined that a different choice would be more appropriate.
Management considers the accounting estimates and assumptions discussed below to be its critical accounting estimates and, accordingly, provides an explanation of each below.
The discussion below should also be read in conjunction with the Group’s disclosure of significant IFRS accounting policies which is provided in note 2 to the consolidated financial statements, “Significant accounting policies”.
Management has discussed its critical accounting estimates and associated disclosures with the Company’s Audit and Risk Committee.
Impairment reviewsIFRS requires management to undertake an annual test for impairment of indefinite lived assets and, for finite lived assets, to test for impairment if events or changes in circumstances indicate that the carrying amount of an asset may not be recoverable.
Impairment testing is an area involving management judgement, requiring assessment as to whether the carrying value of assets can be supported by the net present value of future cash flows derived from such assets using cash flow projections which have been discounted at an appropriate rate. In calculating the net present value of the future cash flows, certain assumptions are required to be made in respect of highly uncertain matters including management’s expectations of:
aa growth in EBITDA, calculated as adjusted operating profit before depreciation and amortisation;
aa timing and quantum of future capital expenditure;
aa long-term growth rates; and
aa the selection of discount rates to reflect the risks involved.
The Group prepares and approves formal five year management plans for its operations, which are used in the value in use calculations. In certain developing markets the fifth year of the management plan may not be indicative of the long-term future performance as operations may not have reached maturity. For these operations, the Group extends the plan data for an additional five year period.
For businesses where the five year management plans are used for the Group’s value in use calculations, a long-term growth rate into perpetuity has been determined as the lower of:
aa the nominal GDP rates for the country of operation; and
aa the long-term compound annual growth rate in EBITDA in years six to ten estimated by management.
For businesses where the plan data is extended for an additional five years for the Group’s value in use calculations, a long-term growth rate into perpetuity has been determined as the lower of:
aa the nominal GDP rates for the country of operation; and
aa the compound annual growth rate in EBITDA in years nine to ten of the management plan.
Changing the assumptions selected by management, in particular the discount rate and growth rate assumptions used in the cash flow projections, could significantly affect the Group’s impairment evaluation and hence results.
The Group’s review includes the key assumptions related to sensitivity in the cash flow projections. Further details are provided in note 10 to the consolidated financial statements.
Revenue recognition and presentation Arrangements with multiple deliverablesIn revenue arrangements including more than one deliverable, the deliverables are assigned to one or more separate units of accounting and the arrangement consideration is allocated to each unit of accounting based on its relative fair value.
Determining the fair value of each deliverable can require complex estimates due to the nature of the goods and services provided. The Group generally determines the fair value of individual elements based on prices at which the deliverable is regularly sold on a standalone basis after considering volume discounts where appropriate.
Presentation: gross versus netWhen deciding the most appropriate basis for presenting revenue or costs of revenue, both the legal form and substance of the agreement between the Group and its business partners are reviewed to determine each party’s respective role in the transaction.
Where the Group’s role in a transaction is that of principal, revenue is recognised on a gross basis. This requires revenue to comprise the gross value of the transaction billed to the customer, after trade discounts, with any related expenditure charged as an operating cost.
Where the Group’s role in a transaction is that of an agent, revenue is recognised on a net basis with revenue representing the margin earned.
Taxation The Group’s tax charge on ordinary activities is the sum of the total current and deferred tax charges. The calculation of the Group’s total tax charge necessarily involves a degree of estimation and judgement in respect of certain items whose tax treatment cannot be finally determined until resolution has been reached with the relevant tax authority or, as appropriate, through a formal legal process. The final resolution of some of these items may give rise to material profits, losses and/or cash flows.
The complexity of the Group’s structure makes the degree of estimation and judgement more challenging. The resolution of issues is not always within the control of the Group and it is often dependent on the efficiency of the legal processes in the relevant taxing jurisdictions in which the Group operates. Issues can, and often do, take many years to resolve. Payments in respect of tax liabilities for an accounting period result from payments on account and on the final resolution of open items. As a result there can be substantial differences between the tax charge in the consolidated income statement and tax payments.
Recognition of deferred tax assetsThe recognition of deferred tax assets is based upon whether it is more likely than not that sufficient and suitable taxable profits will be available in the future against which the reversal of temporary differences can be deducted. To determine the future taxable profits, reference is made to the latest available profit forecasts. Where the temporary differences are related to losses, relevant tax law is considered to determine the availability of the losses to offset against the future taxable profits.
Significant items on which the Group has exercised accounting judgement include recognition of a deferred tax asset in respect of losses in Germany (see note 6 of the consolidated financial statements) and the recognition of a deferred tax asset in respect of losses in Luxembourg (see note 6 to the consolidated financial statements). The amounts recognised in the consolidated financial statements in respect of each matter are derived from the Group’s best estimation and judgement as described above.
Critical accounting estimates
92Vodafone Group Plc Annual Report 2012
Recognition therefore involves judgement regarding the future financial performance of the particular legal entity or tax group in which the deferred tax asset has been recognised.
Historical differences between forecast and actual taxable profits have not resulted in material adjustments to the recognition of deferred tax assets.
Business combinationsThe recognition of business combinations requires the excess of the purchase price of acquisitions over the net book value of assets acquired to be allocated to the assets and liabilities of the acquired entity. The Group makes judgements and estimates in relation to the fair value allocation of the purchase price. If any unallocated portion is positive it is recognised as goodwill and if negative, it is recognised in the income statement.
GoodwillThe amount of goodwill initially recognised as a result of a business combination is dependent on the allocation of the purchase price to the fair value of the identifiable assets acquired and the liabilities assumed. The determination of the fair value of the assets and liabilities is based, to a considerable extent, on management’s judgement.
Allocation of the purchase price affects the results of the Group as finite lived intangible assets are amortised, whereas indefinite lived intangible assets, including goodwill, are not amortised and could result in differing amortisation charges based on the allocation to indefinite lived and finite lived intangible assets.
On transition to IFRS the Group elected not to apply IFRS 3, “Business combinations”, retrospectively as the difficulty in applying these requirements to the large number of business combinations completed by the Group from incorporation through to 1 April 2004 exceeded any potential benefits. Goodwill arising before the date of transition to IFRS, after adjusting for items including the impact of proportionate consolidation of joint ventures, amounted to £78,753 million.
If the Group had elected to apply the accounting for business combinations retrospectively it may have led to an increase or decrease in goodwill and increase in licences, customer bases, brands and related deferred tax liabilities recognised on acquisition.
Finite lived intangible assetsOther intangible assets include the Group’s aggregate amounts spent on the acquisition of licences and spectrum, computer software, customer bases, brands and development costs. These assets arise from both separate purchases and from acquisition as part of business combinations.
On the acquisition of mobile network operators the identifiable intangible assets may include licences, customer bases and brands. The fair value of these assets is determined by discounting estimated future net cash flows generated by the asset where no active market for the assets exists. The use of different assumptions for the expectations of future cash flows and the discount rate would change the valuation of the intangible assets.
The relative size of the Group’s intangible assets, excluding goodwill, makes the judgements surrounding the estimated useful lives critical to the Group’s financial position and performance.
At 31 March 2012 intangible assets, excluding goodwill, amounted to £21,164 million (2011: £23,322 million) and represented 15.2% (2011: 15.4%) of the Group’s total assets.
Estimation of useful lifeThe useful life used to amortise intangible assets relates to the expected future performance of the assets acquired and management’s judgement of the period over which economic benefit will be derived from the asset. The basis for determining the useful life for the most significant categories of intangible assets is as follows:
Licences and spectrum feesThe estimated useful life is generally the term of the licence unless there is a presumption of renewal at negligible cost. Using the licence term reflects the period over which the Group will receive economic benefit. For technology specific licences with a presumption of renewal at negligible cost, the estimated useful economic life reflects the Group’s expectation of the period over which the Group will continue to receive economic benefit from the licence. The economic lives are periodically reviewed taking into consideration such factors as changes in technology. Historically any changes to economic lives have not been material following these reviews.
Customer basesThe estimated useful life principally reflects management’s view of the average economic life of the customer base and is assessed by reference to customer churn rates. An increase in churn rates may lead to a reduction in the estimated useful life and an increase in the amortisation charge. Historically changes to the estimated useful lives have not had a significant impact on the Group’s results and financial position.
Capitalised softwareThe useful life is determined by management at the time the software is acquired and brought into use and is regularly reviewed for appropriateness. For computer software licences, the useful life represents management’s view of expected term over which the Group will receive benefits from the software, but not exceeding the licence term. For unique software products controlled by the Group, the life is based on historical experience with similar products as well as anticipation of future events which may impact their life such as changes in technology. Historically changes in useful lives have not resulted in material changes to the Group’s amortisation charge.
Property, plant and equipmentProperty, plant and equipment also represent a significant proportion of the asset base of the Group being 13.4% (2011: 13.3%) of the Group’s total assets. Therefore the estimates and assumptions made to determine their carrying value and related depreciation are critical to the Group’s financial position and performance.
Estimation of useful lifeThe charge in respect of periodic depreciation is derived after determining an estimate of an asset’s expected useful life and the expected residual value at the end of its life. Increasing an asset’s expected life or its residual value would result in a reduced depreciation charge in the consolidated income statement.
The useful lives and residual values of Group assets are determined by management at the time the asset is acquired and reviewed annually for appropriateness. The lives are based on historical experience with similar assets as well as anticipation of future events which may impact their life such as changes in technology. Furthermore, network infrastructure is only depreciated over a period that extends beyond the expiry of the associated licence under which the operator provides telecommunications services if there is a reasonable expectation of renewal or an alternative future use for the asset.
Historically changes in useful lives and residual values have not resulted in material changes to the Group’s depreciation charge.
Provisions and contingent liabilitiesThe Group exercises judgement in measuring and recognising provisions and the exposures to contingent liabilities related to pending litigation or other outstanding claims subject to negotiated settlement, mediation, arbitration or government regulation, as well as other contingent liabilities (see note 29 to the consolidated financial statements). Judgement is necessary in assessing the likelihood that a pending claim will succeed, or a liability will arise, and to quantify the possible range of the financial settlement. Because of the inherent uncertainty in this evaluation process, actual losses may be different from the originally estimated provision.
Critical accounting estimates (continued)

Business reviewPerform
anceG
overnanceFinancials
Additional information
93Vodafone Group Plc Annual Report 2012
Independent auditor’s report to the members of Vodafone Group Plc We have audited the consolidated financial statements of Vodafone Group Plc for the year ended 31 March 2012 which comprise the consolidated income statement, the consolidated statement of comprehensive income, the consolidated statement of financial position, the consolidated statement of changes in equity, the consolidated statement of cash flows, and the related notes 1 to 33. The financial reporting framework that has been applied in their preparation is applicable law and International Financial Reporting Standards (‘IFRSs’) as adopted by the European Union.
This report is made solely to the Company’s members, as a body, in accordance with Chapter 3 of Part 16 of the Companies Act 2006. Our audit work has been undertaken so that we might state to the Company’s members those matters we are required to state to them in an auditor’s report and for no other purpose. To the fullest extent permitted by law, we do not accept or assume responsibility to anyone other than the Company and the Company’s members as a body, for our audit work, for this report, or for the opinions we have formed.
Respective responsibilities of directors and auditorAs explained more fully in the directors’ statement of responsibilities, the directors are responsible for the preparation of the consolidated financial statements and for being satisfied that they give a true and fair view.
Our responsibility is to audit and express an opinion on the consolidated financial statements in accordance with applicable law and International Standards on Auditing (UK and Ireland). Those standards require us to comply with the Auditing Practices Board’s Ethical Standards for Auditors.
Scope of the audit of the financial statementsAn audit involves obtaining evidence about the amounts and disclosures in the financial statements sufficient to give reasonable assurance that the financial statements are free from material misstatement, whether caused by fraud or error. This includes an assessment of: whether the accounting policies are appropriate to the Group’s circumstances and have been consistently applied and adequately disclosed; the reasonableness of significant accounting estimates made by the directors; and the overall presentation of the financial statements. In addition, we read all the financial and non-financial information in the annual report to identify material inconsistencies with the audited financial statements. If we become aware of any apparent material misstatements or inconsistencies we consider the implications for our report.
Opinion on financial statementsIn our opinion the consolidated financial statements:
aa give a true and fair view of the state of the Group’s affairs as at 31 March 2012 and of its profit for the year then ended;
aa have been properly prepared in accordance with IFRSs as adopted by the European Union; and
aa have been prepared in accordance with the requirements of the Companies Act 2006 and Article 4 of the IAS Regulation.
Separate opinion in relation to IFRSs as issued by the IASBAs explained in note 1 to the consolidated financial statements, the Group in addition to complying with its legal obligation to apply IFRSs as adopted by the European Union, has also applied IFRSs as issued by the International Accounting Standards Board (‘IASB’).
In our opinion the consolidated financial statements comply with IFRSs as issued by the IASB.
Opinion on other matter prescribed by the Companies Act 2006In our opinion the information given in the directors’ report for the financial year for which the consolidated financial statements are prepared is consistent with the Group financial statements.
Matters on which we are required to report by exceptionWe have nothing to report in respect of the following:
Under the Companies Act 2006 we are required to report to you if, in our opinion:
aa certain disclosures of directors’ remuneration specified by law are not made; or
aa we have not received all the information and explanations we require for our audit.
Under the listing rules we are required to review:
aa the directors’ statement contained within the directors’ report in relation to going concern;
aa the part of the Corporate Governance Statement relating to the Company’s compliance with the nine provisions of the UK Corporate Governance Code specified for our review; and
aa certain elements of the report to shareholders by the Board on directors’ remuneration.
Other matterWe have reported separately on the parent company financial statements of Vodafone Group Plc for the year ended 31 March 2012 and on the information in the directors’ remuneration report that is described as having been audited.
Panos Kakoullis FCA (Senior Statutory Auditor) for and on behalf of Deloitte LLPChartered Accountants and Statutory Auditor London United Kingdom
22 May 2012
Audit report on the consolidated financial statements

94Vodafone Group Plc Annual Report 2012
Consolidated income statementfor the years ended 31 March
2012 2011 2010
Note £m £m £m
Revenue 3 46,417 45,884 44,472Cost of sales (31,546) (30,814) (29,439)Gross profit 14,871 15,070 15,033Selling and distribution expenses (3,227) (3,067) (2,981)Administrative expenses (5,075) (5,300) (5,328)Share of result in associates 14 4,963 5,059 4,742Impairment losses 10 (4,050) (6,150) (2,100)Other income and expense 26 3,705 (16) 114Operating profit 4 11,187 5,596 9,480Non-operating income and expense 15 (162) 3,022 (10)Investment income 5 456 1,309 716Financing costs 5 (1,932) (429) (1,512)Profit before taxation 9,549 9,498 8,674Income tax expense 6 (2,546) (1,628) (56)Profit for the financial year 7,003 7,870 8,618
Attributable to:– Equity shareholders 6,957 7,968 8,645– Non-controlling interests 46 (98) (27)
7,003 7,870 8,618
Basic earnings per share 8 13.74p 15.20p 16.44p
Diluted earnings per share 8 13.65p 15.11p 16.36p
Consolidated statement of comprehensive incomefor the years ended 31 March
2012 2011 2010
£m £m £m
(Losses)/gains on revaluation of available-for-sale investments, net of tax (17) 310 206Foreign exchange translation differences, net of tax (3,673) (2,132) (1,021)Net actuarial (losses)/gains on defined benefit pension schemes, net of tax (272) 136 (104)Revaluation gain – – 860Foreign exchange gains transferred to the income statement (681) (630) (84)Fair value (gains)/losses transferred to the income statement – (2,192) 3Other, net of tax (10) 19 67Other comprehensive loss (4,653) (4,489) (73)Profit for the financial year 7,003 7,870 8,618Total comprehensive income for the year 2,350 3,381 8,545
Attributable to:– Equity shareholders 2,383 3,567 8,312– Non-controlling interests (33) (186) 233
2,350 3,381 8,545
The accompanying notes are an integral part of these consolidated financial statements.

Business reviewPerform
anceG
overnanceFinancials
Additional information
95Vodafone Group Plc Annual Report 2012
Consolidated statement of financial positionat 31 March
2012 2011
Note £m £m
Non-current assetsGoodwill 9 38,350 45,236Other intangible assets 9 21,164 23,322Property, plant and equipment 11 18,655 20,181Investments in associates 14 35,108 38,105Other investments 15 791 1,381Deferred tax assets 6 1,970 2,018Post employment benefits 23 31 97Trade and other receivables 17 3,482 3,877
119,551 134,217
Current assetsInventory 16 486 537Taxation recoverable 334 281Trade and other receivables 17 10,744 9,259Other investments 15 1,323 674Cash and cash equivalents 18 7,138 6,252
20,025 17,003Total assets 139,576 151,220
EquityCalled up share capital 19 3,866 4,082Additional paid-in capital 154,123 153,760Treasury shares (7,841) (8,171)Retained losses (84,184) (77,661)Accumulated other comprehensive income 10,971 15,545Total equity shareholders’ funds 76,935 87,555
Non-controlling interests 2,090 2,880Put options over non-controlling interests (823) (2,874)Total non-controlling interests 1,267 6Total equity 78,202 87,561
Non-current liabilitiesLong-term borrowings 22 28,362 28,375Taxation liabilities 250 350Deferred tax liabilities 6 6,597 6,486Post employment benefits 23 337 87Provisions 24 479 482Trade and other payables 25 1,324 804
37,349 36,584Current liabilitiesShort-term borrowings 22 6,258 9,906Taxation liabilities 1,898 1,912Provisions 24 633 559Trade and other payables 25 15,236 14,698
24,025 27,075Total equity and liabilities 139,576 151,220
The consolidated financial statements were approved by the Board of directors and authorised for issue on 22 May 2012 and were signed on its behalf by:
Vittorio Colao Andy HalfordChief Executive Chief Financial Officer
The accompanying notes are an integral part of these consolidated financial statements.

96Vodafone Group Plc Annual Report 2012
Consolidated statement of changes in equityfor the years ended 31 March
Equity
Additional Other comprehensive income share- Non-
Share paid-in Treasury Retained Currency Pensions Investment Revaluation holders’ controlling
capital capital1 shares losses reserve reserve reserve surplus Other funds interests Total
£m £m £m £m £m £m £m £m £m £m £m £m
1 April 2009 4,153 153,348 (8,036) (83,820) 18,451 (259) 2,148 180 (3) 86,162 (1,385) 84,777Issue or reissue of shares – – 189 (119) – – – – – 70 – 70Share-based payment – 1612 – – – – – – – 161 – 161Acquisition of non-controlling interest – – – (133) – – – – – (133) 1,636 1,503Comprehensive income – – – 8,645 (1,365) (104) 209 860 67 8,312 233 8,545Profit/(loss) – – – 8,645 – – – – – 8,645 (27) 8,618OCI – before tax – – – – (1,320) (149) 377 860 79 (153) 260 107OCI – taxes – – – – 39 45 (171) – (12) (99) – (99)Transfer to the income statement – – – – (84) – 3 – – (81) – (81)
Dividends – – – (4,131) – – – – – (4,131) (56) (4,187)Other – – 37 (97) – – – – – (60) 1 (59)31 March 2010 4,153 153,509 (7,810) (79,655) 17,086 (363) 2,357 1,040 64 90,381 429 90,810
Issue or reissue of shares – – 232 (125) – – – – – 107 – 107Redemption or cancellation of shares (71) 71 1,532 (1,532) – – – – – – – –Purchase of own shares – – (2,125) – – – – – – (2,125) – (2,125)Share-based payment – 1802 – – – – – – – 180 – 180Acquisition of non-controlling interest – – – (120) – – – – – (120) 35 (85)Comprehensive income – – – 7,968 (2,669) 136 (1,882) – 14 3,567 (186) 3,381Profit/(loss) – – – 7,968 – – – – – 7,968 (98) 7,870OCI – before tax – – – – (2,053) 190 347 – 14 (1,502) (88) (1,590)OCI – taxes – – – – 14 (54) (37) – – (77) – (77)Transfer to the income statement – – – – (630) – (2,192)3 – – (2,822) – (2,822)
Dividends – – – (4,468) – – – – – (4,468) (328) (4,796)Other – – – 271 – – (238) – – 33 56 8931 March 2011 4,082 153,760 (8,171) (77,661) 14,417 (227) 237 1,040 78 87,555 6 87,561
Issue or reissue of shares – 2 277 (208) – – – – – 71 – 71Redemption or cancellation of shares (216) 216 4,724 (4,724) – – – – – – – –Purchase of own shares – – (4,671)4 – – – – – – (4,671) – (4,671)Share-based payment – 1452 – – – – – – – 145 – 145Acquisition of non-controlling interest – – – (1,908) – – – – – (1,908) 1,599 (309)Comprehensive income – – – 6,957 (4,279) (272) (17) – (6) 2,383 (33) 2,350Profit – – – 6,957 – – – – – 6,957 46 7,003OCI – before tax – – – – (3,629) (365) (17) – (14) (4,025) (71) (4,096)OCI – taxes – – – – 31 93 – – 8 132 (8) 124Transfer to the income statement – – – – (681) – – – – (681) – (681)
Dividends – – – (6,654) – – – – – (6,654) (305) (6,959)Other – – – 14 – – – – – 14 – 1431 March 2012 3,866 154,123 (7,841) (84,184) 10,138 (499) 220 1,040 72 76,935 1,267 78,202
Notes:1 Includes share premium, capital redemption reserve and merger reserve. The merger reserve was derived from acquisitions made prior to 31 March 2004 and subsequently allocated to additional paid-in capital on adoption
of IFRS. 2 Includes a £2 million tax credit (2011: £24 million, 2010: £11 million).3 Amounts for 2011 include a £208 million tax credit.4 Amount includes a commitment for the purchase of own shares of £1,091 million (2011: £nil).

Business reviewPerform
anceG
overnanceFinancials
Additional information
97Vodafone Group Plc Annual Report 2012
Consolidated statement of cash flowsfor the years ended 31 March
2012 2011 2010
Note £m £m £m
Net cash flow from operating activities 27 12,755 11,995 13,064
Cash flows from investing activitiesPurchase of interests in subsidiaries and joint ventures, net of cash acquired (149) (46) (1,777)Other investing activities in relation to purchase of subsidiaries 310 (356) –Purchase of interests in associates (5) – –Purchase of intangible assets (3,090) (4,290) (2,134)Purchase of property, plant and equipment (4,762) (4,350) (4,841)Purchase of investments (417) (318) (522)Disposal of interests in subsidiaries and joint ventures, net of cash disposed 832 – –Disposal of interests in associates 6,799 – –Disposal of property, plant and equipment 117 51 48Disposal of investments 66 4,467 17Dividends received from associates 4,023 1,424 1,436Dividends received from investments 3 85 141Interest received 322 1,659 195Taxation on investing activities (206) (208) –Net cash flow from investing activities 3,843 (1,882) (7,437)
Cash flows from financing activitiesIssue of ordinary share capital and reissue of treasury shares 71 107 70Net movement in short-term borrowings 1,206 (573) 227Proceeds from issue of long-term borrowings 1,642 4,861 4,217Repayment of borrowings (3,520) (4,064) (5,184)Purchase of treasury shares (3,583) (2,087) –Equity dividends paid (6,643) (4,468) (4,139)Dividends paid to non-controlling shareholders in subsidiaries (304) (320) (56)Contributions from non-controlling shareholders in subsidiaries – – 613Other transactions with non-controlling shareholders in subsidiaries (2,605) (137) –Interest paid (1,633) (1,578) (1,601)Net cash flow from financing activities (15,369) (8,259) (5,853)
Net cash flow 1,229 1,854 (226)
Cash and cash equivalents at beginning of the financial year 18 6,205 4,363 4,846Exchange loss on cash and cash equivalents (346) (12) (257)Cash and cash equivalents at end of the financial year 18 7,088 6,205 4,363
The accompanying notes are an integral part of these consolidated financial statements.

98Vodafone Group Plc Annual Report 2012
Notes to the consolidated financial statements
1. Basis of preparationThe consolidated financial statements are prepared in accordance with IFRS as issued by the International Accounting Standards Board and are also prepared in accordance with IFRS adopted by the European Union (‘EU’), the Companies Act 2006 and Article 4 of the EU IAS Regulations. The consolidated financial statements are prepared on a going concern basis.
The preparation of financial statements in conformity with IFRS requires management to make estimates and assumptions that affect the reported amounts of assets and liabilities and disclosure of contingent assets and liabilities at the date of the financial statements and the reported amounts of revenue and expenses during the reporting period. For a discussion on the Group’s critical accounting estimates see “Critical accounting estimates” on pages 91 to 92. Actual results could differ from those estimates. The estimates and underlying assumptions are reviewed on an ongoing basis. Revisions to accounting estimates are recognised in the period in which the estimate is revised if the revision affects only that period or in the period of the revision and future periods if the revision affects both current and future periods.
Amounts in the consolidated financial statements are stated in pounds sterling.
Vodafone Group Plc is registered in England (No. 1833679).
2. Significant accounting policies
Accounting conventionThe consolidated financial statements are prepared on a historical cost basis except for certain financial and equity instruments that have been measured at fair value.
New accounting pronouncements adoptedOn 1 April 2011 the Group adopted new accounting policies to comply with:
aa “Improvements to IFRS” issued in May 2010.
aa Amendments to IAS 24 “State-controlled entities and the definition of a related party”.
aa Amendments to IFRIC 14 “Prepayments on a minimum funding requirement”.
aa IFRIC 19 “Extinguishing financial liabilities with equity instruments”.
These changes have no material impact on the consolidated results, financial position or cash flows of the Group.
New accounting pronouncements not yet adoptedPhase I of IFRS 9 “Financial Instruments” was issued in November 2009 and has subsequently been updated and amended. The standard is effective for annual periods beginning on or after 1 January 2015 and has not yet been endorsed for use in the EU. The standard introduces changes to the classification and measurement of financial assets and the requirements relating to financial liabilities in relation to the presentation of changes in fair value due to credit risks and the removal of an exemption from measuring certain derivative liabilities at fair value. The Group is currently assessing the impact of the standard on its results, financial position and cash flows.
The Group has not adopted the following pronouncements, which have been issued by the IASB or the IFRIC. These pronouncements have not yet been endorsed for use in the EU. The Group does not currently believe the adoption of these pronouncements will have a material impact on the consolidated results, financial position or cash flows of the Group.
aa Amendments to IAS 1, “Presentation of items of other comprehensive income”, effective for annual periods beginning on or after 1 July 2012.
aa Amendment to IAS 12, “Deferred tax: recovery of underlying assets”, effective for annual periods beginning on or after 1 January 2012.
aa Amendments to IAS 32, “Offsetting financial assets and financial liabilities”, effective for annual periods beginning on or after 1 January 2014.
aa IFRIC 20, “Stripping costs in the production phase of a surface mine”, effective for annual periods beginning on or after 1 January 2013.
aa Amendment to IFRS 1, “Severe hyperinflation and removal of fixed dates for first-timer adopters”, effective for annual periods beginning on or after 1 July 2011.
aa Amendment to IFRS 1, “Government loans”, effective for annual periods beginning on or after 1 January 2013.
aa Amendments to IFRS 7, “Financial Instruments: Disclosure”, effective for annual periods beginning on or after 1 July 2011.
aa “Improvements to IFRS 2009 – 2011 Cycle”, effective for annual periods beginning on or after 1 January 2013.

Business reviewPerform
anceG
overnanceFinancials
Additional information
99Vodafone Group Plc Annual Report 2012
The Group has also not adopted the following pronouncements which are effective for annual periods beginning on or after 1 January 2013 and have not yet been endorsed for use in the EU. The Group has not completed its assessment of the impact of these pronouncements on the consolidated results, financial position or cash flows of the Group. However, the Group currently expects that IFRS 11, “Joint Arrangements”, will have a material impact on the presentation of the Group’s interests in its joint ventures owing to the Group’s significant investments in joint ventures as discussed in note 13.
aa IFRS 10, “Consolidated Financial Statements”, which replaces parts of IAS 27, “Consolidated and Separate Financial Statements” and all of SIC-12, “Consolidation – Special Purpose Entities”, builds on existing principles by identifying the concept of control as the determining factor in whether an entity should be included within the consolidated financial statements of the parent company. The remainder of IAS 27, “Separate Financial Statements”, now contains accounting and disclosure requirements for investments in subsidiaries, joint ventures and associates only when an entity prepares separate financial statements and is therefore not applicable in the Group’s consolidated financial statements.
aa IFRS 11, “Joint Arrangements”, which replaces IAS 31, “Interests in Joint Ventures” and SIC-13, “Jointly Controlled Entities – Non-monetary Contributions by Venturers”, requires a single method, known as the equity method, to account for interests in jointly controlled entities which is consistent with the accounting treatment currently applied to investments in associates. The proportionate consolidation method currently applied to the Group’s interests in joint ventures is prohibited. IAS 28, “Investments in Associates and Joint Ventures”, was amended as a consequence of the issuance of IFRS 11. In addition to prescribing the accounting for investment in associates, it now sets out the requirements for the application of the equity method when accounting for joint ventures. The application of the equity method has not changed as a result of this amendment.
aa IFRS 12, “Disclosure of Interest in Other Entities”, is a new and comprehensive standard on disclosure requirements for all forms of interests in other entities, including joint arrangements, associates, special purpose vehicles and other off balance sheet vehicles. The standard includes disclosure requirements for entities covered under IFRS 10 and IFRS 11.
aa IFRS 13, “Fair Value Measurement”, provides guidance on how fair value should be applied where its use is already required or permitted by other standards within IFRS, including a precise definition of fair value and a single source of fair value measurement and disclosure requirements for use across IFRS.
aa Amendments to IAS 19, “Employee benefits”, require a revised allocation of costs for defined benefit pension schemes between the income statement and other comprehensive income and prohibit the use of the “corridor approach” to spread the recognition of actuarial gains and losses, which is not used by the Group, and require a different measurement basis for asset returns. The amendments also include a revised definition of short- and long-term benefits to employees and revised criteria for the recognition of termination benefits.
Basis of consolidationThe consolidated financial statements incorporate the financial statements of the Company and entities controlled, both unilaterally and jointly, by the Company.
Accounting for subsidiariesA subsidiary is an entity controlled by the Company. Control is achieved where the Company has the power to govern the financial and operating policies of an entity so as to obtain benefits from its activities.
The results of subsidiaries acquired or disposed of during the year are included in the income statement from the effective date of acquisition or up to the effective date of disposal, as appropriate. Where necessary, adjustments are made to the financial statements of subsidiaries to bring their accounting policies into line with those used by the Group.
All intra-group transactions, balances, income and expenses are eliminated on consolidation.
Non-controlling interests in the net assets of consolidated subsidiaries are identified separately from the Group’s equity therein. Non-controlling interests consist of the amount of those interests at the date of the original business combination and the non-controlling shareholder’s share of changes in equity since the date of the combination. Total comprehensive income is attributed to non-controlling interests even if this results in the non-controlling interests having a deficit balance.
Business combinationsAcquisitions of subsidiaries are accounted for using the acquisition method. The cost of the acquisition is measured at the aggregate of the fair values, at the date of exchange, of assets given, liabilities incurred or assumed, and equity instruments issued by the Group. Acquisition-related costs are recognised in the income statement as incurred. The acquiree’s identifiable assets and liabilities are recognised at their fair values at the acquisition date.
Goodwill is measured as the excess of the sum of the consideration transferred, the amount of any non-controlling interests in the acquiree and the fair value of the Group’s previously held equity interest in the acquiree, if any, over the net amounts of identifiable assets acquired and liabilities assumed at the acquisition date.
The interest of the non-controlling shareholders in the acquiree may initially be measured either at fair value or at the non-controlling shareholders’ proportion of the net fair value of the identifiable assets acquired, liabilities and contingent liabilities assumed. The choice of measurement basis is made on an acquisition-by-acquisition basis.
Acquisition of interests from non-controlling shareholdersIn transactions with non-controlling parties that do not result in a change in control, the difference between the fair value of the consideration paid or received and the amount by which the non-controlling interest is adjusted is recognised in equity.

100Vodafone Group Plc Annual Report 2012
Notes to the consolidated financial statements (continued)
Interests in joint venturesA joint venture is a contractual arrangement whereby the Group and other parties undertake an economic activity that is subject to joint control; that is, when the strategic financial and operating policy decisions relating to the activities require the unanimous consent of the parties sharing control.
The Group reports its interests in jointly controlled entities using proportionate consolidation. The Group’s share of the assets, liabilities, income, expenses and cash flows of jointly controlled entities are combined with the equivalent items in the results on a line-by-line basis.
Any goodwill arising on the acquisition of the Group’s interest in a jointly controlled entity is accounted for in accordance with the Group’s accounting policy for goodwill arising on the acquisition of a subsidiary.
Investments in associatesAn associate is an entity over which the Group has significant influence and that is neither a subsidiary nor an interest in a joint venture. Significant influence is the power to participate in the financial and operating policy decisions of the investee but is not control or joint control over those policies.
The results and assets and liabilities of associates are incorporated in the consolidated financial statements using the equity method of accounting. Under the equity method, investments in associates are carried in the consolidated statement of financial position at cost as adjusted for post-acquisition changes in the Group’s share of the net assets of the associate, less any impairment in the value of the investment. Losses of an associate in excess of the Group’s interest in that associate are not recognised. Additional losses are provided for, and a liability is recognised, only to the extent that the Group has incurred legal or constructive obligations or made payments on behalf of the associate.
Any excess of the cost of acquisition over the Group’s share of the net fair value of the identifiable assets, liabilities and contingent liabilities of the associate recognised at the date of acquisition is recognised as goodwill. The goodwill is included within the carrying amount of the investment.
The licences of the Group’s associate in the US, Verizon Wireless, are indefinite lived assets as they are subject to perfunctory renewal. Accordingly, they are not subject to amortisation but are tested annually for impairment, or when indicators exist that the carrying value is not recoverable.
Intangible assetsIdentifiable intangible assets are recognised when the Group controls the asset, it is probable that future economic benefits attributed to the asset will flow to the Group and the cost of the asset can be reliably measured.
GoodwillGoodwill arising on the acquisition of an entity represents the excess of the cost of acquisition over the Group’s interest in the net fair value of the identifiable assets, liabilities and contingent liabilities of the entity recognised at the date of acquisition.
Goodwill is initially recognised as an asset at cost and is subsequently measured at cost less any accumulated impairment losses. Goodwill is denominated in the currency of the acquired entity and revalued to the closing rate at each reporting period date.
Goodwill is not subject to amortisation but is tested for impairment.
Negative goodwill arising on an acquisition is recognised directly in the income statement.
On disposal of a subsidiary or a jointly controlled entity, the attributable amount of goodwill is included in the determination of the profit or loss recognised in the income statement on disposal.
Goodwill arising before the date of transition to IFRS, on 1 April 2004, has been retained at the previous UK GAAP amounts, subject to being tested for impairment at that date. Goodwill written off to reserves under UK GAAP prior to 1998 has not been reinstated and is not included in determining any subsequent profit or loss on disposal.
Finite lived intangible assetsIntangible assets with finite lives are stated at acquisition or development cost, less accumulated amortisation. The amortisation period and method is reviewed at least annually. Changes in the expected useful life or the expected pattern of consumption of future economic benefits embodied in the asset is accounted for by changing the amortisation period or method, as appropriate, and are treated as changes in accounting estimates. The amortisation expense on intangible assets with finite lives is recognised in profit or loss in the expense category consistent with the function of the intangible asset.
Licence and spectrum feesAmortisation periods for licence and spectrum fees are determined primarily by reference to the unexpired licence period, the conditions for licence renewal and whether licences are dependent on specific technologies. Amortisation is charged to the income statement on a straight-line basis over the estimated useful lives from the commencement of service of the network.
Computer softwareComputer software comprises computer software purchased from third parties as well as the cost of internally developed software. Computer software licences are capitalised on the basis of the costs incurred to acquire and bring into use the specific software. Costs that are directly associated with the production of identifiable and unique software products controlled by the Group, and are probable of producing future economic benefits are recognised as intangible assets. Direct costs include software development employee costs and directly attributable overheads.
2. Significant accounting policies (continued)

Business reviewPerform
anceG
overnanceFinancials
Additional information
101Vodafone Group Plc Annual Report 2012
Software integral to a related item of hardware equipment is accounted for as property, plant and equipment.
Costs associated with maintaining computer software programs are recognised as an expense when they are incurred.
Internally developed software is recognised only if all of the following conditions are met:
aa an asset is created that can be separately identified;
aa it is probable that the asset created will generate future economic benefits; and
aa the development cost of the asset can be measured reliably.
Amortisation is charged to the income statement on a straight-line basis over the estimated useful lives from the date the software is available for use.
Other intangible assetsOther intangible assets, including brands and customer bases, are recorded at fair value at the date of acquisition. Amortisation is charged to the income statement , over the estimated useful lives of intangible assets from the date they are available for use, on a straight-line basis, with the exception of customer relationships which are amortised on a sum of digits basis. The amortisation basis adopted for each class of intangible asset reflects the Group’s consumption of the economic benefit from that asset.
Estimated useful livesThe estimated useful lives of finite lived intangible assets are as follows:
aa Licence and spectrum fees 3 – 25 years
aa Computer software 3 – 5 years
aa Brands 1 – 10 years
aa Customer bases 2 – 7 years
Property, plant and equipmentLand and buildings held for use are stated in the statement of financial position at their cost, less any subsequent accumulated depreciation and subsequent accumulated impairment losses.
Amounts for equipment, fixtures and fittings, which includes network infrastructure assets and which together comprise an all but insignificant amount of the Group’s property, plant and equipment, are stated at cost less accumulated depreciation and any accumulated impairment losses.
Assets in the course of construction are carried at cost, less any recognised impairment loss. Depreciation of these assets commences when the assets are ready for their intended use.
The cost of property, plant and equipment includes directly attributable incremental costs incurred in their acquisition and installation.
Depreciation is charged so as to write off the cost of assets, other than land and properties under construction, using the straight-line method, over their estimated useful lives, as follows:
aa Freehold buildings 25 – 50 years
aa Leasehold premises the term of the lease
Equipment, fixtures and fittings:
aa Network infrastructure 3 – 25 years
aa Other 3 – 10 years
Depreciation is not provided on freehold land.
Assets held under finance leases are depreciated over their expected useful lives on the same basis as owned assets or, where shorter, the term of the relevant lease.
The gain or loss arising on the disposal or retirement of an item of property, plant and equipment is determined as the difference between the sale proceeds and the carrying amount of the asset and is recognised in the income statement.
Impairment of assetsGoodwillGoodwill is not subject to amortisation but is tested for impairment annually or whenever there is an indication that the asset may be impaired.
For the purpose of impairment testing, assets are grouped at the lowest levels for which there are separately identifiable cash flows, known as cash-generating units. If the recoverable amount of the cash-generating unit is less than the carrying amount of the unit, the impairment loss is allocated first to reduce the carrying amount of any goodwill allocated to the unit and then to the other assets of the unit pro-rata on the basis of the carrying amount of each asset in the unit. Impairment losses recognised for goodwill are not reversed in a subsequent period.
Recoverable amount is the higher of fair value less costs to sell and value in use. In assessing value in use, the estimated future cash flows are discounted to their present value using a pre-tax discount rate that reflects current market assessments of the time value of money and the risks specific to the asset for which the estimates of future cash flows have not been adjusted.
The Group prepares and approves formal five year management plans for its operations, which are used in the value in use calculations. In certain developing markets the fifth year of the management plan is not indicative of the long-term future performance as operations may not have reached maturity. For these operations, the Group extends the plan data for an additional five year period.

102Vodafone Group Plc Annual Report 2012
Notes to the consolidated financial statements (continued)
Property, plant and equipment and finite lived intangible assetsAt each reporting period date, the Group reviews the carrying amounts of its property, plant and equipment and finite lived intangible assets to determine whether there is any indication that those assets have suffered an impairment loss. If any such indication exists, the recoverable amount of the asset is estimated in order to determine the extent, if any, of the impairment loss. Where it is not possible to estimate the recoverable amount of an individual asset, the Group estimates the recoverable amount of the cash-generating unit to which the asset belongs.
If the recoverable amount of an asset or cash-generating unit is estimated to be less than its carrying amount, the carrying amount of the asset or cash-generating unit is reduced to its recoverable amount. An impairment loss is recognised immediately in the income statement.
Where an impairment loss subsequently reverses, the carrying amount of the asset or cash-generating unit is increased to the revised estimate of its recoverable amount, not to exceed the carrying amount that would have been determined had no impairment loss been recognised for the asset or cash-generating unit in prior years. A reversal of an impairment loss is recognised immediately in the income statement.
RevenueRevenue is recognised to the extent the Group has delivered goods or rendered services under an agreement, the amount of revenue can be measured reliably and it is probable that the economic benefits associated with the transaction will flow to the Group. Revenue is measured at the fair value of the consideration received, exclusive of sales taxes and discounts.
The Group principally obtains revenue from providing the following telecommunication services: access charges, airtime usage, messaging, interconnect fees, data services and information provision, connection fees and equipment sales. Products and services may be sold separately or in bundled packages.
Revenue for access charges, airtime usage and messaging by contract customers is recognised as services are performed, with unbilled revenue resulting from services already provided accrued at the end of each period and unearned revenue from services to be provided in future periods deferred. Revenue from the sale of prepaid credit is deferred until such time as the customer uses the airtime, or the credit expires.
Revenue from interconnect fees is recognised at the time the services are performed.
Revenue from data services and information provision is recognised when the Group has performed the related service and, depending on the nature of the service, is recognised either at the gross amount billed to the customer or the amount receivable by the Group as commission for facilitating the service.
Customer connection revenue is recognised together with the related equipment revenue to the extent that the aggregate equipment and connection revenue does not exceed the fair value of the equipment delivered to the customer. Any customer connection revenue not recognised together with related equipment revenue is deferred and recognised over the period in which services are expected to be provided to the customer.
Revenue for device sales is recognised when the device is delivered to the end customer and the sale is considered complete. For device sales made to intermediaries, revenue is recognised if the significant risks associated with the device are transferred to the intermediary and the intermediary has no general right of return. If the significant risks are not transferred, revenue recognition is deferred until sale of the device to an end customer by the intermediary or the expiry of the right of return.
In revenue arrangements including more than one deliverable, the arrangements are divided into separate units of accounting. Deliverables are considered separate units of accounting if the following two conditions are met: (1) the deliverable has value to the customer on a stand-alone basis and (2) there is evidence of the fair value of the item. The arrangement consideration is allocated to each separate unit of accounting based on its relative fair value.
CommissionsIntermediaries are given cash incentives by the Group to connect new customers and upgrade existing customers.
For intermediaries who do not purchase products and services from the Group, such cash incentives are accounted for as an expense. Such cash incentives to other intermediaries are also accounted for as an expense if:
aa the Group receives an identifiable benefit in exchange for the cash incentive that is separable from sales transactions to that intermediary; and
aa the Group can reliably estimate the fair value of that benefit.
Cash incentives that do not meet these criteria are recognised as a reduction of the related revenue.
InventoryInventory is stated at the lower of cost and net realisable value. Cost is determined on the basis of weighted average costs and comprises direct materials and, where applicable, direct labour costs and those overheads that have been incurred in bringing the inventories to their present location and condition.
LeasingLeases are classified as finance leases whenever the terms of the lease transfer substantially all the risks and rewards of ownership of the asset to the lessee. All other leases are classified as operating leases.
Assets held under finance leases are recognised as assets of the Group at their fair value at the inception of the lease or, if lower, at the present value of the minimum lease payments as determined at the inception of the lease. The corresponding liability to the lessor is included in the statement of financial position as a finance lease obligation. Lease payments are apportioned between finance charges and reduction of the lease obligation so as to achieve a constant rate of interest on the remaining balance of the liability. Finance charges are recognised in the income statement.
Rentals payable under operating leases are charged to the income statement on a straight-line basis over the term of the relevant lease. Benefits received and receivable as an incentive to enter into an operating lease are also spread on a straight-line basis over the lease term.
2. Significant accounting policies (continued)

Business reviewPerform
anceG
overnanceFinancials
Additional information
103Vodafone Group Plc Annual Report 2012
Foreign currenciesThe consolidated financial statements are presented in sterling, which is the parent company’s functional and presentation currency. Each entity in the Group determines its own functional currency and items included in the financial statements of each entity are measured using that functional currency.
Transactions in foreign currencies are initially recorded at the functional currency rate prevailing at the date of the transaction. Monetary assets and liabilities denominated in foreign currencies are retranslated into the respective functional currency of the entity at the rates prevailing on the reporting period date. Non-monetary items carried at fair value that are denominated in foreign currencies are retranslated at the rates prevailing on the initial transaction dates. Non-monetary items measured in terms of historical cost in a foreign currency are not retranslated.
Changes in the fair value of monetary securities denominated in foreign currency classified as available-for-sale are analysed between translation differences and other changes in the carrying amount of the security. Translation differences are recognised in the income statement and other changes in carrying amount are recognised in equity.
Translation differences on non-monetary financial assets, such as investments in equity securities, classified as available-for-sale are reported as part of the fair value gain or loss and are included in equity.
For the purpose of presenting consolidated financial statements, the assets and liabilities of entities with a functional currency other than sterling are expressed in sterling using exchange rates prevailing at the reporting period date. Income and expense items and cash flows are translated at the average exchange rates for the period and exchange differences arising are recognised directly in equity. On disposal of a foreign entity, the cumulative amount previously recognised in equity relating to that particular foreign operation is recognised in profit or loss.
Goodwill and fair value adjustments arising on the acquisition of a foreign operation are treated as assets and liabilities of the foreign operation and translated accordingly.
In respect of all foreign operations, any exchange differences that have arisen before 1 April 2004, the date of transition to IFRS, are deemed to be nil and will be excluded from the determination of any subsequent profit or loss on disposal.
The net foreign exchange gain recognised in the consolidated income statement for the year ended 31 March 2012 is £702 million (2011: £1,022 million, 2010: £35 million). The net gains are recorded within operating income (2012: £34 million charge, 2011: £14 million charge, 2010: £29 million credit), other income and expense and non-operating income and expense (2012: £681 million credit, 2011: £630 million credit, 2010: £84 million credit), investment and financing income (2012: £55 million credit, 2011: £405 million credit, 2010: £78 million charge) and income tax expense (2011: £1 million credit). The foreign exchange gains included within other income and expense and non-operating income and expense arise on the disposal of interests in joint ventures, associates and investments from the recycling of foreign exchange gains previously recorded in the consolidated statement of comprehensive income.
Research expenditureExpenditure on research activities is recognised as an expense in the period in which it is incurred.
Post employment benefitsFor defined benefit retirement plans, the difference between the fair value of the plan assets and the present value of the plan liabilities is recognised as an asset or liability on the statement of financial position. Scheme liabilities are assessed using the projected unit funding method and applying the principal actuarial assumptions at the reporting period date. Assets are valued at market value.
Actuarial gains and losses are taken to the statement of comprehensive income as incurred. For this purpose, actuarial gains and losses comprise both the effects of changes in actuarial assumptions and experience adjustments arising because of differences between the previous actuarial assumptions and what has actually occurred.
Other movements in the net surplus or deficit are recognised in the income statement, including the current service cost, any past service cost and the effect of any curtailment or settlements. The interest cost less the expected return on assets is also charged to the income statement. The amount charged to the income statement in respect of these plans is included within operating costs or in the Group’s share of the results of equity accounted operations as appropriate.
The Group’s contributions to defined contribution pension plans are charged to the income statement as they fall due.
Cumulative actuarial gains and losses at 1 April 2004, the date of transition to IFRS, have been recognised in the statement of financial position.
TaxationIncome tax expense represents the sum of the current tax payable and deferred tax.
Current tax payable or recoverable is based on taxable profit for the year. Taxable profit differs from profit as reported in the income statement because some items of income or expense are taxable or deductible in different years or may never be taxable or deductible. The Group’s liability for current tax is calculated using UK and foreign tax rates and laws that have been enacted or substantively enacted by the reporting period date.
Deferred tax is the tax expected to be payable or recoverable in the future arising from temporary differences between the carrying amounts of assets and liabilities in the financial statements and the corresponding tax bases used in the computation of taxable profit. It is accounted for using the statement of financial position liability method. Deferred tax liabilities are generally recognised for all taxable temporary differences and deferred tax assets are recognised to the extent that it is probable that taxable profits will be available against which deductible temporary differences can be utilised. Such assets and liabilities are not recognised if the temporary difference arises from the initial recognition (other than in a business combination) of assets and liabilities in a transaction that affects neither the taxable profit nor the accounting profit. Deferred tax liabilities are not recognised to the extent they arise from the initial recognition of non-tax deductible goodwill.
Deferred tax liabilities are recognised for taxable temporary differences arising on investments in subsidiaries and associates, and interests in joint ventures, except where the Group is able to control the reversal of the temporary difference and it is probable that the temporary difference will not reverse in the foreseeable future.

104Vodafone Group Plc Annual Report 2012
Notes to the consolidated financial statements (continued)
The carrying amount of deferred tax assets is reviewed at each reporting period date and adjusted to reflect changes in probability that sufficient taxable profits will be available to allow all or part of the asset to be recovered.
Deferred tax is calculated at the tax rates that are expected to apply in the period when the liability is settled or the asset realised, based on tax rates that have been enacted or substantively enacted by the reporting period date.
Tax assets and liabilities are offset when there is a legally enforceable right to set off current tax assets against current tax liabilities and when they either relate to income taxes levied by the same taxation authority on either the same taxable entity or on different taxable entities which intend to settle the current tax assets and liabilities on a net basis.
Tax is charged or credited to the income statement, except when it relates to items charged or credited to other comprehensive income or directly to equity, in which case the tax is recognised in other comprehensive income or in equity.
Financial instrumentsFinancial assets and financial liabilities, in respect of financial instruments, are recognised on the Group’s statement of financial position when the Group becomes a party to the contractual provisions of the instrument.
Trade receivablesTrade receivables do not carry any interest and are stated at their nominal value as reduced by appropriate allowances for estimated irrecoverable amounts. Estimated irrecoverable amounts are based on the ageing of the receivable balances and historical experience. Individual trade receivables are written off when management deems them not to be collectible.
Other investmentsOther investments are recognised and derecognised on a trade date where a purchase or sale of an investment is under a contract whose terms require delivery of the investment within the timeframe established by the market concerned, and are initially measured at cost, including transaction costs.
Other investments classified as held for trading and available-for-sale are stated at fair value. Where securities are held for trading purposes, gains and losses arising from changes in fair value are included in net profit or loss for the period. For available-for-sale investments, gains and losses arising from changes in fair value are recognised directly in equity, until the security is disposed of or is determined to be impaired, at which time the cumulative gain or loss previously recognised in equity, determined using the weighted average cost method, is included in the net profit or loss for the period.
Other investments classified as loans and receivables are stated at amortised cost using the effective interest method, less any impairment.
Cash and cash equivalentsCash and cash equivalents comprise cash on hand and call deposits, and other short-term highly liquid investments that are readily convertible to a known amount of cash and are subject to an insignificant risk of changes in value.
Trade payablesTrade payables are not interest bearing and are stated at their nominal value.
Financial liabilities and equity instrumentsFinancial liabilities and equity instruments issued by the Group are classified according to the substance of the contractual arrangements entered into and the definitions of a financial liability and an equity instrument. An equity instrument is any contract that evidences a residual interest in the assets of the Group after deducting all of its liabilities and includes no obligation to deliver cash or other financial assets. The accounting policies adopted for specific financial liabilities and equity instruments are set out below.
Capital market and bank borrowingsInterest bearing loans and overdrafts are initially measured at fair value (which is equal to cost at inception), and are subsequently measured at amortised cost, using the effective interest rate method, except where they are identified as a hedged item in a fair value hedge. Any difference between the proceeds net of transaction costs and the amount due on settlement or redemption of borrowings is recognised over the term of the borrowing.
Equity instrumentsEquity instruments issued by the Group are recorded at the proceeds received, net of direct issuance costs.
Derivative financial instruments and hedge accountingThe Group’s activities expose it to the financial risks of changes in foreign exchange rates and interest rates.
The use of financial derivatives is governed by the Group’s policies approved by the Board of directors, which provide written principles on the use of financial derivatives consistent with the Group’s risk management strategy. Changes in values of all derivatives of a financing nature are included within investment income and financing costs in the income statement. The Group does not use derivative financial instruments for speculative purposes.
Derivative financial instruments are initially measured at fair value on the contract date and are subsequently remeasured to fair value at each reporting date. The Group designates certain derivatives as:
aa hedges of the change of fair value of recognised assets and liabilities (‘fair value hedges’);
aa hedges of highly probable forecast transactions or hedges of foreign currencies risk of firm commitments (“cash flow hedges”); or
aa hedges of net investments in foreign operations.
Hedge accounting is discontinued when the hedging instrument expires or is sold, terminated, or exercised, or no longer qualifies for hedge accounting, or the Company chooses to end the hedging relationship.
2. Significant accounting policies (continued)

Business reviewPerform
anceG
overnanceFinancials
Additional information
105Vodafone Group Plc Annual Report 2012
Fair value hedgesThe Group’s policy is to use derivative instruments (primarily interest rate swaps) to convert a proportion of its fixed rate debt to floating rates in order to hedge the interest rate risk arising, principally, from capital market borrowings. The Group designates these as fair value hedges of interest rate risk with changes in fair value of the hedging instrument recognised in the income statement for the period together with the changes in the fair value of the hedged item due to the hedged risk, to the extent the hedge is effective. The ineffective portion is recognised immediately in the income statement.
Cash flow hedgesCash flow hedging is used by the Group to hedge certain exposures to variability in future cash flows. The effective portion of changes in the fair value of derivatives that are designated and qualify as cash flow hedges is recognised in other comprehensive income; gains or losses relating to any ineffective portion are recognised immediately in the income statement.
When the hedged item is recognised in the income statement amounts previously recognised in other comprehensive income and accumulated in equity for the hedging instrument are reclassified to the income statement and recognised in the same line. However, when the hedged forecast transaction results in the recognition of a non-financial asset or a non-financial liability, the gains and losses previously recognised in other comprehensive income and accumulated in equity are transferred from equity and included in the initial measurement of the cost of the non-financial asset or non-financial liability.
When hedge accounting is discontinued any gain or loss recognised in other comprehensive income at that time remains in equity and is recognised in the income statement when the hedged transaction is ultimately recognised in the income statement. If a forecast transaction is no longer expected to occur, the gain or loss accumulated in equity is recognised immediately in the income statement.
Net investment hedgesExchange differences arising from the translation of the net investment in foreign operations are recognised directly in equity. Gains and losses on those hedging instruments (which include bonds, commercial paper and foreign exchange contracts) designated as hedges of the net investments in foreign operations are recognised in equity to the extent that the hedging relationship is effective. These amounts are included in exchange differences on translation of foreign operations as stated in the statement of comprehensive income. Gains and losses relating to hedge ineffectiveness are recognised immediately in the income statement for the period. Gains and losses accumulated in the translation reserve are included in the income statement when the foreign operation is disposed of.
Put option arrangementsThe potential cash payments related to put options issued by the Group over the equity of subsidiary companies are accounted for as financial liabilities when such options may only be settled other than by exchange of a fixed amount of cash or another financial asset for a fixed number of shares in the subsidiary.
The amount that may become payable under the option on exercise is initially recognised at fair value within borrowings with a corresponding charge directly to equity. The charge to equity is recognised separately as written put options over non-controlling interests, adjacent to non-controlling interests in the net assets of consolidated subsidiaries. The Group recognises the cost of writing such put options, determined as the excess of the fair value of the option over any consideration received, as a financing cost.
Such options are subsequently measured at amortised cost, using the effective interest rate method, in order to accrete the liability up to the amount payable under the option at the date at which it first becomes exercisable. The charge arising is recorded as a financing cost. In the event that the option expires unexercised, the liability is derecognised with a corresponding adjustment to equity.
ProvisionsProvisions are recognised when the Group has a present obligation (legal or constructive) as a result of a past event, it is probable that the Group will be required to settle that obligation and a reliable estimate can be made of the amount of the obligation. Provisions are measured at the directors’ best estimate of the expenditure required to settle the obligation at the reporting date and are discounted to present value where the effect is material.
Share-based paymentsThe Group issues equity-settled share-based payments to certain employees. Equity-settled share-based payments are measured at fair value (excluding the effect of non-market-based vesting conditions) at the date of grant. The fair value determined at the grant date of the equity-settled share-based payments is expensed on a straight-line basis over the vesting period, based on the Group’s estimate of the shares that will eventually vest and adjusted for the effect of non-market-based vesting conditions.
Fair value is measured using a binomial pricing model, being a lattice-based option valuation model, which is calibrated using a Black-Scholes framework. The expected life used in the model has been adjusted, based on management’s best estimate, for the effects of non-transferability, exercise restrictions and behavioural considerations.
The Group uses historical data to estimate option exercise and employee termination within the valuation model; separate groups of employees that have similar historical exercise behaviour are considered separately for valuation purposes. The expected life of options granted is derived from the output of the option valuation model and represents the period of time that options are expected to be outstanding. Expected volatilities are based on implied volatilities as determined by a simple average of no less than three international banks, excluding the highest and lowest numbers. The risk free rates for periods within the contractual life of the option are based on the UK gilt yield curve in effect at the time of grant.
Some share awards have an attached market condition, based on total shareholder return (“TSR”), which is taken into account when calculating the fair value of the share awards. The valuation for the TSR is based on Vodafone’s ranking within the same group of companies, where possible, over the past five years. The volatility of the ranking over a three year period is used to determine the probable weighted percentage number of shares that could be expected to vest and hence affect fair value.
The fair value of awards of non-vested shares is equal to the closing price of the Vodafone’s shares on the date of grant, adjusted for the present value of future dividend entitlements where appropriate.

106Vodafone Group Plc Annual Report 2012
Notes to the consolidated financial statements (continued)
3. Segment analysisThe Group has a single group of related services and products being the supply of communications services and products. Segment information is provided on the basis of geographic areas, being the basis on which the Group manages its worldwide interests. Revenue is attributed to a country or region based on the location of the Group company reporting the revenue. Inter-segment sales are charged at arm’s length prices.
Segment Intra-region Regional Inter-region Group
revenue revenue revenue revenue revenue EBITDA1
£m £m £m £m £m £m
31 March 2012Germany 8,233 (44) 8,189 (1) 8,188 2,965Italy 5,658 (28) 5,630 (1) 5,629 2,514Spain 4,763 (54) 4,709 (3) 4,706 1,193UK 5,397 (37) 5,360 (6) 5,354 1,294Other Europe 8,352 (59) 8,293 (5) 8,288 2,479Europe 32,403 (222) 32,181 (16) 32,165 10,445India 4,265 – 4,265 (6) 4,259 1,122Vodacom 5,638 – 5,638 (8) 5,630 1,930Other Africa, Middle East and Asia Pacific 3,965 – 3,965 (23) 3,942 1,063Africa, Middle East and Asia Pacific 13,868 – 13,868 (37) 13,831 4,115Non-Controlled Interests and Common Functions 423 – 423 (2) 421 (85)Group 46,694 (222) 46,472 (55) 46,417 14,475Verizon Wireless2 20,187 7,689
31 March 2011Germany 7,900 (51) 7,849 (2) 7,847 2,952Italy 5,722 (31) 5,691 (3) 5,688 2,643Spain 5,133 (62) 5,071 (2) 5,069 1,562UK 5,271 (50) 5,221 (7) 5,214 1,233Other Europe 8,253 (70) 8,183 (3) 8,180 2,433Europe 32,279 (264) 32,015 (17) 31,998 10,823India 3,855 (1) 3,854 (11) 3,843 985Vodacom 5,479 – 5,479 (8) 5,471 1,844Other Africa, Middle East and Asia Pacific 3,971 – 3,971 (27) 3,944 1,170Africa, Middle East and Asia Pacific 13,305 (1) 13,304 (46) 13,258 3,999Non-Controlled Interests and Common Functions 659 – 659 (31) 628 (152)Group 46,243 (265) 45,978 (94) 45,884 14,670Verizon Wireless2 18,711 7,313
31 March 2010Germany 8,008 (41) 7,967 (8) 7,959 3,122Italy 6,027 (40) 5,987 (2) 5,985 2,843Spain 5,713 (81) 5,632 (2) 5,630 1,956UK 5,025 (47) 4,978 (10) 4,968 1,141Other Europe 8,357 (88) 8,269 (5) 8,264 2,582Europe 33,130 (297) 32,833 (27) 32,806 11,644India 3,114 (1) 3,113 (20) 3,093 807Vodacom 4,450 – 4,450 (7) 4,443 1,528Other Africa, Middle East and Asia Pacific 3,526 – 3,526 (30) 3,496 977Africa, Middle East and Asia Pacific 11,090 (1) 11,089 (57) 11,032 3,312Non-Controlled Interests and Common Functions 667 – 667 (33) 634 (221)Group 44,887 (298) 44,589 (117) 44,472 14,735Verizon Wireless2 17,222 6,689
Notes:1 The Group’s measure of segment profit, EBITDA, excludes the Group’s share of results in associates. The Group’s share of results in associates, by segment, for the year ended 31 March 2012 is Other Europe £3 million
(2011: £nil; 2010 £nil), Vodacom £nil (2011: £nil; 2010: £(2) million), Other Africa, Middle East and Asia Pacific £36 million (2011: £51 million; 2010: £56 million) and Non-Controlled Interests and Common Functions £4,924 million (2011: £5,008 million; 2010: £4,688 million).
2 Values shown for Verizon Wireless, which is an associate, are not included in the calculation of Group revenue or EBITDA.

Business reviewPerform
anceG
overnanceFinancials
Additional information
107Vodafone Group Plc Annual Report 2012
A reconciliation of EBITDA to operating profit is shown below. For a reconciliation of operating profit to profit before taxation, see the consolidated income statement on page 94.
2012 2011 2010
£m £m £m
EBITDA 14,475 14,670 14,735Depreciation, amortisation and loss on disposal of fixed assets (7,906) (7,967) (8,011)Share of results in associates 4,963 5,059 4,742Impairment losses (4,050) (6,150) (2,100)Other income and expense 3,705 (16) 114Operating profit 11,187 5,596 9,480
Other
expenditure Depreciation Impairment
Non-current Capital on intangible and loss/
assets1 expenditure2 assets amortisation (reversal)
£m £m £m £m £m
31 March 2012Germany 19,151 880 4 1,469 –Italy 13,978 621 875 783 2,450Spain 8,069 429 71 626 900UK 6,430 575 – 880 –Other Europe 10,146 1,092 313 1,389 700Europe 57,774 3,597 1,263 5,147 4,050India 8,431 805 – 1,066 –Vodacom 6,469 723 – 840 –Other Africa, Middle East and Asia Pacific 4,735 793 – 771 –Africa, Middle East and Asia Pacific 19,635 2,321 – 2,677 –Non-Controlled Interests and Common Functions 760 447 – 35 –Group 78,169 6,365 1,263 7,859 4,050
31 March 2011Germany 20,764 824 1,214 1,361 –Italy 16,645 590 12 732 1,050Spain 9,596 517 – 641 2,950UK 6,665 516 – 874 –Other Europe 11,438 1,230 59 1,406 2,150Europe 65,108 3,677 1,285 5,014 6,150India 9,882 870 1,851 973 –Vodacom 7,382 572 19 1,013 –Other Africa, Middle East and Asia Pacific 4,797 754 2 793 –Africa, Middle East and Asia Pacific 22,061 2,196 1,872 2,779 –Non-Controlled Interests and Common Functions 1,570 346 9 83 –Group 88,739 6,219 3,166 7,876 6,150
31 March 2010Germany 20,211 766 18 1,422 –Italy 17,941 610 60 732 –Spain 12,746 543 – 638 –UK 6,977 494 – 963 –Other Europe 13,883 1,282 228 1,467 (200)Europe 71,758 3,695 306 5,222 (200)India 8,665 853 – 848 2,300Vodacom 7,783 520 – 1,005 –Other Africa, Middle East and Asia Pacific 5,062 694 – 683 –Africa, Middle East and Asia Pacific 21,510 2,067 – 2,536 2,300Non-Controlled Interests and Common Functions 1,632 430 19 152 –Group 94,900 6,192 325 7,910 2,100
Notes:1 Comprises goodwill, other intangible assets and property, plant and equipment.2 Includes additions to property, plant and equipment and computer software, reported within intangible assets.

108Vodafone Group Plc Annual Report 2012
Notes to the consolidated financial statements (continued)
4. Operating profitOperating profit has been arrived at after charging/(crediting):
2012 2011 2010
£m £m £m
Net foreign exchange losses/(gains) 34 14 (29)Depreciation of property, plant and equipment (note 11):
Owned assets 4,284 4,318 4,412Leased assets 79 54 44
Amortisation of intangible assets (note 9) 3,496 3,504 3,454Impairment of goodwill in subsidiaries and associates (note 10) 3,848 6,150 2,300Impairment/(reversal of impairment) of licences and spectrum (note 10) 121 – (200)Impairment of property, plant and equipment (note 10) 81 – –Research and development expenditure 304 287 303Staff costs (note 32) 3,843 3,642 3,770Operating lease rentals payable:
Plant and machinery 173 127 71Other assets including fixed line rentals 1,672 1,761 1,587
Loss on disposal of property, plant and equipment 47 91 101Own costs capitalised attributable to the construction or acquisition of property, plant and equipment (374) (331) (296)
The total remuneration of the Group’s auditor, Deloitte LLP and other member firms of Deloitte Touche Tohmatsu Limited for services provided to the Group is analysed below:
2012 2011 2010
£m £m £m
Audit fees:Parent company 1 1 1Subsidiaries 6 7 7
7 8 8Audit-related assurance services1 1 1 1Audit and audit-related fees 8 9 9
Taxation advisory services – 1 1Other non-audit services 1 – –Total fees 9 10 10
Note:1 Relates to fees for statutory and regulatory filings.
In addition to the above, the Group’s joint ventures and associates paid fees totalling £2 million (2011: £1 million, 2010: £2 million) and £5 million (2011: £5 million, 2010: £7 million) respectively to Deloitte LLP and other member firms of Deloitte Touche Tohmatsu Limited during the year. Deloitte LLP and other member firms of Deloitte Touche Tohmatsu Limited have also received amounts totalling less than £1 million in each of the last three years in respect of services provided to pension schemes and charitable foundations associated to the Group.
A description of the work performed by the Audit and Risk Committee in order to safeguard auditor independence when non-audit services are provided is set out in “Corporate governance” on page 70.

Business reviewPerform
anceG
overnanceFinancials
Additional information
109Vodafone Group Plc Annual Report 2012
5. Investment income and financing costs2012 2011 2010
£m £m £m
Investment income:Available-for-sale investments:
Dividends received 2 83 145Loans and receivables at amortised cost 168 339 423Gain on settlement of loans and receivables1 – 472 –Fair value through the income statement (held for trading):
Derivatives – foreign exchange contracts 121 38 3Other2 165 263 92
Equity put rights and similar arrangements3 – 114 53456 1,309 716
Financing costs:Items in hedge relationships:
Other loans 211 746 888Interest rate swaps (178) (338) (464)Dividends on redeemable preference shares 56 58 56Fair value hedging instrument (539) (47) 228Fair value of hedged item 511 40 (183)Cash flow hedges transferred from equity – 17 82
Other financial liabilities held at amortised cost:Bank loans and overdrafts4 769 629 591Other loans2 785 121 185Potential interest credit on settlement of tax issues5 (9) (826) (178)Equity put rights and similar arrangements2 3 81 19 94Finance leases 1 9 7
Fair value through the income statement (held for trading):Derivatives – forward starting swaps and futures 244 1 206
1,932 429 1,512Net financing costs/(investment income) 1,476 (880) 796
Notes:1 Gain on settlement of loans and receivables issued by SoftBank Mobile Corp.2 Amounts for 2012 include net foreign exchange gains of £55 million (2011: £405 million gain; 2010 £78 million loss) arising from net investments in foreign operations, investments held following the disposal of Vodafone
Japan to SoftBank Corp. and net foreign exchange movements on certain intercompany balances.3 Includes amounts in relation to the Group’s arrangements with its minority partners in India.4 The Group capitalised £25 million of interest expense in the year (2011: £138 million; 2010: £1 million). The interest rate used to determine the amount of borrowing costs eligible for capitalisation was 5.0%.5 Amounts for 2012, 2011 and 2010 include a reduction of the provision for potential interest on tax issues.
6. Taxation
Income tax expense2012 2011 2010
£m £m £m
United Kingdom corporation tax (income)/expense:Current year – 141 40Adjustments in respect of prior years (4) (5) (4)
(4) 136 36Overseas current tax expense/(income):
Current year 2,440 2,152 2,377Adjustments in respect of prior years (231) (477) (1,718)
2,209 1,675 659Total current tax expense 2,205 1,811 695
Deferred tax on origination and reversal of temporary differences:United Kingdom deferred tax (8) (275) (166)Overseas deferred tax 349 92 (473)
Total deferred tax expense/(income) 341 (183) (639)Total income tax expense 2,546 1,628 56

110Vodafone Group Plc Annual Report 2012
Notes to the consolidated financial statements (continued)
Tax (credited)/charged directly to other comprehensive income2012 2011 2010
£m £m £m
Current tax credit (5) (14) (38)Deferred tax (credit)/charge (119) (117) 137Total tax (credited)/charged directly to other comprehensive income (124) (131) 99
Tax credited directly to equity2012 2011 2010
£m £m £m
Current tax credit (1) (5) (1)Deferred tax credit (1) (19) (10)Total tax credited directly to equity (2) (24) (11)
Factors affecting tax expense for the yearThe table below explains the differences between the expected tax expense, at the UK statutory tax rate of 26% (2011 and 2010: 28%), and the Group’s total tax expense for each year. Further discussion of the current year tax expense can be found in the section titled “Operating results” on page 41.
2012 2011 2010
£m £m £m
Profit before tax as shown in the consolidated income statement 9,549 9,498 8,674 Expected income tax expense at UK statutory tax rate 2,483 2,659 2,429 Effect of taxation of associates, reported within operating profit 78 145 160 Impairment losses with no tax effect 1,053 1,722 588 Disposal of Group investments1 (718) (763) – Impact of agreement of German write down losses – – (2,103)Effect of different statutory tax rates of overseas jurisdictions 675 371 370 Deferred tax impact of previously unrecognised temporary differences including losses2 (634) (1,247) (198)Current tax impact of previously unrecognised temporary differences including losses – (734) (261)Effect of unrecognised temporary differences (285) 366 (260)Adjustments in respect of prior years (210) (1,088) (387)Effect of secondary and irrecoverable taxes 159 91 49 Effect of current year changes in statutory tax rates (3) 29 35 Deferred tax on overseas earnings 15 143 5 Assets revalued for tax purposes – 121 – Expenses not deductible for tax purposes and other items 235 332 201 Exclude taxation of associates (302) (519) (572)Income tax expense 2,546 1,628 56
Notes:1 Relates to the disposal of SFR and Polkomtel. 2011 relates to the disposal of China Mobile Limited and SoftBank.2 See note regarding deferred tax asset recognition on page 111.
Deferred taxAnalysis of movements in the net deferred tax balance during the year:
£m
1 April 2011 (4,468)Exchange movements 26Charged to the income statement (341)Credited directly to other comprehensive income 119Credited directly to equity 1Reclassifications 10Arising on acquisition and disposals 2631 March 2012 (4,627)
6. Taxation (continued)

Business reviewPerform
anceG
overnanceFinancials
Additional information
111Vodafone Group Plc Annual Report 2012
Deferred tax assets and liabilities, before offset of balances within countries, are as follows:
Amount Net
(charged)/ recognised
credited Gross Gross Less deferred tax
in income deferred deferred tax amounts (liability)/
statement tax asset liability unrecognised asset
£m £m £m £m £m
Accelerated tax depreciation (792) 198 (4,595) – (4,397)
Intangible assets 178 620 (2,061) (275) (1,716)Tax losses 254 24,742 – (22,515) 2,227 Deferred tax on overseas earnings (13) – (1,796) – (1,796)Other short-term temporary differences 32 3,254 (877) (1,322) 1,055 31 March 2012 (341) 28,814 (9,329) (24,112) (4,627)
Analysed in the statement of financial position, after offset of balances within countries, as:
£m
Deferred tax asset 1,970Deferred tax liability (6,597)31 March 2012 (4,627)
Amount Net
(charged)/ recognised
credited Gross Gross Less deferred tax
in income deferred deferred tax amounts (liability)/
statement tax asset liability unrecognised asset
£m £m £m £m £m
Accelerated tax depreciation (1,374) 253 (3,682) – (3,429)Intangible assets (140) 815 (2,449) (335) (1,969)Tax losses 1,198 27,882 – (25,784) 2,098 Deferred tax on overseas earnings 764 – (1,775) – (1,775)Other short-term temporary differences (265) 4,075 (395) (3,073) 607 31 March 2011 183 33,025 (8,301) (29,192) (4,468)
Analysed in the statement of financial position, after offset of balances within countries, as:
£m
Deferred tax asset 2,018Deferred tax liability (6,486)31 March 2011 (4,468)
Factors affecting the tax charge in future yearsFactors that may affect the Group’s future tax charge include the impact of corporate restructurings, the resolution of open issues, future planning opportunities, corporate acquisitions and disposals, the use of brought forward tax losses and changes in tax legislation and tax rates.
The Group is routinely subject to audit by tax authorities in the territories in which it operates, and specifically, in India these are usually resolved through the Indian legal system. The Group considers each issue on its merits and, where appropriate, holds provisions in respect of the potential tax liability that may arise. However, the amount ultimately paid may differ materially from the amount accrued and could therefore affect the Group’s overall profitability and cash flows in future periods.
At 31 March 2012 the gross amount and expiry dates of losses available for carry forward are as follows:
Expiring Expiring
within within
5 years 6-10 years Unlimited Total
£m £m £m £m
Losses for which a deferred tax asset is recognised 68 31 8,317 8,416Losses for which no deferred tax is recognised 1,838 670 82,912 85,420
1,906 701 91,229 93,836
The losses arising on the write down of investments in Germany are available to use against both German federal and trade tax liabilities. Losses of £3,804 million (2011: £3,892 million) are included in the above table on which a deferred tax asset has been recognised. The Group has not recognised a deferred tax asset on £11,547 million (2011: £13,389 million) of the losses as it is uncertain that these losses will be utilised.
Included above are losses amounting to £1,907 million (2011: £1,907 million) in respect of UK subsidiaries which are only available for offset against future capital gains and since it is uncertain whether these losses will be utilised, no deferred tax asset has been recognised.
The losses above also include £72,696 million (2011: £82,725 million) that have arisen in overseas holding companies as a result of revaluations of those companies’ investments for local GAAP purposes. No deferred tax asset is recognised in respect of £68,653 million of these losses as it is uncertain whether these losses will be utilised. A deferred tax asset has been recognised for the remainder of these losses (see page 112).

112Vodafone Group Plc Annual Report 2012
Notes to the consolidated financial statements (continued)
A total deferred tax asset of £1,164 million (2011: £1,143 million) has been recognised in relation to some of the losses of a fiscal unity in Luxembourg as we expect the members of this fiscal unity to generate taxable profits against which these losses will be used. £791 million (2011: £856 million) of the asset has been recognised as a result of the agreement reached with the UK tax authorities in respect of the CFC tax case in the prior year.
The Group holds provisions in respect of deferred taxation that would arise if temporary differences on investments in subsidiaries, associates and interests in joint ventures were to be realised after the year end reporting date. No deferred tax liability has been recognised in respect of a further £40,515 million (2011: £41,607 million) of unremitted earnings of subsidiaries, joint ventures and associates because the Group is in a position to control the timing of the reversal of the temporary difference and it is probable that such differences will not reverse in the foreseeable future. It is not practicable to estimate the amount of unrecognised deferred tax liabilities in respect of these unremitted earnings.
7. Equity dividends2012 2011 2010
£m £m £m
Declared during the financial year:Final dividend for the year ended 31 March 2011: 6.05 pence per share(2010: 5.65 pence per share, 2009: 5.20 pence per share) 3,102 2,976 2,731Interim dividend for the year ended 31 March 2012: 3.05 pence per share(2011: 2.85 pence per share, 2010: 2.66 pence per share) 1,536 1,492 1,400Second interim dividend share for the year ended 31 March 2012: 4.00 pence per share(2011: nil, 2010: nil) 2,016 – –
6,654 4,468 4,131Proposed after the end of reporting period and not recognised as a liability:Final dividend for the year ended 31 March 2012: 6.47 pence per share(2011: 6.05 pence per share, 2010: 5.65 pence per share) 3,195 3,106 2,976
8. Earnings per share2012 2011 2010
Millions Millions Millions
Weighted average number of shares for basic earnings per share 50,644 52,408 52,595Effect of dilutive potential shares: restricted shares and share options 314 340 254Weighted average number of shares for diluted earnings per share 50,958 52,748 52,849
£m £m £m
Earnings for basic and diluted earnings per share 6,957 7,968 8,645
6. Taxation (continued)
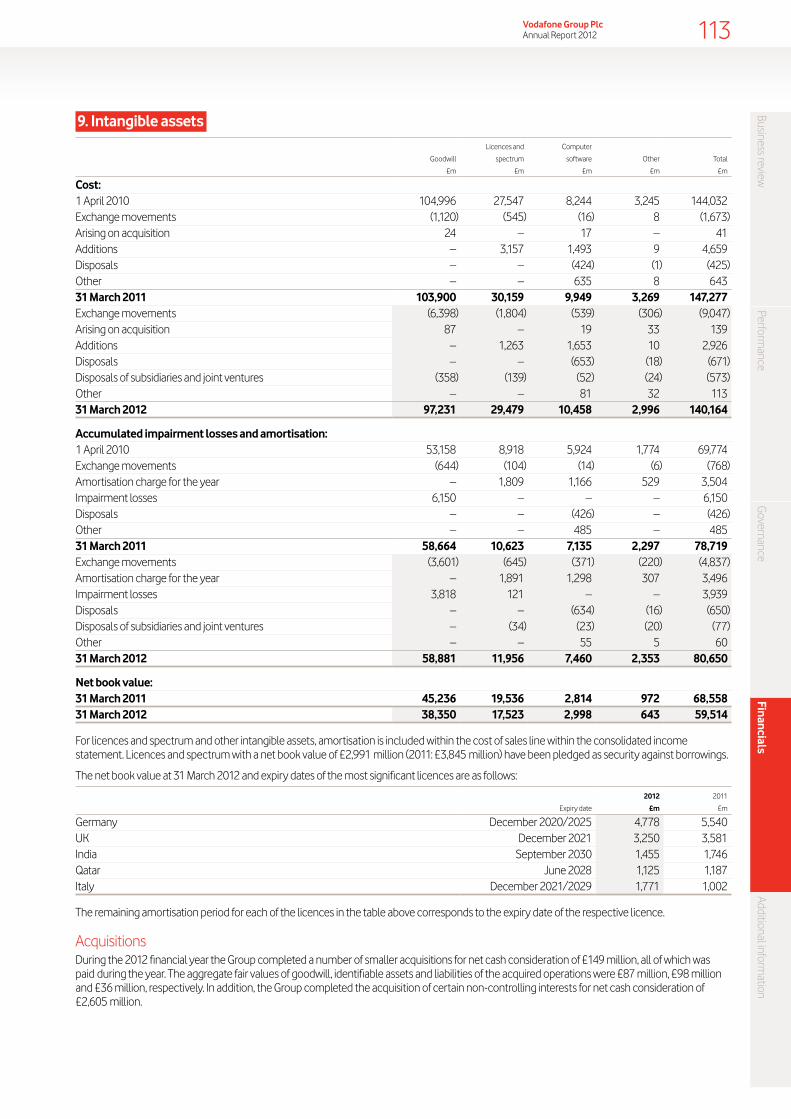
Business reviewPerform
anceG
overnanceFinancials
Additional information
113Vodafone Group Plc Annual Report 2012
9. Intangible assetsLicences and Computer
Goodwill spectrum software Other Total
£m £m £m £m £m
Cost:1 April 2010 104,996 27,547 8,244 3,245 144,032Exchange movements (1,120) (545) (16) 8 (1,673)Arising on acquisition 24 – 17 – 41Additions – 3,157 1,493 9 4,659Disposals – – (424) (1) (425)Other – – 635 8 64331 March 2011 103,900 30,159 9,949 3,269 147,277Exchange movements (6,398) (1,804) (539) (306) (9,047)Arising on acquisition 87 – 19 33 139Additions – 1,263 1,653 10 2,926Disposals – – (653) (18) (671)Disposals of subsidiaries and joint ventures (358) (139) (52) (24) (573)Other – – 81 32 11331 March 2012 97,231 29,479 10,458 2,996 140,164
Accumulated impairment losses and amortisation:1 April 2010 53,158 8,918 5,924 1,774 69,774Exchange movements (644) (104) (14) (6) (768)Amortisation charge for the year – 1,809 1,166 529 3,504Impairment losses 6,150 – – – 6,150Disposals – – (426) – (426)Other – – 485 – 48531 March 2011 58,664 10,623 7,135 2,297 78,719Exchange movements (3,601) (645) (371) (220) (4,837)Amortisation charge for the year – 1,891 1,298 307 3,496Impairment losses 3,818 121 – – 3,939Disposals – – (634) (16) (650)Disposals of subsidiaries and joint ventures – (34) (23) (20) (77)Other – – 55 5 6031 March 2012 58,881 11,956 7,460 2,353 80,650
Net book value:31 March 2011 45,236 19,536 2,814 972 68,55831 March 2012 38,350 17,523 2,998 643 59,514
For licences and spectrum and other intangible assets, amortisation is included within the cost of sales line within the consolidated income statement. Licences and spectrum with a net book value of £2,991 million (2011: £3,845 million) have been pledged as security against borrowings.
The net book value at 31 March 2012 and expiry dates of the most significant licences are as follows:
2012 2011
Expiry date £m £m
Germany December 2020/2025 4,778 5,540UK December 2021 3,250 3,581India September 2030 1,455 1,746Qatar June 2028 1,125 1,187Italy December 2021/2029 1,771 1,002
The remaining amortisation period for each of the licences in the table above corresponds to the expiry date of the respective licence.
AcquisitionsDuring the 2012 financial year the Group completed a number of smaller acquisitions for net cash consideration of £149 million, all of which was paid during the year. The aggregate fair values of goodwill, identifiable assets and liabilities of the acquired operations were £87 million, £98 million and £36 million, respectively. In addition, the Group completed the acquisition of certain non-controlling interests for net cash consideration of £2,605 million.

114Vodafone Group Plc Annual Report 2012
Notes to the consolidated financial statements (continued)
10. Impairment
Impairment lossesThe net impairment losses recognised in the consolidated income statement, as a separate line item within operating profit, in respect of goodwill, licences and spectrum fees, and property, plant and equipment are as follows:
2012 20111 2010Cash generating unit Reportable segment £m £m £m
Italy Italy 2,450 1,050 –Spain Spain 900 2,950 –Greece Other Europe2 450 800 –Portugal Other Europe2 250 350 –Ireland Other Europe2 – 1,000 –Turkey Other Europe – – (200)India India – – 2,300
4,050 6,150 2,100
Notes:1 Impairment charges for the year ended 31 March 2011 relate solely to goodwill.2 Total impairment losses in the Other Europe segment were £700 million in the year ended 31 March 2012 (2011: £2,150 million).
Year ended 31 March 2012The impairment losses were based on value in use calculations. The pre-tax adjusted discount rates used in the most recent value in use calculation in the year ended 31 March 2012 are as follows:
Pre-tax adjusted
discount rate
Italy 12.1%Spain 10.6%Greece 22.8%Portugal 16.9%
During the year ended 31 March 2012, impairment charges in relation to the Group’s investments in Italy, Spain, Greece and Portugal of £2,450 million, £900 million, £450 million and £250 million, respectively, were reported. Of the total charge, £3,848 million relates to goodwill, and £202 million is allocated to licence intangible assets and property, plant and equipment in Greece.
The impairment charges were primarily driven by increased discount rates as a result of increases in bond rates, with the exception of Spain where rates have reduced marginally compared to 31 March 2011. In addition, business valuations were negatively impacted by lower cash flows within business plans reflecting challenging economic and competitive conditions, and faster than expected regulatory rate cuts, particularly in Italy.
The pre-tax risk adjusted discount rates used in the previous value in use calculations at 31 March 2011 are disclosed below.
Year ended 31 March 2011The net impairment losses were based on value in use calculations. The pre-tax adjusted discount rates used in the value in use calculation in the year ended 31 March 2011 were as follows:
Pre-tax adjusted
discount rate
Italy 11.9%Spain 11.5%Greece 14.0%Ireland 14.5%Portugal 14.0%
During the year ended 31 March 2011 the goodwill in relation to the Group’s investments in Italy, Spain, Greece, Ireland and Portugal was impaired by £1,050 million, £2,950 million, £800 million, £1,000 million and £350 million, respectively. The impairment charges were primarily driven by increased discount rates as a result of increases in government bond rates. In addition, business valuations were negatively impacted by lower cash flows within business plans, reflecting weaker country-level macroeconomic environments.

Business reviewPerform
anceG
overnanceFinancials
Additional information
115Vodafone Group Plc Annual Report 2012
Year ended 31 March 2010The net impairment loss was based on value in use calculations. The pre-tax adjusted discount rates used in the value in use calculation in the year ended 31 March 2010 were as follows:
Pre-tax adjusted
discount rate
India 13.8%Turkey 17.6%
During the year ended 31 March 2010 the goodwill in relation to the Group’s operations in India was impaired by £2,300 million primarily due to intense price competition following the entry of a number of new operators into the market. The pre-tax risk adjusted discount rate used in the previous value in use calculation at 31 March 2009 was 12.3%.
In addition, impairment losses of £200 million, previously recognised in respect of intangible assets in relation to the Group’s operations in Turkey, were reversed. The reversal was in relation to licences and spectrum and was as a result of favourable changes in the discount rate. The cash flow projections within the business plans used for impairment testing were substantially unchanged from those used at 31 March 2009. The pre-tax risk adjusted discount rate used in the previous value in use calculation at 31 March 2009 was 19.5%.
GoodwillThe carrying value of goodwill at 31 March was as follows:
2012 2011
£m £m
Germany 11,566 12,200Italy 10,400 13,615Spain 5,833 7,133
27,799 32,948Other 10,551 12,288
38,350 45,236
Key assumptions used in the value in use calculationsThe key assumptions used in determining the value in use are:Assumption How determined
Budgeted EBITDA Budgeted EBITDA has been based on past experience adjusted for the following:aa voice and messaging revenue is expected to benefit from increased usage from new customers, especially in emerging markets, the introduction of new services and traffic moving from fixed networks to mobile networks, though these factors will be offset by increased competitor activity, which may result in price declines, and the trend of falling termination and other regulated rates;
aa non-messaging data revenue is expected to continue to grow as the penetration of 3G (plus 4G where available) enabled devices and smartphones rise along with higher data bundle attachment rates, and new products and services are introduced; and
aa margins are expected to be impacted by negative factors such as the cost of acquiring and retaining customers in increasingly competitive markets and the expectation of further termination rate cuts by regulators and by positive factors such as the efficiencies expected from the implementation of Group initiatives.
Budgeted capital expenditure The cash flow forecasts for capital expenditure are based on past experience and include the ongoing capital expenditure required to roll out networks in emerging markets, to provide enhanced voice and data products and services and to meet the population coverage requirements of certain of the Group’s licences. Capital expenditure includes cash outflows for the purchase of property, plant and equipment and computer software.
Long-term growth rate For businesses where the five year management plans are used for the Group’s value in use calculations, a long-term growth rate into perpetuity has been determined as the lower of:
aa the nominal GDP rates for the country of operation; andaa the long-term compound annual growth rate in EBITDA in years six to ten estimated by management.
Pre-tax risk adjusted discount rate The discount rate applied to the cash flows of each of the Group’s operations is generally based on the risk free rate for ten year bonds issued by the government in the respective market. Where government bond rates contain a material component of credit risk, high quality local corporate bond rates may be used.These rates are adjusted for a risk premium to reflect both the increased risk of investing in equities and the systematic risk of the specific Group operating company. In making this adjustment, inputs required are the equity market risk premium (that is the required increased return required over and above a risk free rate by an investor who is investing in the market as a whole) and the risk adjustment, beta, applied to reflect the risk of the specific Group operating company relative to the market as a whole.In determining the risk adjusted discount rate, management has applied an adjustment for the systematic risk to each of the Group’s operations determined using an average of the betas of comparable listed mobile telecommunications companies and, where available and appropriate, across a specific territory. Management has used a forward-looking equity market risk premium that takes into consideration both studies by independent economists, the average equity market risk premium over the past ten years and the market risk premiums typically used by investment banks in evaluating acquisition proposals.

116Vodafone Group Plc Annual Report 2012
Notes to the consolidated financial statements (continued)
Sensitivity to changes in assumptionsOther than as disclosed below, management believes that no reasonably possible change in any of the above key assumptions would cause the carrying value of any cash generating unit to exceed its recoverable amount.
31 March 2012The estimated recoverable amounts of the Group’s operations in Italy, Spain, Greece and Portugal equalled their respective carrying values and, consequently, any adverse change in key assumption would, in isolation, cause a further impairment loss to be recognised. The estimated recoverable amounts of the Group’s operations in India and Romania exceeded their carrying values by approximately £2,060 million and £66 million respectively.
The table below shows the key assumptions used in the value in use calculations.
Assumptions used in value in use calculation
Germany Italy Spain Greece Portugal India Romania
% % % % % % %
Pre-tax adjusted discount rate 8.5 12.1 10.6 22.8 16.9 15.1 11.5 Long-term growth rate 1.5 1.2 1.6 1.0 2.3 6.8 3.0 Budgeted EBITDA1 2.3 (1.2) 3.9 (6.1) 0.2 15.0 0.8 Budgeted capital expenditure2 8.5–11.8 10.1–12.3 10.3–11.7 9.3–12.7 12.5–14.0 11.4–14.4 12.0–14.3
Notes:1 Budgeted EBITDA is expressed as the compound annual growth rates in the initial five years for all cash generating units of the plans used for impairment testing.2 Budgeted capital expenditure is expressed as the range of capital expenditure as a percentage of revenue in the initial five years for all cash generating units of the plans used for impairment testing.
The table below shows, for India and Romania, the amount by which each key assumption must change in isolation in order for the estimated recoverable amount to be equal to its carrying value.
Change required for carrying value to equal the recoverable amount
India Romania
pps pps
Pre-tax adjusted discount rate 1.1 0.3Long-term growth rate (1.6) (0.4)Budgeted EBITDA1 (3.3) (0.6)Budgeted capital expenditure2 3.6 1.0
Notes:1 Budgeted EBITDA is expressed as the compound annual growth rates in the initial five years for all cash generating units of the plans used for impairment testing.2 Budgeted capital expenditure is expressed as a percentage of revenue in the initial five years for all the cash generating units of the plans used for impairment testing.
The changes in the following table to assumptions used in the impairment review would, in isolation, lead to an (increase)/decrease to the aggregate impairment loss recognised in the year ended 31 March 2012:
Italy Spain Greece Portugal
Increase Decrease Increase Decrease Increase Decrease Increase Decrease
by 2pps by 2pps by 2pps by 2pps by 2pps by 2pps by 2pps by 2pps
£bn £bn £bn £bn £bn £bn £bn £bn
Pre-tax adjusted discount rate (2.22) 2.45 (1.42) 0.90 (0.03) 0.06 (0.23) 0.25Long-term growth rate 2.45 (2.16) 0.90 (1.31) 0.04 (0.01) 0.25 (0.18)Budgeted EBITDA1 1.70 (1.64) 0.30 (0.28) 0.04 (0.01) 0.22 (0.20)Budgeted capital expenditure2 (1.00) 0.94 (0.93) 0.90 (0.05) 0.07 (0.13) 0.14
Notes:1 Budgeted EBITDA is expressed as the compound annual growth rates in the initial five years for all cash generating units of the plans used for impairment testing.2 Budgeted capital expenditure is expressed as a percentage of revenue in the initial five years for all cash generating units of the plans used for impairment testing.
31 March 2011The estimated recoverable amounts of the Group’s operations in Italy, Spain, Greece, Ireland and Portugal equalled their respective carrying values and, consequently, any adverse change in key assumptions would, in isolation, cause a further impairment loss to be recognised. The estimated recoverable amounts of the Group’s operations in Turkey, India and Ghana exceeded their carrying values by approximately £1,481 million, £977 million and £138 million, respectively.
The table below shows the key assumptions used in the value in use calculations.Assumptions used in value in use calculation
Italy Spain Greece Ireland Portugal Turkey India Ghana
% % % % % % % %
Pre-tax adjusted discount rate 11.9 11.5 14.0 14.5 14.0 14.1 14.2 20.8Long-term growth rate 0.8 1.6 2.0 2.0 1.5 6.1 6.3 6.3Budgeted EBITDA1 (1.0) – 1.2 2.4 (1.2) 16.8 16.5 41.4Budgeted capital expenditure2 9.6–11.3 7.8–10.6 10.7–12.3 9.4–11.6 12.4–14.1 10.0–16.6 12.9–22.7 7.3–41.3
Notes:1 Budgeted EBITDA is expressed as the compound annual growth rates in the initial ten years for Turkey and Ghana and the initial five years for all other cash generating units of the plans used for impairment testing.2 Budgeted capital expenditure is expressed as the range of capital expenditure as a percentage of revenue in the initial ten years for Turkey and Ghana and the initial five years for all other cash generating units of the plans
used for impairment testing.
10. Impairment (continued)
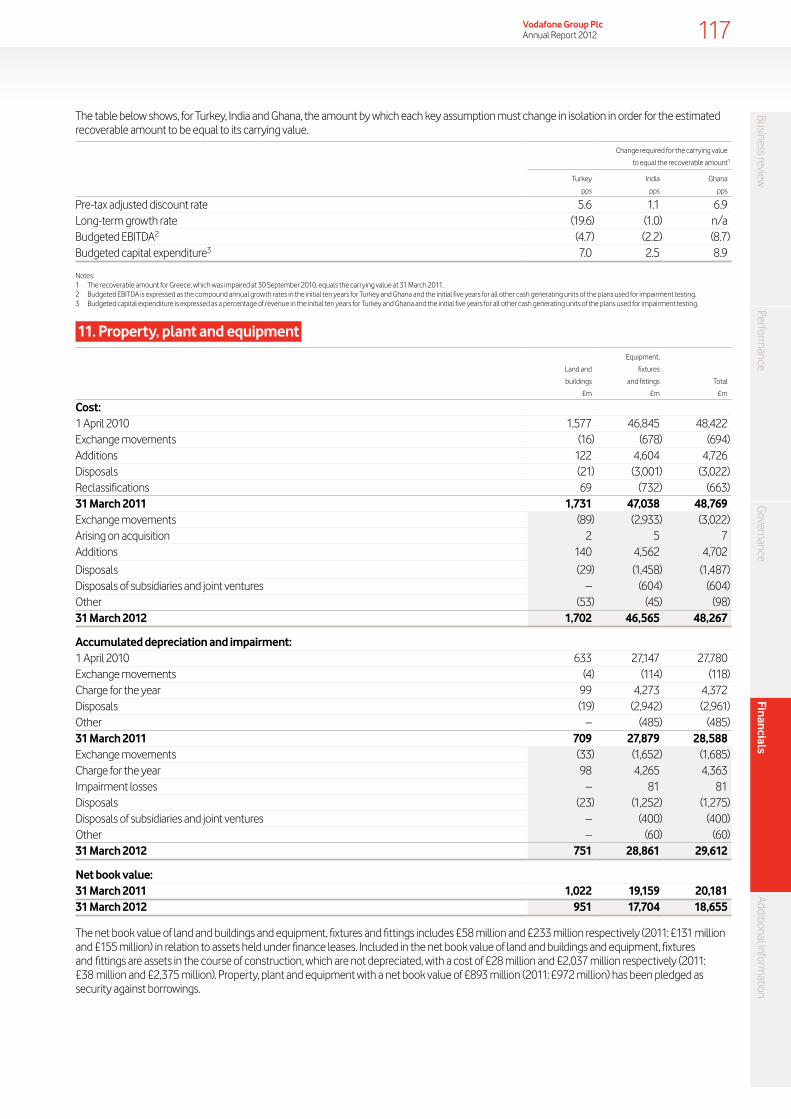
Business reviewPerform
anceG
overnanceFinancials
Additional information
117Vodafone Group Plc Annual Report 2012
The table below shows, for Turkey, India and Ghana, the amount by which each key assumption must change in isolation in order for the estimated recoverable amount to be equal to its carrying value.
Change required for the carrying value
to equal the recoverable amount1
Turkey India Ghana
pps pps pps
Pre-tax adjusted discount rate 5.6 1.1 6.9Long-term growth rate (19.6) (1.0) n/aBudgeted EBITDA2 (4.7) (2.2) (8.7)Budgeted capital expenditure3 7.0 2.5 8.9
Notes:1 The recoverable amount for Greece, which was impaired at 30 September 2010, equals the carrying value at 31 March 2011.2 Budgeted EBITDA is expressed as the compound annual growth rates in the initial ten years for Turkey and Ghana and the initial five years for all other cash generating units of the plans used for impairment testing.3 Budgeted capital expenditure is expressed as a percentage of revenue in the initial ten years for Turkey and Ghana and the initial five years for all other cash generating units of the plans used for impairment testing.
11. Property, plant and equipmentEquipment,
Land and fixtures
buildings and fittings Total
£m £m £m
Cost:1 April 2010 1,577 46,845 48,422Exchange movements (16) (678) (694)Additions 122 4,604 4,726Disposals (21) (3,001) (3,022)Reclassifications 69 (732) (663)31 March 2011 1,731 47,038 48,769 Exchange movements (89) (2,933) (3,022)Arising on acquisition 2 5 7 Additions 140 4,562 4,702
Disposals (29) (1,458) (1,487)Disposals of subsidiaries and joint ventures – (604) (604)Other (53) (45) (98)31 March 2012 1,702 46,565 48,267
Accumulated depreciation and impairment:1 April 2010 633 27,147 27,780Exchange movements (4) (114) (118)Charge for the year 99 4,273 4,372Disposals (19) (2,942) (2,961)Other – (485) (485)31 March 2011 709 27,879 28,588Exchange movements (33) (1,652) (1,685)Charge for the year 98 4,265 4,363Impairment losses – 81 81Disposals (23) (1,252) (1,275)Disposals of subsidiaries and joint ventures – (400) (400)Other – (60) (60)31 March 2012 751 28,861 29,612
Net book value:31 March 2011 1,022 19,159 20,18131 March 2012 951 17,704 18,655
The net book value of land and buildings and equipment, fixtures and fittings includes £58 million and £233 million respectively (2011: £131 million and £155 million) in relation to assets held under finance leases. Included in the net book value of land and buildings and equipment, fixtures and fittings are assets in the course of construction, which are not depreciated, with a cost of £28 million and £2,037 million respectively (2011: £38 million and £2,375 million). Property, plant and equipment with a net book value of £893 million (2011: £972 million) has been pledged as security against borrowings.
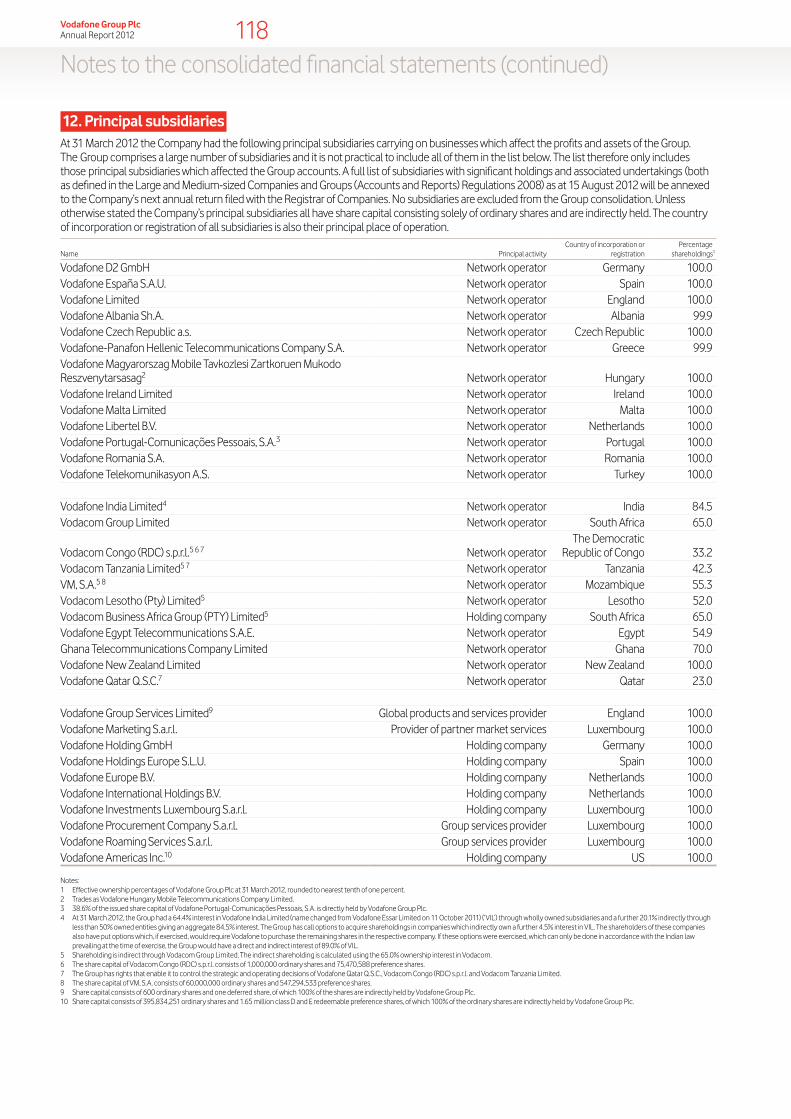
118Vodafone Group Plc Annual Report 2012
Notes to the consolidated financial statements (continued)
12. Principal subsidiariesAt 31 March 2012 the Company had the following principal subsidiaries carrying on businesses which affect the profits and assets of the Group. The Group comprises a large number of subsidiaries and it is not practical to include all of them in the list below. The list therefore only includes those principal subsidiaries which affected the Group accounts. A full list of subsidiaries with significant holdings and associated undertakings (both as defined in the Large and Medium-sized Companies and Groups (Accounts and Reports) Regulations 2008) as at 15 August 2012 will be annexed to the Company’s next annual return filed with the Registrar of Companies. No subsidiaries are excluded from the Group consolidation. Unless otherwise stated the Company’s principal subsidiaries all have share capital consisting solely of ordinary shares and are indirectly held. The country of incorporation or registration of all subsidiaries is also their principal place of operation.
Name Principal activityCountry of incorporation or
registrationPercentage
shareholdings1
Vodafone D2 GmbH Network operator Germany 100.0Vodafone España S.A.U. Network operator Spain 100.0Vodafone Limited Network operator England 100.0Vodafone Albania Sh.A. Network operator Albania 99.9Vodafone Czech Republic a.s. Network operator Czech Republic 100.0Vodafone-Panafon Hellenic Telecommunications Company S.A. Network operator Greece 99.9Vodafone Magyarorszag Mobile Tavkozlesi Zartkoruen Mukodo Reszvenytarsasag2 Network operator Hungary 100.0Vodafone Ireland Limited Network operator Ireland 100.0Vodafone Malta Limited Network operator Malta 100.0Vodafone Libertel B.V. Network operator Netherlands 100.0Vodafone Portugal-Comunicações Pessoais, S.A.3 Network operator Portugal 100.0Vodafone Romania S.A. Network operator Romania 100.0Vodafone Telekomunikasyon A.S. Network operator Turkey 100.0
Vodafone India Limited4 Network operator India 84.5Vodacom Group Limited Network operator South Africa 65.0
Vodacom Congo (RDC) s.p.r.l.5 6 7 Network operatorThe Democratic
Republic of Congo 33.2Vodacom Tanzania Limited5 7 Network operator Tanzania 42.3VM, S.A.5 8 Network operator Mozambique 55.3Vodacom Lesotho (Pty) Limited5 Network operator Lesotho 52.0Vodacom Business Africa Group (PTY) Limited5 Holding company South Africa 65.0Vodafone Egypt Telecommunications S.A.E. Network operator Egypt 54.9Ghana Telecommunications Company Limited Network operator Ghana 70.0Vodafone New Zealand Limited Network operator New Zealand 100.0Vodafone Qatar Q.S.C.7 Network operator Qatar 23.0
Vodafone Group Services Limited9 Global products and services provider England 100.0Vodafone Marketing S.a.r.l. Provider of partner market services Luxembourg 100.0Vodafone Holding GmbH Holding company Germany 100.0Vodafone Holdings Europe S.L.U. Holding company Spain 100.0Vodafone Europe B.V. Holding company Netherlands 100.0Vodafone International Holdings B.V. Holding company Netherlands 100.0Vodafone Investments Luxembourg S.a.r.l. Holding company Luxembourg 100.0Vodafone Procurement Company S.a.r.l. Group services provider Luxembourg 100.0Vodafone Roaming Services S.a.r.l. Group services provider Luxembourg 100.0Vodafone Americas Inc.10 Holding company US 100.0
Notes:1 Effective ownership percentages of Vodafone Group Plc at 31 March 2012, rounded to nearest tenth of one percent. 2 Trades as Vodafone Hungary Mobile Telecommunications Company Limited.3 38.6% of the issued share capital of Vodafone Portugal-Comunicações Pessoais, S.A. is directly held by Vodafone Group Plc.4 At 31 March 2012, the Group had a 64.4% interest in Vodafone India Limited (name changed from Vodafone Essar Limited on 11 October 2011) (‘VIL’) through wholly owned subsidiaries and a further 20.1% indirectly through
less than 50% owned entities giving an aggregate 84.5% interest. The Group has call options to acquire shareholdings in companies which indirectly own a further 4.5% interest in VIL. The shareholders of these companies also have put options which, if exercised, would require Vodafone to purchase the remaining shares in the respective company. If these options were exercised, which can only be done in accordance with the Indian law prevailing at the time of exercise, the Group would have a direct and indirect interest of 89.0% of VIL.
5 Shareholding is indirect through Vodacom Group Limited. The indirect shareholding is calculated using the 65.0% ownership interest in Vodacom.6 The share capital of Vodacom Congo (RDC) s.p.r.l. consists of 1,000,000 ordinary shares and 75,470,588 preference shares.7 The Group has rights that enable it to control the strategic and operating decisions of Vodafone Qatar Q.S.C., Vodacom Congo (RDC) s.p.r.l. and Vodacom Tanzania Limited. 8 The share capital of VM, S.A. consists of 60,000,000 ordinary shares and 547,294,533 preference shares.9 Share capital consists of 600 ordinary shares and one deferred share, of which 100% of the shares are indirectly held by Vodafone Group Plc.10 Share capital consists of 395,834,251 ordinary shares and 1.65 million class D and E redeemable preference shares, of which 100% of the ordinary shares are indirectly held by Vodafone Group Plc.
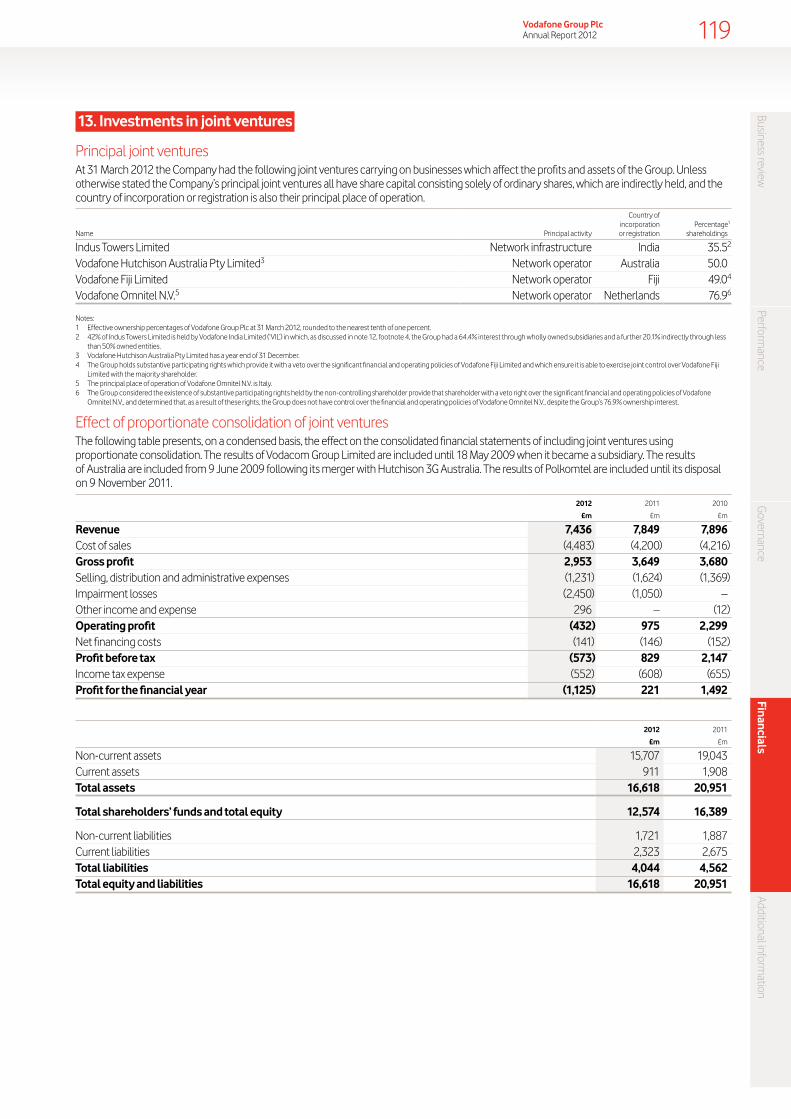
Business reviewPerform
anceG
overnanceFinancials
Additional information
119Vodafone Group Plc Annual Report 2012
13. Investments in joint ventures
Principal joint venturesAt 31 March 2012 the Company had the following joint ventures carrying on businesses which affect the profits and assets of the Group. Unless otherwise stated the Company’s principal joint ventures all have share capital consisting solely of ordinary shares, which are indirectly held, and the country of incorporation or registration is also their principal place of operation.
Country of incorporation Percentage1
Name Principal activity or registration shareholdings
Indus Towers Limited Network infrastructure India 35.52
Vodafone Hutchison Australia Pty Limited3 Network operator Australia 50.0Vodafone Fiji Limited Network operator Fiji 49.04
Vodafone Omnitel N.V.5 Network operator Netherlands 76.96
Notes:1 Effective ownership percentages of Vodafone Group Plc at 31 March 2012, rounded to the nearest tenth of one percent.2 42% of Indus Towers Limited is held by Vodafone India Limited (‘VIL’) in which, as discussed in note 12, footnote 4, the Group had a 64.4% interest through wholly owned subsidiaries and a further 20.1% indirectly through less
than 50% owned entities.3 Vodafone Hutchison Australia Pty Limited has a year end of 31 December.4 The Group holds substantive participating rights which provide it with a veto over the significant financial and operating policies of Vodafone Fiji Limited and which ensure it is able to exercise joint control over Vodafone Fiji
Limited with the majority shareholder.5 The principal place of operation of Vodafone Omnitel N.V. is Italy.6 The Group considered the existence of substantive participating rights held by the non-controlling shareholder provide that shareholder with a veto right over the significant financial and operating policies of Vodafone
Omnitel N.V., and determined that, as a result of these rights, the Group does not have control over the financial and operating policies of Vodafone Omnitel N.V., despite the Group’s 76.9% ownership interest.
Effect of proportionate consolidation of joint venturesThe following table presents, on a condensed basis, the effect on the consolidated financial statements of including joint ventures using proportionate consolidation. The results of Vodacom Group Limited are included until 18 May 2009 when it became a subsidiary. The results of Australia are included from 9 June 2009 following its merger with Hutchison 3G Australia. The results of Polkomtel are included until its disposal on 9 November 2011.
2012 2011 2010
£m £m £m
Revenue 7,436 7,849 7,896Cost of sales (4,483) (4,200) (4,216)Gross profit 2,953 3,649 3,680Selling, distribution and administrative expenses (1,231) (1,624) (1,369)Impairment losses (2,450) (1,050) –Other income and expense 296 – (12)Operating profit (432) 975 2,299Net financing costs (141) (146) (152)Profit before tax (573) 829 2,147Income tax expense (552) (608) (655)Profit for the financial year (1,125) 221 1,492
2012 2011
£m £m
Non-current assets 15,707 19,043Current assets 911 1,908Total assets 16,618 20,951
Total shareholders’ funds and total equity 12,574 16,389
Non-current liabilities 1,721 1,887Current liabilities 2,323 2,675Total liabilities 4,044 4,562Total equity and liabilities 16,618 20,951

120Vodafone Group Plc Annual Report 2012
Notes to the consolidated financial statements (continued)
14. Investments in associatesAt 31 March 2012 the Company had the following principal associates carrying on businesses which affect the profits and assets of the Group. The Company’s principal associates all have share capital consisting solely of ordinary shares, unless otherwise stated, and are all indirectly held. The country of incorporation or registration of all associates is also their principal place of operation.
Country ofincorporation Percentage1
Name Principal activity or registration shareholdings
Cellco Partnership2 Network operator US 45.0Safaricom Limited3 4 Network operator Kenya 40.0
Notes:1 Effective ownership percentages of Vodafone Group Plc at 31 March 2012, rounded to the nearest tenth of one percent.2 Cellco Partnership trades under the name Verizon Wireless.3 The Group also holds two non-voting shares.4 At 31 March 2012 the fair value of Safaricom Limited was KES 51 billion (£386 million) based on the closing quoted share price on the Nairobi Stock Exchange.
The Group’s share of the aggregated financial information of equity accounted associates is set out below.
2012 2011 2010
£m £m £m
Share of revenue in associates 20,601 24,213 23,288Share of result in associates 4,963 5,059 4,742Share of discontinued operations in associates – 18 93
2012 2011
£m £m
Non-current assets 38,788 45,446Current assets 3,764 5,588Share of total assets 42,552 51,034
Non-current liabilities 3,990 5,719Current liabilities 2,888 6,656Non-controlling interests 566 554Share of total liabilities and non-controlling interests 7,444 12,929Share of equity shareholders’ funds in associates 35,108 38,105
15. Other investmentsNon-current other investments comprise the following, all of which are classified as available-for-sale, with the exception of public debt and bonds, and other debt and bonds, which are classified as loans and receivables, and cash held in restricted deposits:
2012 2011
£m £m
Included within non-current assets:Listed securities:
Equity securities 1 1Unlisted securities:
Equity securities 671 967Public debt and bonds 54 3Other debt and bonds 65 72Cash held in restricted deposits – 338
791 1,381
Unlisted equity securities include a 26% interest in Bharti Infotel Private Limited through which the Group has a 4.39% economic interest in Bharti Airtel Limited. Unlisted equity investments are recorded at fair value where appropriate, or at cost if their fair value cannot be reliably measured as there is no active market from which their fair values can be derived.
In the year ended 31 March 2011 the Group sold its 3.2% interest in China Mobile for £4,264 million generating a £3,019 million income statement gain, including income statement recognition of foreign exchange rate gains previously recognised in equity.
For public debt and bonds, other debt and bonds and cash held in restricted deposits, the carrying amount approximates fair value.

Business reviewPerform
anceG
overnanceFinancials
Additional information
121Vodafone Group Plc Annual Report 2012
Current other investments comprise the following, of which public debt and bonds are classified as held for trading. Other debt and bonds includes £87 million of assets held for trading (2011: £64 million):
2012 2011
£m £m
Included within current assets:Public debt and bonds 900 610Other debt and bonds 90 64Cash held in restricted deposits 333 –
1,323 674
Current public debt and bonds include Government Bonds of £900 million (2011: £610 million) which consist of index linked gilts with less than six years to maturity held on an effective floating rate basis.
For public debt and bonds, other debt and bonds and cash held in restricted deposits, the carrying amount approximates fair value.
16. Inventory2012 2011
£m £m
Goods held for resale 486 537
Inventory is reported net of allowances for obsolescence, an analysis of which is as follows:
2012 2011 2010
£m £m £m
1 April 117 120 111Exchange movements (8) (1) 5Amounts (credited)/charged to the income statement – (2) 431 March 109 117 120
Cost of sales includes amounts related to inventory amounting to £6,327 million (2011: £5,878 million; 2010: £5,268 million).
17. Trade and other receivables2012 2011
£m £m
Included within non-current assets:Trade receivables 120 92Other receivables 235 1,719Prepayments and accrued income 326 137Derivative financial instruments 2,801 1,929
3,482 3,877
Included within current assets:Trade receivables 3,885 4,185Amounts owed by associates 15 53Other receivables 2,984 1,606Prepayments and accrued income 3,702 3,299Derivative financial instruments 158 116
10,744 9,259
The Group’s trade receivables are stated after allowances for bad and doubtful debts based on management’s assessment of creditworthiness, an analysis of which is as follows:
2012 2011 2010
£m £m £m
1 April 1,006 929 874Exchange movements (64) (30) (27)Amounts charged to administrative expenses 458 460 465Trade receivables written off (386) (353) (383)31 March 1,014 1,006 929
The carrying amounts of trade and other receivables approximate their fair value. Trade and other receivables are predominantly non-interest bearing.

122Vodafone Group Plc Annual Report 2012
Notes to the consolidated financial statements (continued)
17. Trade and other receivables (continued)
2012 2011
£m £m
Included within “Derivative financial instruments”:Fair value through the income statement (held for trading):
Interest rate swaps 1,514 1,292Foreign exchange swaps 128 99
1,642 1,391Fair value hedges:
Interest rate swaps 1,317 6542,959 2,045
The fair values of these financial instruments are calculated by discounting the future cash flows to net present values using appropriate market interest and foreign currency rates prevailing at 31 March.
18. Cash and cash equivalents2012 2011
£m £m
Cash at bank and in hand 2,762 896Money market funds 3,190 5,015Repurchase agreements 600 –Other 586 341Cash and cash equivalents as presented in the statement of financial position 7,138 6,252Bank overdrafts (50) (47)Cash and cash equivalents as presented in the statement of cash flows 7,088 6,205
Bank balances and money market funds comprise cash held by the Group on a short-term basis with original maturity of three months or less. The carrying amount of cash and cash equivalents approximates their fair value.
Repurchase agreements have an original maturity of less than three months and the carrying value approximates the fair value.
19. Called up share capital2012 2011
Number £m Number £m
Ordinary shares of 113⁄ 7 US cents each allotted, issued and fully paid:1
1 April 56,811,123,429 4,082 57,809,246,732 4,153Allotted during the year 3,883,860 – 1,876,697 –Cancelled during the year (3,000,000,000) (216) (1,000,000,000) (71)31 March 53,815,007,289 3,866 56,811,123,429 4,082
Note:1 At 31 March 2012 the Group held 4,169,067,107 (2011: 5,233,597,599) treasury shares with a nominal value of £299 million (2011: £376 million). The market value of shares held was £7,179 million (2011: £9,237 million).
During the year 166,003,556 (2011: 150,404,079) treasury shares were reissued under Group share option schemes.
Allotted during the yearNominal Net
value proceeds
Number £m £m
Share awards and option scheme awards1 3,883,860 – 7
Note:1. Shares allotted during the year were in relation to US share awards and option schemes.
20. Share-based paymentsThe Company currently uses a number of equity settled share plans to grant options and shares to its directors and employees.
The maximum aggregate number of ordinary shares which may be issued in respect of share options or share plans will not (without shareholder approval) exceed:
aa 10% of the ordinary share capital of the Company in issue immediately prior to the date of grant, when aggregated with the total number of ordinary shares which have been allocated in the preceding ten year period under all plans; and
aa 5% of the ordinary share capital of the Company in issue immediately prior to the date of grant, when aggregated with the total number of ordinary shares which have been allocated in the preceding ten year period under all plans, other than any plans which are operated on an all-employee basis.
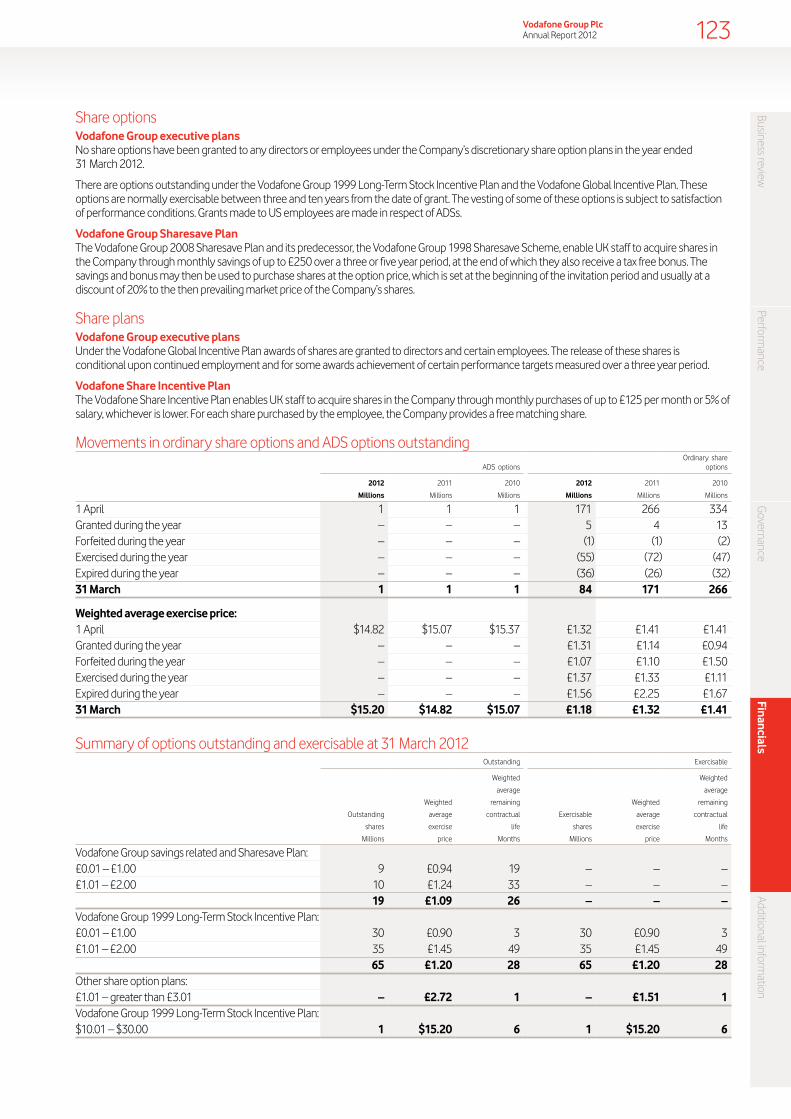
Business reviewPerform
anceG
overnanceFinancials
Additional information
123Vodafone Group Plc Annual Report 2012
Share optionsVodafone Group executive plansNo share options have been granted to any directors or employees under the Company’s discretionary share option plans in the year ended 31 March 2012.
There are options outstanding under the Vodafone Group 1999 Long-Term Stock Incentive Plan and the Vodafone Global Incentive Plan. These options are normally exercisable between three and ten years from the date of grant. The vesting of some of these options is subject to satisfaction of performance conditions. Grants made to US employees are made in respect of ADSs.
Vodafone Group Sharesave PlanThe Vodafone Group 2008 Sharesave Plan and its predecessor, the Vodafone Group 1998 Sharesave Scheme, enable UK staff to acquire shares in the Company through monthly savings of up to £250 over a three or five year period, at the end of which they also receive a tax free bonus. The savings and bonus may then be used to purchase shares at the option price, which is set at the beginning of the invitation period and usually at a discount of 20% to the then prevailing market price of the Company’s shares.
Share plansVodafone Group executive plansUnder the Vodafone Global Incentive Plan awards of shares are granted to directors and certain employees. The release of these shares is conditional upon continued employment and for some awards achievement of certain performance targets measured over a three year period.
Vodafone Share Incentive PlanThe Vodafone Share Incentive Plan enables UK staff to acquire shares in the Company through monthly purchases of up to £125 per month or 5% of salary, whichever is lower. For each share purchased by the employee, the Company provides a free matching share.
Movements in ordinary share options and ADS options outstandingADS options
Ordinary share options
2012 2011 2010 2012 2011 2010
Millions Millions Millions Millions Millions Millions
1 April 1 1 1 171 266 334Granted during the year – – – 5 4 13Forfeited during the year – – – (1) (1) (2)Exercised during the year – – – (55) (72) (47)Expired during the year – – – (36) (26) (32)31 March 1 1 1 84 171 266
Weighted average exercise price:1 April $14.82 $15.07 $15.37 £1.32 £1.41 £1.41Granted during the year – – – £1.31 £1.14 £0.94Forfeited during the year – – – £1.07 £1.10 £1.50Exercised during the year – – – £1.37 £1.33 £1.11Expired during the year – – – £1.56 £2.25 £1.6731 March $15.20 $14.82 $15.07 £1.18 £1.32 £1.41
Summary of options outstanding and exercisable at 31 March 2012Outstanding Exercisable
Weighted Weighted
average average
Weighted remaining Weighted remaining
Outstanding average contractual Exercisable average contractual
shares exercise life shares exercise life
Millions price Months Millions price Months
Vodafone Group savings related and Sharesave Plan:£0.01 – £1.00 9 £0.94 19 – – –£1.01 – £2.00 10 £1.24 33 – – –
19 £1.09 26 – – –Vodafone Group 1999 Long-Term Stock Incentive Plan:£0.01 – £1.00 30 £0.90 3 30 £0.90 3£1.01 – £2.00 35 £1.45 49 35 £1.45 49
65 £1.20 28 65 £1.20 28Other share option plans:£1.01 – greater than £3.01 – £2.72 1 – £1.51 1Vodafone Group 1999 Long-Term Stock Incentive Plan:$10.01 – $30.00 1 $15.20 6 1 $15.20 6
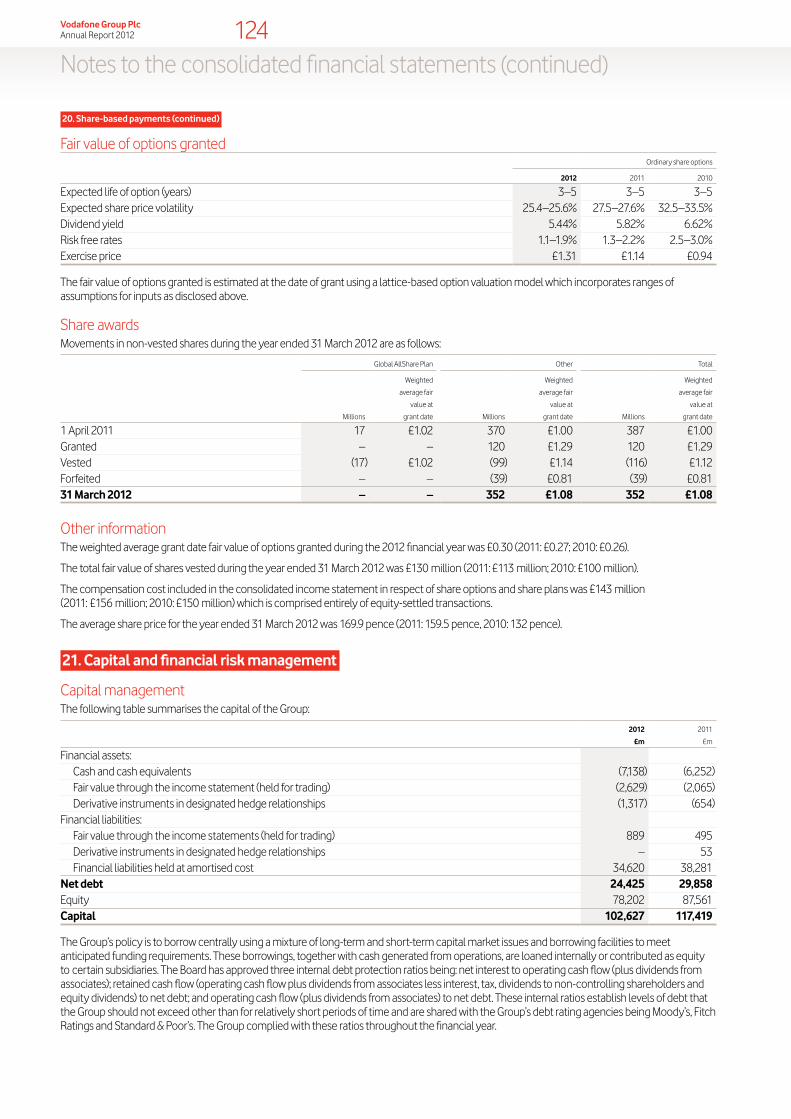
124Vodafone Group Plc Annual Report 2012
Notes to the consolidated financial statements (continued)
20. Share-based payments (continued)
Fair value of options grantedOrdinary share options
2012 2011 2010
Expected life of option (years) 3–5 3–5 3–5Expected share price volatility 25.4–25.6% 27.5–27.6% 32.5–33.5%Dividend yield 5.44% 5.82% 6.62%Risk free rates 1.1–1.9% 1.3–2.2% 2.5–3.0%Exercise price £1.31 £1.14 £0.94
The fair value of options granted is estimated at the date of grant using a lattice-based option valuation model which incorporates ranges of assumptions for inputs as disclosed above.
Share awardsMovements in non-vested shares during the year ended 31 March 2012 are as follows:
Global AllShare Plan Other Total
Weighted Weighted Weighted
average fair average fair average fair
value at value at value at
Millions grant date Millions grant date Millions grant date
1 April 2011 17 £1.02 370 £1.00 387 £1.00Granted – – 120 £1.29 120 £1.29Vested (17) £1.02 (99) £1.14 (116) £1.12Forfeited – – (39) £0.81 (39) £0.8131 March 2012 – – 352 £1.08 352 £1.08
Other informationThe weighted average grant date fair value of options granted during the 2012 financial year was £0.30 (2011: £0.27; 2010: £0.26).
The total fair value of shares vested during the year ended 31 March 2012 was £130 million (2011: £113 million; 2010: £100 million).
The compensation cost included in the consolidated income statement in respect of share options and share plans was £143 million (2011: £156 million; 2010: £150 million) which is comprised entirely of equity-settled transactions.
The average share price for the year ended 31 March 2012 was 169.9 pence (2011: 159.5 pence, 2010: 132 pence).
21. Capital and financial risk management
Capital managementThe following table summarises the capital of the Group:
2012 2011
£m £m
Financial assets: Cash and cash equivalents (7,138) (6,252)Fair value through the income statement (held for trading) (2,629) (2,065)Derivative instruments in designated hedge relationships (1,317) (654)
Financial liabilities: Fair value through the income statements (held for trading) 889 495 Derivative instruments in designated hedge relationships – 53 Financial liabilities held at amortised cost 34,620 38,281
Net debt 24,425 29,858 Equity 78,202 87,561 Capital 102,627 117,419
The Group’s policy is to borrow centrally using a mixture of long-term and short-term capital market issues and borrowing facilities to meet anticipated funding requirements. These borrowings, together with cash generated from operations, are loaned internally or contributed as equity to certain subsidiaries. The Board has approved three internal debt protection ratios being: net interest to operating cash flow (plus dividends from associates); retained cash flow (operating cash flow plus dividends from associates less interest, tax, dividends to non-controlling shareholders and equity dividends) to net debt; and operating cash flow (plus dividends from associates) to net debt. These internal ratios establish levels of debt that the Group should not exceed other than for relatively short periods of time and are shared with the Group’s debt rating agencies being Moody’s, Fitch Ratings and Standard & Poor’s. The Group complied with these ratios throughout the financial year.

Business reviewPerform
anceG
overnanceFinancials
Additional information
125Vodafone Group Plc Annual Report 2012
Financial risk managementThe Group’s treasury function provides a centralised service to the Group for funding, foreign exchange, interest rate management and counterparty risk management.
Treasury operations are conducted within a framework of policies and guidelines authorised and reviewed by the Board, most recently on 27 March 2012. A treasury policy committee comprising of the Group’s Chief Financial Officer, Group General Counsel and Company Secretary, Group Treasury Director and Director of Financial Reporting meets at least annually to review treasury activities and its members receive management information relating to treasury activities on a quarterly basis. The Group’s accounting function, which does not report to the Group Treasury Director, provides regular update reports of treasury activity to the Board. The Group’s internal auditor reviews the internal control environment regularly.
The Group uses a number of derivative instruments for currency and interest rate risk management purposes only that are transacted by specialist treasury personnel. The Group mitigates banking sector credit risk by the use of collateral support agreements.
Credit riskThe Group considers its exposure to credit risk at 31 March to be as follows:
2012 2011
£m £m
Bank deposits 2,762 896Repurchase agreements 600 –Cash held in restricted deposits 333 338Government bonds 900 610Money market fund investments 3,190 5,015Derivative financial instruments 2,959 2,045Other investments – debt and bonds 160 75Trade receivables 4,005 4,277Other receivables 3,219 3,325Other 586 341
18,714 16,922
The Group invests in UK index linked government bonds on the basis that they generate a swap return in excess of £ LIBOR and are amongst the most creditworthy of investments available.
Money market investments are in accordance with established internal treasury policies which dictate that an investment’s long-term credit rating is no lower than mid BBB. Additionally, the Group invests in AAA unsecured money market mutual funds where the investment is limited to 7.5% of each fund.
The Group has investments in repurchase agreements which are fully collateralised investments. The collateral is sovereign and supranational debt of major AAA rated EU countries denominated in euros and US dollars and can be readily converted to cash. In the event of any default, ownership of the collateral would revert to the Group. Detailed below is the value of the collateral held by the Group at 31 March 2012.
2012 2011
£m £m
Sovereign 575 –Supranational 25 –
600 –
In respect of financial instruments used by the Group’s treasury function, the aggregate credit risk the Group may have with one counterparty is limited by (i) reference to the long-term credit ratings assigned for that counterparty by Moody’s, Fitch Ratings and Standard & Poor’s, (ii) that counterparty’s five year credit default swap (‘CDS’) spread, and (iii) the sovereign credit rating of that counterparty’s principal operating jurisdiction. Furthermore, collateral support agreements were introduced from the fourth quarter of 2008. Under collateral support agreements the Group’s exposure to a counterparty with whom a collateral support agreement is in place is reduced to the extent that the counterparty must post cash collateral when there is value due to the Group under outstanding derivative contracts that exceeds a contractually agreed threshold amount. When value is due to the counterparty the Group is required to post collateral on identical terms. Such cash collateral is adjusted daily as necessary.
In the event of any default ownership of the cash collateral would revert to the respective holder at that point. Detailed below is the value of the cash collateral, which is reported within short-term borrowings, held by the Group at 31 March 2012:
2012 2011
£m £m
Cash collateral 980 531
The majority of the Group’s trade receivables are due for maturity within 90 days and largely comprise amounts receivable from consumers and business customers. At 31 March 2012 £1,806 million (2011: £2,233 million) of trade receivables were not yet due for payment. Total trade receivables consisted of £2,672 million (2011: £2,852 million) relating to the Europe region and £1,333 million (2011: £1,425 million) relating to the Africa, Middle East and Asia Pacific region. Accounts are monitored by management and provisions for bad and doubtful debts raised where it is deemed appropriate.

126Vodafone Group Plc Annual Report 2012
Notes to the consolidated financial statements (continued)
21. Capital and financial risk management (continued)
The following table presents ageing of receivables that are past due and provisions for doubtful receivables that have been established.2012 2011
Gross receivables
Less provisions
Net receivables
Gross receivables
Less provisions
Net receivables
£m £m £m £m £m £m
30 days or less 1,914 (390) 1,524 1,933 (372) 1,561 Between 31 – 60 days 192 (21) 171 140 (40) 100 Between 61 – 180 days 435 (96) 339 157 (72) 85 Greater than 180 days 598 (433) 165 778 (480) 298
3,139 (940) 2,199 3,008 (964) 2,044
Concentrations of credit risk with respect to trade receivables are limited given that the Group’s customer base is large and unrelated. Due to this management believes there is no further credit risk provision required in excess of the normal provision for bad and doubtful receivables. Amounts charged to administrative expenses during the year ended 31 March 2012 were £458 million (2011: £460 million, 2010: £465 million) (see note 17).
The Group’s investments in preferred equity and a subordinated loan received as part of the disposal of Vodafone Japan to SoftBank in the 2007 financial year were disposed of in the prior year. The Group has a receivable of £1,514 million (2011: £1,488 million) in relation to the second tranche of consideration receivable in relation to the disposal. This amount was received on 2 April 2012.
As discussed in note 29 the Group has covenanted to provide security in favour of the Trustee of the Vodafone Group UK Pension Scheme in respect of the funding deficit in the scheme. The security takes the form of an English law pledge over UK index linked government bonds.
Liquidity riskAt 31 March 2012 the Group had €4.2 billion and US$4.2 billion syndicated committed undrawn bank facilities and US$15 billion and £5 billion commercial paper programmes, supported by the €4.2 billion and US$4.2 billion syndicated committed bank facilities, available to manage its liquidity. The Group uses commercial paper and bank facilities to manage short-term liquidity and manages long-term liquidity by raising funds in the capital markets.
€4.2 billion of the syndicated committed facility has a maturity date of 1 July 2015. US$4.2 billion has a maturity of 9 March 2016; during the year US$4.1 billion of this facility was extended by one year, now maturing 9 March 2017. Both facilities have remained undrawn throughout the financial year and since year end and provide liquidity support.
The Group manages liquidity risk on long-term borrowings by maintaining a varied maturity profile with a cap on the level of debt maturing in any one calendar year, therefore minimising refinancing risk. Long-term borrowings mature between one and 25 years.
Liquidity is reviewed daily on at least a 12 month rolling basis and stress tested on the assumption that all commercial paper outstanding matures and is not reissued. The Group maintains substantial cash and cash equivalents which at 31 March 2012 amounted to £7,138 million (2011: £6,252 million).
Market riskInterest rate managementUnder the Group’s interest rate management policy, interest rates on monetary assets and liabilities denominated in euros, US dollars and sterling are maintained on a floating rate basis except for periods up to six years where interest rate fixing has to be undertaken in accordance with treasury policy. Where assets and liabilities are denominated in other currencies interest rates may also be fixed. In addition, fixing is undertaken for longer periods when interest rates are statistically low.
For each one hundred basis point fall or rise in market interest rates for all currencies in which the Group had borrowings at 31 March 2012 there would be a reduction or increase in profit before tax by approximately £33 million (2011: increase or reduce by £30 million) including mark-to-market revaluations of interest rate and other derivatives and the potential interest on outstanding tax issues. There would be no material impact on equity.

Business reviewPerform
anceG
overnanceFinancials
Additional information
127Vodafone Group Plc Annual Report 2012
Foreign exchange managementAs Vodafone’s primary listing is on the London Stock Exchange its share price is quoted in sterling. Since the sterling share price represents the value of its future multi-currency cash flows, principally in euro, US dollars, South African rand, Indian rupee and sterling, the Group maintains the currency of debt and interest charges in proportion to its expected future principal multi-currency cash flows and has a policy to hedge external foreign exchange risks on transactions denominated in other currencies above certain de minimis levels. As the Group’s future cash flows are increasingly likely to be derived from emerging markets it is likely that more debt in emerging market currencies will be drawn.
As such, at 31 March 2012 140% of net debt was denominated in currencies other than sterling (54% euro, 54% US dollar and 32% other) while 40% of net debt had been purchased forward in sterling in anticipation of sterling denominated shareholder returns via dividends and share buybacks. This allows euro, US dollar and other debt to be serviced in proportion to expected future cash flows and therefore provides a partial hedge against income statement translation exposure, as interest costs will be denominated in foreign currencies. Yen debt is used as a hedge against the value of yen assets as the Group has minimal yen cash flows.
Under the Group’s foreign exchange management policy foreign exchange transaction exposure in Group companies is generally maintained at the lower of €5 million per currency per month or €15 million per currency over a six month period.
The Group recognises foreign exchange movements in equity for the translation of net investment hedging instruments and balances treated as investments in foreign operations. However, there is no net impact on equity for exchange rate movements as there would be an offset in the currency translation of the foreign operation.
The following table details the Group’s sensitivity of the Group’s operating profit to a strengthening of the Group’s major currencies in which it transacts. The percentage movement applied to each currency is based on the average movements in the previous three annual reporting periods. Amounts are calculated by retranslating the operating profit of each entity whose functional currency is either euro or US dollar.
2012
£m
Euro 3% change – Operating profit1 140US dollar 4% change – Operating profit1 195
Note:1 Operating profit before impairment losses and other income and expense
At 31 March 2011 sensitivity of the Group’s operating profit was analysed for a strengthening of the euro by 4% and the US dollar by 13%, which represented movements of £230 million and £594 million respectively.
Equity riskThe Group has equity investments, primarily in Bharti Infotel Private Limited, which is subject to equity risk. See note 15 to the consolidated financial statements for further details on the carrying value of this investment.
Fair value of financial instrumentsThe table below sets out the valuation basis of financial instruments held at fair value by the Group at 31 March 2012.
Level 11 Level 22 Total
2012 2011 2012 2011 2012 2011
£m £m £m £m £m £m
Financial assets:Fair value through the income statement (held for trading) – – 949 674 949 674Derivative financial instruments:
Interest rate swaps – – 2,831 1,946 2,831 1,946Foreign exchange contracts – – 128 99 128 99Interest rate futures – – 38 31 38 31
– – 3,946 2,750 3,946 2,750Financial investments available-for-sale:
Listed equity securities3 1 1 – – 1 1 Unlisted equity securities3 – – 591 703 591 703
1 1 591 703 592 704 1 1 4,537 3,453 4,538 3,454
Financial liabilities:Derivative financial instruments:
Interest rate swaps – – 800 395 800 395Foreign exchange contracts – – 89 153 89 153
– – 889 548 889 548
Notes:1 Level 1 classification comprises financial instruments where fair value is determined by unadjusted quoted prices in active markets for identical assets or liabilities.2 Level 2 classification comprises where fair value is determined from inputs other than quoted prices that are observable for the asset or liability, either directly or indirectly. Fair values for unlisted equity securities are derived
from observable quoted market prices for similar items. Derivative financial instrument fair values are present values determined from future cash flows discounted at rates derived from market sourced data.3 Details of listed and unlisted equity securities are included in note 15 “Other Investments”.

128Vodafone Group Plc Annual Report 2012
Notes to the consolidated financial statements (continued)
22. Borrowings
Carrying value and fair value information2012 2011
Short-term Long-term Short-term Long-term
borrowings borrowings Total borrowings borrowings Total
£m £m £m £m £m £m
Financial liabilities measured at amortised cost:Bank loans 1,635 5,624 7,259 2,070 5,872 7,942Bank overdrafts 50 – 50 47 – 47Redeemable preference shares – 1,281 1,281 – 1,169 1,169Commercial paper 2,272 – 2,272 1,660 – 1,660Bonds 1,289 14,463 15,752 2,470 16,046 18,516Other liabilities1 2 1,012 2,417 3,429 3,659 1,023 4,682
Bonds in fair value hedge relationships – 4,577 4,577 – 4,265 4,2656,258 28,362 34,620 9,906 28,375 38,281
Notes: 1 At 31 March 2012 amount includes £980 million (2011: £531 million) in relation to collateral support agreements.2 Amounts at 31 March 2012 includes £840 million (2011: £3,190 million) in relation to the options disclosed in note 12.
Bank loans include INR 273 billion of loans held by Vodafone India Limited (‘VIL’) and its subsidiaries (the ‘VIL Group’). The VIL Group has a number of security arrangements supporting certain licences secured under the terms of tri-party agreements between the relevant borrower, the department of telecommunications, Government of India and the agent representing the secured lenders and certain share pledges of the shares under VIL. The terms and conditions of the security arrangements mean that should members of the VIL Group not meet all of their loan payment and performance obligations, the lenders may sell the pledged shares and enforce rights over the certain licences under the terms of the tri-party agreements to recover their losses, with any remaining sales proceeds being returned to the VIL Group. Each of the eight legal entities within the VIL Group provide cross guarantees to the lenders in respect to debt contracted by the other seven.
The fair value and carrying value of the Group’s short-term borrowings is as follows:
Sterling equivalent
nominal value Fair value Carrying value
2012 2011 2012 2011 2012 2011
£m £m £m £m £m £m
Financial liabilities measured at amortised cost 4,915 7,316 4,977 7,425 4,969 7,436
Bonds: 1,267 2,444 1,288 2,463 1,289 2,470
1.15% US dollar 100 million bond due August 2012 63 – 63 – 63 –3.625% euro 1,250 million bond due November 2012 1,032 – 1,051 – 1,050 –6.75% Australian dollar 265 million bond due January 2013 172 – 174 – 176 –US dollar floating rate note due June 2011 – 171 – 171 – 1715.5% US dollar 750 million bond due June 2011 – 467 – 471 – 4781% US dollar 100 million bond due August 2011 – 45 – 45 – 45Euro floating rate note due January 2012 – 1,144 – 1,146 – 1,148US dollar floating rate note due February 2012 – 306 – 306 – 3065.35% US dollar 500 million bond due February 2012 – 311 – 324 – 322
Short-term borrowings 6,182 9,760 6,265 9,888 6,258 9,906

Business reviewPerform
anceG
overnanceFinancials
Additional information
129Vodafone Group Plc Annual Report 2012
The fair value and carrying value of the Group’s long-term borrowings is as follows:
Sterling equivalent
nominal value Fair value Carrying value
2012 2011 2012 2011 2012 2011
£m £m £m £m £m £m
Financial liabilities measured at amortised cost:Bank loans 5,336 5,728 5,625 5,872 5,624 5,873Redeemable preference shares 1,032 1,027 1,199 1,054 1,281 1,169Other liabilities 2,325 1,022 2,472 1,023 2,417 1,022Bonds: 13,184 14,581 14,746 15,578 14,463 16,0463.625% euro 1,250 million bond due November 2012 – 1,104 – 1,125 – 1,1326.75% Australian dollar 265 million bond due January 2013 – 171 – 173 – 176Czech kurona floating rate note due June 2013 18 19 18 19 18 19Euro floating rate note due September 2013 638 751 641 752 638 7525.0% US dollar 1,000 million bond due December 2013 625 623 669 676 657 6676.875% euro 1,000 million bond due December 2013 763 883 834 970 786 922Euro floating rate note due June 2014 938 1,104 939 1,099 938 1,1054.15% US dollar 1,250 million bond due June 2014 755 778 808 826 773 8024.625% sterling 350 million bond due September 2014 304 350 325 367 326 3824.625% sterling 525 million bond due September 2014 525 525 562 551 541 5445.125% euro 500 million bond due April 2015 417 442 463 475 442 4705.0% US dollar 750 million bond due September 2015 469 467 528 506 505 5123.375% US dollar 500 million bond due November 2015 313 311 335 317 314 3126.25% euro 1,250 million bond due January 2016 938 1,104 1,094 1,230 953 1,1392.875% US dollar 600 million bond due March 2016 375 374 393 371 374 3715.75% US dollar 750 million bond due March 2016 469 467 543 523 522 5324.75% euro 500 million bond due June 2016 417 442 469 463 455 4875.625% US dollar 1,300 million bond due February 2017 813 809 954 897 908 9201.625% US dollar 1,000 million bond due March 2017 625 – 624 – 621 –5.375% sterling 600 million bond due December 2017 552 600 632 638 573 6295% euro 750 million bond due June 2018 625 663 726 697 650 6898.125% sterling 450 million bond due November 2018 450 450 589 550 485 4884.375% US dollar 500 million bond due March 2021 313 311 348 307 310 3097.875% US dollar 750 million bond due February 2030 469 467 648 591 751 7596.25% US dollar 495 million bond due November 2032 310 308 377 332 424 4256.15% US dollar 1,700 million bond due February 2037 1,063 1,058 1,227 1,123 1,499 1,503
Bonds in fair value hedge relationships: 3,882 3,962 4,541 4,199 4,577 4,2652.15% Japanese yen 3,000 million bond due April 2015 23 23 24 24 23 235.375% US dollar 900 million bond due January 2015 563 560 628 616 621 6214.625% US dollar 500 million bond due July 2018 313 311 354 327 367 3385.45% US dollar 1,250 million bond due June 2019 782 778 920 850 898 8234.65% euro 1,250 million bond January 2022 1,042 1,104 1,203 1,115 1,172 1,1145.375% euro 500 million bond June 2022 417 442 501 470 532 5055.625% sterling 250 million bond due December 2025 250 250 294 258 324 2846.6324% euro 50 million bond due December 2028 42 44 86 68 67 575.9% sterling 450 million bond due November 2032 450 450 531 471 573 500
Long-term borrowings 25,759 26,320 28,583 27,726 28,362 28,375
Fair values are calculated using quoted market prices or discounted cash flows with a discount rate based upon forward interest rates available to the Group at the reporting date.

130Vodafone Group Plc Annual Report 2012
Notes to the consolidated financial statements (continued)
Maturity of borrowingsThe maturity profile of the anticipated future cash flows including interest in relation to the Group’s non-derivative financial liabilities on an undiscounted basis, which, therefore, differs from both the carrying value and fair value, is as follows:
Redeemable Loans in fair
Bank preference Commercial Other value hedge
loans shares paper Bonds liabilities relationships Total
£m £m £m £m £m £m £m
Within one year 684 56 2,283 2,000 1,044 199 6,266 In one to two years 2,983 56 – 2,828 771 199 6,837 In two to three years 567 56 – 3,197 – 762 4,582 In three to four years 1,316 56 – 3,536 1,235 191 6,334 In four to five years 1,574 56 – 1,541 726 169 4,066 In more than five years 1,466 1,214 – 6,780 69 4,465 13,994
8,590 1,494 2,283 19,882 3,845 5,985 42,079 Effect of discount/financing rates (1,331) (213) (11) (4,130) (366) (1,408) (7,459)31 March 2012 7,259 1,281 2,272 15,752 3,479 4,577 34,620
Within one year 947 52 1,670 3,292 3,766 203 9,930 In one to two years 1,914 52 – 2,009 191 203 4,369 In two to three years 2,748 52 – 2,919 60 203 5,982 In three to four years 529 52 – 3,251 60 763 4,655 In four to five years 987 52 – 3,613 901 195 5,748 In more than five years 2,197 1,240 – 7,725 – 4,752 15,914
9,322 1,500 1,670 22,809 4,978 6,319 46,598 Effect of discount/financing rates (1,380) (331) (10) (4,293) (249) (2,054) (8,317)31 March 2011 7,942 1,169 1,660 18,516 4,729 4,265 38,281
The maturity profile of the Group’s financial derivatives (which include interest rate and foreign exchange swaps), using undiscounted cash flows, is as follows:
2012 2011
Payable Receivable Payable Receivable
£m £m £m £m
Within one year 14,357 14,498 14,840 15,051In one to two years 675 786 631 829In two to three years 561 678 724 882In three to four years 540 641 667 770In four to five years 402 520 619 690In more than five years 2,533 3,566 3,715 4,592
19,068 20,689 21,196 22,814
The currency split of the Group’s foreign exchange derivatives, all of which mature in less than one year, is as follows:
2012 2011
Payable Receivable Payable Receivable
£m £m £m £m
Sterling 1,287 7,070 – 10,198Euro 4,793 2,613 11,422 2,832US dollar 4,415 2,445 13 387Japanese yen 2,207 23 2,164 23Other 962 1,552 727 832
13,664 13,703 14,326 14,272
Payables and receivables are stated separately in the table above as settlement is on a gross basis. The £39 million net receivable (2011: £54 million net payable) in relation to foreign exchange financial instruments in the table above is split £89 million (2011: £153 million) within trade and other payables and £128 million (2011: £99 million) within trade and other receivables.
The present value of minimum lease payments under finance lease arrangements under which the Group has leased certain of its equipment is analysed as follows:
2012 2011
£m £m
Within one year 18 14In two to five years 34 45In more than five years 34 6
22. Borrowings (continued)

Business reviewPerform
anceG
overnanceFinancials
Additional information
131Vodafone Group Plc Annual Report 2012
Interest rate and currency of borrowingsTotal Floating rate Fixed rate Other
borrowings borrowings borrowings1 borrowings2
Currency £m £m £m £m
Sterling 2,838 912 1,926 – Euro 10,696 4,408 6,288 – US dollar 14,085 4,521 9,495 69 Japanese yen 23 23 – – Other 6,978 3,489 2,718 771 31 March 2012 34,620 13,353 20,427 840
Sterling 2,831 906 1,925 –Euro 12,361 4,198 8,163 –US dollar 16,030 9,488 3,352 3,190Japanese yen 807 807 – –Other 6,252 2,920 3,332 –31 March 2011 38,281 18,319 16,772 3,190
Notes:1 The weighted average interest rate for the Group’s sterling denominated fixed rate borrowings is 5.7% (2011: 5.7%). The weighted average time for which these rates are fixed is 4.5 years (2011: 5.4 years). The weighted average
interest rate for the Group’s euro denominated fixed rate borrowings is 4.2% (2011: 4.3%). The weighted average time for which the rates are fixed is 2.8 years (2011: 3.8 years). The weighted average interest rate for the Group’s US dollar denominated fixed rate borrowings is 5.1% (2011: 5.4%). The weighted average time for which the rates are fixed is 10.0 years (2011: 9.7 years). The weighted average interest rate for the Group’s other currency fixed rate borrowings is 10.1% (2011: 9.2%). The weighted average time for which the rates are fixed is 2.7 years (2011: 2.0 years).
2 Other borrowings of £840 million (2011: £3,190 million) are the liabilities arising under options over direct and indirect interests in Vodafone India.
The figures shown in the tables above take into account interest rate swaps used to manage the interest rate profile of financial liabilities. Interest on floating rate borrowings is generally based on national LIBOR equivalents or government bond rates in the relevant currencies.
At 31 March 2012 the Group had entered into foreign exchange contracts to decrease its sterling and other currency borrowings above by £5,783 million and £590 million respectively, and to increase its euro, US dollar and Japanese yen currency borrowings above by amounts equal to £2,180 million, £1,970 million and £2,184 million respectively.
At 31 March 2011 the Group had entered into foreign exchange contracts to decrease its sterling, US dollar and other currency borrowings above by £10,198 million and amounts equal to £374 million and £105 million respectively, and to increase its euro and Japanese yen currency borrowings above by amounts equal to £8,590 million and £2,141 million respectively.
Further protection from euro and US dollar interest rate movements is provided by interest rate swaps. At 31 March 2012 the Group had euro denominated interest rate swaps covering the period from June 2012 to June 2016 for an amount equal to £685 million. US dollar denominated interest swaps provide cover for the periods March 2012 to June 2012, June 2012 to September 2015, September 2015 to March 2016 and March 2016 to June 2016 for amounts equal to £653 million, £1,894 million, £1,241 million and £914 million respectively. Additionally US dollar denominated interest rate swaps reduce the level of fixed rate debt during the periods June 2016 to December 2019 by an amount equal to £327 million and sterling interest rate swaps reduce the level of fixed debt during the periods December 2016 to December 2017 and December 2017 to December 2018 by amounts of £1,050 million and £450 million respectively.
At 31 March 2011 further protection from euro and US dollar interest rate movements was provided by interest rate swaps. The Group had euro denominated interest rate swaps covering periods June 2015 to December 2015 equal to £833 million. US dollar denominated interest swaps cover the period March 2011 to December 2011 and December 2011 to December 2015 for amounts equal to £1,282 million and £641 million respectively.
The Group has entered into euro and US dollar denominated interest rate futures. The euro denominated interest rate futures provide cover for the periods March 2012 to June 2012, June 2012 to September 2012, September 2012 to December 2012, December 2012 to March 2013, March 2013 to June 2013, June 2013 to September 2013, September 2013 to December 2013, December 2013 to March 2014, June 2014 to December 2014, December 2014 to March 2015, March 2015 to June 2015, June 2015 to September 2015, September 2015 to December 2015, December 2015 to March 2016, March 2016 to June 2016, June 2016 to September 2016 and September 2016 to December 2016 for amounts equal to £7,435 million, £422 million, £976 million, £1,806 million, £1,640 million, £1,391 million, £2,076 million, £2,326 million, £3,738 million, £831 million, £2,396 million, £3,472 million, £2,650 million, £1,819 million, £154 million, £3,196 million and £328 million respectively. The US dollar denominated interest rate futures cover the periods March 2014 to June 2014, December 2015 to March 2016, March 2016 to June 2016, June 2016 to September 2016, September 2016 to December 2016 and December 2016 to March 2017 for amounts equal to £653 million, £3,060 million, £2,505 million, £2,351 million, £1,988 million and £1,976 million respectively.
At 31 March 2011 the Group had entered into euro and US dollar denominated interest rate futures. The euro denominated interest rate futures covered the periods September 2011 to December 2011, December 2011 to March 2012, March 2012 to June 2012 and June 2012 to September 2012 for amounts equal to £2,083 million, £833 million, £7,185 million and £6,811 million respectively. Additional cover was provided for the period March 2013 to March 2014 and March 2015 to March 2016 for average amounts for each period equal to £2,006 million and £2,331 million respectively. The US dollar denominated interest rate futures covered the periods June 2011 to September 2011, June 2013 to September 2013 and September 2013 to December 2013 for amounts equal to £3,601 million, £1,923 million and £833 million respectively.
The Group has entered into interest rate swaps to alter the level of protection against interest rate movements during future periods. US dollar interest rate futures reduce the level of fixed debt during the periods March 2012 to June 2012, June 2012 to September 2012, September 2012 to December 2012, December 2012 to September 2013, September 2013 to December 2013, June 2015 to September 2015 and September 2015 to December 2015 for amounts equal to £1,894 million, £1,306 million, £9,494 million, £3,919 million, £3,070 million, £4,385 million and £2,133 million respectively. Additionally sterling interest rate futures reduced fixed debt in the periods March 2012 to June 2012 and December 2013 to March 2014 by amounts of £7,289 million and £667 million respectively.

132Vodafone Group Plc Annual Report 2012
Notes to the consolidated financial statements (continued)
At 31 March 2011 the Group had entered into interest rate swaps to alter the level of protection against interest rate movements during future periods. During the period June 2016 to December 2016 euro denominated interest rate swaps reduced the level of fixed rate debt in the Group by an amount equal to £833 million. US dollar denominated swaps reduced the level of fixed rate debt during the period March 2016 to March 2019 for an amount equal to £321 million. US dollar denominated interest rate futures reduced the level of fixed rate debt during the periods September 2012 to December 2012 and December 2013 to March 2014 for amounts equal to £4,487 million and £1,282 million respectively.
Borrowing facilitiesAt 31 March 2012 the Group’s most significant committed borrowing facilities comprised two bank facilities which remained undrawn throughout the period of €4,230 million (£3,527 million) and US$4,245 million (£2,654 million) both expiring between three and five years (2011: two bank facilities of €4,150 million (£3,666 million) and US$4,170 million (£2,596 million)), a US$515 million (£322 million) bank facility which expires in more than five years (2011: US$650 million (£405 million)), two loan facilities of €400 million (£334 million) and €350 million (£292 million) both expiring between two and five years (2011: two loan facilities of €400 million (£353 million) and €350 million (£309 million) and a loan facility of €410 million (£342 million) which expires in more than five years ( 2011: €410 million (£362 million)), The €400 million and €350 million loan facilities were fully drawn on 14 February 2007 and 12 August 2008 respectively and the €410 million facility was drawn on 30 July 2010. During the year two new facilities were negotiated for €400 million (£334 million) and €300 million (£250 million) which remain undrawn and expire in more than 5 years.
Under the terms and conditions of the €4,230 million and US$4,245 million bank facilities, lenders have the right, but not the obligation, to cancel their commitment 30 days from the date of notification of a change of control of the Company and have outstanding advances repaid on the last day of the current interest period.
The facility agreements provide for certain structural changes that do not affect the obligations of the Company to be specifically excluded from the definition of a change of control. This is in addition to the rights of lenders to cancel their commitment if the Company has committed an event of default.
The terms and conditions of the drawn facilities in the Group’s Turkish and Italian operating companies of €400 million and €350 million respectively and the Group’s German, Italian and Romanian fixed line operations of €410 million, €400 million and €300 million respectively, are similar to those of the US dollar bank facilities. In addition should the Group’s Turkish operating company spend less than the equivalent of US$800 million on capital expenditure the Group will be required to repay the drawn amount of the facility that exceeds 50% of the capital expenditure and should the Group’s Italian operating company spend less than the equivalent of €1,500 million on capital expenditure, the Group will be required to repay the drawn amount of the facility that exceeds 18% of the capital expenditure. Similarly should the Group’s German, Italian or Romanian fixed line operations spend less that the equivalent of €824 million, €1,252 million and €1,246 million on capital expenditure respectively, the Group will be required to repay the drawn amount of the facility that exceeds 50% of the capital expenditure.
In addition to the above, certain of the Group’s subsidiaries had committed facilities at 31 March 2012 of £7,842 million (2011: £7,152 million) in aggregate, of which £1,100 million (2011: £667 million) was undrawn. Of the total committed facilities £2,353 million (2011: £2,137 million) expires in less than one year, £4,078 million (2011: £3,719 million) expires between two and five years, and £1,411 million (2011: £1,296 million) expires in more than five years.
Redeemable preference sharesRedeemable preference shares comprise class D and E preferred shares issued by Vodafone Americas, Inc. An annual dividend of US$51.43 per class D and E preferred share is payable quarterly in arrears. The dividend for the year amounted to £56 million (2011: £58 million). The aggregate redemption value of the class D and E preferred shares is US$1.65 billion. The holders of the preferred shares are entitled to vote on the election of directors and upon each other matter coming before any meeting of the shareholders on which the holders of ordinary shares are entitled to vote. Holders are entitled to vote on the basis of twelve votes for each share of class D or E preferred stock held. The maturity date of the 825,000 class D preferred shares is 6 April 2020. The 825,000 class E preferred shares have a maturity date of 1 April 2020. The class D and E preferred shares have a redemption price of US$1,000 per share plus all accrued and unpaid dividends.
22. Borrowings (continued)

Business reviewPerform
anceG
overnanceFinancials
Additional information
133Vodafone Group Plc Annual Report 2012
23. Post employment benefits
BackgroundAt 31 March 2012 the Group operated a number of pension plans for the benefit of its employees throughout the world, which vary depending on the conditions and practices in the countries concerned. The Group’s pension plans are provided through both defined benefit and defined contribution arrangements. Defined benefit schemes provide benefits based on the employees’ length of pensionable service and their final pensionable salary or other criteria. Defined contribution schemes offer employees individual funds that are converted into benefits at the time of retirement.
The Group operates defined benefit schemes in Germany, Ghana, Ireland, Italy, India, the United Kingdom and the United States. Defined contribution pension schemes are currently provided in Australia, Egypt, Greece, Hungary, Ireland, Italy, Kenya, Malta, the Netherlands, New Zealand, Portugal, South Africa, Spain, the United Kingdom and the United States. The Group’s principal defined benefit pension scheme in the United Kingdom was closed to new entrants from 1 January 2006 and closed to future accrual for existing members on 31 March 2010.
Income statement expense2012 2011 2010
£m £m £m
Defined contribution schemes 145 130 110Defined benefit schemes (2) 4 50Total amount charged to the income statement (note 32) 143 134 160
Defined benefit schemesThe principal actuarial assumptions used for estimating the Group’s benefit obligations are set out below:
20121 20111 20101
% % %
Weighted average actuarial assumptions used at 31 March:Rate of inflation 3.0 3.1 3.5Rate of increase in salaries 2.9 2.9 4.6Rate of increase in pensions in payment and deferred pensions 3.0 3.1 3.5Discount rate 4.7 5.6 5.7Expected rates of return:Equities 7.4 8.2 8.5Bonds2 4.2 5.1 5.1
Notes:1 Figures shown represent a weighted average assumption of the individual schemes.2 For the year ended 31 March 2012 the expected rate of return for bonds consisted of a 4.6% rate of return for corporate bonds (2011: 5.3%; 2010: 5.5%) and a 2.6% rate of return for government bonds (2011: 3.6%; 2010: 4.0%).
The expected return on assets assumptions are derived by considering the expected long-term rates of return on plan investments. The overall rate of return is a weighted average of the expected returns of the individual investments made in the Group plans. The long-term rates of return on equities are derived from considering current risk free rates of return with the addition of an appropriate future risk premium from an analysis of historic returns in various countries. The long-term rates of return on bonds are set in line with market yields currently available at the statement of financial position date.
Mortality assumptions used are consistent with those recommended by the individual scheme actuaries and reflect the latest available tables, adjusted for the experience of the Group where appropriate. The largest scheme in the Group is the UK scheme and the tables used for this scheme indicate a further life expectancy for a male/female pensioner currently aged 65 of 23.6/24.4 years (2011: 23.5/24.3 years, 2010: 22.3/25.4 years) and a further life expectancy from age 65 for a male/female non-pensioner member currently aged 40 of 27.2/26.7 years (2011: 27.0/26.6 years, 2010: 24.6/27.9 years).
Measurement of the Group’s defined benefit retirement obligations are particularly sensitive to changes in certain key assumptions including the discount rate. An increase or decrease in the discount rate of 0.5% would result in a £203 million increase or a £230 million decrease in the defined benefit obligation respectively.
Charges made to the consolidated income statement and consolidated statement of comprehensive income (‘SOCI’) on the basis of the assumptions stated above are:
2012 2011 2010
£m £m £m
Current service cost 11 12 29Interest cost 85 95 77Expected return on pension assets (99) (103) (76)Curtailment/settlement 1 – 20Total included within staff costs (2) 4 50
Actuarial losses/(gains) recognised in the SOCI 365 (190) 149Cumulative actuarial losses recognised in the SOCI 671 306 496

134Vodafone Group Plc Annual Report 2012
Notes to the consolidated financial statements (continued)
Fair value of the assets and present value of the liabilities of the schemesThe amount included in the statement of financial position arising from the Group’s obligations in respect of its defined benefit schemes is as follows:
2012 2011 2010
£m £m £m
Movement in pension assets:1 April 1,558 1,487 1,100Exchange rate movements (22) (2) (10)Expected return on pension assets 99 103 76Actuarial (losses)/gains (30) (6) 286Employer cash contributions 34 24 133Member cash contributions 6 5 12Benefits paid (42) (51) (45)Other movements 1 (2) (65)31 March 1,604 1,558 1,487
Movement in pension liabilities:1 April 1,548 1,690 1,332Exchange rate movements (33) (4) (15)Current service cost 11 12 29Interest cost 85 95 77Member cash contributions 6 5 12Actuarial losses/(gains) 335 (196) 435Benefits paid (42) (51) (79)Other movements – (3) (101)31 March 1,910 1,548 1,690
An analysis of net (deficit)/assets is provided below for the Group’s principal defined benefit pension scheme in the UK and for the Group as a whole.
UK Group
2012 2011 2010 2009 2008 2012 2011 2010 2009 2008
£m £m £m £m £m £m £m £m £m £m
Analysis of net (deficit)/assets:Total fair value of scheme assets 1,218 1,180 1,131 755 934 1,604 1,558 1,487 1,100 1,271Present value of funded scheme liabilities (1,444) (1,127) (1,276) (815) (902) (1,852) (1,488) (1,625) (1,196) (1,217)Net (deficit)/assets for funded schemes (226) 53 (145) (60) 32 (248) 70 (138) (96) 54Present value of unfunded scheme liabilities – – – (8) – (58) (60) (65) (136) (93)Net (deficit)/assets (226) 53 (145) (68) 32 (306) 10 (203) (232) (39)Net (deficit)/assets are analysed as:Assets – 53 – – 32 31 97 34 8 65Liabilities (226) – (145) (68) – (337) (87) (237) (240) (104)
It is expected that contributions of £34 million will be paid into the Group’s defined benefit retirement schemes during the year ending 31 March 2013. The assets of the schemes are held in external trustee administered funds.
Actual return on pension assets2012 2011 2010
£m £m £m
Actual return on pension assets 69 97 362
Analysis of pension assets at 31 March is as follows: % % %Equities 60.1 61.6 59.6Bonds 37.1 36.5 37.5Property 0.3 0.3 0.3Other 2.5 1.6 2.6
100.0 100.0 100.0
The schemes have no direct investments in the Group’s equity securities or in property currently used by the Group.
23. Post employment benefits (continued)

Business reviewPerform
anceG
overnanceFinancials
Additional information
135Vodafone Group Plc Annual Report 2012
History of experience adjustments2012 2011 2010 2009 2008
£m £m £m £m £m
Experience adjustments on pension liabilities:Amount (21) 23 8 6 (5)Percentage of pension liabilities (1%) 1% – – –
Experience adjustments on pension assets:Amount (30) (6) 286 (381) (176)Percentage of pension assets (2%) – 19% (35%) (14%)
24. ProvisionsAsset
retirement Legal and
obligations regulatory Other Total
£m £m £m £m
1 April 2010 370 184 440 994Exchange movements (4) (1) (11) (16)Amounts capitalised in the year 4 – – 4Amounts charged to the income statement – 88 212 300Utilised in the year − payments (8) (12) (181) (201)Amounts released to the income statement – (30) (29) (59)Other (47) 41 25 1931 March 2011 315 270 456 1,041 Exchange movements (19) (12) (26) (57)Amounts capitalised in the year 37 – – 37 Amounts charged to the income statement – 50 209 259 Utilised in the year − payments (4) (25) (164) (193)Amounts released to the income statement – (6) (47) (53)Other (10) 33 55 78 31 March 2012 319 310 483 1,112
Provisions have been analysed between current and non-current as follows:
31 March 2012Asset
retirement Legal and
obligations regulatory Other Total
£m £m £m £m
Current liabilities 15 225 393 633Non-current liabilities 304 85 90 479
319 310 483 1,112
31 March 2011Asset
retirement Legal and
obligations regulatory Other Total
£m £m £m £m
Current liabilities 7 215 337 559Non-current liabilities 308 55 119 482
315 270 456 1,041
Asset retirement obligationsIn the course of the Group’s activities a number of sites and other assets are utilised which are expected to have costs associated with exiting and ceasing their use. The associated cash outflows are substantially expected to occur at the dates of exit of the assets to which they relate, which are long-term in nature, primarily in periods up to twenty five years from when the asset is brought into use.
Legal and regulatoryThe Group is involved in a number of legal and other disputes, including notifications of possible claims. The directors of the Company, after taking legal advice, have established provisions after taking into account the facts of each case. The timing of cash outflows associated with the majority of legal claims are typically less than one year, however, for some legal claims the timing of cash flows may be long term in nature. For a discussion of certain legal issues potentially affecting the Group refer to note 29.
Other provisionsOther provisions comprises various provisions including restructuring costs and property, none of which are individually material. The associated cash outflows for restructuring costs are primarily less than one year. The timing of the cash flows associated with property is dependent upon the remaining term of the associated lease.

136Vodafone Group Plc Annual Report 2012
Notes to the consolidated financial statements (continued)
25. Trade and other payables2012 2011
£m £m
Included within non-current liabilities:Other payables 193 80Accruals and deferred income 357 329Derivative financial instruments 774 395
1,324 804
Included within current liabilities:Trade payables 4,526 4,453Amounts owed to associates 18 23Other taxes and social security payable 1,075 1,140Other payables 541 520Accruals and deferred income 8,961 8,409Derivative financial instruments 115 153
15,236 14,698
The carrying amounts of trade and other payables approximate their fair value. The fair values of the derivative financial instruments are calculated by discounting the future cash flows to net present values using appropriate market interest and foreign currency rates prevailing at 31 March.
2012 2011
£m £m
Included within “Derivative financial instruments”:Fair value through the income statement (held for trading):
Interest rate swaps 800 342Foreign exchange swaps 89 153
889 495Fair value hedges:
Interest rate swaps – 53889 548
26. Disposals
France – Société Française du Radiotéléphone S.A. (‘SFR’)On 16 June 2011 the Group sold its entire 44% shareholding in SFR to Vivendi for a cash consideration of €7,750 million (£6,805 million) before tax and transaction costs and also received a final dividend of €200 million (£178 million) on completion of the transaction. The Group recognised a net gain on disposal of £3,419 million, reported in other income and expense.
SFR
£m
Net assets disposed (3,953)Total cash consideration 6,805 Other effects1 567 Net gain on disposal2 3,419
Notes:1 Other effects include foreign exchange gains and losses transferred to the income statement and professional fees related to the disposal.2 Reported in other income and expense in the consolidated income statement.
Poland – Polkomtel S.A.On 9 November 2011 the Group sold its entire 24.4% interest in Polkomtel S.A. to Spartan Capital Holdings SP. z o.o for a cash consideration of €918 million (£784 million) before tax and transaction costs. The Group recognised a net gain on disposal of £296 million, reported in other income and expense.
Polkomtel
£m
Net assets disposed (579)Total cash consideration 784Other effects1 91Net gain on disposal2 296
Notes:1 Other effects include foreign exchange gains and losses transferred to the income statement and professional fees related to the disposal.2 Reported in other income and expense in the consolidated income statement.

Business reviewPerform
anceG
overnanceFinancials
Additional information
137Vodafone Group Plc Annual Report 2012
27. Reconciliation of net cash flow from operating activities2012 2011 2010
£m £m £m
Profit for the financial year 7,003 7,870 8,618Adjustments for:
Share-based payments 143 156 150Depreciation and amortisation 7,859 7,876 7,910Loss on disposal of property, plant and equipment 47 91 101Share of result in associates (4,963) (5,059) (4,742)Impairment losses 4,050 6,150 2,100Other income and expense (3,705) 16 (114)Non-operating income and expense 162 (3,022) 10Investment income (456) (1,309) (716)Financing costs 1,932 429 1,512Income tax expense 2,546 1,628 56Decrease/(increase) in inventory 24 (107) 2Increase in trade and other receivables (689) (387) (714)Increase in trade and other payables 871 1,060 1,164
Cash generated by operations 14,824 15,392 15,337Tax paid (2,069) (3,397) (2,273)Net cash flow from operating activities 12,755 11,995 13,064
28. Commitments
Operating lease commitmentsThe Group has entered into commercial leases on certain properties, network infrastructure, motor vehicles and items of equipment. The leases have various terms, escalation clauses, purchase options and renewal rights, none of which are individually significant to the Group.
Future minimum lease payments under non-cancellable operating leases comprise:
2012 2011
£m £m
Within one year 1,110 1,225In more than one year but less than two years 893 958In more than two years but less than three years 740 746In more than three years but less than four years 624 638In more than four years but less than five years 528 602In more than five years 2,246 2,344
6,141 6,513
The total of future minimum sublease payments expected to be received under non-cancellable subleases is £252 million (2011: £240 million).
Capital commitmentsCompany and subsidiaries Share of joint ventures Group
2012 2011 2012 2011 2012 2011
£m £m £m £m £m £m
Contracts placed for future capital expenditure not provided in the financial statements1 1,735 1,786 283 338 2,018 2,124
Note:1 Commitment includes contracts placed for property, plant and equipment and intangible assets.
The commitments of Cellco Partnership (‘Cellco’), which trades under the name of Verizon Wireless, are disclosed within the consolidated financial statements of Cellco for the year ended 31 December 2011, which are included as an exhibit to our 2012 annual report on Form 20-F filed with the SEC.

138Vodafone Group Plc Annual Report 2012
Notes to the consolidated financial statements (continued)
29. Contingent liabilities2012 2011
£m £m
Performance bonds 270 94Credit guarantees – third party indebtedness 77 114Other guarantees and contingent liabilities 551 1,527
Performance bondsPerformance bonds require the Group to make payments to third parties in the event that the Group does not perform what is expected of it under the terms of any related contracts or commercial arrangements.
Credit guarantees – third party indebtednessCredit guarantees comprise guarantees and indemnities of bank or other facilities including those in respect of the Group’s associates and investments.
Other guarantees and contingent liabilitiesAt 31 March 2011 other guarantees principally comprised of commitments to the India Supreme Court of INR 85 billion (£1,188 million) pending final adjudication in relation to the case with the Indian Tax Authority, see “Legal Proceedings”.
The Group also enters into lease arrangements in the normal course of business which are principally in respect of land, buildings and equipment. Further details on the minimum lease payments due under the non-cancellable operating lease arrangements can be found in note 28.
The Company has covenanted to provide security in favour of the Trustee of the Vodafone Group UK Pension Scheme whilst there is a deficit in the scheme. The deficit is measured on a prescribed basis agreed between the Company and Trustee. In 2010 the Company and Trustee agreed security of a charge over UK index linked gilts (‘ILG’) held by the Company. An initial charge in favour of the Trustee was agreed over ILG 2016 with a notional value of £100 million and ILG 2013 with a notional value of £48.9 million to secure the deficit at that time of approximately £450 million. In December 2011, the security was increased by an additional charge over ILG 2017 with a notional value of £177.7 million due to an increase in the deficit. The security may be substituted either on a voluntary or mandatory basis. As and when alternative security is provided, the Company has agreed that the security cover should include additional headroom of 33%, although if cash is used as the security asset the ratio will revert to 100% of the relevant liabilities or where the proposed replacement security asset is listed on an internationally recognised stock exchange in certain core jurisdictions, the Trustee may decide to agree a lower ratio than 133%.
Legal proceedingsThe Company and its subsidiaries are currently, and may be from time to time, involved in a number of legal proceedings including inquiries from, or discussions with, governmental authorities that are incidental to their operations. However, save as disclosed below, the Company and its subsidiaries are not currently involved in any legal or arbitration proceedings (including any governmental proceedings which are pending or known to be contemplated) which may have, or have had in the 12 months preceding the date of this report, a significant effect on the financial position or profitability of the Company and its subsidiaries. Due to inherent uncertainties, no accurate quantification of any cost, or timing of such cost, which may arise from any of the legal proceedings outlined below can be made.
In October 2009 Telecom Egypt commenced arbitration against Vodafone Egypt in Cairo alleging breach of non-discrimination provisions in an interconnection agreement as a result of allegedly lower interconnection rates paid to Vodafone Egypt by Mobinil. Telecom Egypt has also sought to join Vodafone International Holdings BV (‘VIHBV’), Vodafone Europe BV (‘VEBV’) and Vodafone Group Plc (who Telecom Egypt alleges should be held jointly liable with Vodafone Egypt) to the arbitration. VIHBV, VEBV and Vodafone Group Plc deny that they were subject to the interconnection agreement or any arbitration agreement with Telecom Egypt. Telecom Egypt initially quantified its claim at approximately €190 million in 2009. This was subsequently amended and increased to €551 million in January 2011 and further increased to its current value of just over €1.2 billion in November 2011. The Company disputes Telecom Egypt’s claim (and assertion of jurisdiction over VIHBV, VEBV and Vodafone Group Plc) and will continue to defend its position vigorously. Final submissions are due on 29 June 2012 and the arbitration hearing is currently scheduled to last ten days, commencing 6 September 2012.
Vodafone India Limited (‘VIL’) and VIHBV each received notices in August 2007 and September 2007, respectively, from the Indian tax authority alleging potential liability in connection with alleged failure by VIHBV to deduct withholding tax from consideration paid to the Hutchison Telecommunications International Limited group (‘HTIL’) in respect of HTIL’s gain on its disposal to VIHBV of its interests in a wholly-owned subsidiary that indirectly holds interests in VIL. Following the receipt of such notices, VIL and VIHBV each filed writs seeking orders that their respective notices be quashed and that the Indian tax authority take no further steps under the notices. Initial hearings were held before the Bombay High Court and, in the case of VIHBV, the Bombay High Court admitted the writ for final hearing in June 2008. In December 2008, the Bombay High Court dismissed VIHBV’s writ. VIHBV subsequently filed a special leave petition to the Supreme Court to appeal the Bombay High Court’s dismissal of the writ. On 23 January 2009 the Supreme Court referred the question of the tax authority’s jurisdiction to seek to pursue tax back to the tax authority for adjudication on the facts, with permission granted to VIHBV to appeal that decision back to the Bombay High Court should VIHBV disagree with the tax authority’s findings. On 30 October 2009 VIHBV received a notice from the tax authority requiring VIHBV to show cause as to why it believed that the Indian tax authority did not have competent jurisdiction to proceed against VIHBV for the default of non-deduction of withholding tax from consideration paid to HTIL. VIHBV provided a response on 29 January 2010. On 31 May 2010 VIHBV received an order from the Indian tax authority confirming their view that they did have jurisdiction to proceed against VIHBV, as well as a further notice alleging that VIHBV should be treated as the agent of HTIL for the purpose of recovering tax on the transaction. VIHBV appealed this ruling to the Bombay High Court, as well as filed a new writ petition against the notice seeking to treat it as an agent of HTIL. On 8 September 2010 the Bombay High Court ruled that the tax authority had jurisdiction to decide whether the transaction or some part of the transaction could be taxable in India. VIHBV appealed this decision to the Supreme Court on 14 September 2010. A hearing before the Supreme Court took place on 27 September 2010 at which time the Supreme Court noted the appeal and asked the Indian tax authority to quantify any liability. On 22 October 2010 the Indian tax authority quantified the alleged tax liability and issued a demand for payment of INR 112.2 billion (£1.6 billion) of tax and interest. VIHBV contested the amount of such demand both on the basis of
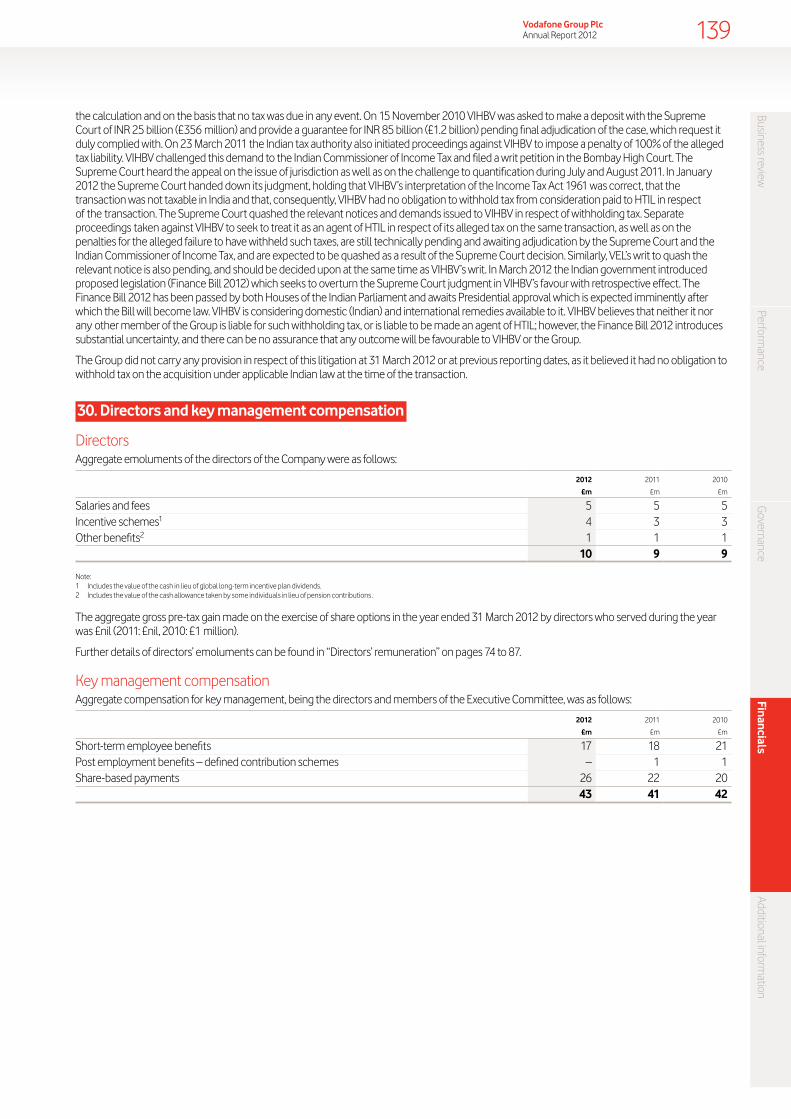
Business reviewPerform
anceG
overnanceFinancials
Additional information
139Vodafone Group Plc Annual Report 2012
the calculation and on the basis that no tax was due in any event. On 15 November 2010 VIHBV was asked to make a deposit with the Supreme Court of INR 25 billion (£356 million) and provide a guarantee for INR 85 billion (£1.2 billion) pending final adjudication of the case, which request it duly complied with. On 23 March 2011 the Indian tax authority also initiated proceedings against VIHBV to impose a penalty of 100% of the alleged tax liability. VIHBV challenged this demand to the Indian Commissioner of Income Tax and filed a writ petition in the Bombay High Court. The Supreme Court heard the appeal on the issue of jurisdiction as well as on the challenge to quantification during July and August 2011. In January 2012 the Supreme Court handed down its judgment, holding that VIHBV’s interpretation of the Income Tax Act 1961 was correct, that the transaction was not taxable in India and that, consequently, VIHBV had no obligation to withhold tax from consideration paid to HTIL in respect of the transaction. The Supreme Court quashed the relevant notices and demands issued to VIHBV in respect of withholding tax. Separate proceedings taken against VIHBV to seek to treat it as an agent of HTIL in respect of its alleged tax on the same transaction, as well as on the penalties for the alleged failure to have withheld such taxes, are still technically pending and awaiting adjudication by the Supreme Court and the Indian Commissioner of Income Tax, and are expected to be quashed as a result of the Supreme Court decision. Similarly, VEL’s writ to quash the relevant notice is also pending, and should be decided upon at the same time as VIHBV’s writ. In March 2012 the Indian government introduced proposed legislation (Finance Bill 2012) which seeks to overturn the Supreme Court judgment in VIHBV’s favour with retrospective effect. The Finance Bill 2012 has been passed by both Houses of the Indian Parliament and awaits Presidential approval which is expected imminently after which the Bill will become law. VIHBV is considering domestic (Indian) and international remedies available to it. VIHBV believes that neither it nor any other member of the Group is liable for such withholding tax, or is liable to be made an agent of HTIL; however, the Finance Bill 2012 introduces substantial uncertainty, and there can be no assurance that any outcome will be favourable to VIHBV or the Group.
The Group did not carry any provision in respect of this litigation at 31 March 2012 or at previous reporting dates, as it believed it had no obligation to withhold tax on the acquisition under applicable Indian law at the time of the transaction.
30. Directors and key management compensation
DirectorsAggregate emoluments of the directors of the Company were as follows:
2012 2011 2010
£m £m £m
Salaries and fees 5 5 5Incentive schemes1 4 3 3Other benefits2 1 1 1
10 9 9
Note:1 Includes the value of the cash in lieu of global long-term incentive plan dividends.2 Includes the value of the cash allowance taken by some individuals in lieu of pension contributions .
The aggregate gross pre-tax gain made on the exercise of share options in the year ended 31 March 2012 by directors who served during the year was £nil (2011: £nil, 2010: £1 million).
Further details of directors’ emoluments can be found in “Directors’ remuneration” on pages 74 to 87.
Key management compensationAggregate compensation for key management, being the directors and members of the Executive Committee, was as follows:
2012 2011 2010
£m £m £m
Short-term employee benefits 17 18 21Post employment benefits – defined contribution schemes – 1 1Share-based payments 26 22 20
43 41 42
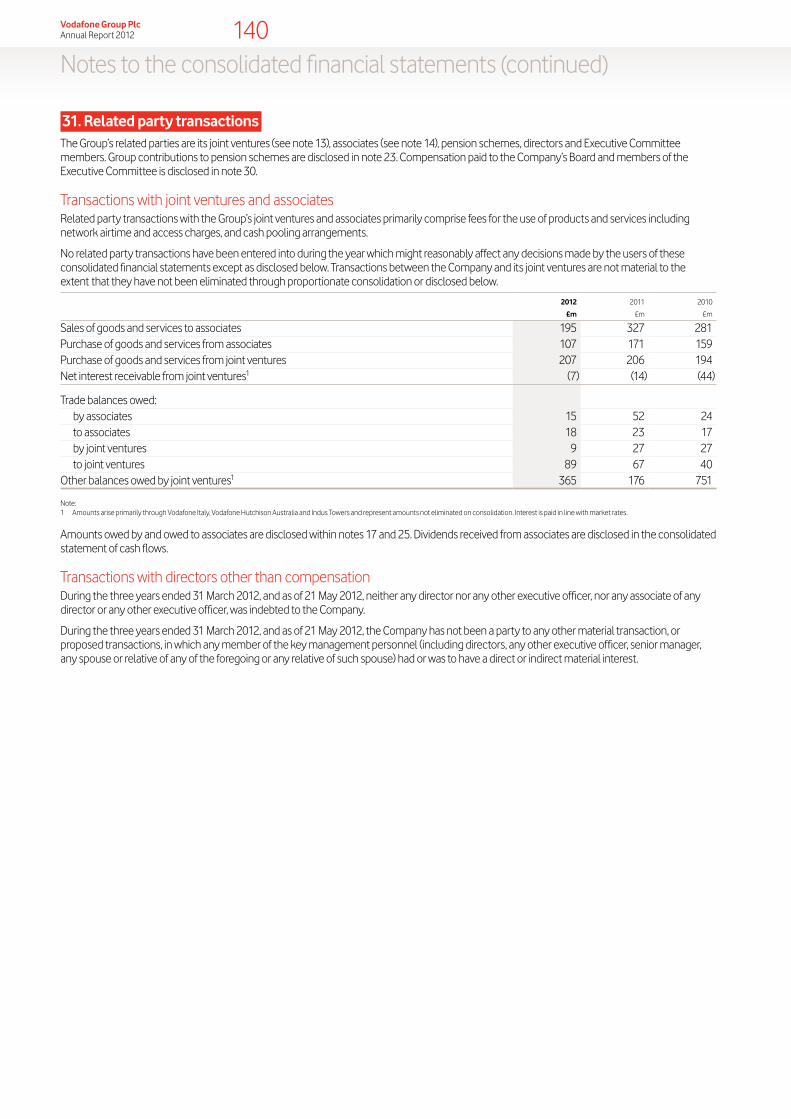
140Vodafone Group Plc Annual Report 2012
Notes to the consolidated financial statements (continued)
31. Related party transactionsThe Group’s related parties are its joint ventures (see note 13), associates (see note 14), pension schemes, directors and Executive Committee members. Group contributions to pension schemes are disclosed in note 23. Compensation paid to the Company’s Board and members of the Executive Committee is disclosed in note 30.
Transactions with joint ventures and associatesRelated party transactions with the Group’s joint ventures and associates primarily comprise fees for the use of products and services including network airtime and access charges, and cash pooling arrangements.
No related party transactions have been entered into during the year which might reasonably affect any decisions made by the users of these consolidated financial statements except as disclosed below. Transactions between the Company and its joint ventures are not material to the extent that they have not been eliminated through proportionate consolidation or disclosed below.
2012 2011 2010
£m £m £m
Sales of goods and services to associates 195 327 281Purchase of goods and services from associates 107 171 159Purchase of goods and services from joint ventures 207 206 194Net interest receivable from joint ventures1 (7) (14) (44)
Trade balances owed:by associates 15 52 24to associates 18 23 17by joint ventures 9 27 27to joint ventures 89 67 40
Other balances owed by joint ventures1 365 176 751
Note:1 Amounts arise primarily through Vodafone Italy, Vodafone Hutchison Australia and Indus Towers and represent amounts not eliminated on consolidation. Interest is paid in line with market rates.
Amounts owed by and owed to associates are disclosed within notes 17 and 25. Dividends received from associates are disclosed in the consolidated statement of cash flows.
Transactions with directors other than compensationDuring the three years ended 31 March 2012, and as of 21 May 2012, neither any director nor any other executive officer, nor any associate of any director or any other executive officer, was indebted to the Company.
During the three years ended 31 March 2012, and as of 21 May 2012, the Company has not been a party to any other material transaction, or proposed transactions, in which any member of the key management personnel (including directors, any other executive officer, senior manager, any spouse or relative of any of the foregoing or any relative of such spouse) had or was to have a direct or indirect material interest.

Business reviewPerform
anceG
overnanceFinancials
Additional information
141Vodafone Group Plc Annual Report 2012
32. EmployeesThe average employee headcount during the year by nature of activity and by segment is shown below.
2012 2011 2010
Employees Employees Employees
By activity:Operations 14,522 14,171 14,099Selling and distribution 30,286 28,311 27,398Customer care and administration 41,565 41,380 43,493
86,373 83,862 84,990
By segment:Germany 12,115 12,594 13,507Italy 5,838 6,121 6,207Spain 4,379 4,389 4,326UK 8,151 8,174 9,766Other Europe 20,061 18,953 18,582Europe 50,544 50,231 52,388
India 11,234 10,743 10,132Vodacom 7,437 7,320 6,833Other Africa, Middle East and Asia Pacific 10,886 10,896 10,887Africa, Middle East and Asia Pacific 29,557 28,959 27,852
Non-Controlled Interests and Common Functions 6,272 4,672 4,750Total 86,373 83,862 84,990
The cost incurred in respect of these employees (including directors) was:
2012 2011 2010
£m £m £m
Wages and salaries 3,158 2,960 3,045Social security costs 399 392 415Share-based payments (note 20) 143 156 150Other pension costs (note 23) 143 134 160
3,843 3,642 3,770
33. Subsequent events
SoftBank considerationOn 2 April 2012 the Group received the remaining consideration of Yen 200 billion (£1.5 billion) from the sale of its SoftBank Mobile Corp. interests.
Offer for Cable & Wireless Worldwide plc (‘CWW’)On 23 April 2012 Vodafone Europe B.V (‘VEBV‘) announced a recommended cash offer to acquire the entire issued and to be issued share capital of CWW (the ‘Offer’). It is intended that the Offer will be effected by way of a court-sanctioned scheme of arrangement (the ‘Scheme’) under Part 26 of the Companies Act. Under the terms of the Offer, CWW shareholders will be entitled to receive 38 pence in cash for each CWW share held. The Offer values the entire issued ordinary share capital of CWW at approximately £1,045 million.
On 21 May 2012 CWW and VEBV announced that the circular relating to the Scheme was being sent to CWW shareholders that day. The Scheme circular sets out, among other things, the full terms and conditions of the Scheme, an explanatory statement, notices of the required meetings, a timetable of principal events and details of the action to be taken by CWW Shareholders.
Subject to approval at the relevant meetings, court approval and the satisfaction or waiver of the other conditions set out in the Scheme circular (including competition and regulatory approvals), the Scheme is expected to become effective on or around 27 July 2012.
On 21 May 2012 VEBV also announced, in order to satisfy its obligation under Rule 15 of the United Kingdom City Code on Takeovers and Mergers, a recommended convertible bond cash offer to the holders of all of the outstanding CWW £230 million 5.75 per cent. convertible bonds due 2014, convertible into ordinary shares of CWW.

142Vodafone Group Plc Annual Report 2012
Audit report on the Company financial statements
Independent auditor’s report to the members of Vodafone Group Plc We have audited the parent company financial statements of Vodafone Group Plc for the year ended 31 March 2012 which comprise the balance sheet and the related notes 1 to 11. The financial reporting framework that has been applied in their preparation is applicable law and United Kingdom Accounting Standards (United Kingdom Generally Accepted Accounting Practice).
This report is made solely to the Company’s members, as a body, in accordance with Chapter 3 of Part 16 of the Companies Act 2006. Our audit work has been undertaken so that we might state to the Company’s members those matters we are required to state to them in an auditor’s report and for no other purpose. To the fullest extent permitted by law, we do not accept or assume responsibility to anyone other than the Company and the Company’s members as a body, for our audit work, for this report, or for the opinions we have formed.
Respective responsibilities of directors and auditorAs explained more fully in the directors’ statement of responsibilities, the directors are responsible for the preparation of the parent company financial statements and for being satisfied that they give a true and fair view.
Our responsibility is to audit and express an opinion on the parent company financial statements in accordance with applicable law and International Standards on Auditing (UK and Ireland). Those standards require us to comply with the Auditing Practices Board’s Ethical Standards for Auditors.
Scope of the audit of the financial statementsAn audit involves obtaining evidence about the amounts and disclosures in the financial statements sufficient to give reasonable assurance that the financial statements are free from material misstatement, whether caused by fraud or error. This includes an assessment of: whether the accounting policies are appropriate to the parent company’s circumstances and have been consistently applied and adequately disclosed; the reasonableness of significant accounting estimates made by the directors; and the overall presentation of the financial statements. In addition, we read all the financial and non-financial information in the annual report to identify material inconsistencies with the audited financial statements. If we become aware of any apparent material misstatements or inconsistencies we consider the implications for our report.
Opinion on financial statementsIn our opinion the parent company financial statements:
aa give a true and fair view of the state of the parent company’s affairs as at 31 March 2012;
aa have been properly prepared in accordance with United Kingdom Generally Accepted Accounting Practice; and
aa have been prepared in accordance with the requirements of the Companies Act 2006.
Opinion on other matters prescribed by the Companies Act 2006In our opinion:
aa the part of the directors’ remuneration report to be audited has been properly prepared in accordance with the Companies Act 2006; and
aa the information given in the directors’ report for the financial year for which the financial statements are prepared is consistent with the parent company financial statements.
Matters on which we are required to report by exceptionWe have nothing to report in respect of the following matters where the Companies Act 2006 requires us to report to you if, in our opinion:
aa adequate accounting records have not been kept by the parent company, or returns adequate for our audit have not been received from branches not visited by us; or
aa the parent company financial statements and the part of the directors’ remuneration report to be audited are not in agreement with the accounting records and returns; or
aa certain disclosures of directors’ remuneration specified by law are not made; or
aa we have not received all the information and explanations we require for our audit.
Other matter We have reported separately on the consolidated financial statements of Vodafone Group Plc for the year ended 31 March 2012.
Panos Kakoullis FCA (Senior Statutory Auditor) for and on behalf of Deloitte LLPChartered Accountants and Statutory Auditor London United Kingdom
22 May 2012

Business reviewPerform
anceG
overnanceFinancials
Additional information
143Vodafone Group Plc Annual Report 2012
Company financial statements of Vodafone Group Plcat 31 March
2012 2011Note £m £m
Fixed assetsShares in Group undertakings 3 65,036 65,112Current assetsDebtors: amounts falling due after more than one year 4 2,443 1,756 Debtors: amounts falling due within one year 4 145,584 133,550 Other investments 5 49 64 Cash at bank and in hand 72 1,430
148,148 136,800 Creditors: amounts falling due within one year 6 (100,271) (94,151)Net current assets 47,877 42,649 Total assets less current liabilities 112,913 107,761 Creditors: amounts falling due after more than one year 6 (21,584) (21,760)
91,329 86,001
Capital and reservesCalled up share capital 7 3,866 4,082 Share premium account 9 43,051 43,028 Capital redemption reserve 9 10,388 10,172 Capital reserve 9 88 88 Other reserves 9 946 1,015 Own shares held 9 (7,889) (8,202)Profit and loss account 9 40,879 35,818 Equity shareholders’ funds 91,329 86,001
The Company financial statements were approved by the Board of directors on 22 May 2012 and were signed on its behalf by:
Vittorio Colao Andy HalfordChief Executive Chief Financial Officer
The accompanying notes are an integral part of these financial statements.
144Vodafone Group Plc Annual Report 2012
1. Basis of preparationThe separate financial statements of the Company are drawn up in accordance with the Companies Act 2006 and UK GAAP.
The preparation of Company financial statements in conformity with generally accepted accounting principles requires management to make estimates and assumptions that affect the reported amounts of assets and liabilities and disclosure of contingent assets and liabilities at the date of the Company financial statements and the reported amounts of revenue and expenses during the reporting period. Actual results could differ from those estimates. The estimates and underlying assumptions are reviewed on an ongoing basis. Revisions to accounting estimates are recognised in the period in which the estimate is revised if the revision affects only that period or in the period of the revision and future periods if the revision affects both current and future periods.
As permitted by section 408(3) of the Companies Act 2006, the profit and loss account of the Company is not presented in this annual report. These separate financial statements are not intended to give a true and fair view of the profit or loss or cash flows of the Company. The Company has not published its individual cash flow statement as its liquidity, solvency and financial adaptability are dependent on the Group rather than its own cash flows.
The Company has taken advantage of the exemption contained in FRS 8 “Related Party Disclosures” and has not reported transactions with fellow Group undertakings.
The Company has taken advantage of the exemption contained in FRS 29 “Financial Instruments: Disclosures” and has not produced any disclosures required by that standard, as disclosures that comply with FRS 29 are available in the Vodafone Group Plc annual report for the year ended 31 March 2012.
2. Significant accounting policiesThe Company’s significant accounting policies are described below.
Accounting conventionThe Company financial statements are prepared under the historical cost convention and in accordance with applicable accounting standards of the UK Accounting Standards Board and pronouncements of the Urgent Issues Task Force.
InvestmentsShares in Group undertakings are stated at cost less any provision for impairment.
The Company assesses investments for impairment whenever events or changes in circumstances indicate that the carrying value of an investment may not be recoverable. If any such indication of impairment exists, the Company makes an estimate of the recoverable amount. If the recoverable amount of the cash-generating unit is less than the value of the investment, the investment is considered to be impaired and is written down to its recoverable amount. An impairment loss is recognised immediately in the profit and loss account.
For available-for-sale investments, gains and losses arising from changes in fair value are recognised directly in equity, until the investment is disposed of or is determined to be impaired, at which time the cumulative gain or loss previously recognised in equity, determined using the weighted average cost method, is included in the net profit or loss for the period.
Foreign currenciesTransactions in foreign currencies are initially recorded at the rates of exchange prevailing on the dates of the transactions. Monetary assets and liabilities denominated in foreign currencies are retranslated into the Company’s functional currency at the rates prevailing on the balance sheet date. Non-monetary items carried at fair value that are denominated in foreign currencies are retranslated at the rates prevailing on the initial transaction dates. Non-monetary items measured in terms of historical cost in a foreign currency are not retranslated.
Exchange differences arising on the settlement of monetary items, and on the retranslation of monetary items, are included in the profit and loss account for the period. Exchange differences arising on the retranslation of non-monetary items carried at fair value are included in the profit and loss account for the period.
Borrowing costsAll borrowing costs are recognised in the profit and loss account in the period in which they are incurred.
TaxationCurrent tax, including UK corporation tax and foreign tax, is provided at amounts expected to be paid (or recovered) using the tax rates and laws that have been enacted or substantively enacted by the balance sheet date.
Deferred tax is provided in full on timing differences that exist at the balance sheet date and that result in an obligation to pay more tax, or a right to pay less tax in the future. The deferred tax is measured at the rate expected to apply in the periods in which the timing differences are expected to reverse, based on the tax rates and laws that are enacted or substantively enacted at the balance sheet date. Timing differences arise from the inclusion of items of income and expenditure in taxation computations in periods different from those in which they are included in the Company financial statements. Deferred tax assets are recognised to the extent that it is regarded as more likely than not that they will be recovered. Deferred tax assets and liabilities are not discounted.
Financial instrumentsFinancial assets and financial liabilities, in respect of financial instruments, are recognised on the Company balance sheet when the Company becomes a party to the contractual provisions of the instrument.
Financial liabilities and equity instrumentsFinancial liabilities and equity instruments issued by the Company are classified according to the substance of the contractual arrangements entered into and the definitions of a financial liability and an equity instrument. An equity instrument is any contract that evidences a residual interest in the assets of the Company after deducting all of its liabilities and includes no obligation to deliver cash or other financial assets. The accounting policies adopted for specific financial liabilities and equity instruments are set out below.
Capital market and bank borrowingsInterest bearing loans and overdrafts are initially measured at fair value (which is equal to cost at inception) and are subsequently measured at amortised cost using the effective interest rate method, except where they are identified as a hedged item in a fair value hedge. Any difference between the proceeds net of transaction costs and the settlement or redemption of borrowings is recognised over the term of the borrowing.
Notes to the Company financial statements

Business reviewPerform
anceG
overnanceFinancials
Additional information
145Vodafone Group Plc Annual Report 2012
Equity instrumentsEquity instruments issued by the Company are recorded at the proceeds received, net of direct issuance costs.
Derivative financial instruments and hedge accountingThe Company’s activities expose it to the financial risks of changes in foreign exchange rates and interest rates.
The use of financial derivatives is governed by the Group’s policies approved by the Board of directors, which provide written principles on the use of financial derivatives consistent with the Group’s risk management strategy.
Derivative financial instruments are initially measured at fair value on the contract date and are subsequently remeasured to fair value at each reporting date. The Company designates certain derivatives as hedges of the change of fair value of recognised assets and liabilities (“fair value hedges”). Hedge accounting is discontinued when the hedging instrument expires or is sold, terminated or exercised, no longer qualifies for hedge accounting or the Company chooses to end the hedging relationship.
Fair value hedgesThe Company’s policy is to use derivative instruments (primarily interest rate swaps) to convert a proportion of its fixed rate debt to floating rates in order to hedge the interest rate risk arising, principally, from capital market borrowings.
The Company designates these as fair value hedges of interest rate risk with changes in fair value of the hedging instrument recognised in the profit and loss account for the period together with the changes in the fair value of the hedged item due to the hedged risk, to the extent the hedge is effective. The ineffective portion is recognised immediately in the profit and loss account.
Share-based paymentsThe Group operates a number of equity-settled share-based compensation plans for the employees of subsidiaries using the Company’s equity instruments. The fair value of the compensation given in respect of these share-based compensation plans is recognised as a capital contribution to the Company’s subsidiaries over the vesting period. The capital contribution is reduced by any payments received from subsidiaries in respect of these share-based payments.
Dividends paid and receivedDividends paid and received are included in the Company financial statements in the period in which the related dividends are actually paid or received or, in respect of the Company’s final dividend for the year, approved by shareholders.
PensionsThe Company is the sponsoring employer of the Vodafone Group pension scheme, a defined benefit pension scheme. The Company is unable to identify its share of the underlying assets and liabilities of the Vodafone Group pension scheme on a consistent and reasonable basis. Therefore, the Company has applied the guidance within FRS 17 to account for defined benefit schemes as if they were defined contribution schemes and recognise only the contribution payable each year. The Company had no contributions payable for the years ended 31 March 2012 and 31 March 2011.
3. Fixed assets
Shares in Group undertakings£m
Cost:1 April 2011 70,743Capital contributions arising from share-based payments 143Contributions received in relation to share-based payments (212)Disposals (7)31 March 2012 70,667
Amounts provided for:1 April 2011 and 31 March 2012 5,631
Net book value:31 March 2011 65,11231 March 2012 65,036
At 31 March 2012 the Company had the following principal subsidiary:Country of Percentage
Name Principal activity incorporation shareholding
Vodafone European Investments Holding company England 100

146Vodafone Group Plc Annual Report 2012
4. Debtors2012 2011
£m £m
Amounts falling due within one year:Amounts owed by subsidiaries 145,200 133,246 Taxation recoverable 207 158 Other debtors 177 146
145,584 133,550
Amounts falling due after more than one year:Deferred taxation 2 2 Other debtors 2,441 1,754
2,443 1,756
5. Other investments2012 2011
£m £m
Investments 49 64
6. Creditors2012 2011
£m £m
Amounts falling due within one year:Bank loans and other loans 4,576 4,739 Amounts owed to subsidiaries 94,432 89,194 Other creditors 127 166 Accruals and deferred income 1,136 52
100,271 94,151
Amounts falling due after more than one year:Other loans 20,821 21,367 Other creditors 763 393
21,584 21,760
Included in amounts falling due after more than one year are other loans of £9,326 million, which are due in more than five years from 1 April 2012 and are payable otherwise than by instalments. Interest payable on these loans ranges from 4.375% to 8.125%.
7. Share capital2012 2011
Number £m Number £m
Ordinary shares of 11 3⁄ 7 US cents each allotted, issued and fully paid:1 2
1 April 56,811,123,429 4,082 57,809,246,732 4,153Allotted during the year 3,883,860 – 1,876,697 –Cancelled during the year (3,000,000,000) (216) (1,000,000,000) (71)31 March 53,815,007,289 3,866 56,811,123,429 4,082
Notes:1 50,000 (2011: 50,000) 7% cumulative fixed rate shares of £1 each were allotted, issued and fully paid by the Company. 2 At 31 March 2012 the Company held 4,169,067,107 (2011: 5,233,597,599) treasury shares with a nominal value of £299 million (2011: £376 million).
Allotted during the yearNominal Net
value proceedsNumber £m £m
Share awards and option scheme awards1 3,883,860 – 7
Note:1 Shares allocated during the year were in relation to US share awards and option schemes.
Notes to the Company financial statements (continued)
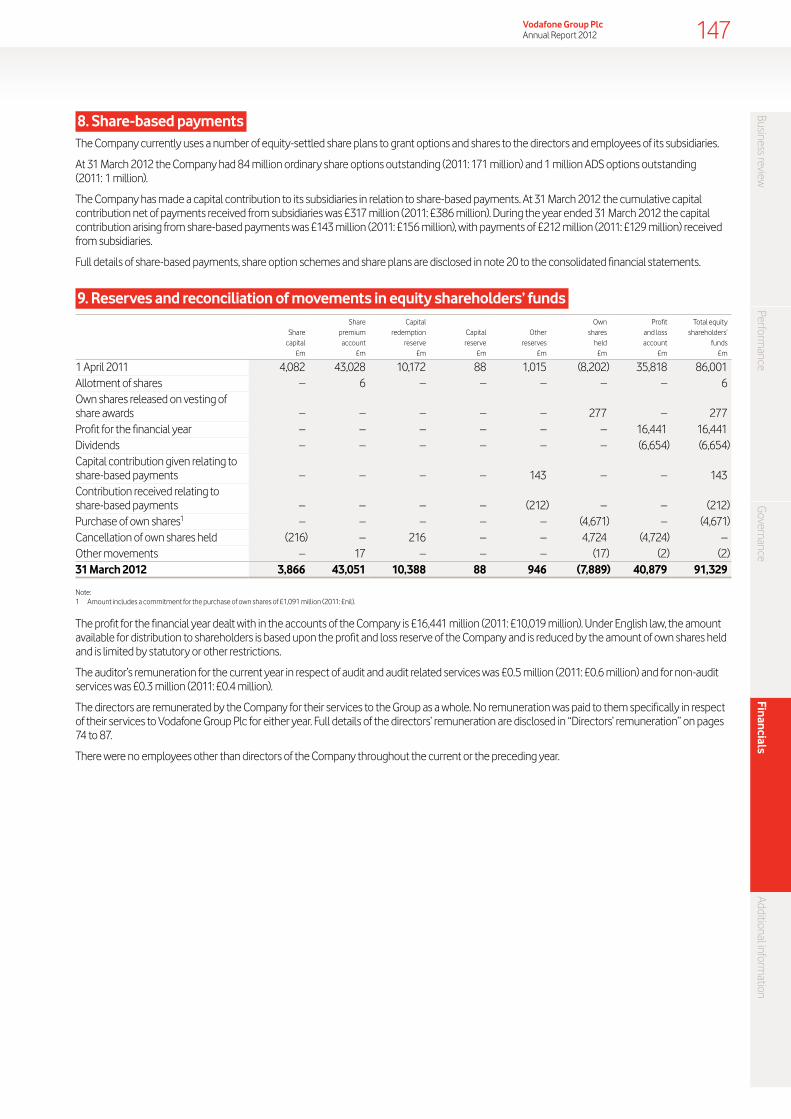
Business reviewPerform
anceG
overnanceFinancials
Additional information
147Vodafone Group Plc Annual Report 2012
8. Share-based paymentsThe Company currently uses a number of equity-settled share plans to grant options and shares to the directors and employees of its subsidiaries.
At 31 March 2012 the Company had 84 million ordinary share options outstanding (2011: 171 million) and 1 million ADS options outstanding (2011: 1 million).
The Company has made a capital contribution to its subsidiaries in relation to share-based payments. At 31 March 2012 the cumulative capital contribution net of payments received from subsidiaries was £317 million (2011: £386 million). During the year ended 31 March 2012 the capital contribution arising from share-based payments was £143 million (2011: £156 million), with payments of £212 million (2011: £129 million) received from subsidiaries.
Full details of share-based payments, share option schemes and share plans are disclosed in note 20 to the consolidated financial statements.
9. Reserves and reconciliation of movements in equity shareholders’ fundsShare Capital Own Profit Total equity
Share premium redemption Capital Other shares and loss shareholders’capital account reserve reserve reserves held account funds
£m £m £m £m £m £m £m £m
1 April 2011 4,082 43,028 10,172 88 1,015 (8,202) 35,818 86,001 Allotment of shares – 6 – – – – – 6 Own shares released on vesting of share awards – – – – – 277 – 277 Profit for the financial year – – – – – – 16,441 16,441 Dividends – – – – – – (6,654) (6,654)Capital contribution given relating to share-based payments – – – – 143 – – 143 Contribution received relating to share-based payments – – – – (212) – – (212)Purchase of own shares1 – – – – – (4,671) – (4,671)Cancellation of own shares held (216) – 216 – – 4,724 (4,724) – Other movements – 17 – – – (17) (2) (2)31 March 2012 3,866 43,051 10,388 88 946 (7,889) 40,879 91,329
Note:1 Amount includes a commitment for the purchase of own shares of £1,091 million (2011: £nil).
The profit for the financial year dealt with in the accounts of the Company is £16,441 million (2011: £10,019 million). Under English law, the amount available for distribution to shareholders is based upon the profit and loss reserve of the Company and is reduced by the amount of own shares held and is limited by statutory or other restrictions.
The auditor’s remuneration for the current year in respect of audit and audit related services was £0.5 million (2011: £0.6 million) and for non-audit services was £0.3 million (2011: £0.4 million).
The directors are remunerated by the Company for their services to the Group as a whole. No remuneration was paid to them specifically in respect of their services to Vodafone Group Plc for either year. Full details of the directors’ remuneration are disclosed in “Directors’ remuneration” on pages 74 to 87.
There were no employees other than directors of the Company throughout the current or the preceding year.

148Vodafone Group Plc Annual Report 2012
10. Equity dividends2012 2011
£m £m
Declared during the financial year:Final dividend for the year ended 31 March 2011: 6.05 pence per share (2010: 5.65 pence per share) 3,102 2,976Interim dividend for the year ended 31 March 2012: 3.05 pence per share (2011: 2.85 pence per share) 1,536 1,492Second interim dividend for the year ended 31 March 2012: 4.00 pence per share (2011: nil) 2,016 –
6,654 4,468Proposed after the balance sheet date and not recognised as a liability:Final dividend for the year ended 31 March 2012: 6.47 pence per share (2011: 6.05 pence per share) 3,195 3,106
11. Contingent liabilities2012 2011
£m £m
Performance bonds 165 3Other guarantees and contingent liabilities 1,655 3,113
Performance bondsPerformance bonds require the Company to make payments to third parties in the event that the Company or its subsidiaries do not perform what is expected of them under the terms of any related contracts.
Other guarantees and contingent liabilitiesOther guarantees at 31 March 2012 principally comprise the Company’s guarantee of the Group’s 50% share of a AUD 1.7 billion loan facility of its joint venture, Vodafone Hutchison Australia Pty Limited, and the counter indemnification by the Company of guarantees provided by an indirect subsidiary of the Company to Piramal Healthcare Limited (‘Piramal’) for INR 89.2 billion (£1,096 million). The guarantees to Piramal were made in respect to its acquisition of approximately 11% shareholding in Vodafone India Limited (‘VIL’) during the 2012 financial year. The acquisition agreements dated 10 August 2011 and 28 December 2011 contemplate various exit mechanisms for Piramal including participating in an initial public offering by VIL or, if such initial public offering has not completed by 18 August 2013 or 8 February 2014 respectively or Piramal chooses not to participate in such initial public offering, Piramal selling its shareholding to the Vodafone Group in two tranches of 5.485% for an aggregate price of between approximately INR 70 billion (£0.8 billion) and INR 83 billion (£1.0 billion).
Other guarantees at March 2011 comprised the Company’s guarantee over underwritten put options over 33% of VIL owned by the Essar Group. The total consideration due under these options was US$5 billion (£3.1 billion). The transfer of a 22% shareholding in VIL to Vodafone was completed in two tranches on 1 June 2011 and 1 July 2011. Under separate agreement, the Essar Group sold a 11% shareholding in VIL to Piramal as described above.
As discussed in note 29 to the consolidated financial statements the Company has covenanted to provide security in favour of the trustee of the Vodafone Group UK Pension Scheme in respect of the funding deficit in the scheme.
Legal proceedingsDetails regarding certain legal actions which involve the Company are set out in note 29 to the consolidated financial statements.
Notes to the Company financial statements (continued)
Business reviewPerform
anceG
overnanceFinancials
Additional inform
ation149Vodafone Group Plc
Annual Report 2012
Investor calendar
Ex-dividend date for final dividend 6 June 2012Record date for final dividend 8 June 2012Interim management statement 30 June 2012 20 July 2012Annual general meeting 24 July 2012Final dividend payment 1 August 2012Half-year financial results 13 November 2012Ex-dividend date for interim dividend 21 November 20121
Record date for interim dividend 23 November 20121
Interim dividend payment 6 February 20131
Note:1 Provisional dates.
Shareholder information
DividendsDetails on the dividend amount per share can be found on page 55.
Payment of dividends by direct creditThe Company pays cash dividends by mandate electronically to shareholders’ bank or building society accounts. The advantages of electronic payments are secure delivery and dividend payments credited to shareholders’ bank or building society account on the same day of payment. A consolidated tax voucher covering both the interim and final dividends paid during the financial year is sent to shareholders at the time of the interim dividend in February.
ADS holders may alternatively have their cash dividends paid by cheque.
Overseas dividend paymentsHolders of ordinary shares resident in the eurozone (defined for this purpose as a country that has adopted the euro as its national currency) automatically receive their dividends in euros. The sterling/euro exchange rate will be determined by us in accordance with the Company’s articles of association up to 13 business days’ prior to the payment date.
Holders resident outside the UK and eurozone automatically receive dividends in pounds sterling but may elect to receive dividends in local currency directly into their bank account by registering for our registrars’ Global Payments Service. For further information, visit www.investorcentre.co.uk for details and terms and conditions.
Cash dividends to ADS holders will be paid by the ADS depositary in US dollars. The sterling/US dollar exchange rate for this purpose will be determined by us up to ten New York and London business days prior to the payment date.
Further information about dividend payments can be found at www.vodafone.com/dividends or, alternatively, please contact our registrars or the ADS depositary, as applicable, for further details.
Dividend reinvestment planWe offer a dividend reinvestment plan which allows holders of ordinary shares, who choose to participate, to use their cash dividends to acquire additional shares in the Company. These are purchased on their behalf by the plan administrator through a low cost dealing arrangement.
For ADS holders BNY Mellon maintains a Global BuyDIRECT Plan which is a direct purchase and sale plan for depositary receipts with a dividend reinvestment facility.
Managing your shares via Investor CentreInvestor Centre is a portfolio service operated by Computershare, for investors, which gives holders of the Company’s ordinary shares online access to information about their investments as well as a facility to help manage their holdings online, such as:
aa update dividend mandate bank instructions and review dividend payment history;
aa update member details and address changes; and
aa register to receive Company communications electronically.
Computershare also offer an internet and telephone share dealing service to existing shareholders.
The service can be obtained on www.investorcentre.co.uk. Shareholders with any queries regarding their holding should contact Computershare. Their contact details can be found on page 150.
Shareholders may also find the investors section of our corporate website, www.vodafone.com/investor, useful for general queries and information about the Company.
Shareholder communicationsA growing number of our shareholders have opted to receive their communications from the Company electronically using email and web-based communications. The use of electronic communications, rather than printed paper documents, means information about the Company can be received as soon as it is available and has the added benefit of reducing costs and our impact on the environment. Each time the Company issues a shareholder communication, shareholders registered for electronic communications will be sent an email alert containing a link to the relevant documents.
If you still receive paper communications from us, we would encourage you to sign up for this service by providing us with an email address. You can register your e-address via our registrar at www.investorcentre.co.uk or contact them via the telephone number provided on page 150. Further information about this service is available on the investor page of our website.
Annual general meeting The twenty-eighth AGM of the Company will be held at the Grange Tower Bridge Hotel, 45 Prescot Street, London E1 8GP on 24 July 2012 at 11.00 a.m.
The AGM will be transmitted via a live webcast which can be viewed on the website at www.vodafone.com/agm on the day of the meeting and a recording will be available to view after that date.

150Vodafone Group Plc Annual Report 2012
Shareholder information (continued)
ShareGiftWe support ShareGift, the charity share donation scheme (registered charity number 1052686). Through ShareGift, shareholders who have only a very small number of shares, which might be considered uneconomic to sell, are able to donate them to charity. Donated shares are aggregated and sold by ShareGift, the proceeds being passed on to a wide range of UK charities.
Further details about ShareGift can be obtained from its website at www.ShareGift.org or by calling +44 (0)20 7930 3737.
Asset Checker LimitedWe participate in Asset Checker, the online service which provides a search facility for solicitors and probate professionals to quickly and easily trace UK shareholdings relating to deceased estates. For further information visit www.assetchecker.co.uk or call 0870 707 4004.
Warning to shareholders (“Boiler room” scams)Over recent years we have become aware of investors who have received unsolicited calls or correspondence, in some cases purporting to have been issued by the Company, concerning investment matters. These typically make claims of highly profitable opportunities in UK or US investments which turn out to be worthless or simply do not exist. Approaches such as these are usually made by unauthorised companies and individuals and are commonly known as “boiler room” scams. Investors are advised to be wary of any unsolicited advice or offers to buy shares. If it sounds too good to be true, it often is.
More detailed information about this or similar activity can be found on the FSA website www.fsa.gov.uk/consumer.
Registrars and transfer office The registrars Holders of ordinary shares resident in Ireland:Computershare Investor Services PLC Computershare Investor Services (Ireland) Ltd The Pavilions PO Box 9742 Bridgwater Road, Bristol BS99 6ZZ, England Dublin 18, Ireland Telephone: +44 (0)870 702 0198 Telephone: +353 (0)818 300 999 www.investorcentre.co.uk/contactus www.investorcentre.co.uk/contactus
ADS depositary The Bank of New York Mellon PO Box 358516 Pittsburgh, PA 15252-8516, US Telephone: +1 800 233 5601 (toll free) or, for calls outside the US, +1 201 680 6837 (not toll free) and enter company number 2160 Email: [email protected]
Share price historyUpon flotation of the Company on 11 October 1988 the ordinary shares were valued at 170 pence each. When the Company was finally demerged on 16 September 1991 the base cost of Racal Electronics Plc shares for UK taxpayers was apportioned between the Company and Racal Electronics Plc for capital gains tax purposes in the ratio of 80.036% and 19.964% respectively. Opening share prices on 16 September 1991 were 332 pence for each Vodafone share and 223 pence for each Racal share.
On 21 July 1994 the Company effected a bonus issue of two new shares for every one then held and on 30 September 1999 it effected a bonus issue of four new shares for every one held at that date. The flotation and demerger share prices therefore may be restated as 11.333 pence and 22.133 pence respectively.
On 31 July 2006 the Group returned approximately £9 billion to shareholders in the form of a B share arrangement. As part of this arrangement, and in order to facilitate historical share price comparisons, the Group’s share capital was consolidated on the basis of seven new ordinary shares for every eight ordinary shares held at this date.
The closing share price at 31 March 2012 was 172.2 pence (31 March 2011: 176.5 pence). The closing share price on 21 May 2012 was 165.0 pence.
The following tables set out, for the periods indicated, i) the reported high and low middle market quotations of ordinary shares on the London Stock Exchange, and ii) the reported high and low sales prices of ADSs on the New York Stock Exchange (‘NYSE’)/NASDAQ. The Company transferred its ADS listing from the NYSE to NASDAQ on 29 October 2009.
London StockExchange
Pounds perordinary share
NYSE/NASDAQDollars per ADS
Year ended 31 March High Low High Low
2008 1.98 1.36 40.87 26.882009 1.70 0.96 32.87 15.302010 1.54 1.11 24.04 17.682011 1.85 1.27 32.70 18.212012 1.84 1.54 29.46 24.31
London Stock Exchange
Pounds perordinary share
NYSE/NASDAQDollars per ADS
Quarter High Low High Low
2010/2011First quarter 1.53 1.27 23.79 18.21Second quarter 1.65 1.36 25.80 20.71Third quarter 1.80 1.57 28.52 28.84Fourth quarter 1.85 1.67 32.70 26.342011/2012First quarter 1.83 1.58 29.46 25.67Second quarter 1.75 1.54 28.75 24.31Third quarter 1.84 1.63 29.28 25.42Fourth quarter 1.82 1.65 28.37 26.002012/2013First quarter1 1.77 1.64 28.39 26.00
Note:1 Covering period up to 21 May 2012.

Business reviewPerform
anceG
overnanceFinancials
Additional inform
ation151Vodafone Group Plc
Annual Report 2012
London Stock Exchange
Pounds perordinary share
NASDAQ
Dollars per ADS
Month High Low High Low
November 2011 1.84 1.64 29.28 25.63December 2011 1.80 1.71 28.11 26.78January 2012 1.82 1.71 28.37 26.59February 2012 1.79 1.69 28.28 27.04March 2012 1.76 1.65 28.03 26.00April 2012 1.77 1.68 28.39 26.83May 20121 1.75 1.64 28.26 26.00
Note:1 Covering period up to 21 May 2012.
Inflation and foreign currency translationInflationInflation has not had a significant effect on the Group’s results of operations and financial condition during the three years ended 31 March 2012.
Foreign currency translationThe following table sets out the pounds sterling exchange rates of the other principal currencies of the Group, being: “euros”, “€” or “eurocents”, the currency of the European Union (‘EU’) member states which have adopted the euro as their currency, and “US dollars”, “US$”, “cents” or “¢”, the currency of the US.
31 March %Currency (=£1) 2012 2011 Change
Average:Euro 1.16 1.18 (1.7)US dollar 1.60 1.56 2.6At 31 March:Euro 1.20 1.13 6.2US dollar 1.60 1.61 (0.6)
The following table sets out, for the periods and dates indicated, the period end, average, high and low exchanges rates for pounds sterling expressed in US dollars per £1.00.Year ended 31 March 31 March Average High Low
2008 1.99 2.01 2.11 1.942009 1.43 1.72 2.00 1.372010 1.52 1.60 1.70 1.442011 1.61 1.56 1.64 1.432012 1.60 1.60 1.67 1.53
The following table sets out, for the periods indicated, the high and low exchange rates for pounds sterling expressed in US dollars per £1.00.Month High Low
November 2011 1.61 1.54December 2011 1.57 1.54January 2012 1.58 1.53February 2012 1.59 1.57March 2012 1.60 1.56April 2012 1.62 1.58
MarketsOrdinary shares of Vodafone Group Plc are traded on the London Stock Exchange and in the form of ADSs on NASDAQ. The Company had a total market capitalisation of approximately £81.4 billion at 21 May 2012 making it the second largest listing in The Financial Times Stock Exchange 100 index and the 26th largest company in the world based on market capitalisation at that date.
ADSs, each representing ten ordinary shares, are traded on NASDAQ under the symbol “VOD”. The ADSs are evidenced by ADRs issued by BNY Mellon, as depositary, under a deposit agreement, dated as of
12 October 1988, as amended and restated on 26 December 1989, 16 September 1991, 30 June 1999, 31 July 2006 and 30 July 2009 between the Company, the depositary and the holders from time to time of ADRs issued thereunder.
ADS holders are not members of the Company but may instruct BNY Mellon on the exercise of voting rights relative to the number of ordinary shares represented by their ADSs. See “Articles of association and applicable English law – Rights attaching to the Company’s shares – Voting rights” on page 152.
Shareholders at 31 March 2012
Number of ordinary shares heldNumber of
accounts% of total
issued shares
1 – 1,000 425,559 0.221,001 – 5,000 79,267 0.345,001 – 50,000 28,303 0.6650,001 – 100,000 1,116 0.15100,001 – 500,000 1,025 0.43More than 500,000 1,563 98.20
536,833 100.00
Geographical analysis of shareholders at 31 March 2012
Region% of total
issued shares
UK 42.3North America 30.4Europe (excluding the UK) 12.2Rest of the world 15.1
Major shareholdersBNY Mellon, as custodian of the Company’s ADR programme, held approximately 19% of the Company’s ordinary shares of 113⁄7 US cents each at 21 May 2012 as nominee. The total number of ADRs outstanding at 21 May 2012 was 938,044,545. At this date 1,401 holders of record of ordinary shares had registered addresses in the US and in total held approximately 0.007% of the ordinary shares of the Company.
At 31 March 2012 the following percentage interests in the ordinary share capital of the Company, disclosable under the Disclosure and Transparency Rules, (DTR 5), have been notified to the directors. No changes in the interests disclosed to the Company have been notified between 31 March 2012 and 21 May 2012.Shareholder Shareholding
Black Rock, Inc. 5.99%Legal & General Group Plc 4.04%
The rights attaching to the ordinary shares of the Company held by these shareholders are identical in all respects to the rights attaching to all the ordinary shares of the Company. The directors are not aware, at 21 May 2012, of any other interest of 3% or more in the ordinary share capital of the Company. The Company is not directly or indirectly owned or controlled by any foreign government or any other legal entity. There are no arrangements known to the Company that could result in a change of control of the Company.
Articles of association and applicable English lawThe following description summarises certain provisions of the Company’s articles of association and applicable English law. This summary is qualified in its entirety by reference to the Companies Act 2006 of England and Wales and the Company’s articles of association. Information on where shareholders can obtain copies of the articles of association is provided under “Documents on display” on page 154.
The Company is a public limited company under the laws of England and Wales. The Company is registered in England and Wales under the name Vodafone Group Public Limited Company with the registration number 1833679.

152Vodafone Group Plc Annual Report 2012
Shareholder information (continued)
All of the Company’s ordinary shares are fully paid. Accordingly, no further contribution of capital may be required by the Company from the holders of such shares.
English law specifies that any alteration to the articles of association must be approved by a special resolution of the shareholders.
Articles of associationBy a special resolution passed at the 2010 AGM the Company removed its object clause together with all other provisions of its memorandum of association which, by virtue of the Companies Act 2006, are treated as forming part of the Company’s articles of association. Accordingly, the Company’s articles of association do not specifically restrict the objects of the Company.
DirectorsThe Company’s articles of association provide for a Board of directors, consisting of not fewer than three directors, who shall manage the business and affairs of the Company.
The directors are empowered to exercise all the powers of the Company subject to any restrictions in the articles of association, the Companies Act (as defined in the articles of association) and any special resolution.
Under the Company’s articles of association a director cannot vote in respect of any proposal in which the director, or any person connected with the director, has a material interest other than by virtue of the director’s interest in the Company’s shares or other securities. However, this restriction on voting does not apply to resolutions (i) giving the director or a third party any guarantee, security or indemnity in respect of obligations or liabilities incurred at the request of or for the benefit of the Company, (ii) giving any guarantee, security or indemnity to the director or a third party in respect of obligations of the Company for which the director has assumed responsibility under an indemnity or guarantee, (iii) relating to an offer of securities of the Company in which the director is entitled to participate as a holder of shares or other securities or in the underwriting of such shares or securities, (iv) concerning any other company in which the director (together with any connected person) is a shareholder or an officer or is otherwise interested, provided that the director (together with any connected person) is not interested in 1% or more of any class of the Company’s equity share capital or the voting rights available to its shareholders, (v) relating to the arrangement of any employee benefit in which the director will share equally with other employees and (vi) relating to any insurance that the Company purchases or renews for its directors or any group of people including directors.
The directors are empowered to exercise all the powers of the Company to borrow money, subject to the limitation that the aggregate amount of all liabilities and obligations of the Group outstanding at any time shall not exceed an amount equal to 1.5 times the aggregate of the Group’s share capital and reserves calculated in the manner prescribed in the articles of association unless sanctioned by an ordinary resolution of the Company’s shareholders.
The Company can make market purchases of its own shares or agree to do so in the future provided it is duly authorised by its members in a general meeting and subject to and in accordance with section 701 of the Companies Act 2006.
At each AGM all directors who were elected or last re-elected at or before the AGM held in the third calendar year before the current year shall automatically retire. In 2005 the Company reviewed its policy regarding the retirement and re-election of directors and, although it is not intended to amend the Company’s articles of association in this regard, the Board has decided in the interests of good corporate governance that all of the directors wishing to continue in office should offer themselves for re-election annually.
Directors are not required under the Company’s articles of association to hold any shares of the Company as a qualification to act as a director, although executive directors participating in long-term incentive plans must comply with the Company’s share ownership guidelines. In accordance with best practice in the UK for corporate governance, compensation awarded to executive directors is decided by a remuneration committee consisting exclusively of non-executive directors.
In addition, as required by The Directors’ Remuneration Report Regulations, the Board has, since 2003, prepared a report to shareholders on the directors’ remuneration which complies with the regulations (see pages 74 to 87). The report is also subject to a shareholder vote.
Rights attaching to the Company’s sharesAt 31 March 2012 the issued share capital of the Company was comprised of 50,000 7% cumulative fixed rate shares of £1.00 each and 49,645,940,182 ordinary shares (excluding treasury shares) of 113⁄7 US cents each.
Dividend rightsHolders of 7% cumulative fixed rate shares are entitled to be paid in respect of each financial year, or other accounting period of the Company, a fixed cumulative preferential dividend of 7% per annum on the nominal value of the fixed rate shares. A fixed cumulative preferential dividend may only be paid out of available distributable profits which the directors have resolved should be distributed. The fixed rate shares do not have any other right to share in the Company’s profits.
Holders of the Company’s ordinary shares may, by ordinary resolution, declare dividends but may not declare dividends in excess of the amount recommended by the directors. The Board of directors may also pay interim dividends. No dividend may be paid other than out of profits available for distribution. Dividends on ordinary shares can be paid to shareholders in whatever currency the directors decide, using an appropriate exchange rate for any currency conversions which are required.
If a dividend has not been claimed for one year after the date of the resolution passed at a general meeting declaring that dividend or the resolution of the directors providing for payment of that dividend, the directors may invest the dividend or use it in some other way for the benefit of the Company until the dividend is claimed. If the dividend remains unclaimed for 12 years after the relevant resolution either declaring that dividend or providing for payment of that dividend, it will be forfeited and belong to the Company.
Voting rightsThe Company’s articles of association provide that voting on substantive resolutions (i.e. any resolution which is not a procedural resolution) at a general meeting shall be decided on a poll. On a poll, each shareholder who is entitled to vote and is present in person or by proxy has one vote for every share held. Procedural resolutions (such as a resolution to adjourn a general meeting or a resolution on the choice of Chairman of a general meeting) shall be decided on a show of hands, where each shareholder who is present at the meeting has one vote regardless of the number of shares held, unless a poll is demanded. In addition, the articles of association allow persons appointed as proxies of shareholders entitled to vote at general meetings to vote on a show of hands, as well as to vote on a poll and attend and speak at general meetings. The articles of association also allow persons appointed as proxies by two or more shareholders entitled to vote at general meetings to vote for and against a resolution on a show of hands.
Under English law two shareholders present in person constitute a quorum for purposes of a general meeting unless a company’s articles of association specify otherwise. The Company’s articles of association do not specify otherwise, except that the shareholders do not need to be present in person and may instead be present by proxy to constitute a quorum.

Business reviewPerform
anceG
overnanceFinancials
Additional inform
ation153Vodafone Group Plc
Annual Report 2012
Under English law shareholders of a public company such as the Company are not permitted to pass resolutions by written consent.
Record holders of the Company’s ADSs are entitled to attend, speak and vote on a poll or a show of hands at any general meeting of the Company’s shareholders by the depositary’s appointment of them as corporate representatives with respect to the underlying ordinary shares represented by their ADSs. Alternatively holders of ADSs are entitled to vote by supplying their voting instructions to the depositary or its nominee who will vote the ordinary shares underlying their ADSs in accordance with their instructions.
Employees are able to vote any shares held under the Vodafone Group Share Incentive Plan and “My ShareBank” (a vested nominee share account) through the respective plan’s trustees.
Holders of the Company’s 7% cumulative fixed rate shares are only entitled to vote on any resolution to vary or abrogate the rights attached to the fixed rate shares. Holders have one vote for every fully paid 7% cumulative fixed rate share.
Liquidation rightsIn the event of the liquidation of the Company, after payment of all liabilities and deductions in accordance with English law, the holders of the Company’s 7% cumulative fixed rate shares would be entitled to a sum equal to the capital paid up on such shares, together with certain dividend payments, in priority to holders of the Company’s ordinary shares. The holders of the fixed rate shares do not have any other right to share in the Company’s surplus assets.
Pre-emptive rights and new issues of sharesUnder section 549 of the Companies Act 2006 directors are, with certain exceptions, unable to allot the Company’s ordinary shares or securities convertible into the Company’s ordinary shares without the authority of the shareholders in a general meeting. In addition, section 561 of the Companies Act 2006 imposes further restrictions on the issue of equity securities (as defined in the Companies Act 2006 which include the Company’s ordinary shares and securities convertible into ordinary shares) which are, or are to be, paid up wholly in cash and not first offered to existing shareholders. The Company’s articles of association allow shareholders to authorise directors for a period specified in the relevant resolution to allot (i) relevant securities generally up to an amount fixed by the shareholders and (ii) equity securities for cash other than in connection with a pre-emptive offer up to an amount specified by the shareholders and free of the pre-emption restriction in section 561. At the AGM in 2011 the amount of relevant securities fixed by shareholders under (i) above and the amount of equity securities specified by shareholders under (ii) above were both in line with corporate governance guidelines. The directors consider it desirable to have the maximum flexibility permitted by corporate governance guidelines to respond to market developments and to enable allotments to take place to finance business opportunities as they arise. In order to retain such maximum flexibility, the directors propose to renew the authorities granted by shareholders in 2011 at this year’s AGM. Further details of such proposals are provided in the 2012 notice of AGM.
Disclosure of interests in the Company’s sharesThere are no provisions in the articles of association whereby persons acquiring, holding or disposing of a certain percentage of the Company’s shares are required to make disclosure of their ownership percentage although such requirements exist under rules derived from the Disclosure and Transparency Rules (‘DTRs’).
The basic disclosure requirement upon a person acquiring or disposing of shares that are admitted to trading on a regulated market and carrying voting rights is an obligation to provide written notification to the Company, including certain details as set out in DTR 5, where the percentage of the person’s voting rights which he holds as shareholder or through his direct or indirect holding of financial instruments (falling within DTR 5.3.1R) reaches or exceeds 3% and reaches, exceeds or falls below each 1% threshold thereafter.
Under section 793 of the Companies Act 2006 the Company may, by notice in writing, require a person that the Company knows or has reasonable cause to believe is, or was during the preceding three years, interested in the Company’s shares to indicate whether or not that is correct and, if that person does or did hold an interest in the Company’s shares, to provide certain information as set out in the Companies Act 2006. DTR 3 deals with the disclosure by persons ‘discharging managerial responsibility’ and their connected persons of the occurrence of all transactions conducted on their account in the shares of the Company. Part 28 of The Companies Act 2006 sets out the statutory functions of the Panel on Takeovers & Mergers (the ‘Panel’). The Panel is responsible for issuing and administering the Code on Takeovers & Mergers which includes disclosure requirements on all parties to a takeover with regard to dealings in the securities of an offeror or offeree company and also on their respective associates during the course of an offer period.
General meetings and noticesSubject to the articles of association, annual general meetings are held at such times and place as determined by the directors of the Company. The directors may also, when they think fit, convene other general meetings of the Company. General meetings may also be convened on requisition as provided by the Companies Act 2006.
An annual general meeting needs to be called by not less than 21 days’ notice in writing. Subject to obtaining shareholder approval on an annual basis, the Company may call other general meetings on 14 days’ notice. The directors may determine that persons entitled to receive notices of meetings are those persons entered on the register at the close of business on a day determined by the directors but not later than 21 days before the date the relevant notice is sent. The notice may also specify the record date, the time of which shall be determined in accordance with the articles of association and the Companies Act 2006.
Shareholders must provide the Company with an address or (so far as the Companies Act 2006 allows) an electronic address or fax number in the United Kingdom in order to be entitled to receive notices of shareholders’ meetings and other notices and documents. In certain circumstances the Company may give notices to shareholders by publication on the Company’s website and advertisement in newspapers in the United Kingdom. Holders of the Company’s ADSs are entitled to receive notices under the terms of the deposit agreement relating to the ADSs.
Under section 336 of the Companies Act 2006 the annual general meeting of shareholders must be held each calendar year and within six months of the Company’s year end.

154Vodafone Group Plc Annual Report 2012
Shareholder information (continued)
Electronic communicationsThe Company has previously passed a resolution allowing it to communicate all shareholder information by electronic means, including making such information available on the Company’s website. Those shareholders who have positively elected for website communication (or are deemed to have consented to receive electronic communication in accordance with the Companies Act 2006) will receive written notification whenever shareholder documentation is made available on the website.
Variation of rightsIf at any time the Company’s share capital is divided into different classes of shares, the rights attached to any class may be varied, subject to the provisions of the Companies Act 2006, either with the consent in writing of the holders of three quarters in nominal value of the shares of that class or at a separate meeting of the holders of the shares of that class.
At every such separate meeting all of the provisions of the articles of association relating to proceedings at a general meeting apply, except that (i) the quorum is to be the number of persons (which must be at least two) who hold or represent by proxy not less than one third in nominal value of the issued shares of the class or, if such quorum is not present on an adjourned meeting, one person who holds shares of the class regardless of the number of shares he holds, (ii) any person present in person or by proxy may demand a poll and (iii) each shareholder will have one vote per share held in that particular class in the event a poll is taken. Class rights are deemed not to have been varied by the creation or issue of new shares ranking equally with or subsequent to that class of shares in sharing in profits or assets of the Company or by a redemption or repurchase of the shares by the Company.
Limitations on voting and shareholdingAs far as the Company is aware there are no limitations imposed on the transfer, holding or voting of the Company’s ordinary shares other than those limitations that would generally apply to all of the shareholders. No shareholder has any securities carrying special rights with regard to control of the Company.
Documents on displayThe Company is subject to the information requirements of the Exchange Act applicable to foreign private issuers. In accordance with these requirements the Company files its annual report on Form 20-F and other related documents with the SEC. These documents may be inspected at the SEC’s public reference rooms located at 100 F Street, NE Washington, DC 20549. Information on the operation of the public reference room can be obtained in the US by calling the SEC on +1-800-SEC-0330. In addition, some of the Company’s SEC filings, including all those filed on or after 4 November 2002, are available on the SEC’s website (www.sec.gov). Shareholders can also obtain copies of the Company’s articles of association from our website at www.vodafone.com/governance or from the Company’s registered office.
Material contractsAt the date of this annual report the Group is not party to any contracts that are considered material to the Group’s results or operations except for its US$4.2 billion and €4.2 billion credit facilities which are discussed under “Financial position and resources” on page 58.
Exchange controlsThere are no UK government laws, decrees or regulations that restrict or affect the export or import of capital, including but not limited to, foreign exchange controls on remittance of dividends on the ordinary shares or on the conduct of the Group’s operations.
TaxationAs this is a complex area investors should consult their own tax advisor regarding the US federal, state and local, the UK and other tax consequences of owning and disposing of shares and ADSs in their particular circumstances.
This section describes, primarily for a US holder (as defined below), in general terms, the principal US federal income tax and UK tax consequences of owning or disposing of shares or ADSs in the Company held as capital assets (for US and UK tax purposes). This section does not, however, cover the tax consequences for members of certain classes of holders subject to special rules including officers of the Company, employees and holders that, directly or indirectly, hold 10% or more of the Company’s voting stock. A US holder is a beneficial owner of shares or ADSs that is for US federal income tax purposes:
aa a citizen or resident of the US;
aa a US domestic corporation;
aa an estate, the income of which is subject to US federal income tax regardless of its source; or
aa a trust, if a US court can exercise primary supervision over the trust’s administration and one or more US persons are authorised to control all substantial decisions of the trust.
If a partnership holds the shares or ADSs, the US federal income tax treatment of a partner will generally depend on the status of the partner and the tax treatment of the partnership. A partner in a partnership holding the shares or ADSs should consult its tax advisor with regard to the US federal income tax treatment of an investment in the shares or ADSs.
This section is based on the US Internal Revenue Code of 1986, as amended, its legislative history, existing and proposed regulations thereunder, published rulings and court decisions, and on the tax laws of the United Kingdom and the Double Taxation Convention between the United States and the United Kingdom (the ‘treaty’), all as currently in effect. These laws are subject to change, possibly on a retroactive basis.
This section is further based in part upon the representations of the depositary and assumes that each obligation in the deposit agreement and any related agreement will be performed in accordance with its terms.
For purposes of the treaty and the US-UK double taxation convention relating to estate and gift taxes (the ‘Estate Tax Convention’), and for US federal income tax and UK tax purposes, this section is based on the assumption that a holder of ADRs evidencing ADSs will be treated as the owner of the shares in the Company represented by those ADSs. Investors should note that a recent ruling by the first-tier tax tribunal in the UK has cast doubt on this view, but HMRC have stated that they will continue to apply their longstanding practice of regarding the holder of such ADRs as holding the beneficial interest in the underlying shares. Investors should note, however, that this is an area of some uncertainty that may be subject to further developments in the future. Generally exchanges of shares for ADRs and ADRs for shares will not be subject to US federal income tax or to UK tax other than stamp duty or stamp duty reserve tax (see the section on these taxes on page 156).

Business reviewPerform
anceG
overnanceFinancials
Additional inform
ation155Vodafone Group Plc
Annual Report 2012
Taxation of dividendsUK taxationUnder current UK tax law no withholding tax will be deducted from the dividends we pay. Shareholders who are within the charge to UK corporation tax will be subject to corporation tax on the dividends we pay unless the dividends fall within an exempt class and certain other conditions are met. It is expected that the dividends we pay would generally be exempt.
A shareholder in the Company who is an individual resident for UK tax purposes in the United Kingdom is entitled, in calculating their liability to UK income tax, to a tax credit on cash dividends we pay on our shares or ADSs and the tax credit is equal to one-ninth of the cash dividend.
US federal income taxationSubject to the PFIC rules described below, a US holder is subject to US federal income taxation on the gross amount of any dividend we pay out of our current or accumulated earnings and profits (as determined for US federal income tax purposes). Dividends paid to a non-corporate US holder in tax years beginning before 1 January 2013 that constitute qualified dividend income will be taxable to the holder at a maximum tax rate of 15% provided that the ordinary shares or ADSs are held for more than 60 days during the 121 day period beginning 60 days before the ex-dividend date and the holder meets other holding period requirements. Dividends paid by us with respect to the shares or ADSs will generally be qualified dividend income. A US holder is not subject to a UK withholding tax. The US holder includes in gross income for US federal income tax purposes only the amount of the dividend actually received from us and the receipt of a dividend does not entitle the US holder to a foreign tax credit.
Dividends must be included in income when the US holder, in the case of shares, or the depositary, in the case of ADSs, actually or constructively receives the dividend and will not be eligible for the dividends-received deduction generally allowed to US corporations in respect of dividends received from other US corporations. Dividends will be income from sources outside the United States. For the purpose of the foreign tax credit limitation, foreign source income is classified in one or two baskets and the credit for foreign taxes on income in any basket is limited to US federal income tax allocable to that income. Generally the dividends we pay will constitute foreign source income in the passive income basket.
In the case of shares, the amount of the dividend distribution to be included in income will be the US dollar value of the pound sterling payments made determined at the spot pound sterling/US dollar rate on the date of the dividend distribution regardless of whether the payment is in fact converted into US dollars. Generally any gain or loss resulting from currency exchange fluctuations during the period from the date the dividend payment is to be included in income to the date the payment is converted into US dollars will be treated as ordinary income or loss. Generally the gain or loss will be income or loss from sources within the United States for foreign tax credit limitation purposes.
Taxation of capital gainsUK taxationA US holder may be liable for both UK and US tax in respect of a gain on the disposal of our shares or ADSs if the US holder is:
aa a citizen of the United States resident or ordinarily resident for UK tax purposes in the United Kingdom;
aa a citizen of the United States who has been resident or ordinarily resident for UK tax purposes in the United Kingdom, ceased to be so resident or ordinarily resident for a period of less than five years of assessment and who disposed of the shares or ADSs during that period (a ‘temporary non-resident’), unless the shares or ADSs were also acquired during that period, such liability arising on that individual’s return to the UK;
aa a US domestic corporation resident in the United Kingdom by reason of being centrally managed and controlled in the United Kingdom; or
aa a citizen of the United States or a US domestic corporation that carries on a trade, profession or vocation in the United Kingdom through a branch or agency or, in the case of US domestic companies, through a permanent establishment and that has used the shares or ADSs for the purposes of such trade, profession or vocation or has used, held or acquired the shares or ADSs for the purposes of such branch or agency or permanent establishment.
Under the treaty capital gains on dispositions of the shares or ADSs are generally subject to tax only in the country of residence of the relevant holder as determined under both the laws of the United Kingdom and the United States and as required by the terms of the treaty. However, individuals who are residents of either the United Kingdom or the United States and who have been residents of the other jurisdiction (the US or the UK, as the case may be) at any time during the six years immediately preceding the relevant disposal of shares or ADSs may be subject to tax with respect to capital gains arising from the dispositions of the shares or ADSs not only in the country of which the holder is resident at the time of the disposition but also in that other country (although, in respect of UK taxation, generally only to the extent that such an individual comprises a temporary non-resident).
US federal income taxationSubject to the PFIC rules described below a US holder that sells or otherwise disposes of our shares or ADSs will recognise a capital gain or loss for US federal income tax purposes equal to the difference between the US dollar value of the amount realised and the holder’s tax basis, determined in US dollars, in the shares or ADSs. Generally a capital gain of a non-corporate US holder that is recognised in tax years beginning before 1 January 2013 is taxed at a maximum rate of 15% provided the holder has a holding period of more than one year. The gain or loss will generally be income or loss from sources within the United States for foreign tax credit limitation purposes. The deductibility of losses is subject to limitations.

156Vodafone Group Plc Annual Report 2012
Additional tax considerationsUK inheritance taxAn individual who is domiciled in the United States (for the purposes of the Estate Tax Convention) and is not a UK national will not be subject to UK inheritance tax in respect of our shares or ADSs on the individual’s death or on a transfer of the shares or ADSs during the individual’s lifetime, provided that any applicable US federal gift or estate tax is paid, unless the shares or ADSs are part of the business property of a UK permanent establishment or pertain to a UK fixed base used for the performance of independent personal services. Where the shares or ADSs have been placed in trust by a settlor they may be subject to UK inheritance tax unless, when the trust was created, the settlor was domiciled in the United States and was not a UK national. Where the shares or ADSs are subject to both UK inheritance tax and to US federal gift or estate tax, the estate tax convention generally provides a credit against US federal tax liabilities for UK inheritance tax paid.
UK stamp duty and stamp duty reserve taxStamp duty will, subject to certain exceptions, be payable on any instrument transferring our shares to the custodian of the depositary at the rate of 1.5% on the amount or value of the consideration if on sale or on the value of such shares if not on sale. Stamp duty reserve tax (‘SDRT’), at the rate of 1.5% of the price or value of the shares, could also be payable in these circumstances and on issue to such a person but no SDRT will be payable if stamp duty equal to such SDRT liability is paid.
A ruling by the European Court of Justice has determined that the 1.5% SDRT charges on issue of shares to a clearance service is contrary to EU law. As a result of that ruling, HMRC indicated that where new shares are first issued to a clearance service or to a depositary within the European Union, the 1.5% SDRT charge will not be levied. Subsequently, a recent decision by the first-tier tax tribunal in the UK extended this ruling to the issue of shares (or, where it is integral to the raising of new capital, the transfer of shares) to depositary receipts systems wherever located. HMRC have stated that they will not seek to appeal this decision and, as such, will no longer seek to impose 1.5% SDRT on the issue of shares (or, where it is integral to the raising of new capital, the transfer of shares) to a clearance service or to a depositary, wherever located. Investors should, however, be aware that this area may be subject to further developments in the future.
No stamp duty will be payable on any transfer of our ADSs provided that the ADSs and any separate instrument of transfer are executed and retained at all times outside the United Kingdom. A transfer of our shares in registered form will attract ad valorem stamp duty generally at the rate of 0.5% of the purchase price of the shares. There is no charge to ad valorem stamp duty on gifts.
SDRT is generally payable on an unconditional agreement to transfer our shares in registered form at 0.5% of the amount or value of the consideration for the transfer, but is repayable if, within six years of the date of the agreement, an instrument transferring the shares is executed or, if the SDRT has not been paid, the liability to pay the tax (but not necessarily interest and penalties) would be cancelled. However, an agreement to transfer our ADSs will not give rise to SDRT.
PFIC rulesWe do not believe that our shares or ADSs will be treated as stock of a passive foreign investment company (‘PFIC’) for US federal income tax purposes. This conclusion is a factual determination that is made annually and thus is subject to change. If we are treated as a PFIC, any gain realised on the sale or other disposition of the shares or ADSs would in general not be treated as capital gain unless a US holder elects to be taxed annually on a mark-to-market basis with respect to the shares or ADSs. Otherwise a US holder would be treated as if he or she has realised such gain and certain ‘excess distributions’ rateably over the holding period for the shares or ADSs and would be taxed at the highest tax rate in effect for each such year to which the gain was allocated. An interest charge in respect of the tax attributable to each such year would also apply. Dividends received from us would not be eligible for the preferential tax rate applicable to qualified dividend income for certain non-corporate holders.
Backup withholding and information reportingPayments of dividends and other proceeds to a US holder with respect to shares or ADSs, by a US paying agent or other US intermediary will be reported to the Internal Revenue Service (‘IRS’) and to the US holder as may be required under applicable regulations. Backup withholding may apply to these payments if the US holder fails to provide an accurate taxpayer identification number or certification of exempt status or fails to report all interest and dividends required to be shown on its US federal income tax returns. Certain US holders are not subject to backup withholding. US holders should consult their tax advisers as to their qualification for exemption from backup withholding and the procedure for obtaining an exemption.
Foreign financial asset reportingRecently enacted legislation imposes new reporting requirements on US holders with respect to the holding of certain foreign financial assets, including equity of foreign entities, if the aggregate value of all of these assets exceeds US$50,000. The shares and ADSs are expected to constitute foreign financial assets subject to these requirements unless the shares and ADSs are held in an account at a financial institution (in which case, the account may be reportable if maintained by a foreign financial institution). US holders should consult their tax advisors regarding the application of this legislation.
.
Shareholder information (continued)

Business reviewPerform
anceG
overnanceFinancials
Additional inform
ation157Vodafone Group Plc
Annual Report 2012
The Company was incorporated under English law in 1984 as Racal Strategic Radio Limited (registered number 1833679). After various name changes, 20% of Racal Telecom Plc share capital was offered to the public in October 1988. The Company was fully demerged from Racal Electronics Plc and became an independent company in September 1991, at which time it changed its name to Vodafone Group Plc.
Since then we have entered into various transactions which enhanced our international presence. The most significant of these transactions were as follows:
aa the merger with AirTouch Communications, Inc. which completed on 30 June 1999. The Company changed its name to Vodafone AirTouch Plc in June 1999 but then reverted to its former name, Vodafone Group Plc, on 28 July 2000;
aa the acquisition of Mannesmann AG which completed on 12 April 2000. Through this transaction we acquired businesses in Germany and Italy and increased our indirect holding in SFR;
aa through a series of business transactions between 1999 and 2004 we acquired a 97.7% stake in Vodafone Japan. This was then disposed of on 27 April 2006;
aa on 8 May 2007 we acquired companies with controlling interests in Vodafone India Limited (‘VIL’), formerly Vodafone Essar Limited, for US$10.9 billion (£5.5 billion); and
aa on 20 April 2009 we acquired an additional 15.0% stake in Vodacom for cash consideration of ZAR 20.6 billion (£1.6 billion). On 18 May 2009 Vodacom became a subsidiary.
Other transactions that have occurred since 31 March 2009 are as follows:
10 May 2009 – Qatar: Vodafone Qatar completed a public offering of 40.0% of its authorised share capital raising QAR 3.4 billion (£0.6 billion). The shares were listed on the Qatar Exchange on 22 July 2009. Qatar launched full services on its network on 7 July 2009.
9 June 2009 – Australia: Vodafone Australia merged with Hutchison 3G Australia to form a 50:50 joint venture, Vodafone Hutchison Australia Pty Limited.
10 September 2010 – China Mobile Limited: We sold our entire 3.2% interest in China Mobile Limited for cash consideration of £4.3 billion.
30/31 March 2011 – India: The Essar Group exercised its underwritten put option over 22.0% of VIL, following which we exercised our call option over the remaining 11.0% of VIL owned by the Essar Group. The total consideration due under these two options is US$5 billion (£3.1 billion).
16 June 2011 – SFR: We sold our entire 44% interest in SFR to Vivendi for a cash consideration of €7.75 billion (£6.8 billion) and received a final dividend from SFR of €200 million (£176 million).
1 June/1 July 2011 – India: We acquired an additional 22% stake in VIL from the Essar Group for a cash consideration of US$4.2 billion (£2.6 billion) including withholding tax.
18 August 2011 – India: Piramal Healthcare Limited (‘Piramal’) purchased 5.5% of VIL from the Essar Group for a cash consideration of INR 28.6 billion (£368 million).
9 November 2011 – Poland: We sold our entire 24.4% interest in Polkomtel in Poland for cash consideration of approximately €920 million (£784 million) before tax and transaction costs.
8 February 2012 – India: Piramal purchased a further 5.5% of VIL from the Essar Group for a cash consideration of approximately INR 30.1 billion (£399 million) taking Piramal’s total shareholding in VIL to approximately 11%.
History and development

158Vodafone Group Plc Annual Report 2012
Our operating companies are generally subject to regulation governing the operation of their business activities. Such regulation typically takes the form of industry specific law and regulation covering telecommunications services and general competition (antitrust) law applicable to all activities.
The following section describes the regulatory frameworks and the key regulatory developments at the global and regional level and in selected countries in which we have significant interests. Many of the regulatory developments reported in the following section involve ongoing proceedings or consideration of potential proceedings that have not reached a conclusion. Accordingly, we are unable to attach a specific level of financial risk to our performance from such matters.
European Union (‘EU’)The European Commission (the ‘Commission’) is reviewing the future scope and nature of universal service provision in the EU. Current obligations generally involve the provision of a fixed connection allowing access to voice and simple data services. In some countries those operators responsible for providing universal services receive compensation from a fund to which we and others are required to make a financial contribution. The Commission has indicated that it would be reluctant to extend the scope of these funds to include very high speed broadband deployment and that additional financing for such projects should instead be sought from general taxation. The Commission has also published a broadband strategy which proposes that the European Investment Bank offer support for broadband infrastructure projects which fulfil certain criteria and proposes to use €9 billion (£7.5 billion) of the “Connecting Europe Facility” to fund broadband networks and digital services from 2014.
RoamingThe current roaming regulation (the ‘roaming regulation’) entered into force in July 2009 and requires mobile operators to supply voice and text roaming services under retail price caps. Wholesale price caps also apply to voice, text and data roaming services. In March 2012 the Commission, European Parliament and Council provisionally agreed a new roaming regulation which will replace the current roaming regulation upon its expiry in July 2012. Final adoption is expected by June 2012. The new roaming regulation proposes to retain retail price caps for voice and text roaming services and to introduce a new retail cap for data roaming services. These caps will be set at 29 eurocents per minute for retail outbound voice calls, 9 eurocents per retail text and 70 eurocents per megabyte for retail data from 1 July 2012. These will reduce annually until July 2014 when outbound retail voice calls will be set at 19 eurocents per minute, retail texts at 6 eurocents per text and retail data at 20 eurocents per megabyte. The caps will apply until at least 2016 but would be removed thereafter if competition were deemed by the Commission to be sufficiently effective. The Commission also proposes to retain wholesale price caps for voice, text and data roaming services which will reduce annually until July 2014, apply until at least 2018 and could be removed thereafter. The new roaming regulation will expire in 2022.
The Commission also proposed a number of measures which are intended to increase competition in the retail market for roaming (and thereby facilitate the withdrawal of price caps). These include a requirement that users be able, from July 2014, to purchase roaming services from a provider other than their current domestic provider and to retain the same phone number when roaming.
Call terminationNational regulators are required to take utmost account of the Commission’s existing recommendation on the regulation of fixed and mobile termination rates published in 2009. This recommendation requires mobile termination rates (‘MTRs’) to be set using a long run incremental cost methodology by December 2012.
At 31 March 2012 the MTRs effective for our subsidiaries within the EU, which differs from those in our Europe region, ranged from 2.70 eurocents per minute (2.25 pence) to 5.30 eurocents per minute (4.42 pence), at the relevant 31 March 2012 foreign exchange rates.
Fixed network regulationIn October 2011 the Commission consulted on proposals for guidelines to national regulators on the setting of access prices for fixed networks, recognising that prices for copper services will influence incentives for investment in, and demand for, fibre based networks. Further details are expected during 2012.
SpectrumIn February 2012 the Commission adopted its radio spectrum policy programme (‘RSPP’), following agreement with the European Parliament and Council. The decision, which came into force in March 2012, requires Member States to make 800 MHz (‘digital dividend’) spectrum available for mobile use by 1 January 2013 and the Commission to report, by January 2015, on the need for further spectrum for mobile use.
In February 2012 the World Radiocommunications Conference agreed to consider the allocation of additional frequency bands for future mobile use at the next conference in 2015 and in particular the 694–790 MHz band in Europe and Africa.
Net neutralityIn December 2011 national regulators sent questionnaires to European operators seeking details of traffic management practices, including blocking of services or throttling of bandwidth. Our companies responded in January 2012 and the results are expected to inform a review of network management activities by the Commission during 2012.
Europe regionGermanyOur current MTR was reduced in December 2010 to 3.36 eurocents per minute, effective until 30 November 2012.
In December 2011 the national regulator enquired about the demand for 900/1800 MHz spectrum beyond 2016 when current licences expire. It is expected that the national regulator will ask for formal applications later in 2012.
In February 2012 the German Parliament adopted a new telecommunications law to implement amendments to the European regulatory framework, including certain new measures to protect consumers.
ItalyIn September 2011 we acquired 2x10 MHz of 800 MHz spectrum, 2x5 MHz of 1800 MHz spectrum and 2x15 MHz of 2.6 GHz spectrum for a cost of €1.26 billion (£1.1 billion). The licences are valid until 2030.
In November 2011 the national regulator adopted a decision to cut our MTRs to 0.98 eurocents by July 2013, which we are appealing.
In January 2012 the national regulator issued the final decision concerning obligations to be imposed on Telecom Italia in relation to its fibre network, placing an obligation on Telecom Italia to give unbundled access, where technically feasible, and “end to end” access services.
In February 2012 the national regulator issued a questionnaire to operators on the SMS termination market.
SpainIn February 2012 the national regulator published proposals to reduce our MTRs to 1.09 eurocents per minute by January 2014. The Commission expressed serious doubts about the proposals and on 30 March 2012 the national regulator withdrew its proposals and instead confirmed that MTRs will reduce to 1.09 eurocents by 1 July 2013.
The national regulator has determined that our contributions to universal service costs should be €17 million (£14.2 million) and €47 million (£39.2 million) for 2008 and 2009 respectively. We are appealing both decisions.
In July 2011 we acquired 2x10 MHz of 800 MHz spectrum and 2x20 MHz of 2.6 GHz spectrum for a cost of €517 million (£431 million).
Regulation
Business reviewPerform
anceG
overnanceFinancials
Additional inform
ation159Vodafone Group Plc
Annual Report 2012
The licences will expire in 2030. Our 900 MHz licence has been modified to allow refarming and we have the option to extend it until 2030. The licence currently expires in 2020. In November 2011 we acquired 2x10 MHz of 2.6 GHz TDD spectrum at a cost of €10.4 million (£8.7 million).
In December 2011 the National Competition Authority issued a draft decision which proposes that Vodafone, Telefonica and Orange have abused a collective dominant position in the provision of wholesale origination of SMS and MMS and abused an individual dominant position in the provision of SMS and MMS termination services in setting excessive prices. The Council of the National Competition Authority must now take the final decision and consider the imposition of fines.
In January 2012 the National Competition Authority informed Vodafone, Orange and Telefonica that they were investigating claims from BT Spain that the operators had engaged in an unlawful price squeeze in the market for fixed and mobile services for business users. We have since received a questionnaire, to which we have responded.
In February 2012 the government announced its intention to merge the national telecommunications regulator into a new regulatory body called the National Markets and Competition Commission.
United KingdomOur regulated average MTR at 31 March 2012 was 3.02 pence per minute. The national regulator proposed a glidepath with annual adjustments that would see a reduction to 0.69 pence per minute (plus inflation adjustment) by 1 April 2014. Following appeals of this decision, the rate of 0.69 pence per minute (plus inflation adjustment) will have to be reached one year earlier (by 1 April 2013). All 2G licences have been modified to allow refarming to 3G. All 3G licences will also be made indefinite rather than expiring in 2021.
The national regulator has consulted on the release of 800 MHz and 2.6 GHz spectrum, including proposals for the auction design. The auction is expected to take place in the first quarter of 2013.
Other EuropeAlbaniaAMC (Deutsche Telekom) launched its 3G services in the market in January 2012. The national regulator launched a public tender in February 2012 to award the third 3G licence in the market but the minimum bid price set by the Telecoms Minister was not met and the tender failed.
Czech RepublicIn March 2012 the government released a consultation on the auction of 800 MHz, 1800 MHz, and 2.6 GHz spectrum, which is expected to take place in November 2012. The government proposes to reserve a portion of 1800 MHz spectrum for a new entrant and to require licensees to provide access for MVNOs.
The national regulator is currently reviewing the market for mobile origination and access to determine whether mobile operators should be obliged to provide regulated access to MVNOs.
GreeceIn November 2011 we acquired 2x15 MHz of 900 MHz spectrum and 2x10 MHz of 1800 MHz spectrum for a cost of €169 million (£142 million). The licences are valid until 2026.
HungaryIn October 2010 the Hungarian Parliament adopted a law which imposes a significant additional tax burden on the telecommunications, retail and energy sectors. The law came into force in December 2010 and will apply until at least January 2013. We paid HUF 7,119,714,000 (£23 million) in relation to the 2011 financial year. In March 2012 the Commission announced that it would commence infringement proceedings in the European Court of Justice on the basis that the tax is unlawful.
We acquired an additional 2x2 MHz of 900 MHz for HUF 15.7 billion (£44 million) spectrum through an auction in January 2012. We and other operators are, however, challenging the award of certain spectrum to a new entrant during that procedure.
At the end of April 2012 the government proposed the introduction of a new end-user tax on both mobile and fixed phone traffic of HUF 2.0 per minute and per SMS/MMS. The new tax would generate tax revenue of HUF 52 billion (£147.3 million) a year, which is close to 10% of the relevant service revenue of the whole market, and would be in force from 1 July 2012.
IrelandThe national regulator is planning to auction all spectrum in the 900/1800 MHz spectrum bands at the same time as the 800 MHz band in mid 2012, with the 800 MHz spectrum awarded under the auction available in 2013. In the meantime, Vodafone’s and O2’s 900 MHz licences will be renewed until the commencement of the new licences in 2013.
NetherlandsOur MTR reduced to 4.20 eurocents per minute in January 2011 following a proposal by the national regulator to reduce it to 1.2 eurocents per minute by September 2012. Following an appeal, the court directed that the MTR should instead reduce to 2.4 eurocents by September 2012. The Commission has suggested that it may challenge this decision, but we do not believe it has the legal grounds to do so.
The government has announced plans to auction 800 MHz, 900 MHz, 1800 MHz, 2.1 GHz and 2.6 GHz spectrum in October 2012. The government will reserve 2x5 MHz in the 900 MHz band for new entrants, in addition to 2x10 MHz in the 800 MHz band.
In May 2012 the Dutch Parliament adopted amendments to the Telecommunications Act which are intended to limit the circumstances in which operators are able to engage in network management and to prevent operators from varying the charges to end users by reference to the type of internet service or application they wish to use. The cumulative effect of these measures is to prevent operators from blocking or otherwise charging specifically for voice over internet protocol (‘VOIP’) and other internet services. These measures are expected to apply from January 2013.
PortugalThe national regulator will reduce MTRs to 1.27 eurocents per minute as from 31 December 2012.
In November 2011 we acquired 2x10 MHz of 800 MHz spectrum, 2x5 MHz of 900 MHz spectrum, 2x14 MHz of 1800 MHz spectrum and 2x20 MHz of 2.6 GHz spectrum for a cost of €146 million (£123 million). The licences are valid until 2026.
RomaniaThe government agreed to renew our 900/1800 MHz licences for a further period of one year (until December 2012) for a fee of €6.4 million (£5.4 million). In the meantime, the government plans to offer the licences for a further 15 year term during an auction in mid-2012 which will also include the 800 MHz and 2.6 GHz bands.
In February 2011 Vodafone was fined €28 million (£23.3 million) by the competition authority in relation to an alleged refusal to interconnect with another party in 2006. We appealed this decision in April 2011. Other enquiries remain ongoing. In April 2011 we were advised that a new proceeding in relation to MTRs and on-net pricing has commenced and have since received a questionnaire, to which we intend to respond. A competition investigation regarding prepaid distribution is in the final stage of being closed without any fine.

160Vodafone Group Plc Annual Report 2012
TurkeyOur MTRs are currently 0.0323 Lira per minute.
In July 2011 the government announced that rural villages with populations of less than 500 which do not have GSM coverage will be provided with mobile services funded by the universal service fund. Following an agreement with the Ministry of Transport, Maritime Affairs and Communications in January 2012, 687 such villages are to be covered by Vodafone Turkey.
In August 2011 the national regulator indicated that rates for the termination of calls originated from abroad will no longer be subject to regulation.
In September 2011 the national regulator proposed enabling refarming in the 900 MHz and 1800 MHz bands and assigning additional 900MHz spectrum to Avea and 1800 MHz spectrum to Vodafone and Turkcell. Further details are expected shortly.
In October 2011 the Council of Ministers increased the taxes on handsets from 20% to 25%.
Africa, Middle East and Asia Pacific regionIndiaLitigation remains pending in the Telecommunications Dispute Settlement Appellate Tribunal (‘TDSAT’) and Supreme Court in relation to a number of significant regulatory issues including MTRs, spectrum usage charges, and 3G intra-circle roaming (‘ICR’).
In February 2012 the Union Minister of Communications and IT announced some aspects of the spectrum management and licensing framework, including a reduction of licence fees to a uniform fee of 8%, but deferred other aspects including possible one-off fees for spectrum above 6.2 MHz.
The Supreme Court of India issued a decision on 2 February 2012 cancelling the 122 new licences issued in 2008 with effect from June 2012 and directing the government to re-allocate the spectrum by auction. None of Vodafone’s licences were affected by this decision and Vodafone is in active dialogue with the government with a view to acquiring additional spectrum through auction. The implications of these developments will be considered alongside the issues announced in February 2012 by the Union Minister of Communications and IT, the national regulator’s recommendations of May 2010 and April 2012, and the Cabinet before a decision is taken.
New regulations came into force during the 2012 financial year in relation to the activation of value added services, unsolicited commercial communications, and distribution of prepaid vouchers, requiring some changes to activation procedures, capping of high volume SMS users and content of vouchers.
The current MTR is maintained at INR 0.2.
South AfricaThe Ministry of Communications and the national regulator have decided to postpone the process of licensing “high demand spectrum” (2.6 GHz and 800 MHz) while the Ministry reviews its long-term policy approach to the information and communications technology (‘ICT’) sector. The Minister initiated a policy review process in April 2012 at the National ICT Colloquium. This process is expected to be completed in 2014.
The National Consumer Commission (‘NCC’), the regulatory authority tasked with enforcing the Consumer Protection Act (‘CPA’), has instituted investigations into the communications sector including consumer complaints relating to quality of service, international roaming charges, airtime and data carry-over rules, and contract terms and conditions. The NCC issued a compliance notice against Vodacom in August 2011 in relation to fixed-term consumer agreements which the NCC alleges do not comply with the CPA. Vodacom is challenging the legal validity of the compliance notice in South Africa’s National Consumer Tribunal.
MTRs are currently ZAR 0.56 per minute (peak) and ZAR 0.52 (off peak) and, under a continuing glide path, are due to decrease to ZAR 0.40 (flat rate) in April 2013.
Other Africa, Middle East and Asia PacificAustraliaVodafone Hutchison Australia has agreed to renew its spectrum licences in the 850 MHz and 1800 MHz bands, from their expiry in 2013, for an additional period of 15 years for a fee of approximately AUS$590 million (£400 million). The government is now preparing to auction 700 MHz and 2.6 GHz spectrum in late 2012 or early 2013.
The national regulator cut MTRs to AUS$0.06 (4.05 pence) on 1 January 2012. A glide path has been set with the MTR to fall to AUS$0.036 (2.43 pence) by 1 January 2014.
EgyptThe national regulator set MTRs at 65% of each operator’s average on-net retail revenue per minute in September 2008 and issued a similar decree in 2010. Mobinil obtained interim relief against this regulation and a final order is awaited. Vodafone Egypt has filed a similar case in the Administrative Court challenging the regulator’s decisions regarding the applicable MTRs as well as the calculation formula. In December 2011 the Commisioner’s Committee of the Administrative Court issued a non-binding opinion recommending the annulment of the regulator’s decision. A final decision has not yet been made. A series of arbitrations concerning interconnection payments have been launched by Mobinil and Telecom Egypt, leading to a claim by Telecom Egypt against Vodafone Egypt relating to historic termination charges.
New ZealandVodafone and Telecom New Zealand have been selected to share a NZ$285 million (£146 million) government grant to roll-out and operate an open access fibre and wireless network in rural areas.
The national regulator has adopted a regulation which reduces MTRs from around 18 cents to 7.5 cents in May 2011, with further reductions to 4.0 cents from April 2012. SMS termination rates are regulated at 0.06 cents per SMS.
The government is now preparing to auction 700 MHz spectrum in late 2012 or early 2013.
The governments of New Zealand and Australia have jointly appointed consultants to investigate the costs of providing trans-tasman international roaming services as part of an ongoing enquiry.
Regulation (continued)
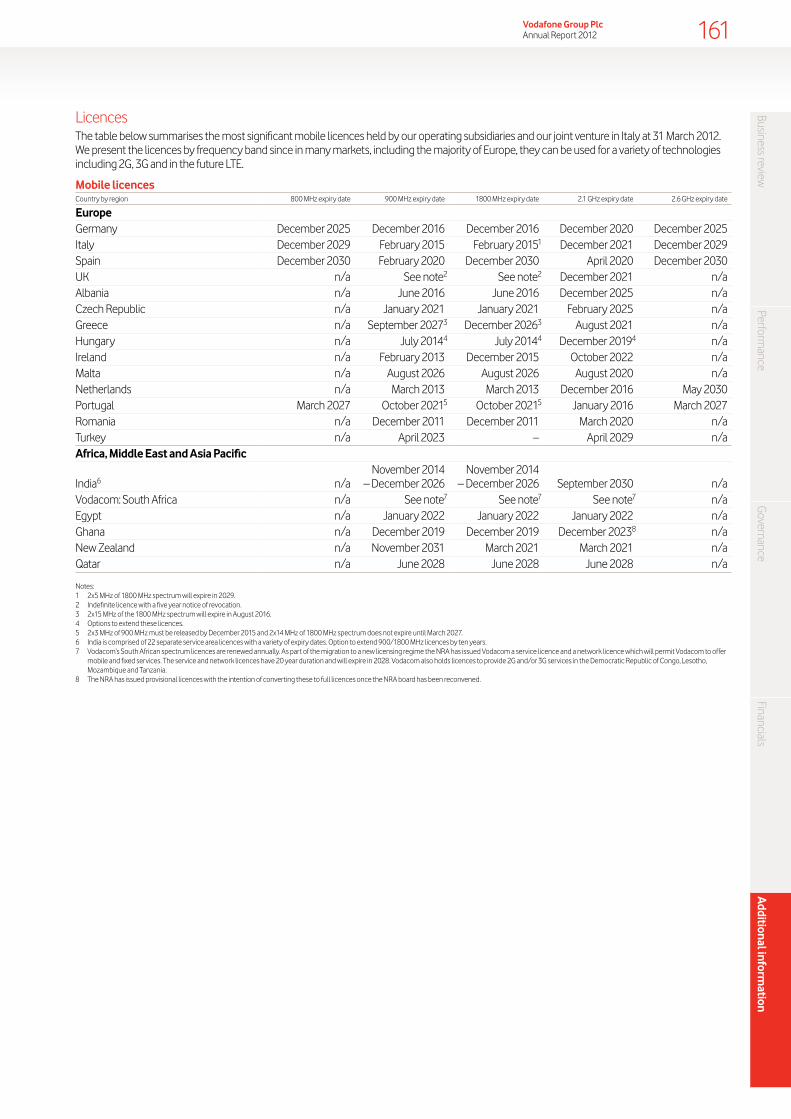
Business reviewPerform
anceG
overnanceFinancials
Additional inform
ation161Vodafone Group Plc
Annual Report 2012
LicencesThe table below summarises the most significant mobile licences held by our operating subsidiaries and our joint venture in Italy at 31 March 2012. We present the licences by frequency band since in many markets, including the majority of Europe, they can be used for a variety of technologies including 2G, 3G and in the future LTE.
Mobile licencesCountry by region 800 MHz expiry date 900 MHz expiry date 1800 MHz expiry date 2.1 GHz expiry date 2.6 GHz expiry date
EuropeGermany December 2025 December 2016 December 2016 December 2020 December 2025Italy December 2029 February 2015 February 20151 December 2021 December 2029Spain December 2030 February 2020 December 2030 April 2020 December 2030UK n/a See note2 See note2 December 2021 n/aAlbania n/a June 2016 June 2016 December 2025 n/aCzech Republic n/a January 2021 January 2021 February 2025 n/aGreece n/a September 20273 December 20263 August 2021 n/aHungary n/a July 20144 July 20144 December 20194 n/aIreland n/a February 2013 December 2015 October 2022 n/aMalta n/a August 2026 August 2026 August 2020 n/aNetherlands n/a March 2013 March 2013 December 2016 May 2030Portugal March 2027 October 20215 October 20215 January 2016 March 2027Romania n/a December 2011 December 2011 March 2020 n/aTurkey n/a April 2023 – April 2029 n/aAfrica, Middle East and Asia Pacific
India6 n/aNovember 2014
– December 2026November 2014
– December 2026 September 2030 n/aVodacom: South Africa n/a See note7 See note7 See note7 n/aEgypt n/a January 2022 January 2022 January 2022 n/aGhana n/a December 2019 December 2019 December 20238 n/aNew Zealand n/a November 2031 March 2021 March 2021 n/aQatar n/a June 2028 June 2028 June 2028 n/a
Notes:1 2x5 MHz of 1800 MHz spectrum will expire in 2029.2 Indefinite licence with a five year notice of revocation.3 2x15 MHz of the 1800 MHz spectrum will expire in August 2016.4 Options to extend these licences.5 2x3 MHz of 900 MHz must be released by December 2015 and 2x14 MHz of 1800 MHz spectrum does not expire until March 2027.6 India is comprised of 22 separate service area licences with a variety of expiry dates. Option to extend 900/1800 MHz licences by ten years. 7 Vodacom’s South African spectrum licences are renewed annually. As part of the migration to a new licensing regime the NRA has issued Vodacom a service licence and a network licence which will permit Vodacom to offer
mobile and fixed services. The service and network licences have 20 year duration and will expire in 2028. Vodacom also holds licences to provide 2G and/or 3G services in the Democratic Republic of Congo, Lesotho, Mozambique and Tanzania.
8 The NRA has issued provisional licences with the intention of converting these to full licences once the NRA board has been reconvened.
162Vodafone Group Plc Annual Report 2012
In the discussion of our reported financial position, operating results and cash flows, information is presented to provide readers with additional financial information that is regularly reviewed by management. However, this additional information presented is not uniformly defined by all companies including those in the Group’s industry. Accordingly, it may not be comparable with similarly titled measures and disclosures by other companies. Additionally, certain information presented is derived from amounts calculated in accordance with IFRS but is not itself an expressly permitted GAAP measure. Such non-GAAP measures should not be viewed in isolation or as an alternative to the equivalent GAAP measure.
EBITDAEBITDA is operating profit excluding share in results of associates, depreciation and amortisation, gains/losses on the disposal of fixed assets, impairment losses and other operating income and expense. We use EBITDA, in conjunction with other GAAP and non-GAAP financial measures such as adjusted operating profit, operating profit and net profit, to assess our operating performance. We believe that EBITDA is an operating performance measure, not a liquidity measure, as it includes non-cash changes in working capital and is reviewed by the Chief Executive to assess internal performance in conjunction with EBITDA margin, which is an alternative sales margin figure. We believe it is both useful and necessary to report EBITDA as a performance measure as it enhances the comparability of profit across segments.
Because EBITDA does not take into account certain items that affect operations and performance, EBITDA has inherent limitations as a performance measure. To compensate for these limitations, we analyse EBITDA in conjunction with other GAAP and non-GAAP operating performance measures. EBITDA should not be considered in isolation or as a substitute for a GAAP measure of operating performance.
A reconciliation of EBITDA to the closest equivalent GAAP measure, operating profit, is provided in note 3 to the consolidated financial statements on page 107.
Group adjusted operating profit and adjusted earnings per shareGroup adjusted operating profit excludes non-operating income of associates, impairment losses and other income and expense. Adjusted earnings per share also excludes amounts in relation to equity put rights and similar arrangements and certain foreign exchange rate differences, together with related tax effects. We believe that it is both useful and necessary to report these measures for the following reasons:
aa these measures are used for internal performance reporting;
aa these measures are used in setting director and management remuneration; and
aa they are useful in connection with discussion with the investment analyst community and debt rating agencies.
Reconciliations of adjusted operating profit and adjusted earnings per share to the respective closest equivalent GAAP measures, operating profit and basic earnings per share, are provided in “Operating results” beginning on page 40.
Cash flow measuresIn presenting and discussing our reported results, free cash flow and operating free cash flow are calculated and presented even though these measures are not recognised within IFRS. We believe that it is both useful and necessary to communicate free cash flow to investors and other interested parties, for the following reasons:
aa free cash flow allows us and external parties to evaluate our liquidity and the cash generated by our operations. Free cash flow does not include payments for licences and spectrum included within intangible assets, items determined independently of the ongoing business, such as the level of dividends, and items which are deemed discretionary, such as cash flows relating to acquisitions and disposals or financing activities. In addition, it does not necessarily reflect the amounts which we have an obligation to incur. However, it does reflect the cash available for such discretionary activities, to strengthen the consolidated statement of financial position or to provide returns to shareholders in the form of dividends or share purchases;
aa free cash flow facilitates comparability of results with other companies although our measure of free cash flow may not be directly comparable to similarly titled measures used by other companies;
aa these measures are used by management for planning, reporting and incentive purposes; and
aa these measures are useful in connection with discussion with the investment analyst community and debt rating agencies.
A reconciliation of cash generated by operations, the closest equivalent GAAP measure, to operating free cash flow and free cash flow, is provided in “Financial position and resources” on page 55.
OtherCertain of the statements within the section titled “Chief Executive’s review” on pages 14 to 17 contain forward-looking non-GAAP financial information for which at this time there is no comparable GAAP measure and which at this time cannot be quantitatively reconciled to comparable GAAP financial information.
Certain of the statements within the section titled “Guidance” on page 50 contain forward-looking non-GAAP financial information which at this time cannot be quantitatively reconciled to comparable GAAP financial information.
Organic growthAll amounts in this document marked with an “*” represent organic growth which presents performance on a comparable basis, both in terms of merger and acquisition activity and foreign exchange rates. We believe that “organic growth”, which is not intended to be a substitute for or superior to reported growth, provides useful and necessary information to investors and other interested parties for the following reasons:
aa it provides additional information on underlying growth of the business without the effect of certain factors unrelated to the operating performance of the business;
aa it is used for internal performance analysis; and
aa it facilitates comparability of underlying growth with other companies, although the term “organic” is not a defined term under IFRS and may not, therefore, be comparable with similarly titled measures reported by other companies.
Non-GAAP information

Business reviewPerform
anceG
overnanceFinancials
Additional inform
ation163Vodafone Group Plc
Annual Report 2012
Reconciliation of organic growth to reported growth is shown where used, or in the table below: Organic change
%
Otheractivity1
pps
Foreignexchange
pps
Reportedchange
%
31 March 2012GroupService revenue 1.5 (0.4) (0.8) 0.3Revenue 2.2 (0.3) (0.7) 1.2Service revenue for the quarter ended 31 March 2012 2.3 (0.9) (3.0) (1.6)Voice revenue (4.0) (0.4) (1.2) (5.6)Messaging revenue 4.4 (0.8) 0.2 3.8Data revenue 22.2 (0.3) (0.2) 21.7Fixed line revenue 5.4 – 0.9 6.3Emerging markets service revenue 13.2 – (8.4) 4.8Enterprise revenue 2.2 5.1 0.8 8.1Enterprise data revenue 18.2 6.7 1.2 26.1Vodafone Global Enterprise revenue 11 (1) (1) 9EBITDA (0.6) (0.3) (0.4) (1.3)Adjusted operating profit 2.5 (4.4) (0.5) (2.4)EuropeService revenue excluding the impact of termination rate cuts 1.4 – 0.5 1.9Data revenue 20.2 – 1.0 21.2Vodafone Global Enterprise revenue 12 (1) (4) 7Germany – data revenue 21.3 – 1.6 22.9Germany – enterprise revenue 5.6 – 1.6 7.2Italy – data revenue 16.8 – 1.6 18.4Italy – enterprise revenue 5.1 – 1.6 6.7Spain – data revenue 18.4 – 1.9 20.3Spain – fixed line revenue 7.3 – 1.6 8.9UK – data revenue 14.5 – – 14.5Netherlands – service revenue 2.1 (0.1) 1.6 3.6Turkey – service revenue 25.1 (1.1) (17.8) 6.2Percentage point reduction in EBITDA margin (1.5) – 0.2 (1.3)Italy – percentage point reduction in EBITDA margin (1.9) 0.1 – (1.8)Spain – percentage point reduction in EBITDA margin (5.5) – 0.1 (5.4)UK – percentage point reduction in EBITDA margin 0.6 – – 0.6Africa, Middle East and Asia PacificVodafone Global Enterprise revenue 8 – 9 17India – data revenue 51.3 – (10.8) 40.5South Africa – service revenue 4.4 – (6.1) (1.7)South Africa – data revenue 24.3 – (7.9) 16.4Vodacom’s international operations excluding Gateway and Vodacom Business Africa 31.9 – (3.5) 28.4Australia – service revenue (8.8) – 7.2 (1.6)Egypt – service revenue 1.4 – (6.8) (5.4)Ghana – service revenue 29.2 – (14.1) 15.1Qatar – service revenue 27.1 – (2.8) 24.3Safaricom – service revenue 13.6 – (13.2) 0.4Percentage point reduction in EBITDA margin (0.1) (0.1) (0.2) (0.4)India – percentage point reduction in EBITDA margin 0.8 (0.1) – 0.7Other Africa, Middle East and Asia Pacific – percentage point reduction in EBITDA margin (2.2) (0.1) (0.4) (2.7)Verizon Wireless2
Service revenue 7.3 (0.1) (2.6) 4.6Revenue 10.6 – (2.7) 7.9EBITDA 7.9 (0.1) (2.7) 5.1Group’s share of result of Verizon Wireless 9.3 (0.1) (2.7) 6.5

164Vodafone Group Plc Annual Report 2012
Organic change
%
M&Aactivity
pps
Foreignexchange
pps
Reportedchange
%
31 March 2011GroupService revenue H2 2011 2.5 0.2 (1.5) 1.2 H1 2011 1.7 1.5 0.5 3.7 Change 0.8 (1.3) (2.0) (2.5)Revenue 2.8 0.8 (0.4) 3.2Service revenue 2.1 0.9 (0.6) 2.4Data revenue 26.4 1.2 (1.2) 26.4Emerging markets service revenue 11.8 3.4 6.8 22.0EBITDA (0.7) 1.4 (1.1) (0.4)Adjusted operating profit 1.8 2.5 (1.2) 3.1EuropeService revenue for the six months ended 31 March 2011 (0.3) 0.2 (3.5) (3.6)Enterprise revenue 0.5 0.2 (3.2) (2.5)Germany – data revenue 27.9 – (5.1) 22.8Germany – enterprise revenue 3.6 – (4.2) (0.6)Italy – data revenue 21.5 – (4.8) 16.7Spain – data revenue 14.8 – (4.8) 10.0Greece – service revenue (19.4) – (3.2) (22.6)Turkey – service revenue 28.9 3.6 2.7 35.2Africa, Middle East and Asia PacificSouth Africa – data revenue3 41.8 9.5 15.6 66.9Egypt – service revenue (0.8) – (1.0) (1.8)Ghana – service revenue 21.0 – 1.6 22.6Indus Towers – contribution to India service revenue growth 1.7 – 0.1 1.8Percentage point reduction in EBITDA margin (0.6) 1.0 (0.2) 0.2Verizon Wireless2
Revenue 6.0 – 2.6 8.6Service revenue 5.8 – 2.6 8.4EBITDA 6.7 (0.1) 2.7 9.3Group’s share of result of Verizon Wireless 8.5 (0.1) 2.7 11.1
31 March 2010GroupData revenue 19.3 6.9 6.8 33.0Emerging markets service revenue 7.9 31.3 7.9 47.1Notes:1 “Other activity” includes the impact of M&A activity and the revision to intra-group roaming recharges from 1 October 2012.2 Organic growth rates include the impact of a non-cash revenue adjustment which was recorded to properly defer previously recognised data revenue that will be earned and recognised in future periods. Excluding this the
equivalent growth rates for service revenue, revenue, adjusted EBITDA and the Group’s share of result in Verizon Wireless would have been 6.8%*, 10.1%*, 6.7%* and 7.5%* (2011: 6.4%*, 6.6%*, 8.2%* and 10.8%*) respectively.3 Data revenue in South Africa grew by 41.8%*. Excluding the impact of reclassifications between messaging and data revenue during the year, data revenue grew by 35.9%*.
Non-GAAP information (continued)

Business reviewPerform
anceG
overnanceFinancials
Additional inform
ation165Vodafone Group Plc
Annual Report 2012
The information in this document that is referenced in the following table is included in our annual report on Form 20-F for 2012 filed with the SEC (the “2012 Form 20-F”). The information in this document may be updated or supplemented at the time of filing with the SEC or later amended if necessary. No other information in this document is included in the 2012 Form 20-F or incorporated by reference into any filings by us under the Securities Act. Please see “Documents on display” on page 154 for information on how to access the 2012 Form 20-F as filed with the SEC. The 2012 Form 20-F has not been approved or disapproved by the SEC nor has the SEC passed judgement upon the adequacy or accuracy of the 2012 Form 20-F.Item Form 20-F caption Location in this document Page
1 Identity of directors, senior management and advisers Not applicable –
2 Offer statistics and expected timetable Not applicable –3
Key information3A Selected financial data Selected financial data 172
Shareholder information – Inflation and foreign currency translation 151
3B Capitalisation and indebtedness Not applicable –3C Reasons for the offer and use of proceeds Not applicable –3D Risk factors Principal risk factors and uncertainties 51 to 53
4 Information on the Company4A History and development of the company History and development 157
Contact details Back cover4B Business overview Who we are 2 to 3
What we do and how we do it 4 to 5Where we do it 6 to 7Where we are heading 8 to 9How we’re doing 10 to 11Industry trends 18 to 19How we do business 20 to 21Strategy: mobile data 22 to 25Strategy: enterprise and total communications 28 to 29Strategy: new services 30 to 31Operating results 40 to 49Regulation 158 to 161
4C Organisational structure Note 12 “Principal subsidiaries” 118Note 13 “Investments in joint ventures” 119Note 14 “Investments in associates” 120Note 15 “Other investments” 120
4D Property, plant and equipment What we do and how we do it 4 to 5How we do business 20 to 21Financial position and resources 54 to 59Sustainable business 36 to 37
4A Unresolved staff comments None –5 Operating and financial review and prospects
5A Operating results Operating results 40 to 49Note 22 “Borrowings” 128Shareholder information – Inflation and foreign currency translation 151Regulation 158 to 161
5B Liquidity and capital resources Financial position and resources – Liquidity and capital resources 55 to 59Note 21 “Capital and financial risk management” 124Note 22 “Borrowings” 128
5C Research and development, patents and licences, etc
Strategy: mobile data 22 to 25Note 4 “Operating profit” 108Regulation – Licences 161
5D Trend information Chief Executive’s review 14 to 17Industry trends 18 to 19
5E Off-balance sheet arrangements Financial position and resources – Off-balance sheet arrangements 59Note 28 “Commitments” 137Note 29 “Contingent liabilities” 138
5F Tabular disclosure of contractual obligations Financial position and resources – Contractual obligations and contingencies 54
5G Safe harbor Forward-looking statements 168 to 169
Form 20-F cross reference guide

166Vodafone Group Plc Annual Report 2012
Form 20-F cross reference guide (continued)
Item Form 20-F caption Location in this document Page
6 Directors, senior management and employees6A Directors and senior management Board of directors and Group management 60 to 626B Compensation Directors’ remuneration 74 to 876C Board practices Corporate governance 63 to 73
Directors’ remuneration 74 to 87Board of directors and Group management 60 to 62
6D Employees Our people 34 to 35Note 32 “Employees” 141
6E Share ownership Directors’ remuneration 74 to 87Note 20 “Share-based payments” 122
7 Major shareholders and related party transactions7A Major shareholders Shareholder information – Major shareholders 1517B Related party transactions Directors’ remuneration 74 to 87
Note 29 “Contingent liabilities” 138Note 31 “Related party transactions” 140
7C Interests of experts and counsel Not applicable –8 Financial information
8A Consolidated statements and other financial information
Financials1 94Audit report on the consolidated financial statements 93Note 29 “Contingent liabilities” 138Financial position and resources 54 to 59
8B Significant changes Not applicable –9 The offer and listing
9A Offer and listing details Shareholder information – Share price history 150 to 1519B Plan of distribution Not applicable –9C Markets Shareholder information – Markets 1519D Selling shareholders Not applicable –9E Dilution Not applicable –9F Expenses of the issue Not applicable –
10 Additional information10A Share capital Not applicable –10B Memorandum and articles of association Shareholder information – Articles of association and applicable
English law 151 to 15410C Material contracts Shareholder information – Material contracts 15410D Exchange controls Shareholder information – Exchange controls 15410E Taxation Shareholder information – Taxation 154 to 15610F Dividends and paying agents Not applicable –10G Statement by experts Not applicable –10H Documents on display Shareholder information – Documents on display 15410I Subsidiary information Not applicable –
11 Quantitative and qualitative disclosures about market risk Note 21 “Capital and financial risk management” 124
12 Description of securities other than equity securities12A Debt securities Not applicable –12B Warrants and rights Not applicable –12C Other securities Not applicable –12D American depositary shares Filed with the SEC –
13 Defaults, dividend arrearages and delinquencies Not applicable –14 Material modifications to the rights of security
holders and use of proceeds Not applicable –15 Controls and procedures Corporate governance 63 to 73
Directors’ statement of responsibility – Management’s report on internal control over financial reporting 89Audit report on internal controls 90

Business reviewPerform
anceG
overnanceFinancials
Additional inform
ation167Vodafone Group Plc
Annual Report 2012
Item Form 20-F caption Location in this document Page
16 16A Audit Committee financial expert Corporate governance – Board committees 68 to 7116B Code of ethics Corporate governance – US listing requirements 7316C Principal accountant fees and services Note 4 “Operating profit” 108
Corporate governance – Board committees – External audit 7016D Exemptions from the listing standards for audit
committees Not applicable –16E Purchase of equity securities by the issuer and
affiliated purchasers Financial position and resources 54 to 5916F Change in registrant’s certifying accountant Not applicable –16G Corporate governance Corporate governance – US listing requirements 7316H Mine safety disclosure Not applicable –
17 Financial statements Not applicable –18 Financial statements Financials1 9419 Exhibits Filed with the SEC –
Note:1 The Company financial statements, and the audit report and notes relating thereto, on pages 143 to 148 should not be considered to form part of the Company’s annual report on Form 20-F.

168Vodafone Group Plc Annual Report 2012
This document contains “forward-looking statements” within the meaning of the US Private Securities Litigation Reform Act of 1995 with respect to the Group’s financial condition, results of operations and businesses and certain of the Group’s plans and objectives.
In particular, such forward-looking statements include statements with respect to:
aa the Group’s expectations regarding its financial and operating performance, including statements contained within the Chief Executive’s review on pages 14 to 17, the Group’s 7% dividend per share growth target, and the guidance statement for the 2013 financial year and the medium-term free cash flow guidance on page 50 of this document, and the performance of joint ventures, associates, including Verizon Wireless and VHA, other investments and newly acquired businesses;
aa intentions and expectations regarding the development of products, services and initiatives introduced by, or together with, Vodafone or by third parties, including new mobile technologies, such as the introduction of 4G, the Vodafone M-Pesa money transfer system, M2M connections, the operator billing service, tablets and an increase in download speeds and 3G services;
aa expectations regarding the global economy and the Group’s operating environment and market position, including future market conditions, growth in the number of worldwide mobile phone users and other trends, including increased mobile data usage and increased mobile penetration in emerging markets;
aa revenue and growth expected from the Group’s enterprise and total communications strategy, including data revenue growth, and its expectations with respect to long-term shareholder value growth;
aa mobile penetration and coverage rates, mobile termination rate cuts, the Group’s ability to acquire spectrum, expected growth prospects in the Europe, Africa, Middle East and Asia Pacific regions and growth in customers and usage generally;
aa anticipated benefits to the Group from cost efficiency programmes;
aa possible future acquisitions, including increases in ownership in existing investments, the timely completion of pending acquisition transactions and pending offers for investments, including licence and spectrum acquisitions, and the expected funding required to complete such acquisitions or investments;
aa expectations regarding the Group’s future revenue, operating profit, EBITDA, EBITDA margin, free cash flow, capital intensity, depreciation and amortisation charges, foreign exchange rates, tax rates and capital expenditure;
aa expectations regarding the Group’s access to adequate funding for its working capital requirements and share buyback programmes, and the rate of dividend growth by the Group (including the Group’s 7% dividend per share growth target) or its existing investments; and
aa the impact of regulatory and legal proceedings involving the Group and of scheduled or potential regulatory changes.
Forward-looking statements are sometimes, but not always, identified by their use of a date in the future or such words as “will”, “anticipates”, “aims”, “could”, “may”, “should”, “expects”, “believes”, “intends”, “plans” or “targets”. By their nature, forward-looking statements are inherently predictive, speculative and involve risk and uncertainty because they relate to events and depend on circumstances that will occur in the future. There are a number of factors that could cause actual results and developments to differ materially from those expressed or implied by these forward-looking statements. These factors include, but are not limited to, the following:
aa general economic and political conditions in the jurisdictions in which the Group operates and changes to the associated legal, regulatory and tax environments;
aa increased competition, from both existing competitors and new market entrants, including mobile virtual network operators;
aa levels of investment in network capacity and the Group’s ability to deploy new technologies, products and services in a timely manner, particularly data content and services;
aa rapid changes to existing products and services and the inability of new products and services to perform in accordance with expectations, including as a result of third party or vendor marketing efforts;
aa the ability of the Group to integrate new technologies, products and services with existing networks, technologies, products and services;
aa the Group’s ability to generate and grow revenue from both voice and non-voice services and achieve expected cost savings;
aa a lower than expected impact of new or existing products, services or technologies on the Group’s future revenue, cost structure and capital expenditure outlays;
aa slower than expected customer growth, reduced customer retention, reductions or changes in customer spending and increased pricing pressure;
aa the Group’s ability to expand its spectrum position, win 3G and 4G allocations and realise expected synergies and benefits associated with 3G and 4G;
Forward-looking statements

Business reviewPerform
anceG
overnanceFinancials
Additional inform
ation169Vodafone Group Plc
Annual Report 2012
aa the Group’s ability to secure the timely delivery of high quality, reliable handsets, network equipment and other key products from suppliers;
aa loss of suppliers, disruption of supply chains and greater than anticipated prices of new mobile handsets;
aa changes in the costs to the Group of, or the rates the Group may charge for, terminations and roaming minutes;
aa the Group’s ability to realise expected benefits from acquisitions, partnerships, joint ventures, franchises, brand licences, platform sharing or other arrangements with third parties, particularly those related to the development of data and internet services;
aa acquisitions and divestments of Group businesses and assets and the pursuit of new, unexpected strategic opportunities which may have a negative impact on the Group’s financial condition and results of operations;
aa the Group’s ability to integrate acquired business or assets and the imposition of any unfavourable conditions, regulatory or otherwise, on any pending or future acquisitions or dispositions;
aa the extent of any future write-downs or impairment charges on the Group’s assets, or restructuring charges incurred as a result of an acquisition or disposition;
aa developments in the Group’s financial condition, earnings and distributable funds and other factors that the Board takes into account in determining the level of dividends;
aa the Group’s ability to satisfy working capital requirements through borrowing in capital markets, bank facilities and operations;
aa changes in foreign exchange rates, including particularly the exchange rate of pounds sterling to the euro and the US dollar;
aa changes in the regulatory framework in which the Group operates, including the commencement of legal or regulatory action seeking to regulate the Group’s permitted charging rates;
aa the impact of legal or other proceedings against the Group or other companies in the communications industry; and
aa changes in statutory tax rates and profit mix, the Group’s ability to resolve open tax issues and the timing and amount of any payments in respect of tax liabilities.
Furthermore, a review of the reasons why actual results and developments may differ materially from the expectations disclosed or implied within forward-looking statements can be found under “Principal risk factors and uncertainties” on pages 51 to 53 of this document. All subsequent written or oral forward-looking statements attributable to the Company or any member of the Group or any persons acting on their behalf are expressly qualified in their entirety by the factors referred to above. No assurances can be given that the forward-looking statements in this document will be realised. Subject to compliance with applicable law and regulations, Vodafone does not intend to update these forward-looking statements and does not undertake any obligation to do so.

170Vodafone Group Plc Annual Report 2012
Definition of terms
2G 2G networks are operated using global system for mobile (‘GSM’) technology which offer services such as voice, text messaging and basic data. In addition, all the Group’s controlled networks support general packet radio services (‘GPRS’), often referred to as 2.5G. GPRS allows mobile devices to access IP based data services such as the internet and email.
3G A cellular technology based on wide band CDMA delivering voice and data services.4G 4G or LTE technology offers even faster data transfer speeds than 3G/HSPA, increases network capacity and
is able to deliver sustained customer throughputs of between 6 – 12 Mbps in real network conditions.Acquisition costs The total of connection fees, trade commissions and equipment costs relating to new customer connections.ADR American depositary receipts is a mechanism designed to facilitate trading in shares of non-US companies
in the US stock markets. The main purpose is to create an instrument which can easily be settled through US stock market clearing systems.
ADS American depositary shares are shares evidenced by American depositary receipts. ADSs are issued by a depositary bank and represent one or more shares of a non-US issuer held by the depositary bank. The main purpose of ADSs is to facilitate trading in shares of non-US companies in the US markets and, accordingly, ADRs which evidence ADSs are in a form suitable for holding in US clearing systems.
AGM Annual general meeting.AOP Adjusted operating profit. Group adjusted operating profit excludes non-operating income of associates,
impairment losses, and other income and expense.Applications (‘apps’) Apps are software applications usually designed to run on a smartphone or tablet device and provide a
convenient means for the user to perform certain tasks. They cover a wide range of activities including banking, ticket purchasing, travel arrangements, social networking and games. For example the My Vodafone app lets customers check their bill totals on their smartphone and see the minutes, texts and data allowance remaining.
ARPU Service revenue excluding fixed line revenue, fixed advertising revenue, revenue related to business managed services and revenue from certain tower sharing arrangements divided by average customers.
Capital expenditure (‘capex’) This measure includes the aggregate of capitalised property, plant and equipment additions and capitalised software costs.
Churn Total gross customer disconnections in the period divided by the average total customers in the period.Controlled and jointly controlled Controlled and jointly controlled measures include 100% for the Group’s mobile operating subsidiaries and
the Group’s proportionate share for joint ventures. Customer costs Customer costs include acquisition costs, being the total of connection fees, trade commissions and
equipment costs relating to new customer connections, and retention costs, being the total of trade commissions, loyalty scheme and equipment costs relating to customer retention and upgrades, as well as expenses related to ongoing commissions.
Depreciation and other amortisation
This measure includes the profit or loss on disposal of property, plant and equipment and computer software.
Direct costs Direct costs include interconnect costs and other direct costs of providing services.Enterprise The Group’s business customer segment.EBITDA Operating profit excluding share in results of associates, depreciation and amortisation, gains/losses on the
disposal of fixed assets, impairment losses and other operating income and expense.Emerging markets Vodafone entities are India, Vodacom, Egypt, Turkey, Ghana, Qatar and Fiji. Fixed broadband customer A fixed broadband customer is defined as a physical connection or access point to a fixed line network. FRC Financial Reporting Council.Free cash flow Operating free cash flow after cash flows in relation to taxation, interest, dividends received from associates
and investments and dividends paid to non-controlling shareholders in subsidiaries but before licence and spectrum payments.
For the year ended 31 March 2012 payments in respect of a tax case settlement, tax relating to the disposal of our 24.4% interest in Polkomtel, the income dividend received from Verizon Wireless in January 2012 and the return of the court deposit made in respect of the India tax case are also excluded. For the year ended 31 March 2011 other items excluded included tax relating to the disposal of China Mobile Limited, the SoftBank disposal and a court deposit made in respect of the India tax case.
FSA Financial Services Authority.Impairment A downward revaluation of an asset.Interconnect costs A charge paid by Vodafone to other fixed line or mobile operators when a Vodafone customer calls
a customer connected to a different network.ICT Information and communications technology.IP Internet protocol (‘IP’) is the method by which data is sent from one computer to another on the internet.LTE Long-term evolution (‘LTE’) is 4G technology which offers even faster data transfer speeds than 3G/HSPA,
increases network capacity and is able to deliver sustained customer throughputs of between 6 – 12 Mbps in real network conditions.
M2M Machine-to-machine. M2M communications, or telemetry, enable devices to communicate with one another via built-in mobile SIM cards.
Mark-to-market Mark-to-market or fair value accounting refers to accounting for the value of an asset or liability based on the current market price of the asset or liability.

Business reviewPerform
anceG
overnanceFinancials
Additional inform
ation171Vodafone Group Plc
Annual Report 2012
Mobile broadband Also known as mobile internet (see below).Mobile customer A mobile customer is defined as a subscriber identity module (‘SIM’), or in territories where SIMs do not exist,
a unique mobile telephone number, which has access to the network for any purpose, including data only usage, except telemetric applications. Telemetric applications include, but are not limited to, asset and equipment tracking, mobile payment and billing functionality, e.g. vending machines and meter readings, and include voice enabled customers whose usage is limited to a central service operation, e.g. emergency response applications in vehicles.
Mobile internet Browser based access to the internet or web applications using a mobile device, such as a smartphone, connected to a wireless network.
Mobile termination rate (‘MTR’) A per minute charge paid by a telecommunications network operator when a customer makes a call to another mobile or fixed line network operator.
MVNO Mobile virtual network operators, companies that provide mobile phone services but do not have their own licence of spectrum or the infrastructure required to operate a network.
Net debt Long-term borrowings, short-term borrowings and mark-to-market adjustments on financing instruments less cash and cash equivalents.
Net promoter score (‘NPS’) Net promoter score is a customer loyalty metric used to monitor customer satisfaction.Operating expenses Operating expenses comprise primarily of network and IT related expenditure, support costs from HR and
finance and certain intercompany items.Operating free cash flow Cash generated from operations after cash payments for capital expenditure (excludes capital licence and
spectrum payments) and cash receipts from the disposal of intangible assets and property, plant and equipment.
Organic growth All amounts marked with an “*” represent organic growth which presents performance on a comparable basis, both in terms of merger and acquisition activity and foreign exchange rates. From 1 October 2012 the Group revised its intra-group roaming charges. Whilst neutral to Group revenue and profitability, these changes do have an impact on reported service revenue by country and regionally from Q3 onwards. Whilst prior period reported revenue has not been restated, to ensure comparability in organic growth rates, country and regional revenue in the prior financial year have been recalculated based on the new pricing structure to form the basis for our organic calculations.
Partner markets Markets in which the Group has entered into a partner agreement with a local mobile operator enabling a range of Vodafone’s global products and services to be marketed in that operator’s territory and extending Vodafone’s reach into such markets.
Penetration Number of SIMs in a country as a percentage of the country’s population. Penetration can be in excess of 100% due to customers’ owning more than one SIM.
Petabyte A petabyte is a measure of data usage. One petabyte is a million gigabytes.Pps Percentage points.Pro-forma growth Pro-forma growth is organic growth adjusted to include acquired business for the whole of both periods.Reported growth Reported growth is based on amounts reported in pounds sterling as determined under IFRS.RAN Radio access network is part of a mobile telecommunication system which conceptually sits between the
mobile phone and the base station.Retention costs The total of trade commissions, loyalty scheme and equipment costs relating to customer retention
and upgrade.Roaming Allows our customers to make calls on other operators’ mobile networks while travelling abroad.Service revenue Service revenue comprises all revenue related to the provision of ongoing services including, but not limited
to, monthly access charges, airtime usage, roaming, incoming and outgoing network usage by non-Vodafone customers and interconnect charges for incoming calls.
Smartphone devices A smartphone is a mobile phone offering advanced capabilities including access to email and the internet.Smartphone penetration The number of smartphone devices divided by the number of registered SIMs, excluding data only SIMs.SME Small to medium-sized enterprises.SoHo Small-office-home-office.Spectrum The radio frequency bands and channels assigned for telecommunication services.Tablet device A tablet is a slate shaped, mobile or portable casual computing device equipped with a finger operated
touchscreen or stylus, for example the Apple iPad.“to the cloud” This means the customer has little or no equipment at their premises and all the equipment and capability is
run from the Vodafone network instead. This removes the need for customers to make capital investment and instead they have an operating cost model with a recurring monthly fee.
Visitor revenue Amounts received by a Vodafone operating company when customers of another operator, including those of other Vodafone companies, roam onto its network.
VZW Verizon Wireless, the Group’s associate in the US.VZW income dividends Distributions (other than tax distributions) by Verizon Wireless as agreed from time to time by the Board of
Verizon Wireless.VZW tax distributions Specific distributions made by the Cellco Partnership to its partners based on the taxable income of
Verizon Wireless.

172Vodafone Group Plc Annual Report 2012
Selected financial data
At/for the year ended 31 March 2012 2011 2010 2009 2008
Consolidated income statement data (£m)Revenue 46,417 45,884 44,472 41,017 35,478Operating profit 11,187 5,596 9,480 5,857 10,047Profit before taxation 9,549 9,498 8,674 4,189 9,001Profit for the financial year 7,003 7,870 8,618 3,080 6,756
Consolidated statement of financial position data (£m)Total assets 139,576 151,220 156,985 152,699 127,270Total equity 78,202 87,561 90,810 84,777 76,471Total equity shareholders’ funds 76,935 87,555 90,381 86,162 78,043
Earnings per share1
Weighted average number of shares (millions)– Basic 50,644 52,408 52,595 52,737 53,019– Diluted 50,958 52,748 52,849 52,969 53,287
Basic earnings per ordinary share 13.74p 15.20p 16.44p 5.84p 12.56pDiluted earnings per ordinary share 13.65p 15.11p 16.36p 5.81p 12.50p
Cash dividends1 2
Amount per ordinary share (pence) 13.52p 8.90p 8.31p 7.77p 7.51pAmount per ADS (pence) 135.2p 89.0p 83.1p 77.7p 75.1pAmount per ordinary share (US cents) 21.63c 14.33c 12.62c 11.11c 14.91cAmount per ADS (US cents) 216.3c 143.3c 126.2c 111.1c 149.1c
Other dataRatio of earnings to fixed charges3 4.3 5.7 3.6 1.2 3.9
Notes: 1 See note 8 to the consolidated financial statements, “Earnings per share”. Earnings and dividends per ADS is calculated by multiplying earnings per ordinary share by ten, the number of ordinary shares per ADS. Dividend per
ADS is calculated on the same basis.2 The final dividend for the year ended 31 March 2012 was proposed by the directors on 22 May 2012 and is payable on 1 August 2012 to holders of record as of 8 June 2012. The total dividends have been translated into
US dollars at 31 March 2012 for purposes of the above disclosure but the dividends are payable in US dollars under the terms of the ADS depositary agreement.3 For the purposes of calculating these ratios, earnings consist of profit before tax adjusted for fixed charges, dividend income from associates, share of profits and losses from associates, interest capitalised, interest amortised
and profits and losses on ordinary activities before taxation from discontinued operations. Fixed charges comprise one third of payments under operating leases, representing the estimated interest element of these payments, interest payable and similar charges, interest capitalised and preferred share dividends.
We are creating a more valuableVodafoneOur strategy is focused on four areas of growth potential and founded on strong capital and cost discipline. This is delivering results: we have outperformed our key competitors in most major markets, and returned over £10 billion to shareholders in the last 12 months.
£46.4bnGroup revenue increased 1.2% to £46.4 billion with a strong demand for data services and further voice penetration in emerging markets.
£11.5bnAdjusted operating profit was £11.5 billion, slightly down on last year (up 2.5%* on an organic basis) supported by a good performance from our US associate, Verizon Wireless.
£6.1bnFree cash flow of £6.1 billion, decreased due to the sale of our interests in China and France and a lower working capital benefit.
9.52pTotal ordinary dividends per share of 9.52 pence, up 7.0% in line with our dividend per share growth target. We also paid a special dividend of 4.0 pence per share and our £6.8 billion share buyback programme is almost complete.
£6.4bnCapital expenditure increased by 2.3%, as we continued to maintain our high level of investment to support our network strategy.
14.91pAdjusted earnings per share of 14.91 pence, down 11.0% on last year, resulting from the loss of income following the sale of several businesses and higher financing costs.
Business reviewPerform
anceG
overnanceFinancials
Additional inform
ation173Vodafone Group Plc
Annual Report 2012
Vodafone, the Vodafone logo, Vodacom, M-Pesa, the M-Pesa logo, OfficeNet, Vodafone One Net, Vodafone Discover, Vodafone Cloud, Vodafone Protect, Vodafone Guardian, Vodafone Farmers’ Club, Vodafone mHealth Solutions, Justtextgiving by Vodafone, The Vodafone Way and Bluefish are trade marks of the Vodafone Group. Moyo, Ricarica Insieme and Mobile for Good are trade marks of the Vodafone Foundation. Other product and company names mentioned herein may be the trade marks of their respective owners.
The content of our website (www.vodafone.com) should not be considered to form part of this annual report or our annual report on Form 20-F.
© Vodafone Group 2012
Text printed on amadeus 75 silk which is made from 75% de-inked post-consumer waste and 25% virgin fibre. The cover is on amadeus 100 silk, made entirely from de-inked post-consumer waste. Both products are Forest Stewardship Council (‘FSC’) certified and produced using elemental chlorine free (‘ECF’) bleaching. The manufacturing mill also holds ISO 14001 accreditation for environmental management.
Designed and produced by Radley Yeldar ry.com

Creating a more valuableVodafone
Vodafone Group Plc
Registered Office: Vodafone House The Connection Newbury Berkshire RG14 2FN England
Registered in England No. 1833679
Telephone: +44 (0) 1635 33251Fax: +44 (0) 1635 238080
www.vodafone.com Contact details:
Registrars shareholder helpline Telephone: +44 (0) 870 702 0198 (In Ireland): +353 (0) 818 300 999
Investor Relations Email: [email protected] Website: www.vodafone.com/investor
Media Relations Telephone: +44 (0) 1635 664444 Email: [email protected] Website: www.vodafone.com/media
Sustainability Email: [email protected] Website: www.vodafone.com/sustainability
Vodafone Group PlcAnnual Reportfor the year ended 31 March 2012
Vodafone Group Plc Annual Report for the year ended 31 M
arch 2012
Access our online Annual Report at:vodafone.com/ar2012