Visuals and visualisation of human body systems Sindhu Mathai1 and Jayashree Ramadas
20
1 Visuals and visualisation of human body systems Sindhu Mathai 1 and Jayashree Ramadas Homi Bhabha Centre for Science Education, TIFR Abstract This paper explores the role of diagrams and text in middle school students' understanding and visualisation of human body systems. We develop a common framework based on structure and function to assess students' responses across diagram and verbal modes. Visualisation is defined in terms of understanding transformations on structure and relating these with function. We found in Indian students a high dependence on the verbal mode. Students expressed structure as well as function concepts significantly better through text rather than diagrams. Prior knowledge strongly influenced visualisation (as assessed through transformations) and comprehension of text and diagrams including the ability to move flexibly between text and diagrams. We suggest better use of line drawings for integrating structure and function: practices that should equip the learner to "dual-code" text with diagrams, thereby leading to enhanced understanding and expression. Understanding the ‘visual’ Systematising and characterising the ‘visual' presents unique challenges because of the diversity of visual information and its specificity to the domain and context in which it is situated. The terms `visual' and `visualisation' are often used in the context of external representations, from depictive ones like photographs, videos and 3D models, to simplified and abstracted line drawings, and even transient visual referents such as gestures. Formal and relatively well-developed visual codes such as flow charts, networks and sign languages, employ symbols that may be remote from their visual referents, with a vocabulary and grammar of their own. We use the term ‘visuals’ for external (physical) representations and `visualisation' for internal (mental) representations. Paivio's dual coding theory (Clark and Paivio, 1991), proposes two cognitive subsystems, one specialised for representation and processing of visual materials, and the other for verbal or linguistic materials. The two systems being richly interconnected, recall and recognition are enhanced by presenting information in 1 Present address: "The School", Krishnamurti Foundation India (KFI), Damodar Gardens, Besant Avenue, Adyar, Chennai 600 020, India.
Transcript of Visuals and visualisation of human body systems Sindhu Mathai1 and Jayashree Ramadas

1
Visuals and visualisation of human body systems
Sindhu Mathai1 and Jayashree Ramadas Homi Bhabha Centre for Science Education, TIFR
Abstract This paper explores the role of diagrams and text in middle school students' understanding and visualisation of human body systems. We develop a common framework based on structure and function to assess students' responses across diagram and verbal modes. Visualisation is defined in terms of understanding transformations on structure and relating these with function. We found in Indian students a high dependence on the verbal mode. Students expressed structure as well as function concepts significantly better through text rather than diagrams. Prior knowledge strongly influenced visualisation (as assessed through transformations) and comprehension of text and diagrams including the ability to move flexibly between text and diagrams. We suggest better use of line drawings for integrating structure and function: practices that should equip the learner to "dual-code" text with diagrams, thereby leading to enhanced understanding and expression. Understanding the ‘visual’ Systematising and characterising the ‘visual' presents unique challenges because of the diversity of visual information and its specificity to the domain and context in which it is situated. The terms `visual' and `visualisation' are often used in the context of external representations, from depictive ones like photographs, videos and 3D models, to simplified and abstracted line drawings, and even transient visual referents such as gestures. Formal and relatively well-developed visual codes such as flow charts, networks and sign languages, employ symbols that may be remote from their visual referents, with a vocabulary and grammar of their own. We use the term ‘visuals’ for external (physical) representations and `visualisation' for internal (mental) representations. Paivio's dual coding theory (Clark and Paivio, 1991), proposes two cognitive subsystems, one specialised for representation and processing of visual materials, and the other for verbal or linguistic materials. The two systems being richly interconnected, recall and recognition are enhanced by presenting information in
1 Present address: "The School", Krishnamurti Foundation India (KFI), Damodar Gardens, Besant Avenue, Adyar, Chennai 600 020, India.
me
Text Box
This article is published in the International Journal of Science Education, Vol 31 (3), Special Issue on "Visual and Spatial Modes in Science Learning", February 2009. [copyright Taylor & Francis] International Journal of Science Education is available at http://journalsonline.tandf.co.uk/

2
both visual and verbal form (Clark & Paivio, 1991). Subsequent research has explored the mechanisms for effective integration of text with visuals leading towards construction of mental models (Schnotz, 2002). We suggest ways of integration that might work for human body systems. Visuals in Science, unlike those in art, are intended to convey a specific meaning, one that is discernible to a trained mind within a given socio-cultural and historical context. Qualities of external visuals as well as internal mental visualisation in science are highly dependent on expertise in the domain, as is illustrated in this paper. Schematisation of visuals may be a matter of style and choice. Barbara McClintock, Nobel Prize winning cytogeneticist, went against prevailing trends in biology, to use photographs as, "both her evidence and the key to her explanations" (Keirns, 1999). With an increased understanding of biological processes at the molecular level, communication has tended towards more schematised representations. Yet demands of disciplines like taxonomy and physiology still necessitate the use of realistic representations, within which process elements then need to be depicted. Diagrams of human body systems in history Pioneering work on human anatomy and physiology by Galen (120-200 A.D.) made extensive use of diagrams. Contemporary Indian medical and surgical treatises were the Caraka Samhita and the Susruta Samhita, composed around 200 A.D. (Sharma, 1992). These works remarkably, arising from an oral tradition, relied entirely on text-based communication. In 1543 Vesalius in Italy published a monumental work 'The fabric of the human body', considered for several centuries hence to be the best illustrated atlas of the human body (Ronan, 1983). Detailed colour illustrations have since been used in pedagogy, though their use in developing countries remains limited by availability of resources. Diagrams in learning about human body systems Children learn about body systems through everyday experiences of breathing and eating, and also of illness (Gellert, 1962). Early understanding of the body is said to be "intentional" or "psychological", developing, by about age 10, to an intuitive understanding of biological processes (Carey, 1985). By this age school students have been exposed to diagrams of the structure of body systems. Students' own diagrams with text can be used to understand their linking of body internal structure with function (Ramadas and Nair, 1996; Reiss and Tunnicliffe, 2001). Ainsworth and Loizou (2003) presented undergraduate students with diagrams and text on the circulatory system and prompted them to self-explain verbally. They found that diagrams elicited more self-explanations than text. Learners could overcome the disadvantages posed by text, if they drew self-explanations. Drawing enabled them to translate self-explanations across different representational formats (Ainsworth and Iacovoides, 2005). Conceptual framework underlying text and diagrams
3
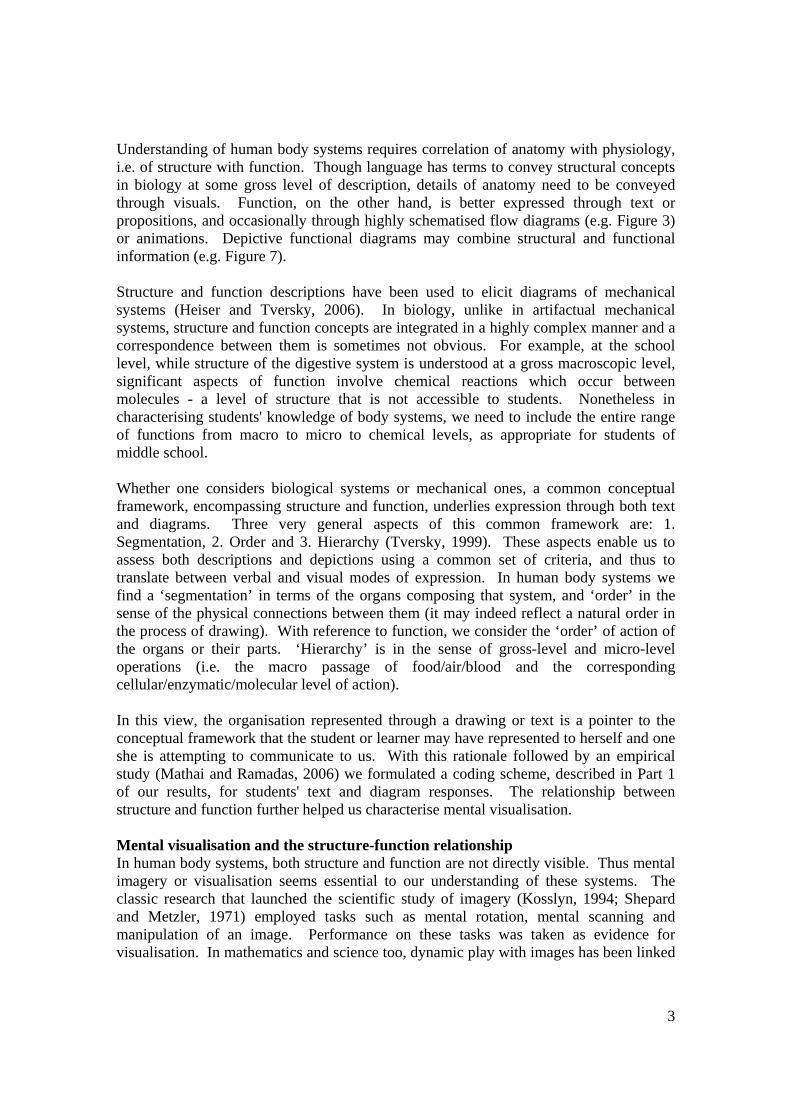
Understanding of human body systems requires correlation of anatomy with physiology, i.e. of structure with function. Though language has terms to convey structural concepts in biology at some gross level of description, details of anatomy need to be conveyed through visuals. Function, on the other hand, is better expressed through text or propositions, and occasionally through highly schematised flow diagrams (e.g. Figure 3) or animations. Depictive functional diagrams may combine structural and functional information (e.g. Figure 7). Structure and function descriptions have been used to elicit diagrams of mechanical systems (Heiser and Tversky, 2006). In biology, unlike in artifactual mechanical systems, structure and function concepts are integrated in a highly complex manner and a correspondence between them is sometimes not obvious. For example, at the school level, while structure of the digestive system is understood at a gross macroscopic level, significant aspects of function involve chemical reactions which occur between molecules - a level of structure that is not accessible to students. Nonetheless in characterising students' knowledge of body systems, we need to include the entire range of functions from macro to micro to chemical levels, as appropriate for students of middle school. Whether one considers biological systems or mechanical ones, a common conceptual framework, encompassing structure and function, underlies expression through both text and diagrams. Three very general aspects of this common framework are: 1. Segmentation, 2. Order and 3. Hierarchy (Tversky, 1999). These aspects enable us to assess both descriptions and depictions using a common set of criteria, and thus to translate between verbal and visual modes of expression. In human body systems we find a ‘segmentation’ in terms of the organs composing that system, and ‘order’ in the sense of the physical connections between them (it may indeed reflect a natural order in the process of drawing). With reference to function, we consider the ‘order’ of action of the organs or their parts. ‘Hierarchy’ is in the sense of gross-level and micro-level operations (i.e. the macro passage of food/air/blood and the corresponding cellular/enzymatic/molecular level of action). In this view, the organisation represented through a drawing or text is a pointer to the conceptual framework that the student or learner may have represented to herself and one she is attempting to communicate to us. With this rationale followed by an empirical study (Mathai and Ramadas, 2006) we formulated a coding scheme, described in Part 1 of our results, for students' text and diagram responses. The relationship between structure and function further helped us characterise mental visualisation. Mental visualisation and the structure-function relationship In human body systems, both structure and function are not directly visible. Thus mental imagery or visualisation seems essential to our understanding of these systems. The classic research that launched the scientific study of imagery (Kosslyn, 1994; Shepard and Metzler, 1971) employed tasks such as mental rotation, mental scanning and manipulation of an image. Performance on these tasks was taken as evidence for visualisation. In mathematics and science too, dynamic play with images has been linked

4
to visualisation (Simon, 1996; Briggs and Bodner, 2005) and has been termed "transformational reasoning" (Piaget and Inhelder, 1966; Simon, 1996). Since structure by nature is static while function is dynamic, functional understanding may have implication for visualisation. Ramadas and Nair (1996) tested for understanding of the digestive system through questions on the structure-function relationship, i.e. asking students to manipulate structure to see its effects on function. Tasks of this type might elicit mental visualisation in relation to human body systems. We selected macro aspects of function (expansion, contraction or shape-changes of parts and; movement of air, food or blood through the system), which could be correlated directly with mechanical manipulation of the corresponding parts of the body. "Visualisation" questions were of four different kinds: 1. Describing or drawing a diagram from a novel viewer / object orientation:
• Suppose you ask your friend to open wide his mouth. You then look inside it. What organs do you see inside the mouth? Describe their shape. How do these organs help in digestion of food?
• Draw the inside of your friend's mouth as it might have appeared to you.
These two questions require the student to imagine the inside of the mouth from an orientation different from what she has seen in the textbook diagram, and to make a drawing of it. 2. Manipulating structure by change of size or dimension:
• Suppose the food-pipe was longer or shorter, what difference would it make? Would it affect digestion of food? If so, how?
Here there is a requirement to visualise the entire digestive tract as a connected structure and the modified role of the food pipe in accommodating to the new structure. 3. Manipulating structure by making it appear like some other organ, or asking the student to imagine an alternative structure:
• Suppose the stomach was in the shape of a pipe. What difference would it make? Would it affect digestion of food? If yes, how?
4. Describing the appearance of an organ or substance following a transformation:
• Draw and describe the appearance of a piece of toast at each step of the process of digestion.
Sample and research questions
5
The sample consisted of 87 mixed-ability students of Grade 8 drawn from five English Medium schools in Mumbai, India. All the schools were located in a large campus area and followed the National curriculum. Written questionnaires were administered on the digestive and respiratory systems. Results for the digestive system only are reported here, mentioning consistency or otherwise with the respiratory system. All questionnaires, coding schemes and relevant tables of results are in Mathai and Ramadas (2008). Part 1 consisted of free-response questions on a. basic knowledge (Describe the food pipe/ stomach/ small intestine/ large intestine. How does the food pipe or another digestive organ help in digestion?) and b. visualisation (as described above). Responses were to be given through a combination of text and diagrams. The research questions were:
• How do students express understanding of body systems through text and diagrams?
• How effectively is structure and function expressed through text and diagrams? • What difficulties do students have with understanding body systems? • How do we characterize mental visualisation? • Are "visualisers" and "verbalisers" distinguishable?
Part 2 related to comprehension of text passages on structure or function, while Part 3 looked at comprehension of diagrams conveying structure or function from the perspective of developing a pedagogy of diagrams. The questions in Parts 2 and 3 required students to make connections between structure and function. The additional research questions were:
• How well do students comprehend and apply information presented through text and diagrams?
• How can pedagogical practices be informed by our understanding of visual literacy?
Part 1: The digestive systems through text and diagrams In Part 1 students were encouraged to respond through a combination of text and diagrams. Using the conceptual framework described above their text or diagram responses on "basic knowledge" questions were scored on three counts, ‘segmentation’, ‘order’ and ‘hierarchy’, which were combined using the scheme in Table 1. Whether assessing text or diagrams, scores on ‘segmentation’ and ‘order of location’ were added to give a structure score. To get the text or diagram function score the criteria for ‘order of action’ and ‘hierarchy’ were combined. The procedure is illustrated for diagrams in Figures 2 and 3. Scores on visualisation were assigned independently, based on performance on the "visualisation" questions. All scores were assigned as proportions of a maximum total score, and thus ranged between 0 and 1.

6
Basic knowledge Visualisation
Text responses (T) Drawn responses (D)
Structure (TS) Function (TF)
Structure (DS) Function (DF)
Names of Organs - Segmentation (depiction of
organs)
-
Order (described location of
organs)
Order of action and Hierarchy
(descriptions)
Order (depicted location of organs)
Order of action and Hierarchy
(depictions)
Generation and
transformation of images (Text and Diagrams)
Table 1: Coding scheme for Part 1 The five variables in Table 1 are: Structure expressed through Text (TS), Function expressed through Text (TF), Structure expressed through Diagram (DS), Function expressed through Diagram (DF) and Visualisation (V). Note that TS, TF, DS and DF were derived from responses to the same set of questions and that scoring for text and diagrams, though independent, followed a common scheme. Illustrations of diagram scores are in Figures 2 and 3. Inter-rater reliabilities estimated through Spearman's rho ranged from 0.65 to 0.84 (p<0.01). Distributions of scores on these variables gave us significant insight into students' understanding and expression. Table 2 summarises the comparisons between mean scores on the five variables. This Table is constructed on the basis of 5X5 paired t-tests on the variables TS, TF, DS, DF and V. Results from all the 5X5 comparisons were completely consistent (p<0.05).
Category of students No. of students
Comparisons of mean scores (t-tests, p<0.05)
All students 70 TS > TF > V > DF > DS .67 > .63 > .57 > .39 > .32
Only students who drew diagrams
41 TS > TF > DF > V > DS .72 > .70 > .65 > .61 > .54
Students who drew no diagrams
29 TS > TF > V .61 > .53 > .50
Table 2: Comparison of mean scores on all variables for the digestive system Table 2 shows that students more effectively expressed themselves through text rather than through diagrams. They also showed a preference towards expression through text: more than a third responded exclusively through text. About 36% students drew no

7
diagrams of the digestive system. Among students who drew diagrams, text scores were significantly higher than diagram scores. Following results on mechanical systems (Heiser and Tversky, 2006) and our own study with 12 students (Mathai and Ramadas, 2006) we anticipated that structure may be better expressed through diagrams than through text, and function may be better expressed through text. The latter hypothesis was confirmed, but to our surprise we found that, on an average, structure concepts too were better expressed through text than through diagrams. Thus text expression was better than diagrams for both structure and function concepts (Table 2). Most student diagrams were stereotypical but imperfect copies of a canonical textbook diagram of the digestive system. Some prevalent errors are described in the next section. High correlations (Spearman's rho) between TS and TF (0.9, p<0.01) and between DS and DF (0.7, p<0.01), indicated a consistency within the text and diagram responses. Between text and diagrams the correlations were somewhat lower (0.3 and 0.4, p<0.01). Re-coding the scores into three categories: Low (0-0.33), Medium (0.34-0.66) and High (0.67-1.00) showed that of 26 students who had "High" text scores, 13 also had "High" diagrams scores while 7 had "Low" diagram scores. Thus a group of high-scoring students were good in both modes, while another group of pure "verbalisers" had minimal facility with diagrams. There were no students who were good with diagrams but not with text. The trends reported so far were consistently replicated with similar questions framed on "basic knowledge" and "visualisation" of the respiratory system, though the absolute scores there were lower than those for the digestive system (Mathai and Ramadas, 2008). Overall, concepts of structure were better expressed than those of function, one exception being that of diagrams of the digestive system (Table 2, Rows 1 and 2), which showed that function was expressed better than structure through diagrams. The anomaly, which occurred only for the digestive system, was probably related to its high level of structural complexity, with 12 organs (versus 8 for the respiratory system) to be depicted in the correct shapes and relative spatial configurations. Specific problems in depicting the digestive system are described in the next section. Conceptual problems Scores assigned to texts and diagrams were based on the assumption of a common underlying conceptual framework. Distributions of these scores Figures 1 (a to d) were sensitive to some widely prevalent conceptual misunderstandings, as described below.

8
Figures 1 (a-d): Anomalous distributions of scores on the digestive system indicating (i) a low incidence of diagrams drawn and (ii) relatively large sub-populations of students with "medium" scores, who turned out to hold common alternative conceptions One observation from Figures 1c and 1d is the high incidence of students not drawing diagrams at all. The other striking aspect of all the distributions is their bimodal nature, with a disproportionately large number of students in the middle. Using the Low, Medium and High categories to sort the original responses we identified discriminating factors between the medium and high-scoring students to be their understanding of accessory organs, namely, the liver and pancreas (the gall bladder was rarely mentioned) and the small intestines. 75% students in the "Medium" category of TS and 82% in the "Medium" category of TF had an incorrect understanding of the location and function respectively of the accessory organs. The most common error was to consider the food to go into the liver and pancreas during digestion (thereby maintaining a linear pathway (Figure 2). The other common error had to with the connections between the stomach / duodenum and small and large intestines. 63% and 60% students in the "Medium" categories of TS and TF located the small intestines incorrectly or misunderstood its role as the site of "absorption". The latter problem may have to do with an inadequate

9
understanding of the link between the digestive and circulatory systems. Figures 2 and 3 illustrate these error-sites through the students' diagrams.
Figure 2: Student's diagram showing a structural connection from the stomach to the large intestine
Figure 3: Student's schematic function diagram showing two common alternative conceptions: food moving into the auxiliary organs and the large intestine ahead of the small intestine

10
Distributions for the respiratory system did not show these anomalies, and it turned out that conceptual misunderstandings about respiration, involving the pharynx, bronchioles, alveoli and diaphragm, were uniformly present across low and medium scoring students. In both systems, an understanding of processes at a macro level, the passage of food or air, was attained by most students, while difficulties arose at the microscopic or chemical level, the action of the liver and pancreas, alveolar action and cellular respiration. Visualisation of the digestive system
Figure 4: Visualisation scores for the digestive system There were 11 sub-questions on visualisation of the digestive system, each carrying four points. The four points for scoring were, i. Generation of an image, ii. correctness of the generated image, iii. manipulation of the generated image and iv. correctness of the manipulation. Inter-observer reliability was 0.65 (p<0.01). The distribution of visualisation scores is shown in Figure 4. Students' performance on visualisation turned out better than their performance on diagrams (Figures 1c and 1d). Recall that the diagram scores were derived from depictions of basic structure or function while visualisation was tested through questions requiring transformations. Here are some common responses to a visualisation question with scores assigned on a four-point scale. Scores took account of the student's entire response relating to structure and function of the food pipe. If the food pipe were longer: - it would take more time for food to travel from the mouth to the stomach (4). - if the food pipe was involved in digestion the food would take a longer to get digested in the food pipe (2).

11
- the location of organs would change because of the increased length thereby disrupting the process of digestion (3). If the food pipe were shorter: - there would be improper digestion (0). - the food pipe serves as a passage to the stomach, so food will reach the stomach faster (4). - There will be no change in the digestive process (1). Looking for way to characterise visualisation in terms of the other variables, we found, for the digestive system, higher correlations of V with the text scores (Spearman's rho=0.6 and 0.5 for TF and TS respectively, p<0.01) than with the diagram scores (rho=0.4 and 0.3 for DF and DS respectively, p<0.05). Of 25 students with high visualisation scores, 18 had high text scores while 9 had high diagram scores. This was not as surprising as it might seem, since most of the visualisation responses could be given in the verbal mode, and most students preferred to do so. Students who could describe the system effectively could also articulate what would happen if structure of the system was different or it was viewed in a different way. Their difficulty lay more in exact depictions on paper than in mental visualisation. Thus we could conjecture that good visualisers were also good verbalisers, but that drawing skills did not necessarily accompany mental visualisation. These results supported observations in our pilot study (Mathai and Ramadas, 2006) that students did not spontaneously generate visual mental images but when presented with a specific task followed by probing questions, they could be persuaded to do so. Further, they found it difficult to depict the generated image on paper, relying rather on words and gestures to demonstrate their understanding. On repeated requests to draw diagrams some students responded that diagrams were difficult to draw, particularly in biology, or that not everyone has the skill to draw. One student suggested that words offer a freedom of expression, which diagrams cannot. Another pointed to the exactness needed when communicating through diagrams: "one single mistake and the whole thing goes wrong." Some positive aspects mentioned were that "pictures are necessary in biology"; "diagrams give an over-all view"; "one has to read and understand written descriptions, but in diagrams that is not necessary" and "it is interesting to draw diagrams unlike writing." Visualisation as defined here was closely predicated on prior knowledge of the domain (we believe this should be so in any science context). Thus, in parallel with scores on basic knowledge, visualisation scores too were significantly higher for the digestive system compared to the respiratory system (t=3.76, p<0.00) (Mathai and Ramadas, 2008). Part 2: Comprehension of texts on structure and function: the predominant role of content

12
How effectively do students comprehend structure and function through text? To address this question we prepared two passages on the digestive system in two different versions: a "structure" version (Part 2A) and a "function" version (Part 2B), administered to two sub-samples of 44 and 34 students respectively. The sub-samples were matched by three levels of ability as judged by their science teacher. The passages went a little beyond the content level of the textbooks at the middle school level. For the purpose of enabling structure-function correlation the selected content had mechanical action predominant in comparison with microscopic or chemical action. The passages, questions and coding schemes are in Mathai and Ramadas (2008). The first passage described the chewing of food. A sample line from the "structure" version: "Incisors are the front teeth which are flat in shape. On both sides of the incisors are the long and pointed canine teeth..." The "function" version stated: "The teeth chew the food in the following way. First the incisors break off a piece of food. Tough foods are torn up by the canines..." A common question for both passages asked students to correlate the shape and location of each kind of tooth with its function. The second passage focused on the mechanism of swallowing (the term "oesophagus" was used here onwards as it was very familiar to students). A sample in the "structure" version: "The oesophagus is a flexible tube. This tube begins at the back of the mouth. The walls of the tube can repeatedly relax and contract to push the food along the oesophagus." The "function" version was: "When food is swallowed, it goes from the mouth into the oesophagus. The food is pushed along with the help of repeated contractions and relaxations of the oesophagus." A common question here was: "How do you think the food is pushed from the mouth to the stomach through the oesophagus? Make a drawing of it." In complex biological contexts the distinction between "structure" and "function" passages was somewhat artificial: either kind of passage could not be completely free of the complementary (function or structure) information, and yet make sense. Consequently the difference lay in emphasis more than in content. For example, in the description of the mouth, the presence of enzymes in the saliva had to be mentioned for the "structure" passage to be readable, and also comparable in content to the "function" passage. Similarly, in the description of swallowing, its mechanical action on the food was unavoidably mentioned. Inter-rater reliability of scores estimated through Spearman's rho was 0.75 (p<0.01).
Mean scores and (s.d.) 2A (Structure
version) 2B (Function
version) Significance
Mann Whitney U Passage 1 (mouth) 0.69 (0.20) 0.67 (0.19) N.S. Passage 2 (oesophagus and stomach)
0.36 (0.23) 0.47 (0.24) z = - 2.0, p < 0.05
Significance Wilcoxon Signed ranks
z = -5.7, p = 0.00 z = -3.7, p = 0.00
Table 3: Effect of content on comprehension of "structure" and "function" passages

13
Table 3 shows that scores on Passage 2 in both versions were lower than the corresponding scores on Passage 1, a difference that might be attributable to prior knowledge. Passage 1 concerned chewing of food in the mouth, a phenomenon that is familiar from prior experience as well as school learning. Passage 2 concerned the mechanical action of the epiglottis, oesophagus and trachea, situations that are further removed from experience, structurally more complex, and also passed over quickly in middle school. Interestingly, though scores on Passage 1 in the structure and function versions were not significantly different, in Passage 2 scores on the function version were higher. Thus the "function" version of Passage 2 enabled students to understand the role of the epiglottis and of mucus and to better depict how the food is pushed from the mouth to the stomach. For passages on the respiratory system we found a generally lower level of comprehension than for the digestive system. The difficult parts had to do with microscopic aspects like ciliary action, peristaltic motion of the bronchioles, alveoli and capillaries. Part 3: Towards a pedagogy of structure-function diagrams Having found that students have a low preference and low competence in expressing themselves through diagrams, and having identified their problems in understanding the micro-level aspects of function, we went about generating and adapting diagrams that might encourage visualisation through connecting of structure with function at the micro level. This study had a strong pedagogical motivation. We prepared structure-function tasks involving diagrams. Table 4 and Figures 5-8 describe those on the digestive system. Figures 6-8 were adapted from the Time Life series (Broderick, 1994). Tasks 1 and 3 used predominantly structure diagrams concerning details of the digestive system. Task 2 was a practical task involving cross-section of an electric cable holding three separate wires. Its purpose was to orient the students towards the notion of cross-section in a situation that was visible to them. Task 4 was based on a structure+function diagram of the large intestines and Task 5 on a predominantly function diagram of the entire digestive system. Score on each task was obtained from several sub-questions testing comprehension of the diagrams and relating of structure with function (Mathai and Ramadas, 2008). Tasks 1-3 were administered to 75 students and Tasks 4-5 to 73 students. Task no. Description Number of
sub-questions
Mean Score and (s.d.)
1 Orientation and arrangement of teeth in lateral (Figure 5) and top views of the jaw
9 0.48 (0.23)
2 Meaning of "cross-section" and cross-sectional view of a given
5 0.42 (0.34)

14
electric cable 3 Location and cross-sections of
oesophagus and trachea (Figure 6)
3 0.23 (0.31)
4 Working of the large intestines (Figure 7)
11 0.46 (0.17)
5 Chemical action in the digestive tract (Figure 8)
9 0.41 (0.24)
Table 4: Structure-function tasks using diagrams
Figure 5: A "structure" diagram showing position and arrangement of different kinds of teeth
Figure 6: Depiction of structure and function at the micro level: Detail of trachea and oesophagus

15
Figure 7: Depiction of structure and function at the macro level: Cartoon of the large intestines
Figure 8: A "function" diagram of digestion The most difficult of the tasks was no.3 (Figure 6), involving comprehension of a magnified view (Wilcoxon's signed ranks, p<0.00). Tasks 1, 2, 4 and 5 turned out to be of moderate difficulty. Part of the problem with Task 3 may have been in understanding the idea of cross-section, which was tested separately in Task 2. We found in the respiratory system too tasks involving cross-sections were relatively difficult. Finally the content may have posed a challenge: the situation of the trachea, oesophagus and epiglottis was found difficult in the text comprehension tasks too.

16
Tasks 4 and 5 (Figures 7 and 8) were particularly interesting because they were meant to convey function. Figure 7, a combination of macro structure with function, was understood fairly well in terms of passage of waste material, but the time labels were less well understood, and labels for the ascending, transverse and descending colons were found uninterpretable by the majority of students. Thus, though structure and sequence were clear to students, the detailed spatial and temporal aspects of the diagram were difficult to comprehend. The reasons may lie in diagrammatic conventions, in language (terminology) or in conceptual understanding. Figure 8 was a schematic function diagram with symbols for the various components of food. Many students had trouble in understanding the use of the key, but more striking was the observation that portions near the beginning and the end of the digestive tract were comprehended better than the portions in the middle. It is in the middle stages that there are several simultaneous reactions happening, resulting in more information to be processed by students. Difficulties in comprehending diagrams related to understanding of cross-sections, microscopic or chemical processes and structure-function relationships. These difficulties were partly related to specific biology knowledge, as also to general aspects of diagrams like conventions, viewpoints and amount of information to be processed. Implications for visual literacy Socio-cultural context India had an ancient and highly exclusive tradition of oral learning. That exclusivity finds reflection in an acute shortage of resources for mass education, even as outdated practices of oral and text-based instruction persist in the vast majority of schools. Specifically this means that even pictures are rare in many State textbooks, let alone availability of videos and animations. Though the situation is changing somewhat, exposure to carefully designed, informative and educative visuals remains low. Added to this is the fact that classroom discourse is driven by requirements of examinations which are predominantly verbal in nature. Students in our sample came from a relatively privileged middle-class background in which typically they would have access to illustrated books, TV and computers. Yet more than a third of them preferred expression solely through text. Text descriptions of both structure and function were more complete and correct than through diagrams. Performance on mental visualisation tasks too was better than that on diagrams. Visuals need to be understood and interpreted within a culture and context. In oral cultures exposure to pictures comes about through schooling. Liddell (1997) found that South African children interpreted less from pictures than their Western counterparts, who used pictures as a bridge to language development. They used pictures in a passive form; labelling and linking associated with picture interpretation progressively decreased through the school years. This is an area of pedagogy that needs attention.

17
Practice helps A significant documented result from previous research is that training plays a role in improving visual skills, and there is better performance in tasks which are situated in a context (Newcombe & Learmonth, 2005). Pedagogical practices that have been suggested for science include hands-on learning, practices which are didactic, depictive, require modelling and encoding, and lead towards creative and intuitive discovery of the emergent properties of a combination of information (Mathewson, 2005). For learning of human body systems we can make some specific recommendations. Visuals and visualisation This study makes a distinction between mental "visualisation", products of which could be expressed verbally, and external depictions or "visuals", which, like text, could be learnt by rote. Our results recall two different kinds of cognitive pathways that have been proposed for processing of drawings: a non-visual pathway, sufficient for routine drawings, going directly from associative to procedural memory; and a visual-imagery pathway involving long-term visual memory and top-down hypothesis testing (Guérin et al., 1999). Pedagogy in schools may at times bypass the visual imagery pathway, leading to routine processing of drawings. Diagrams in Indian textbooks often inadequately supplement text-based information. Rarely is there any cross-referral between text and diagrams. Dual coding of content could be facilitated by linking text with diagrams within textbooks and through classroom discourse. Text should refer to and make use of the spatial information contained in diagrams, encouraging students to switch from one to the other in meaningful sequence. The disconnect seen between internal "visualisation" and external "visuals" could be mended through this practice. Interweaving flexibly between the verbal and visual is a skill to be developed not only while reading text and diagrams but also while moving from dynamic visuals such as videos, to written or spoken description and back. Models, computer-aided 3D visualizations and animations could further activate multiple modes of representations. Design of diagrams We emphasise 2D line drawings for their low cost and accessibility in the Indian context and also for their power of simplification. Though overtly simplistic, line drawings abstract out relevant details and provide useful cues to understand complex situations. It seems a worthwhile pedagogical exercise to design a wide variety of diagrams to convey structure and function in biology, while sensitising students to a range of visuals within the genre of line drawings. The range includes depictive, detailed drawings, more abstracted, schematised drawings with significant features highlighted, or without any depictive component at all (using only boxes, arrows, lines, etc.). Diagrams could be drawn from different orientations or viewpoints, they might show relationships between external appearance and internal structure, as in various types of cross-sections. One could have drawings that convey chemical processes, make use of a key and show dynamic processes using symbols.

18
We need to encourage use of schematic diagrams especially since biology teaching in school tends to rely exclusively on depictive, exact representations. Schematic representations are less dependent on drawing skills, and at the same time provide affordances to convey structure-function relationships. Diagrams should be designed that can be used as tools for thinking through situations, and specifically promote inferences from structure to function and vice versa. Comprehension of such diagrams is not a given. In designing diagrams for pedagogy one needs to introduce visual vocabulary in a gradual way, giving careful attention to symbols, conventions and complexity. Finally one needs to pre-test diagrams with the student populations with whom they are to be used. Role of domain knowledge Most cognitive strategies depend for use on prior knowledge of content, and visualisation is no exception. If prior knowledge can be relied upon then it frees up available resources for coordination within cognitive components (Pressley and Hilden, 2006). There is danger of circularity here when one is talking about the relationship between the use of visuals and effectiveness of learning. Ideally one would begin with familiar content to introduce new diagrammatic and discourse techniques which could in turn be used to tackle more difficult content. Learning styles It is often suggested some children have a greater propensity to use visual images and drawings, or use a more visual style of thinking. Alcock and Simpson (2004) found that visual thinkers tend to introduce diagrams during interview tasks, gesture while explaining arguments, explicitly indicate a preference for thinking with pictures or making diagrams, refer to a sense of meaning derived from a source other than formal expressions, may be quickly convinced about the correctness of their conclusions, and may overlook formal definitions. Though we identified a group of exclusively verbal students in our sample, we were not able to find any exclusively visual students. Use of diagrams was rare, yet there was evidence for mental visualisation related with overall good performance in other tasks. This result was possible through a methodology of testing on a large sample. To identify consistently visual thinking styles one would need data over much longer interaction in dynamic interview situations. That is yet another direction for further research. References Ainsworth, S. E. & Iacovides, I. (2005) Learning by constructing self-explanation diagrams. Paper presented at the EARLI conference, Cyprus, August 05. Ainsworth, S. E. and Loizou, A. T. (2003). The effects of self-explaining when learning with text or diagrams. Cognitive Science, 27(4), 669-681. Alcock, L. and Simpson, A. (2004). Convergence of sequences and series: interactions between visual reasoning and the learner's beliefs about their own role. Educational Studies in Mathematics 57, 1-32.

19
Briggs, M. and Bodner, G. (2005). A model of molecular visualization. In Gilbert, J. K. (Ed.) Visualization in Science Education, Dodrecht, The Netherlands: Springer. Broderick, M. (Ed.) (1994). The Human Body. Time Life's Illustrated World of Science. Hong Kong: Time Life Inc. Carey, S. (1985). The Human Body. In Conceptual Change in Childhood, Cambridge, MA: Bradford books, MIT Press Clark, J. M. and Paivio, A. (1991). Dual coding theory and education. Educational Psychology Review, 3(3), 149-170. Gellert, E. (1962). Children's conceptions of the content and functions of the human body. Genetic Psychology Monographs, 65, 292-411. Guérin, F., Ska, B. and Belleville, S. (1999). Cognitive Processing of Drawing Abilities. Brain and Cognition, 40, 464-478. Heiser, J. and Tversky, B. (2006). Arrows in comprehending and producing mechanical diagrams. Cognitive Science, 30(3), 581-592. Kierns, C. (1999). Seeing patterns: visual evidence and pictorial communication in the work of Barbara McClintock. Journal of the History of Biology 32, 163-196. Kosslyn, S.M. (1994). Image and Brain: the Resolution of the Imagery Debate. Massachusetts: the MIT Press. Liddell, C. (1997). Every picture tells a story - or does it? Young South African children interpreting pictures. Journal of Cross Cultural Psychology, 28, 266-283. Mathai, S. and Ramadas, J. (2006). The visual and verbal as modes to express understanding of the human body. In Barker-Plummer, D., Cox, R. and Swoboda, N. (Eds.), Diagrammatic Representation and Inference, LNAI 4045, pp 173-175. Berlin: Springer-Verlag. Mathai, S. and Ramadas, J. (2008). Questionnaires, coding schemes and selected results for "Visuals and visualisation of human body systems”. Retrieved December 13, 2008, from http://www.hbcse.tifr.res.in/vthinking1. Mathewson, J. H. (2005). The visual core of science: definition and applications to education. International Journal of Science Education, 27 (5), 529-548. Newcombe and Learmonth, A. (2005). The development of spatial competence. In Shah, P. and Miyake, A. (Eds.), Handbook of Visuospatial Reasoning (pp. 213-256). New York: Cambridge University Press. Piaget, J. and Inhelder, B. (1966). Mental Imagery in the Child. London: Routledge. Pressley, M. and Hilden, K. (2006). Cognitive Strategies. In William, D. et al (Eds.) Handbook of Child Psychology, 6th Edition, Vol 2: Cognition, Perception and Language. New Jersey: John Wiley. Ramadas, J. and Nair, U. (1996). The system idea as a tool in understanding conceptions about the digestive system. International Journal of Science Education, 18 (3), 355-368. Reiss, M. J. and Tunnicliffe, S. D. (2001). Students' understandings of human organs and organ systems. Research in Science Education, 31, 383-399. Netherlands: Kluwer Academic Publishers. Ronan, C. A. (1983). The Cambridge Illustrated History of the World’s Science. New York: Cambridge University Press. Schnotz, W. (2002). Towards an integrated view of learning from text and visual displays. Educational Psychology Review, 14(1), 101-119.

20
Sharma, P. V. (1992). History of Medicine in India (from antiquity to 1000 A.D.). New Delhi: Indian National Science Academy. Shepard, R. N. and Metzler, J. (1971). Mental rotation of three-dimensional objects. Science, 171, 701-3. Simon, M. A. (1996). Beyond inductive and deductive reasoning: the search for a sense of knowing. Educational Studies in Mathematics 30, 197-210. Tversky, B. (1999). What does drawing reveal about thinking? In J. S. Gero & B. Tversky (Eds.), Visual and spatial reasoning in design. (pp. 93-101). Sydney, Australia: Key Centre of Design Computing and Cognition.