Vision - COL Financial
84
-
Upload
khangminh22 -
Category
Documents
-
view
1 -
download
0
Transcript of Vision - COL Financial

VisionTo provide unparalleled service to our customers by empowering them with knowledge, tools and wealth-building programs to help them achieve their financial goals.
MissionTo empower individual investors to take control of their financial lives by delivering the most useful and ethical financial products and services driven by our core competence in technology and market expertise, and guided by our core values of customer focus, innovation, operating discipline and teamwork, thereby maximizing value for our shareholders.
ContentsCOL Financial Wins Bell Award
About COL Financial Group, Inc.
What We Do
Chairman’s Message
President’s Report
Operational Highlights
Chief Financial Officer’s Message
Board of Directors
Management Team
Year Highlights
Corporate Governance
Corporate Social Responsibility
Statement of Management’s Responsibility
Independent Auditors’ Report
Financial Statements
1
2
4
6
10
12
14
18
20
22
25
26
27
29

COL FINANCIAL GROUP, INC., the country’s leading and fastest-growing online stockbrokerage firm, was recognized by the Philippine Stock Exchange for Corporate Governance in the Large Trading Participant Category in the 1st PSE Bell Awards. The PSE launched the Bell Awards in December 2011 to honor the best of the over 200 listed firms and over 130 brokers that complied with the Exchange’s corporate governance guidelines.
COL FINANCIAL GROUP INC. WINS THE PSE BELL AWARD FOR CORPORATE GOVERNANCE
COL Chairman Edward K. Lee, Vice Chairman Alexander Yu and President & CEO Dino Bate with the PSE Bell Award
“My father used to say: “Unless you’re a big boy, don’t play in the stock market. You will only get burned.” Perhaps this was true in those not-so-distant times. But now, there is true and sustained confidence in the country - built not on rumors, but on genuine performance. Today, confidence is growing, because the market looks at the solidity of listed firms, and no longer worries about impunity on the part of people who think they can pull one over investors. The result is the growing of the stock market itself, as it becomes an increasingly attractive proposition for investors.”
- President Noynoy AquinoExcerpt from the President’s Speech at the
Philippine Bell Awards, December 2011
COL 2012 ANNUAL REPORT 1

2
The concept of online trading in the Philippines began as an attempt to introduce non-traditional investment channels to actual and potential stock market investors.
That alternative provided by COL Financial’s predecessor, CitisecOnline, has now grown by leaps and bounds, offering opportunities that were not conceived of before.
COL Financial Group Inc. provides top speed, reliable, accurate investment execution for its diverse mix of clients. Its popularity and accessibility have enabled the company to
grow its client base as well as its share to the overall trades in the Philippine equities market.
By doing what it does best, COL Financial has earned not only the trust of investors but also regulators. In 2012, it was given the prestigious Bell Award for Corporate Governance – a testament to its commitment to integrity and excellence in a business driven by trust.
COL Financial also provides numerous value-added services to both its customers and the general investing public.
WHAT WE DO
Since 2008, it has ranked number 1 broker in the Philippines Stock Exchange in terms of number of transactions executed. In 2011, COL registered over 20% overall market share of trades executed, besting over 130 local and foreign brokers.
With its customer-focused strategy, it aims to continually enhance its online trading platform and provide value-added services to further improve the online trading experience and empower them to make better-informed investment decisions.
Committed to provide Value, Innovation, Trust and Service, COL is well-positioned
to capitalize both on the anticipated development of the capital markets as well as the vast opportunities of increasing the retail investor base in the Philippines.
In February 21, 2012, the Securities and Exchange Commission approved the corporate change in name from CitisecOnline.com, Inc. to COL Financial Group, Inc. As the former name has its legal limitations which prevents us from offering our customers a wider range of products and services, COL Financial Group, Inc. will now be able to expand within its expertise in the stockbrokerage industry, and continue to create the best value for its customers.
ABOUT COL FINANCIALCOL Financial Group Inc. is the leading online stockbroker in the Philippines today. With over 45,000 customers and over Php34 Billion in assets, it has built itself as a formidable institution and a force to reckon with in the stockbrokerage industry.
2

3
Credit within 30 minutes for new fund deposits
Email confirmations for all account movements
and Dividend credits within the day
INVESTING MADE MORE UNDERSTANDABLE
Over 200 seminars = 1 Seminar Every Other Day
COL Financial delivers outstanding stock brokerage services.
COL Financial provides top-quality research and investment advice.
COL Financial supports the development of the Philippine capital market.
That COL Financial is the leading stock broker in the Philippine Stock Exchange in terms of number of transactions is no accident.
Being a pioneer in providing an online trading platform to its clients, the company knows that having the best hardware and software infrastructure is key to delivering the best brand of trading service.
Various products like the Easy Investment Program and the Margin Account Facility also provide options to investors of varying orientations and appetites.
Prompt and personalized service is a priority. There is a dedicated team that regularly reaches out to active investors and a private client group that takes care of the investment requirements of premium customers.
The result? More than 45,000 customers are trading with COL Financial – and the number is still growing.
For COL Financial, a successful investor is an empowered investor. He or she is smart, attuned, and knows exactly what he or she wants from the market.
The Company provides daily, weekly and monthly reports to its clients. Fundamental and technical analyses are given by a dynamic pool of analysts who have both training and experience in interpreting economic and corporate developments as they apply to investment decisions.
“COL”ing the Shots, a new research product, offers in-depth analyses of specific companies.
A continuing financial literacy program is COL Financial’s advocacy. Investment advice is not telling investors what to do but guiding them as they make intelligent and prudent decisions. Clients are also given pointers on how to read financial reports and appreciate business information on their own.
The economic environment in the Philippines, with the government’s reform agenda, vibrant output growth and a thriving middle class, makes the development of capital markets, specifically the equities market, a foregone conclusion.
Indeed, equity trading is not limited to high net-worth individuals. Retail investors are also encouraged to participate in equities trading and thus create more wealth for themselves and for their families.
COL Financial is in a position to generate continued interest in the Philippine stock market, specifically as more and more retail investors come in. Its continuing education and financial literacy program envisions an economy driven by intelligent investors with an appetite for other means of wealth generation aside from the traditional savings instruments.
The response has been overwhelming. More and more
potential investors are signing up for the investor education
program – an indication of the Filipino
investor’s readiness to embrace newer
and bigger things.
COL 2012 ANNUAL REPORT 3

The CHAIRMAN’S
MESSAGE
CHAIRMAN’S MESSAGE
“OUR ROLE REMAINS TO HELP THE FILIPINOS BUILD THEIR KNOWLEDGE BASE AND INSTILL THE DISCIPLINE OF INVESTING WISELY FOR THE LONGER TERM.”
4
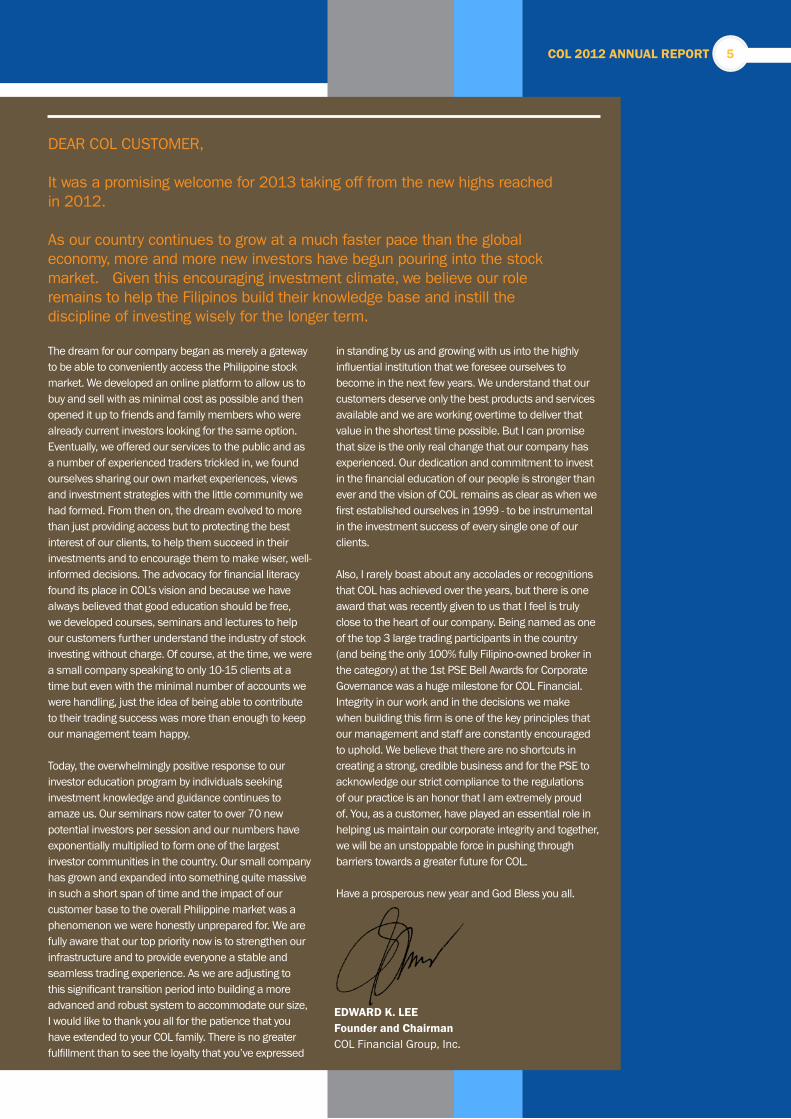
in standing by us and growing with us into the highly influential institution that we foresee ourselves to become in the next few years. We understand that our customers deserve only the best products and services available and we are working overtime to deliver that value in the shortest time possible. But I can promise that size is the only real change that our company has experienced. Our dedication and commitment to invest in the financial education of our people is stronger than ever and the vision of COL remains as clear as when we first established ourselves in 1999 - to be instrumental in the investment success of every single one of our clients. Also, I rarely boast about any accolades or recognitions that COL has achieved over the years, but there is one award that was recently given to us that I feel is truly close to the heart of our company. Being named as one of the top 3 large trading participants in the country (and being the only 100% fully Filipino-owned broker in the category) at the 1st PSE Bell Awards for Corporate Governance was a huge milestone for COL Financial. Integrity in our work and in the decisions we make when building this firm is one of the key principles that our management and staff are constantly encouraged to uphold. We believe that there are no shortcuts in creating a strong, credible business and for the PSE to acknowledge our strict compliance to the regulations of our practice is an honor that I am extremely proud of. You, as a customer, have played an essential role in helping us maintain our corporate integrity and together, we will be an unstoppable force in pushing through barriers towards a greater future for COL. Have a prosperous new year and God Bless you all.
DEAR COL CUSTOMER,
It was a promising welcome for 2013 taking off from the new highs reached in 2012.
As our country continues to grow at a much faster pace than the global economy, more and more new investors have begun pouring into the stock market. Given this encouraging investment climate, we believe our role remains to help the Filipinos build their knowledge base and instill the discipline of investing wisely for the longer term.
The dream for our company began as merely a gateway to be able to conveniently access the Philippine stock market. We developed an online platform to allow us to buy and sell with as minimal cost as possible and then opened it up to friends and family members who were already current investors looking for the same option. Eventually, we offered our services to the public and as a number of experienced traders trickled in, we found ourselves sharing our own market experiences, views and investment strategies with the little community we had formed. From then on, the dream evolved to more than just providing access but to protecting the best interest of our clients, to help them succeed in their investments and to encourage them to make wiser, well-informed decisions. The advocacy for financial literacy found its place in COL’s vision and because we have always believed that good education should be free, we developed courses, seminars and lectures to help our customers further understand the industry of stock investing without charge. Of course, at the time, we were a small company speaking to only 10-15 clients at a time but even with the minimal number of accounts we were handling, just the idea of being able to contribute to their trading success was more than enough to keep our management team happy. Today, the overwhelmingly positive response to our investor education program by individuals seeking investment knowledge and guidance continues to amaze us. Our seminars now cater to over 70 new potential investors per session and our numbers have exponentially multiplied to form one of the largest investor communities in the country. Our small company has grown and expanded into something quite massive in such a short span of time and the impact of our customer base to the overall Philippine market was a phenomenon we were honestly unprepared for. We are fully aware that our top priority now is to strengthen our infrastructure and to provide everyone a stable and seamless trading experience. As we are adjusting to this significant transition period into building a more advanced and robust system to accommodate our size, I would like to thank you all for the patience that you have extended to your COL family. There is no greater fulfillment than to see the loyalty that you’ve expressed
EDWARD K. LEEFounder and ChairmanCOL Financial Group, Inc.
COL 2012 ANNUAL REPORT 5

PRESIDENT’S REPORT
The PRESIDENT’S REPORT
“WE CONTINUE TO FOCUS ON THE BUILDING BLOCKS OF CLIENT AND ASSET GROWTH WHICH WE BELIEVE WILL TRANSLATE TO LONG-TERM EARNINGS GROWTH AND VALUE CREATION.”
6
COL 2012 ANNUAL REPORT
2011
7
Expanded COL’s Market in the PSE
2012
*PSE Overall ranking improved from #8 to #7
6.9%
7.8%
2011
Total Assets (in PhpBil)
2012
3.5%
4.2%
21%
2011
Increase in Market Share of Transactions
2012
21%
24%
#1 Broker in terms of number of transactions executed
COL 2012 ANNUAL REPORT 7
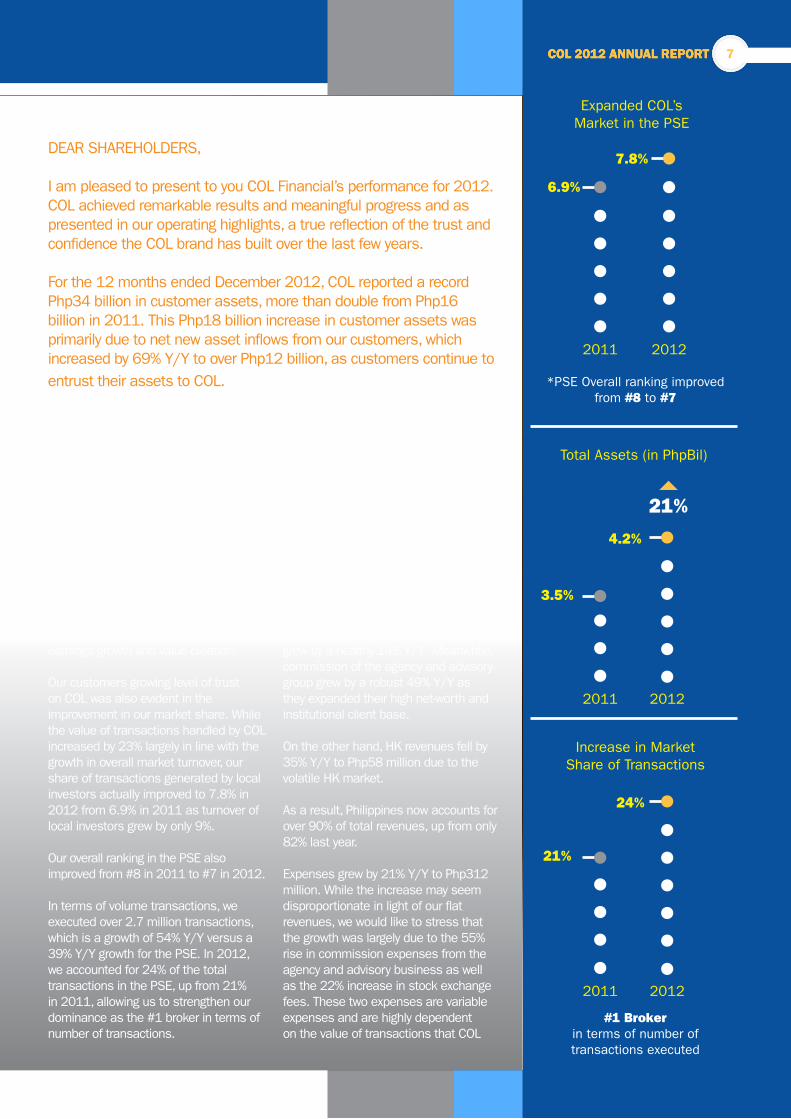
DEAR SHAREHOLDERS,
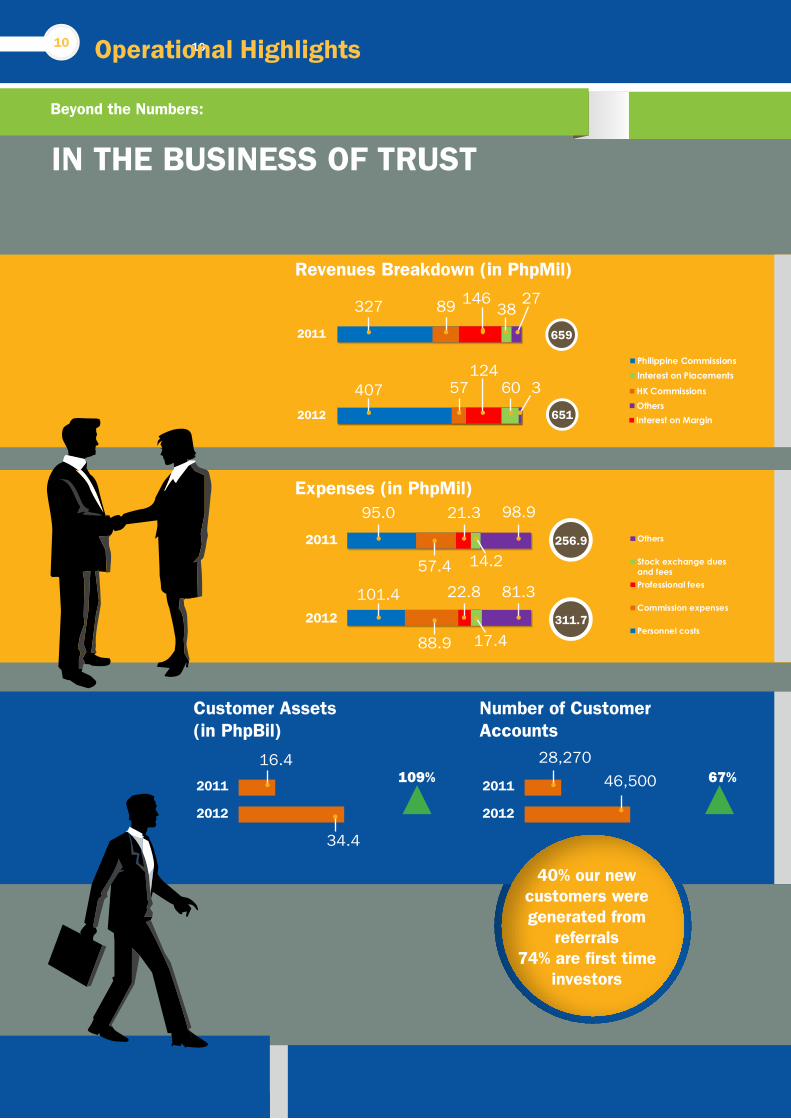
I am pleased to present to you COL Financial’s performance for 2012. COL achieved remarkable results and meaningful progress and as presented in our operating highlights, a true reflection of the trust and confidence the COL brand has built over the last few years.
For the 12 months ended December 2012, COL reported a record Php34 billion in customer assets, more than double from Php16 billion in 2011. This Php18 billion increase in customer assets was primarily due to net new asset inflows from our customers, which increased by 69% Y/Y to over Php12 billion, as customers continue to entrust their assets to COL.
The strong growth in customer assets was made possible as COL’s total customer base reached 46,500, up by 66% Y/Y from only 28,000 in 2011. More importantly, 40% of our new customers were generated from referrals, while 74% are first time investors in the stock market. This is a result of our unwavering commitment to educate and expand the retail investor base.
We continue to focus on the building blocks of client and asset growth which we believe will translate to long-term earnings growth and value creation.
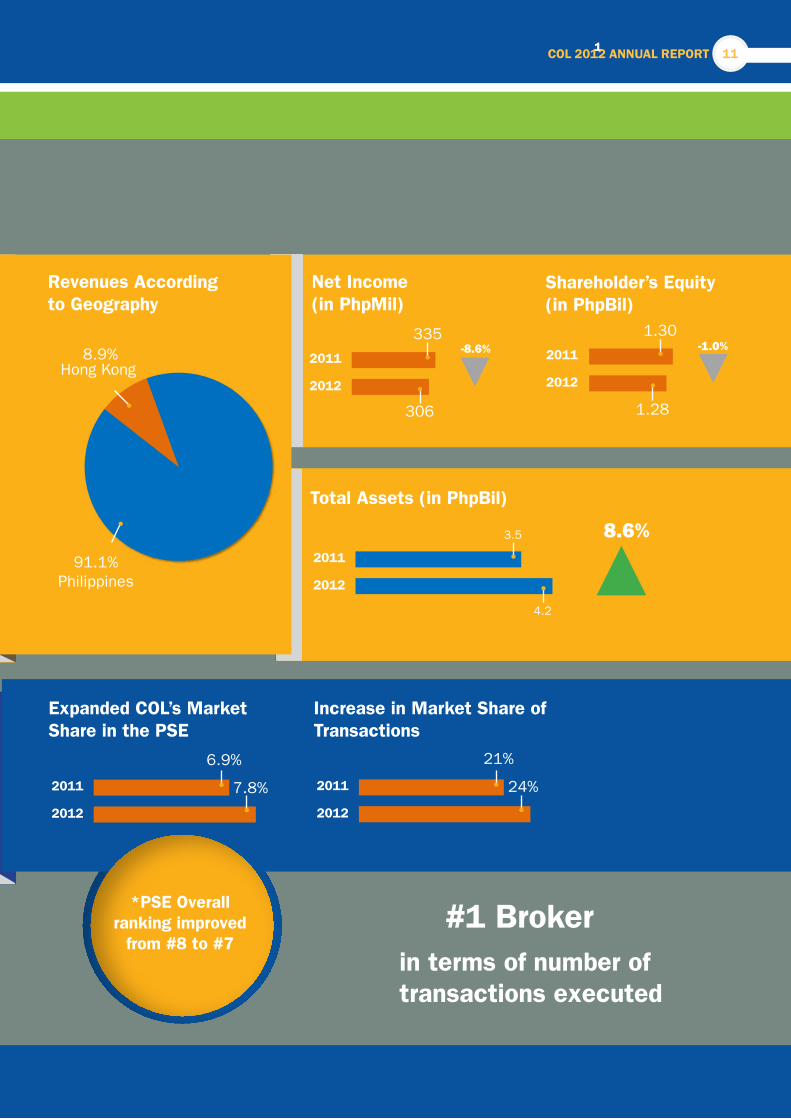
Our customers growing level of trust on COL was also evident in the improvement in our market share. While the value of transactions handled by COL increased by 23% largely in line with the growth in overall market turnover, our share of transactions generated by local investors actually improved to 7.8% in 2012 from 6.9% in 2011 as turnover of local investors grew by only 9%.
Our overall ranking in the PSE also improved from #8 in 2011 to #7 in 2012.
In terms of volume transactions, we executed over 2.7 million transactions, which is a growth of 54% Y/Y versus a 39% Y/Y growth for the PSE. In 2012, we accounted for 24% of the total transactions in the PSE, up from 21% in 2011, allowing us to strengthen our dominance as the #1 broker in terms of number of transactions.
COL’s consolidated revenues were flat at Php651 million as the strong performance of Philippine operations was offset by the weaker performance of the HK business.
Philippine revenues grew by 10% Y/Y to Php593 million, driven by the 24% growth in commissions. However, stripping out the non-recurring gains booked in 2011, Philippine revenues grew by a faster pace of 15% Y/Y. Commissions from our self-directed accounts continued to account for two-thirds of our commission revenues which grew by a healthy 14% Y/Y. Meanwhile, commission of the agency and advisory group grew by a robust 49% Y/Y as they expanded their high net-worth and institutional client base.
On the other hand, HK revenues fell by 35% Y/Y to Php58 million due to the volatile HK market.
As a result, Philippines now accounts for over 90% of total revenues, up from only 82% last year.
Expenses grew by 21% Y/Y to Php312 million. While the increase may seem disproportionate in light of our flat revenues, we would like to stress that the growth was largely due to the 55% rise in commission expenses from the agency and advisory business as well as the 22% increase in stock exchange fees. These two expenses are variable expenses and are highly dependent on the value of transactions that COL
COL 2012 ANNUAL REPORT 7

THE PRESIDENT’S REPORT
handles. As far as the other expenses are concerned, the total amount increased by only 11.0%, at par with budgeted levels. We only increased expense on items that were necessary to support our expanding customer base, as the company remains focused on operating discipline.
Pre-tax operating margin for 2012 fell to 52% but remains well above the average of 39% for online brokers globally. Our margin declined primarily as a result of the weak performance of HK and the growth in the agency business which is a lower margin business.
Overall, our net income fell by 8.6% Y/Y to Php306 million.
As of end 2012, consolidated net assets grew by 21% to Php4.2 billion. This was largely due to the increase in our cash to Php2.6 billion, supported by the significant amount of funds deposited by our customers, a testament to their increasing level of trust in COL.
Stockholders’ equity was flat at Php1.3 billion as the payment of Php280 million worth of cash dividends during the year was offset by the booking of Php306 million worth of profits. COL’s ROE remained very healthy at 24% in 2012, allowing us to maintain our position as the most profitable listed broker in Asia.
This year, we will also pay COL stockholders as of April 1, 2013 Php0.63/share in cash dividends as we remain focused on the efficient use of funds. While our net income was flat in 2012, we believe that we should look beyond this number and instead focus on the building blocks of client and asset growth, which should translate to long-term earnings growth and value creation as the economic environment improves.
Our business will continue to grow exponentially as we make our customers our priority by delivering a safe, reliable, accessible,
understandable and value-driven service for successful investing. Therefore, in our organization, TRUST REALLY MATTERS. In order for us to maintain our clients’ trust, we operate at a high level of integrity and create better ways to serve our customers. In 2012, we upgraded once more our hardware and software infrastructure; expanding our ISP bandwidth by 20% and lease line capacity between COL and the PSE by 150%. To further improve our transaction speed and capacity, we increased our order processing and market data processing capability by 100% and the number of web servers by 28%. Our Makati Data Center is now fully operational with our Tektite Data Center as our backup, covering our contingency measures to ensure system reliability.
As with previous years, we have been able to effectively manage our
costs and deliver on our service levels through the
efficient use of resources and our adherence to a strict operating discipline. We continue to capitalize on the use of technology by automating our processes while managing the same headcount throughout
the organization.
As we scale our business to support our growth, measures
continued to be in place to uphold transparency and security in our
customers’ transactions as well as improve our service levels. In 2012, we have been able to significantly improve on our delivery of services, such as the crediting of new fund deposits within 30-minutes from the time the notice has been sent by the bank as against same day credit in the past. Furthermore, email confirmations for all account movements and dividend credits are now received by the client within the same day.
In our effort to make investing in stocks more understandable, we continue to dedicate a significant amount of our resources in our investor education and financial literacy campaigns. We held over 200 seminars in 2012, equivalent to holding a seminar every other day throughout the year.
“WE BELIEVE THAT THE BEST LONG-TERM GROWTH
STRATEGY IS ONE THAT PUTS OUR CUSTOMERS FIRST. AND THAT SIMPLY MEANS THAT WE WILL HAVE TO BE AND WILL
CONTINUE TO BE THE BEST IN EVERYTHING WE DO.”
8

We also increased the number of seminars we offered. We introduced a new seminar on “How to better understand research reports”, and held our market briefings in larger venues such as the Meralco Theater and the Newport Performing Arts Theater. Our briefings are also immediately available online through our YouTube channel to accommodate those who were unable to attend the events.
Focus on our customers continues to be our first priority by providing a prompt and more personalized service to them. Our Customer Service Hotline is now fully capable of handling more calls as we converted our analog lines to digital and upgraded our phone system to respond to the growing needs of our customers. Our Customer Relationship Managers regularly touch base with our more active customers, promptly addressing account and service requirements. Our Private Client Group have effectively been able to attract the higher net worth individuals who seek more personalized service and guidance in managing their portfolios.
Furthermore, we introduced a new research product, “COLing the Shots”, a monthly publication of timely and actionable ideas by our highly respected and well-followed Head of Research, April Tan.
We continue to develop stronger relationships with our customers, building their trust and looking out for their best interest, without any compromises in any part of our business.
We are proud that the Philippine Stock Exchange recognized our efforts as a respected member of the Exchange and awarded us the first Philippine Stock Exchange’s Bell Award on Good Governance in 2012. This prestigious award is a testimony that COL has met the highest standards and strict requirements for corporate governance in the PSE. This recognition is a true reflection of our corporate DNA—passion, integrity, commitment, excellence and teamwork.
2013 and Beyond
We live in very interesting times. In fact, I believe we are entering the Golden Period in the history of the Philippines where prosperity and opportunities come together. The country has recently received a significant milestone as the Fitch Ratings raised the Philippines credit rating to investment grade. Furthermore, there
is growing confidence in the government and business enterprises.
I am very confident that this too will be a promising time for COL Financial if we continue to build on our values and do what we do best. With our core competence and expertise in equities and financial literacy, coupled with our commitment to create value for our customers in making them successful investors, our growth potential is vast. With our expansive reach and our formula for smarter and self-directed investing, we will continue to develop a new breed of investors who will be able to confidently take control of their own investments and achieve their financial goals.
We will become the financial services partner for our customers in building genuine wealth, by being more than a stockbroker. We are developing new products and services to better cater to our customers’ individual needs.
We will remain diligent in effectively managing our resources with a strict operating discipline as we find creative ways of enhancing our processes and back-end support and infrastructure.
And we will remain passionate and committed to our role in nation building through our financial literacy advocacy for all Filipinos through our investor education campaigns.
We believe that the best long-term growth strategy is one that puts our customers first. And that simply means that we will have to be and will continue to be the best in everything we do.
CONRADO F. BATEPresident & CEOCOL Financial Group Inc.
COL 2012 ANNUAL REPORT 9
10 Operational Highlights
2738
14689327
2011 659
360124
57407
6512012
327407
8957
146 124
38 6027 3
2011 2012Philippine Commissions HK Commissions Interest on MarginInterest on Placements Others
327407
8957
146 124
38 6027 3
2011 2012Philippine Commissions HK Commissions Interest on MarginInterest on Placements Others
327407
8957
146 124
38 6027 3
2011 2012Philippine Commissions HK Commissions Interest on MarginInterest on Placements Others
95.0 101.4
57.4 88.9
21.3 22.814.2 17.4
68.9 81.3
2011 2012
Others
Stock exchange duesand feesProfessional fees
Commission expenses
Personnel costs
2011
98.9
14.2
21.3
57.4
95.0
256.9
2012
81.322.8101.4
17.488.9
311.7
Expenses (in PhpMil)
2011
2012
16.4
34.4
109%
Customer Assets (in PhpBil)
2011
2012
28,270
46,500 67%
Number of Customer Accounts
40% our new customers were generated from
referrals74% are first time
investors
IN THE BUSINESS OF TRUST
Revenues Breakdown (in PhpMil)
Beyond the Numbers:
10
11
2011
2012
335
306
-8.6%
Net Income (in PhpMil)
8.9%
91.1% Philippines
Hong Kong
Revenues According to Geography
2011
2012
-1.0%
Shareholder’s Equity (in PhpBil)
1.28
1.30
4.2
2011
2012
3.5 8.6%
Total Assets (in PhpBil)
2011
2012
6.9%
7.8%
Expanded COL’s Market Share in the PSE
2011
2012
21%
24%
Increase in Market Share of Transactions
*PSE Overall ranking improved
from #8 to #7#1 Broker
in terms of number oftransactions executed
COL 2012 ANNUAL REPORT 11
1.30
1.28
The CHIEF
FINANCIAL OFFICER‘SMESSAGE
CHAIRMAN’S MESSAGE
‘11 ‘12‘10‘09‘08
‘11 ‘12‘10‘09‘08
2,128
5,122
11,962
16,447
34,359
44,502
+104.5%
6,309
8,716
15,345
28,067
46,536
55,891
+67.1%
Client Equity (In Php Mil)
Client Base
12

from Php2.1Billion to Php2.6Billion as our total cash from clients expanded by 40%.
Given COL’s healthy profitability and strong balance sheet, we will give out Php0.62/share in cash dividends. This is equivalent to almost 100% of our recurring profits for the year, providing you, our shareholders a dividend yield of more than 3.0%.
Although profits fell in 2012, this was largely due to rising expenses and the weak revenues from our Hong Kong operations. The 21% year-on-year increase in expenses is largely attributable to the rise in commission expenses from our expanding agency advisory business, which should only grow in line with this business group. Furthermore, investments were made to build a more robust infrastructure and increase our capacity in anticipation for the exponential growth of our client base, this year and beyond. Although our Hong Kong business continues suffer from the weak performance of the Hong Kong stock market, it remains profitable and only accounts for 8.9% of total revenues from a high of 90% in 2008.
Although consolidated net income fell during the year, our profitability as measured by return on average equity (ROAE) remained very attractive at 23.7%, establishing COL as the most profitable listed stock brokerage firm in Asia.
In summary, while 2012 was not COL’s best year in terms of profitability, we have built the necessary resources and capabilities to meet the growing needs of our client base, which will allow us to deliver stronger earnings and profitable growth for the years to come.
Although the business performance may seem disappointing at first, COL Financial’s true strength lies in its deliberate and strategic efforts to sustain the business over the long-term.
Let us take a look at the ways that COL has made meaningful progress in 2012.
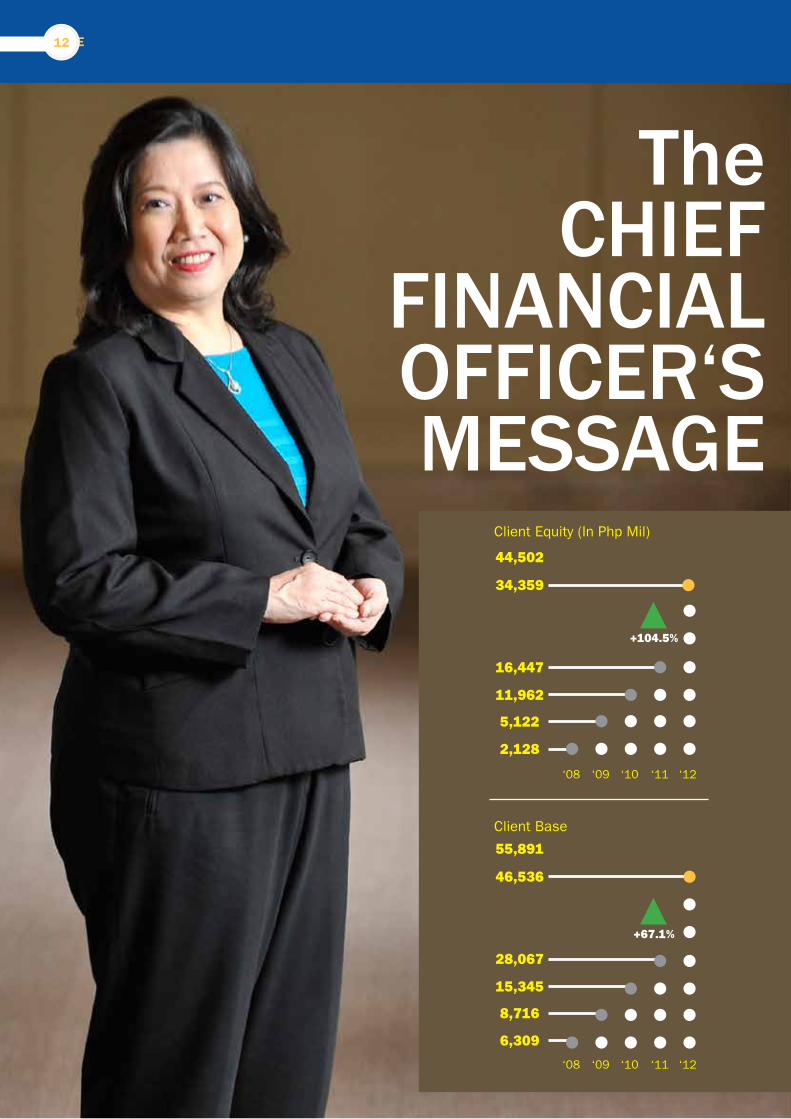
First and foremost, we maintained our momentum for growth in terms of client acquisition and asset gathering. COL client base increased by 68% to 46,636 while client assets more than doubled from Php16.5Billion to Php34.4Billion in 2012 after increasing by a 3-year CAGR of 64% in new clients and 98% in new client assets.
We managed to grow our client assets at the same pace of 104.5% year on year despite the significant growth registered for the past 3 years of 98%. More importantly, net new asset flows reached Php6.9Billion, accounting for the 39% increase in client equity. We believe that in our basic operating model, client growth will ensure the sustainability and growth of earnings over the long-term.
Due to the said factors, commission revenues from COL’s Philippine operations jumped by 24% to Php406.5 Million in 2012. More importantly, your company was able to maintain its leading position in the Philippine Stock Exchange as a testament of the Filipino investors’ growing level of trust in COL. In terms of volume of transactions, COL’s market share jumped to 23% in 2012 from 21% in 2011, strengthening its position as the number one stock broker in the PSE. In value terms, COL improved its rank from number 8 to the 7th largest stockbroker, handling Php150.4 Billion worth of transactions. Market share in terms of total value of local transactions handled also increased by 90 basis points to 7.8% from 6.9% during the previous year.
COL’s balance sheet continues to be very healthy, as we remain debt-free. Total assets grew by 22% to Php4.1Billion from Php3.6Billion from the previous year. This was largely brought about by the growth in our cash position of 21%
CATHERINE L. ONGChief Financial OfficerCOL Financial Group, Inc.
BEYOND THE NUMBERS
At a glance, COL Financial’s financial figures may look unexciting, given that consolidated revenues was flat while net income was down 8.6% versus the previous year. Consolidated revenues for 2012 were Php651Million while net income was Php306Million versus Php335Million in 2011.
COL 2012 ANNUAL REPORT 13

BOARD OF DIRECTORS14
1 2 3
4 5 6

COL 2012 ANNUAL REPORT 15
1 EDWARD K. LEEChairman
Edward K. Lee, 57, Filipino, is concurrently the Chairman of the Board of COL since 1999, COL Securities (HK) Limited since 2001, and Citisecurities, Inc. since 1986. He has also been the Chairman and Chief Executive Officer of the CWC Group of Companies which include CWC Development, Inc., Barrington Carpets, Inc., Citimex, Inc. and CWC International, Inc. for the past 30 years. Mr. Lee served as a nominee of Citisecurities, Inc. to the Manila Stock Exchange and presently to the Philippine Stock Exchange. He was elected as one of the Governors of the Philippine Stock Exchange and was the Chairman of the Computerization committee of the Manila Stock Exchange and PSE in 1994. He went on to become a member of the Board of Directors of A. Soriano Corporation serving for two terms. Mr. Lee was also nominated to the 2007 Entrepreneur of the Year Philippines by Ernst & Young.
3 ALEXANDER C. YUVice-Chairman Alexander C. Yu, 57, Filipino, is currently the Vice Chairman of COL since 1999 and the Vice Chairman and Treasurer of Citisecurities, Inc. since 1986. He is also currently a Director of COL Securities (HK) Limited since 2001 and also of Winner Industrial Corp. for more than 10 years. He is the proprietor of Trans-Asia General Merchandise and in 1997, served as a Director of A. Soriano Corporation.
4 CATHERINE L. ONGDirector, Senior Vice President, Chief Financial Officer and Treasurer Catherine L. Ong, 60, is the President of Citisecurities, Inc. and Executive Vice President and Treasurer of CWC Group of Companies, which includes CWC Industries, Inc., Barrington Carpets, Inc., Citimex, Inc. and CWC International Corporation. She has held the latter position for more than 20 years now. She has extensive experience in banking, having held various positions in Metropolitan Bank and Trust Company (Metrobank). She was an Assistant Vice President and Area Supervisor of Metrobank and served as a Director of Metrobank’s subsidiary, Pan Philippines Life Insurance Corp. (now known as Philippine Axa Life). Ms. Ong graduated from the Philippine Women’s University with a Bachelor of Science Degree in Business Administration, Major in Accounting.
5 CAESAR A. GUERZONSenior Vice President/Corporate Secretary and Head of Legal, Human Resources and Administration Departments
Caesar A. Guerzon, 62, Filipino, was a Director of COL from 1999 to 2006. He is concurrently a Director of COL Securities (HK) Limited and the Corporate Secretary of Citisecurities, Inc. and the CWC Group of Companies which includes CWC Industries, Inc., Barrington Carpets, Inc., Citimex, Inc. and CWC International Corporation. Presently, he serves as the Chairman of the Board of Rural Bank of Sta. Maria, Ilocos Sur, Inc., a member of the Board of Trustees of COG - Makati, Inc. and Secretary to the Sangguniang Barangay of Bel-Air, Makati City. He served as a member of the Governance Committee of the Philippine Stock Exchange and the Legislative Committee of the Philippine Association of Securities Brokers & Dealers, Inc. Mr. Guerzon is a Certified Securities Representative and a member of the Integrated Bar of the Philippines.
6 PAULWELL HANDirector Paulwell Han, 52, Chinese, is a graduate of Business Finance at San Francisco State University, USA. He is currently the Director and General Manager of different corporations located in Hong Kong namely: Dai Heng Pharmaceutical Co., Ltd., Yee Ting Tong Company Limited, Tecworld Investment Co., Ltd., Silver Jubilee Co., Ltd., Sunning Restaurant and Etta Trading Company Limited.
2 CONRADO F. BATEPresident and Chief Executive Officer Conrado F. Bate, 50, Filipino, is currently the President and Chief Executive Officer of COL. He has extensive experience in the Philippine stock brokerage and fund management industry. Prior positions that he held include: Vice President of JP Morgan Philippines in 2002; President and CEO of Abacus Securities Corporation from 1995-1997; and Vice President of Fund Management Division of Philamlife Insurance Company from 1990 to 1995. Mr. Bate was a member of the Board of Directors of the Philippine Stock Exchange (2005-2006) and served as its Chairman of the Investor Education Committee and Member of the Legislative Committee. He was an independent director of the ATR Kim Eng Asset Management from 2005 to 2010 and serves in the same capacity for Corston-Smith Asset Management Sdn. Bhd. from February 2009 to present.
COL 2012 ANNUAL REPORT 15

BOARD OF DIRECTORS
8 9
11 12
7
10
16

17
7 JOEL LITMANDirector Joel Litman, 42, was elected as director on August 12, 2011. Litman is currently Managing Director of Equity Analysis & Strategy, Inc. headquartered in New York City, and Chairman of the Board of Directors of the EAS Group, which includes the Institute of Strategy & Valuation, EAS Digital, and other private holdings. Previously, he held Director/Manager positions at Credit Suisse First Boston, Deloitte Consulting, and American Express. He is co-author of the book, DRIVEN: Business Strategy, Human Actions, and the Creation of Wealth and has published in Harvard Business Review. Professor Litman teaches and is on faculty at multiple business schools for strategy and valuation courses and has lectured at Harvard Business School and other top universities. He is also Chairman of the Foundation for Socioeconomic Advancement focused on philanthropic efforts in underdeveloped communities. He is a Certified Public Accountant in the United States, a member of the Global CFA Institute, received his B.S. Accountancy at DePaul University and his MBA/MM from the Kellogg Graduate School of Management at Northwestern University.
9 HERNAN G. LIMDirector Hernan G. Lim, 59, Filipino, is currently the President of Hoc Po Feeds Corporation and the Executive Vice President of HGL Development Corporation. He has also been a Director of Citimex, Inc., Citisecurities, Inc., CWC Development, Inc., Barrington Carpets, Inc. and CWC Industries, Inc. for more than 10 years now. He holds a degree in Bachelor of Science in Electronic and Communication Engineering at the University of Santo Tomas. He also took the Basic Management Course at the Asian Institute of Management.
11 WELLINGTON C. YUDirector
Wellington C. Yu, 68, Filipino, finished his BS Chemical Engineering at De La Salle University in 1965 and his MBA and MS Chemical Engineering from the University of Pittsburgh. From 1973 to 1985, he was the Dean of the College of Business and Economics of De La Salle University and of the Graduate School of Business from 1981 to 1984. He was conferred the title of Dean Emeritus in the College of Business and Economics. He was the Senior Vice President of Tropical Rent-A-Car in Hawaii from 1986 to 1990 & President of Suntrips, Inc. of San Jose, California from 1990 to 1997. In 2012, Xavier School San Juan awarded the “Exemplary Alumnus” title to Dean Yu. He is presently the Dean of the College at Philippine Cultural College in Manila.
10 KHOO BOO BOON Independent Director Khoo Boo Boon, 54, Malaysian, has extensive experience in commodities trading, stock trading, advertising, marketing research and corporate management and has held senior executive positions in the Asean region. He currently runs his own management consulting firm, Knowledge-Based Business Intelligence and Consulting (KBBIC) and sits on the Board of Directors of GTF Worldwide Philippines, and Geka Property Holdings Inc., Bethel Home Holdings Inc. Mr. Khoo is an alumnus of the Asian Institute of Management where he earned a Masters degree in Development Management in 1990 as Canadian International Development Agency (CIDA) Fellow.
12 MANUEL ESTACIONIndependent Director Manuel S. Estacion, 67, Filipino, is a Bachelor of Science in Commerce graduate of San Beda College. He is presently engaged by The Hong Kong and Shanghai Banking Corporation (HSBC) as the Bank Representative in the remaining labor related cases pending in Court. He previously served HSBC in various capacities and was Vice President Human Resources from 1996 to 1999 after which he acted as a Consultant to HSBC prior to his present engagement. Mr. Estacion is a Charter Member and a Director of the Rotary Club of Ortigas Center for the Rotary Year 2012-2013.
8 RAYMOND C. YUDirector Raymond C. Yu, 59, Filipino, is a Bachelor of Science in Commerce graduate of De La Salle University in 1974. He is currently the President of Winner Industrial Corporation and a Director of more than 16 years of the following corporations: Citisecurities, Inc., CWC Development, Inc., Barrington Carpets, Inc., Citimex, Inc. and CWC International, Inc.
COL 2012 ANNUAL REPORT 17

MANAGEMENT TEAM
1 2 3
4 5 6
7 8ABC AB
18

1 CONRADO F. BATEDirector/President and Chief Executive Officer
6 JUAN G. BARREDO Vice President and Head of Customer Service and Sales Department
Juan “Juanis” G. Barredo, 43, Filipino, Vice President and Head of Customer Service and Sales Department of COL, manages the day-to-day operations of the Business Center, Customer Service and Customer Relations Groups and support personnel. He spearheads the COL Investor Seminar Series, the flagship investor education program of the Company.
3 APRIL LYNN C. LEE-TAN, CFAVice President and Head of Research Department
April Lynn C. Lee-Tan, 37, Filipino, has been with COL’s research team since 1999. She is a Certified Securities Representative and a Chartered Financial Analyst (CFA) holder. She has been elected and currently serves as the President of the Certified Financial Analysts Association of the Philippines.
7A LORENA E. VELARDEVice President and Head of Accounting Department
Lorena C. Espino-Velarde, 42, Filipino is the Vice President and Head of Accounting of COL since the year 2001 and up to the present. She is also the Compliance Officer of Citisecurities, Inc.
2 CATHERINE L. ONGDirector, Senior Vice President, Chief Financial Officer and Treasurer
7B GERALD T. CHUAGeneral Manager, CitisecOnline.com Hong Kong, Ltd.
Gerald Chua, 34, Filipino, is currently the General Manager of CitisecOnline.com Hong Kong, Ltd. In 2001, he was part of the team who set up the COL Hong Kong office and until today manages its day-to-day operations.
5 CAESAR A. GUERZONSenior Vice President/Corporate Secretary and Head of Legal Department and Human Resources and Administration Department
4 NIKOS J. BAUTISTAVice President and Chief Technology Officer
Nikos J. Bautista, 42, Filipino, is the Chief Technology Officer of COL. He is also a consultant for the New Trading System Project of the Philipipine Stock Exchange and for the various projects of the PDEx.
8B JOHN GATMAYTANHead, Private Clients Group
John Gatmaytan, 47, Filipino, is currently the Joint-Head of the Private Clients Group of COL Financial Group. He has extensive institutional experience in the fields of stock broking, investment banking, fund raising, distribution and portfolio management, having organized and led successful teams in various top-tier financial services companies. Prior to COL, he was a Vice President of ATR-Kim Eng Securities Philippines from 2000 to 2009; Vice President and Head of Sales of DBP-Daiwa Securities Philippines Inc. from 1995-1997; Vice President and Head of Sales of Philippine Asia Equity Securities Inc. ( formerly First Pacific Securities ) from 1992-1995. John has 25 years of experience behind him, having started with the firm Citicorp Vickers in 1986.
8A GEORGE WONGHead, Private Clients Group
George Wong, 41, Filipino, is currently the Joint-Head of the Private Clients Group of COL Financial Group. He has extensive institutional experience in the fields of stock broking, equity sales, fund raising, and portfolio management. Prior to COL, he was an AVP of JP Morgan Securities Philippines from 1999 to 2003, and its forerunner company Jardine Fleming Exchange Capital Securities Inc. from 1997 to 1999; Assistant Vice President of DBP-Daiwa Securities Philippines Inc, from 1995-1997. George has 20 years of equities experience behind him, having started with the firm First Pacific Securities Philippines in 1992. He was rated by Asiamoney magazine in 1999 as one of the Philippines’ Best in Equity Sales for that year.
7C MELISSA NGAssistant Vice President and Head of Operations Department Melissa O. Ng, 39, Chinese, graduated with a degree of Bachelor of Science Degree in Applied Economics and a Bachelor of Science Degree in Business Management from De La Salle University. She earned her MBA (Silver Medalist) from De La Salle University in 2000. She has been with the Company since 2007 and has previous banking experience from Security Bank and Union Bank of the Philippines.
COL 2012 ANNUAL REPORT 19

JJanuary
2012
PSE BULLRUN
MMarch
2012
COL MARKET OUTLOOK (Meralco)
23
20
JJuly
2012
MONEYSENSE MONEY SUMMIT
23
13
COL MID-YEAR MARKETING BRIEFING (Meralco)
OOctober
2012
COL CORPORATE BRIEFING
23
13
LAUNCH OF COL ADVERTISING CAMPAIGN
YEAR HIGHLIGHTS20

AApril
2012
OFFICIAL CHANGE OF CORPORATE NAME TO COL FINANCIAL
10 JJune
2012
MONEYSENSE MONEY SUMMIT
21
NNovember
2012 26
KERYGMA CONFERENCE
DDecember
2012
1
1ST PSE BELL AWARDS FOR CORPORATE GOVERNANCE
COL 2012 ANNUAL REPORT 21
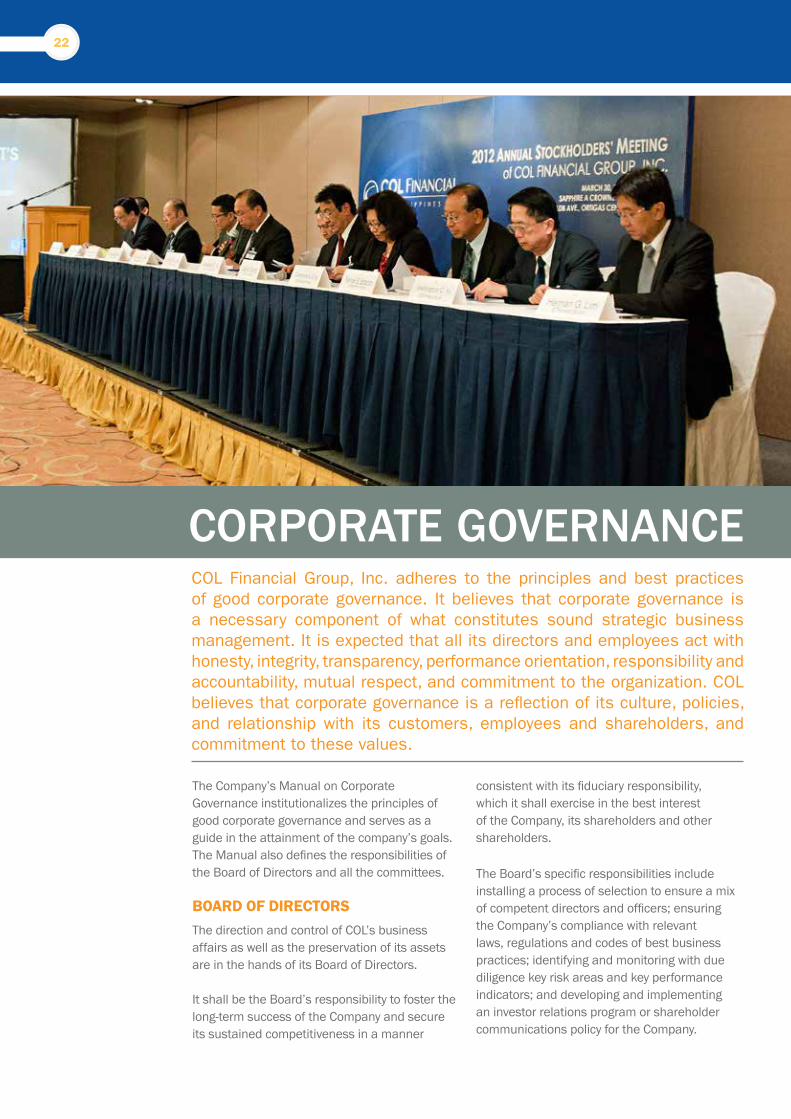
CORPORATE GOVERNANCECOL Financial Group, Inc. adheres to the principles and best practices of good corporate governance. It believes that corporate governance is a necessary component of what constitutes sound strategic business management. It is expected that all its directors and employees act with honesty, integrity, transparency, performance orientation, responsibility and accountability, mutual respect, and commitment to the organization. COL believes that corporate governance is a reflection of its culture, policies, and relationship with its customers, employees and shareholders, and commitment to these values.
The Company’s Manual on Corporate Governance institutionalizes the principles of good corporate governance and serves as a guide in the attainment of the company’s goals. The Manual also defines the responsibilities of the Board of Directors and all the committees.
BOARD OF DIRECTORSThe direction and control of COL’s business affairs as well as the preservation of its assets are in the hands of its Board of Directors.
It shall be the Board’s responsibility to foster the long-term success of the Company and secure its sustained competitiveness in a manner
consistent with its fiduciary responsibility, which it shall exercise in the best interest of the Company, its shareholders and other shareholders.
The Board’s specific responsibilities include installing a process of selection to ensure a mix of competent directors and officers; ensuring the Company’s compliance with relevant laws, regulations and codes of best business practices; identifying and monitoring with due diligence key risk areas and key performance indicators; and developing and implementing an investor relations program or shareholder communications policy for the Company.
22
COMPENSATION COMMITTEE
AUDIT COMMITTEE
BOARD OFDIRECTORS
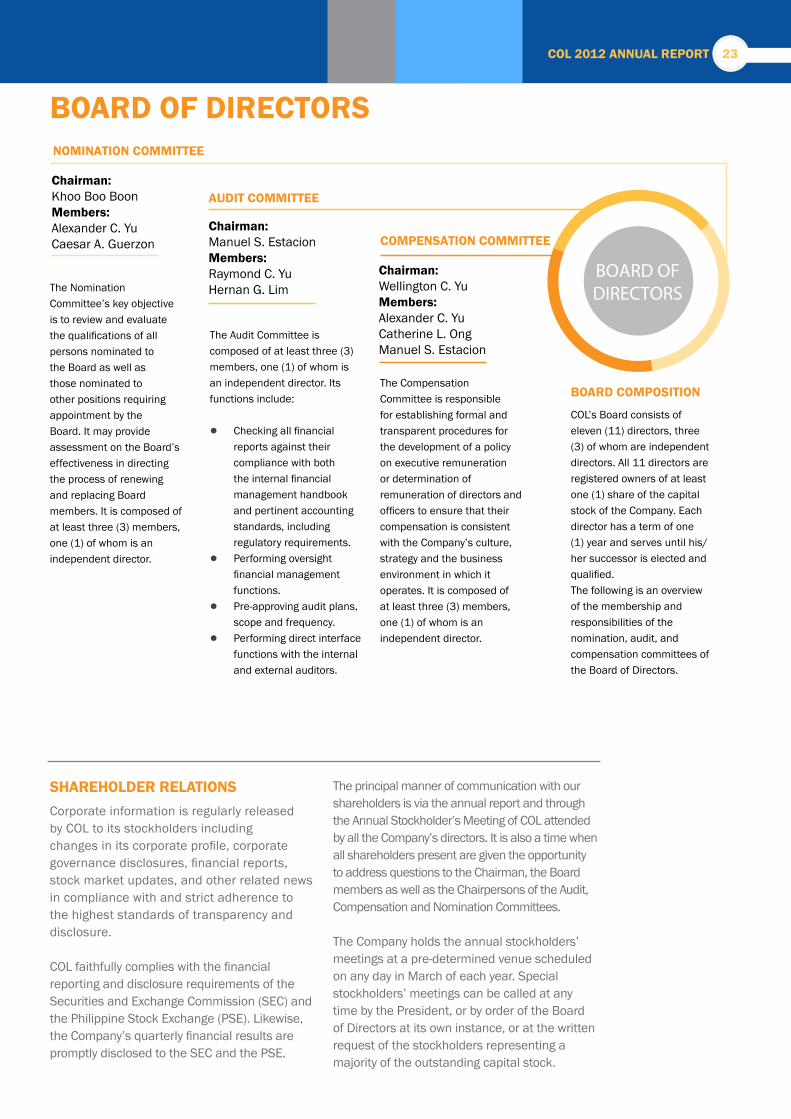
Chairman:Wellington C. YuMembers:Alexander C. Yu Catherine L. OngManuel S. Estacion
NOMINATION COMMITTEE
Chairman:Khoo Boo Boon Members:Alexander C. YuCaesar A. Guerzon
Chairman:Manuel S. EstacionMembers:Raymond C. YuHernan G. Lim
The Audit Committee is composed of at least three (3) members, one (1) of whom is an independent director. Its functions include:
● Checking all financial reports against their compliance with both the internal financial management handbook and pertinent accounting standards, including regulatory requirements.
● Performing oversight financial management functions.
● Pre-approving audit plans, scope and frequency.
● Performing direct interface functions with the internal and external auditors.
The Nomination Committee’s key objective is to review and evaluate the qualifications of all persons nominated to the Board as well as those nominated to other positions requiring appointment by the Board. It may provide assessment on the Board’s effectiveness in directing the process of renewing and replacing Board members. It is composed of at least three (3) members, one (1) of whom is an independent director.
The Compensation Committee is responsible for establishing formal and transparent procedures for the development of a policy on executive remuneration or determination of remuneration of directors and officers to ensure that their compensation is consistent with the Company’s culture, strategy and the business environment in which it operates. It is composed of at least three (3) members, one (1) of whom is an independent director.
BOARD OF DIRECTORS
BOARD COMPOSITION
COL’s Board consists of eleven (11) directors, three (3) of whom are independent directors. All 11 directors are registered owners of at least one (1) share of the capital stock of the Company. Each director has a term of one (1) year and serves until his/her successor is elected and qualified. The following is an overview of the membership and responsibilities of the nomination, audit, and compensation committees of the Board of Directors.
SHAREHOLDER RELATIONSCorporate information is regularly released by COL to its stockholders including changes in its corporate profile, corporate governance disclosures, financial reports, stock market updates, and other related news in compliance with and strict adherence to the highest standards of transparency and disclosure.
COL faithfully complies with the financial reporting and disclosure requirements of the Securities and Exchange Commission (SEC) and the Philippine Stock Exchange (PSE). Likewise, the Company’s quarterly financial results are promptly disclosed to the SEC and the PSE.
The principal manner of communication with our shareholders is via the annual report and through the Annual Stockholder’s Meeting of COL attended by all the Company’s directors. It is also a time when all shareholders present are given the opportunity to address questions to the Chairman, the Board members as well as the Chairpersons of the Audit, Compensation and Nomination Committees.
The Company holds the annual stockholders’ meetings at a pre-determined venue scheduled on any day in March of each year. Special stockholders’ meetings can be called at any time by the President, or by order of the Board of Directors at its own instance, or at the written request of the stockholders representing a majority of the outstanding capital stock.
COL 2012 ANNUAL REPORT 23

Notice of any regular or special meeting of the stockholders is sent by mail or personal delivery at least two (2) weeks prior to the scheduled date of the meeting. In all regular or special meeting, quorum shall, unless otherwise provided by law, constitute the presence either in person or by proxy of stockholders representing a majority of the outstanding capital stock of the Company.
SHAREHOLDER RELATIONS
Corporate information is regularly released by COL to its stockholders including changes in its corporate profile, corporate governance disclosures, financial reports, stock market updates, and other related news in compliance with and strict adherence to the highest standards of transparency and disclosure.
COL faithfully complies with the financial reporting and disclosure requirements of the Securities and Exchange Commission (SEC) and the Philippine Stock Exchange (PSE). Likewise, the Company’s quarterly financial results are promptly disclosed to the SEC and the PSE.
The principal manner of communication with our shareholders is via the annual report and through the Annual Stockholder’s Meeting of COL attended by all the Company’s directors. It is also a time when all shareholders present are given the opportunity to address questions to the Chairman, the Board members as well as the Chairpersons of the Audit, Compensation and Nomination Committees.
The Company holds the annual stockholders’ meetings at a pre-determined venue scheduled on any day in March of each year. Special stockholders’ meetings can be called at any time by the President, or by order of the Board of Directors at its own instance, or at the written request of the stockholders representing a majority of the outstanding capital stock.
Notice of any regular or special meeting of the stockholders is sent by mail or personal delivery at least two (2) weeks prior to the scheduled date of the meeting. In all regular or special meeting, quorum shall, unless otherwise provided by law, constitute the presence either in person or by proxy of stockholders representing a majority of the outstanding capital stock of the Company.
24

CORPORATE SOCIAL RESPONSIBILITY
Below is a list of some of the organizations and corporations who enlisted COL to conduct Stock Market Investor seminars in 2012:
• Trion• Visteon• Philippine Airlines• HSBC• Thousand Oaks• DKS• USAP• Chevron• DELL• FEAST• Asian Institute of Management• DKS• Tower Watson• DNL• Publicis • USANA
• SALMAT• College of St. • MAIN Hardware• Fujitsu• MEKENI• Emerson• Camella• Philippine Dental Association• Century Philippines• General Mills• Ateneo Graduate School• First Balfour• Accenture• Catholic Filipino Academy• Emerson• Green Circle Realty
INVESTOR EDUCATION
Since 2006, COL has led the growth of the retail investor base for stock market investing in the Philippines, having pioneered free financial literacy and investor education seminars to Filipinos nationwide.
In 2012, COL conducted over 200 seminars all around the country to more than 15,000 attendees covering topics on the basics of stock investing, how to read research reports and the Easy Investment Program. Seminars are held 3x a week at the COL Training Center.
The drive for investor education and financial literacy continues to grow with a strong interest coming from top corporations, educational institutions and universities as well as special interest groups.
TREE PLANTING ACTIVITY
As part of the COL’s Corporate Social Responsibility program and to show the strong commitment to the environment, COL’s management team, officers and staff had its first tree planting activity and reforestation program. The Tree Planting Activity was held last October 20 at the Old Sanitary Landfill, Antipolo City. The same is in partnership with Metro Manila Development Authority (MMDA) and City Environment Management of Antipolo, Rizal.
COL 2012 ANNUAL REPORT 25
26
COL 2012 ANNUAL REPORT 2727
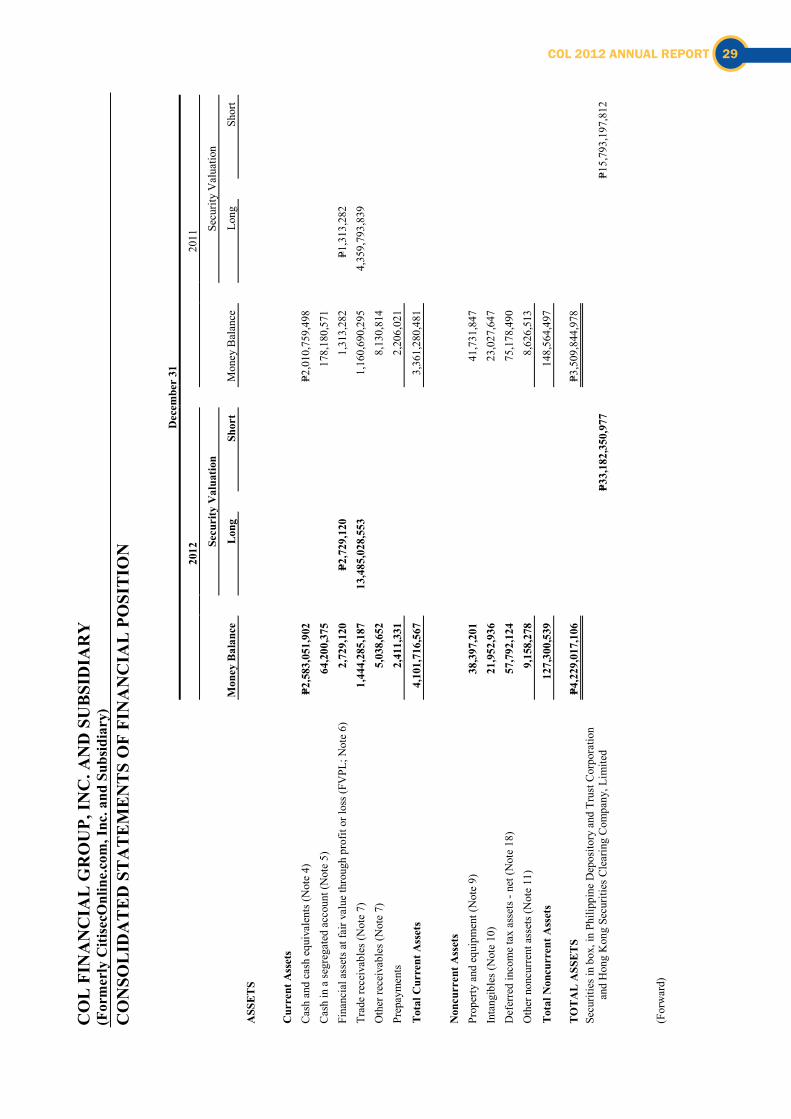
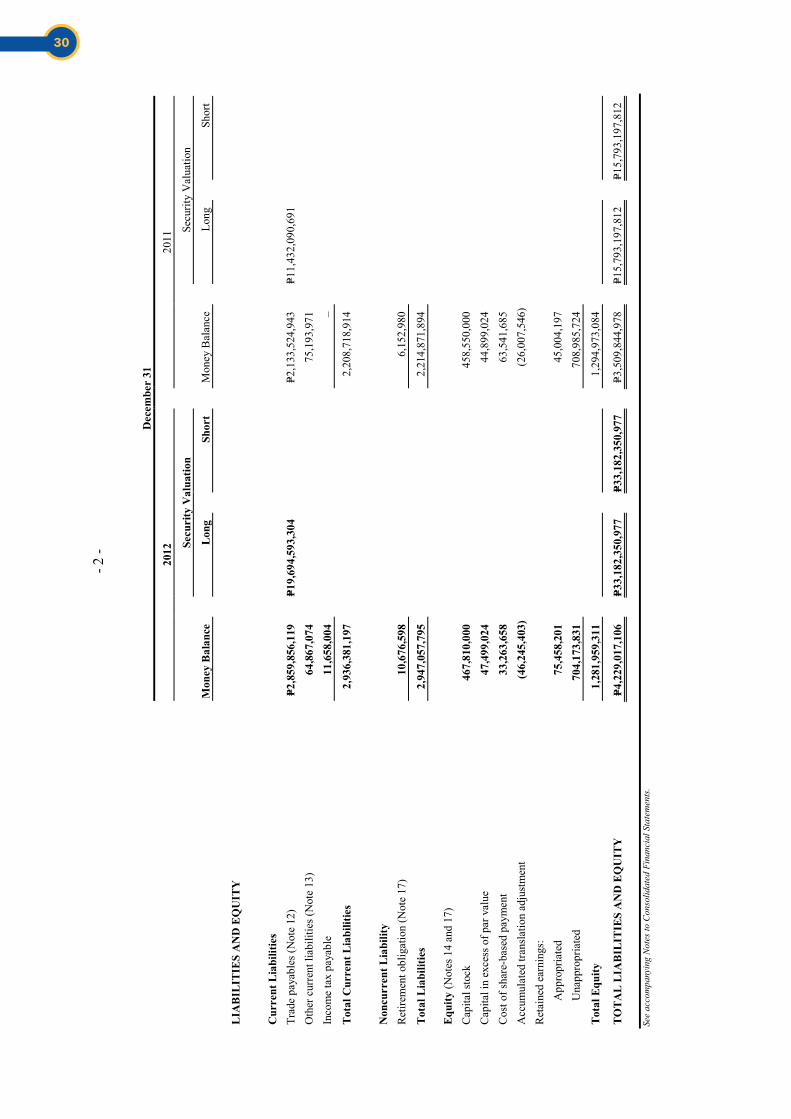
*SGVFS000888*
INDEPENDENT AUDITORS’ REPORT The Stockholders and the Board of Directors COL Financial Group, Inc. Unit 2401-B East Tower, PSE Centre Exchange Road, Ortigas Center, Pasig City We have audited the accompanying consolidated financial statements of COL Financial Group, Inc. (formerly CitisecOnline.com, Inc.) and Subsidiary, which comprise the consolidated statements of financial position as at December 31, 2012 and 2011, and the consolidated statements of income, consolidated statements of comprehensive income, consolidated statements of changes in equity and consolidated statements of cash flows for each of the three years in the period ended December 31, 2012, and a summary of significant accounting policies and other explanatory information. Management’s Responsibility for the Consolidated Financial Statements Management is responsible for the preparation and fair presentation of these consolidated financial statements in accordance with accounting principles generally accepted in the Philippines as described in Note 2 to the consolidated financial statements, and for such internal control as management determines is necessary to enable the preparation of consolidated financial statements that are free from material misstatement, whether due to fraud or error. Auditors’ Responsibility Our responsibility is to express an opinion on these consolidated financial statements based on our audits. We conducted our audits in accordance with Philippine Standards on Auditing. Those standards require that we comply with ethical requirements and plan and perform the audit to obtain reasonable assurance about whether the consolidated financial statements are free from material misstatement. An audit involves performing procedures to obtain audit evidence about the amounts and disclosures in the consolidated financial statements. The procedures selected depend on the auditor’s judgment, including the assessment of the risks of material misstatement of the consolidated financial statements, whether due to fraud or error. In making those risk assessments, the auditor considers internal control relevant to the entity’s preparation and fair presentation of the consolidated financial statements in order to design audit procedures that are appropriate in the circumstances, but not for the purpose of expressing an opinion on the effectiveness of the entity’s internal control. An audit also includes evaluating the appropriateness of accounting policies used and the reasonableness of accounting estimates made by management, as well as evaluating the overall presentation of the consolidated financial statements. We believe that the audit evidence we have obtained is sufficient and appropriate to provide a basis for our audit opinion.
SyCip Gorres Velayo & Co. 6760 Ayala Avenue 1226 Makati City Philippines
Phone: (632) 891 0307 Fax: (632) 819 0872 www.sgv.com.ph BOA/PRC Reg. No. 0001, December 28, 2012, valid until December 31, 2015 SEC Accreditation No. 0012-FR-3 (Group A), November 15, 2012, valid until November 16, 2015
A member firm of Ernst & Young Global Limited
*SGVFS000888*
- 2 -
Opinion In our opinion, the consolidated financial statements present fairly, in all material respects, the financial position of COL Financial Group, Inc. and Subsidiary as at December 31, 2012 and 2011, and their financial performance and their cash flows for each of the three years in the period ended December 31, 2012 in accordance with accounting principles generally accepted in the Philippines as described in Note 2 to the consolidated financial statements. SYCIP GORRES VELAYO & CO. Eleanore A. Layug Partner CPA Certificate No. 0100794 SEC Accreditation No. 1250-A (Group A), August 9, 2012, valid until August 8, 2015 Tax Identification No. 163-069-453 BIR Accreditation No. 08-001998-97-2012, January 11, 2012, valid until January 10, 2015 PTR No. 3669689, January 2, 2013, Makati City March 6, 2013
28
*SGVFS000888*
CO
L F
INA
NC
IAL
GR
OU
P, IN
C. A
ND
SU
BSI
DIA
RY
(F
orm
erly
Citi
secO
nlin
e.co
m, I
nc. a
nd S
ubsid
iary
) C
ON
SOL
IDA
TE
D S
TA
TE
ME
NT
S O
F FI
NA
NC
IAL
PO
SIT
ION
Dec
embe
r 31
2012
2011
Mon
ey B
alan
ce
Secu
rity
Val
uatio
n
Mon
ey B
alan
ce
Secu
rity
Val
uatio
n
Lo
ng
Shor
t
Lo
ng
Shor
t
ASS
ETS
C
urre
nt A
sset
s
C
ash
and
cash
equ
ival
ents
(Not
e 4)
P=2
,583
,051
,902
P=2
,010
,759
,498
C
ash
in a
segr
egat
ed a
ccou
nt (N
ote
5)
64,2
00,3
75
178,
180,
571
Fi
nanc
ial a
sset
s at f
air v
alue
thro
ugh
prof
it or
loss
(FV
PL; N
ote
6)
2,72
9,12
0
P=2,7
29,1
20
1,
313,
282
P=1
,313
,282
Trad
e re
ceiv
able
s (N
ote
7)
1,44
4,28
5,18
7
13,4
85,0
28,5
53
1,
160,
690,
295
4,
359,
793,
839
Oth
er re
ceiv
able
s (N
ote
7)
5,03
8,65
2
8,13
0,81
4
Prep
aym
ents
2,
411,
331
2,
206,
021
Tota
l Cur
rent
Ass
ets
4,10
1,71
6,56
7
3,36
1,28
0,48
1
N
oncu
rren
t Ass
ets
Prop
erty
and
equ
ipm
ent (
Not
e 9)
38
,397
,201
41
,731
,847
In
tang
ible
s (N
ote
10)
21,9
52,9
36
23,0
27,6
47
Def
erre
d in
com
e ta
x as
sets
- ne
t (N
ote
18)
57,7
92,1
24
75,1
78,4
90
Oth
er n
oncu
rren
t ass
ets (
Not
e 11
) 9,
158,
278
8,
626,
513
Tota
l Non
curr
ent A
sset
s 12
7,30
0,53
9
148,
564,
497
TO
TAL
ASS
ETS
P=4,2
29,0
17,1
06
P=3,5
09,8
44,9
78
Secu
ritie
s in
box,
in P
hilip
pine
Dep
osito
ry a
nd T
rust
Cor
pora
tion
and
Hon
g K
ong
Secu
ritie
s Cle
arin
g C
ompa
ny, L
imite
d
P=3
3,18
2,35
0,97
7
P=15,
793,
197,
812
(For
war
d)
COL 2012 ANNUAL REPORT 29
*SGVFS000888*
- 2
-
Dec
embe
r 31
2012
2011
Mon
ey B
alan
ce
Secu
rity
Val
uatio
n
Mon
ey B
alan
ce
Secu
rity
Val
uatio
n
Lo
ng
Shor
t
Lo
ng
Shor
t
LIA
BIL
ITIE
S A
ND
EQ
UIT
Y
C
urre
nt L
iabi
litie
s
Tr
ade
paya
bles
(Not
e 12
) P=2
,859
,856
,119
P=1
9,69
4,59
3,30
4
P=2
,133
,524
,943
P=1
1,43
2,09
0,69
1
O
ther
cur
rent
liab
ilitie
s (N
ote
13)
64,8
67,0
74
75,1
93,9
71
Inco
me
tax
paya
ble
11,6
58,0
04
–
Tota
l Cur
rent
Lia
bilit
ies
2,93
6,38
1,19
7
2,20
8,71
8,91
4
N
oncu
rren
t Lia
bilit
y
R
etire
men
t obl
igat
ion
(Not
e 17
) 10
,676
,598
6,
152,
980
Tota
l Lia
bilit
ies
2,94
7,05
7,79
5
2,21
4,87
1,89
4
Equi
ty (N
otes
14
and
17)
Cap
ital s
tock
46
7,81
0,00
0
458,
550,
000
C
apita
l in
exce
ss o
f par
val
ue
47,4
99,0
24
44,8
99,0
24
Cos
t of s
hare
-bas
ed p
aym
ent
33,2
63,6
58
63,5
41,6
85
Acc
umul
ated
tran
slat
ion
adju
stm
ent
(46,
245,
403)
(2
6,00
7,54
6)
Ret
aine
d ea
rnin
gs:
A
ppro
pria
ted
75,4
58,2
01
45,0
04,1
97
U
napp
ropr
iate
d 70
4,17
3,83
1
708,
985,
724
Tota
l Equ
ity
1,28
1,95
9,31
1
1,29
4,97
3,08
4
TOTA
L LI
AB
ILIT
IES
AN
D E
QU
ITY
P=4
,229
,017
,106
P=3
3,18
2,35
0,97
7
P=33,
182,
350,
977
P=3
,509
,844
,978
P=1
5,79
3,19
7,81
2
P=15,
793,
197,
812
See
acco
mpa
nyin
g N
otes
to C
onso
lidat
ed F
inan
cial
Sta
tem
ents
.
30
*SGVFS000888*
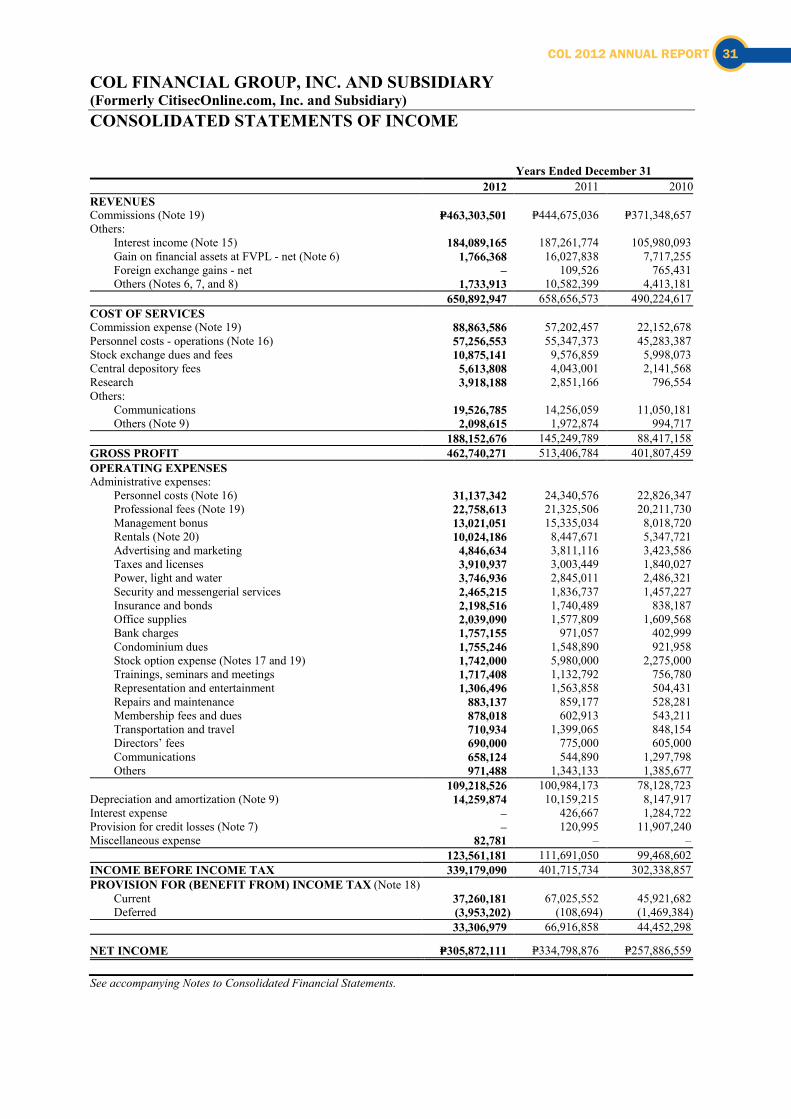
COL FINANCIAL GROUP, INC. AND SUBSIDIARY (Formerly CitisecOnline.com, Inc. and Subsidiary) CONSOLIDATED STATEMENTS OF INCOME Years Ended December 31 2012 2011 2010 REVENUES Commissions (Note 19) P=463,303,501 P=444,675,036 P=371,348,657 Others: Interest income (Note 15) 184,089,165 187,261,774 105,980,093 Gain on financial assets at FVPL - net (Note 6) 1,766,368 16,027,838 7,717,255 Foreign exchange gains - net – 109,526 765,431 Others (Notes 6, 7, and 8) 1,733,913 10,582,399 4,413,181 650,892,947 658,656,573 490,224,617 COST OF SERVICES Commission expense (Note 19) 88,863,586 57,202,457 22,152,678 Personnel costs - operations (Note 16) 57,256,553 55,347,373 45,283,387 Stock exchange dues and fees 10,875,141 9,576,859 5,998,073 Central depository fees 5,613,808 4,043,001 2,141,568 Research 3,918,188 2,851,166 796,554 Others: Communications 19,526,785 14,256,059 11,050,181 Others (Note 9) 2,098,615 1,972,874 994,717 188,152,676 145,249,789 88,417,158 GROSS PROFIT 462,740,271 513,406,784 401,807,459 OPERATING EXPENSES Administrative expenses: Personnel costs (Note 16) 31,137,342 24,340,576 22,826,347 Professional fees (Note 19) 22,758,613 21,325,506 20,211,730 Management bonus 13,021,051 15,335,034 8,018,720 Rentals (Note 20) 10,024,186 8,447,671 5,347,721 Advertising and marketing 4,846,634 3,811,116 3,423,586 Taxes and licenses 3,910,937 3,003,449 1,840,027 Power, light and water 3,746,936 2,845,011 2,486,321 Security and messengerial services 2,465,215 1,836,737 1,457,227 Insurance and bonds 2,198,516 1,740,489 838,187 Office supplies 2,039,090 1,577,809 1,609,568 Bank charges 1,757,155 971,057 402,999 Condominium dues 1,755,246 1,548,890 921,958 Stock option expense (Notes 17 and 19) 1,742,000 5,980,000 2,275,000 Trainings, seminars and meetings 1,717,408 1,132,792 756,780 Representation and entertainment 1,306,496 1,563,858 504,431 Repairs and maintenance 883,137 859,177 528,281 Membership fees and dues 878,018 602,913 543,211 Transportation and travel 710,934 1,399,065 848,154 Directors’ fees 690,000 775,000 605,000 Communications 658,124 544,890 1,297,798 Others 971,488 1,343,133 1,385,677 109,218,526 100,984,173 78,128,723 Depreciation and amortization (Note 9) 14,259,874 10,159,215 8,147,917 Interest expense – 426,667 1,284,722 Provision for credit losses (Note 7) – 120,995 11,907,240 Miscellaneous expense 82,781 – – 123,561,181 111,691,050 99,468,602 INCOME BEFORE INCOME TAX 339,179,090 401,715,734 302,338,857 PROVISION FOR (BENEFIT FROM) INCOME TAX (Note 18) Current 37,260,181 67,025,552 45,921,682 Deferred (3,953,202) (108,694) (1,469,384) 33,306,979 66,916,858 44,452,298
NET INCOME P=305,872,111 P=334,798,876 P=257,886,559 See accompanying Notes to Consolidated Financial Statements.
COL 2012 ANNUAL REPORT 31
*SGVFS000888*
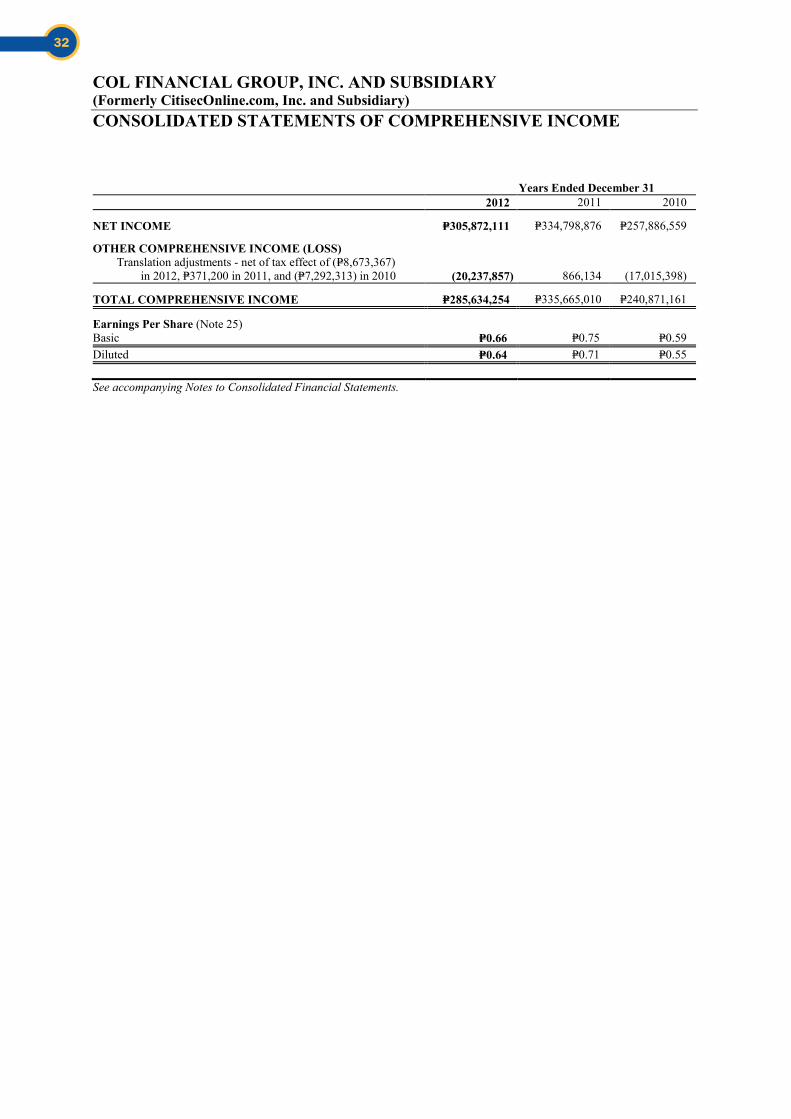
COL FINANCIAL GROUP, INC. AND SUBSIDIARY (Formerly CitisecOnline.com, Inc. and Subsidiary) CONSOLIDATED STATEMENTS OF COMPREHENSIVE INCOME Years Ended December 31 2012 2011 2010
NET INCOME P=305,872,111 P=334,798,876 P=257,886,559
OTHER COMPREHENSIVE INCOME (LOSS) Translation adjustments - net of tax effect of (P=8,673,367)
in 2012, P=371,200 in 2011, and (P=7,292,313) in 2010 (20,237,857) 866,134 (17,015,398)
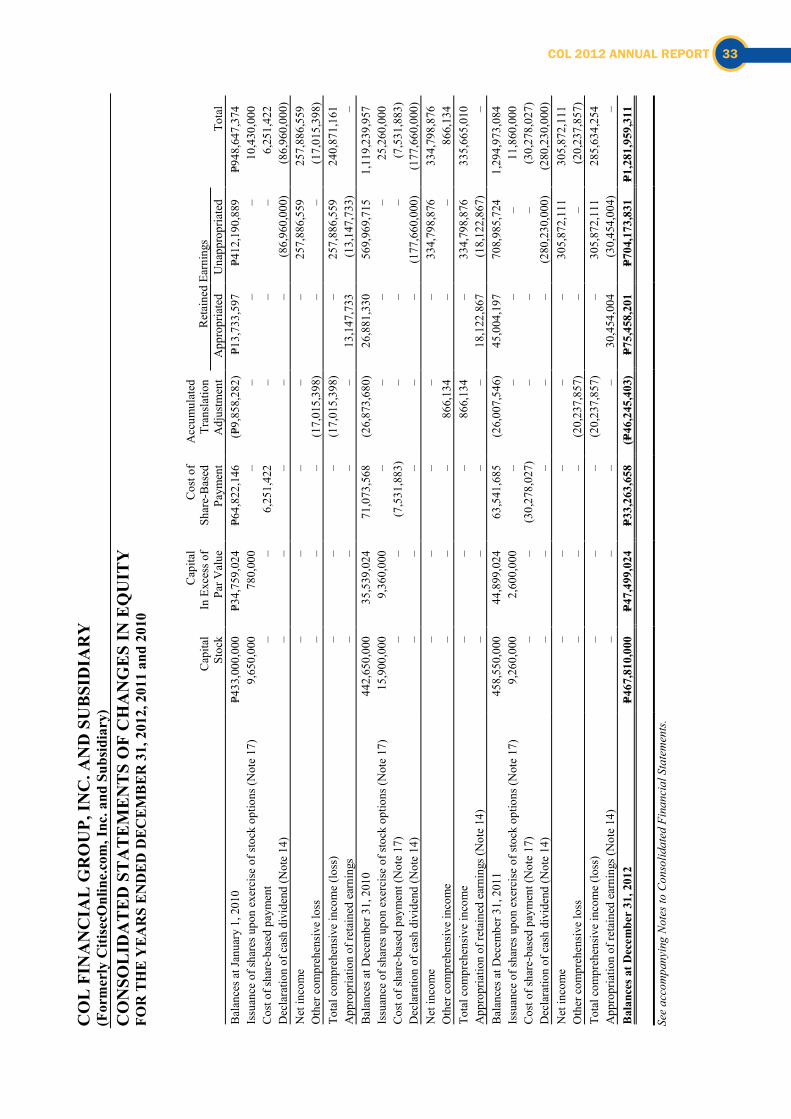
TOTAL COMPREHENSIVE INCOME P=285,634,254 P=335,665,010 P=240,871,161
Earnings Per Share (Note 25) Basic P=0.66 P=0.75 P=0.59 Diluted P=0.64 P=0.71 P=0.55 See accompanying Notes to Consolidated Financial Statements.
32
*SGVFS000888*
CO
L F
INA
NC
IAL
GR
OU
P, IN
C. A
ND
SU
BSI
DIA
RY
(F
orm
erly
Citi
secO
nlin
e.co
m, I
nc. a
nd S
ubsid
iary
) C
ON
SOL
IDA
TE
D S
TA
TE
ME
NT
S O
F C
HA
NG
ES
IN E
QU
ITY
FO
R T
HE
YEA
RS
END
ED D
ECEM
BER
31,
201
2, 2
011
and
2010
Cap
ital
Stoc
k
Cap
ital
In E
xces
s of
Par V
alue
Cos
t of
Shar
e-B
ased
Pa
ymen
t
Acc
umul
ated
Tr
ansl
atio
n A
djus
tmen
t R
etai
ned
Earn
ings
To
tal
App
ropr
iate
d U
napp
ropr
iate
d B
alan
ces a
t Jan
uary
1, 2
010
P=433
,000
,000
P=3
4,75
9,02
4 P=6
4,82
2,14
6 (P=
9,85
8,28
2)
P=13,
733,
597
P=412
,190
,889
P=9
48,6
47,3
74
Issu
ance
of s
hare
s upo
n ex
erci
se o
f sto
ck o
ptio
ns (N
ote
17)
9,65
0,00
0 78
0,00
0 –
– –
– 10
,430
,000
C
ost o
f sha
re-b
ased
pay
men
t –
– 6,
251,
422
– –
– 6,
251,
422
Dec
lara
tion
of c
ash
divi
dend
(Not
e 14
) –
– –
– –
(86,
960,
000)
(8
6,96
0,00
0)
Net
inco
me
– –
– –
– 25
7,88
6,55
9 25
7,88
6,55
9 O
ther
com
preh
ensi
ve lo
ss
– –
– (1
7,01
5,39
8)
– –
(17,
015,
398)
To
tal c
ompr
ehen
sive
inco
me
(loss
) –
– –
(17,
015,
398)
–
257,
886,
559
240,
871,
161
App
ropr
iatio
n of
reta
ined
ear
ning
s –
– –
– 13
,147
,733
(1
3,14
7,73
3)
– B
alan
ces a
t Dec
embe
r 31,
201
0 44
2,65
0,00
0 35
,539
,024
71
,073
,568
(2
6,87
3,68
0)
26,8
81,3
30
569,
969,
715
1,11
9,23
9,95
7 Is
suan
ce o
f sha
res u
pon
exer
cise
of s
tock
opt
ions
(Not
e 17
) 15
,900
,000
9,
360,
000
– –
– –
25,2
60,0
00
Cos
t of s
hare
-bas
ed p
aym
ent (
Not
e 17
) –
– (7
,531
,883
) –
– –
(7,5
31,8
83)
Dec
lara
tion
of c
ash
divi
dend
(Not
e 14
) –
– –
– –
(177
,660
,000
) (1
77,6
60,0
00)
Net
inco
me
– –
– –
– 33
4,79
8,87
6 33
4,79
8,87
6 O
ther
com
preh
ensi
ve in
com
e –
– –
866,
134
– –
866,
134
Tota
l com
preh
ensi
ve in
com
e –
– –
866,
134
– 33
4,79
8,87
6 33
5,66
5,01
0 A
ppro
pria
tion
of re
tain
ed e
arni
ngs (
Not
e 14
) –
– –
– 18
,122
,867
(1
8,12
2,86
7)
– B
alan
ces a
t Dec
embe
r 31,
201
1 45
8,55
0,00
0 44
,899
,024
63
,541
,685
(2
6,00
7,54
6)
45,0
04,1
97
708,
985,
724
1,29
4,97
3,08
4 Is
suan
ce o
f sha
res u
pon
exer
cise
of s
tock
opt
ions
(Not
e 17
) 9,
260,
000
2,60
0,00
0 –
– –
– 11
,860
,000
C
ost o
f sha
re-b
ased
pay
men
t (N
ote
17)
– –
(30,
278,
027)
–
– –
(30,
278,
027)
D
ecla
ratio
n of
cas
h di
vide
nd (N
ote
14)
– –
– –
– (2
80,2
30,0
00)
(280
,230
,000
) N
et in
com
e –
– –
– –
305,
872,
111
305,
872,
111
Oth
er c
ompr
ehen
sive
loss
–
– –
(20,
237,
857)
–
– (2
0,23
7,85
7)
Tota
l com
preh
ensi
ve in
com
e (lo
ss)
– –
– (2
0,23
7,85
7)
– 30
5,87
2,11
1 28
5,63
4,25
4 A
ppro
pria
tion
of re
tain
ed e
arni
ngs (
Not
e 14
) –
– –
– 30
,454
,004
(3
0,45
4,00
4)
– B
alan
ces a
t Dec
embe
r 31
, 201
2 P=4
67,8
10,0
00
P=47,
499,
024
P=33,
263,
658
(P=46
,245
,403
) P=7
5,45
8,20
1 P=7
04,1
73,8
31
P=1,2
81,9
59,3
11
See
acco
mpa
nyin
g N
otes
to C
onso
lidat
ed F
inan
cial
Sta
tem
ents.
COL 2012 ANNUAL REPORT 33
*SGVFS000888*
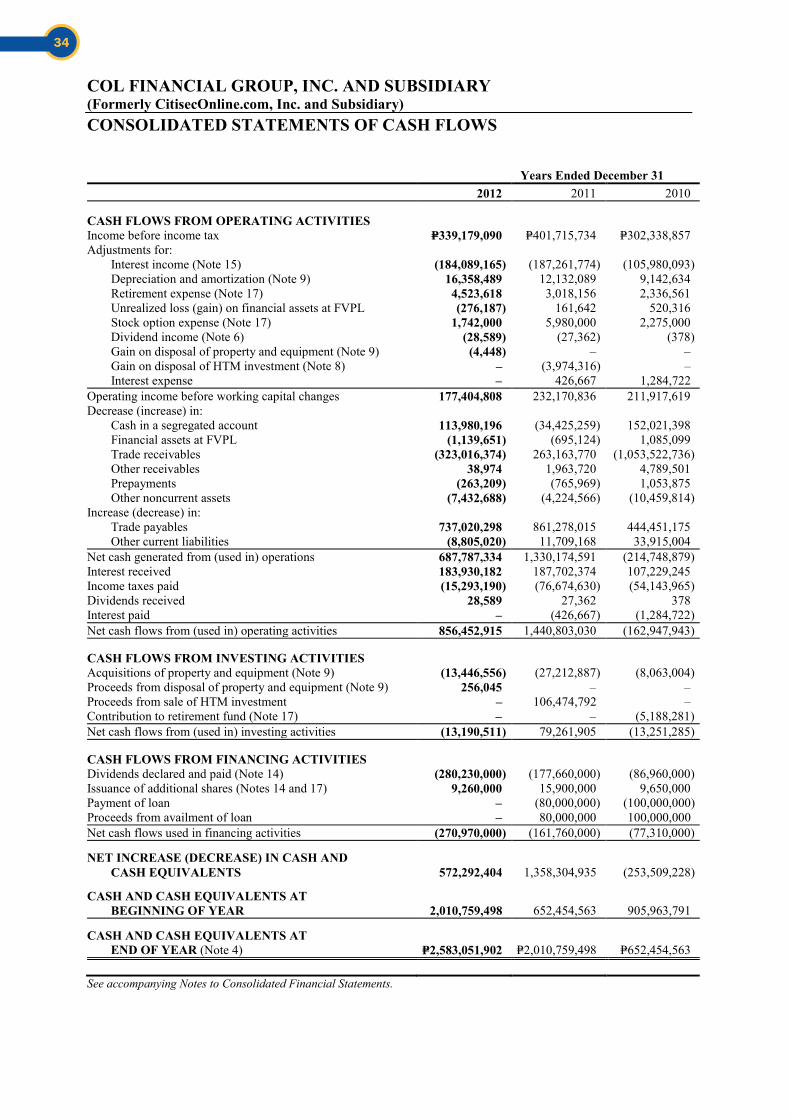
COL FINANCIAL GROUP, INC. AND SUBSIDIARY (Formerly CitisecOnline.com, Inc. and Subsidiary) CONSOLIDATED STATEMENTS OF CASH FLOWS Years Ended December 31 2012 2011 2010
CASH FLOWS FROM OPERATING ACTIVITIES Income before income tax P=339,179,090 P=401,715,734 P=302,338,857 Adjustments for: Interest income (Note 15) (184,089,165) (187,261,774) (105,980,093) Depreciation and amortization (Note 9) 16,358,489 12,132,089 9,142,634 Retirement expense (Note 17) 4,523,618 3,018,156 2,336,561 Unrealized loss (gain) on financial assets at FVPL (276,187) 161,642 520,316 Stock option expense (Note 17) 1,742,000 5,980,000 2,275,000 Dividend income (Note 6) (28,589) (27,362) (378) Gain on disposal of property and equipment (Note 9) (4,448) – – Gain on disposal of HTM investment (Note 8) – (3,974,316) –
Interest expense – 426,667 1,284,722 Operating income before working capital changes 177,404,808 232,170,836 211,917,619 Decrease (increase) in: Cash in a segregated account 113,980,196 (34,425,259) 152,021,398 Financial assets at FVPL (1,139,651) (695,124) 1,085,099 Trade receivables (323,016,374) 263,163,770 (1,053,522,736) Other receivables 38,974 1,963,720 4,789,501 Prepayments (263,209) (765,969) 1,053,875 Other noncurrent assets (7,432,688) (4,224,566) (10,459,814) Increase (decrease) in: Trade payables 737,020,298 861,278,015 444,451,175 Other current liabilities (8,805,020) 11,709,168 33,915,004 Net cash generated from (used in) operations 687,787,334 1,330,174,591 (214,748,879) Interest received 183,930,182 187,702,374 107,229,245 Income taxes paid (15,293,190) (76,674,630) (54,143,965) Dividends received 28,589 27,362 378 Interest paid – (426,667) (1,284,722) Net cash flows from (used in) operating activities 856,452,915 1,440,803,030 (162,947,943)
CASH FLOWS FROM INVESTING ACTIVITIES Acquisitions of property and equipment (Note 9) (13,446,556) (27,212,887) (8,063,004) Proceeds from disposal of property and equipment (Note 9) 256,045 – – Proceeds from sale of HTM investment – 106,474,792 – Contribution to retirement fund (Note 17) – – (5,188,281) Net cash flows from (used in) investing activities (13,190,511) 79,261,905 (13,251,285)
CASH FLOWS FROM FINANCING ACTIVITIES Dividends declared and paid (Note 14) (280,230,000) (177,660,000) (86,960,000) Issuance of additional shares (Notes 14 and 17) 9,260,000 15,900,000 9,650,000 Payment of loan – (80,000,000) (100,000,000) Proceeds from availment of loan – 80,000,000 100,000,000 Net cash flows used in financing activities (270,970,000) (161,760,000) (77,310,000)
NET INCREASE (DECREASE) IN CASH AND CASH EQUIVALENTS 572,292,404 1,358,304,935 (253,509,228)
CASH AND CASH EQUIVALENTS AT BEGINNING OF YEAR 2,010,759,498 652,454,563 905,963,791
CASH AND CASH EQUIVALENTS AT END OF YEAR (Note 4) P=2,583,051,902 P=2,010,759,498 P=652,454,563
See accompanying Notes to Consolidated Financial Statements.
34
*SGVMC410962*
CITISECONLINE.COM, INC. AND SUBSIDIARY NOTES TO CONSOLIDATED FINANCIAL STATEMENTS 1. Corporate Information
CitisecOnline.com, Inc. (CitisecOnline, Parent Company) was registered with the Philippine Securities and Exchange Commission (SEC) on August 16, 1999, primarily to engage in the business of broker of securities and to provide stockbrokerage services through innovative internet technology. CitisecOnline.com Hong Kong Limited (COLHK, Subsidiary), a wholly-owned foreign subsidiary, was domiciled and incorporated in Hong Kong, primarily to act as stockbroker and invest in securities. In the normal course of business, the Parent Company and COLHK (the Group) are also engaged in providing financial advice, in the gathering and distribution of financial and investment information and statistics and in acting as financial, commercial or business representative. The registered address of the Parent Company is Unit 2401-B East Tower, PSE Centre, Exchange Road, Ortigas Center, Pasig City, Philippines. The registered address of COLHK is Room 803, Luk Yu Building, 24-26 Stanley Street, Hong Kong.
On July 12, 2006, the Parent Company completed its initial public offering (IPO) of 110,000,000 common shares (25.58% of the total outstanding common stock) through the Philippine Stock Exchange (PSE).
On August 15, 2006, the Board of Directors (BOD) of the Parent Company approved the acquisition of the Trading Right of Mark Securities Corporation for the purpose of making the Parent Company a PSE Trading Participant. On December 13, 2006, the BOD of PSE approved the application of CitisecOnline as a Corporate Trading Participant in PSE through the transfer of the Trading Right registered in the name of Mark Securities Corporation and the designation of Mr. Conrado F. Bate as its Nominee Trading Participant.
On October 20, 2008, the Parent Company made an initial contribution to the Clearing and Trade Guaranty Fund (CTGF) of the Securities Clearing Corporation of the Philippines (SCCP) as a prerequisite to its accreditation as a clearing member of SCCP. On August 20, 2009, the Parent Company made a top-up contribution six (6) months after it started operating its own seat in the PSE on February 16, 2009.
Pursuant to a special resolution passed at an extraordinary general meeting of the Subsidiary held on May 19, 2011 and approved by the Companies Registry of the Securities and Futures Commission, the name of the Subsidiary was changed from CitisecOnLine.com Hong Kong Limited to COL Securities (HK) Limited.
On February 21, 2012, SEC approved the Parent Company‟s application for the change in company name from CitisecOnline.com, Inc. to COL Financial Group, Inc.
The accompanying consolidated financial statements of the Group as at December 31, 2011 and 2010 and for each of the three years in the period ended December 31, 2011 were authorized for issue by the BOD on March 1, 2012.
COL 2012 ANNUAL REPORT 35
- 2 -
*SGVFS000888*
2. Basis of Preparation, Statement of Compliance and Summary of Significant Accounting Policies
Basis of Preparation The consolidated financial statements have been prepared on a historical cost basis, except for financial assets at FVPL, which have been measured at fair value. The Group’s consolidated financial statements are presented in Philippine peso, which is the presentation currency under Philippine Financial Reporting Standards (PFRS). Based on the economic substance of the underlying circumstances relevant to the Group, the functional currencies of the Parent Company and COLHK have been determined to be Philippine peso and Hong Kong (HK) dollar, respectively. All values are rounded to the nearest peso, except as otherwise indicated.
Statement of Compliance The consolidated financial statements of the Group have been prepared in compliance with accounting principles generally accepted in the Philippines. The Group prepared its consolidated financial statements in accordance with PFRS, except for the use of closing prices for the valuation of equity securities as required by the Securities Regulation Code (SRC). PFRS requires the use of current bid prices for valuation of equity securities held.
Basis of Consolidation The consolidated financial statements include the accounts of the Parent Company and COLHK, a 100% owned and controlled foreign subsidiary, after eliminating significant intercompany balances and transactions.
The Subsidiary is consolidated from the date of acquisition, being the date on which the Parent Company obtains control, and continues to be consolidated until the date that such control ceases. The financial statements of the Subsidiary are prepared for the same reporting year as the Parent Company, using uniform accounting policies for like transactions and other events in similar circumstances.
Changes in Accounting Policies and Disclosures The accounting policies adopted are consistent with those of the previous financial year except for the following amended PFRS and Philippine Accounting Standards (PAS) which were adopted as at January 1, 2012.
PFRS 7, Financial Instruments: Disclosures - Transfers of Financial Assets (Amendments)
The amendments to PFRS 7 are effective for annual periods beginning on or after July 1, 2011. The amendments require additional disclosures about financial assets that have been transferred but not derecognized to enhance the understanding of the relationship between those assets that have not been derecognized and their associated liabilities. In addition, the amendments require disclosures about continuing involvement in derecognized assets to enable users of financial statements to evaluate the nature of, and risks associated with, the entity’s continuing involvement in those derecognized assets. The amendments affect disclosures only and have no impact on the Group’s financial position or performance.
PAS 12, Income Taxes - Deferred Tax: Recovery of Underlying Assets (Amendment)
The amendment to PAS 12 is effective for annual periods beginning on or after January 1, 2012. This amendment to PAS 12 clarifies the determination of deferred tax on investment property measured at fair value. The amendment introduces a rebuttable presumption that the carrying amount of investment property measured using the fair value model in PAS 40, Investment Property, will be recovered through sale and, accordingly, requires that any related deferred tax should be measured on a ‘sale’ basis. The presumption is rebutted if the investment property is depreciable and it is held within a business model
36
- 3 -
*SGVFS000888*
whose objective is to consume substantially all of the economic benefits in the investment property over time (‘use’ basis), rather than through sale. Furthermore, the amendment introduces the requirement that deferred tax on non-depreciable assets measured using the revaluation model in PAS 16, Property, Plant and Equipment, always be measured on a sale basis of the asset. The adoption of the amendments did not have any impact on the Group’s financial position or performance.
Standards Issued But Not Yet Effective The Group will adopt the following standards and interpretations enumerated below when these become effective. Except as otherwise indicated, the Group does not expect the adoption of these new and amended standards and interpretations to have a significant impact on its consolidated financial statements.
Effective in 2013:
PAS 1, Presentation of Financial Statements - Presentation of Items of Other Comprehensive
Income or OCI (Amendments) The amendments are effective for annual periods beginning on or after July 1, 2012. The amendments to PAS 1 change the grouping of items presented in OCI. Items that would be reclassified (or recycled) to profit or loss at a future point in time (for example, upon derecognition or settlement) would be presented separately from items that will never be reclassified. The amendments do not change the nature of the items that are currently recognized in OCI, nor do they impact the determination of whether items of OCI are classified through profit or loss in the future periods. The amendments will be applied retrospectively and will result to the modification of the presentation of items of OCI.
PAS 19, Employee Benefits (Revised)
The revised standard is effective for annual periods beginning on or after January 1, 2013. The revised standard includes a number of amendments that range from fundamental changes such as removing the corridor mechanism and the concept of expected returns on plan assets to simple clarifications and rewording. The revised standard also requires new disclosures such as, among others, a sensitivity analysis for each significant actuarial assumption, information on asset-liability matching strategies, duration of the defined benefit obligation, and disaggregation of plan assets by nature and risk. Once effective, the Group has to apply the amendments retroactively to the earliest period presented.
The Group reviewed its existing employee benefits and determined that the amended standard has an impact on its accounting for retirement benefits. The Group obtained the services of an external actuary to compute the impact to the Group’s financial statements upon adoption of the standard.
COL 2012 ANNUAL REPORT 37
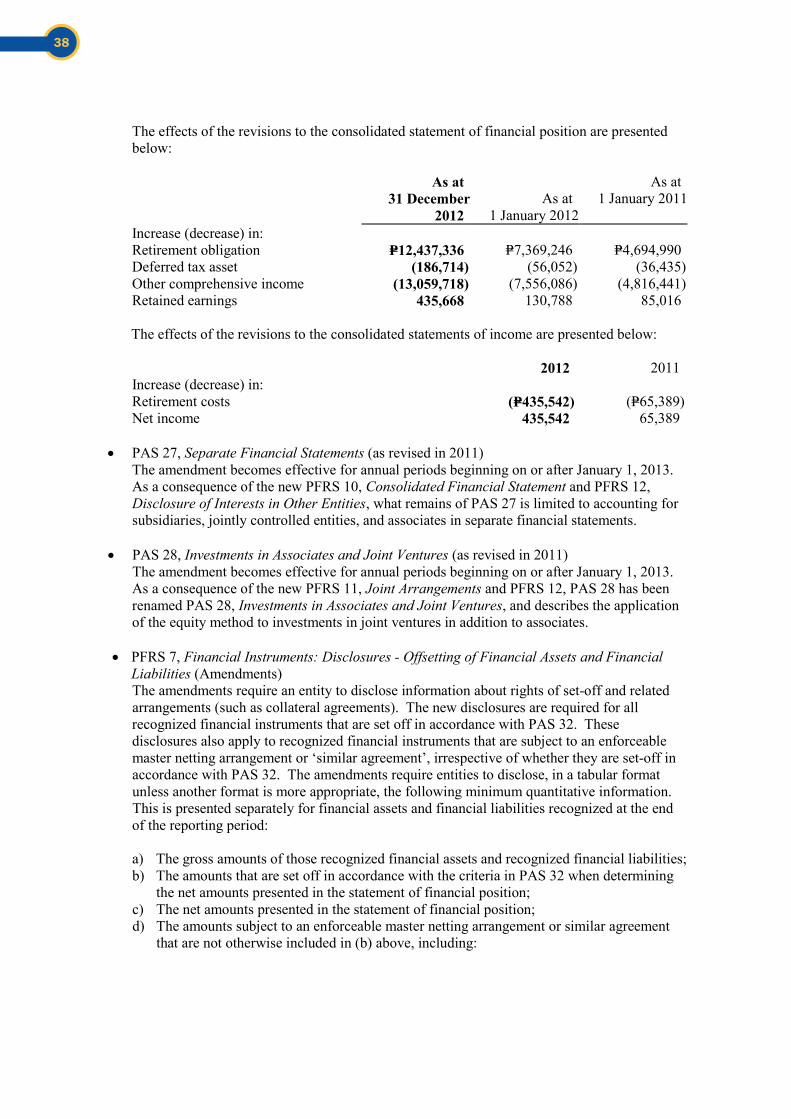
- 4 -
*SGVFS000888*
The effects of the revisions to the consolidated statement of financial position are presented below:
As at 31 December
2012 As at
1 January 2012
As at 1 January 2011
Increase (decrease) in: Retirement obligation P=12,437,336 P=7,369,246 P=4,694,990 Deferred tax asset (186,714) (56,052) (36,435) Other comprehensive income (13,059,718) (7,556,086) (4,816,441) Retained earnings 435,668 130,788 85,016
The effects of the revisions to the consolidated statements of income are presented below:
2012 2011 Increase (decrease) in: Retirement costs (P=435,542) (P=65,389) Net income 435,542 65,389
PAS 27, Separate Financial Statements (as revised in 2011)
The amendment becomes effective for annual periods beginning on or after January 1, 2013. As a consequence of the new PFRS 10, Consolidated Financial Statement and PFRS 12, Disclosure of Interests in Other Entities, what remains of PAS 27 is limited to accounting for subsidiaries, jointly controlled entities, and associates in separate financial statements.
PAS 28, Investments in Associates and Joint Ventures (as revised in 2011)
The amendment becomes effective for annual periods beginning on or after January 1, 2013. As a consequence of the new PFRS 11, Joint Arrangements and PFRS 12, PAS 28 has been renamed PAS 28, Investments in Associates and Joint Ventures, and describes the application of the equity method to investments in joint ventures in addition to associates.
PFRS 7, Financial Instruments: Disclosures - Offsetting of Financial Assets and Financial
Liabilities (Amendments) The amendments require an entity to disclose information about rights of set-off and related arrangements (such as collateral agreements). The new disclosures are required for all recognized financial instruments that are set off in accordance with PAS 32. These disclosures also apply to recognized financial instruments that are subject to an enforceable master netting arrangement or ‘similar agreement’, irrespective of whether they are set-off in accordance with PAS 32. The amendments require entities to disclose, in a tabular format unless another format is more appropriate, the following minimum quantitative information. This is presented separately for financial assets and financial liabilities recognized at the end of the reporting period:
a) The gross amounts of those recognized financial assets and recognized financial liabilities; b) The amounts that are set off in accordance with the criteria in PAS 32 when determining
the net amounts presented in the statement of financial position; c) The net amounts presented in the statement of financial position; d) The amounts subject to an enforceable master netting arrangement or similar agreement
that are not otherwise included in (b) above, including:
38
- 5 -
*SGVFS000888*
i. Amounts related to recognized financial instruments that do not meet some or all of the offsetting criteria in PAS 32; and
ii. Amounts related to financial collateral (including cash collateral); and e) The net amount after deducting the amounts in (d) from the amounts in (c) above.
The amendments to PFRS 7 are to be retrospectively applied and are effective for annual periods beginning on or after January 1, 2013. The amendments affect disclosures only and have no impact on the Group’s financial position or performance.
PFRS 10, Consolidated Financial Statements
This standard is effective for annual periods beginning on or after January 1, 2013. PFRS 10 replaces the portion of PAS 27, Consolidated and Separate Financial Statements, which addresses the accounting for consolidated financial statements. It also addresses the issues raised in Standing Interpretations Committee (SIC) 12, Consolidation - Special Purpose Entities, resulting to SIC being withdrawn. PFRS 10 establishes a single control model that applies to all entities including special purpose entities. The changes introduced by PFRS 10 will require management to exercise significant judgment to determine which entities are controlled, and therefore, are required to be consolidated by a parent, compared with the requirements that were in PAS 27. The new standard will be applied retrospectively. The new standard has no impact to the Group since the Parent Company’s subsidiary is wholly owned.
PFRS 11, Joint Arrangements
This standard is effective for annual periods beginning on or after January 1, 2013. PFRS 11 replaces PAS 31, Interests in Joint Ventures, and SIC 13, Jointly Controlled Entities - Non-Monetary Contributions by Venturers. PFRS 11 removes the option to account for jointly controlled entities using proportionate consolidation. Instead, jointly controlled entities that meet the definition of a joint venture must be accounted for using the equity method.
PFRS 12, Disclosure of Interests in Other Entities This standard is effective for annual periods beginning on or after January 1, 2013. PFRS 12 includes all of the disclosures related to consolidated financial statements that were previously in PAS 27, as well as all the disclosures that were previously included in PAS 31 and PAS 28, Investments in Associates. These disclosures relate to an entity’s interests in subsidiaries, joint arrangements, associates and structured entities. A number of new disclosures are also required. The adoption of PFRS 12 will affect disclosures only and have no impact on the Group’s financial position or performance.
PFRS 13, Fair Value Measurement
This standard is effective for annual periods beginning on or after January 1, 2013. PFRS 13 establishes a single source of guidance under PFRSs for all fair value measurements. PFRS 13 does not change when an entity is required to use fair value, but rather provides guidance on how to measure fair value under PFRS when fair value is required or permitted. This standard should be applied prospectively as of the beginning of the annual period in which it is initially applied. Its disclosure requirements need not be applied in comparative information provided for periods before initial application of PFRS 13.
The Group does not anticipate that the adoption of this standard will have a significant impact on its financial position and performance.
COL 2012 ANNUAL REPORT 39
- 6 -
*SGVFS000888*
Philippine Interpretation International Financial Reporting Interpretations Committee (IFRIC) 20, Stripping Costs in the Production Phase of a Surface Mine This interpretation becomes effective for annual periods beginning on or after January 1, 2013 and applies to waste removal costs that are incurred in surface mining activity during the production phase of the mine (“production stripping costs”). The interpretation addresses the accounting for the benefit from the stripping activity. This new interpretation is not relevant to the Group.
Annual Improvements to PFRSs (2009-2011 cycles)
These amendments to the standards are effective for annual periods beginning on or after January 1, 2013 and are applied retrospectively. Earlier application is permitted.
PFRS 1, First-time Adoption of PFRS - Borrowing Costs
The amendment clarifies that, upon adoption of PFRS, an entity that capitalized borrowing costs in accordance with its previous generally accepted accounting principles, may carry forward, without any adjustment, the amount previously capitalized in its opening statement of financial position at the date of transition. Subsequent to the adoption of PFRS, borrowing costs are recognized in accordance with PAS 23, Borrowing Costs. The amendment does not apply to the Group as it is not a first-time adopter of PFRS.
PAS 1, Presentation of Financial Statements - Clarification of the requirements for
comparative information The amendments clarify the requirements for comparative information that are disclosed voluntarily and those that are mandatory due to retrospective application of an accounting policy, or retrospective restatement or reclassification of items in the financial statements. An entity must include comparative information in the related notes to the financial statements when it voluntarily provides comparative information beyond the minimum required comparative period. The additional comparative period does not need to contain a complete set of financial statements. On the other hand, supporting notes for the third balance sheet (mandatory when there is a retrospective application of an accounting policy, or retrospective restatement or reclassification of items in the financial statements) are not required. The amendments affect disclosures only and have no impact on the Group’s financial position or performance.
PAS 16, Property, Plant and Equipment - Classification of servicing equipment
The amendment clarifies that spare parts, stand-by equipment and servicing equipment should be recognized as property, plant and equipment when they meet the definition of property, plant and equipment and should be recognized as inventory if otherwise. The amendment will not have any significant impact on the Group’s financial position or performance.
PAS 32, Financial Instruments: Presentation - Tax effect of distribution to holders of equity
instruments The amendment clarifies that income taxes relating to distributions to equity holders and to transaction costs of an equity transaction are accounted for in accordance with PAS 12, Income Taxes. The Group expects that this amendment will not have any impact on its financial position or performance.
40
- 7 -
*SGVFS000888*
PAS 34, Interim Financial Reporting - Interim financial reporting and segment information for total assets and liabilities The amendment clarifies that the total assets and liabilities for a particular reportable segment need to be disclosed only when the amounts are regularly provided to the chief operating decision maker and there has been a material change from the amount disclosed in the entity’s previous annual financial statements for that reportable segment. The amendment affects disclosures only and has no impact on the Group’s financial position or performance.
Effective in 2014:
PAS 32, Financial Instruments: Presentation - Offsetting of Financial Assets and Financial
Liabilities This standard is effective for annual periods beginning on or after January 1, 2014. The amendments clarify the meaning of “currently has a legally enforceable right to set-off” and also clarify the application of the PAS 32 offsetting criteria to settlement systems (such as central clearing house systems) which apply gross settlement mechanisms that are not simultaneous. The amendments affect presentation only and have no impact on the Group’s financial position or performance. The amendments to PAS 32 are to be applied retrospectively.
Effective in 2015:
PFRS 9, Financial Instruments This standard is effective for annual periods beginning on or after January 1, 2015. PFRS 9, as issued, reflects the first phase on the replacement of PAS 39, Financial Instruments: Recognition and Measurement and applies to the classification and measurement of financial assets and liabilities as defined in PAS 39. Work on impairment of financial instruments and hedge accounting is still ongoing, with a view to replacing PAS 39 in its entirety. PFRS 9 requires all financial assets to be measured at fair value at initial recognition. A debt financial asset may, if the fair value option (FVO) is not invoked, be subsequently measured at amortized cost if it is held within a business model that has the objective to hold the assets to collect the contractual cash flows and its contractual terms give rise, on specified dates, to cash flows that are solely payments of principal and interest on the principal outstanding. All other debt instruments are subsequently measured at FVPL. All equity financial assets are measured at fair value either through OCI or profit or loss. Equity financial assets held for trading must be measured at FVPL. For FVO liabilities, the amount of change in the fair value of a liability that is attributable to changes in credit risk must be presented in OCI. The remainder of the change in fair value is presented in profit or loss, unless presentation of the fair value change in respect of the liability’s credit risk in OCI would create or enlarge an accounting mismatch in profit or loss. All other PAS 39 classification and measurement requirements for financial liabilities have been carried forward into PFRS 9, including the embedded derivative separation rules and the criteria for using the FVO. The adoption of the first phase of PFRS 9 will have an effect on the classification and measurement of the Group’s financial assets, but will potentially have no impact on the classification and measurement of financial liabilities.
COL 2012 ANNUAL REPORT 41
- 8 -
*SGVFS000888*
To be Determined
Philippine Interpretation IFRIC 15, Agreements for the Construction of Real Estate This interpretation covers accounting for revenue and associated expenses by entities that undertake the construction of real estate directly or through subcontractors. The SEC and the Financial Reporting Standards Council have deferred the effectivity of this interpretation until the final Revenue standard is issued by the International Accounting Standards Board and an evaluation of the requirements of the final Revenue standard against the practices of the Philippine real estate industry is completed. Adoption of the interpretation when it becomes effective will not have any impact on the Group’s financial statements.
The revised, amended and additional disclosure or accounting changes provided by the standards and interpretations will be included in the consolidated financial statements in the year of adoption, if applicable.
Summary of Significant Accounting Policies
Foreign Currency Translation Transactions in foreign currencies are initially recorded in the prevailing functional currency exchange rate at the date of the transaction. Monetary assets and liabilities denominated in foreign currencies are restated at the closing functional currency rate of exchange at the end of the reporting period. All differences are taken to the consolidated statement of income.
The financial statements of the foreign consolidated subsidiary are translated at closing exchange rates with respect to the consolidated statement of financial position, and at the average exchange rates for the year with respect to the consolidated statement of income. Resulting translation differences are included in equity (under accumulated translation adjustment). Upon disposal of the foreign subsidiary, accumulated exchange differences are recognized in the consolidated statement of income as a component of the gain or loss on disposal.
Cash and Cash Equivalents Cash includes cash on hand and in banks. Cash equivalents are short-term, highly liquid investments that are readily convertible to known amounts of cash with original maturities of three (3) months or less from dates of acquisition and that are subject to insignificant risk of changes in value.
Financial Instruments - Initial Recognition and Subsequent Measurement Date of Recognition Financial instruments are recognized in the consolidated statement of financial position when the Group becomes a party to the contractual provisions of the instrument. Purchases or sales of financial assets that require delivery of assets within the time frame established by regulation or convention in the marketplace are recognized on the trade date.
Initial Recognition and Classification of Financial Instruments All financial assets, including trading and investment securities and loans and receivables, are initially measured at fair value. Except for securities valued at FVPL, the initial measurement of financial assets includes transaction costs. The Group classifies its financial assets in the
42
- 9 -
*SGVFS000888*
following categories: financial assets at FVPL, held to maturity (HTM) investments, available-for-sale (AFS) financial assets, and loans and receivables. The classification depends on the purpose for which the financial instruments were acquired and whether they are quoted in an active market. Management determines the classification of its financial instruments at initial recognition and, where allowed and appropriate, re-evaluates such designation at each end of the reporting period. The Group’s financial assets are of the nature of financial assets at FVPL, and loans and receivables. As at December 31, 2012 and 2011, the Group has no HTM investments and AFS financial assets.
Also under PAS 39, all financial liabilities are recognized initially at fair value and in the case of loans and borrowings, plus directly attributable transaction costs. Financial liabilities are classified as at FVPL or other financial liabilities. The Group’s financial liabilities as at December 31, 2012 and 2011 are of the nature of other financial liabilities.
Financial instruments are classified as liabilities or equity in accordance with the substance of the contractual arrangement. Interest, dividends, gains and losses relating to a financial instrument or a component that is a financial liability are reported as expense or income. Distributions to holders of financial instruments classified as equity are charged directly to equity net of any related income tax benefits.
Financial Assets and Financial Liabilities at FVPL Financial assets and financial liabilities at FVPL include financial assets and financial liabilities held for trading purposes, financial assets and financial liabilities designated upon by management at initial recognition as at FVPL, and derivative instruments (including bifurcated embedded derivatives). Financial assets and financial liabilities are classified as held for trading if they are acquired for the purpose of selling and repurchasing in the near term.
Financial assets or financial liabilities are designated as at FVPL on initial recognition when the following criteria are met:
The designation eliminates or significantly reduces the inconsistent treatment that would
otherwise arise from measuring the assets or liabilities or recognizing gains or losses on them on a different basis; or
The assets and liabilities are part of a group of financial assets, financial liabilities or both
which are managed and their performance evaluated on a fair value basis, in accordance with a documented risk management or investment strategy; or
The financial instrument contains an embedded derivative, unless the embedded derivative
does not significantly modify the cash flows or it is clear, with little or no analysis, that it would not be separately recorded.
Financial assets and financial liabilities at FVPL are recorded in the consolidated statement of financial position at fair value. Changes in fair value are recorded in ‘Gain on financial assets at FVPL - net’ in the consolidated statement of income. Interest earned or incurred is recorded in interest income or expense, respectively, while dividend income is recorded in other revenues according to the terms of the contract, or when the right of the payment has been established.
COL 2012 ANNUAL REPORT 43
- 10 -
*SGVFS000888*
As at December 31, 2012 and 2011, the Group has no financial assets and financial liabilities that have been designated as at FVPL.
Embedded Derivatives An embedded derivative is separated from the host contract and accounted for as derivative if all of the following conditions are met:
The economic characteristics and risks of the embedded derivative are not closely related
to the economic characteristic of the host contract;
A separate instrument with the same terms as the embedded derivative would meet the definition of the derivative; and
The hybrid or combined instrument is not recognized at FVPL.
Separated embedded derivatives are classified as financial assets or financial liabilities at FVPL unless they are designated as effective hedging instruments. Derivative instruments are initially recognized at fair value on the date in which a derivative transaction is entered into or bifurcated, and are subsequently re-measured at fair value. Derivatives are carried as assets when the fair value is positive and as liabilities when the fair value is negative. Consequently, gains and losses from changes in fair value of these derivatives are recognized immediately in the consolidated statement of income.
The Group assesses whether embedded derivatives are required to be separated from host contracts when the Group first becomes party to the contract. Reassessment only occurs if there is a change in the terms of the contract that significantly modifies the cash flows that would otherwise be required.
As at December 31, 2012 and 2011, the Group has no bifurcated embedded derivatives.
HTM Investments HTM investments are quoted non-derivative financial assets with fixed or determinable payments and fixed maturities for which the Group’s management has the positive intention and ability to hold to maturity. Where the Group sells other than an insignificant amount of HTM investments, during either the current financial year or the two (2) preceding financial years, the entire category would be tainted and reclassified as AFS financial assets and will be re-measured to fair value. After initial measurement, these investments are subsequently measured at amortized cost using the effective interest rate method (EIR), less impairment in value. Amortized cost is calculated by taking into account any discount or premium on acquisition and fees that are an integral part of the EIR.
The amortization is included in ‘Interest income’ in the consolidated statement of income. Gains and losses are recognized in income when the HTM investments are derecognized and impaired, as well as through the amortization process. The losses arising from impairment of such investments are recognized in the consolidated statement of income.
Loans and Receivables These are non-derivative financial assets with fixed or determinable payments that are not quoted in an active market. They arise when the Group provides money, goods or services directly to a debtor with no intention of trading the receivables.
44
- 11 -
*SGVFS000888*
This accounting policy mainly relates to the consolidated statement of financial position captions ‘Cash and cash equivalents’ and ‘Trade and other receivables’, which arise primarily from service revenues and other types of receivables.
Receivables are recognized initially at fair value, which normally pertains to the billable amount. After initial measurement, loans and receivables are subsequently measured at amortized cost using the EIR method, less allowance for credit losses. Amortized cost is calculated by taking into account any discount or premium on acquisition and fees and costs that are an integral part of the EIR. The amortization is included in ‘Interest income’ in the consolidated statement of income. The losses arising from impairment are recognized in ‘Provision for credit losses’ in the consolidated statement of income.
Other Financial Liabilities Issued financial instruments or their components, which are not designated as at FVPL are classified as other financial liabilities, where the substance of the contractual arrangement results in the Group having an obligation either to deliver cash or another financial asset to the holder, or to satisfy the obligation other than by the exchange of a fixed amount of cash or another financial asset for a fixed number of own equity shares. The components of issued financial instruments that contain both liability and equity elements are accounted for separately, with the equity component being assigned the residual amount after deducting from the instrument as a whole the amount separately determined as the fair value of the liability component on the date of issue. After initial measurement, other financial liabilities are measured at amortized cost using the EIR method. Amortized cost is calculated by taking into account any discount or premium on the issue and fees that are an integral part of the EIR. Any effects of restatement of foreign currency-denominated liabilities are recognized in ‘Foreign exchange gains - net’ account in the consolidated statement of income.
This accounting policy applies primarily to the consolidated statement of financial position captions ‘Trade payables’ and ‘Other current liabilities’ and other obligations that meet the above definition (other than liabilities covered by other accounting standards, such as income tax payable).
Fair Value The fair value of financial instruments that are actively traded in organized financial markets is determined by reference to quoted market close prices at the close of business on the reporting period.
For investments where there is no active market, fair value is determined using valuation techniques. Such techniques include comparison to similar investments for which market observable prices exist and discounted cash flow analysis or other valuation models.
Day 1 Difference Where the transaction price in a non-active market is different from the fair value from other observable current market transactions in the same instrument or based on a valuation technique whose variables include only data from observable market, the Group recognizes the difference between the transaction price and fair value (a ‘Day 1’ difference) in the consolidated statement of income unless it qualifies for recognition as some other type of asset. In cases where fair value is determined using data which is not observable, the difference between the transaction price and model value is recognized in the consolidated statement of income only when the inputs become observable or when the instrument is derecognized. For each transaction, the Group determines the appropriate method for recognizing the ‘Day 1’ difference amount.
COL 2012 ANNUAL REPORT 45
- 12 -
*SGVFS000888*
Trade Receivables and Payables Trade receivables from customers, which include margin accounts and payable to clearing house and other brokers arise from securities purchased (in a regular way transaction) that have been contracted for but not yet delivered at the end of the reporting period. Payable to customers and receivable from clearing house and other brokers arise from securities sold (in a regular way transaction) that have been contracted for but not yet delivered at the end of the reporting period. Refer to the accounting policy for ‘Loans and Receivables’ and ‘Other Financial Liabilities’ for recognition and measurement.
Derecognition of Financial Instruments Financial Assets A financial asset (or, where applicable a part of a financial asset or part of a group of similar financial assets) is derecognized when:
The rights to receive cash flows from the asset have expired;
The Group retains the right to receive cash flows from the asset, but has assumed an
obligation to pay them in full without material delay to a third party under a ‘pass-through’ arrangement; or
The Group has transferred its rights to receive cash flows from the asset and either (a) has
transferred substantially all the risks and rewards of the asset, or (b) has neither transferred nor retained substantially all the risks and rewards of the asset, but has transferred control of the asset.
When the Group has transferred its rights to receive cash flows from an asset and has neither transferred nor retained substantially all the risks and rewards of the asset nor transferred control of the asset, the asset is recognized to the extent of the Group’s continuing involvement in the asset. Continuing involvement that takes the form of a guarantee over the transferred asset is measured at the lower of the original carrying amount of the asset and the maximum amount of consideration that the Group could be required to repay.
When the Group continues to recognize an asset to the extent of its continuing involvement, the entity also recognizes an associated liability. Despite the other measurement requirements in PFRS, the transferred asset and the associated liability are measured on a basis that reflects the rights and obligations that the entity has retained. The associated liability is measured in such a way that the net carrying amount of the transferred asset and the associated liability is:
a. the amortized cost of the rights and obligations retained by the entity, if the transferred
asset is measured at amortized cost; or
b. equal to the fair value of the rights and obligations retained by the entity when measured on a stand-alone basis, if the transferred asset is measured at fair value.
The Group shall continue to recognize any income arising on the transferred asset to the extent of its continuing involvement and shall recognize any expense incurred on the associated liability.
Financial Liabilities A financial liability is derecognized when the obligation under the liability is discharged or cancelled or has expired.
46
- 13 -
*SGVFS000888*
Where an existing financial liability is replaced by another from the same lender on substantially different terms, or the terms of an existing liability are substantially modified, such exchange or modification is treated as a derecognition of the original liability and the recognition of a new liability, and the difference in the respective carrying amounts is recognized in the consolidated statement of income.
Impairment of Financial Assets The Group assesses at each end of the reporting period whether a financial asset or group of financial assets is impaired.
Assets Carried at Amortized Cost The Group first assesses whether objective evidence of impairment exists individually for financial assets that are individually significant, and individually or collectively for financial assets that are not individually significant. If it is determined that no objective evidence of impairment exists for an individually assessed financial asset, whether significant or not, the asset is included in a group of financial assets with similar credit risk characteristics and that group of financial assets is collectively assessed for impairment. Assets that are individually assessed for impairment and for which an impairment loss is or continues to be recognized are not included in a collective assessment of impairment.
If there is objective evidence that an impairment loss on loans and receivables carried at amortized cost has been incurred, the amount of the loss is measured as the difference between the asset’s carrying amount and the present value of estimated future cash flows (excluding future credit losses that have not been incurred) discounted at the financial asset’s original EIR (i.e., the EIR computed at initial recognition). The carrying amount of the asset shall be reduced either directly or through the use of an allowance account. The amount of the loss shall be recognized in the consolidated statement of income.
If, in a subsequent period, the amount of the impairment loss decreases and the decrease can be related objectively to an event occurring after the impairment was recognized, the previously recognized impairment loss is reversed. Any subsequent reversal of an impairment loss is recognized in the consolidated statement of income, to the extent that the carrying value of the asset does not exceed its amortized cost at the reversal date.
In relation to receivables, a provision for credit losses is made when there is objective evidence (such as the probability of insolvency or significant financial difficulties of the debtor) that the Group will not be able to collect all of the amounts due under the original terms of the invoice. The carrying amount of the receivable is reduced through the use of an allowance account. Impaired debts are derecognized when they are assessed as uncollectible.
Offsetting Financial assets and liabilities are only offset and the net amount reported in the consolidated statement of financial position when there is a legally enforceable right to offset the recognized amounts and the Group intends to either settle on a net basis, or to realize the asset and the liability simultaneously. Input Value-added Taxes (VAT) Input VAT represents VAT imposed on the Parent Company by its suppliers and contractors for the acquisition of goods and services required under Philippine taxation laws and regulations.
Input VAT is stated at its estimated net realizable values.
COL 2012 ANNUAL REPORT 47
- 14 -
*SGVFS000888*
Prepayments and Other Noncurrent Assets The Group’s prepayments are composed of prepaid insurance, prepaid taxes, prepaid subscriptions and other prepayments. Other noncurrent assets are composed of deposit to CTGF, refundable deposits and other deposits. These assets are classified as current when it is probable to be realized within one (1) year from the end of the reporting period. Otherwise, these are classified as noncurrent assets.
Property and Equipment Property and equipment is stated at cost, excluding the costs of day-to-day servicing, less accumulated depreciation and amortization and any accumulated impairment in value. Such cost includes the cost of replacing part of such property and equipment, if the recognition criteria are met. The initial cost of property and equipment comprises its purchase price, including import duties, non-refundable taxes and any directly attributable costs of bringing the asset to its working condition and location for its intended use. Expenditures incurred after the property and equipment have been put into operations, such as repairs and maintenance, are normally charged against income in the period when the costs are incurred. In situations where it can be clearly demonstrated that the expenditures have resulted in an increase in the future economic benefits expected to be obtained from the use of an item of property and equipment beyond its originally assessed standard of performance, the expenditures are capitalized as additional costs of property and equipment.
Each part of an item of property and equipment with a cost that is significant in relation to the total cost of the item is depreciated separately.
Depreciation and amortization is computed on the straight-line basis over the following estimated useful lives of the assets:
Category Number of Years Furniture, fixtures and equipment 3-10 Leasehold improvements
5 or term of lease, whichever is shorter
The carrying values of property and equipment are reviewed for impairment when events or changes in circumstances indicate that the carrying value may not be recoverable.
An item of property and equipment is derecognized upon disposal or when no future economic benefits are expected from its use or disposal. Any gain or loss arising on derecognition of the asset (calculated as the difference between the net disposal proceeds and the carrying amount of the asset) is included in the consolidated statement of income in the year the asset is derecognized. The asset’s residual values, if any, useful lives and methods are reviewed and adjusted if appropriate, at each end of the reporting period.
Intangibles Intangibles are composed of exchange trading rights, which are carried at cost less any allowance for impairment losses. Exchange trading rights are reviewed for impairment annually or more frequently if events or changes in circumstances indicate that the carrying values may be impaired. The exchange trading rights are deemed to have indefinite useful lives as there is no foreseeable limit to the period over which the asset is expected to generate net cash inflows for the Group. The Parent Company does not intend to sell its exchange trading right in the near future. COLHK’s exchange trading right is a nontransferable right.
48
- 15 -
*SGVFS000888*
Impairment of Non-financial Assets The Group assesses at each end of the reporting period whether there is an indication that its property and equipment, intangibles and other noncurrent assets may be impaired. If any such indication exists or when the annual impairment testing for an asset is required, the Group makes an estimate of the asset’s recoverable amount. An asset’s recoverable amount is the higher of the asset’s value-in-use (VIU) or its fair value less costs to sell. The fair value less costs to sell is the amount obtainable from the sale of an asset at an arm’s-length transaction, while VIU is the present value of estimated future cash flows expected to arise from the continuing use of an asset and from its disposal at the end of its useful life. Where the carrying amount of an asset exceeds its recoverable amount, the asset is considered impaired and is written down to its recoverable amount. An impairment loss is recognized by a charge against current operations for the excess of the carrying amount of an asset over its recoverable amount in the year in which it arises.
A previously recognized impairment loss is reversed by a credit to current operations to the extent that it does not restate the asset to a carrying amount in excess of what would have been determined (net of any accumulated depreciation and amortization) had no impairment loss been recognized for the asset in prior years.
Leases Determination of Whether an Arrangement Contains a Lease The determination of whether an arrangement is, or contains a lease is based on the substance of the arrangement and requires an assessment of whether the fulfillment of the arrangement is dependent on the use of a specific asset or assets and the arrangement conveys a right to use the asset. A reassessment is made after inception of the lease only if one of the following applies:
(a) There is a change in contractual terms, other than a renewal or extension of the
arrangement;
(b) A renewal option is exercised or extension granted, unless that term of the renewal or extension was initially included in the lease term;
(c) There is a change in the determination of whether fulfillment is dependent on a specified
asset; or
(d) There is a substantial change to the asset.
Where a reassessment is made, lease accounting shall commence or cease from the date when the change in circumstances gave rise to the reassessment for scenarios (a), (c) or (d) above, and at the date of renewal or extension period for scenario (b).
Group as a Lessee Leases where the lessor retains substantially all the risks and benefits of ownership of the asset are classified as operating leases. Operating lease payments are recognized as an expense in the consolidated statement of income on a straight-line basis over the lease term.
Provisions Provisions are recognized when the Group has a present obligation (legal or constructive) as a result of a past event, it is probable that an outflow of resources embodying economic benefits will be required to settle the obligation and a reliable estimate can be made of the amount of
COL 2012 ANNUAL REPORT 49
- 16 -
*SGVFS000888*
the obligation. If the effect of the time value of money is material, provisions are made by discounting the expected future cash flows at a pre-tax rate that reflects current market assessments of the time value of money and, where appropriate, the risks specific to the liability. Where discounting is used, the increase in the provision due to the passage of time is recognized as an interest expense.
Where the Group expects some or all of a provision to be reimbursed, the reimbursement is recognized as a separate asset but only when the reimbursement is virtually certain. The expense relating to any provision is presented in the consolidated statement of income, net of any reimbursement.
Capital Stock and Capital in Excess of Par Value The Parent Company has issued capital stock that is classified as equity. Incremental costs directly attributable to the issue of new capital stock are shown in equity as a deduction, net of any related tax benefit, from the proceeds.
Where the Group purchases the Parent Company’s capital stock (treasury shares), the consideration paid, including any directly attributable incremental costs (net of applicable taxes) is deducted from equity attributable to the Parent Company’s stockholders until the shares are cancelled or reissued. Where such shares are subsequently reissued, any consideration received, net of any directly attributable incremental transaction costs and the related tax effects, is included in equity.
Amount of contribution in excess of par value is accounted for as a capital in excess of par value. Capital in excess of par value also arises from additional capital contribution from the stockholders.
Retained Earnings Retained earnings are accumulated profits realized out of normal and continuous operations of the business after deducting therefrom distributions to stockholders and transfers to capital or other accounts. Cash and stock dividends are recognized as a liability and a deduction from equity when they are approved by the Group’s BOD and stockholders, respectively. Dividends for the year that are approved after the reporting period are dealt with as an event after the end of the reporting period. Retained earnings may also include effect of changes in accounting policy as may be required by the standard’s transitional provisions.
Revenue Recognition Revenue is recognized to the extent that it is probable that the economic benefits will flow to the Group and the revenue can be reliably measured. The Group is acting as principal in all arrangements except for its brokerage transactions. The following specific recognition criteria must also be met before revenue is recognized:
Commissions Commissions are recognized as income upon confirmation of trade deals. These are computed based on a flat rate for every trade transaction.
Interest Interest income is recognized as it accrues taking into account the effective yield of the asset.
Dividend Dividend income is recognized when the right to receive payment is established, which is the date of declaration.
50
- 17 -
*SGVFS000888*
Cost and Expenses Cost and expenses are decreases in economic benefits during the accounting period in the form of outflows or decrease of assets or incurrence of liabilities that result in decreases in equity, other than those relating to distributions to equity participants. Cost and expenses are recognized when the related revenue is earned or when the service is incurred. The majority of cost and expenses incurred by the Group such as commissions, personnel costs, professional fees, and computer services, are overhead in nature and are recognized with regularity as the Group continues its operations.
Share-Based Payment Transactions Certain employees (including senior executives) of the Group receive remuneration in the form of share-based payment transactions, whereby employees render services in exchange for shares or rights over shares (‘equity-settled transactions’).
The cost of equity-settled transactions with employees is measured by reference to the fair value at the date at which they are granted. In valuing equity-settled transactions, vesting conditions, including performance conditions, other than market conditions (conditions linked to share prices), shall not be taken into account when estimating the fair value of the shares or share options at the measurement date. Instead, vesting conditions are taken into account in estimating the number of equity instruments that will vest. The fair value is determined using an appropriate pricing model, further details of which are given in Note 17 to the notes to consolidated financial statements.
The cost of equity-settled transactions is recognized in the consolidated statement of income, together with a corresponding increase in equity, over the period in which service conditions are fulfilled, ending on the date on which relevant employees become fully entitled to the award (vesting date). The cumulative expense recognized for equity-settled transactions at each end of the reporting period until the vesting date reflects the extent to which the vesting period has expired and the number of awards, based on the best available estimate of number of equity instruments in the opinion of the management of the Group, will ultimately vest.
No expense is recognized for awards that do not ultimately vest, except for awards where vesting is conditional upon a market condition, which are treated as vesting irrespective of whether or not the market condition is satisfied, provided that all other performance conditions are satisfied. Where the terms of an equity-settled award are modified, as a minimum, expense is recognized as if the terms had not been modified. In addition, an expense is recognized for any increase in the value of the transaction as a result of the modification, measured at the date of modification. Where an equity-settled award is cancelled, it is treated as if it had vested on the date of cancellation, and any expense not yet recognized for the award is recognized immediately. However, if a new award is substituted for the cancelled award, and designated as a replacement award on the date that it is granted, the cancelled and new awards are treated as if they were a modification of the original award, as described in the previous paragraph.
The Group has applied PFRS 2, only to equity-settled awards granted after November 7, 2002 that had not vested on or before January 1, 2005.
Prior to January 1, 2005, the Group did not recognize any expense for share options granted but disclosed required information for such options (see Note 17). The Group recognizes capital stock upon the exercise of the stock options.
Retirement Costs The Parent Company has a noncontributory defined benefit retirement plan.
COL 2012 ANNUAL REPORT 51

- 18 -
*SGVFS000888*
The retirement costs of the Parent Company is determined using the projected unit credit method. Under this method, the current service cost is the present value of retirement benefits payable in the future with respect to services rendered in the current period.
The liability recognized in the consolidated statement of financial position in respect of the defined benefit retirement plan is the present value of the defined benefit retirement obligation at the end of the reporting period less the fair value of any plan assets, together with adjustments for unrecognized actuarial gains or losses and past service costs. The defined benefit retirement obligation is calculated annually, as necessary, by an independent actuary using the projected unit credit method. The present value of the defined benefit retirement obligation is determined by discounting the estimated future cash outflows using interest rate on government bonds that have terms to maturity approximating the terms of the related retirement liability. Actuarial gains and losses arising from experience adjustments and changes in actuarial assumptions are credited to or charged against income when the net cumulative unrecognized actuarial gains and losses at the end of the previous period exceeded ten percent (10%) of the higher of the defined benefit retirement obligation and the fair value of plan assets, if any, at that date. These gains or losses are recognized over the expected average remaining working lives of the employees participating in the plan.
Past service costs, if any, are recognized immediately in the consolidated statement of income, unless the changes to the retirement plan are conditional on the employees remaining in service for a specified period of time (the vesting period). In this case, the past-service costs are amortized on a straight-line basis over the vesting period.
The defined benefit asset or liability comprises the present value of the defined benefit retirement obligation less past service costs not yet recognized and less the fair value of any plan assets out of which the obligations are to be settled directly. The value of any asset is restricted to the sum of any past service cost not yet recognized and the present value of any economic benefits available in the form of refunds from the plan or reductions in the future contributions to the plan.
The retirement plan of COLHK is a defined contribution retirement plan. Under a defined contribution retirement plan, the entity’s legal and constructive obligation is limited to the amount that it agrees to contribute to the fund. Thus, the amount of the post-employment benefits received by the employee is determined by the amount of contributions paid by an entity to a post-employment benefit plan, together with investment returns arising from the contributions. Consequently, actuarial risk (that benefits will be less than expected) and investment risk (that assets invested will be sufficient to meet expected benefits) fall on the employee.
The standard requires an entity to recognize short-term employee benefits when an employee has rendered service in exchange of those benefits.
Earnings Per Share (EPS) Basic EPS is computed by dividing earnings applicable to common stock by the weighted average number of common shares outstanding, after giving retroactive effect for any stock dividends, stock splits or reverse stock splits during the year.
Diluted EPS is computed by dividing net income by the weighted average number of common shares outstanding during the year, after giving retroactive effect for any stock dividends, stock splits or reverse stock splits during the year, and adjusted for the effect of dilutive options. Outstanding stock options will have a dilutive effect under the treasury stock method only when
52

- 19 -
*SGVFS000888*
the average market price of the underlying common share during the period exceeds the exercise price of the option. Where the effect of the exercise of all outstanding options has anti-dilutive effect, basic and diluted EPS are stated at the same amount.
Income Taxes Current Income Tax Current income tax assets and liabilities for the current and prior periods are measured at the amount expected to be recovered from or paid to the taxation authorities. The tax rates and tax laws used to compute the amount are those that are enacted or substantively enacted at the end of the reporting period.
Deferred Income Tax Deferred income tax is provided, using the balance sheet liability method, on all temporary differences at the end of the reporting period between the tax bases of assets and liabilities and their carrying amounts for financial reporting purposes.
Deferred income tax liabilities are recognized for all taxable temporary differences, including asset revaluations. Deferred income tax assets are recognized for all deductible temporary differences to the extent that it is probable that sufficient future taxable income will be available against which the deductible temporary differences can be utilized. Deferred income tax, however, is not recognized on temporary differences that arise from the initial recognition of an asset or liability in a transaction that is not a business combination and, at the time of the transaction, affects neither the accounting income nor the taxable income or loss.
With respect to investments in foreign subsidiaries, deferred income tax liabilities are recognized except where the timing of the reversal of the temporary difference can be controlled and it is probable that the temporary difference will not reverse in the foreseeable future.
The carrying amount of deferred income tax assets is reviewed at each end of the reporting period and reduced to the extent that it is no longer probable that sufficient future taxable income will be available to allow all or part of the deferred income tax asset to be utilized. Unrecognized deferred income tax assets are reassessed at each end of the reporting period and are recognized to the extent that it has become probable that future taxable income will allow the deferred income tax asset to be recovered.
Deferred income tax assets and liabilities are measured at the tax rates that are applicable to the period when the asset is realized or the liability is settled, based on tax rates and tax laws that have been enacted or substantively enacted at the end of the reporting period.
Current income tax and deferred income tax relating to items recognized directly in equity is also recognized in equity and not in the consolidated statement of income. Deferred income tax assets and deferred income tax liabilities are offset if a legally enforceable right exists to offset current income tax assets against current income tax liabilities and deferred income taxes related to the same taxable entity and the same taxation authority.
Contingencies Contingent liabilities are not recognized in the consolidated financial statements. These are disclosed unless the possibility of an outflow of resources embodying economic benefits is remote. Contingent assets are not recognized in the consolidated financial statements but are disclosed when an inflow of economic benefits is probable.
COL 2012 ANNUAL REPORT 53
- 20 -
*SGVFS000888*
Segment Reporting The Group’s operating businesses are organized and managed separately according to the geographical location of its operations, with each segment representing a unit that offers stockbrokerage services and serves different markets. Financial information on geographical segments is presented in Note 26. The Group operates in one business segment, being stockbrokerage services; therefore, business segment information is no longer presented.
Events After the Reporting Period Post-year-end events that provide additional information about the Group’s position at the end of the reporting period (adjusting events) are reflected in the consolidated financial statements. Post-year-end events that are not adjusting events are disclosed when material.
3. Summary of Significant Accounting Judgments, Estimates and Assumptions
The preparation of the consolidated financial statements in accordance with PFRS requires the Group to make judgments and estimates that affect the reported amounts of assets, liabilities, income and expenses and disclosure of contingent assets and contingent liabilities. Future events may occur which will cause the judgments and assumptions used in arriving at the estimates to change. The effects of any change in judgments and estimates are reflected in the consolidated financial statements as they become reasonably determinable.
Judgments and estimates and assumptions are continually evaluated and are based on historical experience and other factors, including expectations of future events that are believed to be reasonable under the circumstances. However, actual outcome can differ from these estimates.
Judgments In the process of applying the Company’s accounting policies, management has made the following judgments, apart from those involving estimations, which have the most significant effect on the amounts recognized in the consolidated financial statements:
Determining Functional Currency Based on the economic substance of the underlying circumstances relevant to the Group, the functional currencies of the Parent Company and COLHK have been determined to be Philippine peso and HK dollar, respectively. The Philippine peso and the HK dollar are the currencies of the primary economic environments in which the Parent Company and COLHK, respectively, operate. They are the currencies that mainly influence the revenue and expenses of the Parent Company and COLHK.
Assessment on Whether an Agreement is a Finance or Operating Lease Management assesses at the inception of the lease whether an arrangement is a finance or operating lease based on who bears substantially all risk and benefits incidental to the ownership of the leased item. Based on management’s assessment, the risk and rewards of owning the items leased by the Group are retained by the lessor and therefore accounts for as operating lease.
Operating Lease Commitments - Group as Lessee The Group has entered into commercial property leases on its facility and administrative office locations. The Group has determined that these are operating leases since they do not retain all the significant risks and rewards of ownership of these properties.
54
- 21 -
*SGVFS000888*
Classifying Financial Assets at FVPL The Group classifies financial assets that are held for trading as financial assets at FVPL. These financial assets are held for the purpose of selling in the short term. As at December 31, 2012 and 2011, the Group has financial assets at FVPL amounting to P=2,729,120 and P=1,313,282, respectively (see Note 6).
Deferred Income Tax Assets The Group reviews the carrying amounts of deferred income tax assets at each end of the reporting period and reduces deferred income tax assets to the extent that it is no longer probable that sufficient future taxable income will be available to allow all or part of the deferred income tax assets to be utilized. The Group has net deferred income tax assets amounting to P=57,792,124 and P=75,178,490 as at December 31, 2012 and 2011, respectively (see Note 18).
Estimates and Assumptions The key assumptions concerning the future and other key sources of estimation uncertainty at the end of the reporting period, that have a significant risk of causing a material adjustment to the carrying amounts of assets and liabilities within the next financial year are discussed below.
Estimating Impairment of Trade and Other Receivables The Group reviews its receivables at each end of the reporting period to assess whether provision for impairment losses should be recorded in the consolidated statement of income. In particular, judgment by management is required in the estimation of the amount and timing of future cash flows when determining the level of allowance required. The Group individually assesses receivables when the value of the collateral falls below the management-set level. When no payment is received within a specified timeframe, the outstanding balance is deemed impaired. Collective assessment is based on the age of the financial assets and historical expected losses adjusted for current conditions.
As at December 31, 2012 and 2011, the allowance for credit losses on trade and other receivables amounted to P=12,465,143 and P=12,830,410, respectively (Note 7).
The carrying value of trade and other receivables as at December 31, 2012 and 2011 amounted to P=1,449,323,839 and P=1,168,821,109, respectively (see Note 7).
Estimating Useful Lives of Property and Equipment The Group estimates the useful lives of its property and equipment based on the period over which the assets are expected to be available for use. The Group reviews annually the estimated useful lives of property and equipment based on factors that include asset utilization, internal technical evaluation, technological changes, environmental and anticipated use of the assets tempered by related industry benchmark information. It is possible that future results of operations could be materially affected by changes in the Group’s estimates brought about by changes in the factors mentioned. Depreciation and amortization amounted to P=16,358,489, P=12,132,089 and P=9,142,634 in 2012, 2011 and 2010, respectively. As at December 31, 2012 and 2011, the net book values of property and equipment amounted to P=38,397,201 and P=41,731,847, respectively (see Note 9).
Assessing Impairment of Property and Equipment and Other Noncurrent Assets The Group assesses impairment on property and equipment and other noncurrent assets whenever events or changes in circumstances indicate that the carrying amount of an asset may not be recoverable. The factors that the Group considers important which could trigger an impairment review include the following:
COL 2012 ANNUAL REPORT 55
- 22 -
*SGVFS000888*
Significant underperformance relative to expected historical or projected future operating results;
Significant changes in the manner of use of the acquired assets or the strategy for overall
business; and
Significant negative industry or economic trends.
An impairment loss is recognized whenever the carrying amount of an asset exceeds its recoverable amount. The recoverable amount is the higher of an asset’s fair value less costs to sell and VIU. The fair value less costs to sell is the amount obtainable from the sale of an asset in an arm’s-length transaction less the costs of disposal while VIU is the present value of estimated future cash flows expected to arise from the continuing use of an asset and from its disposal at the end of its useful life.
In determining the present value of estimated future cash flows expected to be generated from the continued use of the assets, the Group is required to make estimates and assumptions that can materially affect the consolidated financial statements.
Based on management’s assessment, there are no indications of impairment on the Group’s property and equipment as at December 31, 2012 and 2011.
No impairment loss was recognized in 2012, 2011 and 2010 for property and equipment and other noncurrent assets.
As at December 31, 2012 and 2011, the Group has no allowance for impairment losses on property and equipment. The net book values of property and equipment amounted to P=38,397,201 and P=41,731,847 as at December 31, 2012 and 2011, respectively (see Note 9).
As at December 31, 2012 and 2011, allowance for impairment losses on other noncurrent assets amounted to P=13,724,200. The net book values of other noncurrent assets amounted to P=9,158,278 and P=8,626,513, respectively (see Note 11).
Determining Useful Lives and Impairment of the Intangibles Intangibles include exchange trading rights, which are carried at cost less any allowance for impairment loss. Exchange trading rights are reviewed for impairment annually or more frequently if events or changes in circumstances indicate that the carrying values may be impaired. The exchange trading rights are deemed to have indefinite useful lives as there is no foreseeable limit to the period over which the asset is expected to generate net cash inflows for the Group.
The management’s impairment test for the Parent Company’s exchange trading right is based on the available market value while COLHK’s exchange trading right is based on VIU calculation that uses a discounted cash flow model. The cash flows are derived from the budget for the next five (5) years. The recoverable amount is most sensitive to the discount rate used for the discounted cash flow model as well as the expected future cash inflows and the growth rate used.
56
- 23 -
*SGVFS000888*
The key assumptions used to determine the recoverable amount of the Group’s exchange trading rights are further explained in Note 10. The Parent Company does not intend to sell its exchange trading right in the near future. COLHK’s right is nontransferable with an indefinite useful life. As at December 31, 2012 and 2011, the carrying values of intangibles amounted to P=21,952,936 and P=23,027,647, respectively (see Note 10).
Determining Fair Values of Financial Instruments PFRS requires that certain financial assets and liabilities be carried at fair value, which requires the use of accounting judgment and estimates. While significant components of fair value measurement are determined using verifiable objective evidence (e.g., foreign exchange rates, interest rates and volatility rates), the timing and amount of changes in fair value would differ with the valuation methodology used. Any change in the fair value of these financial assets and liabilities would directly affect the statement of income and the statement of changes in equity.
The fair values of the Group’s financial assets as at December 31, 2012 and 2011 amounted to P=4,103,869,695 and P=3,363,987,195, respectively, while the fair values of financial liabilities as at December 31, 2012 and 2011 amounted to P=2,902,850,793 and P=2,189,442,416, respectively (see Note 23).
Estimating Contingencies The Group evaluates legal and administrative proceedings to which it is involved based on analysis of potential results. Management and its legal counsels do not believe that any current proceedings will have material adverse effects on its financial position and results of operations. It is possible, however, that future results of operations could be materially affected by changes in the estimates or in the effectiveness of strategies relating to these proceedings (see Note 24).
Share-Based Payments The Group measures the cost of equity-settled transactions with employees by reference to the fair value of the equity instruments at the date at which they are granted. Estimating fair value for share-based payments requires determining the most appropriate valuation model for a grant of equity instruments, which is dependent on the terms and conditions of the grant. This also requires determining the most appropriate inputs to the valuation model including the expected life of the option, volatility and dividend yield and making assumptions about them. The assumptions and models used for estimating fair value for share-based payments are disclosed in Note 17. As at December 31, 2012 and 2011, cost of share-based payment in equity amounted to P=33,263,658 and P=63,541,685, respectively (see Note 17).
Retirement Obligation The cost of defined benefit retirement plans is determined using an actuarial valuation. The actuarial valuation involves making assumptions about discount rates, expected rates of return on assets, future salary increases, mortality rates and future pension increases. Due to the long-term nature of these plans, such estimates are subject to significant uncertainty.
The assumed discount rates were determined using the market yields on Philippine Government bonds with terms consistent with the expected employee benefit payout at the end of the reporting period. As at December 31, 2012 and 2011, the retirement obligation of the Parent Company amounted to P=10,676,598 and P=6,152,980, respectively (see Note 17).
COL 2012 ANNUAL REPORT 57
- 24 -
*SGVFS000888*
4. Cash and Cash Equivalents
2012 2011 Cash on hand and in banks P=327,438,524 P=408,345,847 Short-term cash investments 2,255,613,378 1,602,413,651 P=2,583,051,902 P=2,010,759,498
Cash in banks earn interest at the respective bank deposit rates. Short-term cash investments are made for varying periods of up to three (3) months depending on the Group’s immediate cash requirements, and earn interest at 1.30% to 4.56% per annum in 2012, 1.60% to 4.56% per annum in 2011 and 1.50% to 4.25% per annum in 2010. Interest income of the Group from cash in banks amounted to P=60,342,514, P=39,522,787 and P=17,318,452 in 2012, 2011, and 2010, respectively (see Note 15). The Parent Company has United States (US) dollar-denominated cash in banks as at December 31, 2012 and 2011 (see Note 22).
In compliance with SRC Rule 49.2 covering customer protection and custody of securities, the Parent Company maintains special reserve bank accounts for its customers amounting to P=2,306,326,701 and P=1,663,501,898 as at December 31, 2012 and 2011, respectively. The Parent Company’s reserve requirement is determined based on the SEC’s prescribed computations. As at December 31, 2012 and 2011, the Parent Company’s reserve accounts are adequate to cover its reserve requirements.
5. Cash in a Segregated Account
COLHK receives and holds money deposited by clients in the course of the conduct of the regulated activities of its ordinary business. These clients’ monies are maintained with a licensed bank. The Group has classified the clients’ monies under current assets in the consolidated statement of financial position and recognized a corresponding payable to customers on grounds that it is liable for any loss or misappropriation of clients’ monies. The Group is not allowed to use the clients’ monies to settle its own obligations.
As at December 31, 2012 and 2011, cash in a segregated account for COLHK amounted to P=64,200,375 and P=178,180,571, respectively.
6. Financial Assets at FVPL
Financial assets at FVPL pertain to investments in shares of stock of companies listed in the PSE and major US Stock Exchanges. Net gains recognized from fair value changes of these financial instruments amounted to P=1,766,368, P=16,027,838 and P=7,717,255 in 2012, 2011 and 2010, respectively. Dividend income included under other revenues amounted to P=28,589, P=27,362 and P=378 in 2012, 2011 and 2010, respectively.
Financial assets at FVPL as at December 31, 2012 and 2011 amounted to P=2,729,120 and P=1,313,282, respectively.
58
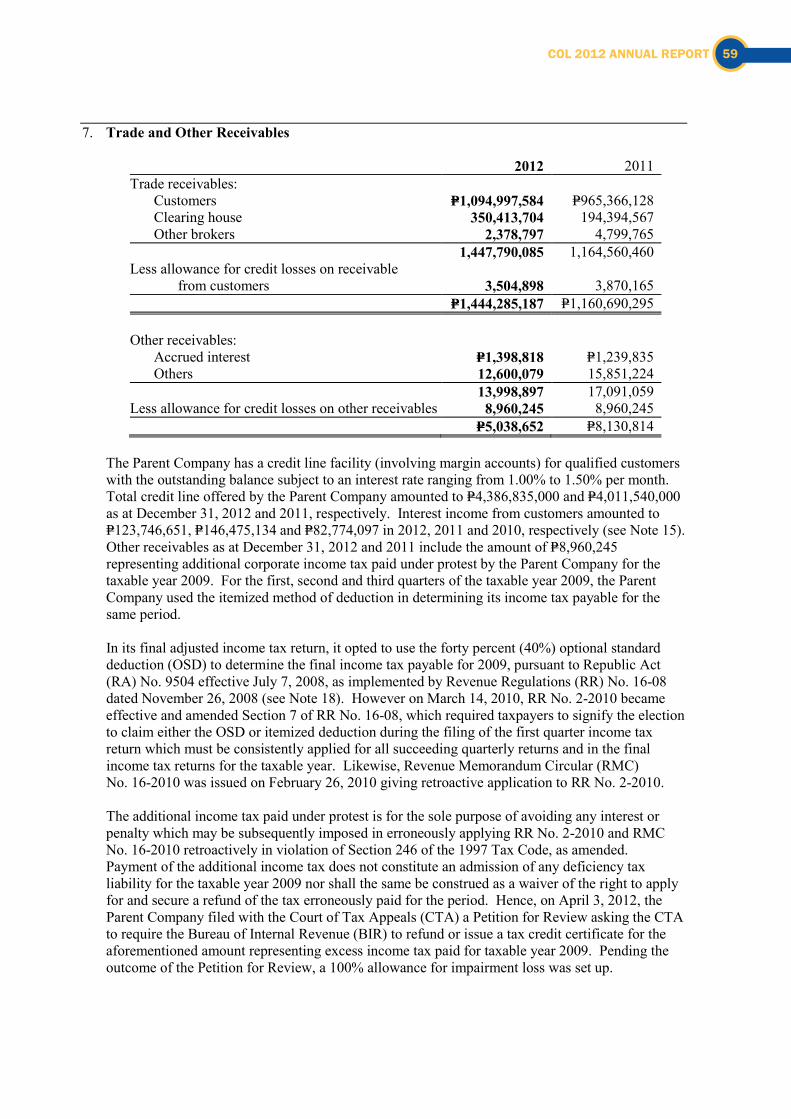
- 25 -
*SGVFS000888*
7. Trade and Other Receivables
2012 2011 Trade receivables: Customers P=1,094,997,584 P=965,366,128 Clearing house 350,413,704 194,394,567 Other brokers 2,378,797 4,799,765 1,447,790,085 1,164,560,460 Less allowance for credit losses on receivable
from customers
3,504,898 3,870,165 P=1,444,285,187 P=1,160,690,295 Other receivables: Accrued interest P=1,398,818 P=1,239,835 Others 12,600,079 15,851,224 13,998,897 17,091,059 Less allowance for credit losses on other receivables 8,960,245 8,960,245 P=5,038,652 P=8,130,814
The Parent Company has a credit line facility (involving margin accounts) for qualified customers with the outstanding balance subject to an interest rate ranging from 1.00% to 1.50% per month. Total credit line offered by the Parent Company amounted to P=4,386,835,000 and P=4,011,540,000 as at December 31, 2012 and 2011, respectively. Interest income from customers amounted to P=123,746,651, P=146,475,134 and P=82,774,097 in 2012, 2011 and 2010, respectively (see Note 15). Other receivables as at December 31, 2012 and 2011 include the amount of P=8,960,245 representing additional corporate income tax paid under protest by the Parent Company for the taxable year 2009. For the first, second and third quarters of the taxable year 2009, the Parent Company used the itemized method of deduction in determining its income tax payable for the same period.
In its final adjusted income tax return, it opted to use the forty percent (40%) optional standard deduction (OSD) to determine the final income tax payable for 2009, pursuant to Republic Act (RA) No. 9504 effective July 7, 2008, as implemented by Revenue Regulations (RR) No. 16-08 dated November 26, 2008 (see Note 18). However on March 14, 2010, RR No. 2-2010 became effective and amended Section 7 of RR No. 16-08, which required taxpayers to signify the election to claim either the OSD or itemized deduction during the filing of the first quarter income tax return which must be consistently applied for all succeeding quarterly returns and in the final income tax returns for the taxable year. Likewise, Revenue Memorandum Circular (RMC) No. 16-2010 was issued on February 26, 2010 giving retroactive application to RR No. 2-2010.
The additional income tax paid under protest is for the sole purpose of avoiding any interest or penalty which may be subsequently imposed in erroneously applying RR No. 2-2010 and RMC No. 16-2010 retroactively in violation of Section 246 of the 1997 Tax Code, as amended. Payment of the additional income tax does not constitute an admission of any deficiency tax liability for the taxable year 2009 nor shall the same be construed as a waiver of the right to apply for and secure a refund of the tax erroneously paid for the period. Hence, on April 3, 2012, the Parent Company filed with the Court of Tax Appeals (CTA) a Petition for Review asking the CTA to require the Bureau of Internal Revenue (BIR) to refund or issue a tax credit certificate for the aforementioned amount representing excess income tax paid for taxable year 2009. Pending the outcome of the Petition for Review, a 100% allowance for impairment loss was set up.
COL 2012 ANNUAL REPORT 59
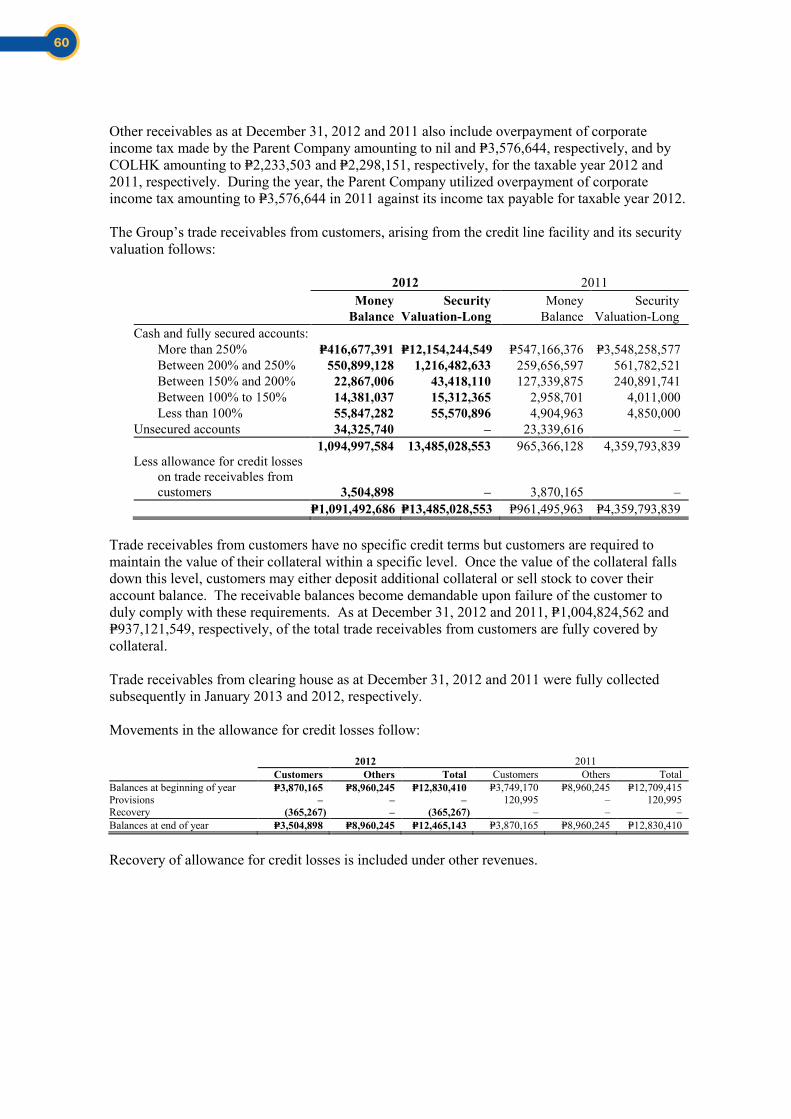
- 26 -
*SGVFS000888*
Other receivables as at December 31, 2012 and 2011 also include overpayment of corporate income tax made by the Parent Company amounting to nil and P=3,576,644, respectively, and by COLHK amounting to P=2,233,503 and P=2,298,151, respectively, for the taxable year 2012 and 2011, respectively. During the year, the Parent Company utilized overpayment of corporate income tax amounting to P=3,576,644 in 2011 against its income tax payable for taxable year 2012. The Group’s trade receivables from customers, arising from the credit line facility and its security valuation follows:
2012 2011
Money
Balance Security
Valuation-Long Money
Balance Security
Valuation-Long Cash and fully secured accounts: More than 250% P=416,677,391 P=12,154,244,549 P=547,166,376 P=3,548,258,577 Between 200% and 250% 550,899,128 1,216,482,633 259,656,597 561,782,521 Between 150% and 200% 22,867,006 43,418,110 127,339,875 240,891,741 Between 100% to 150% 14,381,037 15,312,365 2,958,701 4,011,000 Less than 100% 55,847,282 55,570,896 4,904,963 4,850,000 Unsecured accounts 34,325,740 – 23,339,616 – 1,094,997,584 13,485,028,553 965,366,128 4,359,793,839 Less allowance for credit losses
on trade receivables from customers 3,504,898 – 3,870,165 –
P=1,091,492,686 P=13,485,028,553 P=961,495,963 P=4,359,793,839
Trade receivables from customers have no specific credit terms but customers are required to maintain the value of their collateral within a specific level. Once the value of the collateral falls down this level, customers may either deposit additional collateral or sell stock to cover their account balance. The receivable balances become demandable upon failure of the customer to duly comply with these requirements. As at December 31, 2012 and 2011, P=1,004,824,562 and P=937,121,549, respectively, of the total trade receivables from customers are fully covered by collateral.
Trade receivables from clearing house as at December 31, 2012 and 2011 were fully collected subsequently in January 2013 and 2012, respectively.
Movements in the allowance for credit losses follow:
2012 2011 Customers Others Total Customers Others Total Balances at beginning of year P=3,870,165 P=8,960,245 P=12,830,410 P=3,749,170 P=8,960,245 P=12,709,415 Provisions – – – 120,995 – 120,995 Recovery (365,267) – (365,267) – – – Balances at end of year P=3,504,898 P=8,960,245 P=12,465,143 P=3,870,165 P=8,960,245 P=12,830,410
Recovery of allowance for credit losses is included under other revenues.
60
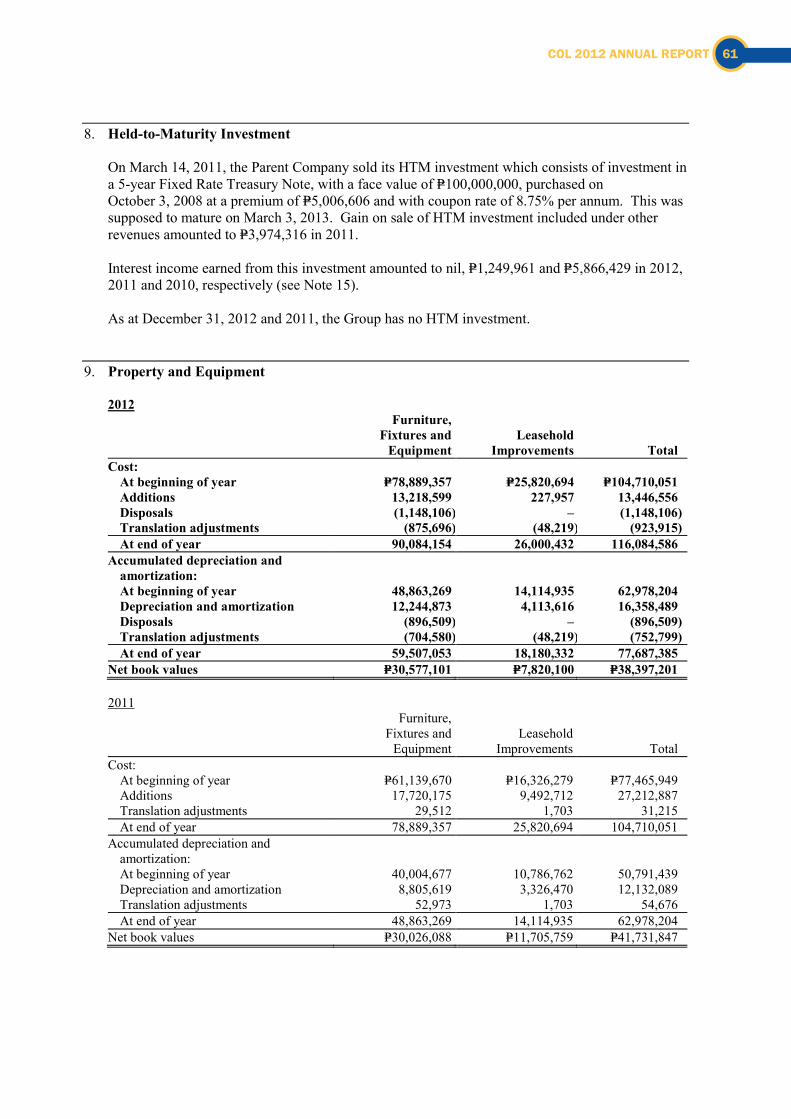
- 27 -
*SGVFS000888*
8. Held-to-Maturity Investment
On March 14, 2011, the Parent Company sold its HTM investment which consists of investment in a 5-year Fixed Rate Treasury Note, with a face value of P=100,000,000, purchased on October 3, 2008 at a premium of P=5,006,606 and with coupon rate of 8.75% per annum. This was supposed to mature on March 3, 2013. Gain on sale of HTM investment included under other revenues amounted to P=3,974,316 in 2011.
Interest income earned from this investment amounted to nil, P=1,249,961 and P=5,866,429 in 2012, 2011 and 2010, respectively (see Note 15).
As at December 31, 2012 and 2011, the Group has no HTM investment.
9. Property and Equipment
2012
Furniture, Fixtures and
Equipment Leasehold
Improvements Total Cost: At beginning of year P=78,889,357 P=25,820,694 P=104,710,051 Additions 13,218,599 227,957 13,446,556 Disposals (1,148,106) – (1,148,106) Translation adjustments (875,696) (48,219) (923,915) At end of year 90,084,154 26,000,432 116,084,586 Accumulated depreciation and
amortization: At beginning of year 48,863,269 14,114,935 62,978,204 Depreciation and amortization 12,244,873 4,113,616 16,358,489 Disposals (896,509) – (896,509) Translation adjustments (704,580) (48,219) (752,799) At end of year 59,507,053 18,180,332 77,687,385 Net book values P=30,577,101 P=7,820,100 P=38,397,201
2011
Furniture, Fixtures and
Equipment Leasehold
Improvements Total Cost: At beginning of year P=61,139,670 P=16,326,279 P=77,465,949 Additions 17,720,175 9,492,712 27,212,887 Translation adjustments 29,512 1,703 31,215 At end of year 78,889,357 25,820,694 104,710,051 Accumulated depreciation and
amortization: At beginning of year 40,004,677 10,786,762 50,791,439 Depreciation and amortization 8,805,619 3,326,470 12,132,089 Translation adjustments 52,973 1,703 54,676 At end of year 48,863,269 14,114,935 62,978,204 Net book values P=30,026,088 P=11,705,759 P=41,731,847
COL 2012 ANNUAL REPORT 61
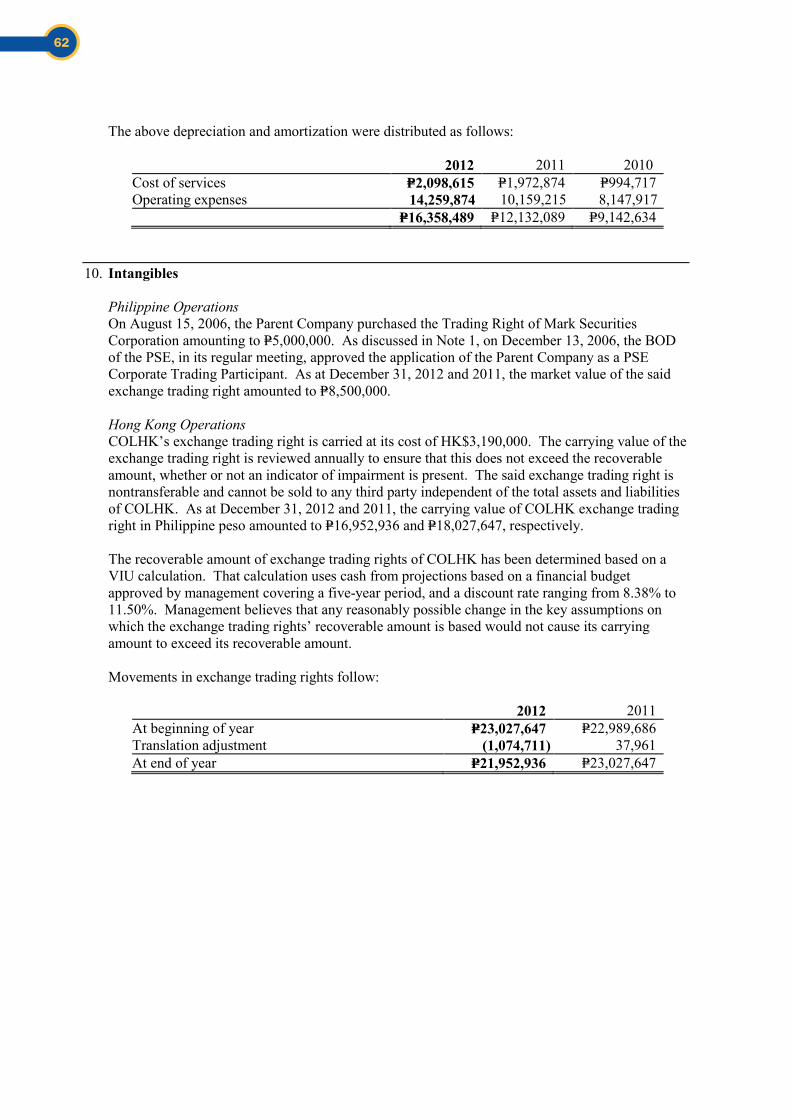
- 28 -
*SGVFS000888*
The above depreciation and amortization were distributed as follows:
2012 2011 2010 Cost of services P=2,098,615 P=1,972,874 P=994,717 Operating expenses 14,259,874 10,159,215 8,147,917 P=16,358,489 P=12,132,089 P=9,142,634
10. Intangibles
Philippine Operations On August 15, 2006, the Parent Company purchased the Trading Right of Mark Securities Corporation amounting to P=5,000,000. As discussed in Note 1, on December 13, 2006, the BOD of the PSE, in its regular meeting, approved the application of the Parent Company as a PSE Corporate Trading Participant. As at December 31, 2012 and 2011, the market value of the said exchange trading right amounted to P=8,500,000.
Hong Kong Operations COLHK’s exchange trading right is carried at its cost of HK$3,190,000. The carrying value of the exchange trading right is reviewed annually to ensure that this does not exceed the recoverable amount, whether or not an indicator of impairment is present. The said exchange trading right is nontransferable and cannot be sold to any third party independent of the total assets and liabilities of COLHK. As at December 31, 2012 and 2011, the carrying value of COLHK exchange trading right in Philippine peso amounted to P=16,952,936 and P=18,027,647, respectively.
The recoverable amount of exchange trading rights of COLHK has been determined based on a VIU calculation. That calculation uses cash from projections based on a financial budget approved by management covering a five-year period, and a discount rate ranging from 8.38% to 11.50%. Management believes that any reasonably possible change in the key assumptions on which the exchange trading rights’ recoverable amount is based would not cause its carrying amount to exceed its recoverable amount.
Movements in exchange trading rights follow:
2012 2011 At beginning of year P=23,027,647 P=22,989,686 Translation adjustment (1,074,711) 37,961 At end of year P=21,952,936 P=23,027,647
62
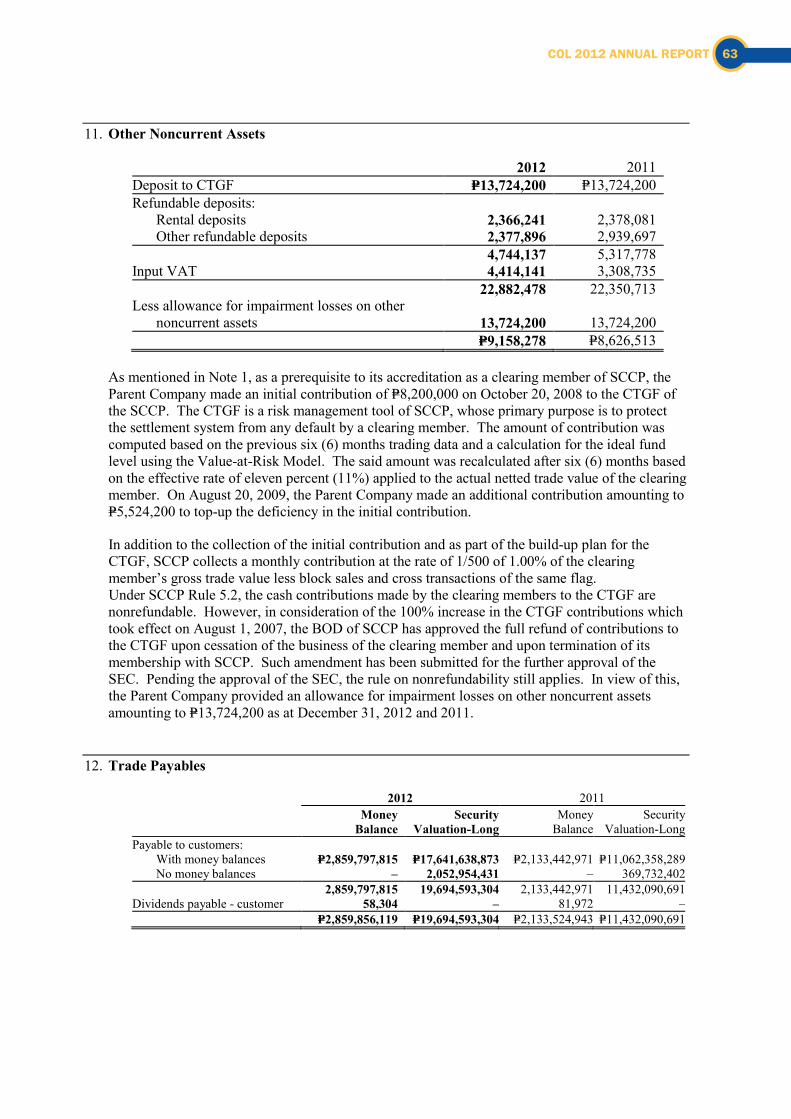
- 29 -
*SGVFS000888*
11. Other Noncurrent Assets
2012 2011 Deposit to CTGF P=13,724,200 P=13,724,200 Refundable deposits: Rental deposits 2,366,241 2,378,081 Other refundable deposits 2,377,896 2,939,697 4,744,137 5,317,778 Input VAT 4,414,141 3,308,735 22,882,478 22,350,713 Less allowance for impairment losses on other
noncurrent assets
13,724,200
13,724,200 P=9,158,278 P=8,626,513
As mentioned in Note 1, as a prerequisite to its accreditation as a clearing member of SCCP, the Parent Company made an initial contribution of P=8,200,000 on October 20, 2008 to the CTGF of the SCCP. The CTGF is a risk management tool of SCCP, whose primary purpose is to protect the settlement system from any default by a clearing member. The amount of contribution was computed based on the previous six (6) months trading data and a calculation for the ideal fund level using the Value-at-Risk Model. The said amount was recalculated after six (6) months based on the effective rate of eleven percent (11%) applied to the actual netted trade value of the clearing member. On August 20, 2009, the Parent Company made an additional contribution amounting to P=5,524,200 to top-up the deficiency in the initial contribution.
In addition to the collection of the initial contribution and as part of the build-up plan for the CTGF, SCCP collects a monthly contribution at the rate of 1/500 of 1.00% of the clearing member’s gross trade value less block sales and cross transactions of the same flag. Under SCCP Rule 5.2, the cash contributions made by the clearing members to the CTGF are nonrefundable. However, in consideration of the 100% increase in the CTGF contributions which took effect on August 1, 2007, the BOD of SCCP has approved the full refund of contributions to the CTGF upon cessation of the business of the clearing member and upon termination of its membership with SCCP. Such amendment has been submitted for the further approval of the SEC. Pending the approval of the SEC, the rule on nonrefundability still applies. In view of this, the Parent Company provided an allowance for impairment losses on other noncurrent assets amounting to P=13,724,200 as at December 31, 2012 and 2011.
12. Trade Payables
2012 2011 Money
Balance Security
Valuation-LongMoney
Balance Security
Valuation-LongPayable to customers: With money balances P=2,859,797,815 P=17,641,638,873 P=2,133,442,971 P=11,062,358,289 No money balances – 2,052,954,431 – 369,732,402 2,859,797,815 19,694,593,304 2,133,442,971 11,432,090,691Dividends payable - customer 58,304 – 81,972 – P=2,859,856,119 P=19,694,593,304 P=2,133,524,943 P=11,432,090,691
COL 2012 ANNUAL REPORT 63
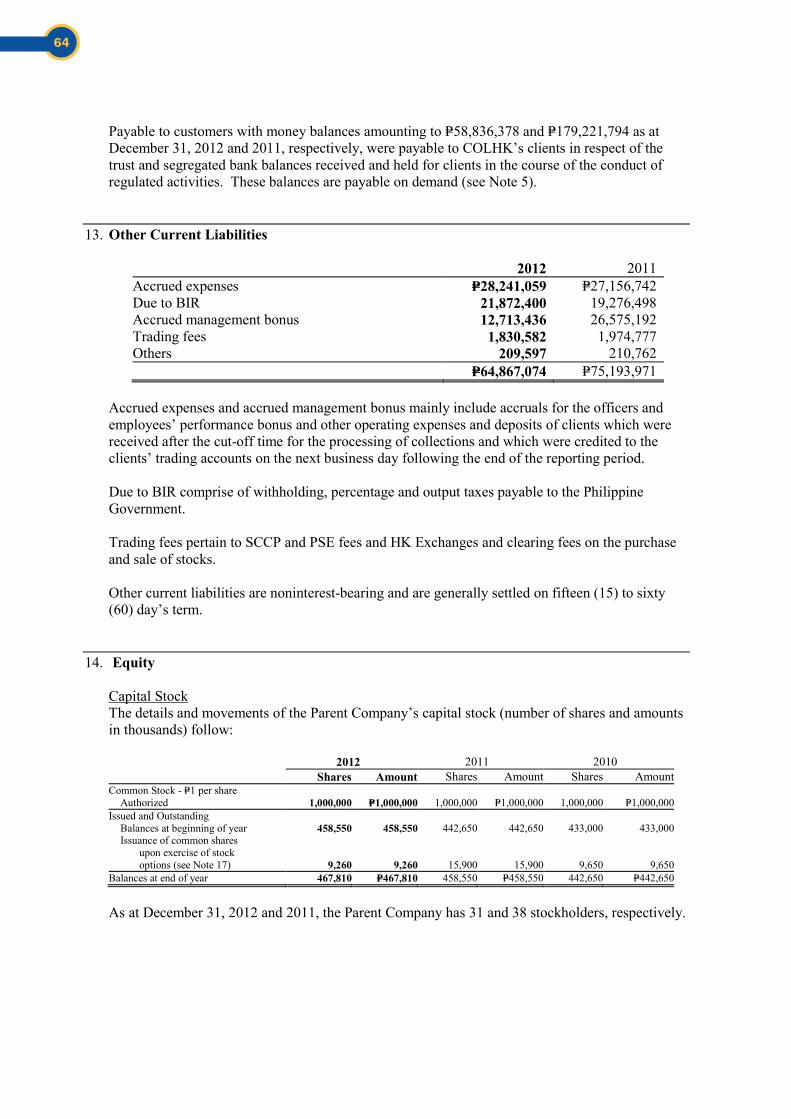
- 30 -
*SGVFS000888*
Payable to customers with money balances amounting to P=58,836,378 and P=179,221,794 as at December 31, 2012 and 2011, respectively, were payable to COLHK’s clients in respect of the trust and segregated bank balances received and held for clients in the course of the conduct of regulated activities. These balances are payable on demand (see Note 5).
13. Other Current Liabilities
2012 2011 Accrued expenses P=28,241,059 P=27,156,742 Due to BIR 21,872,400 19,276,498 Accrued management bonus 12,713,436 26,575,192 Trading fees 1,830,582 1,974,777 Others 209,597 210,762 P=64,867,074 P=75,193,971
Accrued expenses and accrued management bonus mainly include accruals for the officers and employees’ performance bonus and other operating expenses and deposits of clients which were received after the cut-off time for the processing of collections and which were credited to the clients’ trading accounts on the next business day following the end of the reporting period.
Due to BIR comprise of withholding, percentage and output taxes payable to the Philippine Government.
Trading fees pertain to SCCP and PSE fees and HK Exchanges and clearing fees on the purchase and sale of stocks.
Other current liabilities are noninterest-bearing and are generally settled on fifteen (15) to sixty (60) day’s term.
14. Equity
Capital Stock The details and movements of the Parent Company’s capital stock (number of shares and amounts in thousands) follow: 2012 2011 2010 Shares Amount Shares Amount Shares AmountCommon Stock - P=1 per share Authorized 1,000,000 P=1,000,000 1,000,000 P=1,000,000 1,000,000 P=1,000,000Issued and Outstanding Balances at beginning of year 458,550 458,550 442,650 442,650 433,000 433,000 Issuance of common shares upon exercise of stock options (see Note 17) 9,260 9,260 15,900 15,900 9,650 9,650Balances at end of year 467,810 P=467,810 458,550 P=458,550 442,650 P=442,650
As at December 31, 2012 and 2011, the Parent Company has 31 and 38 stockholders, respectively.
64
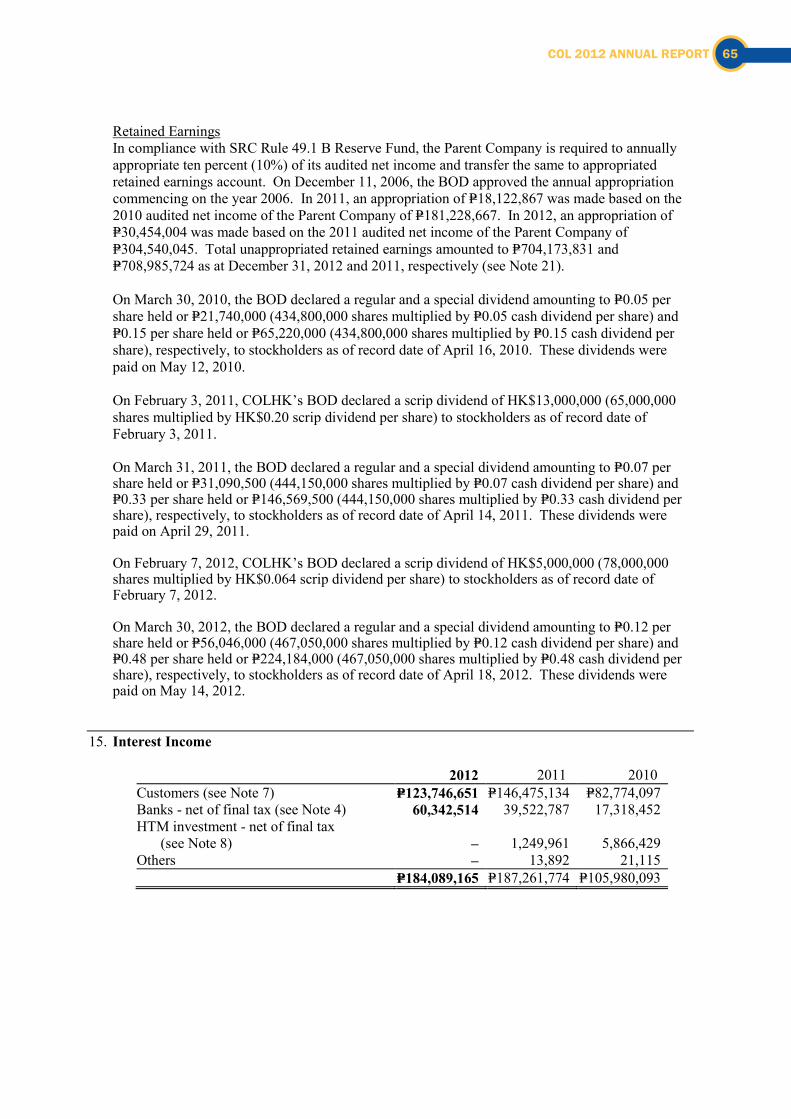
- 31 -
*SGVFS000888*
Retained Earnings In compliance with SRC Rule 49.1 B Reserve Fund, the Parent Company is required to annually appropriate ten percent (10%) of its audited net income and transfer the same to appropriated retained earnings account. On December 11, 2006, the BOD approved the annual appropriation commencing on the year 2006. In 2011, an appropriation of P=18,122,867 was made based on the 2010 audited net income of the Parent Company of P=181,228,667. In 2012, an appropriation of P=30,454,004 was made based on the 2011 audited net income of the Parent Company of P=304,540,045. Total unappropriated retained earnings amounted to P=704,173,831 and P=708,985,724 as at December 31, 2012 and 2011, respectively (see Note 21).
On March 30, 2010, the BOD declared a regular and a special dividend amounting to P=0.05 per share held or P=21,740,000 (434,800,000 shares multiplied by P=0.05 cash dividend per share) and P=0.15 per share held or P=65,220,000 (434,800,000 shares multiplied by P=0.15 cash dividend per share), respectively, to stockholders as of record date of April 16, 2010. These dividends were paid on May 12, 2010.
On February 3, 2011, COLHK’s BOD declared a scrip dividend of HK$13,000,000 (65,000,000 shares multiplied by HK$0.20 scrip dividend per share) to stockholders as of record date of February 3, 2011.
On March 31, 2011, the BOD declared a regular and a special dividend amounting to P=0.07 per share held or P=31,090,500 (444,150,000 shares multiplied by P=0.07 cash dividend per share) and P=0.33 per share held or P=146,569,500 (444,150,000 shares multiplied by P=0.33 cash dividend per share), respectively, to stockholders as of record date of April 14, 2011. These dividends were paid on April 29, 2011.
On February 7, 2012, COLHK’s BOD declared a scrip dividend of HK$5,000,000 (78,000,000 shares multiplied by HK$0.064 scrip dividend per share) to stockholders as of record date of February 7, 2012.
On March 30, 2012, the BOD declared a regular and a special dividend amounting to P=0.12 per share held or P=56,046,000 (467,050,000 shares multiplied by P=0.12 cash dividend per share) and P=0.48 per share held or P=224,184,000 (467,050,000 shares multiplied by P=0.48 cash dividend per share), respectively, to stockholders as of record date of April 18, 2012. These dividends were paid on May 14, 2012.
15. Interest Income
2012 2011 2010 Customers (see Note 7) P=123,746,651 P=146,475,134 P=82,774,097 Banks - net of final tax (see Note 4) 60,342,514 39,522,787 17,318,452 HTM investment - net of final tax (see Note 8) – 1,249,961 5,866,429 Others – 13,892 21,115 P=184,089,165 P=187,261,774 P=105,980,093
COL 2012 ANNUAL REPORT 65
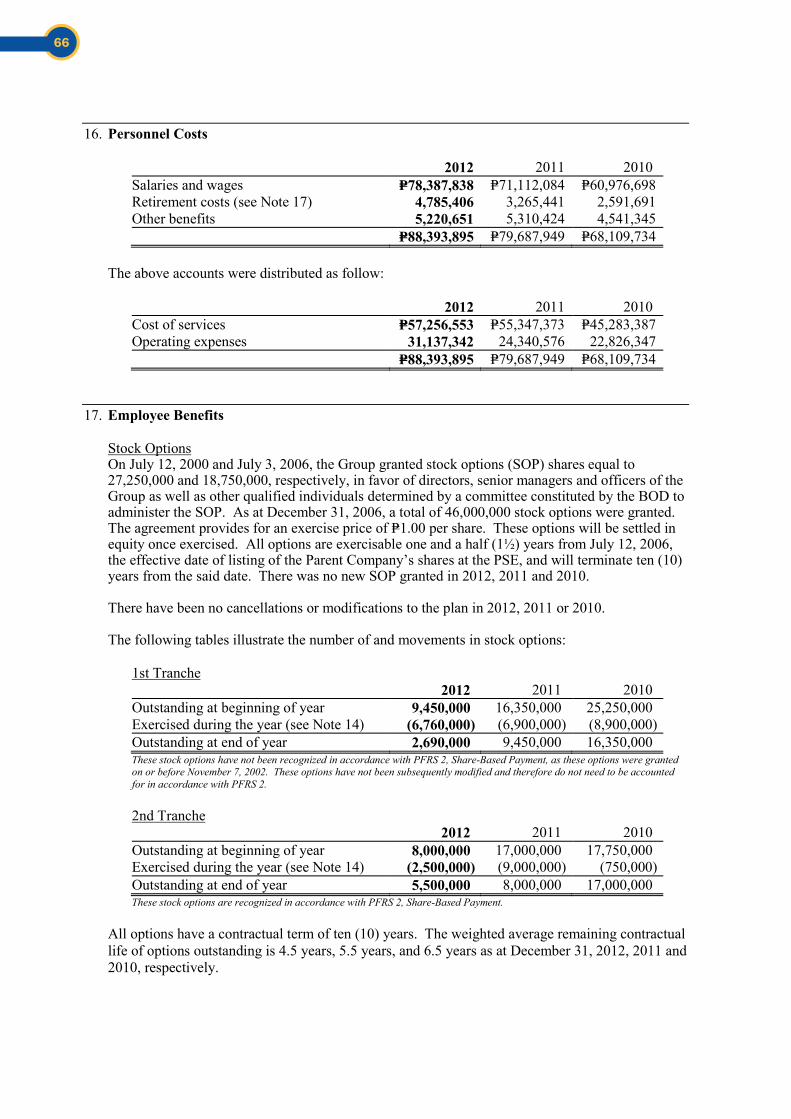
- 32 -
*SGVFS000888*
16. Personnel Costs
2012 2011 2010 Salaries and wages P=78,387,838 P=71,112,084 P=60,976,698 Retirement costs (see Note 17) 4,785,406 3,265,441 2,591,691 Other benefits 5,220,651 5,310,424 4,541,345 P=88,393,895 P=79,687,949 P=68,109,734
The above accounts were distributed as follow:
2012 2011 2010 Cost of services P=57,256,553 P=55,347,373 P=45,283,387 Operating expenses 31,137,342 24,340,576 22,826,347 P=88,393,895 P=79,687,949 P=68,109,734
17. Employee Benefits
Stock Options On July 12, 2000 and July 3, 2006, the Group granted stock options (SOP) shares equal to 27,250,000 and 18,750,000, respectively, in favor of directors, senior managers and officers of the Group as well as other qualified individuals determined by a committee constituted by the BOD to administer the SOP. As at December 31, 2006, a total of 46,000,000 stock options were granted. The agreement provides for an exercise price of P=1.00 per share. These options will be settled in equity once exercised. All options are exercisable one and a half (1½) years from July 12, 2006, the effective date of listing of the Parent Company’s shares at the PSE, and will terminate ten (10) years from the said date. There was no new SOP granted in 2012, 2011 and 2010.
There have been no cancellations or modifications to the plan in 2012, 2011 or 2010.
The following tables illustrate the number of and movements in stock options:
1st Tranche 2012 2011 2010 Outstanding at beginning of year 9,450,000 16,350,000 25,250,000 Exercised during the year (see Note 14) (6,760,000) (6,900,000) (8,900,000) Outstanding at end of year 2,690,000 9,450,000 16,350,000 These stock options have not been recognized in accordance with PFRS 2, Share-Based Payment, as these options were granted on or before November 7, 2002. These options have not been subsequently modified and therefore do not need to be accounted for in accordance with PFRS 2. 2nd Tranche 2012 2011 2010 Outstanding at beginning of year 8,000,000 17,000,000 17,750,000 Exercised during the year (see Note 14) (2,500,000) (9,000,000) (750,000) Outstanding at end of year 5,500,000 8,000,000 17,000,000 These stock options are recognized in accordance with PFRS 2, Share-Based Payment.
All options have a contractual term of ten (10) years. The weighted average remaining contractual life of options outstanding is 4.5 years, 5.5 years, and 6.5 years as at December 31, 2012, 2011 and 2010, respectively.
66
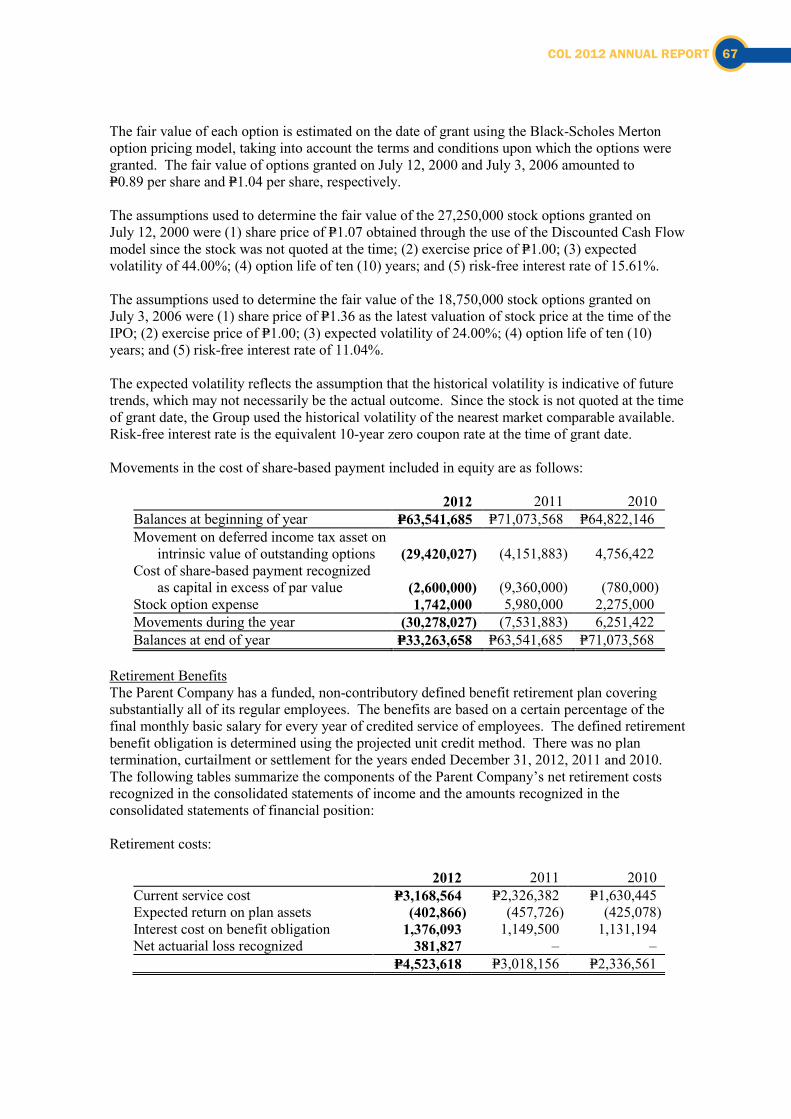
- 33 -
*SGVFS000888*
The fair value of each option is estimated on the date of grant using the Black-Scholes Merton option pricing model, taking into account the terms and conditions upon which the options were granted. The fair value of options granted on July 12, 2000 and July 3, 2006 amounted to P=0.89 per share and P=1.04 per share, respectively.
The assumptions used to determine the fair value of the 27,250,000 stock options granted on July 12, 2000 were (1) share price of P=1.07 obtained through the use of the Discounted Cash Flow model since the stock was not quoted at the time; (2) exercise price of P=1.00; (3) expected volatility of 44.00%; (4) option life of ten (10) years; and (5) risk-free interest rate of 15.61%.
The assumptions used to determine the fair value of the 18,750,000 stock options granted on July 3, 2006 were (1) share price of P=1.36 as the latest valuation of stock price at the time of the IPO; (2) exercise price of P=1.00; (3) expected volatility of 24.00%; (4) option life of ten (10) years; and (5) risk-free interest rate of 11.04%.
The expected volatility reflects the assumption that the historical volatility is indicative of future trends, which may not necessarily be the actual outcome. Since the stock is not quoted at the time of grant date, the Group used the historical volatility of the nearest market comparable available. Risk-free interest rate is the equivalent 10-year zero coupon rate at the time of grant date.
Movements in the cost of share-based payment included in equity are as follows:
2012 2011 2010 Balances at beginning of year P=63,541,685 P=71,073,568 P=64,822,146 Movement on deferred income tax asset on intrinsic value of outstanding options (29,420,027) (4,151,883) 4,756,422 Cost of share-based payment recognized as capital in excess of par value (2,600,000) (9,360,000) (780,000) Stock option expense 1,742,000 5,980,000 2,275,000 Movements during the year (30,278,027) (7,531,883) 6,251,422 Balances at end of year P=33,263,658 P=63,541,685 P=71,073,568
Retirement Benefits The Parent Company has a funded, non-contributory defined benefit retirement plan covering substantially all of its regular employees. The benefits are based on a certain percentage of the final monthly basic salary for every year of credited service of employees. The defined retirement benefit obligation is determined using the projected unit credit method. There was no plan termination, curtailment or settlement for the years ended December 31, 2012, 2011 and 2010. The following tables summarize the components of the Parent Company’s net retirement costs recognized in the consolidated statements of income and the amounts recognized in the consolidated statements of financial position:
Retirement costs:
2012 2011 2010 Current service cost P=3,168,564 P=2,326,382 P=1,630,445 Expected return on plan assets (402,866) (457,726) (425,078) Interest cost on benefit obligation 1,376,093 1,149,500 1,131,194 Net actuarial loss recognized 381,827 – – P=4,523,618 P=3,018,156 P=2,336,561
COL 2012 ANNUAL REPORT 67
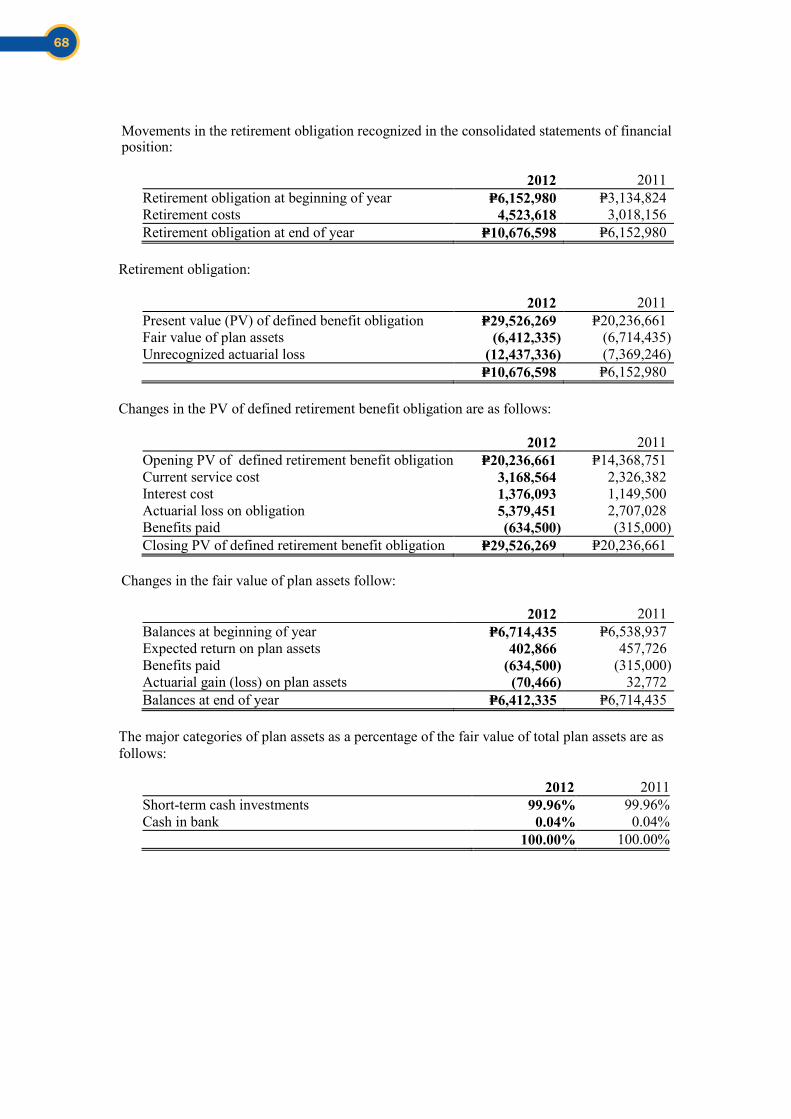
- 34 -
*SGVFS000888*
Movements in the retirement obligation recognized in the consolidated statements of financial position:
2012 2011 Retirement obligation at beginning of year P=6,152,980 P=3,134,824 Retirement costs 4,523,618 3,018,156 Retirement obligation at end of year P=10,676,598 P=6,152,980
Retirement obligation:
2012 2011 Present value (PV) of defined benefit obligation P=29,526,269 P=20,236,661 Fair value of plan assets (6,412,335) (6,714,435) Unrecognized actuarial loss (12,437,336) (7,369,246) P=10,676,598 P=6,152,980
Changes in the PV of defined retirement benefit obligation are as follows:
2012 2011 Opening PV of defined retirement benefit obligation P=20,236,661 P=14,368,751 Current service cost 3,168,564 2,326,382 Interest cost 1,376,093 1,149,500 Actuarial loss on obligation 5,379,451 2,707,028 Benefits paid (634,500) (315,000) Closing PV of defined retirement benefit obligation P=29,526,269 P=20,236,661
Changes in the fair value of plan assets follow:
2012 2011 Balances at beginning of year P=6,714,435 P=6,538,937 Expected return on plan assets 402,866 457,726 Benefits paid (634,500) (315,000) Actuarial gain (loss) on plan assets (70,466) 32,772 Balances at end of year P=6,412,335 P=6,714,435
The major categories of plan assets as a percentage of the fair value of total plan assets are as follows:
2012 2011Short-term cash investments 99.96% 99.96%Cash in bank 0.04% 0.04% 100.00% 100.00%
68
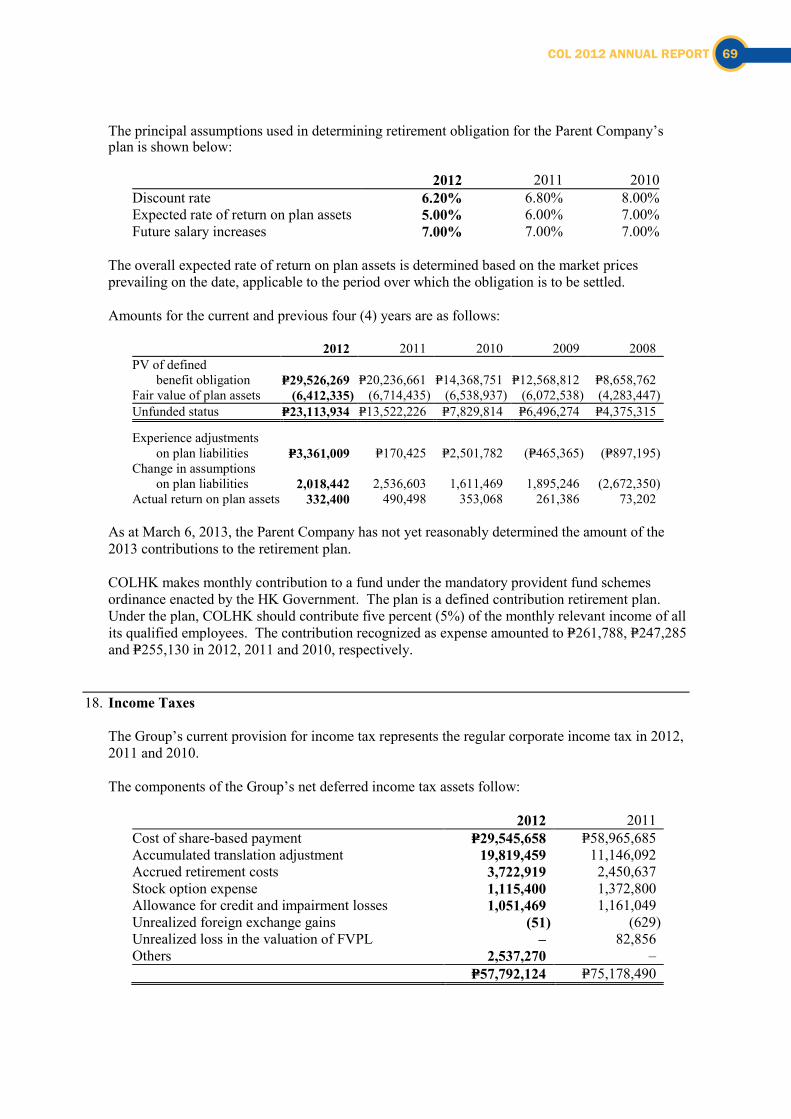
- 35 -
*SGVFS000888*
The principal assumptions used in determining retirement obligation for the Parent Company’s plan is shown below:
2012 2011 2010Discount rate 6.20% 6.80% 8.00%Expected rate of return on plan assets 5.00% 6.00% 7.00%Future salary increases 7.00% 7.00% 7.00%
The overall expected rate of return on plan assets is determined based on the market prices prevailing on the date, applicable to the period over which the obligation is to be settled.
Amounts for the current and previous four (4) years are as follows:
2012 2011 2010 2009 2008 PV of defined
benefit obligation P=29,526,269 P=20,236,661 P=14,368,751 P=12,568,812 P=8,658,762 Fair value of plan assets (6,412,335) (6,714,435) (6,538,937) (6,072,538) (4,283,447) Unfunded status P=23,113,934 P=13,522,226 P=7,829,814 P=6,496,274 P=4,375,315
Experience adjustments on plan liabilities P=3,361,009 P=170,425 P=2,501,782 (P=465,365) (P=897,195)
Change in assumptions on plan liabilities 2,018,442 2,536,603 1,611,469 1,895,246 (2,672,350)
Actual return on plan assets 332,400 490,498 353,068 261,386 73,202
As at March 6, 2013, the Parent Company has not yet reasonably determined the amount of the 2013 contributions to the retirement plan.
COLHK makes monthly contribution to a fund under the mandatory provident fund schemes ordinance enacted by the HK Government. The plan is a defined contribution retirement plan. Under the plan, COLHK should contribute five percent (5%) of the monthly relevant income of all its qualified employees. The contribution recognized as expense amounted to P=261,788, P=247,285 and P=255,130 in 2012, 2011 and 2010, respectively.
18. Income Taxes
The Group’s current provision for income tax represents the regular corporate income tax in 2012, 2011 and 2010.
The components of the Group’s net deferred income tax assets follow:
2012 2011 Cost of share-based payment P=29,545,658 P=58,965,685 Accumulated translation adjustment 19,819,459 11,146,092 Accrued retirement costs 3,722,919 2,450,637 Stock option expense 1,115,400 1,372,800 Allowance for credit and impairment losses 1,051,469 1,161,049 Unrealized foreign exchange gains (51) (629) Unrealized loss in the valuation of FVPL – 82,856 Others 2,537,270 – P=57,792,124 P=75,178,490
COL 2012 ANNUAL REPORT 69
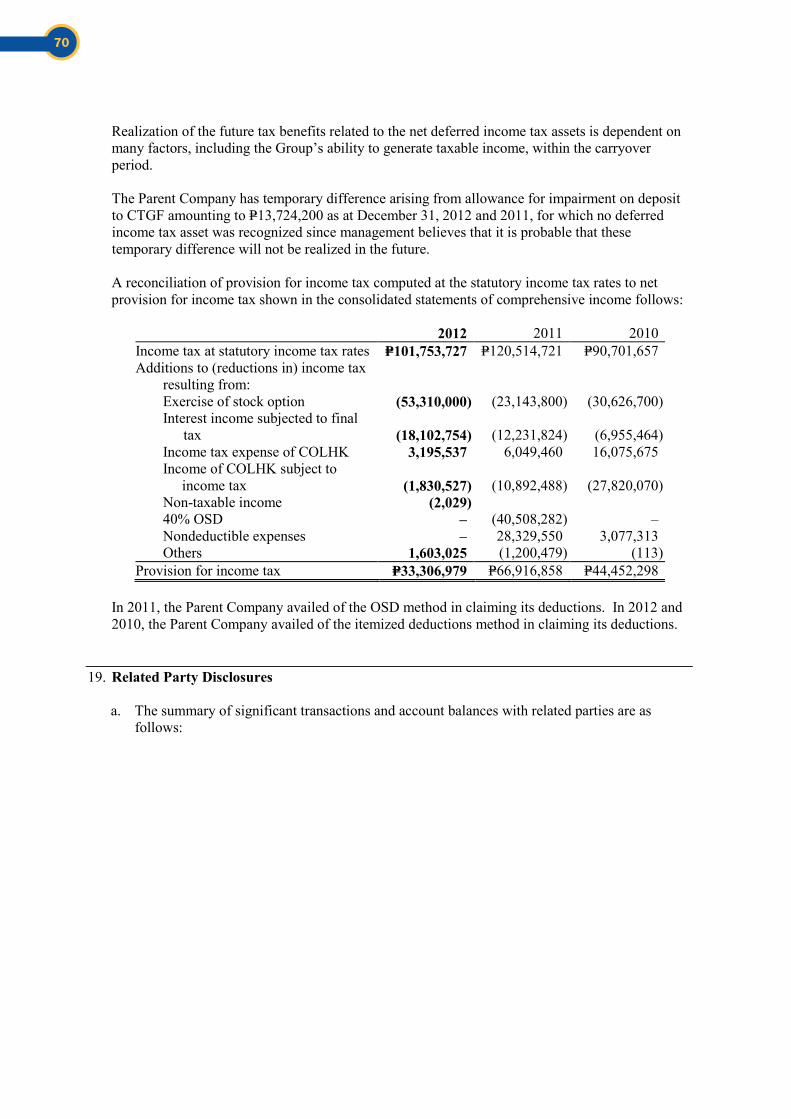
- 36 -
*SGVFS000888*
Realization of the future tax benefits related to the net deferred income tax assets is dependent on many factors, including the Group’s ability to generate taxable income, within the carryover period.
The Parent Company has temporary difference arising from allowance for impairment on deposit to CTGF amounting to P=13,724,200 as at December 31, 2012 and 2011, for which no deferred income tax asset was recognized since management believes that it is probable that these temporary difference will not be realized in the future.
A reconciliation of provision for income tax computed at the statutory income tax rates to net provision for income tax shown in the consolidated statements of comprehensive income follows:
2012 2011 2010 Income tax at statutory income tax rates P=101,753,727 P=120,514,721 P=90,701,657 Additions to (reductions in) income tax resulting from: Exercise of stock option (53,310,000) (23,143,800) (30,626,700) Interest income subjected to final tax (18,102,754) (12,231,824) (6,955,464) Income tax expense of COLHK 3,195,537 6,049,460 16,075,675 Income of COLHK subject to
income tax (1,830,527) (10,892,488) (27,820,070) Non-taxable income (2,029) 40% OSD – (40,508,282) – Nondeductible expenses – 28,329,550 3,077,313 Others 1,603,025 (1,200,479) (113) Provision for income tax P=33,306,979 P=66,916,858 P=44,452,298
In 2011, the Parent Company availed of the OSD method in claiming its deductions. In 2012 and 2010, the Parent Company availed of the itemized deductions method in claiming its deductions.
19. Related Party Disclosures
a. The summary of significant transactions and account balances with related parties are as follows:
70
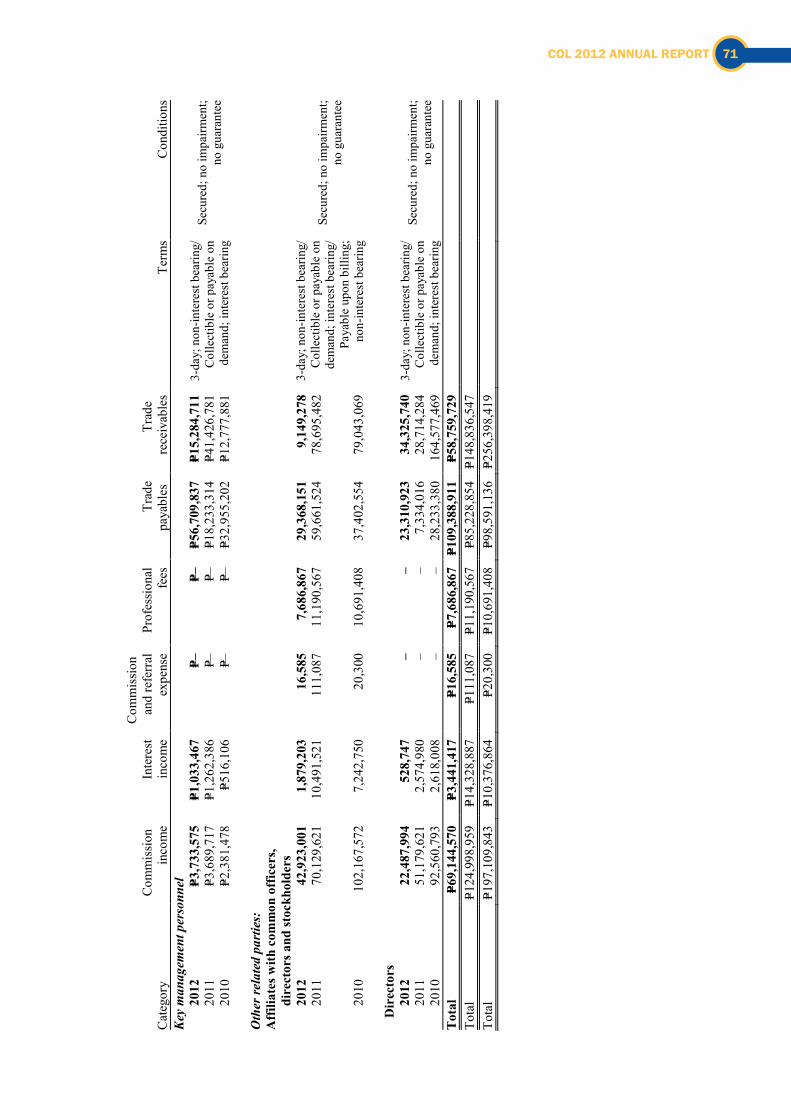
- 37
-
*SGVFS000888*
Cat
egor
y C
omm
issi
on
inco
me
Inte
rest
in
com
e
Com
mis
sion
an
d re
ferr
al
expe
nse
Prof
essi
onal
fe
es
Trad
e pa
yabl
es
Trad
e
rece
ivab
les
Term
sC
ondi
tions
Key
man
agem
ent p
erso
nnel
20
12
P=3,7
33,5
75
P=1,0
33,4
67
P=–
P=–
P=56,
709,
837
P=15,
284,
711
3-da
y; n
on-in
tere
st b
earin
g/C
olle
ctib
le o
r pay
able
on
dem
and;
inte
rest
bea
ring
Secu
red;
no
impa
irmen
t; no
gua
rant
ee
20
11
P=3,6
89,7
17
P=1,2
62,3
86
P=–
P=–
P=18,
233,
314
P=41,
426,
781
2010
P=2
,381
,478
P=5
16,1
06
P=–
P=–
P=32,
955,
202
P=12,
777,
881
O
ther
rela
ted
parti
es:
Aff
iliat
es w
ith c
omm
on o
ffic
ers,
di
rect
ors a
nd st
ockh
olde
rs
20
12
42,9
23,0
01
1,87
9,20
3 16
,585
7,
686,
867
29,3
68,1
51
9,14
9,27
8 3-
day;
non
- inte
rest
bea
ring/
Col
lect
ible
or p
ayab
le o
n de
man
d; in
tere
st b
earin
g/Pa
yabl
e up
on b
illin
g;no
n-in
tere
st b
earin
g
Secu
red;
no
impa
irmen
t; no
gua
rant
ee
20
11
70,1
29,6
21
10,4
91,5
21
111,
087
11,1
90,5
67
59,6
61,5
24
78,6
95,4
82
2010
10
2,16
7,57
2 7,
242,
750
20,3
00
10,6
91,4
08
37,4
02,5
54
79,0
43,0
69
Dir
ecto
rs
2012
22
,487
,994
52
8,74
7 –
– 23
,310
,923
34
,325
,740
3-
day;
non
- inte
rest
bea
ring/
Col
lect
ible
or p
ayab
le o
n de
man
d; in
tere
st b
earin
g
Secu
red;
no
impa
irmen
t; no
gua
rant
ee
20
11
51,1
79,6
21
2,57
4,98
0 –
– 7,
334,
016
28,7
14,2
84
2010
92
,560
,793
2,
618,
008
– –
28,2
33,3
80
164,
577,
469
Tota
l P=6
9,14
4,57
0 P=3
,441
,417
P=1
6,58
5 P=7
,686
,867
P=1
09,3
88,9
11
P=58,
759,
729
Tota
l P=1
24,9
98,9
59
P=14,
328,
887
P=111
,087
P=1
1,19
0,56
7 P=8
5,22
8,85
4 P=1
48,8
36,5
47
Tota
l P=1
97,1
09,8
43
P=10,
376,
864
P=20,
300
P=10,
691,
408
P=98,
591,
136
P=256
,398
,419
COL 2012 ANNUAL REPORT 71
- 38 -
*SGVFS000888*
b. Compensation of key management personnel of the Group follows:
2012 2011 2010 Short-term employee benefits P=50,528,506 P=17,597,285 P=41,919,082 Retirement costs 2,420,795 100,149 1,429,925 Cost of share-based payment 1,742,000 5,980,000 2,275,000 P=54,691,301 P=23,677,434 P=45,624,007
c. The Parent Company’s retirement fund is being held in trust by a trustee bank.
As at December 31, 2012, the carrying amount and the fair value of the retirement fund amounted to P=6,489,846 and P=6,412,335, respectively. The retirement fund consists of cash and short-term cash investments which accounted 0.04% and 99.96%, respectively (see Note 17).
In 2012, there were no transactions between the retirement fund and the Parent Company.
20. Leases
The Group leases its office premises under separate operating lease agreements expiring on various dates and whose lease terms are negotiated every 1-3 years. Rental costs charged to operations amounted to P=10,024,186, P=8,447,671 and P=5,347,721 in 2012, 2011 and 2010, respectively.
The future minimum lease payments are as follows:
2012 2011 Within one (1) year P=7,327,525 P=12,271,336 After one (1) year but not more than five (5) years 2,404,002 5,668,997 P=9,731,527 P=17,940,333
21. Capital Management
The primary objective of the Group’s capital management is to ensure that the Group maintains healthy capital ratios in order to support its business, pay existing obligations and maximize shareholder value. The Group manages its capital structure and makes adjustments to it, in light of changes in economic conditions. No changes were made in the objectives, policies or processes during the years ended December 31, 2012, 2011 and 2010.
The Amended Implementing Rules and Regulations of the SRC effective March 6, 2004 include, among others, revisions in the terms and conditions for registration and subsequent renewal of license applicable to both exchange trading participants and non-exchange broker dealers as follows: (a) to allow a net capital of P=2.5 million or 2.50% of aggregate indebtedness, whichever is higher, for broker dealers dealing only in proprietary shares and not holding securities, (b) to allow the SEC to set a different net capital requirement for those authorized to use the Risk-Based Capital Adequacy (RBCA) model, and (c) to require unimpaired paid-up capital of P=100.0 million for broker dealers, which are either first time registrants or those acquiring existing broker dealer firms and will participate in a registered clearing agency; P=10.0 million plus a surety bond for
72
- 39 -
*SGVFS000888*
existing broker dealers not engaged in market making transactions; and P=2.5 million for broker dealers dealing only in proprietary shares and not holding securities.
The SEC approved Memorandum Circular No. 16 dated November 11, 2004 which provides the guidelines on the adoption in the Philippines of the RBCA Framework for all registered brokers dealers in accordance with SRC. These guidelines cover the following risks: (a) position or market risk, (b) credit risks such as counterparty, settlement, large exposure, and margin financing risks, and (c) operational risk.
The Parent Company being a registered broker in securities is subject to the stringent rules of the SEC and other regulatory agencies with respect to the maintenance of specific levels of RBCA ratios. RBCA is a ratio that compares the broker or dealer’s total measured risk to its liquid capital. As a rule, the Parent Company must maintain an RBCA ratio of at least 110% and a net liquid capital (NLC) of at least P=5.0 million or five percent (5%) of its aggregate indebtedness, whichever is higher. Also, the Aggregated Indebtedness (AI) of every stockbroker should not exceed two thousand percent (2,000%) of its NLC. In the event that the minimum RBCA ratio of 110% or the minimum NLC is breached, the Parent Company shall immediately cease doing business as a broker and shall notify the PSE and SEC. As at December 31, 2012 and 2011, the Parent Company is compliant with the foregoing requirements.
The Parent Company’s capital pertains to equity per books adjusted for deferred income tax assets and assets not readily convertible into cash.
The RBCA ratio of the Parent Company as at December 31, 2012 and 2011 are as follows:
2012 2011 Equity eligible for NLC P=923,551,435 P=872,980,645 Less ineligible assets 190,163,399 192,910,902 NLC P=733,388,036 P=680,069,743 Position risk P=40,367 P=480,243 Operational risk 81,214,878 52,746,292 Total Risk Capital Requirement P=81,255,245 P=53,226,535 AI P=2,870,517,855 P=2,030,945,889 5% of AI P=143,525,893 P=101,547,294 Required NLC 143,525,893 101,547,294 Net Risk-Based Capital Excess P=589,862,144 P=578,522,449 Ratio of AI to NLC 391% 299% RBCA ratio 903% 1,278%
The following are the definition of terms used in the above computation:
1. Ineligible assets
These pertain to fixed assets and assets which cannot be readily converted into cash.
2. Operational risk requirement The amount required to cover a level of operational risk which is the exposure associated with commencing and remaining in business arising separately from exposures covered by other
COL 2012 ANNUAL REPORT 73
- 40 -
*SGVFS000888*
risk requirements. It is the risk of loss resulting from inadequate or failed internal processes, people and systems which include, among others, risks of fraud, operational or settlement failure and shortage of liquid resources, or from external events.
3. Position risk requirement
The amount necessary to accommodate a given level of position risk which is the risk a broker dealer is exposed to and arising from securities held by it as a principal or in its proprietary or dealer account.
4. AI
Total money liabilities of a broker dealer arising in connection with any transaction whatsoever, and includes, among other things, money borrowed, money payable against securities loaned and securities failed to receive, the market value of securities borrowed to the extent to which no equivalent value is paid or credited (other than the market value of margin securities borrowed from customers and margin securities borrowed from non-customers), customers’ and non-customers’ free credit balances, and credit balances in customers’ and non-customers’ account having short positions in securities subject to the exclusions provided in the said SEC Memorandum.
On May 28, 2009, the SEC approved the PSE’s Rules Governing Trading Rights and Trading Participants, which supersede the Membership Rules of the PSE. Section 8(c) of Article III of the said rules requires trading participants to have a minimum unimpaired paid-up capital, as defined by the SEC, of P=20 million effective December 31, 2009, and P=30 million effective December 31, 2011 and onwards. In 2012 and, 2011, the Parent Company is compliant with the new capital requirement.
In addition, SRC Rule 49.1 (B), Reserve Fund of such circular, requires that every broker dealer shall annually appropriate a certain minimum percentage of its audited profit after tax and transfer the same to Appropriated Retained Earnings. Minimum appropriation shall be 30%, 20% and 10% of profit after tax for brokers/dealers with unimpaired paid up capital of P=10 million to P=30 million, between P=30 million to P=50 million and more than P=50 million, respectively (see Note 14).
The Parent Company’s regulated operations have complied with all externally-imposed capital requirements as at December 31, 2012 and 2011.
COLHK monitors capital using liquid capital as provided for under Hong Kong’s Securities and Futures Ordinance (Cap. 571) and Securities and Futures (Financial Resources) Rules (Cap. 571N). COLHK’s policy is to keep liquid capital at the higher of the floor requirement of HK$3,000,000 and computed variable required capital. As at December 31, 2012 and 2011, COLHK is compliant with the said requirement.
22. Financial Risk Management Objectives and Policies
The main purpose of the Group’s financial instruments is to fund its operations. The Group’s principal financial instruments consist of cash and cash equivalents, cash in a segregated account, financial assets at FVPL, trade receivables, other receivables, trade payables and other current liabilities, which arise from operations.
74
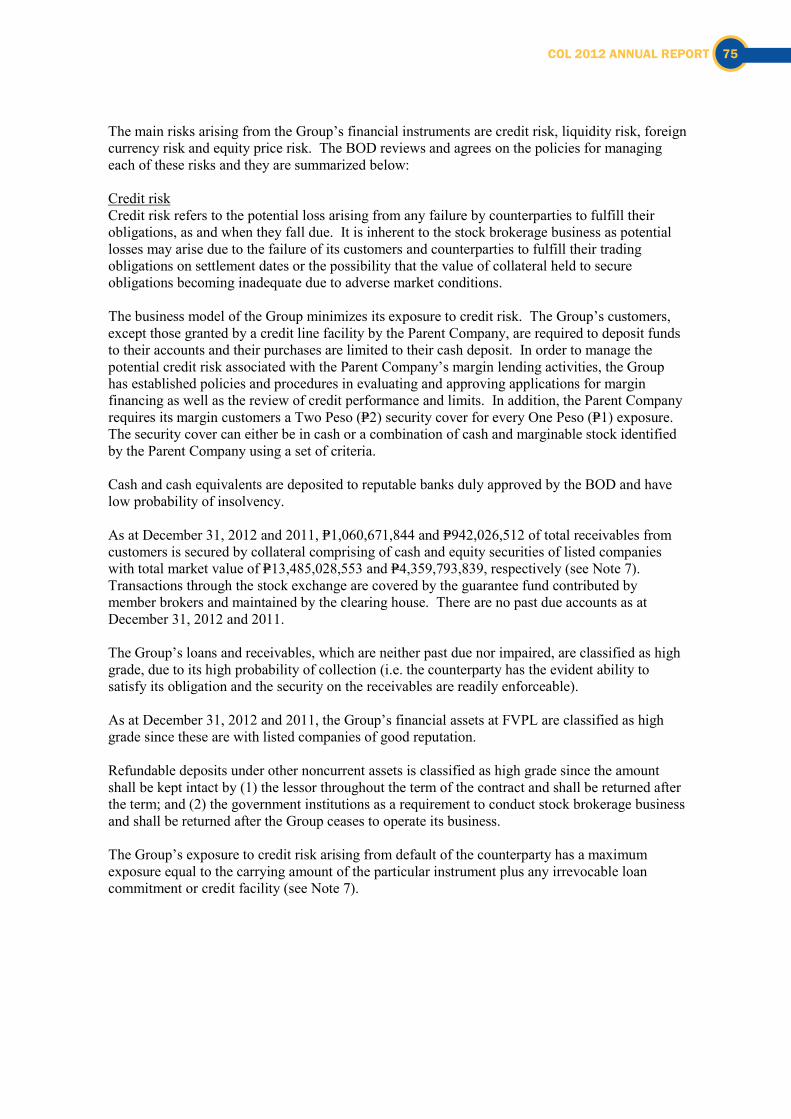
- 41 -
*SGVFS000888*
The main risks arising from the Group’s financial instruments are credit risk, liquidity risk, foreign currency risk and equity price risk. The BOD reviews and agrees on the policies for managing each of these risks and they are summarized below:
Credit risk Credit risk refers to the potential loss arising from any failure by counterparties to fulfill their obligations, as and when they fall due. It is inherent to the stock brokerage business as potential losses may arise due to the failure of its customers and counterparties to fulfill their trading obligations on settlement dates or the possibility that the value of collateral held to secure obligations becoming inadequate due to adverse market conditions.
The business model of the Group minimizes its exposure to credit risk. The Group’s customers, except those granted by a credit line facility by the Parent Company, are required to deposit funds to their accounts and their purchases are limited to their cash deposit. In order to manage the potential credit risk associated with the Parent Company’s margin lending activities, the Group has established policies and procedures in evaluating and approving applications for margin financing as well as the review of credit performance and limits. In addition, the Parent Company requires its margin customers a Two Peso (P=2) security cover for every One Peso (P=1) exposure. The security cover can either be in cash or a combination of cash and marginable stock identified by the Parent Company using a set of criteria.
Cash and cash equivalents are deposited to reputable banks duly approved by the BOD and have low probability of insolvency.
As at December 31, 2012 and 2011, P=1,060,671,844 and P=942,026,512 of total receivables from customers is secured by collateral comprising of cash and equity securities of listed companies with total market value of P=13,485,028,553 and P=4,359,793,839, respectively (see Note 7). Transactions through the stock exchange are covered by the guarantee fund contributed by member brokers and maintained by the clearing house. There are no past due accounts as at December 31, 2012 and 2011.
The Group’s loans and receivables, which are neither past due nor impaired, are classified as high grade, due to its high probability of collection (i.e. the counterparty has the evident ability to satisfy its obligation and the security on the receivables are readily enforceable).
As at December 31, 2012 and 2011, the Group’s financial assets at FVPL are classified as high grade since these are with listed companies of good reputation.
Refundable deposits under other noncurrent assets is classified as high grade since the amount shall be kept intact by (1) the lessor throughout the term of the contract and shall be returned after the term; and (2) the government institutions as a requirement to conduct stock brokerage business and shall be returned after the Group ceases to operate its business.
The Group’s exposure to credit risk arising from default of the counterparty has a maximum exposure equal to the carrying amount of the particular instrument plus any irrevocable loan commitment or credit facility (see Note 7).
COL 2012 ANNUAL REPORT 75
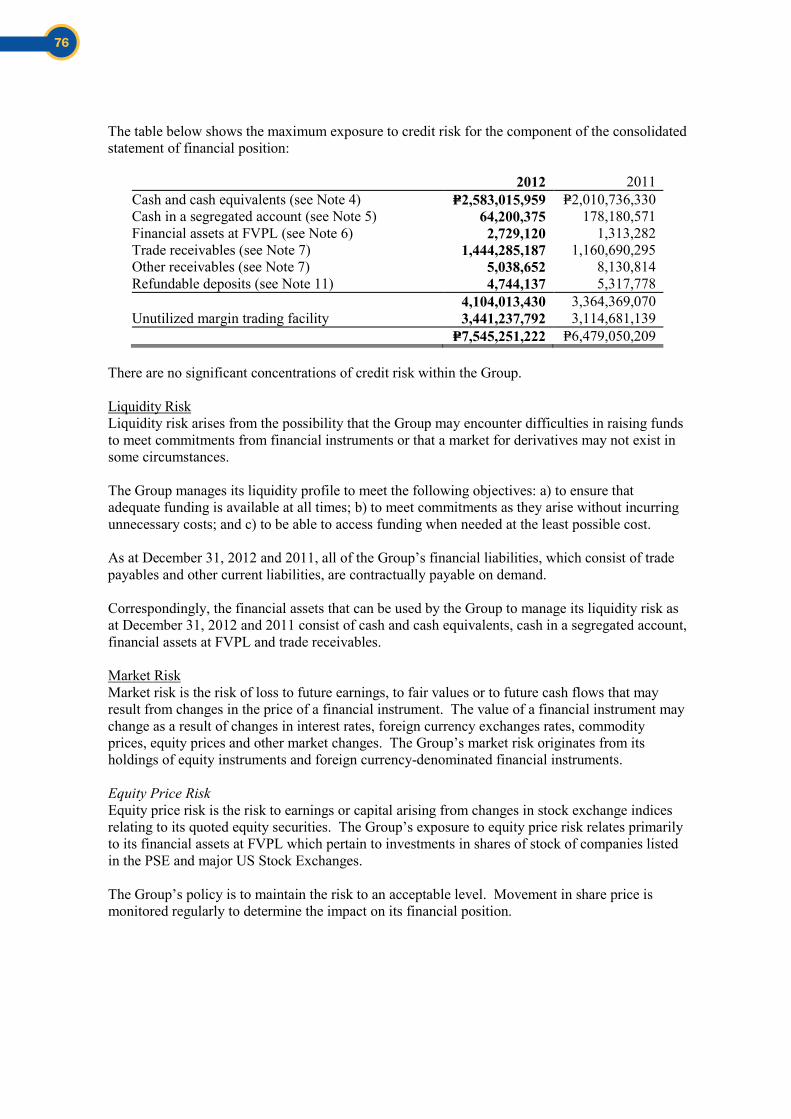
- 42 -
*SGVFS000888*
The table below shows the maximum exposure to credit risk for the component of the consolidated statement of financial position:
2012 2011 Cash and cash equivalents (see Note 4) P=2,583,015,959 P=2,010,736,330 Cash in a segregated account (see Note 5) 64,200,375 178,180,571 Financial assets at FVPL (see Note 6) 2,729,120 1,313,282 Trade receivables (see Note 7) 1,444,285,187 1,160,690,295 Other receivables (see Note 7) 5,038,652 8,130,814 Refundable deposits (see Note 11) 4,744,137 5,317,778 4,104,013,430 3,364,369,070 Unutilized margin trading facility 3,441,237,792 3,114,681,139 P=7,545,251,222 P=6,479,050,209
There are no significant concentrations of credit risk within the Group.
Liquidity Risk Liquidity risk arises from the possibility that the Group may encounter difficulties in raising funds to meet commitments from financial instruments or that a market for derivatives may not exist in some circumstances.
The Group manages its liquidity profile to meet the following objectives: a) to ensure that adequate funding is available at all times; b) to meet commitments as they arise without incurring unnecessary costs; and c) to be able to access funding when needed at the least possible cost.
As at December 31, 2012 and 2011, all of the Group’s financial liabilities, which consist of trade payables and other current liabilities, are contractually payable on demand.
Correspondingly, the financial assets that can be used by the Group to manage its liquidity risk as at December 31, 2012 and 2011 consist of cash and cash equivalents, cash in a segregated account, financial assets at FVPL and trade receivables.
Market Risk Market risk is the risk of loss to future earnings, to fair values or to future cash flows that may result from changes in the price of a financial instrument. The value of a financial instrument may change as a result of changes in interest rates, foreign currency exchanges rates, commodity prices, equity prices and other market changes. The Group’s market risk originates from its holdings of equity instruments and foreign currency-denominated financial instruments.
Equity Price Risk Equity price risk is the risk to earnings or capital arising from changes in stock exchange indices relating to its quoted equity securities. The Group’s exposure to equity price risk relates primarily to its financial assets at FVPL which pertain to investments in shares of stock of companies listed in the PSE and major US Stock Exchanges.
The Group’s policy is to maintain the risk to an acceptable level. Movement in share price is monitored regularly to determine the impact on its financial position.
76
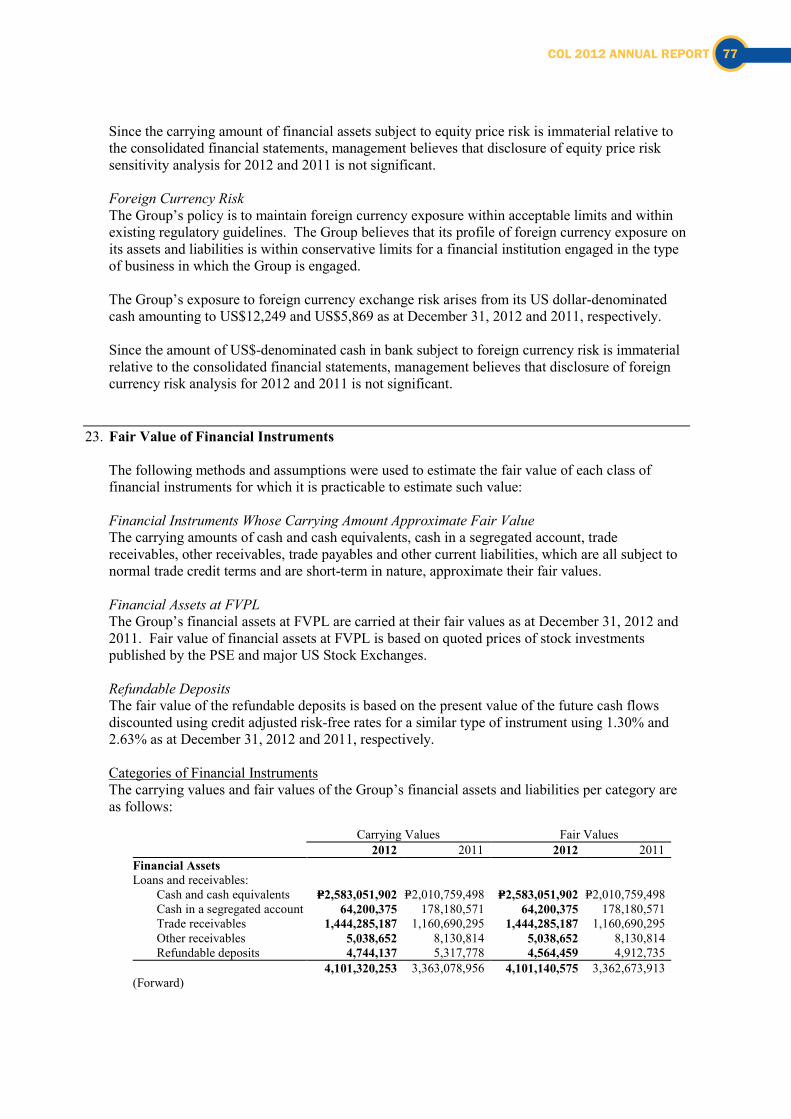
- 43 -
*SGVFS000888*
Since the carrying amount of financial assets subject to equity price risk is immaterial relative to the consolidated financial statements, management believes that disclosure of equity price risk sensitivity analysis for 2012 and 2011 is not significant.
Foreign Currency Risk The Group’s policy is to maintain foreign currency exposure within acceptable limits and within existing regulatory guidelines. The Group believes that its profile of foreign currency exposure on its assets and liabilities is within conservative limits for a financial institution engaged in the type of business in which the Group is engaged.
The Group’s exposure to foreign currency exchange risk arises from its US dollar-denominated cash amounting to US$12,249 and US$5,869 as at December 31, 2012 and 2011, respectively.
Since the amount of US$-denominated cash in bank subject to foreign currency risk is immaterial relative to the consolidated financial statements, management believes that disclosure of foreign currency risk analysis for 2012 and 2011 is not significant.
23. Fair Value of Financial Instruments
The following methods and assumptions were used to estimate the fair value of each class of financial instruments for which it is practicable to estimate such value:
Financial Instruments Whose Carrying Amount Approximate Fair Value The carrying amounts of cash and cash equivalents, cash in a segregated account, trade receivables, other receivables, trade payables and other current liabilities, which are all subject to normal trade credit terms and are short-term in nature, approximate their fair values.
Financial Assets at FVPL The Group’s financial assets at FVPL are carried at their fair values as at December 31, 2012 and 2011. Fair value of financial assets at FVPL is based on quoted prices of stock investments published by the PSE and major US Stock Exchanges.
Refundable Deposits The fair value of the refundable deposits is based on the present value of the future cash flows discounted using credit adjusted risk-free rates for a similar type of instrument using 1.30% and 2.63% as at December 31, 2012 and 2011, respectively.
Categories of Financial Instruments The carrying values and fair values of the Group’s financial assets and liabilities per category are as follows:
Carrying Values Fair Values 2012 2011 2012 2011 Financial Assets Loans and receivables: Cash and cash equivalents P=2,583,051,902 P=2,010,759,498 P=2,583,051,902 P=2,010,759,498 Cash in a segregated account 64,200,375 178,180,571 64,200,375 178,180,571 Trade receivables 1,444,285,187 1,160,690,295 1,444,285,187 1,160,690,295 Other receivables 5,038,652 8,130,814 5,038,652 8,130,814 Refundable deposits 4,744,137 5,317,778 4,564,459 4,912,735 4,101,320,253 3,363,078,956 4,101,140,575 3,362,673,913 (Forward)
COL 2012 ANNUAL REPORT 77
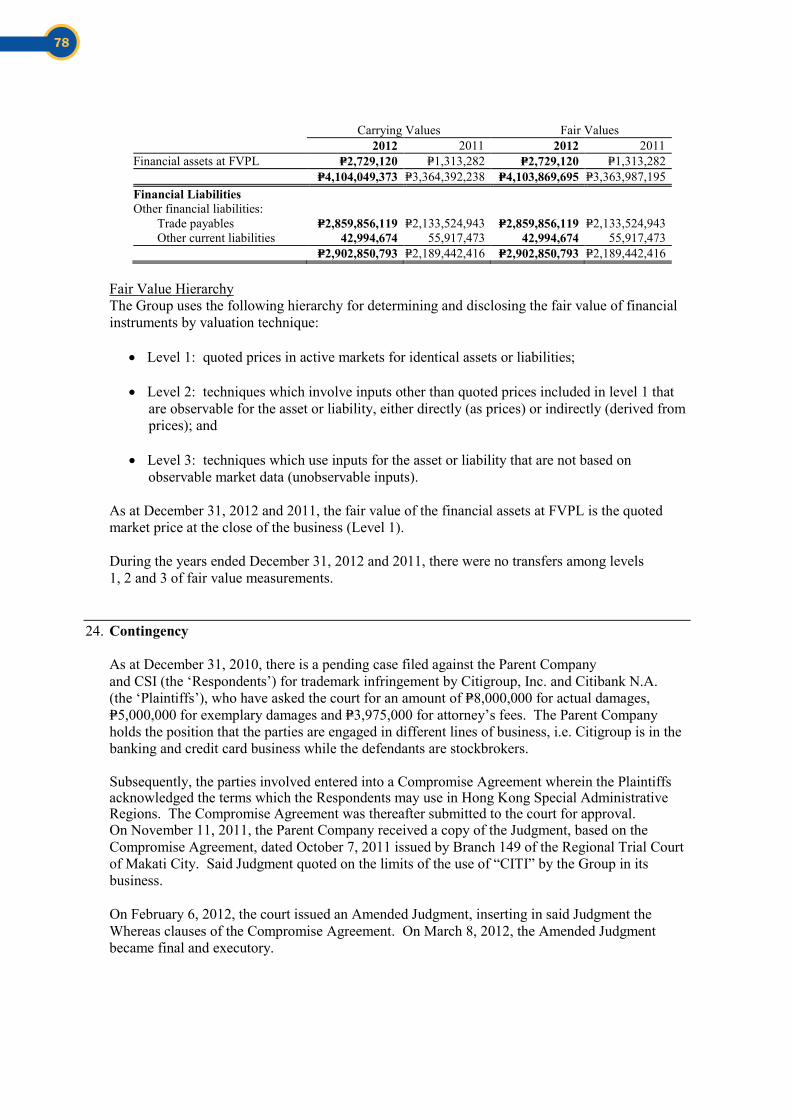
- 44 -
*SGVFS000888*
Carrying Values Fair Values 2012 2011 2012 2011 Financial assets at FVPL P=2,729,120 P=1,313,282 P=2,729,120 P=1,313,282 P=4,104,049,373 P=3,364,392,238 P=4,103,869,695 P=3,363,987,195 Financial Liabilities Other financial liabilities: Trade payables P=2,859,856,119 P=2,133,524,943 P=2,859,856,119 P=2,133,524,943 Other current liabilities 42,994,674 55,917,473 42,994,674 55,917,473 P=2,902,850,793 P=2,189,442,416 P=2,902,850,793 P=2,189,442,416
Fair Value Hierarchy The Group uses the following hierarchy for determining and disclosing the fair value of financial instruments by valuation technique:
Level 1: quoted prices in active markets for identical assets or liabilities;
Level 2: techniques which involve inputs other than quoted prices included in level 1 that
are observable for the asset or liability, either directly (as prices) or indirectly (derived from prices); and
Level 3: techniques which use inputs for the asset or liability that are not based on
observable market data (unobservable inputs).
As at December 31, 2012 and 2011, the fair value of the financial assets at FVPL is the quoted market price at the close of the business (Level 1).
During the years ended December 31, 2012 and 2011, there were no transfers among levels 1, 2 and 3 of fair value measurements.
24. Contingency
As at December 31, 2010, there is a pending case filed against the Parent Company and CSI (the ‘Respondents’) for trademark infringement by Citigroup, Inc. and Citibank N.A. (the ‘Plaintiffs’), who have asked the court for an amount of P=8,000,000 for actual damages, P=5,000,000 for exemplary damages and P=3,975,000 for attorney’s fees. The Parent Company holds the position that the parties are engaged in different lines of business, i.e. Citigroup is in the banking and credit card business while the defendants are stockbrokers.
Subsequently, the parties involved entered into a Compromise Agreement wherein the Plaintiffs acknowledged the terms which the Respondents may use in Hong Kong Special Administrative Regions. The Compromise Agreement was thereafter submitted to the court for approval. On November 11, 2011, the Parent Company received a copy of the Judgment, based on the Compromise Agreement, dated October 7, 2011 issued by Branch 149 of the Regional Trial Court of Makati City. Said Judgment quoted on the limits of the use of “CITI” by the Group in its business.
On February 6, 2012, the court issued an Amended Judgment, inserting in said Judgment the Whereas clauses of the Compromise Agreement. On March 8, 2012, the Amended Judgment became final and executory.
78
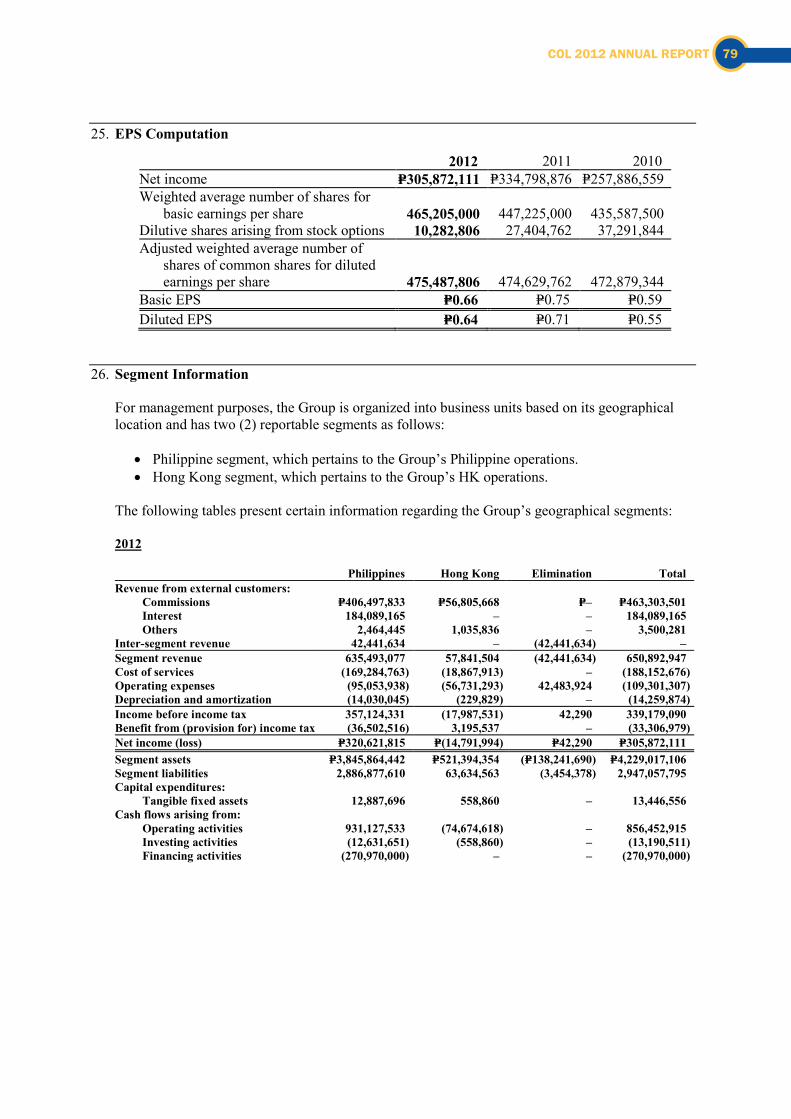
- 45 -
*SGVFS000888*
25. EPS Computation
2012 2011 2010 Net income P=305,872,111 P=334,798,876 P=257,886,559 Weighted average number of shares for
basic earnings per share 465,205,000 447,225,000 435,587,500 Dilutive shares arising from stock options 10,282,806 27,404,762 37,291,844 Adjusted weighted average number of
shares of common shares for diluted earnings per share 475,487,806 474,629,762 472,879,344
Basic EPS P=0.66 P=0.75 P=0.59 Diluted EPS P=0.64 P=0.71 P=0.55
26. Segment Information
For management purposes, the Group is organized into business units based on its geographical location and has two (2) reportable segments as follows:
Philippine segment, which pertains to the Group’s Philippine operations. Hong Kong segment, which pertains to the Group’s HK operations.
The following tables present certain information regarding the Group’s geographical segments:
2012
Philippines Hong Kong Elimination Total Revenue from external customers: Commissions P=406,497,833 P=56,805,668 P=– P=463,303,501 Interest 184,089,165 – – 184,089,165 Others 2,464,445 1,035,836 – 3,500,281 Inter-segment revenue 42,441,634 – (42,441,634) – Segment revenue 635,493,077 57,841,504 (42,441,634) 650,892,947 Cost of services (169,284,763) (18,867,913) – (188,152,676) Operating expenses (95,053,938) (56,731,293) 42,483,924 (109,301,307) Depreciation and amortization (14,030,045) (229,829) – (14,259,874) Income before income tax 357,124,331 (17,987,531) 42,290 339,179,090 Benefit from (provision for) income tax (36,502,516) 3,195,537 – (33,306,979) Net income (loss) P=320,621,815 P=(14,791,994) P=42,290 P=305,872,111 Segment assets P=3,845,864,442 P=521,394,354 (P=138,241,690) P=4,229,017,106 Segment liabilities 2,886,877,610 63,634,563 (3,454,378) 2,947,057,795 Capital expenditures: Tangible fixed assets 12,887,696 558,860 – 13,446,556 Cash flows arising from: Operating activities 931,127,533 (74,674,618) – 856,452,915 Investing activities (12,631,651) (558,860) – (13,190,511) Financing activities (270,970,000) – – (270,970,000)
COL 2012 ANNUAL REPORT 79
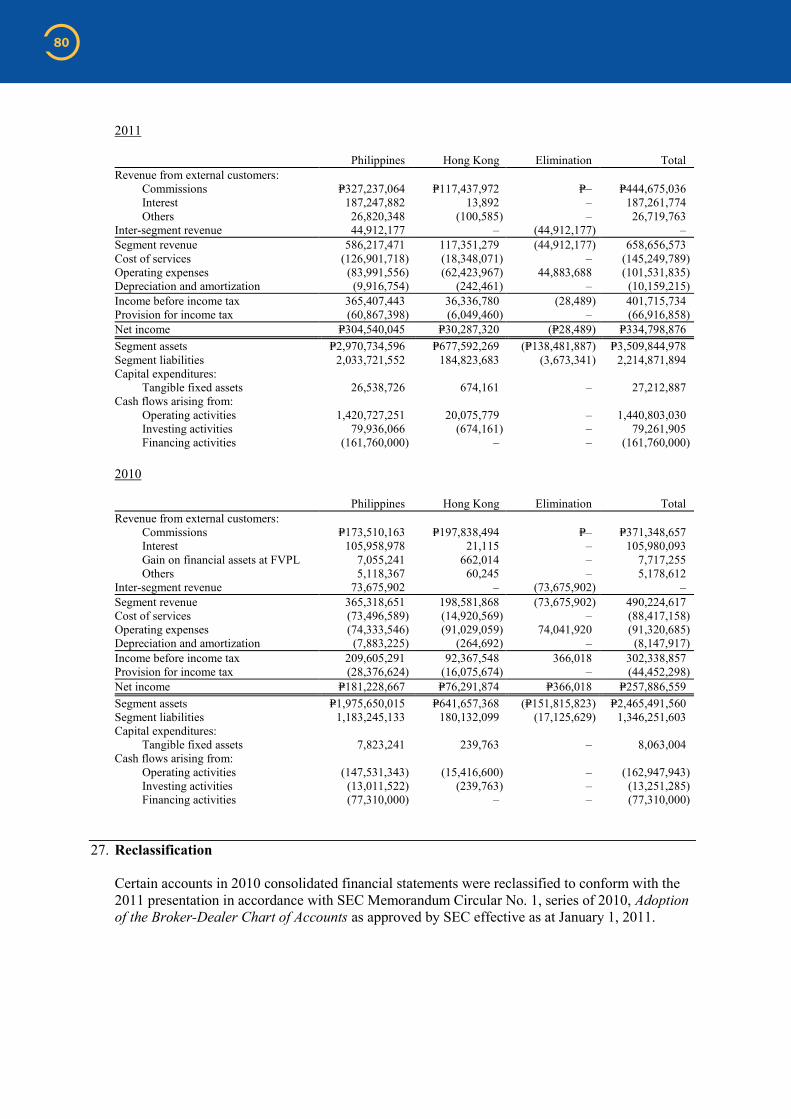
- 46 -
*SGVFS000888*
2011
Philippines Hong Kong Elimination Total Revenue from external customers: Commissions P=327,237,064 P=117,437,972 P=– P=444,675,036 Interest 187,247,882 13,892 – 187,261,774 Others 26,820,348 (100,585) – 26,719,763 Inter-segment revenue 44,912,177 – (44,912,177) – Segment revenue 586,217,471 117,351,279 (44,912,177) 658,656,573 Cost of services (126,901,718) (18,348,071) – (145,249,789) Operating expenses (83,991,556) (62,423,967) 44,883,688 (101,531,835) Depreciation and amortization (9,916,754) (242,461) – (10,159,215) Income before income tax 365,407,443 36,336,780 (28,489) 401,715,734 Provision for income tax (60,867,398) (6,049,460) – (66,916,858) Net income P=304,540,045 P=30,287,320 (P=28,489) P=334,798,876 Segment assets P=2,970,734,596 P=677,592,269 (P=138,481,887) P=3,509,844,978 Segment liabilities 2,033,721,552 184,823,683 (3,673,341) 2,214,871,894 Capital expenditures: Tangible fixed assets 26,538,726 674,161 – 27,212,887 Cash flows arising from: Operating activities 1,420,727,251 20,075,779 – 1,440,803,030 Investing activities 79,936,066 (674,161) – 79,261,905 Financing activities (161,760,000) – – (161,760,000)
2010
Philippines Hong Kong Elimination Total Revenue from external customers: Commissions P=173,510,163 P=197,838,494 P=– P=371,348,657 Interest 105,958,978 21,115 – 105,980,093 Gain on financial assets at FVPL 7,055,241 662,014 – 7,717,255 Others 5,118,367 60,245 – 5,178,612 Inter-segment revenue 73,675,902 – (73,675,902) – Segment revenue 365,318,651 198,581,868 (73,675,902) 490,224,617 Cost of services (73,496,589) (14,920,569) – (88,417,158) Operating expenses (74,333,546) (91,029,059) 74,041,920 (91,320,685) Depreciation and amortization (7,883,225) (264,692) – (8,147,917) Income before income tax 209,605,291 92,367,548 366,018 302,338,857 Provision for income tax (28,376,624) (16,075,674) – (44,452,298) Net income P=181,228,667 P=76,291,874 P=366,018 P=257,886,559 Segment assets P=1,975,650,015 P=641,657,368 (P=151,815,823) P=2,465,491,560 Segment liabilities 1,183,245,133 180,132,099 (17,125,629) 1,346,251,603 Capital expenditures: Tangible fixed assets 7,823,241 239,763 – 8,063,004 Cash flows arising from: Operating activities (147,531,343) (15,416,600) – (162,947,943) Investing activities (13,011,522) (239,763) – (13,251,285) Financing activities (77,310,000) – – (77,310,000)
27. Reclassification
Certain accounts in 2010 consolidated financial statements were reclassified to conform with the 2011 presentation in accordance with SEC Memorandum Circular No. 1, series of 2010, Adoption of the Broker-Dealer Chart of Accounts as approved by SEC effective as at January 1, 2011.
80

COL 2012 ANNUAL REPORT 81
CONCEPT, CONTENT DESIGN, AND LAYOUT:K2 INTERACTIVE, INC.
PHOTOGRAPHY:DODIE LEGASPI