
VIDEO GAMES: CLOUD INVADERS - CitiFirst
162
Citi is one of the world’s largest financial institutions, operating in all major established and emerging markets. Across these world markets, our employees conduct an ongoing multi-disciplinary conversation – accessing information, analyzing data, developing insights, and formulating advice. As our premier thought leadership product, Citi GPS is designed to help our readers navigate the global economy’s most demanding challenges and to anticipate future themes and trends in a fast-changing and interconnected world. Citi GPS accesses the best elements of our global conversation and harvests the thought leadership of a wide range of senior professionals across our firm. This is not a research report and does not constitute advice on investments or a solicitations to buy or sell any financial instruments. For more information on Citi GPS, please visit our website at www.citi.com/citigps. Citi GPS: Global Perspectives & Solutions June 2019 VIDEO GAMES: CLOUD INVADERS Bracing for the Netflix-ization of Gaming
-
Upload
khangminh22 -
Category
Documents
-
view
0 -
download
0
Transcript of VIDEO GAMES: CLOUD INVADERS - CitiFirst
Citi is one of the world’s largest financial institutions, operating in all major established and emerging markets. Across these world markets, our employees conduct an ongoing multi-disciplinary conversation – accessing information, analyzing data, developing insights, and formulating advice. As our premier thought leadership product, Citi GPS is designed to help our readers navigate the global economy’s most demanding challenges and to anticipate future themes and trends in a fast-changing and interconnected world. Citi GPS accesses the best elements of our global conversation and harvests the thought leadership of a wide range of senior professionals across our firm. This is not a research report and does not constitute advice on investments or a solicitations to buy or sell any financial instruments. For more information on Citi GPS, please visit our website at www.citi.com/citigps.
Citi GPS: Global Perspectives & Solutions
June 2019
VIDEO GAMES: CLOUD INVADERSBracing for the Netflix-ization of Gaming

© 2019 Citigroup
Authors
Jason B Bazinet
U.S. Entertainment, Cable & Satellite Analyst
+1-212-816-6395 | [email protected]
Thomas A Singlehurst, CFA
Head of European Media Research Team
+44-20-7986-4051 | [email protected]
Kota Ezawa
Co-Head of Global Technology Research
+81-3-6776-4640 | [email protected]
Mark May
U.S. Internet Analyst
+1-212-816-5564 | [email protected]
Walter H Pritchard, CFA
U.S. Software Analyst
+1-415-951-1770 | [email protected]
Alicia Yap, CFA
Head of Pan-Asia Internet Research
+852-2501-2773 | [email protected]
Expert Commentators
Luke Alvarez
Founding Managing
Partner, Hiro Capital
Ralf Reichart
Co-CEO of ESL
Wil Stephens
CEO, Founder of Fusebox
Games
Global Video Game Team
Hillman Chan, CFA
China Internet & Media Analyst
+852-2501-2777 | [email protected]
Arthur Lai
Greater China Technology Analyst
+852-2501-2758 | [email protected]
Carrie Liu `
Taiwan Technology Hardware Analyst
+886-2-8726-9086 | [email protected]
Atif Malik
U.S. Semiconductor and Semi Equip Analyst
+1-415-951-1892 | [email protected]
Rafal Materka
Poland Investment Research Team
+48-22-690-3288 | [email protected]
Asiya Merchant, CFA
U.S. IT Hardware & Tech Supply Chain Analyst
+1-415-951-1752 | [email protected]
Minami Munakata
Japan Metals & Mining, Media Analyst
+81-3-6776-4632 | [email protected]
Catherine T O'Neill
European Media Analyst
+44-20-7986-8053 | [email protected] +
Ashwin Shirvaikar, CFA
U.S. Payments, Processors & IT Analyst
+1-212-816-0822 | [email protected]
Jim Suva, CPA
IT Hardware & EMS, Telco & Network Equipment Analyst
+1-415-951-1703 | [email protected]
Kyle Twomey
Europe Small Cap Analyst
+44-20-7986-7955 | [email protected]
John Yu
Korea Internet & Media Analyst
+82-2-3705-0721 | [email protected]
© 2019 Citigroup
3
VIDEO GAMES: CLOUD INVADERS Bracing for the Netflix-ization of Gaming What was your first memory of playing video games? Mine was playing Centipede
at the local pizzeria. Armed with quarters and enough money for one slice of pizza,
we would play until we were either broke or our fingers were sore from firing digital
missiles. Eventually my friend got an Atari game system and after months of
begging for the same, my Dad caved in and bought us a gaming system – an
Intellivision game system. He told us over and over that it was a better system to
Atari but it didn’t have all the cool games that my friends played. It was hard
sometimes being the daughter of an engineer who cared about technology
superiority, but at least the hockey game let you punch people.
Game choices moved quickly after that – Tetris on my Macintosh Plus, Donkey
Kong on my Nintendo DS, Brickbreaker on my Blackberry, and now Candy Crush
on my iPhone. The common constraint through the years was that the games I
played continued to be dependent on the device I owned.
When the Internet came about, new firms started disrupting traditional media
businesses such as newspapers, radio, and television by giving consumers what
they wanted, when they wanted, and on the device they wanted. But it didn’t disrupt
the video game industry. Game publishers were able to use the Internet to augment
their revenues. They used the Internet to increase in-game sales and sell software
directly to consumers, and tapped into the smartphone market and the growth of
mobile gaming.
Are video game publishers immune from disruptive threats? The authors of the
report that follows answer with a resounding no. There is a technology on the
horizon that has all the characteristics of a disruptive threat to the video game
ecosystems — the cloud.
The video game ecosystem has been evolving over the last few years — towards
group play vs. single play, to in-game monetization vs. software sales, to renting vs.
buying hardware, to video games being a spectator sport, and to software being
made for all devices vs. software made specifically for hardware. These new trends
in the video game industry could make it much easier for the big cloud players to
come in and start pulling away revenue.
The cloud-based providers will be able to offer low-cost access to cloud-based
gaming and a wide array of gaming content. They will also be able to monetize
gaming in non-traditional ways that play to their strengths — through in-game
monetization, in-game advertising, broadcasting, and digital. For consumers, cloud
will make it easier to play games on different platforms and allow players to be
device agnostic, hitting pause on a PC game and picking it up again on a mobile
device. Game developers will be able to support more devices as compatibility
issues decrease between software and hardware.
eSports, a $1billion business and growing, will have increased opportunities on the
cloud and we believe game publishers will still be able to thrive in the emerging
video game world but will have to adapt their business models to ensure they’re
positioned appropriately..
If the report is right, I may finally be able to play PacMan!
Kathleen Boyle, CFA
Citi GPS Managing Editor
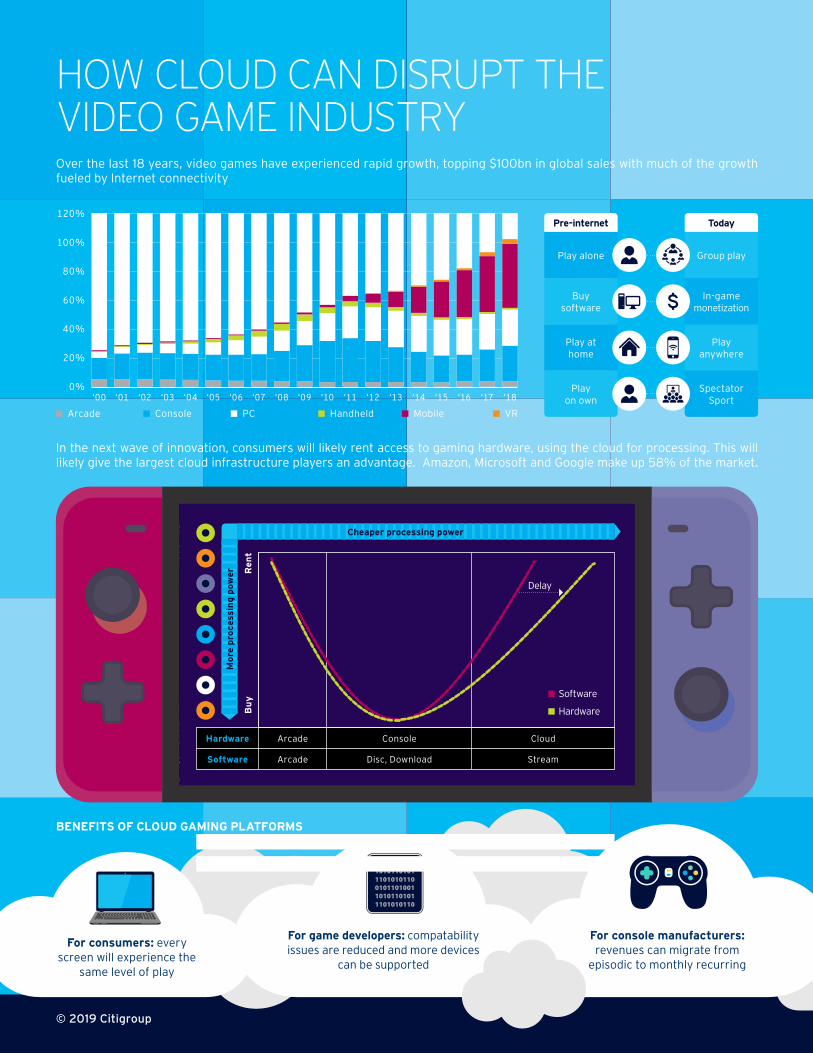
HOW CLOUD CAN DISRUPT THE VIDEO GAME INDUSTRY Over the last 18 years, video games have experienced rapid growth, topping $100bn in global sales with much of the growth fueled by Internet connectivity
In the next wave of innovation, consumers will likely rent access to gaming hardware, using the cloud for processing. This will likely give the largest cloud infrastructure players an advantage. Amazon, Microsoft and Google make up 58% of the market.
Pre-internet Today120%
100%
80%
60%
40%
20%
0%
Arcade Console PC Handheld Mobile VR
‘00 ‘01 ‘02 ‘03 ‘04 ‘05 ‘06 ‘07 ‘08 ‘09 ‘10 ‘11 ‘12 ‘13 ‘14 ‘15 ‘16 ‘17 ‘18
© 2019 Citigroup
BENEFITS OF CLOUD GAMING PLATFORMS
For console manufacturers: revenues can migrate from
episodic to monthly recurring
For consumers: every screen will experience the
same level of play
For game developers: compatability issues are reduced and more devices
can be supported
Play alone Group play
Buy software
In-game monetization
Play at home
Play anywhere
Play on own
Spectator Sport
Hardware
Software
Arcade Console Cloud
Arcade Disc, Download Stream
Cheaper processing power
Mor
e pr
oces
sing
pow
er Ren
tB
uy
Software
Hardware
Delay
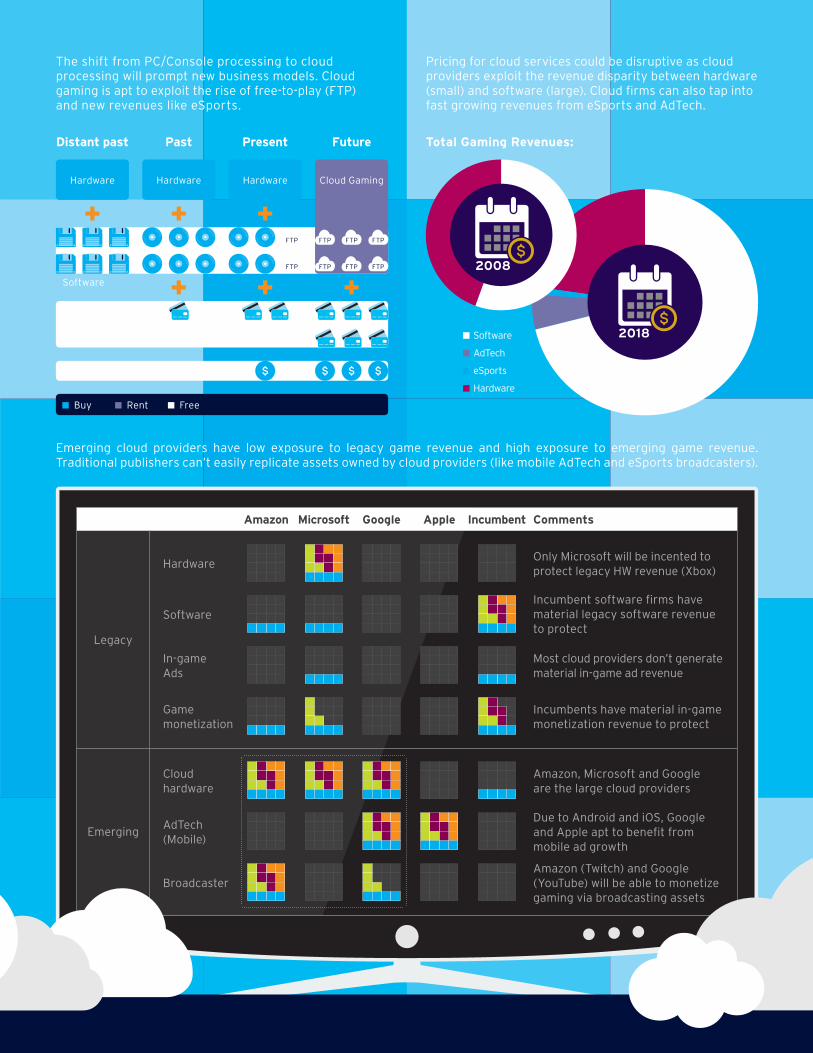
Legacy
In-game Ads
Software
Hardware
Most cloud providers don’t generate material in-game ad revenue
Incumbent software firms have material legacy software revenue to protect
Only Microsoft will be incented to protect legacy HW revenue (Xbox)
Incumbents have material in-game monetization revenue to protect
Amazon, Microsoft and Google are the large cloud providers
Due to Android and iOS, Google and Apple apt to benefit from mobile ad growth
Amazon (Twitch) and Google (YouTube) will be able to monetize gaming via broadcasting assets
Game monetization
Cloud hardware
AdTech (Mobile)
Broadcaster
Emerging
Amazon GoogleMicrosoft Apple Incumbent Comments
Emerging cloud providers have low exposure to legacy game revenue and high exposure to emerging game revenue. Traditional publishers can’t easily replicate assets owned by cloud providers (like mobile AdTech and eSports broadcasters).
Pricing for cloud services could be disruptive as cloud providers exploit the revenue disparity between hardware (small) and software (large). Cloud firms can also tap into fast growing revenues from eSports and AdTech.
Total Gaming Revenues:
Software
AdTech
eSports
Hardware
The shift from PC/Console processing to cloud processing will prompt new business models. Cloud gaming is apt to exploit the rise of free-to-play (FTP) and new revenues like eSports.
Distant past Past Present Future
Buy Rent Free
Hardware
Software
In-game spend
New monetization (eSports, Mobile, AdTech)
Hardware Hardware Cloud Gaming
FTPFTP
FTPFTP
FTP
FTP
FTP
FTP
2018
2008

© 2019 Citigroup
6
Contents Summary 7
The Console/PC Value Chain 11
Layer I: Intellectual Property 12 Layer II: Game Developers 14
The Genres 20 AAA Versus Independent Games 21
Layer III: Game Publishers 26 Layer IV: Hardware 29
Arcades: Where the Games Begin 29 Console and Handsets: Where the Market Expands 30 Handheld Market 32 PC Market 38
Layer V: Distribution 40 Cloud Gaming 45
Layer VI: Consumer 53 Layer VII: eSports 55
Mode of Distribution 55 Live Streamers 58 Sponsorships 63 Subscribers 64 Ads 64 Donations 65 Professional eSports 69 Turnover of eSports Titles a Key Consideration 79 Grassroots Competition 80 Live Streaming vs. eSports: The Broadcaster’s Perspective 81
The Mobile Value Chain 83 Layer I: Intellectual Property 86 Layer II: Developers and Publishers 87 Layer III: Installs 89 Layer IV: Mobile OS 92 Layer V: Generate Advertising 93 Layer VI: Advertiser 95 Layer VII: Consumer 96
Mobile Economics 97 Mobile Gaming Revenues 99
Industry Evolution 100 Internet-enhanced Gaming Profits 100 Foundation In Place for a New Model 102 What the New Model Might Look Like 107 Pricing of Cloud Gaming Services 114 Regulations 121
Prudent Strategic Responses 122 Potential M&A 122 How Publishers Should Respond 123
Expert Views 128
Expert Views from the Gaming Industry 129 A Conversation with Luke Alvarez 130 A Conversation with Ralf Reichart 138 A Conversation with Wil Stephens 146
© 2019 Citigroup
7
Summary Eight years ago, Marc Andreesen – of Netscape fame – penned an article in The
Wall Street Journal titled: ‘Why Software is Eating the World’. Mr. Andreesen’s idea,
like all good ideas, was simple: software — riding on top of the Internet — was
changing everything. For the software owners, it was a boon. But, for incumbents, it
represented unrelenting value destruction.
In the wake of this software-induced upheaval, non-software centric firms have
been dented, damaged, upended, or dethroned. The list of victims is long: book
stores (Amazon), brick-based retail (Amazon), travel agencies (Expedia), taxi cabs
(Uber), phone books (Google), photos (Apple), newspapers (Google), magazines
(Facebook), radio stations (Spotify), and cable networks (Netflix).
Indeed, over the last 20 years, five U.S. leviathans have proven particularly adept at
using software to create significant economic value. Wall Street’s shorthand for
these firms is FAANG: Facebook, Apple, Amazon, Netflix, and Google. In Asia, there
are three disruptive firms — Baidu, Alibaba and Tencent — or BAT. Each firm —
and a handful of smaller entities — has used software and the Internet to give
consumers what they want, when they want it, at far lower cost.
After the FAANG or BAT transformation is complete, these giants jockey for position
to ensure they capture the lion’s share of the sector’s remaining, albeit diminished,
profits. In the process, the largest Internet firms get bigger. Incumbent firms stall,
shrink, or sometimes, disappear.
Within the entertainment sector, however, there’s a small collection of rarefied
entities. To date, these few firms have been immune to the software-centric,
Internet-enabled FAANG assault: Sports teams, concert promoters, and video game
publishers. Indeed, each of these businesses has actually used the Internet to
improve results:
Sports teams sold digital content rights on top of traditional TV rights.
Concert promoters — like Live Nation —- benefitted as lucrative CD sales
collapsed. That’s because rock stars toured more often to preserve their
lifestyles.
Video game publishers have deftly used the Internet to: (1) sell copies of their
software directly to consumers, disintermediating retailers; (2) augment game
sales with in-game monetization (like loot boxes); and (3) tap into explosive
smartphone growth to monetize mobile games.
But, will video game publishers remain immune to the FAANG threat? We don’t
think so. A number of large firms — including Google, Amazon, and Microsoft — are
rapidly building cloud scale. And, we suspect a natural way to leverage this
infrastructure is to move into gaming. Moreover, there’s quite a bit of money up for
grabs: $100 billion per year for software and $35 billion a year for hardware.
But, to understand why we’re so focused on Google, Amazon, and Microsoft, we
need to understand five powerful trends that are — or will — rumble across the
video game ecosystem.
© 2019 Citigroup
8
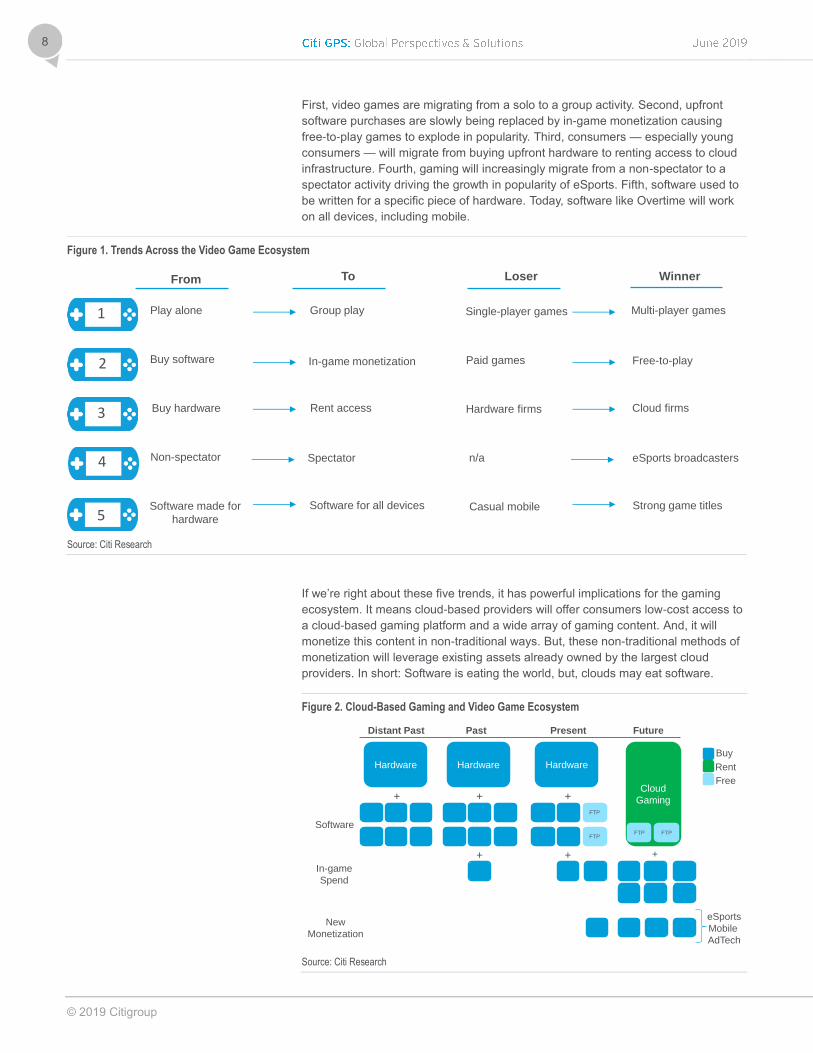
First, video games are migrating from a solo to a group activity. Second, upfront
software purchases are slowly being replaced by in-game monetization causing
free-to-play games to explode in popularity. Third, consumers — especially young
consumers — will migrate from buying upfront hardware to renting access to cloud
infrastructure. Fourth, gaming will increasingly migrate from a non-spectator to a
spectator activity driving the growth in popularity of eSports. Fifth, software used to
be written for a specific piece of hardware. Today, software like Overtime will work
on all devices, including mobile.
Figure 1. Trends Across the Video Game Ecosystem
Source: Citi Research
If we’re right about these five trends, it has powerful implications for the gaming
ecosystem. It means cloud-based providers will offer consumers low-cost access to
a cloud-based gaming platform and a wide array of gaming content. And, it will
monetize this content in non-traditional ways. But, these non-traditional methods of
monetization will leverage existing assets already owned by the largest cloud
providers. In short: Software is eating the world, but, clouds may eat software.
Figure 2. Cloud-Based Gaming and Video Game Ecosystem
Source: Citi Research
From To Loser Winner
Software made for
hardware
Software for all devices Casual mobile Strong game titles5
Non-spectator Spectator n/a eSports broadcasters4
Buy hardware Rent access Hardware firms Cloud firms3
Buy software In-game monetization Paid games Free-to-play2
Play alone Group play Single-player games Multi-player games1
Hardware
+
Software
Hardware
+
In-game
Spend
+
Hardware
FTP
+
+
Cloud
Gaming
+
Present FuturePast
FTP
Distant Past
Buy
New
Monetization
FTPFTP
eSports
Mobile
AdTech
Rent
Free
© 2019 Citigroup
9
What assets will a cloud-based firm leverage? There are quite a few:
First, Google, Amazon, and Microsoft are the largest providers of cloud-based
services (with ~60% share as of the fourth quarter of 2018). This will enable low-
cost cloud gaming services.
Second, the largest game broadcasters are Twitch (owned by Amazon) and
YouTube (owned by Google). This gives two cloud-based firms indirect methods
of monetization that cannot be matched by incumbent game publishers.
Third, a large portion of gaming revenues stem from in-game advertising,
particularly on mobile devices. And, the mobile AdTech ecosystem is controlled
by two firms: Apple and Google.
Fourth, digital distribution — particularly for Amazon — is a core competency. As
such, these cloud-based firms could open (or acquire) gaming distribution
platforms like Valve’s Steam.
Fifth, cloud gaming companies have ample means to cross-sell their offerings.
Cross-selling opportunities span both hardware (FireTV, AppleTV, Alexa) and
software (YouTube Premium, Amazon Prime).
If we’re correct, video game publishers that are over-monetizing their intellectual
property (IP) by selling the game plus in-game content could see long-term top-line
pressures. How can incumbent gaming firms respond? We think there are five key
steps:
First, incumbents should deemphasize titles that aren’t tied to sports, have weak
IP, and don’t have a robust eSports (or live streamer) community. That’s because
sports titles tend to have a very loyal following (and are likely less prone to cloud-
based price competition). And, we expect eSports to play a larger role in the
gaming ecosystem as fewer very popular games (with robust IP) increasingly
dominate the gaming ecosystem.
Second, publishers should redirect developer time to refreshing existing titles to
keep in-game monetization robust and consumer engagement consistent.
Third, for non-sports titles with weaker IP, publishers should begin to gradually
lower the retail prices of the games while simultaneously investing in in-game
monetization. This will make the transition to free-to-play less disruptive.
Fourth, publishers should invest in eSports and develop games that are likely to
have a strong live streaming following.
Fifth, video game firms should ensure that every popular title has a viable mobile
version. This will prepare firms for the inevitability of cloud gaming (when
mobile/personal computer (PC)/console gaming platforms converge).
So, the ‘salad days’ for video game publishers — where the Internet enhanced
profits — probably won’t last. But, there are clearly steps video game publishers can
make today to ensure they still play a viable part in the new cloud-based, platform-
converged, eSports-centric video game ecosystem.

© 2019 Citigroup
10
To explore our thesis, we have divided this report into three main sections. First,
we’ll unpack the video game value chain tackling the console/PC market and the
mobile market separately. Second, we’ll suggest how the video game industry will
likely evolve. Third, we’ll review the strategic implications — and potential next
steps — for the video game incumbents.
Before we dive in, a quick disclaimer. As we did this work, we were struck by both
the level and quality of debate related to cloud computing and its impact on the
video game ecosystem. There are strong arguments on both sides of the debate.
Obviously, we have our view. But, we are conscious not all readers will agree with
us. With this in mind, we hope readers will find the ‘Expert Views’ section at the
back of the report helpful. These experts have decades of experience in the space.
We are also very open to feedback: Please do get in touch if you think we’ve
missed something or have drawn the wrong conclusions. We are keen to engage.

© 2019 Citigroup
11
The Console/PC Value Chain The video game industry has a long history. Back in 1958, a physicist, William
Higinbotham, created the first video game: Tennis for Two. It took about 15 years
before the business world took notice. The Magnavox Odyssey debuted in 1972.
Over the next 60 years, a rather complex industry organically evolved. In the PC
and console market, the video game value chain has seven layers:
Intellectual Property (IP): At the top of the stack are owners of intellectual
property. This includes sports leagues (FIFA, NFL), movies (Star Wars), books
(Tom Clancy), and toys (Lego). This IP is often licensed for a royalty payment.
Developers: Video game developers are one layer down the value chain. These
entities write code to create the game. They receive a fee and perhaps a royalty
(if the game is successful) from the game publisher. They may rely on — and pay
for — game engines to accelerate game development. If not, they’ll use specific
application programming interfaces (APIs) that allow the software to work easily
with a variety of hardware platforms.
Publishers: Toward the middle of the stack are game publishers. Publishers sell
and market video games. They make three types of payments: (1) payments to
the owner of the underlying IP (if applicable); (2) payments to the game
developer; and (3) payments to the manufacturer of the console (but not PC
firms). If the game is distributed digitally, they may also make a payment to the
digital storefront.
Hardware: The game developer and game publisher will agree to develop the
game for a specific type of hardware. It could be a console — like PlayStation,
Xbox or Nintendo — or a PC. In the future, this may be a ‘virtual hardware’
presence that is a streaming service across any hardware.
Distributors: Toward the bottom of the stack are the distributors. They sell the
game to the consumer. Delivery could be via a physical disc (GameStop,
Amazon) or a digital file (Steam, Electronic Art’s Origin).
Consumers: Near the bottom of the value chain, you’ll find the consumer. They
spend money to enjoy the underlying game.
eSports: The final layer of the value chain is eSports. eSports can include
professional teams (in tournaments). Or, it may capture consumers watching
amateurs play video games on a broadcast platform (like Twitch). These
amateurs are also called ‘live streamers’.
© 2019 Citigroup
12
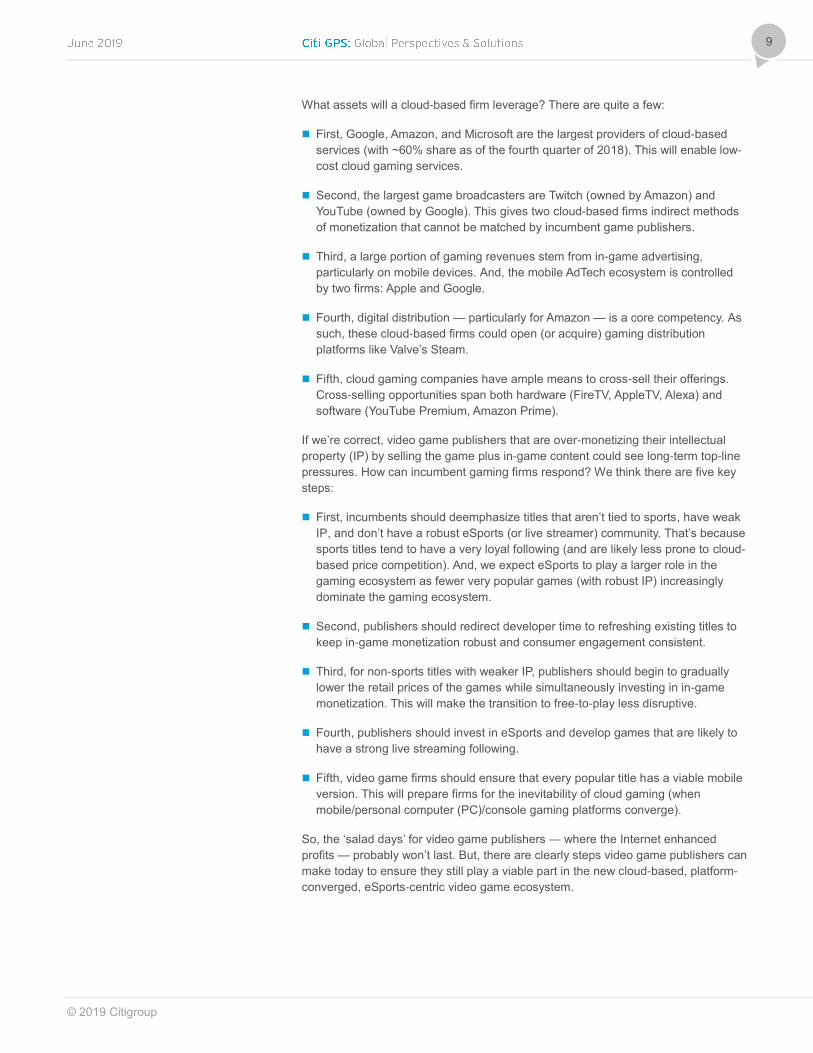
Figure 3. The Console/PC Value Chain
Note: IP – Intellectual Property, SW = Software, T = Time. Source: Citi Research
Let’s walk through each step of the value chain in a bit more detail.
Layer I: Intellectual Property
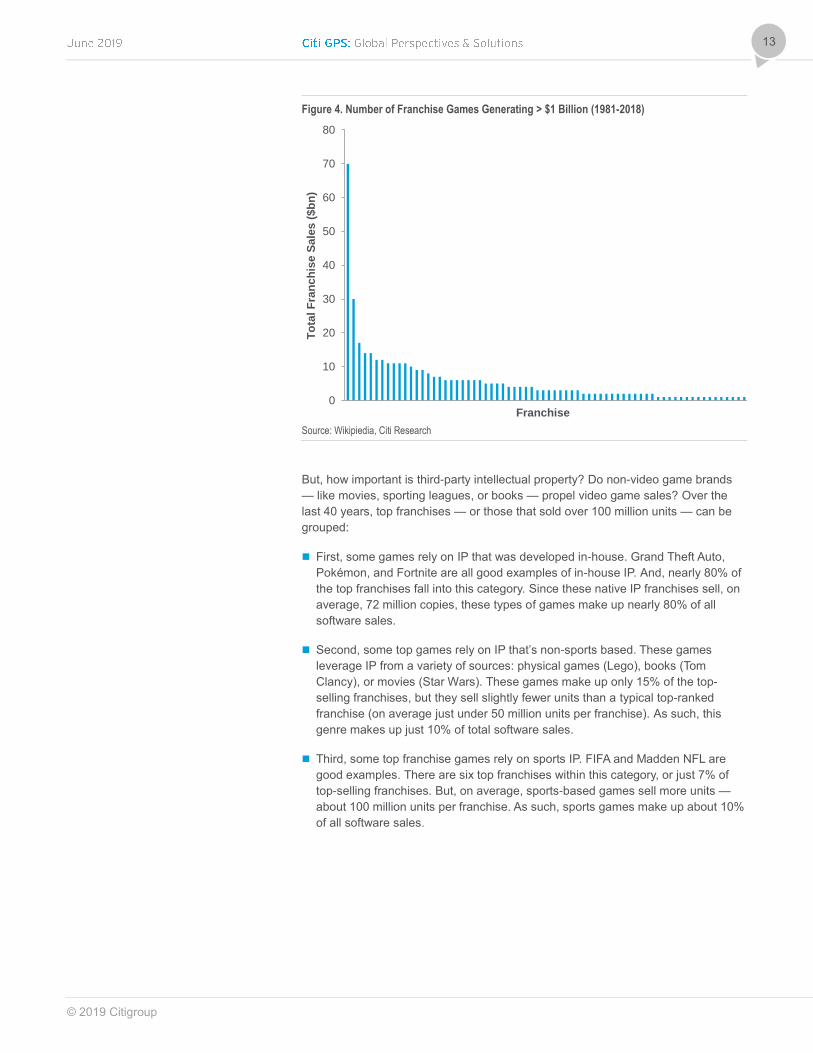
Over the last 40 years, only 70 global video game franchise games have generated
over $1 billion in global sales. But, some of the highest grossing franchises — like
Pokémon or Mario Brothers— have been around for 20 years, or more.
And, some of these iconic franchises are still selling briskly. A recent examination of
the top-selling video games on Amazon.com in March 2019) shows that Pokémon
Sword was the 13th best-selling item, the Sims4 ranked 14th, and Grand Theft Auto
ranked 15th. So, brand recognition — that often leverages IP — clearly matters.
Intellectual Property
Game Developer
(Studio)
Game Publisher
Hardware
Manufacturer
Distributer
Consumer
Description
Owner of IP that is licensed to
publisher
Pitches ideas to publisher
Develops games for publisher
Economics
Share of game sales (may include
minimum payment)
Receives advances from publisher
Receives royalty payments from publisher
“Green lights” game
Sells markets and distributes game
Pays royalties to IP owner (if applicable)
Advances money to developer for game
Makes royalty payments to game developer
Makes royalty payments to HW mfg
Designs and manufactures hardware Receives revenue from hardware sales
Receives royalty payments from publisher
Distributes game in physical stores
Distributes game digitally
Plays game Pays retail price for game
Spend on in-game items after purchase
Pays wholesale price for game
Receives retail price for game
$
$
$
$
$
IP
SW
SW
SW
API
Game
Engine $
SW
eSportsConsumers watch professionals
play video games (in person or
over broadcaster like Twitch)
Players and leagues collect funds from
consumers (donations, subscriptions) game
developers, game publishers, advertisers
and sponsors
$
TAd
Sponsor
$
$
© 2019 Citigroup
13
Figure 4. Number of Franchise Games Generating > $1 Billion (1981-2018)
Source: Wikipiedia, Citi Research
But, how important is third-party intellectual property? Do non-video game brands
— like movies, sporting leagues, or books — propel video game sales? Over the
last 40 years, top franchises — or those that sold over 100 million units — can be
grouped:
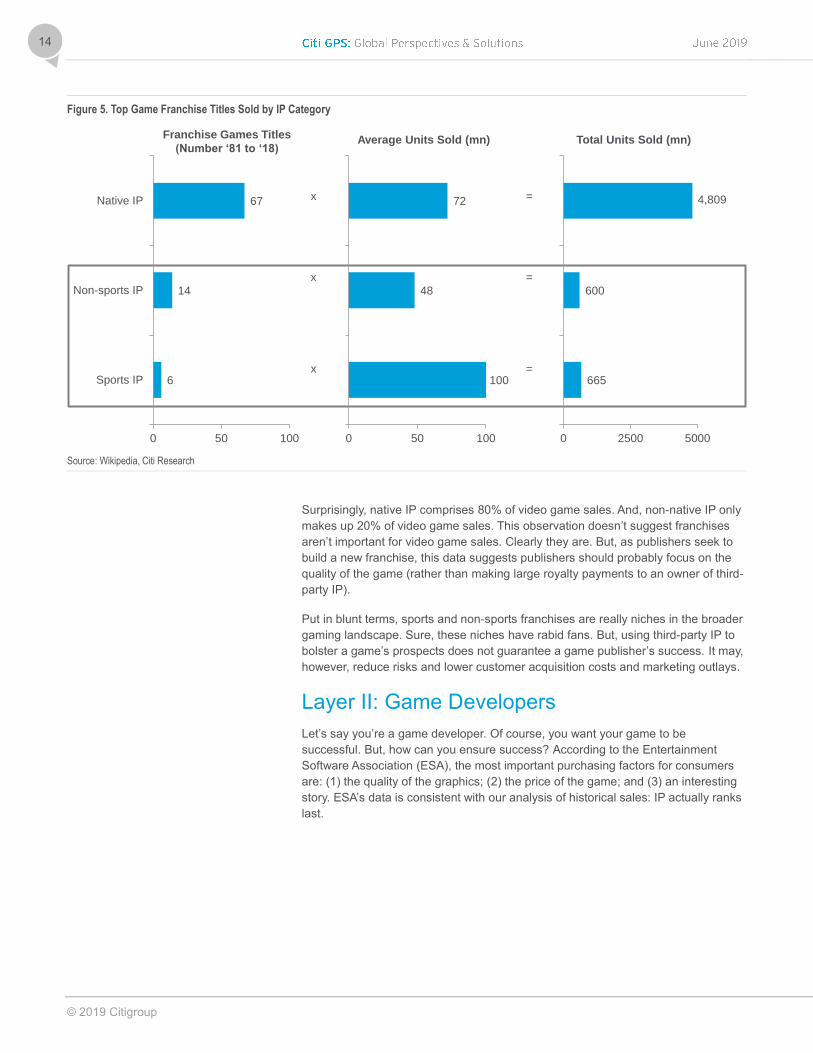
First, some games rely on IP that was developed in-house. Grand Theft Auto,
Pokémon, and Fortnite are all good examples of in-house IP. And, nearly 80% of
the top franchises fall into this category. Since these native IP franchises sell, on
average, 72 million copies, these types of games make up nearly 80% of all
software sales.
Second, some top games rely on IP that’s non-sports based. These games
leverage IP from a variety of sources: physical games (Lego), books (Tom
Clancy), or movies (Star Wars). These games make up only 15% of the top-
selling franchises, but they sell slightly fewer units than a typical top-ranked
franchise (on average just under 50 million units per franchise). As such, this
genre makes up just 10% of total software sales.
Third, some top franchise games rely on sports IP. FIFA and Madden NFL are
good examples. There are six top franchises within this category, or just 7% of
top-selling franchises. But, on average, sports-based games sell more units —
about 100 million units per franchise. As such, sports games make up about 10%
of all software sales.
0
10
20
30
40
50
60
70
80
To
tal F
ran
ch
ise S
ale
s (
$b
n)
Franchise
© 2019 Citigroup
14
Figure 5. Top Game Franchise Titles Sold by IP Category
Source: Wikipedia, Citi Research
Surprisingly, native IP comprises 80% of video game sales. And, non-native IP only
makes up 20% of video game sales. This observation doesn’t suggest franchises
aren’t important for video game sales. Clearly they are. But, as publishers seek to
build a new franchise, this data suggests publishers should probably focus on the
quality of the game (rather than making large royalty payments to an owner of third-
party IP).
Put in blunt terms, sports and non-sports franchises are really niches in the broader
gaming landscape. Sure, these niches have rabid fans. But, using third-party IP to
bolster a game’s prospects does not guarantee a game publisher’s success. It may,
however, reduce risks and lower customer acquisition costs and marketing outlays.
Layer II: Game Developers
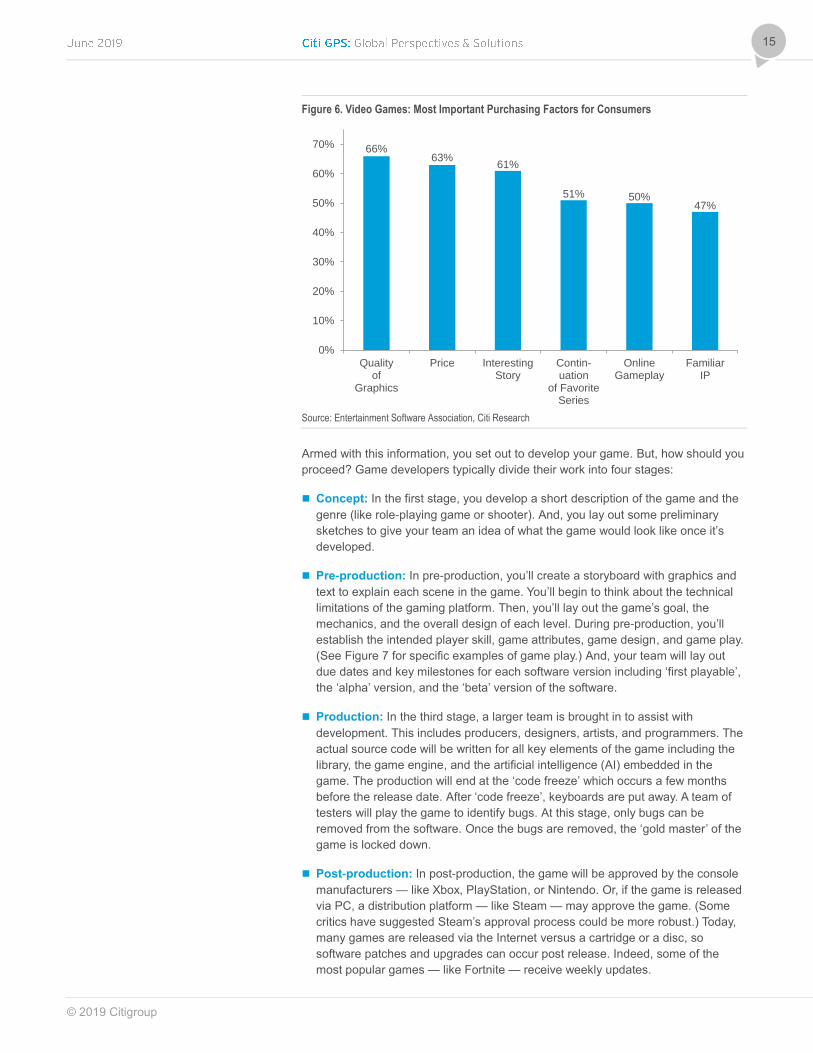
Let’s say you’re a game developer. Of course, you want your game to be
successful. But, how can you ensure success? According to the Entertainment
Software Association (ESA), the most important purchasing factors for consumers
are: (1) the quality of the graphics; (2) the price of the game; and (3) an interesting
story. ESA’s data is consistent with our analysis of historical sales: IP actually ranks
last.
100
48
72
0 50 100
Average Units Sold (mn)
6
14
67
0 50 100
Sports IP
Non-sports IP
Native IP
Franchise Games Titles
(Number ‘81 to ‘18)
665
600
0 2500 5000
4,809
Total Units Sold (mn)
x
x
x
=
=
=
© 2019 Citigroup
15
Figure 6. Video Games: Most Important Purchasing Factors for Consumers
Source: Entertainment Software Association, Citi Research
Armed with this information, you set out to develop your game. But, how should you
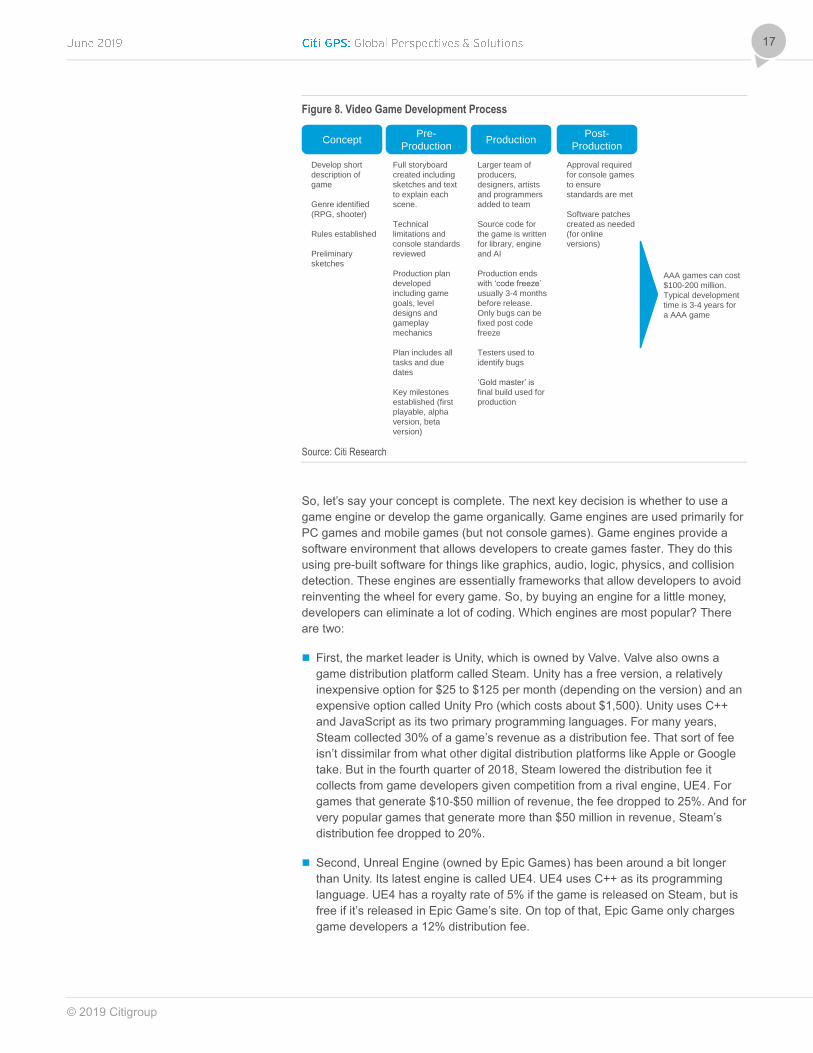
proceed? Game developers typically divide their work into four stages:
Concept: In the first stage, you develop a short description of the game and the
genre (like role-playing game or shooter). And, you lay out some preliminary
sketches to give your team an idea of what the game would look like once it’s
developed.
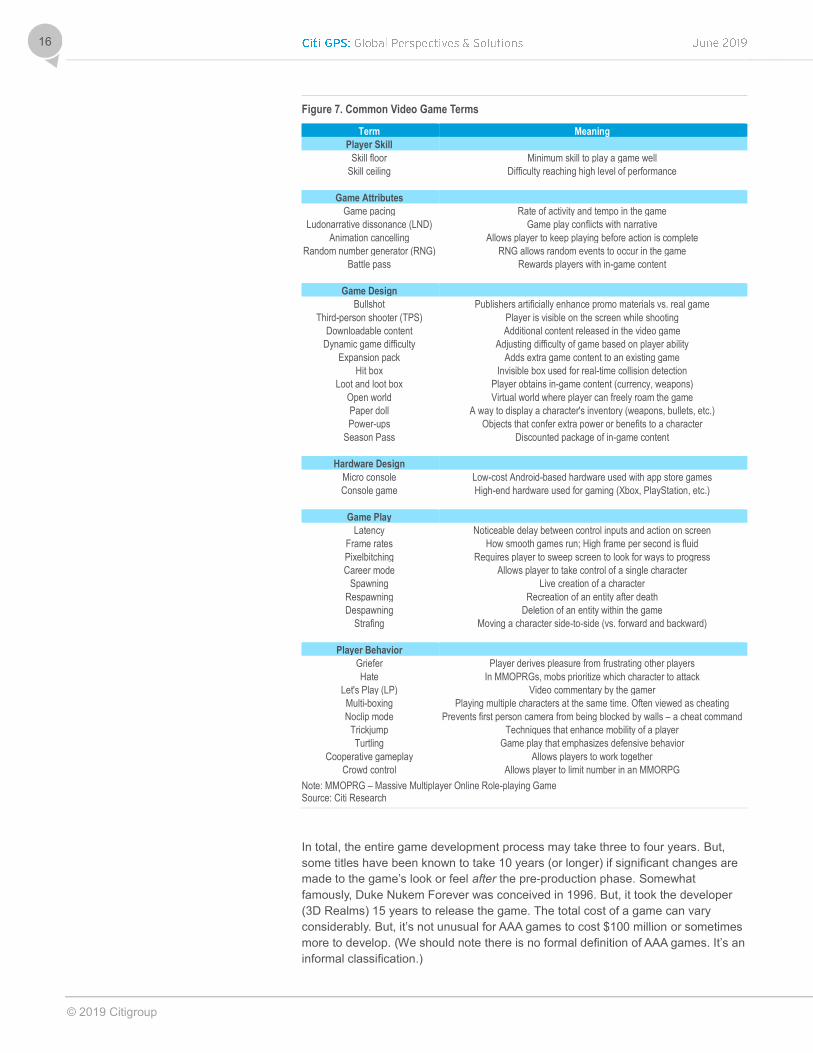
Pre-production: In pre-production, you’ll create a storyboard with graphics and
text to explain each scene in the game. You’ll begin to think about the technical
limitations of the gaming platform. Then, you’ll lay out the game’s goal, the
mechanics, and the overall design of each level. During pre-production, you’ll
establish the intended player skill, game attributes, game design, and game play.
(See Figure 7 for specific examples of game play.) And, your team will lay out
due dates and key milestones for each software version including ‘first playable’,
the ‘alpha’ version, and the ‘beta’ version of the software.
Production: In the third stage, a larger team is brought in to assist with
development. This includes producers, designers, artists, and programmers. The
actual source code will be written for all key elements of the game including the
library, the game engine, and the artificial intelligence (AI) embedded in the
game. The production will end at the ‘code freeze’ which occurs a few months
before the release date. After ‘code freeze’, keyboards are put away. A team of
testers will play the game to identify bugs. At this stage, only bugs can be
removed from the software. Once the bugs are removed, the ‘gold master’ of the
game is locked down.
Post-production: In post-production, the game will be approved by the console
manufacturers — like Xbox, PlayStation, or Nintendo. Or, if the game is released
via PC, a distribution platform — like Steam — may approve the game. (Some
critics have suggested Steam’s approval process could be more robust.) Today,
many games are released via the Internet versus a cartridge or a disc, so
software patches and upgrades can occur post release. Indeed, some of the
most popular games — like Fortnite — receive weekly updates.
66%63%
61%
51% 50%47%
0%
10%
20%
30%
40%
50%
60%
70%
Qualityof
Graphics
Price InterestingStory
Contin-uation
of FavoriteSeries
OnlineGameplay
FamiliarIP
© 2019 Citigroup
16
Figure 7. Common Video Game Terms
Term Meaning
Player Skill
Skill floor Minimum skill to play a game well
Skill ceiling Difficulty reaching high level of performance
Game Attributes
Game pacing Rate of activity and tempo in the game
Ludonarrative dissonance (LND) Game play conflicts with narrative
Animation cancelling Allows player to keep playing before action is complete
Random number generator (RNG) RNG allows random events to occur in the game
Battle pass Rewards players with in-game content
Game Design
Bullshot Publishers artificially enhance promo materials vs. real game
Third-person shooter (TPS) Player is visible on the screen while shooting
Downloadable content Additional content released in the video game
Dynamic game difficulty Adjusting difficulty of game based on player ability
Expansion pack Adds extra game content to an existing game
Hit box Invisible box used for real-time collision detection
Loot and loot box Player obtains in-game content (currency, weapons)
Open world Virtual world where player can freely roam the game
Paper doll A way to display a character's inventory (weapons, bullets, etc.)
Power-ups Objects that confer extra power or benefits to a character
Season Pass Discounted package of in-game content
Hardware Design
Micro console Low-cost Android-based hardware used with app store games
Console game High-end hardware used for gaming (Xbox, PlayStation, etc.)
Game Play
Latency Noticeable delay between control inputs and action on screen
Frame rates How smooth games run; High frame per second is fluid
Pixelbitching Requires player to sweep screen to look for ways to progress
Career mode Allows player to take control of a single character
Spawning Live creation of a character
Respawning Recreation of an entity after death
Despawning Deletion of an entity within the game
Strafing Moving a character side-to-side (vs. forward and backward)
Player Behavior
Griefer Player derives pleasure from frustrating other players
Hate In MMOPRGs, mobs prioritize which character to attack
Let's Play (LP) Video commentary by the gamer
Multi-boxing Playing multiple characters at the same time. Often viewed as cheating
Noclip mode Prevents first person camera from being blocked by walls – a cheat command
Trickjump Techniques that enhance mobility of a player
Turtling Game play that emphasizes defensive behavior
Cooperative gameplay Allows players to work together
Crowd control Allows player to limit number in an MMORPG
Note: MMOPRG – Massive Multiplayer Online Role-playing Game Source: Citi Research
In total, the entire game development process may take three to four years. But,
some titles have been known to take 10 years (or longer) if significant changes are
made to the game’s look or feel after the pre-production phase. Somewhat
famously, Duke Nukem Forever was conceived in 1996. But, it took the developer
(3D Realms) 15 years to release the game. The total cost of a game can vary
considerably. But, it’s not unusual for AAA games to cost $100 million or sometimes
more to develop. (We should note there is no formal definition of AAA games. It’s an
informal classification.)
© 2019 Citigroup
17
Figure 8. Video Game Development Process
Source: Citi Research
So, let’s say your concept is complete. The next key decision is whether to use a
game engine or develop the game organically. Game engines are used primarily for
PC games and mobile games (but not console games). Game engines provide a
software environment that allows developers to create games faster. They do this
using pre-built software for things like graphics, audio, logic, physics, and collision
detection. These engines are essentially frameworks that allow developers to avoid
reinventing the wheel for every game. So, by buying an engine for a little money,
developers can eliminate a lot of coding. Which engines are most popular? There
are two:
First, the market leader is Unity, which is owned by Valve. Valve also owns a
game distribution platform called Steam. Unity has a free version, a relatively
inexpensive option for $25 to $125 per month (depending on the version) and an
expensive option called Unity Pro (which costs about $1,500). Unity uses C++
and JavaScript as its two primary programming languages. For many years,
Steam collected 30% of a game’s revenue as a distribution fee. That sort of fee
isn’t dissimilar from what other digital distribution platforms like Apple or Google
take. But in the fourth quarter of 2018, Steam lowered the distribution fee it
collects from game developers given competition from a rival engine, UE4. For
games that generate $10-$50 million of revenue, the fee dropped to 25%. And for
very popular games that generate more than $50 million in revenue, Steam’s
distribution fee dropped to 20%.
Second, Unreal Engine (owned by Epic Games) has been around a bit longer
than Unity. Its latest engine is called UE4. UE4 uses C++ as its programming
language. UE4 has a royalty rate of 5% if the game is released on Steam, but is
free if it’s released in Epic Game’s site. On top of that, Epic Game only charges
game developers a 12% distribution fee.
ConceptPre-
ProductionProduction
Post-
Production
Develop short
description of
game
Genre identified
(RPG, shooter)
Rules established
Preliminary
sketches
Approval required
for console games
to ensure
standards are met
Software patches
created as needed
(for online
versions)
Full storyboard
created including
sketches and text
to explain each
scene.
Technical
limitations and
console standards
reviewed
Production plan
developed
including game
goals, level
designs and
gameplay
mechanics
Plan includes all
tasks and due
dates
Key milestones
established (first
playable, alpha
version, beta
version)
Larger team of
producers,
designers, artists
and programmers
added to team
Source code for
the game is written
for library, engine
and AI
Production ends
with ‘code freeze’
usually 3-4 months
before release.
Only bugs can be
fixed post code
freeze
Testers used to
identify bugs
‘Gold master’ is
final build used for
production
AAA games can cost
$100-200 million.
Typical development
time is 3-4 years for
a AAA game
© 2019 Citigroup
18
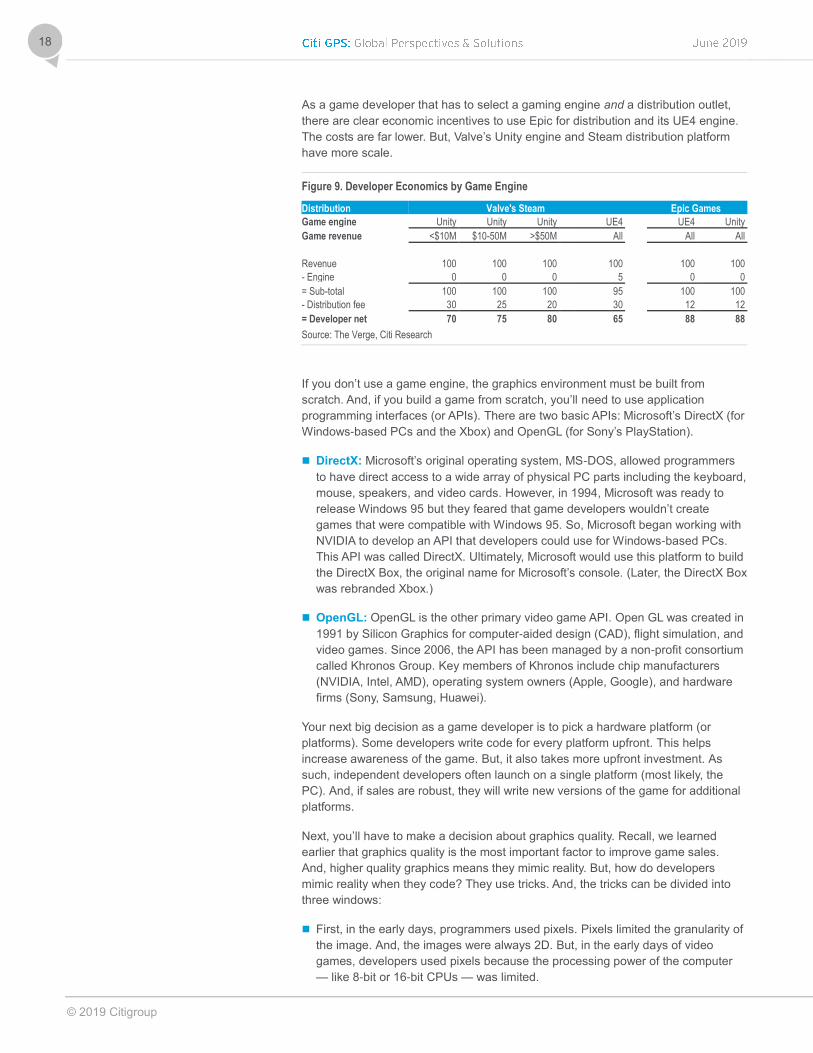
As a game developer that has to select a gaming engine and a distribution outlet,
there are clear economic incentives to use Epic for distribution and its UE4 engine.
The costs are far lower. But, Valve’s Unity engine and Steam distribution platform
have more scale.
Figure 9. Developer Economics by Game Engine
Distribution Valve's Steam Epic Games
Game engine Unity Unity Unity UE4 UE4 Unity
Game revenue <$10M $10-50M >$50M All All All
Revenue 100 100 100 100 100 100
- Engine 0 0 0 5 0 0
= Sub-total 100 100 100 95 100 100
- Distribution fee 30 25 20 30 12 12
= Developer net 70 75 80 65 88 88
Source: The Verge, Citi Research
If you don’t use a game engine, the graphics environment must be built from
scratch. And, if you build a game from scratch, you’ll need to use application
programming interfaces (or APIs). There are two basic APIs: Microsoft’s DirectX (for
Windows-based PCs and the Xbox) and OpenGL (for Sony’s PlayStation).
DirectX: Microsoft’s original operating system, MS-DOS, allowed programmers
to have direct access to a wide array of physical PC parts including the keyboard,
mouse, speakers, and video cards. However, in 1994, Microsoft was ready to
release Windows 95 but they feared that game developers wouldn’t create
games that were compatible with Windows 95. So, Microsoft began working with
NVIDIA to develop an API that developers could use for Windows-based PCs.
This API was called DirectX. Ultimately, Microsoft would use this platform to build
the DirectX Box, the original name for Microsoft’s console. (Later, the DirectX Box
was rebranded Xbox.)
OpenGL: OpenGL is the other primary video game API. Open GL was created in
1991 by Silicon Graphics for computer-aided design (CAD), flight simulation, and
video games. Since 2006, the API has been managed by a non-profit consortium
called Khronos Group. Key members of Khronos include chip manufacturers
(NVIDIA, Intel, AMD), operating system owners (Apple, Google), and hardware
firms (Sony, Samsung, Huawei).
Your next big decision as a game developer is to pick a hardware platform (or
platforms). Some developers write code for every platform upfront. This helps
increase awareness of the game. But, it also takes more upfront investment. As
such, independent developers often launch on a single platform (most likely, the
PC). And, if sales are robust, they will write new versions of the game for additional
platforms.
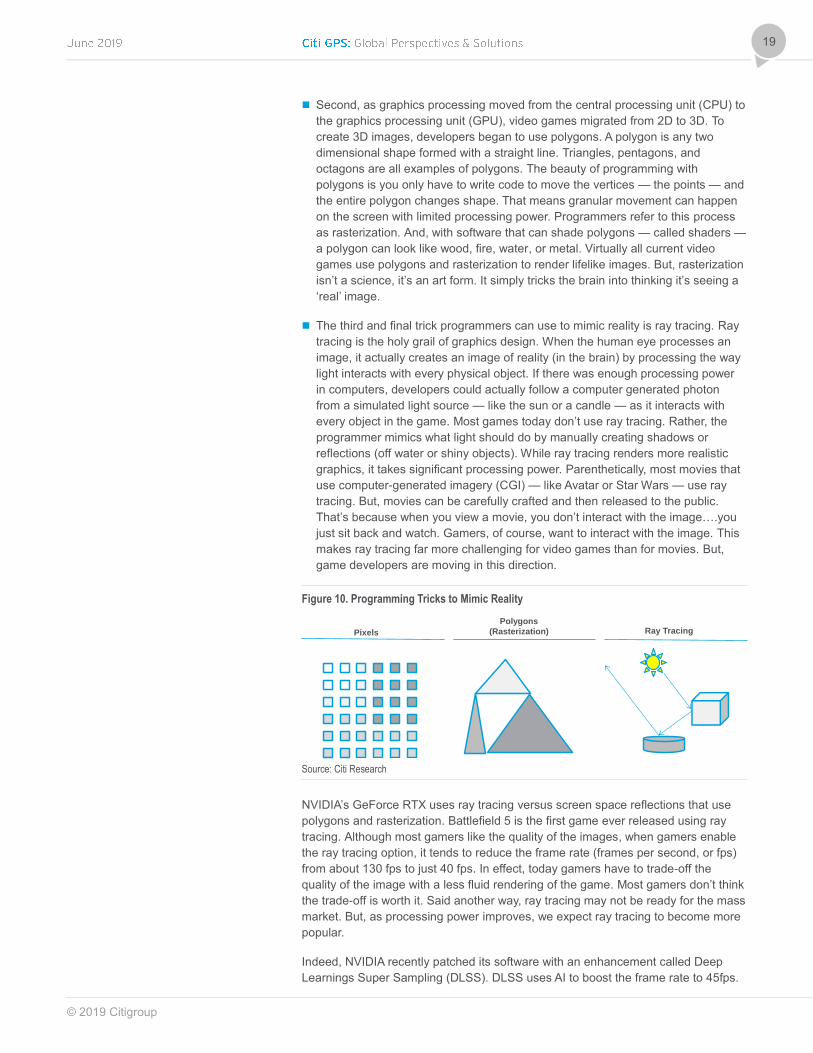
Next, you’ll have to make a decision about graphics quality. Recall, we learned
earlier that graphics quality is the most important factor to improve game sales.
And, higher quality graphics means they mimic reality. But, how do developers
mimic reality when they code? They use tricks. And, the tricks can be divided into
three windows:
First, in the early days, programmers used pixels. Pixels limited the granularity of
the image. And, the images were always 2D. But, in the early days of video
games, developers used pixels because the processing power of the computer
— like 8-bit or 16-bit CPUs — was limited.
© 2019 Citigroup
19
Second, as graphics processing moved from the central processing unit (CPU) to
the graphics processing unit (GPU), video games migrated from 2D to 3D. To
create 3D images, developers began to use polygons. A polygon is any two
dimensional shape formed with a straight line. Triangles, pentagons, and
octagons are all examples of polygons. The beauty of programming with
polygons is you only have to write code to move the vertices — the points — and
the entire polygon changes shape. That means granular movement can happen
on the screen with limited processing power. Programmers refer to this process
as rasterization. And, with software that can shade polygons — called shaders —
a polygon can look like wood, fire, water, or metal. Virtually all current video
games use polygons and rasterization to render lifelike images. But, rasterization
isn’t a science, it’s an art form. It simply tricks the brain into thinking it’s seeing a
‘real’ image.
The third and final trick programmers can use to mimic reality is ray tracing. Ray
tracing is the holy grail of graphics design. When the human eye processes an
image, it actually creates an image of reality (in the brain) by processing the way
light interacts with every physical object. If there was enough processing power
in computers, developers could actually follow a computer generated photon
from a simulated light source — like the sun or a candle — as it interacts with
every object in the game. Most games today don’t use ray tracing. Rather, the
programmer mimics what light should do by manually creating shadows or
reflections (off water or shiny objects). While ray tracing renders more realistic
graphics, it takes significant processing power. Parenthetically, most movies that
use computer-generated imagery (CGI) — like Avatar or Star Wars — use ray
tracing. But, movies can be carefully crafted and then released to the public.
That’s because when you view a movie, you don’t interact with the image….you
just sit back and watch. Gamers, of course, want to interact with the image. This
makes ray tracing far more challenging for video games than for movies. But,
game developers are moving in this direction.
Figure 10. Programming Tricks to Mimic Reality
Source: Citi Research
NVIDIA’s GeForce RTX uses ray tracing versus screen space reflections that use
polygons and rasterization. Battlefield 5 is the first game ever released using ray
tracing. Although most gamers like the quality of the images, when gamers enable
the ray tracing option, it tends to reduce the frame rate (frames per second, or fps)
from about 130 fps to just 40 fps. In effect, today gamers have to trade-off the
quality of the image with a less fluid rendering of the game. Most gamers don’t think
the trade-off is worth it. Said another way, ray tracing may not be ready for the mass
market. But, as processing power improves, we expect ray tracing to become more
popular.
Indeed, NVIDIA recently patched its software with an enhancement called Deep
Learnings Super Sampling (DLSS). DLSS uses AI to boost the frame rate to 45fps.
Pixels
Polygons
(Rasterization) Ray Tracing
© 2019 Citigroup
20
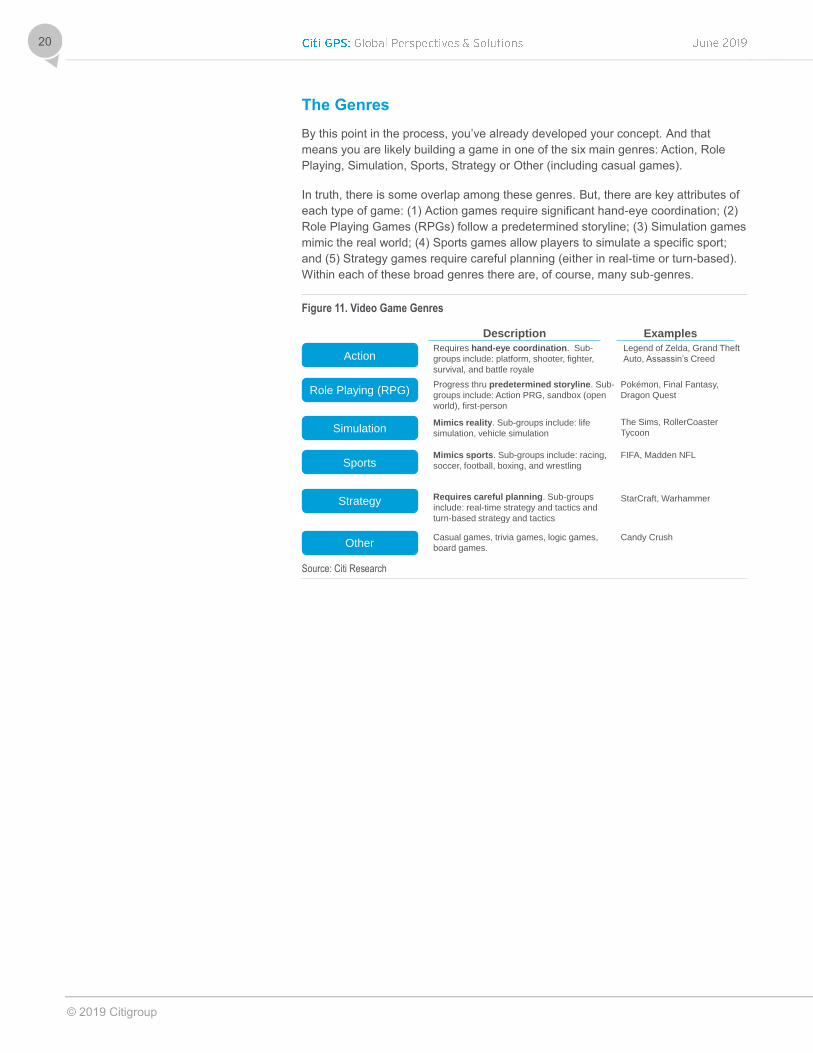
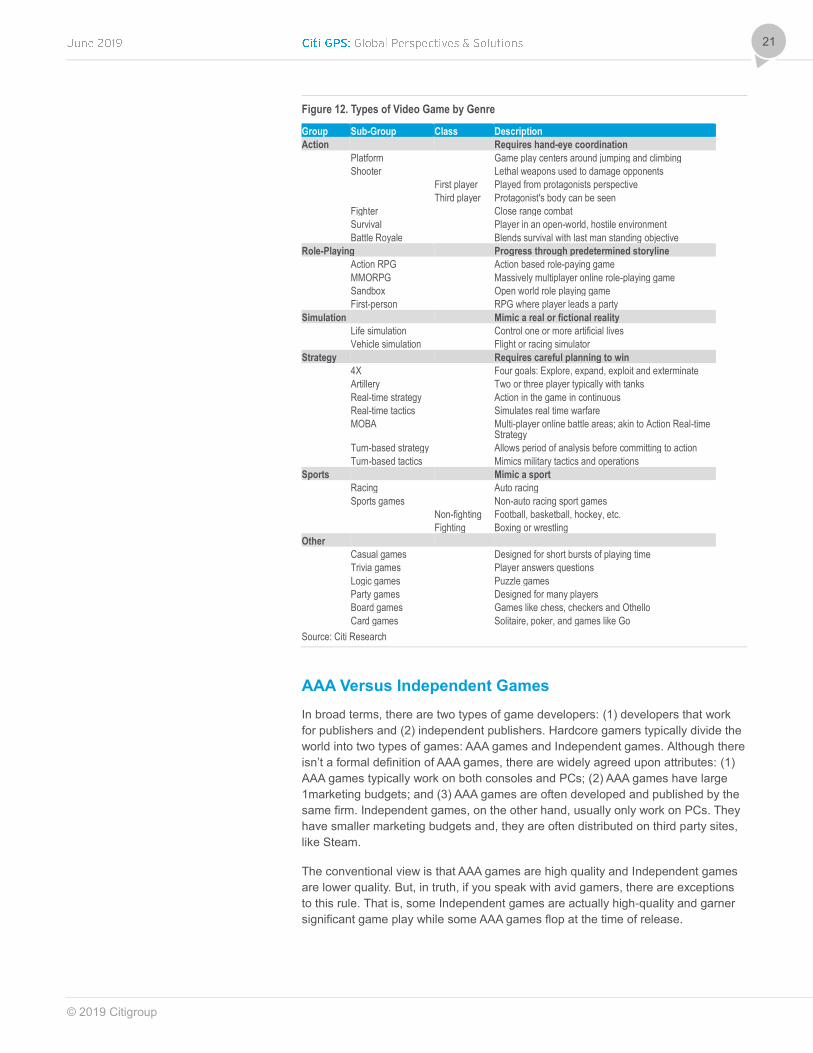
The Genres
By this point in the process, you’ve already developed your concept. And that
means you are likely building a game in one of the six main genres: Action, Role
Playing, Simulation, Sports, Strategy or Other (including casual games).
In truth, there is some overlap among these genres. But, there are key attributes of
each type of game: (1) Action games require significant hand-eye coordination; (2)
Role Playing Games (RPGs) follow a predetermined storyline; (3) Simulation games
mimic the real world; (4) Sports games allow players to simulate a specific sport;
and (5) Strategy games require careful planning (either in real-time or turn-based).
Within each of these broad genres there are, of course, many sub-genres.
Figure 11. Video Game Genres
Source: Citi Research
Action
Role Playing (RPG)
Simulation
Sports
Strategy
Other
Requires hand-eye coordination. Sub-
groups include: platform, shooter, fighter,
survival, and battle royale
Progress thru predetermined storyline. Sub-
groups include: Action PRG, sandbox (open
world), first-person
Mimics reality. Sub-groups include: life
simulation, vehicle simulation
Mimics sports. Sub-groups include: racing,
soccer, football, boxing, and wrestling
Requires careful planning. Sub-groups
include: real-time strategy and tactics and
turn-based strategy and tactics
Casual games, trivia games, logic games,
board games.
Description Examples
Pokémon, Final Fantasy,
Dragon Quest
FIFA, Madden NFL
Candy Crush
Legend of Zelda, Grand Theft
Auto, Assassin’s Creed
The Sims, RollerCoaster
Tycoon
StarCraft, Warhammer
© 2019 Citigroup
21
Figure 12. Types of Video Game by Genre
Group Sub-Group Class Description
Action Requires hand-eye coordination
Platform Game play centers around jumping and climbing
Shooter Lethal weapons used to damage opponents
First player Played from protagonists perspective
Third player Protagonist's body can be seen
Fighter Close range combat
Survival Player in an open-world, hostile environment
Battle Royale Blends survival with last man standing objective
Role-Playing Progress through predetermined storyline
Action RPG Action based role-paying game
MMORPG Massively multiplayer online role-playing game
Sandbox Open world role playing game
First-person RPG where player leads a party
Simulation Mimic a real or fictional reality
Life simulation Control one or more artificial lives
Vehicle simulation Flight or racing simulator
Strategy Requires careful planning to win
4X Four goals: Explore, expand, exploit and exterminate
Artillery Two or three player typically with tanks
Real-time strategy Action in the game in continuous
Real-time tactics Simulates real time warfare
MOBA Multi-player online battle areas; akin to Action Real-time Strategy
Turn-based strategy Allows period of analysis before committing to action
Turn-based tactics Mimics military tactics and operations
Sports Mimic a sport
Racing Auto racing
Sports games Non-auto racing sport games
Non-fighting Football, basketball, hockey, etc.
Fighting Boxing or wrestling
Other
Casual games Designed for short bursts of playing time
Trivia games Player answers questions
Logic games Puzzle games
Party games Designed for many players
Board games Games like chess, checkers and Othello
Card games Solitaire, poker, and games like Go
Source: Citi Research
AAA Versus Independent Games
In broad terms, there are two types of game developers: (1) developers that work
for publishers and (2) independent publishers. Hardcore gamers typically divide the
world into two types of games: AAA games and Independent games. Although there
isn’t a formal definition of AAA games, there are widely agreed upon attributes: (1)
AAA games typically work on both consoles and PCs; (2) AAA games have large
1marketing budgets; and (3) AAA games are often developed and published by the
same firm. Independent games, on the other hand, usually only work on PCs. They
have smaller marketing budgets and, they are often distributed on third party sites,
like Steam.
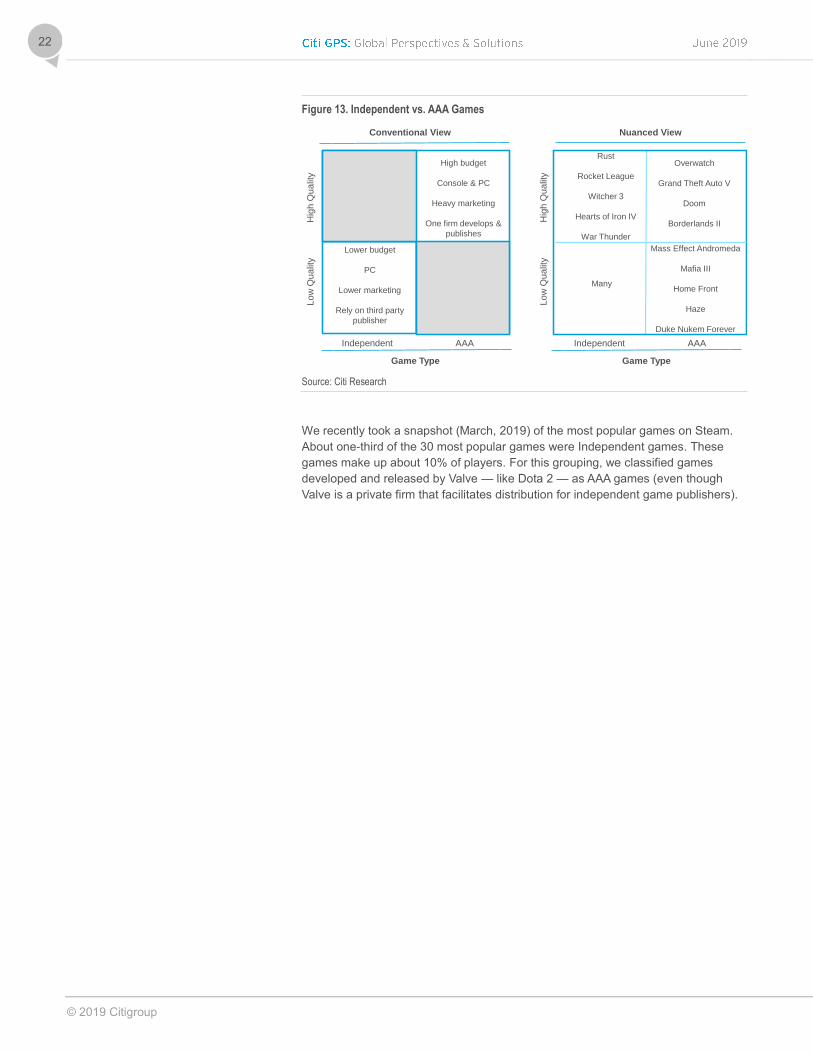
The conventional view is that AAA games are high quality and Independent games
are lower quality. But, in truth, if you speak with avid gamers, there are exceptions
to this rule. That is, some Independent games are actually high-quality and garner
significant game play while some AAA games flop at the time of release.
© 2019 Citigroup
22
Figure 13. Independent vs. AAA Games
Source: Citi Research
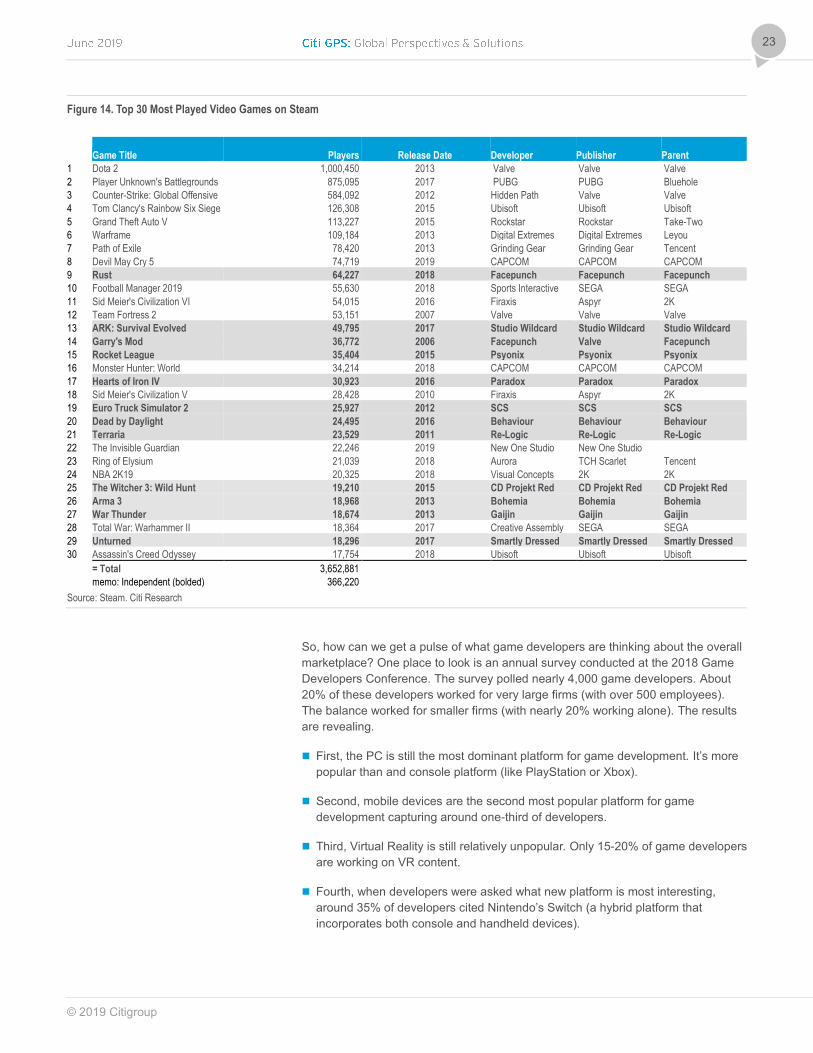
We recently took a snapshot (March, 2019) of the most popular games on Steam.
About one-third of the 30 most popular games were Independent games. These
games make up about 10% of players. For this grouping, we classified games
developed and released by Valve — like Dota 2 — as AAA games (even though
Valve is a private firm that facilitates distribution for independent game publishers).
Conventional View Nuanced View
Independent AAA
Hig
h Q
ua
lity
Lo
w Q
ua
lity
High budget
Console & PC
Heavy marketing
One firm develops &
publishes
Lower budget
PC
Lower marketing
Rely on third party
publisher
Independent AAA
Hig
h Q
ua
lity
Lo
w Q
ua
lity
Game Type Game Type
Rust
Rocket League
Witcher 3
Hearts of Iron IV
War Thunder
Mass Effect Andromeda
Mafia III
Home Front
Haze
Duke Nukem Forever
Overwatch
Grand Theft Auto V
Doom
Borderlands II
Many
© 2019 Citigroup
23
Figure 14. Top 30 Most Played Video Games on Steam
Game Title Players
Release Date Developer Publisher Parent
1 Dota 2 1,000,450 2013 Valve Valve Valve
2 Player Unknown's Battlegrounds 875,095 2017 PUBG PUBG Bluehole
3 Counter-Strike: Global Offensive 584,092 2012 Hidden Path Valve Valve
4 Tom Clancy's Rainbow Six Siege 126,308 2015 Ubisoft Ubisoft Ubisoft
5 Grand Theft Auto V 113,227 2015 Rockstar Rockstar Take-Two
6 Warframe 109,184 2013 Digital Extremes Digital Extremes Leyou
7 Path of Exile 78,420 2013 Grinding Gear Grinding Gear Tencent
8 Devil May Cry 5 74,719 2019 CAPCOM CAPCOM CAPCOM
9 Rust 64,227 2018 Facepunch Facepunch Facepunch
10 Football Manager 2019 55,630 2018 Sports Interactive SEGA SEGA
11 Sid Meier's Civilization VI 54,015 2016 Firaxis Aspyr 2K
12 Team Fortress 2 53,151 2007 Valve Valve Valve
13 ARK: Survival Evolved 49,795 2017 Studio Wildcard Studio Wildcard Studio Wildcard
14 Garry's Mod 36,772 2006 Facepunch Valve Facepunch
15 Rocket League 35,404 2015 Psyonix Psyonix Psyonix
16 Monster Hunter: World 34,214 2018 CAPCOM CAPCOM CAPCOM
17 Hearts of Iron IV 30,923 2016 Paradox Paradox Paradox
18 Sid Meier's Civilization V 28,428 2010 Firaxis Aspyr 2K
19 Euro Truck Simulator 2 25,927 2012 SCS SCS SCS
20 Dead by Daylight 24,495 2016 Behaviour Behaviour Behaviour
21 Terraria 23,529 2011 Re-Logic Re-Logic Re-Logic
22 The Invisible Guardian 22,246 2019 New One Studio New One Studio
23 Ring of Elysium 21,039 2018 Aurora TCH Scarlet Tencent
24 NBA 2K19 20,325 2018 Visual Concepts 2K 2K
25 The Witcher 3: Wild Hunt 19,210 2015 CD Projekt Red CD Projekt Red CD Projekt Red
26 Arma 3 18,968 2013 Bohemia Bohemia Bohemia
27 War Thunder 18,674 2013 Gaijin Gaijin Gaijin
28 Total War: Warhammer II 18,364 2017 Creative Assembly SEGA SEGA
29 Unturned 18,296 2017 Smartly Dressed Smartly Dressed Smartly Dressed
30 Assassin's Creed Odyssey 17,754 2018 Ubisoft Ubisoft Ubisoft
= Total 3,652,881
memo: Independent (bolded) 366,220
Source: Steam. Citi Research
So, how can we get a pulse of what game developers are thinking about the overall
marketplace? One place to look is an annual survey conducted at the 2018 Game
Developers Conference. The survey polled nearly 4,000 game developers. About
20% of these developers worked for very large firms (with over 500 employees).
The balance worked for smaller firms (with nearly 20% working alone). The results
are revealing.
First, the PC is still the most dominant platform for game development. It’s more
popular than and console platform (like PlayStation or Xbox).
Second, mobile devices are the second most popular platform for game
development capturing around one-third of developers.
Third, Virtual Reality is still relatively unpopular. Only 15-20% of game developers
are working on VR content.
Fourth, when developers were asked what new platform is most interesting,
around 35% of developers cited Nintendo’s Switch (a hybrid platform that
incorporates both console and handheld devices).
© 2019 Citigroup
24
Figure 15. Platform of Last Completed Game vs. Current Gamed Development
Source: 2018 Game Developers Conference, Citi Research
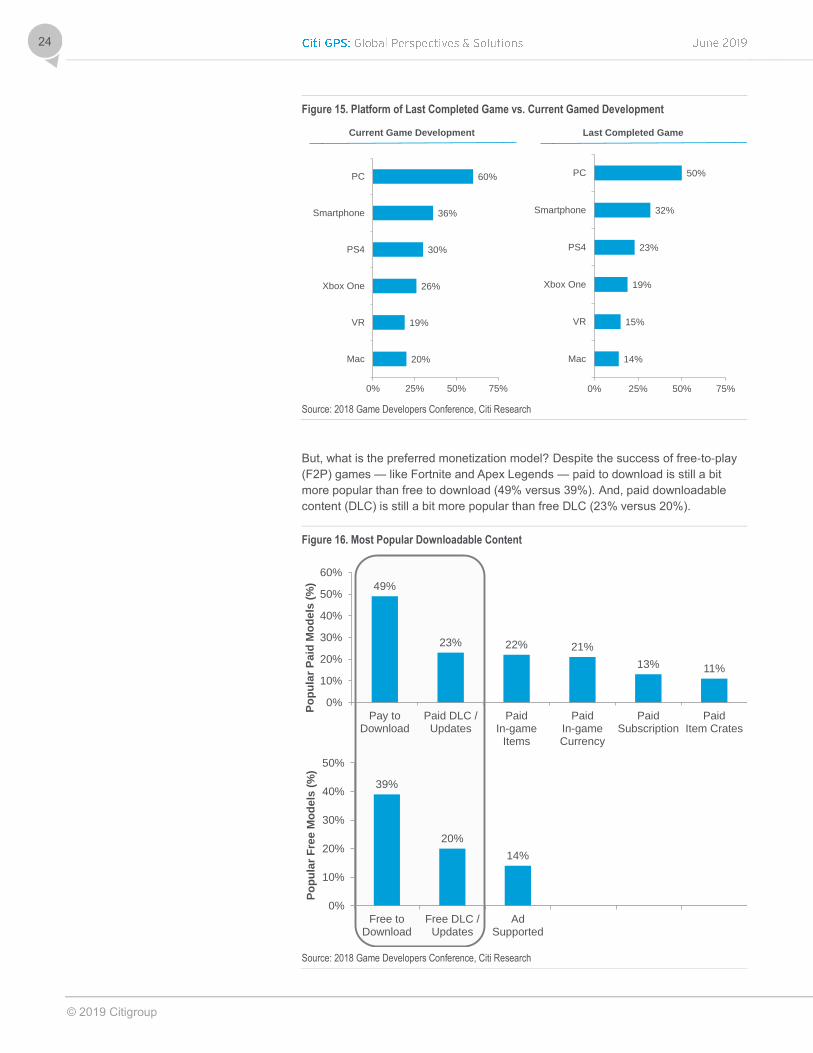
But, what is the preferred monetization model? Despite the success of free-to-play
(F2P) games — like Fortnite and Apex Legends — paid to download is still a bit
more popular than free to download (49% versus 39%). And, paid downloadable
content (DLC) is still a bit more popular than free DLC (23% versus 20%).
Figure 16. Most Popular Downloadable Content
Source: 2018 Game Developers Conference, Citi Research
20%
19%
26%
30%
36%
60%
0% 25% 50% 75%
Mac
VR
Xbox One
PS4
Smartphone
PC
14%
15%
19%
23%
32%
50%
0% 25% 50% 75%
Mac
VR
Xbox One
PS4
Smartphone
PC
Current Game Development Last Completed Game
39%
20%
14%
0%
10%
20%
30%
40%
50%
Free toDownload
Free DLC /Updates
AdSupported
Po
pu
lar
Fre
e M
od
els
(%
)
49%
23% 22% 21%
13% 11%
0%
10%
20%
30%
40%
50%
60%
Pay toDownload
Paid DLC /Updates
PaidIn-game
Items
PaidIn-gameCurrency
PaidSubscription
PaidItem Crates
Po
pu
lar
Pa
id M
od
els
(%
)
© 2019 Citigroup
25
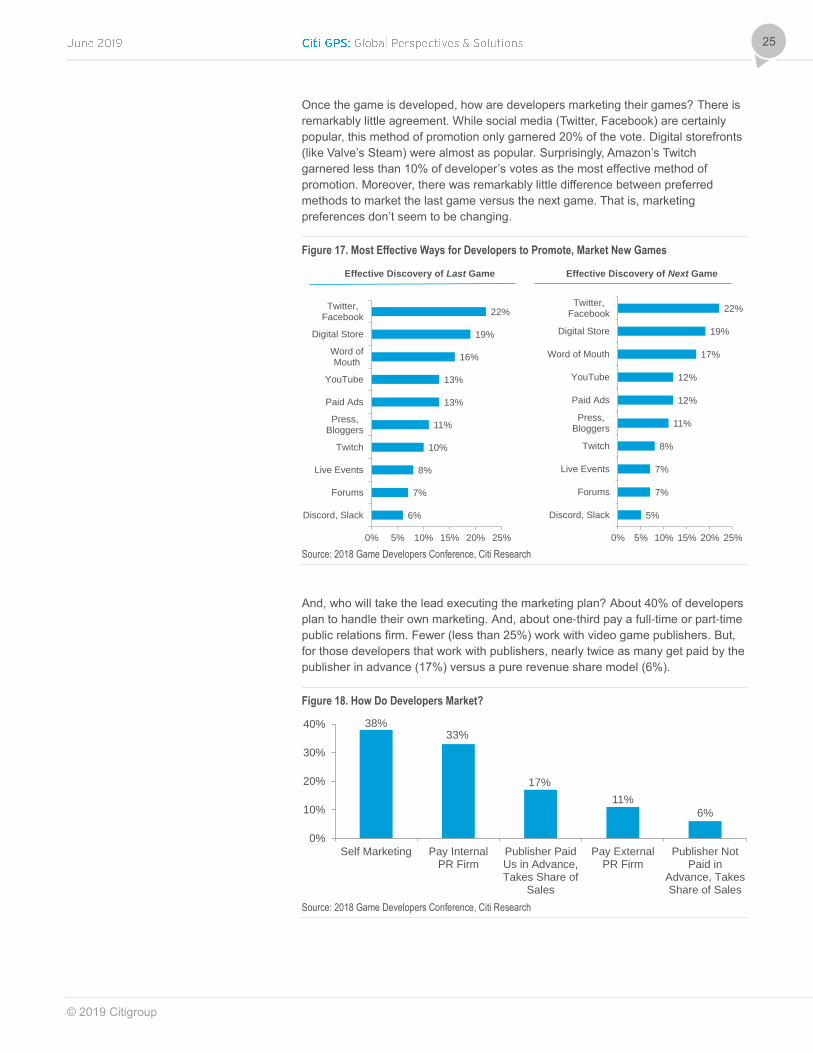
Once the game is developed, how are developers marketing their games? There is
remarkably little agreement. While social media (Twitter, Facebook) are certainly
popular, this method of promotion only garnered 20% of the vote. Digital storefronts
(like Valve’s Steam) were almost as popular. Surprisingly, Amazon’s Twitch
garnered less than 10% of developer’s votes as the most effective method of
promotion. Moreover, there was remarkably little difference between preferred
methods to market the last game versus the next game. That is, marketing
preferences don’t seem to be changing.
Figure 17. Most Effective Ways for Developers to Promote, Market New Games
Source: 2018 Game Developers Conference, Citi Research
And, who will take the lead executing the marketing plan? About 40% of developers
plan to handle their own marketing. And, about one-third pay a full-time or part-time
public relations firm. Fewer (less than 25%) work with video game publishers. But,
for those developers that work with publishers, nearly twice as many get paid by the
publisher in advance (17%) versus a pure revenue share model (6%).
Figure 18. How Do Developers Market?
Source: 2018 Game Developers Conference, Citi Research
6%
7%
8%
10%
11%
13%
13%
16%
19%
22%
0% 5% 10% 15% 20% 25%
Discord, Slack
Forums
Live Events
Twitch
Press,Bloggers
Paid Ads
YouTube
Word ofMouth
Digital Store
Twitter,Facebook
5%
7%
7%
8%
11%
12%
12%
17%
19%
22%
0% 5% 10% 15% 20% 25%
Discord, Slack
Forums
Live Events
Twitch
Press,Bloggers
Paid Ads
YouTube
Word of Mouth
Digital Store
Twitter,Facebook
Effective Discovery of Last Game Effective Discovery of Next Game
38%33%
17%
11%
6%
0%
10%
20%
30%
40%
Self Marketing Pay InternalPR Firm
Publisher PaidUs in Advance,Takes Share of
Sales
Pay ExternalPR Firm
Publisher NotPaid in
Advance, TakesShare of Sales
© 2019 Citigroup
26
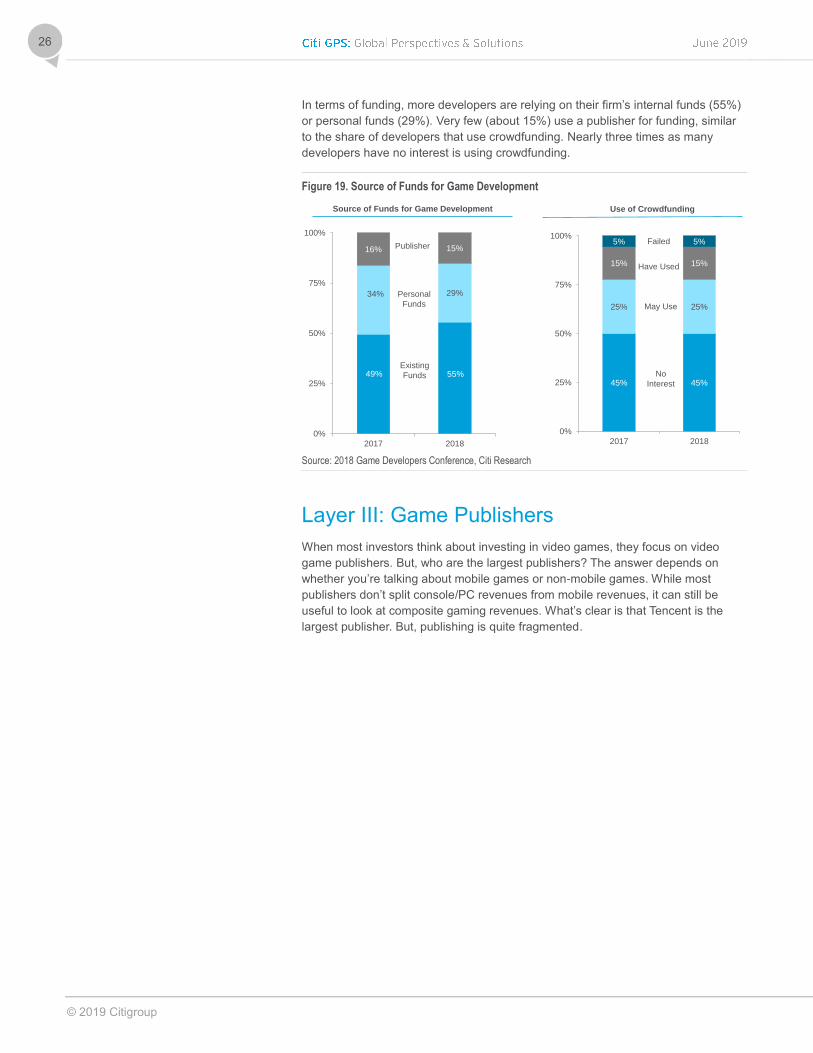
In terms of funding, more developers are relying on their firm’s internal funds (55%)
or personal funds (29%). Very few (about 15%) use a publisher for funding, similar
to the share of developers that use crowdfunding. Nearly three times as many
developers have no interest is using crowdfunding.
Figure 19. Source of Funds for Game Development
Source: 2018 Game Developers Conference, Citi Research
Layer III: Game Publishers
When most investors think about investing in video games, they focus on video
game publishers. But, who are the largest publishers? The answer depends on
whether you’re talking about mobile games or non-mobile games. While most
publishers don’t split console/PC revenues from mobile revenues, it can still be
useful to look at composite gaming revenues. What’s clear is that Tencent is the
largest publisher. But, publishing is quite fragmented.
49% 55%
34% 29%
16% 15%
0%
25%
50%
75%
100%
2017 2018
45% 45%
25% 25%
15% 15%
5% 5%
0%
25%
50%
75%
100%
2017 2018
Existing
Funds
Personal
Funds
Publisher
No
Interest
May Use
Have Used
Failed
Source of Funds for Game Development Use of Crowdfunding
© 2019 Citigroup
27
Figure 20. Largest Video Game Publishers – Global Console/PC/Mobile Revenue
Company Region Listing 2010 2011 2012 2013 2014 2015 2016 2017 2018E
Tencent China Public 1,812 2,260 3,264 4,318 7,236 9,238 11,926 16,847 18,343
+ Microsoft* U.S. Public 2,612 2,744 2,490 2,321 2,806 4,038 5,626 6,333 8,988
+ Activision U.S. Public 4,802 4,489 4,987 4,341 4,813 4,620 6,599 7,156 7,262
+ NetEase China Public 1,375 1,566 1,706 1,915 2,065 2,473 3,997 5,183 5,742
+ Electronic Arts U.S. Public 4,159 3,828 4,186 3,793 4,021 4,319 4,566 4,942 5,180
+ Nintendo Japan Public 3,316 2,352 2,395 2,013 1,820 1,493 1,541 2,993 3,968
+ Epic U.S. Private 200 250 300 350 450 540 636 2,400 3,800
+ Sony Japan Public 761 1,349 1,168 1,543 1,592 1,689 2,081 2,986 3,608
+ Take-Two U.S. Public 1,127 872 1,090 2,503 1,057 1,475 1,776 2,160 2,880
+ Bandai Namco Japan Public 1,162 1,512 1,728 1,529 1,536 1,661 2,170 2,688 2,824
+ Nexon Japan Public 1,122 1,155 1,313 1,541 1,559 1,571 1,678 2,103 2,272
+ Ubisoft EU Public 1,193 1,455 1,379 1,645 1,259 1,684 1,603 1,723 1,923
+ Square Enix Japan Public 749 909 1,076 943 1,017 1,323 1,834 1,725 1,844
+ Netmarble Korea Public 185 245 326 486 528 912 1,244 2,272 1,819
+ NCSoft Korea Public 583 529 709 721 769 326 816 1,647 1,544
+ Aristocrat Australia Public 31 56 122 216 351 617 852 1,100 1,339
+ Konami Japan Public 415 486 553 604 509 773 750 885 1,073
+ Sanqi China Public - - - - - - 655 798 1,033
+ PUBG Corp (Krafton Game Union) Korea Private - - - - 4 1 1 253 944
+ Zynga U.S. Public 166 298 358 429 515 618 741 861 907
= Top 20 publishers 25,770 26,355 29,149 31,210 33,906 39,372 51,092 67,054 77,291
+ Other 25,381 30,892 31,716 31,790 34,711 33,554 29,671 24,954 24,079
= Global PC, console and mobile 51,151 57,247 60,865 63,000 68,617 72,926 80,762 92,008 101,371
Note: Microsoft includes Xbox licensing revenue Source: Citi Research
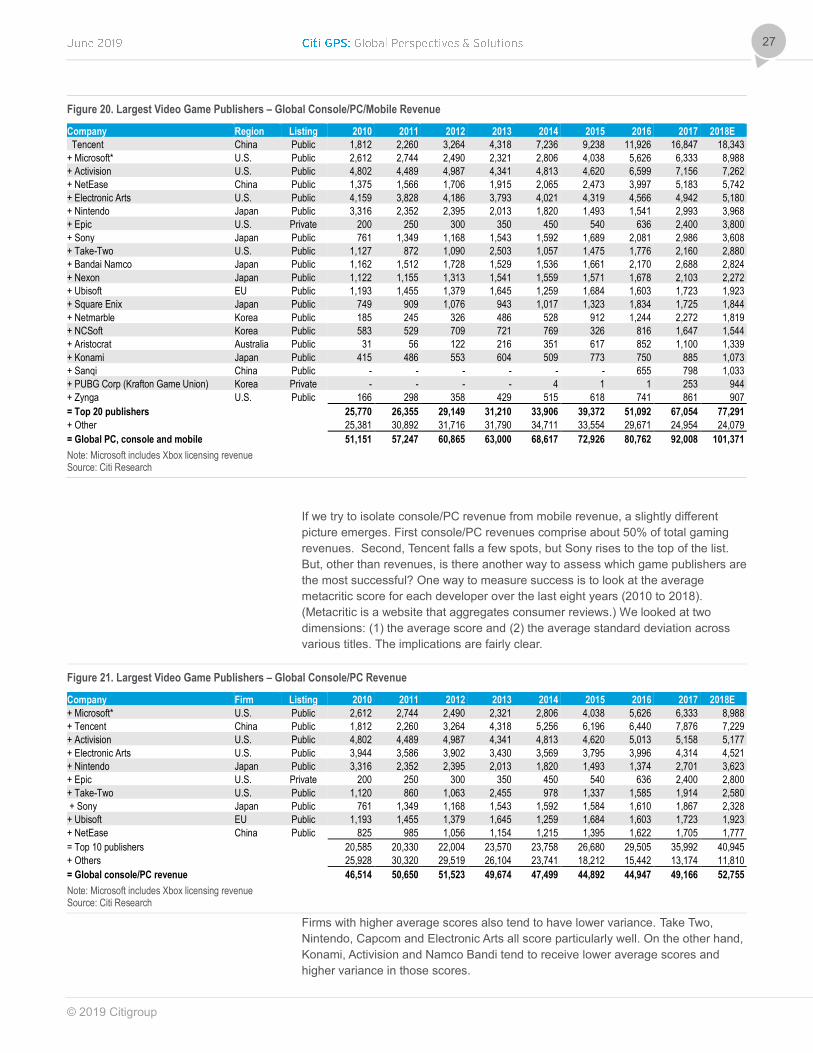
If we try to isolate console/PC revenue from mobile revenue, a slightly different
picture emerges. First console/PC revenues comprise about 50% of total gaming
revenues. Second, Tencent falls a few spots, but Sony rises to the top of the list.
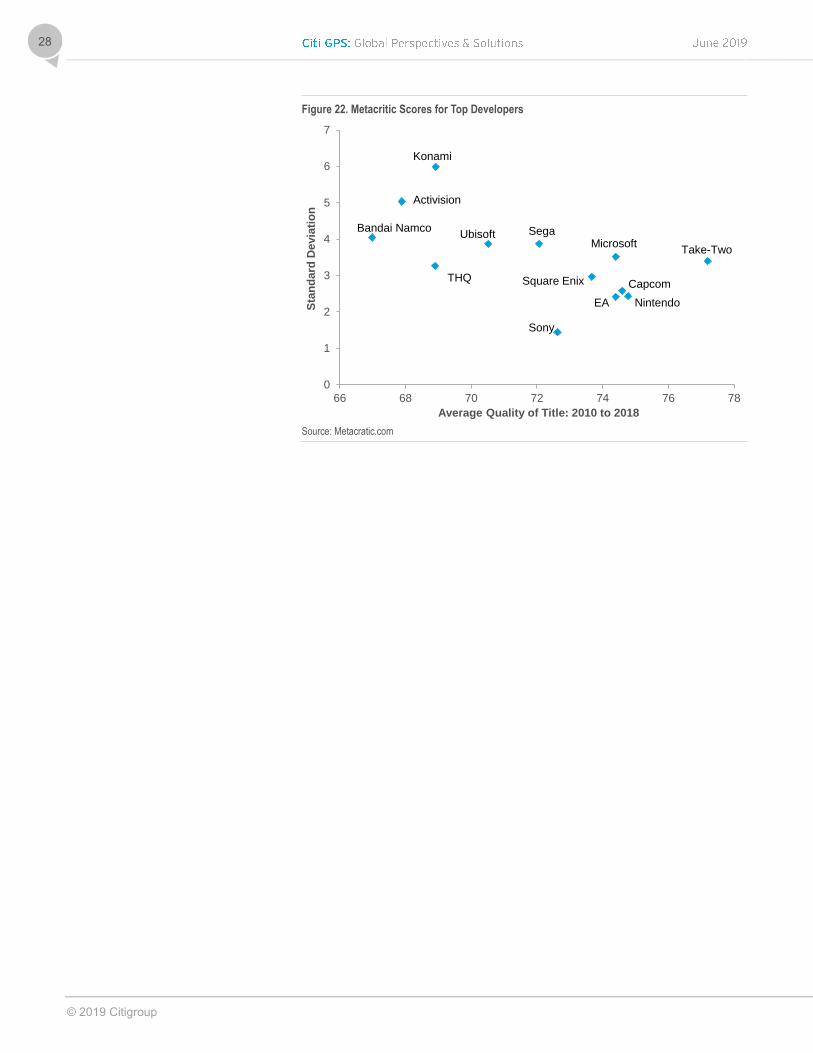
But, other than revenues, is there another way to assess which game publishers are
the most successful? One way to measure success is to look at the average
metacritic score for each developer over the last eight years (2010 to 2018).
(Metacritic is a website that aggregates consumer reviews.) We looked at two
dimensions: (1) the average score and (2) the average standard deviation across
various titles. The implications are fairly clear.
Figure 21. Largest Video Game Publishers – Global Console/PC Revenue
Company Firm Listing 2010 2011 2012 2013 2014 2015 2016 2017 2018E
+ Microsoft* U.S. Public 2,612 2,744 2,490 2,321 2,806 4,038 5,626 6,333 8,988
+ Tencent China Public 1,812 2,260 3,264 4,318 5,256 6,196 6,440 7,876 7,229
+ Activision U.S. Public 4,802 4,489 4,987 4,341 4,813 4,620 5,013 5,158 5,177
+ Electronic Arts U.S. Public 3,944 3,586 3,902 3,430 3,569 3,795 3,996 4,314 4,521
+ Nintendo Japan Public 3,316 2,352 2,395 2,013 1,820 1,493 1,374 2,701 3,623
+ Epic U.S. Private 200 250 300 350 450 540 636 2,400 2,800
+ Take-Two U.S. Public 1,120 860 1,063 2,455 978 1,337 1,585 1,914 2,580
+ Sony Japan Public 761 1,349 1,168 1,543 1,592 1,584 1,610 1,867 2,328
+ Ubisoft EU Public 1,193 1,455 1,379 1,645 1,259 1,684 1,603 1,723 1,923
+ NetEase China Public 825 985 1,056 1,154 1,215 1,395 1,622 1,705 1,777
= Top 10 publishers 20,585 20,330 22,004 23,570 23,758 26,680 29,505 35,992 40,945
+ Others 25,928 30,320 29,519 26,104 23,741 18,212 15,442 13,174 11,810
= Global console/PC revenue 46,514 50,650 51,523 49,674 47,499 44,892 44,947 49,166 52,755
Note: Microsoft includes Xbox licensing revenue Source: Citi Research
Firms with higher average scores also tend to have lower variance. Take Two,
Nintendo, Capcom and Electronic Arts all score particularly well. On the other hand,
Konami, Activision and Namco Bandi tend to receive lower average scores and
higher variance in those scores.
© 2019 Citigroup
28
Figure 22. Metacritic Scores for Top Developers
Source: Metacratic.com
0
1
2
3
4
5
6
7
66 68 70 72 74 76 78
Sta
nd
ard
De
via
tio
n
Average Quality of Title: 2010 to 2018
Take-Two
Nintendo
Capcom
EA
Microsoft
Square Enix
Sony
SegaUbisoft
THQ
Konami
Activision
Bandai Namco
© 2019 Citigroup
29
Layer IV: Hardware
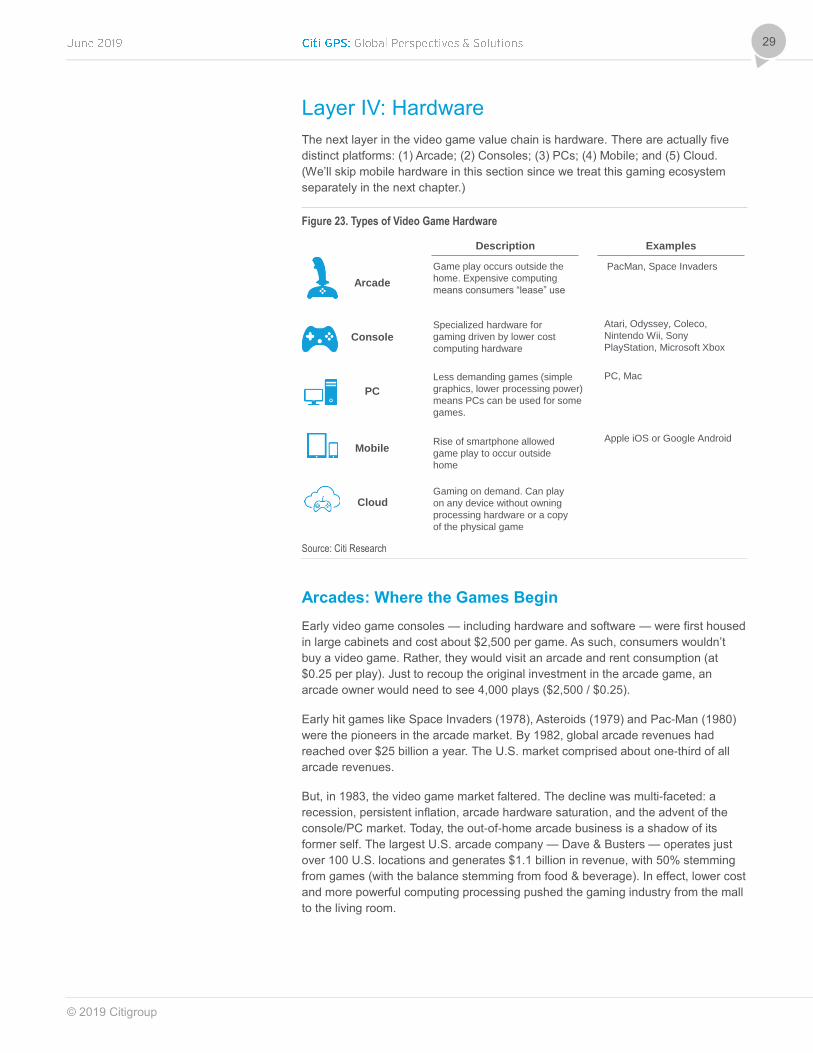
The next layer in the video game value chain is hardware. There are actually five
distinct platforms: (1) Arcade; (2) Consoles; (3) PCs; (4) Mobile; and (5) Cloud.
(We’ll skip mobile hardware in this section since we treat this gaming ecosystem
separately in the next chapter.)
Figure 23. Types of Video Game Hardware
Source: Citi Research
Arcades: Where the Games Begin
Early video game consoles — including hardware and software — were first housed
in large cabinets and cost about $2,500 per game. As such, consumers wouldn’t
buy a video game. Rather, they would visit an arcade and rent consumption (at
$0.25 per play). Just to recoup the original investment in the arcade game, an
arcade owner would need to see 4,000 plays ($2,500 / $0.25).
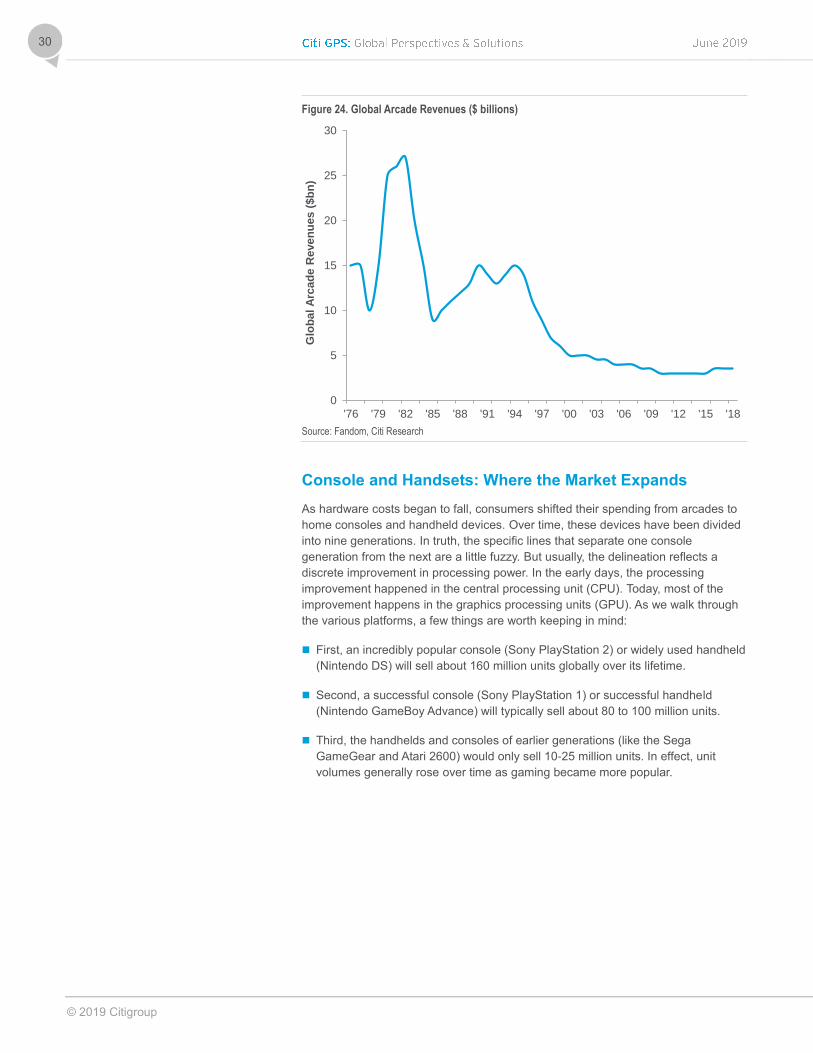
Early hit games like Space Invaders (1978), Asteroids (1979) and Pac-Man (1980)
were the pioneers in the arcade market. By 1982, global arcade revenues had
reached over $25 billion a year. The U.S. market comprised about one-third of all
arcade revenues.
But, in 1983, the video game market faltered. The decline was multi-faceted: a
recession, persistent inflation, arcade hardware saturation, and the advent of the
console/PC market. Today, the out-of-home arcade business is a shadow of its
former self. The largest U.S. arcade company — Dave & Busters — operates just
over 100 U.S. locations and generates $1.1 billion in revenue, with 50% stemming
from games (with the balance stemming from food & beverage). In effect, lower cost
and more powerful computing processing pushed the gaming industry from the mall
to the living room.
Arcade
Console
Cloud
PC
Mobile
Description Examples
Game play occurs outside the
home. Expensive computing
means consumers “lease” use
PacMan, Space Invaders
Specialized hardware for
gaming driven by lower cost
computing hardware
Atari, Odyssey, Coleco,
Nintendo Wii, Sony
PlayStation, Microsoft Xbox
Less demanding games (simple
graphics, lower processing power)
means PCs can be used for some
games.
PC, Mac
Rise of smartphone allowed
game play to occur outside
home
Gaming on demand. Can play
on any device without owning
processing hardware or a copy
of the physical game
Apple iOS or Google Android
© 2019 Citigroup
30
Figure 24. Global Arcade Revenues ($ billions)
Source: Fandom, Citi Research
Console and Handsets: Where the Market Expands
As hardware costs began to fall, consumers shifted their spending from arcades to
home consoles and handheld devices. Over time, these devices have been divided
into nine generations. In truth, the specific lines that separate one console
generation from the next are a little fuzzy. But usually, the delineation reflects a
discrete improvement in processing power. In the early days, the processing
improvement happened in the central processing unit (CPU). Today, most of the
improvement happens in the graphics processing units (GPU). As we walk through
the various platforms, a few things are worth keeping in mind:
First, an incredibly popular console (Sony PlayStation 2) or widely used handheld
(Nintendo DS) will sell about 160 million units globally over its lifetime.
Second, a successful console (Sony PlayStation 1) or successful handheld
(Nintendo GameBoy Advance) will typically sell about 80 to 100 million units.
Third, the handhelds and consoles of earlier generations (like the Sega
GameGear and Atari 2600) would only sell 10-25 million units. In effect, unit
volumes generally rose over time as gaming became more popular.
0
5
10
15
20
25
30
'76 '79 '82 '85 '88 '91 '94 '97 '00 '03 '06 '09 '12 '15 '18
Glo
ba
l A
rca
de
Re
ve
nu
es
($
bn
)

© 2019 Citigroup
31
Figure 25. Unit Sales of Consoles and Handheld Devices
Source: The Video Game Textbook, Citi Research
If we focus on consoles (but exclude handhelds for a moment), five important trends
are important:
First, in the 1st and 2nd generation, the console manufacturers were comprised
of four main firms: Atari, Magnavox, Mattel and Coleco. Only one of these firms
— Atari — would survive to the 4th generation.
Second, between the 3rd and 6th generation, three firms battled for dominance:
Atari, Nintendo and Sega. But, only one of these firms — Nintendo — would
survive to the 7th generation. Both Atari and Sega dropped out.
Third, during the 5th generation, Sony entered the market. And, two cycles later
(7th generation), Microsoft entered the market. During the 7th and 8th
generation, three firms competed for share: Nintendo (the stalwart), Sony, and
Microsoft.
Fourth, between the 1st and 7th generation, global console sales improved. Only
in the most recent generation — the 8th generation — have console sales
faltered. We suspect this is due, in part, to the rise of mobile gaming (which we’ll
review in more detail a bit later).s
Fifth, as we look at winners and losers within each generation, there isn’t a hard
and fast rule for who takes the most market share. While we ran many
regressions to crack the code for console sales, there doesn’t seem to be a clear
set of variables that drive market share in each generation.
0
20
40
60
80
100
120
140
160
180
Un
its
So
ld (
mn
)
Console
Handheld

© 2019 Citigroup
32
Figure 26. Console Unit Sales Sold by Generation
Source: The Video Game Textbook, Citi Research
Handheld Market
So far, we’ve focused on the console market. But, beginning in 1988 a new market
developed: the handheld gaming market. With the exception of a few short periods
(’90 to ’94) and (’04 to ’07), the console market sold more units than the handheld
market. More recently, we’ve seen the entrance of hybrid devices that serve the
console and handheld market with a single device (the 9th Generation Nintendo
Switch).
Figure 27. Console, Handheld & Hybrid Units Sold
Source: The Video Game Textbook, Citi Research
0
20
40
60
80
100
120
'76 '78 '80 '82 '84 '86 '88 '90 '92 '94 '96 '98 '00 '02 '04 '06 '08 '10 '12 '14 '16 '18
Co
ns
ole
Un
its
So
ld (
mn
)
Atari
Magnavox
Mattel
Coleco
Sega
Nintendo
Sony
Microsoft
Console Generation
In total, nearly 1
billion video game
consoles have
been sold.
Each generation
of improved
graphics with
richer colors,
faster processing
and improved
sound.
2nd 3rd 4th 5th 6th 7th 8th
0
10
20
30
40
50
60
70
'76 '80 '84 '88 '92 '96 '00 '04 '08 '12 '16
Co
nso
le &
Han
dh
eld
Un
its S
old
(m
n)
Console
Hybrid
(Console +
Handheld)
Handheld

© 2019 Citigroup
33
If we look at the various firms that sold handhelds, it’s quite different than the
console market. Since handhelds hit the market long after Atari, Magnavox, Mattel,
and Coleco exited gaming, there are far fewer handheld players. Moreover,
Microsoft has never rolled out a handheld device. As such, today, there is only one
firm that sells handhelds — Nintendo — and, it’s a hybrid device.
Figure 28. Handheld Units Solid by Generation
Source: The Video Game Textbook, Citi Research
If we look at handheld market shares, there are a few important observations. First,
Nintendo is the clear market leader with about 20 million units sold in 2018. Second,
Sega exited the market back in the late 1990s. Third, Sony’s latest entry (the
PlayStation Vita) will cease production in 2019. As such, in 2020, Nintendo will be
the only firm selling handheld devices.
Figure 29. Handheld Units Sold by Manufacturer
Source: The Video Game Textbook, Citi Research
0
10
20
30
40
50
60
'76 '78 '80 '82 '84 '86 '88 '90 '92 '94 '96 '98 '00 '02 '04 '06 '08 '10 '12 '14 '16 '18
Ha
nd
he
ld U
nit
s S
old
(m
n)
Sega
Nintendo
Sony
Handheld Generation
In total, nearly 575
million video game
consoles have
been sold.
Each generation
of improved
graphics with
richer colors,
faster processing
and improved
sound.
2nd 3rd 4th 5th 6th 7th 8th
0
5
10
15
20
25
30
35
40
'76 '78 '80 '82 '84 '86 '88 '90 '92 '94 '96 '98 '00 '02 '04 '06 '08 '10 '12 '14 '16 '18
Ha
nd
he
ld U
nit
s S
old
(m
n)
Nintendo
Sony
Sega
In total, nearly
575 million
handheld video
game devices
have been sold.
Nintendo is the
market leader,
followed by Sony.
© 2019 Citigroup
34
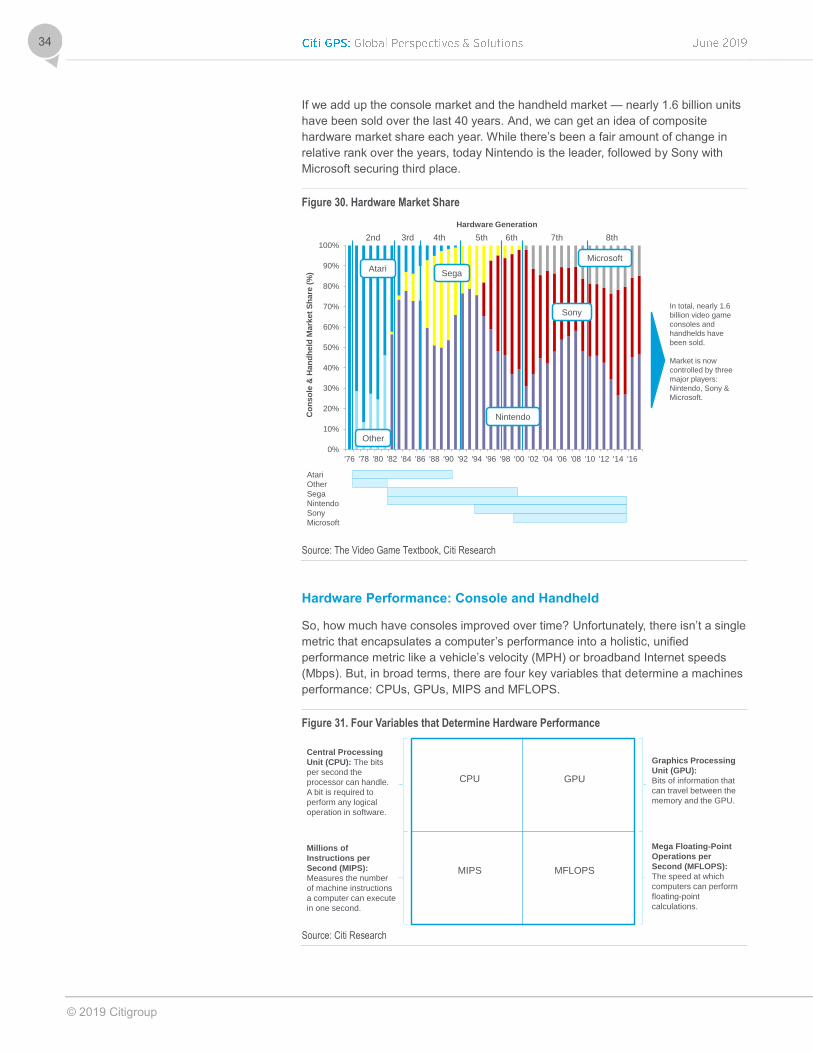
If we add up the console market and the handheld market — nearly 1.6 billion units
have been sold over the last 40 years. And, we can get an idea of composite
hardware market share each year. While there’s been a fair amount of change in
relative rank over the years, today Nintendo is the leader, followed by Sony with
Microsoft securing third place.
Figure 30. Hardware Market Share
Source: The Video Game Textbook, Citi Research
Hardware Performance: Console and Handheld
So, how much have consoles improved over time? Unfortunately, there isn’t a single
metric that encapsulates a computer’s performance into a holistic, unified
performance metric like a vehicle’s velocity (MPH) or broadband Internet speeds
(Mbps). But, in broad terms, there are four key variables that determine a machines
performance: CPUs, GPUs, MIPS and MFLOPS.
Figure 31. Four Variables that Determine Hardware Performance
Source: Citi Research
0%
10%
20%
30%
40%
50%
60%
70%
80%
90%
100%
'76 '78 '80 '82 '84 '86 '88 '90 '92 '94 '96 '98 '00 '02 '04 '06 '08 '10 '12 '14 '16
Co
nso
le &
Han
dh
eld
Mark
et
Sh
are
(%
)
Hardware Generation
In total, nearly 1.6
billion video game
consoles and
handhelds have
been sold.
Market is now
controlled by three
major players:
Nintendo, Sony &
Microsoft.
2nd 3rd 4th 5th 6th 7th 8th
Atari
Other
Sega
Nintendo
Sony
Microsoft
Nintendo
Sony
Sega
Microsoft
Atari
Other
CPU GPU
MIPS MFLOPS
Central Processing
Unit (CPU): The bits
per second the
processor can handle.
A bit is required to
perform any logical
operation in software.
Millions of
Instructions per
Second (MIPS):
Measures the number
of machine instructions
a computer can execute
in one second.
Graphics Processing
Unit (GPU):
Bits of information that
can travel between the
memory and the GPU.
Mega Floating-Point
Operations per
Second (MFLOPS):
The speed at which
computers can perform
floating-point
calculations.
© 2019 Citigroup
35
Let’s start with CPU. The CPU measures the number of bits the processor can
handle. Early consoles had 8 bit processors but as the consoles moved into the 6th
generation, the CPUs improved to 128 bit processors. However, in the 7th
generation consoles, hardware firms scaled back CPU capacity and began to use
other levers to enhance machine performance. Indeed, the Microsoft Xbox
(released in 2001) as a 7th generation console only had a 32-bit CPU. (And,
parenthetically, the iPhone 6 only uses 64-bit CPUs.)
Figure 32. CPU Units Sold by Console Generation
Source: The Video Game Textbook, Citi Research
So, how did hardware firms improve performance as we moved beyond 6th
generation consoles? They turned from the CPU — the brains of the computer — to
the graphics processing unit, or GPU. GPUs are often called the ‘heart of the
console’ because it’s the chip that handles graphics.
While CPUs retrenched for a while, GPUs — the number of bits that can travel
between the console’s memory and the GPU — generally improved. GPUs peaked
at 256 bits. And, unlike CPUs, GPUs generally improved as hardware firm moved
from 6th generation to the 7th generation consoles.
0
50
100
150
200
250
300
'76 '78 '80 '82 '84 '86 '88 '90 '92 '94 '96 '98 '00 '02 '04 '06 '08 '10 '12 '14 '16 '18
CP
U (
nu
mb
er)
Atari
Magnavox
Mattel
Coleco
Sega
Nintendo
Sony
Microsoft
Console Generation
CPUs improved
between 2nd
Generations and
6th Generation.
Then, hardware
began to use
other ways to
improve
performance.
2nd 3rd 4th 5th 6th 7th 8th

© 2019 Citigroup
36
Figure 33. GPU Units Sold by Console Generation
Source: Forbes, Citi Research
Beyond CPUs and GPUs, there is one other way to measure a console’s
performance: the number of instructions a machine can perform per second. This is
often abbreviated with the acronym MIPS or ‘millions of instructions per second’.
The first console with its own processor — the Fairchild Channel F — could only
process 0.14 MIPS. Current consoles can process 200K MIPS. In effect, the PS4 is
akin to running 1.4 million Channel F’s.
0
50
100
150
200
250
300
'76 '78 '80 '82 '84 '86 '88 '90 '92 '94 '96 '98 '00 '02 '04 '06 '08 '10 '12 '14 '16 '18
GP
U (
nu
mb
er)
Atari
Magnavox
Mattel
Coleco
Sega
Nintendo
Sony
Microsoft
Console Generation
GPUs improved
between 3nd
Generations and
7th Generation.
Then, it peaked at
256 bits per
second.
2nd 3rd 4th 5th 6th 7th 8th

© 2019 Citigroup
37
Figure 34. MIPS by Console Generation
Source: Forbes, Citi Research
The final metric used to measure a console’s performance is MFLOPS, or mega
floating-point operations per second. But, what are floating points? Since software
engineers deal with limited memory, they cannot store numbers with infinite
precision. At some point, they truncate the number. The easiest way to accomplish
this is to convert all numbers into scientific notation (for example 123 = 1.23 x10²).
This means there are no fixed numbers before — or after — the decimal point.
Instead, it just floats based on how you decide to represent the number in scientific
notation. Floating point representations are less accurate than fixed point
representations. But, floating point representations can handle a larger range of
numbers.
If we look at the improvement in MFLOPS, it didn’t show up as a positive figure until
1982 when the Sega Model 1 could handle 80 MFLOPS. But, the Sony PS4 can
handle 1,843,200 MFLOPS. That’s an improvement of 23,000x.
0
50,000
100,000
150,000
200,000
250,000
'76 '78 '80 '82 '84 '86 '88 '90 '92 '94 '96 '98 '00 '02 '04 '06 '08 '10 '12 '14 '16 '18
MIP
S (
mn
)
Atari
Magnavox
Mattel
Coleco
Sega
Nintendo
Sony
Microsoft
Console Generation
Millions of
instructions per
second – or MIPS
– have
dramatically
improved over the
last 40 years.
2nd 3rd 4th 5th 6th 7th 8th

© 2019 Citigroup
38
Figure 35. MFLOPS by Console Generation
`
Source: Forbes, Citi Research
PC Market
So far, we’ve spent all of our time on arcades, consoles, and the handheld market.
But, this isn’t to suggest that some gaming doesn’t occur on PCs. Indeed, on a
global basis the PC market comprises about 50% of (non-mobile) software sales.
PC gamers tend to fall into two groups: low-end gamers and very high-end gamers.
First, at the low-end, these PC players engage with casual games, strategy
games, and role-playing games (RPG). They don’t often play sports, action, or
shooter games. Those types of games are typically played by the segment that
uses consoles.
Second, at the high-end, there are some gamers that don’t find off-the-shelf
hardware — from Sony, Microsoft and Nintendo — robust enough. This small
segment will purchase robust (and often expensive) gaming rigs that have extra
performance and often have clever brand names like ‘Alienware ‘.
Figure 36. Some Game Genres Require Console Processing
Sports Action Shooter Other RPG Strategy Casual Total
Console 13% 23% 25% 23% 12% 4% 1% 63%
/ PC 0% 4% 6% 9% 19% 36% 26% 70%
= Ratio 66.0x 5.6x 3.9x 2.7x 0.6x 0.1x 0.0x
Source: NPD 2016
PC hardware volumes — including PCs for businesses — vastly outpace console
and handset sales each year. Indeed, in 2018, there were about 5x more PCs sold
than gaming hardware devices — like consoles and handhelds.
0
200,000
400,000
600,000
800,000
1,000,000
1,200,000
1,400,000
1,600,000
1,800,000
2,000,000
'76 '78 '80 '82 '84 '86 '88 '90 '92 '94 '96 '98 '00 '02 '04 '06 '08 '10 '12 '14 '16 '18
MF
LO
PS
(n
um
be
r)
Atari
Magnavox
Mattel
Coleco
Sega
Nintendo
Sony
Microsoft
Console Generation
Floating point
calculations were
not introduced
until 7th
Generation
consoles.
2nd 3rd 4th 5th 6th 7th 8th
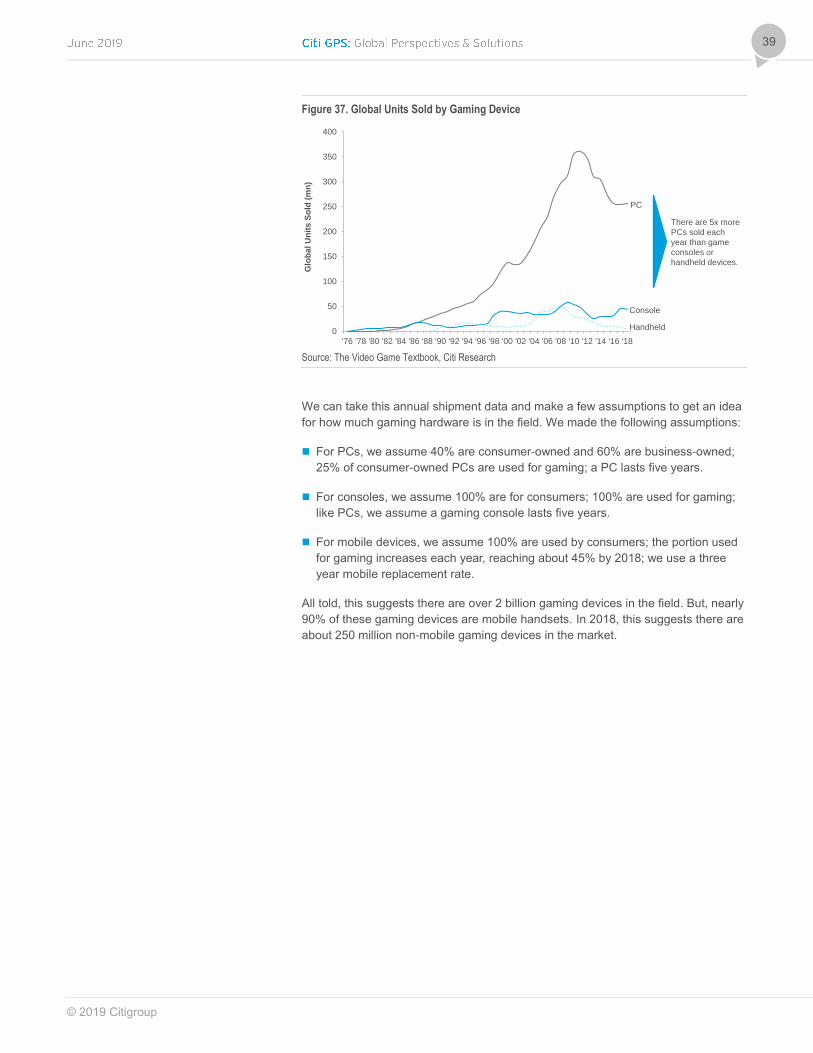
© 2019 Citigroup
39
Figure 37. Global Units Sold by Gaming Device
Source: The Video Game Textbook, Citi Research
We can take this annual shipment data and make a few assumptions to get an idea
for how much gaming hardware is in the field. We made the following assumptions:
For PCs, we assume 40% are consumer-owned and 60% are business-owned;
25% of consumer-owned PCs are used for gaming; a PC lasts five years.
For consoles, we assume 100% are for consumers; 100% are used for gaming;
like PCs, we assume a gaming console lasts five years.
For mobile devices, we assume 100% are used by consumers; the portion used
for gaming increases each year, reaching about 45% by 2018; we use a three
year mobile replacement rate.
All told, this suggests there are over 2 billion gaming devices in the field. But, nearly
90% of these gaming devices are mobile handsets. In 2018, this suggests there are
about 250 million non-mobile gaming devices in the market.
0
50
100
150
200
250
300
350
400
'76 '78 '80 '82 '84 '86 '88 '90 '92 '94 '96 '98 '00 '02 '04 '06 '08 '10 '12 '14 '16 '18
Glo
ba
l U
nit
s S
old
(m
n)
There are 5x more
PCs sold each
year than game
consoles or
handheld devices.
PC
Console
Handheld
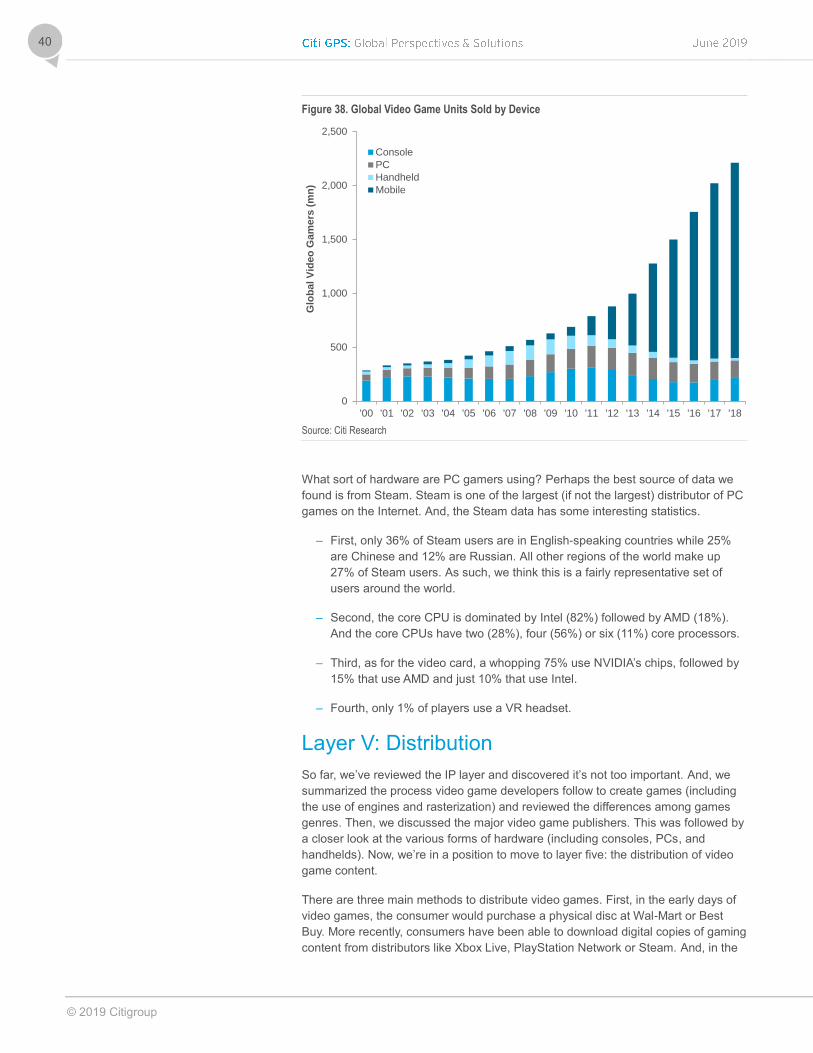
© 2019 Citigroup
40
Figure 38. Global Video Game Units Sold by Device
Source: Citi Research
What sort of hardware are PC gamers using? Perhaps the best source of data we
found is from Steam. Steam is one of the largest (if not the largest) distributor of PC
games on the Internet. And, the Steam data has some interesting statistics.
– First, only 36% of Steam users are in English-speaking countries while 25%
are Chinese and 12% are Russian. All other regions of the world make up
27% of Steam users. As such, we think this is a fairly representative set of
users around the world.
– Second, the core CPU is dominated by Intel (82%) followed by AMD (18%).
And the core CPUs have two (28%), four (56%) or six (11%) core processors.
– Third, as for the video card, a whopping 75% use NVIDIA’s chips, followed by
15% that use AMD and just 10% that use Intel.
– Fourth, only 1% of players use a VR headset.
Layer V: Distribution
So far, we’ve reviewed the IP layer and discovered it’s not too important. And, we
summarized the process video game developers follow to create games (including
the use of engines and rasterization) and reviewed the differences among games
genres. Then, we discussed the major video game publishers. This was followed by
a closer look at the various forms of hardware (including consoles, PCs, and
handhelds). Now, we’re in a position to move to layer five: the distribution of video
game content.
There are three main methods to distribute video games. First, in the early days of
video games, the consumer would purchase a physical disc at Wal-Mart or Best
Buy. More recently, consumers have been able to download digital copies of gaming
content from distributors like Xbox Live, PlayStation Network or Steam. And, in the
0
500
1,000
1,500
2,000
2,500
'00 '01 '02 '03 '04 '05 '06 '07 '08 '09 '10 '11 '12 '13 '14 '15 '16 '17 '18
Glo
ba
l V
ideo
Ga
me
rs (
mn
)
Console
PC
Handheld
Mobile
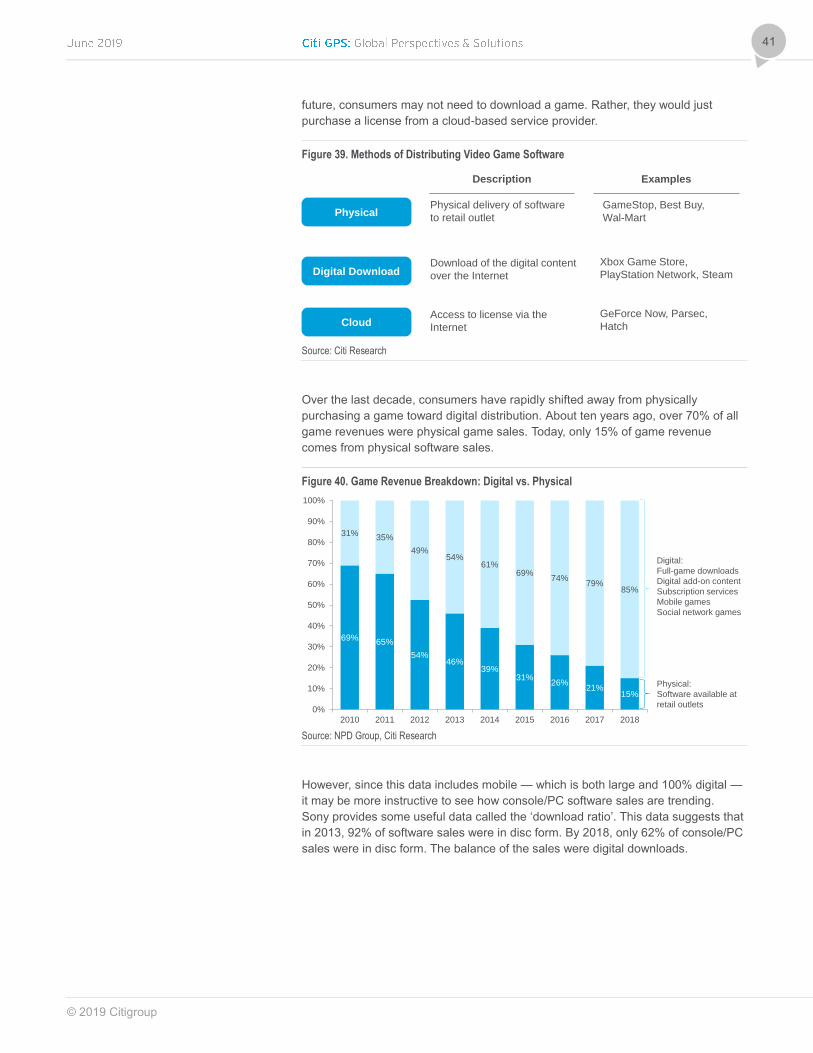
© 2019 Citigroup
41
future, consumers may not need to download a game. Rather, they would just
purchase a license from a cloud-based service provider.
Figure 39. Methods of Distributing Video Game Software
Source: Citi Research
Over the last decade, consumers have rapidly shifted away from physically
purchasing a game toward digital distribution. About ten years ago, over 70% of all
game revenues were physical game sales. Today, only 15% of game revenue
comes from physical software sales.
Figure 40. Game Revenue Breakdown: Digital vs. Physical
Source: NPD Group, Citi Research
However, since this data includes mobile — which is both large and 100% digital —
it may be more instructive to see how console/PC software sales are trending.
Sony provides some useful data called the ‘download ratio’. This data suggests that
in 2013, 92% of software sales were in disc form. By 2018, only 62% of console/PC
sales were in disc form. The balance of the sales were digital downloads.
Physical
Digital Download
Cloud
Description Examples
Physical delivery of software
to retail outlet
GameStop, Best Buy,
Wal-Mart
Download of the digital content
over the Internet
Xbox Game Store,
PlayStation Network, Steam
Access to license via the
Internet
GeForce Now, Parsec,
Hatch
69%65%
54%46%
39%31%
26%21%
15%
31%35%
49%54%
61%69%
74%79%
85%
0%
10%
20%
30%
40%
50%
60%
70%
80%
90%
100%
2010 2011 2012 2013 2014 2015 2016 2017 2018
Digital:
Full-game downloads
Digital add-on content
Subscription services
Mobile games
Social network games
Physical:
Software available at
retail outlets
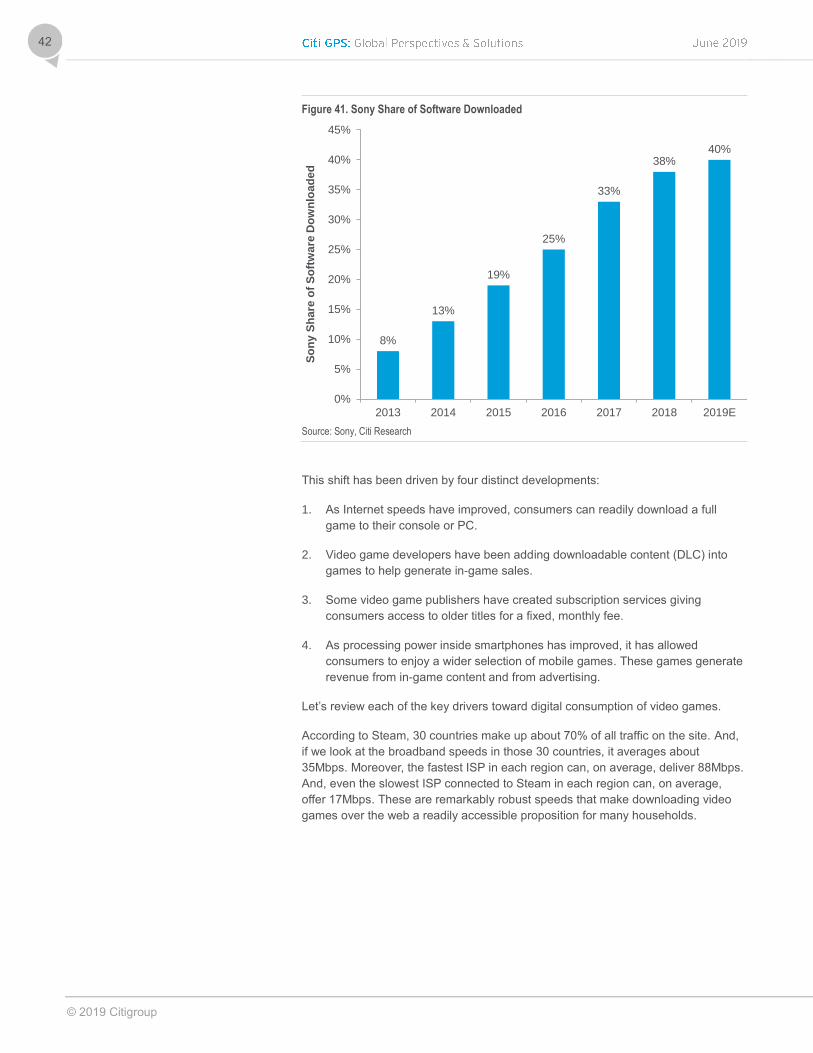
© 2019 Citigroup
42
Figure 41. Sony Share of Software Downloaded
Source: Sony, Citi Research
This shift has been driven by four distinct developments:
1. As Internet speeds have improved, consumers can readily download a full
game to their console or PC.
2. Video game developers have been adding downloadable content (DLC) into
games to help generate in-game sales.
3. Some video game publishers have created subscription services giving
consumers access to older titles for a fixed, monthly fee.
4. As processing power inside smartphones has improved, it has allowed
consumers to enjoy a wider selection of mobile games. These games generate
revenue from in-game content and from advertising.
Let’s review each of the key drivers toward digital consumption of video games.
According to Steam, 30 countries make up about 70% of all traffic on the site. And,
if we look at the broadband speeds in those 30 countries, it averages about
35Mbps. Moreover, the fastest ISP in each region can, on average, deliver 88Mbps.
And, even the slowest ISP connected to Steam in each region can, on average,
offer 17Mbps. These are remarkably robust speeds that make downloading video
games over the web a readily accessible proposition for many households.
8%
13%
19%
25%
33%
38%40%
0%
5%
10%
15%
20%
25%
30%
35%
40%
45%
2013 2014 2015 2016 2017 2018 2019E
So
ny S
hare
of
So
ftw
are
Do
wn
load
ed
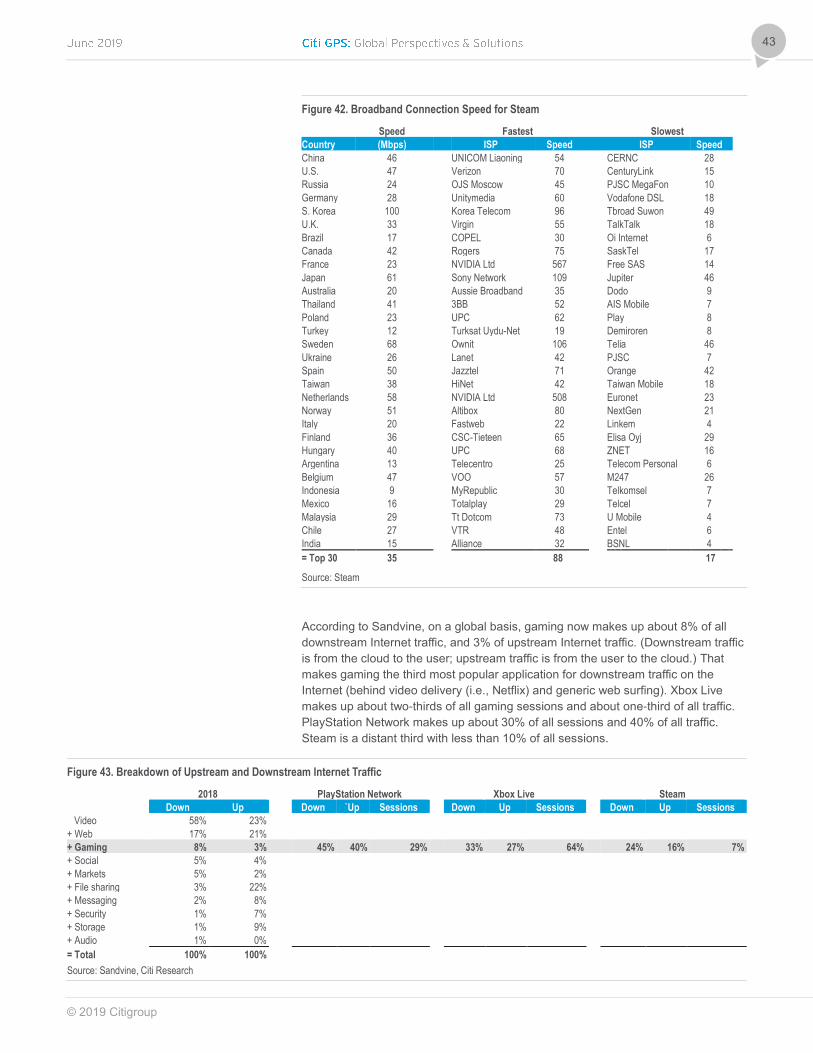
© 2019 Citigroup
43
Figure 42. Broadband Connection Speed for Steam
Speed Fastest Slowest
Country (Mbps) ISP Speed ISP Speed
China 46 UNICOM Liaoning 54 CERNC 28
U.S. 47 Verizon 70 CenturyLink 15
Russia 24 OJS Moscow 45 PJSC MegaFon 10
Germany 28 Unitymedia 60 Vodafone DSL 18
S. Korea 100 Korea Telecom 96 Tbroad Suwon 49
U.K. 33 Virgin 55 TalkTalk 18
Brazil 17 COPEL 30 Oi Internet 6
Canada 42 Rogers 75 SaskTel 17
France 23 NVIDIA Ltd 567 Free SAS 14
Japan 61 Sony Network 109 Jupiter 46
Australia 20 Aussie Broadband 35 Dodo 9
Thailand 41 3BB 52 AIS Mobile 7
Poland 23 UPC 62 Play 8
Turkey 12 Turksat Uydu-Net 19 Demiroren 8
Sweden 68 Ownit 106 Telia 46
Ukraine 26 Lanet 42 PJSC 7
Spain 50 Jazztel 71 Orange 42
Taiwan 38 HiNet 42 Taiwan Mobile 18
Netherlands 58 NVIDIA Ltd 508 Euronet 23
Norway 51 Altibox 80 NextGen 21
Italy 20 Fastweb 22 Linkem 4
Finland 36 CSC-Tieteen 65 Elisa Oyj 29
Hungary 40 UPC 68 ZNET 16
Argentina 13 Telecentro 25 Telecom Personal 6
Belgium 47 VOO 57 M247 26
Indonesia 9 MyRepublic 30 Telkomsel 7
Mexico 16 Totalplay 29 Telcel 7
Malaysia 29 Tt Dotcom 73 U Mobile 4
Chile 27 VTR 48 Entel 6
India 15 Alliance 32 BSNL 4
= Top 30 35 88 17
Source: Steam
According to Sandvine, on a global basis, gaming now makes up about 8% of all
downstream Internet traffic, and 3% of upstream Internet traffic. (Downstream traffic
is from the cloud to the user; upstream traffic is from the user to the cloud.) That
makes gaming the third most popular application for downstream traffic on the
Internet (behind video delivery (i.e., Netflix) and generic web surfing). Xbox Live
makes up about two-thirds of all gaming sessions and about one-third of all traffic.
PlayStation Network makes up about 30% of all sessions and 40% of all traffic.
Steam is a distant third with less than 10% of all sessions.
Figure 43. Breakdown of Upstream and Downstream Internet Traffic
2018 PlayStation Network Xbox Live Steam
Down Up Down `Up Sessions Down Up Sessions Down Up Sessions
Video 58% 23%
+ Web 17% 21%
+ Gaming 8% 3% 45% 40% 29% 33% 27% 64% 24% 16% 7%
+ Social 5% 4%
+ Markets 5% 2%
+ File sharing 3% 22%
+ Messaging 2% 8%
+ Security 1% 7%
+ Storage 1% 9%
+ Audio 1% 0%
= Total 100% 100%
Source: Sandvine, Citi Research
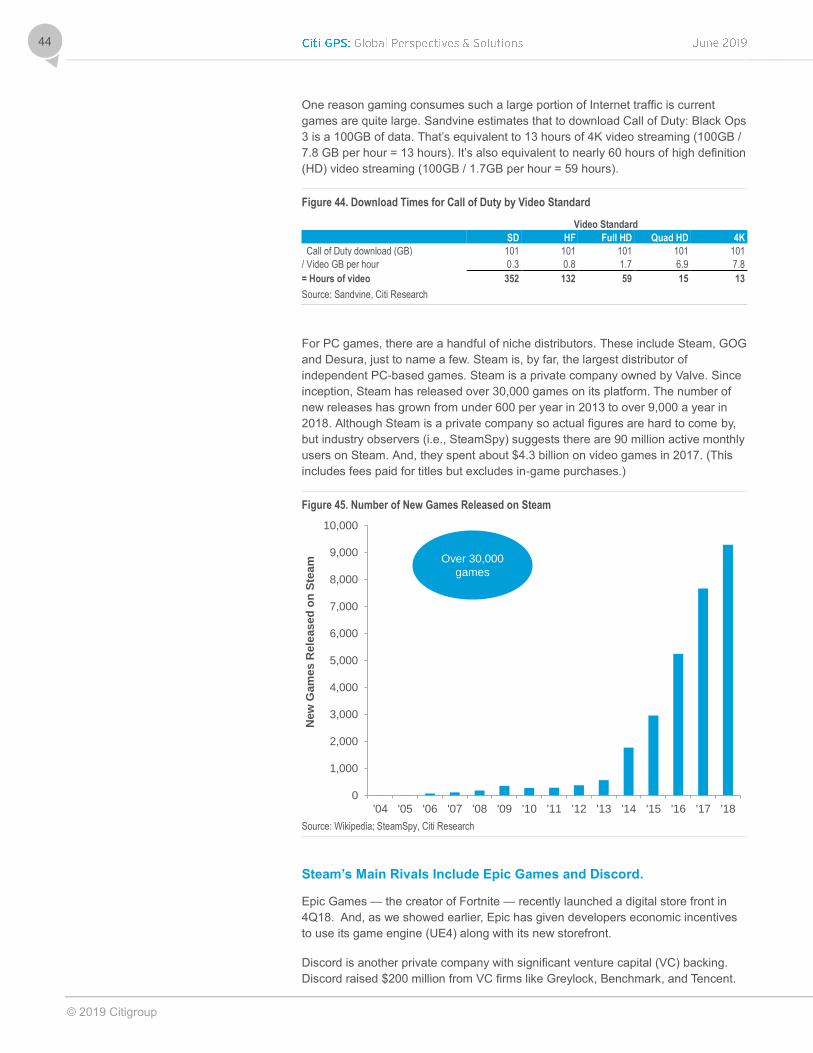
© 2019 Citigroup
44
One reason gaming consumes such a large portion of Internet traffic is current
games are quite large. Sandvine estimates that to download Call of Duty: Black Ops
3 is a 100GB of data. That’s equivalent to 13 hours of 4K video streaming (100GB /
7.8 GB per hour = 13 hours). It’s also equivalent to nearly 60 hours of high definition
(HD) video streaming (100GB / 1.7GB per hour = 59 hours).
Figure 44. Download Times for Call of Duty by Video Standard
Video Standard
SD HF Full HD Quad HD 4K
Call of Duty download (GB) 101 101 101 101 101
/ Video GB per hour 0.3 0.8 1.7 6.9 7.8
= Hours of video 352 132 59 15 13
Source: Sandvine, Citi Research
For PC games, there are a handful of niche distributors. These include Steam, GOG
and Desura, just to name a few. Steam is, by far, the largest distributor of
independent PC-based games. Steam is a private company owned by Valve. Since
inception, Steam has released over 30,000 games on its platform. The number of
new releases has grown from under 600 per year in 2013 to over 9,000 a year in
2018. Although Steam is a private company so actual figures are hard to come by,
but industry observers (i.e., SteamSpy) suggests there are 90 million active monthly
users on Steam. And, they spent about $4.3 billion on video games in 2017. (This
includes fees paid for titles but excludes in-game purchases.)
Figure 45. Number of New Games Released on Steam
Source: Wikipedia; SteamSpy, Citi Research
Steam’s Main Rivals Include Epic Games and Discord.
Epic Games — the creator of Fortnite — recently launched a digital store front in
4Q18. And, as we showed earlier, Epic has given developers economic incentives
to use its game engine (UE4) along with its new storefront.
Discord is another private company with significant venture capital (VC) backing.
Discord raised $200 million from VC firms like Greylock, Benchmark, and Tencent.
0
1,000
2,000
3,000
4,000
5,000
6,000
7,000
8,000
9,000
10,000
'04 '05 '06 '07 '08 '09 '10 '11 '12 '13 '14 '15 '16 '17 '18
New
Ga
me
s R
ele
as
ed
on
Ste
am Over 30,000
games

© 2019 Citigroup
45
Discord has focused on social features – like voice chat and instant messaging - to
drive growth. Steam has responded by incorporating social features into its
platform. In addition, Electronic Arts (EA) broke away from Steam in 2011 to form
EA Origin. But, EA service still isn’t very popular.
We used Google Trends to assess popularity of the digital storefronts of Steam,
Discord, and Epic. Discord has gradually grown in popularity over the past few
years. And Epic is a relatively new upstart. Steam, it seems, is still the leader. Most
gamers like Steam’s game selection, search functionality, and on-line support. Most
gamers still think Discord and Epic haven’t yet caught up to Steam.
Figure 46. Popularity of Digital Storefronts by Game Distributors
Source: Google, Citi Research
Cloud Gaming
Cloud gaming is relatively simple. Rather than processing video game content on a
PC or console, the processing is done inside the network, or in the cloud.
Cloud gaming has been a long-term aspiration for the video game industry. It all
began with OnLive. OnLive launched the first cloud gaming platform back in 2009.
Although OnLive officially had 1.5 million active users when the service shuttered,
the service was losing money. Press reports such as The Verge suggested OnLive
was burning through $60 million a year. Moreover, latency times were quite
significant at around 150 milliseconds.
Despite the demise of OnLive, industry observers are still drawn to the technical
elegance of cloud gaming. For the consumer, it eliminates the need to upgrade
console hardware. And, if the cloud gaming platform is designed properly, it makes
it easier for consumers to play games on different platforms (including smartphones
and PCs). For the game developers, it allows firms to support more devices and
reduces compatibility issues between software and hardware. And, for console
manufacturers, it allows revenues to migrate to monthly recurring revenues (versus
episodic hardware revenues). And, those transitions are usually good for valuations
(due to expansion of the multiple).
0
10
20
30
40
50
60
70
80
90
100
Ma
y-1
4
Sep
-14
Ja
n-1
5
Ma
y-1
5
Sep
-15
Ja
n-1
6
Ma
y-1
6
Sep
-16
Ja
n-1
7
Ma
y-1
7
Sep
-17
Ja
n-1
8
Ma
y-1
8
Sep
-18
Ja
n-1
9
U.S
. G
oo
gle
Tre
nd
s I
nte
res
t (1
00
= P
eak
)SteamDiscordEpic
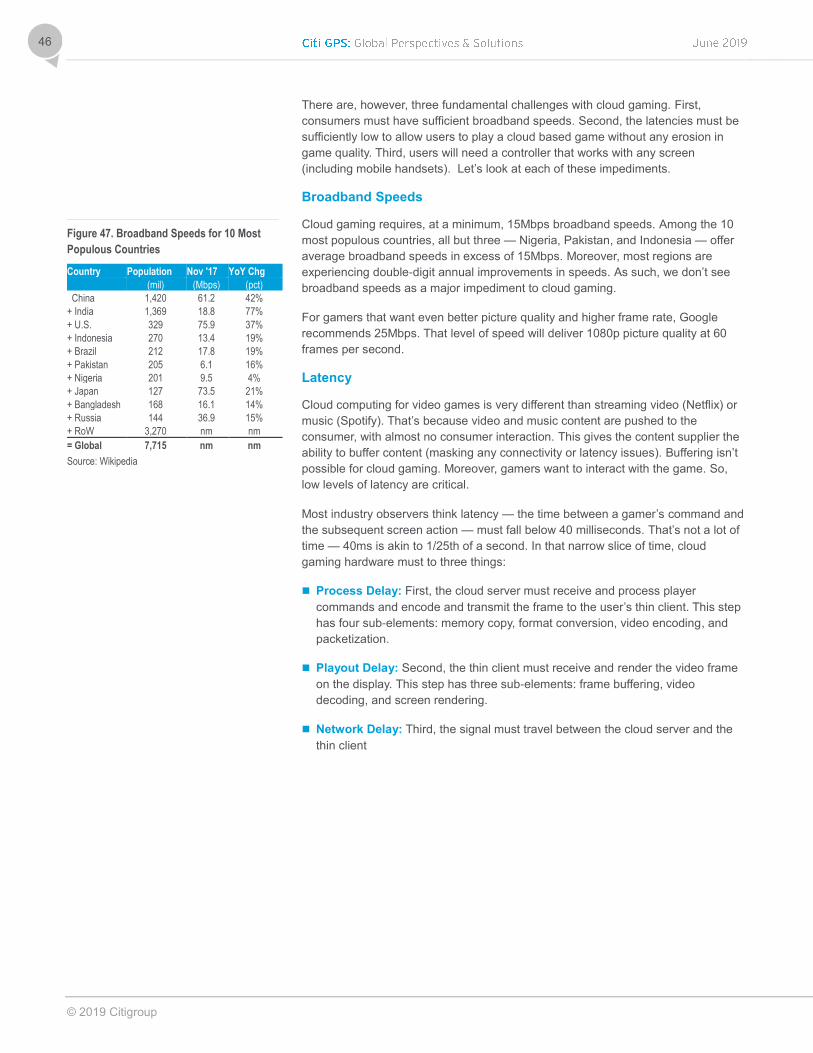
© 2019 Citigroup
46
There are, however, three fundamental challenges with cloud gaming. First,
consumers must have sufficient broadband speeds. Second, the latencies must be
sufficiently low to allow users to play a cloud based game without any erosion in
game quality. Third, users will need a controller that works with any screen
(including mobile handsets). Let’s look at each of these impediments.
Broadband Speeds
Cloud gaming requires, at a minimum, 15Mbps broadband speeds. Among the 10
most populous countries, all but three — Nigeria, Pakistan, and Indonesia — offer
average broadband speeds in excess of 15Mbps. Moreover, most regions are
experiencing double-digit annual improvements in speeds. As such, we don’t see
broadband speeds as a major impediment to cloud gaming.
For gamers that want even better picture quality and higher frame rate, Google
recommends 25Mbps. That level of speed will deliver 1080p picture quality at 60
frames per second.
Latency
Cloud computing for video games is very different than streaming video (Netflix) or
music (Spotify). That’s because video and music content are pushed to the
consumer, with almost no consumer interaction. This gives the content supplier the
ability to buffer content (masking any connectivity or latency issues). Buffering isn’t
possible for cloud gaming. Moreover, gamers want to interact with the game. So,
low levels of latency are critical.
Most industry observers think latency — the time between a gamer’s command and
the subsequent screen action — must fall below 40 milliseconds. That’s not a lot of
time — 40ms is akin to 1/25th of a second. In that narrow slice of time, cloud
gaming hardware must to three things:
Process Delay: First, the cloud server must receive and process player
commands and encode and transmit the frame to the user’s thin client. This step
has four sub-elements: memory copy, format conversion, video encoding, and
packetization.
Playout Delay: Second, the thin client must receive and render the video frame
on the display. This step has three sub-elements: frame buffering, video
decoding, and screen rendering.
Network Delay: Third, the signal must travel between the cloud server and the
thin client
Figure 47. Broadband Speeds for 10 Most
Populous Countries
Country Population Nov '17 YoY Chg
(mil) (Mbps) (pct)
China 1,420 61.2 42%
+ India 1,369 18.8 77%
+ U.S. 329 75.9 37%
+ Indonesia 270 13.4 19%
+ Brazil 212 17.8 19%
+ Pakistan 205 6.1 16%
+ Nigeria 201 9.5 4%
+ Japan 127 73.5 21%
+ Bangladesh 168 16.1 14%
+ Russia 144 36.9 15%
+ RoW 3,270 nm nm
= Global 7,715 nm nm
Source: Wikipedia
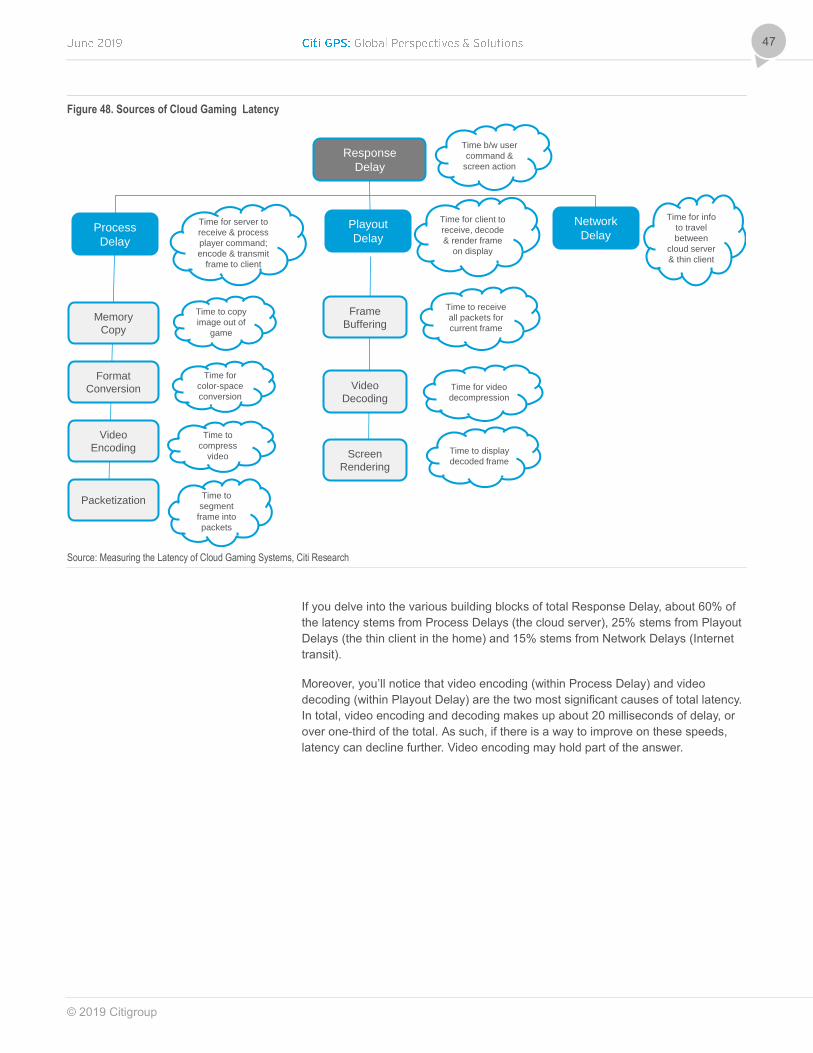
© 2019 Citigroup
47
Figure 48. Sources of Cloud Gaming Latency
Source: Measuring the Latency of Cloud Gaming Systems, Citi Research
If you delve into the various building blocks of total Response Delay, about 60% of
the latency stems from Process Delays (the cloud server), 25% stems from Playout
Delays (the thin client in the home) and 15% stems from Network Delays (Internet
transit).
Moreover, you’ll notice that video encoding (within Process Delay) and video
decoding (within Playout Delay) are the two most significant causes of total latency.
In total, video encoding and decoding makes up about 20 milliseconds of delay, or
over one-third of the total. As such, if there is a way to improve on these speeds,
latency can decline further. Video encoding may hold part of the answer.
Response
Delay
Process
Delay
Network
DelayPlayout
Delay
Memory
Copy
Format
Conversion
Video
Encoding
Packetization
Frame
Buffering
Video
Decoding
Screen
Rendering
Time b/w user
command &
screen action
Time for info
to travel
between
cloud server
& thin client
Time for server to
receive & process
player command;
encode & transmit
frame to client
Time for client to
receive, decode
& render frame
on display
Time to copy
image out of
game
Time for
color-space
conversion
Time to
compress
video
Time to
segment
frame into
packets
Time to receive
all packets for
current frame
Time for video
decompression
Time to display
decoded frame
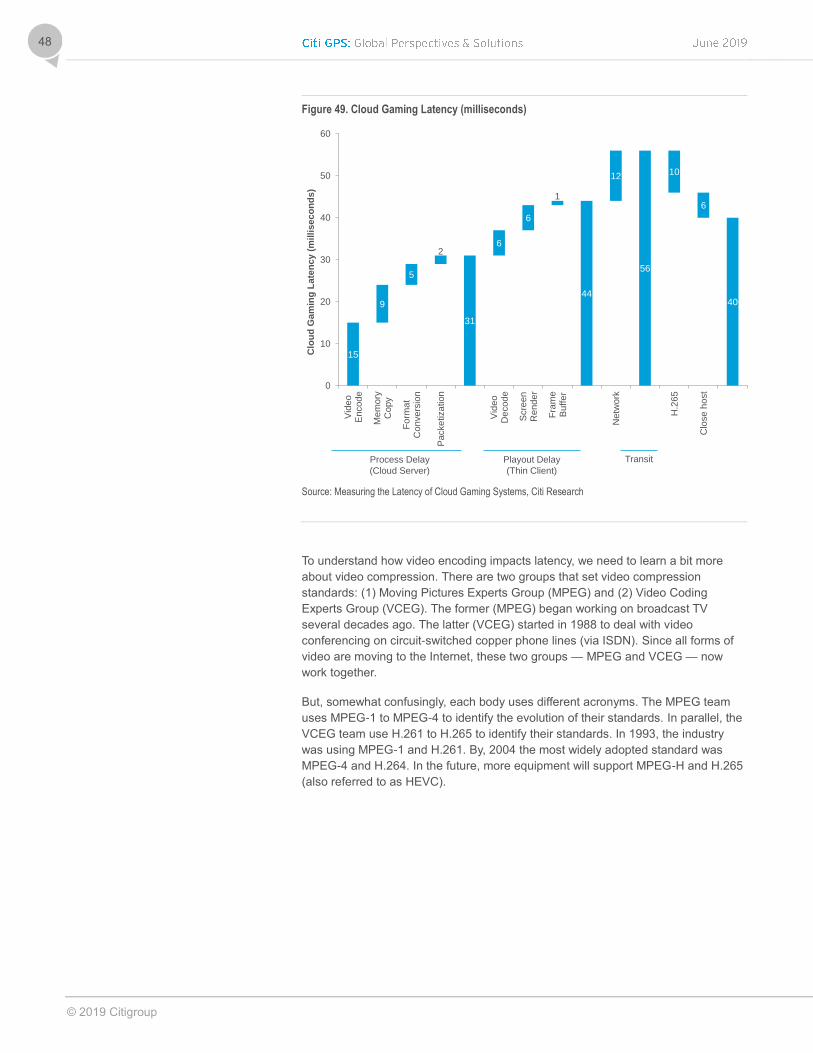
© 2019 Citigroup
48
Figure 49. Cloud Gaming Latency (milliseconds)
Source: Measuring the Latency of Cloud Gaming Systems, Citi Research
To understand how video encoding impacts latency, we need to learn a bit more
about video compression. There are two groups that set video compression
standards: (1) Moving Pictures Experts Group (MPEG) and (2) Video Coding
Experts Group (VCEG). The former (MPEG) began working on broadcast TV
several decades ago. The latter (VCEG) started in 1988 to deal with video
conferencing on circuit-switched copper phone lines (via ISDN). Since all forms of
video are moving to the Internet, these two groups — MPEG and VCEG — now
work together.
But, somewhat confusingly, each body uses different acronyms. The MPEG team
uses MPEG-1 to MPEG-4 to identify the evolution of their standards. In parallel, the
VCEG team use H.261 to H.265 to identify their standards. In 1993, the industry
was using MPEG-1 and H.261. By, 2004 the most widely adopted standard was
MPEG-4 and H.264. In the future, more equipment will support MPEG-H and H.265
(also referred to as HEVC).
15
9
5
2
31
6
6
1
44
12
56
10
6
40
0
10
20
30
40
50
60
Vid
eo
Enco
de
Me
mo
ryC
opy
Fo
rma
tC
onve
rsio
n
Packe
tiza
tion
Vid
eo
De
co
de
Scre
en
Re
nd
er
Fra
me
Buff
er
Netw
ork
H.2
65
Clo
se
ho
st
Clo
ud
Ga
min
g L
ate
nc
y (
mil
lis
ec
on
ds
)
Process Delay
(Cloud Server)
Playout Delay
(Thin Client)
Transit
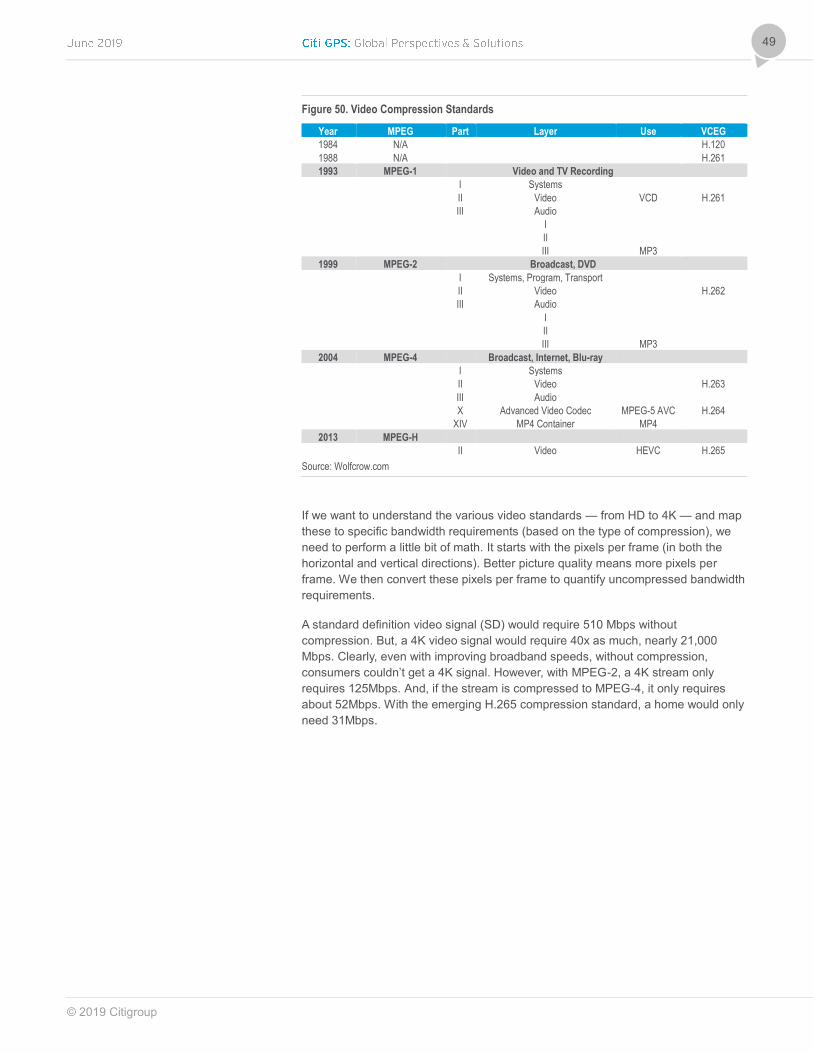
© 2019 Citigroup
49
Figure 50. Video Compression Standards
Year MPEG Part Layer Use VCEG
1984 N/A H.120
1988 N/A H.261
1993 MPEG-1 Video and TV Recording
I Systems
II Video VCD H.261
III Audio
I
II
III MP3
1999 MPEG-2 Broadcast, DVD
I Systems, Program, Transport
II Video H.262
III Audio
I
II
III MP3
2004 MPEG-4 Broadcast, Internet, Blu-ray
I Systems
II Video H.263
III Audio
X Advanced Video Codec MPEG-5 AVC H.264
XIV MP4 Container MP4
2013 MPEG-H
II Video HEVC H.265
Source: Wolfcrow.com
If we want to understand the various video standards — from HD to 4K — and map
these to specific bandwidth requirements (based on the type of compression), we
need to perform a little bit of math. It starts with the pixels per frame (in both the
horizontal and vertical directions). Better picture quality means more pixels per
frame. We then convert these pixels per frame to quantify uncompressed bandwidth
requirements.
A standard definition video signal (SD) would require 510 Mbps without
compression. But, a 4K video signal would require 40x as much, nearly 21,000
Mbps. Clearly, even with improving broadband speeds, without compression,
consumers couldn’t get a 4K signal. However, with MPEG-2, a 4K stream only
requires 125Mbps. And, if the stream is compressed to MPEG-4, it only requires
about 52Mbps. With the emerging H.265 compression standard, a home would only
need 31Mbps.
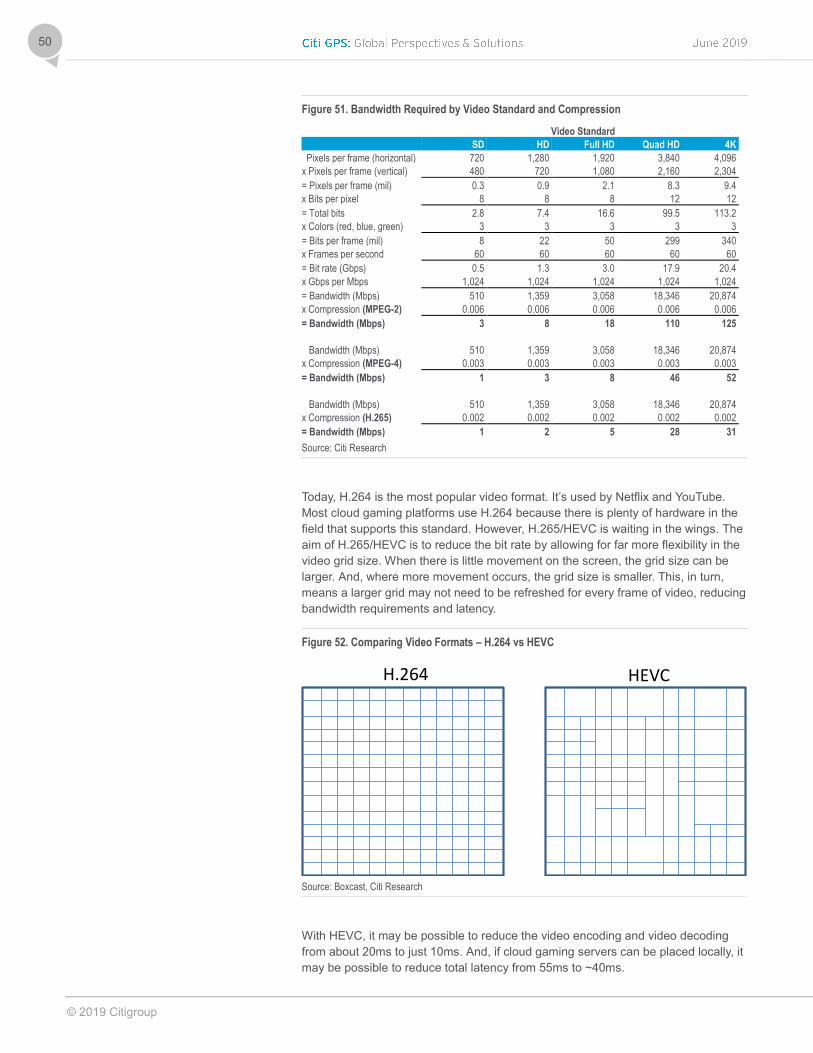
© 2019 Citigroup
50
Figure 51. Bandwidth Required by Video Standard and Compression
Video Standard
SD HD Full HD Quad HD 4K
Pixels per frame (horizontal) 720 1,280 1,920 3,840 4,096
x Pixels per frame (vertical) 480 720 1,080 2,160 2,304
= Pixels per frame (mil) 0.3 0.9 2.1 8.3 9.4
x Bits per pixel 8 8 8 12 12
= Total bits 2.8 7.4 16.6 99.5 113.2
x Colors (red, blue, green) 3 3 3 3 3
= Bits per frame (mil) 8 22 50 299 340
x Frames per second 60 60 60 60 60
= Bit rate (Gbps) 0.5 1.3 3.0 17.9 20.4
x Gbps per Mbps 1,024 1,024 1,024 1,024 1,024
= Bandwidth (Mbps) 510 1,359 3,058 18,346 20,874
x Compression (MPEG-2) 0.006 0.006 0.006 0.006 0.006
= Bandwidth (Mbps) 3 8 18 110 125
Bandwidth (Mbps) 510 1,359 3,058 18,346 20,874
x Compression (MPEG-4) 0.003 0.003 0.003 0.003 0.003
= Bandwidth (Mbps) 1 3 8 46 52
Bandwidth (Mbps) 510 1,359 3,058 18,346 20,874
x Compression (H.265) 0.002 0.002 0.002 0.002 0.002
= Bandwidth (Mbps) 1 2 5 28 31
Source: Citi Research
Today, H.264 is the most popular video format. It’s used by Netflix and YouTube.
Most cloud gaming platforms use H.264 because there is plenty of hardware in the
field that supports this standard. However, H.265/HEVC is waiting in the wings. The
aim of H.265/HEVC is to reduce the bit rate by allowing for far more flexibility in the
video grid size. When there is little movement on the screen, the grid size can be
larger. And, where more movement occurs, the grid size is smaller. This, in turn,
means a larger grid may not need to be refreshed for every frame of video, reducing
bandwidth requirements and latency.
Figure 52. Comparing Video Formats – H.264 vs HEVC
Source: Boxcast, Citi Research
With HEVC, it may be possible to reduce the video encoding and video decoding
from about 20ms to just 10ms. And, if cloud gaming servers can be placed locally, it
may be possible to reduce total latency from 55ms to ~40ms.
H.264 HEVC
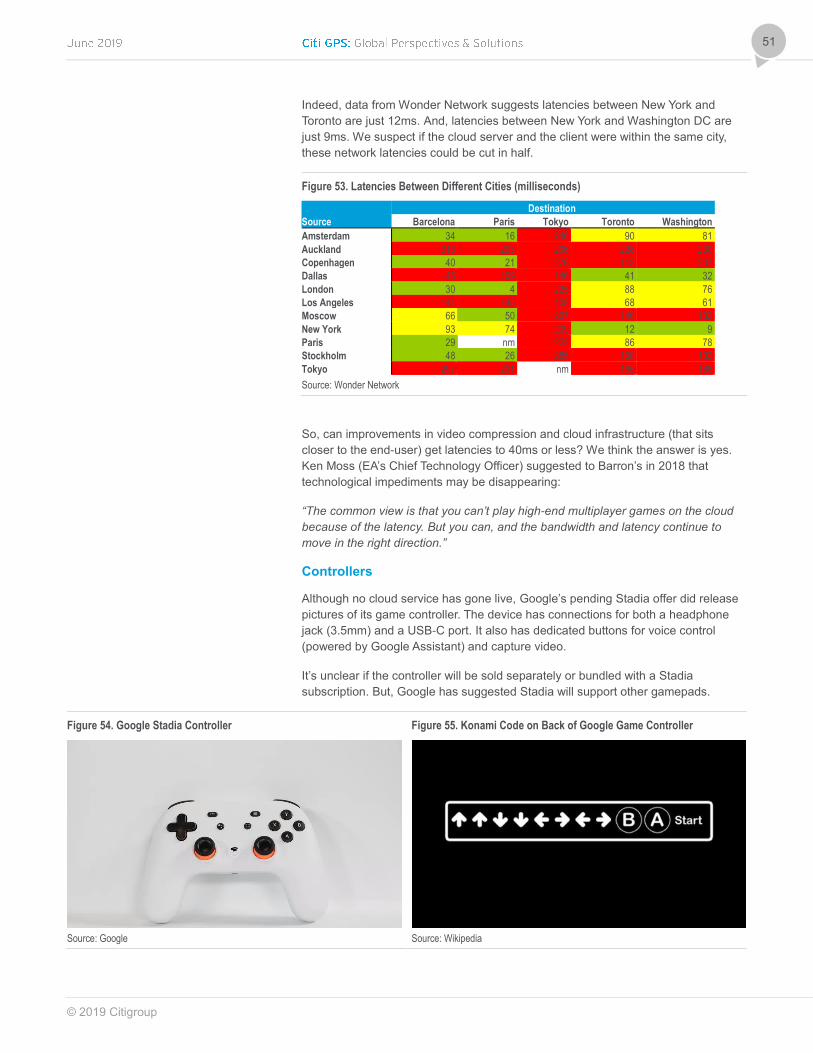
© 2019 Citigroup
51
Indeed, data from Wonder Network suggests latencies between New York and
Toronto are just 12ms. And, latencies between New York and Washington DC are
just 9ms. We suspect if the cloud server and the client were within the same city,
these network latencies could be cut in half.
Figure 53. Latencies Between Different Cities (milliseconds)
Destination
Source Barcelona Paris Tokyo Toronto Washington
Amsterdam 34 16 246 90 81
Auckland 313 293 206 228 230
Copenhagen 40 21 276 113 207
Dallas 145 109 146 41 32
London 30 4 225 88 76
Los Angeles 144 145 108 68 61
Moscow 66 50 207 140 132
New York 93 74 209 12 9
Paris 29 nm 222 86 78
Stockholm 48 26 285 108 103
Tokyo 297 231 nm 165 168
Source: Wonder Network
So, can improvements in video compression and cloud infrastructure (that sits
closer to the end-user) get latencies to 40ms or less? We think the answer is yes.
Ken Moss (EA’s Chief Technology Officer) suggested to Barron’s in 2018 that
technological impediments may be disappearing:
“The common view is that you can’t play high-end multiplayer games on the cloud
because of the latency. But you can, and the bandwidth and latency continue to
move in the right direction.”
Controllers
Although no cloud service has gone live, Google’s pending Stadia offer did release
pictures of its game controller. The device has connections for both a headphone
jack (3.5mm) and a USB-C port. It also has dedicated buttons for voice control
(powered by Google Assistant) and capture video.
It’s unclear if the controller will be sold separately or bundled with a Stadia
subscription. But, Google has suggested Stadia will support other gamepads.
Figure 54. Google Stadia Controller
Figure 55. Konami Code on Back of Google Game Controller
Source: Google Source: Wikipedia
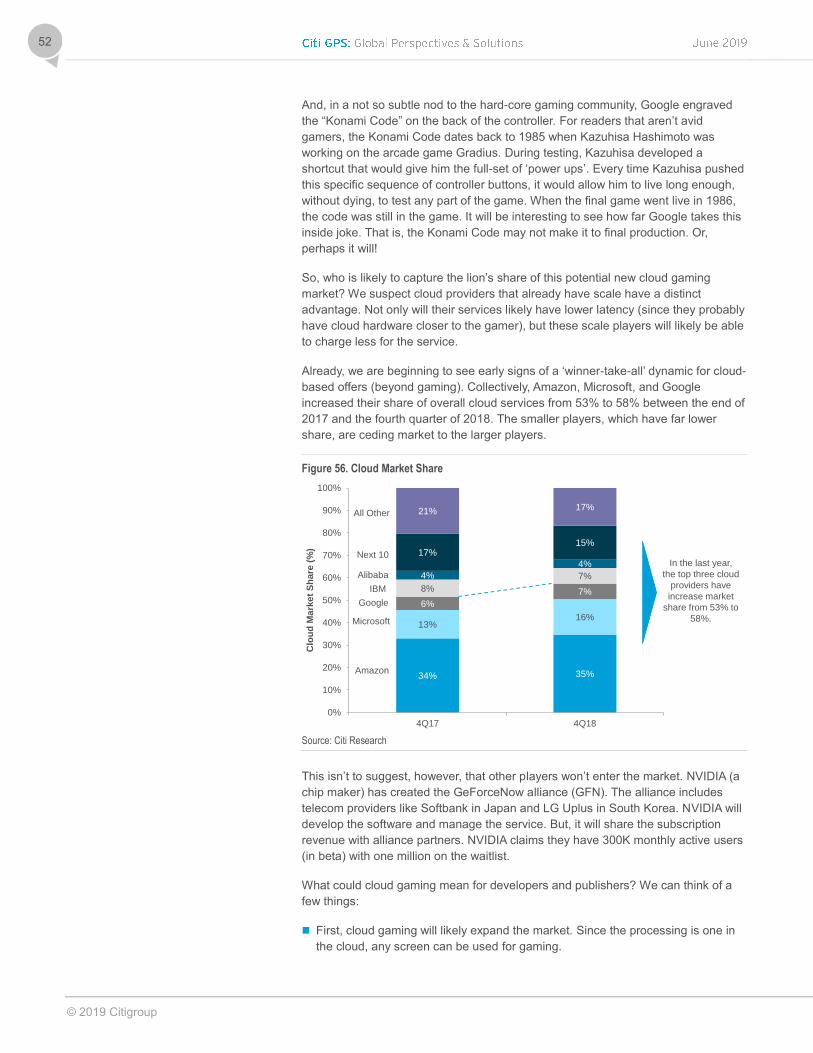
© 2019 Citigroup
52
And, in a not so subtle nod to the hard-core gaming community, Google engraved
the “Konami Code” on the back of the controller. For readers that aren’t avid
gamers, the Konami Code dates back to 1985 when Kazuhisa Hashimoto was
working on the arcade game Gradius. During testing, Kazuhisa developed a
shortcut that would give him the full-set of ‘power ups’. Every time Kazuhisa pushed
this specific sequence of controller buttons, it would allow him to live long enough,
without dying, to test any part of the game. When the final game went live in 1986,
the code was still in the game. It will be interesting to see how far Google takes this
inside joke. That is, the Konami Code may not make it to final production. Or,
perhaps it will!
So, who is likely to capture the lion’s share of this potential new cloud gaming
market? We suspect cloud providers that already have scale have a distinct
advantage. Not only will their services likely have lower latency (since they probably
have cloud hardware closer to the gamer), but these scale players will likely be able
to charge less for the service.
Already, we are beginning to see early signs of a ‘winner-take-all’ dynamic for cloud-
based offers (beyond gaming). Collectively, Amazon, Microsoft, and Google
increased their share of overall cloud services from 53% to 58% between the end of
2017 and the fourth quarter of 2018. The smaller players, which have far lower
share, are ceding market to the larger players.
Figure 56. Cloud Market Share
Source: Citi Research
This isn’t to suggest, however, that other players won’t enter the market. NVIDIA (a
chip maker) has created the GeForceNow alliance (GFN). The alliance includes
telecom providers like Softbank in Japan and LG Uplus in South Korea. NVIDIA will
develop the software and manage the service. But, it will share the subscription
revenue with alliance partners. NVIDIA claims they have 300K monthly active users
(in beta) with one million on the waitlist.
What could cloud gaming mean for developers and publishers? We can think of a
few things:
First, cloud gaming will likely expand the market. Since the processing is one in
the cloud, any screen can be used for gaming.
34% 35%
13%16%
6%
7%8%
7%4%
4%
17%15%
21% 17%
0%
10%
20%
30%
40%
50%
60%
70%
80%
90%
100%
4Q17 4Q18
Clo
ud
Ma
rke
t S
ha
re (
%)
Amazon
Microsoft
IBM
Alibaba
Next 10
All Other
In the last year,
the top three cloud
providers have
increase market
share from 53% to
58%.
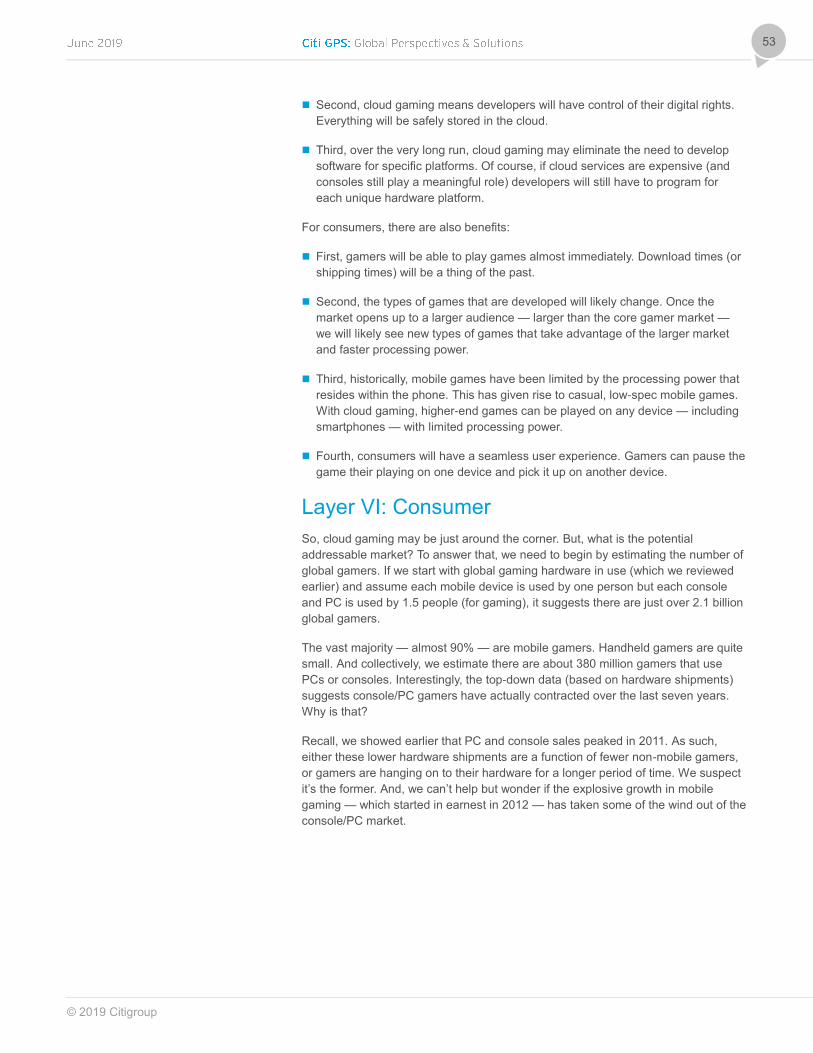
© 2019 Citigroup
53
Second, cloud gaming means developers will have control of their digital rights.
Everything will be safely stored in the cloud.
Third, over the very long run, cloud gaming may eliminate the need to develop
software for specific platforms. Of course, if cloud services are expensive (and
consoles still play a meaningful role) developers will still have to program for
each unique hardware platform.
For consumers, there are also benefits:
First, gamers will be able to play games almost immediately. Download times (or
shipping times) will be a thing of the past.
Second, the types of games that are developed will likely change. Once the
market opens up to a larger audience — larger than the core gamer market —
we will likely see new types of games that take advantage of the larger market
and faster processing power.
Third, historically, mobile games have been limited by the processing power that
resides within the phone. This has given rise to casual, low-spec mobile games.
With cloud gaming, higher-end games can be played on any device — including
smartphones — with limited processing power.
Fourth, consumers will have a seamless user experience. Gamers can pause the
game their playing on one device and pick it up on another device.
Layer VI: Consumer
So, cloud gaming may be just around the corner. But, what is the potential
addressable market? To answer that, we need to begin by estimating the number of
global gamers. If we start with global gaming hardware in use (which we reviewed
earlier) and assume each mobile device is used by one person but each console
and PC is used by 1.5 people (for gaming), it suggests there are just over 2.1 billion
global gamers.
The vast majority — almost 90% — are mobile gamers. Handheld gamers are quite
small. And collectively, we estimate there are about 380 million gamers that use
PCs or consoles. Interestingly, the top-down data (based on hardware shipments)
suggests console/PC gamers have actually contracted over the last seven years.
Why is that?
Recall, we showed earlier that PC and console sales peaked in 2011. As such,
either these lower hardware shipments are a function of fewer non-mobile gamers,
or gamers are hanging on to their hardware for a longer period of time. We suspect
it’s the former. And, we can’t help but wonder if the explosive growth in mobile
gaming — which started in earnest in 2012 — has taken some of the wind out of the
console/PC market.
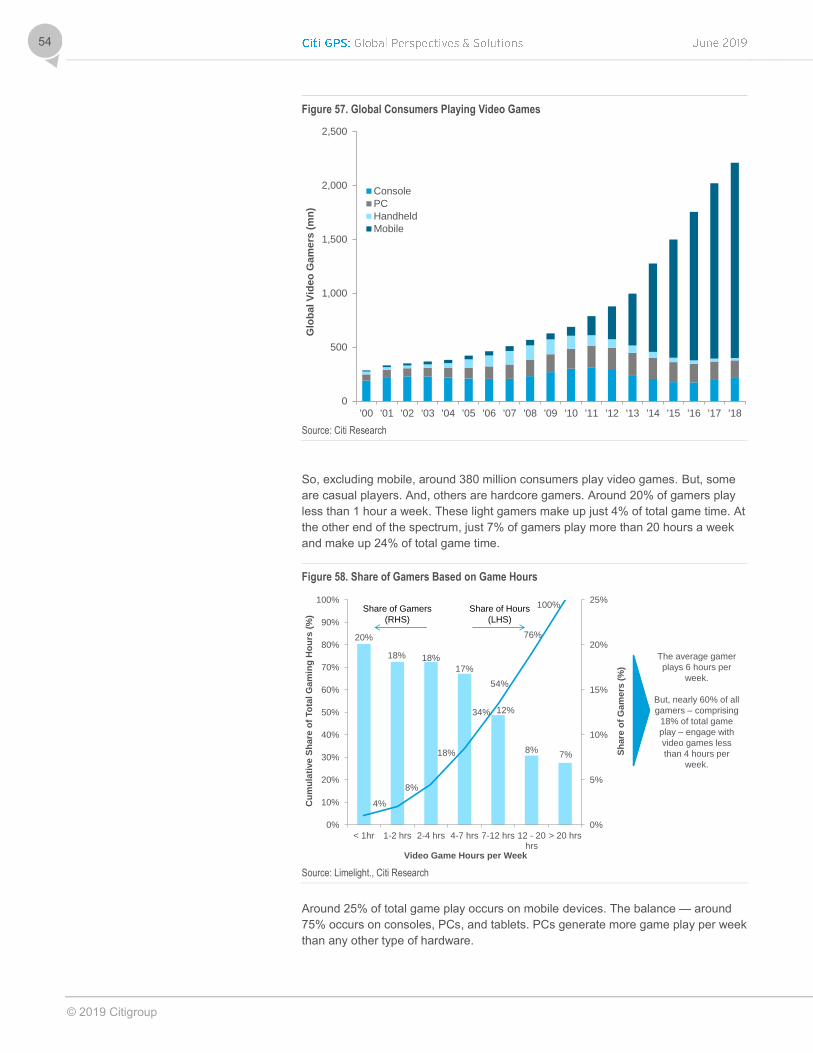
© 2019 Citigroup
54
Figure 57. Global Consumers Playing Video Games
Source: Citi Research
So, excluding mobile, around 380 million consumers play video games. But, some
are casual players. And, others are hardcore gamers. Around 20% of gamers play
less than 1 hour a week. These light gamers make up just 4% of total game time. At
the other end of the spectrum, just 7% of gamers play more than 20 hours a week
and make up 24% of total game time.
Figure 58. Share of Gamers Based on Game Hours
Source: Limelight., Citi Research
Around 25% of total game play occurs on mobile devices. The balance — around
75% occurs on consoles, PCs, and tablets. PCs generate more game play per week
than any other type of hardware.
0
500
1,000
1,500
2,000
2,500
'00 '01 '02 '03 '04 '05 '06 '07 '08 '09 '10 '11 '12 '13 '14 '15 '16 '17 '18
Glo
ba
l V
ide
o G
am
ers
(m
n)
Console
PC
Handheld
Mobile
20%
18% 18%
17%
12%
8%7%
4%
8%
18%
34%
54%
76%
100%
0%
5%
10%
15%
20%
25%
0%
10%
20%
30%
40%
50%
60%
70%
80%
90%
100%
< 1hr 1-2 hrs 2-4 hrs 4-7 hrs 7-12 hrs 12 - 20hrs
> 20 hrs
Sh
are
of
Ga
me
rs (
%)
Cu
mu
lati
ve
Sh
are
of
To
tal G
am
ing
Ho
urs
(%
)
Video Game Hours per Week
Share of Hours
(LHS)
Share of Gamers
(RHS)
The average gamer
plays 6 hours per
week.
But, nearly 60% of all
gamers – comprising
18% of total game
play – engage with
video games less
than 4 hours per
week.

© 2019 Citigroup
55
Figure 59. Video Game Hours by Device
Source: Limelight, Citi Research
Layer VII: eSports
Let’s shift to the bottom of the console/PC value chain: electronic sports and live
streamers. Live streamers gain viewers when individuals watch an amateur — albeit
a very good one — play games on a site like Twitch. Professional eSports is when
individuals watch a professional team. Between live streaming and professional
teams, there are a wide array of grassroots eSports competitions and events.
For older readers, eSports and live streaming might be a little difficult to understand.
Most readers in their 40s or 50s might wonder: “Who wants to watch someone else
play video games?” It’s a fair question. But, if you think about it, food lovers watch
others cook (Food Network) and sports fans watch others play sports (ESPN).
Video games shouldn’t be any different.
Mode of Distribution
But, video games didn’t always have eSports. What caused the change? We think it
was driven by the mode of distribution, which almost always changes the way
consumers use an application.
Voice services were the first application that experienced this shift when voice
migrated from a wired connection to a wireless connection. Since phone
conversations are often between two people, this shift in distribution didn’t alter
voice communications, per se. But, voice was supplanted by social media — apps
like Twitter, Facebook, and Instagram. As such, communication migrated from a 1:1
activity to a group activity.
Video was the second application that experienced a shift in consumption patterns
once distribution changed. From the 1950s to 2010, almost all TV shows were
delivered over the air — or over coaxial cable — according to a predetermined
schedule. Since content was ‘pushed’ the shows were consumed by groups. Today,
of course, a significant portion of TV consumption (non-sports and non-news
content) is ‘pulled’ off a server. As such, TV consumption is no longer a group
activity. Rather it’s often for a single user.
1.37
1.80
1.03
1.76
5.96
0
1
2
3
4
5
6
Console PC Tablet Mobile Total
Gam
e P
lay p
er
Week (
hrs
)
© 2019 Citigroup
56
Figure 60. Shift in Consumer Patterns for Various Modes of Distribution
Source: Citi Research
Something similar is going on with video games. In the past, a consumer would
purchase and play a game by themselves (or with friends and family in close
proximity). That is, the console or PC wasn’t connected to the Internet. But, with
nearly ubiquitous connectivity, gamers today are often playing games in groups.
This has spawned an entirely new type of gaming hardware: the gaming headset.
The headset allows gamers to listen to and communicate with other gamers within
the same virtual world. As communal gaming becomes more popular — augmented
by virtual reality headsets — it promises to become even more social and
immersive, a true ‘third space’.
Voice
TV
TV
GamesTV
TV
PC
TV
PCCloud
Cloud
TV
Mode of Distribution Mode of Consumption Voice moved
from wires to
wireless
Voice
remained 1:1 ,
but wireless
spawned
group chat
(like Twitter).
Video
distribution
moved from
wireless to
wires
Consumption
moved from
group to 1:1
Game
distribution
moved from
tethered to
cloud
Consumption
moved from
1:1 to groups
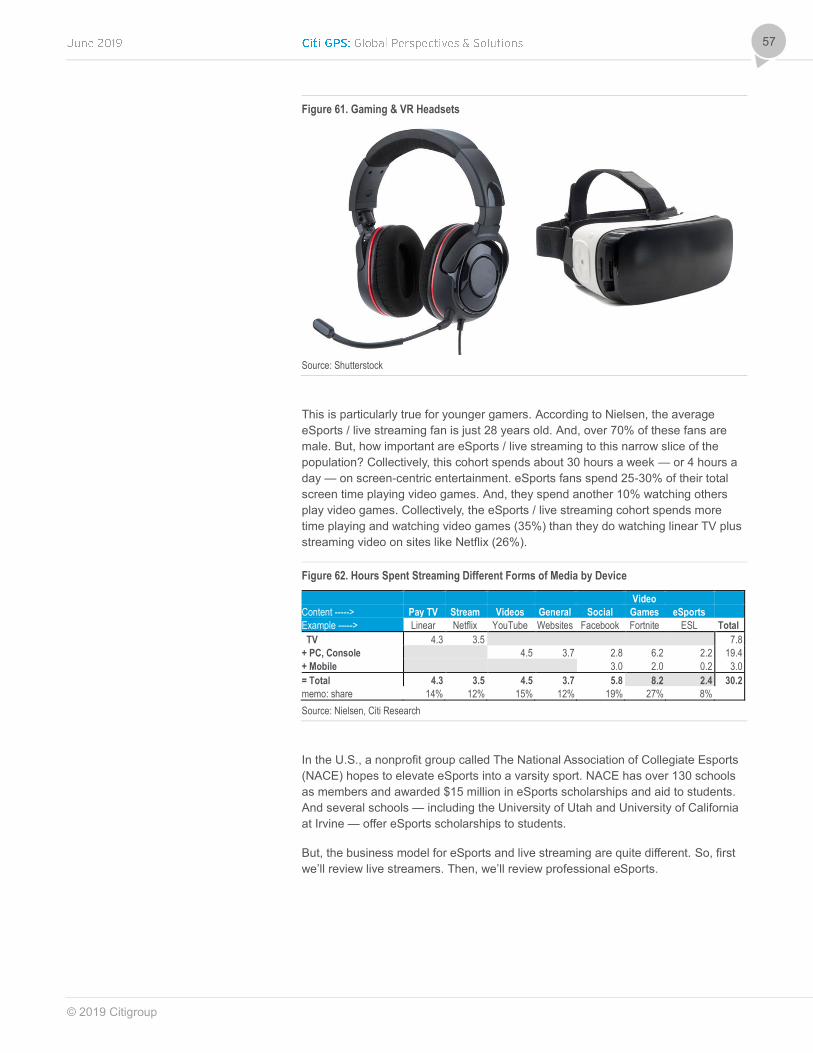
© 2019 Citigroup
57
Figure 61. Gaming & VR Headsets
Source: Shutterstock
This is particularly true for younger gamers. According to Nielsen, the average
eSports / live streaming fan is just 28 years old. And, over 70% of these fans are
male. But, how important are eSports / live streaming to this narrow slice of the
population? Collectively, this cohort spends about 30 hours a week — or 4 hours a
day — on screen-centric entertainment. eSports fans spend 25-30% of their total
screen time playing video games. And, they spend another 10% watching others
play video games. Collectively, the eSports / live streaming cohort spends more
time playing and watching video games (35%) than they do watching linear TV plus
streaming video on sites like Netflix (26%).
Figure 62. Hours Spent Streaming Different Forms of Media by Device
Video
Content -----> Pay TV Stream Videos General Social Games eSports
Example -----> Linear Netflix YouTube Websites Facebook Fortnite ESL Total
TV 4.3 3.5 7.8
+ PC, Console 4.5 3.7 2.8 6.2 2.2 19.4
+ Mobile 3.0 2.0 0.2 3.0
= Total 4.3 3.5 4.5 3.7 5.8 8.2 2.4 30.2
memo: share 14% 12% 15% 12% 19% 27% 8%
Source: Nielsen, Citi Research
In the U.S., a nonprofit group called The National Association of Collegiate Esports
(NACE) hopes to elevate eSports into a varsity sport. NACE has over 130 schools
as members and awarded $15 million in eSports scholarships and aid to students.
And several schools — including the University of Utah and University of California
at Irvine — offer eSports scholarships to students.
But, the business model for eSports and live streaming are quite different. So, first
we’ll review live streamers. Then, we’ll review professional eSports.

© 2019 Citigroup
58
Live Streamers
The live streamer model has five important entities: (1) the person who uploads the
their game play (the gamer); (2) the software firm that brings the gamer and the
viewer together (the broadcaster); (3) the business that wants to advertise to the
consumer (the advertiser); (4) the person that wants to watch an expert play the
game (the consumer); (5) and the business that wants to promote a video game or
other product or service (the sponsor).
Figure 63. Live Streaming Ecosystem
Source: Citi Research
But, how can a consumer watch someone play video games? Well, any video game
player can upload their live game to the cloud via a broadcaster. There are a
handful of useful websites for this purpose. The most prominent site is Twitch
(acquired by Amazon in 2014 for about $900 million). But, there are many rivals
including YouTube (Google), Steam TV (Valve), Mixer (Microsoft), Facebook, Huya
(China), Douya (China), and Caffeine. These streaming services are often called
video game ‘broadcasters’. And, some of these broadcasters have purchased rights
to specific eSports (something we’ll discuss in more depth in the eSports section).
Gamer
Broadcaster
Consumer
Sponsor
Advertiser
$ (sponsorship)
Content
Content
$ (subscribe)
$ (subscribe)
$ (ads)
$ (ads)
$ (donate)
Description
Top 20% of gamers collect 80% of
revenue. Popular gamers can make
>$1M per year
Economics
Gamer collects funds from: (1)
Sponsors, (2) Consumer donations,
(3) Consumer subscriptions, and (4)
Ads
Broadcaster is the hub of the
ecosystem. Brings parties together.
Broadcaster collects up to 50% of (1)
Consumer subscription fees and (2)
Ads. Broadcaster does not collect
portion of donations or sponsorships
Advertiser pays for impressions on
Broadcaster.
Ads cost around $8 per 1000
impressions. Broadcasts can keep up
to 50%. Balance remitted to gamer.
Consumer gets to see how best
players play the game.
Consumer views game play for free.
Can donate or subscribe to gamer.
Sponsor can use gamer popularity to
promote products or services. Can
be game play, YouTube videos, live
appearances, Tweets, or Instagram
videos
Wide variance in economics. But,
game play typically worth $0.10 per
viewer hour
Views
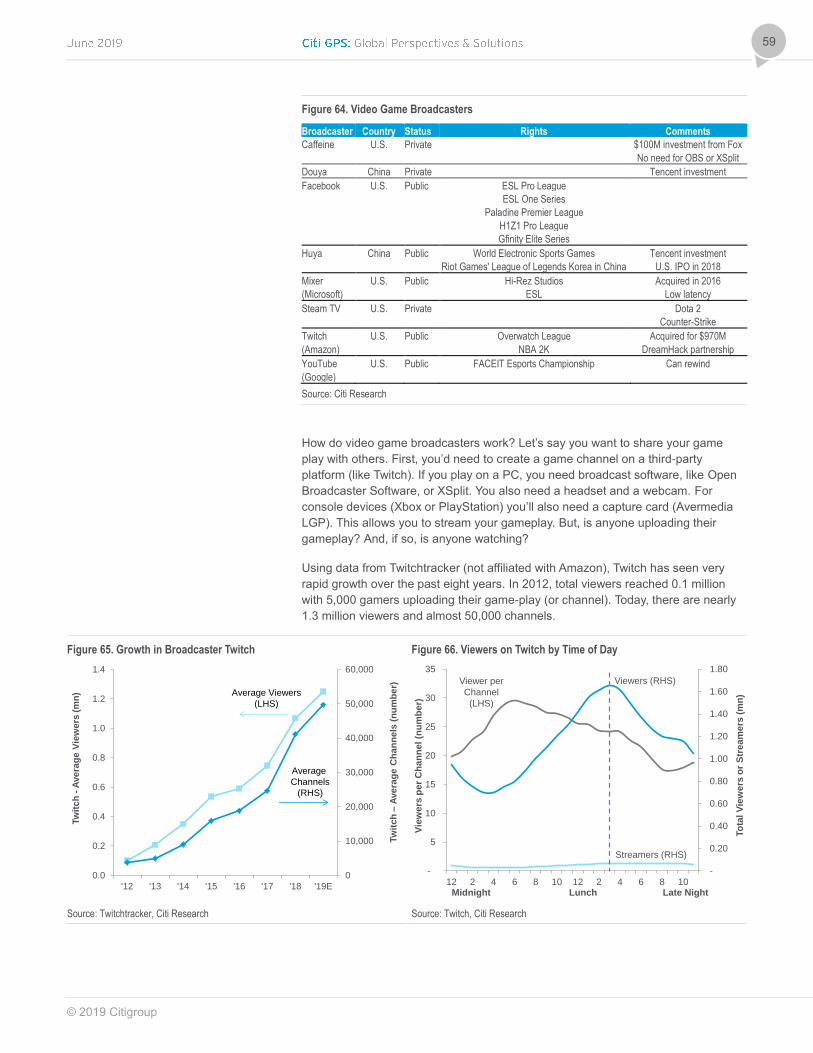
© 2019 Citigroup
59
Figure 64. Video Game Broadcasters
Broadcaster Country Status Rights Comments
Caffeine U.S. Private $100M investment from Fox
No need for OBS or XSplit
Douya China Private Tencent investment
Facebook U.S. Public ESL Pro League
ESL One Series
Paladine Premier League
H1Z1 Pro League
Gfinity Elite Series
Huya China Public World Electronic Sports Games Tencent investment
Riot Games' League of Legends Korea in China U.S. IPO in 2018
Mixer U.S. Public Hi-Rez Studios Acquired in 2016
(Microsoft) ESL Low latency
Steam TV U.S. Private Dota 2
Counter-Strike
Twitch U.S. Public Overwatch League Acquired for $970M
(Amazon) NBA 2K DreamHack partnership
YouTube U.S. Public FACEIT Esports Championship Can rewind
(Google)
Source: Citi Research
How do video game broadcasters work? Let’s say you want to share your game
play with others. First, you’d need to create a game channel on a third-party
platform (like Twitch). If you play on a PC, you need broadcast software, like Open
Broadcaster Software, or XSplit. You also need a headset and a webcam. For
console devices (Xbox or PlayStation) you’ll also need a capture card (Avermedia
LGP). This allows you to stream your gameplay. But, is anyone uploading their
gameplay? And, if so, is anyone watching?
Using data from Twitchtracker (not affiliated with Amazon), Twitch has seen very
rapid growth over the past eight years. In 2012, total viewers reached 0.1 million
with 5,000 gamers uploading their game-play (or channel). Today, there are nearly
1.3 million viewers and almost 50,000 channels.
Figure 65. Growth in Broadcaster Twitch
Figure 66. Viewers on Twitch by Time of Day
Source: Twitchtracker, Citi Research Source: Twitch, Citi Research
0
10,000
20,000
30,000
40,000
50,000
60,000
0.0
0.2
0.4
0.6
0.8
1.0
1.2
1.4
'12 '13 '14 '15 '16 '17 '18 '19E
Tw
itc
h –
Ave
rag
e C
ha
nn
els
(n
um
be
r)
Tw
itc
h -
Ave
rag
e V
iew
ers
(m
n) Average Viewers
(LHS)
Average
Channels
(RHS)
-
0.20
0.40
0.60
0.80
1.00
1.20
1.40
1.60
1.80
-
5
10
15
20
25
30
35
12 2 4 6 8 10 12 2 4 6 8 10
To
tal V
iew
ers
or
Str
ea
me
rs (
mn
)
Vie
we
rs p
er
Ch
an
ne
l (n
um
be
r)
Streamers (RHS)
Viewers (RHS)Viewer per
Channel
(LHS)
Midnight Lunch Late Night

© 2019 Citigroup
60
And, according to Twitch, about 50,000 gamers are uploading their content at any
given time (Figure 65, dark-blue line). And, on average, about 1.2 million consumers
are watching these channels (Figure 65 light-blue line). So, on average, only about
25 people are watching each channel (Figure 66 grey line). That’s a very small
audience.
You may also notice that the peak viewing hour for Twitch is about 2pm. That differs
from TV (where the peak-hour occurs around 7pm). We suspect this speaks to the
younger Twitch demographic. Recall, the average eSports fan is just 28 years old.
As such, a large number of Twitch users are likely in school (rather than working).
So, peak viewing for gaming is far earlier in the day, when school ends. Peak TV
viewing is later in the day, when work ends.
In terms of geographic mix, around two-thirds of Twitch players speak English. The
remaining one-third is spread across nine different regions. But, Russian, German,
Spanish, and French users make up about 25% of the total user base. The reaming
15% are mostly in Asia-Pac (who typically converse in Korean, Chinese, and
Japanese). In effect, Twitch is still very concentrated in North America and
underrepresented in the rest of the world, particularly Asia.
Figure 67. Twitch Players by Language
Source: Twitch, Citi Research
Gamoloco is another site that isn’t affiliated with Twitch. But, they do give fairly
detailed information on Twitch users who upload their game (and create a channel).
Crucially, the Gamoloco data is organized by both game title and by channel.
In aggregate, Gamoloco has similar figures to Twitch: about 78K people are
uploading their game play at any given time. And, about 50% of all channels are for
the 10 most popular games. The average channel only has about 15 people
watching the live stream (versus 25 using Twitch data). While there’s some variance
by game title, the general rule is this: the more channels a game title has, the fewer
the viewers per channel.
63%
8%
7%5%
5%4%
3% 2% 2% 2%
0%
10%
20%
30%
40%
50%
60%
70%
80%
90%
100%
En
glis
h
Ru
ssia
n
Ge
rma
n
Sp
an
ish
Fre
nch
Ko
rea
n
Po
rtu
ge
se
Ch
ine
se
Ja
pa
ne
se
Turk
ish
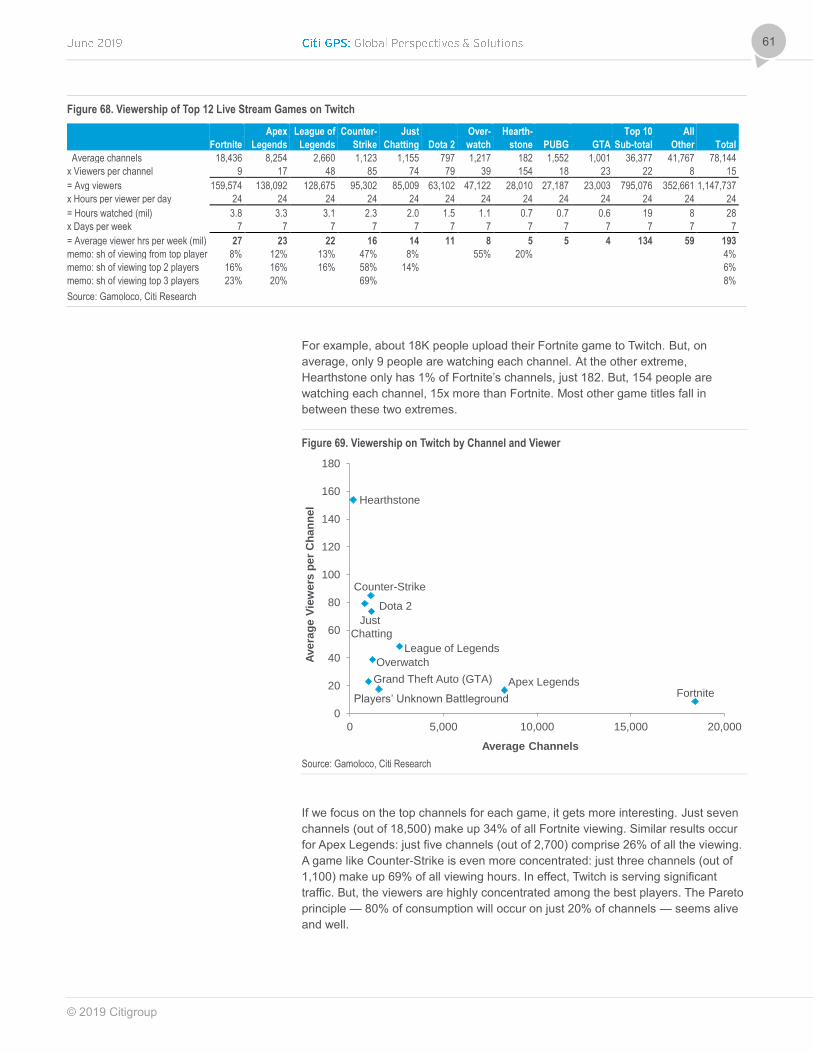
© 2019 Citigroup
61
Figure 68. Viewership of Top 12 Live Stream Games on Twitch
Apex League of Counter- Just Over- Hearth- Top 10 All
Fortnite Legends Legends Strike Chatting Dota 2 watch stone PUBG GTA Sub-total Other Total
Average channels 18,436 8,254 2,660 1,123 1,155 797 1,217 182 1,552 1,001 36,377 41,767 78,144
x Viewers per channel 9 17 48 85 74 79 39 154 18 23 22 8 15
= Avg viewers 159,574 138,092 128,675 95,302 85,009 63,102 47,122 28,010 27,187 23,003 795,076 352,661 1,147,737
x Hours per viewer per day 24 24 24 24 24 24 24 24 24 24 24 24 24
= Hours watched (mil) 3.8 3.3 3.1 2.3 2.0 1.5 1.1 0.7 0.7 0.6 19 8 28
x Days per week 7 7 7 7 7 7 7 7 7 7 7 7 7
= Average viewer hrs per week (mil) 27 23 22 16 14 11 8 5 5 4 134 59 193
memo: sh of viewing from top player 8% 12% 13% 47% 8% 55% 20% 4%
memo: sh of viewing top 2 players 16% 16% 16% 58% 14% 6%
memo: sh of viewing top 3 players 23% 20% 69% 8%
Source: Gamoloco, Citi Research
For example, about 18K people upload their Fortnite game to Twitch. But, on
average, only 9 people are watching each channel. At the other extreme,
Hearthstone only has 1% of Fortnite’s channels, just 182. But, 154 people are
watching each channel, 15x more than Fortnite. Most other game titles fall in
between these two extremes.
Figure 69. Viewership on Twitch by Channel and Viewer
Source: Gamoloco, Citi Research
If we focus on the top channels for each game, it gets more interesting. Just seven
channels (out of 18,500) make up 34% of all Fortnite viewing. Similar results occur
for Apex Legends: just five channels (out of 2,700) comprise 26% of all the viewing.
A game like Counter-Strike is even more concentrated: just three channels (out of
1,100) make up 69% of all viewing hours. In effect, Twitch is serving significant
traffic. But, the viewers are highly concentrated among the best players. The Pareto
principle — 80% of consumption will occur on just 20% of channels — seems alive
and well.
0
20
40
60
80
100
120
140
160
180
0 5,000 10,000 15,000 20,000
Ave
rag
e V
iew
ers
pe
r C
ha
nn
el
Average Channels
Fortnite
Hearthstone
Apex Legends
League of Legends
Counter-Strike
Just
Chatting
Dota 2
Overwatch
Grand Theft Auto (GTA)
Players’ Unknown Battleground
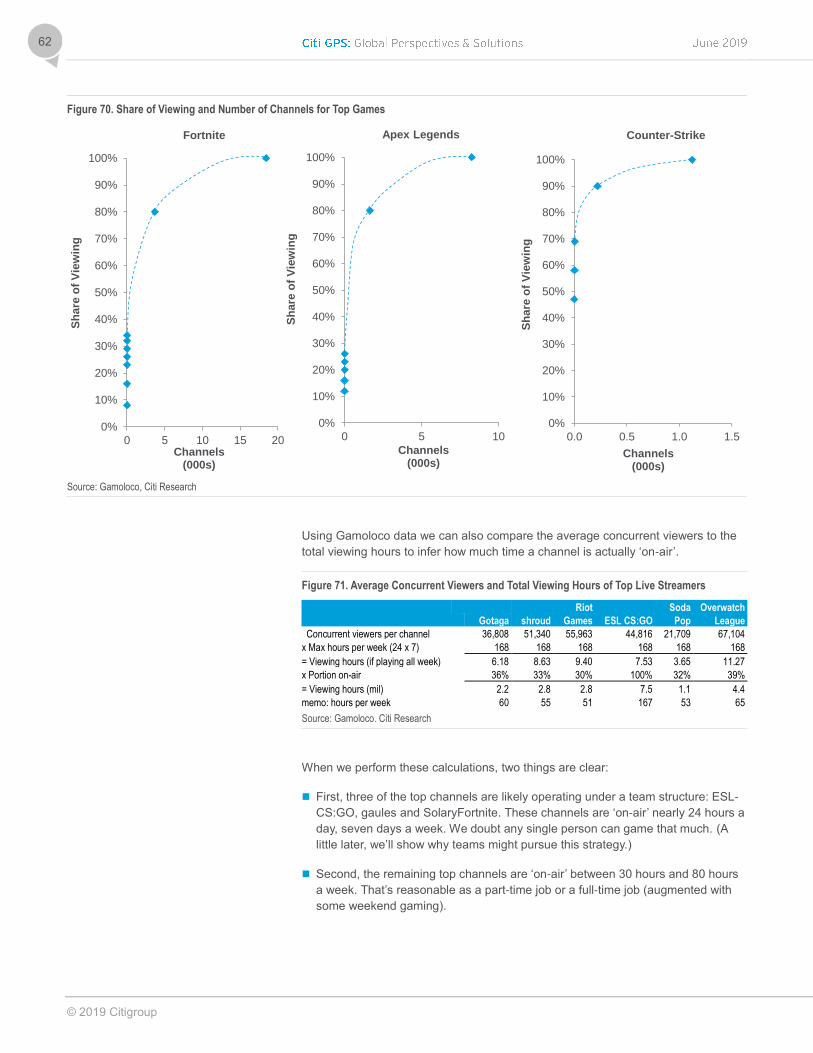
© 2019 Citigroup
62
Figure 70. Share of Viewing and Number of Channels for Top Games
Source: Gamoloco, Citi Research
Using Gamoloco data we can also compare the average concurrent viewers to the
total viewing hours to infer how much time a channel is actually ‘on-air’.
Figure 71. Average Concurrent Viewers and Total Viewing Hours of Top Live Streamers
Riot Soda Overwatch
Gotaga shroud Games ESL CS:GO Pop League
Concurrent viewers per channel 36,808 51,340 55,963 44,816 21,709 67,104
x Max hours per week (24 x 7) 168 168 168 168 168 168
= Viewing hours (if playing all week) 6.18 8.63 9.40 7.53 3.65 11.27
x Portion on-air 36% 33% 30% 100% 32% 39%
= Viewing hours (mil) 2.2 2.8 2.8 7.5 1.1 4.4
memo: hours per week 60 55 51 167 53 65
Source: Gamoloco. Citi Research
When we perform these calculations, two things are clear:
First, three of the top channels are likely operating under a team structure: ESL-
CS:GO, gaules and SolaryFortnite. These channels are ‘on-air’ nearly 24 hours a
day, seven days a week. We doubt any single person can game that much. (A
little later, we’ll show why teams might pursue this strategy.)
Second, the remaining top channels are ‘on-air’ between 30 hours and 80 hours
a week. That’s reasonable as a part-time job or a full-time job (augmented with
some weekend gaming).
0%
10%
20%
30%
40%
50%
60%
70%
80%
90%
100%
0 5 10 15 20
Sh
are
of
Vie
win
g
Channels(000s)
Fortnite
0%
10%
20%
30%
40%
50%
60%
70%
80%
90%
100%
0 5 10
Sh
are
of
Vie
win
g
Channels(000s)
Apex Legends
0%
10%
20%
30%
40%
50%
60%
70%
80%
90%
100%
0.0 0.5 1.0 1.5
Sh
are
of
Vie
win
g
Channels(000s)
Counter-Strike
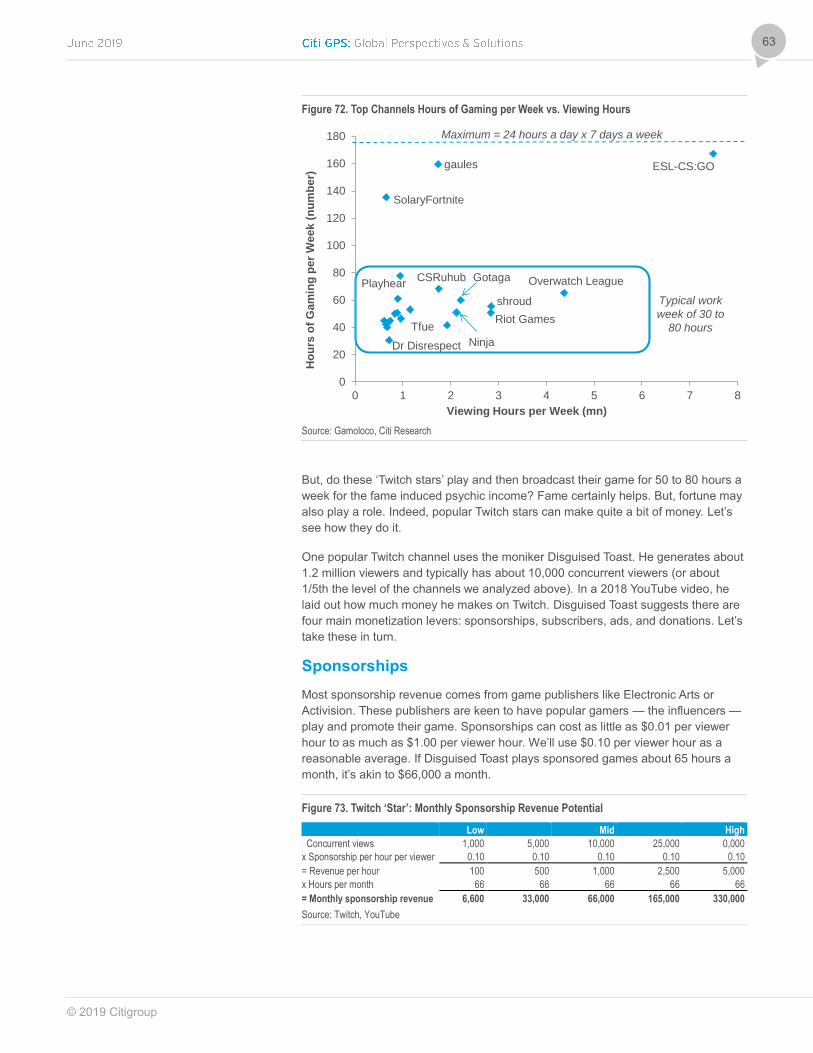
© 2019 Citigroup
63
Figure 72. Top Channels Hours of Gaming per Week vs. Viewing Hours
Source: Gamoloco, Citi Research
But, do these ‘Twitch stars’ play and then broadcast their game for 50 to 80 hours a
week for the fame induced psychic income? Fame certainly helps. But, fortune may
also play a role. Indeed, popular Twitch stars can make quite a bit of money. Let’s
see how they do it.
One popular Twitch channel uses the moniker Disguised Toast. He generates about
1.2 million viewers and typically has about 10,000 concurrent viewers (or about
1/5th the level of the channels we analyzed above). In a 2018 YouTube video, he
laid out how much money he makes on Twitch. Disguised Toast suggests there are
four main monetization levers: sponsorships, subscribers, ads, and donations. Let’s
take these in turn.
Sponsorships
Most sponsorship revenue comes from game publishers like Electronic Arts or
Activision. These publishers are keen to have popular gamers — the influencers —
play and promote their game. Sponsorships can cost as little as $0.01 per viewer
hour to as much as $1.00 per viewer hour. We’ll use $0.10 per viewer hour as a
reasonable average. If Disguised Toast plays sponsored games about 65 hours a
month, it’s akin to $66,000 a month.
Figure 73. Twitch ‘Star’: Monthly Sponsorship Revenue Potential
Low Mid High
Concurrent views 1,000 5,000 10,000 25,000 0,000
x Sponsorship per hour per viewer 0.10 0.10 0.10 0.10 0.10
= Revenue per hour 100 500 1,000 2,500 5,000
x Hours per month 66 66 66 66 66
= Monthly sponsorship revenue 6,600 33,000 66,000 165,000 330,000
Source: Twitch, YouTube
0
20
40
60
80
100
120
140
160
180
0 1 2 3 4 5 6 7 8
Ho
urs
of
Ga
min
g p
er
We
ek (
nu
mb
er)
Viewing Hours per Week (mn)
ESL-CS:GOgaules
SolaryFortnite
Overwatch LeaguePlayhear
Ninja
Riot Games
shroud
GotagaCSRuhub
Maximum = 24 hours a day x 7 days a week
Dr Disrespect
Typical work
week of 30 to
80 hoursTfue
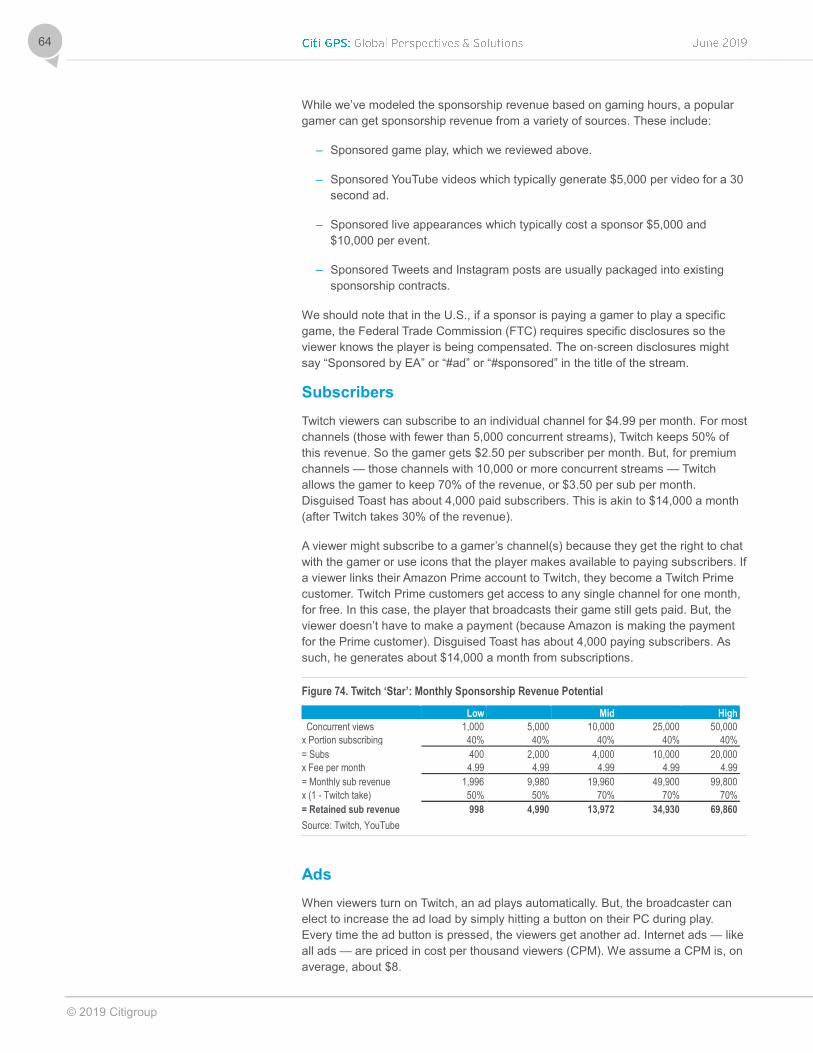
© 2019 Citigroup
64
While we’ve modeled the sponsorship revenue based on gaming hours, a popular
gamer can get sponsorship revenue from a variety of sources. These include:
– Sponsored game play, which we reviewed above.
– Sponsored YouTube videos which typically generate $5,000 per video for a 30
second ad.
– Sponsored live appearances which typically cost a sponsor $5,000 and
$10,000 per event.
– Sponsored Tweets and Instagram posts are usually packaged into existing
sponsorship contracts.
We should note that in the U.S., if a sponsor is paying a gamer to play a specific
game, the Federal Trade Commission (FTC) requires specific disclosures so the
viewer knows the player is being compensated. The on-screen disclosures might
say “Sponsored by EA” or “#ad” or “#sponsored” in the title of the stream.
Subscribers
Twitch viewers can subscribe to an individual channel for $4.99 per month. For most
channels (those with fewer than 5,000 concurrent streams), Twitch keeps 50% of
this revenue. So the gamer gets $2.50 per subscriber per month. But, for premium
channels — those channels with 10,000 or more concurrent streams — Twitch
allows the gamer to keep 70% of the revenue, or $3.50 per sub per month.
Disguised Toast has about 4,000 paid subscribers. This is akin to $14,000 a month
(after Twitch takes 30% of the revenue).
A viewer might subscribe to a gamer’s channel(s) because they get the right to chat
with the gamer or use icons that the player makes available to paying subscribers. If
a viewer links their Amazon Prime account to Twitch, they become a Twitch Prime
customer. Twitch Prime customers get access to any single channel for one month,
for free. In this case, the player that broadcasts their game still gets paid. But, the
viewer doesn’t have to make a payment (because Amazon is making the payment
for the Prime customer). Disguised Toast has about 4,000 paying subscribers. As
such, he generates about $14,000 a month from subscriptions.
Figure 74. Twitch ‘Star’: Monthly Sponsorship Revenue Potential
Low Mid High
Concurrent views 1,000 5,000 10,000 25,000 50,000
x Portion subscribing 40% 40% 40% 40% 40%
= Subs 400 2,000 4,000 10,000 20,000
x Fee per month 4.99 4.99 4.99 4.99 4.99
= Monthly sub revenue 1,996 9,980 19,960 49,900 99,800
x (1 - Twitch take) 50% 50% 70% 70% 70%
= Retained sub revenue 998 4,990 13,972 34,930 69,860
Source: Twitch, YouTube
Ads
When viewers turn on Twitch, an ad plays automatically. But, the broadcaster can
elect to increase the ad load by simply hitting a button on their PC during play.
Every time the ad button is pressed, the viewers get another ad. Internet ads — like
all ads — are priced in cost per thousand viewers (CPM). We assume a CPM is, on
average, about $8.
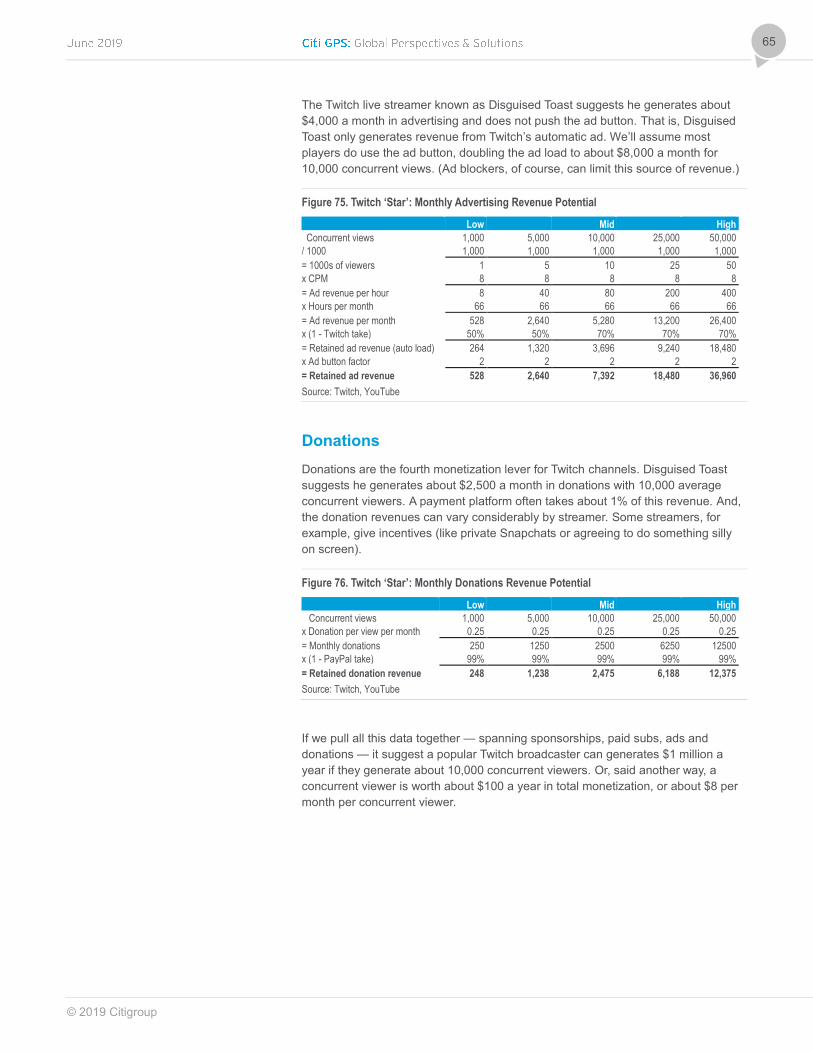
© 2019 Citigroup
65
The Twitch live streamer known as Disguised Toast suggests he generates about
$4,000 a month in advertising and does not push the ad button. That is, Disguised
Toast only generates revenue from Twitch’s automatic ad. We’ll assume most
players do use the ad button, doubling the ad load to about $8,000 a month for
10,000 concurrent views. (Ad blockers, of course, can limit this source of revenue.)
Figure 75. Twitch ‘Star’: Monthly Advertising Revenue Potential
Low Mid High
Concurrent views 1,000 5,000 10,000 25,000 50,000
/ 1000 1,000 1,000 1,000 1,000 1,000
= 1000s of viewers 1 5 10 25 50
x CPM 8 8 8 8 8
= Ad revenue per hour 8 40 80 200 400
x Hours per month 66 66 66 66 66
= Ad revenue per month 528 2,640 5,280 13,200 26,400
x (1 - Twitch take) 50% 50% 70% 70% 70%
= Retained ad revenue (auto load) 264 1,320 3,696 9,240 18,480
x Ad button factor 2 2 2 2 2
= Retained ad revenue 528 2,640 7,392 18,480 36,960
Source: Twitch, YouTube
Donations
Donations are the fourth monetization lever for Twitch channels. Disguised Toast
suggests he generates about $2,500 a month in donations with 10,000 average
concurrent viewers. A payment platform often takes about 1% of this revenue. And,
the donation revenues can vary considerably by streamer. Some streamers, for
example, give incentives (like private Snapchats or agreeing to do something silly
on screen).
Figure 76. Twitch ‘Star’: Monthly Donations Revenue Potential
Low Mid High
Concurrent views 1,000 5,000 10,000 25,000 50,000
x Donation per view per month 0.25 0.25 0.25 0.25 0.25
= Monthly donations 250 1250 2500 6250 12500
x (1 - PayPal take) 99% 99% 99% 99% 99%
= Retained donation revenue 248 1,238 2,475 6,188 12,375
Source: Twitch, YouTube
If we pull all this data together — spanning sponsorships, paid subs, ads and
donations — it suggest a popular Twitch broadcaster can generates $1 million a
year if they generate about 10,000 concurrent viewers. Or, said another way, a
concurrent viewer is worth about $100 a year in total monetization, or about $8 per
month per concurrent viewer.
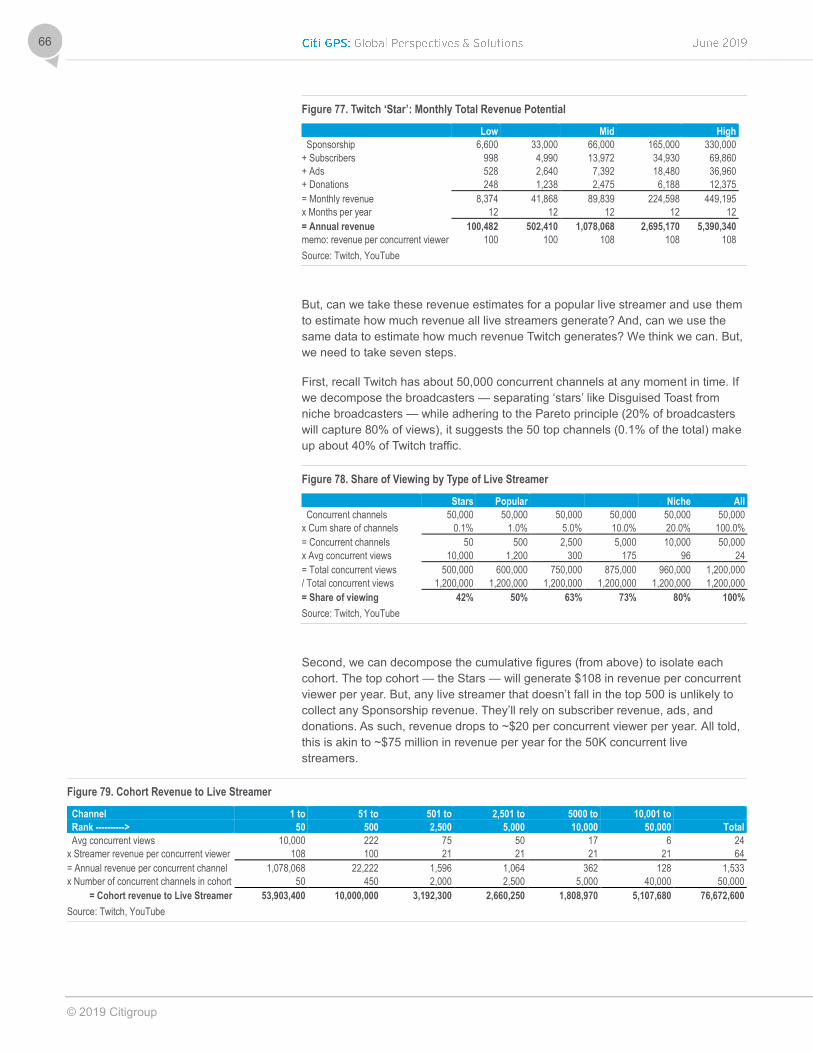
© 2019 Citigroup
66
Figure 77. Twitch ‘Star’: Monthly Total Revenue Potential
Low Mid High
Sponsorship 6,600 33,000 66,000 165,000 330,000
+ Subscribers 998 4,990 13,972 34,930 69,860
+ Ads 528 2,640 7,392 18,480 36,960
+ Donations 248 1,238 2,475 6,188 12,375
= Monthly revenue 8,374 41,868 89,839 224,598 449,195
x Months per year 12 12 12 12 12
= Annual revenue 100,482 502,410 1,078,068 2,695,170 5,390,340
memo: revenue per concurrent viewer 100 100 108 108 108
Source: Twitch, YouTube
But, can we take these revenue estimates for a popular live streamer and use them
to estimate how much revenue all live streamers generate? And, can we use the
same data to estimate how much revenue Twitch generates? We think we can. But,
we need to take seven steps.
First, recall Twitch has about 50,000 concurrent channels at any moment in time. If
we decompose the broadcasters — separating ‘stars’ like Disguised Toast from
niche broadcasters — while adhering to the Pareto principle (20% of broadcasters
will capture 80% of views), it suggests the 50 top channels (0.1% of the total) make
up about 40% of Twitch traffic.
Figure 78. Share of Viewing by Type of Live Streamer
Stars Popular Niche All
Concurrent channels 50,000 50,000 50,000 50,000 50,000 50,000
x Cum share of channels 0.1% 1.0% 5.0% 10.0% 20.0% 100.0%
= Concurrent channels 50 500 2,500 5,000 10,000 50,000
x Avg concurrent views 10,000 1,200 300 175 96 24
= Total concurrent views 500,000 600,000 750,000 875,000 960,000 1,200,000
/ Total concurrent views 1,200,000 1,200,000 1,200,000 1,200,000 1,200,000 1,200,000
= Share of viewing 42% 50% 63% 73% 80% 100%
Source: Twitch, YouTube
Second, we can decompose the cumulative figures (from above) to isolate each
cohort. The top cohort — the Stars — will generate $108 in revenue per concurrent
viewer per year. But, any live streamer that doesn’t fall in the top 500 is unlikely to
collect any Sponsorship revenue. They’ll rely on subscriber revenue, ads, and
donations. As such, revenue drops to ~$20 per concurrent viewer per year. All told,
this is akin to ~$75 million in revenue per year for the 50K concurrent live
streamers.
Figure 79. Cohort Revenue to Live Streamer
Channel 1 to 51 to 501 to 2,501 to 5000 to 10,001 to
Rank ----------> 50 500 2,500 5,000 10,000 50,000 Total
Avg concurrent views 10,000 222 75 50 17 6 24
x Streamer revenue per concurrent viewer 108 100 21 21 21 21 64
= Annual revenue per concurrent channel 1,078,068 22,222 1,596 1,064 362 128 1,533
x Number of concurrent channels in cohort 50 450 2,000 2,500 5,000 40,000 50,000
= Cohort revenue to Live Streamer 53,903,400 10,000,000 3,192,300 2,660,250 1,808,970 5,107,680 76,672,600
Source: Twitch, YouTube
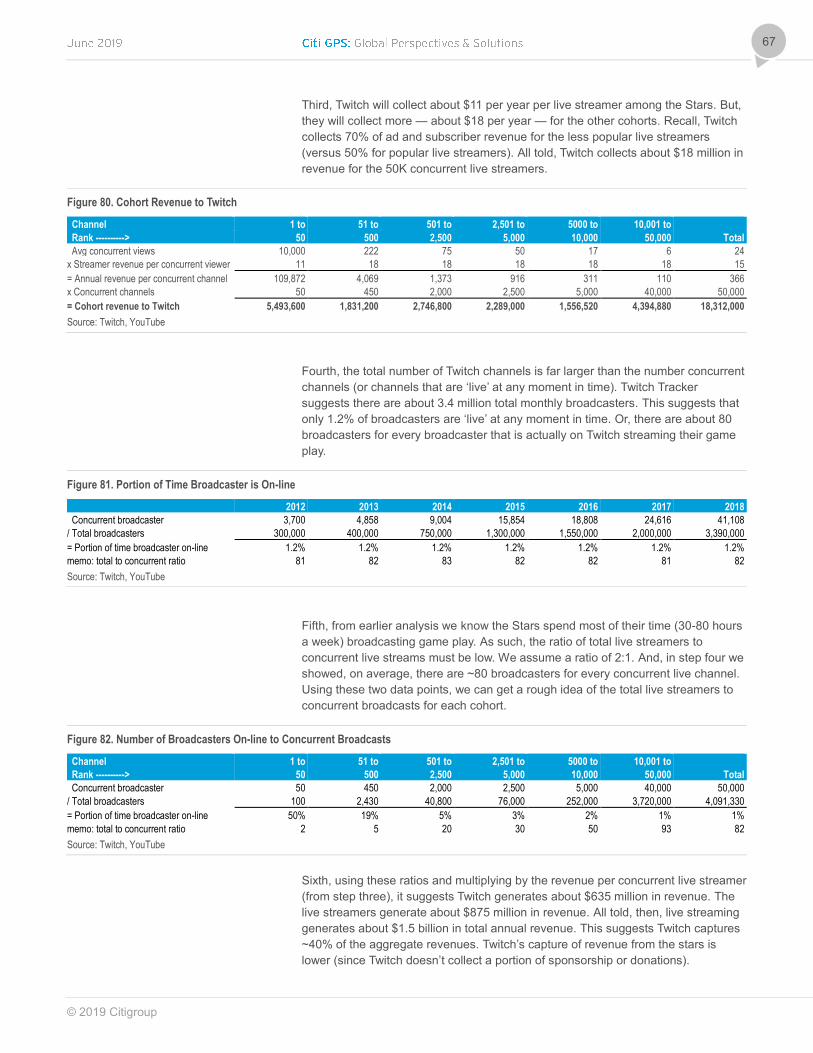
© 2019 Citigroup
67
Third, Twitch will collect about $11 per year per live streamer among the Stars. But,
they will collect more — about $18 per year — for the other cohorts. Recall, Twitch
collects 70% of ad and subscriber revenue for the less popular live streamers
(versus 50% for popular live streamers). All told, Twitch collects about $18 million in
revenue for the 50K concurrent live streamers.
Figure 80. Cohort Revenue to Twitch
Channel 1 to 51 to 501 to 2,501 to 5000 to 10,001 to
Rank ----------> 50 500 2,500 5,000 10,000 50,000 Total
Avg concurrent views 10,000 222 75 50 17 6 24
x Streamer revenue per concurrent viewer 11 18 18 18 18 18 15
= Annual revenue per concurrent channel 109,872 4,069 1,373 916 311 110 366
x Concurrent channels 50 450 2,000 2,500 5,000 40,000 50,000
= Cohort revenue to Twitch 5,493,600 1,831,200 2,746,800 2,289,000 1,556,520 4,394,880 18,312,000
Source: Twitch, YouTube
Fourth, the total number of Twitch channels is far larger than the number concurrent
channels (or channels that are ‘live’ at any moment in time). Twitch Tracker
suggests there are about 3.4 million total monthly broadcasters. This suggests that
only 1.2% of broadcasters are ‘live’ at any moment in time. Or, there are about 80
broadcasters for every broadcaster that is actually on Twitch streaming their game
play.
Figure 81. Portion of Time Broadcaster is On-line
2012 2013 2014 2015 2016 2017 2018
Concurrent broadcaster 3,700 4,858 9,004 15,854 18,808 24,616 41,108
/ Total broadcasters 300,000 400,000 750,000 1,300,000 1,550,000 2,000,000 3,390,000
= Portion of time broadcaster on-line 1.2% 1.2% 1.2% 1.2% 1.2% 1.2% 1.2%
memo: total to concurrent ratio 81 82 83 82 82 81 82
Source: Twitch, YouTube
Fifth, from earlier analysis we know the Stars spend most of their time (30-80 hours
a week) broadcasting game play. As such, the ratio of total live streamers to
concurrent live streams must be low. We assume a ratio of 2:1. And, in step four we
showed, on average, there are ~80 broadcasters for every concurrent live channel.
Using these two data points, we can get a rough idea of the total live streamers to
concurrent broadcasts for each cohort.
Figure 82. Number of Broadcasters On-line to Concurrent Broadcasts
Channel 1 to 51 to 501 to 2,501 to 5000 to 10,001 to
Rank ----------> 50 500 2,500 5,000 10,000 50,000 Total
Concurrent broadcaster 50 450 2,000 2,500 5,000 40,000 50,000
/ Total broadcasters 100 2,430 40,800 76,000 252,000 3,720,000 4,091,330
= Portion of time broadcaster on-line 50% 19% 5% 3% 2% 1% 1%
memo: total to concurrent ratio 2 5 20 30 50 93 82
Source: Twitch, YouTube
Sixth, using these ratios and multiplying by the revenue per concurrent live streamer
(from step three), it suggests Twitch generates about $635 million in revenue. The
live streamers generate about $875 million in revenue. All told, then, live streaming
generates about $1.5 billion in total annual revenue. This suggests Twitch captures
~40% of the aggregate revenues. Twitch’s capture of revenue from the stars is
lower (since Twitch doesn’t collect a portion of sponsorship or donations).
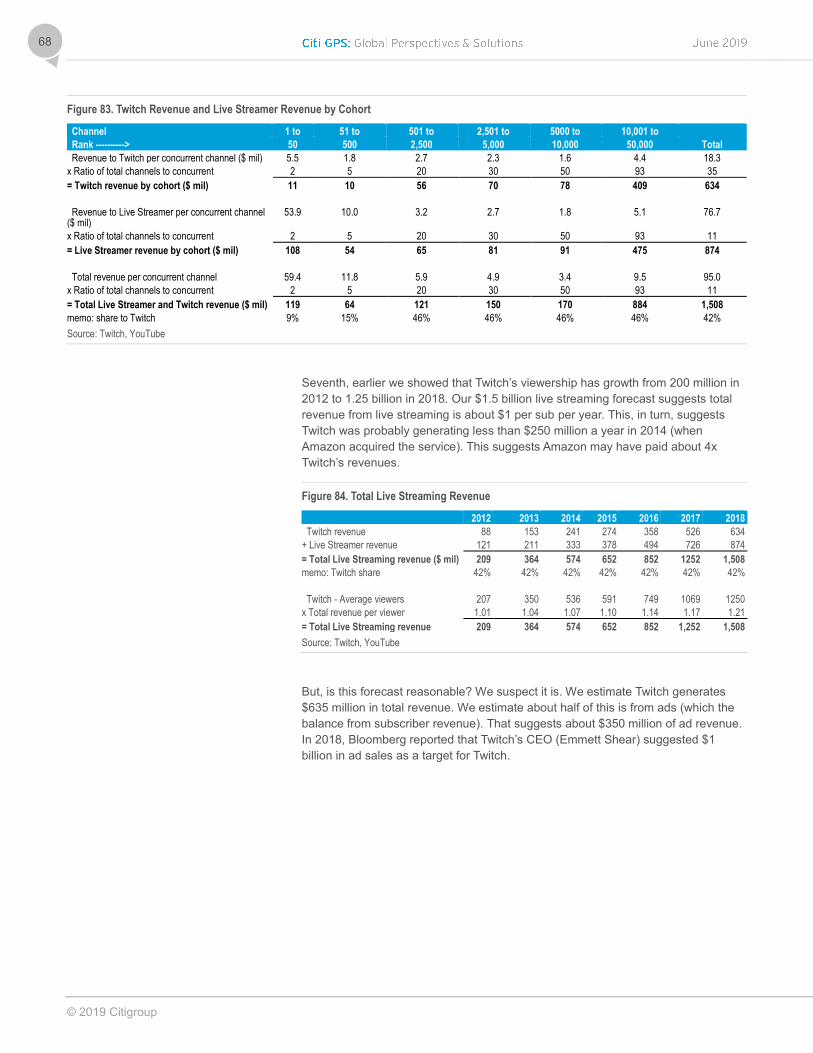
© 2019 Citigroup
68
Figure 83. Twitch Revenue and Live Streamer Revenue by Cohort
Channel 1 to 51 to 501 to 2,501 to 5000 to 10,001 to
Rank ----------> 50 500 2,500 5,000 10,000 50,000 Total
Revenue to Twitch per concurrent channel ($ mil) 5.5 1.8 2.7 2.3 1.6 4.4 18.3
x Ratio of total channels to concurrent 2 5 20 30 50 93 35
= Twitch revenue by cohort ($ mil) 11 10 56 70 78 409 634
Revenue to Live Streamer per concurrent channel ($ mil)
53.9 10.0 3.2 2.7 1.8 5.1 76.7
x Ratio of total channels to concurrent 2 5 20 30 50 93 11
= Live Streamer revenue by cohort ($ mil) 108 54 65 81 91 475 874
Total revenue per concurrent channel 59.4 11.8 5.9 4.9 3.4 9.5 95.0
x Ratio of total channels to concurrent 2 5 20 30 50 93 11
= Total Live Streamer and Twitch revenue ($ mil) 119 64 121 150 170 884 1,508
memo: share to Twitch 9% 15% 46% 46% 46% 46% 42%
Source: Twitch, YouTube
Seventh, earlier we showed that Twitch’s viewership has growth from 200 million in
2012 to 1.25 billion in 2018. Our $1.5 billion live streaming forecast suggests total
revenue from live streaming is about $1 per sub per year. This, in turn, suggests
Twitch was probably generating less than $250 million a year in 2014 (when
Amazon acquired the service). This suggests Amazon may have paid about 4x
Twitch’s revenues.
Figure 84. Total Live Streaming Revenue
2012 2013 2014 2015 2016 2017 2018
Twitch revenue 88 153 241 274 358 526 634
+ Live Streamer revenue 121 211 333 378 494 726 874
= Total Live Streaming revenue ($ mil) 209 364 574 652 852 1252 1,508
memo: Twitch share 42% 42% 42% 42% 42% 42% 42%
Twitch - Average viewers 207 350 536 591 749 1069 1250
x Total revenue per viewer 1.01 1.04 1.07 1.10 1.14 1.17 1.21
= Total Live Streaming revenue 209 364 574 652 852 1,252 1,508
Source: Twitch, YouTube
But, is this forecast reasonable? We suspect it is. We estimate Twitch generates
$635 million in total revenue. We estimate about half of this is from ads (which the
balance from subscriber revenue). That suggests about $350 million of ad revenue.
In 2018, Bloomberg reported that Twitch’s CEO (Emmett Shear) suggested $1
billion in ad sales as a target for Twitch.
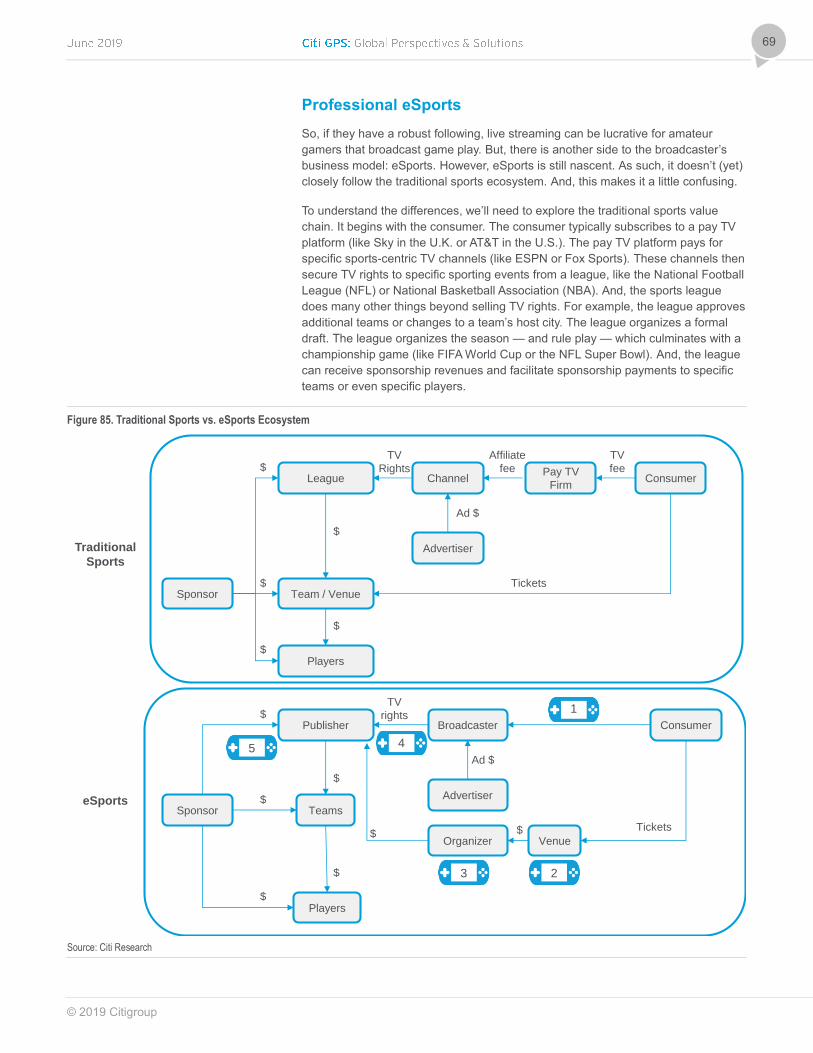
© 2019 Citigroup
69
Professional eSports
So, if they have a robust following, live streaming can be lucrative for amateur
gamers that broadcast game play. But, there is another side to the broadcaster’s
business model: eSports. However, eSports is still nascent. As such, it doesn’t (yet)
closely follow the traditional sports ecosystem. And, this makes it a little confusing.
To understand the differences, we’ll need to explore the traditional sports value
chain. It begins with the consumer. The consumer typically subscribes to a pay TV
platform (like Sky in the U.K. or AT&T in the U.S.). The pay TV platform pays for
specific sports-centric TV channels (like ESPN or Fox Sports). These channels then
secure TV rights to specific sporting events from a league, like the National Football
League (NFL) or National Basketball Association (NBA). And, the sports league
does many other things beyond selling TV rights. For example, the league approves
additional teams or changes to a team’s host city. The league organizes a formal
draft. The league organizes the season — and rule play — which culminates with a
championship game (like FIFA World Cup or the NFL Super Bowl). And, the league
can receive sponsorship revenues and facilitate sponsorship payments to specific
teams or even specific players.
Figure 85. Traditional Sports vs. eSports Ecosystem
Source: Citi Research
5 4
League
Team / Venue
ConsumerPay TV
FirmChannel
Advertiser
Sponsor
Players
TV
fee
Affiliate
fee
TV
Rights
Ad $
Tickets
$
$
$
$
$
Publisher
Teams
ConsumerBroadcaster
Advertiser
Sponsor
Players
TV
rights
Ad $
Tickets
$
$
$
$
$
VenueOrganizer$$
Traditional
Sports
eSports
1
23

© 2019 Citigroup
70
If we compare the value chain for traditional sports versus eSports at a conceptual
level, today there are five key differences. First, the consumer can get access to
eSports for free (via broadcasters like Twitch). Second, the consumer doesn’t buy a
ticket from the team. Rather, they purchase a ticket to a specific eSports venue,
which is often leased (while most traditional sports teams own their own facility).
Third, since eSports events are episodic, organizers often help promote the event.
Fourth, for some eSports events, it’s possible for broadcasters (like Twitch) to
acquire rights directly from a game publisher, like Activision. (There are instances
where media rights are sold by event organizers as well.) Fifth, in eSports, it’s
possible for the publisher to act like a league owner in traditional sports.
This leads to a subtle, but important, point. For traditional sports, in the U.S., the
league has a commissioner. The commissioner is hired by the team owners and,
collectively the team owners decide if they want to change the rules of the game,
add a team to the league, or make any other rule change. In other markets, even if
there is a more fluid system — where grassroots teams can access top tier leagues
without buying a franchise — there is usually a body who controls the parameters
which determines league access.
For eSports, the public firms that sell the franchise rights (i.e., Activision) are public
companies. As such, they serve the interest of shareholders. And, the intellectual
property associated with the league is owned by game publisher. So, any eSports
team tethered to particular IP is beholden to the game publisher. Of course, in
traditional sports, team franchise owners aren’t beholden to anyone. That’s one
reason — but not the only reason — why a traditional sports franchise in the U.S.
might sell for several billion while an eSports franchise in the U.S. might only sell for
tens of millions.
Beyond these five major differences, however, there are a slew of other subtle
differences between eSports and traditional sports. The key differences include: (1)
the drafting of players; (2) professional team structure; (3) sports leagues; (4)
venues to watch live event; (5) tournament play; (6) ways to watch less popular,
niche events; and (7) ways to watch popular events. For five of these seven
attributes, it is clear that eSports is at a much earlier stage of evolution than
traditional sports. Let’s take a closer look:
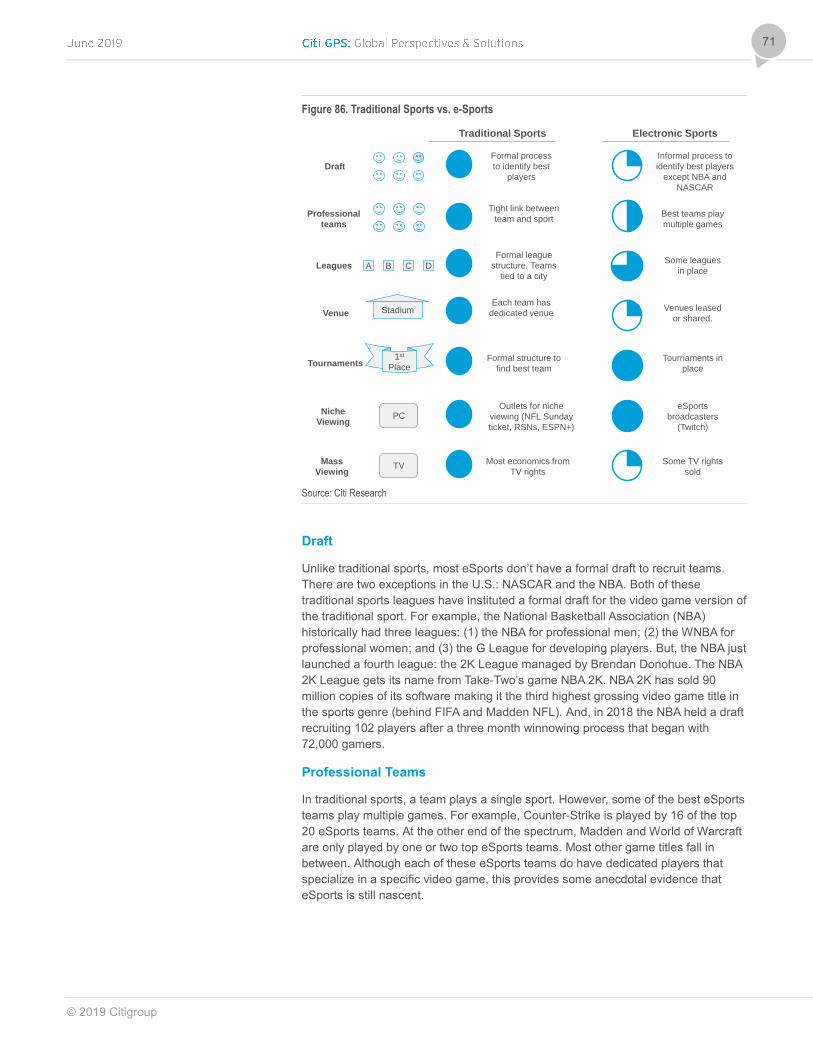
© 2019 Citigroup
71
Figure 86. Traditional Sports vs. e-Sports
Source: Citi Research
Draft
Unlike traditional sports, most eSports don’t have a formal draft to recruit teams.
There are two exceptions in the U.S.: NASCAR and the NBA. Both of these
traditional sports leagues have instituted a formal draft for the video game version of
the traditional sport. For example, the National Basketball Association (NBA)
historically had three leagues: (1) the NBA for professional men; (2) the WNBA for
professional women; and (3) the G League for developing players. But, the NBA just
launched a fourth league: the 2K League managed by Brendan Donohue. The NBA
2K League gets its name from Take-Two’s game NBA 2K. NBA 2K has sold 90
million copies of its software making it the third highest grossing video game title in
the sports genre (behind FIFA and Madden NFL). And, in 2018 the NBA held a draft
recruiting 102 players after a three month winnowing process that began with
72,000 gamers.
Professional Teams
In traditional sports, a team plays a single sport. However, some of the best eSports
teams play multiple games. For example, Counter-Strike is played by 16 of the top
20 eSports teams. At the other end of the spectrum, Madden and World of Warcraft
are only played by one or two top eSports teams. Most other game titles fall in
between. Although each of these eSports teams do have dedicated players that
specialize in a specific video game, this provides some anecdotal evidence that
eSports is still nascent.
Traditional Sports Electronic Sports
TV
1st
Place
Stadium
Mass
Viewing
PCNiche
Viewing
Tournaments
Venue
Draft
Professional
teams
A B C DLeagues
Formal process
to identify best
players
Informal process to
identify best players
except NBA and
NASCAR
Tight link between
team and sportBest teams play
multiple games
Formal league
structure. Teams
tied to a city
Some leagues
in place
Each team has
dedicated venueVenues leased
or shared.
Formal structure to
find best team
Tournaments in
place
Outlets for niche
viewing (NFL Sunday
ticket, RSNs, ESPN+)
eSports
broadcasters
(Twitch)
Most economics from
TV rights
Some TV rights
sold
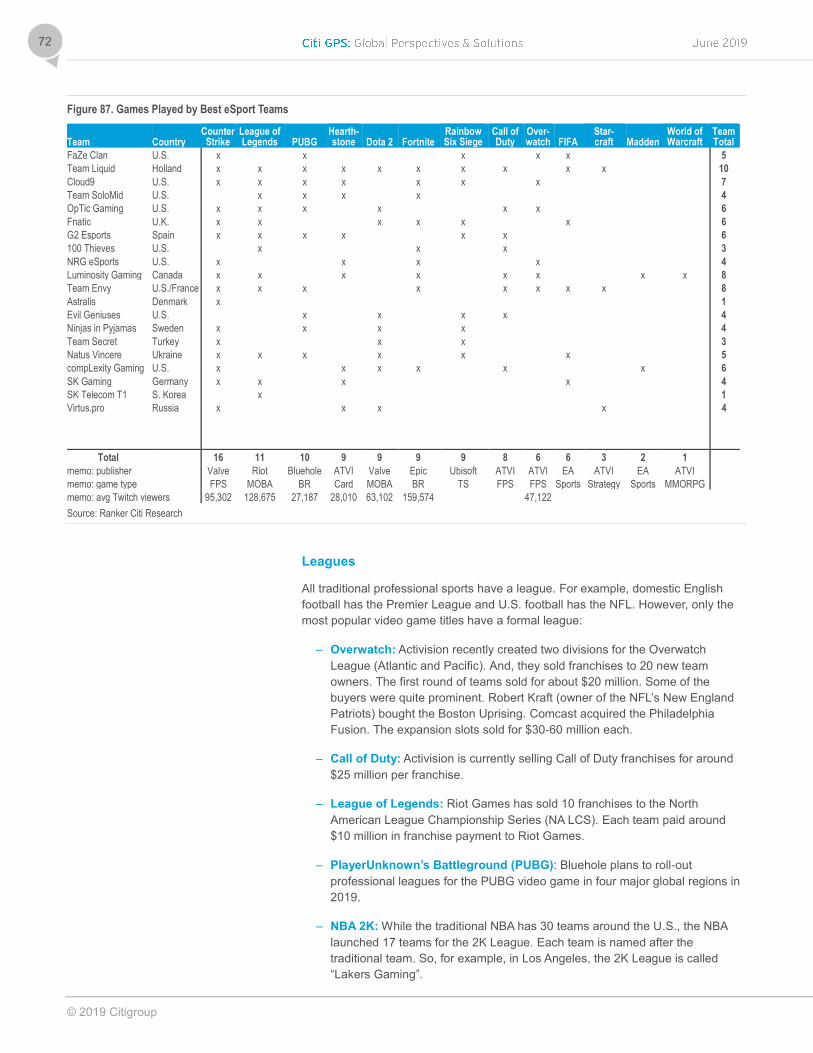
© 2019 Citigroup
72
Figure 87. Games Played by Best eSport Teams
Team Country Counter Strike
League of Legends PUBG
Hearth- stone Dota 2 Fortnite
Rainbow Six Siege
Call of Duty
Over-watch FIFA
Star- craft Madden
World of Warcraft
Team Total
FaZe Clan U.S. x x x x x 5
Team Liquid Holland x x x x x x x x x x 10
Cloud9 U.S. x x x x x x x 7
Team SoloMid U.S. x x x x 4
OpTic Gaming U.S. x x x x x x 6
Fnatic U.K. x x x x x x 6
G2 Esports Spain x x x x x x 6
100 Thieves U.S. x x x 3
NRG eSports U.S. x x x x 4
Luminosity Gaming Canada x x x x x x x x 8
Team Envy U.S./France x x x x x x x x 8
Astralis Denmark x 1
Evil Geniuses U.S. x x x x 4
Ninjas in Pyjamas Sweden x x x x 4
Team Secret Turkey x x x 3
Natus Vincere Ukraine x x x x x x 5
compLexity Gaming U.S. x x x x x x 6
SK Gaming Germany x x x x 4
SK Telecom T1 S. Korea x 1
Virtus.pro Russia x x x x 4
Total 16 11 10 9 9 9 9 8 6 6 3 2 1
memo: publisher Valve Riot Bluehole ATVI Valve Epic Ubisoft ATVI ATVI EA ATVI EA ATVI
memo: game type FPS MOBA BR Card MOBA BR TS FPS FPS Sports Strategy Sports MMORPG
memo: avg Twitch viewers 95,302 128,675 27,187 28,010 63,102 159,574 47,122
Source: Ranker Citi Research
Leagues
All traditional professional sports have a league. For example, domestic English
football has the Premier League and U.S. football has the NFL. However, only the
most popular video game titles have a formal league:
– Overwatch: Activision recently created two divisions for the Overwatch
League (Atlantic and Pacific). And, they sold franchises to 20 new team
owners. The first round of teams sold for about $20 million. Some of the
buyers were quite prominent. Robert Kraft (owner of the NFL’s New England
Patriots) bought the Boston Uprising. Comcast acquired the Philadelphia
Fusion. The expansion slots sold for $30-60 million each.
– Call of Duty: Activision is currently selling Call of Duty franchises for around
$25 million per franchise.
– League of Legends: Riot Games has sold 10 franchises to the North
American League Championship Series (NA LCS). Each team paid around
$10 million in franchise payment to Riot Games.
– PlayerUnknown’s Battleground (PUBG): Bluehole plans to roll-out
professional leagues for the PUBG video game in four major global regions in
2019.
– NBA 2K: While the traditional NBA has 30 teams around the U.S., the NBA
launched 17 teams for the 2K League. Each team is named after the
traditional team. So, for example, in Los Angeles, the 2K League is called
“Lakers Gaming”.
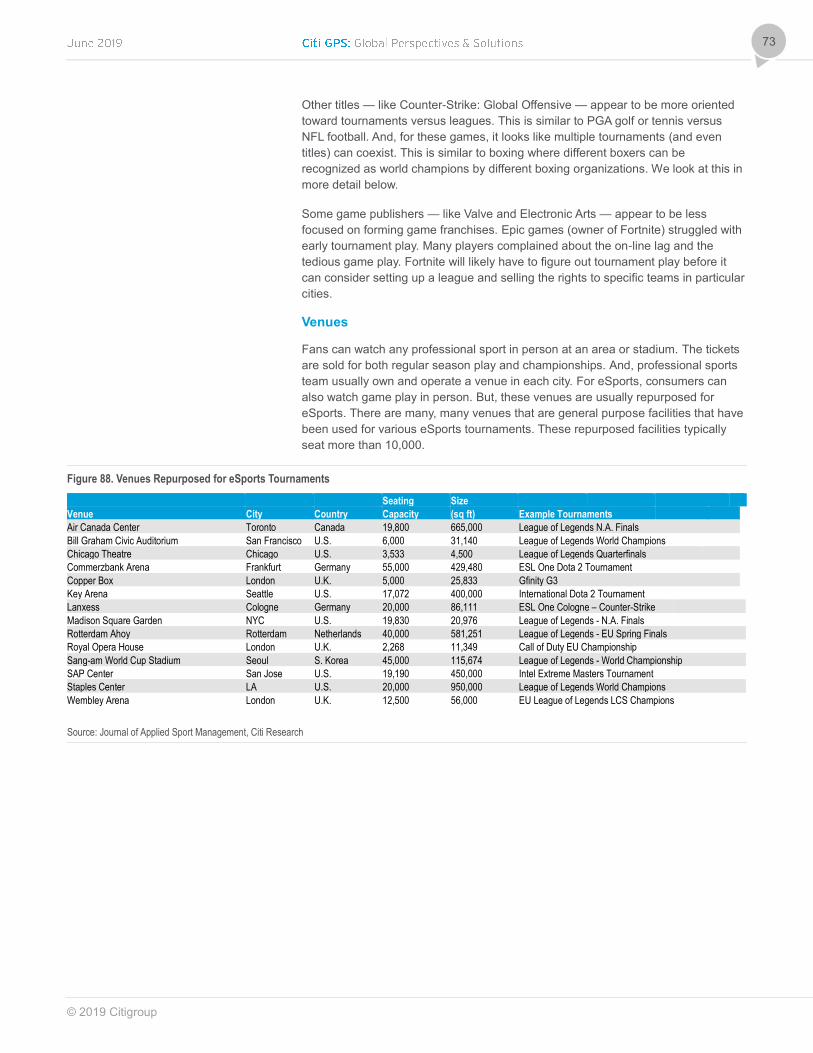
© 2019 Citigroup
73
Other titles — like Counter-Strike: Global Offensive — appear to be more oriented
toward tournaments versus leagues. This is similar to PGA golf or tennis versus
NFL football. And, for these games, it looks like multiple tournaments (and even
titles) can coexist. This is similar to boxing where different boxers can be
recognized as world champions by different boxing organizations. We look at this in
more detail below.
Some game publishers — like Valve and Electronic Arts — appear to be less
focused on forming game franchises. Epic games (owner of Fortnite) struggled with
early tournament play. Many players complained about the on-line lag and the
tedious game play. Fortnite will likely have to figure out tournament play before it
can consider setting up a league and selling the rights to specific teams in particular
cities.
Venues
Fans can watch any professional sport in person at an area or stadium. The tickets
are sold for both regular season play and championships. And, professional sports
team usually own and operate a venue in each city. For eSports, consumers can
also watch game play in person. But, these venues are usually repurposed for
eSports. There are many, many venues that are general purpose facilities that have
been used for various eSports tournaments. These repurposed facilities typically
seat more than 10,000.
Figure 88. Venues Repurposed for eSports Tournaments
Seating Size
Venue City Country Capacity (sq ft) Example Tournaments
Air Canada Center Toronto Canada 19,800 665,000 League of Legends N.A. Finals
Bill Graham Civic Auditorium San Francisco U.S. 6,000 31,140 League of Legends World Champions
Chicago Theatre Chicago U.S. 3,533 4,500 League of Legends Quarterfinals
Commerzbank Arena Frankfurt Germany 55,000 429,480 ESL One Dota 2 Tournament
Copper Box London U.K. 5,000 25,833 Gfinity G3
Key Arena Seattle U.S. 17,072 400,000 International Dota 2 Tournament
Lanxess Cologne Germany 20,000 86,111 ESL One Cologne – Counter-Strike
Madison Square Garden NYC U.S. 19,830 20,976 League of Legends - N.A. Finals
Rotterdam Ahoy Rotterdam Netherlands 40,000 581,251 League of Legends - EU Spring Finals
Royal Opera House London U.K. 2,268 11,349 Call of Duty EU Championship
Sang-am World Cup Stadium Seoul S. Korea 45,000 115,674 League of Legends - World Championship
SAP Center San Jose U.S. 19,190 450,000 Intel Extreme Masters Tournament
Staples Center LA U.S. 20,000 950,000 League of Legends World Champions
Wembley Arena London U.K. 12,500 56,000 EU League of Legends LCS Champions
Source: Journal of Applied Sport Management, Citi Research
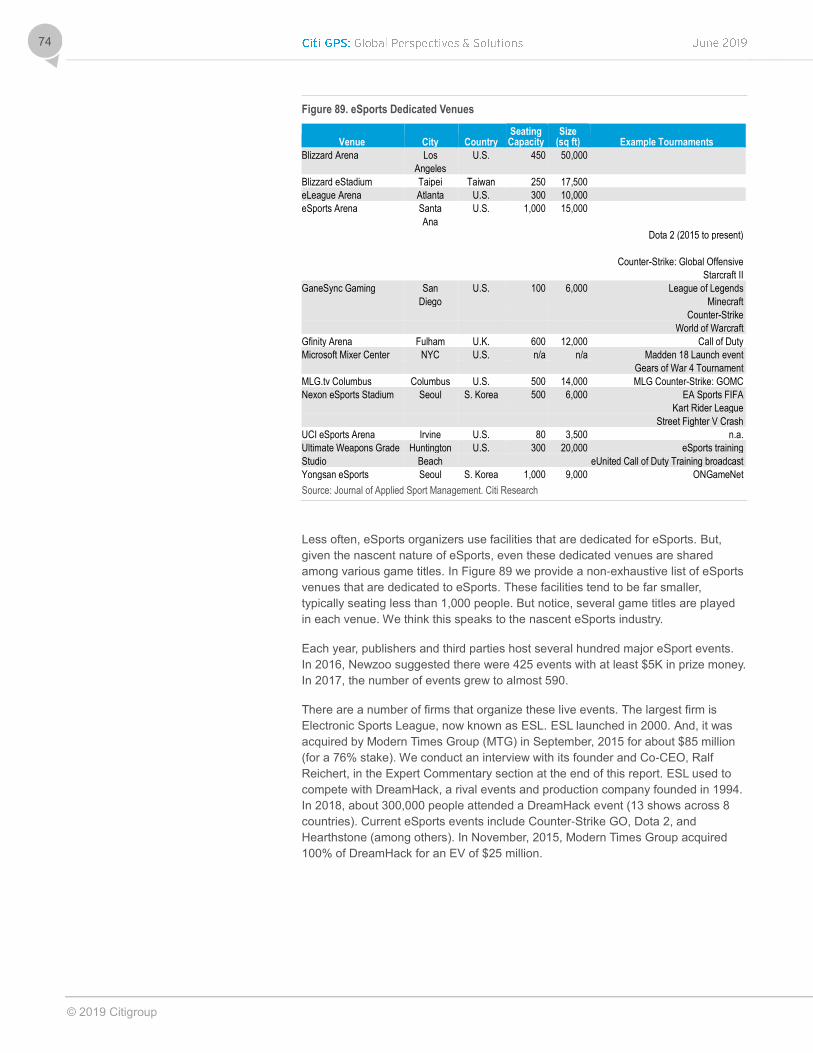
© 2019 Citigroup
74
Figure 89. eSports Dedicated Venues
Venue City Country Seating Capacity
Size (sq ft) Example Tournaments
Blizzard Arena Los U.S. 450 50,000
Angeles
Blizzard eStadium Taipei Taiwan 250 17,500
eLeague Arena Atlanta U.S. 300 10,000
eSports Arena Santa U.S. 1,000 15,000
Ana
Dota 2 (2015 to present)
Counter-Strike: Global Offensive
Starcraft II
GaneSync Gaming San U.S. 100 6,000 League of Legends
Diego Minecraft
Counter-Strike
World of Warcraft
Gfinity Arena Fulham U.K. 600 12,000 Call of Duty
Microsoft Mixer Center NYC U.S. n/a n/a Madden 18 Launch event
Gears of War 4 Tournament
MLG.tv Columbus Columbus U.S. 500 14,000 MLG Counter-Strike: GOMC
Nexon eSports Stadium Seoul S. Korea 500 6,000 EA Sports FIFA
Kart Rider League
Street Fighter V Crash
UCI eSports Arena Irvine U.S. 80 3,500 n.a.
Ultimate Weapons Grade Huntington U.S. 300 20,000 eSports training
Studio Beach eUnited Call of Duty Training broadcast
Yongsan eSports Seoul S. Korea 1,000 9,000 ONGameNet
Source: Journal of Applied Sport Management. Citi Research
Less often, eSports organizers use facilities that are dedicated for eSports. But,
given the nascent nature of eSports, even these dedicated venues are shared
among various game titles. In Figure 89 we provide a non-exhaustive list of eSports
venues that are dedicated to eSports. These facilities tend to be far smaller,
typically seating less than 1,000 people. But notice, several game titles are played
in each venue. We think this speaks to the nascent eSports industry.
Each year, publishers and third parties host several hundred major eSport events.
In 2016, Newzoo suggested there were 425 events with at least $5K in prize money.
In 2017, the number of events grew to almost 590.
There are a number of firms that organize these live events. The largest firm is
Electronic Sports League, now known as ESL. ESL launched in 2000. And, it was
acquired by Modern Times Group (MTG) in September, 2015 for about $85 million
(for a 76% stake). We conduct an interview with its founder and Co-CEO, Ralf
Reichert, in the Expert Commentary section at the end of this report. ESL used to
compete with DreamHack, a rival events and production company founded in 1994.
In 2018, about 300,000 people attended a DreamHack event (13 shows across 8
countries). Current eSports events include Counter-Strike GO, Dota 2, and
Hearthstone (among others). In November, 2015, Modern Times Group acquired
100% of DreamHack for an EV of $25 million.
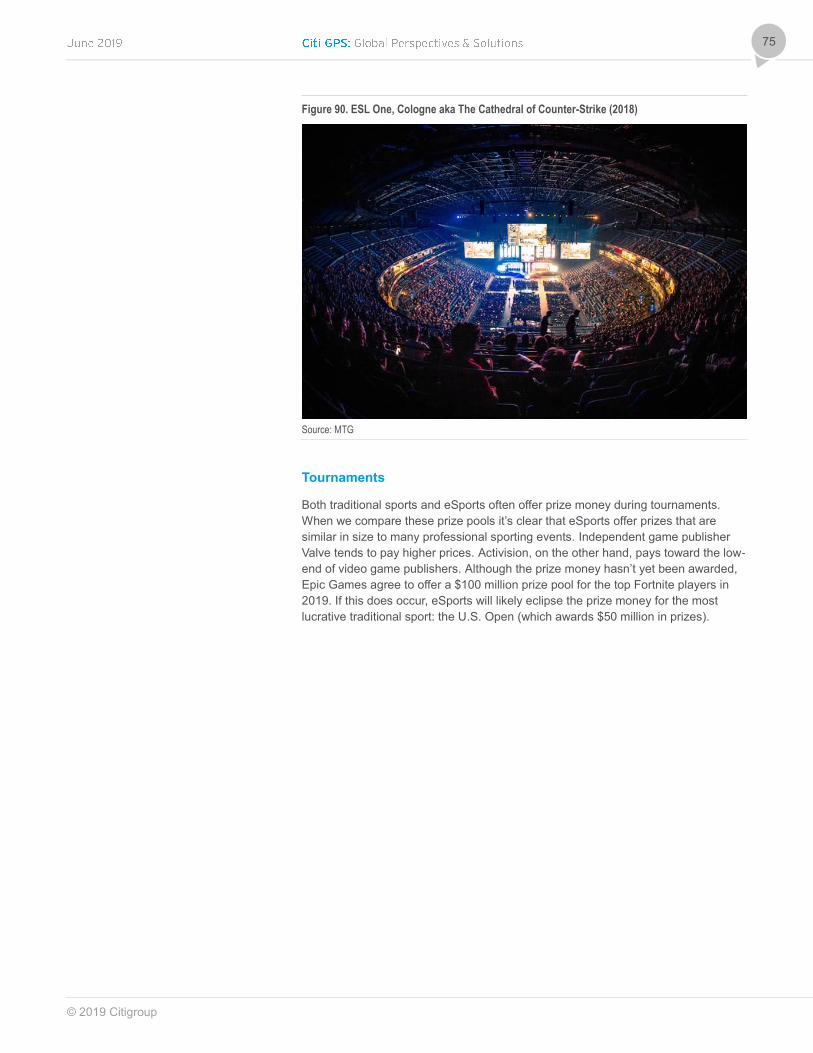
© 2019 Citigroup
75
Figure 90. ESL One, Cologne aka The Cathedral of Counter-Strike (2018)
Source: MTG
Tournaments
Both traditional sports and eSports often offer prize money during tournaments.
When we compare these prize pools it’s clear that eSports offer prizes that are
similar in size to many professional sporting events. Independent game publisher
Valve tends to pay higher prices. Activision, on the other hand, pays toward the low-
end of video game publishers. Although the prize money hasn’t yet been awarded,
Epic Games agree to offer a $100 million prize pool for the top Fortnite players in
2019. If this does occur, eSports will likely eclipse the prize money for the most
lucrative traditional sport: the U.S. Open (which awards $50 million in prizes).
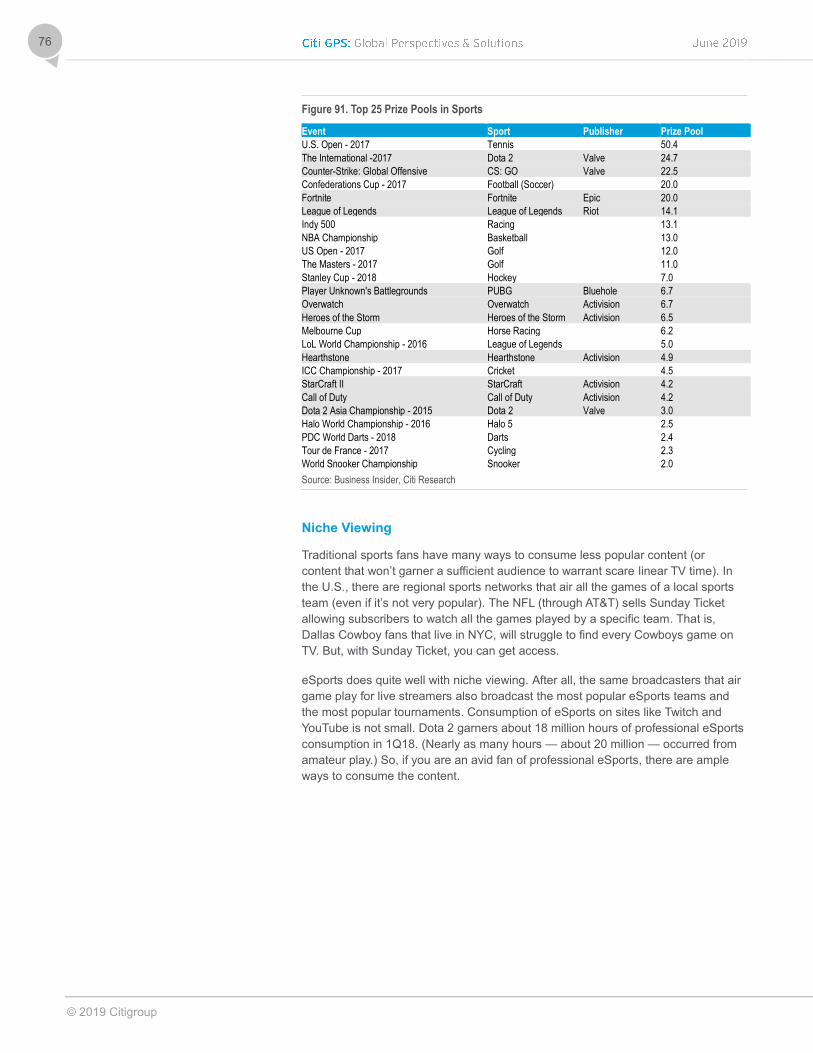
© 2019 Citigroup
76
Figure 91. Top 25 Prize Pools in Sports
Event Sport Publisher Prize Pool
U.S. Open - 2017 Tennis 50.4
The International -2017 Dota 2 Valve 24.7
Counter-Strike: Global Offensive CS: GO Valve 22.5
Confederations Cup - 2017 Football (Soccer) 20.0
Fortnite Fortnite Epic 20.0
League of Legends League of Legends Riot 14.1
Indy 500 Racing 13.1
NBA Championship Basketball 13.0
US Open - 2017 Golf 12.0
The Masters - 2017 Golf 11.0
Stanley Cup - 2018 Hockey 7.0
Player Unknown's Battlegrounds PUBG Bluehole 6.7
Overwatch Overwatch Activision 6.7
Heroes of the Storm Heroes of the Storm Activision 6.5
Melbourne Cup Horse Racing 6.2
LoL World Championship - 2016 League of Legends 5.0
Hearthstone Hearthstone Activision 4.9
ICC Championship - 2017 Cricket 4.5
StarCraft II StarCraft Activision 4.2
Call of Duty Call of Duty Activision 4.2
Dota 2 Asia Championship - 2015 Dota 2 Valve 3.0
Halo World Championship - 2016 Halo 5 2.5
PDC World Darts - 2018 Darts 2.4
Tour de France - 2017 Cycling 2.3
World Snooker Championship Snooker 2.0
Source: Business Insider, Citi Research
Niche Viewing
Traditional sports fans have many ways to consume less popular content (or
content that won’t garner a sufficient audience to warrant scare linear TV time). In
the U.S., there are regional sports networks that air all the games of a local sports
team (even if it’s not very popular). The NFL (through AT&T) sells Sunday Ticket
allowing subscribers to watch all the games played by a specific team. That is,
Dallas Cowboy fans that live in NYC, will struggle to find every Cowboys game on
TV. But, with Sunday Ticket, you can get access.
eSports does quite well with niche viewing. After all, the same broadcasters that air
game play for live streamers also broadcast the most popular eSports teams and
the most popular tournaments. Consumption of eSports on sites like Twitch and
YouTube is not small. Dota 2 garners about 18 million hours of professional eSports
consumption in 1Q18. (Nearly as many hours — about 20 million — occurred from
amateur play.) So, if you are an avid fan of professional eSports, there are ample
ways to consume the content.
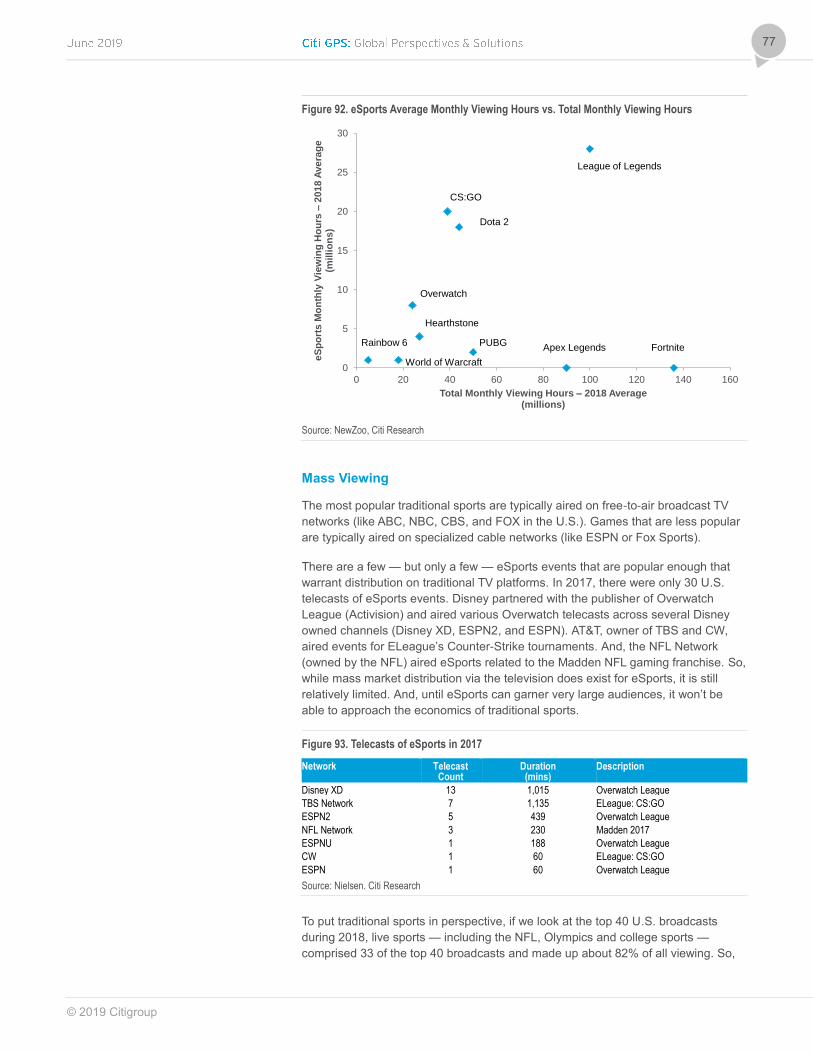
© 2019 Citigroup
77
Figure 92. eSports Average Monthly Viewing Hours vs. Total Monthly Viewing Hours
Source: NewZoo, Citi Research
Mass Viewing
The most popular traditional sports are typically aired on free-to-air broadcast TV
networks (like ABC, NBC, CBS, and FOX in the U.S.). Games that are less popular
are typically aired on specialized cable networks (like ESPN or Fox Sports).
There are a few — but only a few — eSports events that are popular enough that
warrant distribution on traditional TV platforms. In 2017, there were only 30 U.S.
telecasts of eSports events. Disney partnered with the publisher of Overwatch
League (Activision) and aired various Overwatch telecasts across several Disney
owned channels (Disney XD, ESPN2, and ESPN). AT&T, owner of TBS and CW,
aired events for ELeague’s Counter-Strike tournaments. And, the NFL Network
(owned by the NFL) aired eSports related to the Madden NFL gaming franchise. So,
while mass market distribution via the television does exist for eSports, it is still
relatively limited. And, until eSports can garner very large audiences, it won’t be
able to approach the economics of traditional sports.
Figure 93. Telecasts of eSports in 2017
Network Telecast Count
Duration (mins)
Description
Disney XD 13 1,015 Overwatch League
TBS Network 7 1,135 ELeague: CS:GO
ESPN2 5 439 Overwatch League
NFL Network 3 230 Madden 2017
ESPNU 1 188 Overwatch League
CW 1 60 ELeague: CS:GO
ESPN 1 60 Overwatch League
Source: Nielsen. Citi Research
To put traditional sports in perspective, if we look at the top 40 U.S. broadcasts
during 2018, live sports — including the NFL, Olympics and college sports —
comprised 33 of the top 40 broadcasts and made up about 82% of all viewing. So,
0
5
10
15
20
25
30
0 20 40 60 80 100 120 140 160
eS
po
rts
Mo
nth
ly V
iew
ing
Ho
urs
–2
01
8 A
ve
rag
e
(mil
lio
ns
)
Total Monthly Viewing Hours – 2018 Average(millions)
Fortnite
League of Legends
PUBGApex Legends
Dota 2
CS:GO
Hearthstone
Overwatch
World of Warcraft
Rainbow 6
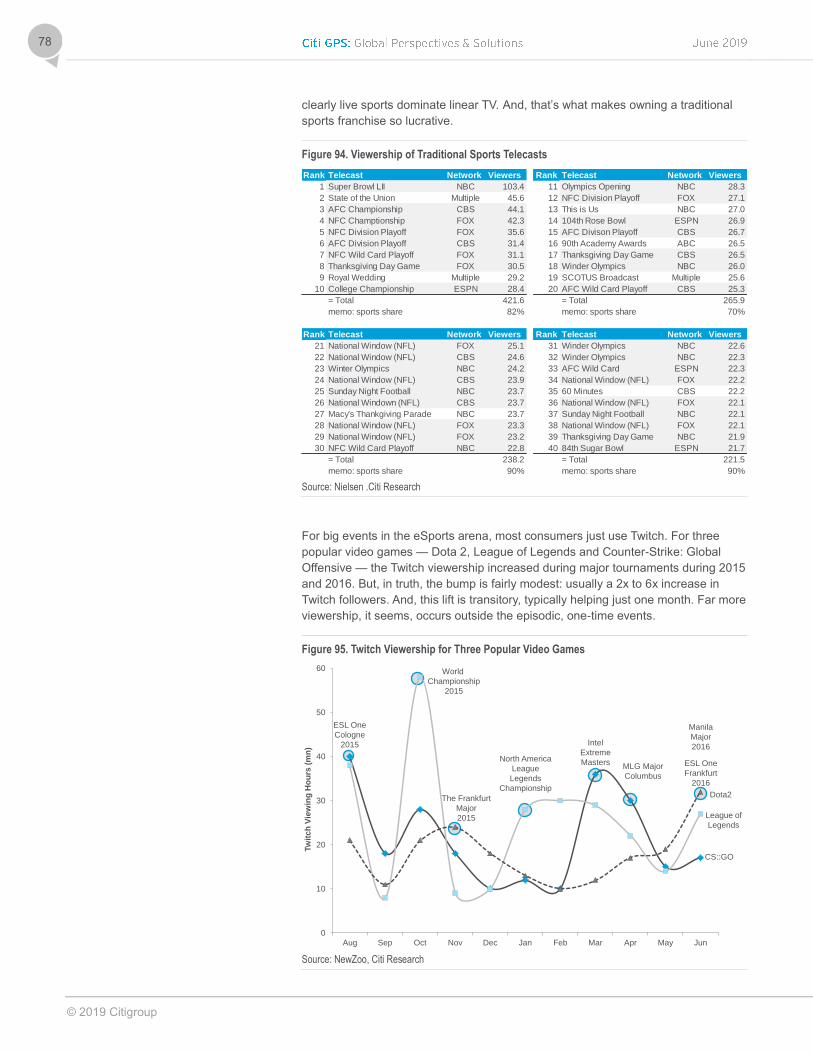
© 2019 Citigroup
78
clearly live sports dominate linear TV. And, that’s what makes owning a traditional
sports franchise so lucrative.
Figure 94. Viewership of Traditional Sports Telecasts
Source: Nielsen .Citi Research
For big events in the eSports arena, most consumers just use Twitch. For three
popular video games — Dota 2, League of Legends and Counter-Strike: Global
Offensive — the Twitch viewership increased during major tournaments during 2015
and 2016. But, in truth, the bump is fairly modest: usually a 2x to 6x increase in
Twitch followers. And, this lift is transitory, typically helping just one month. Far more
viewership, it seems, occurs outside the episodic, one-time events.
Figure 95. Twitch Viewership for Three Popular Video Games
Source: NewZoo, Citi Research
Rank Telecast Network Viewers Rank Telecast Network Viewers
1 Super Browl LII NBC 103.4 11 Olympics Opening NBC 28.3
2 State of the Union Multiple 45.6 12 NFC Division Playoff FOX 27.1
3 AFC Championship CBS 44.1 13 This is Us NBC 27.0
4 NFC Champtionship FOX 42.3 14 104th Rose Bowl ESPN 26.9
5 NFC Division Playoff FOX 35.6 15 AFC Divison Playoff CBS 26.7
6 AFC Division Playoff CBS 31.4 16 90th Academy Awards ABC 26.5
7 NFC Wild Card Playoff FOX 31.1 17 Thanksgiving Day Game CBS 26.5
8 Thanksgiving Day Game FOX 30.5 18 Winder Olympics NBC 26.0
9 Royal Wedding Multiple 29.2 19 SCOTUS Broadcast Multiple 25.6
10 College Championship ESPN 28.4 20 AFC Wild Card Playoff CBS 25.3
= Total 421.6 = Total 265.9
memo: sports share 82% memo: sports share 70%
Rank Telecast Network Viewers Rank Telecast Network Viewers
21 National Window (NFL) FOX 25.1 31 Winder Olympics NBC 22.6
22 National Window (NFL) CBS 24.6 32 Winder Olympics NBC 22.3
23 Winter Olympics NBC 24.2 33 AFC Wild Card ESPN 22.3
24 National Window (NFL) CBS 23.9 34 National Window (NFL) FOX 22.2
25 Sunday Night Football NBC 23.7 35 60 Minutes CBS 22.2
26 National Windown (NFL) CBS 23.7 36 National Window (NFL) FOX 22.1
27 Macy's Thankgiving Parade NBC 23.7 37 Sunday Night Football NBC 22.1
28 National Window (NFL) FOX 23.3 38 National Window (NFL) FOX 22.1
29 National Window (NFL) FOX 23.2 39 Thanksgiving Day Game NBC 21.9
30 NFC Wild Card Playoff NBC 22.8 40 84th Sugar Bowl ESPN 21.7
= Total 238.2 = Total 221.5
memo: sports share 90% memo: sports share 90%
0
10
20
30
40
50
60
Aug Sep Oct Nov Dec Jan Feb Mar Apr May Jun
Tw
itc
h V
iew
ing
Ho
urs
(m
n)
League of
Legends
CS::GO
Dota2
ESL One
Cologne
2015
World
Championship
2015
The Frankfurt
Major
2015
North America
League
Legends
Championship
Intel
Extreme
MastersMLG Major
Columbus
Manila
Major
2016
ESL One
Frankfurt
2016
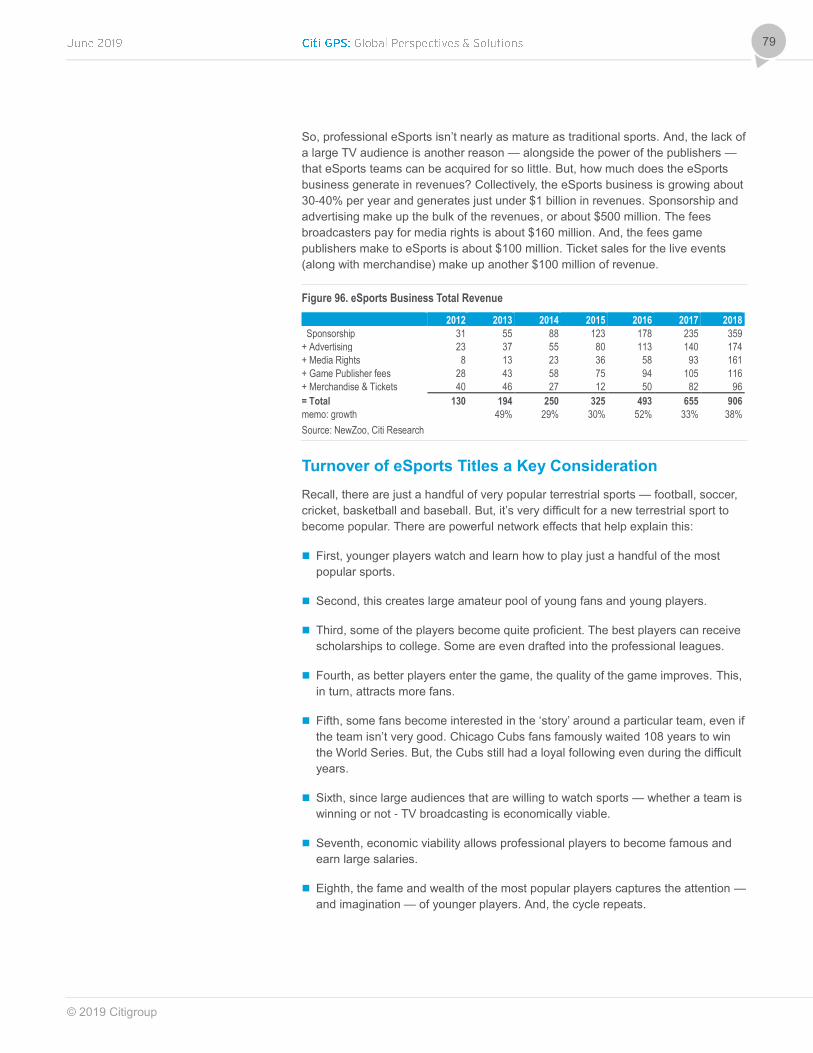
© 2019 Citigroup
79
So, professional eSports isn’t nearly as mature as traditional sports. And, the lack of
a large TV audience is another reason — alongside the power of the publishers —
that eSports teams can be acquired for so little. But, how much does the eSports
business generate in revenues? Collectively, the eSports business is growing about
30-40% per year and generates just under $1 billion in revenues. Sponsorship and
advertising make up the bulk of the revenues, or about $500 million. The fees
broadcasters pay for media rights is about $160 million. And, the fees game
publishers make to eSports is about $100 million. Ticket sales for the live events
(along with merchandise) make up another $100 million of revenue.
Figure 96. eSports Business Total Revenue
2012 2013 2014 2015 2016 2017 2018
Sponsorship 31 55 88 123 178 235 359
+ Advertising 23 37 55 80 113 140 174
+ Media Rights 8 13 23 36 58 93 161
+ Game Publisher fees 28 43 58 75 94 105 116
+ Merchandise & Tickets 40 46 27 12 50 82 96
= Total 130 194 250 325 493 655 906
memo: growth 49% 29% 30% 52% 33% 38%
Source: NewZoo, Citi Research
Turnover of eSports Titles a Key Consideration
Recall, there are just a handful of very popular terrestrial sports — football, soccer,
cricket, basketball and baseball. But, it’s very difficult for a new terrestrial sport to
become popular. There are powerful network effects that help explain this:
First, younger players watch and learn how to play just a handful of the most
popular sports.
Second, this creates large amateur pool of young fans and young players.
Third, some of the players become quite proficient. The best players can receive
scholarships to college. Some are even drafted into the professional leagues.
Fourth, as better players enter the game, the quality of the game improves. This,
in turn, attracts more fans.
Fifth, some fans become interested in the ‘story’ around a particular team, even if
the team isn’t very good. Chicago Cubs fans famously waited 108 years to win
the World Series. But, the Cubs still had a loyal following even during the difficult
years.
Sixth, since large audiences that are willing to watch sports — whether a team is
winning or not - TV broadcasting is economically viable.
Seventh, economic viability allows professional players to become famous and
earn large salaries.
Eighth, the fame and wealth of the most popular players captures the attention —
and imagination — of younger players. And, the cycle repeats.
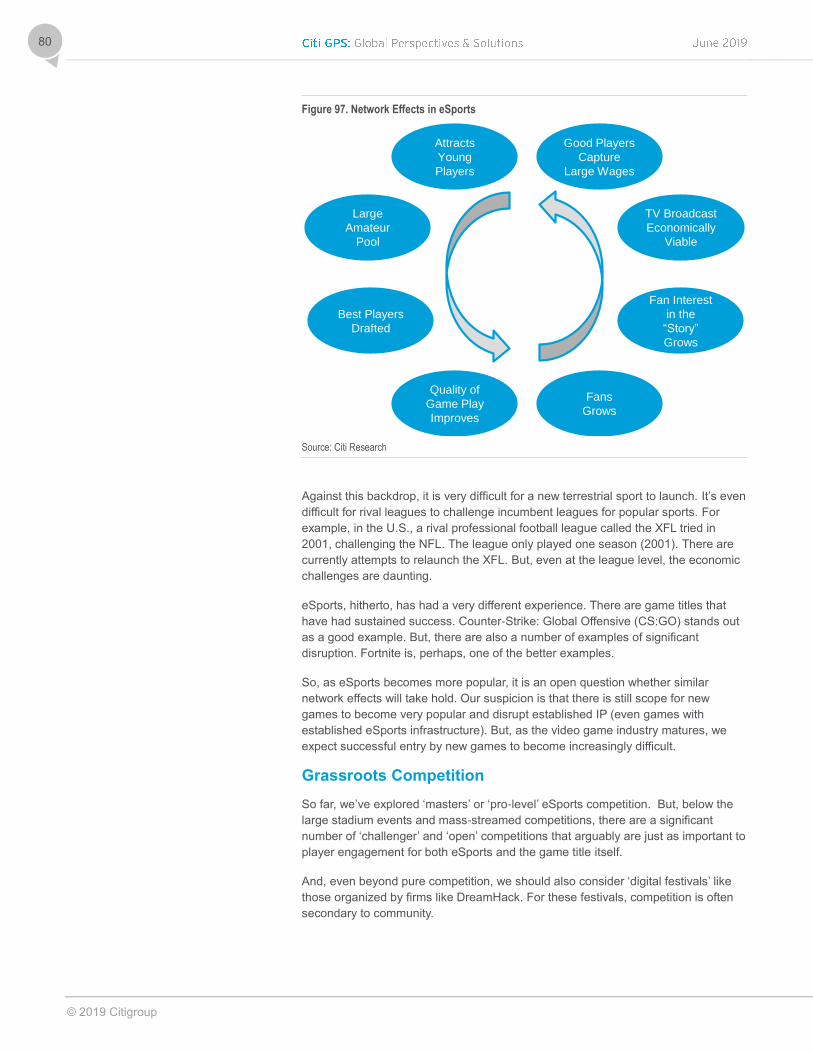
© 2019 Citigroup
80
Figure 97. Network Effects in eSports
Source: Citi Research
Against this backdrop, it is very difficult for a new terrestrial sport to launch. It’s even
difficult for rival leagues to challenge incumbent leagues for popular sports. For
example, in the U.S., a rival professional football league called the XFL tried in
2001, challenging the NFL. The league only played one season (2001). There are
currently attempts to relaunch the XFL. But, even at the league level, the economic
challenges are daunting.
eSports, hitherto, has had a very different experience. There are game titles that
have had sustained success. Counter-Strike: Global Offensive (CS:GO) stands out
as a good example. But, there are also a number of examples of significant
disruption. Fortnite is, perhaps, one of the better examples.
So, as eSports becomes more popular, it is an open question whether similar
network effects will take hold. Our suspicion is that there is still scope for new
games to become very popular and disrupt established IP (even games with
established eSports infrastructure). But, as the video game industry matures, we
expect successful entry by new games to become increasingly difficult.
Grassroots Competition
So far, we’ve explored ‘masters’ or ‘pro-level’ eSports competition. But, below the
large stadium events and mass-streamed competitions, there are a significant
number of ‘challenger’ and ‘open’ competitions that arguably are just as important to
player engagement for both eSports and the game title itself.
And, even beyond pure competition, we should also consider ‘digital festivals’ like
those organized by firms like DreamHack. For these festivals, competition is often
secondary to community.
Attracts
Young
Players
Large
Amateur
Pool
Best Players
Drafted
Quality of
Game Play
Improves
Fans
Grows
Fan Interest
in the
“Story”
Grows
TV Broadcast
Economically
Viable
Good Players
Capture
Large Wages
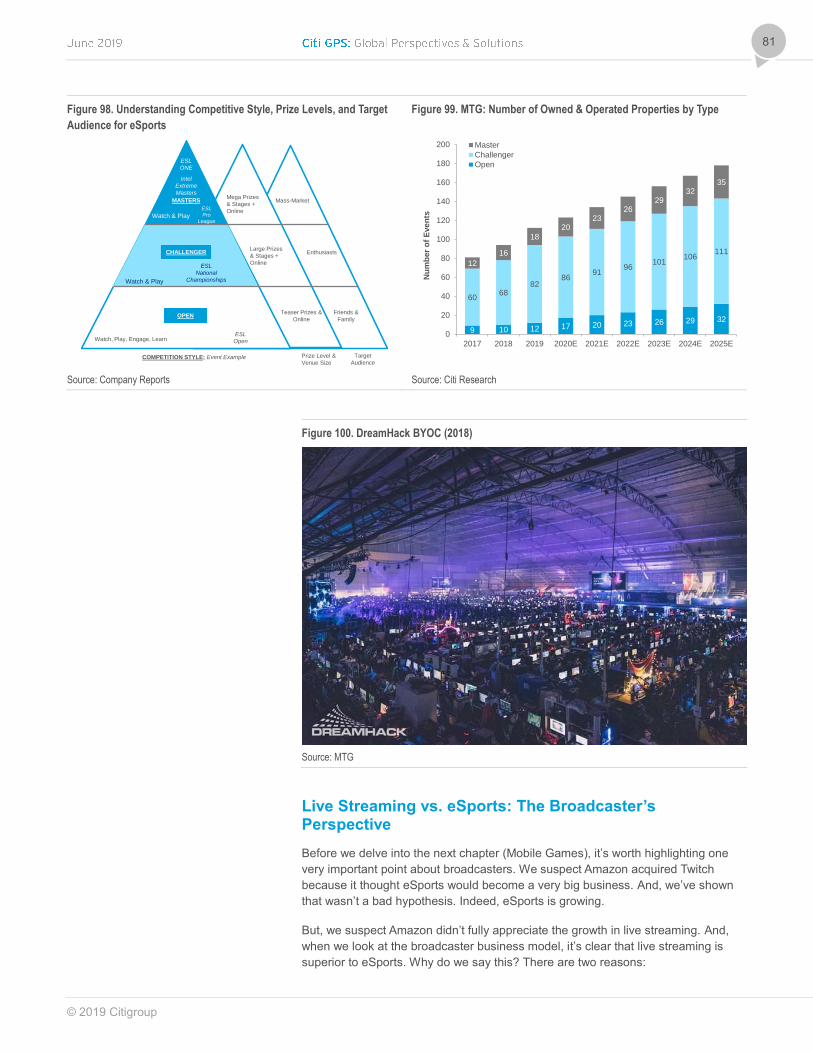
© 2019 Citigroup
81
Figure 98. Understanding Competitive Style, Prize Levels, and Target
Audience for eSports
Figure 99. MTG: Number of Owned & Operated Properties by Type
Source: Company Reports Source: Citi Research
Figure 100. DreamHack BYOC (2018)
Source: MTG
Live Streaming vs. eSports: The Broadcaster’s Perspective
Before we delve into the next chapter (Mobile Games), it’s worth highlighting one
very important point about broadcasters. We suspect Amazon acquired Twitch
because it thought eSports would become a very big business. And, we’ve shown
that wasn’t a bad hypothesis. Indeed, eSports is growing.
But, we suspect Amazon didn’t fully appreciate the growth in live streaming. And,
when we look at the broadcaster business model, it’s clear that live streaming is
superior to eSports. Why do we say this? There are two reasons:
Mass-Market
Enthusiasts
Friends &
Family
Teaser Prizes &
Online
Large Prizes
& Stages +
Online
Mega Prizes
& Stages +
Online
MASTERS
Watch & Play
CHALLENGER
OPEN
Watch & Play
Watch, Play, Engage, Learn
COMPETITION STYLE; Event Example Prize Level &
Venue Size
Target
Audience
ESL
National
Championships
ESL
ONE
ESL
Pro
League
Intel
Extreme
Masters
ESL
Open
9 10 12 17 20 23 26 29 32
6068
8286
9196
101106
111
12
16
18
2023
2629
3235
0
20
40
60
80
100
120
140
160
180
200
2017 2018 2019 2020E 2021E 2022E 2023E 2024E 2025E
Nu
mb
er
of
Eve
nts
Master
Challenger
Open
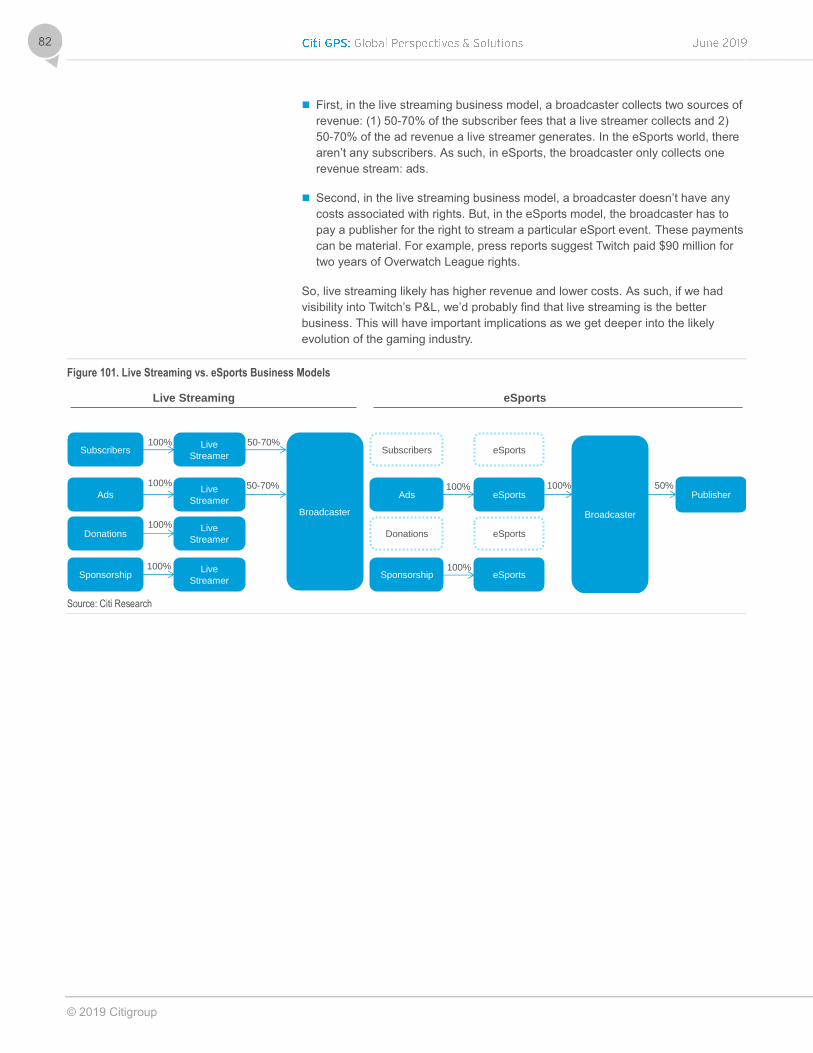
© 2019 Citigroup
82
First, in the live streaming business model, a broadcaster collects two sources of
revenue: (1) 50-70% of the subscriber fees that a live streamer collects and 2)
50-70% of the ad revenue a live streamer generates. In the eSports world, there
aren’t any subscribers. As such, in eSports, the broadcaster only collects one
revenue stream: ads.
Second, in the live streaming business model, a broadcaster doesn’t have any
costs associated with rights. But, in the eSports model, the broadcaster has to
pay a publisher for the right to stream a particular eSport event. These payments
can be material. For example, press reports suggest Twitch paid $90 million for
two years of Overwatch League rights.
So, live streaming likely has higher revenue and lower costs. As such, if we had
visibility into Twitch’s P&L, we’d probably find that live streaming is the better
business. This will have important implications as we get deeper into the likely
evolution of the gaming industry.
Figure 101. Live Streaming vs. eSports Business Models
Source: Citi Research
Broadcaster
SubscribersLive
Streamer
Broadcaster
Subscribers eSports100% 50-70%
AdsLive
Streamer
100% 50-70%Ads eSports
100% 100%
Donations100%
Donations eSports
Sponsorship100%
Sponsorship100%
Live
Streamer
Live
StreamereSports
Publisher50%
Live Streaming eSports
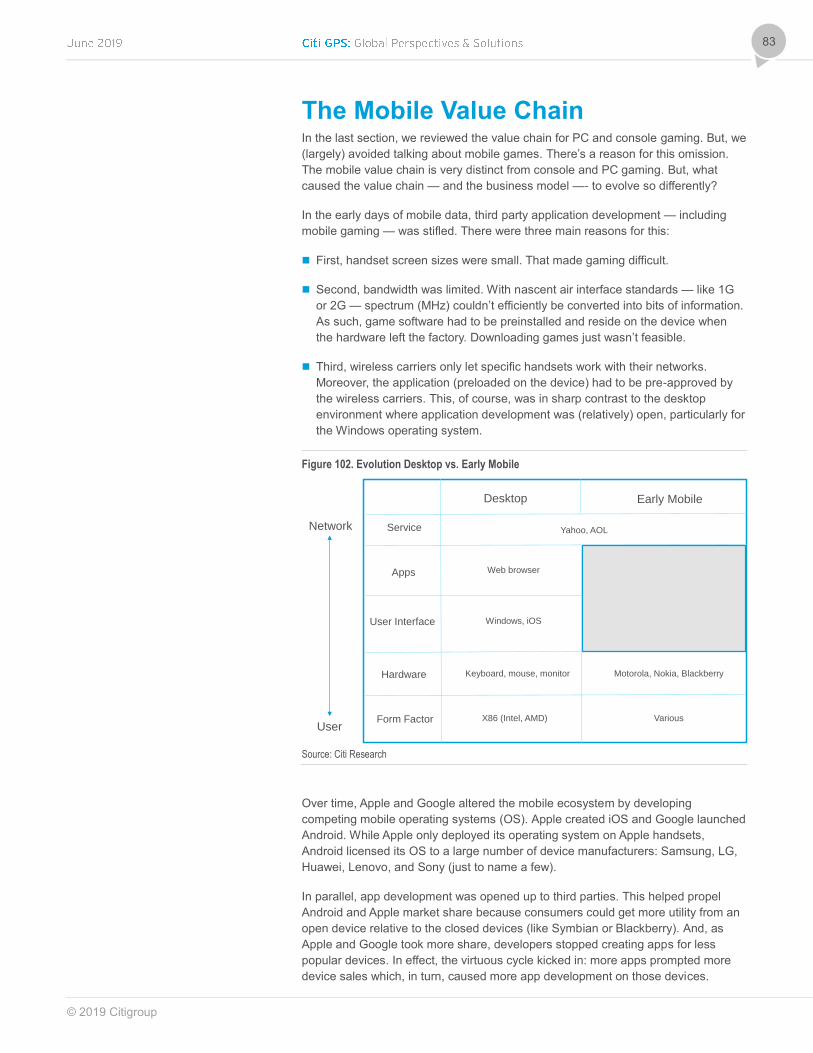
© 2019 Citigroup
83
The Mobile Value Chain In the last section, we reviewed the value chain for PC and console gaming. But, we
(largely) avoided talking about mobile games. There’s a reason for this omission.
The mobile value chain is very distinct from console and PC gaming. But, what
caused the value chain — and the business model —- to evolve so differently?
In the early days of mobile data, third party application development — including
mobile gaming — was stifled. There were three main reasons for this:
First, handset screen sizes were small. That made gaming difficult.
Second, bandwidth was limited. With nascent air interface standards — like 1G
or 2G — spectrum (MHz) couldn’t efficiently be converted into bits of information.
As such, game software had to be preinstalled and reside on the device when
the hardware left the factory. Downloading games just wasn’t feasible.
Third, wireless carriers only let specific handsets work with their networks.
Moreover, the application (preloaded on the device) had to be pre-approved by
the wireless carriers. This, of course, was in sharp contrast to the desktop
environment where application development was (relatively) open, particularly for
the Windows operating system.
Figure 102. Evolution Desktop vs. Early Mobile
Source: Citi Research
Over time, Apple and Google altered the mobile ecosystem by developing
competing mobile operating systems (OS). Apple created iOS and Google launched
Android. While Apple only deployed its operating system on Apple handsets,
Android licensed its OS to a large number of device manufacturers: Samsung, LG,
Huawei, Lenovo, and Sony (just to name a few).
In parallel, app development was opened up to third parties. This helped propel
Android and Apple market share because consumers could get more utility from an
open device relative to the closed devices (like Symbian or Blackberry). And, as
Apple and Google took more share, developers stopped creating apps for less
popular devices. In effect, the virtuous cycle kicked in: more apps prompted more
device sales which, in turn, caused more app development on those devices.
Desktop Early Mobile
Service
Apps
User Interface
Form Factor
Hardware
Network
User
Yahoo, AOL
Web browser
Windows, iOS
Keyboard, mouse, monitor
X86 (Intel, AMD)
Motorola, Nokia, Blackberry
Various
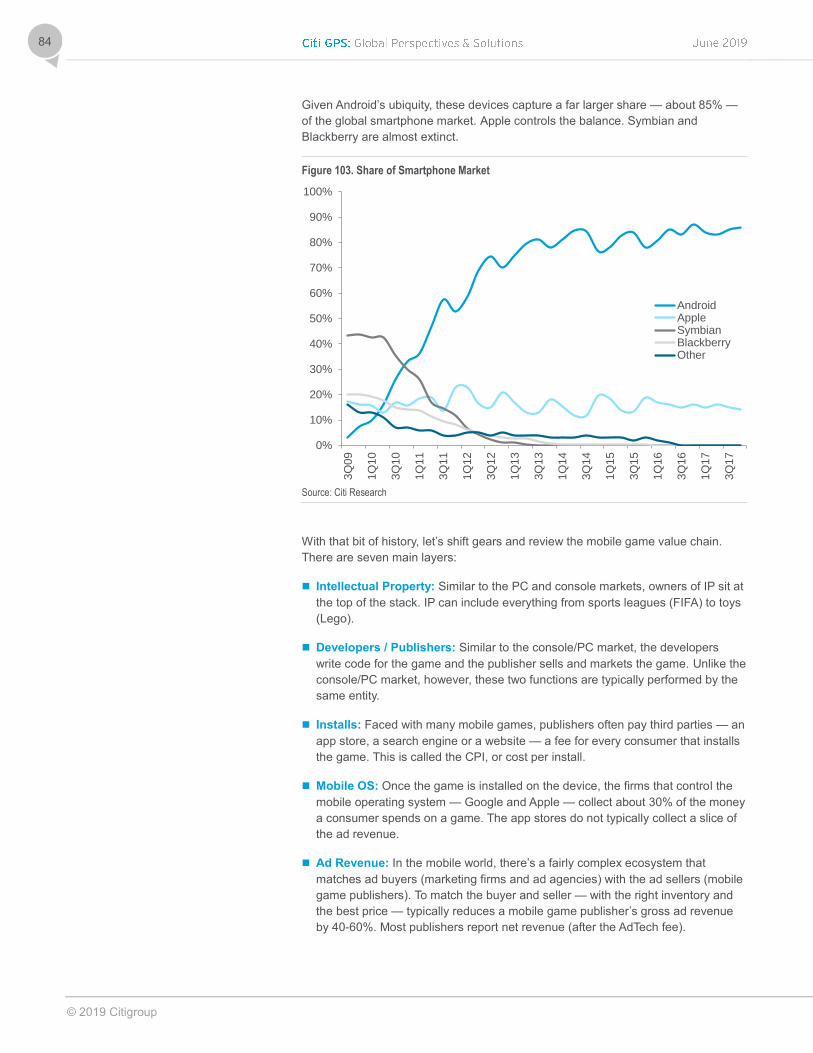
© 2019 Citigroup
84
Given Android’s ubiquity, these devices capture a far larger share — about 85% —
of the global smartphone market. Apple controls the balance. Symbian and
Blackberry are almost extinct.
Figure 103. Share of Smartphone Market
Source: Citi Research
With that bit of history, let’s shift gears and review the mobile game value chain.
There are seven main layers:
Intellectual Property: Similar to the PC and console markets, owners of IP sit at
the top of the stack. IP can include everything from sports leagues (FIFA) to toys
(Lego).
Developers / Publishers: Similar to the console/PC market, the developers
write code for the game and the publisher sells and markets the game. Unlike the
console/PC market, however, these two functions are typically performed by the
same entity.
Installs: Faced with many mobile games, publishers often pay third parties — an
app store, a search engine or a website — a fee for every consumer that installs
the game. This is called the CPI, or cost per install.
Mobile OS: Once the game is installed on the device, the firms that control the
mobile operating system — Google and Apple — collect about 30% of the money
a consumer spends on a game. The app stores do not typically collect a slice of
the ad revenue.
Ad Revenue: In the mobile world, there’s a fairly complex ecosystem that
matches ad buyers (marketing firms and ad agencies) with the ad sellers (mobile
game publishers). To match the buyer and seller — with the right inventory and
the best price — typically reduces a mobile game publisher’s gross ad revenue
by 40-60%. Most publishers report net revenue (after the AdTech fee).
0%
10%
20%
30%
40%
50%
60%
70%
80%
90%
100%
3Q
09
1Q
10
3Q
10
1Q
11
3Q
11
1Q
12
3Q
12
1Q
13
3Q
13
1Q
14
3Q
14
1Q
15
3Q
15
1Q
16
3Q
16
1Q
17
3Q
17
AndroidAppleSymbianBlackberryOther
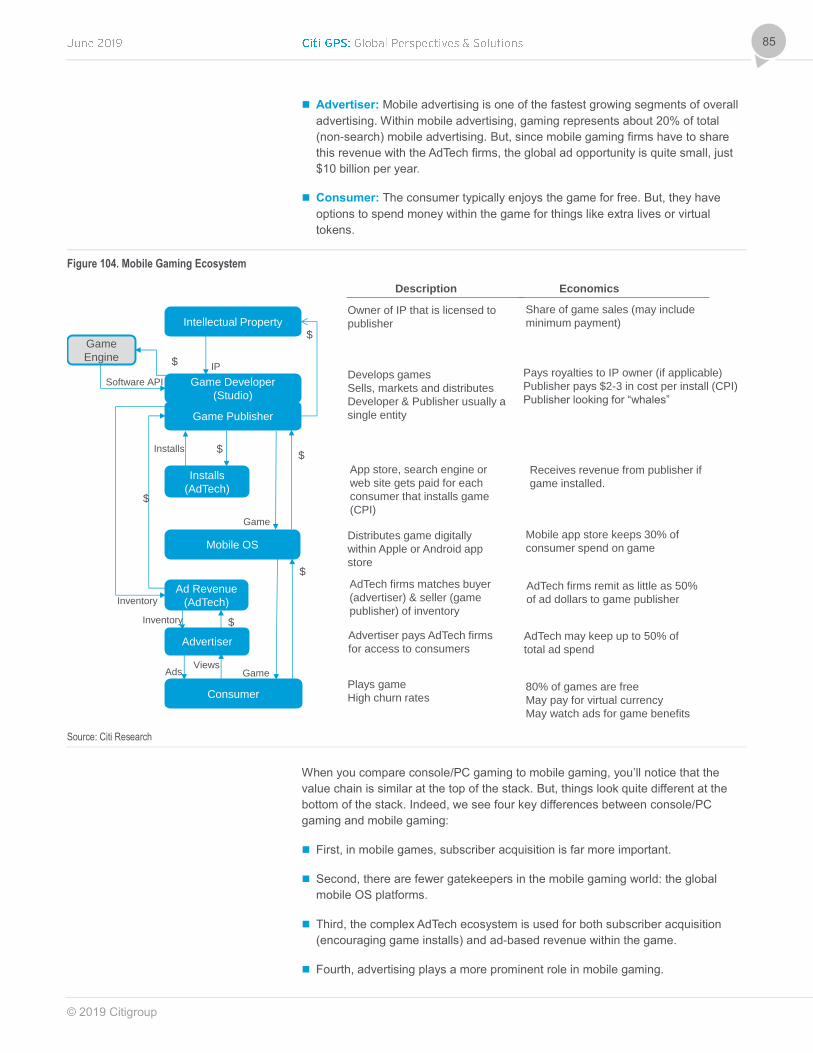
© 2019 Citigroup
85
Advertiser: Mobile advertising is one of the fastest growing segments of overall
advertising. Within mobile advertising, gaming represents about 20% of total
(non-search) mobile advertising. But, since mobile gaming firms have to share
this revenue with the AdTech firms, the global ad opportunity is quite small, just
$10 billion per year.
Consumer: The consumer typically enjoys the game for free. But, they have
options to spend money within the game for things like extra lives or virtual
tokens.
Figure 104. Mobile Gaming Ecosystem
Source: Citi Research
When you compare console/PC gaming to mobile gaming, you’ll notice that the
value chain is similar at the top of the stack. But, things look quite different at the
bottom of the stack. Indeed, we see four key differences between console/PC
gaming and mobile gaming:
First, in mobile games, subscriber acquisition is far more important.
Second, there are fewer gatekeepers in the mobile gaming world: the global
mobile OS platforms.
Third, the complex AdTech ecosystem is used for both subscriber acquisition
(encouraging game installs) and ad-based revenue within the game.
Fourth, advertising plays a more prominent role in mobile gaming.
Intellectual Property
Game Developer
(Studio)
Game Publisher
Mobile OS
Consumer
Description
Owner of IP that is licensed to
publisher
Develops games
Sells, markets and distributes
Developer & Publisher usually a
single entity
Economics
Share of game sales (may include
minimum payment)
Pays royalties to IP owner (if applicable)
Publisher pays $2-3 in cost per install (CPI)
Publisher looking for “whales”
App store, search engine or
web site gets paid for each
consumer that installs game
(CPI)
Receives revenue from publisher if
game installed.
Distributes game digitally
within Apple or Android app
store
Plays game
High churn rates80% of games are free
May pay for virtual currency
May watch ads for game benefits
Mobile app store keeps 30% of
consumer spend on game
$
$
IP
Game
Engine $
Software API
Advertiser
Ads
Installs
(AdTech)
Installs
Ad Revenue
(AdTech)
$
$
$
Game
Game
Advertiser pays AdTech firms
for access to consumersAdTech may keep up to 50% of
total ad spend
AdTech firms matches buyer
(advertiser) & seller (game
publisher) of inventory
AdTech firms remit as little as 50%
of ad dollars to game publisher
Inventory
Inventory
Views
$
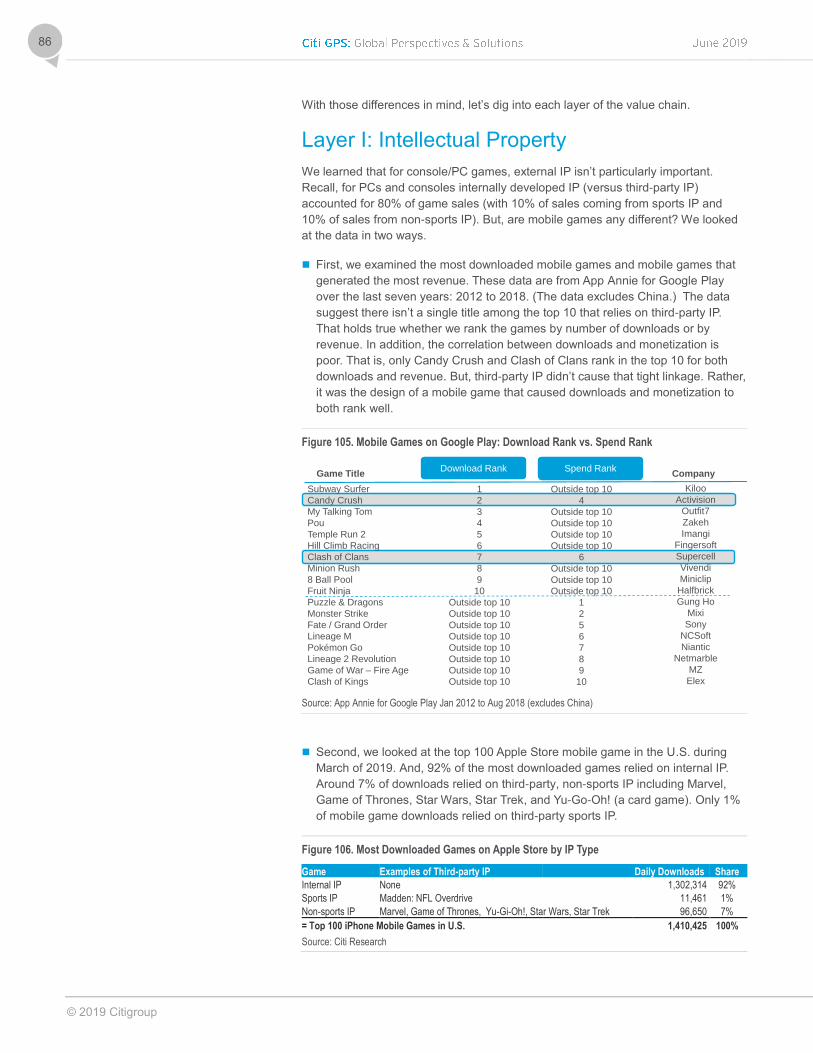
© 2019 Citigroup
86
With those differences in mind, let’s dig into each layer of the value chain.
Layer I: Intellectual Property
We learned that for console/PC games, external IP isn’t particularly important.
Recall, for PCs and consoles internally developed IP (versus third-party IP)
accounted for 80% of game sales (with 10% of sales coming from sports IP and
10% of sales from non-sports IP). But, are mobile games any different? We looked
at the data in two ways.
First, we examined the most downloaded mobile games and mobile games that
generated the most revenue. These data are from App Annie for Google Play
over the last seven years: 2012 to 2018. (The data excludes China.) The data
suggest there isn’t a single title among the top 10 that relies on third-party IP.
That holds true whether we rank the games by number of downloads or by
revenue. In addition, the correlation between downloads and monetization is
poor. That is, only Candy Crush and Clash of Clans rank in the top 10 for both
downloads and revenue. But, third-party IP didn’t cause that tight linkage. Rather,
it was the design of a mobile game that caused downloads and monetization to
both rank well.
Figure 105. Mobile Games on Google Play: Download Rank vs. Spend Rank
Source: App Annie for Google Play Jan 2012 to Aug 2018 (excludes China)
Second, we looked at the top 100 Apple Store mobile game in the U.S. during
March of 2019. And, 92% of the most downloaded games relied on internal IP.
Around 7% of downloads relied on third-party, non-sports IP including Marvel,
Game of Thrones, Star Wars, Star Trek, and Yu-Go-Oh! (a card game). Only 1%
of mobile game downloads relied on third-party sports IP.
Figure 106. Most Downloaded Games on Apple Store by IP Type
Game Examples of Third-party IP Daily Downloads Share
Internal IP None 1,302,314 92%
Sports IP Madden: NFL Overdrive 11,461 1%
Non-sports IP Marvel, Game of Thrones, Yu-Gi-Oh!, Star Wars, Star Trek 96,650 7%
= Top 100 iPhone Mobile Games in U.S. 1,410,425 100%
Source: Citi Research
Subway Surfer
Candy Crush
My Talking Tom
Pou
Temple Run 2
Hill Climb Racing
Clash of Clans
Minion Rush
8 Ball Pool
Fruit Ninja
Puzzle & Dragons
Monster Strike
Fate / Grand Order
Lineage M
Pokémon Go
Lineage 2 Revolution
Game of War – Fire Age
Clash of Kings
Download Rank Spend Rank
1
2
3
4
5
6
7
8
9
10
Outside top 10
Outside top 10
Outside top 10
Outside top 10
Outside top 10
Outside top 10
Outside top 10
Outside top 10
Outside top 10
4
Outside top 10
Outside top 10
Outside top 10
Outside top 10
6
Outside top 10
Outside top 10
Outside top 10
1
2
5
6
7
8
9
10
Kiloo
Activision
Outfit7
Zakeh
Imangi
Fingersoft
Supercell
Vivendi
Miniclip
Halfbrick
Gung Ho
Mixi
Sony
NCSoft
Niantic
Netmarble
MZ
Elex
Game Title Company
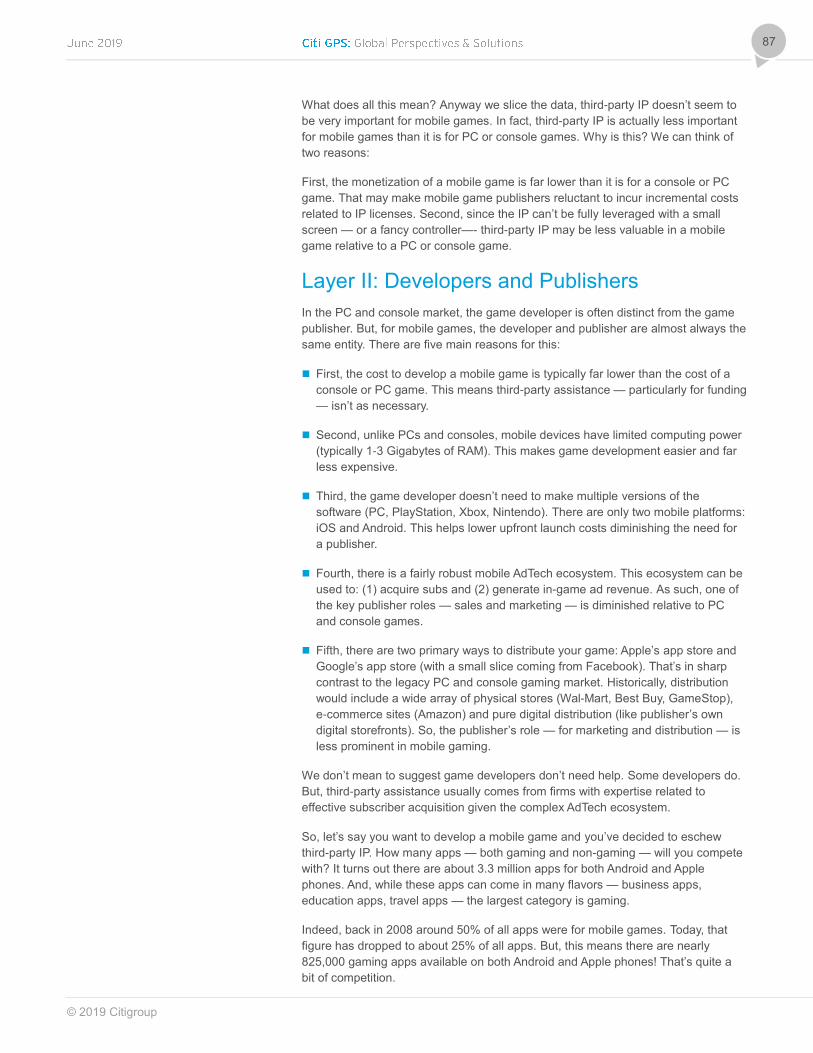
© 2019 Citigroup
87
What does all this mean? Anyway we slice the data, third-party IP doesn’t seem to
be very important for mobile games. In fact, third-party IP is actually less important
for mobile games than it is for PC or console games. Why is this? We can think of
two reasons:
First, the monetization of a mobile game is far lower than it is for a console or PC
game. That may make mobile game publishers reluctant to incur incremental costs
related to IP licenses. Second, since the IP can’t be fully leveraged with a small
screen — or a fancy controller—- third-party IP may be less valuable in a mobile
game relative to a PC or console game.
Layer II: Developers and Publishers
In the PC and console market, the game developer is often distinct from the game
publisher. But, for mobile games, the developer and publisher are almost always the
same entity. There are five main reasons for this:
First, the cost to develop a mobile game is typically far lower than the cost of a
console or PC game. This means third-party assistance — particularly for funding
— isn’t as necessary.
Second, unlike PCs and consoles, mobile devices have limited computing power
(typically 1-3 Gigabytes of RAM). This makes game development easier and far
less expensive.
Third, the game developer doesn’t need to make multiple versions of the
software (PC, PlayStation, Xbox, Nintendo). There are only two mobile platforms:
iOS and Android. This helps lower upfront launch costs diminishing the need for
a publisher.
Fourth, there is a fairly robust mobile AdTech ecosystem. This ecosystem can be
used to: (1) acquire subs and (2) generate in-game ad revenue. As such, one of
the key publisher roles — sales and marketing — is diminished relative to PC
and console games.
Fifth, there are two primary ways to distribute your game: Apple’s app store and
Google’s app store (with a small slice coming from Facebook). That’s in sharp
contrast to the legacy PC and console gaming market. Historically, distribution
would include a wide array of physical stores (Wal-Mart, Best Buy, GameStop),
e-commerce sites (Amazon) and pure digital distribution (like publisher’s own
digital storefronts). So, the publisher’s role — for marketing and distribution — is
less prominent in mobile gaming.
We don’t mean to suggest game developers don’t need help. Some developers do.
But, third-party assistance usually comes from firms with expertise related to
effective subscriber acquisition given the complex AdTech ecosystem.
So, let’s say you want to develop a mobile game and you’ve decided to eschew
third-party IP. How many apps — both gaming and non-gaming — will you compete
with? It turns out there are about 3.3 million apps for both Android and Apple
phones. And, while these apps can come in many flavors — business apps,
education apps, travel apps — the largest category is gaming.
Indeed, back in 2008 around 50% of all apps were for mobile games. Today, that
figure has dropped to about 25% of all apps. But, this means there are nearly
825,000 gaming apps available on both Android and Apple phones! That’s quite a
bit of competition.
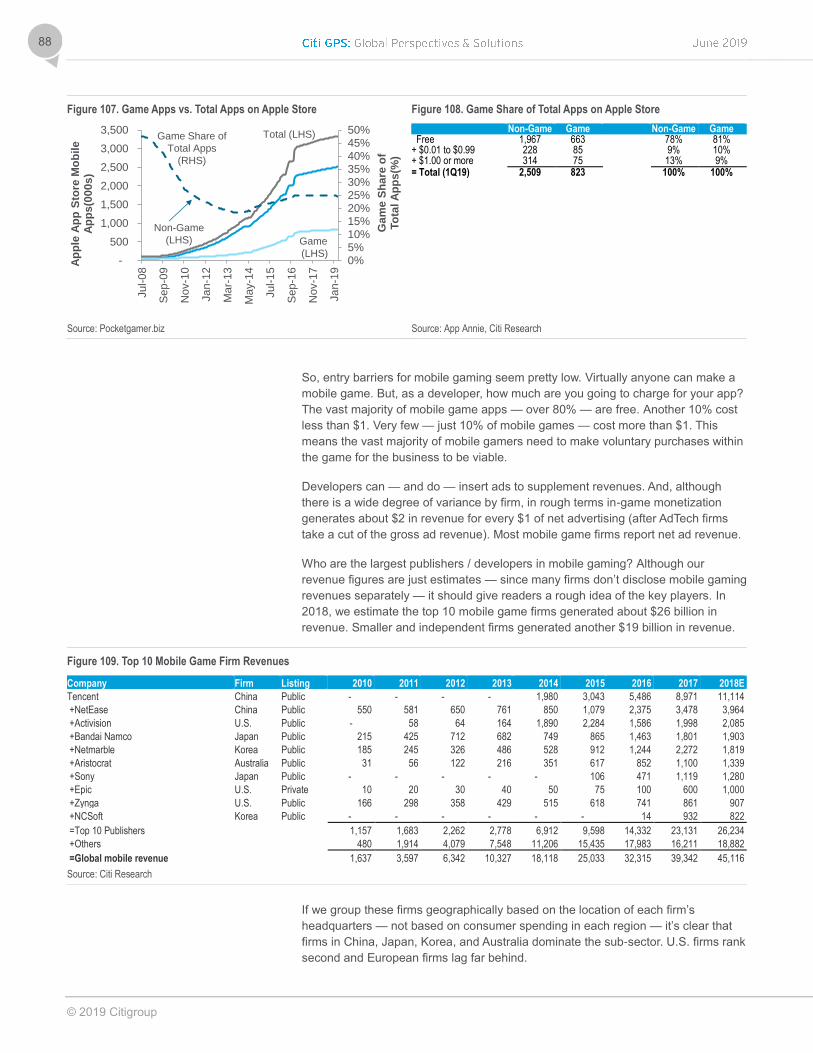
© 2019 Citigroup
88
Figure 107. Game Apps vs. Total Apps on Apple Store
Figure 108. Game Share of Total Apps on Apple Store
Non-Game Game Non-Game Game Free 1,967 663 78% 81% + $0.01 to $0.99 228 85 9% 10% + $1.00 or more 314 75 13% 9% = Total (1Q19) 2,509 823 100% 100%
Source: Pocketgamer.biz Source: App Annie, Citi Research
So, entry barriers for mobile gaming seem pretty low. Virtually anyone can make a
mobile game. But, as a developer, how much are you going to charge for your app?
The vast majority of mobile game apps — over 80% — are free. Another 10% cost
less than $1. Very few — just 10% of mobile games — cost more than $1. This
means the vast majority of mobile gamers need to make voluntary purchases within
the game for the business to be viable.
Developers can — and do — insert ads to supplement revenues. And, although
there is a wide degree of variance by firm, in rough terms in-game monetization
generates about $2 in revenue for every $1 of net advertising (after AdTech firms
take a cut of the gross ad revenue). Most mobile game firms report net ad revenue.
Who are the largest publishers / developers in mobile gaming? Although our
revenue figures are just estimates — since many firms don’t disclose mobile gaming
revenues separately — it should give readers a rough idea of the key players. In
2018, we estimate the top 10 mobile game firms generated about $26 billion in
revenue. Smaller and independent firms generated another $19 billion in revenue.
Figure 109. Top 10 Mobile Game Firm Revenues
Company Firm Listing 2010 2011 2012 2013 2014 2015 2016 2017 2018E
Tencent China Public - - - - 1,980 3,043 5,486 8,971 11,114
+NetEase China Public 550 581 650 761 850 1,079 2,375 3,478 3,964
+Activision U.S. Public - 58 64 164 1,890 2,284 1,586 1,998 2,085
+Bandai Namco Japan Public 215 425 712 682 749 865 1,463 1,801 1,903
+Netmarble Korea Public 185 245 326 486 528 912 1,244 2,272 1,819
+Aristocrat Australia Public 31 56 122 216 351 617 852 1,100 1,339
+Sony Japan Public - - - - - 106 471 1,119 1,280
+Epic U.S. Private 10 20 30 40 50 75 100 600 1,000
+Zynga U.S. Public 166 298 358 429 515 618 741 861 907
+NCSoft Korea Public - - - - - - 14 932 822
=Top 10 Publishers 1,157 1,683 2,262 2,778 6,912 9,598 14,332 23,131 26,234
+Others 480 1,914 4,079 7,548 11,206 15,435 17,983 16,211 18,882
=Global mobile revenue 1,637 3,597 6,342 10,327 18,118 25,033 32,315 39,342 45,116
Source: Citi Research
If we group these firms geographically based on the location of each firm’s
headquarters — not based on consumer spending in each region — it’s clear that
firms in China, Japan, Korea, and Australia dominate the sub-sector. U.S. firms rank
second and European firms lag far behind.
0%5%10%15%20%25%30%35%40%45%50%
-
500
1,000
1,500
2,000
2,500
3,000
3,500Ju
l-0
8
Sep
-09
No
v-1
0
Ja
n-1
2
Ma
r-13
May-1
4
Ju
l-1
5
Sep
-16
No
v-1
7
Ja
n-1
9
Ga
me
Sh
are
of
To
tal A
pp
s(%
)
Ap
ple
Ap
p S
tore
Mo
bil
e
Ap
ps
(00
0s
)
Total (LHS)
Non-Game
(LHS) Game
(LHS)
Game Share of
Total Apps
(RHS)

© 2019 Citigroup
89
Layer III: Installs
So, there are many, many mobile games and many mobile game firms. As such,
competition is fierce. And, most games are free. This means you can’t offer a lower
retail price to attract installs. So, as a developer/publisher, how are you going to get
consumers to install your game on their smartphone? Well, there are a few
important steps:
First, after your game is developed, you’ll need to tailor the app to each region.
Local customization will certainly include language changes. But, it may also
require other tweaks — like cultural modifications.
Second, with your geographically tailored app in hand, you have three broad
options to encourage local users to install your app:
– Adjust Keywords in the App Store: Developers can adjust keywords
associated with the app. By doing this, when consumers go to an app store,
your app can rank toward the top of the list. Many developers will use App
Annie and Sensor Tower to help with keyword adjustments. These websites
allow you to see where your app ranks relative to other apps for each
keyword. If a user types “candy game” in the keyword, where does your game
compare to Candy Crush? Of course, a higher ranking app is more likely to be
installed.
– Tap into Firm’s Internal Audience: You can encourage your internal
audience to use your app. This might mean promoting your game on your
social media page, your firm’s website, or promoting the game by using an
internal email list of customers.
– Purchase Access to External Audience: The last option is to tap into third-
party audiences. If you pursue this last option, you’ll need a marketing budget.
You can pay for ads on social media, in the app store, on third-party websites,
or on video sites like YouTube.
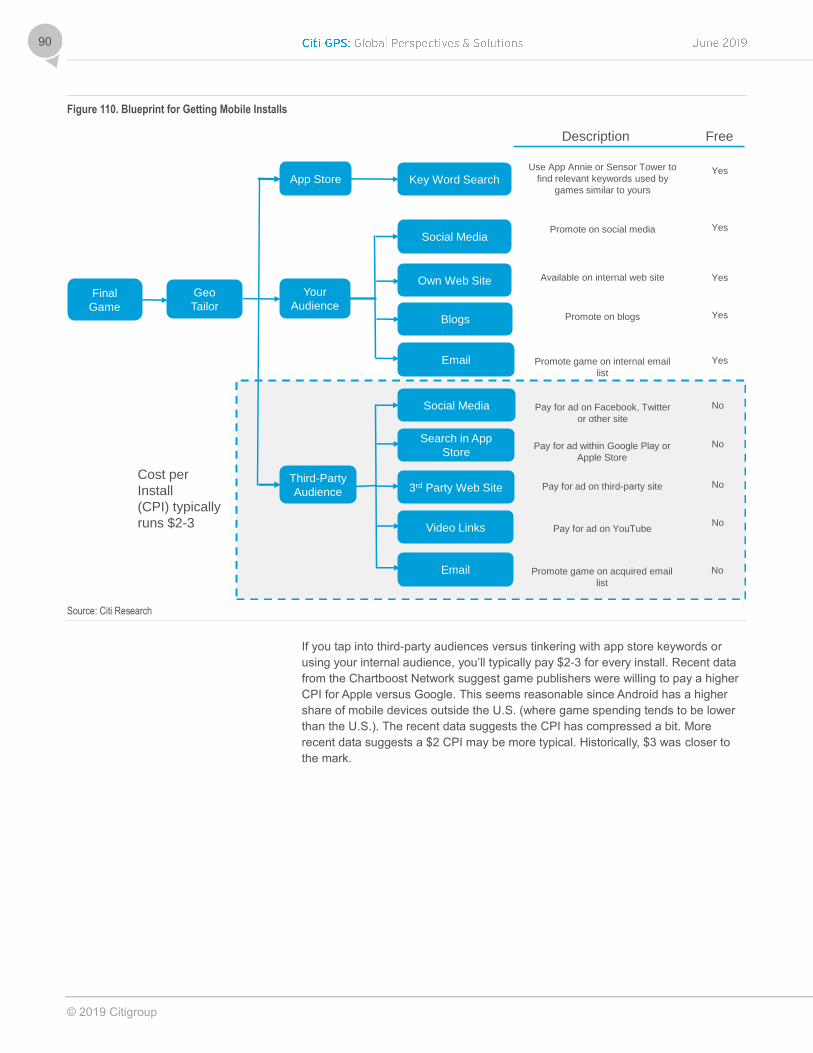
© 2019 Citigroup
90
Figure 110. Blueprint for Getting Mobile Installs
Source: Citi Research
If you tap into third-party audiences versus tinkering with app store keywords or
using your internal audience, you’ll typically pay $2-3 for every install. Recent data
from the Chartboost Network suggest game publishers were willing to pay a higher
CPI for Apple versus Google. This seems reasonable since Android has a higher
share of mobile devices outside the U.S. (where game spending tends to be lower
than the U.S.). The recent data suggests the CPI has compressed a bit. More
recent data suggests a $2 CPI may be more typical. Historically, $3 was closer to
the mark.
Final
Game
App Store Key Word Search
Your
Audience
Video Links
Own Web Site
Blogs
Social Media
Geo
Tailor
Third-Party
Audience
Search in App
Store
Social Media
3rd Party Web Site
Description
Use App Annie or Sensor Tower to
find relevant keywords used by
games similar to yours
Available on internal web site
Promote on social media
Free
Yes
Yes
Yes
Promote on blogs Yes
Promote game on internal email
list
Yes
Pay for ad on Facebook, Twitter
or other site
No
Pay for ad within Google Play or
Apple Store
No
Pay for ad on third-party site No
Pay for ad on YouTubeNo
Email Promote game on acquired email
list
No
Cost per
Install
(CPI) typically
runs $2-3

© 2019 Citigroup
91
Figure 111. Cost per Install: Apple vs. Google
Figure 112. No. of Apps Downloaded vs. Used on Android
Source: ; eMarketer; Chartboost, Network Citi Research Source: App Annie, Citi Research
Although averages can be a misleading, according to App Annie, the average
Android smartphone uses between 35 and 40 apps (including games and non-
games). And, in most countries, smartphone users download 1-2x more apps than
they actually use. In emerging economies — like India or Brazil — the ratio of
downloaded apps to used apps is 1:1. But, in developed economies — like the U.S.
or Australia — the ratio of downloaded apps to used apps is closer to 2:1.
This dynamic poses a bit of a conundrum for mobile game firms. In markets where
disposable income is higher — which results in greater in-game spending and
higher ad revenues — the likelihood of a consumer downloading, but not using,
your app increases. That suggests in developed markets, you may pay for more
installs but not generate as much revenue.
So, let’s say that you get some consumers to download your gaming app. How long
will these new users stick around and play your game? With such a heavily reliance
on free subs, it may not come as a surprise that mobile game churn rates are very
high.
Although mobile game firms don’t disclose churn rates, many do disclose Monthly
and Daily Active Users (MAU and DAU, respectively). If we compare DAUs to
MAUs, it suggests that about one-quarter of the monthly users use the gaming app
daily. This highlights a truism about mobile gaming: avid fans drive most of the
economics. But, most players only occasionally play the game.
Figure 113. Monthly & Daily Active User Rates for Zynga and Glu
2016 2017 2018
Zynga + Glu Daily Active Users (DAU) 23 25 26
/ Zynga + Glu Monthly Active Users (MAU) 100 110 110
= Share of subs engaged daily 23% 23% 24%
memo: Zynga daily engagement 30% 26% 26%
memo: Glu daily engagement 12% 14% 16%
Source: Company Report, Citi Research
We can come at the data one other way. Both Zynga and Glu disclose beginning
and ending period DAUs. They also disclose marketing outlays to get new installs. If
we assume a cost per install (of $2.50), it suggests monthly churn rates run 25-
30%.
$0.00
$0.50
$1.00
$1.50
$2.00
$2.50
$3.00
$3.50
$4.00D
ec-1
5
Apr-
16
Aug
-16
Dec-1
6
Apr-
17
Aug
-17
Dec-1
7
Apr-
18
Aug
-18
Dec-1
8
Co
st
pe
r In
sta
ll
Apple
39
37
40
34
36
36
36
37
33
33
35
64
65
60
64
47
46
44
44
37
29
27
0 20 40 60 80 100 120
Australia
U.S.
S. Korea
Japan
U.K.
Germany
France
Mexico
Brazil
Indonesia
India
Used Installed
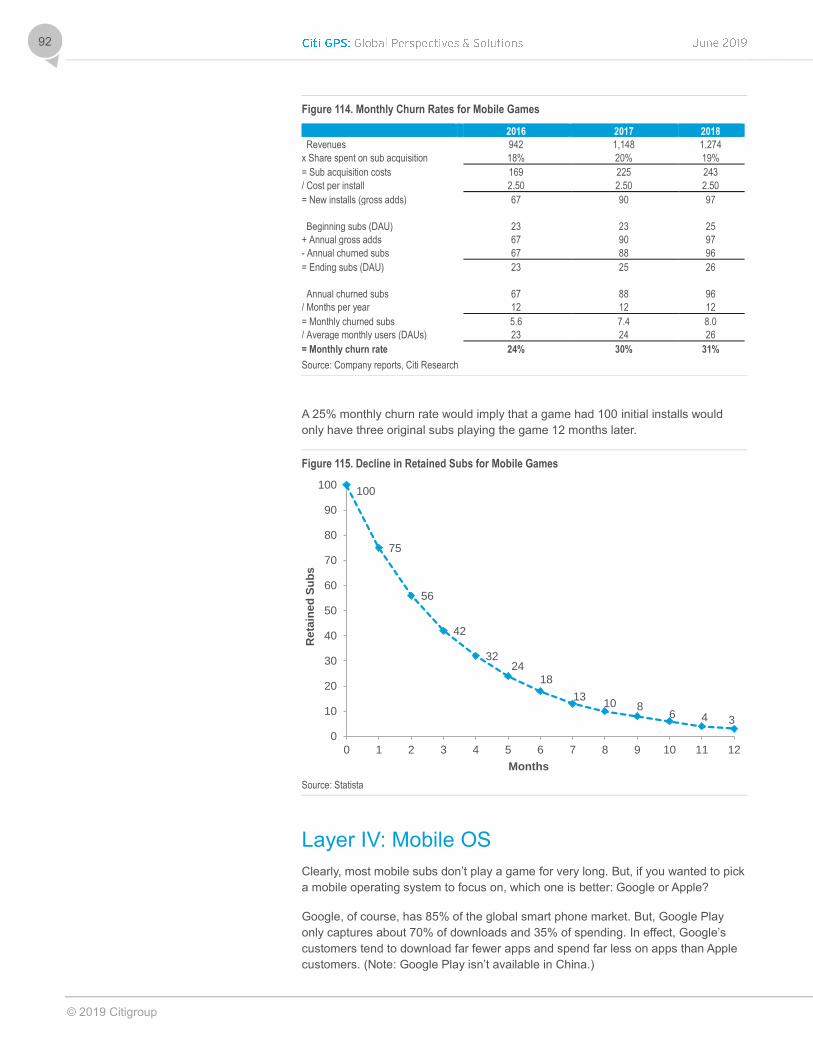
© 2019 Citigroup
92
Figure 114. Monthly Churn Rates for Mobile Games
2016 2017 2018
Revenues 942 1,148 1,274
x Share spent on sub acquisition 18% 20% 19%
= Sub acquisition costs 169 225 243
/ Cost per install 2.50 2.50 2.50
= New installs (gross adds) 67 90 97
Beginning subs (DAU) 23 23 25
+ Annual gross adds 67 90 97
- Annual churned subs 67 88 96
= Ending subs (DAU) 23 25 26
Annual churned subs 67 88 96
/ Months per year 12 12 12
= Monthly churned subs 5.6 7.4 8.0
/ Average monthly users (DAUs) 23 24 26
= Monthly churn rate 24% 30% 31%
Source: Company reports, Citi Research
A 25% monthly churn rate would imply that a game had 100 initial installs would
only have three original subs playing the game 12 months later.
Figure 115. Decline in Retained Subs for Mobile Games
Source: Statista
Layer IV: Mobile OS
Clearly, most mobile subs don’t play a game for very long. But, if you wanted to pick
a mobile operating system to focus on, which one is better: Google or Apple?
Google, of course, has 85% of the global smart phone market. But, Google Play
only captures about 70% of downloads and 35% of spending. In effect, Google’s
customers tend to download far fewer apps and spend far less on apps than Apple
customers. (Note: Google Play isn’t available in China.)
100
75
56
42
3224
18
1310 8
6 4 3
0
10
20
30
40
50
60
70
80
90
100
0 1 2 3 4 5 6 7 8 9 10 11 12
Re
tain
ed
Su
bs
Months
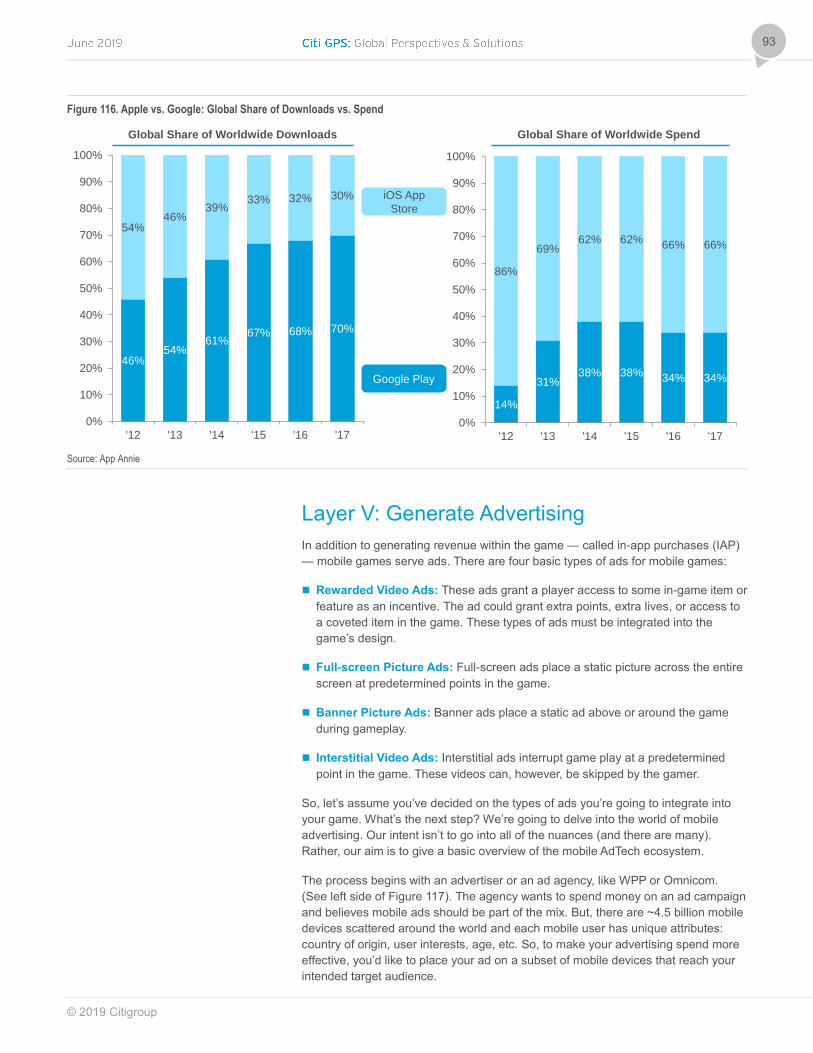
© 2019 Citigroup
93
Figure 116. Apple vs. Google: Global Share of Downloads vs. Spend
Source: App Annie
Layer V: Generate Advertising
In addition to generating revenue within the game — called in-app purchases (IAP)
— mobile games serve ads. There are four basic types of ads for mobile games:
Rewarded Video Ads: These ads grant a player access to some in-game item or
feature as an incentive. The ad could grant extra points, extra lives, or access to
a coveted item in the game. These types of ads must be integrated into the
game’s design.
Full-screen Picture Ads: Full-screen ads place a static picture across the entire
screen at predetermined points in the game.
Banner Picture Ads: Banner ads place a static ad above or around the game
during gameplay.
Interstitial Video Ads: Interstitial ads interrupt game play at a predetermined
point in the game. These videos can, however, be skipped by the gamer.
So, let’s assume you’ve decided on the types of ads you’re going to integrate into
your game. What’s the next step? We’re going to delve into the world of mobile
advertising. Our intent isn’t to go into all of the nuances (and there are many).
Rather, our aim is to give a basic overview of the mobile AdTech ecosystem.
The process begins with an advertiser or an ad agency, like WPP or Omnicom.
(See left side of Figure 117). The agency wants to spend money on an ad campaign
and believes mobile ads should be part of the mix. But, there are ~4.5 billion mobile
devices scattered around the world and each mobile user has unique attributes:
country of origin, user interests, age, etc. So, to make your advertising spend more
effective, you’d like to place your ad on a subset of mobile devices that reach your
intended target audience.
46%54%
61%67% 68% 70%
54%46%
39%33% 32% 30%
0%
10%
20%
30%
40%
50%
60%
70%
80%
90%
100%
'12 '13 '14 '15 '16 '17
14%
31%38% 38% 34% 34%
86%
69%62% 62% 66% 66%
0%
10%
20%
30%
40%
50%
60%
70%
80%
90%
100%
'12 '13 '14 '15 '16 '17
Global Share of Worldwide Downloads Global Share of Worldwide Spend
iOS App
Store
Google Play

© 2019 Citigroup
94
Perhaps you sell energy drinks. And, as a marketer you know the target audience is
men, aged 18-24. Your research also suggests that energy drink consumers also
over index on first person shooter (FPS) games. You might want to push your ad to
that specific subset of mobile games. But, how would you go about that? The best
place to go is a Demand Side Platform, or DSP, which allows ad buyers to bid for ad
space on specific digital sites. Google’s DV360 is a good example of a DSP.
At the other end of the process is the mobile game publisher like Zynga or Glu. (See
right side of Figure 117). The game publisher has a specific amount of inventory
that it wants to monetize. The game publisher would make the inventory available to
a Supply Side Platform (SSP), which allows publishers to sell inventory to
advertisers at a competitive price. Examples of SSPs include Google’s DoubleClick
or Unity Ads.
Since the DSP has an idea of demand and the SSP has an idea of supply, there
needs to be a way for the market to clear in an efficient way. And, there are two
main options — an Ad Exchange and an Ad Network.
Figure 117. Advertising Ecosystem
Source: Citi Research
Ad
Agency
Game
Publisher
Ad
Exchange
Ad
Network
Ad Exchange: Sales channel for buying &
selling inventory. Prices determined via
bidding.
Example firms: Google’s DoubleClick,
Facebook Exchange
Ad Network: Outsourced sales capability for
publishers. Sorts audiences from various sources.
Provides value to both agency & publisher (like
targeting, optimization)
Example firms: Google, Media.net
Demand Side
Platform
(DSP)
Supply Side
Platform
(SSP)
SSP: Allows
publisher to sell
inventory to
advertisers at
competitive prices
Example firms:
Google’s
DoubleClick, Unity
Ads
DSP: Allows ad
buyers to bid for
space on digital
sites.
Example firms:
Google’s DV360
f/k/a DoubleClick
Bid Manager,
MediaMath, ONE
by AOL

© 2019 Citigroup
95
But, what’s the difference between an ad exchange and an ad network?
An Ad Exchange — like Facebook Exchange or Google’s DoubleClick — is a
sales channel where prices are determined via bidding. The ad buyer bids on
available inventory. If they place the highest bid, the have the right to place their
ad on that specific slice of inventory.
An Ad Network — like Google or Media.net — is just an outsourced sales
capability that can sort audiences from various game publishers. They provide
value to both the buyer (ad agency) and the seller (game publisher) by matching
the supply and demand in a way that helps the buyer get a higher price and the
seller meet their marketing objectives.
Figure 118. Ad Networks vs. Ad Exchanges
Source: Citi Research
Layer VI: Advertiser
With 4.5 billion mobile devices and a relatively easy way to target a subset of the
aggregate users, mobile advertising has emerged as one of the fastest growing
types of ads. According to Magna Global, total global ad outlays for all mediums —
Internet, TV, print, outdoor — has grown from $368 billion in 2010 to $535 billion in
2018.
Interestingly, in 2010 mobile advertising didn’t exist. But, today, the mobile ad
market generates about $150 billion in revenue. Said another way, over the last
eight years, 90% of the growth in total ad spending has accrued to mobile platforms
(90% = $150B / ($535B - $368B)).
Within mobile advertising, however, there are two basic types of ads: search and
non-search. As a mobile gaming company, therefore, the addressable market is
closer to $80 billion a year (with the balance accruing to search firms like Google).
But, virtually every social media company and every mobile website is vying for that
$80 billion. We estimate mobile gaming captures ~20% of the $80 billion, or just $18
billion a year. And, the AdTech players are going to capture about 40% of this
spending since they match the ad buyer (say Omnicom) with the ad seller (Zynga).
This means mobile gaming firms are competing for just $10 billion of net mobile ad
revenue each year.
Transaction:
Innovation:
Ad Target:
Ad Network Ad Exchange
Arbitrage Auction
Offload unsold inventory
Sell inventory across sites
Competitive bidding
Better rules (set ad budget,
maximum bid)
BehavioralContextual
Limited for rich mediaLimited transparencyChallenge:
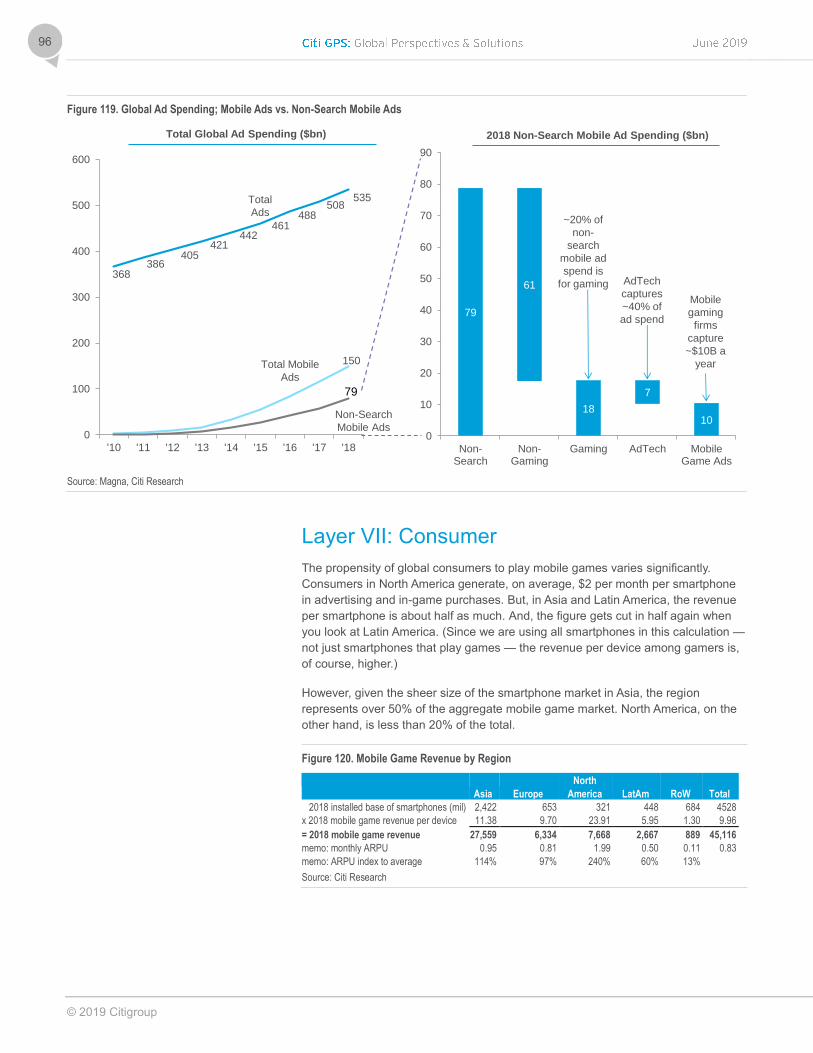
© 2019 Citigroup
96
Figure 119. Global Ad Spending; Mobile Ads vs. Non-Search Mobile Ads
Source: Magna, Citi Research
Layer VII: Consumer
The propensity of global consumers to play mobile games varies significantly.
Consumers in North America generate, on average, $2 per month per smartphone
in advertising and in-game purchases. But, in Asia and Latin America, the revenue
per smartphone is about half as much. And, the figure gets cut in half again when
you look at Latin America. (Since we are using all smartphones in this calculation —
not just smartphones that play games — the revenue per device among gamers is,
of course, higher.)
However, given the sheer size of the smartphone market in Asia, the region
represents over 50% of the aggregate mobile game market. North America, on the
other hand, is less than 20% of the total.
Figure 120. Mobile Game Revenue by Region
Asia Europe
North
America LatAm RoW Total
2018 installed base of smartphones (mil) 2,422 653 321 448 684 4528
x 2018 mobile game revenue per device 11.38 9.70 23.91 5.95 1.30 9.96
= 2018 mobile game revenue 27,559 6,334 7,668 2,667 889 45,116
memo: monthly ARPU 0.95 0.81 1.99 0.50 0.11 0.83
memo: ARPU index to average 114% 97% 240% 60% 13%
Source: Citi Research
368386
405421
442461
488508
535
150
0
100
200
300
400
500
600
'10 '11 '12 '13 '14 '15 '16 '17 '18
79
Total
Ads
Total Mobile
Ads
Non-Search
Mobile Ads
Total Global Ad Spending ($bn)
79
61
18
7
10
0
10
20
30
40
50
60
70
80
90
Non-Search
Non-Gaming
Gaming AdTech MobileGame Ads
2018 Non-Search Mobile Ad Spending ($bn)
~20% of
non-
search
mobile ad
spend is
for gaming AdTech
captures
~40% of
ad spend
Mobile
gaming
firms
capture
~$10B a
year
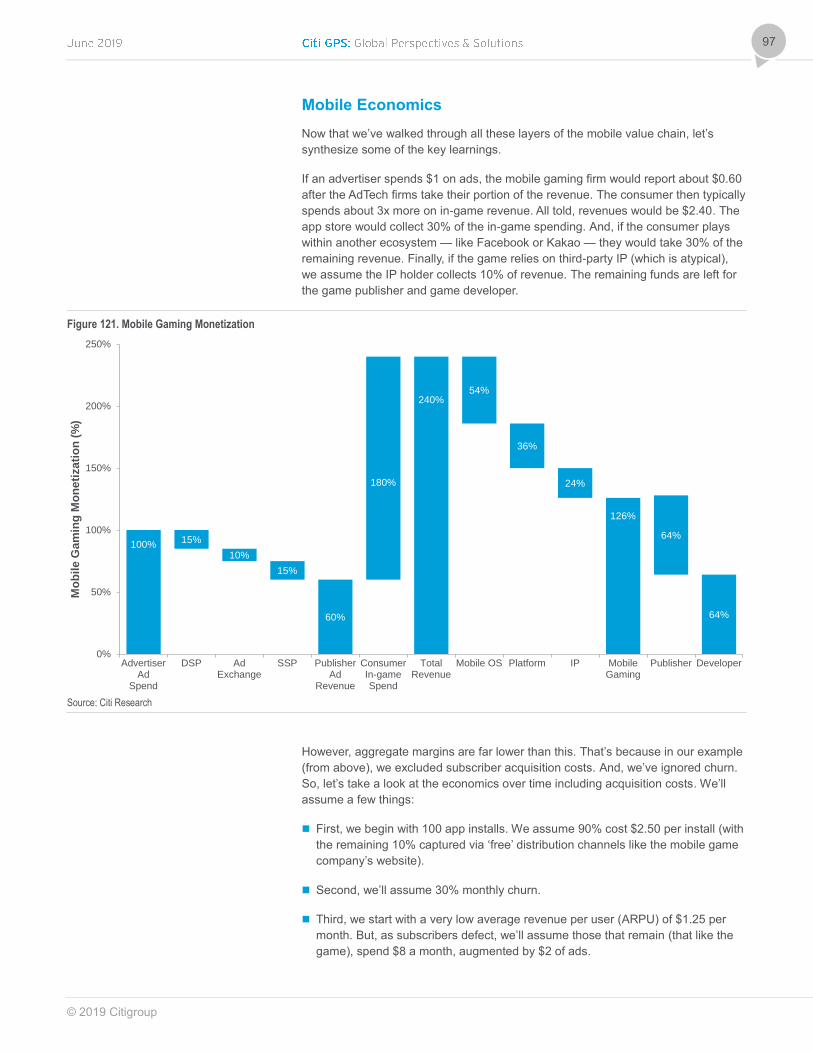
© 2019 Citigroup
97
Mobile Economics
Now that we’ve walked through all these layers of the mobile value chain, let’s
synthesize some of the key learnings.
If an advertiser spends $1 on ads, the mobile gaming firm would report about $0.60
after the AdTech firms take their portion of the revenue. The consumer then typically
spends about 3x more on in-game revenue. All told, revenues would be $2.40. The
app store would collect 30% of the in-game spending. And, if the consumer plays
within another ecosystem — like Facebook or Kakao — they would take 30% of the
remaining revenue. Finally, if the game relies on third-party IP (which is atypical),
we assume the IP holder collects 10% of revenue. The remaining funds are left for
the game publisher and game developer.
Figure 121. Mobile Gaming Monetization
Source: Citi Research
However, aggregate margins are far lower than this. That’s because in our example
(from above), we excluded subscriber acquisition costs. And, we’ve ignored churn.
So, let’s take a look at the economics over time including acquisition costs. We’ll
assume a few things:
First, we begin with 100 app installs. We assume 90% cost $2.50 per install (with
the remaining 10% captured via ‘free’ distribution channels like the mobile game
company’s website).
Second, we’ll assume 30% monthly churn.
Third, we start with a very low average revenue per user (ARPU) of $1.25 per
month. But, as subscribers defect, we’ll assume those that remain (that like the
game), spend $8 a month, augmented by $2 of ads.
100%15%
10%
15%
60%
180%
240%54%
36%
24%
126%
64%
64%
0%
50%
100%
150%
200%
250%
AdvertiserAd
Spend
DSP AdExchange
SSP PublisherAd
Revenue
ConsumerIn-gameSpend
TotalRevenue
Mobile OS Platform IP MobileGaming
Publisher Developer
Mo
bil
e G
am
ing
Mo
ne
tiza
tio
n (
%)
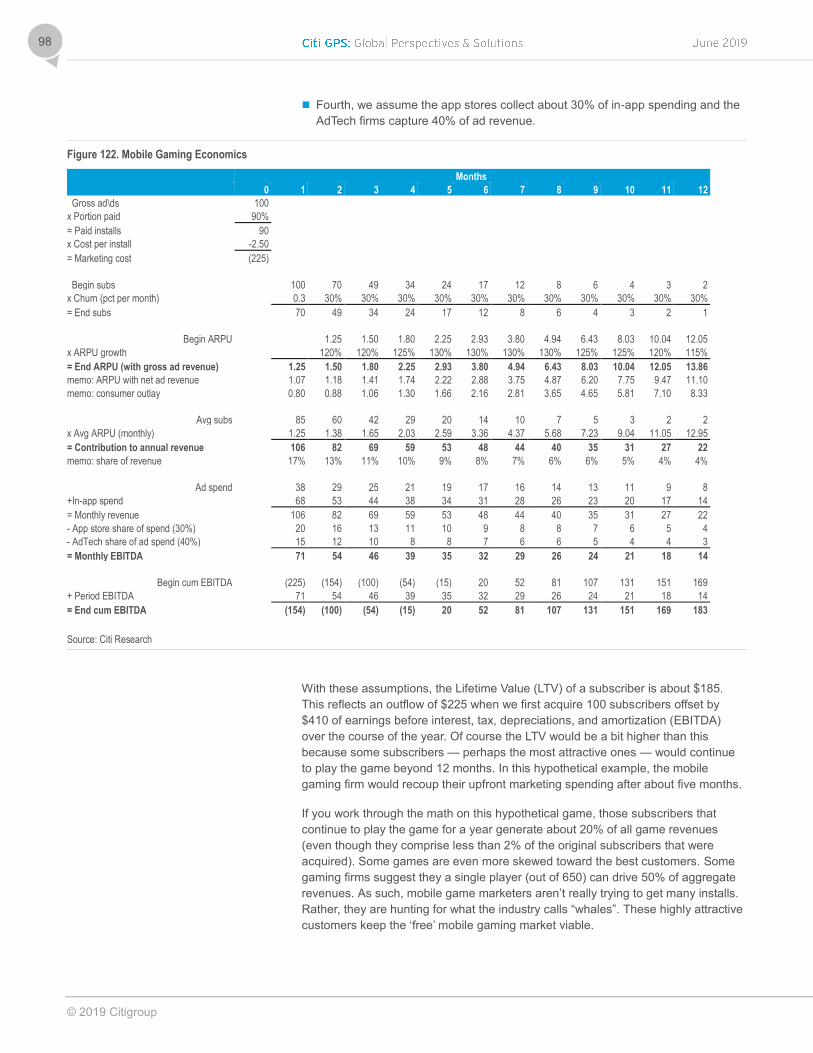
© 2019 Citigroup
98
Fourth, we assume the app stores collect about 30% of in-app spending and the
AdTech firms capture 40% of ad revenue.
Figure 122. Mobile Gaming Economics
Months
0 1 2 3 4 5 6 7 8 9 10 11 12
Gross ad\ds 100
x Portion paid 90%
= Paid installs 90
x Cost per install -2.50
= Marketing cost (225)
Begin subs 100 70 49 34 24 17 12 8 6 4 3 2
x Churn (pct per month) 0.3 30% 30% 30% 30% 30% 30% 30% 30% 30% 30% 30%
= End subs 70 49 34 24 17 12 8 6 4 3 2 1
Begin ARPU 1.25 1.50 1.80 2.25 2.93 3.80 4.94 6.43 8.03 10.04 12.05
x ARPU growth 120% 120% 125% 130% 130% 130% 130% 125% 125% 120% 115%
= End ARPU (with gross ad revenue) 1.25 1.50 1.80 2.25 2.93 3.80 4.94 6.43 8.03 10.04 12.05 13.86
memo: ARPU with net ad revenue 1.07 1.18 1.41 1.74 2.22 2.88 3.75 4.87 6.20 7.75 9.47 11.10
memo: consumer outlay 0.80 0.88 1.06 1.30 1.66 2.16 2.81 3.65 4.65 5.81 7.10 8.33
Avg subs 85 60 42 29 20 14 10 7 5 3 2 2
x Avg ARPU (monthly) 1.25 1.38 1.65 2.03 2.59 3.36 4.37 5.68 7.23 9.04 11.05 12.95
= Contribution to annual revenue 106 82 69 59 53 48 44 40 35 31 27 22
memo: share of revenue 17% 13% 11% 10% 9% 8% 7% 6% 6% 5% 4% 4%
Ad spend 38 29 25 21 19 17 16 14 13 11 9 8
+In-app spend 68 53 44 38 34 31 28 26 23 20 17 14
= Monthly revenue 106 82 69 59 53 48 44 40 35 31 27 22
- App store share of spend (30%) 20 16 13 11 10 9 8 8 7 6 5 4
- AdTech share of ad spend (40%) 15 12 10 8 8 7 6 6 5 4 4 3
= Monthly EBITDA 71 54 46 39 35 32 29 26 24 21 18 14
Begin cum EBITDA (225) (154) (100) (54) (15) 20 52 81 107 131 151 169
+ Period EBITDA 71 54 46 39 35 32 29 26 24 21 18 14
= End cum EBITDA (154) (100) (54) (15) 20 52 81 107 131 151 169 183
Source: Citi Research
With these assumptions, the Lifetime Value (LTV) of a subscriber is about $185.
This reflects an outflow of $225 when we first acquire 100 subscribers offset by
$410 of earnings before interest, tax, depreciations, and amortization (EBITDA)
over the course of the year. Of course the LTV would be a bit higher than this
because some subscribers — perhaps the most attractive ones — would continue
to play the game beyond 12 months. In this hypothetical example, the mobile
gaming firm would recoup their upfront marketing spending after about five months.
If you work through the math on this hypothetical game, those subscribers that
continue to play the game for a year generate about 20% of all game revenues
(even though they comprise less than 2% of the original subscribers that were
acquired). Some games are even more skewed toward the best customers. Some
gaming firms suggest they a single player (out of 650) can drive 50% of aggregate
revenues. As such, mobile game marketers aren’t really trying to get many installs.
Rather, they are hunting for what the industry calls “whales”. These highly attractive
customers keep the ‘free’ mobile gaming market viable.
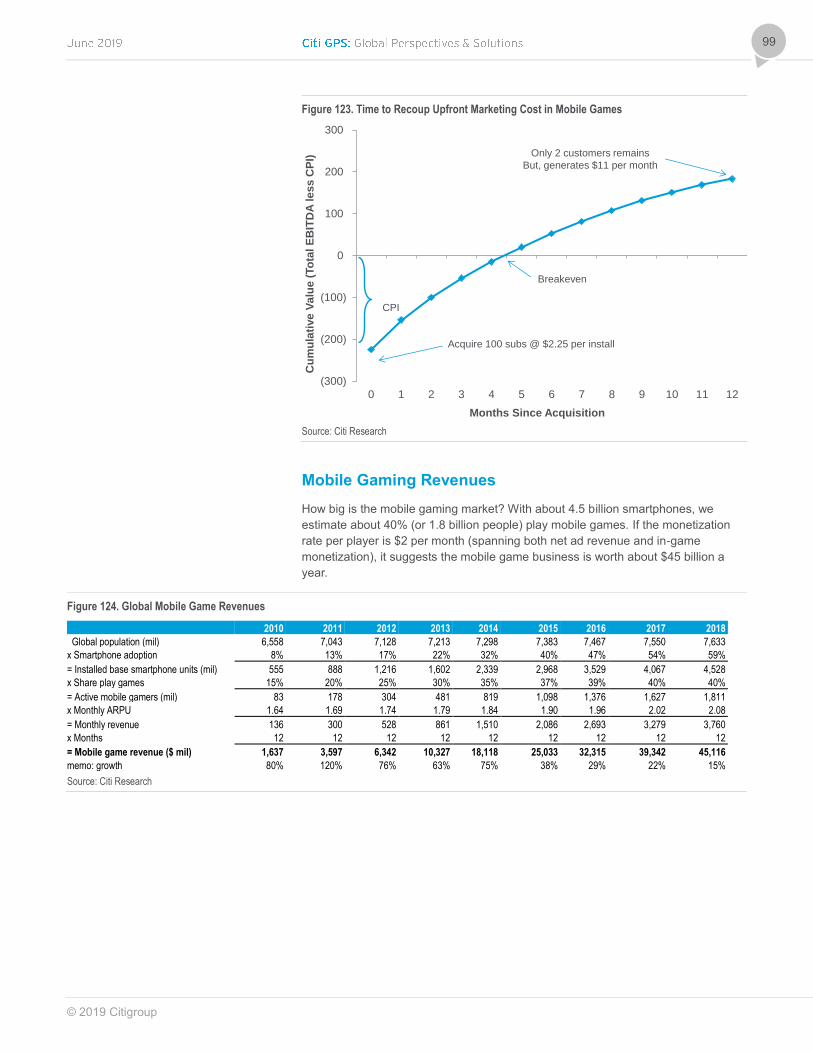
© 2019 Citigroup
99
Figure 123. Time to Recoup Upfront Marketing Cost in Mobile Games
Source: Citi Research
Mobile Gaming Revenues
How big is the mobile gaming market? With about 4.5 billion smartphones, we
estimate about 40% (or 1.8 billion people) play mobile games. If the monetization
rate per player is $2 per month (spanning both net ad revenue and in-game
monetization), it suggests the mobile game business is worth about $45 billion a
year.
Figure 124. Global Mobile Game Revenues
2010 2011 2012 2013 2014 2015 2016 2017 2018
Global population (mil) 6,558 7,043 7,128 7,213 7,298 7,383 7,467 7,550 7,633
x Smartphone adoption 8% 13% 17% 22% 32% 40% 47% 54% 59%
= Installed base smartphone units (mil) 555 888 1,216 1,602 2,339 2,968 3,529 4,067 4,528
x Share play games 15% 20% 25% 30% 35% 37% 39% 40% 40%
= Active mobile gamers (mil) 83 178 304 481 819 1,098 1,376 1,627 1,811
x Monthly ARPU 1.64 1.69 1.74 1.79 1.84 1.90 1.96 2.02 2.08
= Monthly revenue 136 300 528 861 1,510 2,086 2,693 3,279 3,760
x Months 12 12 12 12 12 12 12 12 12
= Mobile game revenue ($ mil) 1,637 3,597 6,342 10,327 18,118 25,033 32,315 39,342 45,116
memo: growth 80% 120% 76% 63% 75% 38% 29% 22% 15%
Source: Citi Research
(300)
(200)
(100)
0
100
200
300
0 1 2 3 4 5 6 7 8 9 10 11 12
Cu
mu
lati
ve
Va
lue
(To
tal
EB
ITD
A l
es
s C
PI)
Months Since Acquisition
CPI
Breakeven
Only 2 customers remains
But, generates $11 per month
Acquire 100 subs @ $2.25 per install
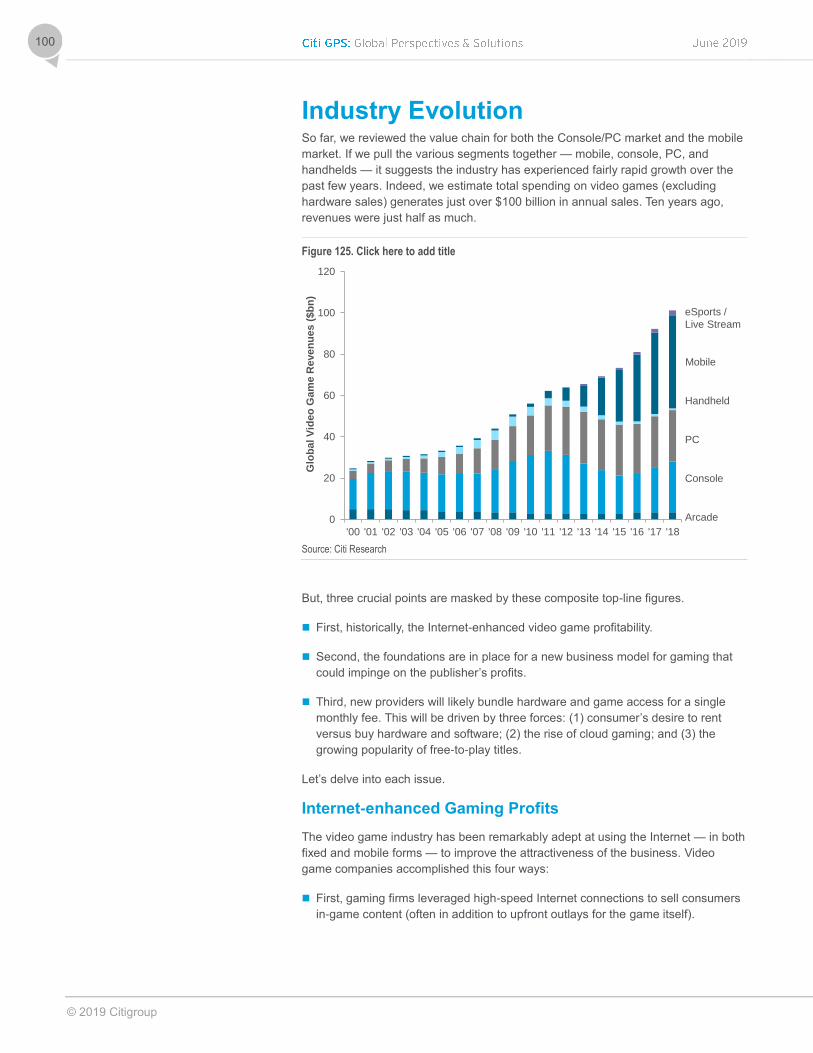
© 2019 Citigroup
100
Industry Evolution So far, we reviewed the value chain for both the Console/PC market and the mobile
market. If we pull the various segments together — mobile, console, PC, and
handhelds — it suggests the industry has experienced fairly rapid growth over the
past few years. Indeed, we estimate total spending on video games (excluding
hardware sales) generates just over $100 billion in annual sales. Ten years ago,
revenues were just half as much.
Figure 125. Click here to add title
Source: Citi Research
But, three crucial points are masked by these composite top-line figures.
First, historically, the Internet-enhanced video game profitability.
Second, the foundations are in place for a new business model for gaming that
could impinge on the publisher’s profits.
Third, new providers will likely bundle hardware and game access for a single
monthly fee. This will be driven by three forces: (1) consumer’s desire to rent
versus buy hardware and software; (2) the rise of cloud gaming; and (3) the
growing popularity of free-to-play titles.
Let’s delve into each issue.
Internet-enhanced Gaming Profits
The video game industry has been remarkably adept at using the Internet — in both
fixed and mobile forms — to improve the attractiveness of the business. Video
game companies accomplished this four ways:
First, gaming firms leveraged high-speed Internet connections to sell consumers
in-game content (often in addition to upfront outlays for the game itself).
0
20
40
60
80
100
120
'00 '01 '02 '03 '04 '05 '06 '07 '08 '09 '10 '11 '12 '13 '14 '15 '16 '17 '18
Glo
ba
l V
ideo
Ga
me
Re
ve
nu
es
($
bn
)
Arcade
Console
PC
Handheld
Mobile
eSports /
Live Stream
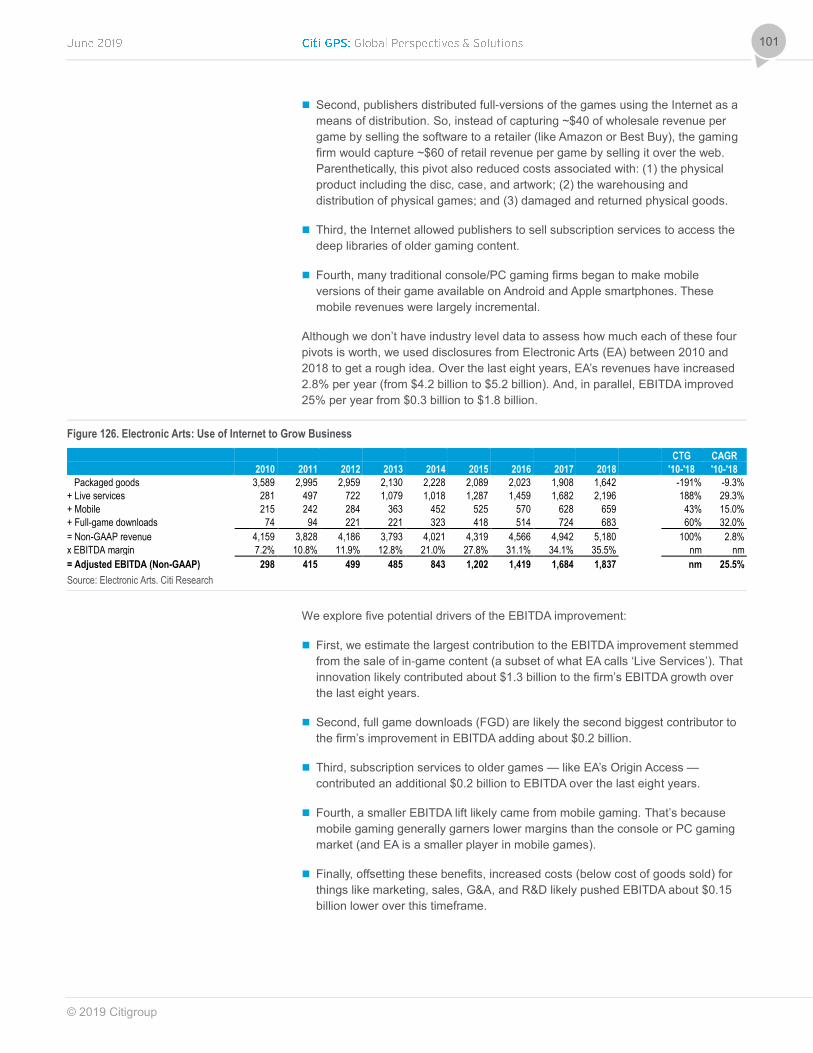
© 2019 Citigroup
101
Second, publishers distributed full-versions of the games using the Internet as a
means of distribution. So, instead of capturing ~$40 of wholesale revenue per
game by selling the software to a retailer (like Amazon or Best Buy), the gaming
firm would capture ~$60 of retail revenue per game by selling it over the web.
Parenthetically, this pivot also reduced costs associated with: (1) the physical
product including the disc, case, and artwork; (2) the warehousing and
distribution of physical games; and (3) damaged and returned physical goods.
Third, the Internet allowed publishers to sell subscription services to access the
deep libraries of older gaming content.
Fourth, many traditional console/PC gaming firms began to make mobile
versions of their game available on Android and Apple smartphones. These
mobile revenues were largely incremental.
Although we don’t have industry level data to assess how much each of these four
pivots is worth, we used disclosures from Electronic Arts (EA) between 2010 and
2018 to get a rough idea. Over the last eight years, EA’s revenues have increased
2.8% per year (from $4.2 billion to $5.2 billion). And, in parallel, EBITDA improved
25% per year from $0.3 billion to $1.8 billion.
Figure 126. Electronic Arts: Use of Internet to Grow Business
CTG CAGR
2010 2011 2012 2013 2014 2015 2016 2017 2018 '10-'18 '10-'18
Packaged goods 3,589 2,995 2,959 2,130 2,228 2,089 2,023 1,908 1,642 -191% -9.3%
+ Live services 281 497 722 1,079 1,018 1,287 1,459 1,682 2,196 188% 29.3%
+ Mobile 215 242 284 363 452 525 570 628 659 43% 15.0%
+ Full-game downloads 74 94 221 221 323 418 514 724 683 60% 32.0%
= Non-GAAP revenue 4,159 3,828 4,186 3,793 4,021 4,319 4,566 4,942 5,180 100% 2.8%
x EBITDA margin 7.2% 10.8% 11.9% 12.8% 21.0% 27.8% 31.1% 34.1% 35.5% nm nm
= Adjusted EBITDA (Non-GAAP) 298 415 499 485 843 1,202 1,419 1,684 1,837 nm 25.5%
Source: Electronic Arts. Citi Research
We explore five potential drivers of the EBITDA improvement:
First, we estimate the largest contribution to the EBITDA improvement stemmed
from the sale of in-game content (a subset of what EA calls ‘Live Services’). That
innovation likely contributed about $1.3 billion to the firm’s EBITDA growth over
the last eight years.
Second, full game downloads (FGD) are likely the second biggest contributor to
the firm’s improvement in EBITDA adding about $0.2 billion.
Third, subscription services to older games — like EA’s Origin Access —
contributed an additional $0.2 billion to EBITDA over the last eight years.
Fourth, a smaller EBITDA lift likely came from mobile gaming. That’s because
mobile gaming generally garners lower margins than the console or PC gaming
market (and EA is a smaller player in mobile games).
Finally, offsetting these benefits, increased costs (below cost of goods sold) for
things like marketing, sales, G&A, and R&D likely pushed EBITDA about $0.15
billion lower over this timeframe.

© 2019 Citigroup
102
Figure 127. EA Adjusted EBITDA
Source: Citi Research
So, the Internet has been a boon to video game publishers and there are several
underlying drivers of the EBITDA improvement. But, in-game monetization is by far
the most important driver.
Foundation In Place for a New Model
What’s striking about these findings is this: most other media businesses have
actually been damaged by the Internet. These include: ad agencies, phone
directories, newspapers, magazines, radio stations, and cable networks. (And, there
are some non-media victims as well, including traditional retail, travel agencies, and
cab services.)
In effect, video game publishers are members of a fairly exclusive club: media
businesses that haven’t been harmed by the Internet. This club includes only a
handful of U.S. media companies: sports franchises (Formula One, WWE), concert
promoters (Live Nation), and video game publishers (EA and Activision).
298
1,284
203
218211
1,837
0
300
600
900
1200
1500
1800
2100
2008 In-game Full game Mobile Subs Other 2018
EA
Ad
jus
ted
EB
ITD
A($
mil
lio
ns
)
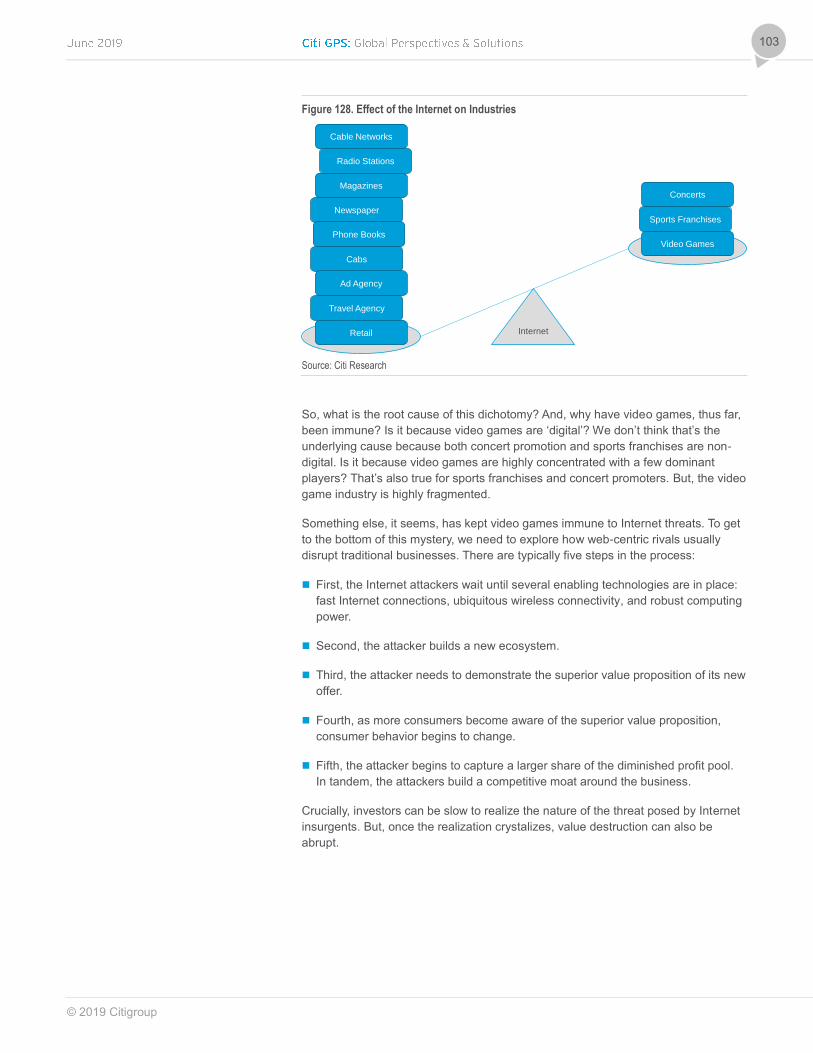
© 2019 Citigroup
103
Figure 128. Effect of the Internet on Industries
Source: Citi Research
So, what is the root cause of this dichotomy? And, why have video games, thus far,
been immune? Is it because video games are ‘digital’? We don’t think that’s the
underlying cause because both concert promotion and sports franchises are non-
digital. Is it because video games are highly concentrated with a few dominant
players? That’s also true for sports franchises and concert promoters. But, the video
game industry is highly fragmented.
Something else, it seems, has kept video games immune to Internet threats. To get
to the bottom of this mystery, we need to explore how web-centric rivals usually
disrupt traditional businesses. There are typically five steps in the process:
First, the Internet attackers wait until several enabling technologies are in place:
fast Internet connections, ubiquitous wireless connectivity, and robust computing
power.
Second, the attacker builds a new ecosystem.
Third, the attacker needs to demonstrate the superior value proposition of its new
offer.
Fourth, as more consumers become aware of the superior value proposition,
consumer behavior begins to change.
Fifth, the attacker begins to capture a larger share of the diminished profit pool.
In tandem, the attackers build a competitive moat around the business.
Crucially, investors can be slow to realize the nature of the threat posed by Internet
insurgents. But, once the realization crystalizes, value destruction can also be
abrupt.
Radio Stations
Cable Networks
Magazines
Newspaper
Phone Books
Cabs
Ad Agency
Travel Agency
Retail
Concerts
Sports Franchises
Video Games
Internet
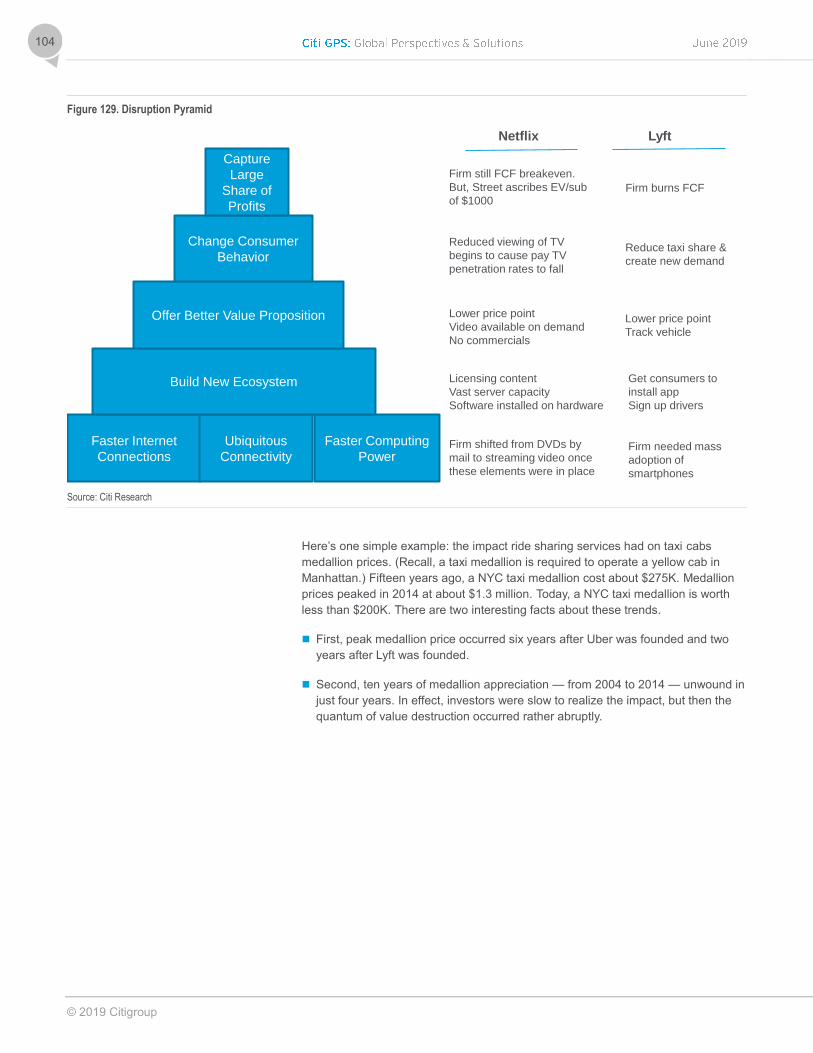
© 2019 Citigroup
104
Figure 129. Disruption Pyramid
Source: Citi Research
Here’s one simple example: the impact ride sharing services had on taxi cabs
medallion prices. (Recall, a taxi medallion is required to operate a yellow cab in
Manhattan.) Fifteen years ago, a NYC taxi medallion cost about $275K. Medallion
prices peaked in 2014 at about $1.3 million. Today, a NYC taxi medallion is worth
less than $200K. There are two interesting facts about these trends.
First, peak medallion price occurred six years after Uber was founded and two
years after Lyft was founded.
Second, ten years of medallion appreciation — from 2004 to 2014 — unwound in
just four years. In effect, investors were slow to realize the impact, but then the
quantum of value destruction occurred rather abruptly.
Faster Internet
Connections
Ubiquitous
Connectivity
Faster Computing
Power
Build New Ecosystem
Offer Better Value Proposition
Change Consumer
Behavior
Capture
Large
Share of
Profits
Netflix
Firm shifted from DVDs by
mail to streaming video once
these elements were in place
Licensing content
Vast server capacity
Software installed on hardware
Lower price point
Video available on demand
No commercials
Reduced viewing of TV
begins to cause pay TV
penetration rates to fall
Firm still FCF breakeven.
But, Street ascribes EV/sub
of $1000
Lyft
Firm burns FCF
Reduce taxi share &
create new demand
Lower price point
Track vehicle
Get consumers to
install app
Sign up drivers
Firm needed mass
adoption of
smartphones
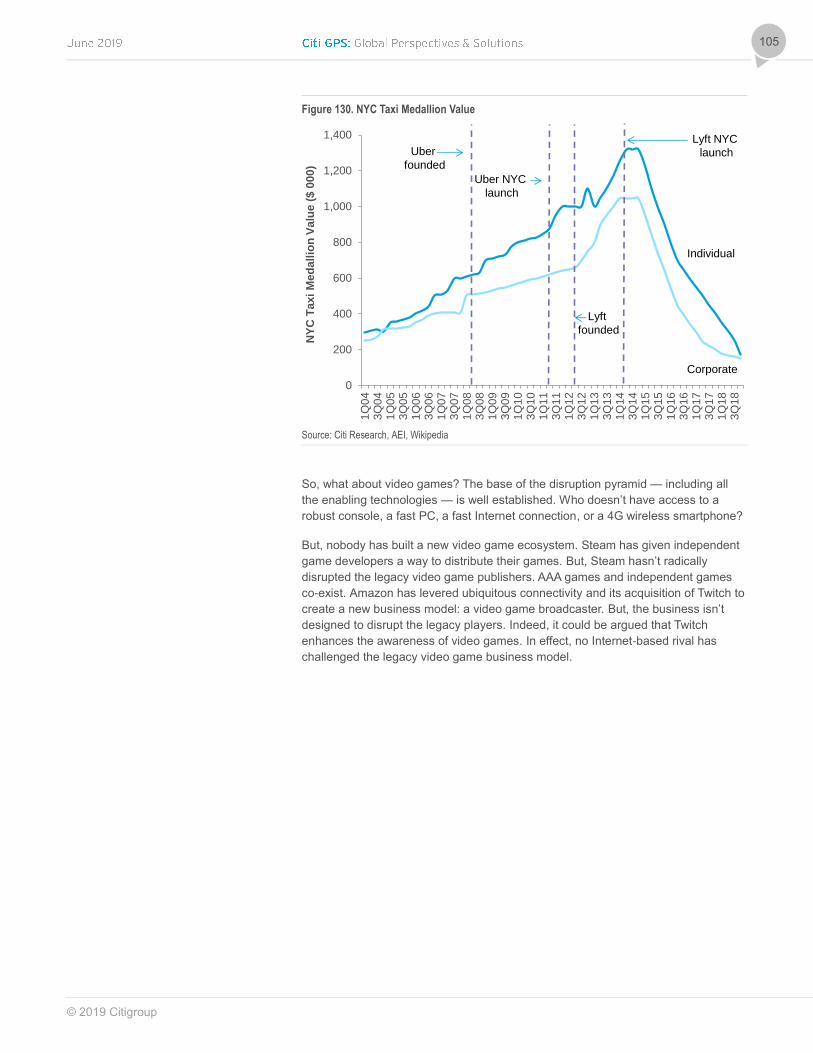
© 2019 Citigroup
105
Figure 130. NYC Taxi Medallion Value
Source: Citi Research, AEI, Wikipedia
So, what about video games? The base of the disruption pyramid — including all
the enabling technologies — is well established. Who doesn’t have access to a
robust console, a fast PC, a fast Internet connection, or a 4G wireless smartphone?
But, nobody has built a new video game ecosystem. Steam has given independent
game developers a way to distribute their games. But, Steam hasn’t radically
disrupted the legacy video game publishers. AAA games and independent games
co-exist. Amazon has levered ubiquitous connectivity and its acquisition of Twitch to
create a new business model: a video game broadcaster. But, the business isn’t
designed to disrupt the legacy players. Indeed, it could be argued that Twitch
enhances the awareness of video games. In effect, no Internet-based rival has
challenged the legacy video game business model.
0
200
400
600
800
1,000
1,200
1,400
1Q
04
3Q
04
1Q
05
3Q
05
1Q
06
3Q
06
1Q
07
3Q
07
1Q
08
3Q
08
1Q
09
3Q
09
1Q
10
3Q
10
1Q
11
3Q
11
1Q
12
3Q
12
1Q
13
3Q
13
1Q
14
3Q
14
1Q
15
3Q
15
1Q
16
3Q
16
1Q
17
3Q
17
1Q
18
3Q
18
NY
C T
axi
Me
da
llio
n V
alu
e (
$ 0
00
)
Individual
Corporate
Uber
founded
Uber NYC
launch
Lyft NYC
launch
Lyft
founded
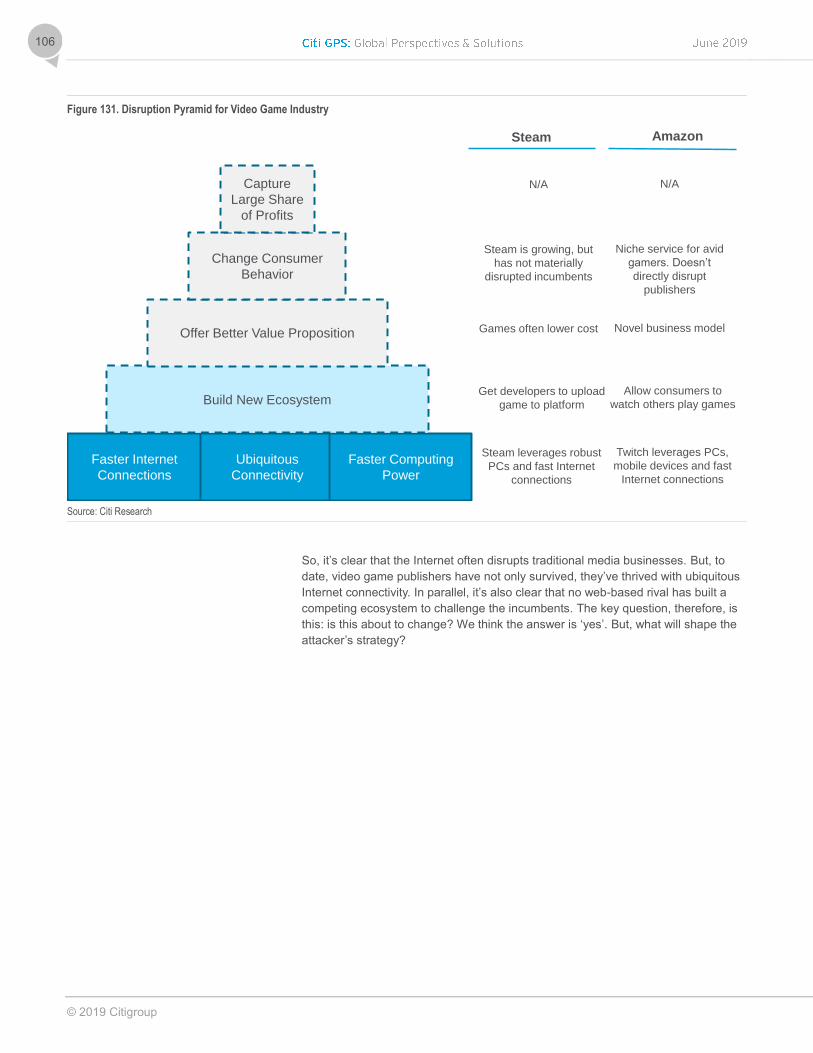
© 2019 Citigroup
106
Figure 131. Disruption Pyramid for Video Game Industry
Source: Citi Research
So, it’s clear that the Internet often disrupts traditional media businesses. But, to
date, video game publishers have not only survived, they’ve thrived with ubiquitous
Internet connectivity. In parallel, it’s also clear that no web-based rival has built a
competing ecosystem to challenge the incumbents. The key question, therefore, is
this: is this about to change? We think the answer is ‘yes’. But, what will shape the
attacker’s strategy?
Faster Internet
Connections
Ubiquitous
Connectivity
Faster Computing
Power
Build New Ecosystem
Offer Better Value Proposition
Change Consumer
Behavior
Capture
Large Share
of Profits
Steam
Steam leverages robust
PCs and fast Internet
connections
Get developers to upload
game to platform
Games often lower cost
Steam is growing, but
has not materially
disrupted incumbents
N/A
Amazon
Twitch leverages PCs,
mobile devices and fast
Internet connections
Allow consumers to
watch others play games
Novel business model
Niche service for avid
gamers. Doesn’t
directly disrupt
publishers
N/A

© 2019 Citigroup
107
What the New Model Might Look Like
We suspect the new business model will lease access to console/PC processing
and a stable of games for a single monthly fee.
Figure 132. Cloud-Based Gaming and Video Game Ecosystem
Source: Citi Research
Why do we think this is likely? There are three reasons: (1) Young consumers prefer
renting to owning; (2) Cloud gaming is poised to replace PC and console sales; and
(3) The rise of free-to-play games will help facilitate the cloud transition since it will
be frictionless for the cloud firm to offer processing and content for a single, bundled
price. Let’s look at each of these items a bit more closely.
Young Consumers Prefer Renting
First, in the distant past hardware was purchased discretely; software was
purchased discretely. But, consumers — particularly younger consumers — like the
idea of monthly recurring expenses without the burden of ownership. Uber
(transport), Spotify (music), and Netflix (video) are all good examples of the rental
model. We don’t think video games should be any different. As such, we expect the
cloud-based firms to bundle hardware access and software access into a single
monthly fee.
Cloud will Replace PC and Console Sales
For 60 years, a single variable has shaped the video game industry: the cost and
processing power of computers.
In the beginning, processing was expensive. Heavy upfront costs forced
consumers to the arcade to enjoy the game at $0.25 per play. As such, both
hardware and software were rented.
Next, as processing power improved — and processing costs declined —
consumers were able to buy their ‘personal arcade’ for in-home use. The console
and game cartridge market was born.
Finally, as processing power improves further, we expect consumers to migrate
to cloud gaming. In effect, consumers will again rent access to hardware and
software, just like the old arcade days. The only difference: rental access will
occur in the comfort of your home.
Hardware
+
Software
Hardware
+
In-game
Spend
+
Hardware
FTP
+
+
Cloud
Gaming
+
Present FuturePast
FTP
Distant Past
Buy
New
Monetization
FTPFTP
eSports
Mobile
AdTech
Rent
Free
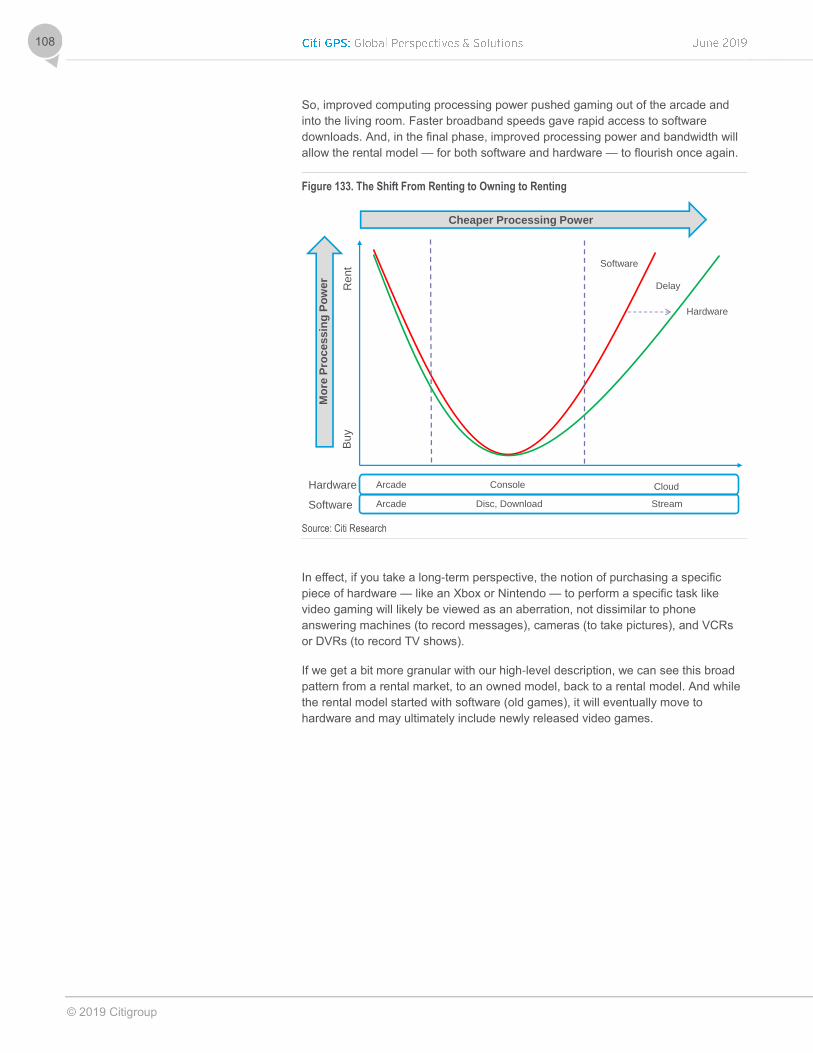
© 2019 Citigroup
108
So, improved computing processing power pushed gaming out of the arcade and
into the living room. Faster broadband speeds gave rapid access to software
downloads. And, in the final phase, improved processing power and bandwidth will
allow the rental model — for both software and hardware — to flourish once again.
Figure 133. The Shift From Renting to Owning to Renting
Source: Citi Research
In effect, if you take a long-term perspective, the notion of purchasing a specific
piece of hardware — like an Xbox or Nintendo — to perform a specific task like
video gaming will likely be viewed as an aberration, not dissimilar to phone
answering machines (to record messages), cameras (to take pictures), and VCRs
or DVRs (to record TV shows).
If we get a bit more granular with our high-level description, we can see this broad
pattern from a rental market, to an owned model, back to a rental model. And while
the rental model started with software (old games), it will eventually move to
hardware and may ultimately include newly released video games.
Rent
Buy
Arcade
Arcade
Console
Disc, Download
Cloud
Stream
Hardware
Software
Hardware
Software
Delay
Cheaper Processing Power
Mo
re P
rocessin
g P
ow
er
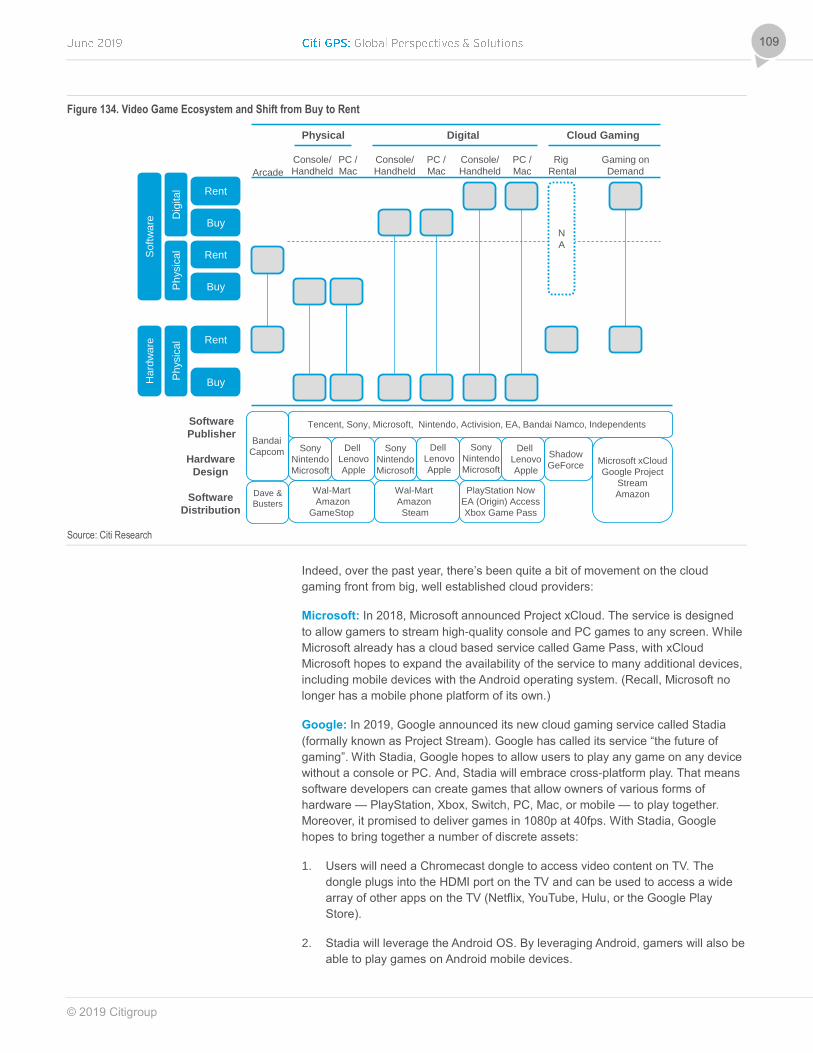
© 2019 Citigroup
109
Figure 134. Video Game Ecosystem and Shift from Buy to Rent
Source: Citi Research
Indeed, over the past year, there’s been quite a bit of movement on the cloud
gaming front from big, well established cloud providers:
Microsoft: In 2018, Microsoft announced Project xCloud. The service is designed
to allow gamers to stream high-quality console and PC games to any screen. While
Microsoft already has a cloud based service called Game Pass, with xCloud
Microsoft hopes to expand the availability of the service to many additional devices,
including mobile devices with the Android operating system. (Recall, Microsoft no
longer has a mobile phone platform of its own.)
Google: In 2019, Google announced its new cloud gaming service called Stadia
(formally known as Project Stream). Google has called its service “the future of
gaming”. With Stadia, Google hopes to allow users to play any game on any device
without a console or PC. And, Stadia will embrace cross-platform play. That means
software developers can create games that allow owners of various forms of
hardware — PlayStation, Xbox, Switch, PC, Mac, or mobile — to play together.
Moreover, it promised to deliver games in 1080p at 40fps. With Stadia, Google
hopes to bring together a number of discrete assets:
1. Users will need a Chromecast dongle to access video content on TV. The
dongle plugs into the HDMI port on the TV and can be used to access a wide
array of other apps on the TV (Netflix, YouTube, Hulu, or the Google Play
Store).
2. Stadia will leverage the Android OS. By leveraging Android, gamers will also be
able to play games on Android mobile devices.
So
ftw
are
Cloud Gaming
Arcade
Console/
Handheld
PC /
Mac
Buy
Rent
Buy
Rent
Gaming on
Demand
Rig
Rental
Ha
rdw
are
Console/
Handheld
Software
Publisher
Dave &
Busters
Sony
Nintendo
Microsoft
Shadow
GeForce
Dell
Lenovo
Apple
Tencent, Sony, Microsoft, Nintendo, Activision, EA, Bandai Namco, Independents
N
A
Hardware
Design
Software
Distribution
Sony
Nintendo
Microsoft
Bandai
Capcom
Wal-Mart
Amazon
GameStop
Microsoft xCloud
Google Project
Stream
Amazon
Dig
ita
lP
hysic
al
Buy
Rent
Ph
ysic
al
PlayStation Now
EA (Origin) Access
Xbox Game Pass
Physical Digital
PC /
Mac
Wal-Mart
Amazon
Steam
Dell
Lenovo
Apple
Console/
Handheld
PC /
Mac
Sony
Nintendo
Microsoft
Dell
Lenovo
Apple
© 2019 Citigroup
110
3. Stadia will also incorporate YouTube.
4. Google will perform game processing using Google’s data centers.
5. Stadia launched with a game controller. The controller communicates using
WiFi with the router. This allows a gamer to seamlessly transition from one
screen — like a TV — to another — like a smartphone — seamlessly.
Unfortunately, to date, Google hasn’t disclosed Stadia’s retail price point. Nor has
Google disclosed the business model. At launch, Google will have access to some
games from Ubisoft and a game from id Software: Doom Eternal. (Prior id Software
titles include Wolfenstein, Doom, Quake and Rage.)
Amazon: The Information reports that Amazon may enter the cloud gaming market
as soon as 2020. And, The Verge reported four job listings at Amazon for ‘cloud
gamers’.
New Model App to Embrace Free-to-Play
So, a cloud-based rental model seems poised to launch relatively soon. When
Google, Amazon, and Microsoft do enter the market, we expect each of them to
leverage free-to-play titles. Recall, earlier we showed that ~90% of mobile games
are free-to-play (FTP). But, fewer PC and console games are free, although they do
exist.
We used a list from Digital Trends that reviewed 35 high-quality FTP titles that span
all popular genres: action, battle royale, role play, and shooter. Virtually all of these
games are available on PCs, with about 50% available on Xbox or PlayStation
platforms. We cross-checked these games with Metacritic to ensure (most) of the
games were high quality (with a score of 70 or above).
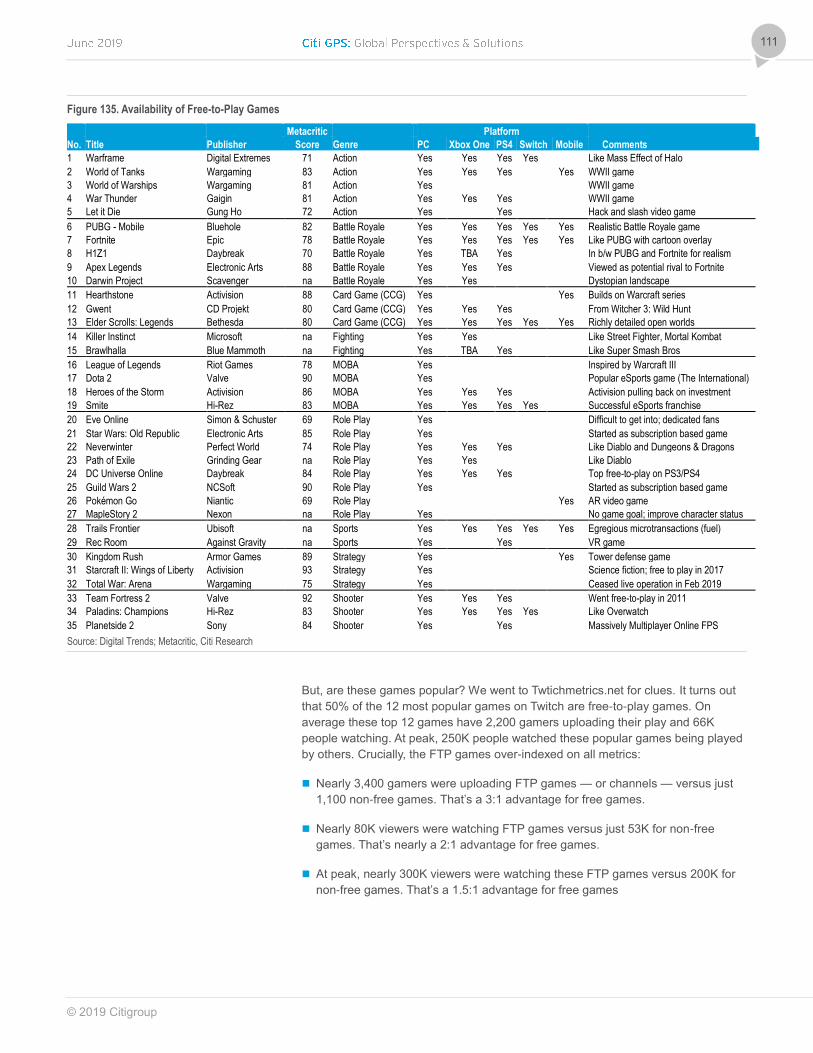
© 2019 Citigroup
111
Figure 135. Availability of Free-to-Play Games
Metacritic Platform
No. Title Publisher Score Genre PC Xbox One PS4 Switch Mobile Comments
1 Warframe Digital Extremes 71 Action Yes Yes Yes Yes Like Mass Effect of Halo
2 World of Tanks Wargaming 83 Action Yes Yes Yes Yes WWII game
3 World of Warships Wargaming 81 Action Yes WWII game
4 War Thunder Gaigin 81 Action Yes Yes Yes WWII game
5 Let it Die Gung Ho 72 Action Yes Yes Hack and slash video game
6 PUBG - Mobile Bluehole 82 Battle Royale Yes Yes Yes Yes Yes Realistic Battle Royale game
7 Fortnite Epic 78 Battle Royale Yes Yes Yes Yes Yes Like PUBG with cartoon overlay
8 H1Z1 Daybreak 70 Battle Royale Yes TBA Yes In b/w PUBG and Fortnite for realism
9 Apex Legends Electronic Arts 88 Battle Royale Yes Yes Yes Viewed as potential rival to Fortnite
10 Darwin Project Scavenger na Battle Royale Yes Yes Dystopian landscape
11 Hearthstone Activision 88 Card Game (CCG) Yes Yes Builds on Warcraft series
12 Gwent CD Projekt 80 Card Game (CCG) Yes Yes Yes From Witcher 3: Wild Hunt
13 Elder Scrolls: Legends Bethesda 80 Card Game (CCG) Yes Yes Yes Yes Yes Richly detailed open worlds
14 Killer Instinct Microsoft na Fighting Yes Yes Like Street Fighter, Mortal Kombat
15 Brawlhalla Blue Mammoth na Fighting Yes TBA Yes Like Super Smash Bros
16 League of Legends Riot Games 78 MOBA Yes Inspired by Warcraft III
17 Dota 2 Valve 90 MOBA Yes Popular eSports game (The International)
18 Heroes of the Storm Activision 86 MOBA Yes Yes Yes Activision pulling back on investment
19 Smite Hi-Rez 83 MOBA Yes Yes Yes Yes Successful eSports franchise
20 Eve Online Simon & Schuster 69 Role Play Yes Difficult to get into; dedicated fans
21 Star Wars: Old Republic Electronic Arts 85 Role Play Yes Started as subscription based game
22 Neverwinter Perfect World 74 Role Play Yes Yes Yes Like Diablo and Dungeons & Dragons
23 Path of Exile Grinding Gear na Role Play Yes Yes Like Diablo
24 DC Universe Online Daybreak 84 Role Play Yes Yes Yes Top free-to-play on PS3/PS4
25 Guild Wars 2 NCSoft 90 Role Play Yes Started as subscription based game
26 Pokémon Go Niantic 69 Role Play Yes AR video game
27 MapleStory 2 Nexon na Role Play Yes No game goal; improve character status
28 Trails Frontier Ubisoft na Sports Yes Yes Yes Yes Yes Egregious microtransactions (fuel)
29 Rec Room Against Gravity na Sports Yes Yes VR game
30 Kingdom Rush Armor Games 89 Strategy Yes Yes Tower defense game
31 Starcraft II: Wings of Liberty Activision 93 Strategy Yes Science fiction; free to play in 2017
32 Total War: Arena Wargaming 75 Strategy Yes Ceased live operation in Feb 2019
33 Team Fortress 2 Valve 92 Shooter Yes Yes Yes Went free-to-play in 2011
34 Paladins: Champions Hi-Rez 83 Shooter Yes Yes Yes Yes Like Overwatch
35 Planetside 2 Sony 84 Shooter Yes Yes Massively Multiplayer Online FPS
Source: Digital Trends; Metacritic, Citi Research
But, are these games popular? We went to Twtichmetrics.net for clues. It turns out
that 50% of the 12 most popular games on Twitch are free-to-play games. On
average these top 12 games have 2,200 gamers uploading their play and 66K
people watching. At peak, 250K people watched these popular games being played
by others. Crucially, the FTP games over-indexed on all metrics:
Nearly 3,400 gamers were uploading FTP games — or channels — versus just
1,100 non-free games. That’s a 3:1 advantage for free games.
Nearly 80K viewers were watching FTP games versus just 53K for non-free
games. That’s nearly a 2:1 advantage for free games.
At peak, nearly 300K viewers were watching these FTP games versus 200K for
non-free games. That’s a 1.5:1 advantage for free games
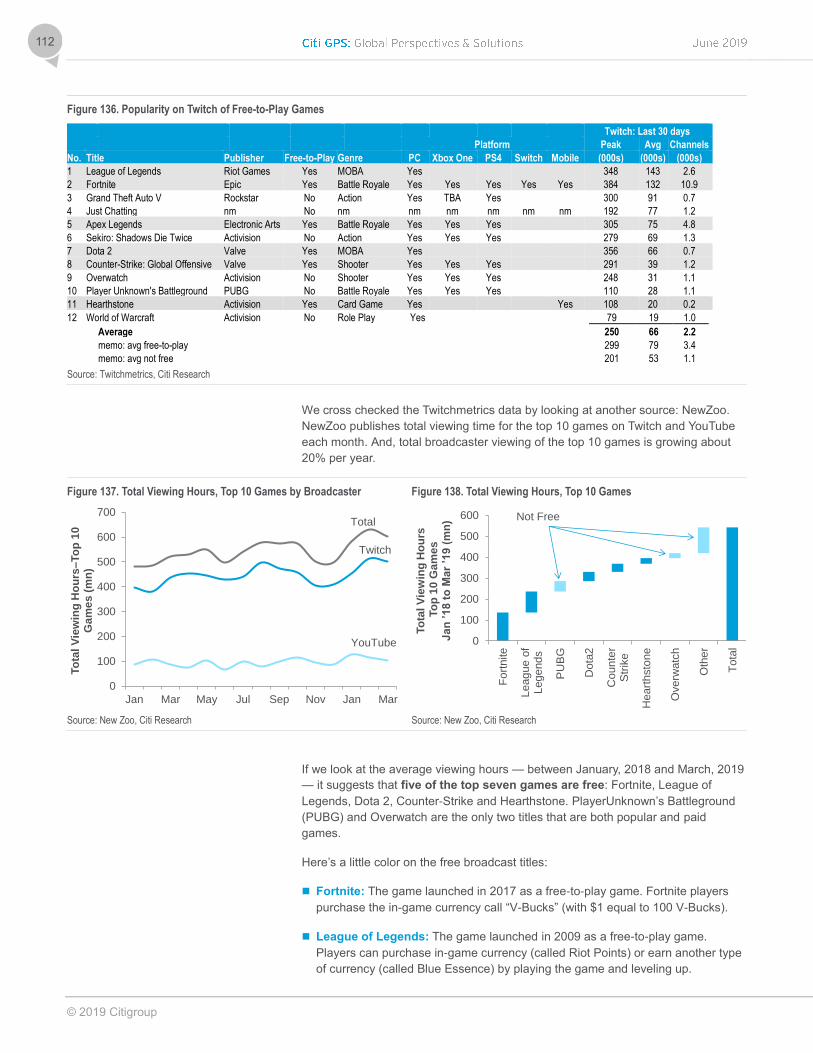
© 2019 Citigroup
112
Figure 136. Popularity on Twitch of Free-to-Play Games
Twitch: Last 30 days
Platform Peak Avg Channels
No. Title Publisher Free-to-Play Genre PC Xbox One PS4 Switch Mobile (000s) (000s) (000s)
1 League of Legends Riot Games Yes MOBA Yes 348 143 2.6
2 Fortnite Epic Yes Battle Royale Yes Yes Yes Yes Yes 384 132 10.9
3 Grand Theft Auto V Rockstar No Action Yes TBA Yes 300 91 0.7
4 Just Chatting nm No nm nm nm nm nm nm 192 77 1.2
5 Apex Legends Electronic Arts Yes Battle Royale Yes Yes Yes 305 75 4.8
6 Sekiro: Shadows Die Twice Activision No Action Yes Yes Yes 279 69 1.3
7 Dota 2 Valve Yes MOBA Yes 356 66 0.7
8 Counter-Strike: Global Offensive Valve Yes Shooter Yes Yes Yes 291 39 1.2
9 Overwatch Activision No Shooter Yes Yes Yes 248 31 1.1
10 Player Unknown's Battleground PUBG No Battle Royale Yes Yes Yes 110 28 1.1
11 Hearthstone Activision Yes Card Game Yes Yes 108 20 0.2
12 World of Warcraft Activision No Role Play Yes 79 19 1.0
Average 250 66 2.2
memo: avg free-to-play 299 79 3.4
memo: avg not free 201 53 1.1
Source: Twitchmetrics, Citi Research
We cross checked the Twitchmetrics data by looking at another source: NewZoo.
NewZoo publishes total viewing time for the top 10 games on Twitch and YouTube
each month. And, total broadcaster viewing of the top 10 games is growing about
20% per year.
Figure 137. Total Viewing Hours, Top 10 Games by Broadcaster
Figure 138. Total Viewing Hours, Top 10 Games
Source: New Zoo, Citi Research Source: New Zoo, Citi Research
If we look at the average viewing hours — between January, 2018 and March, 2019
— it suggests that five of the top seven games are free: Fortnite, League of
Legends, Dota 2, Counter-Strike and Hearthstone. PlayerUnknown’s Battleground
(PUBG) and Overwatch are the only two titles that are both popular and paid
games.
Here’s a little color on the free broadcast titles:
Fortnite: The game launched in 2017 as a free-to-play game. Fortnite players
purchase the in-game currency call “V-Bucks” (with $1 equal to 100 V-Bucks).
League of Legends: The game launched in 2009 as a free-to-play game.
Players can purchase in-game currency (called Riot Points) or earn another type
of currency (called Blue Essence) by playing the game and leveling up.
0
100
200
300
400
500
600
700
Jan Mar May Jul Sep Nov Jan Mar
To
tal V
iew
ing
Ho
urs
–To
p 1
0
Ga
me
s (
mn
)
YouTube
Twitch
Total
0
100
200
300
400
500
600F
ort
nite
Leag
ue o
fLege
nds
PU
BG
Dota
2
Co
un
ter
Str
ike
Heart
hsto
ne
Overw
atc
h
Oth
er
Tota
l
To
tal V
iew
ing
Ho
urs
To
p 1
0 G
am
es
J
an
’1
8 t
o M
ar
’19
(m
n) Not Free
© 2019 Citigroup
113
Hearthstone: The game was released in 2014. It is a free digital card game
developed and published by Activision’s Blizzard Entertainment.
Apex Legends: Apex Legends was released in 2019 by EA as a free-to-play
game. Respawn Entertainment created both Titanfall (2014) and Titanfall 2
(2016) as an independent studio. In 2017, Electronic Arts acquired Respawn. As
Respawn looked at the evolution of the gaming community — particularly the
popularity of PlayerUnknown’s Battleground, Respawn elected to not developer
Titanfall 3. Rather they pivoted their development efforts to Apex Legends, a free
game.
And, for the handful of titles that still charge a fee for the game, there seems to be
downward pressure on selling prices:
Player Unknown’s Battlegrounds: PUBG is an online multiplayer battle royale
game developed by South Korean video game company Bluehole. The game
was released in 2017. The game originally cost $30. But, in 2018 the firm
lowered the price. The game now costs just $20 on Steam. Some believe the
discount is designed to respond to the success of Fortnite. In Thailand, PUBG
recently began offering a separate free title called PUBG Lite.
Dota 2: This game was released in July, 2013 by Valve. While the game
originally had some restrictions that prevented everyone from playing for free, by
December of 2013 Valve opened up the game to everyone for free. It is often the
most popular game on Valve’s site Steam.
Counter-Strike: Global Offensive: Counter-Strike was first released about 20
years ago (in 2000). The game migrated to free-to-play in June 2018.
Overwatch: Overwatch was released in 2016. Over the last two years,
Overwatch’s retail price has dropped from $60 to $40. In January, 2019, EA
dropped the price again to $20. Many expect it will soon be available for free.
How do the trends look for free-to-play games versus paid games? About 15
months ago, free-to-play games were generating about as many viewing hours as
paid games. But, today, there are more than two minutes of broadcast consumption
on free games versus paid games.
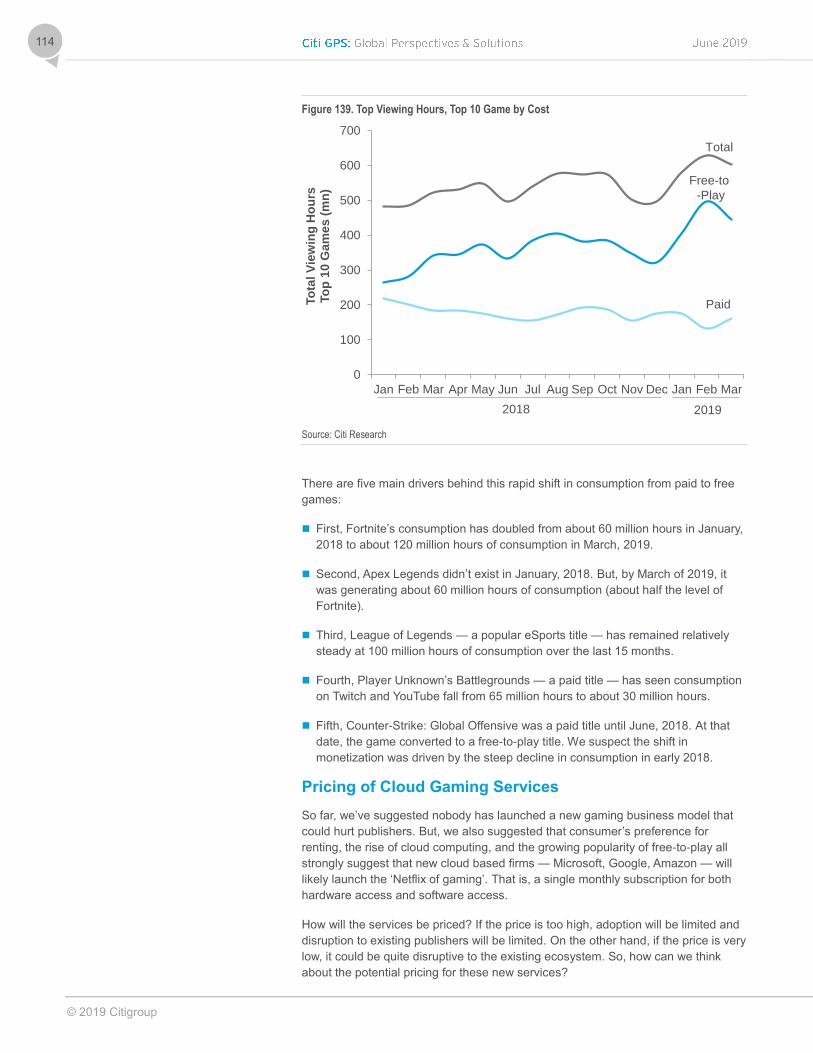
© 2019 Citigroup
114
Figure 139. Top Viewing Hours, Top 10 Game by Cost
Source: Citi Research
There are five main drivers behind this rapid shift in consumption from paid to free
games:
First, Fortnite’s consumption has doubled from about 60 million hours in January,
2018 to about 120 million hours of consumption in March, 2019.
Second, Apex Legends didn’t exist in January, 2018. But, by March of 2019, it
was generating about 60 million hours of consumption (about half the level of
Fortnite).
Third, League of Legends — a popular eSports title — has remained relatively
steady at 100 million hours of consumption over the last 15 months.
Fourth, Player Unknown’s Battlegrounds — a paid title — has seen consumption
on Twitch and YouTube fall from 65 million hours to about 30 million hours.
Fifth, Counter-Strike: Global Offensive was a paid title until June, 2018. At that
date, the game converted to a free-to-play title. We suspect the shift in
monetization was driven by the steep decline in consumption in early 2018.
Pricing of Cloud Gaming Services
So far, we’ve suggested nobody has launched a new gaming business model that
could hurt publishers. But, we also suggested that consumer’s preference for
renting, the rise of cloud computing, and the growing popularity of free-to-play all
strongly suggest that new cloud based firms — Microsoft, Google, Amazon — will
likely launch the ‘Netflix of gaming’. That is, a single monthly subscription for both
hardware access and software access.
How will the services be priced? If the price is too high, adoption will be limited and
disruption to existing publishers will be limited. On the other hand, if the price is very
low, it could be quite disruptive to the existing ecosystem. So, how can we think
about the potential pricing for these new services?
0
100
200
300
400
500
600
700
Jan Feb Mar Apr May Jun Jul Aug Sep Oct Nov Dec Jan Feb Mar
To
tal V
iew
ing
Ho
urs
To
p 1
0 G
am
es
(m
n)
Paid
Free-to
-Play
Total
2018 2019
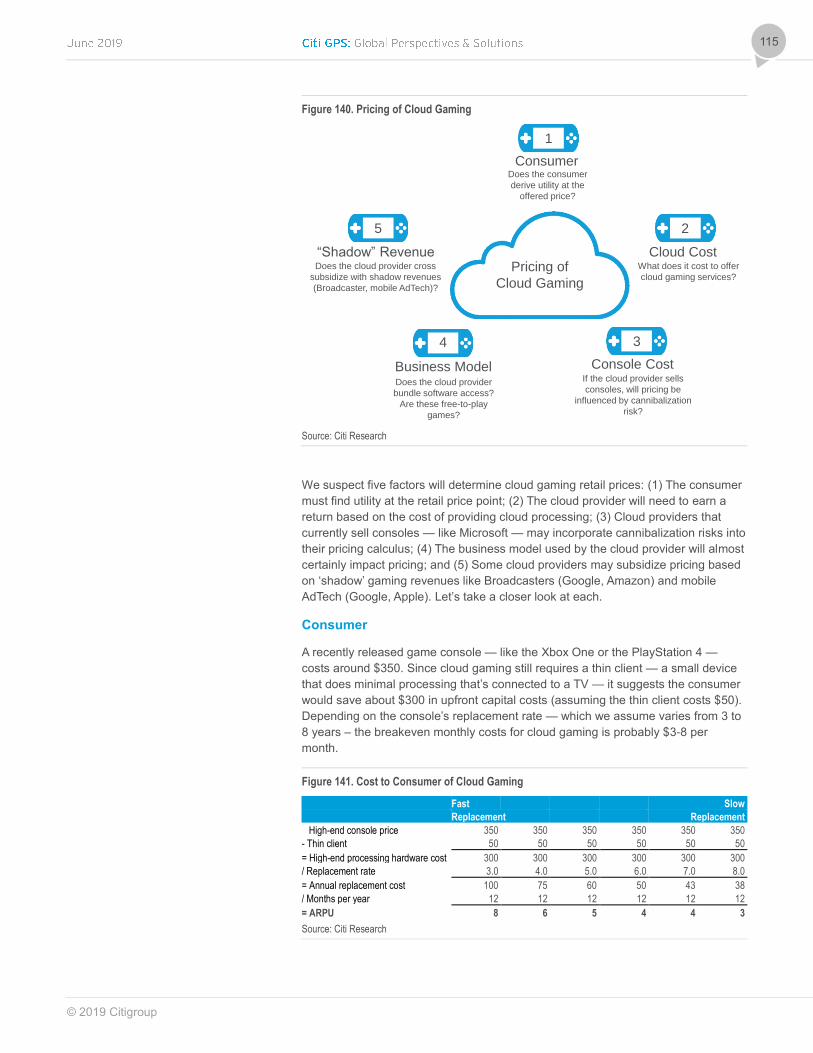
© 2019 Citigroup
115
Figure 140. Pricing of Cloud Gaming
Source: Citi Research
We suspect five factors will determine cloud gaming retail prices: (1) The consumer
must find utility at the retail price point; (2) The cloud provider will need to earn a
return based on the cost of providing cloud processing; (3) Cloud providers that
currently sell consoles — like Microsoft — may incorporate cannibalization risks into
their pricing calculus; (4) The business model used by the cloud provider will almost
certainly impact pricing; and (5) Some cloud providers may subsidize pricing based
on ‘shadow’ gaming revenues like Broadcasters (Google, Amazon) and mobile
AdTech (Google, Apple). Let’s take a closer look at each.
Consumer
A recently released game console — like the Xbox One or the PlayStation 4 —
costs around $350. Since cloud gaming still requires a thin client — a small device
that does minimal processing that’s connected to a TV — it suggests the consumer
would save about $300 in upfront capital costs (assuming the thin client costs $50).
Depending on the console’s replacement rate — which we assume varies from 3 to
8 years – the breakeven monthly costs for cloud gaming is probably $3-8 per
month.
Figure 141. Cost to Consumer of Cloud Gaming
Fast Slow
Replacement Replacement
High-end console price 350 350 350 350 350 350
- Thin client 50 50 50 50 50 50
= High-end processing hardware cost 300 300 300 300 300 300
/ Replacement rate 3.0 4.0 5.0 6.0 7.0 8.0
= Annual replacement cost 100 75 60 50 43 38
/ Months per year 12 12 12 12 12 12
= ARPU 8 6 5 4 4 3
Source: Citi Research
Consumer
Cloud Cost
Console Cost
“Shadow” Revenue
Business Model
Does the consumer
derive utility at the
offered price?
What does it cost to offer
cloud gaming services?
If the cloud provider sells
consoles, will pricing be
influenced by cannibalization
risk?
Does the cloud provider
bundle software access?
Are these free-to-play
games?
Does the cloud provider cross
subsidize with shadow revenues
(Broadcaster, mobile AdTech)?
5
4 3
2
1
Pricing of
Cloud Gaming
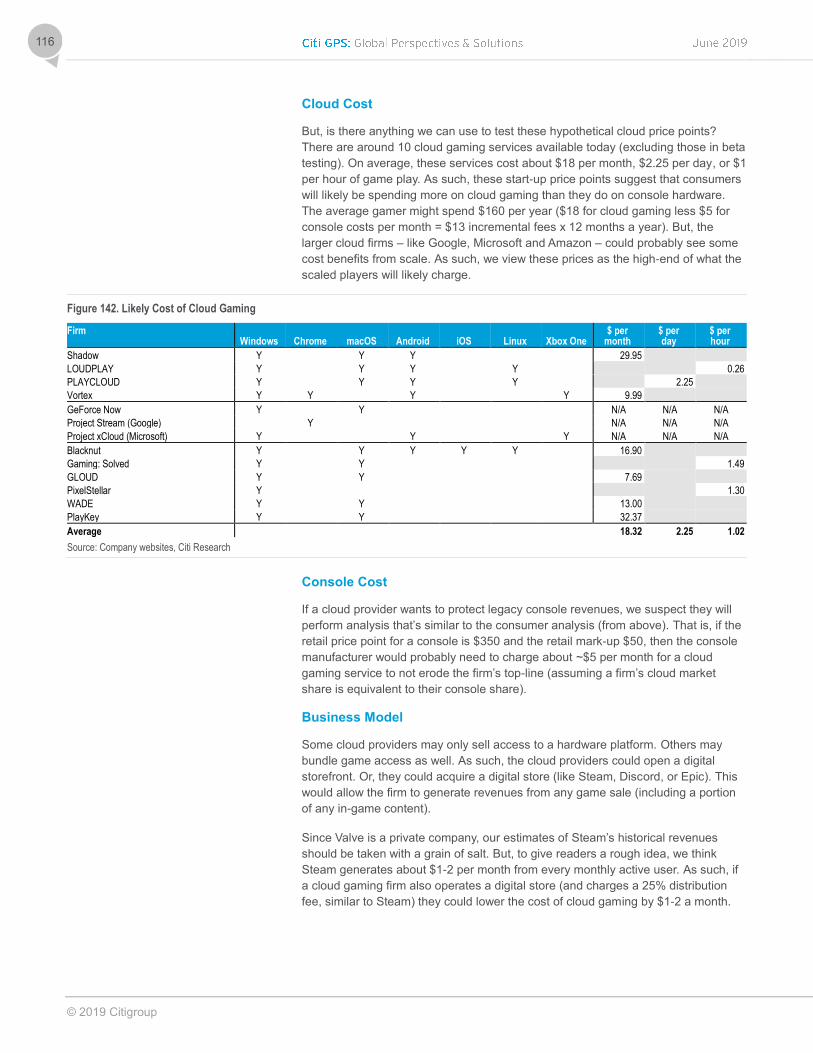
© 2019 Citigroup
116
Cloud Cost
But, is there anything we can use to test these hypothetical cloud price points?
There are around 10 cloud gaming services available today (excluding those in beta
testing). On average, these services cost about $18 per month, $2.25 per day, or $1
per hour of game play. As such, these start-up price points suggest that consumers
will likely be spending more on cloud gaming than they do on console hardware.
The average gamer might spend $160 per year ($18 for cloud gaming less $5 for
console costs per month = $13 incremental fees x 12 months a year). But, the
larger cloud firms – like Google, Microsoft and Amazon – could probably see some
cost benefits from scale. As such, we view these prices as the high-end of what the
scaled players will likely charge.
Figure 142. Likely Cost of Cloud Gaming
Firm Windows
Chrome
macOS
Android
iOS
Linux
Xbox One
$ per month
$ per day
$ per hour
Shadow Y Y Y 29.95
LOUDPLAY Y Y Y Y 0.26
PLAYCLOUD Y Y Y Y 2.25
Vortex Y Y Y Y 9.99
GeForce Now Y Y N/A N/A N/A
Project Stream (Google) Y N/A N/A N/A
Project xCloud (Microsoft) Y Y Y N/A N/A N/A
Blacknut Y Y Y Y Y 16.90
Gaming: Solved Y Y 1.49
GLOUD Y Y 7.69
PixelStellar Y 1.30
WADE Y Y 13.00
PlayKey Y Y 32.37
Average 18.32 2.25 1.02
Source: Company websites, Citi Research
Console Cost
If a cloud provider wants to protect legacy console revenues, we suspect they will
perform analysis that’s similar to the consumer analysis (from above). That is, if the
retail price point for a console is $350 and the retail mark-up $50, then the console
manufacturer would probably need to charge about ~$5 per month for a cloud
gaming service to not erode the firm’s top-line (assuming a firm’s cloud market
share is equivalent to their console share).
Business Model
Some cloud providers may only sell access to a hardware platform. Others may
bundle game access as well. As such, the cloud providers could open a digital
storefront. Or, they could acquire a digital store (like Steam, Discord, or Epic). This
would allow the firm to generate revenues from any game sale (including a portion
of any in-game content).
Since Valve is a private company, our estimates of Steam’s historical revenues
should be taken with a grain of salt. But, to give readers a rough idea, we think
Steam generates about $1-2 per month from every monthly active user. As such, if
a cloud gaming firm also operates a digital store (and charges a 25% distribution
fee, similar to Steam) they could lower the cost of cloud gaming by $1-2 a month.
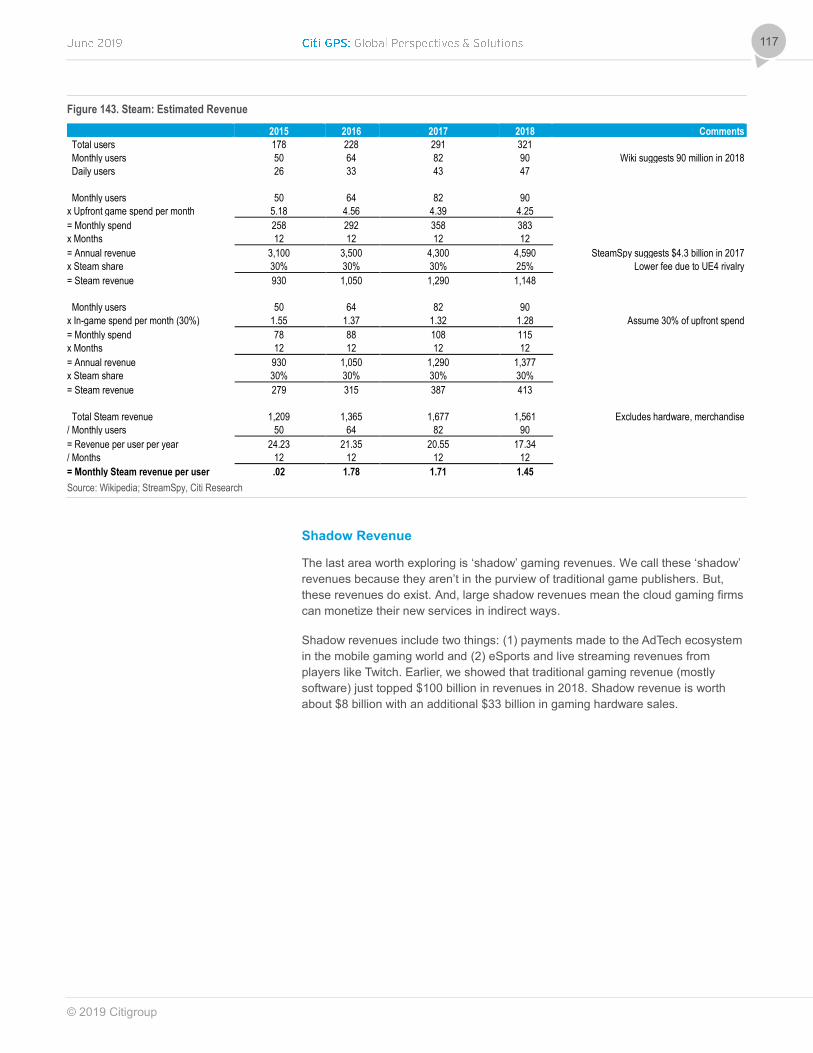
© 2019 Citigroup
117
Figure 143. Steam: Estimated Revenue
2015 2016 2017 2018 Comments
Total users 178 228 291 321
Monthly users 50 64 82 90 Wiki suggests 90 million in 2018
Daily users 26 33 43 47
Monthly users 50 64 82 90
x Upfront game spend per month 5.18 4.56 4.39 4.25
= Monthly spend 258 292 358 383
x Months 12 12 12 12
= Annual revenue 3,100 3,500 4,300 4,590 SteamSpy suggests $4.3 billion in 2017
x Steam share 30% 30% 30% 25% Lower fee due to UE4 rivalry
= Steam revenue 930 1,050 1,290 1,148
Monthly users 50 64 82 90
x In-game spend per month (30%) 1.55 1.37 1.32 1.28 Assume 30% of upfront spend
= Monthly spend 78 88 108 115
x Months 12 12 12 12
= Annual revenue 930 1,050 1,290 1,377
x Steam share 30% 30% 30% 30%
= Steam revenue 279 315 387 413
Total Steam revenue 1,209 1,365 1,677 1,561 Excludes hardware, merchandise
/ Monthly users 50 64 82 90
= Revenue per user per year 24.23 21.35 20.55 17.34
/ Months 12 12 12 12
= Monthly Steam revenue per user .02 1.78 1.71 1.45
Source: Wikipedia; StreamSpy, Citi Research
Shadow Revenue
The last area worth exploring is ‘shadow’ gaming revenues. We call these ‘shadow’
revenues because they aren’t in the purview of traditional game publishers. But,
these revenues do exist. And, large shadow revenues mean the cloud gaming firms
can monetize their new services in indirect ways.
Shadow revenues include two things: (1) payments made to the AdTech ecosystem
in the mobile gaming world and (2) eSports and live streaming revenues from
players like Twitch. Earlier, we showed that traditional gaming revenue (mostly
software) just topped $100 billion in revenues in 2018. Shadow revenue is worth
about $8 billion with an additional $33 billion in gaming hardware sales.
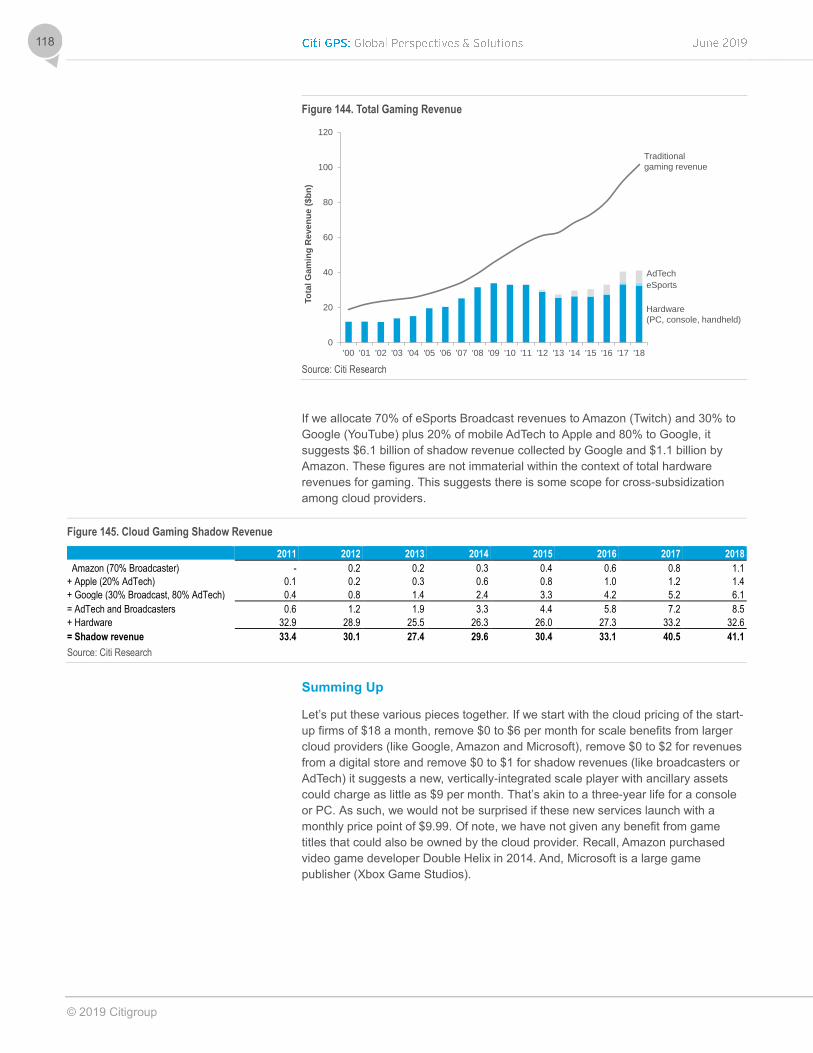
© 2019 Citigroup
118
Figure 144. Total Gaming Revenue
Source: Citi Research
If we allocate 70% of eSports Broadcast revenues to Amazon (Twitch) and 30% to
Google (YouTube) plus 20% of mobile AdTech to Apple and 80% to Google, it
suggests $6.1 billion of shadow revenue collected by Google and $1.1 billion by
Amazon. These figures are not immaterial within the context of total hardware
revenues for gaming. This suggests there is some scope for cross-subsidization
among cloud providers.
Figure 145. Cloud Gaming Shadow Revenue
2011 2012 2013 2014 2015 2016 2017 2018
Amazon (70% Broadcaster) - 0.2 0.2 0.3 0.4 0.6 0.8 1.1
+ Apple (20% AdTech) 0.1 0.2 0.3 0.6 0.8 1.0 1.2 1.4
+ Google (30% Broadcast, 80% AdTech) 0.4 0.8 1.4 2.4 3.3 4.2 5.2 6.1
= AdTech and Broadcasters 0.6 1.2 1.9 3.3 4.4 5.8 7.2 8.5
+ Hardware 32.9 28.9 25.5 26.3 26.0 27.3 33.2 32.6
= Shadow revenue 33.4 30.1 27.4 29.6 30.4 33.1 40.5 41.1
Source: Citi Research
Summing Up
Let’s put these various pieces together. If we start with the cloud pricing of the start-
up firms of $18 a month, remove $0 to $6 per month for scale benefits from larger
cloud providers (like Google, Amazon and Microsoft), remove $0 to $2 for revenues
from a digital store and remove $0 to $1 for shadow revenues (like broadcasters or
AdTech) it suggests a new, vertically-integrated scale player with ancillary assets
could charge as little as $9 per month. That’s akin to a three-year life for a console
or PC. As such, we would not be surprised if these new services launch with a
monthly price point of $9.99. Of note, we have not given any benefit from game
titles that could also be owned by the cloud provider. Recall, Amazon purchased
video game developer Double Helix in 2014. And, Microsoft is a large game
publisher (Xbox Game Studios).
0
20
40
60
80
100
120
'00 '01 '02 '03 '04 '05 '06 '07 '08 '09 '10 '11 '12 '13 '14 '15 '16 '17 '18
To
tal G
am
ing
Re
ve
nu
e (
$b
n)
AdTech
eSports
Hardware
(PC, console, handheld)
Traditional
gaming revenue
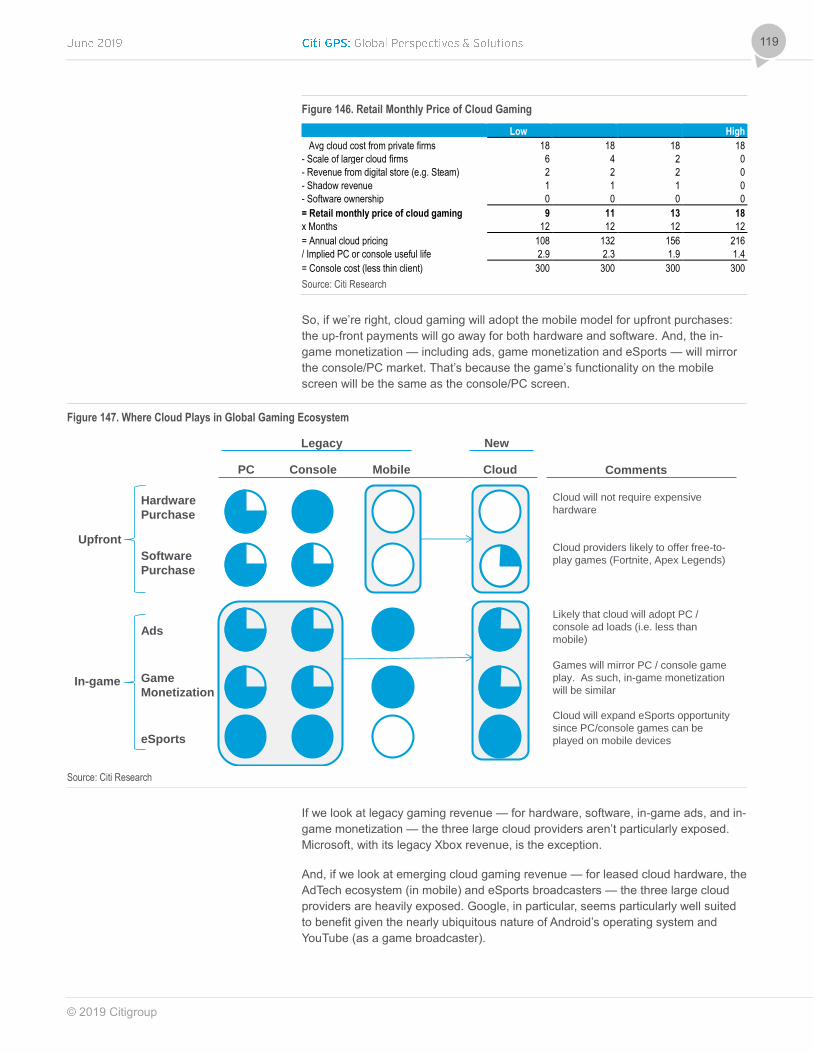
© 2019 Citigroup
119
Figure 146. Retail Monthly Price of Cloud Gaming
Low High
Avg cloud cost from private firms 18 18 18 18
- Scale of larger cloud firms 6 4 2 0
- Revenue from digital store (e.g. Steam) 2 2 2 0
- Shadow revenue 1 1 1 0
- Software ownership 0 0 0 0
= Retail monthly price of cloud gaming 9 11 13 18
x Months 12 12 12 12
= Annual cloud pricing 108 132 156 216
/ Implied PC or console useful life 2.9 2.3 1.9 1.4
= Console cost (less thin client) 300 300 300 300
Source: Citi Research
So, if we’re right, cloud gaming will adopt the mobile model for upfront purchases:
the up-front payments will go away for both hardware and software. And, the in-
game monetization — including ads, game monetization and eSports — will mirror
the console/PC market. That’s because the game’s functionality on the mobile
screen will be the same as the console/PC screen.
Figure 147. Where Cloud Plays in Global Gaming Ecosystem
Source: Citi Research
If we look at legacy gaming revenue — for hardware, software, in-game ads, and in-
game monetization — the three large cloud providers aren’t particularly exposed.
Microsoft, with its legacy Xbox revenue, is the exception.
And, if we look at emerging cloud gaming revenue — for leased cloud hardware, the
AdTech ecosystem (in mobile) and eSports broadcasters — the three large cloud
providers are heavily exposed. Google, in particular, seems particularly well suited
to benefit given the nearly ubiquitous nature of Android’s operating system and
YouTube (as a game broadcaster).
MobilePC Cloud
Hardware
Purchase
Console
Software
Purchase
Ads
Game
Monetization
eSports
Comments
Upfront
In-game
Cloud will not require expensive
hardware
Cloud providers likely to offer free-to-
play games (Fortnite, Apex Legends)
Likely that cloud will adopt PC /
console ad loads (i.e. less than
mobile)
Cloud will expand eSports opportunity
since PC/console games can be
played on mobile devices
Games will mirror PC / console game
play. As such, in-game monetization
will be similar
Legacy New

© 2019 Citigroup
120
Amazon is also well positioned with Twitch. Microsoft isn’t as well positioned to
monetize future revenue streams (with the exception of direct cloud leasing
revenues).
Figure 148. Where Large Cloud Providers Play in Global Gaming Ecosystem
Source: Citi Research
If we summarized the dynamics we’ve reviewed so far, we would divide the key
developments into five waves. Items toward the top of the page have already
occurred. Items toward the bottom of the page are still apt to unfold. The five waves
include:
The first wave was enabled by pervasive broadband Internet access. This
prompted four second-wave developments.
In the second wave, we’ll see (or have seen) enhanced video game profits,
higher levels of group play, the rise of eSports, and the enablement of cloud
gaming.
In the third wave, we’ll likely see game complexity rise, lower barriers to entry for
consumers, the console/PC and mobile market converge, and the rise of new
gaming entrants with cloud infrastructure (like Google and Amazon).
In the fourth wave, we’ll see game updates and refresh rates accelerate (like
Fortnite), low-end games — particularly casual games — struggle, and new
business models (from cloud providers) evolve.
In the fifth wave, we’ll likely see far fewer games supported by the video game
publishers and a rapid rise in free-to-play. The new business model — from the
cloud gaming firms — is apt to be supported by cloud lease payments, in-game
monetization, and the mobile AdTech ecosystem (for Google and Apple).
GoogleAmazon EA
Hardware
Microsoft
Software
In game ads
Game
monetization
Broadcaster
Comments
Only Microsoft will be incented to protect
legacy HW revenue (Xbox)
Only EA has material legacy software
revenue to protect
Most cloud providers don’t generate
material in-game ad revenue
Amazon (Twitch) and Google (YouTube)
will be able to monetize gaming via
broadcasting assets
EA has material in-game monetization
revenue to protect
Apple
Cloud
hardwareAmazon, Microsoft and Google are the
large cloud providers
Ad Tech
(Mobile)
Due to Android and iOS, Google and
Apple apt to benefit from mobile ad
growth
Legacy
Em
erg
ing
Large Cloud Providers
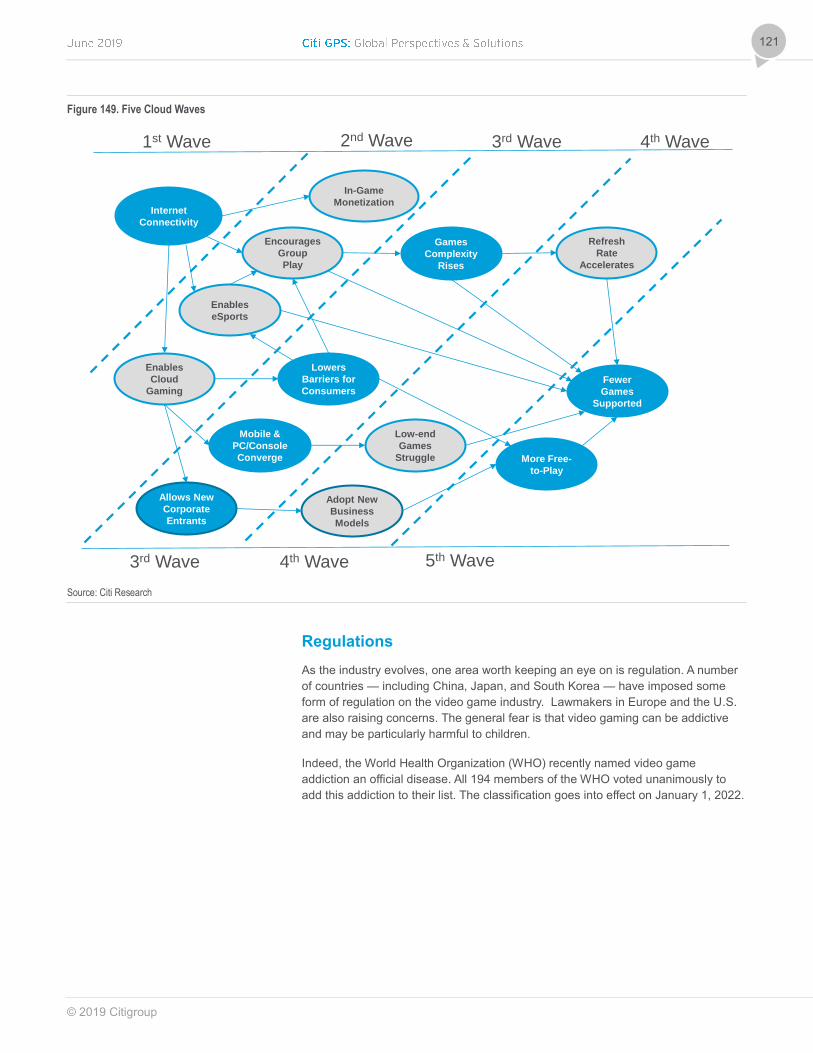
© 2019 Citigroup
121
Figure 149. Five Cloud Waves
Source: Citi Research
Regulations
As the industry evolves, one area worth keeping an eye on is regulation. A number
of countries — including China, Japan, and South Korea — have imposed some
form of regulation on the video game industry. Lawmakers in Europe and the U.S.
are also raising concerns. The general fear is that video gaming can be addictive
and may be particularly harmful to children.
Indeed, the World Health Organization (WHO) recently named video game
addiction an official disease. All 194 members of the WHO voted unanimously to
add this addiction to their list. The classification goes into effect on January 1, 2022.
Internet
Connectivity
In-Game
Monetization
Allows New
Corporate
Entrants
Enables
eSports
Games
Complexity
Rises
Enables
Cloud
Gaming
Encourages
Group
Play
Refresh
Rate
Accelerates
Lowers
Barriers for
ConsumersFewer
Games
Supported
Mobile &
PC/Console
Converge More Free-
to-Play
Adopt New
Business
Models
Low-end
Games
Struggle
1st Wave 2nd Wave 3rd Wave 4th Wave
3rd Wave 4th Wave 5th Wave
© 2019 Citigroup
122
Prudent Strategic Responses So far, we’ve reviewed the value chain for the console/PC and mobile markets. And,
we’ve suggested cloud-based providers will likely offer a relatively low-priced
service that gives consumers access to both processing and many free-to-play
games.
In this section, we want to address two questions. First, what M&A, if any, is likely to
occur as cloud gaming moves to the forefront? Second, what steps, if any, should
incumbent game publishers take to thrive in this emerging world of video games?
Potential M&A
We’ve mapped each of the major player’s assets in 10 different categories (from IP
at the top down to eSports at the bottom). What’s clear from this graphic is the video
game space is fairly complex. No single firm has assets that span the entire value
chain. As such, we could see three types of M&A:
First, we suspect that the emerging cloud gaming firms — including Amazon,
Google, and Microsoft — might be keen to acquire firms that distribute video
games over the web today.
Second, we could also see consolidation among the various video game
publishers. This would put more game titles in a single firm and (perhaps) allow
these firms to launch their own cloud gaming platform.
Third, we don’t think large publishers should acquire standalone mobile games
firms. As cloud computing gains share, lower-end mobile games will likely
diminish in importance.
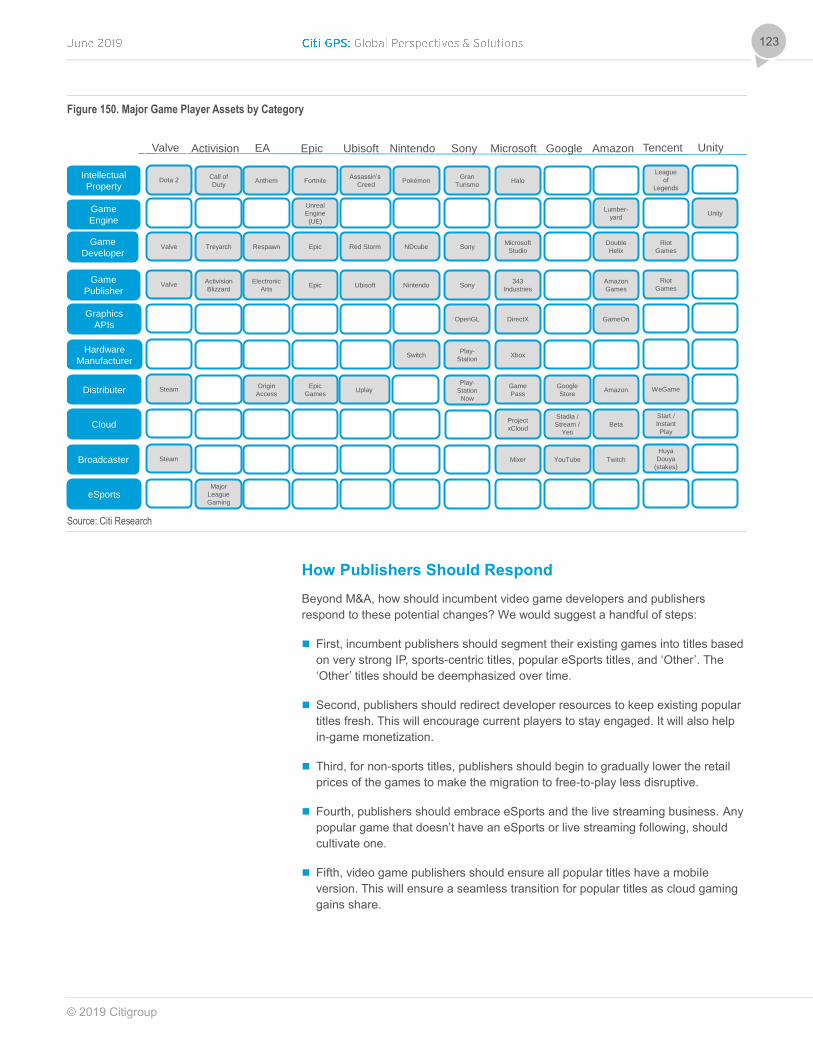
© 2019 Citigroup
123
Figure 150. Major Game Player Assets by Category
Source: Citi Research
How Publishers Should Respond
Beyond M&A, how should incumbent video game developers and publishers
respond to these potential changes? We would suggest a handful of steps:
First, incumbent publishers should segment their existing games into titles based
on very strong IP, sports-centric titles, popular eSports titles, and ‘Other’. The
‘Other’ titles should be deemphasized over time.
Second, publishers should redirect developer resources to keep existing popular
titles fresh. This will encourage current players to stay engaged. It will also help
in-game monetization.
Third, for non-sports titles, publishers should begin to gradually lower the retail
prices of the games to make the migration to free-to-play less disruptive.
Fourth, publishers should embrace eSports and the live streaming business. Any
popular game that doesn’t have an eSports or live streaming following, should
cultivate one.
Fifth, video game publishers should ensure all popular titles have a mobile
version. This will ensure a seamless transition for popular titles as cloud gaming
gains share.
Intellectual
Property
Game
Developer
Game
Publisher
Graphics
APIs
Distributer
Broadcaster
Cloud
Activision EA Ubisoft Microsoft GoogleSonyNintendoEpic Amazon
Call of
DutyAnthem
Assassin’s
CreedHalo
Gran
TurismoPokémonFortnite
Treyarch Respawn Red StormMicrosoft
StudioSonyNDcubeEpic
Double
Helix
Activision
Blizzard
Electronic
ArtsUbisoft
343
IndustriesSonyNintendoEpic
Amazon
Games
DirectXOpenGL GameOn
Origin
Access
Game
Pass
Store
Play-
Station
Now
UplayEpic
GamesAmazon
Mixer YouTube Twitch
Project
xCloud
Stadia /
Stream /
Yeti
Beta
eSportsMajor
League
Gaming
Hardware
ManufacturerXbox
Play-
StationSwitch
Valve
Dota 2
Valve
Valve
Steam
Steam
Tencent
League
of
Legends
Riot
Games
Riot
Games
WeGame
Huya
Douya
(stakes)
Start /
Instant
Play
Game
Engine
Unreal
Engine
(UE)
Lumber-
yardUnity
Unity

© 2019 Citigroup
124
#1 - Segment Existing Titles
We showed earlier that sports-based franchises play a niche role in the broader
gaming ecosystem. But, we suspect this segment of the gaming population will
remain relatively immune to many of these secular changes. Titles with a heavy
eSports following, immersive AAA games — particularly if they are free-to-play —
should also perform well. We also suspect immersive AAA games with high
production value (and commensurately high production budgets) — games like Red
Dead Redemption, Grand Theft Auto or the forthcoming Cyberpunk 2077 — will
also continue to play a role. Finally titles with heavy a heavy eSports following —
particularly if they are free-to-play — should also perform well. But, titles that don’t
have a live streaming or eSports following or don’t mimic a real sport or don’t have
high-quality IP should probably be de-emphasized.
#2 - More Frequent Software Updates
As developers focus on fewer games that span both the cloud and mobile
environments, we expect more resources to be spent refreshing game titles. That is,
the rate of software updates is apt to increase. Indeed, since the launch of Fortnite
in 2017, the Epic Games development team has been updating the software at a
breakneck pace. A new update to the software occurs (almost) every week. While
the pace of update was a little more rapid in 3Q17 (when the game was new and
had bugs), since then the cadence has been relatively consistent. By the first
quarter of 2019, Fortnite players have benefitted from nearly 100 updates. Updates
don’t just fix bugs, they add features: like new weapons and new maps. This helps
keep in-game monetization at robust levels.
Figure 151. Number of Fortnite Updates
Source: IGN. Citi Research
#3 - Lower Retail Prices of Non-sports Titles
We showed earlier that many titles are gradually lowering up-front prices for the
game as in-game monetization becomes more prevalent. We think this is a prudent
step and would encourage publishers to gradually migrate to a free-to-play portfolio.
This will make the inevitable transition to free-to-play less disruptive.
0
10
20
30
40
50
60
70
80
90
100
7-J
an
28-J
an
18-F
eb
11-M
ar
1-A
pr
22-A
pr
13-M
ay
3-J
un
24-J
un
15-J
ul
5-A
ug
26-A
ug
16-S
ep
7-O
ct
28-O
ct
18-N
ov
9-D
ec
30-D
ec
Fo
rtn
ite
Up
da
tes
(n
um
be
r)
Date of Update
2017
2018
2019

© 2019 Citigroup
125
#4 – Embrace eSports and Live Streaming
Viewing hours on broadcasters like Twitch are growing rapidly. But, some games —
like Fortnite and League of Legends — have a more robust following. Game
developers should focus on games that lend themselves to third-party viewing. We
think it’s less important, however, to focus on the mix of consumption that is true
eSports versus live streaming. Either mode of consumption is attractive.
Figure 152. Average Viewing Hours – eSports and Live Streaming
Source: Twitchmetrics, Citi Research
#5 - Add Mobile Game Functionality
The largest cloud providers — Microsoft, Google, and Amazon — are all gearing up
for cloud gaming. The most important implication of this shift is this: every screen
will be able to play PC or console quality game. As such, the processing power of
the mobile device will no longer restrict the quality of the game. It also means the
potential market for video games will likely expand (since there are far more mobile
devices than PCs or consoles).
In the current world of gaming, smartphones are typically less powerful than off-the-
shelf PCs. And, gaming consoles like the Xbox are typically less powerful than
gaming rigs. This disparity is processing does two things: (1) it influences the types
of games that are created by developers and (2) it segments the market, allowing a
gamer to spend more (on high-end gaming rigs) if they are avid fans.
Once the cloud is used for gaming, the performance of any TV, smartphone, or off-
the-shelf PC will be similar. We suspect that consoles and gaming rigs will still offer
superior performance. But, by elevating the performance of low-end devices, game
developers will no longer need to limit the quality of mobile games. Standalone,
low-end mobile games will likely be far less prominent in the marketplace.
0%
10%
20%
30%
40%
50%
60%
0 50 100 150
Sh
are
of
Ho
urs
fro
m e
Sp
ort
s (
%)
Average Viewing Hours – Jan ’18 to Mar ’19 (mn)
Fortnite
Rocket LeagueCounter-Strike
StarCraft II Dota2
Overwatch
League of Legends
Hearthstone
FIFACall of Duty
PUBGWorld of
Warcraft
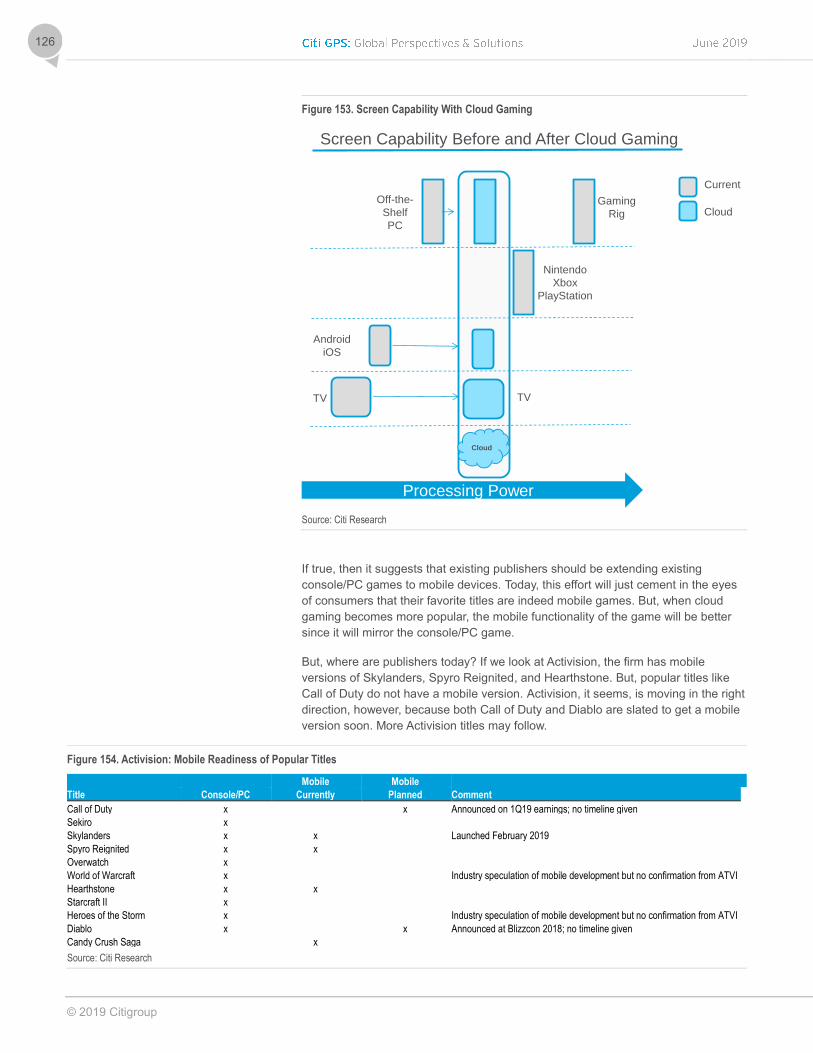
© 2019 Citigroup
126
Figure 153. Screen Capability With Cloud Gaming
Source: Citi Research
If true, then it suggests that existing publishers should be extending existing
console/PC games to mobile devices. Today, this effort will just cement in the eyes
of consumers that their favorite titles are indeed mobile games. But, when cloud
gaming becomes more popular, the mobile functionality of the game will be better
since it will mirror the console/PC game.
But, where are publishers today? If we look at Activision, the firm has mobile
versions of Skylanders, Spyro Reignited, and Hearthstone. But, popular titles like
Call of Duty do not have a mobile version. Activision, it seems, is moving in the right
direction, however, because both Call of Duty and Diablo are slated to get a mobile
version soon. More Activision titles may follow.
Figure 154. Activision: Mobile Readiness of Popular Titles
Mobile Mobile
Title Console/PC Currently Planned Comment
Call of Duty x x Announced on 1Q19 earnings; no timeline given
Sekiro x
Skylanders x x Launched February 2019
Spyro Reignited x x
Overwatch x
World of Warcraft x Industry speculation of mobile development but no confirmation from ATVI
Hearthstone x x
Starcraft II x
Heroes of the Storm x Industry speculation of mobile development but no confirmation from ATVI
Diablo x x Announced at Blizzcon 2018; no timeline given
Candy Crush Saga x
Source: Citi Research
Processing Power
Nintendo
Xbox
PlayStation
Android
iOS
Gaming
Rig
Screen Capability Before and After Cloud Gaming
Cloud
TV
Off-the-
Shelf
PC
TV
Current
Cloud
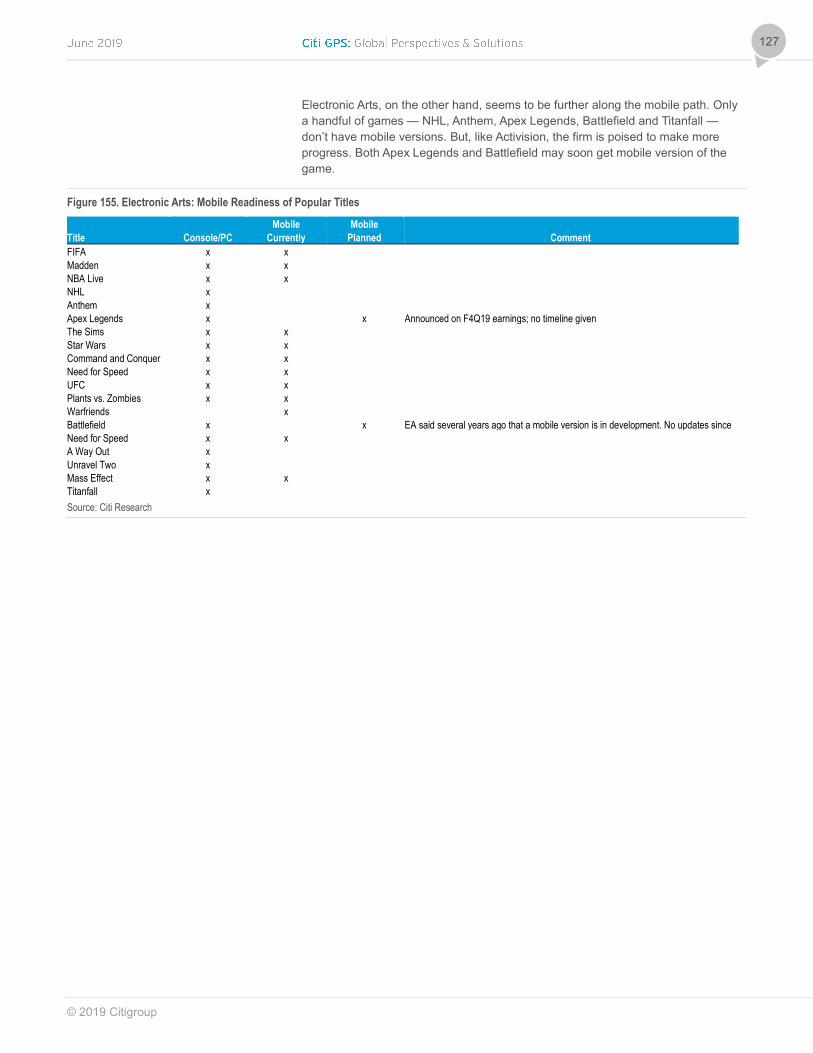
© 2019 Citigroup
127
Electronic Arts, on the other hand, seems to be further along the mobile path. Only
a handful of games — NHL, Anthem, Apex Legends, Battlefield and Titanfall —
don’t have mobile versions. But, like Activision, the firm is poised to make more
progress. Both Apex Legends and Battlefield may soon get mobile version of the
game.
Figure 155. Electronic Arts: Mobile Readiness of Popular Titles
Mobile Mobile
Title Console/PC Currently Planned Comment
FIFA x x
Madden x x
NBA Live x x
NHL x
Anthem x
Apex Legends x x Announced on F4Q19 earnings; no timeline given
The Sims x x
Star Wars x x
Command and Conquer x x
Need for Speed x x
UFC x x
Plants vs. Zombies x x
Warfriends x
Battlefield x x EA said several years ago that a mobile version is in development. No updates since
Need for Speed x x
A Way Out x
Unravel Two x
Mass Effect x x
Titanfall x
Source: Citi Research

© 2019 Citigroup
128
Expert Views
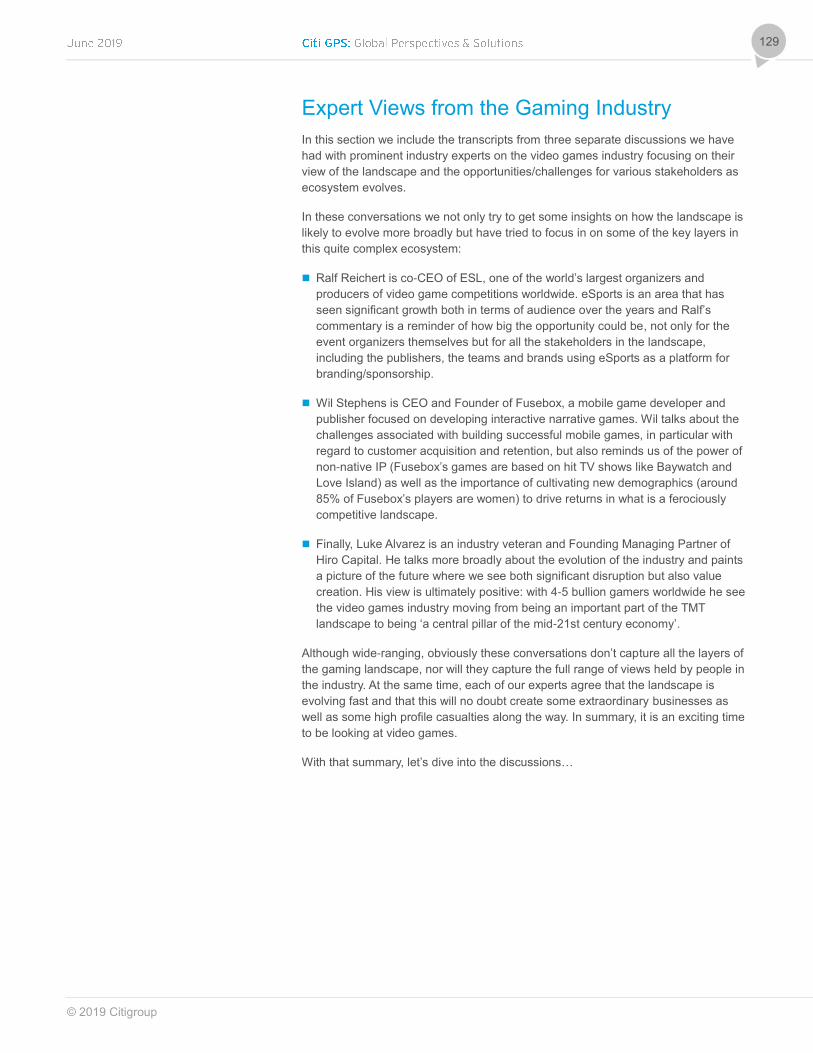
© 2019 Citigroup
129
Expert Views from the Gaming Industry
In this section we include the transcripts from three separate discussions we have
had with prominent industry experts on the video games industry focusing on their
view of the landscape and the opportunities/challenges for various stakeholders as
ecosystem evolves.
In these conversations we not only try to get some insights on how the landscape is
likely to evolve more broadly but have tried to focus in on some of the key layers in
this quite complex ecosystem:
Ralf Reichert is co-CEO of ESL, one of the world’s largest organizers and
producers of video game competitions worldwide. eSports is an area that has
seen significant growth both in terms of audience over the years and Ralf’s
commentary is a reminder of how big the opportunity could be, not only for the
event organizers themselves but for all the stakeholders in the landscape,
including the publishers, the teams and brands using eSports as a platform for
branding/sponsorship.
Wil Stephens is CEO and Founder of Fusebox, a mobile game developer and
publisher focused on developing interactive narrative games. Wil talks about the
challenges associated with building successful mobile games, in particular with
regard to customer acquisition and retention, but also reminds us of the power of
non-native IP (Fusebox’s games are based on hit TV shows like Baywatch and
Love Island) as well as the importance of cultivating new demographics (around
85% of Fusebox’s players are women) to drive returns in what is a ferociously
competitive landscape.
Finally, Luke Alvarez is an industry veteran and Founding Managing Partner of
Hiro Capital. He talks more broadly about the evolution of the industry and paints
a picture of the future where we see both significant disruption but also value
creation. His view is ultimately positive: with 4-5 bullion gamers worldwide he see
the video games industry moving from being an important part of the TMT
landscape to being ‘a central pillar of the mid-21st century economy’.
Although wide-ranging, obviously these conversations don’t capture all the layers of
the gaming landscape, nor will they capture the full range of views held by people in
the industry. At the same time, each of our experts agree that the landscape is
evolving fast and that this will no doubt create some extraordinary businesses as
well as some high profile casualties along the way. In summary, it is an exciting time
to be looking at video games.
With that summary, let’s dive into the discussions…

© 2019 Citigroup
130
A Conversation with Luke Alvarez
Founding Managing Partner, Hiro Capital
Before we start and to set the scene, can you give us a bit of detail on your
background in the video games industry?
I am a lifetime gamer and sportsman. My first video game experience was Pong in
an arcade on holiday in a small town in Italy in the mid-1970s. I was born in 1968,
so I’m proper Gen X — we’re the first generation that grew up with video games, but
we didn’t get the Internet until our late 20’s. The best present I ever got in shabby,
messed-up 1970s London was a LED screen handheld proto-Space Invader type
game that my godfather brought over from the U.S. — amazing. Then I had Atari’s
and Nintendo’s in the 1980s and a Sega Dreamcast (Streetfighter!) in the 1990’s.
That really sparked my enthusiasm for the sector.
I also come from a family background where games — poker, chess, backgammon,
monopoly — featured very prominently in my upbringing. Games and sports and
competition are at the heart of human life and I see video games as a huge and
expanding part of that.
My background in the industry is co-founding a business called Inspired Technology
Group in 2001, which became Inspired Gaming Group. We initially started making
mobile casual games for GSM LCD phones. This was the first generation of phones
that had SMS and we were making games for that environment together with a kind
of software platform that distributed those games and other content across all the
mobile operators in the U.K. and Europe and charged for them.
In candor we were a bit too early. It was six or seven years before the iPhone and
the App store. But having started with that we moved into ‘skill with prize’ and quiz
games. We then pivoted into virtual sports which were photorealistic sports games
for the regulated lottery and sports betting sector.
I first met Ian Livingstone, who’s my co-founding Partner in Hiro Capital, in China in
about 2014. Ian (co-founder of Games Workshop/Warhammer and Eidos) is
obviously a video game pioneer and a true legend in the industry. We worked
together on a couple of projects at the intersection of mobile casual games and skill
games. We had a lot of fun and got to like working together.
Can you talk a bit about the founding philosophy of Hiro Capital? How it came
about and how you approach the landscape?
As a consumer and a player and also having spent 20 years in games and
regulating gaming, I have seen the sector evolve significantly, driven by technology
disruption, and globalization.
With this in mind, the fundamental thesis of Hiro Capital is based on two things.
One, this sector has gone from niche to very, very large over the past 10 years. It
has gone from 100 million players of video games in the mid-1990s, to 200 million in
the mid-2000s and to almost 3 billion now. So it's gone from niche to mass and our
thesis is that this will now go from being mass market to being an absolutely central
pillar of the mid-21st century economy and society and humans’ lives. So we have
seen it move from small-ish to very large today to being absolutely pivotal in the
future.
Luke has 28 years’ experience in technology
and 18 years in digital Gaming and Sports.
He was founder & CEO of Inspired
Entertainment Inc., a Nasdaq listed mobile
games and virtual sports technology
company with operations worldwide. Luke
was a founding board member of The Cloud
Network, the UK’s largest public access Wi-
Fi operator, and Gmatica SRL, one of Italy’s
first government gaming concessions.
Luke was a Case Leader at the Boston
Consulting Group, earned a First Class
Honours in Philosophy at the University of
Cambridge and was a Fulbright Scholar to
the University of California Berkeley.
Luke is also an old skool rock climber
© 2019 Citigroup
131
Thesis two is that the financial investment community has been slow to catch on to
the pace of that growth. In particular in the U.K. and Europe, where as a creative
continent we are extraordinarily good at creating both the games and the
technology around this sector, there's a real gap in capital not so much at the seed
or angel stage, where there's quite a lot, but at the level after that where there is
very, very little. So that covers the economic and market logic for why we started
Hiro.
I suppose the personal story part of this comes from my own experience. As a
climber for the last 45 years I get to hang out (sometimes literally) with a wide range
of people including younger millennials and post-millennials and it really strikes me
that these guys consume media in a very different way. They consume video on
platforms like Twitch and Instagram and Tick Tock and they play games, or watch
people play games, often with family or friends. Their media consumption is almost
all interactive and social.
This is what they're spending their time doing. And the 30 hours a week I would
have spent watching TV when I was their age — when I wasn’t working or playing
or in school/uni — they spend on gaming. I know it is an anecdotal thing but I think
those conversations at the climbing wall woke me up to how profound this
generational shift, even between the 35-year olds and the 20-year olds, has been.
This is another key motivation behind why we are doing Hiro.
The pace of evolution within the video games sector is dramatic and this must
make investing in the space challenging. With the move to
subscription/services, do you think it will become more predictable over
time?
My co-founder Ian Livingstone over the years built and invested in many great
games companies including a couple of 1990s unicorns (including Eidos Lara Croft)
but he makes the point that the investment community has historically been
skeptical, and occasionally has had its fingers burnt, by the video games industry
because of the traditionally non-recurring nature of it. In the 1990s/2000s that hit all
sorts of publishers in the U.K., U.S. and internationally who had extraordinary
periods of growth but then screwed up a big sequel and struggled. Even more
recently we've had a couple of mobile- and Facebook-driven stories of growth and
subsequent decline for games businesses.
But fundamentally, the business model is now clearly moving and shifting and
although a great majority of the income in the industry is still from upfront sales or
downloads, you've got this move to new models. And that's good because it’s long-
term and recurring. Free-to-play with all the in-app purchases is great and you can
see that model doing very well on mobile and more recently doing well cross-
platform with Fortnite and many others.
But this is just the start. We are now seeing the advent of the subscription model
from a number of providers, Apple and Google Stadia and others. I recognize
people tend to make portentous predictions around future adoption, but I do see
parallels with the evolution of retail and eCommerce: Multiple models co-existing.
What we are learning in retail is not that traditional retail is dead but that it is having
to transform. Mid-tier, undefined retail is suffering severely but all sorts of innovative
and new retail and niche retail is flourishing while ecommerce continues to grow
and expand.
© 2019 Citigroup
132
And I think this industry will be like that from a pricing model point of view. I think
there will be very successful subscription ecosystems, no doubt Apple and Google
and Amazon and other FAANGs and BATs. Netflix will also probably move into
games and add games to their subscriptions. And of course Sky/Comcast, Disney,
and AT&T and people like that may end up moving in orthogonally as well.
So I think we're going to see all the media players and the games players trying to
create subscription services for games alongside their TV and movie subscription
services if they have them. And those will converge in interesting ways and some of
them will succeed, and some of them won't.
But I think you're also going to have big ‘free-to-play’ ecosystems with lots of money
inside them and lots of ways to spend that money and new ways being invented all
the time.
And I think there’ll still be a sales and download upfront market place: On Steam,
Epic, Discord, the App Stores etc. There are certain developers who remain
passionate about that and who have a particularly authentic, artist-driven,
independent vision that they don't want to be interfered with, with any kind of
advertising or in game commerce, or with other barriers to the player. And you will
have others who stick to the traditional AAA model, and there will be a hardcore
niche of players who still like that, probably bigger than it is today.
In short, I suspect in 10 years we will have lots of different games products and
ecosystems. I think there's going to be some extraordinary, new entities and models
created along the way and probably some savage casualties. Music is a really
interesting analogy in this context because we have already seen something similar
happen there.
So, building on the analogy with the music industry: some of the parallels are
perhaps obvious — for Twitch we should perhaps think about the similarities
with Spotify — but how should we think about other stakeholders in this
analogy? Should we think of ‘developers’ in the same way we do ‘music
artists’ and, if so, will they be better or worse off in this new world?
Actually, I think the real analogy is between Twitch and YouTube just because,
crudely, they are doing the same thing. They enable watching and self-publishing of
videos. They are both business models that you wouldn’t have conceived of only 20
years ago. And they are both huge and owned by competing FAANGs.
But the one in a way I think is most like Spotify is Epic with Fortnite. Because
Spotify is not just about watching/listening content, it's about downloading an
experience and of course paying for it, while Twitch and YouTube are mostly free.
Fortnite, like Spotify has an entry level free-to-play experience, but you pay more as
you get more committed to it. We should also remember that both companies are
‘new entrants’ (even if Epic has been around forever) that have up-ended their
respective industries and taken share from everybody. The Netflix CEO cites
Fortnite (not HBO) as his biggest threat. But coming back to developers, from their
perspective I think what’s happening is extraordinarily beneficial. Twenty years ago,
if you had games and you wanted to get them to market, you needed distribution,
manufacturing, and expensive advertising for mostly physical titles. And if you were
small you probably had to go to a publisher, and it was hard to get cut through.
In some ways, it's harder now because there are so many games in the App Store if
you are going mobile or cross-platform, and there's so much creativity out there and
so much noise.
© 2019 Citigroup
133
But on the other hand, you've got both the app stores, you've got the whole Tencent
/ NetEase / Asian ecosystem, you've got Steam, you now have the Epic store,
you've got Discord, you've got what Sony are doing, what Microsoft are doing, and
of course Google Stadia and the Apple Arcade.
You have got so many different routes to market. And they've all got slightly different
spins. And actually, if you want to be independent, you can get your publishing tool
off the shelf, you can run your servers in the cloud, and you can buy in a lot of
affiliates and marketing and all sorts of services. There are all these routes to
market to generate money.
Now within all of that, there are loads of other developers to compete with, so if
you're going to cut through, you have got to have something special and unique and
interesting and good.
When we invest in a front end studio — which is going to be about half of our
investment allocation, we look for something that's really, really good, and very
different, because that's how you get cut through.
At an industry level there is a lot of focus on AAA games, free-to-play, and
multiplayer, but how do you as an investor consider the value in legacy IP and
AA formats? In the physical world we are seeing board games and vinyl
seeing a resurgence — is there an analogue in the video games world?
There absolutely is. My partner Ian is a kind of Yoda on gameplay. Judging whether
the core mechanic of a game is compelling or not is fundamental and this applies
both in the physical world and in video games. And of course owning your IP, so you
can monetize across channels and across time.
As regards physical formats, I think the reason why vinyl and physical board games
are in vogue is because digital is amazing and increasingly ubiquitous but it flattens
things. Interestingly, the new generations who have grown up with the Internet are
fascinated by the early 1990s, which in the U.S., Japan, and Western Europe was a
completely modern era that just didn't have the Internet. It was as modern as today
in pretty much all respects — styles of music, clothes, street style, hip hop, extreme
sports — all the same stuff as now and people were pretty prosperous and happy in
a lot of the West but we didn't have the Internet or mobile phones until the mid-90’s.
Digital media is extraordinary but the digital experience is still quite thin and being
able to touch and feel a record and hear that analogue crackle is cool — the fractal
detail goes much deeper than in a stream. Equally, we've seen a resurgence in
board games, Warhammer is doing extraordinarily well with physical figures and so
on. You're seeing all sorts of clubs and bars and pop up venues doing ‘Dungeons
and Dragons’ competitions and things like that on board game nights. And you have
things like Escape Rooms where people are going to play a physical game or
adventure in the real world. And I think that's a good thing.
At Hiro, from a fund point of view, we invest in three sub pillars. Video games over
PC, mobile and console is one, as well as AR/VR/MR. eSports is the second. But
Digital Sports (DSports) — meaning the digitization of real world sports — is the
third. And that's because we think the physical world and the digital world are
converging in interesting ways. Games and sports are the sharp end of where that's
happening for the consumer, and they will continue to be and that will accelerate
over the next decade or so. The really interesting action is going to be in where
those things come together. Ultimately, we want games where people aren't just
sitting on their backsides all the time; they are up and interacting with the real world
and taking pleasure in physical movement while shooting aliens and all that.

© 2019 Citigroup
134
Coming back to the bleeding edge of gaming, clearly there is a lot of focus at
the moment on alternative revenue models e.g., advertising, licensing &
merchandising etc. Two questions: first, what does this mean for paid-for
titles longer term? Will we inevitably move to a free-to-play world? Second,
what other revenue models have you seen/are excited about that could get
traction?
I do think we'll still have paid-for titles in a decade in a market that is much bigger
than it is today. But we strongly feel that ‘free to play’, ‘in-game’ spend and
‘subscription’ is going to eat much of the new income.
There’s going to be a much larger market overall in ten years’ time but it is going to
be a majority free-to-play and subscription market but with still a very substantial
upfront ecosystem. If I had to quantify it, if upfront sales are 80% today, I would
guess it will be a third of a much larger market in 10 years’ time and subscription,
free-to-play and in-game will be the rest.
There will be all sorts of gyrations about what the right level of pricing for a
subscription model will be and who has the scale and breadth of content to make a
subscription platform attractive but most players probably will have capacity for two
or three subscription services at most so some won’t succeed.
When we talk about ‘free-to-play’ and in-app purchases, I think that's a small set of
words for what is going to become a much more interesting thing. At Hiro, we often
talk about the ‘third space’; how platforms like Fortnite are becoming a community
like Second Life was before but with much better graphics and a much larger user
base. And I think in those worlds, clearly money is going to be spent on stuff like
skins or equipment that relates to the game and the core gameplay. But once they
are in, they are in this third space where they're making friends and the kids’ status
in the playground next day at school is based on what they did in the game the night
before, partly. And not necessarily just on how they played, but often on stuff that
isn't so helpful, like how cool their skin is, and sometimes stuff that is helpful, like
how they communicated or problem solved.
And that’s turning this environment into a social space, part of people's extended
friendship networks, community, and sense of themselves. Their self-esteem is
based on what they're doing in the game, and how they are playing and what they
look like. And that creates as many opportunities for spending money and earning
money as there is in the real world.
Our long-term thesis is that the range of digital goods and in-app purchases in
games today is very narrow relative to where it's going to be in a decade or so.
These games aren’t just games. Some of them are on their way to becoming social
communities where you do most of the things you do in the real world.
It is clear with the announcement around Google Stadia that we are on the
cusp of a significant evolution in the rise of cloud computing. How disruptive
do you think this will be? What are the barriers to take up in your view?
I think it will be hugely disruptive and hugely liberating. Thinking back to the late
1990s, I remember how hard it was building data centers if you wanted to do
anything Internet-based and this was the case all the way through to nearly five
years ago. The cloud, more generally, has completely transformed that and many of
us forget how recent it is and how painful and expensive and specialist it was
having to do that stuff yourself and what a barrier to entry it was. I think it's
extraordinary that it's happening and I think it's great that it's happening to games.
© 2019 Citigroup
135
Cloud-based gaming is great for developers because, first of all, you can find your
dev kit in the cloud and you don't have to develop it yourself. And any software
platform outside the game that you do develop, is contributing to your uniqueness
and allowing you to make a special kind of game. So that's a good thing. Obviously,
then, when you want to push that game and publish it and get it out there AWS or
Azure or AliCoud or whomever is there.
And then obviously, the specific cloud-based gaming services: we have all heard
about Google Stadia and Sony's had its subscription initiative for a while, although
this has flipped from streaming only to download as well. Rovio has a spinoff,
NVIDIA has a platform, Intel and Tencent have been investing, no doubt Amazon
etc. will do things - all the big guys are going to do something around it,.
That said, it will likely take a while to be really good. There are some interesting
technical, unit economics scaling challenges with how you build out your gaming
cloud service. You want it to have 10s of millions, ultimately, 100s of millions of
users worldwide but you don't want to have it architected such that you have to put
loads of physical GPUs in all the data center near where all those users are playing.
And some of the models online seem to have taken that approach. And this means
someone that has 10 million users around the world playing a game, you're going to
need many millions of GPUs and that is an awful lot of capex and depreciation of
physical assets and stuff like that.
So you need the right technical approach and we look have looked at a lot of
streaming solutions and approaches and startups and so on and some of them
have very clever streaming approaches, and some of them less so.
And then when it's out there, there will be lots of ecosystems and there will be lots
of competition and this will, generally, be very good for developers, particularly
independent developers who get taken up by these guys.
I think it will be quite painful for some of the big and medium sized publishers, some
of whom will get disintermediated by the big services and their role in the value
chain and their ability to capture margin will struggle. Ultimately, though, I think it will
be really good for the industry, because it will open up the ecosystem and you will
have a lot more self-publishing, smaller developers.
Can we talk a little bit about hardware? In a cloud computing world, what in
your view happens to consoles and handhelds?
Our view is ‘yes and no’. This is all about time horizon. In the next five years or so
we've got another generation of consoles coming, and those will probably do really
well because the market is continuously expanding and that's good.
I think 10 years out, we see a more bifurcated ecosystem where, if you've got 4 or 5
billion people playing games, most of them will be playing games on their next
generation smartphone or communication device. And indeed that will have a much
more powerful chip and graphics than anything in today's consoles, so will be able
to run full AAA mega games. And of course, you will be able to attach to that thing
through next generation Bluetooth all sorts of peripheral devices, including
controllers as well as AR/VR/MR wearables.
At the same time, obviously, we have an eSports ecosystem which is accelerating
and growing very fast, and has now got big sports owners and media companies
and advertisers and brands getting behind it.
© 2019 Citigroup
136
That grew out of countries like South Korea, where people couldn't afford consoles,
so everything was done on PCs in Internet cafes. What we think we're going to see
is, as we've already got, to some extent with today’s specialized PCs, you're going
to see hyper-specialized, athlete-level PCs and gaming consoles, that allow people
to really refine their performance and that are the equivalent of the Sky Tour de
France team, carbon fiber, mega bikes. And there will likely be a halo market of very
good amateurs who want to play on the same kit that their heroes play on and that
will be huge.
This is not wildly dissimilar to today. Consoles today are kind of mid-market — they
have some mass market fun games but they skew a bit towards the hardcore gamer
base, but it is still a compromised experience — you mostly can’t play as
aggressively and as precisely as you can with a PC. So we think the mid-market
disappears long term and you have hardcore athlete consoles and PC’s and a vast
mass market on smartphones with peripherals.
There is a lot of excitement about VR and AR in the context of video games do
you think this hype is justified?
Again, it's all about timing. We first the saw commercial VR companies being set up
in the 1980s, so we have already been through a few VR Gartner Hype Cycles —
periods of over excitement, followed by a trough of disappointment. VR has been
through a few of those over the past thirty or so years. The current headsets have
not crossed the technology adoption curve chasm, they're not mass market, and,
although they are getting better, it still does not feel imminent. The next gen are
definitely closer, but I think still for the early adopters not the mass. AR is possibly a
little bit ahead. And smartphone based AR just isn’t very good and won’t be for a
while.
So we think both of those things are coming. They are a big theme for us. We will
probably make one or two investments related to that space on the tech and
platform side rather than the game side in our first fund. I would expect by fund two
or three will be making a lot more.
We prefer to be investing at the point when the tech is crossing the chasm and is on
the way to becoming mass market.
I'm a big reader — and I still read a lot Sci-Fi. I still think the world of your
imagination can create a more compelling environment than any digital media can
today. There are three canonical texts of science fiction about virtual reality. One is
William Gibson’s Neuromancer from the 1980s. In the 1990s, there was Neal
Stephenson’s Snow Crash. And in the 2000s there was Ernest Cline’s Ready Player
One. I fundamentally believe that world is coming and loads of people who run the
big tech companies have also read those books, grew up thinking about that stuff,
and also playing video games and wanting to build those worlds. So they're coming,
it’s just the tech is not great yet so they’re not coming tomorrow. (Hiro Capital by the
way was inspired by Hiro Protagonist, the VR hero of Snowcrash. And of course,
when you play a game, you’re a hero, and so are our entrepreneurs.)
You have talked in the past about the opportunity in eSports which could be
very significant. Can you scale this and also tell us who do you anticipate is
the main winner from this longer term? Will it be the IP owners, the teams, the
event organizers or the streaming platforms? Or can it be all four?
It's a weird industry at the moment, because you’ve got 600 million people watching
video games online and some eSports but almost all the corporate participants in
the industry are not making much or any money for the moment.

© 2019 Citigroup
137
A lot of them are venture funded and losing venture funded money. The winners
today, and I think the winners in perpetuity, are going to be the really talented
athletes and teams as in other big audience sports like football. And I would expect
that, as the industry matures, the current dynamics between multiple independent
and publisher-owned or -controlled leagues will shake out.
We probably won’t end up with a FIFA-style overarching body but will end up with a
well ordered ecosystem of privileged leagues. In certain games we might have
competing leagues like we have competing boxing belts.
An important point is to remember that “eSports” isn’t like football. It is like physical
sports. There are loads of sports within it correlating to the different games. Some of
those sports will be very profitable like football is and some of them won’t be very
profitable like rock climbing, because it's just too small. DOTA and League of
Legends are soccer and NBA equivalents and there are a bunch of games that you
might consider as being the equivalent of rock climbing. There are lots of small
games with an eSports component that aren’t making any money today as eSports
and still won't be in 10 years’ time.
The athletes will make money. Some of the leagues will make money. And
advertisers and brand owners will spend money and do very well out of it targeting
the next generation.
How do you see the developer/publisher/distributor landscape developing longer
term? Will we see consolidation amongst the larger players do you think? And what
form do you think it will likely take – vertical integration (distribution merging with
developer/publishers) or horizontal consolidation amongst publishers/developers?
I think we will see all of those things. We already see lots of vertical integration, with
e.g., Tencent and Microsoft (both platforms) investing in and acquiring and JVing
studios (Supercell/Epic/Minecraft/Roblox and many many others). That’s active
vertical integration. We’ve also seen defensive vertical integration.
Of course we will continue to see lots of horizontal integration with big publishers
buying small studios. Will we see mega mergers between big publishers? I think we
probably will — it’s a classic response in a transforming industry with big new
entrants, partly because even our biggest game publishers are minnows compared
to the FAANGS and the BATS and some of the big publishers will end up stuck in
the middle: too big to innovate great new games, too small to take on Google or
Apple or Tencent on Cloud Streaming. This has already happened in Music.
And will we see Netflix or Disney buy a big publisher? As Video streaming and
subscription morphs into Game streaming? Maybe so.
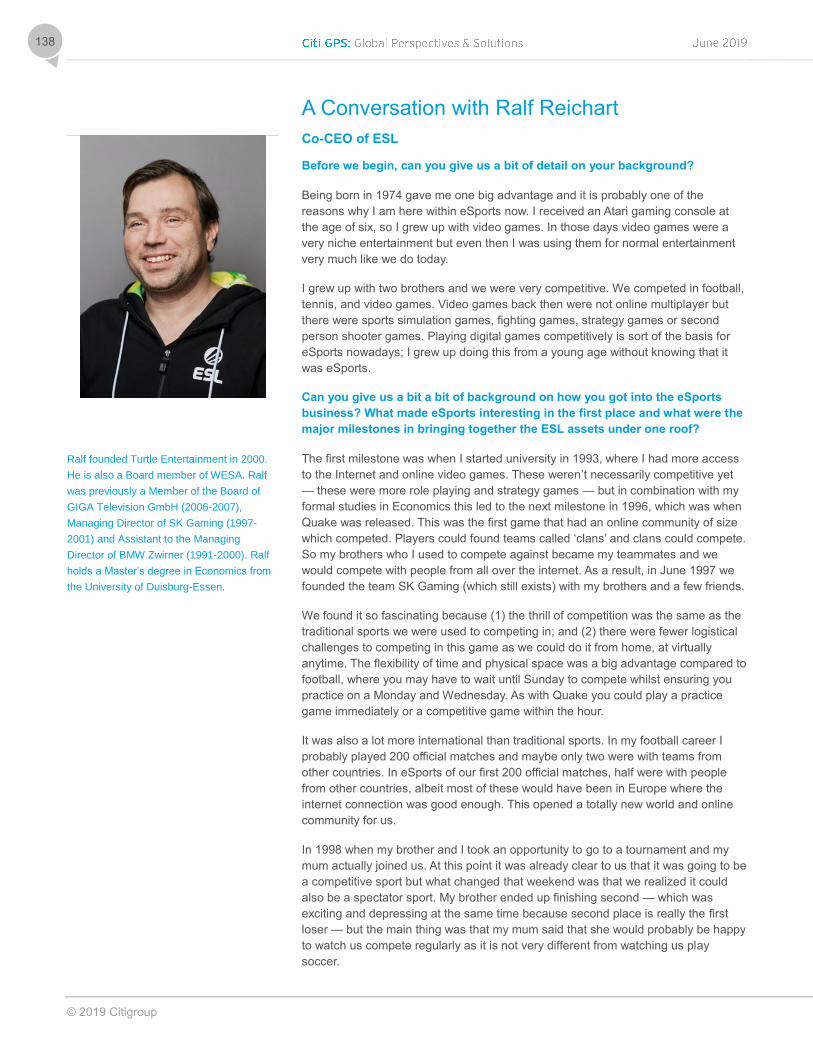
© 2019 Citigroup
138
A Conversation with Ralf Reichart
Co-CEO of ESL
Before we begin, can you give us a bit of detail on your background?
Being born in 1974 gave me one big advantage and it is probably one of the
reasons why I am here within eSports now. I received an Atari gaming console at
the age of six, so I grew up with video games. In those days video games were a
very niche entertainment but even then I was using them for normal entertainment
very much like we do today.
I grew up with two brothers and we were very competitive. We competed in football,
tennis, and video games. Video games back then were not online multiplayer but
there were sports simulation games, fighting games, strategy games or second
person shooter games. Playing digital games competitively is sort of the basis for
eSports nowadays; I grew up doing this from a young age without knowing that it
was eSports.
Can you give us a bit a bit of background on how you got into the eSports
business? What made eSports interesting in the first place and what were the
major milestones in bringing together the ESL assets under one roof?
The first milestone was when I started university in 1993, where I had more access
to the Internet and online video games. These weren’t necessarily competitive yet
— these were more role playing and strategy games — but in combination with my
formal studies in Economics this led to the next milestone in 1996, which was when
Quake was released. This was the first game that had an online community of size
which competed. Players could found teams called ‘clans’ and clans could compete.
So my brothers who I used to compete against became my teammates and we
would compete with people from all over the internet. As a result, in June 1997 we
founded the team SK Gaming (which still exists) with my brothers and a few friends.
We found it so fascinating because (1) the thrill of competition was the same as the
traditional sports we were used to competing in; and (2) there were fewer logistical
challenges to competing in this game as we could do it from home, at virtually
anytime. The flexibility of time and physical space was a big advantage compared to
football, where you may have to wait until Sunday to compete whilst ensuring you
practice on a Monday and Wednesday. As with Quake you could play a practice
game immediately or a competitive game within the hour.
It was also a lot more international than traditional sports. In my football career I
probably played 200 official matches and maybe only two were with teams from
other countries. In eSports of our first 200 official matches, half were with people
from other countries, albeit most of these would have been in Europe where the
internet connection was good enough. This opened a totally new world and online
community for us.
In 1998 when my brother and I took an opportunity to go to a tournament and my
mum actually joined us. At this point it was already clear to us that it was going to be
a competitive sport but what changed that weekend was that we realized it could
also be a spectator sport. My brother ended up finishing second — which was
exciting and depressing at the same time because second place is really the first
loser — but the main thing was that my mum said that she would probably be happy
to watch us compete regularly as it is not very different from watching us play
soccer.
Ralf founded Turtle Entertainment in 2000.
He is also a Board member of WESA. Ralf
was previously a Member of the Board of
GIGA Television GmbH (2006-2007),
Managing Director of SK Gaming (1997-
2001) and Assistant to the Managing
Director of BMW Zwirner (1991-2000). Ralf
holds a Master’s degree in Economics from
the University of Duisburg-Essen.

© 2019 Citigroup
139
We already knew this was going to be a participatory sport because we were so
excited about it but knowing your mum is willing to watch it as well, told us that it
could be a spectator sport.
Fast forward two years to 2000, I finished university and met a few guys from
Cologne who want to start a gaming company and I said we should focus on what I
then called ‘Fiber-Athlete Competitive Gaming’, as the term eSports wasn't coined
back then. This is the founding story of ESL.
My logic at the time was that there was no true infrastructure, no organized league,
and no organized tournaments on a global scale. There were a few individual
projects but nothing of the size we were thinking. We wanted to build these amazing
stages and tournaments for players to become star players and to make a living out
of it, because at that stage it was such a niche. It was the social aspect we wanted
to bring to it. Even if the business model was unclear, our view was that it would
become a spectator sport and that if enough people watch it, the revenue will follow.
There’s a simple saying ‘revenue follows relevance’. So, like in football, we believed
we could make a living if we could get enough people watching.
We expected it to take three to maximum five years, we were incredibly wrong. We
definitely got the vision right but the timing was a little more challenging. From 2000
to 2010 we start to build products, with the launch of Extreme Masters in 2006 a key
milestone, but it took time for it to become a true market, it was still too niche.
It was between 2009 and 2012 it went from being really niche to become lot more
mainstream. The business model began to change to ‘free-to-play’ with more live
video streaming via YouTube Live and Twitch. Social media was also a key platform
for extending awareness. On the back of this, eSports became a market.
Then the most important breakthrough came between 2013 and 2015, when we
started to do stadium events. This was the point where eSports became something
that everyone could ‘touch’. Seeing a full stadium, hearing people shout in an even
more enthusiastic way than seen at most traditional sports, has taken our vision
through from being a fairy tale for a digital first kid, into becoming something
everyone can relate to and understand.
That is certainly one of the most striking developments because before that I had to
explain in every single interview why it was a sport and why it was a business model
worth pursuing. After that everyone who entered the arena understood that this was
a sport. The debate now is how big it will be, whether it will be an Olympic sport in
time. That fundamental question of this being the next generation of sport was
finally answered.
Fast forward three to five years and eSports has become a massive phenomenon, it
is now one of the largest sports in the world and we already have some of the
largest brands involved. The sport is well on its way to becoming a multibillion dollar
business. Now we are really focused on scaling it and building the right models
behind it. Even though it is still incredibly early we know that gaming video is going
to become the primary entertainment channel for the generations to come. We are
just scratching the surface of what the potential could be in 20, 30, or 40 years.
© 2019 Citigroup
140
ESL is now one of the biggest eSports businesses in the world. Can you tell
us a little bit about what makes it different?
Firstly, we organize tournaments and leagues. We are a promoter of eSports and it
is our mission to create the most exciting content. I think it is important to highlight
what we don’t do: we don't build games, we’re not primarily a distribution platform,
and we don't produce hardware around video games or eSports.
We carry out our mission by creating ecosystems; this means it is incredibly
important that whenever we talk about competitions, we don't talk only about the
stadium events. Yes, they are the most exciting and visible competitions but we
want to really build a story from zero to hero, from amateur to the big stage.
That is the idea we aspire to and we're building this not only in North America but
globally. I think that distinguishes us and is unique about what we are doing.
Together with our sister company DreamHack, we're doing it in a very layered
process starting from the online competition, to festivals, to national championships
all the way to what we call ‘Pro League’. ‘Pro League’ is our Champions League
equivalent. The Intel Extreme Masters-Katowice or ESL One-Cologne (known as
the Cathedral of Counter-Strike) or ESL One-New York are what we compare
internally to Wimbledon or the PGA Masters in Augusta.
Looking at this space from the perspective of the publisher/developer, how in
your view has the approach to ‘community’ changed in recent years? What
does this do to the life time value of a particular property/brand?
Pre-2010 there were a handful of publishers who cared about the community and
really invested into it even if there was no direct return on investment (ROI) because
the publisher model was still based on selling games every now and then for $60; it
could be yearly or every four years.
For these publishers, investing in the customer more than three months after the
game release didn't have a direct ROI. It only had a long-term effect which was that
it increased loyalty to the publisher or the game IP which then may be monetized if
a sequel was ever released. So back then only a minority invested in directly into
the community.
I think this all changed in 2010 when the game as a service model began to evolve.
This fundamentally changed the model. The key point is that where you start is not
as important as where you finish. Having 100 million players on day one of the
game is not as important as how many players you have after one, two or three
years. It is the opposite of the traditional model.
We have seen these stories like Counter-Strike, like League of Legends, or like
Zelda which have continued to grow, even after a decade.Games and publishing
used to be a sprint and now it is a marathon. This totally changed the economics
around it as well.
In this context, eSport is one of these incredible tools that will help you to create
such a curve. eSport allows you to create additional content outside of the game,
which creates touch points for your consumer. If the content is of a decent/good
enough quality it can add to the retention of the game, maintaining consumer’s
interest and possibly exposing the game to people who probably haven’t heard of it
or had large engagement with the game previously. It all boils down to additional
marketing.

© 2019 Citigroup
141
One of the pushbacks on the eSports space is the view that IP owners will
want to organize eSports events in house. With this in mind, can you talk
about the different stakeholders in the ecosystem and why, from your
perspective, you feel there is long-term opportunity for independent eSports
businesses?
The overarching philosophical discussion is insourcing vs. outsourcing or vertical
integration vs. focus on the core of the business.I think that there are a few reasons
why we are fairly relaxed on this topic.
We believe that game publishers will try and are already trying to do it all
themselves but it is important to remember there is a lot of variety amongst
developers. Some are two students in a dorm room trying to become incredibly
successful. Others are multibillion dollar companies such as EA and Activision.
Each of these groups of developers will have a very different approach.
If you look at the most successful eSports games in history, they were mostly
created by developers in the ‘two kids in a dorm room’ category.
This variety in developer backgrounds makes it very clear that there will be very
different approaches to running eSports. Also the variety leads to plenty of
opportunities for a company like ESL.
Looking at the skill set, running an eSports live entertainment business is very
different from running a games and services business. I don't think there are
operational synergies between doing it in house just because fundamentally they
are different businesses. Also it boils down to the company's philosophy: do they
want to be the best in the world in one thing or very vertically integrated? I don't
think that there's a right or wrong answer.
A final point to make is that while eSports dramatically increases the life cycle,
games come and go. Yes there are a few cases such as Counter-Strike which has
been around for nearly 20 years, there is a high probability that games will only live
so long. If a person’s goal was to industrialize eSports on a large scale, then I feel
there is a good argument to suggest you need a portfolio of eSports games to
efficiently build it on a global scale. This supports what we see with ESL on a global
level.
We feel good about industrialization and we want to find a diverse way of
approaching it. There is probably no right or wrong way of doing it. As long as we
deliver a significant value to our partners, we are excited for the future.
Can you talk a bit about some of the other stakeholders, for example the
relationship you have with the teams?
As I came from being a team owner (SK Gaming), we are generally big fans of
teams. We understand the role of the team and we know we need to work jointly to
create monetization models, so that both of our businesses can be sustainable.
Running a team is a tough business because there's a lot of competition. Going
back to the founding story of ESL, we needed to build these ecosystems to create
stages for players and teams. We want ecosystems that give longevity and allow
teams to thrive. Our ecosystems can be operated alone, with a publisher or as a
service for a publisher.

© 2019 Citigroup
142
We started WESA as a body to work with teams directly. We now have a many
relationships with team owners; there are a few teams who have worked with us for
more than a decade. However, when we look at this as a whole industry there is a
lot to be figured out. We need to grow the pie and create value for all the
stakeholders we're working with, so that the pie is big enough to provide for
everyone. In my opinion this is extremely similar to traditional sport but with a
couple of key differences: yes, there are lower barriers to entry at each level but
then there is a lot more potential digital scale.
Let’s talk a little bit about the pie. Looking at industry trends, it’s clear that
Sponsorship has been the key driver of industry revenues hitherto. Can you
talk about how the opportunity in sponsorship has evolved? How much of
this is the game/tech industry advertising to itself and how much is the
platform being used as a genuine new medium for more ‘traditional’ brands?
There are a few ways to look at it. If we start by looking how this has evolved over
time, we can learn a lot. Looking back at 2000 when we founded ESL, there was no
market; the product was still in development so we had to sell a vision, which was
challenging. This said, I think we did a good job.
A key achievement in the first 10 years was creating a global relationship with Intel.
You could say Intel is equivalent to the Nike or Adidas of football. They were an
endemic partner which was wholeheartedly supporting the growth of the sport at a
very early stage.
We had plenty of other endemic partners in there, but they were mostly in for
campaign reasons. From 2006-2007, we started to see opportunistic sponsorship
start to become a bit more strategic with the endemic sponsors. From 2010 the
market became a lot stronger and by 2013-2014 the same process started with non-
endemic companies. At this stage, it shifted from more campaign driven, individual
marketer-oriented engagements (e.g. specific deals with Adidas and DHL as early
as 2008) to long term contracts.
From 2013-2015, non-endemic companies really began to look strategically into
sponsorship and nowadays, we have a number of engagements with brands like
Mercedes, DHL, Vodafone, and AT&T which are multiyear, multimillion dollar
engagements and are comparable to where we started with the endemic umbrella
brand Intel. It's a completely different world from where we came from. Today
sponsorship is strategic both with endemic and non-endemic brands and that
makes it extremely sustainable longer term.
The second point is that we have seen the size of the pie dramatically grow over the
last decade but compared to traditional sports I feel we are still under monetized in
terms of media value.
Traditional sports create around 3-5x more than we do compared to the media they
generate. The amount of partners is much higher for traditional sport as well, so
arguably there is still scale to be created, although, I think from a pure ESL
perspective, we'd rather work with a handful of partners in a very deep way, than 20
partners in a very shallow way.
When we look forward and consider new revenue opportunities, clearly the
big one is media rights. Can you talk about how you see this opportunity
evolving? Is this something that is only an opportunity for so-called Masters
events?

© 2019 Citigroup
143
Looking at traditional sports, a lot of the value (around 70-80%) is in media rights
revenue. This is still very different to eSports. Sponsorship is probably the largest
revenue stream in eSports. We look a bit similar to Formula One when you put in all
the host city fees and local contributions; however, the more media-live sports have
a very different profile.
So for us, media rights are in an early stage of evolution. We expect it will contribute
dramatically more to eSports in the coming years. Looking back at our pyramid we
believe it will be a bigger opportunity for the ‘Challenger’ and the ‘Masters’ level
events; as in any other sports the bigger the competition, the bigger the relevance
and the more aggressive the media rights competition is likely to be.
We believe that in the future local content will play a significant role, more so on the
‘Challenger’ level. So there is scope for at least half of the pyramid to see significant
further growth from media rights over time.
Can you talk about the interplay with eSports in a live setting and the
streaming platforms like Twitch and YouTube? Are they a threat to your
business or a complement?
They have a very different business model to us.
The question is not unusual as the industry is still relatively new, so people try to
find boxes to put companies in. A good way to compare us is asking the question,
are documentaries going to be a substitute to Hollywood movies? Both platforms
are primary distribution channels, they have been incredibly important and are one
of the reasons why the sport inflected in around 2010.
Yes, they are competing as content creators with us but that is only 5% of our
business, maybe less. There are always certain things companies from different
segments will do at the same level, this may lead to the occasional competition for a
team or sponsorship but it is really minimal.
I think the key question here is how we as an industry can improve monetization
around content and build premium content offerings that are being presented in the
right way. This is where the industry is lagging behind in my opinion.
Looking at the CPM (cost per thousand impressions) model in the old traditional
linear world, they're still a lot higher than they are on digital media platforms like
Twitch and that's without any data.
So that is one challenge, combined with ad blocking, which is a big challenge for the
industry and that means we need to keep working on a way to improve the
monetization for these distribution platforms. This is where the Asian distribution
platforms are really interesting. In Asia, the distribution platforms have mostly
replaced advertising models with consumer payments, with consumer engagement,
with micro transactions. I'm not saying that one or the other model is better, but the
combination of both and the continuous shift from traditional media toward digital
media, will play a big role in filling the gap and making digital content more
monetizable.
There is a lot of potential excitement about the rise of cloud computing –
what’s your take on platforms like Google Stadia and next gen consoles in an
eSports setting?
© 2019 Citigroup
144
The overarching message here is more people will have access to higher quality
and more complex video games. This is great news for me because it increases
engagement with video games and this increases the probability of deeper
engagement with eSports. It increases the chance that developers will create better
and more eSports-ready games as well as more viewership-capable games.
As a micro trend, it usually takes a while for eSports to pick up on a platform.
Looking back, PC games didn’t really take off until the late 90s with Quake,
Starcraft, and Counter-Strike. Touchscreen mobile games have been around 2007
and this took about 9-10 years: Clash Royale is the game I label as the early
eSports mobile game. In both cases it took about a decade for the platform to
develop and the software to cater for a rich multiplayer experience which is actually
watchable.
With cloud streaming, it's probably going to take a while to find the right game genre
and quality that really distinguishes the platform vs. PC or mobile. As a micro trend
it will probably take a while for it to make a real impact. Longer-term, though the
biggest opportunity will be the ability to really create participatory tournaments at
scale as it should be a really accessible platform but this will take a while.
Battle Royale games, have been a bit more of a challenge in terms of how you
make an eSports proposition exciting. Can you give us your latest thoughts
on why this has been a challenge and how you think it will evolve?
The technical challenges in broadcasting a Battle Royale game go deep and are
very obvious as the first half of the match is impossible to capture from a spectator’s
point of view as so much is going on. In the first five minutes 50 people leave the
match and every three seconds something significant is happening. In Counter-
Strike, by contrast, the first few minutes are quite slow and then the match begins to
climax.
For a spectator watching a Battle Royale game, you have a situation where they
move from a situation where they may not understand what is happening in the
beginning, to a midgame which you can start to get a grip on what is happening, to
an endgame which is very similar to all the traditional games.
Trying to make these first 10 minutes, or 50%, of a match interesting is a story
telling, technical and experience challenge. We did this big Katowice Royale
Fortnite tournament where we believe we implemented a few tricks/technical things
that made the first 10 minutes a decent experience, but there is still a way to go but
this is more of a development and technical challenge. To tackle this we need to
create more content and do tournaments and then iterate again.
Eventually, we will get to the point where the start is not super confusing and is
decent to watch. If we can tell that story from the beginning to the climax, it's going
to be good enough. The sheer amount of players and interest in Battle Royale in
general, and Fortnite specifically, is certainly helping to make it a viable eSports
business.
Do you think the video game ecosystem will consolidate longer-term or will it
become more fragmented?
Looking at the game landscape we think we will see both. There is a concentration
at the top with Tencent, Electronic Arts, Activision etc. they have dramatically grown
in the last 10 years.
© 2019 Citigroup
145
Also, at the same time Epic Games, PUBG Corp, Valve, Supercell, and many, many
others (even companies like Innogames which is owned by MTG) show that there
are a myriad of highly successful medium sized corporations being built, even if I
am not sure we can label Epic as medium-sized now or not — that is a little bit more
of philosophical discussion.
But the opportunity of distribution being easier than ever will certainly lead to more
and more creativity being out there and having direct access to large audiences.
I believe that there will be more amazing games and more amazing game
companies, and at the same time we will have a handful of huge ones with
awesome portfolios. But we are fundamentally not going to see an oligopolistic
market. This confirms the trend of the last 10 years.
Creativity is still the core piece to it and it's not scale or distribution it’s not all the
other things. It is a creative industry at its heart and that is the beauty of it.
How does being part of a bigger group like MTG impact you at ESL?
We made a very conscious decision in 2015 to join the MTG family. The clear logic
behind this was to have a relationship a larger strategic. There were a few reasons
for this.
First, we didn’t want to be constantly raising money because we didn't know how
fast the industry would scale. Being part of MTG helped us to really focus on our
business and it has allowed us to grow at the pace we have done over the last for
four and a half years, which has been quite a fast pace.
The second point was that MTG has been a media company and a games company
but not in a way that it was competing with some of our key clients, i.e., the
publishers. I think that was always important as well because it was like the
‘Switzerland’ of the entertainment industry in the past and now the games/eSports
industry of today.
Lastly, with our sister company DreamHack, we have some economies of scale but
more knowledge and R&D synergies there too. So the last four and a half years this
has been have been the right decision and the right track to move on.
Looking beyond ESL and MTG, how do you think about the future? What do
you think are the key challenges?
One of the reasons why we're so incredibly excited about what we're doing is that
we're in a linear growth industry. When there is hockey stick growth, you face a lot
of operational and sustainability challenges because there is a risk that growth
might prove temporary.
Gaming and eSports have always been a much more linear experience albeit with
the odd bump — certainly the Battle Royale issues have definitely levelled up the
industry — but most of the areas we are exposed to have long-term sustainable
growth potential.
In this context, we are trying to grow a tree with very strong roots. We have the time
to make sure that these roots stick across a certain amount of games on a handful
of platforms. I am more excited about building this than rushing to build a
‘skyscraper’ in the next 12 months which is at risk of falling part because we were
too crazy.

© 2019 Citigroup
146
A Conversation with Wil Stephens
CEO / Founder of Fusebox Games
Before we start and to set the scene, can you give us a bit of detail on your
background in the games industry?
I’ve spent 10 years building businesses at the cross-section of television and
gaming, seeking opportunities within the seismic shift in viewing, consumption and
participation of media.
As part of that process, I’ve been fortunate enough to found, build and exit
businesses in this space giving me a front row seat to the rapidly evolving media
landscape.
Can you talk a bit about Fusebox? How did the business come to be founded
and what are your key franchises so far?
Fusebox was founded in 2016 on the premise that the cost of acquiring users at
scale was becoming prohibitively expensive for small mobile players, therefore we
needed to use well-known brands as a catalyst to drive our downloads. At the same
time television companies revenues were at best flatlining and at worst falling and
were therefore actively looking for new revenue streams. At the intersection of that
particular Venn diagram we created Fusebox.
Our flagship titles are Love Island in partnership with ITV, The X Factor in
partnership with RTL Group’s Fremantle and Baywatch.
Figure 156. Love Island
Source: Fusebox Games
Wil is a Welsh entrepreneur with extensive
experience of building transformational
businesses in television, games and
interactive entertainment. Wil is CEO of
Fusebox Games, an interactive
entertainment company he co-founded in
2016 that develops and publishes mobile
games based on hit TV shows.
Wil founded his first business aged 23 and
as CEO of Cube Interactive, led the
company to win BAFTAs and Broadcast
Digital Awards for their ground-breaking TV
formats and games. After growing Cube
Interactive to offices in Cardiff and London,
he joined the leadership team at New York
based video streaming company Boxee to
build out their international business, later
acquired by Samsung.
Wil was born and raised in Aberystwyth and
now lives in Brixton, London. He is a
member of ‘Speakers for Schools’ which
provides talks to state schools to empower
the next generation, is a Fellow of the RSA
and a member of BAFTA.

© 2019 Citigroup
147
The gaming sector is a fast-paced industry at the best of times but mobile
gaming can be especially frenetic. For those of us who are uninitiated with the
space, what are the key attributes/variables that you think drives success in
the space? How has this changed or evolved over the time you have been
active in the industry?
Firstly, quality is paramount. The start and end point is a great game crafted by an
exceptional team. Nothing beats raw unfiltered feedback from millions of players
and if you haven’t delivered on their expectations, you’ll know about it. Negative
reviews and sentiment kills good games and only the great survive.
Secondly, on metrics, the market is shifting (again) and it’s becoming very hard if
not impossible to play the short-term acquisition/monetization arbitrage game. You’ll
see consolidation and a huge shakeout in the hyper casual market as this new
reality bytes.
The reality of mobile now is you’re better be building your franchises for the long
haul, say 3-5 years plus, to capitalize on the repeat monetization of your user base
you’ve worked so hard to acquire. Returns are getting longer to deliver but
ultimately end up being much bigger. Scale matters.
In an industry which appears to be obsessed with the importance of creating
proprietary IP, what is interesting about Fusebox is that you have partnered
with third parties like ITV to bring established TV brands into a gaming
context. Can you talk about the pros and cons of the partnership model vs.
internally generated IP?
Firstly, scale is hugely important in mobile games. We got to scale quickly through
leveraging IP to rocket us forward and by giving players an opportunity to play
within familiar worlds. This familiarity led to increased and faster monetization,
strong retention and all other key metrics indexing higher than our peers. It’s a great
model that’s worked out well for us and our commercial partners.
However, you only have to look at the Netflix playbook to see how scale can
translate into an opportunity to create and deploy original IP. Netflix took years in
building its platform on catalogue content before moving their vast eyeballs onto
their own content. A similar opportunity will present itself for Fusebox as all the
users we acquire, we control and we learn through data about their interests,
behavior and gameplay patterns.
When to make that move is a big question and all I know today is we’re some way
off being ready to do that shift.
Fusebox games are centered on choice-based narrative. Do the points you
make about IP apply only to this genre or could it apply more broadly?
We chose choice-based narrative games as it’s a great genre to be in: huge
monetization opportunities and long gameplay retention. It’s unbeatable as a
category in terms of return on investment on your development costs. It also fits
with our belief of creating mass-market entertainment for all, not only for niche
gamers. Everyone loves a good story.
The opportunity to work with IP is across all genres, however, and there are a
number of successful studios deploying different styles of games for all sorts of IP.
For now, we’re staying focused and will continue to innovate the narrative genre.
© 2019 Citigroup
148
Can you also talk about the behavior of gamers how this differs by
age/gender and across different gaming genres in mobile? Can we make
generalizations about different cohorts of mobile gamers?
Absolutely. Different genres of games appeal to different demographics, as you’d
expect. Games are typically categorized as hyper-casual, and as the name
suggests are fleeting players with zero loyalty, mid-core that tend to attract a wider
group of non-gamers and then core gamers who are really the more stereotypical
gamer who’d traditionally been heavy console players.
Looking at Fusebox in particular, as you have mentioned in the past, your
games are extremely popular amongst the female demographic. What impact
do you think this has had on your performance and how does this impact
what kind of IP/genre you focus on going forward?
Fusebox targets the mid-core market, so players that don’t necessarily identify
themselves as gamers and have a wide range of interests. We have a strong
female demographic, around 85% of our players are women, and that’s been a
deliberate move on our part. Our players spend more money, are more loyal and
are more open to sharing the game within their friendship groups. All three of those
core metrics, monetization, retention and virility are a huge driver of our success.
Looking at broader industry developments, with services like Google Stadia
we are on the cusp of a significant evolution in the rise of cloud computing
where mobile devices could end up being used for much more sophisticated
gaming experiences. How disruptive do you think this will be for the so-called
casual (mobile) gaming sector?
It will likely make casual games easier to plug into vast networks and become multi-
player by default. This has historically been an arduous task where each develop
re-writes an entire software platform to facilitate real-time social action within their
games. That could send us back to the early days of Facebook games with
FarmVille updates taking over your social feeds or could lead to more innovation
and more interesting co-development between studios that have a similar player
base.
It looks like the mobile game development industry is relatively fragmented.
Can you talk about the benefits of scale in this context? What is the ideal size
for a mobile game developer? And is there any benefit in being part of a
bigger group?
Scale matters. To compete in this market you need a very strong balance sheet to
continuously deploy vast UA budgets until you get to such size that that the network
effects of being able to move your players around your network of games becomes
a material advantage over those still having to purely pay for players.
How do you see the developer/publisher/distributor landscape developing
longer term? Will we see the mobile gaming segment begin to consolidate?
And what form do you think it will likely take — vertical integration
(distribution merging with developer/publishers) or horizontal consolidation
amongst publishers/developers?
In mobile, we’ll start to see the classic studio model deployed, a model successfully
rolled out for years by the TV industry, where a common owner controls a number of
studios each autonomously creating their own games and run as independent
creative endeavors.

© 2019 Citigroup
149
The key to mobile game studios is understanding that it’s all about the people and
the talent, disrupt that and you’ve lost all the goodwill you’ve paid a lot of money for,
so we’ll start to see these common controlled network of studios all share support
services but operate fiercely independent of each other. Tencent do this very well
and its model that will become more prevalent.
The market is dividing into three key groups: the sub $100m companies are all a
tasty snack for the big $1bn+ players, anything between $100 and $500 are largely
orphaned and are finding it very hard and finally the big $1bn+ players are all going
around eating the world.
The key for the small snack sized companies such as Fusebox is to cross the
chasm to become their own $1bn player. It’s a perilous journey; you don’t want to be
stranded half way across but if you do make it, well, wouldn’t it be great to see a
British player emerge to join the elite group of the $1bn+ mobile powerhouses.
© 2019 Citigroup
150
COMPANY NOTES Amazon
Amazon is one of the largest firms in the world. The firm began in Internet retailing.
But, it has expanded into a wide array of adjacent businesses, including gaming.
The major push in gaming began in 2014. That year, Amazon acquired Twitch, a
video game broadcaster, for $970 million. That same year, Amazon acquired Double
Helix, a video game studio.
Double Helix was formed in 2007 after The Collective and Shiny Entertainment
merged. Double Helix developed seven titles including Silent Homecoming (2008),
G.I. Joe: The Rise of Cobra (2009), Front Mission Evolved (2010), Green Lantern:
Rise of Manhunters (2011), Battleship (2012), Killer Instinct (2013), Strider (2014),
and UFOs Love COWs (2014).
In 2018, Chris Hartmann joined Amazon Games. He will lead the entire studio and
marketing organization including development teams in Seattle, Orange County,
and San Diego. Mr. Hartmann spent two decades at Take-Two. And, while he was
there helped develop key video game franchises (NBA 2K, Borderlands, Bioshock,
and Civilization). Currently, Amazon is working on two new titles: New World and
Crucible. In a recent interview, Mr. Hartmann said:
“Between the teams at AGS, the incredible tools and technology from AWS, the
global communities of Twitch and Twitch Prime, and all of the other assets around
Amazon, there are few companies in the world set up to take gaming to the next
level.”
Amazon recently developed a gaming API called GameOn. GameOn is made for
video game developers to integrate competitions, leagues and prizes. The API is
platform agnostic across PCs, consoles, and mobile devices. In 2016, Amazon
created Lumberyard which is a game engine for independent developers.
Lumberyard is still a niche service relative to more established game engines (like
Unity and Ultimate Engine).
Apple
Although Apple is a key hardware (Mac, iPhone) and software player (macOS, iOS),
the firm plays a relatively small role in the broader video game ecosystem. Of
course Apple does operate the Apple App Store. In their app store, Apple collects
30% of any one-time purchase. And, if a consumer subscribes to a service – and
remains a subscriber for a year — the distribution fee drops to 15%. The installed
base of iOS is about 900 million units. And the installed base for Mac is about 100
million units. As such, we suspect Apple is generating the lions’ share of the service
fees from the mobile platform.
Apple recently announced Apple Arcade. The service will allow a user to subscribe
to the arcade and get access to many game titles for a fixed monthly fee. At this
time we don’t know the retail price point of the service. Nor do we know now many
games will be available at launch. But, we don’t expect iconic hit games to be part
of the offering. We expect the service to launch in 2H19. We suspect Apple Arcade
will appeal to casual gamers and families who want to control the content of their
child’s games.
© 2019 Citigroup
151
Aristocrat
Aristocrat is a publicly listed Australian based gaming company. The firm began by
manufacturing slot machines in 1953. In 2017, the firm began to expand into mobile
gaming via M&A. It first acquired Plarium, a mobile game developer. Plarium made
games like Vikings, War of Clans and Sparta. In 2018, the firm acquired Big Fish.
Big Fish published game titles like Gummy Drop, Cooking Craze and Big Fish
Casino. (Previously, Big Fish was owned by Churchill Downs.)
Bandai Namco Entertainment
Bandai is a Japanese video game developer. Best known for developing PacMan
and Tekken game franchises. Owned by Bandai Namco Holdings, a Japanese
entertainment conglomerate. Formerly known as Namco Bandai.
BioWare
A game development studio acquired by EA in 2007. Best known for its
development of Mass Effect, Anthem, and EA’s previous Star Wars titles.
Bluehole
South Korean game developer best known for its development of PlayerUnknown’s
Battlegrounds (PUBG) via its PUBG Corp. subsidiary. Bluehole rolls up to a holding
company called Krafton Game Union. Bluehole is privately held; its second largest
shareholder (after the founder) is understood to be Tencent.
Bungie
An independent game development studio founded in 1991. Best known for its
development of Halo (for Microsoft) and Destiny (for Activision). Acquired by
Microsoft in 2000 and spun out again in 2007. Made news in early 2019 by
announcing a termination of its partnership with Activision on Destiny; Bungie plans
to self-publish future iterations of the game. Bungie has significant equity backing
from NetEase.
Caffeine
Livestreaming platform founded in 2016. Still small relative to other livestreaming
platforms. Founded by former Apple TV programmers with backing from (new) Fox.
Competes with Twitch, Mixer, and UStream (IBM Cloud Video).
Capcom
Japanese video game developer founded in 1979. Best known for development of
Street Fighter and Resident Evil. Publicly traded.
CD Projekt
Polish developer/publisher and owner of GOG.com, the digital distribution platform.
As a developer/publisher, best known for The Witcher 3: Wild Hunt. Also
responsible for development of Cyberpunk 2077 franchise (we expect to be
released in 2020).
© 2019 Citigroup
152
Discord
Owner of a communications software application popular among gamers as well as
a recently-launched online game storefront. Discord’s chat software is popular on
live streaming services like Twitch. In 2018, Discord introduced a digital storefront to
compete with Valve’s Steam and Epic’s Games Store. Initially, Discord’s revenue
split is lower than those of Valve and Epic.
DoubleU Games
DoubleU is publicly listed Korean casino mobile games firm that makes four popular
games for Android and iOS. They include DoubleU Casino, Take 5, Hello Vegas,
and DoubleU Bingo. As games require an in-app purchase but are ad free. DoubleU
Games acquired Double Down Interactive (a subsidiary of International Game
Technology) in 2017 for 2.9x LTM revenue. DDI’s flagship game is DoubleDown
Casino but the firm also has smaller games including Texas Tea, Golden Goddess,
Ultimate Poker, and Firehouse Hounds. The pro forma entity is poised to generate
more revenue than Zynga.
Epic Games
A developer/publisher of video games, the developer of Unreal Engine, and owner
of the Epic Games Store. As a game developer, Epic has been active for nearly 30
years and is best known for Fortnite Battle Royale. As the developer and owner of
Unreal Engine, Epic has provided the architecture upon which many titles (both
independent and publisher-backed) have been written. The Epic Games Store was
opened in late 2018 and competes with Steam. Epic has equity backing from
Tencent and KKR, among others.
GameStop
Retailer that’s traditionally focused on physical game and game
hardware/accessory sales. Has recently made investments in both professional and
amateur eSports initiatives in an effort to diversify its business as physical game
sales have declined. Put itself up for sale last year; announced early in 2019 that no
deal had been struck.
One of the world’s largest firms. A pioneer and key player in Internet search. Google
developed the mobile Android operating system (used on many non-Apple
smartphones). Heavy exposure to the mobile AdTech ecosystem. Firm also owns
YouTube, which is increasingly competing with Amazon’s Twitch and is a significant
player in the cloud ecosystem (competing with Amazon and Microsoft). Recently the
firm announced new cloud gaming platform: Stadia. Google has a significant
number of other material ‘moonshot’ investments: Waymo (driverless cars), Verily,
Calico, etc.
IBM
Tech conglomerate who owns and operates IBM Cloud Video (formerly Ustream),
which it acquired in 2016. IBM Cloud Video is a service that allows users to stream
and host videos and is used in the gaming community to broadcast games and
other content. IBM Cloud Video is a competitor to Twitch.
© 2019 Citigroup
153
Jam City
Jam City is a private mobile games company (formally known as SGN). Popular
titles include Cookie Jam and Jam Juice. The firm recently released Harry Potter:
Hogwarts Mystery which press reports suggest generated 30% of the firm’s total
revenue. The firm is private, but press reports suggested management was
considering an IPO. They recently acquired the mobile games rights for the Peanuts
cartoon series. In 4Q19, the firm also reached an agreement with Disney to license
the firm’s Disney Emoji Blitz characters. Key investors include Netmarble (South
Korean mobile games company) and Jeff Bezos’ Bezos Expeditions.
Kabam
Kabam was a private mobile games company founded in 2006 under the moniker
Watercooler. The firm changed its name in 2010. In 1Q17, Netmarble acquired the
vast majority of the firm. Kabam does still retain some IP.
Konami
Japanese entertainment conglomerate whose holdings include a video game
development studio and publisher. Best known for developing Yu-Gi-Oh, Metal
Gear, and Dance Dance Revolution. Publicly traded.
Microsoft
Microsoft is perhaps the most vertically integrated video game firm in the world. The
firm own IP (Halo), has a game development arm (Xbox Game Studio), a publisher
(343 Industries), controls graphics APIs (DirectX), makes hardware (Xbox),
distributes games (Game Pass), is testing cloud gaming (Project X Cloud) and owns
a game broadcaster (Mixer). Phil Spencer aims to bring Game Pass to every device
(including Android mobile phones) with the Project X Cloud initiative. Moreover, the
firm has begun to invest is more first-party games, albeit on a limited basis. The firm
formed a new studio — called The Initiative — and acquired four studios to help
jumpstart the process: Ninja Theory, PlayGround Games, Undead Labs, and
Compulsion Games.
Modern Times Group
Modern Times Group is a pure play video games business with operations across
eSports and mobile/web gaming. The group started life as a free and pay TV
broadcaster with operations across the Nordic region as well as Central and Easter
Europe. In 2015 the group began to diversify into eSports with the acquisition of
ESL (82% owned) and DreamHack (100%) and in 2016/2017 expanded into
mobile/web games with the acquisitions of Innogames (51%) and Kongregate
(100%). In 2019 the group spun-off its broadcasting business and now operates as
a pure play video games business.
MZ
MZ is a private U.S.-based mobile games company which was founded in 2008.
Previously, the firm was called Addmired and Machine Zone. The firm’s breakout
game is Game of War: Fire Again which was released in 2012. The firm launched
Mobile Strike in 2015. In 2016, MZ partnered with Square Enix to develop Final
Fantasy XV.
© 2019 Citigroup
154
Netmarble
Netmarble is a publicly-listed Korean mobile games company. Key titles include
Lineage 2: Revolution and Seven Knights. The firm tends to focus on massively
multiplayer online role-playing games (MMORPG). But, in 1Q17 it acquired Kabam
(who developed video games for the Marvel franchise, among other games).
NetEase
NetEase is a publicly-listed Chinese Internet company. Around 50% of the firm’s
total revenues come from online games (with the balance from e-commerce, ad
services, email and other services). Key titles include Fantasy Westward Journey,
Onmyoji, New Ghost as well as a number of games licensed from Activision
Blizzard (including Hearthstone).
Niantic
Niantic Labs was started in 2010 as an internal start-up of Google. The firm became
an independent company in 2015 but it is still private. Niantic has made a number of
acquisitions. In 2017, the firm acquired Evertoon, an app that allows consumers to
make short films. In 2018, the firm acquired three firms focused on augmented
reality (AR): Escher Reality, Matrix Mill and DigiLens. Later in 2018, Niantic
acquired Seismic Games, the co-developer of Marvel Strike Force. Niantic also
created Pokémon Go in partnership with Nintendo. Pokémon Go was downloaded
over 750 million times.
Nintendo
Japanese developer/publisher and hardware manufacturer that’s been focused on
gaming since the 1970s. As a developer/publisher, best known for Mario, Zelda, and
Pokémon franchises (Nintendo has partial IP ownership of Pokémon). As a
hardware manufacturer, best known for Nintendo 64, GameCube, Wii, GameBoy,
and Switch. The Switch product has broken ground as a hybrid handheld/console.
Publicly traded.
Nvidia
A manufacturer of electronics components, including semiconductors, that has a
significant presence in the video game market. Its primary gaming products are its
GeForce and Grid graphics processing units (for consoles and cloud gaming,
respectively), which enable real-time 3-D graphics to be displayed. Also produces
Nvidia Shield, a set-top box that facilitates gameplay (via either downloaded or
streamed games).
Oculus Rift
Manufacturer of a virtual reality headset that can be used to play video games. To
play a game using Oculus, the game must support Oculus specifically; the hardware
is used in conjunction with specific software from distributors such as Steam.
Oculus is owned by Facebook (acquired in 2014). Competes with other VR
hardware products such as HTC’s Vive and Sony’s PlayStation VR.
© 2019 Citigroup
155
Playtika
Playtika is a mobile game company owned by Caesars Entertainment. The firm
focuses on social casino games. Titles include Caesars Slots, World Series of
Poker, and Poker Heat. Playtika competes with firms like Aristocrat. But, many
believe Playtika is the market leader in social casino games. In 2016, a consortium
of Chinese firms (led by Giant) agreed to acquire Playtika for $4.4 billion from
Caesars.
Respawn
A game development studio acquired by EA in 2017. Best known for its
development of Titanfall and Apex Legends. Also responsible for the development of
EA’s latest Star Wars adaptation, due for release in 2019.
Riot Games
U.S. video game developer founded in 2006. Best known for developing League of
Legends. In addition to game development, Riot is active in eSports: it operates the
League of Legends competition (in which team franchises and broadcast rights
were sold). Fully acquired by Tencent in 2015.
SciGames
Scientific Games is a U.S. public listed company that focuses on the gaming
business. About 10-15% of the firm’s revenues come from their interactive division.
Notable apps include Jackpot Party Social Casino, Gold Fish Casino Slots, and
Bingo Showdown.
Sega Games
Japanese company whose current activities include developing and publishing
video games. As a publisher, best known for Sonic the Hedgehog. Until 2001, was
also active as a manufacturer of gaming hardware, including consoles. Operates as
a subsidiary of Sega Sammy Holdings.
Slack
Slack is a communications software company whose web chat technology can be
used within video games. Within the context of gaming communications, it
competes with companies like Discord and Vivox (Unity).
Sony
Sony is a Japanese tech-driven entertainment conglomerate. It has been behind the
PlayStation brand console game business for more than two decades now.
Recently it has taken the PlayStation as a platform and expanded it, as the PS Plus,
into a networked business, which has more than 36mn paying subscribers. It is
expanding the franchise still further, with the PS VR virtual reality headsets, the PS
Now cloud game services, and the PS Vue TV broadcasts. Some 20% of game
software is developed in-house and recently Sony has been turning out hits such as
Spider-Man and God of War.
© 2019 Citigroup
156
Square Enix
Japanese game developer founded in 1975. Best known for developing the Final
Fantasy franchise, which has sold >115 copies since 1987. Known to use both
Unreal Engine and Unity Engine for game development in addition to its internal,
proprietary game engines. Has made entrees into the cloud gaming market (with
limited initial success). Publicly traded.
Supercell
Supercell is a publicly-listed Nordic company focused on the mobile games
business. The firm was founded in 2010. In 2013, Softbank bought 51% of
Supercell for about $1.3 billion. Softbank increased its stake to 73% of the firm over
the next few years. In 2016, Tencent acquired 84% of Supercell for $8.6 billion. Key
titles include Clash Royale and Brawl Stars.
Take-Two Interactive
Video game publisher founded in 1993. Best known for developing Grand Theft
Auto and Red Dead at its Rockstar Games studio. Also develops sports titles, such
as NBA 2K.
Tencent
A Chinese tech conglomerate considered to be the world’s largest gaming company.
Has also invested aggressively in Western gaming companies in recent years,
including having acquired or taken equity stakes in Riot Games (fully owned), Epic
Games (minority stake), Activision (minority stake), Ubisoft (minority stake), and
Bluehole (minority stake). Owner of Honor of Kings, the world’s highest-grossing
mobile game, and League of Legends (via Riot). Also active in eSports via the latter
title. On the cloud front, Tencent recently began testing a cloud-based gaming
platform in China with Intel called “Tencent Instant Play”.
Treyarch
A game development studio acquired by Activision in 2001. Best known for its
development of the Call of Duty franchise.
Ubisoft
Ubisoft Entertainment is one of the world’s leading vertically aligned developers,
publishers and distributors of video gaming content for consoles, PCs, smartphones
and tablets in both physical and digital formats. The group’s key franchises, all
developed organically, include Assassin’s Creed, Tom Clancy’s Ghost Recon, Tom
Clancy’s Rainbow Six, Tom Clancy’s The Division, Watch Dogs, For Honor, and The
Crew. The group has a strong market position (about 10% share) within console
and PC gaming in developed Western markets but has a much smaller share
(around 2%) when compared with the broader global video game market, with
significant underweight positions in Asia Pac (by geography) and mobile (by
platform). In 2018, the group signed a long term strategic partnership agreement
with Tencent.
© 2019 Citigroup
157
Unity
A game engine used to power a significant portion (~50%) of games, both in the
mobile and console/PC setting. Especially popular among developers due to
economic arrangement: Unity takes a fixed fee for use of its technology rather than
a split of revenues, as some other engine owners do. Competes with Epic’s Unreal
Engine.
Valve
Valve is a game developer, best known for Counter-Strike and Dota 2. Also
coordinates and operates professional tournaments and match play for both titles.
As owner of Steam, Valve offers a large distribution platform for independent game
developers.
Vivendi (Gameloft)
Vivendi is a publicly traded French company with a diversified collection of media
assets. One of those assets is Gameloft, a video game publisher. Gameloft was
founded in 1999 by one of the five founders of Ubisoft. In 2015, Vivendi acquired a
6% stake in Gameloft. By 2016, Vivendi owned over 95% of in the firm. Popular
Gameloft titles include Asphalt and Gangstar New Orleans OpenWorld.
Vivox
A communications service owned by Unity. Used primarily for text and voice chat
within games. Prominent due to its use in Fortnite, PUBG, and League of Legends.
Competes with Discord’s chat product (among others).
Zynga
Zynga is a publicly listed U.S. company focused on mobile games. FarmVille was
one of the firm’s best known games (which was launched in 2009). Every year, it
seems, Zynga acquires another mobile games entity. Prior acquisitions include
OMGPop (2012), NaturalMotion (2014), Harpan (2017), Peak Games (2017), and
Small Giant Games (2018).

Citi Global Perspectives & Solutions (Citi GPS) is designed to help our clients navigate the global economy’s most demanding challenges, identify future themes and trends, and help our clients profit in a fast-changing and interconnected world. Citi GPS accesses the best elements of our global conversation and harvests the thought leadership of a wide range of senior professionals across the firm.
All Citi GPS reports are available on our website www.citi.com/citigps
Managing Cyber Risk with Human Intelligence A Practical Approach May 2019
Bank X The New New Banks March 2019
2019 Corporate Finance Priorities January 2019
Investment Themes in 2019 January 2019
Car of the Future 4.0 The Race for the Future of Networked Mobility January 2019
China’s Belt and Road Initiative A Progress Report December 2018
Feeding the Future How Innovation and Shifting Consumer Preferences Can Help Feed a Growing Planet November 2018
Migration and the Economy Economic Realities, Social Impact, & Political Choices September 2018
August 2018
Rethinking Single-Use Plastics Responding to a Sea Change in Consumer Behavior August 2018
Disruptive Innovations VI Ten More Things to Stop and Think About August 2018
Putting the Band Back Together Remastering the World of Music August 2018
UN Sustainable Development Goals A Systematic Framework for Aligning Investment June 2018
Electric Vehicles Ready(ing) For Adoption June 2018
ePrivacy and Data Protection Privacy Matters: Navigating the New World of Data Protection May 2018
Sustainable Cities Beacons of Light Against the Shadow of Unplanned Urbanization April 2018
Disruptors at the Gate Strategic M&A for Managing Disruptive Innovation April 2018
The Bank of the Future The ABC’s of Digital Disruption in Finance March 2018
The Public Wealth of Cities How to Turn Around Cities Fortunes by Unlocking Public Assets March 2018
Securing India's Growth Over the Next Decade Twin Pillars of Investment & Productivity February 2018
Investment Themes in 2018 How Much Longer Can the Cycle Run? January 2018
2018 Corporate Finance Priorities January 2018
China Entering a New Political Economy Cycle The World According to Xi Jinping Thought December 2017
Women in the Economy II How Implementing a Women’s Economic Empowerment Agenda Can Shape the Global Economy November 2017
Disruptive Innovations V Ten More Things to Stop and Think About November 2017
Inequality and Prosperity in the Industrialized World Addressing a Growing Challenge September 2017
Technology at Work v3.0 Automating e-Commerce from Click to Pick to Door August 2017
Education: Back to Basics Is Education Fit for the Future July 2017
Solutions for The Global Water Crisis The End of ‘Free and Cheap’ Water April 2017
ePrivacy & Data Protection Who Watches the Watchers? – How Regulation Could Alter the Path of Innovation March 2017
Digital Disruption - Revisited What FinTech VC Investments Tells Us About a Changing Industry January 2017
2017 Corporate Finance Priorities January 2017
2017 Investment Themes A Wind of Change January 2017
Car of the Future v3.0 Mobility 2030 November 2016
Infrastructure for Growth The dawn of a new multi-trillion dollar asset class October 2016

© 2019 Citigroup
160
IMPORTANT DISCLOSURES
This communication has been prepared by Citigroup Global Markets Inc. and is distributed by or through its locally authorised affiliates (collectively, the "Firm") [E6GYB6412478]. This communication is not intended to constitute "research" as that term is defined by applicable regulations. Unless otherwise indicated, any reference to a research report or research recommendation is not intended to represent the whole report and is not in itself considered a recommendation or research report. The views expressed by each author herein are his/ her personal views and do not necessarily reflect the views of his/ her employer or any affiliated entity or the other authors, may differ from the views of other personnel at such entities, and may change without notice. You should assume the following: The Firm may be the issuer of, or may trade as principal in, the financial instruments referred to in this communication or other related financial instruments. The author of this communication may have discussed the information contained herein with others within the Firm and the author and such other Firm personnel may have already acted on the basis of this information (including by trading for the Firm's proprietary accounts or communicating the information contained herein to other customers of the Firm). The Firm performs or seeks to perform investment banking and other services for the issuer of any such financial instruments. The Firm, the Firm's personnel (including those with whom the author may have consulted in the preparation of this communication), and other customers of the Firm may be long or short the financial instruments referred to herein, may have acquired such positions at prices and market conditions that are no longer available, and may have interests different or adverse to your interests. This communication is provided for information and discussion purposes only. It does not constitute an offer or solicitation to purchase or sell any financial instruments. The information contained in this communication is based on generally available information and, although obtained from sources believed by the Firm to be reliable, its accuracy and completeness is not guaranteed. Certain personnel or business areas of the Firm may have access to or have acquired material non-public information that may have an impact (positive or negative) on the information contained herein, but that is not available to or known by the author of this communication. The Firm shall have no liability to the user or to third parties, for the quality, accuracy, timeliness, continued availability or completeness of the data nor for any special, direct, indirect, incidental or consequential loss or damage which may be sustained because of the use of the information in this communication or otherwise arising in connection with this communication, provided that this exclusion of liability shall not exclude or limit any liability under any law or regulation applicable to the Firm that may not be excluded or restricted. The provision of information is not based on your individual circumstances and should not be relied upon as an assessment of suitability for you of a particular product or transaction. Even if we possess information as to your objectives in relation to any transaction, series of transactions or trading strategy, this will not be deemed sufficient for any assessment of suitability for you of any transaction, series of transactions or trading strategy. The Firm is not acting as your advisor, fiduciary or agent and is not managing your account. The information herein does not constitute investment advice and the Firm makes no recommendation as to the suitability of any of the products or transactions mentioned. Any trading or investment decisions you take are in reliance on your own analysis and judgment and/or that of your advisors and not in reliance on us. Therefore, prior to entering into any transaction, you should determine, without reliance on the Firm, the economic risks or merits, as well as the legal, tax and accounting characteristics and consequences of the transaction and that you are able to assume these risks. Financial instruments denominated in a foreign currency are subject to exchange rate fluctuations, which may have an adverse effect on the price or value of an investment in such products. Investments in financial instruments carry significant risk, including the possible loss of the principal amount invested. Investors should obtain advice from their own tax, financial, legal and other advisors, and only make investment decisions on the basis of the investor's own objectives, experience and resources. This communication is not intended to forecast or predict future events. Past performance is not a guarantee or indication of future results. Any prices provided herein (other than those that are identified as being historical) are indicative only and do not represent firm quotes as to either price or size. You should contact your local representative directly if you are interested in buying or selling any financial instrument, or pursuing any trading strategy, mentioned herein. No liability is accepted by the Firm for any loss (whether direct, indirect or consequential) that may arise from any use of the information contained herein or derived herefrom. Although the Firm is affiliated with Citibank, N.A. (together with its subsidiaries and branches worldwide, "Citibank"), you should be aware that none of the other financial instruments mentioned in this communication (unless expressly stated otherwise) are (i) insured by the Federal Deposit Insurance Corporation or any other governmental authority, or (ii) deposits or other obligations of, or guaranteed by, Citibank or any other insured depository institution. This communication contains data compilations, writings and information that are proprietary to the Firm and protected under copyright and other intellectual property laws, and may not be redistributed or otherwise transmitted by you to any other person for any purpose. IRS Circular 230 Disclosure: Citi and its employees are not in the business of providing, and do not provide, tax or legal advice to any taxpayer outside of Citi. Any statements in this Communication to tax matters were not intended or written to be used, and cannot be used or relied upon, by any taxpayer for the purpose of avoiding tax penalties. Any such taxpayer should seek advice based on the taxpayer’s particular circumstances from an independent tax advisor. © 2019 Citigroup Global Markets Inc. Member SIPC. All rights reserved. Citi and Citi and Arc Design are trademarks and service marks of Citigroup Inc. or its affiliates and are used and registered throughout the world.
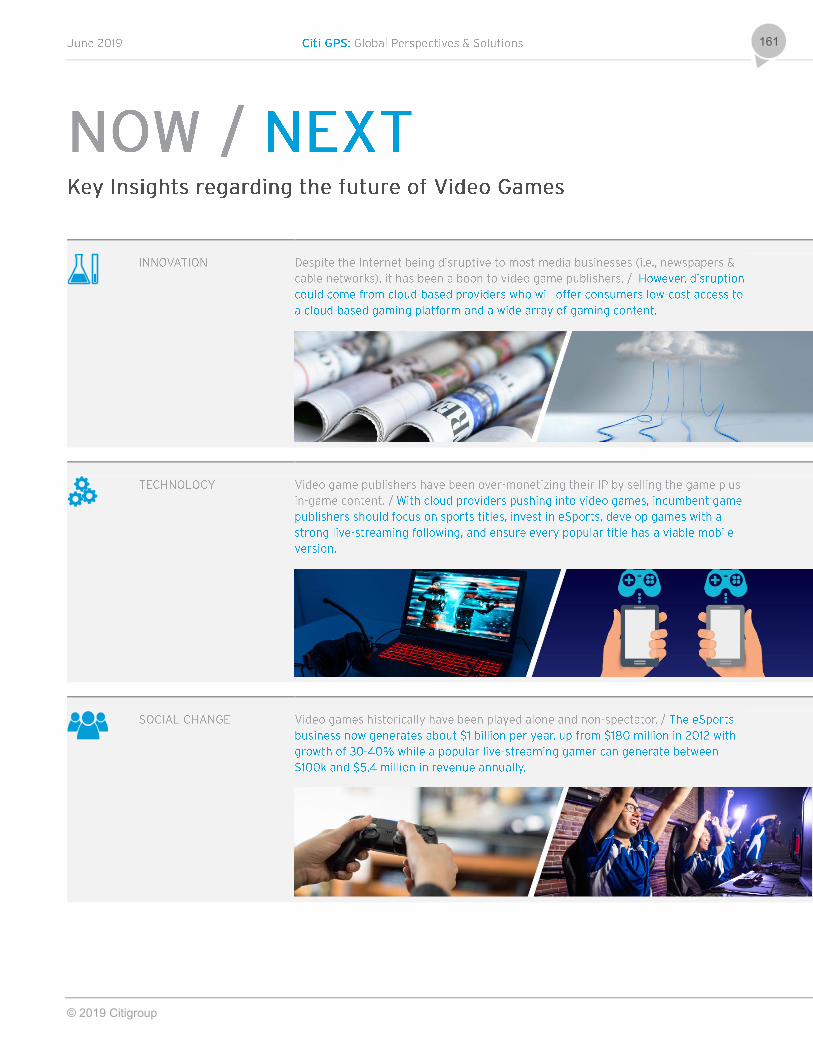
© 2019 Citigroup
161

© 2019 Citigroup
www.citi.com/citigps