VIBRATION ANALYSIS AND MEASUREMENT OF BEAMS ...
143
DOKUZ EYLÜL UNIVERSITY GRADUATE SCHOOL OF NATURAL AND APPLIED SCIENCES VIBRATION ANALYSIS AND MEASUREMENT OF BEAMS HAVING MULTIPLE CRACKS by Kemal MAZANOĞLU January, 2011 İZMİR
-
Upload
khangminh22 -
Category
Documents
-
view
0 -
download
0
Transcript of VIBRATION ANALYSIS AND MEASUREMENT OF BEAMS ...

DOKUZ EYLÜL UNIVERSITY
GRADUATE SCHOOL OF NATURAL AND APPLIED
SCIENCES
VIBRATION ANALYSIS AND MEASUREMENT OF BEAMS HAVING MULTIPLE CRACKS
by
Kemal MAZANOĞLU
January, 2011
İZMİR

VIBRATION ANALYSIS AND MEASUREMENT
OF BEAMS HAVING MULTIPLE CRACKS
A Thesis Submitted to the
Graduate School of Natural and Applied Sciences of Dokuz Eylül University
In Partial Fulfillment of the Requirements for the Degree of Doctor of
Philosophy in Mechanical Engineering, Machine Theory and Dynamics
Program
by
Kemal MAZANOĞLU
January, 2011
İZMİR

Ph.D. THESIS EXAMINATION RESULT FORM
We have read the thesis entitled “VIBRATION ANALYSIS AND
MEASUREMENT OF BEAMS HAVING MULTIPLE CRACKS” completed by
KEMAL MAZANOĞLU under supervision of PROF. DR. MUSTAFA
SABUNCU and we certify that in our opinion it is fully adequate, in scope and in
quality, as a thesis for the degree of Doctor of Philosophy.
Prof. Dr. Mustafa SABUNCU
Supervisor
Prof. Dr. Hira KARAGÜLLE Assist. Prof. Dr. Gülden KÖKTÜRK
Thesis Committee Member Thesis Committee Member
Prof. Dr. Eres SÖYLEMEZ Assoc. Prof. Dr. Zeki KIRAL
Examining Committee Member Examining Committee Member
Prof. Dr. Mustafa SABUNCU Director
Graduate School of Natural and Applied Sciences
ii

ACKNOWLEDGMENTS
I would like firstly to thank my supervisor, Prof. Dr. Mustafa SABUNCU, for his
guidance throughout the doctorate study. This thesis cannot be completed without his
valuable supports and positive criticisms.
I am sincerely grateful to Prof. Dr. Hira KARAGÜLLE and Assist. Prof. Dr.
Gülden KÖKTÜRK for their valuable suggestions and discussions in periodical
meetings of the thesis.
I would also like to express my appreciation to Scientific Research Projects
Council of the Dokuz Eylül University for their support with the project number:
2008.KB.FEN.014.
My thanks also extent to Prof. Dr. İsa YEŞİLYURT and Assist. Prof. Dr. Hasan
ÖZTÜRK for their helps and useful advices. I would also like to send my thanks to
my other colleagues for their morality supports.
Finally, I wish to send my appreciation to my dear family for their
encouragements and patience through this study.
Kemal MAZANOĞLU
iii

VIBRATION ANALYSIS AND MEASUREMENT OF BEAMS HAVING
MULTIPLE CRACKS
ABSTRACT
Vibration based methods are widespread through the non-destructive methods for
detection and identification of cracks in mechanical and structural systems including
beam type elements. The methods are effective since any damage leads to changes in
vibration characteristics that are easily measured. However, identification of cracks
can be more difficult for general beam elements having several complexities.
This thesis presents continuous methods for flexural vibration analyses of multiple
cracked beams and detection methods for single and double cracked beams.
Vibration of beams are analysed with different geometric, boundary, and crack
properties. Vibration analyses of the beams having multiple transverse cracks,
multiple height-edge cracks, and asymmetric double edge cracks are all presented.
Both open and breathing crack models are considered. Energy based numerical
solution method is used in the analyses by describing the energies consumed caused
by each crack. Interactions between the crack effects are also described.
Contour lines representing natural frequency ratios are employed for detecting
single crack. As a contribution to current literature addressing the inverse problems,
a frequency based algorithm is developed for detection of double cracks. An
automated single and double crack detection system is established by using
theoretical and measured natural frequencies. In measurement, stable natural
frequencies are obtained by means of a statistical approach (RSZF) using an
interpolation technique (DASI). Direct and inverse methods presented in this thesis
simplify the crack detection, are convenient for different structures, ideal for
automation, and require low process time, memory and disc capacity.
Keywords : Multiple cracked beams, flexural vibration, energy used continuous
solution, crack detection, natural frequency contour lines, RSZF, DASI.
iv

ÇOK ÇATLAKLI ÇUBUKLARIN TİTREŞİM ANALİZİ VE ÖLÇÜMÜ
ÖZ
Titreşim esaslı metotlar, çubuk tipi elemanlar içeren mekanik ve yapısal
sistemlerdeki çatlakların tespit edilmesi ve tanımlanması için kullanılan tahribatsız
metotlar arasında yaygındır. Bu metotlar, her hasarın kolaylıkla ölçülen titreşim
karakteristiklerinde değişimlere neden olmasından dolayı etkilidirler. Fakat, çeşitli
karmaşıklıklara sahip genel çubuk elemanları için çatlakların tanımlanması daha zor
olabilir.
Bu tez çok çatlaklı çubukların eğilme titreşim analizleri için sürekli metotlar ile
birlikte tek ve çift çatlaklı çubuklar için tespit metotlarını sunmaktadır. Çubukların
titreşimi farklı geometri sınır ve çatlak koşulları ile analiz edilmiştir. Çoklu dik
çatlaklara, çoklu yan kenar çatlaklarına ve asimetrik çift taraflı çatlaklara sahip
çubukların titreşim analizleri gösterilmiştir. Açık ve nefes alan çatlak modellerinin
ikisi de incelenmiştir. Analizler içinde her çatlağın sebep olduğu enerji yutumları
tanımlanarak enerji esaslı nümerik çözüm metodu kullanılmıştır. Çatlak etkileri
arasındaki etkileşimler ayrıca tanımlanmıştır.
Tek çatlağın tespiti için doğal frekans oranlarını gösteren kontur çizgileri
kullanılmıştır. Şu anki ters problemleri işaret eden literatüre katkı olarak, iki çatlağın
tespiti için frekans esaslı bir algoritma geliştirilmiştir. Teorik ve ölçülen frekansları
kullanarak bir otomatik tek ve çift çatlak tespit sistemi kurulmuştur. Ölçümde,
değişmeyen doğal frekanslar bir interpolasyon tekniği (DASI) kullanan bir istatistik
yaklaşım (RSZF) yardımıyla elde edilmiştir. Bu tezde sunulan direk ve ters metotlar
çatlak tespitini basitleştirirler, farklı yapılar için uygundurlar, otomasyon için
idealdirler ve düşük işlem zamanı, hafıza ve disk kapasitesi gerektirirler.
Anahtar sözcükler : Çok çatlaklı çubuklar, eğilme titreşimi, enerji kullanan sürekli
çözüm, çatlak tespiti, doğal frekans kontur çizgileri, RSZF, DASI.
v

CONTENTS
Page
Ph.D. THESIS EXAMINATION RESULT FORM ..................................................ii
ACKNOWLEDGMENTS ........................................................................................iii
ABSTRACT.............................................................................................................. iv
ÖZ .............................................................................................................................. v
CHAPTER ONE – INTRODUCTION .................................................................. 1
1.1 Introduction ..................................................................................................... 1
1.2 Aims and Objectives ....................................................................................... 2
1.3 Thesis Organisation......................................................................................... 3
CHAPTER TWO – LITERATURE REVIEW ..................................................... 5
2.1 Introduction ..................................................................................................... 5
2.2 Cracked Beam Vibration Analysis .................................................................. 5
2.3 Crack Modelling.............................................................................................. 9
2.4 Crack Detection............................................................................................. 12
2.4.1 Frequency Based Methods..................................................................... 12
2.4.2 Mode Shape Based Methods ................................................................. 15
2.4.3 Other Methods ....................................................................................... 17
CHAPTER THREE – CONTINUOUS APPROACHES FOR FLEXURAL
VIBRATION OF THE BEAMS WITH ADDITIONAL MASSES AND
MULTIPLE CRACKS .......................................................................................... 19
3.1 Introduction ................................................................................................... 19
3.2 Flexural Vibration of Un-cracked Beams ..................................................... 19
3.2.1 Analytical Solution ................................................................................ 20
vi

3.2.2 Numerical Solution................................................................................ 21
3.3 Flexural Vibration of the Beams with Additional Masses ............................ 22
3.3.1 Analytical Solution Using Lumped Mass Model .................................. 22
3.3.2 Numerical Solution Using Solid Mass Model ....................................... 24
3.4 Flexural Vibration of the Beams with Multiple Cracks ................................ 25
3.4.1 Analytical Solution Using Local Flexibility Model .............................. 25
3.4.2 Numerical Solution Using Continuous Flexibility Model..................... 27
3.5 Results and Discussions ................................................................................ 30
3.5.1 Case Study: A Fixed–Fixed Beam with a Mass .................................... 30
3.6 Conclusion..................................................................................................... 34
CHAPTER FOUR – FLEXURAL VIBRATION ANALYSIS OF NON-
UNIFORM BEAMS WITH MULTIPLE TRANSVERSE CRACKS .............. 36
4.1 Introduction ................................................................................................... 36
4.2 Vibration of the Beams with a Crack ............................................................ 36
4.3 Energy Balance in Multiple Cracked Beams ................................................ 40
4.4 Results and Discussion.................................................................................. 42
4.4.1 Example 1: Tapered Beams with a Crack.............................................. 44
4.4.2 Example 2: Tapered Beam with Two Cracks ........................................ 45
4.4.3 Example 3: Tapered Beam with Four Cracks........................................ 48
4.5 Conclusion..................................................................................................... 51
CHAPTER FIVE – FLEXURAL VIBRATION ANALYSIS OF NON-
UNIFORM BEAMS WITH MULTIPLE CRACKS ON UNUSUAL EDGE...53
5.1 Introduction ................................................................................................... 53
5.2 Theoretical Explanations............................................................................... 54
5.3 Energy Balance in Beam with Multiple Height-Edge Cracks....................... 58
5.4 Results and Discussion.................................................................................. 61
5.4.1 Example 1: Tapered Cantilever Beams with a Crack............................ 63
5.4.2 Example 2: Tapered Fixed–Fixed Beam with a Crack.......................... 66
vii

5.4.3 Example 3: Tapered Cantilever and Fixed–Fixed Beams with Two
Cracks..................................................................................................... 68
5.4.4 Example 4: Tapered Cantilever Beam with Three Cracks .................... 71
5.5 Conclusion..................................................................................................... 71
CHAPTER SIX – FLEXURAL VIBRATION ANALYSIS OF NON-
UNIFORM BEAMS HAVING DOUBLE-EDGE BREATHING CRACKS....74
6.1 Introduction ................................................................................................... 74
6.2 Vibration of Beams with a Single-Edge and Double-Edge Crack ................ 75
6.3 Results and Discussion.................................................................................. 83
6.4 Conclusion..................................................................................................... 89
CHAPTER SEVEN – A FREQUENCY BASED ALGORITHM FOR
DETECTING DOUBLE CRACKS ON THE BEAM VIA A STATISTICAL
APPROACH USED IN EXPERIMENT.............................................................. 92
7.1 Introduction ................................................................................................... 92
7.2 Algorithm for Detecting Double Cracks ....................................................... 93
7.3 Processes for Obtaining the Best Frequency Ratios in Measurement........... 97
7.4 Results and Discussion.................................................................................. 99
7.5 Conclusion................................................................................................... 109
CHAPTER EIGHT – CONCLUSIONS............................................................. 111
8.1 General Contributions of the Thesis............................................................ 111
8.2 Overview of the Conclusions ...................................................................... 112
8.3 Scopes for the Future Works ....................................................................... 115
REFERENCES..................................................................................................... 117
APPENDICES ...................................................................................................... 130
viii

CHAPTER ONE
INTRODUCTION
1.1 Introduction
Mechanical systems or their structures frequently employ beam type elements
which have to resist physical or chemical loading effects such as impacts, fatigues,
corrosions, welds, etc. All these influences can result in flaws that lead to change of
the dynamic behaviour of the structures. The most common damage type is the
fatigue crack in beam shaped mechanical or structural elements under dynamic
loading. Understanding the vibration effects of cracks enables their recognition in
practical applications of vibration monitoring. Therefore, the vibration identification
of cracked beams has been universally interested by many researchers.
Exact identification of dynamic behaviours is significant for the success of
vibration based crack identification methods which are supported by the theoretical
vibration models. Crack identification methods on direct use of several practical
applications of measurements and vibration monitoring may not need a theoretical
vibration model. These methods are generally based on the inspection of mode shape
changes and need measurements with very high quality which use expensive data
acquisition and monitoring systems having the properties such as multiple sensors,
high sensitivity, large hard disc capacity, and fast processing. Ideal system settled for
the crack identification should be inexpensive, non-invasive and automated, so that
subjective operator differences are avoided.
This doctorate thesis study presents direct and inverse methods for multiple crack
identification based on flexural vibrations of the beams. Motivation of the thesis is
shaped according to lacks observed by the literature review presented in the
following chapter. A global continuous approach valid for the beams having different
geometric, boundary and crack properties has not been presented yet. Multiple
cracked beams are not frequently considered. In addition, any multiple crack
detection method has not been proposed yet by using only the natural frequency
1

2
contours. This is significant lack for crack detection since natural frequency is the
most effortlessly measured modal parameter and contour lines of natural frequency
ratios can be the most simple observation technique.
1.2 Aims and Objectives
This thesis has two general aims to achieve.
First objective is to develop a general vibration analysis method including a crack
modelling for multiple cracked beams. Proposed method should be adoptable for
different physical and boundary conditions of beams and different crack types. The
specifications such as accurate results, short solution time, and convenience for
inverse methods are also aimed for achievements of the developed analysis method.
Instead of finite element based approaches, function based continuous approaches
including analytical and numerical solution methods are investigated due to their
advantage of short solution time.
Secondly, it is aimed to develop a crack detection method for multiple cracked
beams. The method should be non-invasive, robust, and convenient for automation. It
should need minimum numbers of parameters and data samples to use in experiment.
Parameters should be easily measured. Therefore, methods based on natural
frequency changes are investigated instead of the methods using mode shape control.
Flexural vibration frequencies are used due to their easy observation through the low
frequency band in measurement. To develop processes resulting in maximum data
quality with minimum samples is also aimed for increasing the success of the crack
detection method in applications.
3
1.3 Thesis Organisation
This thesis is divided into eight chapters summarised as follows:
Chapter 1 discusses the importance of using continuous approaches in cracked
beams vibration analyses and using crack detection methods which are simple,
effective, accurate and automated as much as possible. Aims and objectives are given
for determining the scope of the thesis.
Chapter 2 gives comprehensive review of the studies presented in existing
literature. So many studies about the cracked beam vibration analysis, crack
modelling, and crack detection are mentioned in the separate sections.
Chapter 3 introduces the vibration analysis of the un-cracked beams and presents
continuous methods for the beams with multiple cracks and additional masses.
Vibration effects of cracks modelled by rotational springs are investigated by the
analytical and numerical methods employing local and continuous flexibility models
respectively. While additional masses are modelled by lumped masses in the
analytical solution, they are considered as solid in the energy used numerical
solution.
Chapter 4 presents the vibration analysis of multiple cracked non-uniform Euler–
Bernoulli beams using the distributions of the energies consumed caused by the
transverse open cracks. A rotational spring model is used for describing the energy
consumed that is equal to total strain change distributed along the beam length. In the
cases of multiple cracks, the energy consumed caused by one crack varies with the
influence of other cracks.
Chapter 5 presents a vibration analysis of non-uniform Euler–Bernoulli beams
having multiple height-edge open cracks. Change of the strain energy distribution
given for the transverse cracks is modified for height-edge cracks. If the beam has

4
multiple cracks, it is assumed that the strain disturbance caused by one of the cracks
is damped as much as the depth ratio of the other cracks at their locations.
Chapter 6 presents a method for the flexural vibration of non-uniform Rayleigh
beams having double-edge transverse cracks which are symmetric or asymmetric
around the central layer of the beam’s height. The breathing crack models are
employed. Distribution of the energy changes along the beam length is determined
by taking the effects of tensile and compressive stress fields into account. Effects of
neutral axis deviations are also included in the model.
Chapter 7 presents an algorithm for identification of double cracks in beams and
the processes minimising the measurement errors in experiment. Theoretical natural
frequency prediction tables prepared by using the single cracked beam model are
employed in crack detection. Single cracks are identified by plotting frequency
contour lines. Double cracks are detected by the algorithm that searches convenient
position pairs over the frequency map. Measurement sensitivity of the experimental
data is increased by presented process including a statistical approach and an
interpolation technique.
Chapter 8 gives general contributions of the thesis, overview of the specific
conclusions, and scopes for the future works.

CHAPTER TWO
LITERATURE REVIEW
2.1 Introduction
Comprehensive review of the previous studies is presented here for the vibration
analysis of cracked beams and detection of the cracks. Overviews of the methods
examining the changes in dynamic behaviours and measured vibration responses to
detect, locate, and characterise damage are given by Dimarogonas (1996) and
Doebling, Farrar, & Prime (1998). Specifically, effects of structural damages on
natural frequencies and crack identification methods based on the frequencies are
summarised by Salawu (1997). Sabnavis, Kirk, Kasarda, & Quinn (2004) summarise
the studies presented for detection of the cracks. Good overview for vibration based
condition monitoring techniques used in time, frequency or modal domains are
presented by Carden & Fanning (2004). More recently, Yan, Cheng, Wu, & Yam
(2007) review the developments in modern-type crack detection methods such as
wavelet, genetic algorithms, and neural networks in addition to the traditional
methods. The papers presented for multiple crack effects and identification methods
are reviewed by Sekhar (2008). The papers including the crack modelling approaches
based on fracture mechanics are reviewed by Papadopoulos (2008).
In literature, presented methods can be considered under main titles as cracked
beam vibration analysis, crack modelling, and crack detection.
2.2 Cracked Beam Vibration Analysis
Structures can be damaged by various external or internal influences such as
impacts, fatigues, corrosions and welds. All these influences can result in flaws that
lead to change of the dynamic behaviour of the structures. The most common
damage type for beam shaped mechanical or structural elements under dynamic
loading is the fatigue crack. Understanding the vibration effects of cracks is critically
significant for recognising cracks in practical applications of vibration monitoring. In
5

6
the literature, vibration analyses of the cracked beams are inspected both analytically
and numerically.
Bending vibration of an un-cracked uniform beam is simply analysed by well
known continuous solution method. In the method, singular values are determined
for the matrix including the terms of the equation set obtained by deflection, slope,
moment, and shear changes along the beam. Sinusoidal and hyperbolic sinusoidal
terms of the equation set satisfying the boundary conditions at the two ends of the
beam form the matrix. When the cracks exist, terms of the 4 new equations
obtained from continuity and compatibility conditions are added into the matrix for
each crack location. At result, cracks cause
44×
n ( )14 +n equations. Matrix size and
accordingly solution time undesirably increase as the number of cracks increases. It
should also be noted that to construct the linear system by using this method for a
general case of n cracks is not a simple task. This should be the main reason for
which cases of just one crack (Dado, 1997; Nandwana & Maiti, 1997a; Rizos,
Aspragathos, & Dimaragonas, 1990) and two cracks (Douka, Bamnios, & Trochidis,
2004; Ostachowicz & Krawczuk, 1991) are considered in the literature.
Consequently, this method is not so convenient for the vibration analyses of the
multiple cracked beams. Shifrin & Ruotolo (1999) extend this base method by using
equations for analysing the vibration of the beams with n cracks. 2+n
Solution of the equation set can also be simplified by the analytical transfer matrix
method that contributes the analyses of the cracked beams by reducing the size of the
matrix. Lin (2004) uses this method for the analyses of the single cracked beams.
However, advantage of the analytical transfer matrix method comes into existence
when the multiple cracked beams are considered as given in the studies of Khiem &
Lien (2001, 2004), Lin, Chang, & Wu (2002), Patil & Maiti (2003), and Tsai &
Wang (1997). Fernandez-Saez & Navarro (2002) presents another analytical
approach including the eigenvalue problems formulated by closed-form expressions
for the successive lower bounds of the fundamental frequency. Matveev &
Bovsunovsky (2002) and Mei, Karpenko, Moody, & Allen (2006) present some other
analytical approaches for flexural vibration analysis of the beams.

7
It should be noted that analytical solution is very difficult for the non-uniform
beams due to the geometric nonlinearities causing nonlinear equations. Therefore,
limited number of studies is presented for the analytical solution of non-uniform
beams. Li (2001, 2002) presents an approach that is used for determining natural
frequencies and mode shapes of cracked stepped beams having varying cross-section
and cracked non-uniform beams having concentrated masses. However, only some
specific forms of non-uniformities can be dealt with in these papers. Analytical
methods also suffer from the lack of the fact that the stress field induced by the crack
is decaying with the distance from the crack.
Some researchers take into account the exponentially decaying effects of
strain/stress fields due to cracks. These effects also cause the nonlinearities and
require different approaches in solution. The energy used methods, employing
exponentially decaying stress/strain functions based on a variational principle, are
proposed to develop and solve vibration equations for these continuous models.
Chondros, Dimarogonas, & Yao (1998, 2001) and Chondros (2001) use the
variational formulation to develop the differential equation and boundary conditions
of single-edge and double-edge cracked beams as one dimensional continuum. The
differential equation and associated boundary conditions for a nominally uniform
Euler–Bernoulli beam containing one or more pairs of symmetric cracks are derived
by Christides & Barr (1984). Shen & Pierre (1994) solve the varying energy
distribution problem for single cracked beams by using many termed Galerkin’s
method. Carneiro & Inman (2001) review this paper by modifying the derivation of
the equation of motion in order to overcome the lack of self-adjointness. Another
approach based on the stiffness definition of cracked beams using strain energy
variation around the crack is proposed by Yang, Swamidas, & Seshadri (2001), for
single and double cracked beams. The case where two or more cracks lie in close
proximity to each other is not analysed in this study. All these approaches suffer
from the overlap of exponential functions when the multiple cracks interact with
each other. An approach for defining interaction of strain disturbances is presented
by Mazanoglu, Yesilyurt, & Sabuncu (2009) on the first three flexural vibration

8
modes of multiple cracked non-uniform beams. The Rayleigh–Ritz approximation
method is used in solution. Interaction of strain disturbances presented for transverse
cracks is then modified for cracks on unusual edge of an Euler–Bernoulli beam
(Mazanoglu & Sabuncu, 2010a) and for asymmetric double-edge breathing cracks on
the Rayleigh beam (Mazanoglu & Sabuncu, 2010b).
Except for the methods based on a variational principle, some other methods are
also presented for the vibration analysis of cracked beams. Fernandez-Saez, Rubio,
& Navarro (1999) describe the transverse deflection of the cracked beam by adding
the polynomial functions to the deflection of the un-cracked beam. With this new
admissible function, which satisfies the boundary and kinematic conditions, and by
using the Rayleigh method, fundamental frequency is obtained. Chaudhari & Maiti
(1999, 2000) propose a method for defining transverse vibrations of tapered beams
and geometrically segmented slender beams with a single crack using the Frobenius
technique. Even though the beams have a single crack, their results are quite coarse.
An approach, which uses modified Fourier series, is developed by Zheng & Fan
(2001) for computing natural frequencies of a non-uniform beam with arbitrary
number of cracks. A semi-analytical model for nonlinear vibrations based on an
extension of the Rayleigh–Ritz method is presented by El Bikri, Benemar, &
Bennouna (2006). The results, which are mainly influenced by the choice of the
admissible functions, are restricted with a single crack and fundamental frequency.
Many of the other approaches are based upon the finite element methods.
Gounaris & Dimarogonas (1988) and Papaeconomou & Dimarogonas (1989)
construct the special cracked element for the vibration of the cracked beam. They
develop a compliance matrix for the behaviour of the beam in the vicinity of the
crack. Mohiuddin & Khulief (1998) develop a finite element model for a tapered
rotating cracked shaft. Yokoyama & Chen (1998) present the matrix equation for free
vibrations of the cracked beam that is constructed from the basic standard beam
elements combined with the modified line–spring model. Zheng & Kessissoglou
(2004) describe an overall additional flexibility instead of the local additional
flexibility for adding into the flexibility matrix of the corresponding intact beam

9
element. Kisa & Gurel (2006, 2007) present a numerical model that combines the
finite element and component mode synthesis methods for the modal analysis of
multi-cracked beams and single cracked stepped beams with circular cross-section.
Tabarraei & Sukumar (2008) present the extended finite element method for mesh
independent modelling of the discontinuous fields like cracks. Use of the finite
element methods to solve the forward problem of crack identification is presented by
numerous researches (Dharmaraju, Tiwari, & Talukdar, 2004; Lee, 2009a; Lee,
2009b; Orhan, 2007; Ozturk, Karaagac, & Sabuncu, 2009; Yuen, 1985). Finite
element models may be preferable since they can be applicable for any structural
members. However, there are so many parameters that can be varied in flexural
vibration of structural members with cracks that it would be very difficult to present
and compare results for all cases. Parameters may vary mainly with modelling of the
crack and meshing properties. Indiscriminate application of the frequencies
calculated using the finite element methods, without consideration of the
assumptions under which the crack models are derived, might lead to gross errors.
On the other hand, careful observation of the behaviour of these damage models can
lead to extension of their utility in practical engineering. Behaviour of the damages
can be observed by the special element or connection models. If the FEM includes no
special models for the cracks, method should be supported by extremely refined
meshes near the cracks for an accurate solution even though the computation time
increases.
2.3 Crack Modelling
In the literature, researchers use several crack models for describing the effects of
crack on dynamic behaviour of the beam. In general, there exist three basic crack
models, namely the equivalent reduced section model, the local flexibility model
from the fracture mechanics and the continuous crack flexibility model. Most studies
include the local flexibility model which use massless rotational spring or locally
reduced cross-section. Magnitudes of the flexibility changes are estimated by the
theoretical and experimental outputs of fracture mechanics (Sih, 1973; Tada, Paris, &
Erwin,1973).

10
In most papers, parts of the beam separated by the cracks are connected by using
rotational springs providing compatibility and continuity conditions at the crack
locations. The effect of rotational spring is considered as the effect of hinge causing
local flexibility between two parts of the beam. This model can be used in the
fundamental solution of the cracked uniform beams, (Dado, 1997; Douka, Bamnios,
& Trochidis, 2004; Ostachowicz & Krawczuk, 1991; Nandwana & Maiti, 1997a;
Rizos, Aspragathos, & Dimaragonas, 1990; Chang & Chen, 2005) and analytical
transfer matrix method (Khiem & Lien, 2001, 2004; Patil & Maiti, 2003). The papers
presented by Chaudhari & Maiti (1999, 2000), Fernandez-Saez & Navarro (2002),
Khiem & Lien, (2002), Lee (2009b), Morassi & Rollo (2001), Yang, Chen, Xiang, &
Jia (2008) can be selected throughout many other studies that use rotational spring
model in their solution methods for identifying local flexibility effects of crack on
vibration. Similarly, Yokoyama & Chen (1998) present line-spring crack model used
especially in the finite element based solutions. In the continuous crack flexibility
models, crack caused additional flexibility effects are distributed along the beams
with exponentially decaying functions. The energy change or the additional
flexibility calculated by fracture mechanics formulations are distributed along the
beam based on a variational principle presented by Carneiro & Inman (2001),
Chondros, Dimarogonas, & Yao (1998, 2001), Chondros (2001), Christides & Barr
(1984), Hu & Liang (1993), Shen & Pierre (1994). Another distribution function is
proposed by Yang, Swamidas, & Seshadri (2001) when the beam is under the effect
of only additional strain. Mazanoglu, Yesilyurt, & Sabuncu (2009) modify the
distribution function for multiple cracked beams. The energy consumed calculated
from the fracture mechanics is verified by means of rotational spring located at the
crack tip and is modified by additional rotational spring corresponding to the effects
of stress fields near the crack tip. The formulations written for the energy consumed
and its distribution form are revised for the height-edge cracks (Mazanoglu &
Sabuncu, 2010a) and double-edge cracks (Mazanoglu & Sabuncu, 2010b).
In literature, cracks are also considered with two models that assume the cracks
always open or breathing in time. The nonlinear effect of a breathing crack on the

11
flexural vibration of cracked structures is discussed in some papers (Cheng, Wu,
Wallace, & Swamidas, 1999; Chondros, Dimarogonas, & Yao, 2001; Friswell &
Penny, 2002; Luzzato, 2003; Matveev & Bovsunovsky, 2002; Qian, Gu, & Jiang,
1990). Mazanoglu & Sabuncu (2010b) combine the open and breathing cracks in the
same model. The difference of solutions between the open and breathing crack
models is quite small when the amplitude is not so large, and the difference becomes
large as the amplitude increased. Thus, most researchers assume the crack remains
open in their models to simplify the problem by ignoring nonlinear influences.
However, it is clear that there exists frequency modulation caused by the strain/stress
difference during the breathing of crack. Therefore, some researchers investigate this
effect in measured data by means of several crack detection techniques (Douka &
Hadjileontiadis, 2005; Loutridis, Douka, & Hadjileontiadis, 2005; Prabhakar, Sekhar,
& Mohanty, 2001; Pugno, Surace, & Ruotolo, 2000; Saavedra & Cuitino, 2002;
Sekhar, 2003).
Different crack models classified according to the position and propagation
characteristics. Most of the researchers present vibration analysis of a beam with
transverse edge crack which is the most critical in respect of fracture of the beam.
Vibration effects of the transverse double edge cracks with symmetric depths are also
investigated (Al-Said, 2007; Al-Said, Naji, & Al-Shukry, 2006; Chondros,
Dimaragonas, & Yao, 1998; Christides & Barr, 1984; Lin, 2004; Ostachowicz &
Krawczuk, 1991). In addition, Mazanoglu & Sabuncu (2010b) present a model for
the symmetric and asymmetric double-edge cracks that is also true for the single-
edge cracks. The cracks on the unusual surface of the beam, called height-edge
cracks, are also modelled by Mazanoglu & Sabuncu (2010a). Nandwana & Maiti
(1997a) investigate the vibration of the beams with inclined edge or internal cracks.
Fracture mechanics formulations for many different cases of the cracks are given by
Tada, Paris, & Irwin (1973). Different crack cases can also be considered by means
of advanced mesh techniques. Extended finite element meshing procedure developed
by Tabarraei & Sukumar (2008) is shown on the examples of double-edge crack and
inclined central crack.

12
2.4 Crack Detection
Numerous methods and approaches are presented for detection and identification
of cracks. In many cases, exact identification of the changes in dynamic behaviour is
significant for the success of vibration based crack identification methods which are
supported by the theoretical vibration models. Contrarily, crack identification
methods based on direct use of several practical applications of measurements and
vibration monitoring sometimes may not need a theoretical vibration model. These
methods are generally based on the inspection of mode shape changes and need
measurements with very high quality which use expensive data acquisition and
monitoring systems having the properties such as multiple sensors, high sensitivity,
large hard disc capacity, and fast processing. Ideal system settled for the crack
identification should be inexpensive, non-invasive and automated, so that subjective
operator differences are avoided.
In the literature, cracks are identified by observing the changes in modal
parameters like natural frequencies and mode shapes. These variations can be
detected by means of several monitoring systems that use signal processing
techniques or algorithms. In very rare cases, previously modelling of the system may
not be required for crack detection in non-model based approaches. Crack detection
methods proposed in the literature are summarised here by considering them under
subtitles of frequency based methods, mode shape based methods, and other
methods.
2.4.1 Frequency Based Methods
Natural frequencies and frequency spectra of any system directly represent
characteristic vibration behaviour of that system. Changes in frequency parameters
can easily be observed in measurements without the requirement of extended
measuring systems. Therefore, crack detection methods based on natural frequencies
are the most popularly proposed and used by the researchers.

13
The majority of studies are related with the identification of single transverse
crack in a beam using the lowest three natural frequencies represented in the
frequency contour graph. Liang, Choy, & Hu (1991) propose that the location and
the size of a crack can be identified through finding the intersection point of three
frequency contour lines. The scheme is adapted to the crack detection in stepped
beams (Nandwana & Maiti, 1997b), geometrically segmented beams (Chaudhari &
Maiti, 2000) and truncated wedged beams (Chinchalkar, 2001). Chen, He, & Xiang
(2005) present an experimental detection of single crack using frequency contour
lines of the first three vibration modes. Measurement errors are minimised by means
of the method of zoom fast Fourier transform which improves the frequency
resolution. Yang, Swamidas, & Seshadri (2001) also use the frequency contours for
crack identification. Owolabi, Swamidas, & Seshadri (2003) report the damage
detection schemes depending on the measuring changes in the first three natural
frequencies and the corresponding amplitudes of the frequency response functions. It
is also suggested that two measurements are sufficient to detect a crack in a beam.
Dado (1997) presents a comprehensive algorithm, which uses the lowest two natural
frequencies as inputs, for detection of a crack in beams under different end
conditions. Kim & Stubbs (2003) and Kim, Ryu, Cho, & Stubbs (2003) present a
crack detection algorithm to locate and size cracks in beam type structures using a
few natural frequencies. Lin (2004) determines the crack location and its sectional
flexibility by measuring any two natural frequencies used in characteristic equation.
The crack size is then computed by using the relationship between the sectional
flexibility and the crack size. Dharmaraju, Tiwari, & Talukdar (2004) develop a
general identification algorithm to estimate crack flexibility coefficients and the
crack depth based on the force-response information. The general identification
algorithm is extended to overcome practical limitations of measuring with a few
degrees of freedom. The static reduction scheme is incorporated into the
identification algorithm for reducing the number of response measurements. Al-Said
(2007) proposes a crack identification technique, which uses shift of first three
natural frequencies, for stepped cantilever beam carrying a rigid disk at its tip. In
many cases, the theoretical natural frequencies do not exactly intersect with the
frequencies observed in measurement. Therefore, the zero-setting procedure is

14
recommended and thus results are shown by frequency falling ratios. In experiment,
natural frequency shifts are generally obtained by the spectral investigation of the
frequency response function.
Another frequency used method, called mechanical impedance, is based upon
spatial or spectral investigation of anti-resonance frequencies in experiments. Zeros
of frequency response functions, where the output velocities have peak values, are
known as anti-resonance frequencies. Prabhakar, Sekhar, & Mohanty (2001) suggest
the measurement of mechanical impedance for crack detection and condition
monitoring of rotor-bearing systems. Bamnios, Douka, & Trochidis (2002)
analytically and experimentally investigate the influence of transverse open crack on
the mechanical impedance of cracked beams under various boundary conditions.
Dilena & Morassi (2004) deal with the identification of single open crack using the
method based on measurements of damage-induced shifts in natural frequencies and
anti-resonant frequencies. Dilena & Morassi (2005) also present the same method for
identification of a single defect in a discrete beam–like system with lumped masses.
However, experiments of Dharmaraju & Sinha (2005) conducted on a free–free beam
show that sharp slope change cannot be observed through the change of first anti-
resonance frequencies obtained as a function of measuring location.
In consideration of the papers presented for the multiple cracks, although most of
studies address the forward problem, some of the papers present also the multiple
crack detection methods using the knowledge of dynamic response of the beam.
Simultaneous detection of location and size of multiple cracks in a beam is much
more involved and complex than the detection of single crack. A frequency
measurement based method that combines the vibration modelling through transfer
matrix method and the approach given by Hu & Liang (1993) is presented by Patil &
Maiti (2003) for detection of multiple open cracks. Khiem & Lien (2004) apply the
dynamic stiffness matrix method to detect multiple cracks in beams using natural
frequencies. A diagnostic technique, which uses the changes of first three natural
frequencies, is presented by Morassi & Rollo (2001) for a simply supported beam
with two cracks having equal severity. Douka, Bamnios, & Trochidis (2004) use the

15
anti-resonance changes, complementary with natural frequency changes, in a
prediction scheme for crack identification in double crack beams. Chen, Zi, Li, & He
(2006) propose dynamic mesh-refinement method, which sets the relationship
between the natural frequency ratios and crack parameters, for identification of
multiple cracks. Lee (2009a) presents a simple method for detecting n cracks using
2n natural frequencies by means of the finite element and the Newton–Raphson
methods. Detailed review of the studies presented for solving forward and inverse
problem of the vibration based identification of multiple cracks are given by Sekhar
(2008). The use of contour graphs for detecting multiple cracks has not been
presented yet.
2.4.2 Mode Shape Based Methods
Mode shape is the other significant modal parameter changing with existence of
the damages. When technical and procedural requirements in measurements are
considered, investigation of the mode shape changes is much more difficult than the
frequency based techniques. However, if these requirements are provided, mode
shape changes supported by the powerful signal processing techniques can be
successful indicators of the damages.
In literature, many studies are presented for crack detection by using the changes
in mode shapes or their derivatives without the use of any advanced processing
techniques. West (1984) presents possibly the first systematic use of mode shape
information for the location of structural damage without the use of prior finite
element model. The mode shapes are partitioned using various schemes, and the
change in modal assurance criteria across the different partitioning techniques is used
to localise the structural damage. Rizos, Asparagathos, & Dimarogonas (1990)
identify the depth and location of a crack by observing the mode shape of the
structure from the measured amplitudes. Pandey, Biswas, & Samman (1991)
demonstrate that absolute changes in mode shape curvature can be a good indicator
of damage for the finite element beam structures they considered. Farrar & Jauregui
(1998) compare the changes in properties such as the flexibility or stiffness matrices
16
derived from measured modal properties and changes in mode shape curvature for
locating structural damage. Ratcliffe (1997) proposes a damage detection method
that uses modified Laplacian operator on mode shape data. Narayana & Jeberaj
(1999) present a new technique for locating crack using a few vibration mode shapes
of a beam and one of the modal parameters that changes globally. Matveev &
Bovsunowsky (2002) develop the algorithm of consecutive calculation of cracked
beam mode shapes amplitudes, to investigate the regularities of mode shapes and to
study the non-linear distortion level of displacement. Kim et al. (2003) formulate a
damage index algorithm to identify damage from monitoring changes in modal strain
energy.
In recent years, spatial investigation of mode shape changes is considered together
with the advanced processing techniques. Many of them are based on the spatial
wavelet analyses. Initial studies for crack identification with the application of
wavelet theory in spatial domain are presented by Liew & Wang (1998), Quek,
Wang, Zhang, & Ang (2001) and Angelo & Arcangelo (2003). In the paper presented
by Rucka & Wilde (2006), the theory is applied to the deflected beam whose
deflection rate is continuously obtained by the support of image processing.
However, crack depth cannot be estimated in these papers. Douka, Loutridis, &
Trochidis (2003) analyse the fundamental vibration mode of a cracked cantilever
beam using continuous wavelet transform in spatial domain and estimate both
location and size of the crack. An intensity factor is defined to relate size of the crack
with the coefficients of the wavelet transform. Lam, Lee, Sun, Cheng, & Guo (2005)
estimate the location and extend of a crack on the obstruction area where vibration
responses are not available. Presented crack detection method for partially obstructed
beams is developed from the spatial wavelet transform and the Bayesian approach.
Chang & Chen (2005) and Chasalevris & Papadopoulos (2006) present methods that
combine the spatial wavelet analysis to find the locations of multiple cracks and
natural frequency changes to find the severity of the cracks. Similarly, multiple
cracks on stepped beams are located by wavelet analysis in the paper of Zhang,
Wang, & Ma (2009). Based on the identified crack locations, a simple transform

17
matrix method requiring only the first two tested natural frequencies is used to
identify the crack depths.
Hadjileontiadis, Douka, & Trochidis (2005a) estimate the location and size of the
crack by analysing the fundamental vibration mode with fractal dimension measure.
They also analyse the modal changes by using kurtosis values obtained from the
vibration data taken along the beam (Hadjileontiadis, Douka, & Trochidis, 2005b).
2.4.3 Other Methods
Investigation of the changes in damping parameter due to cracks does not pay
attention among the researchers. In early years, a few studies are presented to test the
variation characteristics of damping parameter as a result of crack propagation.
Morgan & Osterle (1985) propose probably first damping based method which
employs an abnormal increase in damping coefficients, suggesting more energy
dissipation, can indicate damage in the structure as observed experimentally in most
cases.
Time–frequency analyses are also presented for identifying the presence of a
crack. In the paper of Sekhar (2003), wavelet is applied to the time data taken from
selected position of a rotor. A model based wavelet approach is proposed for online
identification of a crack in a rotor while it is passing through its flexural critical
speed. Douka & Hadjileontiadis (2005) reveal the nonlinear behaviour of the system
by using time–frequency methods as an alternative to Fourier analysis methodology.
They utilise from empirical mode decomposition, Hilbert transform and
instantaneous frequency methods in crack detection. Zhu & Law (2006) estimate the
locations and depths of the cracks by wavelet analysis of the data taken from single
measuring point. However, spatial changes of the wavelet coefficients are obtained
by means of load moving along the beam. Leonard (2007) uses phase and frequency
spectrograms to directly obtain the breathing effects of crack causing nonlinear
vibration.
18
In the last two decades, genetic algorithms have been recognised as promising
intelligent search techniques for difficult optimization problems. Genetic algorithms
are stochastic search techniques based on the mechanism of natural selection and
natural evolution. Mares & Surace (1996) employ a genetic algorithm to identify
damage in elastic structures. Solution procedures employing genetic algorithms by
means of the results obtained by the finite element model are proposed for detecting
multiple cracks in beams (Ruotolo & Surace, 1997) and for detecting shaft crack in
rotor–bearing system (He, Guo, & Chu, 2001). Krawczuk (2002) uses the wave
propagation approach combined with a genetic algorithm for damage detection in
beam–like structures. In recent years, Vakil-Baghmisheh, Peimani, Sadeghi, &
Ettefagh (2008) present a method employing an analytical model and a genetic
algorithm to monitor the possible changes in the natural frequencies of the cantilever
beam.
Lee (2009b) presents a simple method to identify multiple cracks in a beam using
vibration amplitudes. The inverse problem is solved iteratively for the crack
locations and sizes using the Newton–Raphson method and the singular value
decomposition method. An iterative neural network technique is proposed by Chang,
C.C., Chang, T.Y.P., Xu, & Wang (2000) for structural damage detection. Mahmoud
& Kiefa (1999) propose a neural network, which uses six natural frequencies as
inputs, for detecting crack size and crack location. Suresh, Omkar, Ganguli, & Mani
(2004) use less number of modal frequencies to train a neural network for identifying
both the location and depth of a crack. A statistical neural network is proposed by
Wang & He (2007) to detect the crack through measuring the reductions of natural
frequencies.

CHAPTER THREE
CONTINUOUS APPROACHES FOR FLEXURAL VIBRATION OF THE
BEAMS WITH ADDITIONAL MASSES AND MULTIPLE CRACKS
3.1 Introduction
This chapter presents the methods for continuous vibration analyses of multiple
cracked beams. Vibration of the beam with additional masses is also considered as a
specific case of the beam. First of all, the theories of analytical and energy based
numerical solution methods are explained for the flexural vibration of beams without
crack. Many components such as discs, gears, etc. can be considered as additional
masses on the beams when they have the effect that is not negligible on vibrations.
Therefore, the theories are expanded to cover the vibration of beams with additional
masses. Lumped and solid mass models are employed in analytical and numerical
solution methods respectively. Cracks are modelled by rotational springs describing
the flexibility changes locally and continuously. Local and continuous flexibility
models are used in the analytical and numerical solution methods respectively.
Convenient flexibility changing functions are presented for both models.
Results of the methods are compared with the results of a commercial finite
element program. Efficiencies of all methods are discussed on fixed-fixed beam with
an additional mass. Vibration effects of the additional mass, one crack, and two
cracks are presented on the results of methods considered. Good agreements are
observed between the results of the methods employed.
3.2 Flexural Vibration of Un-cracked Beams
Free bending vibration of a uniform beam is identified by following differential
equation.
0),(),(2
2
4
4
=∂
∂+
∂∂
ttzwA
ztzwEI ρ , (3.1)
19

20
where, E, I, and ρ represent elasticity module, area moment of inertia, and density
respectively. Flexural displacement is symbolised by w, and variables z, t are the
position along the beam length and time respectively. Exact analytical method or
approximate numerical methods can be employed for the solution of Equation (3.1).
3.2.1 Analytical Solution
In analytical solution, Equation (3.1) is separated into independent variables of w
and t. Frequency parameter, which depends upon the natural frequency, can be
written as:
42
EIAωρβ = , (3.2)
which is located into following solution form of uniform beam.
zCzCzCzCzW ββββ sinhcoshsincos)( 4321 +++= . (3.3)
1C , , , and are the coefficients of harmonic and hyperbolic terms in the
mode shape function, . Linear algebraic equation set is formed by using mode
shape and its derivatives corresponding to slope, moment, and shear force. Each
function should satisfy the boundary conditions such as fixed, free, and pinned. For
fixed end, displacement and slope should be zero. Contrarily, moment and shear
force are equated to zero for free end. There is no displacement and moment near the
pinned joint. Four functions are obtained by using the conditions at two ends.
2C 3C 4C
)(zW
β
values causing singularity in 44× matrix, which is formed by harmonic and
hyperbolic terms of functions, are found.

21
3.2.2 Numerical Solution
Vibration problem of beams can also be solved approximately by using the energy
based approaches such as Rayleigh and Rayleigh–Ritz methods. These methods are
based on the principle of energy conservation which dictates the maximum values of
potential and kinetic energies should be equal.
0=− KEPE , (3.4)
where, and PE KE represent maximums of potential and kinetic energies that can
be formulated for Euler–Bernoulli beams as follow:
dzdz
zWdzEIPEL
z∫=
⎟⎟⎠
⎞⎜⎜⎝
⎛=
0
2
2
2 )()(21 , (3.5)
( ) dzzWzAKEL
z∫=
=0
22 )()(21 ωρ . (3.6)
Formulation of maximum kinetic energy is modified for the Rayleigh beams,
which take into account the effect of rotary inertia around the axis perpendicular to
the bending plane, as follows:
( ) dzdz
zdWzIdzzWzAKEL
z
L
z∫∫==
⎟⎠⎞
⎜⎝⎛+=
0
22
0
22 )()(21)()(
21 ωρωρ . (3.7)
If jκ is defined as the coefficient of admissible mode shape function, the
derivatives of Equation (3.4) or those of Rayleigh quotient derived from Equation
(3.4) should be equal to zero.
( ) 0=∂−∂ jKEPE κ . (3.8)

22
If )(zjχ are a series of functions satisfying the end conditions, the mode shape
function can be written as:
∑=
=m
jjj zzW
1
)()( χκ . (3.9)
The functions, )(zjχ , are given in Table 3.1 for several end conditions. The
natural frequencies can be found by minimising the determinant of the matrix, which
is formed by the derivatives of function series, obtained from Equation (3.8).
Table 3.1 The functions satisfying several end conditions.
End conditions )(zjχ
Fixed-Fixed ( ) ( )21 1 LzLz j −+
Pinned-Pinned ( ) ( )LzLz j −1
Fixed-Free ( ) ( ) 12 1 −− jLzLz
Fixed-Pinned ( ) ( )LzLz j −+ 11
3.3 Flexural Vibration of the Beams with Additional Masses
3.3.1 Analytical Solution Using Lumped Mass Model
In simplified analytical solution, additional masses can be modelled using lumped
masses as shown in Figure 3.1. Effects of additional masses are contributed into
beam’s vibration by describing compatibility and continuity conditions at their
locations. Displacements and slopes are assumed equal at just left and right sides of
lumped masses.
)()( 1 zWzW ii += ,
nizWzW ii ,....,1)(')(' 1 == + . (3.10)
23
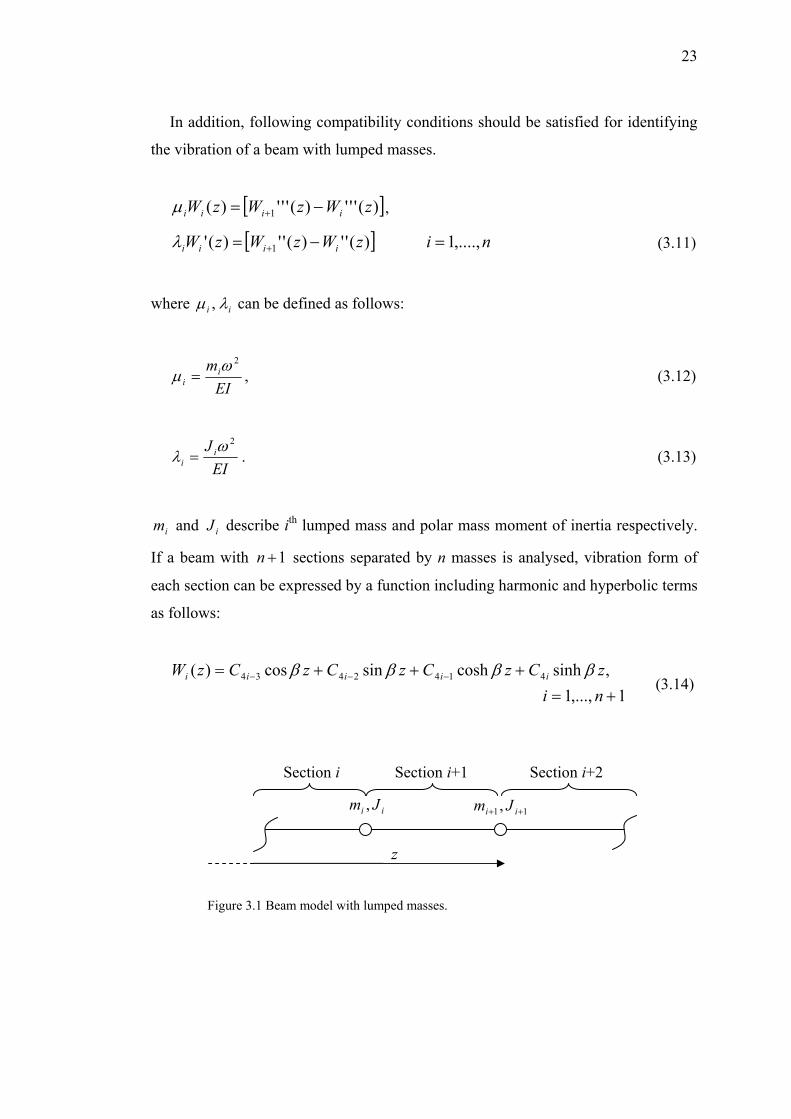
In addition, following compatibility conditions should be satisfied for identifying
the vibration of a beam with lumped masses.
[ ])(''')(''')( 1 zWzWzW iiii −= +µ ,
[ ] nizWzWzW iiii ,....,1)('')('')(' 1 =−= +λ (3.11)
where ii λµ , can be defined as follows:
EImi
i
2ωµ = , (3.12)
EIJ i
i
2ωλ = . (3.13)
im and describe iiJ th lumped mass and polar mass moment of inertia respectively.
If a beam with sections separated by n masses is analysed, vibration form of
each section can be expressed by a function including harmonic and hyperbolic terms
as follows:
1+n
1,...,1,sinhcoshsincos)( 4142434
+=+++= −−−
nizCzCzCzCzW iiiii ββββ
(3.14)
Section i
Figure 3.1 Beam model with lumped masses.
z
Section i+1 Section i+2
ii Jm , 11, ++ ii Jm

24
As a result, totally four boundaries at two ends, and four boundaries at each mass
location give functions. Zero determinant of the matrix obtained by harmonic
and hyperbolic terms of the functions gives the frequency parameter,
44 +n
β .
3.3.2 Numerical Solution Using Solid Mass Model
In more realistic model, the additional masses can be considered with thicknesses
as shown in Figure 3.2. In this case, the problem can be solved by one of the energy
used numerical methods. In the method, following equation representing the kinetic
effects of the additional masses is contributed into the kinetic energy expressions
given in Equations (3.6) and (3.7).
( ) ∫∫+
−
+
−
⎟⎠⎞
⎜⎝⎛+=
2)())((
2)())((
22
)()(
2)())((
2)())((
22)()()(
)()()()(
itimz
itimz
imim
itimz
itimz
imimim dzdz
zdWzIdzzWzAKE ωρωρ
ni ,....,1= (3.15)
)1()1(
)1(
, ++
+
imim
im
IA
ρ
)()(
)(
, imim
im
IA
ρ
1+it hit
)(imz )1( +imz z
Figure 3.2 Beam model with additional masses having thickness.
If the additional masses are the parts of the beam or joined into the beams by
powerful welding, minor changes in potential energy caused by the additional stress
fields around the masses can also be considered. These stress fields decaying with
the distance from the masses should be described by a function. Unless, this decaying
function is described, using a few termed deflection function in the energy methods
can result in deficient approximation due to the instantaneous potential energy

25
change. The issue of stress fields caused by the additional masses, which stays out of
the scope of this research, is not investigated. In many cases, the additional stress
fields due to the additional masses remain minor. In these cases, potential effects of
the additional masses can be neglected for simplicity.
3.4 Flexural Vibration of the Beams with Multiple Cracks
3.4.1 Analytical Solution Using Local Flexibility Model
In general analytical approaches, cracks are modelled by rotational springs, which
are joints of the sections separated by the cracks, as shown in Figure 3.3. Existence
of n cracks requires the expression of n local flexibility changes for connecting n+1
sections. Vibration form of each section can be expressed by harmonic and
hyperbolic terms that are represented by the function written in Equation (3.3).
Continuity at the crack location is provided by the continuity conditions come
through with negligible effects of crack width. Deflection, bending moment and
shear force are assumed to be equal at right hand and left hand sides of the crack as
follow:
)()( 1 zWzW ii += ,
)('')('' 1 zWzW ii += ,
)(''')(''' 1 zWzW ii += , ni ,....,1= . (3.16)
In addition, compatibility condition relates bending moment with the difference of
slopes between both sides of the crack as represented in following equation:
[ ])(')(')('' 1 zWzWzW iiii −= +α , ni ,....,1= . (3.17)
α is the parameter related with stiffness that defined as follows:

26
EIki
i =α , (3.18)
where represents the local rotational stiffness caused by iik th crack, and it is
described by the fracture mechanics theory.
1+ic ic
Figure 3.3 Multiple cracked beam with rotational spring crack model.
Local stiffness of the cracked beam has been explained by two common
formulations in the literature. One of them is presented in the studies of Dado (1997),
Douka, Bamnios, & Trochidis (2004), Li (2001), Rizos, Aspragathos, &
Dimaragonas (1990), and Shifrin & Ruotolo (1999). The other formulation possibly
presented by Ostachowicz & Krawczuk (1991) at first and employed in the studies of
Chaudhari & Maiti (2000), Chen, He, & Xiang (2005), Lin (2004), Nandwana &
Maiti (1997a) is given as follows:
)(72
2
ii af
Ebhkπ
= , (3.19)
where, b and h symbolise width and depth of the beam respectively. is called
as flexibility compliance function of i
)( iafth crack that is formulated as follows:
z
1+iaiah
Section i
ik 1+ik
Section i+2 Section i+1

27
876
5432
4909.23324.7553.7
1773.57201.3035.16384.0)(
⎟⎠⎞
⎜⎝⎛+⎟
⎠⎞
⎜⎝⎛−⎟
⎠⎞
⎜⎝⎛+
⎟⎠⎞
⎜⎝⎛−⎟
⎠⎞
⎜⎝⎛+⎟
⎠⎞
⎜⎝⎛−⎟
⎠⎞
⎜⎝⎛=
ha
ha
ha
ha
ha
ha
ha
af
iii
iiiii
(3.20)
As a result, the equation set having size, 44 +n , is formed by 4n equations of
continuity and compatibility conditions and 4 equations of the end conditions. Matrix
shaped by harmonic and hyperbolic terms of the equation set must be singular for
determining natural frequencies.
3.4.2 Numerical Solution Using Continuous Flexibility Model
In continuous flexibility model, flexibility change caused by the crack is described
as exponentially decaying strain change distributed along the beam. Energy
correspond of this strain change is used in solution. The energy change due to crack
opening can be balanced as the energy stored by a rotational spring located at the
crack tip or a linear spring located at the crack mouth as shown in Figure 3.4. Since
there is no spring in reality, the energy stored by the spring model is lost somewhere
and is called ‘the energy consumed’. Fracture mechanics theory describes the change
of structural strain/stress energies with crack growth (Sih, 1973). The strain stored
due to a crack is determined by means of the stress intensity factor for the Mode I
crack and thus strain energy release rate. Clapeyron’s Theorem states that only half
of the work done by the external moment is stored as strain/stress energy when a
crack exists on a beam. The remaining half is the energy consumed by the crack that
can be formulated as follows:
2)()( czMaDCEU ==∆ , (3.21)
where, is the bending moment at the crack location of beam that is
formulated as:
)( czM

28
2
2 )()(')(
dzzWd
zIEzM ccc = . (3.22)
'E is replaced by E for plane stress, or ( )21 ν−E for plane strain. is the
coefficient defined by the following equation for a strained beam having a transverse
crack:
)(aD
4
22)(18)(cchEb
aaFaD π= , (3.23)
In Equation (3.23), is the function given for )(aF 6.0/ ≤cha as follows:
( ) ( ) ( ) ( )432 /14/8.13/33.7/4.112.1)( cccc hahahahaaF +−+−= . (3.24)
Figure 3.4 Spring models for the crack opening.
The crack opening results in additional angular displacement of the beam causing
also tensile stresses in the vicinity of crack tips. The energy of the tensile stress can
be considered as the energy of the rotational spring model located at the un-stretched
side of the beam as shown in Figure 3.4. When this effect is considered, the energy
)(θck
)(uck
)(φck
M M

29
consumed is determined by taking the difference between the energy effects of the
crack opening and tensile stress caused by the bending of the beam. In this case, the
coefficient is found as follows (Mazanoglu, Yesilyurt, & Sabuncu, 2009): )(aD
( )ccc
hahEb
aaFaD /1)(18)( 4
22
−=π . (3.25)
The energy consumed is distributed along the beam as follows (Yang, Swamidas,
& Seshadri, 2001):
( ) ( )[ ]2)(1),(
aaqzzzaQ
c
cCE
−+=Γ , (3.26)
where and are the terms which can be defined as follow (Yang,
Swamidas, & Seshadri, 2001);
),( czaQ )(aq
[ ]( ) ( )[ ] ( )[{ }]aaqzaaqzLaaq
zMaDzaQ
cc
cc )(arctan)(arctan)(
)()(),(
2
+−= , (3.27)
[ ] ( )( )( ) ccc
c
hahhaahaF
aq 33
32)(3)(
−−
−=
π. (3.28)
If a crack exists on a beam, since the work is done by using the available
maximum potential energy, the energy consumed results in a decrease of maximum
potential energy with the assumption that there is no mass loss at the crack location.
In this case, Equation (3.4) is modified by contributing the energy consumed as
follows:
( )( )∫=
=Γ−Γ−ΓL
z
KECEPE dz0
0 (3.29)

30
Natural frequencies or mode shapes of cracked beams can be determined by using
Equation (3.29) in one of the energy used numerical methods. In the cases of
multiple cracks, stress/strain disturbances caused by different cracks are interacted
with each other. When the cracks have reasonable distance from each other,
interaction effect remains minor due to the exponentially decaying distribution form
of the energy consumed. Since the cracks in close distance are not analysed in this
chapter, interaction of consumed energies caused by different cracks is explained in
the following chapters.
3.5 Results and Discussion
Vibration of the beams with additional masses are analysed by both the analytical
and numerical methods considered and the commercial finite element program
(ANSYS©). Comparative study between the methods is also carried out for multiple
cracked beams with an additional mass. In the finite element program, cracks are
considered as slots which are formed by subtracting thin transverse blocks from the
“solid95” beam. Element size is set to 0.005 m with the “esize” command, and crack
widths are chosen as 0.0004 m. The “solid95” block is used for modelling additional
mass attached to the beam. Smaller element size requirements in the vicinity of
discontinuous regions are provided by the “smrtsize,1” command, and free meshing
procedures are applied. Finite element model of the beam is shown in Appendix B,
Figure B.1. Natural frequencies are obtained by using the analysis type called “modal
analysis” in the program. Changes in the element number caused by the variation of
crack location and crack size, have negligible effects on the results.
3.5.1 Case Study: A Fixed–Fixed Beam with a Mass
A fixed–fixed steel beam is considered with the additional mass at the central
location of the beam. Cross-section of the beam, having length 60 cm, is square with
edge dimensions of 10 mm. Steel rectangular mass, with 30 mm edge dimensions
and 10 mm thickness, symmetrically encloses the beam. Properties of steel material

31
are taken as: density 3mkg7800=ρ , modulus of elasticity , and
Poisson ratio .
GPa210=E
3.0=v
Natural frequencies of the un-cracked uniform beam and the beam with additional
mass are given in Table 3.2. Results of the analytical method and the Rayleigh–Ritz
method employing the deflection function with six terms are compared with results
of the finite element program. All methods give close values for the uniform beam.
However, when the results obtained for the beam with additional mass are compared,
it is seen that the Rayleigh–Ritz method employing solid mass model gives results
better than the analytical method employing lumped mass model. Since a thin beam
is used in the analysis, there are very small differences between the results of the
Euler–Bernoulli and Rayleigh beam models.
Table 3.2 Natural frequencies of beam models obtained by several analysis methods.
Beam model Analysis methods First mode natural
frequency (Hz)
Second mode natural
frequency (Hz)
Analytical method 148.156 408.398 Uniform Euler–
Bernoulli beam Rayleigh–Ritz
method 148.156 408.398
Uniform Rayleigh beam Rayleigh–Ritz
method 148.135 408.180
Uniform finite element
beam
The finite element
program 148.174 407.467
Beam with additional
lumped mass Analytical method 126.05 409.003
Euler–Bernoulli beam
with additional solid
mass
Rayleigh–Ritz
method 130.130 407.516
Rayleigh beam with
additional solid mass
Rayleigh–Ritz
method 130.115 407.300
Finite element beam
with additional solid
mass
The finite element
program 129.420 406.586

32
If the vibration of the beam is analysed by simulating a transverse crack, natural
frequencies fall down as one would expect. Analysis is repeated by considering the
crack at different locations with the depth ratio of 0.3. Resulting natural frequency
ratios obtained by the local flexibility model used in the analytical solution, the
continuous flexibility model used in the Rayleigh–Ritz method, and the finite
element model used in the commercial program are given in Figure 3.5. Results show
that the methods in consideration present good agreement with each other. Small
deviations are obtained near the additional mass and fixed end.
( zc / L )
( ωc / ω
o )
( b )
( a )
Figure 3.5 Natural frequency ratios for the ( a ) first and ( b ) second mode vibrations of
the beam with variably located single crack having depth ratio of 0.3. Results of ( * ) the
Ansys©, ( o ) analytical solution, and ( –― ) Rayleigh–Ritz approximation.
Methods are also comparatively examined by considering the beam with two
cracks. One of the cracks is simulated at the normalised location, 0.45, with the depth
ratio, 0.3, and the other crack, moved along second half of the beam, is considered
with the depth ratio of 0.2. Cracks are not considered in the same side of the
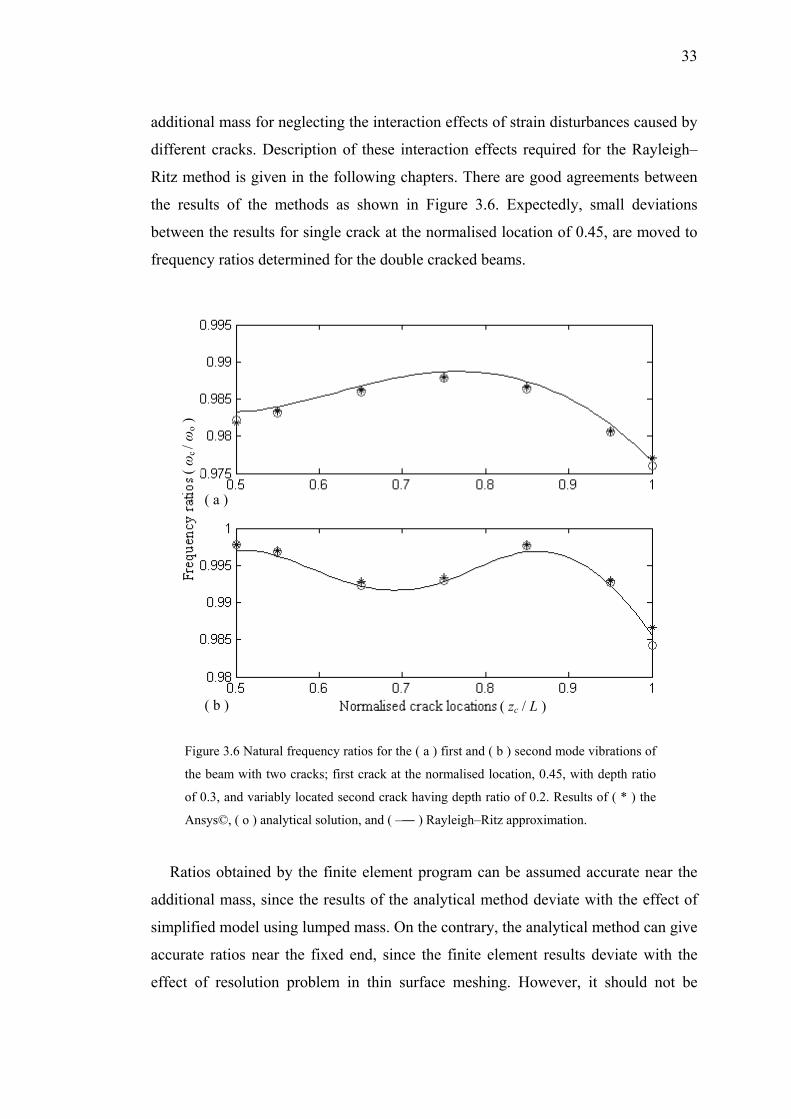
33
additional mass for neglecting the interaction effects of strain disturbances caused by
different cracks. Description of these interaction effects required for the Rayleigh–
Ritz method is given in the following chapters. There are good agreements between
the results of the methods as shown in Figure 3.6. Expectedly, small deviations
between the results for single crack at the normalised location of 0.45, are moved to
frequency ratios determined for the double cracked beams.
( zc / L )
( ωc / ω
o )
( a )
( b )
Figure 3.6 Natural frequency ratios for the ( a ) first and ( b ) second mode vibrations of
the beam with two cracks; first crack at the normalised location, 0.45, with depth ratio
of 0.3, and variably located second crack having depth ratio of 0.2. Results of ( * ) the
Ansys©, ( o ) analytical solution, and ( –― ) Rayleigh–Ritz approximation.
Ratios obtained by the finite element program can be assumed accurate near the
additional mass, since the results of the analytical method deviate with the effect of
simplified model using lumped mass. On the contrary, the analytical method can give
accurate ratios near the fixed end, since the finite element results deviate with the
effect of resolution problem in thin surface meshing. However, it should not be

34
forgotten that, errors in analytical solution for the vibration of un-cracked beams with
lumped mass are moved to solution of the cracked beams. This means, although the
local flexibility model presents well identification for flexibility change caused by
the crack, analytical solution method requires additional flexibility identifications for
other discontinuities like additional masses or steps on the beams. The Rayleigh–Ritz
method also needs identifying flexibility changes in distributed form for providing
continuity along the beam. But, results are quite satisfactory even if the additional
mass caused stress fields are not considered. Small differences can be decreased
more with the use of deflection function including higher number of terms.
In analytical solution, matrix size increases for each discontinuity requiring
compatibility and continuity condition to describe. In example, vibration of a double
cracked beam with a mass is analytically solved by finding singular values of 1616×
matrix. As the matrix size increases, determining singular values will be
difficult and will take more process time. However, vibration of that beam is
analysed by using deflection function with 6 terms resulting in use of 66× matrix in
the numerical solution. Therefore, analytical solution with local flexibi model can
only be convenient for uniform beams with a few numbers of cracks.
more
lity
3.6 Conclusion
this chapter, the methods for continuous vibration analyses of the multiple
cra
vibration analysis of the beam with additional mass, it is observed that error of
the analytical method employing lumped mass model is larger than that of the
In
cked beams with the additional masses are presented. Lumped and solid mass
models are employed in analytical and numerical solution methods respectively.
Cracks are modelled by rotational springs describing the flexibility changes locally in
analytical method and continuously in the energy method. Results of the methods are
compared with the results of a commercial finite element program. Efficiencies of all
methods are discussed on fixed–fixed beams. Good agreements are observed
between the results of the methods.
In
35
nu
sing deflection
function with a few terms even if the beams have multiple discontinuities including
cra
separated by the commonly used rotational spring
model. Because, flexibility change is modelled by using only one rotational spring
loc
convenient for the analyses of uniform beams with a few numbers of cracks. It is
alm
merical method employing solid mass model. Description of the additional
stiffness caused by the additional mass cannot be avoided for the analytical solution
especially when the thickness of mass increases. However, the energy method gives
quite satisfactory result without the use of additional stiffness model.
Low mode vibrations of beams are successfully analysed by u
cks and additional masses. However, number of terms in deflection function used
for the analytical solution increases with each discontinuity. Normally, using more
terms in deflection function causes larger matrix which requires more solution time
for finding its singular values.
Types of the cracks are not
ated at the centre of beam. This needs the explanation of flexibility change for
each different type of cracks. On the other hand, as will be shown in the following
chapters, crack types can be identified by the rotational springs located at crack tips.
It is seen that, analytical method with local flexibility model can only be
ost impossible to analyse vibration of non-uniform beams by using analytical
method. On the contrary, the energy method can be successfully used in different
conditions of beam shaped structures. Therefore, energy used numerical solution is
proposed in this thesis and it is employed in following chapters for non-uniform
beams with different types of cracks.

CHAPTER FOUR
FLEXURAL VIBRATION ANALYSIS OF NON-UNIFORM BEAMS WITH
MULTIPLE TRANSVERSE CRACKS
This chapter is reorganization of the paper published as “VIBRATION
ANALYSIS OF MULTIPLE CRACKED NON-UNIFORM BEAMS” in Journal of
Sound and Vibration (Mazanoglu, Yesilyurt, & Sabuncu, 2009).
4.1 Introduction
Flaws in the components of a structure can influence upon the dynamic behaviour
of the whole structure. It is well known from the literature that one form of damage
that can lead to catastrophic failure if undetected is transverse cracking of the
structure elements. The recognition of the vibration effects of cracks is important in
practise since vibration monitoring has revealed a great potential for investigation of
cracks in the last three decades.
This chapter presents the vibration analysis of multiple cracked non-uniform
beams using the distributions of the energies consumed caused by the transverse
open cracks. The energy consumed is obtained by the change of the strain energy
distribution given by Yang, Swamidas, & Seshadri (2001) for cracked surface of the
beam together with the effect of stress field due to the angular displacement of the
beam. The energy consumed is also determined by arranging the variation of the
strain disturbances for defining the vibration of the multiple cracked non-uniform
beams. Results obtained by the present method are compared with the results of
Zheng & Fan (2001) and a commercial finite element program (ANSYS©) for
several non-uniform cantilever beams.
4.2 Vibration of the Beams with a Crack
According to fracture mechanics theory, structural strain energy increases with the
crack growth. Increase in strain energy, which is assumed equal to the energy
36

37
consumed, under the constant external bending moment is defined as follows (Sih,
1973; Tada, Paris, & Irwin, 1973);
∫==∆a
c dabGCEU0
. (4.1)
G is called the strain energy release rate that can be written as '21 EKG = for the
transverse vibration of the beam by taking only the effects of bending stresses into
account and neglecting the effects of shear stresses on the crack. 'E is equal to E for
plain stress, or ( )21 ν−E for plain strain. Stress intensity factor for the first mode
crack is given as: ( 1K )
)()(6
21 aFhb
azMK
cc
c π= , (4.2)
where and are given in Equations (3.22) and (3.24). Finally, the energy
consumed can be written using the Equation (4.1) as:
)( czM )(aF
[ ]2)()( czMaDCE = , (4.3)
where the coefficient, , is also given in Equation (3.23). )(aD
The expressions given above for the energy consumed (Yang, Swamidas, &
Seshadri, 2001) are valid only when the increase in strain energy through the cracked
side of beam is taken into account. Increase in strain energy through the cracked
beam surface can correspond to the energy of linear springs located along the crack-
edge that can be transformed into the energy of rotational springs placed along the
crack tip.
( ) ,~21
0~
2)( ydukb
Ucb
yc
uc
c∫=
∆=∆ (4.4)

38
( ) .~21
0~
2)( ydkb
Ucb
ycc
c∫=
∆=∆ θθ (4.5)
However, when slope change at the crack location of the beam is considered,
angular displacement of the crack ( )cθ∆ also results with the angular displacement
of the beam ( c )φ∆ at the crack location as shown in Figure 4.1. Angular
displacement of the beam causes the additional stress field in the vicinity of crack tip.
Similar to the additional strain energy definitions, stress energy change can
also be defined by using linear or rotational spring models
( V∆ )
( ))()( , φc
vc kk seen in Figure
4.1. As the strain caused by the crack decreases the potential energy, additional stress
field increases it. Thus, angular displacement of the beam due to the bending
decreases the energy consumed. Here, it should be noted that negative compressive
strain field required to be considered under the neutral layer in the vicinity of crack,
is assumed to be approximately equal to strain at the crack tip. These minor effects
neutralise each other and thus can be neglected in the model. Resultantly, the energy
consumed can be written as follows:
( ) ( )( ) ydkkb
CEcb
ycccc
c
~21
0~
2)(2)(∫=
∆−∆= φθ φθ , (4.6)
where, cc
c ha θφ ∆=∆ . The stiffness relation can also be established by providing
bending moment equivalence as:
( 0~1
0~
)()( =∆−∆∫=
ydkkb
cb
ycccc
c
φθ φθ ) , (4.7)
which results in )()( θφc
cc k
ah
k = .
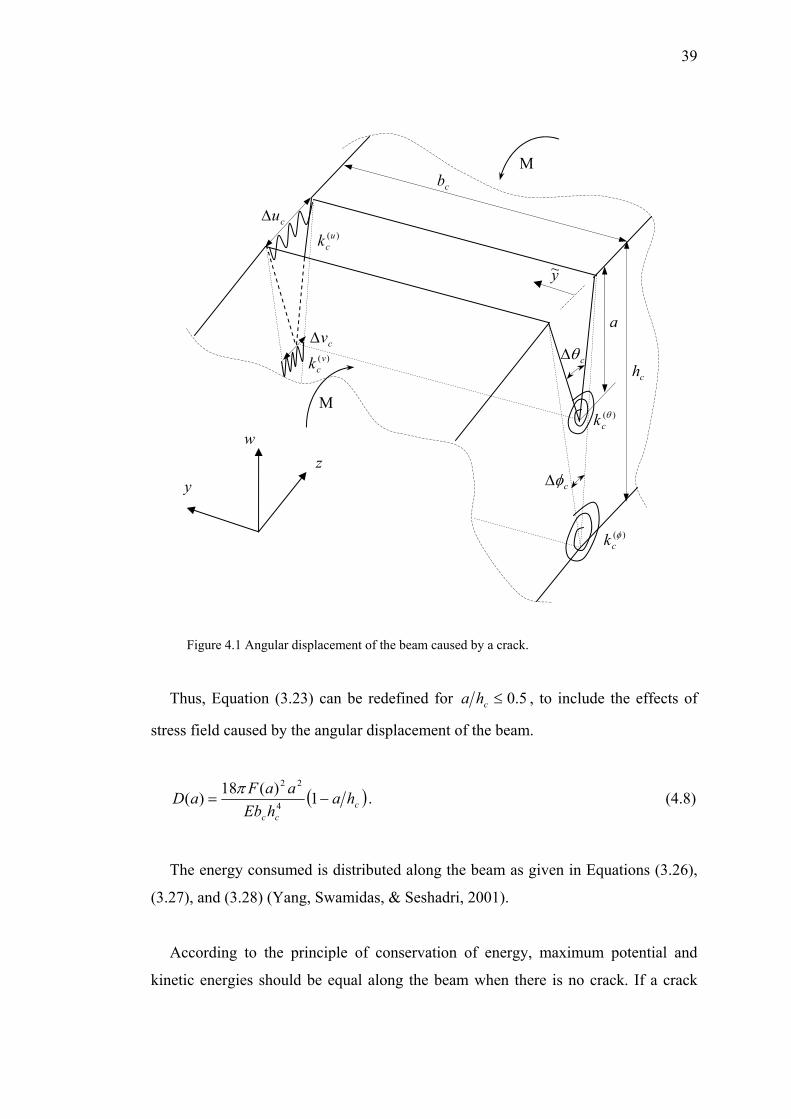
39
M cb
Figure 4.1 Angular displacement of the beam caused by a crack.
Thus, Equation (3.23) can be redefined for 5.0≤cha , to include the effects of
stress field caused by the angular displacement of the beam.
( )ccc
hahEb
aaFaD −= 1)(18)( 4
22π . (4.8)
The energy consumed is distributed along the beam as given in Equations (3.26),
(3.27), and (3.28) (Yang, Swamidas, & Seshadri, 2001).
According to the principle of conservation of energy, maximum potential and
kinetic energies should be equal along the beam when there is no crack. If a crack
ch
a
M
y~
)(θck
cθ∆
w z
y cφ∆
cu∆ )(u
ck
cv∆)(v
ck
)(φck

40
exists on a beam, the energy consumed results with the decrease in maximum
potential energy with the assumption of no mass loss at the crack location. As a
consequence, balance of maximum energies can be obtained as follows:
( )( )∫=
=Γ−Γ−ΓL
z
KECEPE dz0
0 , (4.9)
where, and represent the distributions of the maximum potential and
kinetic energies as:
PEΓ KEΓ
2
2
2 )()(21
⎟⎟⎠
⎞⎜⎜⎝
⎛=Γ
dzzWdzEIPE , (4.10)
( )22 )()(21 zWzAKE ωρ=Γ . (4.11)
Equation (4.9) can be approximated to zero using the Rayleigh–Ritz method
explained in Section 3.2.2. Equation (3.8) is rewritten as follows:
( )( ) 00
=∂⎟⎟⎠
⎞⎜⎜⎝
⎛Γ−Γ−Γ∂ ∫
=j
L
z
KECEPE dz κ . (4.12)
4.3 Energy Balance in Multiple Cracked Beams
In the case of multiple cracks, parameters in Equations from (4.1) to (4.8) can be
modified as where )()()( ,,,, icicicii bhzar ntoi 1= . The effect of interference of cracks
on the distribution of the energy consumed for a multiple cracked beam is considered
throughout the beam length. Typical distributions are shown in Figure 4.2 for the
case of three cracks as an example. It can be noticed that, the distributions cannot be
directly superposed, because the overlap of the distributions is considerably
influential on the result especially when the cracks approach each other. Therefore,

41
the contribution of each crack to the maximum potential energy can be arranged
according to the change of strain disturbance at other crack locations. In this respect,
although the energy consumed caused by crack 1 results with the decrease of
maximum potential energy in part 1 and part 2, strain disturbance as a result of crack
1 changes phase at , and the energy consumed caused by crack 1 results with the
increase of maximum potential energy in part 3. Strain disturbance changes phase
again at , and crack 1 negatively effects the maximum potential energy in part 4.
Similarly, contributions of other cracks on maximum potential energies are seen in
Figure 4.2.
)2(cz
)3(cz
Figure 4.2 Example distributions of the energies consumed caused by three cracks and
contributions of these distributions to the maximum potential energy.
As a consequence, if n cracks exist on the beam surface, the following equations
can be written for parts; 1+n
C
E zc(
3)
CE z
c(2)
CE z
c(1)
(
Nm
)
( N
m )
( N
m )
(-) (+) (-) (-)
z (m) (+) (-) (-) (+) z (m) (-) (-) (+) (-)
z (m) 0 (Part 4) (Part 3) z (Part 2) (Part 1) L )3(cz )2(c )1(cz

42
( )( )
( )( )
( )( )
( )( )
( )( )
( )( )dzBE
dzBE
dzBE
dzBE
dzBE
dzBE
nZcKECE
ncCE
ncCEc
PEn
nZc
nZc
KECEnc
CEnc
CEnc
CEc
PEn
nZc
nZc
KECEnc
CEnc
CEnc
CEnc
CEc
PEn
Zc
Zc
KECEnc
CEc
CEc
CEc
CEc
PE
Zc
Zc
KECEnc
CEc
CEc
CEc
PE
L
Zc
KECEnc
CEc
CEc
PE
∫
∫
∫
∫
∫
∫
Γ−Γ−Γ+Γ±Γ=
Γ−Γ−Γ−Γ+±ΓΓ=
Γ−Γ+Γ−Γ−Γ+Γ±Γ=
Γ−Γ±−Γ+Γ−Γ−Γ+Γ=
Γ−Γ−Γ+Γ−Γ−Γ=
Γ−Γ±−Γ+Γ−Γ=
−+
−
−−
−
−−−−−
)(
0)()1()1(1
)1(
)()()1()2()1(
)2(
)1()()1()2()3()1(1
)2(
)3()()4()3()2()1(3
)1(
)2()()3()2()1(2
)1()()2()1(1
.........
.........
.......
.................
.........
.........
.........
m
m
m
m
(4.13)
Thus, the energy balance can be obtained by satisfying the following equation:
∑+
=
=1
10
n
iiBE . (4.14)
Equation (4.14) can also be approximated to zero by using the Rayleigh–Ritz
method.
4.4 Results and Discussion
Results are represented by applying the method on several non-uniform cantilever
beams which are dimensioned as seen in Figure 4.3. Relations between heights and
length, or widths and length for tapered beams can be defined as follows;
( ) Lzhhhzh 212)( −+= , (4.15)
( ) Lzbbbzb 212)( −+= . (4.16)

43
Figure 4.3 Geometry of a beam.
Four different cantilever beams have the same density, 3mkg7800=ρ and
modulus of elasticity, . The beams have also the following geometric
and material properties;
GPa210=E
Beam1; 1,25.0,m02.0,m6.0 121211 ======= bbhhbhL bh αα ,
3.0=ν
Beam2; 1,2,m02.0,m6.0 11 ===== bhbhL αα , 3.0=ν
Beam3; 5.0,25.0,m02.0,m6.0 11 ===== bhbhL αα , 3.0=ν
Beam4; 0,1,5.0,m02.0,m8.0 11 ====== ναα bhbhL (Zheng & Fan,
2001).
The mode shape function of the beams is given in Table 3.1.
Results of the method are compared with the results of commercial finite element
program (ANSYS©) for Beam1, Beam2, and Beam3. Cracks are considered as the
slots causing discontinuities on the beams. They are formed by subtracting thin
2h )(ich 1h)(ica
2b )(icb b 1
y
z
z (m)0 )z L (ic
w y
z
w

44
transverse blocks from “solid95” beams in the program. Element size is set to 0.009
m with the “esize” command, and crack widths are chosen as 0.0004 m. Much
smaller sized elements are unavoidable in the vicinity of cracks to observe the effects
of discontinuities. Smaller sizes are automatically provided by the use of
“smrtsize,1” command in the free meshing procedures. As a result, modal
frequencies are obtained by using “modal analysis” as the analysis type. It should be
noted that, changes in the element number caused by variation of crack location and
crack size, have negligible effects on the results. Natural frequencies of the un-
cracked beams obtained by the Rayleigh–Ritz approximations and the finite element
program can be seen in Table 4.1.
Table 4.1 Natural frequencies of the un-cracked beams.
Beams Vibration modes
Frequencies (Hz) obtained by Rayleigh–Ritz (4 terms)
Frequencies (Hz) obtained by Rayleigh–Ritz (5 terms)
Frequencies (Hz) obtained by Rayleigh–Ritz (6 terms)
Frequencies (Hz) obtained
by finite element program
Beam1 1 2 3
55.3163 215.4652
-
55.3157 214.4026 520.6647
55.3153 214.4007 514.4896
55.350 214.183 511.814
Beam2 1 2 3
43.4178 374.8819
-
43.3889 373.7616
1146.4491
43.3870 373.7518
1146.4276
43.4305 369.933 1114.86
Beam3 1 2 3
66.0191 230.7768
-
66.0146 228.8314 540.6372
66.0144 228.8170 529.9834
66.036 228.550 527.355
Beam4 1 2 3
28.4894 136.7583
-
28.4866 136.6345 355.5734
28.4863 136.4713 354.0987
- - -
Vibrations of the beams defined above are inspected in the cases of single, double,
and multiple cracks as represented in the following examples.
4.4.1 Example 1: Tapered Beams with a Crack
Beam1, Beam2, and Beam3 are examined by following crack properties;
)variable(,3.0,15.0 11 cc zhha =

45
Results of the method are in good agreement with the results of the finite element
program for single crack cases of different beams as shown in Figures 4.4, 4.5, and
4.6. The method is valid for the crack depth ratio, 5.0≤cha as defined before. It is
for this reason that, normalised crack locations of Beam1 and Beam3 are considered
between 0.2 and 1 for , and between 0.5 and 1 for . Application
of the Rayleigh-Ritz approximation with 4, 5, and 6 terms is sufficient to obtain the
best agreement with the first, second, and third mode of vibrations respectively. It is
clear that higher vibration modes require the use of larger number of terms.
115.0 ha = 13.0 ha =
If the trends of the natural frequency ratios are comparatively examined for the
cracks on Beam1 and Beam2, some distinctions can be obtained. Natural frequency
reductions of Beam1 is lower than that of Beam2 when non-dimensional crack
locations are lower than 0.8. Besides, node points, where no natural frequency
reduction is obtained, are shifted from root to tip with the decreasing truncation
factor. On the other hand, relatively minor influences of second taper on natural
frequency ratios can be observed when Figure 4.4 is compared with Figure 4.6.
Variation of the mass and inertia moment together with the variation of crack depth
ratio along the beam are all influential on the observation of the natural frequency
ratios seen in the figures.
4.4.2 Example 2: Tapered Beam with Two Cracks
Beam3 is examined by following crack properties;
)variable(,91.0,3.0,15.0,3.0 )2()1(11211 cc zLzhhaha ===
Natural frequency ratios obtained by the method are also quite agreeable with
those obtained by the finite element program for double cracked Beam3 as shown in
Figure 4.7. It can be observed that, as crack 2 comes closer to crack 1, the natural

46
frequency ratios of the double cracked beams have a tendency of approaching the
natural frequency ratio of beams having single crack at . )1(cz
(ωc / ω
o)
( zc / L )
Figure 4.4 Natural frequency ratios for the (i) first, (ii) second and (iii) third mode vibration of
Beam1 with variably located crack having depths (a) 115.0 ha = , and (b) . ( o ) Ansys
results, ( —– ) approximation with 4 terms, ( – – ) approximation with 5 terms, ( --- )
approximation with 6 terms.
13.0 ha =
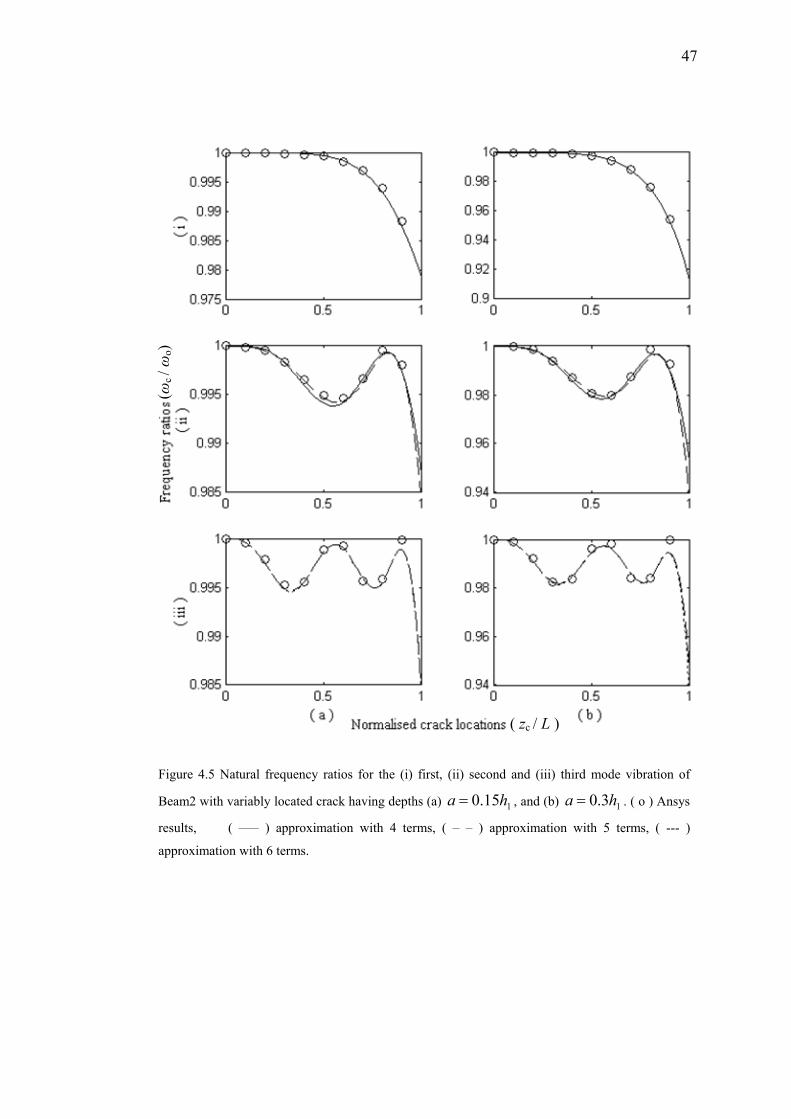
47
(ωc / ω
o)
( zc / L )
Figure 4.5 Natural frequency ratios for the (i) first, (ii) second and (iii) third mode vibration of
Beam2 with variably located crack having depths (a) 115.0 ha = , and (b) . ( o ) Ansys
results, ( —– ) approximation with 4 terms, ( – – ) approximation with 5 terms, ( --- )
approximation with 6 terms.
13.0 ha =

48
(ωc / ω
o)
( zc / L )
Figure 4.6 Natural frequency ratios for the (i) first, (ii) second and (iii) third mode vibration of
Beam3 with variably located crack having depths (a) 115.0 ha = , and (b) . ( o ) Ansys
results, ( —– ) approximation with 4 terms, ( – – ) approximation with 5 terms, ( --- )
approximation with 6 terms.
13.0 ha =
4.4.3 Example 3: Tapered Beam with Four Cracks
Beam4 has the following crack properties;
)variable(,85.0,9.0,95.0)variable(,3.0,2.0,1.0,1.0,2.0,3.0
)4()3()2()1(
1114131211
cccc zLzLzLzhhhahahaha
=======

49
(ωc / ω
o)
( zc / L )
Figure 4.7 Natural frequency ratios for the (i) first, (ii) second and (iii) third mode vibration of
double cracked Beam3 with variably located second crack having depths (a) , and (b)
. ( o ) Ansys results, ( —– ) approximation with 4 terms, ( – – ) approximation with 5
terms, ( --- ) approximation with 6 terms.
12 15.0 ha =
12 3.0 ha =
Natural frequency ratios of Beam4 having four cracks are seen in Figures 4.8 and
4.9 for the first and second mode of vibration respectively. Good agreement with the
results of Zheng & Fan (2001) is obtained by using four term approximation for the

50
first mode of vibration as seen in Figure 4.8. However, small differences between the
results of two methods for a beam with four cracks can be seen in Figure 4.9 which
depicts the second mode natural frequency ratios. Negligible differences increase as
the crack depth increases. It can be observed that, as the number of terms in
deflection function increases, the difference between the results decreases as
expected. In Figure 4.9, the natural frequency ratios coincide for all considered crack
depths at the normalised locations 0 and 0.75.
It should be noted that performing the finite element program with the acceptable
number of elements that results with the correct solution is not possible for the
Beam4 having four cracks. Furthermore, processes can exceed the memory
limitations of computers with the previously defined crack and meshing properties,
especially when the cracks are too close each other.
Freq
uenc
y ra
tios (ω
c / ω
o)
Figur
locate
terms
4a =
0.875 0.75 0.625 0.5 0.375 0.25 0.125 0
Normalised crack locations ( )Lzc
e 4.8 Natural frequency ratios of the first mode vibration of Beam4 with variably
d fourth crack having depths ( —– ) 14 1.0 ha = , ( ···· ) , ( --- )
as given in the paper of Zheng & Fan (2001); and findings of method with 4
( o ).
14 2.0 ha =
13.0 h
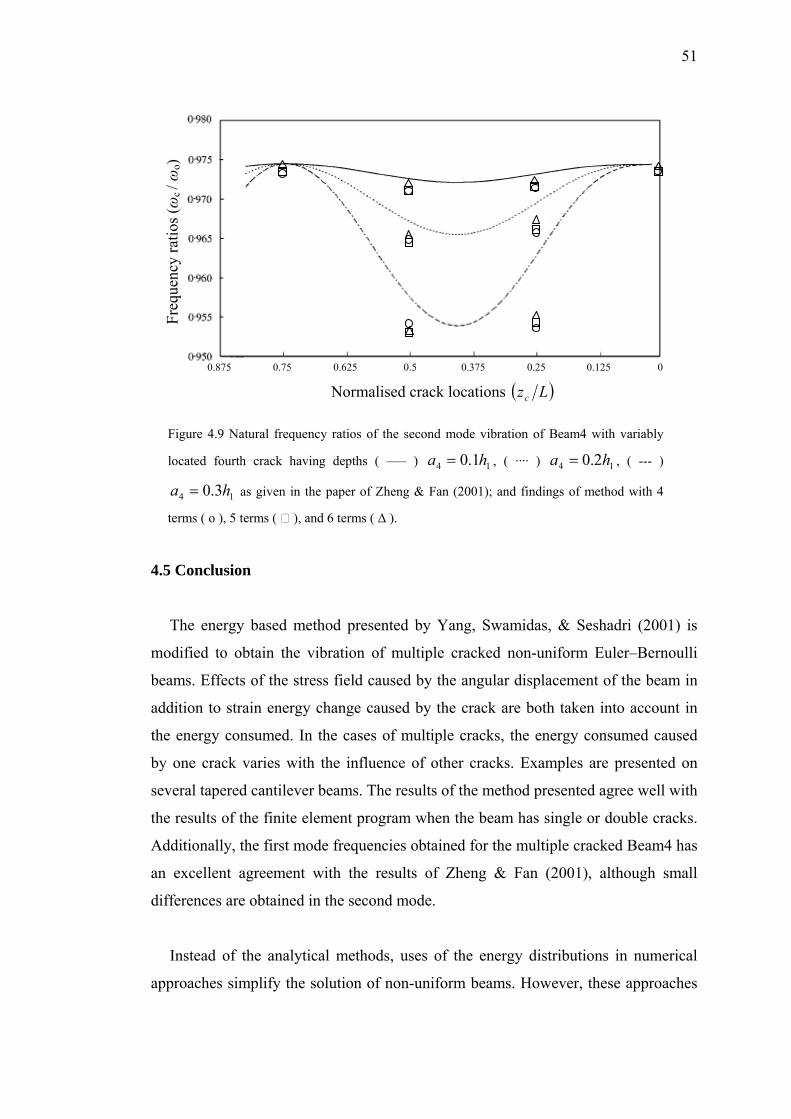
51
Freq
uenc
y ra
tios (ω
c / ω
o)
0.875 0.75 0.625 0.5 0.375 0.25 0.125 0
Normalised crack locations ( )Lzc
Figure 4.9 Natural frequency ratios of the second mode vibration of Beam4 with variably
located fourth crack having depths ( —– ) 14 1.0 ha = , ( ···· ) , ( --- )
as given in the paper of Zheng & Fan (2001); and findings of method with 4
terms ( o ), 5 terms ( ), and 6 terms ( ∆ ).
14 2.0 ha =
14 3.0 ha =
4.5 Conclusion
The energy based method presented by Yang, Swamidas, & Seshadri (2001) is
modified to obtain the vibration of multiple cracked non-uniform Euler–Bernoulli
beams. Effects of the stress field caused by the angular displacement of the beam in
addition to strain energy change caused by the crack are both taken into account in
the energy consumed. In the cases of multiple cracks, the energy consumed caused
by one crack varies with the influence of other cracks. Examples are presented on
several tapered cantilever beams. The results of the method presented agree well with
the results of the finite element program when the beam has single or double cracks.
Additionally, the first mode frequencies obtained for the multiple cracked Beam4 has
an excellent agreement with the results of Zheng & Fan (2001), although small
differences are obtained in the second mode.
Instead of the analytical methods, uses of the energy distributions in numerical
approaches simplify the solution of non-uniform beams. However, these approaches
52
suffer from the interaction of crack effects in multiple cracked beams. Proposal for
the solution of this problem is presented in this chapter. It is observed that double
cracked beam behaves like a single cracked beam when both cracks come closer to
each other, as one would expect.
Coupling effects are neglected in this study. It should be remembered that
bending-torsion coupling cannot be influential on lower vibration modes of non-
uniform Euler–Bernoulli beams. Furthermore, when the beams have cracks with
acceptable depth ratios, bending-torsion coupling has still negligible influence on
lower vibration modes as seen in the figures representing the comparatively
examined method results. However, this coupling may be more influential on the
vibration of the stepped beams.
Significant advantage of the method can be performing the processes in quite
short durations in the order of seconds. Thus, natural frequencies required for the
frequency based inverse methods like prediction schemes or contour graphs can be
easily obtained for each different beam. In practical applications, natural frequencies
may be measured in some error interval that can be kept in minimum by taking large
sampling frequencies.
Effects of truncation factors are evaluated with respect to variation of the natural
frequency ratios. Results show that cracks cause lower natural frequency ratios when
the beam has lower truncation factor except for the cracks near the root of beam. It is
clear that, the truncation factor of beam’s height is much more effective than the
truncation factor of beam’s width. Another finding can be the shift of node points
from root to tip with decreasing truncation factor.

CHAPTER FIVE
FLEXURAL VIBRATION ANALYSIS OF NON-UNIFORM BEAMS WITH
MULTIPLE CRACKS ON UNUSUAL EDGE
This chapter is reorganization of the paper published as “VIBRATION
ANALYSIS OF NON-UNIFORM BEAMS HAVING MULTIPLE EDGE CRACKS
ALONG THE BEAM’S HEIGHT” in International Journal of Mechanical Sciences
(Mazanoglu & Sabuncu, 2010a).
5.1 Introduction
All damages instantaneously change the vibration characteristics of the structures.
It is for this reason that, definition of changes in vibration parameters is essential key
for identification of damages. In existing literature, almost all researchers deal with
the bending vibration of beams having width-edge crack at the stretched surface.
More endurance fall and consequently more natural frequency decrease may be the
reason of this interest. However, vibration of beams having height-edge crack may
also be significant if the external forces bend the beam in the plane of crack tip axis.
Stress/strain behaviour of the cracked planes under tension is given in a handbook
presented by Tada, Paris, & Irwin (1973) together with many cases of the cracked
structures. A thin slender beam can be considered in this scope to analyse its
vibration in both planes. If the cracked beam has considerable thickness, vibration
effects of the height-edge cracks should be different from those of width-edge cracks.
This issue is not presented in existing literature.
This chapter presents a vibration analysis of non-uniform beams having multiple
height-edge open cracks. The method uses the changes in the strain energy
distribution caused by the cracks. Change of the strain energy distribution given by
Yang, Swamidas, & Seshadri (2001) is modified for height-edge crack to obtain the
distribution of the energy consumed. The effect of additional bending of the beam
due to the crack is determined by developing a simple spring model at the crack
location. Coupling effects are neglected for low bending vibration modes of the
53

54
Euler–Bernoulli beam. In the case of multiple cracks, a strain disturbance model is
presented to overcome the problem of the methods based on a variational principle,
which can be described as interaction of the crack effects. Results obtained by the
present method are compared with the results of a commercial finite element
program (ANSYS©) for several tapered cantilever beams and a fixed–fixed beam.
Influences of the taper, boundary and crack location on modal frequencies are given
in the figures.
5.2 Theoretical Explanations
According to fracture mechanics theory, structural strain energy increases with the
crack growth. Increase in strain energy, which is equal to the energy consumed,
under the constant external bending moment is defined as follows:
∫==∆a
c dahGCEU0
. (5.1)
G is called the strain energy release rate that can be written as '21 EKG = for the
transverse vibration of the beam by taking the effects of only bending stresses into
account and neglecting the effects of shear stresses on the crack. 'E is equal to E for
plain stress, or ( )21 vE − for plain strains (Tada, Paris, & Irwin, 1973).
Stress intensity factor for the first mode edge crack in semi-infinite body is
given as:
( 1K )
21
)(612.1
cc
c
hbazM
Kπ
= , (5.2)
where is the bending moment that formulated in Equation (3.22). The energy
consumed can be written using the Equation (5.1) as:
)( czM

55
[ ]2)()( czMaDCE = , (5.3)
where can be formulated for the edge crack as follows: )(aD
32
2212.118)(
cc hEba
aDπ
= . (5.4)
Equation (5.4) is true for the plane stresses or strains and consequently for the
slender beam that has . When the edge cracked beam has the considerable
height, ( ), Equation (5.4) is incomplete unless the beam is assumed to be only
strained due to the crack as given in many works in the literature. However, opening
of the crack also causes additional bending of the beam during the transverse
vibration. In this case, average strain along the height of beam and thus stress amount
should be half of the maximum values. This means, the stress intensity factor is
halved for the considered opening mode of crack. Consequently, Equation (5.4)
should be multiplied by the factor of
cc bh <<
ch
41=ε for the rectangular beams.
Strains are neutralised by the tensile stresses at the un-cracked cross-sections.
However, additional strains come into existence at the crack location. Since the open
crack model is used, only additional strains are considered, that is why the neutral
layer is not mentioned in this chapter. Nevertheless, 'E is modified as ( )225.01 ν−E
for a beam with height-edge open crack to contribute the effect of breathing. Increase
in strain energy through the stretched surface can correspond to the energy of linear
springs located at the opened side of the height-edge crack when the beam is under
the effect of bending moment in zw− plane. The energy of linear springs can be
transformed into the energy of rotational springs placed at the closed side as shown
in Figure 5.1.
( ) ,~21
0~
2~
)(~ yduk
aU
a
yy
uy∫
=
∆=∆ (5.5)

56
( ) ydka
Ua
yyy
~21
0~
2~
)(~∫
=
∆=∆ θθ . (5.6)
Figure 5.1 Assumed opening form of the crack as the external moment applied to the beam.
Since the cross-section decreases at the crack location, angular displacement of
the crack ( )y~θ∆ results in the angular displacement of the beam ( )φ∆ . Strain is
neutralised by the tensile stress at the un-cracked part of crack location and thus
energy is not consumed in this region. That means strain energy of ( )φ∆ should be a
base for the additional strain energy at the crack location. At result, Equation (5.6)
can be modified as follows:
( ) ( )( ) ydkka
Ua
yyy
~21
0~
2)(2~
)(~∫
=
∆−∆=∆ φθ φθ . (5.7)
ch
cb
a
M
yu~∆
M
y~θ∆
y~ φ∆
)(~u
yk
)(~θ
yk)(φk
0θ∆
)(0θk w
z y

57
Relation between the opening angles ( φ∆ , 0θ∆ ) at the tip ( ) and mouth
( ) of the crack can be settled as:
ay =~
0~ =y
( ) 03 θφ ∆=∆ cha . (5.8)
Average angular displacement avθ∆ is equal to 20θ∆ . If bending moment
equivalence is provided on the stretched surface, relation between the stiffness and
angular displacements can be written as:
)()(0
0)( θθφ
φθ
φθ
avav kkk
∆∆
=∆∆
= . (5.9)
Varying opening angles and stiffness can be defined by following equations:
( )( ) ⎥⎦⎤
⎢⎣⎡ +−∆=∆ 1
~12 3
~ayha cavy θθ , for ay << ~0 (5.10)
( )( ) ⎥⎦⎤
⎢⎣⎡ +−= 1
~1
23
)()(
~ayha
kk c
avy
θθ , for ay << ~0 (5.11)
Thus, Equation (5.7) can be arranged using Equations (5.8)-(5.11) as follows:
( ) ( )[ 32)( 121
cavav hakU −∆=∆ θθ ] (5.12)
Consequently, Equation (5.4) can be redefined for ( ) 5.03 ≤cha and 5.0≤cba
as following equation:
( ) ( )[ ]332
22
112.118)( ccc
hahEb
aaD −= επ . (5.13)

58
Increase in strain energy corresponding to the energy consumed is distributed
along the beam length as formulated by Equations (3.26), (3.27) and (3.28) given in
Chapter 3. The only difference is described in Equation (3.28) which is modified for
the height-edge crack as follows:
( ) ( )( )( ) ccc
c
bahhaah
aq 33
3212.13)(
−−
−=
π . (5.14)
If a crack exists on a beam, the energy consumed results in the decrease of
maximum potential energy with the assumption of no mass loss at the crack location.
As a consequence, balance of maximum energies can be obtained by Equation (4.9)
that is approximated to zero by means of the Rayleigh–Ritz method. Resulting
formulation for the mode shape function is given in Equation (3.9). The mode shape
function includes series of functions satisfying the end conditions tabulated in Table
3.1.
5.3 Energy Balance in Beam with Multiple Height-Edge Cracks
In the case of multiple height-edge cracks, some parameters used in previous
equations can be modified as where )()()( ,,, icicici bhza ntoi 1= . Each height-edge
crack partially interferes (as much as its depth ratio) the strain disturbances created
by the other cracks. By means of this assumption, the distribution of the energy
consumed throughout the beam length is modified for the multiple cracked beams by
affecting the influence ratios described below.

59
Figure 5.2 Distribution of the energy consumed caused by crack. thi
Sketch of the distribution of the energy consumed caused by crack is shown in
Figure 5.2. It can be noticed that, the energy consumed is maximum at the crack
mouth where there is no stress and maximum strain. Stress and strain values are
approximately equal at the crack tip and remaining section of the beam’s width at the
crack location. Consequently, the energy consumed becomes zero on this line as seen
in Figure 5.2. In our assumption, rotation of the beam around the z axis is neglected
since the ratios (
thi
)(ici ba , ( 3)(ici ha ) ) related with the crack depths are less than 0.5
and the rectangular beam bends in zw− plane. Therefore, the energy consumed
immediately spreads along the beam’s width with the influences of the inner stresses
of the beam. The energy consumed caused by crack decreases at the other crack
locations where the strain waves are partially damped. The ratio of strain waves
thi
)(ic
)1( +ic Part i
Part i+1Part i+2
M
M
z
y
mNCE ic )(
)(ic
)1(
+ic

60
passing from the remaining un-cracked section of the location of crack i+1 is equal to
)1(11 ++− ici ba . As a result, the energy consumed observed in the neighbour parts of
crack decreases at this ratio in part i+2 as shown in Figure 5.2. If thi )(),( ipicγ defines
the influence ratio of the energy consumed caused by crack i on part i, influence
ratios of crack i on the neighbour parts can be written as follow:
)1(1)2(),(
)1(),(
)(),(
)1(1)1(),(
1
,1
,1
,1
+++
+
−−−
−=
=
=
−=
iciipic
ipic
ipic
iciipic
ba
ba
γ
γ
γ
γ
(5.15)
At this point of view, the influence ratios of the energy consumed in parts δi +
and are generalised as follow: δi −
( )( ) 11
21 11
≥−=
≥−=
−−+−−
−+−+−++
δ,baγγ
δ,baγγ
δ)c(iδi1)δp(ic(i),δ)p(ic(i),
)δc(iδi1)δp(ic(i),δ)p(ic(i), (5.16)
The distributions of the energy consumed are obtained similarly for the other
cracks also. Thus, the decrease of potential energy in each part of the beam is
obtained by superposing the consumed energies caused by all cracks. If n height-
edge cracks exist on the beam, the following energy balance equations can be written
for parts: 1+n
( )( )
( )( )
( )( )dzBE
dzBE
dzBE
nZcKECE
ncnpncCEcnpc
CEcnpc
PEn
iZc
iZc
KECEncipnc
CEcipc
CEcipc
PEi
L
Zc
KECEncpnc
CEcpc
CEcpc
PE
∫
∫
∫
Γ−Γ−−Γ−Γ−Γ=
Γ−Γ−−Γ−Γ−Γ=
Γ−Γ−−Γ−Γ−Γ=
++++
−
)(
0)()1(),()2()1(),2()1()1(),1(1
)(
)1()()(),()2()(),2()1()(),1(
)1()()1(),()2()1(),2()1()1(),1(1
...
...
...
γγγ
γγγ
γγγ
(5.17)
Thus, the total energy given in Equation (4.14) is approximated to zero by using
the Rayleigh–Ritz method.

61
5.4 Results and Discussion
Results are represented by applying the method on several fixed–fixed and
cantilever beams of which dimensions are shown in Figure 5.3. Variation of the
height and width of the beams is given in Equations (4.15) and (4.16) respectively.
Three different beams considered have the same density 3mkg7800=ρ ,
modulus of elasticity , and Poisson ratio GPa210=E 3.0=ν . The beams also have
the following geometric properties:
Beam1; 75.0,5.0,m02.0,m6.0 12b12h11 ======= bbhhbhL αα
Beam2; 75.0,5.1,m02.0,m6.0 bh11 ===== ααbhL
Beam3; 25.2,5.0,m02.0,m6.0 bh11 ===== ααbhL .
Figure 5.3 Geometry of a beam.
2h)(ich h1
)(ica2b )(icb b 1
y
z
z (m) 0 )(icz L
w y
z
w

62
All these beams are considered as cantilevers fixed from Lz = . In addition,
Beam1 is reconsidered as fixed–fixed beam.
Results obtained by the present study are compared with the results of commercial
finite element program (ANSYS©) for the beams considered. Properties of finite
element program presented in Section 4.4 for modal analysis of the beam with
transverse cracks are used also for modal analysis of the beam with height-edge
cracks. Natural frequencies of the un-cracked beams obtained by Rayleigh–Ritz
approximations and the finite element program can be seen in Table 5.1.
Table 5.1 Natural frequencies of the un-cracked beams.
Beams Vibration Modes
Frequencies (Hz) obtained by Rayleigh-Ritz (4 terms)
Frequencies (Hz) obtained by Rayleigh-Ritz (6 terms)
Frequencies (Hz) obtained by Rayleigh-Ritz (8 terms)
Frequencies (Hz) obtained
by Finite Element program
Can
tilev
er
Bea
m1 1
2 3
54.9031 249.6583 689.958
54.8964 249.2314 636.7900
54.8963 249.2008 632.941
54.945 248.75 629.05
Can
tilev
er
Bea
m2 1
2 3
48.8426 344.3177 1053.128
48.8420 344.0024 996.4606
48.8420 344.0013 995.1637
48.91 341.69 976.5
Can
tilev
er
Bea
m3 1
2 3
40.311 225.5448 633.242
40.3082 224.9975 609.3576
40.3082 224.9894 607.0943
40.36 224.62 603.60
Fixe
d B
eam
1 1 2 3
217.6039 598.556
1181.955
217.6028 597.4309 1169.652
217.6027 597.4229 1169.194
217.6 594.42 1155.6
Vibrations of the beams having single, double, and triple cracks are investigated
as follows.

63
5.4.1 Example 1: Tapered Cantilever Beams with a Crack
Beam1, Beam2 and Beam3 are examined by following crack properties:
)(var4.0,2.0 11 iablezbba cc =
(ωc / ω
o)
( zc / L )
Figure 5.4 Natural frequency ratios for the (i) first, (ii) second and (iii) third mode vibration
of cantilever Beam1 with variably located crack having depths 12.0 ba = and .
Results of Ansys for ( o ), and for
14.0 ba =
12.0 ba = 14.0 ba = ( * ). Results of approximations
with 6 terms ( --- ), and 8 terms ( —– ).
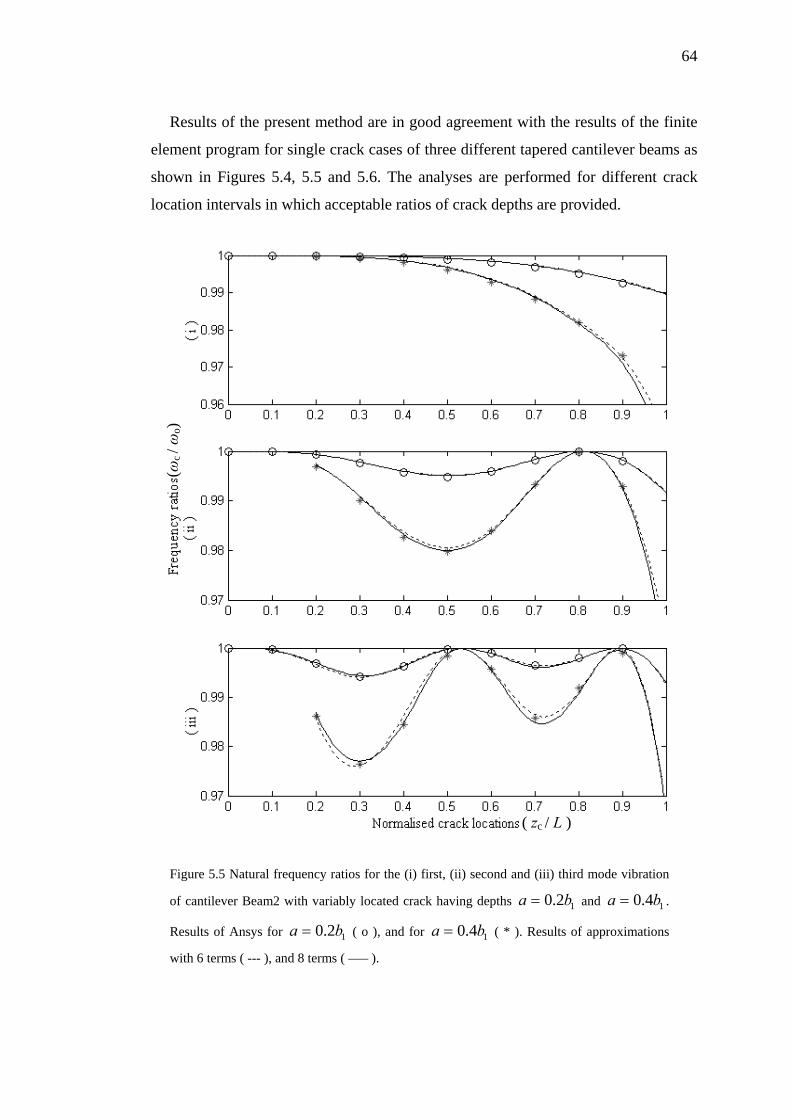
64
Results of the present method are in good agreement with the results of the finite
element program for single crack cases of three different tapered cantilever beams as
shown in Figures 5.4, 5.5 and 5.6. The analyses are performed for different crack
location intervals in which acceptable ratios of crack depths are provided.
(ωc / ω
o)
( zc / L )
Figure 5.5 Natural frequency ratios for the (i) first, (ii) second and (iii) third mode vibration
of cantilever Beam2 with variably located crack having depths 12.0 ba = and .
Results of Ansys for ( o ), and for
14.0 ba =
12.0 ba = 14.0 ba = ( * ). Results of approximations
with 6 terms ( --- ), and 8 terms ( —– ).
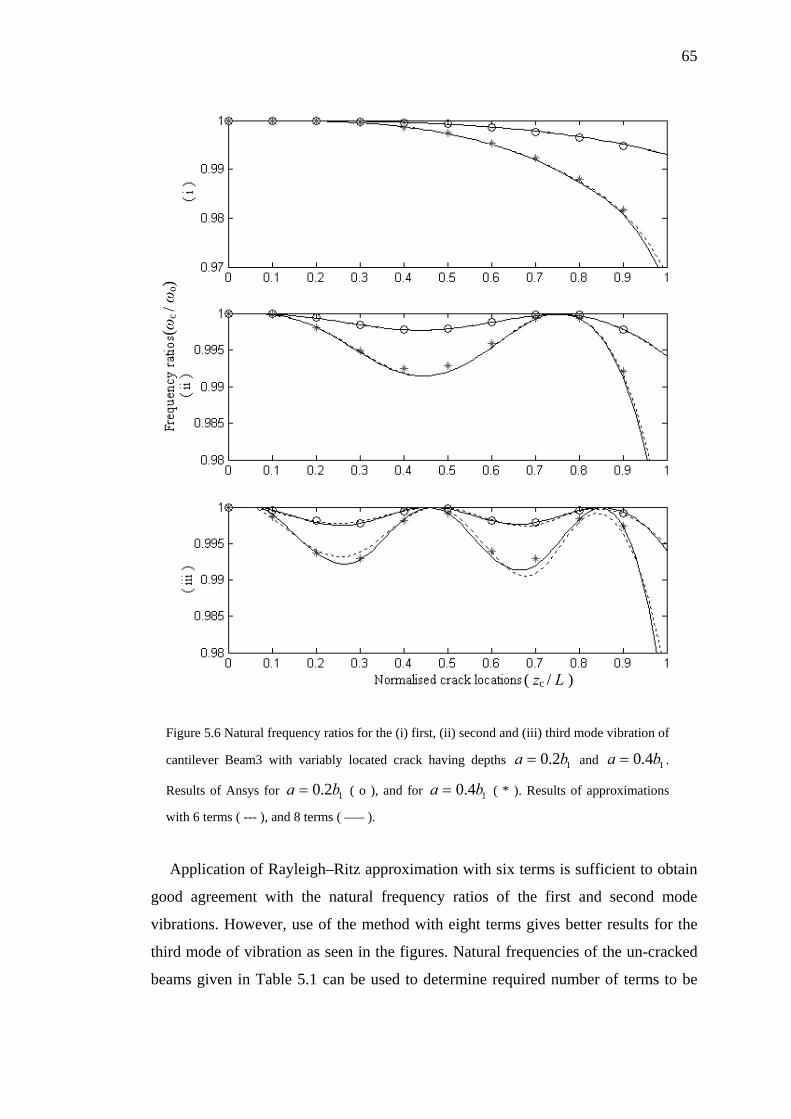
65
(ωc / ω
o)
( zc / L )
Figure 5.6 Natural frequency ratios for the (i) first, (ii) second and (iii) third mode vibration of
cantilever Beam3 with variably located crack having depths 12.0 ba = and .
Results of Ansys for ( o ), and for
14.0 ba =
12.0 ba = 14.0 ba = ( * ). Results of approximations
with 6 terms ( --- ), and 8 terms ( —– ).
Application of Rayleigh–Ritz approximation with six terms is sufficient to obtain
good agreement with the natural frequency ratios of the first and second mode
vibrations. However, use of the method with eight terms gives better results for the
third mode of vibration as seen in the figures. Natural frequencies of the un-cracked
beams given in Table 5.1 can be used to determine required number of terms to be
66
used in the method. It can be observed that, the number of terms, which is sufficient
to obtain accurate natural frequencies for the un-cracked beams, also becomes
sufficient for the cracked beams. In this sense, four termed approximation can be
applicable for only the first vibration mode as can be observed in the table.
If the trends of the natural frequency ratios are comparatively examined for the
cracks on the beams, some distinctions can be observed. Increase of the height taper
factor, hα , results in the highest natural frequency reduction near the root of the
beam that can be seen by the comparison of Figures 5.4 and 5.5. Similarly, higher
width taper factor, bα , causes the more natural frequency reductions near the root as
seen in Figure 5.6. In addition, node points, where no natural frequency reduction is
obtained, are shifted from tip to root with the increasing taper factor. It can be clearly
seen that hα is more influential than bα . Resultantly, variation of the mass and
inertia moment together with the variation of crack depth ratio along the beam are all
influential on the natural frequency ratios seen in the figures.
5.4.2 Example 2: Tapered Fixed–Fixed Beam with a Crack
Beam1 is fixed from both ends and it is examined by following crack properties:
)(var4.0,2.0 11 iablezbba cc =
Figure 5.7 shows that the application of the method when analysing a beam whose
both ends are fixed, gives good results that agree well with the results of the finite
element program. Although the natural frequencies of the fixed–fixed beam are
higher than those of cantilevers due to the increased rigidity, one sees that the
accuracy of the present method does not depend on the different boundary
conditions. Figure 5.7 also shows that the analysis of a fixed–fixed beam using six
terms instead of eight suffices and gives results which agree with the finite element
program. However, when the six termed function is used in the analysis of the
cantilever, there is a discrepancy especially for the third mode frequency ratios.
Maximum natural frequency drops are seen in Figure 5.7 when the cracks are located

67
near the ends of the beam where maximum bending moments occur. Comparing
Figure 5.7 to Figures 5.4, 5.5, and 5.6 shows that there exists one more node points
where there is no natural frequency reduction. This is a result of the bending
moments at the two ends of the fixed–fixed beam.
(ωc / ω
o)
( zc / L )
Figure 5.7 Natural frequency ratios for the (i) first, (ii) second and (iii) third mode vibration of
fixed-fixed Beam1 with variably located crack having depths 12.0 ba = and .
Results of Ansys for ( o ), and for
14.0 ba =
12.0 ba = 14.0 ba = ( * ). Results of approximations
with 6 terms ( --- ), and 8 terms ( —– ).

68
5.4.3 Example 3: Tapered Cantilever and Fixed–Fixed Beams with Two Cracks
Beam1 is examined by the following crack properties:
)(var,91.04.0,2.0,2.0 )2()1(11211 iablezLzbbaba cc ===
(ωc / ω
o)
( zc(2) / L )
Figure 5.8 Natural frequency ratios for the (i) first, (ii) second and (iii) third mode vibration of
double cracked cantilever Beam1 with variably located second crack having depths
and as 12 2.0 ba = 12 4.0 ba = 11 2.0 ba = . Results of Ansys for 12 2.0 ba = ( o ), and for
( * ). Results of approximations with 6 terms ( --- ), and 8 terms ( —– ). 12 4.0 ba =
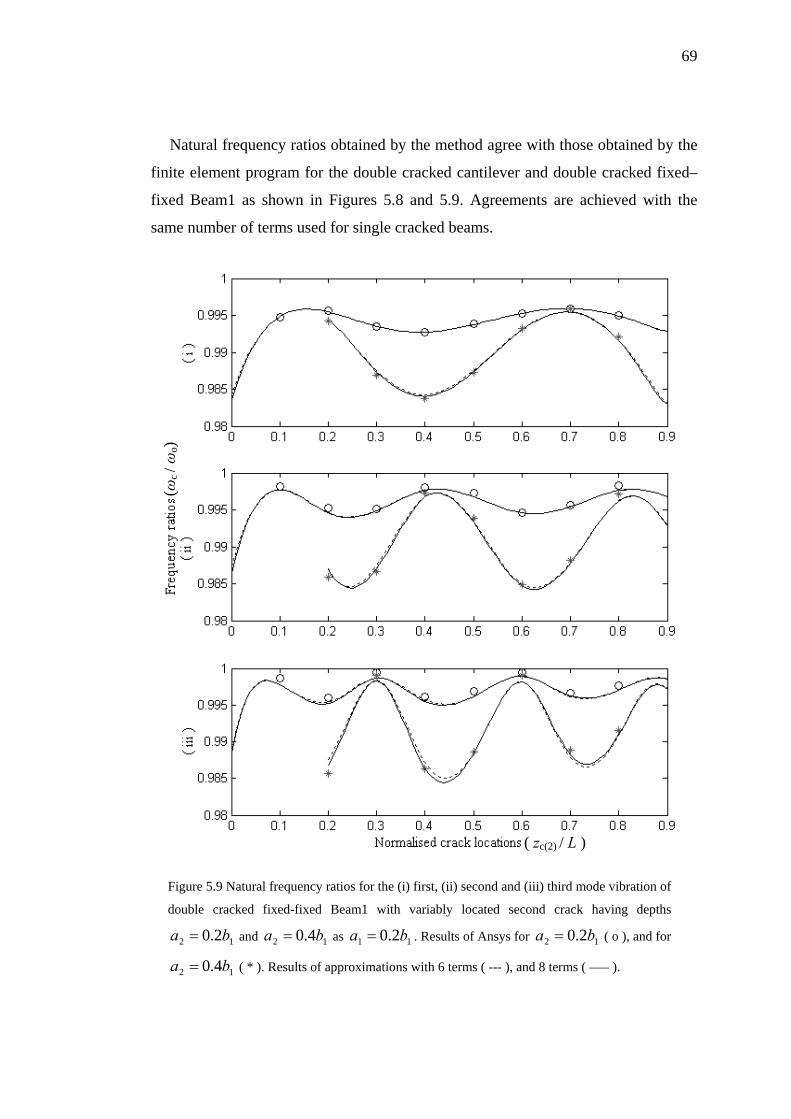
69
Natural frequency ratios obtained by the method agree with those obtained by the
finite element program for the double cracked cantilever and double cracked fixed–
fixed Beam1 as shown in Figures 5.8 and 5.9. Agreements are achieved with the
same number of terms used for single cracked beams.
(ωc / ω
o)
( zc(2) / L )
Figure 5.9 Natural frequency ratios for the (i) first, (ii) second and (iii) third mode vibration of
double cracked fixed-fixed Beam1 with variably located second crack having depths
and as 12 2.0 ba = 12 4.0 ba = 11 2.0 ba = . Results of Ansys for 12 2.0 ba = ( o ), and for
( * ). Results of approximations with 6 terms ( --- ), and 8 terms ( —– ). 12 4.0 ba =

70
Trends of the natural frequency reductions of the double cracked cantilever and
both ends fixed beams are similar to the trends obtained from single cracked beams
seen in Figures 5.4 and 5.7 except for the cases of proximity of the cracks. The
difference arises from partially damped strain disturbances caused by the cracks
which interact with each other.
(ωc / ω
o)
( zc(3) / L )
Figure 5.10 Natural frequency ratios for the (i) first, (ii) second and (iii) third mode vibration
of triple cracked cantilever Beam1 with variably located third crack having depths
and as 13 2.0 ba = 13 4.0 ba = 121 2.0 baa == . Results of Ansys for ( o ),
and for
13 2.0 ba =
13 4.0 ba = ( * ). Results of approximations with 6 terms ( --- ), and 8 terms ( —– ).

71
It is clear that, maximum frequency ratio of the double cracked Beam1 should be
equal to the frequency ratio of the Beam1 having one crack located at the position,
. Interestingly, using the presented method or the finite element program gives
the same results, which indicates that there is no clear effect of coupling on the
considered vibration modes even if the beams have two cracks.
)1(cz
5.4.4 Example 4: Tapered Cantilever Beam with Three Cracks
Beam1 has the following crack properties:
)(var,82.0,91.0)(var4.0,2.0,2.0,2.0
)3()2()1(
1131211
iablezLzLziablebbababa
ccc =====
Natural frequency ratios of cantilever Beam1 having three cracks are seen in
Figure 5.10 for the first three modes of vibrations. Good agreements are also
obtained. As seen in the figures for single, double and triple cracked beams, eight
termed approximation is sufficient to obtain good agreement with the finite element
program for the first three modes of vibration. Thus, it can be said that the number of
cracks along the beam is not effective on the number of terms required to be used in
the approximation. As seen in the figures, crack depths are also not influential over
the number of terms required.
It should be noted that performing the finite element program with the acceptable
number of elements that results in the correct solution requires very long
computation time when the cracks are too close to each other for double and triple
cracked beams. Processes can exceed the memory limitations of computers with
defined cracks and meshing properties.
5.5 Conclusion
The energy method presented by Yang, Swamidas, & Seshadri (2001) is modified
to obtain the vibration of multiple height-edge cracked non-uniform Euler–Bernoulli

72
beams. Fracture mechanics theory is adapted to the height-edge open cracks via a
proposed model for the vibration behaviour of crack. The energy consumed is
determined by forming the opening of the crack and distributing the strain
disturbance along the beam’s length. If the beam has multiple cracks, it is assumed
that the strain disturbance caused by one of the cracks is damped as much as the
depth ratio of the other cracks at their locations. Consumed energies caused by the
cracks are superposed to obtain the overall energies consumed from the potential
energy. Thus, interaction of the multiple crack effects, which is the problem for the
methods based on a variational principle, is defined by the strain disturbance model
presented in this chapter.
When the results of the method are compared with the results of a commercial
finite element program for a fixed–fixed beam and the cantilever beams having
different taper factors, good agreements are found. Significant advantage of the
method can be performing the processes in quite short durations in the order of
seconds when the method compared with the finite element program. Even if the
beam has multiple cracks, the solution time of the method does not rise as much as
the solution time of the finite element program, because the mode shape function
used in the approximation method is not changed in the analysis of the multiple
cracked beam. Thus, natural frequencies required for the frequency based inverse
methods like prediction schemes or contour graphs can easily be obtained for each
different beam. In practise, it is not impossible to obtain exact natural frequency
ratios represented in figures. Sensitivity and resolution of the measurement system
should be satisfactory. Restriction caused by the sampling can be kept to a minimum
by the acquisition of long data with sufficient sampling frequency. Furthermore,
sensitivity in the frequency domain can be improved by several statistical methods.
Vibration of the beam with height-edge cracks can also be described as the unique
plane vibration of width-edge cracked beam. Vibrations in the plane perpendicular to
crack tip axis are well-known with many papers presented in literature. Unique plane
vibrations obtained by the present method can be critical in measuring and crack
identification. Determination of the vibration characteristics in two planes results in

73
adequacy of lower frequency modes especially if the cross-section of the beam is not
square.
Coupling effects are neglected in this chapter. Bending-torsion, which is probably
the most coupling type, can have considerable influence if the cracks become deep
enough. However, admissible sized cracks do not have clear influence of coupling on
the lower modes of bending vibrations as obtained from the present results. It is
certain that coupling is effective at the higher modes of vibration even if the beam is
un-cracked.

CHAPTER SIX
FLEXURAL VIBRATION ANALYSIS OF NON-UNIFORM BEAMS
HAVING DOUBLE-EDGE BREATHING CRACKS
This chapter is reorganization of the paper published as “FLEXURAL
VIBRATION OF NON-UNIFORM BEAMS HAVING DOUBLE-EDGE
BREATHING CRACKS” in Journal of Sound and Vibration (Mazanoglu &
Sabuncu, 2010b).
6.1 Introduction
Understanding the vibration effects of cracks enables their recognition in practical
applications of vibration monitoring. However until date, there has been no work
analysing asymmetric double-edge crack in the literature, mainly because the
definition of a crack advancement function for all different depth combinations of the
double-edge crack would be quite a complicated task.
This chapter presents a method for the flexural vibration of non-uniform Rayleigh
beams having double-edge transverse cracks which are symmetric or asymmetric
around the central layer of the beam’s height. The breathing crack models are
employed because the external moments change direction in a period of vibration.
Distribution of the energy changes along the beam’s length is determined together
with contributing the effects of tensile and compressive stress fields that occur in the
vicinity of the crack tips due to the additional angular displacement of the beam.
Effects of neutral axis deviations are also included in the model. The Rayleigh–Ritz
method is applied on total energy distribution for analysing the vibration of the
beam. Cantilever and simply supported beams are presented as examples and good
agreements are obtained when the employed method results are compared with the
results of the Chondros, Dimarogonas, & Yao (1998) and the results of the
commercial finite element program (ANSYS©). The effects of crack’s asymmetry
and positions of cracks on the natural frequency ratios are shown graphically.
74
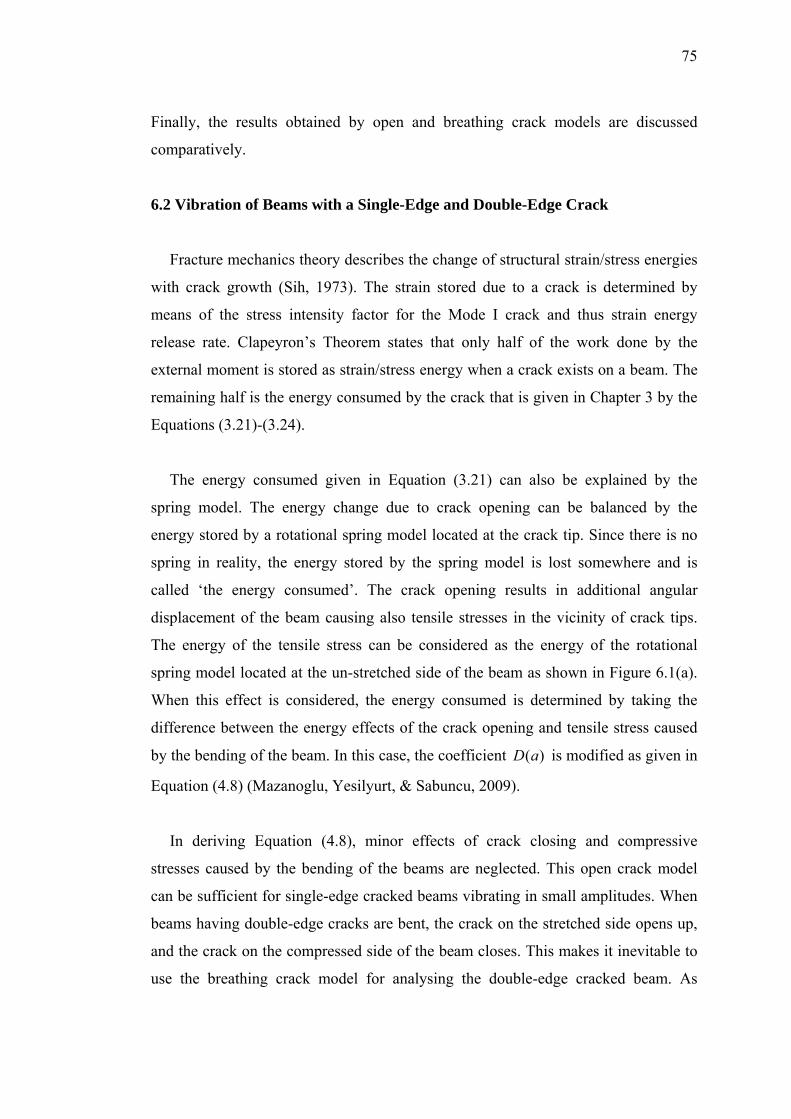
75
Finally, the results obtained by open and breathing crack models are discussed
comparatively.
6.2 Vibration of Beams with a Single-Edge and Double-Edge Crack
Fracture mechanics theory describes the change of structural strain/stress energies
with crack growth (Sih, 1973). The strain stored due to a crack is determined by
means of the stress intensity factor for the Mode I crack and thus strain energy
release rate. Clapeyron’s Theorem states that only half of the work done by the
external moment is stored as strain/stress energy when a crack exists on a beam. The
remaining half is the energy consumed by the crack that is given in Chapter 3 by the
Equations (3.21)-(3.24).
The energy consumed given in Equation (3.21) can also be explained by the
spring model. The energy change due to crack opening can be balanced by the
energy stored by a rotational spring model located at the crack tip. Since there is no
spring in reality, the energy stored by the spring model is lost somewhere and is
called ‘the energy consumed’. The crack opening results in additional angular
displacement of the beam causing also tensile stresses in the vicinity of crack tips.
The energy of the tensile stress can be considered as the energy of the rotational
spring model located at the un-stretched side of the beam as shown in Figure 6.1(a).
When this effect is considered, the energy consumed is determined by taking the
difference between the energy effects of the crack opening and tensile stress caused
by the bending of the beam. In this case, the coefficient is modified as given in
Equation (4.8) (Mazanoglu, Yesilyurt, & Sabuncu, 2009).
)(aD
In deriving Equation (4.8), minor effects of crack closing and compressive
stresses caused by the bending of the beams are neglected. This open crack model
can be sufficient for single-edge cracked beams vibrating in small amplitudes. When
beams having double-edge cracks are bent, the crack on the stretched side opens up,
and the crack on the compressed side of the beam closes. This makes it inevitable to
use the breathing crack model for analysing the double-edge cracked beam. As

76
shown in Figure 6.1(b), this model covers the superposition of two cases: elongation
of the beam due to crack opening and shortening of the beam due to crack closing. It
is clear that, an additional crack will make the beam bend more, mainly because of
the additional cross–section decrease and thus the stiffness loss of the beam. The
beams will posses extra displacement near the open crack, in contrast to the
displacement in negative direction near the closed crack. Tensile and compressive
stresses also occur in the vicinity of the crack tips. Since some of the lost energy
caused by the displacement changes is restored by the effect of the stress changes,
the net energy consumed can be described by the following expression for the
maximum deflection of a beam having double-edge breathing crack:
( )( )stressecompressivtheofEnergyshorteningtheofEnergy
stresstensiletheofEnergyelongation the ofEnergyCE−−−=
(6.1)
The energy changes for the breathing crack can be obtained by the model
including the equivalent rotational springs shown in Figure 6.1(b). Additional
rotational springs are located on the tip of the crack opening, for obtaining the energy
of the compressive stress and are located on the tip of the closed crack for obtaining
the energy change due to the displacement in negative direction. This model, which
includes the extensions to the open crack model, is valid for the total depth ratio of
the cracks in pair, , for less then 0.5. The energy consumed can be
formulated by the energy of the equivalent springs as follows:
cclop haa /)( +
( ) ( )( ) ( ) ( )( )[ ] ydkkkkb
CEcb
ydcdcdcdcdcdcdcdc
c
~21
0~
2)(2)(2)(2)(∫=
∆−∆−∆−∆= ϕψφθ ϕψφθ , (6.2)
where,
dcc
opdc h
aθφ ∆=∆ , (6.3)

77
cb M
Figure 6.1 Models for (a) single-edge and (b) double-edge cracks.
ch
a
M
y~
)(θck
c
θ∆
w z
y cφ∆
cu∆
)(φck
)(uck (a)
cv∆)(v
ck
cb M
ch
opa
M
y~
)(θdck
dcθ∆
w z
y
dcφ∆
)(φdck
(b)
)(ϕdck
dcϕ∆
cla
dcψ∆
)(ψdck

78
dcopc
cldc ah
aψϕ ∆
−=∆ . (6.4)
The stiffness relation can also be established by providing bending moment
equivalences at the stretched and compressed sides of the beam.
)()( θφdc
op
cdc k
ah
k = , (6.5)
)()( ψϕdc
cl
opcdc k
aah
k−
= . (6.6)
If Equations (6.3)-(6.6) are substituted into Equation (6.2), the following equation
is obtained:
( ) ( ) ydah
ak
ha
kb
CEcb
y opc
cldcdc
c
opdcdc
c
~1121
0~
2)(2)(∫= ⎥
⎥⎦
⎤
⎢⎢⎣
⎡⎟⎟⎠
⎞⎜⎜⎝
⎛
−−∆−⎟⎟
⎠
⎞⎜⎜⎝
⎛−∆= ψθ ψθ . (6.7)
The additional rotations of the open ( adθ∆ ) and closed ( adψ∆ ) cracks are
influenced by three parameters which can be stated as; the cross-section decrease (d),
the neutral axis yawing (y) due to the angular displacement difference between the
cracks opening and closing, and the neutral axis shift (s) due to the crack’s
asymmetry. Thus, the additional rotations are formulated as follows:
sydcdcad θθθθθθ ∆+∆+∆=∆−∆=∆ , (6.8)
syddcad ψψψψψ ∆+∆−∆=∆=∆ (6.9)
where dθ∆ and dψ∆ are the additional rotations caused by the direct effect of the
cross-section decreases. The depth of a crack on one edge influences the opening and

79
closing amounts of the crack on the other edge. Thus, additional rotation of the open
crack due to the closed crack based cross-section drop is defined as follows:
cclopc
cld aah
aθθ ∆⎟
⎟⎠
⎞⎜⎜⎝
⎛
−−=∆ , (6.10)
Similarly, the additional rotation of the closed crack is written as follows:
dcl
opd a
aθψ ∆=∆ . (6.11)
Neutral axis is not mentioned in the determination of the coefficient, , given
in Equation (4.8), since the crack is assumed always open and hence the beam bends
with extra displacement and tensile stress only (Mazanoglu, Yesilyurt, & Sabuncu,
(2009). However, the breathing crack model makes it also necessary to take both the
crack closing and the compressive stress effects into consideration. Nonlinear effects
of the breathing cracks arise with the neutral axis modulation around the central axis
during the period of vibration. The relation between the
)(aD
dθ∆ and dψ∆ can also be
described by using yawing of the neutral axis , which is caused by the difference
between these additional rotations. Thus, yawing of the neutral axis is obtained as
follows:
yX
( )dd
dopc
cy ah
hX
ψθψ∆+∆
∆−−=
2 (6.12)
Yawing of the neutral axis leads to another additional rotation symbolised by yθ∆
and yψ∆ in Equations (6.8) and (6.9). The sign of the yψ∆ in Equation (6.9) is
negative, since the angular displacement due to the closed crack is always less then
that caused by the crack opening. This means that the neutral axis always moves
towards the closed crack during the bending. It is clear that, yawing effects reach a
maximum when the cracks are located at the centre of mass of the beam and decrease

80
as the cracks approach to the beam’s ends. The yawing effects function can be
represented by multiplying the maximum yawing with a Normalised Gaussian
function, , having unit amplitude. The mean value of this function is then located
on the mass centre and the standard deviation of the function is . As a
consequence, additional rotation of the beam due to the yawing of the neutral axis
can be defined by the following relations:
NG
6/L
⎟⎟⎠
⎞⎜⎜⎝
⎛∆=∆
2/c
Nydy h
GXθθ , (6.13)
⎟⎟⎠
⎞⎜⎜⎝
⎛∆=∆
2/c
Nydy h
GXψψ . (6.14)
The neutral axis will deviate from the central axis if there is an asymmetry in the
depths of the open and closed cracks. The neutral axis shift is given by the
parameter ; sX
( ) 2opcls aaX −= , (6.15)
and the additional rotations due to this shift is described by the following equations:
⎟⎟⎠
⎞⎜⎜⎝
⎛∆=∆
2/c
sds h
Xθθ , (6.16)
⎟⎟⎠
⎞⎜⎜⎝
⎛∆=∆
2/c
sds h
Xψψ . (6.17)
The signs of sθ∆ and sψ∆ are determined by the sign of . If Equations (6.10)-
(6.17) are considered together with Equations (6.8) and (6.9), the relations for
additional angular displacement effects for open and closed cracks can be easily
found as:
sX

81
γθθθ cclopc
cl
c
s
c
Nycdc aah
ahX
hGX
∆=⎥⎥⎦
⎤
⎢⎢⎣
⎡⎟⎟⎠
⎞⎜⎜⎝
⎛
−−⎟⎟⎠
⎞⎜⎜⎝
⎛+++∆=∆
2/2/11 , (6.18)
βθθψ cclopc
op
c
s
c
Nycdc aah
ahX
hGX
∆=⎥⎥⎦
⎤
⎢⎢⎣
⎡⎟⎟⎠
⎞⎜⎜⎝
⎛
−−⎟⎟⎠
⎞⎜⎜⎝
⎛+−∆=∆
2/2/1 . (6.19)
Resistances to these additional rotations, which are modelled by the rotational
springs, can be determined by equating the bending moments at the stretched and
compressed sides of the beam which in return gives us the following stiffness
equations:
γ
θθ
)()( c
dck
k = , (6.20)
β
θψ
)()( c
dck
k = . (6.21)
Hence, the energy consumed is obtained by substituting the additional rotation
and stiffness expressions into Equation (6.7):
( ) ( ) ydah
ak
byd
ha
kb
CEcc b
y opc
clcc
c
b
y c
opcc
c
~121~1
21
0~
2)(
0~
2)( ∫∫== ⎥
⎥⎦
⎤
⎢⎢⎣
⎡⎟⎟⎠
⎞⎜⎜⎝
⎛
−−∆−
⎥⎥⎦
⎤
⎢⎢⎣
⎡⎟⎟⎠
⎞⎜⎜⎝
⎛−∆= βθγθ θθ
(6.22)
Extensions to the open crack model, seen in Figure 6.1, are extracted from
Equation (6.22) and added into Equation (4.8) which should be modified as the
formulations below, for opening and closing cases of single-edge or double-edge
breathing cracks.

82
γπ
⎟⎟⎠
⎞⎜⎜⎝
⎛−=
c
op
cc
opopop h
ahEb
aaFaD 1
)(18)( 4
22
, (6.23)
βπ
⎟⎟⎠
⎞⎜⎜⎝
⎛
−−=
opc
cl
cc
clclcl ah
ahEb
aaFaD 1
)(18)( 4
22
. (6.24)
Of course when a beam vibrates, it will be bending in two opposite directions
which will result in the exchange of the positions of the open and closed cracks. If
the open and closed cracks are subscripted by the numbers also, Equation (3.21),
defining the energy consumed for a single-edge open crack, is modified as below for
the single-edge and double-edge breathing cracks:
[ ] [ ]21,2
1,1 )()()()( cclcopa zMaDzMaDCE −= (6.25)
[ ] [ ]22,2
2,2 )()()()( cclcopa zMaDzMaDCE −= (6.26)
It should be remembered that the moment terms in Equations (6.25) and (6.26)
include different expressions for open and closed cracks due to the difference in 'E .
The energy consumed is distributed along the beam length as follows (Yang,
Swamidas, & Seshadri, 2001):
( ) ( )[ ] ( ) ( )[ ]222
22
11
1
)(1),(
)(1),(
aaqzzzaQ
aaqzzzaQ
c
c
c
cCE
−++
−+=Γ (6.27)
where
( ) ( )[ ] ( )[{ }]111111
11 )(arctan)(arctan)(
),(aaqzaaqzLaaq
CEzaQ
cc
ac +−= , (6.28)
( ) ( ) ( )( )( ) ccc
c
haahhaaaahaF
aq 321
321
321
21
1)(3
)(−−−
+−−=
π. (6.29)

83
Equations (6.28) and (6.29) can be modified for the crack at the second edge.
The conservation of energy law dictates that, for a beam with no cracks, the
maximum potential energy should be equal to maximum kinetic energy. If a crack
exists on a beam, the energy consumed results in the decrease of maximum potential
energy with the assumption of no mass loss at the crack location. As a consequence,
balance of maximum energies can be obtained by Equation (4.9) that is approximated
to zero by means of the Rayleigh–Ritz method. Since the Rayleigh beam model is
used in this chapter, kinetic energy distribution given in Equation (4.11) is modified
as follows:
( )2
222 )()(21)()(
21
⎟⎠⎞
⎜⎝⎛+=Γ
dzzdWzIzWzAKE ωρωρ . (6.30)
The second term in Equation (6.30) describes the effect of rotary inertia around
the axis perpendicular to the bending plane. Resulting formulation for the mode
shape function is given in Equation (3.9). The mode shape function includes series of
functions satisfying the end conditions tabulated in Table 3.1.
6.3 Results and Discussion
Results are presented by applying the developed method on simply supported and
cantilever beams. Simply supported aluminium and steel beams having single-edge
or symmetric double-edge cracks at the mid-span range are analysed and the results
are compared. The aluminium beam has the following geometric properties; length
, width , and height m235.0=L m006.0=b m0254.0=h . The material properties
of the beam are 3mkg2800=ρ as density, GPa72=E as modulus of elasticity,
and 35.0=ν as poisson ratio. A double-edge cracked steel beam of length, width,
and height are given as m575.0=L , m00952.0=b , and
respectively. The beam has the following material properties; density
m03175.0=h
3mkg7800=ρ , modulus of elasticity GPa206=E , and poisson ratio 35.0=ν . A
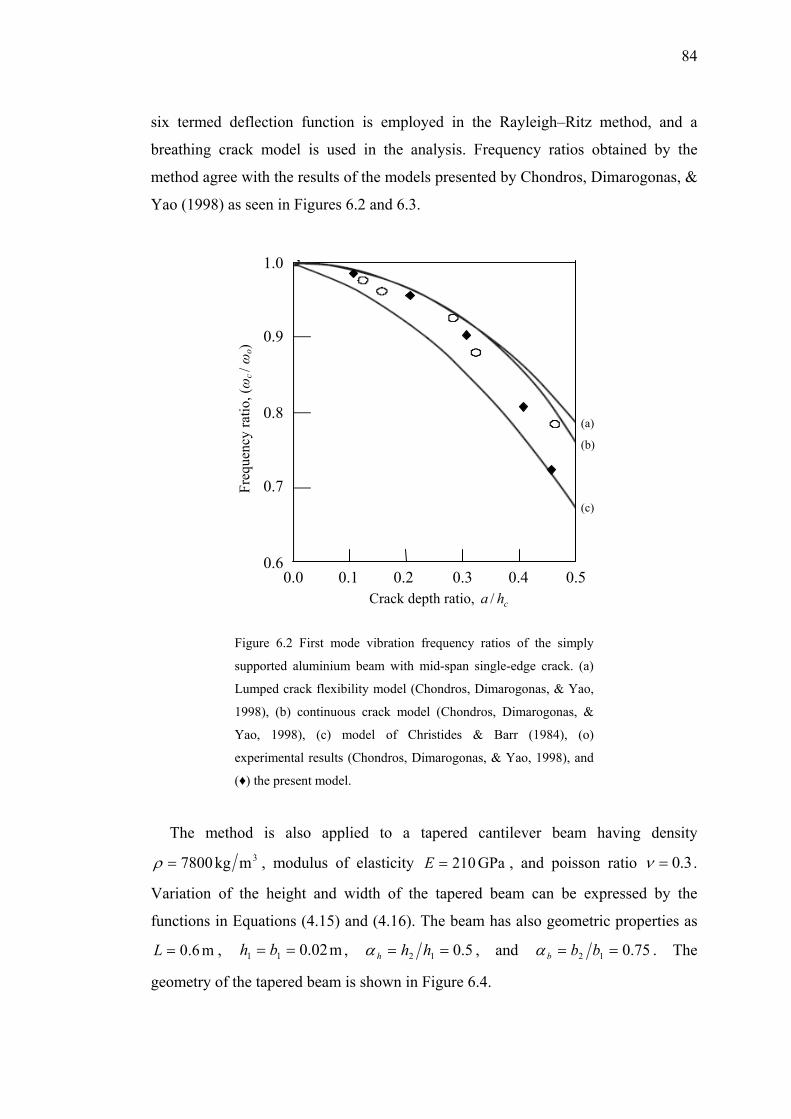
84
six termed deflection function is employed in the Rayleigh–Ritz method, and a
breathing crack model is used in the analysis. Frequency ratios obtained by the
method agree with the results of the models presented by Chondros, Dimarogonas, &
Yao (1998) as seen in Figures 6.2 and 6.3.
1.0 0.9 0.8
Figure 6.2 First mode vibration frequency ratios of the simply
supported aluminium beam with mid-span single-edge crack. (a)
Lumped crack flexibility model (Chondros, Dimarogonas, & Yao,
1998), (b) continuous crack model (Chondros, Dimarogonas, &
Yao, 1998), (c) model of Christides & Barr (1984), (o)
experimental results (Chondros, Dimarogonas, & Yao, 1998), and
(♦) the present model.
The method is also applied to a tapered cantilever beam having density 3mkg7800=ρ , modulus of elasticity GPa210=E , and poisson ratio 3.0=ν .
Variation of the height and width of the tapered beam can be expressed by the
functions in Equations (4.15) and (4.16). The beam has also geometric properties as
, , m6.0=L m02.011 == bh 5.012 == hhhα , and 75.012 == bbbα . The
geometry of the tapered beam is shown in Figure 6.4.
0.0 0.1 0.2 0.3 0.4 0.5 Crack depth ratio, cha /
(a)
(b) 0.7 Fr
eque
ncy
ratio
, (ω
c / ω
o)
(c) 0.6

85
1.0
Freq
uenc
y ra
tio, (ω
c / ω
o)
0.9
(a)
(b)
(c)
0.0 0.1 0.2 0.3 0.4 0.5 0.6 0.8
Crack depth ratio, chaa /)( 21 +
Figure 6.3 First mode vibration frequency ratios of the simply supported steel beam with mid-
span symmetric double-edge crack. (a) Lumped crack flexibility model (Chondros,
Dimarogonas, & Yao, 1998), (b) continuous crack model (Chondros, Dimarogonas, & Yao,
1998), (c) model of Christides & Barr (1984), (o) experimental results (Chondros, Dimarogonas,
& Yao, 1998), and (♦) the present model.
Results obtained by the present method are compared with the results of the
commercial finite element program (ANSYS©) for the tapered beam in
consideration. Analysis properties of the finite element program presented in Section
4.4 for the beam with transverse cracks are used also for the beam with double-edge
cracks. Finite element model of the double–edge cracked beam considered is given in
Appendix B, Figure B.2. It should be remembered that, changes in the element
number caused by the variation of crack location and crack size, have negligible
effects on the results. Natural frequencies of the un-cracked beams obtained by the
Rayleigh–Ritz approximations and the finite element program closely agree with
each other as shown in Table 6.1.

86
Figure 6.4 Geometry of a beam.
Table 6.1 Natural frequencies of the un-cracked beam.
Vibration
Modes
Frequencies (Hz)
obtained by Rayleigh–
Ritz (6 terms)
Frequencies (Hz)
obtained by Rayleigh–
Ritz (9 terms)
Frequencies (Hz)
obtained by Finite
Element program
1
2
54.8890
249.059
54.8890
249.029
54.935
248.75
The vibration of a beam having different combinations of symmetric and
asymmetric double-edge breathing cracks with the same total depth
is investigated as an example. The vibration of a single-edge cracked beam is also
examined. The following crack cases are examined for the beam considered with
variable crack locations:
( )121 3.0 haa =+
Case 1: 1211 15.0,15.0 haha == ; Case 2: 1211 10.0,20.0 haha == ;
Case 3: 1211 05.0,25.0 haha == ; Case 4: 1211 00.0,30.0 haha == .
2h ch 1h1a
2b cb 1b
y
z
z (m) 0 z L c
w y
w
z
2a

87
(ωc / ω
o)
( zc / L )
Figure 6.5 First mode vibration frequency ratios of the tapered cantilever beam
with several depth combinations of cracks in pair. (– –), (---),(—), and (– -) are the
results obtained by the method with six termed deflection function in Case 1, Case
2, Case 3, and Case 4 respectively. (*), (∆), (o), and () are the results of the
Ansys© for mentioned cases.
The analyses are performed for the beams having the cracks located through
in which the total crack depth ratio remains under 0.5. The results of the
present method, which uses the six termed deflection function, agree well with the
results of the finite element program for the first mode of vibration as shown in
Figure 6.5. Second mode frequencies obtained by the method also match with the
results of the finite element program for the beam having single-edge crack.
However, in the cases of double-edge cracks, the matching of the second mode
frequencies decreases when cracks exist through the
LL −2.0
LL 4.02.0 − as seen in Figure
6.6. Better agreement can be observed in higher vibration modes when the deflection
function used in the analysis is expanded with the larger number of terms
(Mazanoglu, Yesilyurt, & Sabuncu, 2009). As shown in Figure 6.7, improved
matching of the second mode frequencies is obtained by a nine termed
approximation function for the beam with a double-edge crack. This result shows
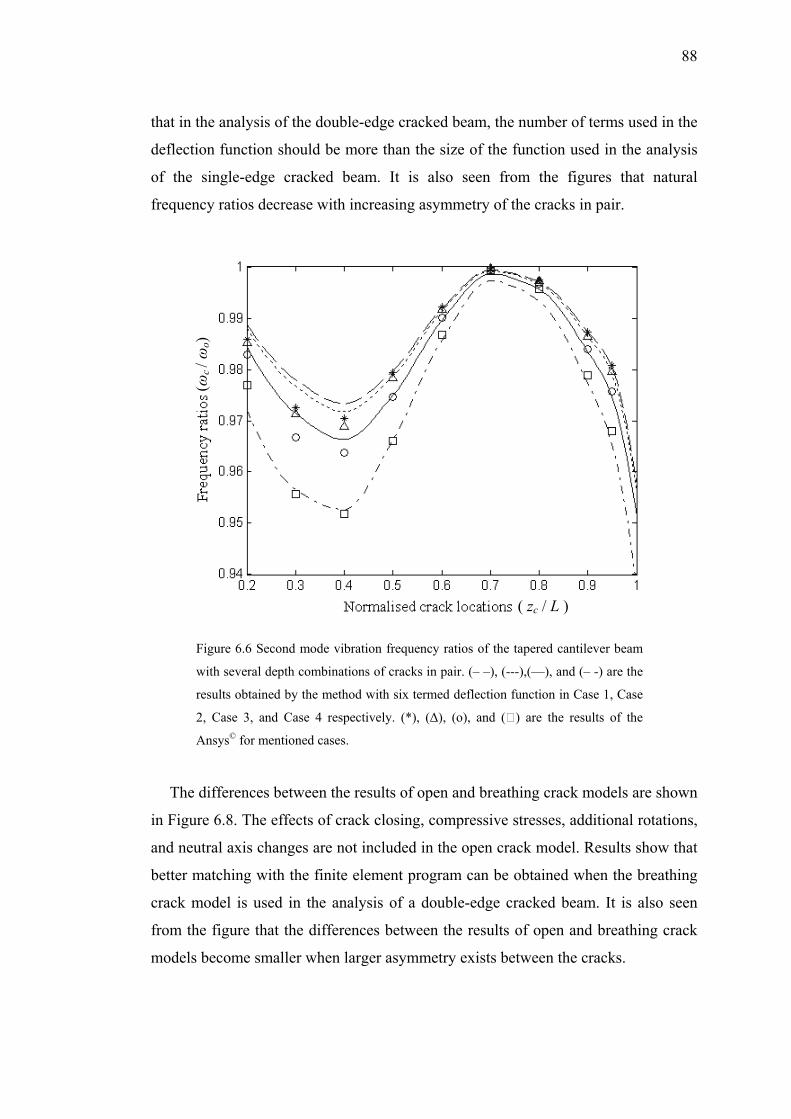
88
that in the analysis of the double-edge cracked beam, the number of terms used in the
deflection function should be more than the size of the function used in the analysis
of the single-edge cracked beam. It is also seen from the figures that natural
frequency ratios decrease with increasing asymmetry of the cracks in pair.
(ωc / ω
o)
( zc / L )
Figure 6.6 Second mode vibration frequency ratios of the tapered cantilever beam
with several depth combinations of cracks in pair. (– –), (---),(—), and (– -) are the
results obtained by the method with six termed deflection function in Case 1, Case
2, Case 3, and Case 4 respectively. (*), (∆), (o), and () are the results of the
Ansys© for mentioned cases.
The differences between the results of open and breathing crack models are shown
in Figure 6.8. The effects of crack closing, compressive stresses, additional rotations,
and neutral axis changes are not included in the open crack model. Results show that
better matching with the finite element program can be obtained when the breathing
crack model is used in the analysis of a double-edge cracked beam. It is also seen
from the figure that the differences between the results of open and breathing crack
models become smaller when larger asymmetry exists between the cracks.

89
(ωc / ω
o)
( zc / L )
Figure 6.7 Second mode vibration frequency ratios of the tapered cantilever beam
with several depth combinations of cracks in pair. (– –), (---), and (—) are the
results obtained by the method with nine termed deflection function in Case 1, Case
2, and Case 3 respectively. (*), (∆), and (o) are the results of the Ansys© for
mentioned cases.
6.4 Conclusion
A method is presented to obtain the vibration of non-uniform beams having
symmetric and asymmetric double-edge breathing cracks. The open crack model
presented by Mazanoglu, Yesilyurt, & Sabuncu (2009) is modified by taking into
account the effects of crack closing and compressive stress in addition to crack
opening and tensile stress for modelling the breathing cracks. In addition to the direct
effect of extra cross-section decrease, the effects of neutral axis yawing due to the
difference between the opening and closing amounts and neutral axis shift due to the
depth difference of the cracks in pair are also included in the model. The energy
effects of the rotary inertia are also taken into consideration. Overall energy is
analysed by the Rayleigh–Ritz approximation method.

90
(ωc / ω
o)
)
Figure 6.8 (a) First mode and (b) second mode natural frequen
method using (a) six termed and (b) nine termed deflection
including breathing (—), and open (---) crack models are com
the Ansys© figured by (*), (∆), and (o) representing Case
respectively.
This chapter presents the first application of the vibrati
beams having double-edge cracks. Up until now, there ha
literature for analysing the vibration of beams with asym
although symmetric double-edge crack models have be
beams. The model presented in this chapter is valid
( zc / L
cy ratios obtained by the
functions. The method
pared with the results of
1, Case 2, and Case 3
on analysis of non-uniform
s been no work in existing
metric double-edge crack
en presented for uniform
for both single-edge and
91
symmetric double-edge cracks. The model has also the capability of analysing the
vibration of beams with different depth combinations of asymmetric double-edge
cracks.
Results of the method including open and breathing crack models are compared
and examined in this chapter. When the results we obtain for the double-edge
cracked beams are compared with the results of the finite element program, we see
that the results of the breathing crack model are more accurate than that of the open
crack model. The differences between the results of open and breathing crack models
become negligible for the single-edge cracks.
In the chapter, it is shown that higher modes of vibration frequencies require
larger number of terms to use in the deflection function. It is also observed that an
extended number of terms are required for analysing the vibration of double-edge
cracked beams. This means vibration analysis of the double-edge cracked beams
needs more time than that of the single-edge cracked beams. However, a significant
advantage of the method is the performing of the calculation process in a short period
of seconds when the method compared with the finite element program. Thus,
natural frequencies required for the frequency based inverse methods can be easily
obtained for different beams.

CHAPTER SEVEN
A FREQUENCY BASED ALGORITHM FOR DETECTING DOUBLE
CRACKS ON THE BEAM VIA A STATISTICAL APPROACH USED IN
EXPERIMENT
7.1 Introduction
Any physical or chemical influences can result in flaws that lead to change of the
dynamic behaviour of the structures. Exact identification of these changes is
significantly important for the success of vibration based crack identification
methods which are supported by the theoretical vibration models. Crack
identification methods on direct use of several practical applications of
measurements and vibration monitoring may not need a theoretical vibration model.
These methods are generally based on the inspection of mode shape changes and
need measurements with very high quality. They require expensive data acquisition
and monitoring systems having the properties such as multiple sensors, high
sensitivity, large hard disc capacity, and fast processing. Ideal system for the crack
identification should be inexpensive, non-invasive and automated, so that subjective
operator differences are avoided.
This chapter presents a method for identification of double cracks in beams and
the processes minimising the measurement errors in experiment. Energy based
numerical method is used in the vibration analyses for determining the natural
frequencies of the cracked beam. Prediction tables including the natural frequency
ratios are prepared by using the theoretical model for different depth and location of
single crack on the beam. Prediction table is expanded by interpolating the data in
both crack location and crack size directions. In resulting frequency map, contour
lines representing the measured frequency ratios are easily utilised for identification
of a single crack. However, if the beams have two cracks, contour lines cannot be
directly used due to the necessity of plotting contours for all different location and
depth combinations of cracks. This problem is solved by an algorithm presented in
this chapter. Algorithm makes it available the approximation to the exact location
92

93
and size of both cracks after initial estimation done for one of the crack. Efficiency
of the algorithm is checked by both experimental frequency ratios and the ratios
obtained by commercial finite element program (ANSYS©). Errors in measured
natural frequencies are minimised by means of presented statistical approach called
‘Recursively scaled zoomed frequencies (RSZF)’. In this approach, measured
frequencies are corrected by mean value of the natural frequencies observed from the
interpolated frequency data determined in different frequency scales. A process
called ‘Derivative aided spline interpolation (DASI)’ is used as an interpolation
method for obtaining changes in peak characteristics in the frequency spectra.
Methods are verified by the experimental natural frequencies measured from the
cantilever beams. Measured natural frequency ratios, which will be obtained more
sensitively by means of RSZF, are given as inputs into the algorithm. Experiments
show that both cracks are detected with acceptable deviations.
7.2 Algorithm for Detecting Double Cracks
A prediction table formed by the natural frequency ratios obtained for all location
and depth ratio of single crack is used as base data. Any correct cracked beam
vibration model can be utilised for preparing the prediction table. However, speed of
solution method and its adaptation to the automation is critically significant. Map of
the frequency falling ratios is formed by interpolating prediction table in both
location ( ) and depth ratio ( ) directions. Measured frequency ratios are meshed
with the frequency ratios in the map and corresponding contour lines are plotted. If
the contour lines for the first three modes are intersected at the same position in the
map, it is known that there is one crack at that position which gives the location and
depth ratio of the crack. However, if the contour lines intersect at the different
positions, it can be judged that there is more than one crack. In this case, a position
for one of the crack is predicted under the contour lines of measured frequency
ratios. Because, the frequency ratio caused by one predicted crack should be found
higher than the frequency ratio caused by two cracks. Remaining frequency fall
should be the effect of the second crack and helps for determining the position of that
crack in the map.
cz cr

94
Here, the relation between the frequency ratios of a double cracked beam and the
frequency ratios of two beams each sharing those cracks should be described. In
most cases, minor effect of cracks interaction can be neglected such that a local
flexibility model is used. Thus, the frequency ratio of the double cracked beam can
be simply formulated as:
)2()1()( cfcfdcf rrr = , (7.1)
where and are the frequency ratios obtained from the separate single
cracked beams.
)1(cfr )2(cfr
When one of the positions is selected for the first crack, frequency ratios
corresponding to this position, , are found. Frequency ratio caused by the
second crack, , can be determined by using the ratio of measured frequencies as
the ratio of double cracked beam, , in Equation (7.1). Since the estimated crack
position is not exactly true, contour lines plotted for the second crack caused
frequency ratios of different vibration modes will intersect at the different positions
in the map. Four contour lines corresponding to four natural frequencies are used in
the algorithm. If the first four natural frequencies are used, intersection positions of
the contour lines for the mode couples 1-2, 1-3, and 1-4 are determined. Sometimes,
there can be more than one intersection points for one mode couple. In this case,
intersection points causing the trio having minimum positional variance are selected
as critical intersection points. Positional variance values are calculated by
multiplying the standard deviations in both location and depth ratio directions. In the
inner loop, minimum positional variances are calculated for the first crack’s selected
position and four surrounding positions of it. Distance from the surrounding
positions to the selected position is identified by the step size.
)1(cfr
)2(cfr
)(dcfr

95
Figure 7.1 Schematic example for the selection of the new converged position in the loop.
he new converged position of the first crack and the next step size are
de
Intersection points of the contour lines for the modes 1 and 4
T
termined in the judge module. Normally, the position, which results in the lowest
of the minimum positional variance, should be the next selected position in the loop
logically closer to the first exact crack position. If the lowest of minimum positional
variances is obtained for the selected or previously selected first crack’s positions,
new position is selected through the remaining surrounding points. In the inner loop,
sometimes contour lines for one of the mode couples may not be intersected, and
thus the intersection point is not observed for that mode couple. Therefore, this point
is also eliminated in selection. This case is represented in Figure 7.1 as an example.
In the figure, the point of first crack symbolised by cross-circle does not cause
intersection of the contour lines for the modes 1 and 4. It is also seen that the other
first crack’s points result in two possible intersection points of contour lines for the
modes 1 and 4. Through them, the points causing minimum positional variances are
selected for the mode couple 1-4. Since the lowest of the minimum positional
variances is obtained by the point symbolised by a star, this will be the next selected
point in the loop as shown in Figure 7.1. When the contour lines of all mode couples
are not intersected, which means there is no corresponding frequency ratio of the
Predicted points for the first crack
Intersection points of the contour lines for the modes 1 and 2
Intersection points of the contour lines for the modes 1 and 3
Critical intersection points for the modes 1 and 4 Eliminated points Eliminated point
Cra
ck d
epth
ratio
( a
/ hc )
The trio causing the lowest of minimum positional variances Next selected
point in the loop
Normalised crack location ( zc / L )
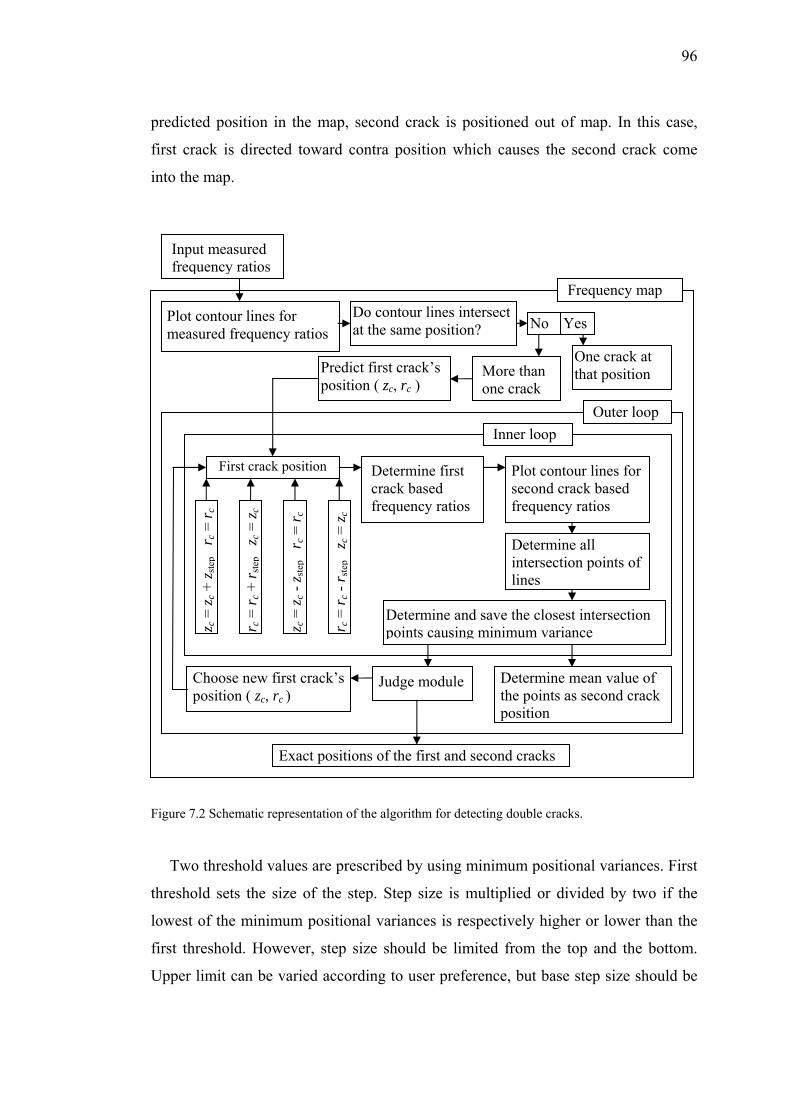
96
predicted position in the map, second crack is positioned out of map. In this case,
first crack is directed toward contra position which causes the second crack come
into the map.
Input measured frequency ratios
Figure 7.2 Schematic representation of the algorithm for detecting double cracks.
Two threshold values are prescribed by using minimum positional variances. First
thr
eshold sets the size of the step. Step size is multiplied or divided by two if the
lowest of the minimum positional variances is respectively higher or lower than the
first threshold. However, step size should be limited from the top and the bottom.
Upper limit can be varied according to user preference, but base step size should be
Predict first crack’s position ( zc, rc )
Plot contour lines for second crack based frequency ratios
Determine first
crack based frequency ratios
Determine all intersection polines
ints of
Determine and save the closest intersection points causing minimum variance
First crack position
z c =
z c +
z ste
p r c
= r c
r c =
r c +
r ste
p z c
= z c
z c =
z c -
z step
r c
= r c
r c =
r c -
r step
z c
= z c
Plot contour lines for tios
Frequency map
measured frequency ra
Outer loop Inner loop
Determine mean value of the points as second crack position
Choose new first crack’s position ( zc, rc )
Judge module
Exact positions of the first and second cracks
Do contour lines intersect No Yes at the same position?
One crack at that position More than
one crack

97
equal to the distance between the neighbour points in the map. For each estimated
first crack position, corresponding second crack position can be determined as mean
of the mode intersection points. Process continues until the lowest of the minimum
positional variances decreases under the second threshold value defined for stopping
the outer loop. Schematic representation of the algorithm is presented in Figure 7.2.
7.3 Processes for Obtaining the Best Frequency Ratios in Measurement
is well known that natural frequencies of the structure can be easily found by
the
It
frequency response function (FRF) which gives the relation between the
excitation and response in frequency domain. FRF can be simply defined as the ratio
of the Fourier transform of response to the Fourier transform of the excitation.
Discrete Fourier transform of any signal can be formulated as follows:
NnkiN
nenskS
π21
0)()(
−−
=∑= 0=k to 1−N (7.2)
owever, measured frequencies are bounded by several limits such as sensor
sen
statistical method supported by interpolation of the frequency data can be useful
for
H
sitivity and resolution. In the frequency spectra, the frequency index spacing can
be minimised by using many samples or low sampling frequency. Nyquist criterion
states that half of the sampling frequency cannot be lower than the aimed measured
frequencies. Moreover, even if this criterion is satisfied, sensitivity decreases as the
frequency approaches to the Nyquist limit. In addition, long time data requires more
disk capacity for storing and more memory for processing.
A
minimising the measurement errors even if larger sampling frequency and shorter
time data are used. The method of RSZF presented in this chapter minimises the
measurement errors without the need of repeating the experiments for taking
statistical data. Several frequency spectra are obtained in one experiment by
decreasing the length of time data N to XN − . Correspondingly, in the interval
20 sff <≤ , while there are N equ les with spacing ( )idistant samp Nff s 2=δ at

98
first, reduced data include XN − samples with spacing ( )( )XNff s −= 2δ .
Observed natural frequencies change due to the use of different frequency scale. In
addition, there can be changes in peak characterisation for all different frequency
scales. More approximate peak values are obtained by interpolating the frequency
data. Classical spline interpolation may be utilised directly on the frequency data, but
changes in peak characterisation are obtained better by applying the DASI method. If
)(kS is the frequency data indexed by 0=k to 1−N derivative of )(kS can be
n as follows:
writte
( ))()1(1)( kSkSf
k −+=δ
, dS 0=k to 2−N (7.3)
yadic spline interpolation is applied on the derivative of the frequency data and
int
D
erpolated derivative, )(int kdS is obtained for 0=k to 1)1(2 −−N . Then, inverse
differentiation gives the (int k ngth 12interpolated frequency data, having le)S −N .
S )0()0(int S= ,
)1(12
)1 +−()( intintint −−
= kdSNf
SkS s , k 1=k to . (7.4)
his process is repeated as long as the frequency data reach to the length meeting
req
22 −N
T
uired sensitivity. After R reputation of the dyadic interpolation, length of the
interpolated data will be ( ) 112int −−= NN R .
As a result, frequency data are rescaled by reducing data length for each return
and different natural frequencies are obtained for all different frequency scales,
although the interpolation minimise the discrepancies. Therefore, mean value of the
natural frequencies found in each return is taken as exact natural frequency. The
processes for the RSZF and DASI are schematically summarised in Figure 7.3.

99
Time data Frequency dataFRF Derivative aided
Figure 7.3 Schematic representations for RSZF and DASI processes.
7.4 Results and Discussion
uccess of the algorithm is checked by using the natural frequency ratios of the
do
n aluminium alloy cantilever beam, which is utilised in the experiment, is also
sim
S
uble cracked cantilever beam obtained by the commercial finite element program.
These ratios are given as inputs into the algorithm which uses prediction tables
prepared by theoretical frequency ratios. Modal properties used in the finite element
program are given in Section 3.5.
A
ulated in the finite element program for checking the efficiency of the algorithm.
In the first example, cracks are simulated at the normalised locations of 0.3 and 0.6
which are positioned from the free end. Their depth ratios are taken to be 0.35 and
0.25 respectively. These cracks are detected using the algorithm at the normalised
location 0.63 with depth ratio 0.23 and the normalised location 0.31 with depth ratio
0.375. Small differences between the exact and detected positions are caused by the
differences between the theoretical frequency ratios and the ratios obtained by the
commercial finite element program. The algorithm is checked by selecting four
spline interpolation
Decreased data t
Interpolated
length in the nexloop
frequency data
Save natural frequencies
Series of natMean Exact natural ural frequencies
Recursively scaled zoomed frequencies
Frequency data
frequencies
Differentiation Derivatives of the frequency data
Interpolat
on Dyadic spline interpolati
ed derivatives Inverse differentiation
Derivative aided spline interpolation

100
different starting positions in the map as shown in Figure 7.4. Contour lines represent
the input frequency ratios of the first four modes. In another example, cracks are
considered at the normalised locations 0.45 and 0.65 with the depth ratios 0.30 and
0.27 respectively. Figure 7.5 shows that cracks are successfully detected by the
algorithm starting from three different positions. In a final example, cracks simulated
at the normalised locations 0.25 and 0.80 are considered with depth ratios 0.35 and
0.15 respectively. Figure 7.6 shows the approximate detection of the cracks as a
result of searching the crack positions by starting from four different predicted first
crack positions.
Figure 7.4 Results of the algorithm for simulated beam slotted from the normalised
ti
Normalised crack location ( z / L )
Crac
k de
pth
ratio
( a
/ h )
0.9908
0.9690.969
0.9535
0.9535
0.9846
0.98460.9846
0.9846
0 0.1 0.2 0.3 0.4 0.5 0.6 0.7 0.8 0.9 10.1
0.15
0.2
0.25
0.3
0.35
0.4
0.45
( a /
h c )
( zc / L )
locations 0.3 and 0.6 with the depth ratios 0.35 and 0.25 respectively. (o) Initial
predictions for the first crack, (―, – –, – · –, ····) paths from predicted points to resulting
positions, (∆ ) resulting first crack position, (□) resulting second crack position. Input
frequency ra os: First mode 0.9908, second mode 0.969, third mode 0.9535, fourth mode
0.9846.

101
Figure 7.5 Results of the algorithm for simulated beam slotted from the normalised
at
As seen in Figures 7.4, 7.5 and 7.6, the algorithm searches the suitable orbit of the
fir
Normalised crack location ( z / L )
Crac
k de
pth
ratio
( a
/ h )
0.984
0.9667
0.9667 0.9805
0.98
05
0.98
05
0.9827
0.9827
0.98
27
0.9827
0 0.1 0.2 0.3 0.4 0.5 0.6 0.7 0.8 0.9 10.1
0.15
0.2
0.25
0.3
0.35
0.4
0.45
( zc / L )
( a /
h c )
locations 0.45 and 0.65 with the depth ratios 0.30 and 0.27 respectively. (o) Initial
predictions for the first crack, (―, – –, ····) paths from predicted points to resulting
positions, (∆ ) resulting first crack position, (□) resulting second crack position. Input
frequency r ios: First mode 0.984, second mode 0.9667, third mode 0.9805, fourth
mode 0.9827.
st mode contour for the predicted crack, and then follows that orbit since the
convenient contour lines for the second crack are investigated by using the first mode
contour lines intersected with the lines of other modes. Searching continues on that
orbit until the positional variance of possible second crack position decreases under
the predetermined threshold for stopping the search. When second crack goes out of
the map, it comes into the map by means of the first crack directed toward contra
position.

102
om the normalised
locations 0.25 and 0.80 with the depth ratios 0.35 and 0.15 respectively. (o) Initial
.
SZF and DASI methods, which increase the sensitivity and resolution of the
me
Normalised crack location ( z / L )
Crac
k de
pth
/ h
)
0.9922
0.9869
0.9869
0.9619
0.9619
0.9619
0.9609
0.9609
0.9609
0.9609
ratio
( a
0 0.1 0.2 0.3 0.4 0.5 0.6 0.7 0.8 0.9 10.1
0.15
0.2
0.25
0.3
0.35
0.4
0.45
( a /
h c )
( zc / L )
Figure 7.6 Results of the algorithm for simulated beam slotted fr
predictions for the first crack, (―, – –, – · –, ····) paths from predicted points to resulting
positions, (∆ ) resulting first crack position, (□) resulting second crack position. Input
frequency ratios: First mode 0.9922, second mode 0.9869, third mode 0.9619, fourth
mode 0.9609
R
asured data, are verified experimentally. An aluminium alloy cantilever beam is
used in experiment. The beam has the following geometric properties: 1010× mm2
cross-section and 36.0=L m length. Its elasticity module and density is determined
as 69=E GPa and 78 26=ρ kg/m3 respectively. Poisson ratio is taken as 3.0=ν .
Cracks are simulated as slots sawed by a fretsaw on site for supplying stable test
condition. Data acquisition is achieved by exciting the beam using impact hammer
and by taking the vibration response using a miniature accelerometer with negligible
weight 0.8g. Photos of test structure and measurement devices are given in Appendix
C. 30000 samples are collected with 6000 Hz sampling frequency to observe the first
four peaks of the natural frequencies in the frequency spectrum obtained from only
one experiment. When there is no crack on the beam, measured natural frequencies
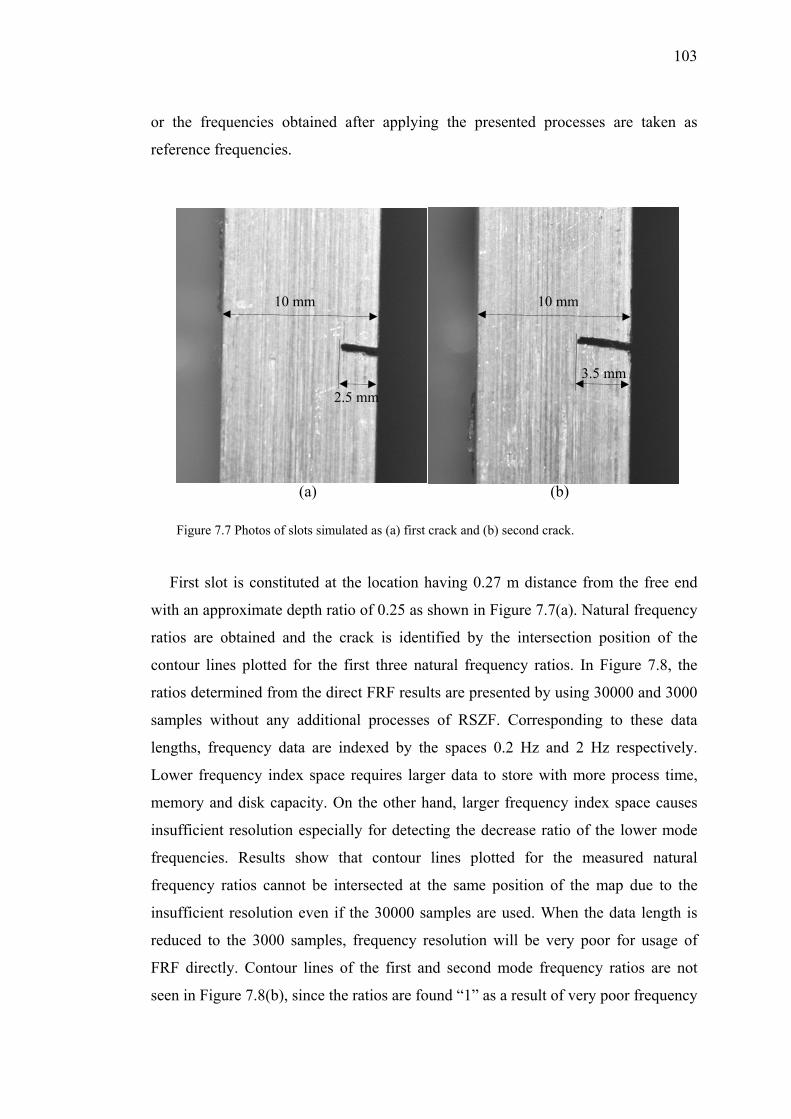
103
or the frequencies obtained after applying the presented processes are taken as
reference frequencies.
10 mm 10 mm
2.5 mm 3.5 mm
(a) (b) Figure 7.7 Photos of slots simulated as (a) first crack and (b) second c
irst slot is constituted at the location having 0.27 m distance from the free end
wi
rack.
F
th an approximate depth ratio of 0.25 as shown in Figure 7.7(a). Natural frequency
ratios are obtained and the crack is identified by the intersection position of the
contour lines plotted for the first three natural frequency ratios. In Figure 7.8, the
ratios determined from the direct FRF results are presented by using 30000 and 3000
samples without any additional processes of RSZF. Corresponding to these data
lengths, frequency data are indexed by the spaces 0.2 Hz and 2 Hz respectively.
Lower frequency index space requires larger data to store with more process time,
memory and disk capacity. On the other hand, larger frequency index space causes
insufficient resolution especially for detecting the decrease ratio of the lower mode
frequencies. Results show that contour lines plotted for the measured natural
frequency ratios cannot be intersected at the same position of the map due to the
insufficient resolution even if the 30000 samples are used. When the data length is
reduced to the 3000 samples, frequency resolution will be very poor for usage of
FRF directly. Contour lines of the first and second mode frequency ratios are not
seen in Figure 7.8(b), since the ratios are found “1” as a result of very poor frequency

104
resolution. The unchanged frequencies can be observed from the FRF results
represented by zooming of the spectra around the first two natural frequencies shown
in Figure 7.9(a).
Normalised crack location ( z / L )
Crac
k de
pth
ra h
)
0.9864
0.9984
0.9984
0.9875
0.9875
0.9875
tio (
a /
Figure 7.8 Contour lines of the measured natural frequency ratios obtained by the
0 0.1 0.2 0.3 0.4 0.5 0.6 0.7 0.8 0.9 10.1
0.15
0.2
0.25
0.3
0.35
0.40.45
Normalised crack location ( z / L )
Crac
k de
pth
h
)0.9863
0.9863
0.9863
direct FRF applied to the (a) 30000 and (b) 3000 samples of data. Modal frequency
ratios: (a) First mode 0.9864, second mode 0.9984, third mode 0.9875, (b) first mode
1, second mode 1, third mode 0.9863.
s a consequence, it is critically significant to obtain satisfactory results by
ad
A
ditional processes applied to the lower sized data. When only zooming process
using DASI is applied to the data having 3000 samples, measured frequencies are a
little modified. This change is recognised in the interpolated frequency spectra seen
in Figure 7.9(b) for the first two vibration modes.
ratio
(a
/
0 0.1 0.2 0.3 0.4 0.5 0.6 0.7 0.8 0.9 10.1
0.15
0.2
0.25
0.3
0.35
0.40.45
(a)
(b) ( zc / L )
( a /
h c )
( zc / L )
( a /
h c )

105
(i)
ii)
(a) (b)
(
Figure 7.9 Frequency spectra of (—) un-cracked and (---) cracked beam’s data
zoomed around (i) first and (ii) second natural frequencies (a) without any
How m each other and do not intersect at the
same position of map as shown in Figure 7.10(a). Here, the RSZF method including
DA
additional process, (b) with DASI process.
ever, contour lines are still apart fro
SI gives the best results. In the application of methods, frequency data are
interpolated 4 levels ( 4=R ), and time data are rescaled 20 times by decreasing the
data length 15 samples in each return. Results show that the best approximation is
observed for detecting the position of single crack in the map as shown in Figure
7.10(b).
Five different data are taken from the un-cracked and cracked conditions of the
same beam to ensure robustness of the experiment. In each measurement, the
observed natural frequencies change a little for higher vibration modes since the
sensitivity decreases as the frequencies increase.
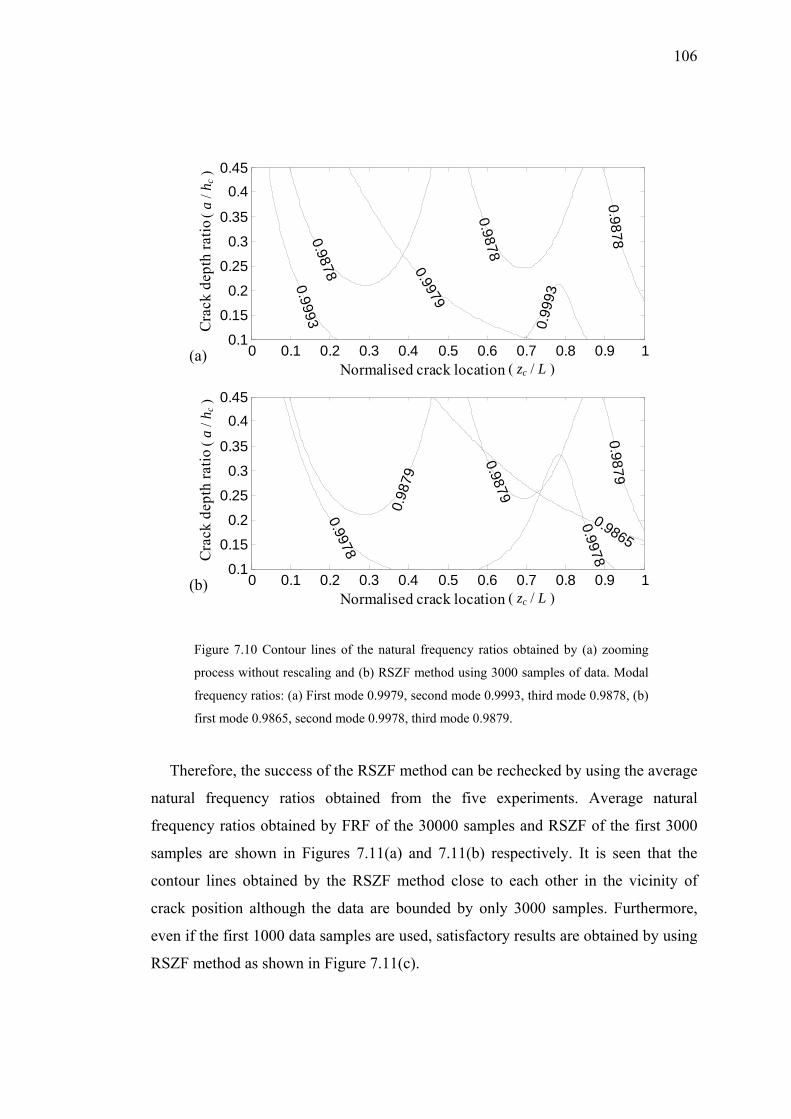
106
Normalised crack location ( z / L )
Crac
k de
pth
/ h
)
0.9979
0.99
93
0.9993
0.9878
0.9878
0.9878
ratio
( a
Figure 7.10 Contour lines of the natural frequency ratios obtained by (a) zooming
0 0.1 0.2 0.3 0.4 0.5 0.6 0.7 0.8 0.9 10.1
0.15
0.2
0.25
0.3
0.35
0.40.45
Normalised crack location ( z / L )
Crac
k de
pth
/ h
)
0.9865
0.9978
0.9978
0.9879
0.9879
0.98
79
process without rescaling and (b) RSZF method using 3000 samples of data. Modal
frequency ratios: (a) First mode 0.9979, second mode 0.9993, third mode 0.9878, (b)
first mode 0.9865, second mode 0.9978, third mode 0.9879.
herefore, the success of the RSZF method can be rechecked by using the average
na
T
tural frequency ratios obtained from the five experiments. Average natural
frequency ratios obtained by FRF of the 30000 samples and RSZF of the first 3000
samples are shown in Figures 7.11(a) and 7.11(b) respectively. It is seen that the
contour lines obtained by the RSZF method close to each other in the vicinity of
crack position although the data are bounded by only 3000 samples. Furthermore,
even if the first 1000 data samples are used, satisfactory results are obtained by using
RSZF method as shown in Figure 7.11(c).
ratio
( a
0 0.1 0.2 0.3 0.4 0.5 0.6 0.7 0.8 0.9 10.1
0.15
0.2
0.25
0.3
0.35
0.40.45
( zc / L )
( zc / L )
( a /
h c )
( a /
h c )
(a)
(b)

107
Normalised crack location ( z / L )
Crac
k de
pth
h )
0.9864
0.99
88
0.9988
0.9878
0.98
78
0.98
78ratio
( a
/
0 0.1 0.2 0.3 0.4 0.5 0.6 0.7 0.8 0.9 10.1
0.15
0.2
0.25
0.3
0.35
0.40.45
Normalised crack location ( z / L )
Crac
k de
pth
h )
0.98640.
9982
0.9982
0.9881
0.98
81
0.98
81
Figure 7.11 Contour lines of the natural frequency ratios obtained by (a) FRF using
30000 samples, (b) RSZF using 3000 samples and (c) RSZF using 1000 samples.
Modal frequency ratios: (a) First mode 0.9864, second mode 0.9988, third mode
0.9878, (b) first mode 0.9864, second mode 0.9982, third mode 0.9881, (c) first
mode 0.9868, second mode 0.9982, third mode 0.9883.
ratio
( a
/
0 0.1 0.2 0.3 0.4 0.5 0.6 0.7 0.8 0.9 10.1
0.15
0.2
0.25
0.3
0.35
0.40.45
Normalised crack location ( z / L )
Crac
k de
pth
h )
0.98680.99
82
0.9982
0.9883
0.98
83
0.98
83ratio
( a
/
0 0.1 0.2 0.3 0.4 0.5 0.6 0.7 0.8 0.9 10.1
0.15
0.2
0.25
0.3
0.35
0.40.45
( a /
h c )
( a /
h c )
( a /
h c )
( zc / L )
( zc / L )
( zc / L )
(a)
(b)
(c)

108
The e free
end w the single crack results that the
best approximations are obtained when the measured natural frequency ratios are
co
5 respectively. (o)
Initial predictions for the first crack, (―, – –, – · –, ····) paths from predicted points to
beam is slotted again from the location having 0.20 m distance from th
ith approximate depth ratio 0.35. It is seen from
rrected by RSZF. Therefore, when two cracks are investigated in the beam, RSZF
results obtained by using 3000 samples of data are given as inputs into the presented
algorithm. As shown in Figure 7.12, both cracks are positioned with acceptable
deviations in the map by means of the first four natural frequency ratios used in the
algorithm. The algorithm successfully approximates to the same crack positions
although it is started from four different predicted positions. Deviations from the
accurate crack positions are caused by the difference between the theoretical model
and the experiment.
Normalised crack location ( z / L )
Crio
( a
/ h )
0.9751
0.9646
0.9646
0.9875
0.9875
0.9875
0.958
0.9580.9580.958
0 0.1 0.2 0.3 0.4 0.5 0.6 0.7 0.8 0.9 10.1
0.15
0.2
0.25
0.3
0.35
0.4
0.45
ack
dept
h ra
t
( zc / L )
( a /
h c )
Figure 7.12 Results of the algorithm for the beam used in experiment slotted from the
normalised locations 0.55 and 0.75 with the depth ratios 0.35 and 0.2
resulting positions, (∆ ) resulting first crack position, (□) resulting second crack position.
Input frequency ratios: First mode 0.9751, second mode 0.9646, third mode 0.9875, fourth
mode 0.9580.
109
7.5
In this chapter, an algorithm that uses the map of the natural frequency ratios is
resented for detecting double cracks in beams. Sensitivity of the measured natural
increased by means of a statistical approach called ‘Recursively
scaled zoomed frequencies (RSZF)’ that uses an interpolation method called
‘D
gives satisfactory results for obtaining natural frequency prediction table. The
nu
cracks cause low frequency
falls. The methods are verified experimentally on cantilever beams which are
co
Conclusion
p
frequencies are
erivative aided spline interpolation (DASI)’ for obtaining increased resolution.
Success of the algorithm highly depends on the correctness of both the frequency
table and the measured natural frequencies. The frequency table is prepared by the
theory presented for single cracked beam. In the method, nine termed approximation
merical method allows forming a prediction table in a short time. It is convenient
for non-uniform beams. Success of the algorithm and the theoretical frequency table
are verified by double cracked beam’s frequency ratios obtained by the commercial
finite element program and used as inputs for the algorithm. The relation between the
frequency ratios of the single cracked and double cracked beams is simply settled by
using local flexibility model. The crack interaction effects can be negligible unless
the cracks are advanced and are too close to each other.
Measurement errors due to insufficient sensitivity and resolution are successfully
minimised by RSZF using DASI. Success of the processes is quite significant for
detecting cracks in the algorithm especially when the
nsidered to have single crack and double cracks. It is shown that RSZF supplies
higher sensitivity using lower data length. Thus, it prevents the user from the
additional process time, memory and disc capacity. DASI, which increases the
success of RSZF, interpolates the frequency data by considering the derivatives that
includes the effects of peak characterisation. The processes will especially be helpful
in detection of the higher modal frequencies obtained by low sensitivities and in
detection of the lower modal frequencies obtained by insufficient resolution in
measurement.

110
Robustness of the algorithm is represented in the examples using the input
frequencies obtained by the commercial finite element program and the experiment.
Although, the algorithm is started from different positions of the maps, cracks are
sat
owever, in many cases, there can be differences between the theoretical
and the measured natural frequencies of the un-cracked beams mainly for higher
mo
isfactorily positioned unless the first prediction is too far from the accurate
position.
The methods presented in this chapter contribute to the automated crack detection
systems. H
dal vibrations. Therefore, un-cracked beam’s data are used as references for zero
setting procedure in application. This procedure prevents complication in the
automated crack detection systems.

CHAPTER EIGHT
CONCLUSIONS
8.1 General Contributions of the Thesis
This doctorate study presents the flexural vibration analyses of multiple cracked
beams at first, to use in detection of the cracks. The work does not only consist of the
presentation of classical vibration theory, but also contains theoretical developments.
Vibrations of the multiple cracked non-uniform Euler–Bernoulli and Rayleigh beams
are analysed by the energy based numerical method. Vibration behaviours are
modelled for several types of multiple cracks in rectangular cross-sectioned beams.
In addition to the transverse edge cracks considered frequently in the literature, the
unusual cracks on the height-edge of the beams and the double-edge cracks with
asymmetric depths are also considered. Open and breathing cracks are modelled by
the rotational springs. Amount of the energy consumed due to the cracks and its
distribution along the beam are described for all types of cracks. Interactions of the
cracks in multiple cracked beams are also presented for different crack types.
In inverse problems, the method based on the frequency contour lines is employed
for detecting only one crack on the beams. As a contribution to current literature
addressing the inverse problems, a frequency based algorithm is developed for
detection of the double cracks on the beams. An automated single and double crack
detection system is settled by using the theoretical natural frequencies as references
and the measured frequencies as inputs. Another contribution is presented for more
reliable natural frequencies by supporting it with a statistical approach and an
interpolation technique. Measured frequencies are modified by the process that
results in more stable natural frequencies, which have minor changes in each
experiment, as the sensitivity and resolution of the data are increased. The process
results in the adequacy of the data having much less samples than the collected data.
Consequently, it prevents the user from the additional process time, memory and disc
capacity to use.
111
112
8.2 Overview of the Conclusions
Chapter 2 reviews current literature including the studies presented for cracked
beam vibration analyses and detection of the cracks. It is seen that a few study are
presented for continuous vibration analyses of cracked non-uniform beams
considered with the special forms. Furthermore, there is no work including general
formulations for the analyses of the multiple cracked non-uniform beams having
different boundaries and different crack models except for the papers extracted from
this thesis. In the most study, the transverse crack models are considered. However, a
good method used in the analysis should be adaptable for different conditions of
cracks and beams.
In measurement, frequency parameter is obtained easier to use in crack detection
when compared with determination of the other modal parameters. In addition,
measuring flexural vibration is much easier than measurements of the torsional and
the longitudinal vibrations that come into exist in higher frequency bands. Therefore,
the methods employing the natural frequencies of flexural vibration are generally
proposed in literature for detection of the cracks. However, a method for multiple
crack detection using only natural frequency drops has not been presented yet. These
lacks in current literature determine the scope of this doctorate study.
Chapter 3 introduces with the vibration analysis of the un-cracked beams and
presents continuous methods for the beams with multiple cracks and additional
masses. Results show that, analytical method with local flexibility model can only be
convenient for the analyses of uniform beams with a few numbers of cracks.
Furthermore, it requires defining local flexibility for each different discontinuity like
additional masses or steps. It also requires explaining solution form for each different
non-uniformity. On the contrary, the energy method can be successfully used in
different conditions of beam shaped structures. Therefore, energy used numerical
solution is proposed in this thesis and it is employed in following chapters for non-
uniform beams with different types of cracks.

113
Chapter 4 presents the modified energy method to obtain the vibration of multiple
cracked non-uniform Euler–Bernoulli beams. It is shown that, both the effects of the
stress field caused by the angular displacement of the beam and the strain energy
change caused by the crack should be taken into account for calculating the energy
consumed. Instead of the analytical methods, usage of the energy distributions in
numerical approaches simplifies the solution of non-uniform beams. However, these
approaches suffer from the interaction of crack effects in multiple cracked beams.
Proposal for the solution of this problem is presented in this chapter. It is observed
that double cracked beam behaves like a single cracked beam when both cracks come
closer to each other, as one would expect. Effects of truncation factors are evaluated
with respect to variation of the natural frequency ratios. It is clear that, the truncation
factor of beam’s height is much more effective than the truncation factor of beam’s
width.
In chapter 5, fracture mechanics theory is adapted to the height-edge open cracks
via a proposed model for the vibration behaviour of crack. The energy consumed is
determined by forming the opening of the crack and distributing the strain
disturbance along the beam’s length. If the beam has multiple cracks, it is shown that
the strain disturbance caused by one of the cracks is damped as much as the depth
ratio of the other cracks at their locations. Thus, interaction of the multiple crack
effects, which is the problem for the methods based on a variational principle, is
defined by the strain disturbance model presented for the height-edge cracks. Unique
plane vibrations obtained by the present method can be critical in measuring and
crack identification. Determination of the vibration characteristics in two planes
results in adequacy of lower frequency modes especially if the cross-section of the
beam is not square. It is observed that even if the beam has multiple cracks, the
solution time of the method does not rise as much as the solution time of the finite
element program.
In chapter 6, a method is presented to obtain the vibration of non-uniform
Rayleigh beams having symmetric and asymmetric double-edge breathing cracks.
The open crack model is modified by taking into account the effects of crack closing

114
and compressive stress in addition to crack opening and tensile stress for modelling
the breathing cracks. It is shown that, extra cross-section decrease, neutral axis
yawing due to the difference between the opening and closing amounts, and neutral
axis shift due to the depth difference of the cracks are all influential for modelling the
vibration of symmetric and asymmetric double-edge breathing cracks. The model is
valid also for single-edge cracks. When the results are compared with the results of
the finite element program, we see that the results of the breathing crack model are
more accurate than that of the open crack model. The differences between the results
of open and breathing crack models become negligible for the single-edge cracks.
Results show that higher modes of vibration frequencies require larger number of
terms to use in the deflection function. It is also observed that an extended number of
terms are required for analysing the vibration of double-edge cracked beams. This
means vibration analysis of the double-edge cracked beams needs more time than
that of the single-edge cracked beams.
In the chapters covering the methods presented for vibration analysis of cracked
beams, coupling effects are neglected. Bending-torsion, which is probably the most
coupling type, can have considerable influence if the cracks become deep enough.
However, admissible sized cracks do not have clear influence of coupling on the
lower modes of bending vibrations as obtained from the results. Advantages of the
numerical method can be its speed and its convenience for non-uniform beams. Thus,
natural frequencies required for the frequency based inverse methods like prediction
schemes or contour graphs can be easily obtained for each different beam. In
practise, it is not impossible to obtain exact natural frequency ratios represented in
figures. Sensitivity and resolution of the measurement system should be satisfactory.
Restriction caused by the sampling can be kept to a minimum by the acquisition of
long data with sufficient sampling frequency. Furthermore, sensitivity in the
frequency domain can be improved by several statistical methods.
In chapter 7, an algorithm that uses the map of the natural frequency ratios is
presented for detecting double cracks in beams. Sensitivity of the measured natural
frequencies are increased by means of a statistical approach called ‘Recursively
115
scaled zoomed frequencies (RSZF)’ that uses an interpolation method called
‘Derivative aided spline interpolation (DASI)’ for obtaining increased resolution.
Success of the algorithm highly depends on the correctness of both the frequency
table and the measured natural frequencies. Frequency table is prepared by the theory
presented for a single cracked beam. Success of the RSZF and DASI processes is
quite significant for detecting cracks in the algorithm especially when the cracks
cause low frequency falls. The methods are verified experimentally on cantilever
beam which is considered with single crack and double cracks. It is shown that RSZF
supplies higher sensitivity using lower data length. Thus, it prevents the user from
the additional process time, memory and disc capacity. DASI, which increases the
success of RSZF, interpolates the frequency data by considering the derivatives that
includes the effects of peak characterisation. The processes will especially be helpful
in detection of the higher modal frequencies obtained by low sensitivities and in
detection of the lower modal frequencies obtained by insufficient resolution in
measurement. The algorithm proposed for detection of double cracks is found robust.
Although, the algorithm is started form different positions of the maps, cracks are
satisfactorily positioned unless the first prediction is too far from the accurate
position. The methods presented in this chapter contribute to the automated crack
detection systems. However, in many cases, there can be differences between the
theoretical and the measured natural frequencies of the un-cracked beams especially
for higher modal vibrations. Therefore, uncracked beam’s data are used as references
for zero setting procedure in application. This procedure prevents complication in the
automated crack detection systems.
8.3 Scopes for the Future Works
Following research and development studies can be performed for vibration
analyses of the cracked beams and detection of the cracks:
Continuous vibration theories can be studied for different structures having cracks
such as stepped beams, frames, and plates. First of all, the cracked beam vibration
116
theory presented in this thesis can be adapted to multi-cracked stepped beams having
additional masses in near future.
The types of the cracks can be identified by using the experimental natural
frequencies measured in two vibration planes of bending. In addition, natural
frequency based inverse method used can be improved for detecting three or more
cracks in beams.
Spatial analysis methods can be developed for detection of cracks by using spatial
data taken from rarely located points. Advanced spatial data can be shaped by
proposed interpolation methods. In addition to spatial analysis by finding the global
values of considered parameters, the data set can be analysed in spatial–time domain
by investigating instant parameters such as frequency, damping and several statistical
values.
A theoretical crack model can be developed for the cracks in profile beam
elements called for example: U shaped, I shaped and T shaped profiles. Vibration
effects of cracks in different cross-sectioned beams like an airplane wings can also be
investigated in future works.

117
REFERENCES
Al-Said, S.M., Naji, M., & Al-Shukry, A.A. (2006). Flexural vibration of rotating
cracked Timoshenko beam. Journal of Vibration and Control, 12, 1271-1287.
Al-Said, S.M. (2007). Crack identification in a stepped beam carrying a rigid disk.
Journal of Sound and Vibration, 300, 863-876.
Angelo, G., & Arcangelo, M. (2003). On the continuous wavelet transforms applied
to discrete vibrational data for detecting open cracks in damaged beams.
International Journal of Solids and Structures, 40, 295-315.
Bamnios, Y., Douka, E., & Trochidis, A. (2002). Crack identification in beam
structures using mechanical impedance. Journal of Sound and Vibration, 256,
287-297.
Carden, E.P., & Fanning, P. (2004). Vibration based condition monitoring: A review.
Structural Health Monitoring, 3, 355-377.
Carneiro, S.H.S., & Inman, D.J. (2001). Comments on the free vibrations of beams
with a single-edge crack. Journal of Sound and Vibration, 244, 729-737.
Chang, C.-C., Chen, L.-W. (2005). Detection of location and size of cracks in the
multiple cracked beam by spatial wavelet based approach. Mechanical Systems
and Signal Processing, 19, 139-155.
Chang, C.C., Chang, T.Y.P., Xu, Y.G., & Wang, M.L. (2000). Structural damage
detection using an iterative neural network. Journal of Intelligent Material
Systems and Structures, 11, 32-42.
Chasalevris, A.C., Papadopoulos, C.A. (2006). Identification of multiple cracks in
beams under bending. Mechanical Systems and Signal Processing, 20, 1631-1673.

118
Chaudhari, T.D., & Maiti, S.K. (1999). Modelling of transverse vibration of beam of
linearly variable depth with edge crack. Engineering Fracture Mechanics, 63,
425-445.
Chaudhari, T.D., & Maiti, S.K. (2000). A study of vibration of geometrically
segmented beams with and without crack. International Journal of Solids and
Structures, 37, 761-779.
Chen, X.F., He, Z.J., & Xiang, J.W. (2005). Experiments on crack identification in
cantilever beams. Society for Experimental Mechanics, 45, 295-300.
Chen, X.F., Zi, Y.Y., Li, B., & He, Z.J. (2006). Identification of multiple cracks
using a dynamic mesh-refinement method. The Journal of Strain Analysis for
Engineering Design, 41, 31-39.
Cheng, S.M., Wu, X.J., Wallace, W., & Swamidas, A.S.J. (1999). Vibrational
response of a beam with a breathing crack. Journal of Sound and Vibration 225,
201-208.
Chinchalkar, S. (2001). Determination of crack location in beams using natural
frequencies. Journal of Sound and Vibration, 247, 417-429.
Chondros, T.G. (2001). The continuous crack flexibility model for crack
identification. Fatigue & Fracture of Engineering Materials & Structures, 24,
643-650.
Chondros, T.G., Dimarogonas, A.D., & Yao, J. (1998). A continuous cracked beam
vibration theory. Journal of Sound and Vibration, 215, 17-34.
Chondros, T.G., Dimarogonas, A.D., & Yao, J. (2001). Vibration of a beam with a
breathing crack. Journal of Sound and Vibration, 239, 57-67.

119
Christides, S., & Barr, A.D.S. (1984). One dimensional theory of cracked Bernoulli-
Euler beams. International Journal Mechanics Science, 26, 639-648.
Dado, M.H. (1997). A comprehensive crack identification algorithm for beams under
different end conditions. Applied Acoustics, 51, 381-398.
Dharmaraju, N., & Sinha, J.K. (2005). Some comments on use of antiresonance for
crack identification in beams. Journal of Sound and Vibration, 286, 669-671.
Dharmaraju, N, Tiwari, R, & Talukdar, S. (2004). Identification of an open crack
model in a beam based on force–response measurements. Computers and
Structures, 82, 167-179.
Dilena, M., & Morassi, A. (2004). The use of antiresonances for crack detection in
beams. Journal of Sound and Vibration, 276, 195-214.
Dilena, M., & Morassi, A. (2005). Damage detection in discrete vibrating systems.
Journal of Sound and Vibration, 289, 830-850.
Dimarogonas, A.D. (1996). Vibration of cracked structures: a state of the art review.
Engineering Fracture Mechanics, 55, 831-857.
Doebling, S.W., Farrar, C.R., & Prime, M.B. (1998). A summary review of
vibration-based damage identification methods. Shock and Vibration Digest,
30(2), 91-105.
Douka, E., Bamnios, G., & Trochidis, A. (2004). A method for determining the
location and depth of cracks in double-cracked beams. Applied Acoustics, 65, 997-
1008.

120
Douka, E., & Hadjileontiadis, L.J. (2005). Time–frequency analysis of the free
vibration response of a beam with a breathing crack. NDT&E International, 38, 3-
10.
Douka, E., Loutridis, S., & Trochidis, A. (2003). Crack identification in beams using
wavelet analysis. International Journal of Solids and Structures, 40, 3557-3569.
El Bikri, K., Benamar, R., & Bennouna, M.M. (2006). Geometrically nonlinear free
vibrations of clamped-clamped beams with an edge crack. Computers and
Structures, 84, 485-502.
Farrar, C.R., & Jauregui, D.A. (1998). Comparative study of damage identification
algorithms applied to a bridge: I. Experiment. Smart Mater. Struct., 7, 704-719.
Fernandez-Saez, J., & Navarro, C. (2002). Fundamental frequency of cracked beams
in bending vibrations: an analytical approach. Journal of Sound and Vibration,
256, 17-31.
Fernandez-Saez, J., & Rubio, L., & Navarro, C. (1999). Approximate calculation of
the fundamental frequency for bending vibrations of cracked beams. Journal of
Sound and Vibration, 225, 345-352.
Friswell, M.I., & Penny, J.E.T. (2002). Crack modelling for structural health
monitoring. Structural Health Monitoring, 1, 139-148.
Gounaris, G., & Dimarogonas, A.D. (1988). A finite element of a cracked prismatic
beam for structural analysis. Computers and Structures, 28, 309–313.
Hadjileontiadis, L.J., Douka, E., & Trochidis, A. (2005a). Fractal dimension analysis
for crack identification in beam structures. Mechanical Systems and Signal
Processing, 19, 659-674.

121
Hadjileontiadis, L.J., Douka, E., & Trochidis, A. (2005b). Crack detection in beams
using kurtosis. Computers and Structures, 83, 909-919.
He, Y., Guo, D., & Chu, F. (2001). Using genetic algorithm and finite element
methods to detect shaft crack for rotor-bearing system. Mathematics and
Computers in Simulation, 57, 95-108.
Hu, J., & Liang, R.Y. (1993). An integrated approach to detection of cracks using
vibration characteristics. Journal of Franklin Institute, 330, 841-853.
Khiem, N.T., & Lien, T.V. (2001). A simplified method for natural frequency
analysis of a multiple cracked beam. Journal of Sound and Vibration, 245, 737-
751.
Khiem, N.T., & Lien, T.V. (2002). The dynamic stiffness matrix method in forced
vibration analysis of multiple-cracked beam. Journal of Sound and Vibration,
254, 541-555.
Khiem, N.T., & Lien, T.V. (2004). Multi-crack detection for beam by the natural
frequencies. Journal of Sound and Vibration, 273, 175-184.
Kim, J.-T., Ryu, Y.-S., Cho, H.-M., & Stubbs, N. (2003). Damage identification in
beam-type structures: frequency-based method vs mode-shape-based method.
Engineering Structures, 25, 57-67.
Kim, J.-T., & Stubbs, N. (2003). Crack detection in beam-type structures using
frequency data. Journal of Sound and Vibration, 259, 145-160.
Kisa, M., & Gurel, M.A. (2006). Modal analysis of multi-cracked beams with
circular cross section. Engineering Fracture Mechanics, 73, 963-977.

122
Kisa, M., & Gurel, M.A. (2007). Free vibration analysis of uniform and stepped
cracked beams with circular cross sections. International Journal of Engineering
Science, 45, 364-380.
Krawczuk, M. (2002). Application of spectral beam finite element with a crack and
iterative search technique for damage detection. Finite Elements Analysis and
Design, 38, 537-548.
Lam, H.F., Lee, Y.Y., Sun, H.Y., Cheng, G.F., & Guo, X. (2005). Application of the
spatial wavelet transform and Bayesian approach to the crack detection of a
partially obstructed beam. Thin-Walled Structures, 43, 1-21.
Lee, J. (2009a). Identification of multiple cracks in a beam using natural frequencies.
Journal of Sound and Vibration, 320, 482-490.
Lee, J. (2009b). Identification of multiple cracks in a beam using vibration
amplitudes. Journal of Sound and Vibration, 326, 205-212.
Leonard, F. (2007). Phase spectrogram and frequency spectrogram as new diagnostic
tools. Mechanical Systems and Signal Processing, 21, 125-137.
Liang, L.Y., Choy, F.K., & Hu, J. (1991). Detection of cracks in beam structures
using measurements of natural frequencies. Journal of the Franklin Institute, 328,
505-518.
Li, Q.S. (2001). Dynamic behaviour of multistep cracked beams with varying cross
section. Acoustical Society of America, 109, 3072-3075.
Li, Q.S. (2002). Free vibration analysis of non-uniform beams with an arbitrary
number of cracks and concentrated masses. Journal of Sound and Vibration, 252,
509-525.
123
Liew, K.M., Wang, Q. (1998). Application of wavelet theory for crack identification
in structures. Journal of Engineering Mechanics, 124, 152-157.
Lin, H.P. (2004). Direct and inverse methods on free vibration analysis of simply
supported beams with a crack. Engineering Structures, 26, 427-436.
Lin, H.P., Chang, S.C., & Wu, J.D. (2002). Beam vibrations with an arbitrary
number of cracks. Journal of Sound and Vibration, 258, 987-999.
Loutridis, S., Douka, E., & Hadjileontiadis, L.J. (2005). Forced vibration behaviour
and crack detection of cracked beams using instantaneous frequency. NDT&E
International, 38, 411-419.
Luzzatto, E. (2003). Approximate computation of non-linear effects in a vibrating
cracked beam. Journal of Sound and Vibration, 265, 745-763.
Mahmoud, M.A., & Kiefa, M.A.A. (1999). Neural network solution of the inverse
vibration problem. NDT&E International, 32, 91-99.
Mares, C., & Surace, C. (1996). An application of genetic algorithms to identify
damage in elastic structures. Journal of Sound and Vibration, 195, 195-215.
Matveev, V.V., & Bovsunovsky, A.P. (2002). Vibration-based diagnostics of fatigue
damage of beam-like structures. Journal of Sound and Vibration, 249, 23-40.
Mazanoglu, K., & Sabuncu, M. (2010a). Vibration analysis of non-uniform beams
having multiple edge cracks along the beam’s height. International Journal of
Mechanical Sciences, 52, 515-522.
Mazanoglu, K., & Sabuncu, M. (2010b). Flexural vibration of non-uniform beams
having double edge breathing cracks. Journal of Sound and Vibration, 329, 4181-
4191.
124
Mazanoglu, K., Yesilyurt, I., & Sabuncu, M. (2009). Vibration analysis of multiple
cracked non-uniform beams. Journal of Sound and Vibration, 320, 977-989.
Mei, C., Karpenko, Y., Moody, S., & Allen, D. (2006). Analytical approach to free
and forced vibrations of axially loaded cracked Timoshenko beams. Journal of
Sound and Vibration, 291, 1041-1060.
Mohiuddin, M.A., & Khulief, Y.A. (1998). Modal characteristics of cracked rotors
using a conical shaft finite element. Computer Methods in Applied Mechanics and
Engineering, 162, 223-247.
Morassi, A., & Rollo, M. (2001). Identification of two cracks in a simply supported
beam from minimal frequency measurements. Journal of Vibration and Control,
7, 729-739.
Morgan, B.J., & Osterle, R.G. (1985). On-site modal analysis – a new powerful
inspection technique. Second International Bridge Conference, 108-114.
Nandwana, B.P., & Maiti, S.K. (1997a). Modelling of vibration of beam in presence
of inclined edge or internal crack for its possible detection based on frequency
measurements. Engineering Fracture Mechanics, 58, 193-205.
Nandwana, B.P., & Maiti, S.K. (1997b). Detection of the location and size of a crack
in stepped cantilever beams based on measurements of natural frequencies.
Journal of Sound and Vibration, 203, 435-446.
Narayana, K.L., & Jeberaj, C. (1999). Sensitivity analysis of local/global modal
parameters for identification of a crack in a beam. Journal of Sound and
Vibration, 228, 977-994.

125
Orhan, S. (2007). Analysis of free and forced vibration of a cracked cantilever beam.
NDT&E International, 40, 443-450.
Ostachowicz, W.M., & Krawczuk, M. (1991). Analysis of the effect of cracks on the
natural frequencies of a cantilever beam. Journal of Sound and Vibration, 150,
191-201.
Owolabi, G.M., Swamidas, A.S.J., & Seshadri, R. (2003). Crack detection in beams
using changes in frequencies and amplitudes of frequency response functions.
Journal of Sound and Vibration, 265, 1-22.
Ozturk, H., Karaagac, C., & Sabuncu, M. (2009). Free vibration and lateral buckling
of a cantilever slender beam with an edge crack: Experimental and numerical
studies. Journal of Sound and Vibration, 326, 235-250.
Pandey, A.K., Biswas, M., & Samman, M.M. (1991). Damage detection from
changes in curvature mode shapes. Journal of Sound and Vibration, 145, 321-332.
Panteliou, S.D., Chondros, T.G., Argyrakis, V.C., & Dimarogonas, A.D. (2001).
Damping factor as an indicator of crack severity. Journal of Sound and Vibration,
241, 235-245.
Papadopoulos, C.A. (2008). The strain energy release approach for modelling cracks
in rotors: A state of the art review. Mechanical Systems and Signal Processing,
22, 763-789.
Papaeconomou, N., & Dimarogonas A. (1989). Vibration of cracked beams.
Computational Mechanics, 5, 88-94.
Patil, D.P., & Maiti, S.K. (2003). Detection of multiple cracks using frequency
measurements. Engineering Fracture Mechanics, 70, 1553-1572.

126
Prabhakar, S., Sekhar, A.S., & Mohanty, A.R. (2001). Detection and monitoring of
cracks using mechanical impedance of rotor-bearing system. Journal of
Acoustical Society of America, 110, 2351-2359.
Pugno, N., Surace, C., & Ruotolo, R. (2000). Evaluation of the non-linear dynamic
response to harmonic excitation of a beam with several breathing cracks. 235,
749-762.
Qian, G.-L., Gu, S.-N, & Jiang, J.-S. (1990). The dynamic behaviour and crack
detection of a beam with a crack. Journal of Sound and Vibration, 138, 233-243.
Quek, S.-T., Wang, Q., Zhang, L., & Ang, K.-K. (2001). Sensitivity analysis of crack
detection in beams by wavelet technique. International Journal of Mechanical
Sciences, 43, 2899-2910.
Ratcliffe, C.P. (1997). Damage detection using a modified Laplacian operator on
mode shape data. Journal of Sound and Vibration, 204, 505-517.
Rizos, P.F., Aspragathos, N., & Dimarogonas, A.D. (1990). Identification of crack
location and magnitude in a cantilever beam from the vibration modes. Journal of
Sound and Vibration, 138, 381-388.
Rucka, M, & Wilde, K. (2006). Crack identification using wavelets on experimental
static deflection profiles. Engineering Structures, 28, 279-288.
Ruotolo, R., & Surace, C. (1997). Damage assessment of multiple cracked beams:
numerical results and experimental validation. Journal of Sound and Vibration,
206, 567-588.
Saavedra, P.N., & Cuitino, L.A. (2002). Vibration analysis of rotor for crack
identification. Journal of Vibration and Control, 8, 51-67.

127
Sabnavis, G., Kirk, R.G., Kasarda, M., & Quinn, D. (2004). Cracked shaft detection
and diagnostics: A literature review. The Shock and Vibration Digest, 36, 287-
296.
Salawu, O.S. (1997). Detection of structural damage through change in frequency: a
review. Engineering structures. 19, 718-723.
Sekhar, A.S. (2003). Identification of a crack in a rotor system using a model-based
wavelet approach. Structural Health Monitoring, 2, 293-308.
Sekhar, A.S. (2008). Multiple cracks effects and identification. Mechanical Systems
and Signal Processing, 22, 845-878
Shen, M.H.H., & Pierre, C. (1994). Free vibration of beams with a single-edge crack.
Journal of Sound and Vibration, 170, 237-259.
Shifrin, E.I., & Ruotolo, R. (1999). Natural frequencies of a beam with an arbitrary
number of cracks. Journal of Sound and Vibration, 222, 409-423.
Sih, G.C. (1973). Some basic problems in fracture mechanics and new concepts.
Engineering Fracture Mechanics, 5, 365-377.
Suresh, S., Omkar, S.N., Ganguli, R., & Mani, V. (2004). Identification of crack
location and depth in a cantilever beam using a modular neural network approach.
Smart Materials and Structures, 13, 907-915.
Tabarraei, A., & Sukumar, N. (2008). Extended finite element method on polygonal
and quadtree meshes. Computer Methods in Applied Mechanics and Engineering,
197,425-438.
Tada, H., Paris, P.C., & Irwin, G.R. (Eds.). (1973). The Stress Analysis of Cracks
Handbook. Hellertown Pennsylvania: Del Research Corporation.
128
Tsai, T.C., & Wang, Y.Z. (1997). The vibration of a multi-crack rotor. International
Journal of Mechanical Sciences, 39, 1037-1053.
Vakil-Baghmisheh, M., Peimani, M., Sadeghi, M.H., & Ettefagh, M.M. (2008).
Crack detection in beam-like structures using genetic algorithms. Applied Soft
Computing, 8, 1150-1160.
Wang, B.S., & He, Z.C. (2007). Crack detection of arch dam using statistical neural
network based on the reductions of natural frequencies. Journal of Sound and
Vibration, 302, 1037-1047.
West, W.M. (1984). Illustration of the use of modal assurance criterion to detect
structural changes in an orbiter test specimen. Air Force Conference on Aircraft
Structural Integrity, 1-6.
Yan, Y.J., Cheng, L., Wu, Z.Y., & Yam, L.H. (2007). Development in vibration-
based structural damage detection technique. Mechanical Systems and Signal
Processing, 21, 2198-2211.
Yang, J., Chen, Y., Xiang, Y., & Jia, X.L. (2008). Free and forced vibration of
cracked inhomogeneous beams under an axial force and a moving load. Journal of
Sound and Vibration, 312, 166-181.
Yang, X.F., Swamidas, A.S.J., & Seshadri, R. (2001). Crack identification in
vibrating beams using the energy method. Journal of Sound and Vibration, 244,
339-357.
Yokoyama, T., & Chen, M.-C. (1998). Vibration analysis of edge-cracked beams
using a line spring-model. Engineering Fracture Mechanics, 59, 403-409.

129
Yuen, M.M.F. (1985). A numerical study of the eigen parameters of a damaged
cantilever. Journal of Sound and Vibration, 103, 301-310.
Zhang, W., Wang, Z., Ma, H. (2009). Crack identification in stepped cantilever beam
combining wavelet analysis with transform matrix. Acta Mechanica Solida Sinica,
22, 360-368.
Zheng, D.Y., & Fan, S.C. (2001). Natural frequencies of a non-uniform beam with
multiple cracks via modified Fourier series. Journal of Sound and Vibration, 242,
701-717.
Zheng, D.Y., & Kessissoglou, N.J. (2004). Free vibration analysis of a cracked beam
by finite element method. Journal of Sound and Vibration, 273, 457-475.
Zhu, X.Q., & Law, S.S. (2006). Wavelet-based crack identification of bridge beam
from operational deflection time history. International Journal of Solids and
Structures, 43, 2299-2317.

130
APPENDICES
APPENDIX A
NOMENCLATURE
a crack depth
A area of cross-section
b width of a beam
BE energy balance equation.
C coefficients of harmonic and hyperbolic terms
CE the energy consumed
E modulus of elasticity
f natural frequency in the unit Hertz
sf sampling frequency
G strain energy release rate
NG normalised Gaussian function
h height of a beam
I second moment of inertia
J polar mass moment of inertia
k (1) stiffness, (2) frequency data index
1K stress intensity factor for the first mode crack
KE maximum kinetic energy
L length of the beam
m (1) total number of terms of polynomial mode shape function, (2) lumped
mass
M bending moment
n (1) total number of discontinuities like cracks or additional masses, (2) time
data index
N number of the data samples
PE maximum potential energy
cr crack depth ratio, ( cha / )
131
fr ratio between the frequencies of the cracked and un-cracked beams
s time data
S frequency data
w coordinate axis along the beams height
W transverse vibration mode shape of the beam.
X (1) deviation of the neutral axis, (2) decreasing amount of the data length
y coordinate axis along the beams width
z coordinate axis along the beams length
α (1) truncation (taper) factor of beam’s height or width, (2) displacement–
slope compatibility coefficient for crack location
β (1) additional effects of the closed crack on negative strain and compressive
stress, (2) frequency parameter γ (1) influence ratio of the energy consumed, (2) additional effects of the open
crack on strain and tensile stress
Γ distribution of the energy
fδ spacing between consecutive samples in frequency data
u∆ linear displacement at the opened side of crack
U∆ change in strain energy
v∆ linear displacement at the crack tip with the effect of material stress
V∆ change in stress energy
θ∆ angular displacement corresponding to the crack opening
φ∆ angular displacement of the beam due to the positive strain at the crack
location
ψ∆ angular displacement corresponding to the crack closing
ϕ∆ angular displacement of the beam due to the negative strain at the crack
location
ε a coefficient caused by the opening form of the edge crack
κ coefficient of the term of polynomial mode shape function.
λ slope–bending moment compatibility coefficient for lumped mass location µ displacement–shear force compatibility coefficient for lumped mass location
ν poisson ratio

132
ρ mass density χ term of polynomial mode shape function.
ω circular frequency
0ω natural frequency of un-cracked beam
c, dc subscript for the words “crack” and “double-edge crack”
d subscript for defining the direct effects of cross-section decreases
i crack and part numerator
j numerator of the mode shape terms
p abbreviation for the word “part”
s subscript for defining the effects of neutral axis shift
y subscript for defining the effects of neutral axis yawing
δ difference between the numerators of crack and part

133
APPENDIX B
SOME OF CRACKED BEAMS MODELLED IN ANSYS
Figure B.1 Transverse crack on the beam with an additional mass.
Figure B.2 Double-edge crack on tapered beam.
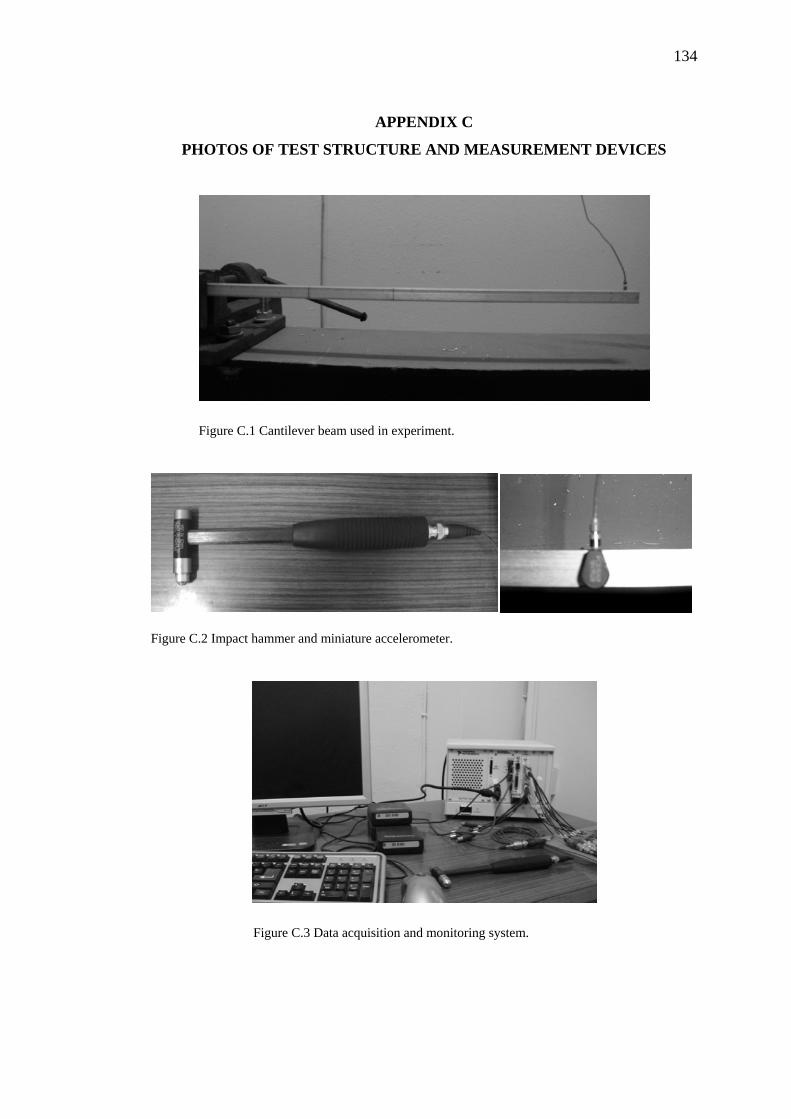
134
APPENDIX C
PHOTOS OF TEST STRUCTURE AND MEASUREMENT DEVICES
Figure C.1 Cantilever beam used in experiment.
Figure C.2 Impact hammer and miniature accelerometer.
Figure C.3 Data acquisition and monitoring system.