Venture Capital, the Regions and Public Policy: The United Kingdom since the Post2000 Technology...
49
1 VENTURE CAPITAL, THE REGIONS AND PUBLIC POLICY: THE UNITED KINGDOM SINCE THE POST-2000 TECHNOLOGY CRASH Colin Mason and Yannis Pierrakis Working Paper 09-02 November 2009 Hunter Centre for Entrepreneurship, University of Strathclyde Business School University of Strathclyde 14 th Floor, Livingstone Tower, Richmond Street, Glasgow, Scotland, G1 1XH T: 0141 548 3482
Transcript of Venture Capital, the Regions and Public Policy: The United Kingdom since the Post2000 Technology...

1
VENTURE CAPITAL, THE REGIONS AND PUBLIC POLICY: THE UNITED KINGDOM SINCE THE POST-2000 TECHNOLOGY CRASH
Colin Mason and Yannis Pierrakis
Working Paper 09-02
November 2009
Hunter Centre for Entrepreneurship, University of Strathclyde Business School University of Strathclyde 14th Floor, Livingstone Tower, Richmond Street, Glasgow, Scotland, G1 1XH T: 0141 548 3482

2
F: 0141 5527602 E: [email protected] W: www.entrepreneur.strath.ac.uk
VENTURE CAPITAL, THE REGIONS AND PUBLIC POLICY:
THE UNITED KINGDOM SINCE THE POST-2000
TECHNOLOGY CRASH
Colin Mason* and Yannis Pierrakis+
*Professor of Entrepreneurship, Hunter Centre for Entrepreneurship, University of Strathclyde,
Glasgow G1 1XH, Scotland. [email protected]
+ Head of Investment Research, NESTA, 1 Plough Lane, London EC4A 1DE, UK and
Research Associate, Cardiff Business School, Cardiff University CF10 3EU, Cardiff, Wales.
ABSTRACT. Early stage venture capital investments declined sharply following the post-2000 technology crash.
Investment activity began to pick-up by mid-decade, in large measure as a result of increased public sector
involvement, but has been brought to a halt by the global financial crisis. At the regional scale, several northern
regions now have more than their expected share of early stage venture capital investment. However, deal sizes are
small, hence early stage venture capital, measured by the total amount invested, remains over-concentrated in
London and the south-east. Moreover, the public sector now dominates much of the investment activity in the
midlands and north. The paper argues that public sector venture capital is unable to create entrepreneurial regions
and that a regionally-based model of public sector venture capital is ineffective because it lacks scale. A new
approach for venture capital-deficient regions is therefore required which gives greater emphasis to the demand-side.
Key words: venture capital, regions, regional policy, entrepreneurs
JEL: H7, G2, G3, R1, R5

3

4
1. INTRODUCTION
The venture capital industry is widely believed to be in crisis (Mason, 2009a). The „tech boom‟
of the late 1990s encouraged a huge inflow of money into venture capital, taking investment
activity to new peaks around the globe, both in terms of the amount of money under management
and the scale of investing. The subsequent „tech bust‟ at the turn of the 21st century resulted in a
collapse in venture capital investing. However, the huge inflow of investment into venture
capital in the late 1990s has had a longer term effect by driving down returns (Kedrosky, 2009).
Many venture capital funds raised their finance in 1999 and 2000 just before the tech bubble
burst. Thus, they were investing when valuations were high, competition for deals was fierce and
the „bubble‟ environment impaired their cognitive behaviour (Valliere and Peterson, 2004). Their
investments suffered high failures rates in the tech crash and because of the 10 year lifespan of
most venture capital funds1 they have been seeking exits when the markets have been depressed.
All of this has combined to produce a dismal investment performance. Post-bubble returns
remain well below their pre-bubble levels (BVCA, 2009). This, in turn, has had adverse effects
on the supply of venture capital. First, it has reduced the attraction of venture capital as an asset
class for institutional investors (Buckman, 2009), making it difficult for existing venture capital
firms to raise new funds and for new venture capitalists to enter the industry. In the UK the
average size of fund has fallen continuously since 2004, and just seven new funds were created
1 Venture capital typically operates on a 10 year closed-fund model. Having raised the finance for a fund, the initial
three or four years will be used to make new investments. In the following two or three years the fund will stop
making new investments and use its remaining cash to make follow-on investments in some of its existing portfolio.
In the final three years of the fund‟s life the managers will be seeking to harvest its profitable investments (through
IPOs and trade sales) and liquidate those investments with little or no value in order to be in a position to distribute
the returns to its investments (the limited partners) by year 10. The year in which the fund was raised therefore has a
critical influence on its returns (Bygrave and Timmons, 1992). Because of this 10 year investing cycle, the funds
that started investing in the late the 1990s were investing when valuations were high, suffered high failure rates in
the tech crash and have been looking to harvest their remaining investments in the mid 2000s when markets have
been depressed. This combination of factors has depressed their returns. For the same reasons, the lack of new
venture capital funds being created in the second half of the 2000s results in a shortage of venture capital in the
following three to five years.

5
in 2008 compared with two or three times that number in previous years (Pierakkis and
Westlake, 2009). Second, existing fund managers have sought to conserve their cash to meet the
financial needs of their existing investments and have largely stopped making new investments.
This has been reinforced by the lack of exit opportunities which has forced investors to stay
involved with their existing businesses for longer, further constraining their ability to make new
investments. As a consequence, the availability of venture capital has declined, particularly for
start-up and early stage businesses. Moreover, many commentators do not see this as a short-
term problem, arguing that the industry needs to downsize, perhaps by as much as half, in order
to improve its returns sufficiently to regain its status as a favoured asset class (Kedrosky, 2009).
This, in turn, has prompted government (in both the UK and other countries) to intervene with a
profusion of schemes – often regionally focused - designed to increase the supply of early stage
venture capital. Murray (2007: 174) notes that this is a clear signal “of venture capital‟s status as
an important instrument of entrepreneurial and innovation policy.”
By using a dataset that has not previously been used in academic studies of venture capital the
aim of this paper is to provide a novel and original insight into how the combination of these
changes in the supply of private sector venture capital and the growth of public sector
intervention have combined to significantly change the availability of venture capital both
nationally and at the regional level. The key finding is that the supply of venture capital in the
Midlands and north of England, along with Scotland, Wales and Northern Ireland is now
dominated by the public sector. We question whether regionally-based public sector funds are
an effective means of promoting an indigenous entrepreneurial capacity in economically lagging
regions and suggest alternative policy approaches.

6
2. ONE MORE TIME: WHY VENTURE CAPITAL IS IMPORTANT
Venture capital‟s importance in regional and national economic development is based on US
evidence of its role in encouraging innovation – a key driver of economic growth - by funding
the emergence and growth of new technology-based companies. New technology-based firms
have significant intangible assets (e.g. patents). They are likely to need funding to cover what
may be a lengthy period of negative earnings as they turn these intellectual assets into products
in advance of sales. Further substantial funding is also likely to be needed to „cross the chasm‟
from early adopters to mainstream customers. Their lack of tangible assets which could be used
as collateral and their uncertain prospects of commercial success means that they are unlikely to
be able to access bank loans. Venture capital is better able to address these challenges on account
of its skills in screening investment opportunities, providing post-investment monitoring and
support and structuring investments and because of the equity-based nature of its investments. As
a consequence, it is the most appropriate source of finance for new technology-based firms.
However, the need for venture capital funds to generate a large return on their investment in a
five to seven year time frame through an IPO or acquisition means that only certain types of
start-ups are candidates for this type of funding (Bhidé, 2007). Management needs to be capable
of rapidly building an enterprise. Venture capitalists normally avoid businesses that are trying to
create a market. Rather, “VCs tend to wait for evidence of sizeable sales in conjunction with a
large number of potential users who have not yet become customers” (Bhidé, 2007: 46). They
also avoid investing in mature markets. The business also needs a durable competitive
advantage. Typically this means that it has technological foundations in the form of their own or

7
someone else‟s patents (usually obtained prior to raising venture capital) and an incipient
technological advantage. However, venture capitalists avoid companies that are developing
ground-level technologies. Rather, venture capitalists seek to build on, or combine, the high level
knowledge that the business has already secured. Finally, venture capitalists look to invest in
businesses where rapid expansion has significant payoffs. That said, venture capitalists will make
a range of trade-offs amongst these criteria. For example, “exceptionally credible founders may
lead VCs to suspend their normal criteria for evaluating potential markets or competitive
advantages” (Bhidé, 2007: 51).
There are few, if any, dissenters from the view that venture capital plays a central role in the
emergence of new industries by funding and supporting innovative companies which later
dominate these industries. Indeed, Lerner and Watson (2008) argue that the venture capital
model is more effective in commercialising scientific discoveries than the corporate sector,
despite the latter‟s large expenditure on R&D. Venture capital investment speeds the
development of companies, enabling them to transform ideas quickly into marketable products
and become industry leaders through first mover advantages (Zhang, 2007). This, in turn, means
they are younger when they achieve an IPO compared with companies that were not venture
capital backed, and they sustain their success for much longer after their IPO (Gompers and
Lerner, 2001). Hellmann and Puri (2000, 2002) show that venture capital-backed companies aim
at more radical innovations, are significantly faster in introducing their products to the market
and pursue more aggressive market strategies than other start-ups.

8
For these reasons, policy-makers view venture capital as playing a central role in both innovation
policy – facilitating the commercialisation the science base – and entrepreneurship policy -
facilitating the emergence of high growth businesses - and so will intervene to address gaps in its
supply (Murray, 2007). The UK‟s new White Paper, New Industry, New Jobs, justifies
intervention on the grounds that “.... access to finance is an important barrier for business to
develop their full potential and .... must be regarded as a serious impediment to the UK‟s
economic success” (HM Government, 2009: 10).
Concerns about the diminishing volume of early stage venture capital investment has been a
recurring theme throughout the post-war era (Mason and Harrison, 1991a). The favoured
approach since the Labour Government came into office in 1997, has been hybrid funds
involving a combination of public and private investment, with incentives which enhance the
returns or lower the risk to attract private sector institutions to invest, and are managed by private
sector fund managers (Murray 2007). Examples include the Early Growth Funds, University
Challenge Funds; Regional Venture Capital Funds). Many of these funds are regionally focussed.
Both the English Regional Development Agencies and the development agencies in Scotland and
Wales have also created their own funds. A more recent development has been the creation of
publicly-funded co-investment funds which invest alongside private investors in the same deals.
These funds are intended to enhance their liquidity of private sector investors so that they can
make new investments which in many cases they would not otherwise make.2
2 There are two main models for co-investment schemes. One model is for the co-investment fund to pre-approve
investment partners and automatically match all of their investments that fall within the scheme‟s rules (e.g. in terms
of size, sector). The other main model involves matching investments made by investors who invest in deals from
approved sources (e.g. business angel networks).

9
3. DATA SOURCES
The paper draws on two data sources. The first is the annual reports on investment activity
published by the British Venture Capital Association (BVCA). This is based on a survey -
undertaken by PriceWaterhouseCoopers - of the Association‟s members which comprise the vast
majority of private equity and venture capital firms. It achieves a very high response rate, often
100%. The main limitation is that the statistics are reported in aggregate form, although are
broken down into detailed categories, for example, by stage, industry and region. In order to
probe beyond the BVCA‟s aggregate figures we utilise Library House data (now absorbed into
Dow Jones Venture Source) which reports individual investments along with various additional
information on the investor and business which enabled customised tables to be generated.3 It is
important to note that Library House‟s coverage of investment activity is narrower than that of
the BVCA, and in particular does not extend to private equity investments. In addition, its
database is built up from reported investments and so does not capture all the investments that
BVCA reports in its annual investments activity reports.4 In addition, the amount of information
that is provided about each investment in Library House‟s database is limited, which restricts the
amount of disaggregation possible. On the other hand, it does capture some investments, notably
those by angel groups and high net worth individuals making large business angel investments,
which are not included in BVCA investment statistics.5
The Library House database disaggregates the type of investments into two categories:
3 This source was also used by Pierrakis and Mason (2008). Some of the figures reported here may differ slightly
from those cited by Pierrakis and Mason (2008): (i) the Library House database is live and so is continually being
updated; (ii) further cleaning of the data by the authors. However, these changes do not change the observed trends
and the argument made by Pierrakis and Mason (2008). 4 Investments of £50,000 or more reported by Library House as a proportion of those in the BVCA statistics have
risen from 33% in 2000 to over 50% since 2005. 5 However, there is no source which provides a comprehensive coverage of angel investments (Mason and Harrison,
2008)

10
Those involving one or more private sector investors. This category primarily captures
venture capital firms, but also identifies investments made by some types of business
angels, notably investor networks (e.g. angel syndicates), family offices and named and
un-named high net worth individuals. On account of their size these investments are
much more visible than those of typical business angels. However, a key limitation of the
data is that investments by business angels are only identified where they have co-
invested with either private or public sector funds.
Those involving one or more publicly backed funds (e.g. Regional Venture Capital
Funds, University Challenge Funds). These are funds which have received some or all of
their capital from the public sector, including central government departments, regional
development agencies and the European Union (e.g. ERDF). They are normally managed
by independent fund managers.6
This information has enabled us to classify investments into the following categories:
Deals involving solely private sector investors. This includes both venture capital funds
and business angels.
Deals solely made by publicly-backed funds.
Deals - which we term co-investments - in which one or more private sector investors has
invested alongside one or more public sector funds. Investments in this category include
both ad hoc syndications between public sector funds and private investors and also
investments involving Co-Investment Funds that have been established specifically to
invest alongside private investors.
6 However, the database does not differentiate between co-investment funds and other public sector funds. So, for
example, investments made by the Scottish Co-Investment Fund, Scottish Seed Fund, Scottish Venture Fund and
Business Growth Fund are not separately identified but simply classified as „Scottish Enterprise‟.

11
Of course, public sector intervention in the early stage venture capital market goes beyond the
establishment of public sector funds. Tax-based incentives to encourage private investors to
invest in unquoted companies through the Enterprise Investment Scheme (EIS) and Venture
Capital Trusts (VCTs) are also very significant. However, the Library House database does not
identify investments made using the EIS and its coverage of investments by VCTs is very
patchy.7
4. VENTURE CAPITAL TRENDS IN THE UK SINCE 2000
4.1 Aggregate analysis
The UK boasts the largest private equity market in Europe, accounting for one in every three
investments. Statistics on investment activity collected by the British Venture Capital
Association (BVCA) show a trebling in the value of investments between 2003 and 2007 from
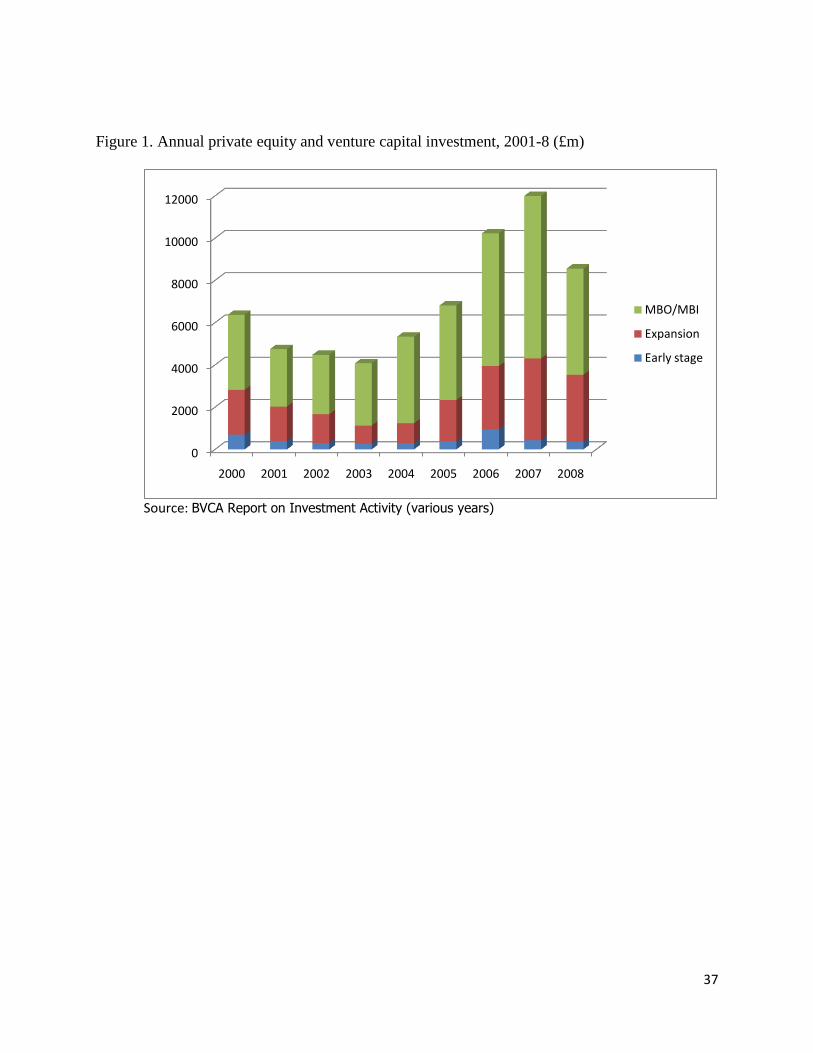
£4bn to nearly £12bn, after falling in the immediate aftermath of the „tech‟ collapse. However,
the value of investments fell by 28% in 2008 as the financial crisis took hold (Figure 1). In
contrast, the number of investments has remained fairly stable at around 1300 over the same
period.
Figure 1. Annual private equity and venture capital investment, 2001-8 (£m)
These statistics include all forms of private equity and not just venture capital. Closer
examination of the details behind these aggregate statistics indicates that this expansion in
7 Library House only reports the fund managers, not the specific fund. It only separately reports investments by
VCTs when they have „VCT‟ in their title.

12
investment activity has been in „private equity‟ rather than „venture capital‟, propelled by a huge
increase in funding for management buy-outs and buy-ins (MBOs and MBIs) (Figure 1). This
has had the effect of driving up the average (mean) size of investment over the period, peaking at
£9m in 2007, more than twice its 2001 value, dropping back to £6.7m in 2008. However,
reflecting the highly skewed investment size distribution, more than three-quarters of all
investments involve amounts of under £2m and around two-thirds are for under £500,000. These
proportions have risen since 2001.
TABLE 1 UK early stage investments 2001-8
Early stage investments have fallen since 2000 in terms of amount invested, apart from the
anomalous year of 2006, and their share of total investment activity has been less than 5% in
recent years (apart from 2006). Numbers of early stage investments, in contrast, have modestly
increased since 2000 (Table 1). Taken in conjunction with trends in the amount invested, this
indicates that there has been a decline in the average size of early stage investments. It is also
worthy of note that the number of early stage investments remained static in 2008 whereas the
amount invested fell by 17% (Table 1).
4.2 Types of investor - Total investments
The additional dimension which the Library House database adds is evidence on changes in the
supply of venture capital since the turn of the century. Specifically, it reveals that the public
sector has become considerably more important as an investor in both absolute and relative
terms. Deals involving public sector funds, either investing on their own or co-investing with

13
private investors (funds or individuals), have more than trebled between 2001 and 2007,
although both fell by 18% in 2008. This represents an increase in their share of investments from
19% in 2001 to 44% in 2008 (Figure 2). Meanwhile, free-standing private sector investments –
although increasing in numerical terms from 2002 until 2006 – have declined as a proportion of
total investment activity from 81% in 2001 to 56% in 2008. These trends – two sides of the same
coin - underline the growth and current scale of the public sector‟s involvement in one form or
another in the supply of venture capital.
Figure 2: Proportion of investments by type of investor, 2000-2008
The increasing significance of the public sector has risen on account of its growing use of co-
investment as an investment model. Co-investments accounted for 26% investments in 2008
compared with just 7% of all investments in 2001 (Figure 2). Indeed, public-private co-
investments are now the dominant form of public sector venture capital investment, reaching a
peak of 67% of all deals involving the public sector in 2007 compared with 37% in 2001, and
since 2005 has exceeded the annual number of free-standing investments by public-sector funds
(Figure 3a). One-third of private sector investments were co-investments with public sector
funds in 2008 compared with just 8% in 2001 (Figure 3b), underlining that a significant
proportion of private venture capital investment activity is now supported by the public sector.
Figure 3: Co-investments as a proportion of deals
Figure 4: Distribution of deals sizes by type of investor, 2007

14
These trends can be unpacked in two further respects. First, these various types of investors
occupy different parts of the funding spectrum (Figure 4). Private investors (funds and
individuals) had an average size of £3.7m in 2007 but a very wide size distribution, with 11% of
deals below £250,000 but 45% above £5m. The average public-private co-investment is smaller
at £1.5m, with 81% of investments at £2m and below. Deals involving only public sector funds
were largely confined to £500,000 and under (83%) (£378,000 average size). Second, wthin the
„private sector‟ business angels have become more significant in both absolute and relative
terms. Their investments increased more than threefold between 2001 and 2007, but then
dropped back by over one-quarter in 2008, while their share of private sector investment rose
from 13% to over 40% (Figure 5). Moreover, business angels and angel groups have become
increasingly prominent as co-investment partners, involved in more than 40% of all deals
annually in which public sector funds participated since 2005.
Figure 5: Number of investments with Business Angel involvement in the UK, 2001-2008
4.3 Types of investor - Early stage investments
We now turn our attention to early stage investments, defined as rounds 1, 2 and 3 investments
that are below £2m. This definition is used because the Library House database categorises deals
in terms of rounds rather than stage of business development.
The increased involvement of the public sector is even more apparent in the early stage venture
capital market. The involvement of the public sector in the supply of early stage venture capital
has increased significantly to a situation in which it accounts for the majority of such

15
investments (Figure 6). In 2001 public sector funds were involved in 36% of investments. By
2003, as the various funds established by the Labour Government came on stream, this had risen
to 51% and by 2008 accounted for 68% of all investments. This reflects the growth of co-
investment schemes which have risen from 10% of all investments in 2001 to more than 30%
since 2005. The proportion of public sector investments which are co-investment deals has risen
from 28% in 2001 to peak at 56% in 2007, falling back to 45% in 2008. Nevertheless private
sector investors remain important, both as free-standing investors and co-investment partners,
involved in more than 60% of all investments annually between 2001 and 2008 and in some
years this proportion was in excess of 70%. But what has happened, of course, is that an
increasing proportion of early stage private sector investments have been co-investments with
public sector funds, rising from 13% in 2001 to more than 45% since 2005, while the proportion
of independent private sector investments has fallen, accounting for just 32% of all investments
in 2008. Meanwhile, the composition of the private sector category has changed, with business
angels increasingly significant as a source of early stage investment at the expense of private
sector funds which have declined. Investments by business angels increased year-on-year
between 2001 and 2007, falling back in 2008, accounting for 44% all private sector investments
in 2008, compared with 16% in 2001, and from 12% of all early stage deals 2001 to 28% in
2008, after peaking at 32% the year earlier.
Figure 6: Early stage investments by year and type of investor 2000-2008
4.4 Summary

16
Year-on-year trends in early stage venture capital investment since the post-2000 technology-
crash have been volatile. Amounts invested have not recovered to their 2000 peak although the
number of investments have risen, reflecting an increase in investments of under £500,000. The
public sector has become proportionately more significant as an investor, largely on account of
the growth of public-private co-investment which is now the dominant way in which the public
invests in early stage companies. Private sector investors remain prominent in terms of the
number of investments they make, but are now much more likely to investment alongside the
public sector in co-investment deals. The composition of early stage private sector investors has
also changed, with an increase in the significance of investments by private individuals,
including „mega angels‟ investing alone, angel syndicates and other forms of organised angel
investing, and a decline in the significance of private sector venture capital funds.
5. VENTURE CAPITAL TRENDS IN THE UK REGIONS
In the remainder of this paper we extend this analysis by shifting focus from the national to the
regional scale. It addresses two empirical questions:
1. Does the geography of venture capital investments in the UK continue to be characterised
by regional inequalities, as previous studies have indicated (Mason, 1987; 2007; Mason
and Harrison, 1991b; 2002; Martin 1989; 1992; Martin et al, 2005)?
2. What has been the effect of the changes in the supply of venture capital, as described in
the previous section, on the geography of venture capital investments?

17
Answers to these questions will, in turn, inform a third question: what has been the effect of the
increased government intervention in the supply of venture capital, and the forms that this
intervention has taken, on the geography of venture capital in the UK in the early 21st century?
It is now well established that venture capital is not equally available in all parts of a country
(Mason and Harrison, 2002; Martin et al, 2005; Green, 2004; Florida and Kenney, 1988; Florida
and Smith, 1993; Zook, 2002). Indeed, some types of government intervention have specifically
focused on the „regional equity gap‟ with initiatives designed to increase the supply of venture
capital in specific regions and localities (Murray, 1998; Sunley et al, 2005). The uneven
geography of venture capital investing is typically explained as an outcome of the clustering of
venture capital funds in a small number of cities and the localised nature of venture capital
investing as a means of reducing uncertainty and thereby minimising risk (Florida and Kenney,
1988; Sorensen and Stuart, 2001; Mason, 2007). Venture capital firms do make long distance
investments, particularly as they mature (Sorensen and Stuart, 2001; De Clercq et al, 2001), but
this is normally in the context of syndicated investments with one or more other investors, and
where one of the other investors – usually the lead investor - is local to the investee business (see
Rosiello and Parris, 2009 for this feature in the UK biotechnology sector).
5.1 The regional distribution of venture capital investments: aggregate patterns
BVCA statistics on investment activity are disaggregated by region and have been used in
previous studies to examine the uneven geography of venture capital investments. There are
various ways in which to measure the regional distribution of venture capital investments.
Essentially there are three critical decisions. First, are venture capital investments

18
measured in terms of number of investments or amount invested? Second, what types of venture
capital investments are included? Investment statistics are disaggregated by stage of investment
(start-up, other early, expansion and MBO/MBI). Third, should venture capital investment in
each region be compared with that region‟s stock of companies, new firms or employment?
Different conclusions may arise depending on the choices made. In what follows we present the
regional distribution of venture capital in the form of location quotients which indicate each
region‟s share of early stage (i.e. start-up and other early stage) venture capital investments (both
number and amount) as a ratio of that region‟s share of national business activity (measured by
the number of VAT-registered companies). A value of over one indicates that a region has more
than its expected share of venture capital investments based on that region‟s share of the national
business population whereas a value of less than one indicates that its share is less than expected.
The analysis is presented for four separate time-periods which conform to aggregate investment
trends. This also has the advantage of smoothing some of the year-on-year fluctuations in
investment activity that are apparent at the regional scale.
TABLE 2. Distribution of early stage investments in the UK: number and region
TABLE 3. Distribution of early stage investments in the UK: amount invested and region
The regional distribution of early stage venture capital investments (Table 2) contrasts sharply
with the regional distribution measured in terms of amounts invested (Table 3). For the period
2005-7, regions with more than their expected share of venture capital investments by number
included both the core regions of London, the South East and East of England and also several
peripheral regions (North East, North West, Scotland). Regions with fewer than expected

19
investments included Yorkshire, the East Midlands, West Midlands, South West, Wales and
Northern Ireland. In 2008, when the onset of the financial crisis resulted in a downturn in
venture capital activity, London and the South East continued to have more than their expected
share of venture capital investments, along with the North West, North East, Scotland and also
the West Midlands and Northern Ireland (Table 2).
However, a rather different picture emerges when the amount invested is considered. For both
the 2005-7 and 2008 periods London and the South East both had more than their expected
shares of early stage venture capital. The East of England, East Midlands and Yorkshire also had
more than their expected shares of investment activity in the 2005-7 period, but in the latter two
regions (which both had lower than expected shares of venture capital investments by number )
this is an outcome of one atypical year and in the other years their location quotients were less
than one.8 In 2008 the regional distribution of early stage venture capital by amount was
dominated by London which attracted almost half of the total. Only London and the South East,
along with the North East, attracted more than their expected shares of early stage venture capital
by amount (Table 3).
Several regions therefore have significantly less than expected shares of venture capital
investment by value but a greater number of venture capital investments than expected. This
group comprises the North East (2005-7 only), North West, Northern Ireland, Scotland and West
Midlands (2008 only). The greater than expected volume of venture capital investments in these
8 Yorkshire‟s location quotient was 0.49 in 2005, 1.62 in 2006 and 0.38 in 2007. East Midland‟s location quotient
was 2.41 in 2005, 0.57 in 2006 and 0.64 in 2007.

20
regions clearly reflects their large numbers of small scale investments, a point that we return to
later.
How stable is this geographical distribution of venture capital investment over time? Comparing
the boom period of the late 1990s, the post 2000 downturn, the mid decade recovery and the
onset of the financial crisis (2008) reveals some contrasting trends for different regions:
London and the South East have both consistently attracted more than their expected
shares of early stage venture capital (both number and amount) across all four periods.
However, whereas London‟s share of early stage venture capital in terms of amount
invested has steadily increased over the past 10 years, from 22% in the boom years to
48% in 2008, the South East‟s share of both the number of investments and amount
invested has fallen over the same period.
East of England attracted more than its expected investment in the crash (2001-3) and
recovery (2005-7) periods
Scotland‟s position has deteriorated over the four periods in terms of its share of venture
capital investment by value, having more than its expected investment in the boom of the
late 1990s but less than its expected share in subsequent periods. This may be linked to
the privatisation of Scottish Enterprise‟s venture capital division at the turn of the century
(Hood, 2000). However, it has consistently had more than its expected share of
investments by number, reflecting the active role of Scottish Enterprise in the venture
capital market and, in particular, the launch of its very successful co-investment scheme
in 2003 (Hayton et al, 2008).

21
The North East and North West have significantly improved their positions since 2001 in
terms of having had more than their expected shares of venture capital investments, but
only in terms of numbers of investments.
Figure 7. Proportion of different types of investors in early stage deals in the UK regions 2000-
2008
5.2 The regional distribution of venture capital investments: types of investors
Using Library House data we are able to decompose the types of venture capital investors in each
region (Figure 7). Looking at the entire 2000-8 period, and only considering early stage
investments (defined as rounds 1-3 and under £2m), we find that there is a clear distinction
between, on the one hand London, the South East and East of England and, on the other hand,
the rest of the country in terms of the proportion of deals involving private and public sector
investors. Looking at the period as a whole, deals exclusively involving private investors
accounted for more than 70% of all investments in London, nearly two-thirds in the South East
and 60% in the East of England. In the South West and East Midlands the proportion of free-
standing private sector investments was around 40%, dropping to 32% in Scotland, around one-
quarter in Yorkshire, the North West, North East and Wales, and around 15% in West Midlands
and Northern Ireland. This means that in regions north and west of the Humber-Severn axis the
public sector is involved in upwards of three-quarters of early stage venture capital investments.
Moreover, the proportion of deals involving the public sector has risen over time, reaching over
90% in several regions in 2008 (Figure 8). However, the form of public sector intervention
varies. In Northern Ireland, Scotland and the North East co-investments between the public and
private sector dominate, accounting for 64%, 52% and 42% respectively of all investments,

22
whereas in the other regions with high proportions of public sector involvement – notably the
West Midlands, Wales, Yorkshire and the North West – free-standing public sector investments
account for 50% or more of all investments.
Figure 8: Proportion of investments involving the public sector by year by region
Figure 9: Proportion of early stage deals involving business angels by region
The Library House data also provides some insight into regional variations in the relative
significance business angels. However, as noted earlier, the data are partial, with business angels
only identified in deals where they have invested alongside venture capital funds. With this
important caveat, business angels are most prominent in Scotland, accounting for over one-third
of early stage investments and the North East where they account for 30%. They are least
significant in Yorkshire and The Humber, North West, Northern Ireland and Wales (Figure 9).
One way in which to interpret this regional pattern is in terms of the dominant form of public
sector intervention (fund or co-investment), discussed in the previous paragraph. There is an
association, at least in those regions that are at the extremes of the distribution, between the
relative importance of co-investments by the public sector and the relative importance of
business angels. It might be that business angels are crowded out in regions where the public
sector invests on its own whereas their numbers are boosted in regions with co-investment funds.
But based on the Scottish experience it may be that a well-developed angel market is actually a
pre-requisite for the successful operation of co-investment funds. The Scottish experience also
suggest that the successful operation of a co-investment fund provides a further boost to the
development of new angel groups (Hayton et al, 2008).

23
6. SUMMARY
The aim of this paper has been twofold: first, to update earlier evidence on the uneven geography
of venture capital in the UK (Mason and Harrison, 2002) and second, to probe below the
aggregate statistics provided by the British Venture Capital Association using deal specific
information to highlight regional variations in the composition of venture capital. At the national
scale the supply of early stage venture capital recovered during the mid 2000s after its collapse in
the wake of the technology crash in 2001 but fell back in 2008 with the onset of the financial
crisis. During this period the provision of early stage venture capital has changed, with public
sector venture capital funds becoming more important‟ largely as a result of the growth of co-
investment schemes which invest alongside business angels and private sector funds. Both public
sector funds investing on their own and private investors investing on their own have declined in
both relative and absolute significance since 2004-5. The composition of private sector investors
has also changed, with funds declining in significance and various types of business angels (high
net worth individuals and angel groups) becoming more important.
At the regional scale several northern regions have more than their expected shares of early stage
venture capital investments, measured by number of deals. At first glance this appears to be a
positive development. However, closer inspection reveals more disquieting features. First, the
high level of investment activity is largely a function of the public sector venture capital funds,
either investing on their own or in conjunction with private sector investors. Indeed, over the
period as a whole the public sector has been involved in more than three-quarters of the early
stage investments made in the midlands and north, rising to more than 90% in some regions in

24
2008. The proportion of free-standing private sector deals in these regions is correspondingly
low. Second, the average size of these investments is small, reflecting the small fund sizes and
maximum investment thresholds of public sector schemes. Early stage venture capital, measured
in terms of the amount invested, continues to be over-concentrated in core regions of southern
England as it always has been (Mason, 1987; Martin, 1989; 1992; Mason and Harrison, 1991b;
2002). So, from a regional perspective the UK now appears to have two early stage venture
capital markets. In London, the South East and, to a lesser extent, the East of England, private
sector investors dominate investment activity, investing for the most part on their own rather
than with public sector co-investors. This contrasts with the remainder of the UK where the early
stage venture capital market is under-pinned by extensive public sector involvement. In some
regions this takes the form of free-standing investments by public sector funds whereas in other
regions it takes the form of co-investments with the private sector. Private investors investing on
their own account for only a minority of investments in these regions and have been more likely
to invest alongside the public sector in co-investment deals than on their own. Moreover, this gap
between London and the South East and the rest of the country has widened since 2001, during
periods of both declining and expanding venture capital investment activity.
7. POLICY IMPLICATIONS
Northern regions of the UK are increasingly dependent on the public sector to supply venture
capital. The key policy question is whether public sector venture capital is an effective means of
achieving regional development. Emerging evidence is not encouraging (Nightingale et al,
2009). Companies that have received funding from public sector venture capital funds have not
performed significantly better than matched firms which did not receive funding from such

25
sources. This finding is open to at least two possible interpretations. From a demand-side
perspective it suggests that the UK does not have a large stock of high potential firms that are
only being held back by a simple lack of equity funding. This interpretation also allows for the
possibility that savvy entrepreneurs positively discriminate in favour of private sector investors
when making their choice of financial partner. Alternatively, from a supply side perspective it
may reflect the limitations of the public sector venture capital model. First, the focus of such
funds on specific geographical areas restricts the supply of suitable investment opportunities,
particularly in smaller regions. Second, the investments made by the public sector venture capital
funds are small, typically under £500,000. This is primarily because the funds have a maximum
investment size, imposed by government to prevent them from undergoing „investment drift‟.
However, this is typically too small to meet the funding needs of high-growth firms (SQW,
2009). In addition, the funds are generally too small to have the capacity to make significant
follow-on investments. The consequence for the management teams of the investee businesses is
that they are forced to spend a disproportionate amount of their time seeking further finance. If
follow-on investment is not found this may necessitate the premature sale the company, or even
its closure. On the other hand, if follow-on investment is raised there is the risk of friction
between the multiple co-investors who sit on their board, for example, in terms of the strategic
direction of the business or when to seek an exit (Peters, 2009). However, being unable to
participate in the follow-on funding means that the public sector fund is likely to suffer punitive
dilution which will significantly erode the value of its investment in the company. The second
possible interpretation is that public sector venture capital funds may not be as „smart‟ as private
sector venture capital in terms of adding value as Shäfer and Shilder (2009) suggest is the case
for Germany. Hood‟s (2000: 337) account of public sector venture capital in Scotland

26
emphasises the “necessity to attract, reward and hold together experienced and committed
venture capital executives to manage public funds.” Without respect in the market place public
sector funds will find it difficult to attract private sector investors to co-invest or provide follow-
on investment. This requires that the individuals running public sector funds are highly rewarded
and incentivised to make the best possible returns. However, the ability of public sector venture
capital funds to attract capable investment managers is constrained by their small size (i.e. funds
under management) because the annual management fee is based on a percentage of the
committed capital (up to 2%). The capabilities of public sector fund managers are therefore often
questioned, both in terms of their ability to make good investments (quality of deal flow, domain
knowledge, effectiveness of their due diligence) and to add value to their investee companies
(e.g. mentoring skills, strategic insights, networks). On the other hand, Pinch and Sunley (2009)
suggest that the ability of private sector venture capitalists to add value may be exaggerated.
Policy-makers have introduced programmes to stimulate business angels in the hope that they
can fill the gap in the provision of early stage venture capital, both nationally and at the regional
level (Mason, 2009b). The angel market is evolving from one that was dominated by individuals
and ad hoc groups making small investments, typically under £100,000, and with little capability
for follow-on investing, to one in which angels increasingly are investing through organised
groups comprising anywhere from 20 to over 100 members. These groups have developed
professionalised routines for deal sourcing and evaluation, and have the capability not only to
make bigger investments but to make follow-on investments (Mason, 2006). Indeed, with start-
up costs reduced as a result of falling bandwidth costs, improvements in open source software
and the emergence of cloud computing, and exits happening much earlier than in the past (Peters,

27
2009), angel groups can fund businesses all the way to an exit. However, there are significant
differences across regions in terms of maturity of their angel markets, with the Scottish market
being the most developed. Moreover, business angels have limitations. Some are inexperienced
and lack competence and may actually hinder their the prospects that their investee businesses
can go on to raise venture capital as a result of unsustainable pricing or poor governance
structures (Harrison and Mason, 2000). Venture capitalists may decide that a deal which already
has several small shareholders is too complicated. Furthermore, angel groups cannot entirely
replace venture capital funds, either in terms of the size of investment or their ability to add
value. Private sector venture capital funds will always be needed when it may take £20-£30m, or
more, to build a global company.
There is now an emerging consensus that a regionally-based public sector venture capital model
is ineffective because of the need for scale in terms of the size of funds (Murray, 1999; 2007;
Nightingale et al 2009; Pierrakis and Westlake, 2009) and insufficient volumes of investment
opportunities at the regional scale. The latter constraint becomes even more significant as
venture capital shifts from being generalist and increasingly adopts a sector focus. Indeed,
individual funds appear to follow a „natural‟ path of sector specialisation to build up
competences as they mature which, in turn, results in geographical diversification (De Clercq et
al, 2001; Sorensen and Stuart, 2001; Christensen 2007). The regional dimension is conspicuously
lacking in recent calls for the creation of new public sector VC funds (NESTA, 2008; Financial
Times, 2009) or in the Government‟s recent announcement of its intention to create a £150m
fund. However, any shift in the provision of public sector venture capital from a regional to a
national focus will inevitably raise concerns in the regions that investments will be concentrated

28
in southern England and, worse still, that promising companies in the regions might move south
to access finance (cf. Zook, 2002; 2005).9 For example, the Northern Way – a consortium of
Regional Development Agencies and local authorities in the North of England – emphasise the
importance of local fund management presence in the regions to stimulate demand and seek out
investment opportunities. They argue that although national initiatives bring scale advantages
they “lack a regional dimension and therefore replicate the geographical imbalance of the private
sector market” (Deloitte, 2009: 60). However, the importance of proximity in venture capital
investing may have been exaggerated (Fritsch and Schilder, 2006; Griffith et al, 2007; Zhang,
2009). Griffith et al (2007) suggest that Silicon Valley venture capitalists have never observed
the „one hour rule‟ of investing and that locational proximity is likely to become even less
important in the future. Venture capital funds with a sector focus typically also place less
emphasis on geographical proximity. Moreover, there are examples of technology clusters that
have been able to „import‟ venture capital from distant locations (e.g. Ottawa: Mason et al, 2002;
Mason, 2007).
Those regions that are dependent on the public sector for early stage venture capital therefore
face two challenges. First, this approach has not proved to be effective in stimulating indigenous
entrepreneurship. Second, regionally-based funds will be phased out as the limitations of this
approach are absorbed by policy-makers. Indeed, the regional venture capital funds are now
9 Zook (2002; 2005) noted that during the emergent phase of „dot-com‟ era many Internet companies moved to
Silicon Valley in order to raise venture capital. This reflected two factors. On the supply side venture capitalists in
Silicon Valley, having recognised that the Internet was „the next big thing‟, were very receptive to approaches for
funding from Internet companies whereas investors in other locations, both in the USA and other countries, either
did not know, did not understand or did not believe in the Internet industry and so were likely to reject funding
proposals. On the demand side the successes of Netscape and Yahoo! underlined the importance of speed to market
to secure first mover advantages, hence the importance of raising venture capital at an early stage to get big fast.
Thus, relocating to Silicon Valley because a strategic choice for Internet entrepreneurs because “that was where the
money was” (2005: 61).

29
approaching the end of their lifespan and so are no longer making new investments. So under the
likely scenario in which venture capital investors are geographically concentrated in and around
London, how can other UK regions attract venture capital? We identify three critical
requirements. First, on the demand side, there is a need to build investable businesses in the
regions. This requires regionally-delivered grant schemes to develop technology to the point that
it is commercially viable (and beyond). What we have in mind are programmes which fund
promising technologies from the laboratory to the market place, such as the Advanced
Technology Programme in the USA (Wessner, 2002; Chang et al, 2002). Human capital
interventions are also likely to be required. US evidence suggests that the presence of
outstanding scientists is much more significant than local sources of venture capital in explaining
the number of venture capital-backed university spin-outs (Zhang, 2009). Attracting prominent
scientists and research teams to universities in the regions might therefore be an effective way in
which to generate businesses that are attractive to venture capital funds. In similar vein, Krabel et
al (2009) find that mobile scientists (regardless of whether they move domestically or
internationally) are more likely to become nascent entrepreneurs. Second, on the supply side,
there is a need to foster the development of regionally-based angel groups. With traditional
venture capital funds facing challenges to their investment model, and opportunities to build
companies to an exit much more quickly and cheaply than in the past (Ante, 2009; Peters, 2009),
angel groups are now assuming a much more significant role as a source of early stage venture
capital. Equally important is that their hands on involvement plays a significant accreditation role
and moves their investee businesses to the point where they are potentially investable by venture
capital firms (Madill et al (2005).10
Finally, given the emphasis that venture capitalists place on
10
Bill Wetzel, the pioneer of research on business angels, has spoken of business angels providing venture capital
funds with “scrubbed and cleaned deals”.

30
trusted networks for deal referrals, there is a need to develop funding „pipelines‟ (Bathelt et al,
2004) between the key players in the regional entrepreneurial eco-systems (e.g. universities,
incubators, angel groups, local venture capital funds) and non-local private sector venture capital
sources.
REFERENCES
Ante, S E (2009) „Super angels‟ shake up venture capital, Business Week, 21 May.
Bathelt, H, Malmberg, A and Maskell, P (2004) Clusters and knowledge, local buzz, global
pipelines and the process of knowledge creation, Progress in Human Geography, 28 (1),
31-56.
Bhidé, A (2007) The Venturesome Economy, Princeton University Press: Princeton.
Buckman, R (2009) Venture capital‟s coming collapse, Forbes, 12 January.
BVCA (2009) BVCA Private Equity and Venture Capital Performance Measurement Survey
2008, British Venture Capital Association: London.
Bygrave, W D and Timmons, J A (1992) Venture Capital at the Crossroads, Cambridge: MAS,
Harvard Business School Press.
Chang, C K N, Shipp, S S and Wang, A J (2002) The Advanced Technology Program: a public-
private partnership for early stage technology development, Venture Capital: an
international journal of entrepreneurial finance, 4 (4), 363-370.
Christensen, J L (2007) The development of geographical specialisation of venture capital,
European Planning Studies, 15, 817-833.

31
De Clercq, D, Goulet, P K, Kumpulainen, M and Mäkelä, M (2001) Portfolio investment
strategies in the Finnish venture capital industry: a longitudinal study, Venture Capital: an
international journal of entrepreneurial finance, 3 (1), 41-62.
Deloitte (2009) Preparing the Ground: Private investment in the regions, in the recovery phase
and beyond, The Northern Way: Private Investment Commission.
Financial Times (2009) Mandelson urged to create VC fund-of-funds, 19 May.
Florida, R. and Kenney, M. (1988) Venture capital, high technology and regional development,
Regional Studies, 22 (1), 33-48.
Florida, R. and D.F. Smith jr (1991) Venture capital formation, investment, and regional
industrialisation, Annals of the Association of American Geographers, 83, 434-451.
Fritsch, M. and D. Schilder (2006) Does venture capital really require spatial proximity? An
empirical investigation, Technical University of Freiberg, Faculty of Economics and
Business Administration, unpublished Working Paper.
Gompers, P. and J. Lerner (2001) The Money of Invention: How Venture Capital Creates New
Wealth, Boston: Harvard Business School Press.
Griffith, T L, Yam, P J and Subramaniam, S (2007) Silicon Valleys one hour distance rule and
managing return on location, Venture Capital: an international journal of entrepreneurial
finance, 9 (2), 85-106.
Harrison, R T and Mason, C M (2000) Venture capital market complementaries: the links
between business angels and venture capital funds in the United Kingdom, Venture
Capital: an international journal of entrepreneurial finance, 2 (3), 223-242.
Hayton, K, Thom, G, Percy, V, Boyd, C and Latimer, K (2008) Evaluation of the Scottish Co-
Investment Fund, A Report to Scottish Enterprise, Glasgow

32
Hellmann, T and Puri, M (2000) The interaction between product market and financing strategy:
the role of Venture Capital, Review of Financial Studies, 13, 959-984
Hellman, T and Puri, M (2002) Venture capital and the professionalization of start-ups:
Empirical Evidence, Journal of Finance, 57, 169-197
HM Government (2009) New Industry, New Jobs, Department of Business, Enterprise and
Regulatory Reform.
Hood, N. (2000) Public venture capital and economic development: the case of Scotland,
Venture Capital: an international journal of entrepreneurial finance, 2, 313-341.
Kedrosky, P (2009) Right-sizing the US Venture Capital Industry, Kansas City: Ewing Marion
Kauffman Foundation.
Krabel, S, Siegel, D S and Slavtchev, V (2009) The Internationalisation of Science and its
Influence on Academic Entrepreneurship, Jerusalem Institute for Market Studies, DP
280109
Madill, J. J., G. H. Haines, jr. and A.L. Riding (2005) The role of angels in technology SMEs: a
link to venture capital, Venture Capital: An International Journal of Entrepreneurial
Finance, 7: 107-129.
Martin, R L (1989) The growth and geographical anatomy of venture capital in the United
Kingdom, Regional Studies, 23, 389-403.
Martin, R L (1992) Financing regional enterprise: the role of the venture capital market, in R
Townroe and R L Martin (eds) Regional Development in the 1990s: The British Isles in
Transition, Jessica Kingsley: London, pp 161-171.

33
Martin, R., C. Berndt, B. Klagge and P. Sunley (2005) Spatial proximity effects and regional
equity gaps in the venture capital market: evidence from Germany and the UK,
Environment and Planning A, 37, 1207-1231.
Mason, C M (1987) Venture capital in the United Kingdom: a geographical perspective,
National Westminster Bank Quarterly Review, May, 47-59.
Mason, C (2006) Informal sources of venture finance, in S C Parker (ed) The Life Cycle of
Entrepreneurial Ventures, New York: Springer: New York, pp.259-299.
Mason, C M (2007) Venture capital: a geographical perspective, in H Landström (ed) Handbook
of Research on Venture Capital, Edward Elgar, Cheltenham, pp 86-112.
Mason, C (2009a) Editorial: Venture Capital in Crisis, Venture Capital: an international journal
of entrepreneurial finance, 11 (4) forthcoming.
Mason, C M (2009b) Public policy support for the informal venture capital market in Europe: a
critical review, International Small Business Journal, forthcoming.
Mason, C M and Harrison, R T (1991a) The small firm equity gap since Bolton, in J Stanworth
and C Gray (eds.) Bolton Twenty Years On: The Small Firm in the 1990s (Paul Chapman
Publishing, London) pp 112-150.
Mason, C M and Harrison, R T (1991b) Venture capital, the equity gap and the north-south
divide in the UK, in M Green (ed.) Venture Capital: International Comparisons,
Routledge, London, pp 202-247.
Mason, C. M. and R.T. Harrison (2002) The geography of venture capital investments in the UK,
Transactions of the Institute of British Geographers, 27, 427-451.

34
Mason, C M and Harrison, R T (2008) Measuring business angel investment activity in the
United Kingdom: a review of potential data sources, Venture Capital: an international
journal of entrepreneurial finance, 10, 309-330.
Mason, C., S. Cooper and R. Harrison (2002) Venture capital and high technology clusters: the
case of Ottawa, in R. Oakey, W. During and S. Kauser (eds.) New Technology-Based Firms
in the New Millennium, Volume II Oxford: Pergammon, pp 261-278.
Murray, G C (1998) A policy response to regional disparities in the supply of risk capital to new
technology-based firms in the European Union, Regional Studies, 32, 405-419.
Murray, G. (1999) Seed Capital Funds and The Effect Of Scale Economies. Venture Capital: An
International Journal of Entrepreneurial Finance, 1 (4) 351-384.
Murray, G C (2007) Venture capital and government policy, in H Landström (ed) Handbook of
Research on Venture Capital, Cheltenham: Edward Elgar, pp 113-151.
NESTA (2008) Stimulating Venture Capital: the need for a new £1bn fund, NESTA: London.
NESTA (2009) Venture Capital Fundraising Activity Slows in 2008, NESTA: London.
Nightingale, P et al (2009) From Funding Gaps to Thin Markets: Designing Hybrid VC Schemes
for the 21st century, SPRU, University of Sussex for BVCA and NESTA.
Peters, B (2009) Early Exits, MeteorBytes Data Management Corporation
Pierrakis, Y and Mason, C (2008) Shifting Sands: The Changing Nature of the Early Stage
Venture Capital Market in the UK, Research Report, NESTA, London.
Pierrakis, Y and Westlake, S (2009) Reshaping the UK Economy: the role of public investment in
financing growth, Research Report 91, NESTA: London
Pinch, S and Sunley, P (2009) Understanding the role of venture capitalists in knowledge
dissemination in high-technology agglomerations: a case study of the University of

35
Southampton spin-off cluster, Venture Capital: an international journal of entrepreneurial
finance, 11 (4) in press.
Roseillo, A and Parris, S (2009) The patterns of venture capital investment in the UK bio-
healthcare sector: the role of proximity, cumulative learning and specialisation, Venture
Capital: an international journal of entrepreneurial finance, 11 (3), 185-211.
Schäfer and Schilder, D (2009) Smart capital in German start-ups: an empirical analysis, Venture
Capital: an international journal of entrepreneurial finance, 11 (2) 163-183.
Sorsenson, O. and T.E. Stuart (2001) Syndication networks and the spatial distribution of venture
capital investments, American Journal of Sociology, 106 (6), 1546-1588.
SQW Consulting (2009) The Supply of Equity Finance to SMEs: Revisiting the ‘Equity Gap’, Report to
the Department of Business, Enterprise and Regulatory Reform and Department for Innovation,
University and Skills.
Sunley, P, Klagge, B, Berndt and Martin, R (2005) Venture capital programmes in the UK and
Germany: in what sense regional policies? Regional Studies, 39 (2), 255-273.
Valliere, D and Peterson, R (2004) Inflating the bubble: examining dot-com investor behaviour,
Venture Capital: an international journal of entrepreneurial finance, 6, 1-22.
Wessner, C W (2002) Entrepreneurial finance and the new economy, Venture Capital: an
international journal of entrepreneurial finance, 4 (4), 349-355.
Zhang, J (2007) Access to venture capital and the performance of venture capital-backed star-ups
in Silicon Valley, Economic Development Quarterly, 21, 124-147.
Zhang, J (2009) Why do some US universities generate more venture capital-backed academic
entrepreneurs than others? Venture Capital: an international journal of entrepreneurial
finance, 11 (2), 133-162.

36
Zook, M.A. (2002) Grounded capital: venture financing and the geography of the Internet
industry, 1994-2000, Journal of Economic Geography, 2 (2), 151-177.
Zook, M.A. (2005) The Geography of the Internet Industry, Oxford: Blackwell Publishing.
37
Figure 1. Annual private equity and venture capital investment, 2001-8 (£m)
Source: BVCA Report on Investment Activity (various years)
0
2000
4000
6000
8000
10000
12000
2000 2001 2002 2003 2004 2005 2006 2007 2008
MBO/MBI
Expansion
Early stage

38
TABLE 1 UK early stage investments 2001-8
(a) Amount invested (£m)
Finance stage 2008 2007 2006 2005 2004 2003 2002 2001 2000
Start-up 172 190 531 160 96 73 99 163 175
Other early stage 187 244 415 222 188 190 196 227 528
Total early stage 359 434 946 382 284 263 295 390 703
Early stage as a % of
total investment
4.1
3.6 9.3 5.6 4.2
6.5
6.6
8.2
11.0
Source: BVCA Report on Investment Activity (various years)
(b) Number of companies
Finance stage 2008 2007 2006 2005 2004 2003 2002 2001 2000
Start-up 170 207 245 208 190 185 165 190 153
Other early stage 285 295 255 285 264 242 233 218 256
Total early stage 455 502 500 493 454 427 398 408 409
Early stage as a % of
total investment
36 38 38 38 35
34
33
31
35
Source: BVCA Report on Investment Activity (various years)

39
Figure 2: Proportion of investments by type of investor, 2000-2008
Source: calculated using data from Library House database
0%
10%
20%
30%
40%
50%
60%
70%
80%
90%
100%
2000 2001 2002 2003 2004 2005 2006 2007 2008
Deals made by private & other funds
Public/private co-investment deals
Freestanding deals made by publicly backed funds

40
Figure 3: Co-investments as a proportion of deals
(a) Public private co-investments deals as a proportion of all deals involving public sector
(b) Public private co-investments deals as a proportion of all deals involving private sector
Source: calculated using data from Library House database
0%
10%
20%
30%
40%
50%
60%
70%
80%
90%
100%
2001 2002 2003 2004 2005 2006 2007 2008
Freestanding deals made by publicly backed funds
Public/private co-investment deals
0%
10%
20%
30%
40%
50%
60%
70%
80%
90%
100%
2001 2002 2003 2004 2005 2006 2007 2008
Deals made by private & other funds
Public/private co-investment deals

41
Figure 4: Distribution of deals sizes by type of investor, 2007
0
5
10
15
20
25
30
35
40
45
50
100 250 500 1000 2000 5000 10000 10000+
Amounts (£000)
Nu
mb
er
of
deals Freestanding deals made by
publicly backed funds
Deals made by private & other
funds
Public/private co-investments
deals

42
Figure 5: Number of investments with Business Angels involvement in the UK, 2001-2008
Source: calculated using data from Library House database
0
20
40
60
80
100
120
140
160
2001 2002 2003 2004 2005 2006 2007 2008

43
Figure 6: Early stage investments by year and type of investor 2000-2008
Source: calculated using data from Library House database
0%
10%
20%
30%
40%
50%
60%
70%
80%
90%
100%
2000 2001 2002 2003 2004 2005 2006 2007 2008
Deals made by private & other funds
Public/private co-investment deals
Freestanding deals made by publicly backed funds

44
TABLE 2. Distribution of early stage investments in the UK: number and region
region 1998-2000
(„boom years‟)
2001-3
(„crash years‟)
2005-7
(„recovery years‟)
2008
(„financial crisis‟)
No. % LQ* No. % LQ no. % LQ No. % LQ
London 252 27.70 1.86 217 17.60 1.14 289 19.36 1.15 78 17.14 1.08
South
East
190 20.90 1.36 233 18.90 1.20 282 18.89 1.18 74 16.26 1.03
South
West
36 3.96 0.41 56 4.54 0.48 106 7.10 0.79 25 5.49 0.58
East of
England
107 11.76 1.17 205 16.63 1.66 161 10.78 1.06 29 6.37 0.63
West
Midlands
39 4.29 0.51 57 4.62 0.56 92 6.10 0.73 45 2.42 0.35
East
Midlands
28 3.08 0.45 31 2.51 0.37 60 4.02 0.59 11 9.89 1.20
Yorkshire
& The
Humber
37 4.07 0.55 44 3.57 0.50 49 3.29 0.46 28 6.15 0.86
North
West
56 6.15 0.63 117 9.49 1.00 212 14.20 1.40 79 17.36 1.81
North
East
22 2.42 0.95 40 3.24 1.29 45 3.01 1.11 22 4.84 1.88
Scotland 106 11.65 1.59 101 8.19 1.15 110 7.37 1.17 33 2.86 0.67
Wales 15 1.65 0.35 57 4.62 1.28 50 3.35 0.85 13 7.25 1.04
N Ireland 22 2.42 0.72 75 6.08 1.83 38 2.54 1.01 18 3.96 1.21
TOTAL 910 1233 1493 455
TABLE 3. Distribution of early stage investments in the UK: amount invested and region
region 1998-2000
(„boom years‟)
2001-3
(„crash years‟)
2005-7
(„recovery years‟)
20082008
(„financial crisis‟)
£m % LQ* £m % LQ £m % LQ £m % LQ
London 329 22.0 1.43 229 24.9 1.56 524 29.74 1.76 172 47.8 1.13
South East 522 34.9 2.10 238 25.8 1.64 353 20.03 1.25 64 17.8 3.02
South West 67 4.5 0.50 26 3.9 0.42 144 8.17 0.91 12 3.3 0.35
East of
England
111 7.4 0.76 216 23.5 2.32 228 12.94 1.28 20 5.6 0.55
West
Midlands
62 4.1 0.50 17 1.8 0.22 28 1.59 0.19 12 3.3 0.41
East
Midlands
45 3.0 0.44 22 2.4 0.35 144 8.17 1.20 9 2.5 0.36
Yorkshire
& The
Humber
76 5.1 0.72 10 1.1 0.16 137 7.76 1.07 5 1.4 0.19
North West 103 6.9 0.76 54 5.9 0.61 99 5.62 0.56 23 6.4 0.67
North East 15 1.0 0.40 6 0.7 0.26 16 0.91 0.34 10 2.8 1.08
Scotland 129 8.6 1.19 64 6.9 0.99 49 2.78 0.44 24 6.7 0.13

45
Wales 14 0.9 0.20 31 3.4 0.78 29 1.65 0.42 2 0.6 0.95
N Ireland 24 1.6 0.48 25 2.7 0.85 11 0.62 0.25 7 1.9 0.60
TOTAL 1497 921 1762 360
Figure 7. Proportion of different types of investors in early stage deals in the UK regions 2000-
2008
Source: calculated using data from Library House database
0%
10%
20%
30%
40%
50%
60%
70%
80%
90%
100%
Lon
do
n
Sou
th E
ast
East
of
Engl
and
Sou
th W
est
East
Mid
lan
ds
No
rth
Wes
t
York
shir
e
Wal
es
No
rth
Eas
t
No
rth
ern
Irel
and
Sco
tlan
d
Wes
t M
idla
nd
s
Deals made by private & other funds
Public/private co-investment deals
Freestanding deals made by publicly backed funds

46
Figure 8: Proportion of investments involving the public sector by year by region

47

48
Source: calculated using data from Library House database
Figure 9: Proportion of early stage deals involving business angels by region
49
Source: calculated using data from Library House database