VEMA 2017-2018 Annual Report - Province of Manitoba
35
-
Upload
khangminh22 -
Category
Documents
-
view
4 -
download
0
Transcript of VEMA 2017-2018 Annual Report - Province of Manitoba
Letter from the Minister
Letter from the Deputy Minister
Chief Operating Officer�s Message

Contents
Vehicle and Equipment Management Agency is an Agency of the Manitoba Government
Profile of Vehicle and Equipment Management Agency��������������.�.... 1 Products and Services����������������������������.�.......... 1 Structure for Operations�������������������������������.. 2 Accountability Structure�������������������������.����.. 2 Staff Complement at VEMA���������������������������� 3 The Public Interest Disclosure (Whistleblower Protection) Act������������...� 3 Promoting Energy-Related Opportunities����������.�����������........ 4 Financial Performance��������������������������������.. 5 Operating Results������������������������.�����........... 5 Financial Position�������������������������.�������. 7 Ratio Analysis������������������������.������..���. 8 Public Sector Compensation Disclosure���������������������... 8 Management�s Responsibility for Financial Reporting���������.��������. 9 Independent Auditors� Report��.��������������������������.. 10 Financial Statements��������������������������������� 11 VEMA Statistics����������������������������������..... 26 VEMA Contacts�.���������������������������������� 28
For the Year Ended March 31, 2018
2017/18 Annual Report 1
Profile of Vehicle and Equipment Management Agency Vehicle and Equipment Management Agency (VEMA, or the Agency) provides acquisition, management and disposal services for both heavy duty and light duty vehicles and equipment. It has one of the larger fleets of vehicles and equipment in Manitoba and, as an Agency within the Department of Finance, its main customers are the departments, agencies and Crown corporations of the provincial government.
VEMA�s full service shop and stores facilities are located in Beausejour, Brandon, Dauphin, The Pas, Thompson and Winnipeg, with satellite shops in several other
locations in the province. In addition, VEMA also provides services as required to Northern Airports and to Marine Operations locations throughout the province. On March 31, 2018, the fleet totaled 5,426 units comprised of light duty vehicles (53%), heavy duty vehicles and equipment (40%), ambulances (4%), and miscellaneous units and attachments (3%).
Annual distance travelled by the owned and managed fleet currently approximates 73 million kilometres and fuel consumption for both heavy and light duty vehicles and equipment owned and managed by VEMA totals more than 19 million litres a year. Radio Services is a division that rounds out the services offered by the Agency. The division�s technicians are responsible for the servicing of
existing radio base stations in areas where cellular phone service is not currently available, and for the evaluation, installation, repair and maintenance of two-way radios used by its provincial and other clients in those areas.
Products and Services A wide range of products and services has been developed over the past several years to meet the needs of the Agency�s provincial government clients, with those services falling into three main
groups: Vehicle and Equipment Services, Fleet Management Services, and Radio Services. Vehicle and Equipment Services for light duty vehicles and equipment include leases, long-term rentals, short-term (daily) rentals, and vehicle insurance and registration. For heavy duty vehicles and equipment, services are primarily to the Department of Infrastructure, with those services designed to provide reliable equipment that is right for the job on a timely basis. Fleet Management Services cover a whole range of services including a credit card for fuel purchases, repair authorizations, preventive maintenance programs, an invoice payment service, a taxable benefit program, and information on the cost, maintenance and distance driven or utilization for each vehicle or piece of equipment. Radio Services plays a significant role in maintaining communications in remote areas, especially during the annual periods of time when Sustainable Development works to suppress forest fires. Stores facilities are located within each full service shop to arrange for, and stock, parts for the maintenance and repair of vehicles and equipment owned or managed by the Agency.
Mission Statement
To provide clients with superior vehicles, equipment, products and services that offer sustainable solutions that are financially and
socially responsible.
Vision Statement
To be the recognized leading provider of asset
management services to the broader public
sector.
For the Year Ended March 31, 2018
2 2017/18 Annual Report
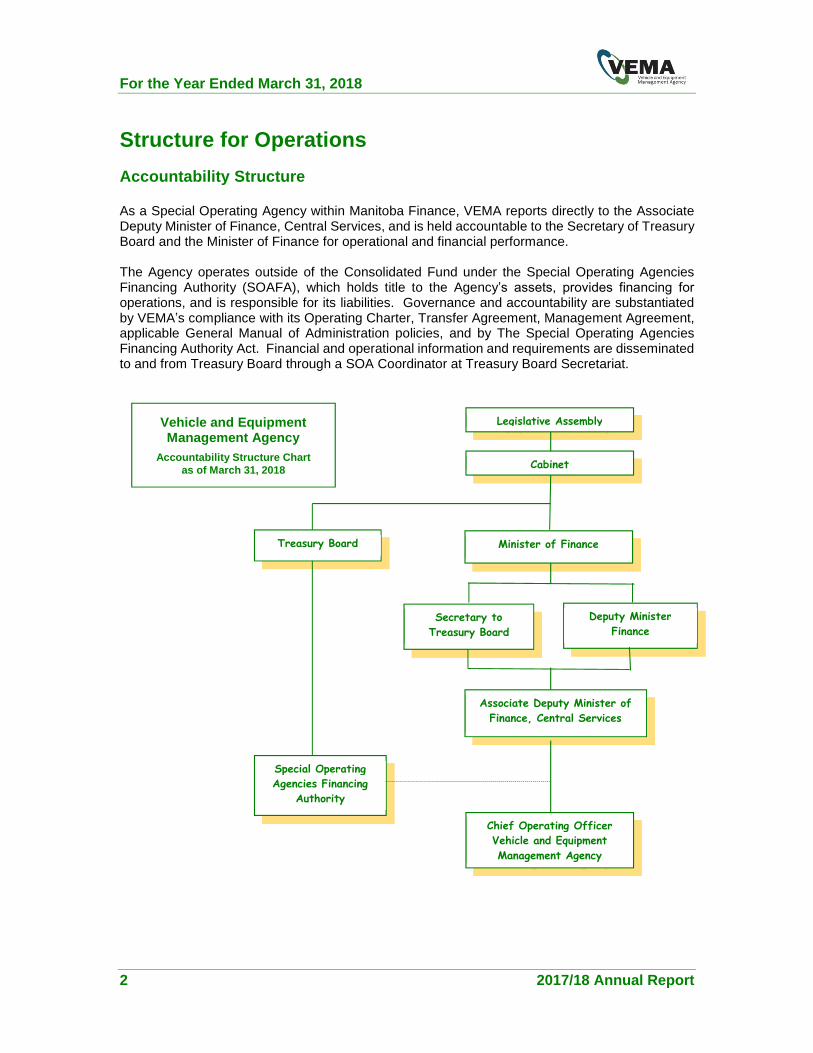
Structure for Operations Accountability Structure As a Special Operating Agency within Manitoba Finance, VEMA reports directly to the Associate Deputy Minister of Finance, Central Services, and is held accountable to the Secretary of Treasury Board and the Minister of Finance for operational and financial performance. The Agency operates outside of the Consolidated Fund under the Special Operating Agencies Financing Authority (SOAFA), which holds title to the Agency�s assets, provides financing for
operations, and is responsible for its liabilities. Governance and accountability are substantiated by VEMA�s compliance with its Operating Charter, Transfer Agreement, Management Agreement, applicable General Manual of Administration policies, and by The Special Operating Agencies Financing Authority Act. Financial and operational information and requirements are disseminated to and from Treasury Board through a SOA Coordinator at Treasury Board Secretariat.
Legislative Assembly
Cabinet
Minister of Finance
Secretary to Treasury Board
Associate Deputy Minister of Finance, Central Services
Chief Operating Officer Vehicle and Equipment Management Agency
Treasury Board
Special Operating Agencies Financing
Authority
Vehicle and Equipment Management Agency
Accountability Structure Chart as of March 31, 2018
Deputy Minister Finance
2017/18 Annual Report 3
Staff Complement at VEMA VEMA has a total of 204 approved Full Time Employee (FTE) positions. The Agency continues to operate with multiple vacancies amongst its 204 FTEs. Throughout most of the 2017/18 year, the number of vacancies approximated 65, including the positions of Chief Operating Officer, Materials Manager, and Manager, Finance and Administration, as well as shop and office positions in all locations. In February 2017, the Operations Manager, Light Duty, was appointed Acting Chief Operating Officer and is covering both positions. The Materials Manager and Manager, Finance and Administration positions are currently being covered by managers from Materials Distribution Agency who are working in a shared capacity between the two agencies. It is quite likely that the current staffing situation will continue throughout much of the 2018/19 year.
The Public Interest Disclosure (Whistleblower Protection) Act The Public Interest Disclosure (Whistleblower Protection) Act came into effect in April 2007. This law gives employees a clear process for disclosing concerns about significant and serious matters (wrongdoing) in the Manitoba public service, and strengthens protection from reprisal. The Act builds on protections already in place under other statutes, as well as collective bargaining rights, policies, practices and processes in the Manitoba public service.
Wrongdoing under the Act may be: contravention of federal or provincial legislation; an act or omission that endangers public safety, public health or the environment; gross mismanagement; or, knowingly directing or counseling a person to commit a wrongdoing. The Act is not intended to deal with routine operational or administrative matters.
A disclosure made by an employee in good faith, in accordance with the Act, and with a reasonable belief that wrongdoing has been or is about to be committed is considered to be a disclosure under the Act, whether or not the subject matter constitutes wrongdoing. All disclosures receive careful and thorough review to determine if action is required under the Act, and must be reported in a department�s annual report in accordance with Section 18 of the Act.
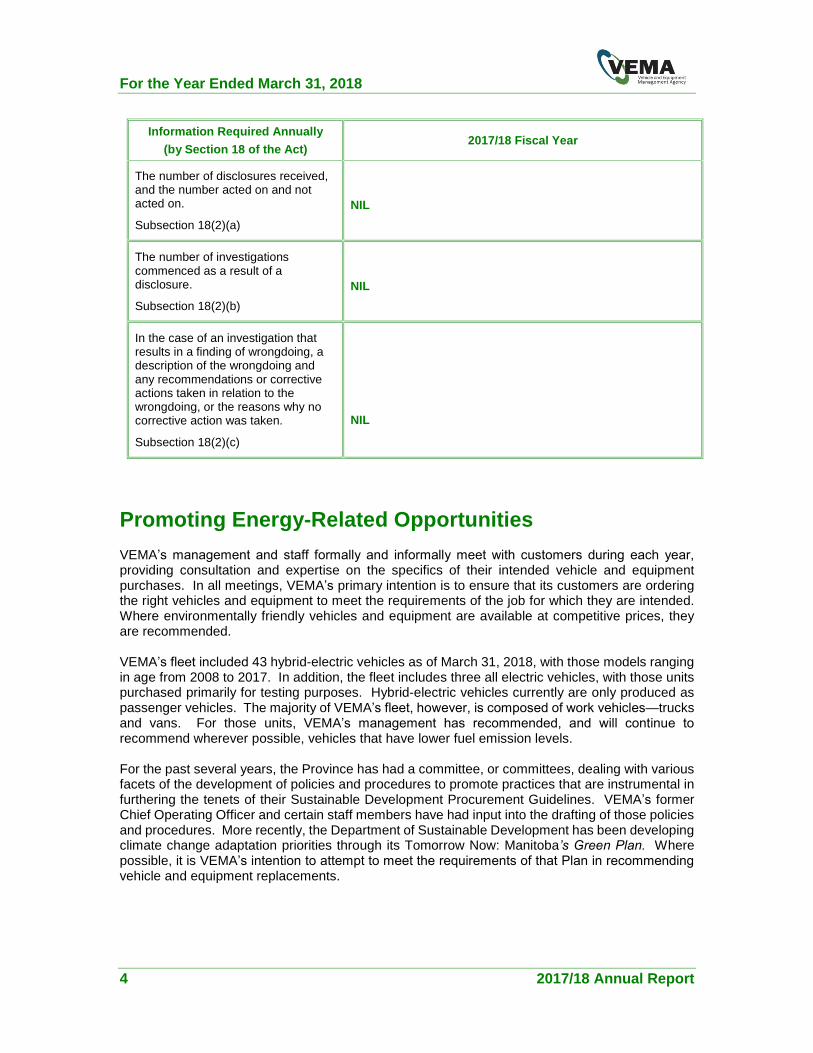
There were no disclosures of wrongdoing that were made to a supervisor or designated officer of the Department of Finance � Vehicle and Equipment Management Agency during the 2017/18 fiscal year. In connection with the information required annually, VEMA confirms the following:
For the Year Ended March 31, 2018
4 2017/18 Annual Report
Information Required Annually
(by Section 18 of the Act) 2017/18 Fiscal Year
The number of disclosures received, and the number acted on and not acted on.
Subsection 18(2)(a)
NIL
The number of investigations commenced as a result of a disclosure.
Subsection 18(2)(b)
NIL
In the case of an investigation that results in a finding of wrongdoing, a description of the wrongdoing and any recommendations or corrective actions taken in relation to the wrongdoing, or the reasons why no corrective action was taken.
Subsection 18(2)(c)
NIL
Promoting Energy-Related Opportunities VEMA�s management and staff formally and informally meet with customers during each year,
providing consultation and expertise on the specifics of their intended vehicle and equipment purchases. In all meetings, VEMA�s primary intention is to ensure that its customers are ordering the right vehicles and equipment to meet the requirements of the job for which they are intended. Where environmentally friendly vehicles and equipment are available at competitive prices, they are recommended. VEMA�s fleet included 43 hybrid-electric vehicles as of March 31, 2018, with those models ranging in age from 2008 to 2017. In addition, the fleet includes three all electric vehicles, with those units purchased primarily for testing purposes. Hybrid-electric vehicles currently are only produced as passenger vehicles. The majority of VEMA�s fleet, however, is composed of work vehicles�trucks and vans. For those units, VEMA�s management has recommended, and will continue to
recommend wherever possible, vehicles that have lower fuel emission levels. For the past several years, the Province has had a committee, or committees, dealing with various facets of the development of policies and procedures to promote practices that are instrumental in furthering the tenets of their Sustainable Development Procurement Guidelines. VEMA�s former Chief Operating Officer and certain staff members have had input into the drafting of those policies and procedures. More recently, the Department of Sustainable Development has been developing climate change adaptation priorities through its Tomorrow Now: Manitoba�s Green Plan. Where possible, it is VEMA�s intention to attempt to meet the requirements of that Plan in recommending
vehicle and equipment replacements.
2017/18 Annual Report 5
Financial Performance The following financial review and analysis compare the actual results for the year ended March 31, 2018, to the projections for the same period and to the actual results for the year ended March 31, 2017. This review and analysis should be read in conjunction with VEMA�s financial statements
for the year (pages 11 to 25) and the summarization of key elements from the statement of operations in Table 1 below. All dollar amounts in the review and analysis are in thousands of dollars. Operating Results
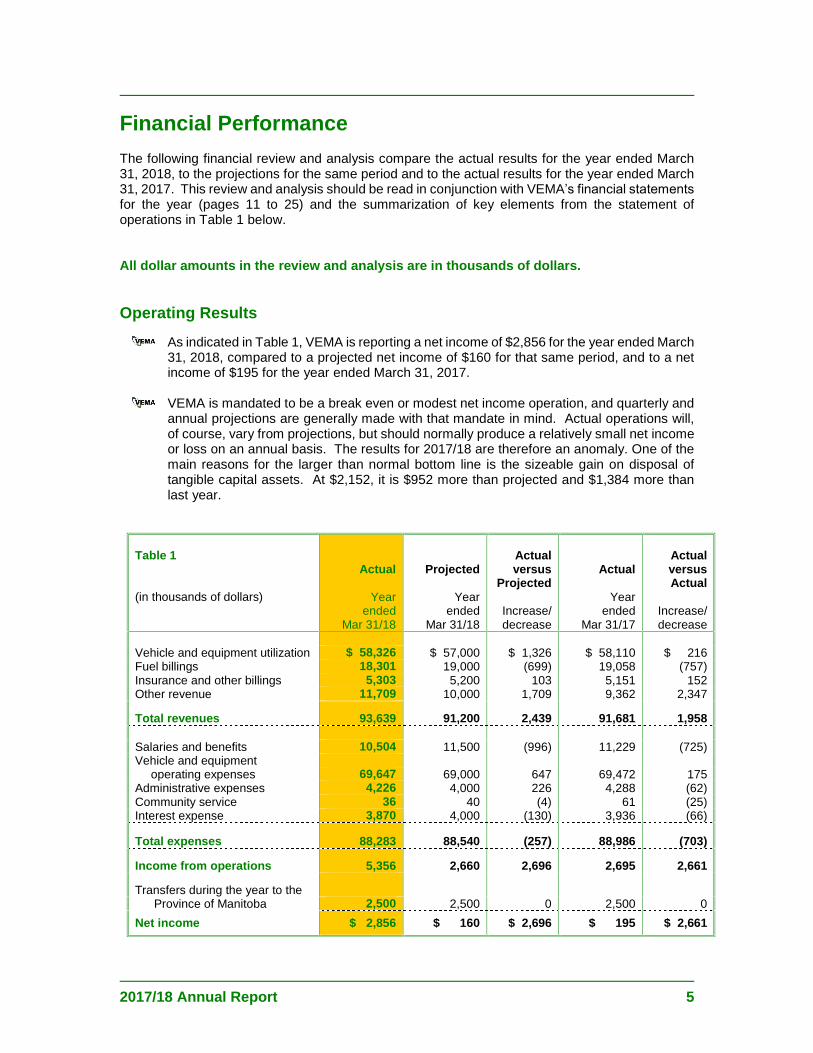
As indicated in Table 1, VEMA is reporting a net income of $2,856 for the year ended March 31, 2018, compared to a projected net income of $160 for that same period, and to a net income of $195 for the year ended March 31, 2017.
VEMA is mandated to be a break even or modest net income operation, and quarterly and annual projections are generally made with that mandate in mind. Actual operations will, of course, vary from projections, but should normally produce a relatively small net income or loss on an annual basis. The results for 2017/18 are therefore an anomaly. One of the main reasons for the larger than normal bottom line is the sizeable gain on disposal of tangible capital assets. At $2,152, it is $952 more than projected and $1,384 more than last year.
Table 1 (in thousands of dollars)
Actual
Year
ended Mar 31/18
Projected
Year ended
Mar 31/18
Actual versus
Projected
Increase/ decrease
Actual
Year ended
Mar 31/17
Actual versus Actual
Increase/ decrease
Vehicle and equipment utilization $ 58,326 $ 57,000 $ 1,326 $ 58,110 $ 216 Fuel billings 18,301 19,000 (699) 19,058 (757) Insurance and other billings 5,303 5,200 103 5,151 152 Other revenue 11,709 10,000 1,709 9,362 2,347
Total revenues 93,639 91,200 2,439 91,681 1,958 Salaries and benefits 10,504 11,500 (996) 11,229 (725) Vehicle and equipment operating expenses 69,647 69,000 647 69,472 175 Administrative expenses 4,226 4,000 226 4,288 (62) Community service 36 40 (4) 61 (25) Interest expense 3,870 4,000 (130) 3,936 (66)
Total expenses 88,283 88,540 (257) 88,986 (703)
Income from operations 5,356 2,660 2,696 2,695 2,661
Transfers during the year to the Province of Manitoba 2,500 2,500 0 2,500 0
Net income $ 2,856 $ 160 $ 2,696 $ 195 $ 2,661
For the Year Ended March 31, 2018
6 2017/18 Annual Report
Another contributing factor to the greater than projected net income for 2017/18 is the
Salaries and Benefits number. It is $996 less than projected and $725 less than last year�s
number. For the most part, as staff depart from VEMA, they are currently not replaced, or are being replaced by part-time staff.
Under the flow through concept used by VEMA for invoicing fuel to customers, fuel expense
essentially follows the pattern of fuel revenues quite closely. The result for the year ended March 31, 2018, portrays this picture, with fuel billings at $18,301 and fuel expense at $18,610.
Fuel expenses are $690 less than projected for the year ended March 31, 2018, a combination of price and volume variances. VEMA�s projected price for gasoline per litre
at the pumps for the 2017/18 year was $0.965. Throughout the year ended March 31, 2018, the price at the pumps approximated the projected price on an overall basis (when VEMA�s negotiated discounts with suppliers are considered), resulting in an average price per litre of $0.958. From the VEMA Statistics on page 26, fuel consumption at 19,420,000 litres during the year is down significantly from projections and from last year. The volume variance is therefore the main reason that fuel expense is lower than both projections and last year�s number.
The net gain on disposal of tangible capital assets breaks down to $2,039 for light duty vehicles and equipment, $18 for ambulances, $92 for heavy duty vehicles and equipment, and $3 for office and shop equipment. Disposals of 462 light duty units in the 2017/18 year produced relatively high disposal prices, resulting in a gain much higher than projected. Statistics relating to the number of vehicle and equipment units disposed during the year are included on page 26 of this Report.
Garage regular service for the year ended March 31, 2018, shows a $1,049 positive variance compared to projections and a $1,081 positive variance compared to the year ended March 31, 2017. Garage regular service primarily represents chargeback revenues billed to customers. Regular repairs and maintenance costs and expenses are billed as a part of the variable and utilization billings. As a result, negative or positive variances in garage regular service revenue are not necessarily indicative of how busy the garages are; they merely reflect an increase or decrease in amounts charged to customers that are not considered to be regular repairs and maintenance.
Radio Services revenue is $710 less than projected and $322 less than its corresponding number a year ago. The Radio Services staff play a significant role in maintaining communications in remote areas, primarily providing tower and electronics inspections and maintenance throughout the province. It is difficult to project their revenues each year because in some years significant equipment and parts are included in their billings to customers, and in other years their billings are primarily composed of labour at hourly billing rates with no significant amount of equipment or parts.
2017/18 Annual Report 7
Financial Position
Vehicle and equipment units total 5,426 as of March 31, 2018. During the year then ended, VEMA received 484 units and disposed of 611 units. Details are included in the VEMA Statistics on page 26.
Arrivals of vehicles and equipment at VEMA mushroomed during the third quarter of the year, with units at a total cost of $9,976 arriving, compared to $11,858 during the first and second quarters combined, and only $2,771 during the fourth quarter. Actual capital additions of $24,670 during the year break down to $13,910 in light duty units, $6,231 in heavy duty units, $3,797 in ambulances, $667 in miscellaneous units, $64 in leasehold improvements, and $1 in office and shop equipment.
The carrying, or net book value, of VEMA�s tangible capital assets at March 31, 2018, of $132,931 represents a decrease of $7,073 from the position at March 31, 2017, and is $4,168 lower than it was projected it would be. The decreased carrying value trend is projected to continue into 2018/19 with vehicle and equipment acquisitions projected for the year of only $9,850.
VEMA offers a 1% discount to customers who pay their monthly rental charges for the year up front on an annual basis in April each year. In April 2017, rental payments received in advance amounted to more than $16,000. As a result, VEMA�s cash position was
extraordinarily high throughout the year.
The amount of borrowings from the Province of Manitoba that was outstanding as of March 31, 2018, decreased by $4,275 from the balance outstanding as of March 31, 2017. New borrowings during the year to assist in funding tangible capital assets were only $18,000, with the semi-annual principal repayments as of September 30, 2017, and March 31, 2018, amounting to $22,275.
The larger than projected net income for the year together with lower than usual borrowings from the Province are the largest contributors to a decrease in Net Debt of $9,718 as of March 31, 2018, compared to the Net Debt position as of March 31, 2017. Because vehicle and equipment acquisitions are projected to be significantly lower in 2018/19 than they have been in recent years, it is projected that Net Debt will be even lower as of March 31, 2019.
For the Year Ended March 31, 2018
8 2017/18 Annual Report
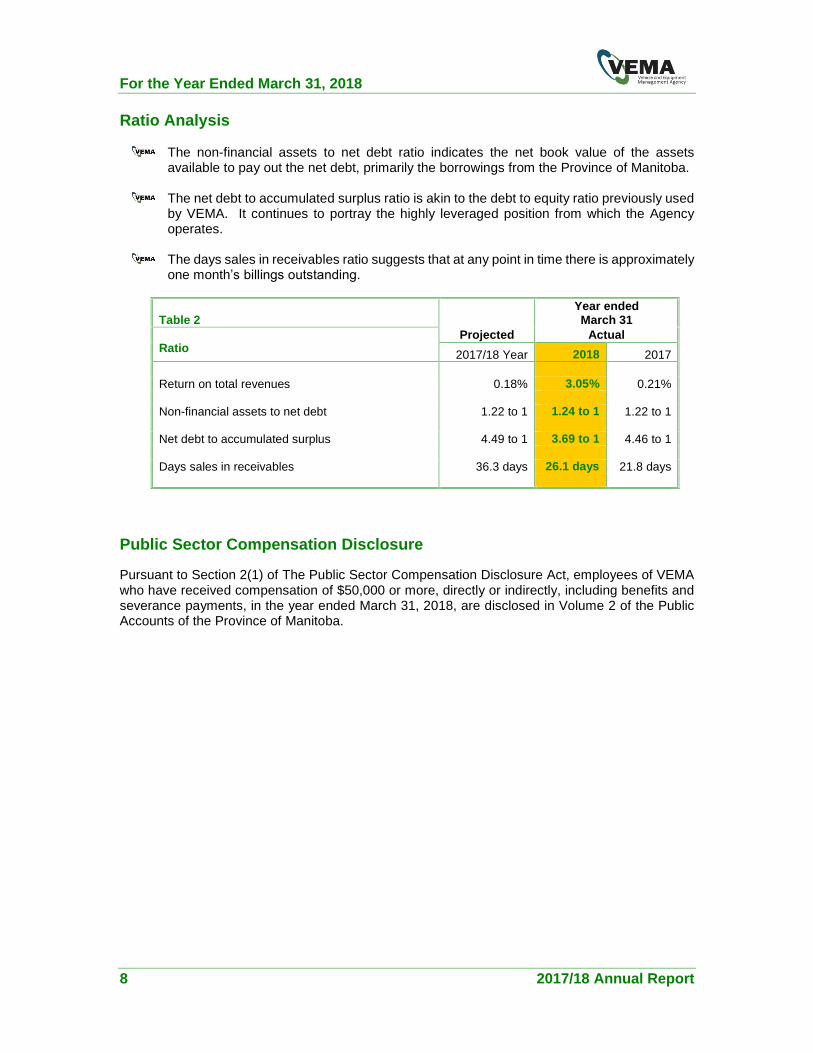
Ratio Analysis
The non-financial assets to net debt ratio indicates the net book value of the assets available to pay out the net debt, primarily the borrowings from the Province of Manitoba.
The net debt to accumulated surplus ratio is akin to the debt to equity ratio previously used
by VEMA. It continues to portray the highly leveraged position from which the Agency operates.
The days sales in receivables ratio suggests that at any point in time there is approximately one month�s billings outstanding.
Table 2 Year ended March 31
Ratio
Projected Actual
2017/18 Year 2018 2017 Return on total revenues 0.18% 3.05% 0.21% Non-financial assets to net debt 1.22 to 1 1.24 to 1 1.22 to 1 Net debt to accumulated surplus 4.49 to 1 3.69 to 1 4.46 to 1 Days sales in receivables 36.3 days 26.1 days 21.8 days
Public Sector Compensation Disclosure Pursuant to Section 2(1) of The Public Sector Compensation Disclosure Act, employees of VEMA who have received compensation of $50,000 or more, directly or indirectly, including benefits and severance payments, in the year ended March 31, 2018, are disclosed in Volume 2 of the Public Accounts of the Province of Manitoba.
2017/18 Annual Report 9
Management�s Responsibility for Financial Reporting
For the Year Ended March 31, 2018
10 2017/18 Annual Report
Independent Auditors� Report
2017/18 Annual Report 11
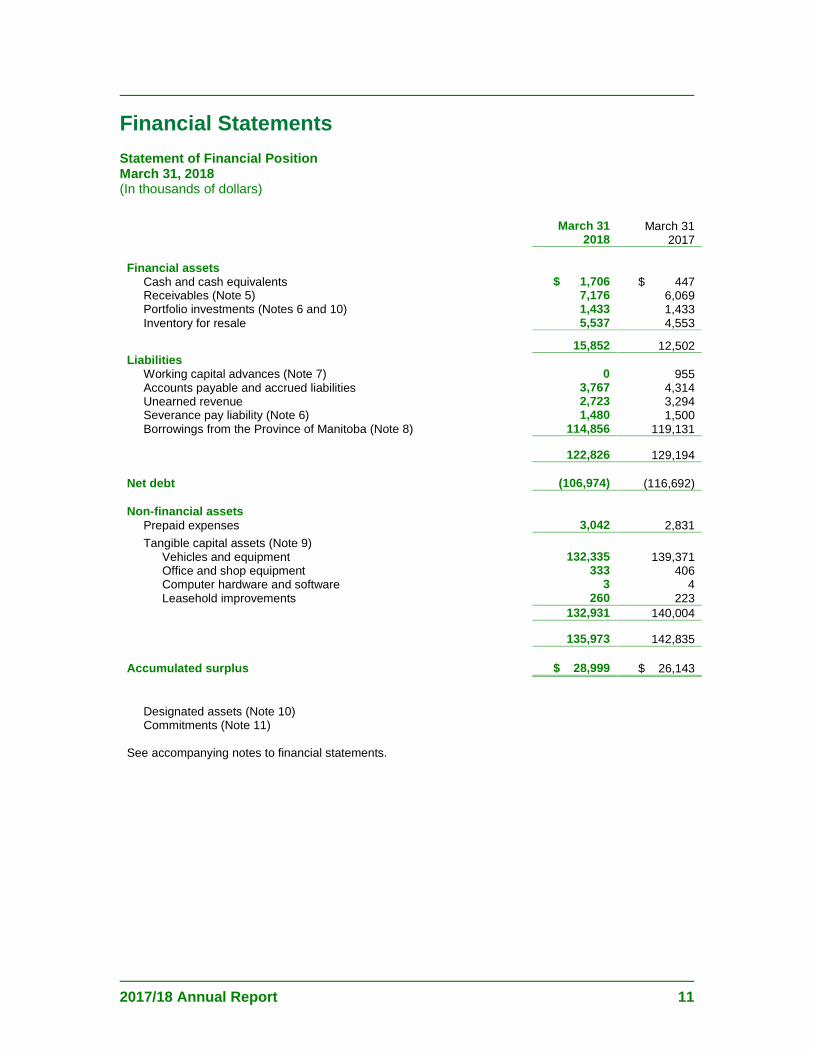
Financial Statements Statement of Financial Position March 31, 2018 (In thousands of dollars)
March 31 2018
March 31 2017
Financial assets Cash and cash equivalents $ 1,706 $ 447 Receivables (Note 5) 7,176 6,069 Portfolio investments (Notes 6 and 10) 1,433 1,433 Inventory for resale 5,537 4,553
15,852 12,502 Liabilities Working capital advances (Note 7) 0 955 Accounts payable and accrued liabilities 3,767 4,314 Unearned revenue 2,723 3,294 Severance pay liability (Note 6) 1,480 1,500 Borrowings from the Province of Manitoba (Note 8) 114,856 119,131
122,826 129,194
Net debt (106,974) (116,692) Non-financial assets Prepaid expenses 3,042 2,831
Tangible capital assets (Note 9) Vehicles and equipment 132,335 139,371 Office and shop equipment 333 406 Computer hardware and software 3 4 Leasehold improvements 260 223 132,931 140,004
135,973 142,835
Accumulated surplus $ 28,999 $ 26,143 Designated assets (Note 10) Commitments (Note 11) See accompanying notes to financial statements.
For the Year Ended March 31, 2018
12 2017/18 Annual Report
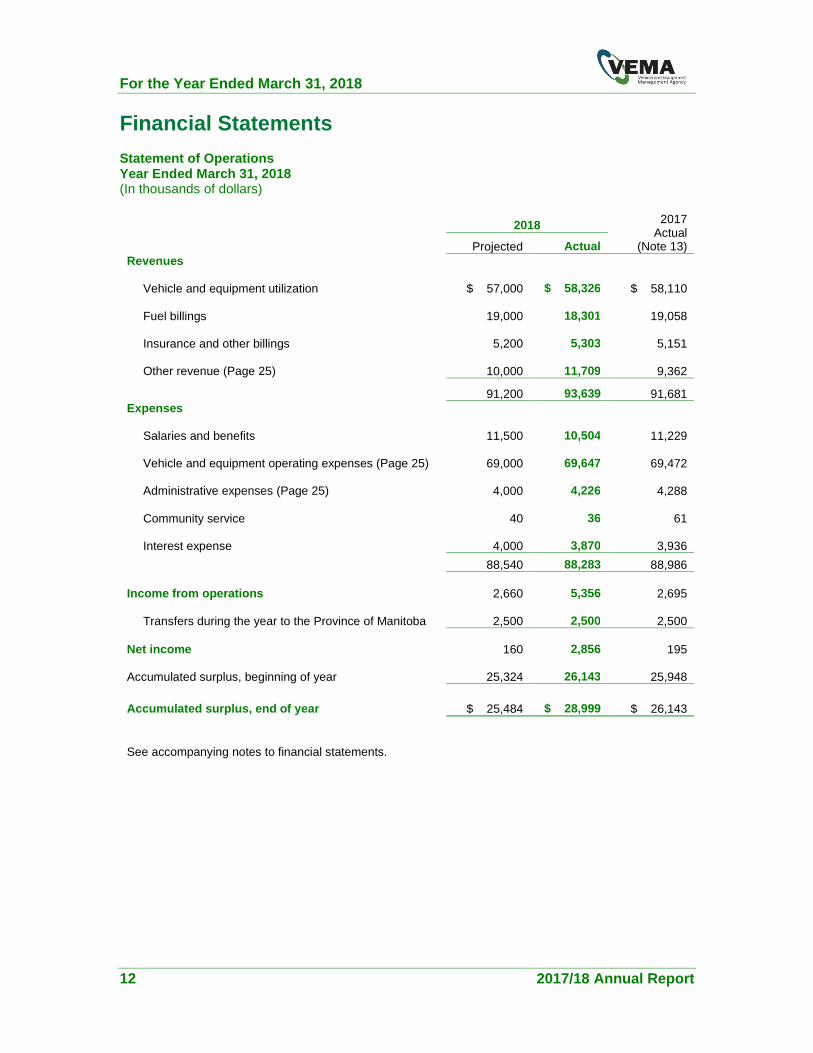
Financial Statements Statement of Operations Year Ended March 31, 2018 (In thousands of dollars)
2018 2017 Actual
(Note 13) Projected Actual Revenues Vehicle and equipment utilization $ 57,000 $ 58,326 $ 58,110 Fuel billings 19,000 18,301 19,058 Insurance and other billings 5,200 5,303 5,151 Other revenue (Page 25) 10,000 11,709 9,362
91,200 93,639 91,681 Expenses Salaries and benefits 11,500 10,504 11,229 Vehicle and equipment operating expenses (Page 25) 69,000 69,647 69,472 Administrative expenses (Page 25) 4,000 4,226 4,288 Community service 40 36 61 Interest expense 4,000 3,870 3,936
88,540 88,283 88,986
Income from operations 2,660 5,356 2,695 Transfers during the year to the Province of Manitoba 2,500 2,500 2,500
Net income 160 2,856 195 Accumulated surplus, beginning of year 25,324 26,143 25,948
Accumulated surplus, end of year $ 25,484 $ 28,999 $ 26,143 See accompanying notes to financial statements.

2017/18 Annual Report 13
Financial Statements Statement of Change in Net Debt Year Ended March 31, 2018 (In thousands of dollars)
2018 2017
Actual Projected Actual Net income $ 160 $ 2,856 $ 195 Tangible capital assets Acquisition of tangible capital assets (25,400) (24,670) (33,118) Amortization of tangible capital assets 28,115 28,439 27,590 Gain on disposal of tangible capital assets, net (1,200) (2,152) (768) Proceeds from disposal of tangible capital assets 4,000 5,456 4,065
Net acquisition of tangible capital assets 5,515 7,073 (2,231) Decrease (increase) in prepaid expenses during the year 0 (211) 36
Decrease (increase) in net debt 5,675 9,718 (2,000) Net debt, beginning of year (120,190) (116,692) (114,692)
Net debt, end of year $ (114,515) $ (106,974) $ (116,692) See accompanying notes to financial statements.
For the Year Ended March 31, 2018
14 2017/18 Annual Report
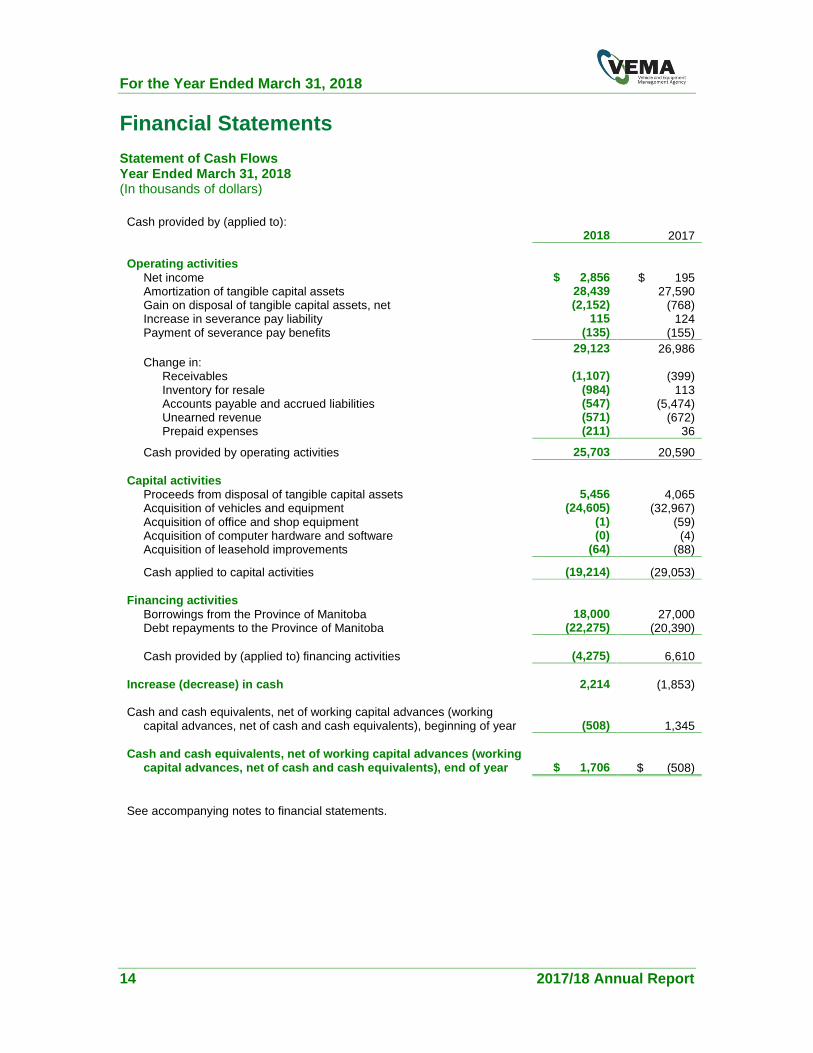
Financial Statements Statement of Cash Flows Year Ended March 31, 2018 (In thousands of dollars)
Cash provided by (applied to): 2018 2017
Operating activities Net income $ 2,856 $ 195 Amortization of tangible capital assets 28,439 27,590 Gain on disposal of tangible capital assets, net (2,152) (768) Increase in severance pay liability 115 124 Payment of severance pay benefits (135) (155) 29,123 26,986 Change in: Receivables (1,107) (399) Inventory for resale (984) 113 Accounts payable and accrued liabilities (547) (5,474) Unearned revenue (571) (672) Prepaid expenses (211) 36
Cash provided by operating activities 25,703 20,590 Capital activities Proceeds from disposal of tangible capital assets 5,456 4,065 Acquisition of vehicles and equipment (24,605) (32,967) Acquisition of office and shop equipment (1) (59) Acquisition of computer hardware and software (0) (4) Acquisition of leasehold improvements (64) (88)
Cash applied to capital activities (19,214) (29,053) Financing activities Borrowings from the Province of Manitoba 18,000 27,000 Debt repayments to the Province of Manitoba (22,275) (20,390)
Cash provided by (applied to) financing activities (4,275) 6,610
Increase (decrease) in cash 2,214 (1,853) Cash and cash equivalents, net of working capital advances (working capital advances, net of cash and cash equivalents), beginning of year (508) 1,345 Cash and cash equivalents, net of working capital advances (working capital advances, net of cash and cash equivalents), end of year $ 1,706 $ (508) See accompanying notes to financial statements.
2017/18 Annual Report 15
Financial Statements Notes to Financial Statements Year Ended March 31, 2018 (In thousands of dollars)
1. Nature of organization In 1934, Fleet Vehicles was created as a branch of the Manitoba provincial government to provide a centralized fleet management program. On April 1, 1992, the branch was approved as a special operating agency, the first such agency at the provincial level in Canada. Since inception, Fleet Vehicles Agency primarily provided light duty vehicles and equipment services, with ambulances becoming a part of the fleet starting in 2001/02. On April 1, 2003, the Agency assumed responsibility for Radio Services, a division that evaluates and supplies the fixed and mobile radio requirements of its provincial and other clients. Following the advent of engineering-based highway management in the 1960s, the Province established a highways department. The Mechanical Equipment Services branch emerged as an integral and important part of the department, primarily providing heavy duty vehicles and equipment, as well as warehousing services. The provided services support the safe and efficient delivery of the department�s construction,
maintenance and preservation programs, and its remote airport programs, in a manner that incorporates the principles of sustainable development and environmental awareness. Effective April 1, 2009, Fleet Vehicles Agency and the Mechanical Equipment Services branch were amalgamated into a new special operating agency named Vehicle and Equipment Management Agency (�VEMA�, or the �Agency�). VEMA combines the acquisition, management and disposal of both light duty and heavy duty vehicles and equipment under common management. VEMA was a part of the Department of Infrastructure and Transportation through March 31, 2015, under the general direction of the Assistant Deputy Minister, Supply and Services Division, and ultimately the policy direction of the Deputy Minister and the Minister. As of April 1, 2015, the Agency was transitioned from Infrastructure and Transportation to the Department of Finance, and is now under the direction of the Associate Deputy Minister of Finance, Central Services, and ultimately the policy direction of the Minister of Finance. The Agency is financed through the Special Operating Agencies Financing Authority (SOAFA). SOAFA has the mandate to hold and acquire assets required for and resulting from Agency operations. It finances the Agency through repayable loans and working capital advances. This financial framework enables VEMA to operate in a business-like manner according to public policy expectations. A Management Agreement assigns responsibility to VEMA to manage and account for the Agency-related assets and operations on behalf of SOAFA. The Agency remains bound by relevant legislation and regulations. It is also bound by administrative policy except where specific exemptions have been provided in its charter in order to meet business objectives.
2. Basis of accounting The Agency�s financial statements are prepared in accordance with Canadian Public Sector Accounting
Standards as recommended by the Public Sector Accounting Board.
For the Year Ended March 31, 2018
16 2017/18 Annual Report
Financial Statements Notes to Financial Statements Year Ended March 31, 2018 (In thousands of dollars)
3. Summary of significant accounting policies Revenues Fixed rate lease revenue is recognized on a straight-line basis over the term of the lease. Variable rate lease revenue is recognized monthly based on equipment usage. Service revenue is recognized when the services have been performed. All revenues are recorded on an accrual basis. Expenses All expenses incurred for goods and services are recognized at the gross amount on an accrual basis. Government transfers are recognized as expenses in the period in which the transfers are authorized and all eligibility criteria have been met. Financial assets
(i) Cash and cash equivalents Cash and cash equivalents include cash on hand and balances with banks. Bank overdrafts and bank borrowings are considered to be financing activities.
(ii) Receivables Receivables are recorded at the lower of cost and net realizable value. Amounts doubtful of collection are recorded when there is uncertainty that the amounts will be realized. (iii) Portfolio investments Portfolio investments are short-term deposits with original maturities of more than three months. These investments are recognized at cost.
(iv) Inventory for resale Inventories for resale are valued at the lower of cost and net realizable value. Cost is determined on a weighted average basis.
Liabilities Liabilities are present obligations as a result of transactions and events occurring prior to the end of the fiscal year. The settlement of the liabilities will result in the future transfer or use of assets or other form of settlement. Liabilities are recorded in the financial statements when there is an appropriate basis of measurement and a reasonable estimate can be made of the amounts involved. Non-financial assets Non-financial assets do not normally provide resources to discharge liabilities of the Agency. These assets are normally employed to provide future services.
2017/18 Annual Report 17
Financial Statements Notes to Financial Statements Year Ended March 31, 2018 (In thousands of dollars)
3. Summary of significant accounting policies (continued)
(i) Prepaid expenses
Prepaid expenses are payments for goods or services that will provide economic benefit in future periods. The prepaid amount is recognized as an expense in the year that the goods or services are consumed. (ii) Tangible capital assets
Tangible capital assets are recognized at cost. Cost includes the purchase price as well as other acquisition costs such as freight charges, transportation, insurance costs and duties. Modifications or additions to the original asset are capitalized and recognized at cost. The values of tangible capital assets are written down when conditions indicate that the values of the future economic benefits associated with the tangible capital assets are less than their book values. The costs of tangible capital assets, less their estimated residual values, are amortized over their useful lives in the following manner:
Vehicles and equipment 30%, declining balance method Vehicles and equipment (signed lease agreement)
Straight-line over term of lease
Office and shop equipment 20%, declining balance method Computer hardware and software 20%, straight-line method Leasehold improvements 10%, straight-line method
Measurement uncertainty The preparation of financial statements requires management to make estimates and assumptions that affect the reported amounts of assets and liabilities, the disclosure of contingencies at the date of the financial statements, and the reported amount of revenues and expenses during the reporting period. Judgment is required in determining the future economic benefit of all non-financial assets, especially in the estimation of the useful lives of tangible capital assets. Actual results could differ from these estimates.
4. Financial instruments and financial risk management Measurement Financial instruments are classified into one of the two measurement categories: (a) fair value; or (b) cost or amortized cost. The Agency records its financial assets at cost. Financial assets include cash and cash equivalents, receivables and portfolio investments. The Agency also records its financial liabilities at cost. Financial liabilities include working capital advances, accounts payable and accrued liabilities, and borrowings from the Province of Manitoba. Gains and losses on financial instruments measured at fair value are recorded in accumulated surplus as re-measurement gains and losses until realized. Upon disposition of the financial instruments, the cumulative
For the Year Ended March 31, 2018
18 2017/18 Annual Report
Financial Statements Notes to Financial Statements Year Ended March 31, 2018 (In thousands of dollars)
4. Financial instruments and financial risk management (continued) re-measurement gains and losses are reclassified to the statement of operations. Gains and losses on financial instruments measured at cost or amortized cost are recognized in the statement of operations in the period the gain or loss occurs. As the Agency has no financial instruments measured at fair value, it did not incur any re-measurement gains and losses during the year ended March 31, 2018 (2017 - $nil). Financial risk management � overview The Agency has exposure to the following risks from its use of financial instruments: credit risk; liquidity risk; market risk; and interest rate risk.
Credit risk
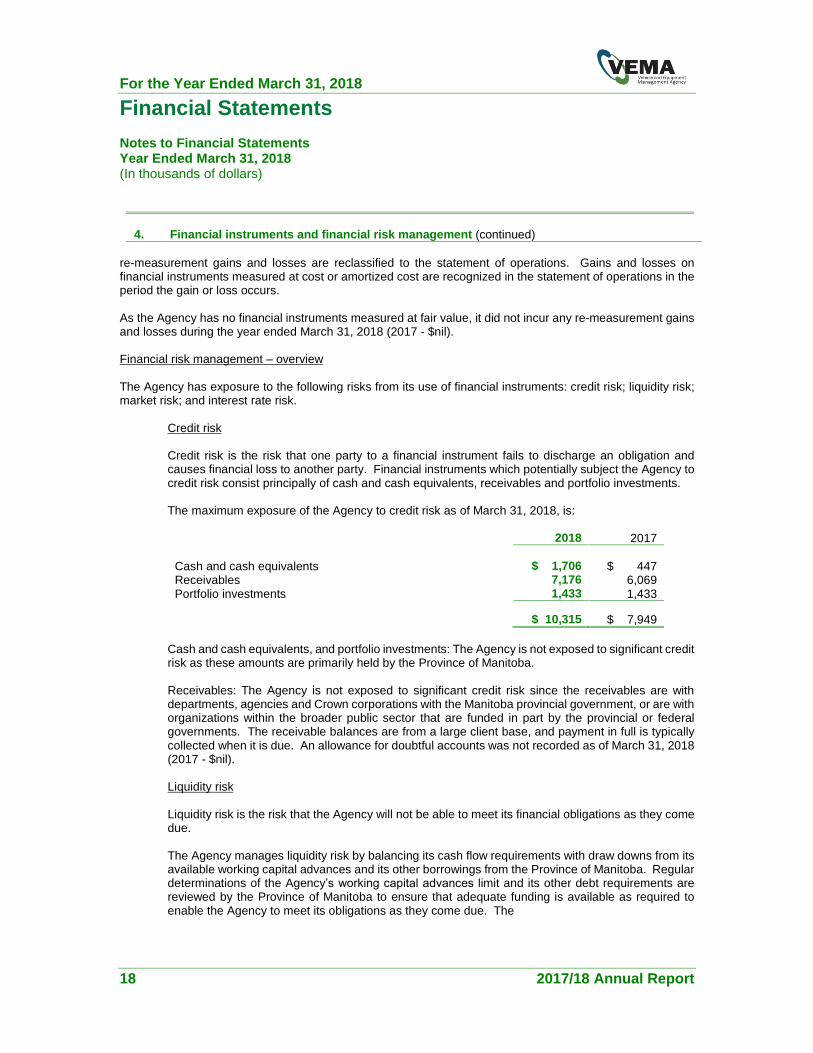
Credit risk is the risk that one party to a financial instrument fails to discharge an obligation and causes financial loss to another party. Financial instruments which potentially subject the Agency to credit risk consist principally of cash and cash equivalents, receivables and portfolio investments. The maximum exposure of the Agency to credit risk as of March 31, 2018, is:
2018 2017 Cash and cash equivalents $ 1,706 $ 447 Receivables 7,176 6,069 Portfolio investments 1,433 1,433
$ 10,315 $ 7,949 Cash and cash equivalents, and portfolio investments: The Agency is not exposed to significant credit risk as these amounts are primarily held by the Province of Manitoba. Receivables: The Agency is not exposed to significant credit risk since the receivables are with departments, agencies and Crown corporations with the Manitoba provincial government, or are with organizations within the broader public sector that are funded in part by the provincial or federal governments. The receivable balances are from a large client base, and payment in full is typically collected when it is due. An allowance for doubtful accounts was not recorded as of March 31, 2018 (2017 - $nil). Liquidity risk Liquidity risk is the risk that the Agency will not be able to meet its financial obligations as they come due. The Agency manages liquidity risk by balancing its cash flow requirements with draw downs from its available working capital advances and its other borrowings from the Province of Manitoba. Regular determinations of the Agency�s working capital advances limit and its other debt requirements are reviewed by the Province of Manitoba to ensure that adequate funding is available as required to enable the Agency to meet its obligations as they come due. The
2017/18 Annual Report 19
Financial Statements Notes to Financial Statements Year Ended March 31, 2018 (In thousands of dollars)
4. Financial instruments and financial risk management (continued)
contractual maturities of the Agency�s borrowings from the Province of Manitoba are included in note
8. Working capital advances are due on demand.
Market risk
Market risk is the risk that changes in market prices, such as interest rates and foreign exchange rates, will affect the Agency�s income from operations or the fair values of its financial instruments.
Interest rate risk
Interest rate risk is the risk that the fair value or future cash flows of a financial instrument will fluctuate because of changes in market interest rates. The interest rate exposure relates to cash, cash equivalents, portfolio investments, working capital advances, and to other borrowings.
The interest rate risk on cash and cash equivalents and working capital advances is considered to be low because of their short term nature. The interest rate risk on portfolio investments is considered low as the original deposits are reinvested at rates for investments with similar terms and conditions.
The Agency manages its interest rate risk on long term borrowings through the exclusive use of fixed rate terms on each amount borrowed.
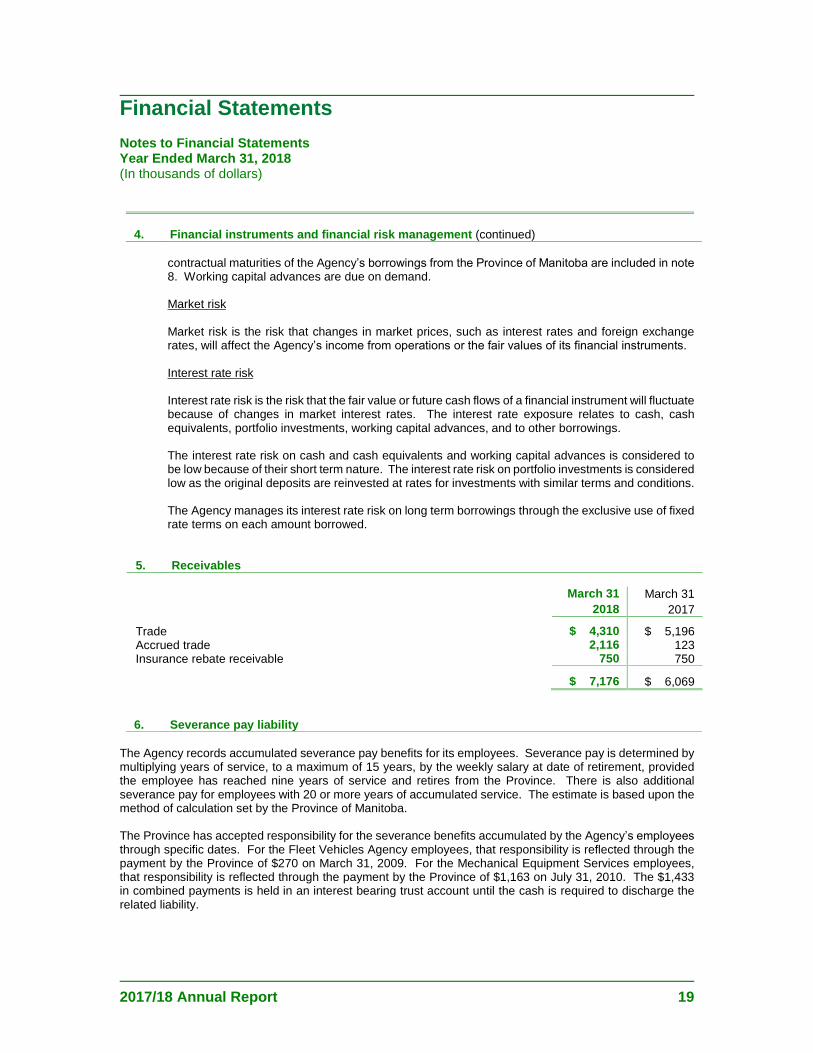
5. Receivables
March 31 March 31
2018 2017
Trade $ 4,310 $ 5,196 Accrued trade 2,116 123 Insurance rebate receivable 750 750
$ 7,176 $ 6,069
6. Severance pay liability The Agency records accumulated severance pay benefits for its employees. Severance pay is determined by multiplying years of service, to a maximum of 15 years, by the weekly salary at date of retirement, provided the employee has reached nine years of service and retires from the Province. There is also additional severance pay for employees with 20 or more years of accumulated service. The estimate is based upon the method of calculation set by the Province of Manitoba. The Province has accepted responsibility for the severance benefits accumulated by the Agency�s employees
through specific dates. For the Fleet Vehicles Agency employees, that responsibility is reflected through the payment by the Province of $270 on March 31, 2009. For the Mechanical Equipment Services employees, that responsibility is reflected through the payment by the Province of $1,163 on July 31, 2010. The $1,433 in combined payments is held in an interest bearing trust account until the cash is required to discharge the related liability.
For the Year Ended March 31, 2018
20 2017/18 Annual Report
Financial Statements Notes to Financial Statements Year Ended March 31, 2018 (In thousands of dollars)
6. Severance pay liability (continued) An actuarial valuation report was completed for the severance pay liability as of April 1, 2017. The report provides a formula to update the liability on an annual basis. In accordance with the formula, the Agency�s
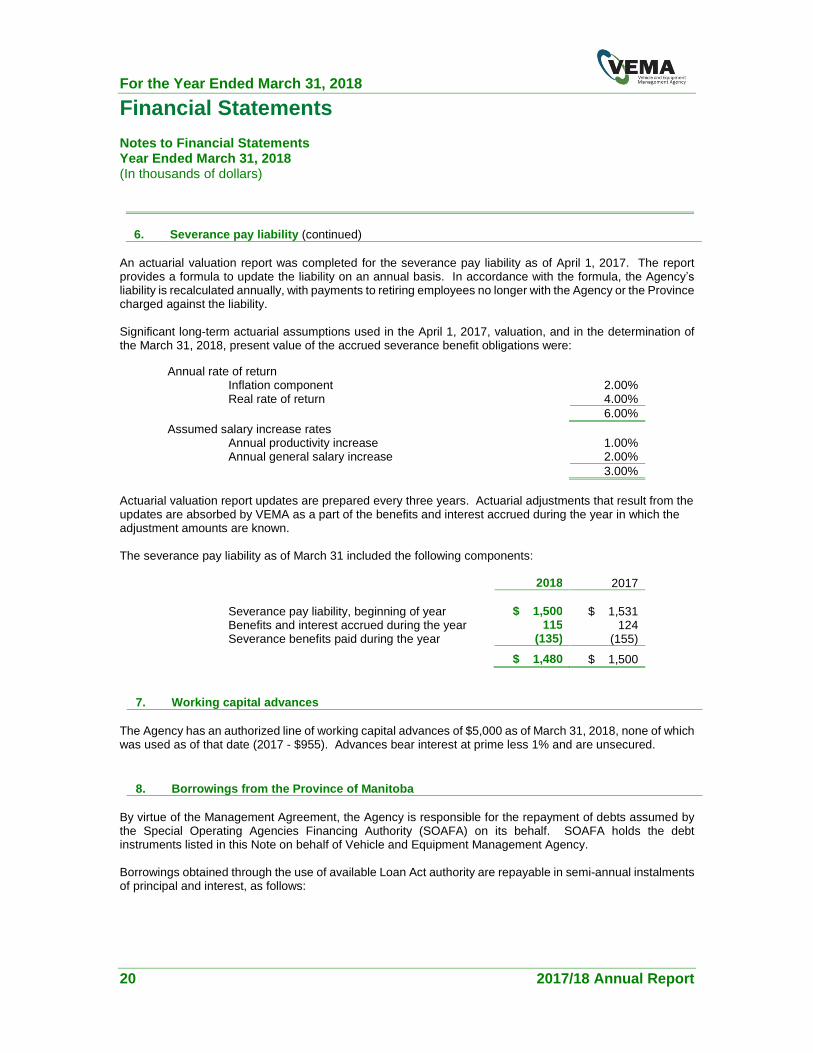
liability is recalculated annually, with payments to retiring employees no longer with the Agency or the Province charged against the liability. Significant long-term actuarial assumptions used in the April 1, 2017, valuation, and in the determination of the March 31, 2018, present value of the accrued severance benefit obligations were:
Annual rate of return Inflation component 2.00% Real rate of return 4.00% 6.00%
Assumed salary increase rates Annual productivity increase 1.00% Annual general salary increase 2.00% 3.00%
Actuarial valuation report updates are prepared every three years. Actuarial adjustments that result from the updates are absorbed by VEMA as a part of the benefits and interest accrued during the year in which the adjustment amounts are known. The severance pay liability as of March 31 included the following components:
2018 2017 Severance pay liability, beginning of year $ 1,500 $ 1,531 Benefits and interest accrued during the year 115 124 Severance benefits paid during the year (135) (155)
$ 1,480 $ 1,500
7. Working capital advances The Agency has an authorized line of working capital advances of $5,000 as of March 31, 2018, none of which was used as of that date (2017 - $955). Advances bear interest at prime less 1% and are unsecured.
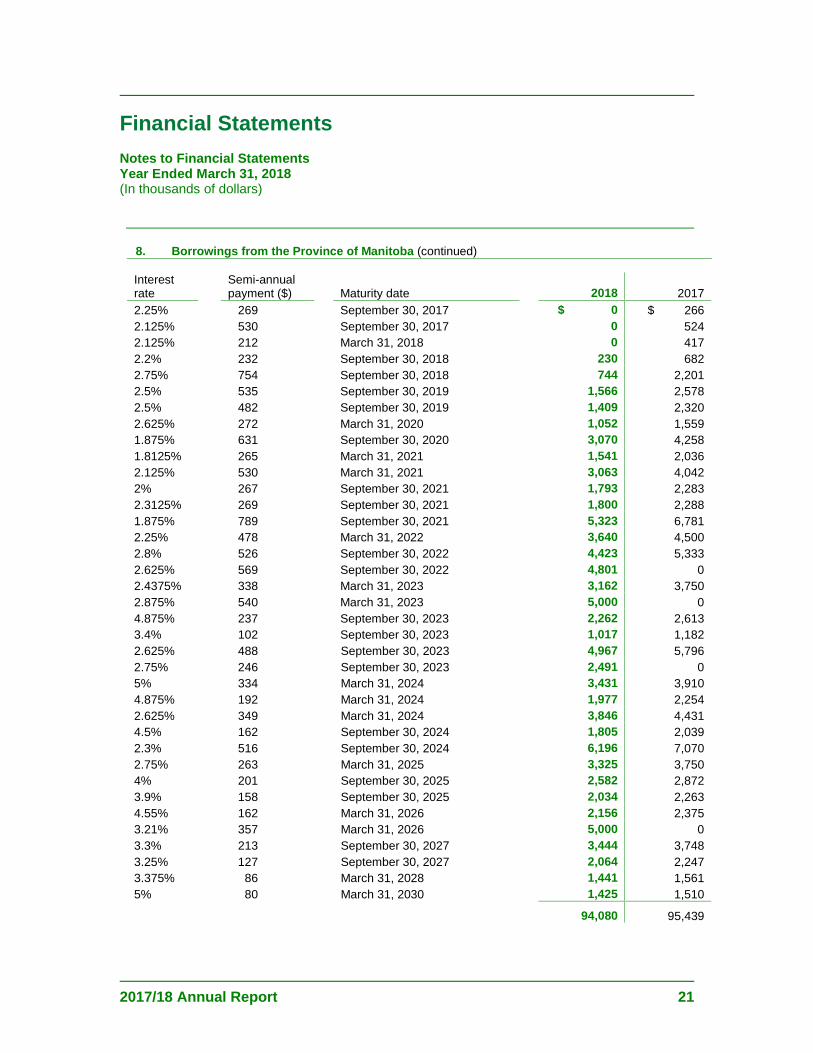
8. Borrowings from the Province of Manitoba By virtue of the Management Agreement, the Agency is responsible for the repayment of debts assumed by the Special Operating Agencies Financing Authority (SOAFA) on its behalf. SOAFA holds the debt instruments listed in this Note on behalf of Vehicle and Equipment Management Agency. Borrowings obtained through the use of available Loan Act authority are repayable in semi-annual instalments of principal and interest, as follows:
2017/18 Annual Report 21
Financial Statements Notes to Financial Statements Year Ended March 31, 2018 (In thousands of dollars)
8. Borrowings from the Province of Manitoba (continued)
Interest rate
Semi-annual payment ($)
Maturity date
2018 2017
2.25% 269 September 30, 2017 $ 0 $ 266 2.125% 530 September 30, 2017 0 524 2.125% 212 March 31, 2018 0 417 2.2% 232 September 30, 2018 230 682 2.75% 754 September 30, 2018 744 2,201 2.5% 535 September 30, 2019 1,566 2,578 2.5% 482 September 30, 2019 1,409 2,320 2.625% 272 March 31, 2020 1,052 1,559 1.875% 631 September 30, 2020 3,070 4,258 1.8125% 265 March 31, 2021 1,541 2,036 2.125% 530 March 31, 2021 3,063 4,042 2% 267 September 30, 2021 1,793 2,283 2.3125% 269 September 30, 2021 1,800 2,288 1.875% 789 September 30, 2021 5,323 6,781 2.25% 478 March 31, 2022 3,640 4,500 2.8% 526 September 30, 2022 4,423 5,333 2.625% 569 September 30, 2022 4,801 0 2.4375% 338 March 31, 2023 3,162 3,750 2.875% 540 March 31, 2023 5,000 0 4.875% 237 September 30, 2023 2,262 2,613 3.4% 102 September 30, 2023 1,017 1,182 2.625% 488 September 30, 2023 4,967 5,796 2.75% 246 September 30, 2023 2,491 0 5% 334 March 31, 2024 3,431 3,910 4.875% 192 March 31, 2024 1,977 2,254 2.625% 349 March 31, 2024 3,846 4,431 4.5% 162 September 30, 2024 1,805 2,039 2.3% 516 September 30, 2024 6,196 7,070 2.75% 263 March 31, 2025 3,325 3,750 4% 201 September 30, 2025 2,582 2,872 3.9% 158 September 30, 2025 2,034 2,263 4.55% 162 March 31, 2026 2,156 2,375 3.21% 357 March 31, 2026 5,000 0 3.3% 213 September 30, 2027 3,444 3,748 3.25% 127 September 30, 2027 2,064 2,247 3.375% 86 March 31, 2028 1,441 1,561 5% 80 March 31, 2030 1,425 1,510
94,080 95,439
For the Year Ended March 31, 2018
22 2017/18 Annual Report
Financial Statements Notes to Financial Statements Year Ended March 31, 2018 (In thousands of dollars)
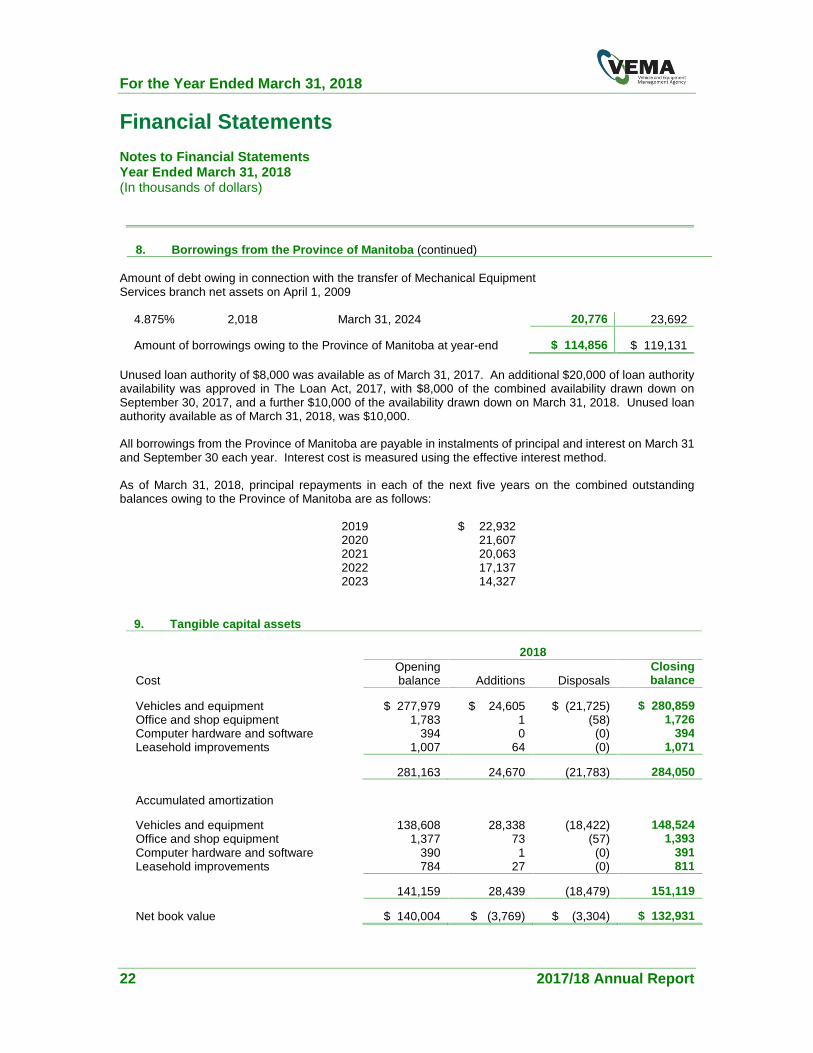
8. Borrowings from the Province of Manitoba (continued) Amount of debt owing in connection with the transfer of Mechanical Equipment Services branch net assets on April 1, 2009
4.875% 2,018 March 31, 2024 20,776 23,692
Amount of borrowings owing to the Province of Manitoba at year-end
$ 114,856 $ 119,131 Unused loan authority of $8,000 was available as of March 31, 2017. An additional $20,000 of loan authority availability was approved in The Loan Act, 2017, with $8,000 of the combined availability drawn down on September 30, 2017, and a further $10,000 of the availability drawn down on March 31, 2018. Unused loan authority available as of March 31, 2018, was $10,000. All borrowings from the Province of Manitoba are payable in instalments of principal and interest on March 31 and September 30 each year. Interest cost is measured using the effective interest method. As of March 31, 2018, principal repayments in each of the next five years on the combined outstanding balances owing to the Province of Manitoba are as follows:
2019 $ 22,932 2020 21,607 2021 20,063 2022 17,137 2023 14,327
9. Tangible capital assets
2018
Cost Opening balance
Additions
Disposals
Closing balance
Vehicles and equipment $ 277,979 $ 24,605 $ (21,725) $ 280,859 Office and shop equipment 1,783 1 (58) 1,726 Computer hardware and software 394 0 (0) 394 Leasehold improvements 1,007 64 (0) 1,071
281,163 24,670 (21,783) 284,050
Accumulated amortization
Vehicles and equipment 138,608 28,338 (18,422) 148,524 Office and shop equipment 1,377 73 (57) 1,393 Computer hardware and software 390 1 (0) 391 Leasehold improvements 784 27 (0) 811
141,159 28,439 (18,479) 151,119
Net book value $ 140,004 $ (3,769) $ (3,304) $ 132,931
2017/18 Annual Report 23
Financial Statements Notes to Financial Statements Year Ended March 31, 2018 (In thousands of dollars)
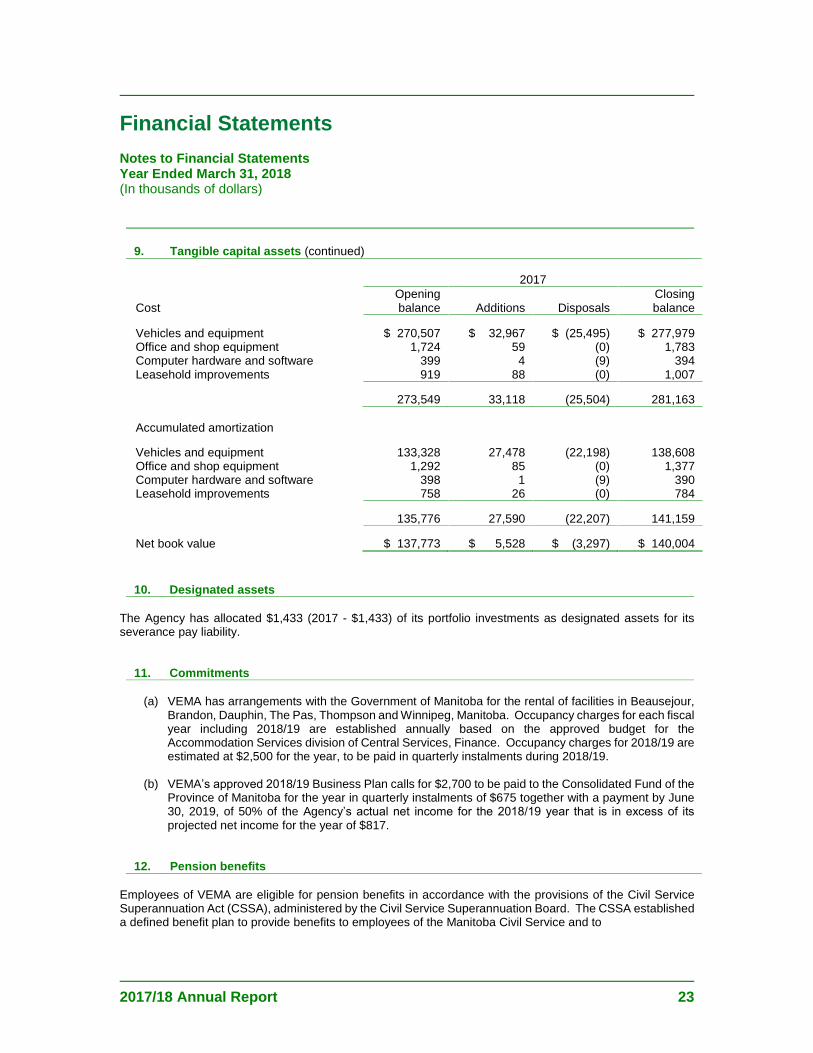
9. Tangible capital assets (continued)
2017
Cost Opening balance
Additions
Disposals
Closing balance
Vehicles and equipment $ 270,507 $ 32,967 $ (25,495) $ 277,979 Office and shop equipment 1,724 59 (0) 1,783 Computer hardware and software 399 4 (9) 394 Leasehold improvements 919 88 (0) 1,007
273,549 33,118 (25,504) 281,163
Accumulated amortization
Vehicles and equipment 133,328 27,478 (22,198) 138,608 Office and shop equipment 1,292 85 (0) 1,377 Computer hardware and software 398 1 (9) 390 Leasehold improvements 758 26 (0) 784
135,776 27,590 (22,207) 141,159
Net book value $ 137,773 $ 5,528 $ (3,297) $ 140,004
10. Designated assets The Agency has allocated $1,433 (2017 - $1,433) of its portfolio investments as designated assets for its severance pay liability.
11. Commitments
(a) VEMA has arrangements with the Government of Manitoba for the rental of facilities in Beausejour, Brandon, Dauphin, The Pas, Thompson and Winnipeg, Manitoba. Occupancy charges for each fiscal year including 2018/19 are established annually based on the approved budget for the Accommodation Services division of Central Services, Finance. Occupancy charges for 2018/19 are estimated at $2,500 for the year, to be paid in quarterly instalments during 2018/19.
(b) VEMA�s approved 2018/19 Business Plan calls for $2,700 to be paid to the Consolidated Fund of the
Province of Manitoba for the year in quarterly instalments of $675 together with a payment by June 30, 2019, of 50% of the Agency�s actual net income for the 2018/19 year that is in excess of its
projected net income for the year of $817.
12. Pension benefits Employees of VEMA are eligible for pension benefits in accordance with the provisions of the Civil Service Superannuation Act (CSSA), administered by the Civil Service Superannuation Board. The CSSA established a defined benefit plan to provide benefits to employees of the Manitoba Civil Service and to
For the Year Ended March 31, 2018
24 2017/18 Annual Report
Financial Statements Notes to Financial Statements Year Ended March 31, 2018 (In thousands of dollars)
12. Pension benefits (continued) participating agencies of the provincial government, including the Agency, through the Civil Service Superannuation Fund. The pension liability related to the CSSA�s defined benefit plan is included in the Province of Manitoba�s
financial statements. Accordingly, no provision is required in the Agency�s financial statements relating to the effects of participation in the plan by the Agency and its employees. The Agency is regularly required to pay to the Province an amount equal to the current pension contributions paid by its employees. The amount paid for 2018 was $681 (2017 - $787).
13. Comparative financial statements Certain reclassifications have been made in the financial statements for the year ended March 31, 2017, to make their presentation comparable to that in the actual financial statements for the year ended March 31, 2018.
2017/18 Annual Report 25
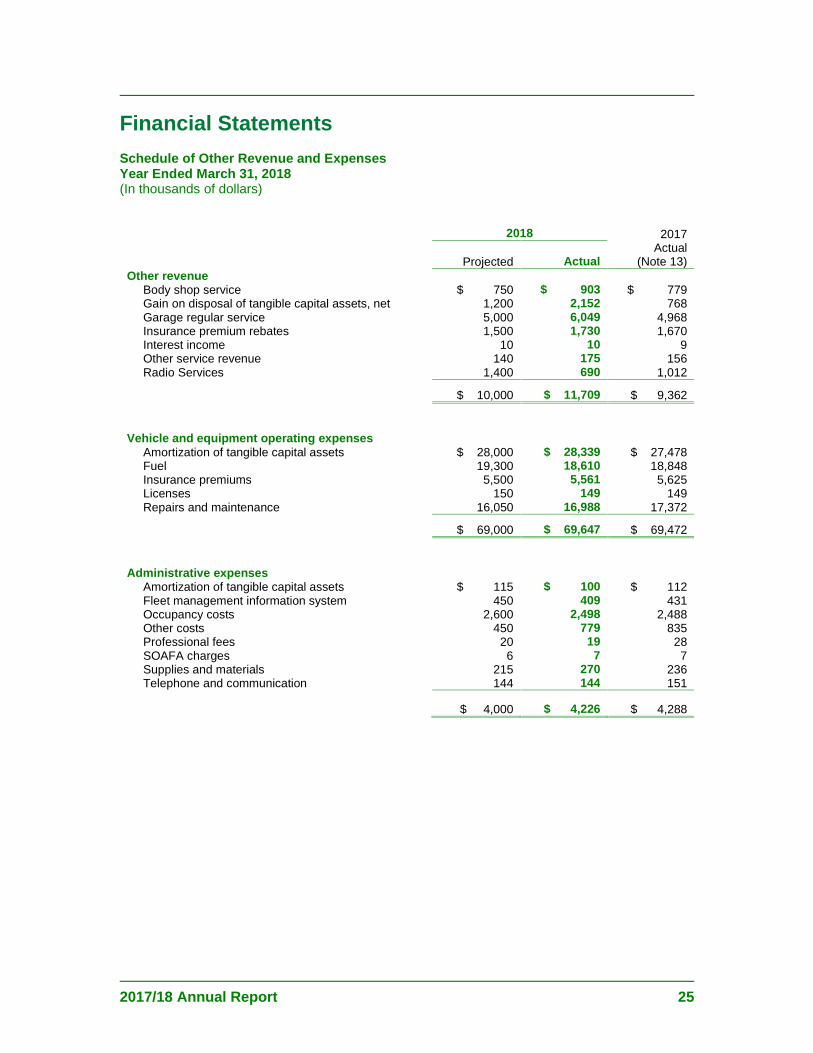
Financial Statements Schedule of Other Revenue and Expenses Year Ended March 31, 2018 (In thousands of dollars)
2018 2017 Actual
(Note 13) Projected
Actual Other revenue Body shop service $ 750 $ 903 $ 779 Gain on disposal of tangible capital assets, net 1,200 2,152 768 Garage regular service 5,000 6,049 4,968 Insurance premium rebates 1,500 1,730 1,670 Interest income 10 10 9 Other service revenue 140 175 156 Radio Services 1,400 690 1,012
$ 10,000 $ 11,709 $ 9,362 Vehicle and equipment operating expenses Amortization of tangible capital assets $ 28,000 $ 28,339 $ 27,478 Fuel 19,300 18,610 18,848 Insurance premiums 5,500 5,561 5,625 Licenses 150 149 149 Repairs and maintenance 16,050 16,988 17,372
$ 69,000 $ 69,647 $ 69,472 Administrative expenses Amortization of tangible capital assets $ 115 $ 100 $ 112 Fleet management information system 450 409 431 Occupancy costs 2,600 2,498 2,488 Other costs 450 779 835 Professional fees 20 19 28 SOAFA charges 6 7 7 Supplies and materials 215 270 236 Telephone and communication 144 144 151
$ 4,000 $ 4,226 $ 4,288
For the Year Ended March 31, 2018
26 2017/18 Annual Report
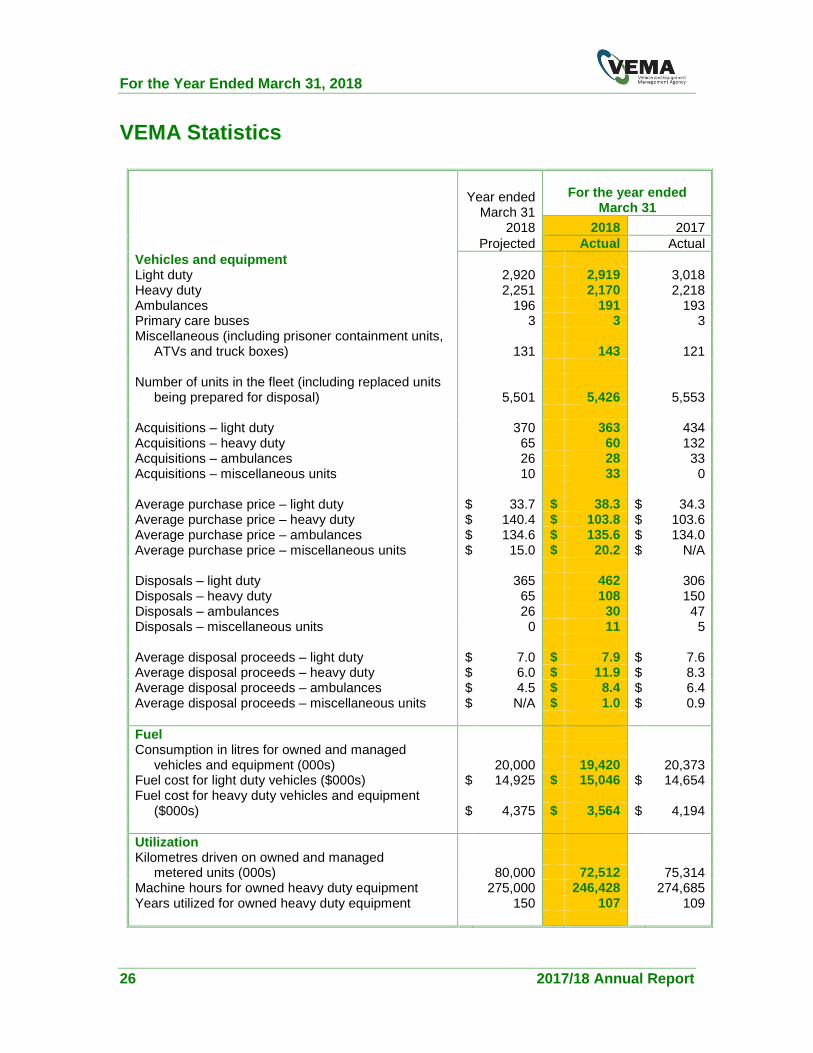
VEMA Statistics
Year ended
March 31 2018
For the year ended March 31
2018 2017 Projected Actual Actual Vehicles and equipment Light duty 2,920 2,919 3,018 Heavy duty 2,251 2,170 2,218 Ambulances 196 191 193 Primary care buses 3 3 3 Miscellaneous (including prisoner containment units, ATVs and truck boxes) 131 143 121 Number of units in the fleet (including replaced units being prepared for disposal) 5,501 5,426 5,553 Acquisitions � light duty 370 363 434 Acquisitions � heavy duty 65 60 132 Acquisitions � ambulances 26 28 33 Acquisitions � miscellaneous units 10 33 0 Average purchase price � light duty $ 33.7 $ 38.3 $ 34.3 Average purchase price � heavy duty $ 140.4 $ 103.8 $ 103.6 Average purchase price � ambulances $ 134.6 $ 135.6 $ 134.0 Average purchase price � miscellaneous units $ 15.0 $ 20.2 $ N/A Disposals � light duty 365 462 306 Disposals � heavy duty 65 108 150 Disposals � ambulances 26 30 47 Disposals � miscellaneous units 0 11 5 Average disposal proceeds � light duty $ 7.0 $ 7.9 $ 7.6 Average disposal proceeds � heavy duty $ 6.0 $ 11.9 $ 8.3 Average disposal proceeds � ambulances $ 4.5 $ 8.4 $ 6.4 Average disposal proceeds � miscellaneous units $ N/A $ 1.0 $ 0.9 Fuel Consumption in litres for owned and managed vehicles and equipment (000s) 20,000 19,420 20,373 Fuel cost for light duty vehicles ($000s) $ 14,925 $ 15,046 $ 14,654 Fuel cost for heavy duty vehicles and equipment ($000s) $ 4,375 $ 3,564 $ 4,194 Utilization Kilometres driven on owned and managed metered units (000s) 80,000 72,512 75,314 Machine hours for owned heavy duty equipment 275,000 246,428 274,685 Years utilized for owned heavy duty equipment 150 107 109
2017/18 Annual Report 27
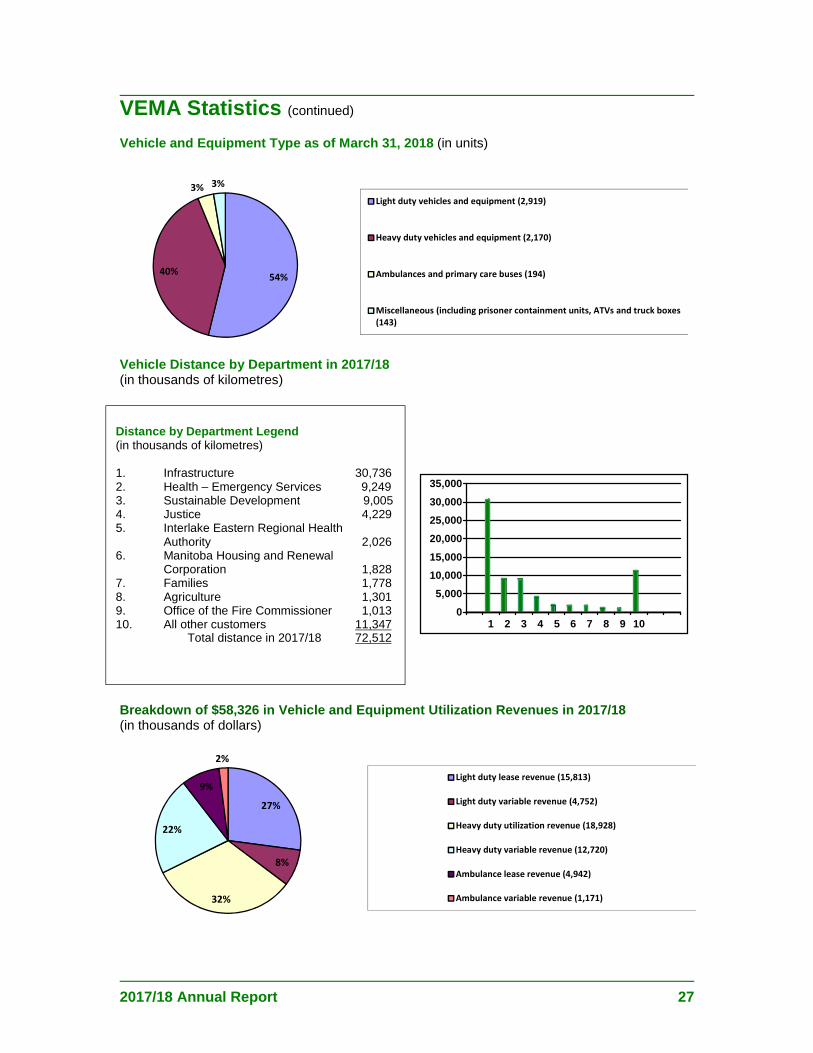
VEMA Statistics (continued) Vehicle and Equipment Type as of March 31, 2018 (in units)
Vehicle Distance by Department in 2017/18 (in thousands of kilometres)
Breakdown of $58,326 in Vehicle and Equipment Utilization Revenues in 2017/18 (in thousands of dollars)
54%40%
3% 3%
Light duty vehicles and equipment (2,919)
Heavy duty vehicles and equipment (2,170)
Ambulances and primary care buses (194)
Miscellaneous (including prisoner containment units, ATVs and truck boxes(143)
27%
8%
32%
22%
9%
2%
Light duty lease revenue (15,813)
Light duty variable revenue (4,752)
Heavy duty utilization revenue (18,928)
Heavy duty variable revenue (12,720)
Ambulance lease revenue (4,942)
Ambulance variable revenue (1,171)
0
5,000
10,000
15,000
20,000
25,000
30,000
35,000
1 2 3 4 5 6 7 8 9 10
Distance by Department Legend (in thousands of kilometres) 1. Infrastructure 30,736 2. Health � Emergency Services 9,249 3. Sustainable Development 9,005 4. Justice 4,229 5. Interlake Eastern Regional Health
Authority 2,026 6. Manitoba Housing and Renewal
Corporation 1,828 7. Families 1,778 8. Agriculture 1,301 9. Office of the Fire Commissioner 1,013 10. All other customers 11,347 Total distance in 2017/18 72,512
For the Year Ended March 31, 2018
28 2017/18 Annual Report
VEMA Contacts
Sean Savage Joel Hershfield A/Chief Operating Officer Phone: (204) 781-7092
Manager, Finance and Administration Phone: (204) 797-8326
Shannan Lanctot David Kroeker Manager, Support Services Systems Supervisor Phone: (204) 945-3309 Phone: (204) 945-4360 Michael Langenfeld Sean Derhak Interim Materials Manager Manager, Heavy Duty Fleet Phone: (204) 794-9096 Phone: (204) 794-6908 Jeff Wood Sean Savage Light Duty Vehicles and Equipment Operations Manager, Light Duty Phone: (204) 945-3303 Phone: (204) 781-7092 Mark Hnatishin Brian Lehky Mechanical Superintendent Mechanical Superintendent Winnipeg and Beausejour Brandon and Dauphin Phone: (204) 268-6280 Phone: (204) 622-2067 Henry Squires Keith Leganchuk Mechanical Superintendent Radio Services Supervisor Thompson and The Pas Phone: (204) 945-8988 Phone: (204) 677-6554
Vehicle and Equipment Management Agency
With full shop facilities in Beausejour, Brandon, Dauphin, The Pas, Thompson and Winnipeg
Satellite shop facilities in several other Manitoba locations And services to Northern Airports and Marine Operations locations throughout Manitoba
VEMA�s vision is to be the recognized leading provider of asset management services to the broader public sector.
2017/18 Annual Report 29