
Valuation of Philip Morris International Inc. - CBS Research ...
159
Valuation of Philip Morris International Inc. HAND IN DATE: 15 MAY 2019 Authors: Ella Horvath (116850) & Karolina Hammarskiöld (116836) Supervisor: Rune Dalgaard Master Thesis Cand.merc. Finance & Strategic Management Copenhagen Business School 2019 Pages: 119; Characters: 199 010
-
Upload
khangminh22 -
Category
Documents
-
view
1 -
download
0
Transcript of Valuation of Philip Morris International Inc. - CBS Research ...

Valuation of Philip Morris International Inc.
HAND IN DATE: 15 MAY 2019
Authors: Ella Horvath (116850) & Karolina Hammarskiöld (116836)
Supervisor: Rune Dalgaard
Master Thesis Cand.merc. Finance & Strategic Management
Copenhagen Business School 2019
Pages: 119; Characters: 199 010

1
Executive summary
The overall aim of this thesis is to determine the intrinsic value of Philip Morris International Inc. as of 13
May 2019. PMI is a leading international tobacco company engaged in the manufacture and sale of cigarettes
and other nicotine-containing products in markets outside of the United States. The company is a United States
based entity incorporated in Virginia with headquarters in New York City, USA, and an operations center in
Lausanne, Switzerland. PMI is the world’s largest transnational tobacco company with net revenues of $29.6
billion, holding the world’s second largest market share after China National Tobacco Corporation.
Philip Morris International Inc. has committed to changing the tobacco industry for good, the company is now
building its future on reduced-risk products, shifting from its core business characterized by steady cash flow
generation to one defined by growing investments into research and development. The changing industry
environment in combination with the typical characteristics of a tobacco company suggests Philip Morris
International Inc. as a compelling valuation case.
The intrinsic valuation approaches suggest a share price of $89.04 as of December 31, 2018. If this value is
discounted forward to 13 May 2019 the share price equals $89.89. When compared to the traded share price
of $83.25, retrieved at the same date, it suggests an upside of 7.98%. Consequently, this thesis concludes a
BUY investment recommendation for PMI shares.
2
Table of Contents Chapter 1 - Introduction to Thesis ........................................................................................................... 5
1.1 Introduction ......................................................................................................................................................................... 5
1.2 Problem Statement ............................................................................................................................................................ 6
1.2.1 Sub-questions ........................................................................................................................ 6
1.3 Methodology and Theory of Science .......................................................................................................................... 7
1.3.1 The Burrell and Morgan Model ............................................................................................. 7
1.3.2 The Two Dimensions............................................................................................................. 7
1.3.3 The Chosen Paradigm ............................................................................................................ 8
1.3.4 Thesis Structure ................................................................................................................... 10
1.3.5 Choice of Valuation Models ................................................................................................ 10
1.3.6 Data ...................................................................................................................................... 11
1.3.7 Delimitations ....................................................................................................................... 12
Chapter 2 - Philip Morris International Inc. and the Tobacco Industry .................................... 13
2.1 History of Tobacco .......................................................................................................................................................... 13
2.2 The Tobacco Industry ................................................................................................................................................... 14
2.2.1 Global Market Players ......................................................................................................... 16
2.3 Philip Morris International Inc. ................................................................................................................................. 17
2.4 Key Company Highlights .............................................................................................................................................. 19
2.4.1 2008 and Forward ................................................................................................................ 19
2.5 Product Portfolio ............................................................................................................................................................. 20
2.5.1 Combustible Cigarettes ........................................................................................................ 20
2.5.2 Reduced-Risk Products ........................................................................................................ 22
2.6 Markets ................................................................................................................................................................................ 23
2.7 Share Price Development ............................................................................................................................................ 25
2.8 Ownership Structure ..................................................................................................................................................... 26
2.9 Peer group .......................................................................................................................................................................... 27
Chapter 3 – Strategic Analysis .................................................................................................................. 28
3.1 PEST Analysis ................................................................................................................................................................... 28
3.1.1 Political Factors ................................................................................................................... 28
3.1.2 Economic Factors ................................................................................................................ 33
3.1.3 Social Factors ...................................................................................................................... 39
3.1.4 Technological Factors .......................................................................................................... 42
3.1.5 Summary of PEST Analysis ................................................................................................ 43
3.2 Porter’s Five Forces Analysis ..................................................................................................................................... 44
3.2.1 Threat of New Entrants ........................................................................................................ 44

3
3.2.2 Bargaining Power of Suppliers ............................................................................................ 47
3.2.3 Bargaining Power of Buyers ................................................................................................ 49
3.2.4 Threat of Substitute Products .............................................................................................. 50
3.2.5 Competitive Rivalry ............................................................................................................ 51
3.2.6 Summary of Porter’s Five Forces ........................................................................................ 52
3.3 SWOT Analysis ................................................................................................................................................................. 52
3.3.1 Strengths .............................................................................................................................. 52
3.3.2 Weaknesses .......................................................................................................................... 54
3.3.3 Opportunities ....................................................................................................................... 56
3.3.4 Threats ................................................................................................................................. 57
3.3.5 Declining Shipment Volumes .............................................................................................. 59
3.2.6 Summary of SWOT Analysis .............................................................................................. 61
Chapter 4 - Financial Statement Analysis ............................................................................................ 62
4.1 Rebalancing Financial Statements for Analytical Purposes .......................................................................... 62
4.1.1 The Analytical Income Statement ....................................................................................... 63
4.1.2 The Analytical Balance Sheet .............................................................................................. 64
4.2 Historical Analysis of Profitability and Performance ....................................................................................... 65
4.2.1 Breaking down the DuPont Model ...................................................................................... 67
4.3 Return on Equity ............................................................................................................................................................. 68
4.3.1 Return on Invested Capital .................................................................................................. 69
4.3.2 Spread .................................................................................................................................. 78
4.3.3 Financial Gearing ................................................................................................................ 79
4.4 DuPont Summary ............................................................................................................................................................ 80
Chapter 5 - Forecasting ............................................................................................................................... 81
5.1 Forecast Period and Terminal Growth ................................................................................................................... 81
5.2 Pro Forma Statement Design ..................................................................................................................................... 82
5.3 Income Statement ........................................................................................................................................................... 82
5.3.1 Revenue Forecast ................................................................................................................. 82
5.3.2 Marketing, Administration and Research costs ................................................................... 89
5.3.3 Amortization ........................................................................................................................ 92
5.3.4 Depreciation ........................................................................................................................ 92
5.3.5 Asset Impairment ................................................................................................................. 93
5.3.6 Tax ....................................................................................................................................... 93
5.4 Balance Sheet .................................................................................................................................................................... 93
5.4.1 Non-current Operating Assets ............................................................................................. 93
5.4.2 Net Working Capital ............................................................................................................ 95

4
5.4.3 Liabilities ............................................................................................................................. 95
5.5 Forecasting Summary ................................................................................................................................................... 96
Chapter 6 - Cost of Capital .......................................................................................................................... 97
6.1 Capital Asset Pricing Model ........................................................................................................................................ 97
6.1.1 Risk-free Rate ...................................................................................................................... 97
6.1.2 Systematic Risk ................................................................................................................... 98
6.1.3 Market Portfolio Risk Premium ........................................................................................ 101
6.1.4 Cost of Equity .................................................................................................................... 102
6.2 Cost of Debt ..................................................................................................................................................................... 102
6.2.1 Tax Rate ............................................................................................................................. 103
6.2.2 Capital Structure ................................................................................................................ 104
6.2.3 Cost of Capital ................................................................................................................... 105
Chapter 7 – Valuation ............................................................................................................................... 106
7.1 Discounted Cash Flow Model ................................................................................................................................... 106
7.2 Economic Value Added Model ................................................................................................................................. 107
7.3 Multiple Valuation ........................................................................................................................................................ 108
7.3.1 Implied Value .................................................................................................................... 111
7.4 Valuation Summary ...................................................................................................................................................... 111
Chapter 8 – Sensitivity Analysis ........................................................................................................... 113
Chapter 9 – Discussion ............................................................................................................................. 117
Chapter 10 – Conclusion .......................................................................................................................... 119
Bibliography ................................................................................................................................................ 120
Appendix ....................................................................................................................................................... 137

5
Chapter 1 - Introduction to Thesis
1.1 Introduction
Despite the tobacco industry receiving negative publicity since the middle of the last century and causing over
7.1 million deaths annually worldwide (Tobacco Atlas, 2019a), the industry is according to the latest statistics
worth a staggering $785 billion, excluding China (BAT, 2019). The success of the tobacco industry, whose
market dynamics demand that it recruits young and healthy customers to smoke potentially deadly products,
depends on marketing expenditures to convey and insert positive values to offset the known dangers related to
the product. Today, the World Health Organization (“WHO”) (2019) estimates that there are over one billion
users of tobacco. However, in the face of mounting damning evidence against the number one product
marketed by the tobacco industry, the combustible cigarette, tobacco companies are now responding by
developing less harmful smoke-free products that are substitute electronic devices to combustible cigarettes,
referred to as electronic cigarettes (“e-cigarettes”). A company following this example is one of the world’s
largest producers of combustible cigarettes, Philip Morris International Inc. (“PMI”), who has seen its
operating profits and FCFs reduced from peak levels, affected by currency headwinds and more intense R&D
and capex endeavors. Committed to changing the tobacco industry for good, PMI is now building its future on
reduced-risk products (“RRPs”), shifting from its core business characterized by steady cash flow generation
to one defined by growing investments into research and development. Further, PMI forms a compelling
subject for investigation as it currently enjoys a first mover advantage with its RRPs, particularly in Europe
and Japan. The authors of the thesis are intrigued as to if a company so deeply embedded into and defined by
the tobacco industry, both in terms of brand and monetary funds, can survive and thrive in a future where the
last cigarette has been put out.
6
1.2 Problem Statement
What is the intrinsic value of one Philip Morris International Inc. share as of 13 May 2019?
1.2.1 Sub-questions
In order to produce a sound and convincing answer to the problem statement, a thorough strategic and financial
analysis will be performed where the following sub-questions will be answered:
Chapter 3 – Strategic analysis
- Which macro-economic factors influence PMI’s risk and future cash flow potential?
- What is the overall attractiveness of the industry and how does it affect PMI’s operations?
- Does PMI possess a competitive advantage and is it sustainable?
Chapter 4 – Financial Statement Analysis
- Which key drivers have affected PMI’s historical financial performance?
Chapter 5 - Forecasting
- Which are the supporting arguments determining the forecast for the income statement and balance
sheet items?
Chapter 6 – Cost of Capital
- What is the most accurate cost of capital for PMI?
Chapter 7 – Valuation
- What is the trading range of PMI?
Chapter 8 – Sensitivity Analysis
- How sensitive is the estimated share price to fluctuations in different company and market factors?

7
1.3 Methodology and Theory of Science
As methodology is believed to be the backbone of the project, emphasis has been devoted to thoroughly
searching for an appropriate methodological approach. Many models have been developed with the attempt to
define paradigms in social and organizational theory. The most common and used model is the one developed
by Burrell and Morgan in 1979 (Hassard, 1991), and it is also this model that has been applied in this paper.
Burrell and Morgan (1979) claim that all social scientists make fundamental assumptions about social reality
and how it should be investigated, influencing the research approach. By examining the model, it is believed
that a suitable framework will be provided, leading to a certain paradigm and a chosen research approach,
allowing the reader to make sense of the type of research that is conducted.
1.3.1 The Burrell and Morgan Model
The model examines two core dimensions, the Radical Change-Regulation dimension and the Subjective-
Objective dimension. The crossing of the two dimensions creates four paradigms, and the choice of paradigm
depends on the standpoint in each dimension. Below, a brief explanation of the two dimensions, as well as the
ontological, epistemological, human nature and methodological categories will be examined. The chosen
standpoint in each dimension will be revealed, which will ultimately describe the suitable paradigm and
methodological approach of this paper.
1.3.2 The Two Dimensions
One of the paradigms refers to the ‘Regulation-Radical Change Dimension’. On the regulation side of the axis,
researchers view the world as a fairly stable place to study (Burrell & Morgan, 1979). Researchers that lean
towards the opposite side of the spectrum, view the world as something that should be changed, often to create
more equal social arrangements (Ibid.).
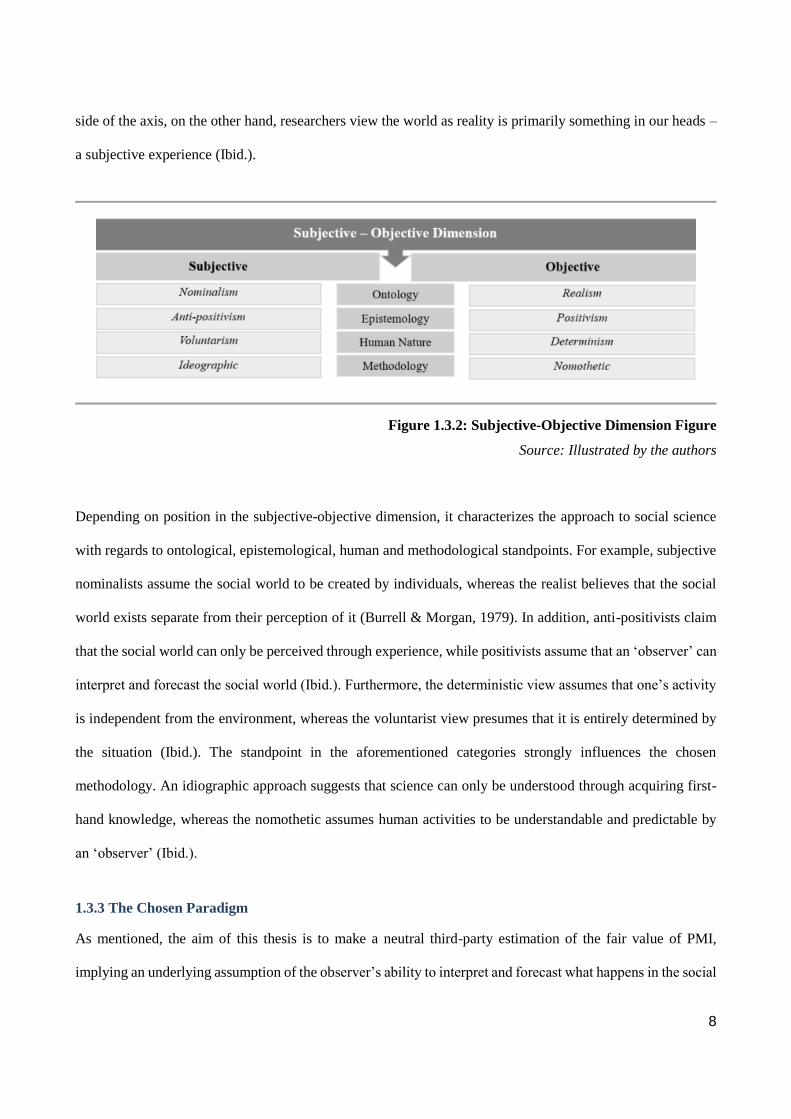
The other dimension refers to the ‘Subjective-Objective dimension’. This dimension focuses on how
knowledge about social reality is created. On the objective side of the Subjective-Objective axis, researchers
view the world as objective, waiting for reality to be discovered (Burrell & Morgan, 1979). On the subjective
8
side of the axis, on the other hand, researchers view the world as reality is primarily something in our heads –
a subjective experience (Ibid.).
Figure 1.3.2: Subjective-Objective Dimension Figure
Source: Illustrated by the authors
Depending on position in the subjective-objective dimension, it characterizes the approach to social science
with regards to ontological, epistemological, human and methodological standpoints. For example, subjective
nominalists assume the social world to be created by individuals, whereas the realist believes that the social
world exists separate from their perception of it (Burrell & Morgan, 1979). In addition, anti-positivists claim
that the social world can only be perceived through experience, while positivists assume that an ‘observer’ can
interpret and forecast the social world (Ibid.). Furthermore, the deterministic view assumes that one’s activity
is independent from the environment, whereas the voluntarist view presumes that it is entirely determined by
the situation (Ibid.). The standpoint in the aforementioned categories strongly influences the chosen
methodology. An idiographic approach suggests that science can only be understood through acquiring first-
hand knowledge, whereas the nomothetic assumes human activities to be understandable and predictable by
an ‘observer’ (Ibid.).
1.3.3 The Chosen Paradigm
As mentioned, the aim of this thesis is to make a neutral third-party estimation of the fair value of PMI,
implying an underlying assumption of the observer’s ability to interpret and forecast what happens in the social

9
world. It is therefore believed that the phenomena being studied, and the social world is disconnected from
one’s perception of it. In terms of human nature, it is believed that PMI’s activities are determined by the
situation and environment it is located, and that the company is sensitive to its environmental conditions.
Furthermore, the fair value of PMI will be examined given the company’s external and internal environments.
Therefore, in terms of regulation-radical change dimension, the regulation side of the dimension searches for
an explanation of the accepted status quo, rather than alternatives to it, suggesting this to be the most
appropriate approach. In addition, as this thesis will rely on secondary data to perform the qualitative analysis
and the use of quantitative data, to answer the problem statement, suggesting the nomothetic methodology.
Taken together to determine the chosen approach to social science, it becomes evident that an objectivist-
regulation view is employed.
The paradigm representing the chosen standpoints in each dimension is called the Functionalist paradigm.
Functionalist theorists support sociology of regulation from an objectivist point of view (Burrell & Morgan,
1979). The world is assumed to be relatively stable and organized, and the world is viewed as a concrete and
objective reality, waiting to be discovered through systematic study (Ibid). Furthermore, the functionalist
paradigm is a problem-oriented approach, aiming to provide practical solutions to practical problems (Ibid.).

10
1.3.4 Thesis Structure
The thesis is outlined in 10 chapters and aims to provide a logical linkage between all aspects of the valuation
of PMI. Consistency and reliability will be maintained by following the structure illustrated in figure 1.3.4.
Figure 1.3.4: Thesis Structure
Source: Author illustration
1.3.5 Choice of Valuation Models
There are many techniques to choose from when aiming to perform a company valuation. Three techniques
will be applied that have different but complementary benefits, including the Discounted Cash Flow (“DCF”)
model, the Economic Value Added (“EVA”) model and a Multiple Analysis. The DCF model is the most
highly regarded amongst practitioners and academics as it relies solely the firm's cash flow, rather than on
accounting-based earnings (Koller et al., 2010). The growing popularity of applying the EVA model can be
explained by its close link to economic theory and competitive strategy (Ibid.). Both factors which will be
further explored in the strategic analysis and in the financial statement analysis. Koller et al. (2010)

11
recommends creating both DCF and EVA models when valuing a company and although they differ in
execution style, when applied correctly, the DCF and EVA models should yield the exact same results. Since
both DCF and EVA discount future income streams with weighted average cost of capital (“WACC”), the
models are said to work the best for firms maintaining a relatively stable debt-value ratio (Ibid.).
Although the DCF model is considered the most accurate and flexible method for valuing a company, it is only
as accurate as the forecast it relies on, and applying a set of comparables would place the DCF in a proper
context (Koller et al., 2010). Consequently, a careful multiple analysis which compares a company’s multiples
with those of its peers can be applied when forecasting to yield a more accurate result. Further, the multiple
valuation tests the plausibility of the cash flow forecast, explains performance disparities between the targeted
company and its peers, and facilitates analysis of market expectations (Koller et al., 2010).
1.3.6 Data
Having made use of both qualitative and quantitative data in the chosen investigative design, it has been
necessary to make exclusions in terms of theory. Further, the thesis will be based on knowledge the authors
have been able to acquire during the spring semester of 2019. Consequently, the thesis will reflect the author's’
position as students, and not as professional practitioners. The thesis uses secondary sources to gain
comprehensive knowledge about PMI and the tobacco industry. The main advantage of this method is that no
interference can be made from the company, suggesting that applied information is less biased. Despite no
internal information or direct communication with PMI or its peers, the majority of the thesis body is based on
information published by PMI. This include quantitative secondary data such as financial reports, and other
investor related materials. Other secondary quantitative data include register data from WHO, Euromonitor
International, Bloomberg, Yahoo! Finance, S&P, etc. These are well known sources, considered highly reliable
and valid. The secondary qualitative data comprise information obtained from analysts covering PMI, banks,
competitors and other finance institutions. The authors acknowledge that these may be subject to biased
opinions due to incentives to accentuate themselves or other parties. A carefully selected number of research
papers, journals and newspapers have also been used to provide further insights into certain topics.
12
1.3.7 Delimitations
To maintain the scope of the thesis and only analyze the most significant and driving factors of the PMI’s
value, several delimitations have been set. The delimitations are set only to account for information available
to the writers prior to 13 May 2019, meaning that the valuation and its underlying assumptions are valid as of
until this date. The thesis is built solely on information accessible to the public with no access to primary data
(i.e. financial reports, financial databases and market research). The valuation is performed using frequently
used and theoretically accepted approaches applied by industry professionals, and these theories will be applied
without elaborating on its underlying assumptions or discuss their accuracy. Furthermore, it is expected that
the reader has a basic degree of knowledge with regards to economic and financial theory. The authors are
aware of possible shortcomings and limitations of applied models and theories, however as they are widely
accepted and applied, it is assumed that they are adequate to produce a convincing and thorough answer to the
research question. The authors are not speculating in future foreign exchange rates, thus the rate of today will
equal the future rate (random walk) (Petersen & Plenborg, 2012; 244). The authors have not conducted any
analysis on interest rate risk factors, which can be reasoned by the fact that the main valuation models applied
in the thesis limits the need for a forecasted interest rate.
13
Chapter 2 - Philip Morris International Inc. and the Tobacco Industry
The following chapter introduces PMI and provides an overview of the tobacco industry, the company, its
corporate history, ownership structure, and share price development. This information will form the basis for
the strategic analysis, which influences the projected future for the industry and company. This, in turn, will
have a significant impact on the company valuation.
2.1 History of Tobacco
The common tobacco plants have likely been used for centuries by people of the Western hemisphere before
Europeans became aware of it in 1492 (Slade, 1997; IARC, 2004). At this time, the tobacco plants were
cultivated by Native Americans in Latin America, and tobacco often had religious uses (Ibid.). The start of the
spread of tobacco from the Americas to the rest of the world when Columbus was offered tobacco leaves by
the Native Americans, and brought the leaves back with him to Europe (IARC, 2004; Burns, 2007). At this
moment, the tobacco plant’s name was “nicotiana”, and the tobacco grown in Europe consisted of seeds that
originated from either Brazil, Mexico, Florida or Virginia (IARC, 2004). It has been claimed that tobacco was
used earlier in China, but currently no convincing documentation for this exists. What is known for certain,
however, is that tobacco was used extensively, and that a variety of early societies discovered the effects of a
self-administered dose of nicotine independently of each other, implying a wide distribution of the plant
(IARC, 2004). Tobacco was grown, smoked and chewed by an increasing amount of people, and eventually
became universal (IARC, 2004; Burns, 2007). Not only was tobacco consumed, but also used as a source of
exchange, income, and sometimes even used as collateral for loans (Ibid.).
The modern history of tobacco truly began with the design of the cigarette machine in the middle of the
nineteenth century when the cigarette machine was patented in 1880 by James Bonsack (Bonsack, 1881; IARC,
2004). Another reason for the increasing popularity of the cigarette was the growing concern of the spread of
tuberculosis, resulting from spitting smokeless tobacco (Glover & Glover, 1992; IARC, 2004). Since the

14
1920s, tobacco has been used mainly to produce combustible cigarette, while cigars, pipes and chewing
tobacco have decreased gradually to relatively small proportions of the global consumption (IARC, 2004).
2.2 The Tobacco Industry
Recent estimates for the global tobacco market (2017) indicate a worth of approximately $785 billion U.S
dollars (“$”), excluding China (Source). Over $700 billion, almost 90% of sales, of this stem from revenues
from combustible cigarettes (source). China is the largest cigarette market in the world, with a retail value in
2017 of US$212.3 billion (Euromonitor International, 2018). China, Indonesia, Russia, United States and Japan
accounted for 61.7% of the selling volume of all cigarettes in 2017 (Tobacco Free Kids, 2018).
As can be seen in figure 2.2, the global combustible cigarette retail volume has continually declined since
2012, from approximately 6000 billion to 5500 billion cigarettes in 2017 (Euromonitor International, 2018).
However, between 2003 and 2017, the retail value of the cigarette market increased from around $400 billion
to $725 billion (Ibid.).
Figure 2.2: Global Cigarette Market, Retail Volume and Retail Value
Source: Author’s illustration using data from Euromonitor International (2018)

15
In Russia alone, cigarette volumes dropped by 25%, while retail values increased by 31% between 2013 and
2017 (Euromonitor International, 2018). Similarly, in the United States, cigarette retail volume fell by 37%
between 2001 and 2006, while cigarette retail value increased by 32%, during the same period (Ibid.). In
Western Europe and the UK, the market value of tobacco increased by approximately 9% and 7% respectively
during the same timespan (Ibid.). This can be explained by the fact that increases in taxes imposed by
governments frequently have been smaller than the price increases imposed by cigarette manufacturers, which
has compensated for the decrease in tobacco retail volume (NCBI, 2004; Maloney & Chaudhuri, 2017).
Furthermore, between 1998 and 2002, the S&P 500 Tobacco Index decreased by 22% (Maloney & Chaudhuri,
2017). In contrast, over the subsequent decade, tobacco companies have seen compounded earnings growth of
7% per year, and an index increase of 178%, outperforming the broader S&P 500 Index which climbed 58%
(Ibid.). In the United Kingdom, British American Tobacco p.l.c. (“BAT”) proved to be the most successful
stock market company since the establishment of the FTSE 100 Index, 35 years ago (Collinson, 2019).
Thus, the tobacco industry has been, and still is, one of the most profitable industries in the world (Tobacco
Free Kids, 2018). Since no significant player has challenged the five leading transnational tobacco companies,
frequently referred to as “Big Tobacco1”, in the industry for a long time, they have been able to enjoy great
cash flow return. The ability to generate such large amounts of cash is somewhat unique for the tobacco
industry. While an average S&P 500 company enjoys an FCF yield of around 4%, Altria, BAT and PMI have
all yield significant higher FCF yield levels of 5.7%, 6.6% and 6.7%, respectively (Waldrep, 2019). Most Big
1 ”Big Tobacco” refers to the largest global tobacco industry companies: Philip Morris International, British American Tobacco,
Imperial Brands, Japan Tobacco International, and China Tobacco
16
Tobacco uses this cash to pay out dividends, often three times the S&P 500 average, making them attractive
stocks to buy in terms of dividend payments (Ibid.).
Emerging markets, characterized by growing populations and an increasing gross domestic product (“GDP”),
are believed to remain as the industry’s potential source of growth. Currently, 80% of the world’s 1.1 billion
tobacco consumers are populated in low and middle-income countries (World Bank, 2019a). However, while
overall tobacco sales have decreased slightly over the past years, sales in emerging markets continue to
increase. For example, between 2005 and 2017, cigarette sales in the Asia Pacific and Middle East and Africa
regions increased, while all other regions experienced declining sales (Euromonitor International, 2018).
Overall industry and retail volume is expected to continue to decrease due to the rising sales of illicit cigarettes,
increased regulation and continued development of alternative products, such as RRPs and other e-cigarettes
(BAT, 2019a). This general expectation has triggered tobacco players to diversify their product portfolios
beyond traditional combustible tobacco with the growth of Next Generation Products (“NGPs”) such as e-
cigarettes and oral tobacco and nicotine products. The e-cigarette market was estimated to be worth $12.3
billion in 2016, a 34% increase from the previous year, while the oral tobacco and nicotine market was worth
an estimated $12.5 billion (BAT, 2019a). In addition, great potential resides in advanced technologies which
have allowed the industry to capture greater profit margins (“PMs”) in later years. In addition, automated
manufacturing processes, in contrast to more traditional manufacturing techniques, has helped to reduce
operational expenses due to less labor needed in the manufacturing process, leading to increased profitability
(Grand View Research, Inc., 2018).
2.2.1 Global Market Players
The tobacco industry hosts some of the most powerful transnational commercial companies in the world and
tobacco companies, which frequently merge, own other large industries and run a complex variety of joint
ventures (Mackay & Eriksen, 2002). Consequently, the industry is heavily consolidated and only a few players

17
grow, sell, and distribute tobacco-related products in the market (Grand View Research, Inc., 2018). In 2001,
approximately 43% of the global tobacco sales were controlled by Big Tobacco (Mackay & Eriksen, 2002).
Six years after, by 2017, Big Tobacco controlled 80.6% of the global cigarette market (Euromonitor
International, 2018). Figure 2.2.1 depicts how market shares were distributed in 2017.
There are primarily four tobacco companies that dominate the global tobacco market, excluding China. These
include PMI, BAT, Altria and Imperial Tobacco, with 2018 net sales of $29.6 billion, $26.1 billion, $25.4
billion and $20.1 billion respectively (Statista, 2019b; PMI 2018, Altria; 2018).
Figure 2.2.2: Leading tobacco companies worldwide in 2018, based on net sales
Source: Author Illustration based on Data from Statista (2019b), and Annual Reports
2.3 Philip Morris International Inc.
PMI is a leading international tobacco company engaged in the manufacture and sale of cigarettes and other
nicotine-containing products in markets outside of the United States. The company is a United States based
18
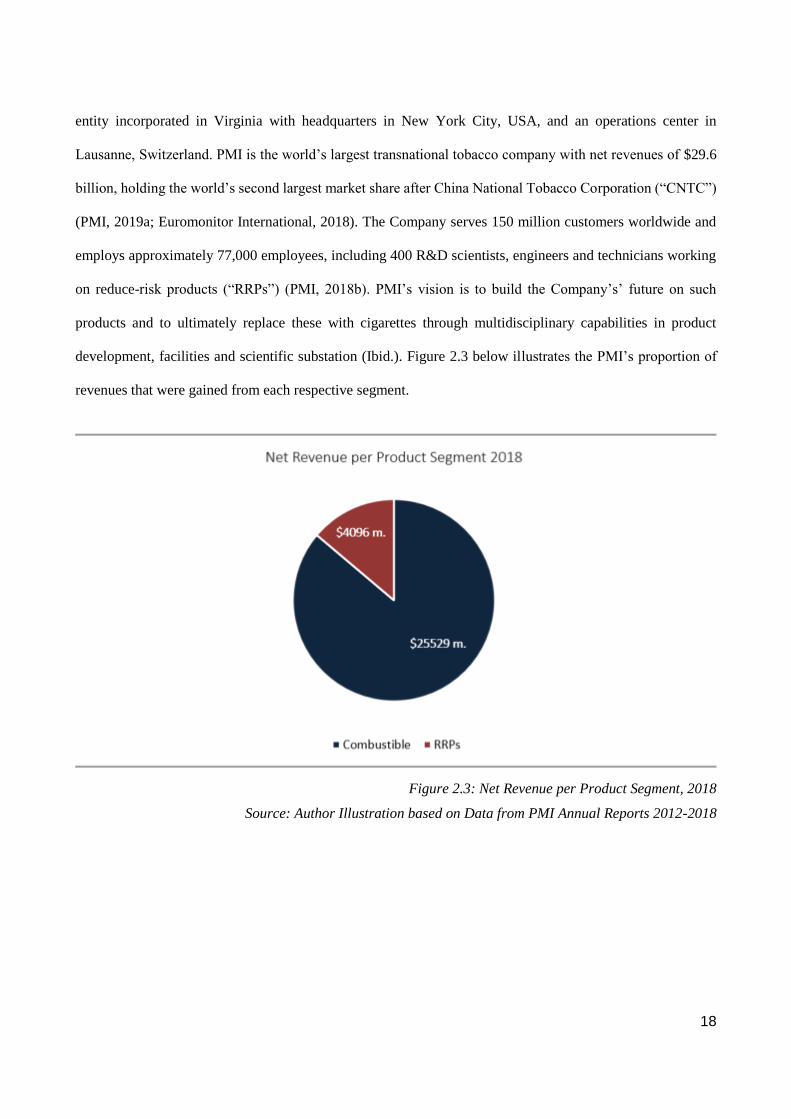
entity incorporated in Virginia with headquarters in New York City, USA, and an operations center in
Lausanne, Switzerland. PMI is the world’s largest transnational tobacco company with net revenues of $29.6
billion, holding the world’s second largest market share after China National Tobacco Corporation (“CNTC”)
(PMI, 2019a; Euromonitor International, 2018). The Company serves 150 million customers worldwide and
employs approximately 77,000 employees, including 400 R&D scientists, engineers and technicians working
on reduce-risk products (“RRPs”) (PMI, 2018b). PMI’s vision is to build the Company’s’ future on such
products and to ultimately replace these with cigarettes through multidisciplinary capabilities in product
development, facilities and scientific substation (Ibid.). Figure 2.3 below illustrates the PMI’s proportion of
revenues that were gained from each respective segment.
Figure 2.3: Net Revenue per Product Segment, 2018
Source: Author Illustration based on Data from PMI Annual Reports 2012-2018

19
2.4 Key Company Highlights
Figure 2.4: Key Company Highlights
Source: Author Illustration based on Data from PMI (2019e)
2.4.1 2008 and Forward
In 2008, PMI is spun-off from its parent company Altria Group Inc. (“Altria”) (prev. Philip Morris Companies
Inc.) by an IPO on March 28th (PMI, 2019e). The decision to separate the internationally oriented company
from its domestic parent was considered to give PMI more freedom to pursue sales growth in emerging markets
as well as clearing the company from legal and regulatory constraints facing its domestic counterpart, Philip
Morris USA (Ibid.). The timing of the IPO was in retrospect unfortunate as it came in the midst of the financial
crisis of 2008, which hurt stocks across the board. However, any ground lost from the crisis was recovered and
by mid-2010, as PMI share price doubled in less than two years. Furthermore, from 2008-2013, PMI’s
quarterly dividend more than doubled, with four consecutive years of double digit percentage payout increases
following the end of the financial crisis (Caplinger, 2017). Since the 2008 spin-off, PMI has increased its
annual dividend every year representing a total increase of 147.8%, or a compound annual growth rate of 9.5%
(PMI, 2019d).

20
In 2009, PMI takes its firsts step towards its smoke-free vision and unveils its new research-and-development
facility in Neuchatel, Switzerland, bringing together over 400 scientists, specialists and staff in a new facility
dedicated to the development of RRPs (PMI, 2018). In 2013 the company establishes a strategic framework
with its former parent, under which Altria makes available its e-cigarette products to PMI for
commercialization outside the United States and PMI makes available two of its candidate RRPs exclusively
to Altria for commercialization in the United States. Further building its RRP portfolio of brands, PMI acquires
United Kingdom based Nococigs in 2014, a leading e-vapor company. In 2014, PMI also pilots IQOS in Italy
and Japan, its first heat-not-burn platform in the RRPs portfolio (Ibid.). In 2016, the company fully launches
its smoke-free vision promising to one day end the use of combustible cigarettes by replacing it with RRPs.
2.5 Product Portfolio
PMI holds a wide range of international and local premium, mid-price and low-price brands including leading
international brands Marlboro, Parliament, Bond Street, Chesterfield, L&M, Lark and Philip Morris. These
seven international cigarette brands contributed to approximately 76% of PMI’s total cigarette shipment in
2018 (PMI, 2018).
2.5.1 Combustible Cigarettes
A combustible cigarette burns shredded tobacco leaves which generates smoke. The smoke contains nicotine,
a highly addictive psychoactive ingredient naturally occurring in tobacco, and a number of other harmful
chemicals that are the primary cause of smoking-related diseases (WHO, 2019). Six of the top 15 international
combustible cigarette brands in the world are owned by PMI where Marlboro, the world’s best-selling
international cigarette brand, is the most valuable brand under the PMI umbrella. In 2018, Marlboro accounted
for approximately 36% of PMI’s total cigarette shipment volume representing approximately 264 billion
cigarettes outside the United States and China. Furthermore, the brand Marlboro represented approximately
9.7% of the international cigarette market, excluding China, in 2018, 9.7% in 2017 and 9.6% in 2016; a notable

21
achievement given the impact of out-switching heated tobacco products in reduce-risk product launch markets
(PMI, 2018).
Figure 2.5.1: International Cigarette Share of Market, 2018, excl. China and the United States
Source: Author Illustration based on Data from PMI (2018)
Figure 2.5.2 below illustrates the regional shipping volumes concerning PMI’s combustible segment, as well
as the total revenue derived between 2012 and 2018. As can be seen from the graph, all regions have
experienced declining shipment volumes since 2012. Furthermore, the total revenue devoted to combustible
products has decreased since 2014 to 2017, and begun to recover in 2018.

22
Figure 2.5.2: PMI Regional Combustible Volume and Total Combustible Revenue
Source: Author Illustration Based on Data from PMI Annual Reports
2.5.2 Reduced-Risk Products
In addition to PMI’s combustible product portfolio, the company is also commercializing a new product
portfolio featuring a range of e-cigarettes referred to as RRPs by PMI. These types of products present less
risk of harm to smokers who switch to these products versus continued smoking (PMI, 2018). However, this
has not been fully scientifically confirmed outside the PMI community. The RRPs are divided into two separate
categories, the first are the Heated Tobacco Products (“HTPs”) also referred to as an “heat-not-burn” cigarette
(Ibid.). HTPs do not burn tobacco but produces an aerosol that contains lower quantities of harmful constituents
than found in cigarette smoke. PMI’s flagship HTP, IQOS, is available in key cities in 44 markets worldwide
and almost 6.6 million adult consumers are estimated to have stopped smoking when making the shift from
combustible cigarettes to e-cigarette IQOS (PMI, 2018). PMI has also created TEEPS, which works similar to
IQOS, but it heats the tobacco with an alternative heat source. The products both uses a heated tobacco unit
which is inserted and heated to generate the aerosol (Ibid.). The heated tobacco units (“HTU”) units are
marketed under the brand name HEETS. PMI estimates that the sales volume of PMI’s HTUs as a percentage
of the total industry sales volume for cigarettes and HTUs in 2018 represents 1.6% (PMI, 2018). The second

23
category of RRPs are the completely tobacco-free Nicotine-Containing Products (“NCP”), also referred to as
“e-vapor”. PMI is currently developing two product platforms – Solaris and Nicocig - which uses battery-
powered devices that vaporizes a liquid solution containing nicotine and flavors (Ibid.).
In figure 2.5.2, the total and regional shipping volumes concerning PMI’s RRP segment, as well as the total
revenue derived since it was first introduced in 2016 has been illustrated. While East Asia & Australia is the
region that contributes the most to total RRP revenue, remaining regional shipment volumes increase on rapid
rates. In 2018, total RRP revenue contributed by 13.82% to PMI’s total revenues (PMI, 2018).
Figure 2.5.2: RRP Volume and Revenue 2016-2018
Source: Author Illustration Using Data from PMI Annual Reports
2.6 Markets
PMI is engaged in the manufacture and sale of combustible cigarettes and RRPs outside of the United States
in 180 markets worldwide, where the company holds the number one or number two market share position

24
(PMI, 2018). The global tobacco market is increasingly diversifying beyond combustible cigarettes, and the e-
cigarette segment is predicted to more than double between 2016-2021 (Mouratidis, 2019). Heated tobacco is
believed be the main driver behind this fast-growing segment (Ibid.).
PMI estimates that the company’s reported share of the international market (defined as worldwide cigarette
and heated tobacco unit volume, excluding the United States and China) was approximately 28.4%, 27.9% and
28.1% in 2018, 2017 and 2016, respectively (PMI, 2018). PMI currently manages its operations in six
reportable segments, including the European Union (“EU”), Eastern Europe, Middle East & Africa, South &
South East Africa, East Asia & Australia, Latin America & Canada. The six revenues attributed to each of the
regions can be found in Figure 2.6 below.
Figure 2.6: 2018 Regional Revenues per Product Segment, in $m.
Source: Author Illustration based on Data from PMI Annual Reports 2012-2018
25
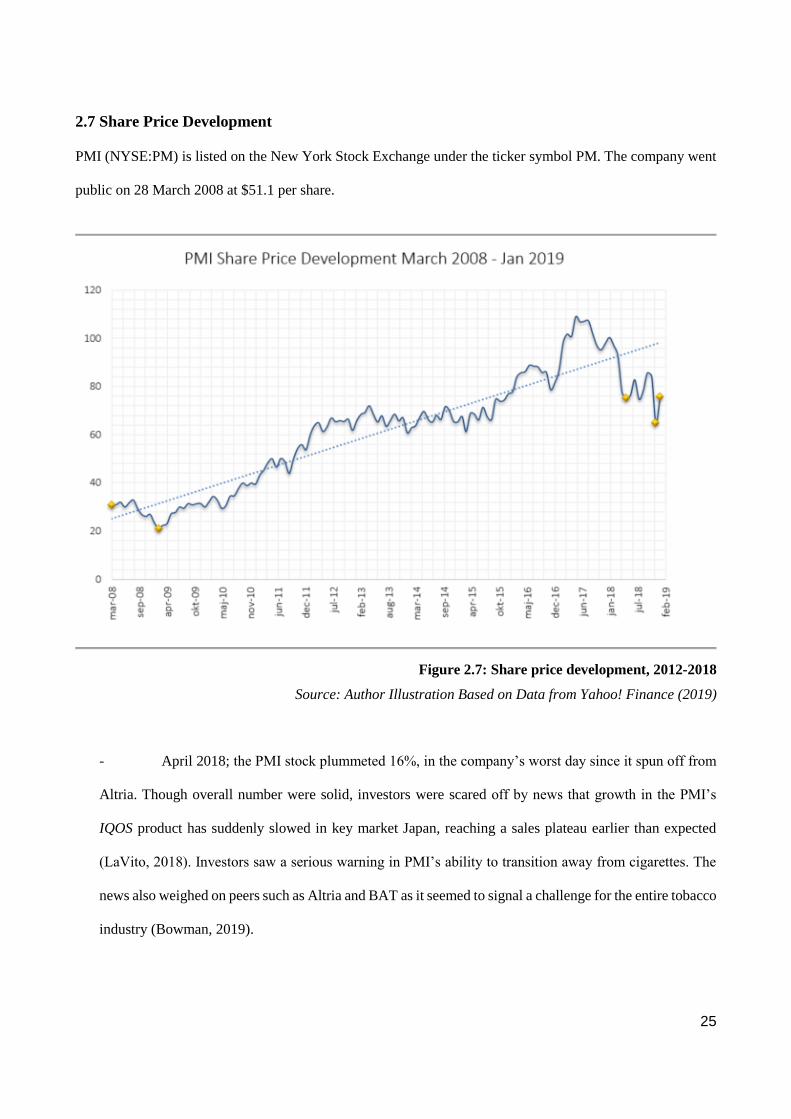
2.7 Share Price Development
PMI (NYSE:PM) is listed on the New York Stock Exchange under the ticker symbol PM. The company went
public on 28 March 2008 at $51.1 per share.
Figure 2.7: Share price development, 2012-2018
Source: Author Illustration Based on Data from Yahoo! Finance (2019)
- April 2018; the PMI stock plummeted 16%, in the company’s worst day since it spun off from
Altria. Though overall number were solid, investors were scared off by news that growth in the PMI’s
IQOS product has suddenly slowed in key market Japan, reaching a sales plateau earlier than expected
(LaVito, 2018). Investors saw a serious warning in PMI’s ability to transition away from cigarettes. The
news also weighed on peers such as Altria and BAT as it seemed to signal a challenge for the entire tobacco
industry (Bowman, 2019).
26
- December 2018; the stock finished the year down 36.8% where losses further losses as leading
financial services company Credit Suisse downgraded the stock from “neutral” to “underperform”.
Subsequently, the stock fell once again when former parent Altria closed its deal with JUUL Labs
(“JUUL”), an e-cigarette company, for $12.8 billion for a 35% stake, signaling attention perhaps was
moving away from IQOS (Bowman, 2019).
- February 2019, after losing 36.8% of its stock value in 2018, PMI began 2019 on a strong note.
As of February 25, the company was trading at $86.60, representing a rise of 29.7% year-to-date (Nathan,
2019).
2.8 Ownership Structure
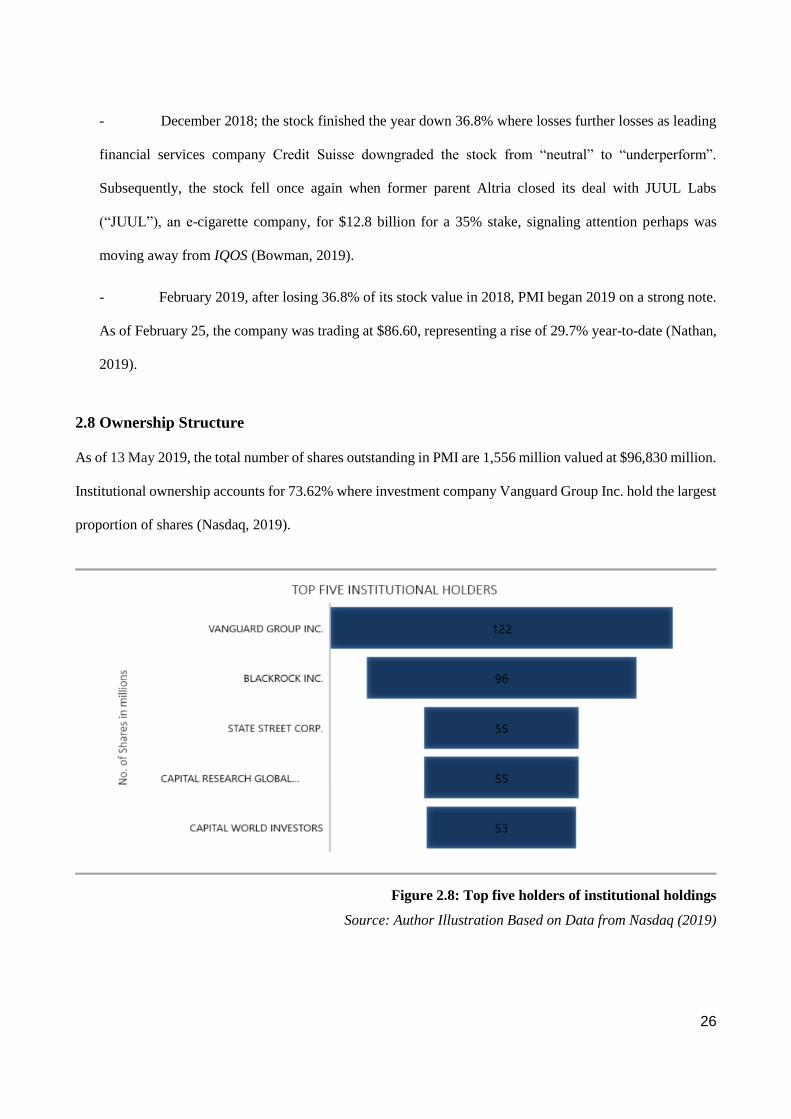
As of 13 May 2019, the total number of shares outstanding in PMI are 1,556 million valued at $96,830 million.
Institutional ownership accounts for 73.62% where investment company Vanguard Group Inc. hold the largest
proportion of shares (Nasdaq, 2019).
Figure 2.8: Top five holders of institutional holdings
Source: Author Illustration Based on Data from Nasdaq (2019)

27
2.9 Peer group
The PMI peer group was selected on the basis of four main characteristics: global presence, industry, and net
revenues and market capitalization of a similar size to those of PMI. All primary international tobacco
companies where considered under review and as a result, the following companies where chosen to constitute
the PMI peer group: Altria Group, Inc (“Altria”), British American Tobacco p.l.c. (“BAT”), and Imperial
Brands PLC (“Imperial”).

28
Chapter 3 – Strategic Analysis
This chapter aims to research the business environment in which PMI operates by analyzing three layers in a
top-down approach. First, the macro environment will be analyzed by applying the PEST model. Second, the
industry environment will be analyzed by applying the Porter’s Five Forces model. Lastly, the SWOT model
will be applied to analyze PMI’s internal business environment.
3.1 PEST Analysis
PEST is an abbreviation for Political, Economic, Social and Technological factors. The analysis was first
introduced by Harvard professor Francis Aguilar in 1967 (Investopedia, 2019a), and is widely used strategic
management tool used to help determining how external factors affect the company’s performance in the long-
run. Possible limitations of the PEST tool include its restrictions of accounting for all possible factors that
affect the given company’s operations, as all possible information may not be available at the time of the
analysis. In addition, while the tool is static, conditions change, and factors are dynamic, which can cause
outdated assumptions. Despite this criticism, the PEST allows its users to gain an overview of the factors that
exist in the company's macro environment. Furthermore, it is believed that an insight into the current state of
the industry will allow the reader to develop an understanding for potential factors that might affect the
company’s operations.
3.1.1 Political Factors
Restrictions on the manufacture, sale, marketing and packaging of tobacco products are in place in nearly all
countries and markets (BAT, 2019a). Thus, the tobacco industry is a highly regulated industry when it comes
to marketing, sales, and tax. However, in terms of its contents and emissions, tobacco is one of the few openly
available commercial products that is relatively unregulated (WHO, 2019), leaving room for increased
regulation with regards to this extent.

29
3.1.1.1 Plain Packaging and Other Packaging Restrictions
Plain packaging regulation prohibits the use of branding, logotypes and colors on packaging, and requires
companies to make use of a uniform font (PMI, 2018). In 2016, the EU Tobacco Products Directive, regulating
the manufacture, presentation and sale of tobacco and related products, was enforced in the EU region
(European Commission, 2019). In terms of packaging, these rules include requirement of health warnings on
tobacco and related products, and the requirement of combined health warnings covering 65% of the front and
back of cigarette packages. Furthermore, promotional and misleading elements on tobacco products are banned
(European Commission, 2019).
The combined cigarette volumes of countries that have implemented, or already legislated for plain packaging,
was over 110 billion sticks in 2017 (Genov, 2018). More specifically, plain packaging laws have been adopted
in countries such as Australia, France, Saudi Arabia and Turkey (PMI, 2018). Countries such as New Zealand
and Israel have implemented plain packaging regulations on all tobacco products, including RRPs (Ibid.).
According to Euromonitor International (2018), the plain packaged volumes are estimated to sum up to 1
trillion sticks by 2030, which then would represent 50% of the total consumption volume world-wide (Genov,
2018). The requirement of plain packaging remains as one of the greatest industry threats, as it limits the ability
to retain a unique and persuasive brand identity (Ibid.).
3.1.1.2 Restrictions and Bans on the Use of Ingredients
As mentioned, the contents and emissions of tobacco has been held relatively unregulated. However, the WHO
is suggesting restrictions or complete bans on the use of some or all ingredients in tobacco products, including
menthol flavors (WHO, 2019). The EU directive has introduced prohibition of characterizing flavors, and
requires the tobacco industry to report to EU countries on the ingredients used in tobacco products. In the
United States, Chile and Brazil, menthol flavors and other flavorings has been prohibited for more than five
years (Robinson & Bond, 2013).
30
Extensive restrictions and ingredient bans would further limit industry players to differentiate their products
as menthol bans would eliminate the entire category of mentholated tobacco products. Turkey followed EU’s
approach, of prohibiting flavored tobacco products, and has banned menthol as of May 2020, and broader
ingredient bans have been adopted by Canada and Brazil (PMI, 2018). Canada banned menthol in cigarettes
as of October 2017 and in all tobacco products as of November 2018. In Brazil, an ingredient ban is currently
on appeal by a tobacco industry union (Ibid.).
3.1.1.3 Bans on Sale and Marketing
For many years, the WHO Framework Convention on Tobacco Control (FCTC) has suggested partial or total
bans on tobacco advertising and marketing, such as bans and restrictions on radio, TV, print and Internet
advertising (PMI, 2018). Some countries have already followed these recommendations. Furthermore, in 2013,
the EU Directive introduced tracking and tracing within the EU in an attempt to avoid the illegal sale of tobacco
products, and allows member countries to ban internet sales of tobacco and related products (European
Commission, 2019). Going forward, the FCTC's guidelines encourage governments to ban all forms of tobacco
communication (Ibid.). Furthermore, in a number of countries, such as Australia, Canada, Norway, Russia,
and Singapore, governments have even banned the display of tobacco products at the point of sale (European
Commission, 2019).
The public health community are requesting further standardization of tobacco products by demanding a
certain cigarette size, which could lead to prohibition of slim cigarettes, or requiring standardized cigarette
paper designs (PMI, 2018). Furthermore, in 2016, the Conference of the Parties (CoP) of WHO FCTC, adopted
guidelines endorsing countries to regulate product design of all tobacco products to decrease their
attractiveness, such as the diameter of cigarettes and the use of flavor pods (WHO, 2017a). In addition, some
regulators are considering regulatory measures intended to reduce the supply of tobacco products, and these
measures have been implemented in some cases. These include regulations aiming at reducing the number of
retailers offering tobacco products by reducing the number of licenses available or banning the sale of tobacco
products within specified distances of certain public facilities (PMI, 2018).
31
3.1.1.4 Restrictions on Public Smoking
Public smoking restrictions have amplified significantly in many countries worldwide. Moreover, many
countries globally have, to various degrees, implemented rules that restrict or ban smoking in public areas,
restaurants, bars, nightclubs and workplaces. Some countries, regional governments and municipalities have
even adopted or proposed, bans on smoking in outdoor places, in cars when minors are present, and private
homes (PMI, 2018). Taking effect on 1st of July 2019, smoking (covering e-cigarette smoking) in open public
areas will be banned in Sweden, including areas such as: outdoor seating areas of restaurants and cafes, bus
stops, train station platforms, and playgrounds (The Local, 2019). In Russia, where 40% of the population
smoke, a public smoking ban was introduced in 2013 (Robinson & Bond, 2013).
3.1.1.5 Electronic Cigarette Products
A total of 98 countries have implemented national and federal laws regulating e-cigarette products (Institute
for Global Tobacco Control, 2019). Similar to combustible cigarettes, these laws are related to the sale,
advertising, packaging, product regulation, reporting/notification, taxation, use and classification of e-cigarette
products (Ibid.).
In terms of product regulation, 32 countries, including EU and the United Kingdom, do not allow the use of
ingredients, other than nicotine, that pose a risk to human well-being in e-cigarette products (Institute for
Global Tobacco Control, 2019). In addition, the same number of countries regulate the actual nicotine amount,
and the quality of nicotine and other ingredients used to manufacture e-liquids (including EU and several UK
countries) (Ibid.). In terms of packaging, the EU, United Kingdom and United States mandate placement of
health warnings on e-cigarette packaging, and nearly 70 countries prohibit and regulate advertising of e-
cigarette products (including several countries in Central- and South America, the United States, the United
Kingdom, EU, Norway, a number of countries in South and Southeast Asia, Australia, New Zealand, and
United Arab Emirates) (Institute for Global Tobacco Control, 2019). The sale of all types of e-cigarette
products are completely banned in 29 countries, such as Argentina, Brazil, Cambodia, Thailand, United

32
Emirates and Turkey, and seven countries including Australia, Mexico and Switzerland even prohibit the sale
of nicotine-containing e-cigarette products (Ibid).
3.1.1.6 Tax
Several governments around the world have made use of increasing tax rates as a financial disincentive to
influence the tobacco and cigarette consumption. The direct consequence of increased excise tax on tobacco
products are raised product prices, making them less affordable, which in turn is believed to drive down
tobacco consumption (Drope et al., 2019).
The types of taxes that often are imposed on tobacco products include excise taxes, sales taxes (VAT) and
import duty (WHO, n.d.b.). Excise taxes can be applied through both a specific tax rate, based on quantity, or
through an ad-valorem, based on value (Ibid.). Of 186 countries worldwide, 50 countries make use of an ad-
valorem excise tax, 50 countries have imposed a specific excise tax, 60 countries use a mixture of both, while
20 countries have not imposed any excise taxes at all (WHO, n.d.b..). Higher income countries tend to use
specific excise tax on tobacco products, while lower income countries often rely on the ad-valorem excise tax
(Ibid.). Furthermore, higher income countries tax tobacco products more heavily than lower-income countries,
with an average tax proportion of average cigarette retail prices reaching almost 60%. In lower income
countries, this proportion lies around 40% (WHO, n.b.c.).
Although the majority of the world’s countries use tax to reduce smoking rates, it is the least used tobacco
control tool worldwide, it is argued that most of the world’s countries, predominantly emerging markets, has
not yet implemented significant tobacco taxes (WHO, 2018; Drope et al., 2019). Many governments are still
reluctant to increase taxes, relying on tobacco industry reports that typically suggest that any additional tax
increase will cause declines in tax revenue or a massive increase in cigarette smuggling (Ibid.).
33
In terms of e-cigarettes, taxation is not currently as widespread as for combustible cigarettes, where only a
total of 13 countries tax e-cigarettes with tax levels ranging from around 10% (Republic of Korea), 20% (UK,
Italy and Latvia), 57% (Indonesia), and up to 200% (Maldives) (Institute for Global Tobacco Control, 2019).
3.1.1.7 Implications for the Tobacco Industry and PMI
Current regulation does not perfectly predict future regulation. However, examining already implemented
regulation and current indications of increased regulation globally going forward, it can be assumed that this
industry is at least not getting less regulated. Increasing knowledge about the health issues caused by tobacco
has led to the public health community to pushing for stricter regulation on all levels, from production to
retailing. Plain packaging requirements, and product standardization demands, limits industry players to
successfully differentiate themselves from their competitors, and maintain a certain level of brand identity.
Furthermore, it is believed that once regulations, and bans of various kinds, have been implemented by
influential countries and unions (e.g. EU), this will trigger similar establishments by other countries. One
segment that leaves room for increased and new regulation is the e-cigarette segment, and tax increases in this
field causing prices to rise, is particularly believed to have significant effects on the demand of these products.
3.1.2 Economic Factors
Economic factors are determinants of a certain economy’s performance which affects the customer purchasing
power (Maverick, 2019). The following chapter examines which economic factors that have the greatest impact
on the demand for combustible cigarettes and RRPs. These factors include economic growth, exchange rates,
interest rates, inflation rates, disposable income of consumers, and unemployment rates. Some of these factors
are evaluated within the context of PMI’s segmentation of their geographical regions (as seen in previous
Figure 2.6). Data on the historical, and assumed future Real GDP growth has been derived from the
International Monetary Fund (“IMF”), but reorganized to fit PMI’s regional allocation. Real GDP growth for
these markets are found in Figure 3.2.1 below. When conducting a correlation analysis of the historical Real
GDP growth between 2012-2018 in each segment, and comparing these figures to the combustible revenue
pattern during the same years, a correlation coefficient of 0.51 is found (Appendix 14). However, since

34
cigarettes are highly price-inelastic, the relation between the two components are believed to be less relevant
as in other more price-sensitive industries.
Figure 3.1.2: Real GDP growth, historically and forecasted
Source: Author Illustration using Data From IMF, 2019
3.1.2.1 Economic Growth
In spite of lawsuits, health problems and rising cigarette prices, Big Tobacco has continued to generate strong
growth and profits. Further, in spite of global economic turndown, the tobacco industry has been doing well
as it less dependent on external finance compared to other industries (Moore & Mirzaei, 2016). In the midst of
the financial crisis in 2008, PMI’s, BAT’s and Japan Tobacco’s sales and gross turnover all increased,
demonstrating that smokers not only continued to smoke despite economic downturn, but that cigarette
consumption in fact increased (He & Yano, 2009). As governments and banks went bankrupt, tobacco firms
became one of the biggest beneficiaries of the financial distress in the developed world (Wachman, 2012).
Although this controversial sector continued to face heavy critique from health advocates and general society,
analysts claimed at the time of the financial crisis that tobacco company stocks where about the closest an
investor could get to a bond on the stock market (Ibid.). Months before the subprime mortgage crash, Altria

35
spun off PMI, enabling the company to pursue aggressive growth in countries with higher smoking rates, while
the former parent continued to focus on cutting cost and handle lawsuits in the United States. However, the
split added a direct effect of exposure to volatile currency exchange rates for PMI and contributed to the list
of economic challenges in a number of markets.
3.1.2.1.1 Low and Middle-Income Countries
Tobacco patterns typically differ according to economic and demographic characteristics. As mentioned,
although smoking overall is declining, the prevalence of tobacco appears to increase in some markets (WHO,
2017b). Hence, Big Tobacco are targeting other low- and medium economies, where cigarette consumption is
predicted to increase due to dynamic economic developments and continued population growth. Today, the
tobacco industry’s largest markets are highly populous countries across Asia, and fast-growing regions
including Africa and the Eastern Mediterranean. In the Middle East and Africa, 180 million men are predicted
to be smoking by 2025, twice as many as in 2000 (Bloomberg, 2018). Cigarette use has decreased during recent
years in China, however, its population stands for over astonishing 40% of the world-wide cigarette
combustible consumption (Kostova et al., 2014). Men in middle-income countries smoke the most, and it is
not uncommon that combustible cigarette consumption among men reaches over 40% in low- and middle
economies (World Bank, 2019a). To exemplify, the number of combustible cigarette smokers is set to increase
in key markets Indonesia and Nigeria, with 24 million and seven million between 2015-2015, respectively
(Kostova et al., 2014). Figure 3.1.3 below illustrates the distribution of cigarette consumption among different
classes of HDI2 countries.
2 Human Development Index

36
Figure 3.1.3: Top 15 consumers: Distribution of cigarette consumption
Source: Author’s illustration using data from Tobacco Atlas, 2019
Within countries, tobacco addiction is also concentrated among people with low income and education levels
(World Bank, 2019a). Poor smokers spend a larger proportion of their salary on tobacco products compared to
wealthier smokers whilst also suffering the most from smoking-related illnesses (Ibid.).
3.1.2.2 Exchange and Interest Rates
Multinational corporation conducting their business in local currencies which is translated into the currency of
the company will vary the company’s profits depending of these currency exchange rates (PMI, 2018). For
example, a firm headquartered in the United States will experience that during times of a strengthening U.S.
dollar, the company’s reported net revenues, operating income and EPS are reduced because the local currency
translates into fewer U.S. dollars. In contrast, during periods of local economic crises, foreign currencies may
be devalued significantly against the U.S. dollar, reducing the company’s margins. Actions to recover margins
may result in lower volume and a weaker competitive position (Ibid.).

37
3.1.2.2.1 Currency Exchange Controls
Companies operating in developing countries can be subjected to currency exchange controls, generally
referring to governmental restrictions on foreign currency trading and cross-border payments (DBS Bank,
2018). Developing countries use this as a tool to limit capital flight, where money leaving the country might
impact its economy and maintain stability of foreign exchange rates because of the fact that foreign exchange
volatility could impact the country’s economic stability (Ibid.).
3.1.2.3 Inflation rates
The general consensus is that raising taxes on tobacco is the most effective policy to reduce tobacco use, the
WHO (2014) recommends that taxes should be raised enough to increase tobacco price above inflation rates,
making tobacco more expensive. Consequently, inflation is an important factor to account for when assessing
external effect on the tobacco industry. As WHO recommends the tobacco tax to be raised in line with or
above-inflation, that would impact the unit price of cigarettes to increase. If such recommendations where to
be enforced, higher unit prices could lead to reduced annual industry volumes, increased competition and trade-
downs by customer to lower-price cigarette brands. Unit price increases have so far been enough to fully offset
the persistent declines in cigarette shipment volumes. However, recessions and lower inflation rates would cap
future cigarette price increases, leaving Big Tobacco with declining unit sales.

38
Figure 3.1.2.3: Inflation rate, average consumer prices: annual percentage change
Source: IMF (2018)
Although taxation is a regular applied regulation tool to limit the sales of tobacco, there is a fear that increases
in excise taxes on tobacco products, especially on cigarettes could lead to increases in consumer prices and an
increase of the Consumer Price Index (“CPI”) (WHO, 2014). WHO (n.d.) reports that this is a concern by
governments who employ strict inflation-control policies. The inflationary impact of excise tax increase
depends on the weight of tobacco in the basket of Consumer Goods that determines CPI and the rate of taxes
on consumer prices. Figure 3.1.2.4 depicts the relationship between tobacco taxes, CPI and its effect on
inflation.
Figure 3.1.2.4: Inflationary impact of tobacco tax increases
Source: Author’s illustration Using Data from WHO (n.d.)

39
3.1.2.4 Implications for the Tobacco Industry and PMI
Economic expansion and increase in disposable income in emerging markets have proved to be a prosperous
combination for Big Tobacco. PMI profits as consumer and business demands are increasing due to generally
lower interest rates. However, in periods of economic uncertainty, consumers may tend to purchase lower-
price brands, and the volume of PMI’s premium-price and mid-price brands and the company’s profitability
would suffer accordingly. Such down-trading trends may be reinforced by regulation that limits branding,
communication and product differentiation. Inflation increase has recently had two notable effects on PMI.
First, the company’s cigarette shipment volume of the local cigarette brand Sampoerna U in Indonesia
decreased due to above-inflation retail price increases. Second, following the categorization of Argentina as a
Highly Inflationary Economy with a three-year cumulative inflation rate greater than 100% reduced PMI’s
currency-neutral net revenue growth by approximately 0.6 points in 2018 (PMI, 2018).
Further, unfavorable currency impact with fluctuations of the U.S. dollar against important currencies such as
the Indonesian rupiah, Russian ruble and Turkish lira will impact profitability across PMI’s primary revenue
markets and local currency cost bases. In addition, previous mentioned currency exchange controls could
subject PMI to the risk of local currency devaluation and business disruption. Interest rates however, have had
a favorable impact on PMI’s business lately, primarily due to ongoing efforts to optimize the company’s capital
structure following the passage of the Tax Cuts and Jobs Act in 2017, the most sweeping tax legislation in the
United States since the Tax Reform Act of 1986 (PMI, 2018). This included the decision to use existing cash
to repay the $2.5 billion principal for PMI’s matured May 2018 ten-year U.S. bond, which had a coupon of
5.7% (Ibid.).
3.1.3 Social Factors
Tobacco use and smoking rates vary greatly among different countries around the globe (WHO, 2015a). These
distinct differences among countries are not likely to be due to coincidence, and is assumed to be the result of
a mixture of socio-cultural factors including cultural differences, gender, religion and socio-economic status.

40
3.1.3.1 Culture and Religion
While countries in Asia have the highest smoking rates, these rates are significantly lower in North America
and Western Europe (US Department of Health and Human Services, 2012). In terms of cultural norms,
cigarettes have been offered to guests as gifts in China and refusing cigarettes is considered impolite (Ibid.).
In addition, men and young males smoke together as a way of cementing social bonds (Pan, 2004; Chen et al.,
2006; Grenard et al., 2006; Weiss et al., 2006; US Department of Health and Human Services, 2012). While
it is reported that nearly half of all men in China smoke today, only 20% of all men in the United Kingdom
and United States smoke (WHO, 2015). With regards to religion, it has been reported that people who are
involved in religious activities tend to have lower smoking rates than people who are not involved (US
Department of Health and Human Services, 2012; Tobacco Free Life, 2019).
3.1.3.2 Gender
Differences between the genders in the prevalence of tobacco use exist worldwide, but the magnitude of the
disparities varies greatly across countries (Warren et al. 2008; US Department of Health and Human Services,
2012). According to the Global Youth Tobacco Surveys (“GYTS”) conducted between the years of 2000 and
2007, the occurrence of cigarette smoking was significantly higher among younger men than young women in
Africa, the Eastern Mediterranean, Southeast Asia, and the Western Pacific but not in the Americas and Europe
(US Department of Health and Human Services, 2012). This can be illustrated by smoking habits in China,
where only 1.8% of women consumed cigarette in 2015, compared to 15% and 18% of women in the United
States and United Kingdom, respectively (WHO, 2015b).
3.1.3.3 Socio-Economic Status
Tobacco consumption proves to be associated with lower socioeconomic status, even in low HDI and medium
HDI countries (Kostova et al., 2014). Moreover, numerous studies worldwide have been conducted to assess
the association between socio-economic status and smoking among adults and youths, and low socio-economic
status are associated with a higher smoking rate in several countries, such as France (Baumann et al., 2007),
Germany (Haustein, 2006), India (Neufeld et al., 2005; Thankappan & Thresia, 2007; Mathur et al., 2008),
41
and the United States (Flint & Novotny, 1997). Furthermore, studies show that the better educated and
wealthier, the less likely one is to smoke (Morgan et al. 2007; Stuber et al. 2008). In addition, it has been found
that smoking is highest in low-income neighborhoods in the Czech Republic (Dragano et al. 2007), Germany
(Dragano et al., 2007), New Zealand (Barnett, 2000), the United Kingdom (Kleinschmidt et al., 1995;
Shohaimi et al., 2003), and United States (Cubbin et al., 2001; Tseng et al., 2001; Chuang et al., 2005; Datta
et al., 2006; Stimpson et al., 2007).
3.1.3.4 Implications for the Tobacco Industry and PMI
One possible social motivation for smoking is to attain certain attributes associated with smoking behavior.
For example, Leventhal & Cleary (1980) suggest individuals may aim for attaining a social image associated
with smoking that traditionally have been in previous cigarette advertisements. Just as in many other situations,
individuals may adopt certain products to attain their ideal self-concept. Furthermore, it is believed that young
individuals are more likely to imitate their role models’ behaviors, especially when associated with positive
outcomes such as power, sex, romance, social status and success (Breed & De Foe, 1984; McIntosh et al.,
1998; Borzekowski et al., 1999; Roberts et al., 1999; Escamilla et al., 2000). However, as awareness of the
health issues regarding tobacco and smoking is broadening, smoking is becoming less associated with glamour,
wealth, sex appeal, popularity and power (US Department of Health and Human Services, 1994). In addition,
stringent regulations and bans with regards to tobacco advertisements limits industry players to achieve this
endeavor among their potential customers.
In a study conducted by Watson et al. (2003), it was reported that many young people particularly identify
with the sociability of smoking, and that young people associated smoking positively with social activities and
relaxation. The sociability perception of smoking among individuals is considered to be a strong motivation
for individuals to consume tobacco, and is therefore an important factor to consider for this industry.

42
3.1.4 Technological Factors
The cigarette industry has an extensive history, but for the most part, cigarettes have remained as
technologically uncomplicated as they were several decades ago. However, all industries, including the
tobacco industry, where the menthol cigarette once passed as an innovation, are now forced to contend with
tech-driven disruption.
3.1.4.1 Tech-driven Disruption
The modern-day e-cigarette was invented by Chinese pharmacist Hon Lik in 2003 where he adopted a
vaporizing technology that produced micro-droplets containing nicotine vibrating at an ultrasound frequency
(Boseley, 2015). Since, the sale of e-cigarettes has become a small yet significant and fast-growing corner of
the cigarette market. As global regulations are tightening, the industry stakes its future on high-tech smoking
devices rather than on combustible cigarettes. Further, regulations and restriction make it nearly impossible
for tobacco companies to improve their marketing mix when media advertising, sponsorship, product
placement and display are banned or restricted (Henriksen, 2012). Hence, placing greater emphasis on product
innovation and new technology seems like the reasonable next step.
3.1.4.2 From Marlboro Country to Silicon Valley
As the industry is moving from the time-tested model of selling easy to make, addictive combustible products
and increasing revenues through incremental price rises, it is now moving towards a far less certain field of e-
cigarettes. Innovation in next-generation tobacco products is now a main priority for Big Tobacco who are all
looking towards a future more closely aligned with Silicon Valley. In the case of PMI, the recent launch of the
company’s smoke-free world initiative underlines the emphasis Big Tobacco are placing on new nicotine
technologies and the promotion of research in this area. Dr. David O’Reilly, BAT’s director of science and
R&D, went as far as proclaiming that the company “are becoming a tech company” placing heavy investments
in RRPs, with its flagship heating product “glo” (Williams-Grut, 2017). Other companies, among them Japan
Tobacco with Ploom, PMI with IQOS, and Altria with JUUL invest hard to take a portion of this potentially
huge market. Billions of dollars have been spent in recent years in search for a cigarette that causes less harm,
but which has the look and feel of the real thing. Subsequently, companies like BAT and PMI have had to hire

43
new talents as they are moving towards working more like a consumer electronic business. In addition to new
staff, tobacco companies are moving from a straightforward manufacturing process to one heavily reliant on
expensive research and development, due to the introduction of new product segments (McClean, 2017). PMI
has since 2008 invested over $6 billion in RRPs (PMI, 2018), and BAT over $2.5 billion in research into
smoking alternatives (Mathis, 2018). However, Big Tobacco are not looking to invent from scratch, most
companies are on the look-out for startups to contribute with creativity, innovation and promising technology.
BAT runs a scouting program to spot promising technology in fledgling business, and has an investment fund
to take positions in these groups (McClean, 2017). PMI also operates in active alliance programs to widen their
knowledge and technology portfolio that could potentially enhance its RRP portfolio. This is enforced through
in-licensing, R&D Agreements, service agreement, co-developing agreements, as well as asset or share
acquisitions.
3.1.4.3 Implications for the Tobacco Industry and PMI
With any given technology, it is difficult to point at a precise point in time where technology made a decisive
impact (Hasselbalch, 2015). Today however, it is of the common opinion that technology is one of the most
important pillars of external impacts. For PMI, technology not only facilitates, but is perhaps the very
prerequisite for the existence of the company in the future to come. Technology drives RRP product
development meaning innovation and R&D advancements are going to have to be at the top of PMI’s agenda
to succeed in the quest for a smoke-free future. The high rate of technological diffusion in the tobacco industry
has resulted in a wider range of product offerings as well as numerous amounts of high-tech e-cigarette with
patented technologies.
3.1.5 Summary of PEST Analysis
As tightening regulation is expected, and health awareness is broadening, it is believed that the industry will
face challenges in keeping profitability at its historical level by only producing combustible cigarettes.
Increased taxes, causing prices to increase, is believed to reduce shipping volumes amongst all brands. In
addition, without the possibility to successfully differentiate, premium-priced brands may be less attractive to

44
consumers. Furthermore, although the review of the economic factor in the PEST analysis suggests that the
economic expansion in emerging markets provide opportunities for tobacco players, companies with a product
portfolio weighted towards the premium-priced brands may be less able to capture these. To remain profitable
in this changing industry, it is believed that effective technology development and R&D investments are crucial
for sustained profitability. By conducting a PEST analysis for PMI, the sub-question “Which macro-economic
factors influence PMI’s risk and future cash flow potential?“ has been answered.
3.2 Porter’s Five Forces Analysis
Porter’s Five Forces model is a common strategic analyzing tool (Grant, 2013) applied to assess five forces
impacting the intensity of competitiveness in a certain industry (Porter, 2008). These forces include the threat
of new entrants and substitutes and bargaining power of suppliers and customers as well as competitive rivalry.
The model can contribute to an understanding of the future attractiveness and profitability of the industry,
where there is chance of above-average return (ROIC>WACC) (Ibid.) and what implications this will have for
the targeted company.
3.2.1 Threat of New Entrants
The threat of entry depends on the level of entry barriers that exist in an industry and on the expected reaction
from incumbents (Porter, 2008). Low entry barriers suggest high threat of entry, and consequently moderate
industry profitability. Moreover, profitability is influenced by the height of entry barriers as it influences
industry players investments and strategies to keep potential entrants away (Porter, 2008). To develop an
understanding of the level of entry barriers in the tobacco industry, seven potential entry barriers will be
elaborated upon in the following sections.
3.2.1.1 Supply-side Economies of Scale
Supply-side economies of scale arise when producers of large volumes enjoy lower costs per unit (Porter,
2008). This can be achieved through allocating fixed costs over more units through efficient technology, or
negotiating better supplier terms due to large orders (Ibid.). Moreover, scale economies can be found in
practically every activity in the value chain, and is what is believed to be serving as a main entry barrier,

45
protecting players in the tobacco industry. Producing at immense volumes, it is believed that PMI and its
competitors enjoy benefits of economies of scale in manufacturing, packaging, branding, and distribution.
Important to consider, is that industry players may experience new competition from already established
brands, entering their geographical market. For example, companies currently serving the Chinese market may
decide to enter the European market, and vice versa.
3.2.1.2 Demand-side Benefits of Scale
Demand-side benefits of scale also known as network effects, arise when the willingness to use a certain
company’s product increases with the number of other users or customers of that company (Porter, 2008). This
effect often arises because buyers may trust larger companies, or value being a part of a network with a larger
number of fellow customers (Ibid.). Although there is not a physical network established by any of the tobacco
companies, it is believed that a strong brand can allow customers to feel a sense of belonging. In addition to
Marlboro, PMI offers several other brands that also qualify to list of the top most sold cigarette brands globally,
implying a large pool of loyal customers that regularly purchase its brands. One could argue that the recurrent
purchasing pattern can be explained by habit. However, studies show that certain brands enjoy particular appeal
among specific demographic groups (Dawes, 2014), suggesting that certain individuals identify with, or aim,
to be a part of a certain brand community.
3.2.1.3 Customer Switching Costs
Customer switching costs refer to the costs associated with switching to another product or brand (Porter,
2008). If switching costs are high, there will be harder for new entrants to win over customers. Switching costs
for end-users in this industry are very low, practically zero, and so are the switching costs for retailers and
distributor as long as there are no contracts in place stating the opposite. The products are easily replaced by
other brands, and it is not the monetary switching costs per se that makes it difficult for new entrants to enter
this industry.
46
3.2.1.4 Capital Requirements
The requirement of large financial resources to participate in an industry can hinder new players to enter an
industry. It is believed that the financial investments needed to enter the tobacco industry successfully are
moderate, and that these investments are mainly associated with plants and machinery needed, and because
this machinery is unlikely to be used to producing other products. In terms of unrecoverable capital, such as
great R&D and marketing expenditures, the capital needed to enter the combustible cigarette industry is not
considered particularly high. The reason for this is mainly because there are not many marketing opportunities,
due to regulation. However, entering the e-cigarette industry is believed to be requiring capital invested in
R&D, as this is still a rather novel field. However, as Porter (2008) argues, large capital requirements seldom
discourage entry if industry returns are believed to be attractive and continuous. Evidently, the tobacco industry
has been highly profitable for many years, and it is therefore believed that it is not the capital requirement per
se that historically has hindered new players to enter this industry.
3.2.1.5 Incumbency Advantages Independent of Size
Regardless of size, incumbents may have cost or quality advantages, known as competitive advantages, that
potential rivals do not possess (Porter, 2008). These advantages can be associated with technology, access to
superior raw material sources, access to certain geographic locations, established brand identities, or
knowledge on how to produce more efficiently (Ibid.). This is assumed to be one of the major entry barriers to
new entrants in this industry, mainly because of the tobacco players’ cumulative experience of operating in
this field, and their already established brand identities.
3.2.1.6 Unequal Access to Distribution Channels
New entrants must secure distribution of its products. Generally, no tobacco industry player is currently able
to improve distribution through intense selling efforts, promotions or price breaks, due to regulation, especially
not where point of sales bans are implemented. Therefore, there would not be any unequal access to distribution
channels. In certain countries, there are licenses needed in order to provide tobacco products, meaning that
distribution channels in these countries are more limited.
47
3.2.1.7 Restrictive Government Policy
As mentioned, the tobacco industry has become increasingly regulated on many levels, and this development
is believed to continue. Governments have placed limitations on how companies market established and new
products, and smoking bans in public places helps curbing consumption. The high level of current regulation,
and the ever-tightening regulation, is believed to successfully keep new entrants away.
3.2.1.8 Threat of New Entrants Summary
Taken together, the entry barriers in this industry is relatively high. This is mainly because of the concentrated
market share distribution among large players who protect their market share carefully. These players are
believed to possess cumulative experience of operating in the tobacco industry, implying capabilities difficult
to replicate overnight. Furthermore, new entrants are not able to engage in marketing activities, due to
regulation, implying difficult in establishing a district brand identity in the industry. Finally, it is believed that
the high level of regulation provides as a prevention mechanism, keeping new entrants on distance.
3.2.2 Bargaining Power of Suppliers
Government mandated prices, production control programs, shifts in crops driven by economic conditions and
the impact of climate change may increase the cost or reduce the quality of the tobacco and other agricultural
supplies used to manufacture PMI’s products. Supplier bargaining power factors are determinants of the level
of competition since it has potential to translate into higher costs for tobacco companies to reduce overall
industry profitability (Porter, 2008). Factors include the number of suppliers in the market, the value of the
firm demanding the product to the supplier, the scarcity of the resource, and the substitutability of the resource
(Ibid.). These factors are evaluated within the context of PMI’s main supplier categories which include tobacco
leaf suppliers, direct material supplier and RRP suppliers.
3.2.2.1 Tobacco Leaf Suppliers
For their combustible cigarette segment, PMI rely heavily on farmers for tobacco supply. Tobacco leaf
production has been shifting towards low and lower middle-income countries while decreasing in high income
countries and at global level, real export price for tobacco leaves are falling (WHO, 2012). PMI purchases
48
tobacco leaves through independent tobacco suppliers from Argentina, Brazil, China, Italy, Indonesia, Malawi,
Mozambique, Philippines, Turkey and the United States. In addition, the company purchases directly from
farmers in a number of countries, including Argentina, Brazil, Colombia, Ecuador, Italy, Pakistan, the
Philippines and Poland. In 2018, direct sourcing from farmers represented approximately 24% of PMI’s global
leaf requirements (PMI, 2018). In their 2018 annual report, PMI states that they believe that there is an adequate
supply of tobacco leaf in the world markets to satisfy current and anticipated production requirements.
A series of tobacco farming research have studied five major tobacco-growing countries, Indonesia, Kenya,
Malawi, Philippines, and Zambia. The research points to some crucial dynamics demonstrating how the
tobacco industry has proven to be an unequal and often unfair partner with farmers. The contracts that Big
Tobacco are in with farmers in these low income-countries are set up to create a situation of price-taking where
tobacco companies are the sole dictators of both price and quality leaving tobacco farmer with little to no
leverage (Devex, 2019). Research also suggest that contract tobacco farmers usually are taken advantage off
because prices suggested in their contracts are significantly higher than market prices. Working mostly in
credit-scarce context, farmer reluctantly accept these poor terms (Tobacco Atlas, 2019b). What further
weakens the farmers almost non-existent power as supplier is the lack of differentiation that can be attributed
to the tobacco leaf (Porter, 2008).
3.2.2.2 Direct Material Suppliers
In addition to tobacco leaf, PMI sources a wide range of direct materials from approximately 500 suppliers.
The three most sourced direct materials include printed paper board used in packaging, acetate tow used in
filter making, and fine paper used in the manufacturing of cigarettes and heated tobacco units. Both materials
are difficult to find a substitute for, the main physical function of a cigarette paper is to keep the cigarette in
the form of a tube and the paper board is necessary to package the cigarettes to the most cost-effective price
(BAT, 2019b). However, as neither paper nor acetate can be considered as scarce, this offset the effect of low
substitutability. In 2018, the top ten suppliers of direct materials represented approximately 50% of all direct
material purchasing, which gives PMI a high degree of negotiation leverage (PMI, 2018). Contributing to this

49
leverage is the standardized nature of these direct materials as well as its lack of differentiated attributes. The
fair amount of negotiating latitude and bargaining power PMI has with its direct material suppliers can mainly
be threatened by further standardization of tobacco products, requiring the use of standardized filter and
cigarette paper designs (PMI, 2018). Such restrictions could potentially decrease the number of suppliers in
the market eligible to produce such standardized materials, thus threatening PMI’s bargaining power.
3.2.2.3 Reduced-Risk Product Suppliers
The adequate supply chain for the RRP portfolio, including the supply of electronic devices is, and will be
even more so in the future, an important supply aspect of PMI’s business. Today, the company sources its
IQOS devices from two electronics manufacturing providers. In addition, a small number of other suppliers
provides other products in the RRP portfolio and related accessories. PMI has a close relationship with these
suppliers and closely monitors their production capability and financial health (PMI, 2018). However, the
commercialization of the RRPs could potentially be adversely affected if the service providers are unable to
meet their commitments, leaving PMI heavily supplier-dependent, potentially facing high switching costs
(Porter, 2008).
Various metals are required in the production of RRPs, and PMI estimates that there is an adequate supply of
such metals in the world market to satisfy the current and anticipated production requirements. However, some
components are obtained from single or limited sources, and can be subject to industry-wide shortages and
price fluctuations. PMI’s potential inability to secure an adequate supply of such components and materials
could negatively impact the commercialization of the RRPs (PMI, 2018).
3.2.3 Bargaining Power of Buyers
In Tobacco Explained, a WHO report originally written by Clive Bates and Andy Rowell, it is stated that since
the 1960s, tobacco companies have internally recognized that the crucial selling point of its product is the
chemical dependence of its customers. Bates and Rowell (2004) continues to state that without nicotine
addicted customers there would be no tobacco industry, shedding a different kind of light on the aspect of

50
buyer’s bargaining power in comparison to most other industries. Like industrial customers, consumers tend
to be more price sensitive if they are purchasing products that are undifferentiated, expensive relative to their
incomes, and of a sort where product performance has limited consequences (Porter, 2008). Assuming that
both RRPs and especially combustible cigarettes will continue to face a future of tight regulation and that
switching costs are kept low, then customers would on the one hand have negotiating leverage because of the
standardized nature of the product. On the other hand, the very premise of bargaining would be challenged by
the fact that the product bargained for is highly addictive. True, it may weaken the bargaining position of all
companies within the tobacco industry, but it would not change the position of the industry as a whole as long
as its gathered customer base are chemically dependent addicts.
3.2.4 Threat of Substitute Products
A substitute product can be anything that is produced in a different industry but manages to meet the same
needs (Porter, 2008). With growing awareness about the harmful effects of tobacco, one can assume that the
demand for substitute products is increasing. In the case of the tobacco industry, the most obvious examples
of substitute products would involve over-the-counter products such as nicotine patches, sprays, gums, and
pastilles. As mentioned in previous sections, there are practically zero costs associated with switching to an
alternative product, instead, regulation has made it possible for savings to capture for those who quit using
tobacco. For example, the cost of nicotine replacements is far lower than the cost of cigarettes (Forbes, 2015).
A growing substitute for the combustible cigarette is the e-cigarette, which has been experiencing an
unprecedented growth over the past few years. For example, the leading e-cigarette company JUUL was
founded with the mission of eliminating cigarettes by providing an acceptable alternative with a competitive
nicotine level (JUUL, 2019). In 2018, JUUL surpassed Facebook as fastest startup to reach decacorn status
(Yahoo Finance, 2018). Thus, if the consumer need is nicotine in isolation, there exist plenty of substitutes.
However, it is believed the habitual ingrained activity of many smokers is difficult to simply substitute to
something else.
51
Finally, although there exist few substitute products to cigarettes, and the smoking activity, there exist a
number of substitute brands and customers can easily switch between brands without any monetary costs
incurred.
3.2.5 Competitive Rivalry
The overall competitive rivalry can be considered high in the tobacco industry. The market is highly
consolidated with six multinational corporations controlling almost 81% of total market share (Rehn, 2014).
The tobacco industry represents a business environment skewed towards the largest players as the smaller
firms are moving further towards periphery (Ibid.). Apart from CNTC holding a 37.1% market share, all of the
other big players hold a relatively equal size. This results in an intense market rivalry where the companies are
continuously seeking ways to reach competitive advantages over one another. As in many industries, the
tobacco industry engages in merger and acquisition (“M&A”) activities to inorganically grow even bigger in
size, capturing market shares in both foreign and domestic markets. However, M&A activity could also pose
a threat to PMI if two major players where to join forces at some point to create synergies in production,
distribution and promotions. This would force PMI to have to incur costs to drive its brand appearance among
other players in the new competitive landscape.
Oversea expansion has also proven to be a way for the firms to gain market share as income levels rise in more
favorable regulation markets which allows tobacco firms to better withstand competition from small discounts
at the retail level. Companies can also compete on price with one another, as they build upon their budget
brands in developing countries (PMI, 2018). The fact that there are a few companies competing with a large
number of e-cigarette and combustible cigarette brands also increase competition. The competitive rivalry is
also projected to increase as firms invest more heavily into R&D and technological developments trying to
catch the new generation of smokers with e-cigarettes. This could of course change the rivalry in terms of
monetary aspects as those who invest early in this segment, as Altria with JUUL, will see their costs increase
and ATR rates decrease. However, this might prove to be a successful strategy raising profits in the future.
While PMI does not have to be overly concerned with new players entering the market, they could be
52
threatened if they don’t manage to compete with their RRPs, and might see for instance JUUL taking over the
entire market. The development of the e-cigarette industry will have a substantial impact on the intensified
competitive landscape. However, continued consolidation of the tobacco industry market, especially in the
form of higher pricing power, could provide steady profits for PMI going forward.
3.2.6 Summary of Porter’s Five Forces
To summarize, competition among industry players are deemed high, the threat of substitute products is fairly
manageable and the bargaining power of suppliers as well as threat of new entrants are deemed low. Although
customer bargaining power can be exerted at some levels, in terms of them having no switching costs,
customers would have a difficult time exerting businesses to get them to provide higher quality products, better
customer service and lower prices. Hence, bargaining power of customers are deemed to be manageable. By
conducting a Porter’s Five Forces analysis for PMI, the sub-question “What is the overall attractiveness and
competition of the industry and how does it affect PMI’s operations?“ has been answered.
3.3 SWOT Analysis
The previous analysis has been focused on the PMI’s external environment. In this section, information derived
from the PEST will allow for a developed understanding of potential opportunities and threats the company
faces. Furthermore, threats and opportunities in an industry are closely linked to a company’s internal state
represented by its strengths and weaknesses. Data generated by an internal analysis is valuable because it can
be used to develop strategic planning objectives to sustain and grow the business (Williams, 2019). For
example, opportunities can be captured through levering on existing strengths, and improving weaknesses.
3.3.1 Strengths
The primary strengths of PMI that positions the company in the forefront of its competitive landscape are
numerous. There are several strengths that positions PMI in front of its competitors, three of these will be
thoroughly examined and analyzed in this next section.
53
3.3.1.1 Strong Portfolio of Brands
Despite various efforts to limit Big Tobacco’s marketing mix and capabilities, PMI has continued to translate
its brand equity into profitable sales. PMI has built a portfolio consisting of some of the world’s most famous
cigarette brands which include dozens of popular regional, national and international brands ranging from
premium, mid-price and low-price brands. Marlboro, arguable the most famous brand in PMI’s portfolio
,continues to rank high on Forbes (2019) list of the world’s most valuable brands. PMI can with its broad and
deep portfolio serve both the type of customer concerned with quality and production with combustible
cigarettes such as Marlboro, Parliament, and Chesterfield as well as RRP brands IQOS and Solaris while also
serving those customers more sensitive to price with brands such as Bond Street, Red and White and Next.
Premium brands Marlboro and Parliament can be higher priced because of its strong and well-known
reputation, earning PMI higher operating margins. The company’s portfolio does not only allow for premium
price charging but also significantly contributes to the loyalty of its customers.
3.3.1.2 Strong Free Cash Flow Generation
Combustible cigarettes, the main source of PMI’s income, are intrinsically a very profitable product, because
of its addictive nature and because they are cheap to make. In financial terms, PMI is what many would call a
cash machine as the company disperses a great amount of cash. Few multinational, regardless of sector, offer
anything close to those figures (McFarlane, 2014). Big Tobacco companies have historically represented
formidable cash machines with the strategy to create value, less through growing revenues but rather through
some combination of continuously improving margins, increasing asset productivity, whilst returning a
substantial portion of free cash flow (“FCF”) to shareholders in the form of dividends or share repurchases
(Kotzen et al., 2012). A substantial amount of cash is distributed to its shareholders in solid dividends which
has kept many investors to remain loyal to PMI (Seeking Alpha, 2018). Since becoming a public company in
2008, PMI has increased its regular quarterly dividend by 147.8% representing a compound annual growth
rate (“CAGR”) of 9.5%. Dividends paid in 2018, 2017 and 2016 were $6.9 billion, $6.5 billion and $6.4 billion,
respectively (PMI, 2018). During 2018, net cash used in financing activities was $9.7 billion, compared with
net cash used in financing activities of $2.8 billion during 2017 and $5.4 billion in 2016 (Ibid.).
54
A strong cash position also provides the company with the means to exploit potential growth and expansion
opportunities. Excess cash is also used to fund innovation, mainly into the RRPs and smoke-free future, as
well as to fund acquisitions in target markets. Given the scrutiny facing nearly all aspects of PMI’s business,
the large amount of cash has also been used to fund PMI’s various legal proceeding covering a wide range of
matters in various jurisdictions (PMI, 2018). In addition to directly creating shareholder value, high dividend
payouts can have a major positive impact on a company’s multiple, many sectors with the highest yields are
also those with the strongest share-price appreciation (Kotzen et al., 2012).
3.3.1.3 Global Presence
PMI benefits from its significant diversification with good exposure to the higher growth emerging markets
and the high margin developed in the emerging markets witnessing industry volume growth or stability, PMI
has been expanding its market share in these segments through organic and inorganic growth.
3.3.2 Weaknesses
A well-orchestrated internal analysis of a company should highlight any organizational weaknesses that may
exist in terms of areas in need of improvement and objectives that has not yet being realized. The reliability of
the information and analysis provided in the following section is compromised due the lack of internal insight
into PMI in terms of management and staff, accounting systems, product lines and distribution networks.
However, the authors believe that there are still important aspects of PMI’s weaknesses that can be analyzed
through an observer's view, using secondary data.
3.3.2.1 Short Operating History in Reduced-Risk Products
PMI has a short operating history in the RRP segment. Consequently, the company can be assumed to hold a
limited experience and knowledge in designing, manufacturing and selling of these products. Soon after PMI
announced its smoke-free future initiative in late 2016 and beginning to aggressively market IQOS, the
company failed to meet demands of its RRP suggesting a weakness in its production operations (Caplinger,
55
2016). Although PMI has announced that the company is expanding its capacity to produce RRPs, both by
investing in new factories and converting its old cigarette production facilities into RRP manufacturing units,
it is difficult to project if this will be enough to meet the future demand (The Economist, 2017).
3.3.2.2 Consumer Confusion
During the last decades, awareness of the existence of RRPs has increased substantially, which in the case of
PMI, is a great strength. However, regarding the details of what an RRP actually is, is often a muddle of
misconceptions. Consumers and non-consumers seem unaware of the health implications, the regulatory
situation concerning the RRP as well as its essential less or non-tobacco nature. Part of the problem, of course,
is that experts and researchers are neither in unison nor wholly decided (Page, 2014). This implies a weakness
in PMI’s marketing possibly affecting RRP sales negatively. Educating smokers of combustible cigarettes,
RRPs and non-users through marketing could offset misleading or critical media coverage. Further, PMI could
be a part of improving coordinated public relations response together with industry peers to mitigate the
negative effects of confusing among the RRP consumers.
3.3.2.3 Weak Market Image
Not only can it be considered a weakness that continued future regulations and restriction will make it nearly
impossible for PMI to improve their marketing mix, thus making their product difficult to differentiate from
their competitors. In addition to the difficulties of designing a unique selling proposition, the product itself is
not considered a “good” product. On the contrary, combustible cigarettes are highly dangerous, causing over
7.1 million deaths annually worldwide (Tobacco Atlas, 2019a). Consequently, like many other dangerous
products, shares in tobacco companies are considered as “sin-stocks”, referring to a publicly traded company
that is either involved in or associated with an activity that is considered to be unethical or immoral, causing
harm to society (Kenton, 2017). PMI and the tobacco industry are no strangers to health organizations around
the world calling for divestments of tobacco-held shares (Telemacque, 2015). Having faced huge litigation
cost and an active investor divestment movement, PMI has previously focused on improving their cash flow
and margins, spending vast amounts on growth markets to later hand the money back to its shareholders in the

56
form of dividend checks (Stevenson, 2019). However, this kind of dividend-fueled value revival might not
forever be enough to offset the apparent negative side-effects of PMI’s business. The weak image of the
combustible cigarette can in the long run hurt PMI’s other products if the linkages with tobacco are still unclear.
That is why, in addition to previous attempts to mitigating the effects of a divestment culture, it is important
to reduce consumer confusion and educate existing and potential customers about the separate features of the
RRPs and the combustible cigarettes.
3.3.3 Opportunities
The internal state of a company’s capabilities or improvement areas are closely linked with the opportunities
presented in a company’s external environment. Internal strengths should be used to take advantage of
opportunities presented, and weaknesses should be improved in order to capture these. Below the assumed
existing industry opportunities will be outlined, to ultimately provide an understanding of how these can be
captured to seize the company’s strengths, and enhance its weaknesses.
3.3.3.1 Emerging Markets
As the populations of emerging markets are becoming wealthier, the number of potential customers is
increasing. Increased smoking rates have been recorded in developing countries such as Nigeria and
Cameroon; in Cameroon, the smoking rate has increased from 7% in 2000 to 22% in 2017 (Ibid.). As
mentioned before, in the “Economic Growth” section of the PEST analysis, 180 million men are predicted to
be smoking by 2025, which is twice as many as in 2000 (Bloomberg, 2018). PMI has proven to be successful
in identifying growth regions with under-addressed demand for tobacco products. As an example, its 2005
acquisition of four Indonesian tobacco companies allowed the company to achieve a market-leading position
in the country (Harrington, 2014). Furthermore, in 2014, the company invested in new ventures in the United
Arab Emirates and Jordan. Thus, while regulation in some parts of the world is increasing, PMI has the
opportunity to maximize business potential in other emerging areas. With its strong portfolio of brands and
global presence, it is believed that PMI has a great potential to do this.
57
3.3.3.2 E-cigarettes
Tapping into the opportunity of the e-cigarette market has been attempted by Big Tobacco in recent years. The
e-cigarette segment has showcased significant growth and is anticipated to be one of the major determinants
for future success of tobacco companies. Aimed at producing less harmful toxicants than combustible
cigarettes, it is anticipated that these products can avoid heavier regulation, and continue to grow to represent
an increasingly material portion of the overall industry’ revenues and profits (Reuters, 2017).
3.3.4 Threats
In the following section, external threats facing PMI will be elaborated upon. These are primarily focusing on
the current decline in shipment volume, believed to result from primarily increased health awareness and
tightening regulation.
3.3.4.1 Increased Health Awareness
Because of its health impact, to reduce smoking remains the key priority to public health communities
worldwide. Knowledge regarding the dangerous health impacts is broadening and research indicates that the
perception of risks and benefits of smoking is strongly associated with the initiation of smoking (Nazir &
Almas, 2017; Aryal, Petzold, & Krettek, 2013). Furthermore, higher education and income has been found to
be associated with higher awareness, and socioeconomic status is strongly associated with smoking prevalence
(Siahpush, 2006). Moreover, it has been found that adolescents with low perception about the long-term risks
related to smoking were 3.6 times more likely to smoke compared with those who had high perception of
smoking related risks (Song et al., 2009). In addition, research suggests that pictorial package warnings
significantly increase people’s awareness of the harms of tobacco use (WHO, 2018). Since increased health
awareness is negatively correlated with smoking (Song et al., 2009), it constitutes a major threat to all players
in the industry.
3.3.4.2 Increasing Tax
According to WHO (2018), tobacco taxes are the most cost-effective way to reduce tobacco use, especially in
more vulnerable populations such as youth and lower-income people, as these groups are particularly sensitive
58
to price increases. Hence, public health communities are suggesting that significant tax increases are especially
needed in countries where consumers’ purchasing powers are growing, such as emerging markets (Drope et
al., 2019). This poses a threat to PMI, and other tobacco companies, as 80% of the world’s tobacco users live
in low- and middle-income countries (WHO, 2018).
Increases in excise taxes are not believed to only be effective in lower-income countries, but is also assumed
to have been the most effective control tool in reducing tobacco consumption in developed economies
(Sweanor et al., 1992; Jha & Chaloupka, 2000; WHO, 2018). A variety of studies have measured the effects
of increases in tax on smoking rates, and findings suggests that a 10% increase in the price of tobacco products
lead to a decrease of about 4% in high-income countries, and 5% in low-income countries (Hopkins et al.,
2001; WHO, 2018). Apart from the direct consequences to the price of tobacco, the implementation of uniform
specific tax structures also threatens the ability of differentiation among industry players, as it reduces the
variability in product prices (Drope et al., 2019). E-cigarettes have also proven to be sensitive to price changes,
and studies reports significant reduction in sales, from 8% to 19%, resulting from a price increase of 10%
(Stoklosa, Drope & Chaloupka, 2016; Huang, Tauras & Chaloupka, 2014).
3.3.4.3 Tightening Regulation and Illicit Trade
Regulation controlling products, prices, branding, and marketing can have a large impact on cigarette sales as
it limits the company to differentiate between its own products and brands, as well as between its competitors’
brands. For example, the ban on flavors and the requirement of plan packaging is particularly effective in
reducing differentiation among brands (Drope et al., 2019). Furthermore, regulation committees have
determined that PMI’s smoke-free delivery device IQOS should not be marketed as less harmful than smoking
cigarettes, it further challenges the company to differentiate between their product categories (Forbes, 2018).
Increased regulation is also considered an indirect threat as it could open up for illicit tobacco trade, a concern
the tobacco industry has raised for years. Globally, the illicit tobacco market is dominated by smuggling across

59
international borders, but illicit trade also involves tax avoidance at the individual level, or tax evasion,
implying the purchase of tobacco products low-tax jurisdictions and resold in high-tax jurisdictions (CDC,
2018). One of the arguments against plain packaging has been that plain packages will be easier and cheaper
to replicate (Tobacco Free Kids, 2019). However, there is no evidence that packaging restrictions can be
connected to illicit trade in countries where these have been implemented. In terms of increased tax, making
legal products significantly more expensive, and non-affordable to some current customers, might increase the
illicit trade. As argued by Joossens & Raw (2012), illicit tobacco trade increases the accessibility and
affordability of tobacco products. This does not only serve as a threat to the tobacco industry, but also weakens
the effectiveness of raising tobacco prices (Joossens & Raw, 2012; CDC, 2018).
3.3.5 Declining Shipment Volumes
The main factors contributing to the decreasing shipment volumes are believed to be attributed to increases in
price resulting from increased regulation and increasing awareness about the harmful effects of tobacco use.
This is believed to be the main cause of industry wide declining shipping volumes and sales. As regulation is
not believed to become more stringent, prices are not expected to decrease, and as combustible cigarettes are
not believed to become any healthier, this threat is believed to be difficult to overcome without diversifying
the product portfolio.

60
Figure 3.3.4.1: Shipment Volumes, in millions
Source: Author Illustration based on Data from PMI Annual Reports 2012-2018
The decreasing trend of combustible cigarette consumption in developed economies poses a major threat to
the company, as its revenues from operations were fully dependent on the sale of combustible cigarettes until
2016, and continues to heavily rely on the sale of this product segment. Between 2014 and 2018, PMI’s
shipment volumes have decreased by almost 9%. In figure 3.3.4.1 above, the RRP segment is included,
meaning that the actual decrease of the company’s cigarette shipment volume was in fact higher between the
years 2016 and 2018 (PMI, 2015; PMI, 2018). The decreasing trend in shipment volumes is not only affecting
PMI, but the entire tobacco industry.

61
3.2.6 Summary of SWOT Analysis
By conducting a SWOT analysis, the sub-question “Does PMI possess a competitive advantage and is it
sustainable“ has been answered. With a global presence and a strong portfolio of brands, PMI has continued
to generate strong FCF. Although the company is particularly threatened by declining shipment volumes, as
well as tightening regulation and illicit trade, the potential emerging markets could somewhat offset these
negative effects. Perhaps what will most contribute to PMI’s competitive advantage in the future is its RRPs,
although the company has a short operating history within this segment, it also poses a great opportunity.

62
Chapter 4 - Financial Statement Analysis
Preceding the forecasting of PMI’s future cash flows, a financial statement analysis will be performed in order
to gain a deeper understanding of the historical performance of the company. This will be achieved by
rebalancing PMI’s income statements (“IS”) and balance sheets (“BS”) seven years back in time, from 2012
to 2018. The chosen time period covers important developments and phases occurring both in the tobacco
industry as well as in PMI’s business. Further, the financial statements of PMI’s chosen peers, BAT, Imperial,
and Altria, will be analyzed from 2012 to 2018.
It is critical to rebalance the IS and BS of PMI since investors categorize operational activities as the primary
source of value creation, whilst financial activities are not considered firm-specific advantage due to its easily
imitated source of nature. The rebalanced posts will streamline the calculation of profitability ratios gathered
from the DuPont Profitability Model used to decompose the different drivers of return on equity (“ROE”). The
historical performance of PMI will be measured against its peer group which will constitute the foundation for
an extensive analysis of the main drivers behind the ratios influencing PMI’s historical performance. The main
drivers found will accord with future trends applied in the following forecast (Petersen & Plenborg, 2012).
4.1 Rebalancing Financial Statements for Analytical Purposes
To gain a deeper insight into PMI’s historical performance, a reformulation of its financial statements into an
analytical IS and an BS sheet is necessary to perform. Rebalancing the financial statements into items related
to core operations and items related to financial operations, allows for an isolation of the operational activities,
which will be important to establish key ratios (Petersen & Plenborg, 2012). See Appendix 1 and 2 for a
complete illustration of the analytical financial statements concerning PMI.

63
4.1.1 The Analytical Income Statement
A reformulation of the IS separates core operating activities from financial items. Operating profit is
characterized by investors as the main source of value creation whilst lenders consider the operating profit as
the main source for servicing provided debt. This separation allows for the calculation of key performance
measures showcased in the profitability of the firm whilst disregarding its financial structure. The two main
operating profits that will be calculated is the operating earnings before tax and interest (“EBIT”) and the net
operating profit after tax (“NOPAT”), where the latter will constitute the base in the FCF calculation. All items
considered transitory will be placed after NOPAT in the IS (Petersen & Plenborg, 2012). The following
sections will present the financial items which displays a particular ground for clarification and discussion.
4.1.1.1 Equity Investments and Securities
Equity and securities income comes from investments known to pay dividend distribution, where stocks are
the most common type of investment (Investopedia, 2017). Such investments are not related to core operations;
hence this post is categorized as a financial item (Petersen & Plenborg, 2012).
4.1.1.2 Pension and Other Employee Benefit Costs
Employers who provide a pension plan must disclose plan assets and liabilities on the IS (Petersen & Plenborg,
2012). Pension coverage for employees of PMI’s subsidiaries is provided through separate plans, many
covered by local statutory requirements. The service cost component of net periodic benefit costs is included
within operating income, while all other cost components are included below operating income, within pension
and other employee benefit costs (PMI, 2018). This goes in line with credit rating institute Moody’s, (2016)
stating that the goal is to report pension expense absent the effects of artificial smoothing, such as the
amortization of prior service costs and actuarial gains and losses. Consequently, volatility in the performance
of pension plan asset is not reflected in EBIT. Concluding from the above statements, pension and other
employee benefit costs are treated as a financial item, separated from EBIT. Adding to this argument, PMI
employees are covered by a defined benefit pension scheme and the pension obligations are interest bearing,
reinforcing the choice of treating this item as a financial item (PMI, 2018).

64
4.1.1.3 Tax on Operations
Income statements does not distinguish between tax on operations and tax on financial items. Consequently, it
is necessary to carve out the interest-bearing expenses as they are tax deductible in order to determine the tax
shield. The tax shield is calculated by applying the United States corporate tax rate of 21% to the net financial
expenses before tax. Thereafter, the tax shield is deducted from the reported tax of PMI’s accounts (Petersen
& Plenborg, 2012).
4.1.2 The Analytical Balance Sheet
Similar to the analytical IS, the analytical BS is divided into operating and financial items. In addition, the
operating activities are further split into current and noncurrent assets, current liabilities, and non-current non-
interest-bearing debt. The financial items are divided into interest bearing assets and debt. Reformulating the
BS will provide insight into PMI’s invested capital (Petersen & Plenborg, 2012). The following sections will
present the financial items which displays a particular ground for clarification and discussion.
4.1.2.1 Cash and Cash Equivalents
The full sum of cash and cash equivalents is not necessarily used for either operating activities, or financial
activities. Naturally, operating cash is used for operating activities, while excess cash is used for non-operating
activities such as paying out dividends and buyback of shares. It is therefore of interest to uncover which part
of the item that should go under each of the two activities. However, if not disclosed, it is somewhat
complicated to do so. Since PMI does not reveal any information regarding the amount of cash used for
operating activities, the total amount of cash and cash equivalents presented in the balance sheet will be
classified as an interest bearing financial item.
4.1.2.2 Short and Long-Term Borrowings
While long-term borrowings are considered to be of financial character, short-term borrowings are assumed to
be related to the operating activities of the company. In addition, current portion of long-term debt is also
considered a financial activity as it de facto concerns long-term debt, but must be paid within a year.

65
4.1.2.3 Deferred Tax Assets and Liabilities
Deferred tax assets and deferred tax liabilities are measured at the tax rates that are anticipated to apply to the
period when the asset is realized, or the liability is settled, based on tax rates and tax laws that have been
recommended (IFRS, 2019). The measurement of deferred tax liabilities and deferred tax assets reflects the
tax consequences that would follow from what is expected at the end of the reporting period, to recover or
settle the carrying amount of its assets and liabilities (Ibid.). Thus, deferred tax assets are the technical
difference between book values and tax values. Since the items stem from the firm’s operations, they are treated
as operating activities.
4.1.2.4 Accrued Liabilities
PMI reports a number of different accrued liability items in its balance sheet, such as marketing and selling,
taxes except income taxes, employment cost and dividends payable. All of these items, except dividends
payable, are considered as operating liabilities as they are directly related to the operations of the company.
Dividends payable is, however, classified as a financial item in the analytical balance sheet.
4.2 Historical Analysis of Profitability and Performance
To evaluate the historical profitability of PMI and its ability to generate satisfactory returns to its shareholders,
the DuPont Profitability Model (“DuPont Model”) will be applied. The DuPont Model is a quick and efficient
way to measure a firm’s operating and financial performance. The model is flexible enough to be applied to
any business because it uses standard numbers from the IS and BS. The DuPont Model is straightforward as it
focuses on evaluating two main areas (1) operating performance through PMs and efficient use of assets; and
(2) financial performance through the cost of debt and leverage (Newman & Briggeman, 2016). Key number
and ratios derived from the DuPont Model will be measured against the same numbers and ratios as PMI’s
selected peer group. Using the benchmark of peers will provide detailed insights into the historical
development of the company compared to simply isolating PMI’s figures without comparison. In addition, a
relative comparison of margins, growth rates, and returns will provide important information applied in the
forecast of PMI.

66
Figure: 4.2: Historical Performance PMI
Source: Author Illustration based on Data from PMI Annual Reports 2012-2018
As can be seen in figure 4.2, PMI’s net revenues have decreased by a total of 5.6% since 2012, mainly driven
by shipment volume decline. Declining shipment volumes has through these years been offset by increased
cigarette prices, reflecting a pricing variance of 7.6% and an increase in sales of RRP products (Dulaney,
2016). However, even though PMI has benefited from higher pricing across all regions, net revenues dropped
in 2015 due to an increasingly complex business environment as well as sharp appreciation of the U.S. dollar
(PMI, 2018). Net revenues continued to drop in the following year, however by 2017 and 2016 revenues
recovered, reflecting an increase of net revenues between 10.6% between 2015-2018.
Earnings before interest tax depreciation amortization (“EBITDA”) and EBIT has decreased in the last seven
years by a total of 18.4% and 19.8%, respectively. The challenging market conditions of 2015 and 2016
affected PMI’s financial position resulting in EBITDA and EBIT margins of negative 13.6% and 15.1%,
respectively. Further decreases in EBIT have been offset by no recorded pre-tax asset impairment and exit

67
costs and since 2016, PMI has not experienced EPS impacts related to these costs. In total between the years
2015-2018, EBITDA and EBIT increased by 6.4% and 5.2%, respectively. PMI’s NOPAT margin have been
kept fairly steady at 26.0% throughout the historical period. However, a considerate drop can be detected in
2017, reflecting a margin of 21.4%, due to a considerable increase in tax on operations. This kind of tax
increase disproportionately affects PMI’s profitability and makes the company less competitive compared to
certain competitors.
Excluding historical figures before 2015, net revenue, EBITDA, EBIT and the NOPAT margin have all
exhibited positive change. However, EBITDA and EBIT margins continued to decrease, although at a less
accelerating rate than when including figures before 2015, of negative 3.8% and 4.8%, respectively.
4.2.1 Breaking down the DuPont Model
The DuPont Model focuses on decomposing ROE, namely return on invested capital (“ROIC”), spread and
financial gearing (“FGEAR”) (Petersen & Plenborg, 2012). For this particular case, ROIC is the preferred
measure as it measures the operational results from PMI’s core business. However, ROIC does not provide
further insights into the drivers behind PMI’s revenues, thus, it is important to decompose this measure into
PM and turnover rate of invested capital (“ATO”). In addition, ROIC will be measured against PMI’s WACC,
to determine whether invested capital is being used efficiently. Further, an index analysis identifying trends
over a specific period of time and a common size analysis will be performed. All figures applied have been
based on an after-tax basis.
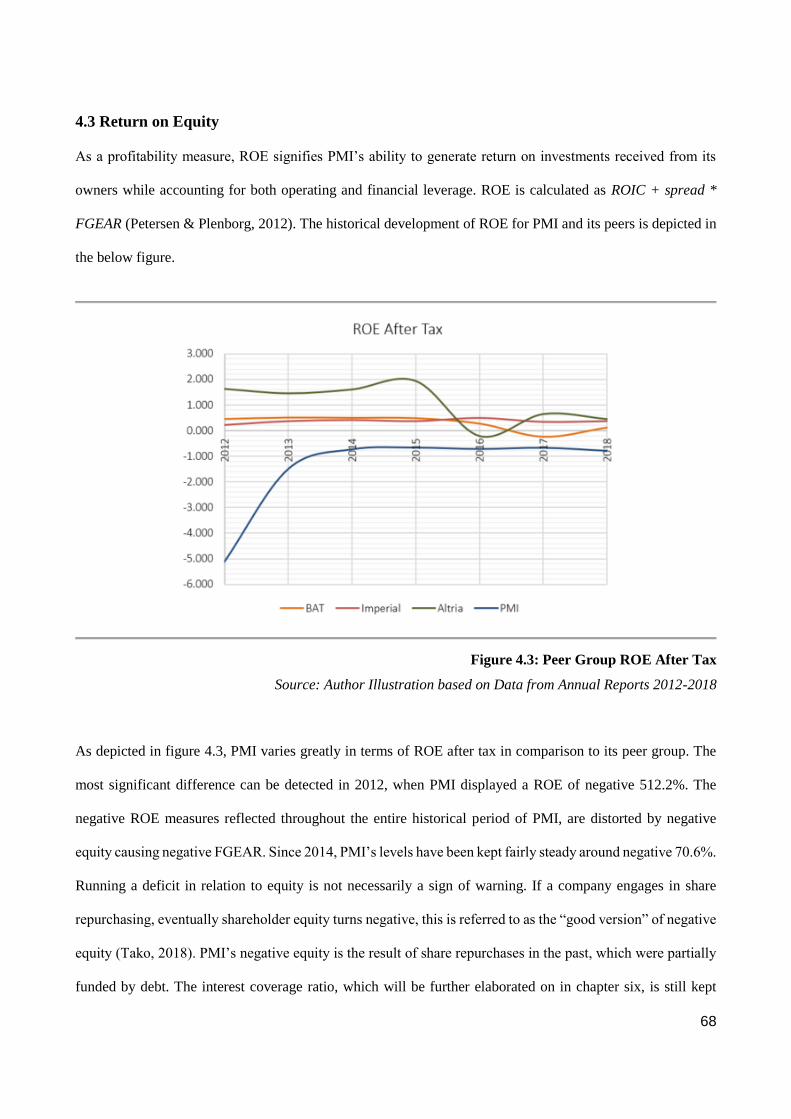
68
4.3 Return on Equity
As a profitability measure, ROE signifies PMI’s ability to generate return on investments received from its
owners while accounting for both operating and financial leverage. ROE is calculated as ROIC + spread *
FGEAR (Petersen & Plenborg, 2012). The historical development of ROE for PMI and its peers is depicted in
the below figure.
Figure 4.3: Peer Group ROE After Tax
Source: Author Illustration based on Data from Annual Reports 2012-2018
As depicted in figure 4.3, PMI varies greatly in terms of ROE after tax in comparison to its peer group. The
most significant difference can be detected in 2012, when PMI displayed a ROE of negative 512.2%. The
negative ROE measures reflected throughout the entire historical period of PMI, are distorted by negative
equity causing negative FGEAR. Since 2014, PMI’s levels have been kept fairly steady around negative 70.6%.
Running a deficit in relation to equity is not necessarily a sign of warning. If a company engages in share
repurchasing, eventually shareholder equity turns negative, this is referred to as the “good version” of negative
equity (Tako, 2018). PMI’s negative equity is the result of share repurchases in the past, which were partially
funded by debt. The interest coverage ratio, which will be further elaborated on in chapter six, is still kept

69
relatively high since PMI’s long-term debt is inexpensive (PMI, 2018). The company is therefore not
considered to be in a dangerous financial situation even though equity levels are negative. However, critics of
this view argues that negative shareholder equity implies that PMI is dependent on investors remaining in the
business, which is never a good trait for a dividend stock (Hargreaves, 2017).
Peers Imperial and BAT have more or less followed the same ROE levels during the historical period, with the
exception of 2017, when a sharp increase in BAT’s NBC caused ROIC to significantly decrease resulting in a
negative spread which affected its ROE negatively. BAT has however managed to recover some of its low
ROIC level and is back to a positive ROE ratio of 11.8%. With a ROE of 44.6% in 2018, Altria has
continuously during the historical period outplaced BAT, Imperial and PMI. This can mainly be contributed
to efficient use of its equity capital where the company pays less for its capital than what it generates in return.
Altia’s ROE has not been kept as steady as BAT and Imperial, however in 2018, it converged with Imperial
representing an average ratio 40.7%. As mentioned, ROE can be further dissected into three distinct ratios,
ROIC, spread and FGEAR, all components of the DuPont Model which will be elaborated upon in the below
sections.
4.3.1 Return on Invested Capital
Successful investments lead to increased earnings. ROIC is the rate of return a company makes above its costs
of debt and equity capital, and give a sense of how efficiently a company uses money to generate returns. In
other words, it measures how much profit a company generates for every dollar invested in the company and
is calculated as a ratio of NOPAT/Invested Capital.
ROIC is particularly useful when compared against the trend lines of peers and competitors (Stannard-
Stockton, 2016). As can be seen in the figure above, the average level of ROIC earned by the peers are
relatively high. On average, the seven-year average per peer ranges from 11.0% (Imperial) to 85.7% (Altria),
when Altria’s large negative ROIC in 2018 is excluded from the equation. Altria’s negative ROIC of -171.5%

70
in this year is likely due to its large investment in JUUL, which has not begun to generate returns at this point
in time.
Figure 4.3.1: Peer Group ROIC After Tax
Source: Author Illustration based on Data from Annual Reports 2012-2018
PMI experiences a 7-year ROIC average of 49.9%. Companies that earn this level of ROIC are generally
characterized by having a very strong set of competitive advantages (Stannard Stockton, 2016). The ROIC can
in turn be compared to the company WACC to determine whether it is creating or destroying value for its
shareholders (Petersen & Plenborg, 2012). This comparison is depicted in Figure 4.3.2 showcasing PMI’s
historical ROIC development in relation to WACC, showing that it has been creating great value for its
shareholders during all years and signaling high industry profitability.

71
Figure 4.3.2: ROIC vs. WACC
Source: Author Illustration Based on Data from PMI Annual Reports 2012-2018
4.3.1.1 Profit Margin
In order to thoroughly analyze the PM, it has to be separated into revenues and EBIT. The PM is calculated as
follows: EBIT/net revenue.
4.3.1.1.1 Revenue
To identify PMI’s revenue drivers and then model them is important in order to provide a thorough and
reasonable basis for the factors contributing to the company’s revenue streams. The drivers behind PMI’s
revenues are, when mathematically operated, contributors to change in revenue streams. Three main drivers
have been identified; including excise tax, volume and price. Even though excise taxes are not directly paid by
the individual consumer, it is passed onto to the consumer as it is included it in the product's price. Therefore,
it drives revenue, and is not considered as a cost.

72
4.3.1.1.1.1 Shipping Volume
As mentioned previously, PMI’s total shipping volume has decreased since 2012. The total shipping volume
decline can be depicted in the figure below. The average decrease amounts to approximately -2.8% per year.
The total decrease between 2012 and 2018 was 15.7%.
Figure 4.3.1.1.1: Total Shipping Volume
Source: Author Illustration Based on Data from PMI Annual Reports 2012-2018
4.3.1.1.1.2 Price
Declining revenues have often been partly offset by increase in prices. PMI discloses that it has been required
to continue to increase prices, to protect unfavorable changes in shipping volumes (PMI, 2018). The exact
price increase that has been performed per year is unknown, but one can compare the net revenues per year,
excluding excise taxes, with the shipping volume per year to get an idea of the price per unit. Although the net
revenue figure refers to more than solely unit and price, such as shipping, and handling charges billed to
customers, net of sales and promotion incentives (PMI, 2018), it is believed that the calculation will allow one
to make sense of the direction of price development. Assuming that the unit price is calculated by dividing the
shipping volume with net revenues excluding excise tax, the average increase of net revenues per product
shipped between 2012 and 2018 corresponds to 3.1%.
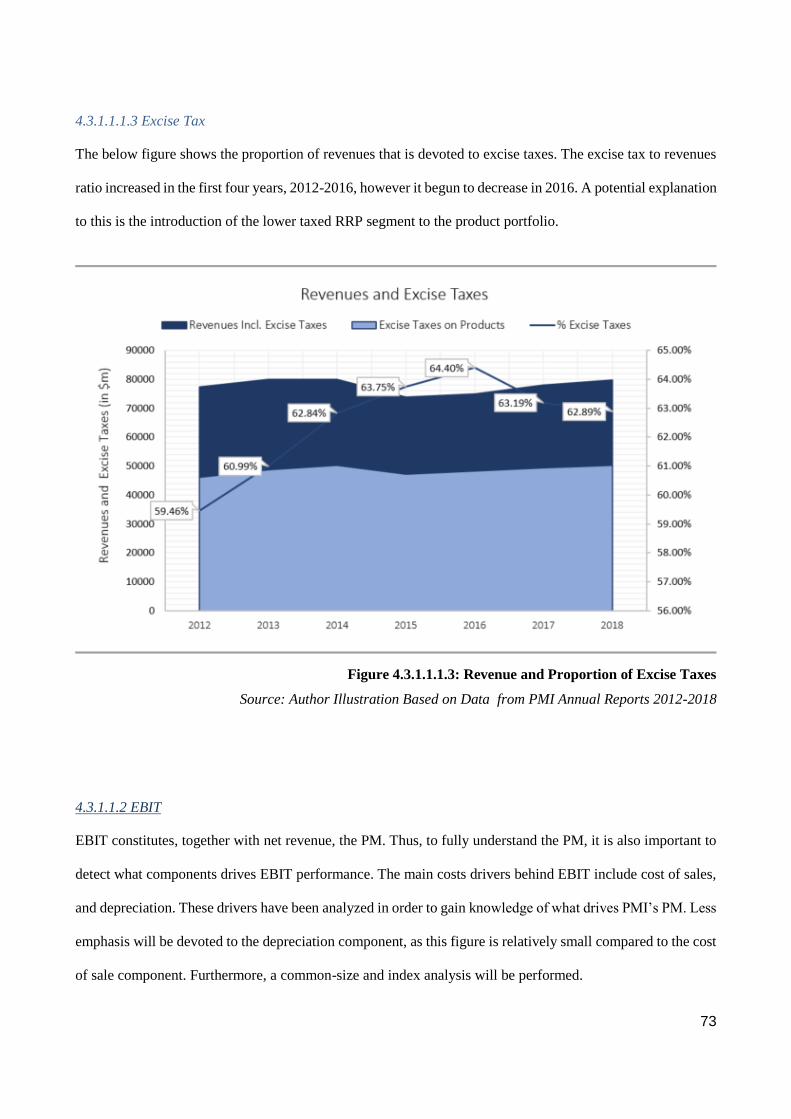
73
4.3.1.1.1.3 Excise Tax
The below figure shows the proportion of revenues that is devoted to excise taxes. The excise tax to revenues
ratio increased in the first four years, 2012-2016, however it begun to decrease in 2016. A potential explanation
to this is the introduction of the lower taxed RRP segment to the product portfolio.
Figure 4.3.1.1.1.3: Revenue and Proportion of Excise Taxes
Source: Author Illustration Based on Data from PMI Annual Reports 2012-2018
4.3.1.1.2 EBIT
EBIT constitutes, together with net revenue, the PM. Thus, to fully understand the PM, it is also important to
detect what components drives EBIT performance. The main costs drivers behind EBIT include cost of sales,
and depreciation. These drivers have been analyzed in order to gain knowledge of what drives PMI’s PM. Less
emphasis will be devoted to the depreciation component, as this figure is relatively small compared to the cost
of sale component. Furthermore, a common-size and index analysis will be performed.

74
4.3.1.1.2.1 Cost of Sales
While revenue has decreased by a total of -5.6% from 2012 to 2018, the proportion of COGS to net revenues
has increased from 33.1% in 2012, to 36.3% in 2018, affecting gross profit unfavorably. However, the cost of
sales has been held fairly stable throughout the years. PMI’s cost of sales consists primarily of tobacco leaf,
non-tobacco raw materials, labor and manufacturing costs, as well as cost of the IQOS devices produced by
third-parties in the years of 2016 and 2018 (PMI, 2018). When a higher cost of sales figure is reported, this is
mainly due to higher manufacturing costs, and unfavorable volume/mix. When the volume/mix leads to higher
cost of sales, it is most likely due to certain brands in the product portfolio being more expensive to produce.
In 2018, PMI reports increased cost efficiencies mainly due to lower tobacco leaf costs through better sourcing,
factory employee reductions, a more simplified combustible tobacco portfolio, and improved metrics for
material waste, tobacco yield and labor productivity. These efficiencies have, however, been partly offset due
to higher manufacturing costs. The cost of sales and net revenues figures are illustrated in the figure above, as
well as the proportion of cost of sales to net revenues.
Figure 4.3.1.1.2.1: Cost of Sales
Source: Author Illustration Based on Data from PMI Annual Reports 2012-2018
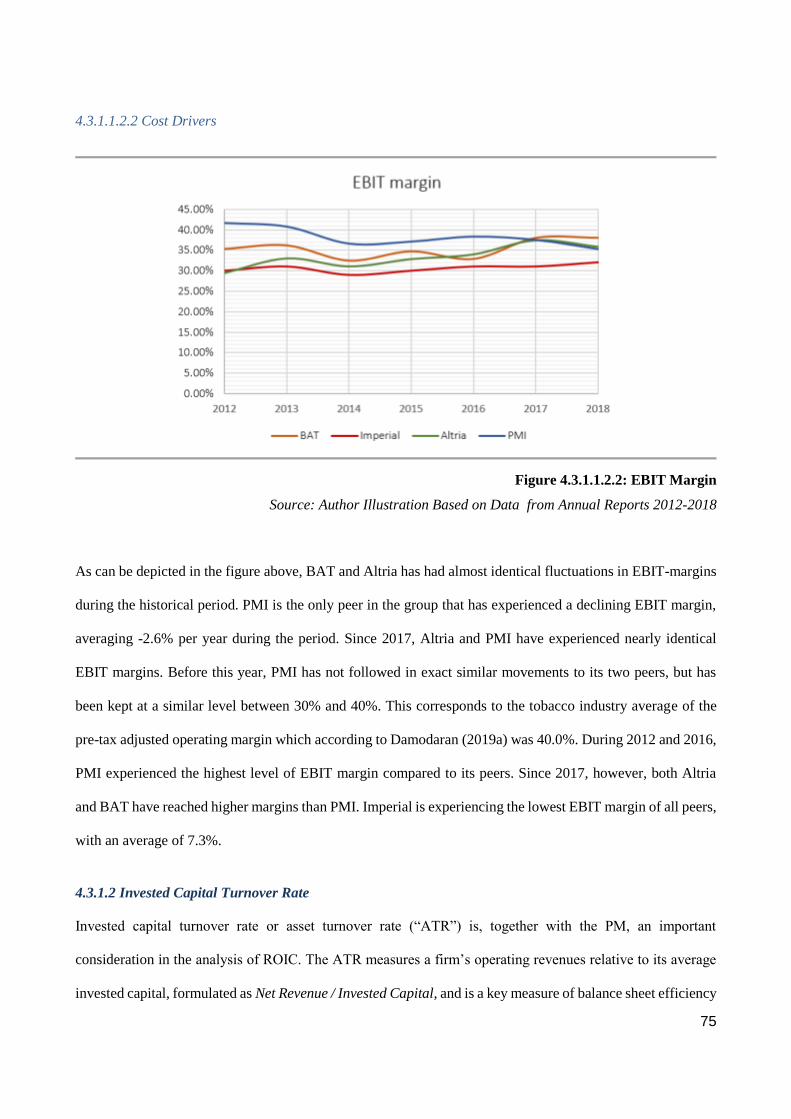
75
4.3.1.1.2.2 Cost Drivers
Figure 4.3.1.1.2.2: EBIT Margin
Source: Author Illustration Based on Data from Annual Reports 2012-2018
As can be depicted in the figure above, BAT and Altria has had almost identical fluctuations in EBIT-margins
during the historical period. PMI is the only peer in the group that has experienced a declining EBIT margin,
averaging -2.6% per year during the period. Since 2017, Altria and PMI have experienced nearly identical
EBIT margins. Before this year, PMI has not followed in exact similar movements to its two peers, but has
been kept at a similar level between 30% and 40%. This corresponds to the tobacco industry average of the
pre-tax adjusted operating margin which according to Damodaran (2019a) was 40.0%. During 2012 and 2016,
PMI experienced the highest level of EBIT margin compared to its peers. Since 2017, however, both Altria
and BAT have reached higher margins than PMI. Imperial is experiencing the lowest EBIT margin of all peers,
with an average of 7.3%.
4.3.1.2 Invested Capital Turnover Rate
Invested capital turnover rate or asset turnover rate (“ATR”) is, together with the PM, an important
consideration in the analysis of ROIC. The ATR measures a firm’s operating revenues relative to its average
invested capital, formulated as Net Revenue / Invested Capital, and is a key measure of balance sheet efficiency

76
(Petersen & Plenborg, 2012). A high ATR ratio does not itself make for a good investment. However, it
indicates that the higher a firm’s ATR ratio is, the lower the required NOPAT margin to earn an adequate
ROIC. Three general takeaways from the relationship between net revenue and invested capital include (1)
lower-margin firms need to be capital efficient; (2) more capital-intensive business need to be margin efficient;
and (3) high-margin, capital-light firms are capable of generating high ROICs (Trainer, 2017).
Figure 4.3.1.2: Invested Capital Turnover Rate (ATR)
Source: Author Illustration Based on Data from Annual Reports 2012-2018
As depicted in Figure 4.3.1.2, Imperial and PMI has trailed the same ATR ratio of 2 during the historical
period. BAT increased its revenues between 2016 and 2017, however not enough to fully offset the effect of a
substantial decrease in invested capital, resulting in a turndown of ATR as depicted in the figure. Altria is once
again the peer who deviates the most from industry average. The graph highlights an upswing of the ATR
between 2015 and 2016, however, in similarity to the graphs showcasing ROIC and spread, a downturn caused
by large fluctuations of invested capital has left Altria with a negative ATR.

77
4.3.1.2.1 Index and Common Size Analysis of Invested Capital
Figure 4.3.1.2.1: Invested Capital
Source: Author’s Illustration based on Peer Annual Reports 2012-2018
Figure 4.3.1.2.1 above illustrates the amount of capital invested between 2012 and 2018 by PMI and each
individual peer. Invested capital refers to the amount of money raised by a company through issuing securities
to equity shareholders and debt to bondholders (Investopedia, 2019b). As can be seen from the graph, the level
of capital invested by their bondholders and shareholders has followed a stable and predictable path for all
peers between the first four years, despite falling revenues.
Naturally, looking at invested capital in isolation causes the risk for misjudgment. For an investment to be
successful, it needs to ultimately create value for its shareholders. Whether the invested capital has been
effectively managed, one need to look at the ROIC. However, it is meaningful to understand the fluctuations
in invested capital. While BAT reported significantly higher capital investments in 2017, Altria has been
reducing its invested capital throughout the years. The large upswing in invested capital concerning BAT in
2017 can be explained by its acquisition of Reynolds American. The acquisition was financed through a

78
combination of existing cash resources, new bank credit lines and the issuance of new bonds, causing its long-
term borrowings to increase by more than 150% (BAT, 2017). Altria on the other hand, reporting negative net
debt as a result of its cash position, experiences negative invested capital in 2018. The negative value can also
be explained by the reported increase in investments assets, in JUUL and AB InBev. The relatively low value
of interest bearing liabilities, in comparison to the high values of investment assets, causes a negative invested
capital figure.
4.3.2 Spread
The spread is a component of ROE, and is calculated by subtracting the net borrowing cost (“NBC”) from
ROIC. The NBC of a firm is rarely equal to its borrowing rate, since NBC usually is affected by financial items
other than the interest costs. The spread represents the financial profitability of the firm in contrast to ROIC
which represents the operating profitability (Petersen & Plenborg, 2012). The spread which is expected to be
positive can become negative. For that reason, leverage fundamentally increases risk. The DuPont model helps
us visualize our strategic choice on leverage. A positive spread indicates debt is being used efficiently while a
negative spread indicates debt costs are likely too high. Multiplying spread by leverage and adding ROIC
yields ROE as follows: ROE= ROIC + (ROIC-NBC)* Financial Leverage (Newman & Briggeman, 2016).
Figure 4.3.2: Spread
Source: Author’s Illustration based on Peer Annual Reports 2012-2018
79
As depicted in Figure 4.3.2, PMI and its peer group all displayed positive relatively aligned spreads up until
2016, indicating debt was utilized efficiently. Imperial has fluctuated the least over the historical period
keeping a steady average of 16.0%. BAT and Imperial have trailed each other at similar levels, however BAT’s
spread was between 2016 and 2017 affected by a previously mentioned a sharp increase in NBC, lowering its
financial spread. PMI has also kept a steady level of spread representing an historical average of 52.3%. The
outlier in this case is Altria, which between the years of 2015-2016, increased its spread drastically due to an
increase in ROIC from 69.2% to 134.3% and a decrease in NBC from negative 3.7% to negative 99.6%. This
resulted in an upswing of the spread to 233.9%. However, from 2016 to 2018, Altria’s spread has decreased
mainly due to fluctuations in NBC from negative 99.6% to negative 1.0%.
4.3.3 Financial Gearing
The final component of ROIC is FGEAR, calculated as net interest-bearing debt (“NIBD”)/ book value of
equity (“BVE”), measuring the ratio of a firm’s debt and shareholder’s equity, that a firm uses to support its
operation. This ratio can be used to evaluate the risk of failure of a business. When there is a high proportion
of debt to equity, a business is said to be highly geared (Petersen & Plenborg, 2012). As can be seen in the
figure below, PMI is experiencing a negative FGEAR throughout 2012 and 2018. The explanation to this is
that PMI’s shareholders equity is negative. Altria is the only other peer in the group that has negative FGEAR
values, also stemming from negative shareholders equity. BAT is experiencing a fairly stable FGEAR figure,
averaging 0.78. Imperial’s FGEAR has been fluctuating over the period, from 1.29 being the lowest number
to 2.18 being the highest.

80
Figure 4.3.3: FGEAR
Source: Author’s Illustration based on Peer Annual Reports 2012-2018
4.4 DuPont Summary
The aim with this chapter was to answer the sub-question “Which key drivers have affected PMI’s historical
financial performance?”. The summarized findings can be found in Appendix 2 and the drivers marked in
green and are deemed the most influential thus creating the basis for the forecast in the subsequent chapter.
81
Chapter 5 - Forecasting
The forecasting chapter will be structured into forecast period and terminal growth, design of the pro forma
statements, income statement and balance sheet. All sections are depicted below and followed by an assessment
of the estimates which supports the pro forma statement.
5.1 Forecast Period and Terminal Growth
For the valuation of PMI, the two-stage DCF and EVA models will be applied, requiring an establishment of
a forecasting period. If the forecasting period includes too many years, the less certain and reliable the
assumptions become. The period must include as many years as would be covered by a typical business cycle
for the industry. The rates used are not required to be the same every year, however the chosen rate should be
aligned with the average. The steady growth rate which will be recovered from the first period of years will be
used to calculate the growth rate for the terminal period (Petersen & Plenborg, 2012). The period for the
valuation of PMI has been set to five years (2019-2023), and is believed to cover any swings in the market. It
also reflects the same forecasted period that many important organizations influencing the legislative and
political climate, such as the WHO, uses to forecast trends and set targets for cigarette prevention. With regards
to the terminal value, it should represent the long-term growth rate prospects of PMI and its surrounding
economy. The terminal value growth rate should not represent a growth above the GDP (Ibid.). As a
multinational company operating in 180 markets, PMI’s net revenues and operating income are affected by
various changes in currency exchange rates, inflation and growth rates. Hence, the long-term growth rate of
the global economy could be applied to reflect the terminal growth rate, which in 2019 is projected to moderate
from a downwardly revised 3% in 2018, to 2.9% in 2019 and 2.8% in 2020-21 when global trade gradually
slows (World Bank, 2019b). In addition, the risk-free rate can be used as a proxy for the nominal growth rate
of the economy and in order to avoid the issue of inflation, the United States government 10-year bond should
be applied (Damodaran, n.d.a). This choice of method is further supported by the fact that PMI’s revenues are
reported in U.S. dollars. The 10-year United States governmental bond was at 21/04/2019 2.56% (Bloomberg,

82
2019). Calculating the average of the long-term growth rate (2.8%) and the risk-free rate (2.56%) results in the
estimated discount growth rate of 2.68%, which will be applied in the forecast and valuation.
5.2 Pro Forma Statement Design
According to Petersen and Plenborg (2012), there are two different approaches to designing the pro forma
statement. In the first approach referred to as the ‘line-item approach’, every accounting item is forecasted
without accounting for the level of activity of the business. The second approach, referred to as the “sales-
driven approach”, uses investments and operating expenses to follow the sales growth. The latter approach,
being the most commonly used method, is argued to represent the strongest relationship between the firm’s
various activities. However, when considering some accounting posts of PMI, it becomes evident that this
approach is not always to most optimal to apply. When the average of some items would yield a forecast rate
that is above or below what seems reasonable, the line-item approach will instead be applied and elaborated
upon in the respective their respective sections.
5.3 Income Statement
The following section will attempt to forecast PMI’s most important income statement items. A sales-driven
approach will be applied, with some exceptions. This approach has been chosen based on the assumption that
operating expenses and investments are driven by the anticipated level of activity (Petersen & Plenborg, 2012).
5.3.1 Revenue Forecast
The estimation of future revenues is argued to be the most critical component of the forecast, as the other item
are believed to be directly related to the expected level of activity. In order to perform a reliable revenue
forecast, it is important to distinguish between combustible products and RRPs, examining each segments’
historical revenue growth. Furthermore, in terms of revenue, there are two main components to consider:
volume and price. The selling volume depends largely on the smoking prevalence, and cigarette consumption,
and the price component is further affected by excise tax.

83
5.3.1.1 Combustible Cigarettes
The revenue drivers forecast concerning combustible cigarettes have been based both on comparing PMI’s
historical trend in shipping volumes and on WHO estimates outlined in a comprehensive future tobacco trends
study. WHO has cooperated with a team of epidemiologists and biostatistician students from the University of
Newcastle, in Australia, and the University of Tokyo in Japan, to generate the underlying trend in tobacco
smoking (WHO, 2015a). The trend has been based on fitting a Bayesian meta-regression using a negative
binomial model, and the data for the analysis has been obtained using the WHO FCTC Implementation
Database, WHO Comprehensive Information Systems for Tobacco Control, WHO Infobase and from other
sources (Ibid.). Data has been provided per country, and each individual country estimates has been allocated
to fit PMI’s regional allocation. This is to account for assumed local and regional differences in terms of
shipping volumes, price increase/decrease and regional regulation, as the contribution per region to total
revenue differ.
5.3.1.1.1 Shipment Volume
The magnitude of the combustible cigarette shipment volume decreases in 2012-2018 varies between the
regions and ranges from -0.02% in European Union, to -6.7% in East Asia & Australia. Furthermore, between
2016 and 2018, the shipment volumes of combustible cigarettes have decreased at even higher rates, ranging
from -2.% in the European Union to -8.7% in the East Asia & Australia region.
These figures do not perfectly mirror WHO’s expectations in their WHO global report on trends in tobacco
smoking. Furthermore, WHO anticipates that the decrease of cigarette consumption will occur mainly in
developed economies, while the consumption will increase in developing economies (WHO, 2015a). For
example, it was forecasted that the global cigarette consumption in Africa and Middle East would increase by
35.7% between the years 2010-2025 (Ibid.), representing a straight-line annual increase of 2.4%. WHO further
expects cigarette prevalence to decrease by 22.4% in the European Union, between 2010-2025, translating into
a straight-line annual decrease of 1.5% (Ibid.). In all regions, except the European Union, PMI’s regional
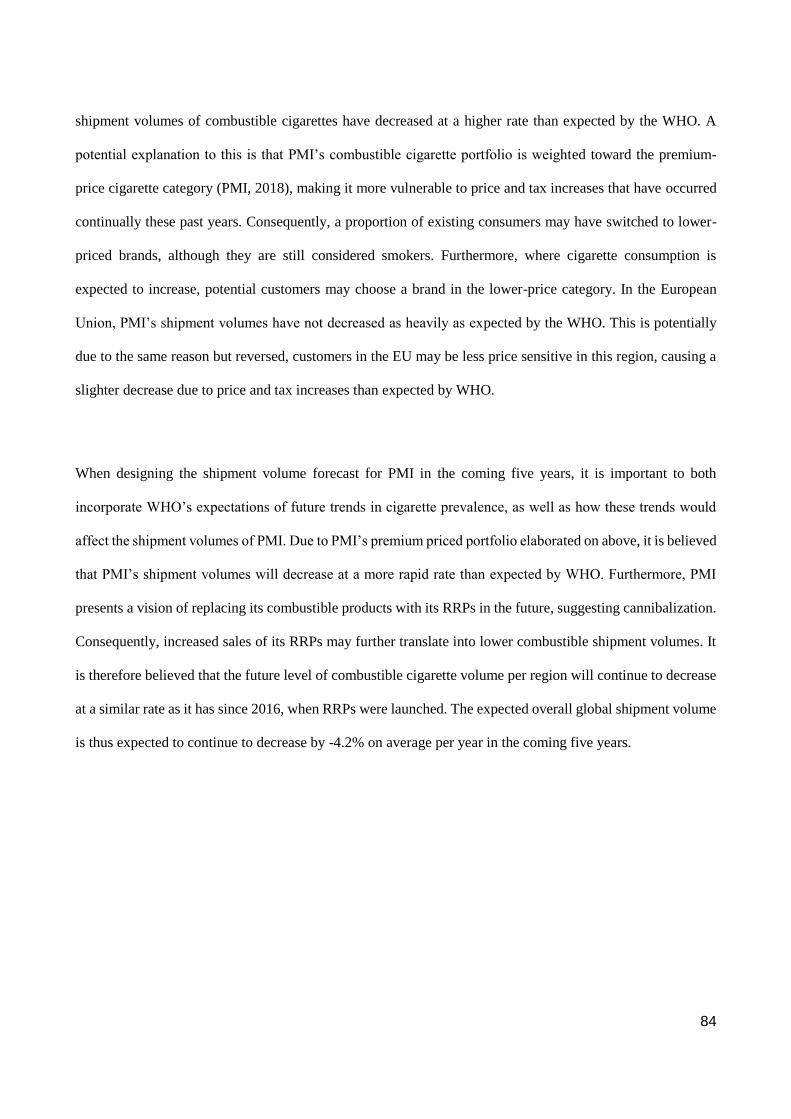
84
shipment volumes of combustible cigarettes have decreased at a higher rate than expected by the WHO. A
potential explanation to this is that PMI’s combustible cigarette portfolio is weighted toward the premium-
price cigarette category (PMI, 2018), making it more vulnerable to price and tax increases that have occurred
continually these past years. Consequently, a proportion of existing consumers may have switched to lower-
priced brands, although they are still considered smokers. Furthermore, where cigarette consumption is
expected to increase, potential customers may choose a brand in the lower-price category. In the European
Union, PMI’s shipment volumes have not decreased as heavily as expected by the WHO. This is potentially
due to the same reason but reversed, customers in the EU may be less price sensitive in this region, causing a
slighter decrease due to price and tax increases than expected by WHO.
When designing the shipment volume forecast for PMI in the coming five years, it is important to both
incorporate WHO’s expectations of future trends in cigarette prevalence, as well as how these trends would
affect the shipment volumes of PMI. Due to PMI’s premium priced portfolio elaborated on above, it is believed
that PMI’s shipment volumes will decrease at a more rapid rate than expected by WHO. Furthermore, PMI
presents a vision of replacing its combustible products with its RRPs in the future, suggesting cannibalization.
Consequently, increased sales of its RRPs may further translate into lower combustible shipment volumes. It
is therefore believed that the future level of combustible cigarette volume per region will continue to decrease
at a similar rate as it has since 2016, when RRPs were launched. The expected overall global shipment volume
is thus expected to continue to decrease by -4.2% on average per year in the coming five years.
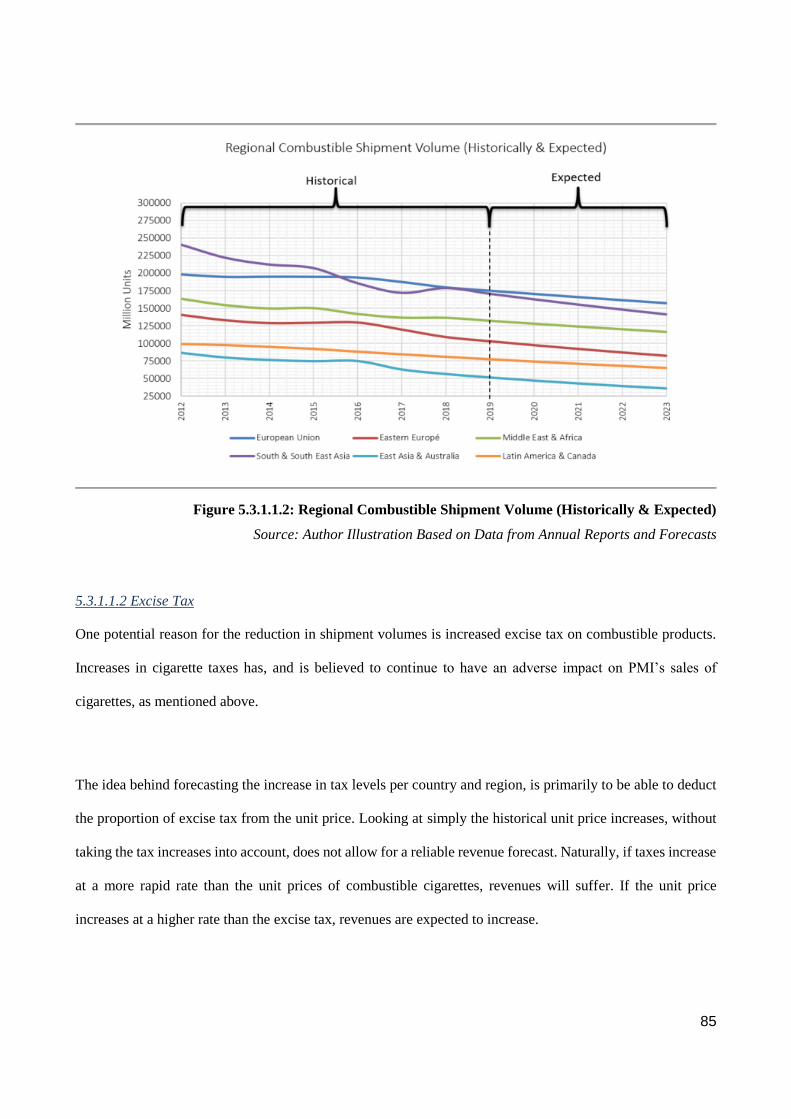
85
Figure 5.3.1.1.2: Regional Combustible Shipment Volume (Historically & Expected)
Source: Author Illustration Based on Data from Annual Reports and Forecasts
5.3.1.1.2 Excise Tax
One potential reason for the reduction in shipment volumes is increased excise tax on combustible products.
Increases in cigarette taxes has, and is believed to continue to have an adverse impact on PMI’s sales of
cigarettes, as mentioned above.
The idea behind forecasting the increase in tax levels per country and region, is primarily to be able to deduct
the proportion of excise tax from the unit price. Looking at simply the historical unit price increases, without
taking the tax increases into account, does not allow for a reliable revenue forecast. Naturally, if taxes increase
at a more rapid rate than the unit prices of combustible cigarettes, revenues will suffer. If the unit price
increases at a higher rate than the excise tax, revenues are expected to increase.
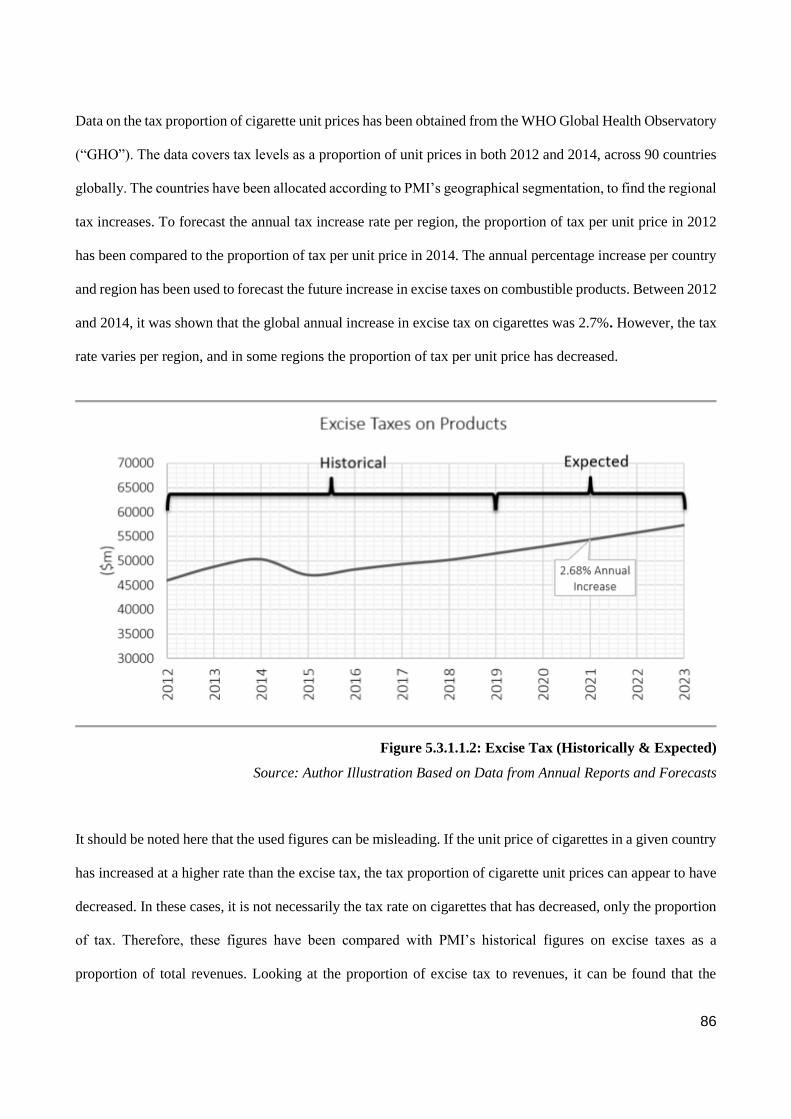
86
Data on the tax proportion of cigarette unit prices has been obtained from the WHO Global Health Observatory
(“GHO”). The data covers tax levels as a proportion of unit prices in both 2012 and 2014, across 90 countries
globally. The countries have been allocated according to PMI’s geographical segmentation, to find the regional
tax increases. To forecast the annual tax increase rate per region, the proportion of tax per unit price in 2012
has been compared to the proportion of tax per unit price in 2014. The annual percentage increase per country
and region has been used to forecast the future increase in excise taxes on combustible products. Between 2012
and 2014, it was shown that the global annual increase in excise tax on cigarettes was 2.7%. However, the tax
rate varies per region, and in some regions the proportion of tax per unit price has decreased.
Figure 5.3.1.1.2: Excise Tax (Historically & Expected)
Source: Author Illustration Based on Data from Annual Reports and Forecasts
It should be noted here that the used figures can be misleading. If the unit price of cigarettes in a given country
has increased at a higher rate than the excise tax, the tax proportion of cigarette unit prices can appear to have
decreased. In these cases, it is not necessarily the tax rate on cigarettes that has decreased, only the proportion
of tax. Therefore, these figures have been compared with PMI’s historical figures on excise taxes as a
proportion of total revenues. Looking at the proportion of excise tax to revenues, it can be found that the
87
relative proportion of tax has increased throughout the years, with an average increase of 1.0% between the
years 2012-2018. Before the PMI’s RRP launch, the excise tax increase was nearly 2.0% annually, between
2012-2016. A potential explanation to the diminishing excise tax increase could be that these products are not
taxed as heavily. Taxes are believed to continue to increase globally, and to do so at a higher rate than it
historically has. Therefore, the figures presented by WHO will be applied when forecasting the increase in
global excise tax levels.
5.3.1.1.3 Price
Similar to taxes which have increased at a steady rate in many markets, so has the unit price for combustible
cigarettes. Moreover, price increases have been applied gradually to the product portfolio, to avoid a price
jump when government taxes are excise. Analyzing the data obtained WHO Global Health Observatory
(GHO), it was found that the average price increase including taxes, between 2012 and 2014, was 6.94%,
excise taxes included. Deducting the identified average tax increase during this period, amounting to 2.7%
between 2012 and 2014, it can be assumed that the “clean price” increase was approximately 4.3% between
the same years.
By dividing PMI’s revenues excluding excise taxes with its corresponding shipping volume in the years of
2012 to 2018, one can see that the relative revenue per unit has increased throughout the years. It is
acknowledged that there are more factors influencing these figures, as the figures are fluctuating. However, as
the average increase between 2012 and 2018 in revenue excluding excise taxes relative to shipping volumes is
3.1%, it is concluded that the figure of a clean price increase of 4.3% is not inappropriate, especially since the
price increase was significantly higher than 3.1% in the final three years. Therefore, it is assumed that the clean
price increase will continue to rise by this percentage in the coming five years.
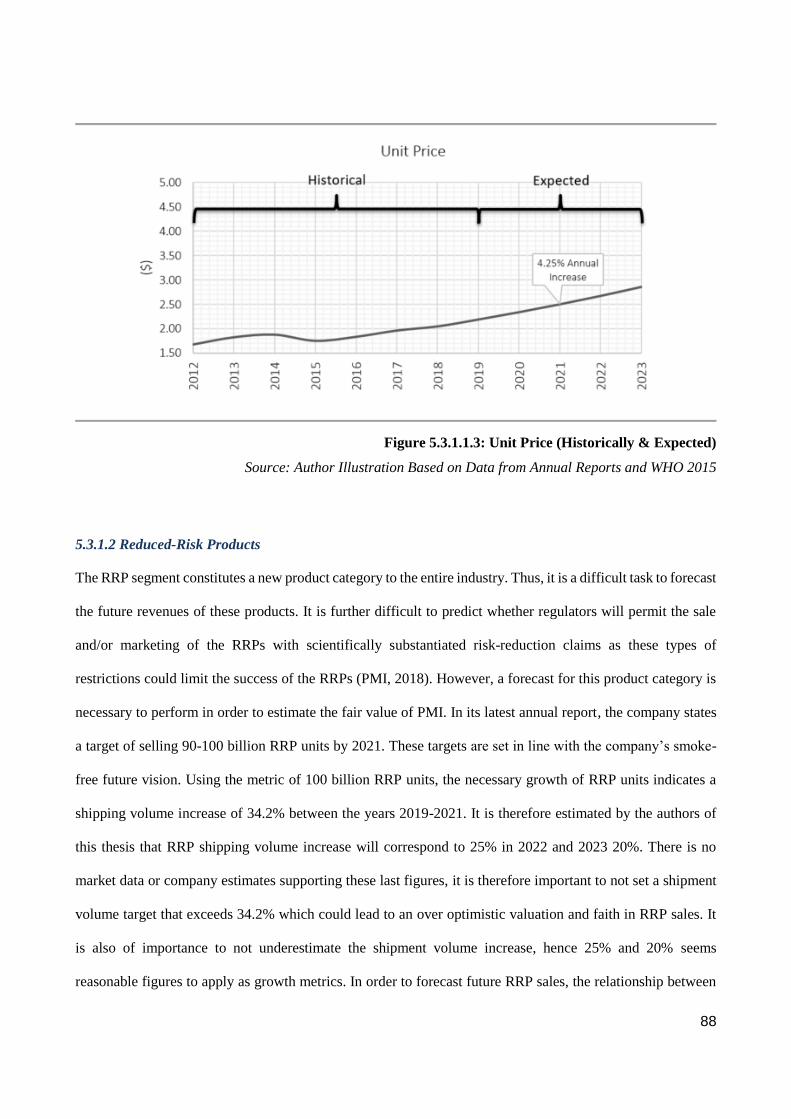
88
Figure 5.3.1.1.3: Unit Price (Historically & Expected)
Source: Author Illustration Based on Data from Annual Reports and WHO 2015
5.3.1.2 Reduced-Risk Products
The RRP segment constitutes a new product category to the entire industry. Thus, it is a difficult task to forecast
the future revenues of these products. It is further difficult to predict whether regulators will permit the sale
and/or marketing of the RRPs with scientifically substantiated risk-reduction claims as these types of
restrictions could limit the success of the RRPs (PMI, 2018). However, a forecast for this product category is
necessary to perform in order to estimate the fair value of PMI. In its latest annual report, the company states
a target of selling 90-100 billion RRP units by 2021. These targets are set in line with the company’s smoke-
free future vision. Using the metric of 100 billion RRP units, the necessary growth of RRP units indicates a
shipping volume increase of 34.2% between the years 2019-2021. It is therefore estimated by the authors of
this thesis that RRP shipping volume increase will correspond to 25% in 2022 and 2023 20%. There is no
market data or company estimates supporting these last figures, it is therefore important to not set a shipment
volume target that exceeds 34.2% which could lead to an over optimistic valuation and faith in RRP sales. It
is also of importance to not underestimate the shipment volume increase, hence 25% and 20% seems
reasonable figures to apply as growth metrics. In order to forecast future RRP sales, the relationship between
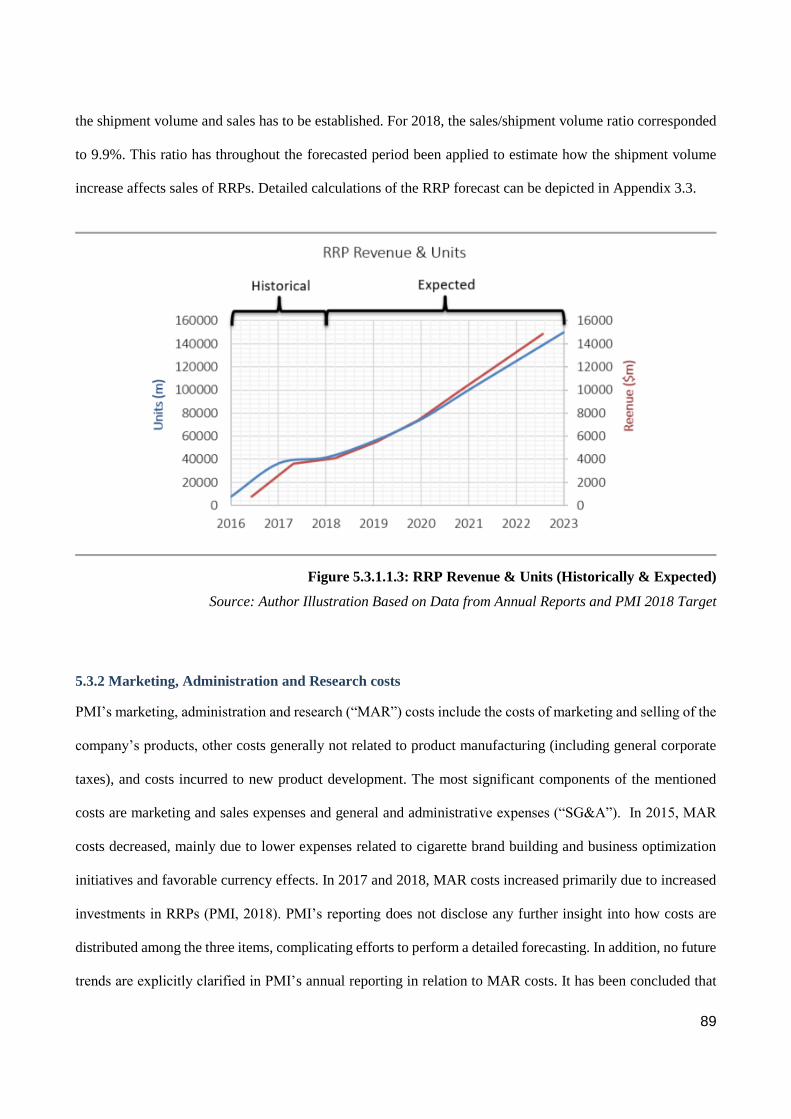
89
the shipment volume and sales has to be established. For 2018, the sales/shipment volume ratio corresponded
to 9.9%. This ratio has throughout the forecasted period been applied to estimate how the shipment volume
increase affects sales of RRPs. Detailed calculations of the RRP forecast can be depicted in Appendix 3.3.
Figure 5.3.1.1.3: RRP Revenue & Units (Historically & Expected)
Source: Author Illustration Based on Data from Annual Reports and PMI 2018 Target
5.3.2 Marketing, Administration and Research costs
PMI’s marketing, administration and research (“MAR”) costs include the costs of marketing and selling of the
company’s products, other costs generally not related to product manufacturing (including general corporate
taxes), and costs incurred to new product development. The most significant components of the mentioned
costs are marketing and sales expenses and general and administrative expenses (“SG&A”). In 2015, MAR
costs decreased, mainly due to lower expenses related to cigarette brand building and business optimization
initiatives and favorable currency effects. In 2017 and 2018, MAR costs increased primarily due to increased
investments in RRPs (PMI, 2018). PMI’s reporting does not disclose any further insight into how costs are
distributed among the three items, complicating efforts to perform a detailed forecasting. In addition, no future
trends are explicitly clarified in PMI’s annual reporting in relation to MAR costs. It has been concluded that

90
applying a strict sales driven approach to the MAR costs will be insufficient. Hence, a more careful line-item
analysis will be performed in the following sections.
5.3.2.1 Research and Development
Research and Development (“R&D”) expenses vary across companies and product fields, depending upon the
stage in the life cycle, higher investments are required in earlier stages. The tobacco industry has historically
been the sector characterized by the least amount of R&D activity (Görg & Strobl, 2005). However, as PMI
moves towards its vision of a smoke-free future, the importance of R&D activity increases substantially. R&D
expense for the RRP portfolio accounted for 92%, 74% and 72% of the company’s total R&D expenses for the
years ended December 31, 2018, 2017 and 2016, respectively (PMI, 2018). Consequently, it can be concluded
that the main driver behind R&D expenditures is RRP investments, while combustible cigarettes are given
little attention. In the forecast, 92% of MAR costs are believed to stem from R&D expenses in the next five
coming years. PMI attributes its success in the smoke-free and e-cigarette category to sustained R&D
investments and there are clear signs of further commitment to invest in RRPs as PMI moves towards its
smoke-free future initiative (Ibid.). R&D expense can be forecasted as a percentage of revenue, and in the case
of PMI, close to all R&D spending is related to the RRP product segment. Thus, the total RRP revenues will
be used as a proxy when forecasting future R&D expenditures. The company has since 2008 invested $6 billion
into R&D, indicating average yearly investments of over $545 million, representing 13.3% of total RRP
revenues and 8.10% of total MAR costs in 2018. It is important to note that this is an average, meaning,
investments could have accelerated in the last years, understating the 2018 R&D spending ratio of 13.3%. Still
in the early stages of the RRP business cycle, R&D costs are assumed to further increase. Although PMI has
made no future projections or publicly committed to a specific amount of spending, it is assumed that R&D
spending will continue to account for 12% in 2019 of total RRP sales and is expected to decrease by 1% per
year in the following four years. This is because it is expected that less R&D expenses are needed to grow the
RRP segment.

91
5.3.2.2 Selling, General & Administrative Expenses
Tobacco control seeks to end tobacco product marketing, blocking all media including store counters and
packaging. Tobacco companies typically responds to marketing restrictions by reallocating resources to the
remaining open channels. As of 2016, 15% of the world’s population were covered by the WHO FCTC’s best
practice policy banning tobacco advertising, promotion and sponsorship (Tobacco Atlas, 2019c). However,
PMI operates in markets not covered by the policy, making it difficult to claim that marketing expenditures
will be reduced any time soon. In addition, there is also a broader marketing scope for RRPs, which can be
promoted in channels that are closed off for combustible products (Ibid.). Excluding the selling and marketing
components, the general and admin (“G&A”) expense tends to be somewhat fixed because it includes senior
management and support staff like HR and finance departments. Consequently, it is forecasted that G&A will
not contribute to the growth of total MAR expenses. Hence, some operating leverage can be achieved from the
G&A expense. As R&D expenses accounts for 8.10% of total MAR costs, it is assumed that SG&A expenses
contribute to the remaining expenses, thus recognizing PMI’s reporting of how SG&A expenses are the most
significant components of the MAR costs (PMI, 2018).
In conclusion, MAR costs are expected to increase mainly driven by increased R&D and marketing
expenditures related to RRPs as well as increased marketing expenditures in target markets where anti-smoking
policies and regulations are weak or have not been enforced. The historical figures, as well as an illustration
of forecasted expenses, can be seen below. The forecast concerning both R&D and SG&A costs can be found
more in detail in Appendix 3.6.

92
Figure 5.3.2.2: SG&A and MAR Expenses (Historically & Expected)
Source: Author Illustration Based on Data from PMI Annual Reports
5.3.3 Amortization
Pre-tax amortization expense for intangible assets during the years ended December 31, 2018, 2017 and 2016,
was $82 million, $88 million and $74 million, respectively. Amortization expense for each of the next five
years is estimated to be $82 million or less, assuming no additional transactions occur that require the
amortization of intangible assets (PMI, 2018). Since PMI has estimated amortization costs for the next five
years, the sales-driven approach representing a 0.45% change will be applied here.
5.3.4 Depreciation
Since 2012, fluctuations in the ratio depreciation/total non-current operating assets, have been kept steady.
PMI depreciates property, plant and equipment using the straight-line method over the estimated useful lives
of the company’s assets. Machinery and equipment are depreciated over periods ranging between 3-15 years
while buildings and building improvements over periods up to 40 years. In conclusion, depreciation will be
forecasted using the sales-driven approach applying the average of 4.04%.

93
5.3.5 Asset Impairment
Historically, up until 2015, PMI accounted for asset impairment and exit costs. No forecast will be attempted
for this post in the budgeting period since it has not been accounted for in the last three fiscal years of reporting.
5.3.6 Tax
In December 2017, the most sweeping tax legislation since the Tax Reform Act of 1986 was signed into law
in the United States significantly reducing the income tax rate for corporation from 35% to 21% (PMI, 2018).
Thus, tax on net financial items applied in the budgeting period as well as in the terminal period is 21%.
5.4 Balance Sheet
The following section will attempt to forecast PMI’s most important balance sheet items. A sales-driven
approach will be applied. In the case of PMI there will be no exceptions to this approach as it is assumed that
all balance sheet items are directly correlated to revenue fluctuations.
5.4.1 Non-current Operating Assets
Non-current operating assets include Property, plant and equipment (“PPE”), Goodwill, Other intangible
assets, Deferred income taxes and Other assets. The following sections presents more detailed information
concerning the three most financially contributing assets. Forecasts for all items are based on their historical
proportion of net revenues.
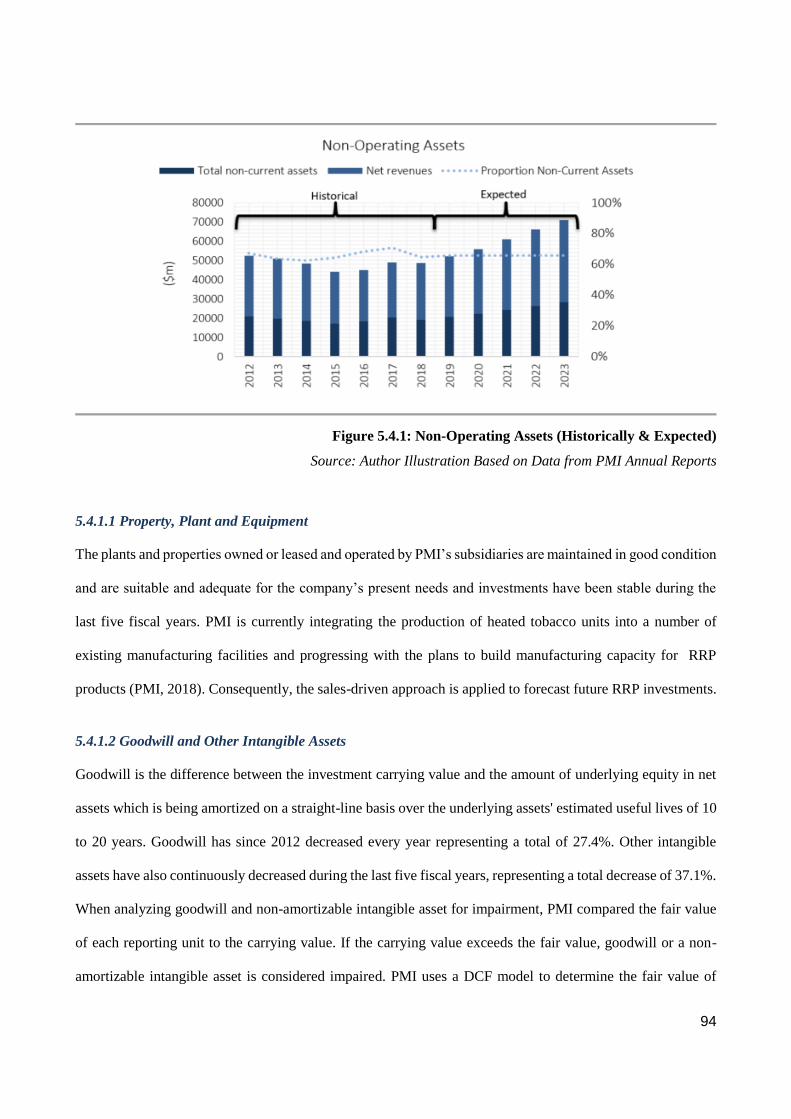
94
Figure 5.4.1: Non-Operating Assets (Historically & Expected)
Source: Author Illustration Based on Data from PMI Annual Reports
5.4.1.1 Property, Plant and Equipment
The plants and properties owned or leased and operated by PMI’s subsidiaries are maintained in good condition
and are suitable and adequate for the company’s present needs and investments have been stable during the
last five fiscal years. PMI is currently integrating the production of heated tobacco units into a number of
existing manufacturing facilities and progressing with the plans to build manufacturing capacity for RRP
products (PMI, 2018). Consequently, the sales-driven approach is applied to forecast future RRP investments.
5.4.1.2 Goodwill and Other Intangible Assets
Goodwill is the difference between the investment carrying value and the amount of underlying equity in net
assets which is being amortized on a straight-line basis over the underlying assets' estimated useful lives of 10
to 20 years. Goodwill has since 2012 decreased every year representing a total of 27.4%. Other intangible
assets have also continuously decreased during the last five fiscal years, representing a total decrease of 37.1%.
When analyzing goodwill and non-amortizable intangible asset for impairment, PMI compared the fair value
of each reporting unit to the carrying value. If the carrying value exceeds the fair value, goodwill or a non-
amortizable intangible asset is considered impaired. PMI uses a DCF model to determine the fair value of

95
goodwill and the intangible assets, supported by the market approach using earnings multiples of comparable
global and local companies within the tobacco industry. These DCF models include management assumptions
not attainable as external information. Since the spin-off from Altria in 2008, PMI has not recorded a charge
to earnings for an impairment of goodwill or non-amortizable intangible assets. In conclusion, a sales-driven
approach will be applied to forecast future goodwill and other intangible assets.
5.4.2 Net Working Capital
Net working capital (“NWC”) expressed as total current operating assets less total current operating liabilities,
excluding non-operating items, such as excess cash and short-term debt. PMI’s current operating assets consist
of receivables, deferred income taxes, inventory, and other current assets. Current operating liabilities consist
of accounts payable, borrowings, income taxes, accrued liabilities, and deferred income taxes. The NWC will
be forecasted on a total base, mainly because available information regarding the different items is scarce. In
addition, as the purpose of the forecast is to predict long-term earning, Petersen and Plenborg (2012) deems a
more aggregated value set-up to be the best suitable option. PMI has for the last five fiscal years had an average
yearly NWC of 3.8% with no large fluctuations excluding the year in 2013 when NWC was 1.3%. The average
of 3.8% will be applied for the forecasted years, thus using the sales-driven approach driven by PMI’s net
revenue development.
5.4.3 Liabilities
The forecast of NIBD has been done in relation to invested capital. When forecasting the future NIBD ratio, a
sales driven approach will be applied. However, the seven-year historical average will not be applied, since
the ratios in 2012 and 2013 results in a skewed yearly average of 160.5%. Instead, the five-year historical
average will be applied resulting in a yearly average of 175%. Net borrowing costs (“NBC”) are calculated as
net financial items after tax divided by NIBD. The NBC have been kept steady throughout the historical period
and there are no outliers skewing the average. Thus, when forecasting NBC, the sales-driven approach will be
applied, representing a yearly average of negative 2.5%.

96
5.5 Forecasting Summary
By forecasting income statement and balance sheet items in this chapter, the question “Which are the
supporting arguments determining the forecast for the income statement and balance sheet items?” have been
answered.

97
Chapter 6 - Cost of Capital
When investing monetary funds into a firm, both equity and debt investors require a compensation for the risk
related to the investment. The required rate of return is equal to the firm's cost of capital which mirrors the
alternative return investors expect from another investment with equal risk. This cost of capital, also referred
to as the WACC, is applied to discount the forecasted future cash flows and comprise namely of cost of debt
(rd), cost of equity (re), and the industry’s average capital structure (Petersen & Plenborg, 2012). The WACC
formula is calculated as depicted below and the components of the formula will be further elaborated in the
following sections.
6.1 Capital Asset Pricing Model
The generally and widely accepted model for calculating cost of equity is the Capital Asset Pricing Model
(“CAPM”). The model includes four components: the risk-free rate (rf), the systematic risk (b), and the market
risk premium (rm). All three components will be further elaborated in the following sections.
6.1.1 Risk-free Rate
The risk-free rate (rf) represents the return expected when investing in a risk-free asset with no risk of default.
However, no investment is fully free from risk in real capital markets. Classic economic theory upholds that
at any point in time, the real risk-free rate of return is relatively stable, but the inflation element and the level
of risk anticipated will cause the total investment return to fluctuate. Although no investment is fully free from
risk in real capital markets, a zero-coupon government bond corresponding to the forecasted horizon can be
applied as a proxy for the risk-free rate. Ideally, each cash flow should be discounted applying a bond with the
98
same maturity as the cash flow. This method calls for complex calculations, making it more common for
practitioners to choose a single government bond with a maturity best corresponding the cash flow stream
being valued. Petersen and Plenborg (2012) suggest using bonds denominated in the same currency as the
discounted cash flows. Thus, based on considerations outlined in this section, a 10-year United States
governmental bond will be applied which at 21/04/2019 had a yield of 2.56% (Bloomberg, 2019).
6.1.2 Systematic Risk
Beta can be explained as the covariation between the return of an individual stock and the return of the given
market portfolio. It is used as a proxy in the CAPM model for the systematic risk of the stock, and it is used to
measure how risky the assets are relative to the market risk (Petersen & Plenborg, 2012.). The beta value of a
portfolio can have several interpretations. A beta equal to one suggests that the share price fluctuates in a
perfect correlation with the market portfolio, thus indicating that a portfolio with a high beta is more volatile
than the market portfolio (Ibid.). Consequently, investors would demand a greater rate of return, as a higher
level of risk is implied. Furthermore, a beta equal to zero suggest that the portfolio or stock is uncorrelated
with the market return, and a beta greater than one or less than zero suggest that the portfolio has a positive
correlation with the market or an inverse correlation with the market, respectively (CFI, 2019; Petersen &
Plenborg, 2012). In the following sections, three of the most frequently used approaches will be applied to
determine the applied average levered beta; the regression method, the industry average method, and the
comparable firms method. The average of these three betas will later be calculated to assure that any
measurements of errors associated with the different approaches are accounted for (Peterson & Plenborg, 2012;
Damodaran, 1999).
6.1.2.1 Beta Estimation – Regression Method
One of the most used methods of measuring a company’s beta is by regressing its returns against the returns
of a certain stock index, with the slope of the regression being the beta (Damodaran, 1999). Despite being one
of the most applied beta measurements, the regressed beta does contain a number of limitations. First, in terms
99
of the time frame chosen, it is important to notice the tradeoff involved when choosing a short period versus a
broader one. Applying a broad time frame includes more observations than a narrower time frame, which could
serve as an advantage (Ibid.). However, this could be offset by the potential changes in characteristics of the
business over time (Ibid.). For PMI and its peers, the two-year betas have been compared to the seven-year
betas, and no considerable difference has been detected. Thus, the seven-year betas have been applied.
In addition, while the CAPM formula projects ex-ante values for beta a regression model uses ex-post data,
assuming that historical figures can be used for future estimations of beta. This is a limitation for the same
reason as the one elaborated on above; companies commonly change their strategies and acquires new
businesses over time, implying that both operational and financial risk may differ over time (Petersen &
Plenborg, 2012).
The second measurement issue is the choice of a return interval. Betas estimated using daily or weekly returns
are likely to have a significant bias. Naturally, if measuring on daily returns, the trading volumes will be lower.
This can also be referred to as the non-trading problem, and occurs when stocks suffer from illiquidity and low
trading volumes (Ibid.). In these cases, the true underlying risk might not be reflected in the regressed beta; for
example, illiquid firms may report lower betas than they really should whereas liquid firms report higher betas
than justified (Damodaran, 1999). PMI and its peers have been listed for more than three years, monthly returns
are applied and should provide sufficient observations for estimating beta (Ibid.).
The S&P 500 Index will be used when regressing the beta of PMI, and its peers, returns. The S&P 500 Index
is widely regarded as being the best single instrument of large-cap U.S. equities, and includes 500 leading
companies, capturing approximately 80% coverage of the available market capitalization (Bloomberg, 2019).
Furthermore, although it includes fewer stocks than the NYSE composite or the Wilshire 5000, it has an
advantage over those indices because it is market weighted, and it includes the 500 largest firms (Damodaran,
100
1999.). However, although PMI is a U.S-registered company, the majority of its operations are based in other
parts of the world. Therefore, one could assume that the index is inappropriate. However, as many U.S.
corporations operate globally, global market events and economic shocks can widely influence S&P 500
companies, and therefore the overall index performance.
The monthly interval, 7-year time frame, and measurement against the S&P 500 Index resulted in an averaged
levered beta of 1.02. Furthermore, using the average seven-year capital structure (D/E ratio of 17.69%), the
unlevered beta results in a beta value of 0.89.
6.1.2.2 Beta Estimation – Industry Average
The industry average approach obtains a comparable levered beta from an industry average that best mimics
the current business of the private company. The beta is based on an extensive data set of several firm betas,
mitigating the negative effect of sourcing and measurement errors often found in beta estimations based on the
regression methods (Brealey et al., 2006). The dataset used was the total betas by sector for computing private
company cost of equity compiled by professor Damodaran (2019b) at NYU. The tobacco industry average
comprised 17 firms with a levered beta of 1.29 (unlevered 1.13).
6.1.2.3 Beta Estimation – Comparable Firms
The comparable firms approach considers the beta average of the peer group. Under the assumption that
markets are efficient, that the peers have the same operational risk i.e. the same beta and that the peer’s shares
are traded at a sufficient volume, the liquidity and observation problem associated with the regression method
can be eliminated (Petersen & Plenborg, 2012). The peer company’s unlevered and levered betas have been
calculated by applying the regression method. The results from the peer regressions have been compared to
data retrieved from Infront Analytics, confirming the validity of betas calculated. The unlevered betas were
used to eliminate the impact of the diverse capital structures of the peers. In addition, the average beta of the
peers has been re-levered against PMI’s target capital structure, offering a beta of 0.58. More details of beta
calculations can be found in Appendix 6.5.
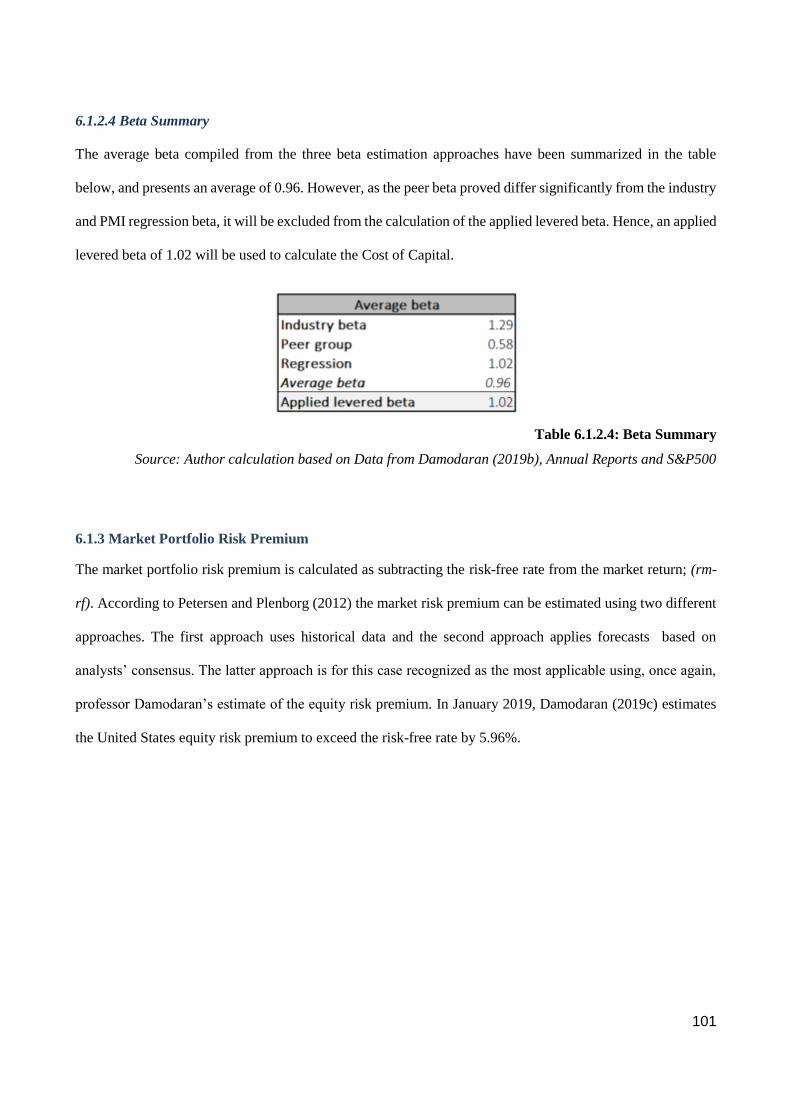
101
6.1.2.4 Beta Summary
The average beta compiled from the three beta estimation approaches have been summarized in the table
below, and presents an average of 0.96. However, as the peer beta proved differ significantly from the industry
and PMI regression beta, it will be excluded from the calculation of the applied levered beta. Hence, an applied
levered beta of 1.02 will be used to calculate the Cost of Capital.
Table 6.1.2.4: Beta Summary
Source: Author calculation based on Data from Damodaran (2019b), Annual Reports and S&P500
6.1.3 Market Portfolio Risk Premium
The market portfolio risk premium is calculated as subtracting the risk-free rate from the market return; (rm-
rf). According to Petersen and Plenborg (2012) the market risk premium can be estimated using two different
approaches. The first approach uses historical data and the second approach applies forecasts based on
analysts’ consensus. The latter approach is for this case recognized as the most applicable using, once again,
professor Damodaran’s estimate of the equity risk premium. In January 2019, Damodaran (2019c) estimates
the United States equity risk premium to exceed the risk-free rate by 5.96%.
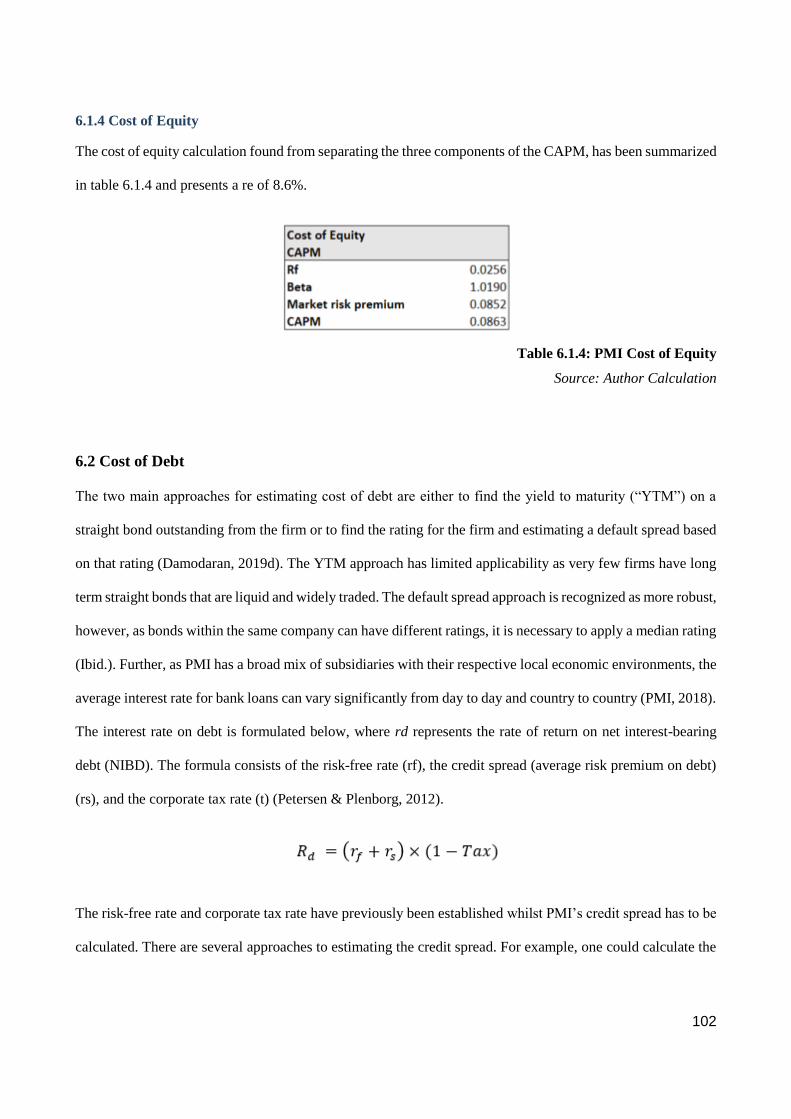
102
6.1.4 Cost of Equity
The cost of equity calculation found from separating the three components of the CAPM, has been summarized
in table 6.1.4 and presents a re of 8.6%.
Table 6.1.4: PMI Cost of Equity
Source: Author Calculation
6.2 Cost of Debt
The two main approaches for estimating cost of debt are either to find the yield to maturity (“YTM”) on a
straight bond outstanding from the firm or to find the rating for the firm and estimating a default spread based
on that rating (Damodaran, 2019d). The YTM approach has limited applicability as very few firms have long
term straight bonds that are liquid and widely traded. The default spread approach is recognized as more robust,
however, as bonds within the same company can have different ratings, it is necessary to apply a median rating
(Ibid.). Further, as PMI has a broad mix of subsidiaries with their respective local economic environments, the
average interest rate for bank loans can vary significantly from day to day and country to country (PMI, 2018).
The interest rate on debt is formulated below, where rd represents the rate of return on net interest-bearing
debt (NIBD). The formula consists of the risk-free rate (rf), the credit spread (average risk premium on debt)
(rs), and the corporate tax rate (t) (Petersen & Plenborg, 2012).
The risk-free rate and corporate tax rate have previously been established whilst PMI’s credit spread has to be
calculated. There are several approaches to estimating the credit spread. For example, one could calculate the

103
median rating from the credit ratings of three well-known credit institutions, found in PMI’s annual reports
and depicted in table 6.2.
Table 6.2: Credit Ratings
Source: PMI, 2018
Another approach is to calculate a synthetic credit rating by applying the financial characteristics of the firm
to estimate an interest coverage ratio. The ratio is given as EBIT/Interest Expense and a higher ratio implies
higher financial strength of the firm (Damodaran, 2019d). The interest coverage can then be used to find the
synthetic ratings of the firm. The interest cover rate for PMI is 12.3, implying a bond rating of Aaa/AAA,
giving a default spread of 0.75% (Ibid.). Details of the interest coverage ratios and default spreads can be found
in Appendix 6.7 and the cost of debt calculation is depicted in figure 6.3 below.
Table 6.3: Cost of Debt
Source: Author Calculation
6.2.1 Tax Rate
As a multinational company, PMI’s operations are subjected to different tax regimes world-wide, thus in
theory, requiring examination of all associated local corporate tax rates to later apply to the portions of loans
in each subsidiary. However, PMI does not disclose sufficient enough of information regarding the loans of

104
the company to do this. Under the assumption that PMI’s earnings are distributed similar to its borrowing, the
historical effective tax rate could be applied, since it represents the weighted average of the company’s
different corporate tax rates. However, it seems unlikely that this would be the case (Petersen & Plenborg,
2012). Consequently, the chosen forecasting rate is the United States corporate tax rate of 21%.
6.2.2 Capital Structure
A company’s capital structure can be forecasted using two different approaches. The first approach uses the
market values of debt and equity applying the mean capital structure of the chosen peer group. The second
approach, which is an iterative approach, uses forecasted cash flow calculations in order to calculate the
favorable debt and equity ratio (Larkin, 2011). Applying both approaches to find the appropriate forecasted
capital structures is believed to yield the best capital structure arrangement (Petersen & Plenborg, 2012). When
performing the iterative process, the result suggests a structure of 14.4% debt, and 85.6% equity. Details can
be found in Appendix 6.8.
It makes sense for a company to aim for a capital structure close to the industry average for two reasons: first,
a company is often exposed to the same risk as its peers. Furthermore, industry averages are often considered
by rating agencies and equity researchers when credit ratings (Damodaran, 2006). The peer group average
suggests a capital structure of 8.7% debt and 91.4% equity. PMI’s capital structure is not identical with the
peer group average, having a capital structure of 17.6% debt and 82.7% equity. Here it should be noted that
Altria has had a negative financial leverage the past years, causing its 7-year average to be -2.7%. Altria is the
only peer group with negative financial leverage. If Altria would be excluded from the equation, the peer group
average would amount to 12.4%, which is significantly closer to the structure suggested by the iterative
process. Looking for other outliers, it can be found that BAT has had significantly higher financial leverage in
2017 and 2018 than any other peer, amounting to 22.2% and 34.8% respectively. Despite fluctuating figures,
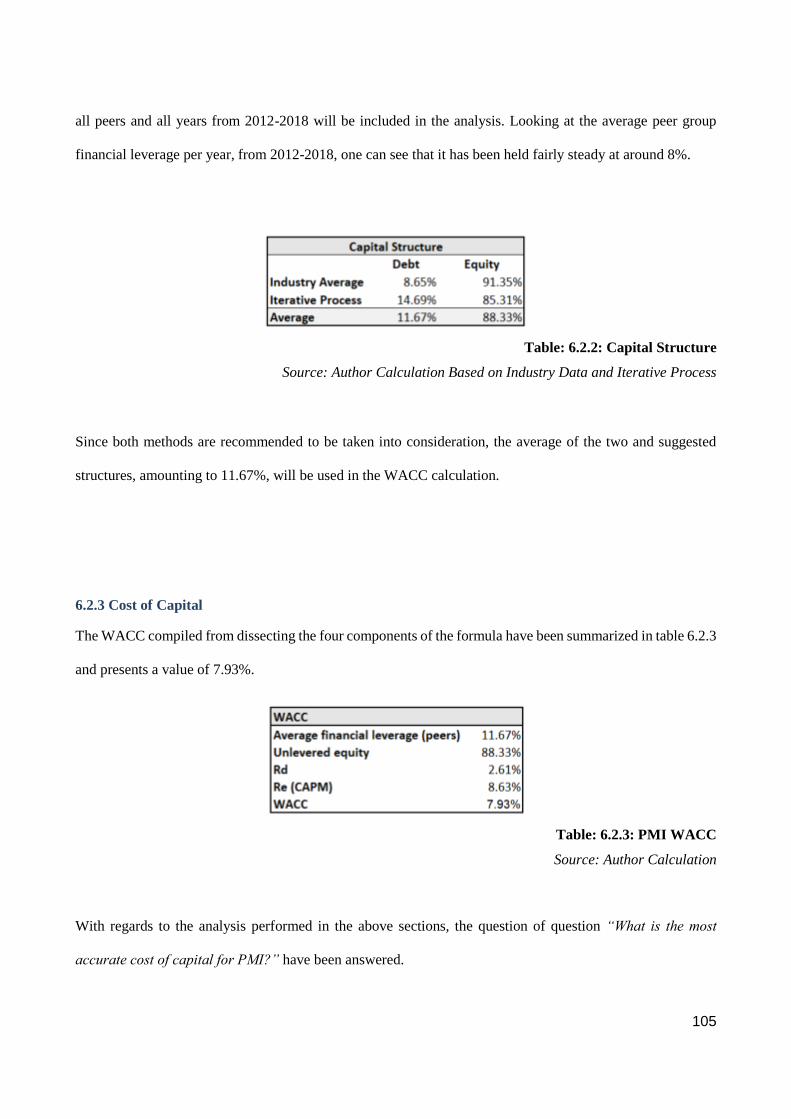
105
all peers and all years from 2012-2018 will be included in the analysis. Looking at the average peer group
financial leverage per year, from 2012-2018, one can see that it has been held fairly steady at around 8%.
Table: 6.2.2: Capital Structure
Source: Author Calculation Based on Industry Data and Iterative Process
Since both methods are recommended to be taken into consideration, the average of the two and suggested
structures, amounting to 11.67%, will be used in the WACC calculation.
6.2.3 Cost of Capital
The WACC compiled from dissecting the four components of the formula have been summarized in table 6.2.3
and presents a value of 7.93%.
Table: 6.2.3: PMI WACC
Source: Author Calculation
With regards to the analysis performed in the above sections, the question of question “What is the most
accurate cost of capital for PMI?” have been answered.
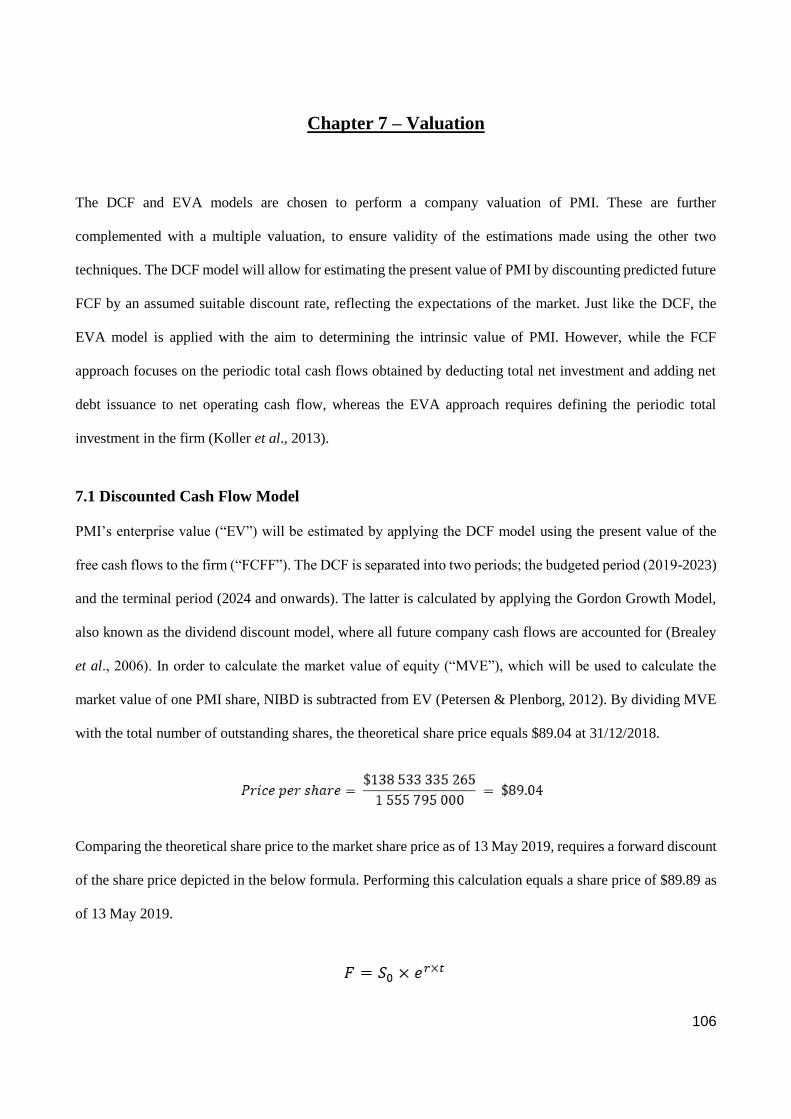
106
Chapter 7 – Valuation
The DCF and EVA models are chosen to perform a company valuation of PMI. These are further
complemented with a multiple valuation, to ensure validity of the estimations made using the other two
techniques. The DCF model will allow for estimating the present value of PMI by discounting predicted future
FCF by an assumed suitable discount rate, reflecting the expectations of the market. Just like the DCF, the
EVA model is applied with the aim to determining the intrinsic value of PMI. However, while the FCF
approach focuses on the periodic total cash flows obtained by deducting total net investment and adding net
debt issuance to net operating cash flow, whereas the EVA approach requires defining the periodic total
investment in the firm (Koller et al., 2013).
7.1 Discounted Cash Flow Model
PMI’s enterprise value (“EV”) will be estimated by applying the DCF model using the present value of the
free cash flows to the firm (“FCFF”). The DCF is separated into two periods; the budgeted period (2019-2023)
and the terminal period (2024 and onwards). The latter is calculated by applying the Gordon Growth Model,
also known as the dividend discount model, where all future company cash flows are accounted for (Brealey
et al., 2006). In order to calculate the market value of equity (“MVE”), which will be used to calculate the
market value of one PMI share, NIBD is subtracted from EV (Petersen & Plenborg, 2012). By dividing MVE
with the total number of outstanding shares, the theoretical share price equals $89.04 at 31/12/2018.
Comparing the theoretical share price to the market share price as of 13 May 2019, requires a forward discount
of the share price depicted in the below formula. Performing this calculation equals a share price of $89.89 as
of 13 May 2019.

107
Figure 7.1: Discounted Cash Flow Model
Source: Author Calculation
7.2 Economic Value Added Model
Just like the DCF, the purpose of using the EVA model is to derive the intrinsic value of a company. Moreover,
EVA is the incremental difference in the rate of return over the company’s cost of capital. The model implies
that EV equals the invested capital of the last FY when adding the capital value of all future EVA’s. EVA is
based on its residual profitability which is computed by NOPAT subtracting the opportunity cost of invested
capital which in turn is determined by multiplying WACC and the capital invested. EVA valuations are
mathematically identical to DCF valuations, except that it does not involve future cash flows forecasting and
does not measure the present value as is done in DCF valuations (Wilson, 1997). Furthermore, unlike the DCF-
approach, the EVA model does not take external effects like inflations into consideration of accounting value
in capital and accounting profit (Ibid.). However, if performed correctly the EVA and DCF models should
yield the same result (Petersen & Plenborg, 2012). This is also the case for PMI where both models yield a
share price of $89.04.

108
Figure 7.2: Economic Value Added Model
Source: Author Calculation
7.3 Multiple Valuation
As a complement to the DCF and EVA valuation methods, a multiple valuation have been conducted. The
measure derived from the multiple valuation can further ensure validity of the estimations made in the DCF
and EVA models. This will contribute to the share price range estimated from the above mentioned models
and the implied value of PMI. Multiples applied for this valuation are Price/Earnings (“P/E”), EV/Sales, and
EV/EBITDA. The peer forward looking multiples are retrieved from the Thomson Reuter database and PMI
multiples are retrieved from previous calculations. The multiples are measured as a harmonic mean which,
excluding extreme outliers that might skew results (Petersen & Plenborg, 2012).
There are several equity multiples to choose from when performing a multiple valuation; the P/E ratio, the
Price/Book (“P/B”) ratio, and Price/Sales. The equity value multiple applied in this thesis is the most
commonly used, the P/E ratio. In the case for PMI, the P/B ratio is negative and will thus be excluded. The
negative P/B values are due to the fact that the company is highly engaged in repurchasing of shares, it is not
uncommon for high FCF stocks like PMI (McClure, 2019). Worth noticing is that the P/B ratio is a tried and
true method for finding low-priced stocks that the market has neglected. If the company is trading for less than
its BV investors assume that either the asset value is overstated by the market, or that the company is earning
low or negative returns on its assets (Ibid.). One of the EV multiples applied in the multiple valuation of PMI
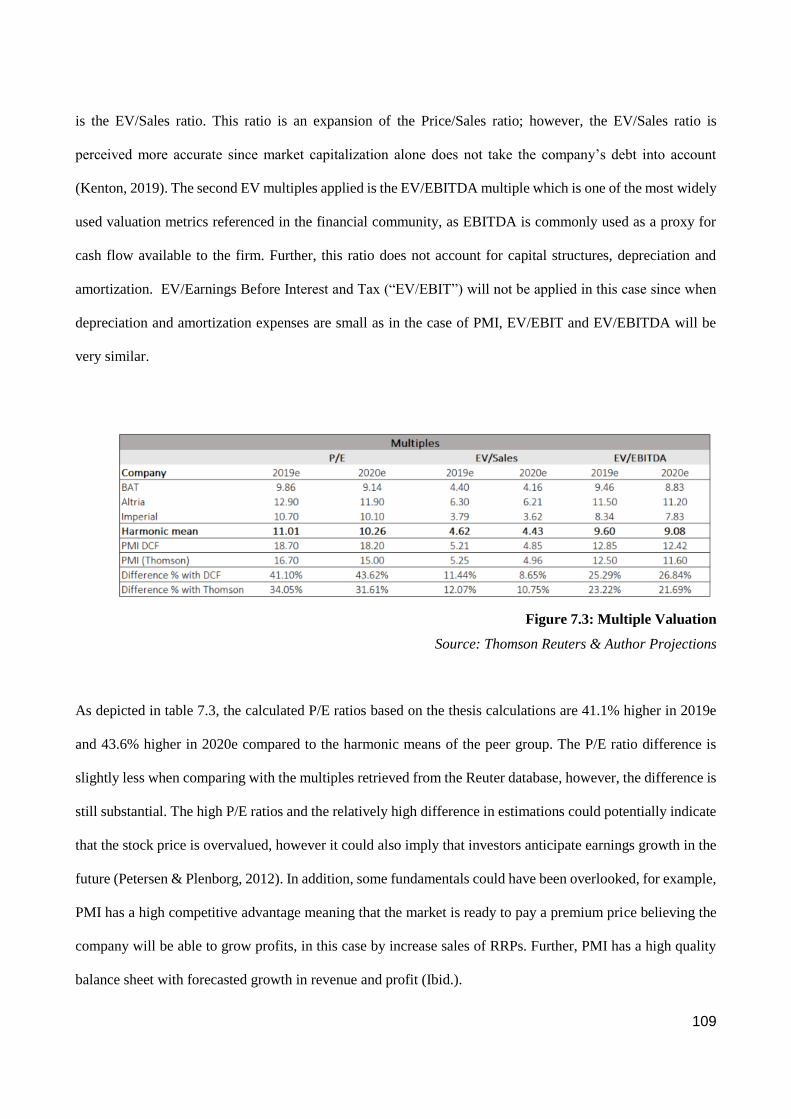
109
is the EV/Sales ratio. This ratio is an expansion of the Price/Sales ratio; however, the EV/Sales ratio is
perceived more accurate since market capitalization alone does not take the company’s debt into account
(Kenton, 2019). The second EV multiples applied is the EV/EBITDA multiple which is one of the most widely
used valuation metrics referenced in the financial community, as EBITDA is commonly used as a proxy for
cash flow available to the firm. Further, this ratio does not account for capital structures, depreciation and
amortization. EV/Earnings Before Interest and Tax (“EV/EBIT”) will not be applied in this case since when
depreciation and amortization expenses are small as in the case of PMI, EV/EBIT and EV/EBITDA will be
very similar.
Figure 7.3: Multiple Valuation
Source: Thomson Reuters & Author Projections
As depicted in table 7.3, the calculated P/E ratios based on the thesis calculations are 41.1% higher in 2019e
and 43.6% higher in 2020e compared to the harmonic means of the peer group. The P/E ratio difference is
slightly less when comparing with the multiples retrieved from the Reuter database, however, the difference is
still substantial. The high P/E ratios and the relatively high difference in estimations could potentially indicate
that the stock price is overvalued, however it could also imply that investors anticipate earnings growth in the
future (Petersen & Plenborg, 2012). In addition, some fundamentals could have been overlooked, for example,
PMI has a high competitive advantage meaning that the market is ready to pay a premium price believing the
company will be able to grow profits, in this case by increase sales of RRPs. Further, PMI has a high quality
balance sheet with forecasted growth in revenue and profit (Ibid.).

110
The calculated EV/Sales ratios are also higher in both forecasted years when compared to the harmonic means
as well as EV/EBITDA. A conclusion which can be drawn from this fact is that PMI has a higher valuation
than its peers. A higher-than-average valuation could be the result of either over optimistic projections, low
operating risks or favorable outlooks for PMI compared to the firms included in the chosen peer group
(Petersen & Plenborg, 2012). It is believed that the latter is the reason for the relatively high valuation of PMI.
This is supported by the fact that multiples based on own calculations compared to analyst forecasts retrieved
from Reuters for both EV/Sales an EV/EBITDA are almost identical. Thus, providing reassurance that the
forecast conducted in this thesis are very close to what analyst expert believe to be the true value of PMI.
In order to estimate the price per share, a calculation of the forecasted EV used in multiples EV/sales and
EV/EBITDA as well as the P/E ratio has to be performed. The forecasted EV is calculated by multiplying the
harmonic mean peer multiple with the corresponding estimated value (sales or EBITDA) (Petersen & Plenborg,
2012). The estimated price per share is calculated by dividing MVE, which is equal to EV subtracted by NIBD,
with the outstanding shares of PMI. The MVE in terms of the P/E ratio is calculated as the harmonic mean of
P/E multiplied by the corresponding result after tax. Dividing the MVE with the outstanding shares of PMI
gives the price per share (Ibid.). The multiple valuation and implied prices per share is depicted in table 7.4,
providing a price spread between $50.2 and $69.6.
Multiple valuation prices reflect how in recent years European pension funds and insurers begun divesting
their holdings in tobacco stocks, pressured by investors deeming it unsuitable to invest for environmental,
social and governance reasons (Pham, 2019). This has placed pressure on tobacco share prices and since 2016,
when momentum for tobacco-free portfolios took hold, the industry has underperformed reflecting the low
price per share.

111
Table 7.4: Multiple Valuation Share Price
Source: Thomson Reuters & Author Projections
7.3.1 Implied Value
The DCF and EVA valuation models suggest a share price of $89.04 as of December 31, 2018. If this value is
discounted forward to 13/05/2019 the share price equals $89.89 compared to the traded share price of $83.25
retrieved at the same date suggesting a upside of 7.98%. Compared to the multiple valuation, providing a price
spread between $50.2 and $69.6, with a downside of 79.06% and 29.15%, suggesting PMI is overvalued. By
estimating the implied price per share, the sub-question “What is the trading range of PMI?” have been
answered.
Table 7.4: Estimated per Share Value
Source: Thomson Reuters & Author Projections
7.4 Valuation Summary
The negative outlook for tobacco shares cannot be ignored, however, it is believed that most of these negative
impacts are already priced into the stocks at these levels. While it is believed that the negative effects of owning
tobacco shares are currently reflected in the price per share it is at the same time believed that multiples are
not fully reflecting the long-term value opportunities of the tobacco industry. This mainly include the RRPs
where a negative outlook might reflect the risk of downgrade in the absence of reforms. It could also include
not accounting for the potential of emerging markets and the risk it involves in term of sales, marketing
restrictions, tax and regulations.
112
Although the multiples showcase no extraordinary differences in price levels, it reflects fear of the unknown
future of the tobacco industry. The multiple valuation can further be challenged in terms of peer group selection
(Damodaran, n.d.b). The relatively low price per share levels in comparison to EVA, DCF and the current trade
price can be explained by the small amount of comparable firms included in the peer group as well as the fact
that these might carry certain types of characteristics making some of the firms not suitable for PMI’s peer
group (Ibid.) What further supports the decision to apply the DCF and EVA result as the final implied value
of PMI is the fact that the current trading price of one PMI stock is more closely aligned to these price levels
produced by the DCF and EVA models. Having considered the multiple valuation results, it can be concluded
that the most appropriate valuation methods applied when determining the fair value of one PMI share is the
DCF and EVA model. Hence, the forward discounted share price of PMI is as of 13/05/2019 $89.89, suggesting
an upside of 7.98% compared to the equivalent traded share price. By summarizing the valuation chapter and
by applying the most appropriate valuation method, the problem statement “What is the intrinsic value of one
Philip Morris International Inc. share as of 13 May 2019?” have been answered.

113
Chapter 8 – Sensitivity Analysis
A sensitivity analysis is used to analyze to which degree variations in inputs, used to estimate the share price,
affect the share price derived from the DCF- and EVA-model. Thus, this section will assess the movements in
the share price, due to changes in the chosen inputs. The rationale behind the analysis is both the expectation
of fluctuations in the inputs - e.g. growth rate, risk-free rate and beta - and the acknowledgement that these
may have been estimated imperfectly. Therefore, the sensitivity analysis is believed to increase the credibility
of the valuation, and make room for the occurrence of deviations. The first figure illustrates the consequence
to share price when changes in WACC and terminal growth (TV) occur.
Figure 8.1: Growth Rate and WACC
Source: Author Illustration
From the figure, one can see that fluctuations in WACC of 1.05%, does have a significant effect on the share
price. So does changes in TV, although the magnitude of the effect is lower. When the currently applied growth
rate of 2.68% is held constant, it can be found that an increase of 1.05% to the current WACC of 7.95% would
cause the estimated value of the share to decrease by 21.05%, implying a dollar decrease of nearly $20 per

114
share. Conversely, a 0.00105 decrease in the current WACC, to 6.9%, would increase the share value by
31.62%, to approximately $125.5. In terms of growth rate, a lower growth rate of 2.48% causes the share price
to decrease by 3.64% if the currently applied WACC of 7.95% is held constant. A higher growth rate, of 2.88%,
would instead result in a $3.71 higher share price.
Figure 8.2: Beta, Risk-free Rate & Share Price
Source: Author Illustration
Figure 8.2 illustrates how changes in the risk-free rate and the beta influences the WACC, which in turn affects
the calculated share price. It is found that both components have a meaningful effect on the share price. At the
applied risk-free rate of 2.56%, changes in beta causes the share price to either decrease by 21.17% to $74.59,
or increase by 31.88% to $124.79. Fluctuations in the risk-free rate does not impact the share price to the same
extent, if beta is held constant at the applied value of approximately 1.2. At this value, a decrease or increase
in the risk-free rate would cause the share price to decrease by 3% to $91.77, or increase by 7% to $100.91.
However, if beta would turn out to decrease to approximately 0.82, the changes in the risk-free rate has a
greater impact on the share price.

115
Figure 8.3: Cost of Capital, Cost of Debt and WACC
Source: Author Illustration
The final figure, 8.3, depicts the effect on the WACC resulting from changes in cost of equity and cost of debt.
As can be seen above, changes in cost of equity causes greater fluctuations in the WACC than cost of debt.
This finding is not surprising, as PMI holds a significantly larger proportion of equity (88.67%), than debt
(11.33%). At the applied cost of debt, an increase in cost of equity from 8.63% to 9.03% would result in an
increase in the WACC to 8.31%, which in turn would cause the share price to decrease to $83.4. An increase
in the cost of debt to 3.01%, would only cause the WACC to increase by 0.5%, and the share price to decrease
to $89.8. A decrease of the cost of capital to 8.23%, would result in an increase in the share price to $99.1. The
effect of cost and equity and debt on the Share price can be found in figure 8.4 below.

116
Figure 8.4: Cost of Capital, Cost of Debt and Share Price
Source: Author Illustration
By conducting the sensitivity analysis for PMI, the sub-question “How sensitive is the estimated share price
to fluctuations in different company and market factors?” have been answered.
117
Chapter 9 – Discussion
The sole purpose of this thesis has been to estimate the fair value of PMI as of 13 May 2019. To address the
problem statement and its sub-elements, several strategic and valuation frameworks and models have been
applied throughout the thesis. This chapter aims at interpreting the findings deducted from these frameworks
and models.
To gain a deeper understanding of PMI’s business environment, a PEST analysis was conducted aiming at
answering the question of “Which macro-economic factors influence PMI’s risk and future cash flow
potential?“. It is believed that the industry will face challenges in keeping profitability at its historical levels
in the long-term future with combustible cigarettes as its main product. Increased taxes causing prices to
increase, reduces shipping volumes throughout PMI’s brand portfolio. In addition, without the possibility to
successfully differentiate, premium-priced brands may become less appealing to customers, which would be
damaging to PMI as a premium brand company. Furthermore, although the economic analysis suggests that
the economic expansion in emerging markets provide opportunities for tobacco players, companies with a
product portfolio weighted towards the premium-priced brands may be less able to capture these. However, it
is believed that the medium-term effect of regulations on tobacco firms is manage due to their geographical
diversification and limited spreading of the strictest regulations. To remain profitable in this changing industry,
it is believed that effective technology development and R&D investments are crucial for sustained
profitability.
Despite PMI being the leader in a highly consolidated industry, all industry dynamics are not favorable.
Conducting a Porter’s Five Forces analysis provided further insight into the competitive state of the tobacco
industry. By conducting this analysis, the question of “What is the overall attractiveness of the industry and
how does it affect PMI’s operations?” have been answered. The industry has faced no real threats of new

118
entrants as the environment is skewed towards the largest players and the smaller firms are moving towards
periphery. The bargaining power of suppliers can also be considered low as PMI’s ability to secure adequate
supply of materials is considered strong. This is mainly due to the fact that materials used in the production of
combustible cigarettes are generic, cheap and fairly uncomplicated to retrieve. The threat of substitute is
twofold, as combustible cigarettes are highly addictive, one could argue that the threat of substitute products
other than combustible cigarettes are very low. However, PMI aims at RRPs becoming a substitute product to
combustible product, and if the company succeeds with this, the threat would significantly increase.
The strategic analysis was concluded with a SWOT analysis which answered the question, “Does PMI possess
a competitive advantage and is it sustainable?”. With a global presence and a strong portfolio of brands, PMI
has continuously throughout the years generated strong FCF. However, the company has experienced FCF
declines particularly due to declining shipment volumes, assumed to be attributed to tightening regulation and
increased health awareness. The recent years’ decline in shipment volume can potentially be, and possibly
already have been, somewhat offset by the growth in emerging markets. However, it is assumed that the 2018
recovery, and the assumed continued recovery of FCF in the forecasted budgeting period, is dependent on the
success of PMI’s RRP operations. If PMI can continue to enjoy first mover advantage with its RRPs in an
increased number of markets, it is believed its competitive advantage can be sustained.
The DCF and EVA valuation models suggest a share price of $89.04 as of December 31, 2018 whilst the
multiple valuation produced share prices ranging from $50.2 to $69.6. This thesis presented a number of
arguments supporting the choice of the valuation method considered to produce the most applicable share
price. The sensitivity analysis conducted in chapter eight, answering the question of “How sensitive is the
estimated share price to fluctuations in different company and market factors?, is a useful tool to apply when
analyzing how relatively small changes of key inputs can affect the share price substantially. These key inputs
are more than often based upon subjective projections. Consequently, there is a possibility of that changing
some inputs might provide a share price more accurately reflecting the true value of one PMI stock.

119
Chapter 10 – Conclusion
The main purpose of this thesis was to estimate the fair value of Philip Morris International Inc. as of 13 May
2019. By concluding the finding deducted from the frameworks and models applied in this thesis, the following
problem statement “What is the intrinsic value of one Philip Morris International Inc. share as of 13 May
2019?” can been answered. The DCF and EVA valuation models suggest a share price of $89.04 as of
December 31, 2018. If this value is discounted forward to 13 May 2019, the share price equals $89.89. When
compared to the traded share price of $83.25 retrieved at the same date, it suggests an upside of 7.98%.
Consequently, this thesis concludes a BUY investment recommendation for PMI shares.

120
Bibliography
Annual Reports
In-text: PMI, 201X
PMI Inc. (2018), Form 10-K 2018
PMI Inc. (2017), Form 10-K 2017
PMI Inc. (2016), Form 10-K 2016
PMI Inc. (2015), Form 10-K 2015
PMI Inc. (2014), Form 10-K 2014
PMI Inc. (2013), Form 10-K 2013
PMI Inc. (2012), Form 10-K 2012
British American Tobacco Plc. (2018), Form 20-F 2018
British American Tobacco Plc. (2017), Form 20-F 2017
British American Tobacco Plc. (2016), Form 20-F 2016
British American Tobacco Plc. (2015), Form 20-F 2015
British American Tobacco Plc. (2014), Form 20-F 2014
British American Tobacco Plc. (2013), Form 20-F 2013
British American Tobacco Plc. (2012), Form 20-F 2012
Imperial Tobacco Group Plc. (2018), Form 20-F 2018
Imperial Tobacco Group Plc. (2017), Form 20-F 2017
Imperial Tobacco Group Plc. (2016), Form 20-F 2016
Imperial Tobacco Group Plc. (2015), Form 20-F 2015
Imperial Tobacco Group Plc. (2014), Form 20-F 2014
Imperial Tobacco Group Plc. (2013), Form 20-F 2013
Imperial Tobacco Group Plc. (2012), Form 20-F 2012
Altria Group, Inc. (2018), Form 10-K 2018
Altria Group, Inc. (2017), Form 10-K 2017
Altria Group, Inc. (2016), Form 10-K 2016
Altria Group, Inc. (2015), Form 10-K 2015
Altria Group, Inc. (2014), Form 10-K 2014
Altria Group, Inc. (2013), Form 10-K 2013
Altria Group, Inc. (2012), Form 10-K 2012

121
Books
Brealey, R., Myers, S. & Allen, F. (2006). Principles of Corporate Finance. Boston: McGraw-
Hill/Irwin.
Grant, R. M. (2013). Contemporary Strategy Analysis. West Sussex: John Wiley & Sons Ltd.
Koller, T.Goedhart, M and Wessels, D (2010). Valuation: Measuring and managing the value of
companies. 5th Edition. New Jersey: John Wiley & Sons Ltd.
Petersen, C., & Plenborg, T. (2012). Financial Statement Analysis: Valuation, Credit analysis &
Executive compensation. Pearson Education Limited.
Plenborg, Thomas & Petersen, Christian V (2012). Financial Statement Analysis Harlow: Pearson
Stopford, M. (2008) The Shipping Market Model, Maritime Economics 2nd Edition.
Journals and Papers
Aryal, UR., Petzold, M. & Krettek, A. (2013). “Perceived risks and benefits of cigarette smoking
among Nepalese adolescents: A population-based cross-sectional study. BMC Public Health.
13: pp. 187.
Baumann, M., Spitz, E., Guillemin, F., Ravaud, J-F., Choquet, M., Falissard, B., & Chau, N. (2007).
“Associations of social and material deprivation with tobacco, alcohol, and psychotropic
drug use, and gender: a population-based study”. International Journal of Health
Geographics, 6 (50): pp. 1-12.
Bates, Clive. & Rowell, Andy. (2004). “Tobacco Explained… The truth about the tobacco industry...
in its own words”. EconPapers, 1 (1): pp. 1-82.
Barnett, JR. (2000). “Does place of residence matter: contextual effects and smoking in
Christchurch”. New Zealand Medical Journal, 113(1120): pp. 433–5.
Borzekowski, D., Flora, J., Feighery, E. & Schooler, C. (1999). “The perceived influence of cigarette
advertisements and smoking susceptibility among seventh graders”. Journal of Health
Communication, 4: pp. 105–118.
Breed, W. & De Foe, J. (1984). “Drinking and smoking on television, 1950–1982”. Journal of Public
Health Policy, 5(1): pp. 257–270.

122
Burns, E. (2007). “The Smoke of the Gods: A Social History of Tobacco”. Philadelphia: Temple
University Press, 1(1): pp. 481-486.
Chen, X., Stanton, B., Fang, X., Li, X., Lin, D., Zhang, J., Liu, H., & Yang, H. (2006). “Perceived
smoking norms, socio-environmental factors, personal attitudes and adolescent smoking in
China: a mediation analysis with longitudinal data”. Journal of Adolescent Health, 38(4):
pp. 359–68.
Christensen, C. M., Raynor, M. E., & McDonald, R. (2015). “What is disruptive innovation”. Harvard
Business Review, 93(12), 44-53.
Chuang, YC., Cubbin, C., Ahn, D., & Winkleby, MA. (2005). “Effects of neighborhood
socioeconomic status and convenience store concentration on individual level smoking”.
Journal of Epidemiology and Community Health, 59(7): pp. 568–73.
Cubbin, C., Hadden, WC., & Winkleby, MA. (2001). “Neighborhood context and cardiovascular
disease risk factors: the contribution of material deprivation”. Ethnicity & Disease, 11(4):
pp. 687–700.
Damodaran, A. (2006). “Valuation Approaches and Metrics”. Stern School of Business, 1(1): pp. 1-
77.
Datta, GD., Subramanian, SV., Colditz, GA., Kawachi, I., Palmer, JR., & Rosenberg, L. (2006).
“Individual, neighborhood, and state-level predictors of smoking among US Black women:
a multilevel analysis”. Social Science & Medicine, 63(4): pp. 1034–44.
Dawes, J. (2014). “Cigarette brand loyalty and purchase patterns: An examination using US consumer
panel data”. Journal of Business Research, 67(9), pp. 1933-1943.
Dragano, N., Bobak, M., Wege, N., Peasey, A., Verde, PE., Kubinova, R., Weyers, S., Moebus, S.,
Möhlenkamp, S., & Stang, A. (2007). "Neighbourhood socioeconomic status and
cardiovascular risk factors: a multilevel analysis of nine cities in the Czech Republic and
Germany”. BMC Public Health, 7: pp. 255.
Escamilla, G., Cradock, A. & Kawachi, I. (2000). “Women and smoking in Hollywood movies: a
content analysis”. American Journal of Public Health, 90: pp. 412–414.
Flint, AJ. & Novotny, TE. (1997). “Poverty status and cigarette smoking prevalence and cessation in
the United States, 1983–1993: the independent risk of being poor”. Tobacco Control, 6(1):
pp. 14–18.
123
Glover, E.D. & Glover, P.N. (1992) “The smokeless tobacco problem: Risk groups in North
America”. In: Smokeless Tobacco or Health: An International Perspective (Smoking and
Tobacco Control Monograph No. 2), Bethesda, MD, National Cancer Institute, pp. 3–10.
Grenard, JL., Guo, Q., Jasuja, GK., Unger, JB., Chou, CP., Gallaher, PE., Sun, P., Palmer, P., &
Anderson Johnson, C. (2006). “Influences affecting adolescent smoking behavior in China”.
Nicotine & Tobacco Research, 8(2): pp. 245–55.
Görg, Holger. & Strobl, Eric. (2005). “The effect of R&D subsidies on private R&D”. University of
Nottingham, 8 (1): pp. 1-16.
Hasselbalch, Jacob. (2015). “Professional disruption in health regulation: electronic cigarettes in the
European Union”. Journal of Professions and Organization, 3 (1): pp. 62-85.
Haustein, KO. (2006). “Smoking and poverty”. European Journal of Cardiovascular Prevention and
Rehabilitation, 13(3): pp. 312–8.
He, Peisen. & Yano, Eiji. (2009). “Tobacco companies are booming despite an economic depression”.
Tobacco Induced Diseases, 5 (9): pp. 1-2.
Henriksen, L. (2012). “Comprehensive tobacco marketing restrictions: promotion, packaging, price
and place ”. Tobacco Control: Stanford Prevention Research Center, 21 (1): pp. 147-153.
Hopkins, D.P., Briss, P.A., Ricard, C.J., Husten, C.G., Carande-Kulis, V.G., Fielding, J.E., Alao,
M.O., McKenna, J.W., Sharp, D.J., Harris, J.R., Woollery, T.A., & Harris, K.W. (2001).
“Reviews of evidence regarding interventions to reduce tobacco use and exposure to
environmental tobacco smoke”. Am. J. prev. Med., 20: 16–66
Huang, J., Tauras, J. & Chaloupka, FJ. (2014). “The impact of price and tobacco control policies on
the demand for electronic nicotine delivery systems”. Tobacco Control. 23(3): pp. iii41–
iii47.
Jha, P. & Chaloupka, F.J. (2000). “The economics of global tobacco control”. Br. med. J., 321, 358–
361
Joossens, L., & Raw, M. (2012). “From cigarette smuggling to illicit tobacco trade”. Tobacco Control,
21(2): pp. 230-234.
Kleinschmidt, I., Hills, M., & Elliott, P. (1995). “Smoking behaviour can be predicted by
neighborhood deprivation measures”. Journal of Epidemiology and Community Health,
49(2): pp. 72–77.

124
Kostova, D., Tesche, J., Perucic, AM., & Yurekli, A. (2014). “Exploring the Relationship Between
Cigarette Prices and Smoking Among Adults: A Cross-Country Study of Low- and Middle-
Income Nations”. Nicotine Tob Res. 16(1): pp. 10-5.
Leventhal, H., & Cleary, PD. (1980). “The smoking problem: a review of the research and theory in
behavioral risk modification”. Psychological Bulletin, 88(2): pp. 370–405.
Mathur, C., Stigler, MH., Perry, CL., Arora, M., & Reddy, KS. (2008). “Differences in prevalence of
tobacco use among Indian urban youth: the role of socioeconomic status”. Nicotine &
Tobacco Research, 10(1): pp. 109–16.
McIntosh, W., Bazzini, D., Smith, S. & Wayne, S. (1998) “Who smokes in Hollywood?
Characteristics of smokers in popular films from 1940 to 1989”. Addictive Behaviors, 23:
pp. 395–398.
Moore, Tomoe. & Mirzaei, Ali. (2016). “The Impact of the Global Financial Crisi on Industry
Growth”. The Manchester School, 84 (2): pp. 159-180.
Morgan, G., Backinger, C., & Leischow, S. (2007). “The future of tobacco-control research”. Cancer
Epidemiology, Biomarkers & Prevention, 16(6): pp. 1077–80.
Nazir, MA. & Khalid Almas, K. (2017) “Awareness about the effects of tobacco consumption on oral
health and the possibility of smoking behavior among male Saudi schoolchildren” European
Journal of Dentistry, 11(1): pp. 29–35.
Neufeld, KJ., Peters, DH., Rani, M., Bonu, S., & Brooner, RK. (2005). “Regular use of alcohol and
tobacco in India and its association with age, gender, and poverty”. Drug and Alcohol
Dependence, 77(3): pp. 283–91.
Newman, Claire. & Briggeman, C. Brian. (2016). “Cooperative Earn, Turns, and Leverage: The
DuPont Profitability Model. Kansas State University: Department of Agricultural
Economics, 8 (1): pp. 1-8.
Pan, Z. (2004). “Socioeconomic predictors of smoking and smoking frequency in urban China:
evidence of smoking as a social function”. Health Promotion International,19(3): pp. 309–
15.
Roberts, D., Henriksen, L. & Christenson, P. (1999). “Substance Use in Popular Movies and Music”.
Office of National Drug Control Policy and Department of Health and Human Services, 1
(1): pp. 1-74

125
Shohaimi, S., Luben, R., Wareham, N., Day, N., Bingham, S., Welch, A., Oakes, S., & Khan, KT.
(2003). “Residential area deprivation predicts smoking habit independently of individual
educational level and occupational social class: a cross sectional study in the Norfolk cohort
of the European Investigation into Cancer”. Journal of Epidemiology and Community
Health, 57(4): pp. 270–6
Siahpush, M., McNeill, A., Hammond, D. & Fong, GT. (2006) “Socioeconomic and country
variations in knowledge of health risks of tobacco smoking and toxic constituents of smoke:
results from the 2002 International Tobacco Control (ITC) Four Country Survey” Tobacco
Control, 15(3): pp. iii65–iii70
Song, AV., Morrell, HE., Cornell JL., Ramos ME., Biehl M. & Kropp, RY. (2009) “Perceptions of
smoking-related risks and benefits as predictors of adolescent smoking initiation. Am J
Public Health. 99: pp. 487–92.
Stoklosa, M., Drope, J. & Chaloupka, FJ. (2016) “Prices and E-Cigarette Demand: Evidence From
the European Union”. NCBI. Nicotine & Tobacco Research, 18(10), pp. 1973–1980.
Stimpson, JP., Ju, H., Raji, MA., & Eschbach, K. (2007). “Neighborhood deprivation and health risk
behaviors in NHANES III”. American Journal of Health Behavior, 31(2): pp. 215–22.
Stuber, J., Galea, S., & Link, G. (2008) “Smoking and the emergence of a stigmatized social status”.
Social Science & Medicine, 67(3): pp. 420–30.
Sweanor, D., Ballin, S., Corcoran, R.D., Davis, A., Deasy, K., Ferrence, R.G., Lahey, R., Lucido, S.,
Nethery, W.J. & Wasserman, J. (1992). “Report of the Tobacco Policy Research Study
Group on tobacco pricing and taxation in the United States”. Tobacco Control, 1: S31-S36
Thankappan, KR. & Thresia, CU. (2007). “Tobacco use and social status in Kerala”. Indian Journal
of Medical Research, 126(4): pp. 300–8.
Tseng, M., Yeatts, K., Millikan, R., & Newman, B. (2001). ”Area-level characteristics and smoking
in women”. American Journal of Public Health, 91(11): pp. 1847–50.
Warren, CW., Jones, NR, Peruga, A., Chauvin, J., Baptiste, JP., Costa de Silva, V, El Awa, F.,
Tsouros, A., Rahman, K., & Fishburn, B. (2008). “Global youth tobacco surveillance, 2000–
2007. Morbidity and Mortality Weekly Report, 57(SS-1): pp. 1–28.
Watson, N., Clarkson, J., Donovan, R. (2003). “Filthy or fashionable? Young people’s perceptions of
smoking in the media”. Giles‐Corti Health Education Research, 18(5), p. 554–567

126
Weiss, JW., Spruijt-Metz, D., Palmer, PH., Chou, CP., & Johnson, CA. (2006). “China Seven Cities
Study Research Team. Smoking among adolescents in China: an analysis based upon the
meanings of smoking theory”. American Journal of Health Promotion, 20(3): pp. 171–8.
Wilson, J. (1997). “Economic Value Added Model”. UBS Global Research, 1(1): pp. 1-52.
Online
Bloomberg. (2018). “Stop Rising Tobacco Use in Africa and the Middle East”. Bloomberg. [Online]
Available at: https://www.bloomberg.com/opinion/articles/2018-06-26/stop-rising-tobacco-
use-in-africa-and-the-middle-east. Accessed 18 March 2019.
Bloomberg. (2019). “Markets, Rates and Government Bonds US” [Online] Available at:
https://www.bloomberg.com/markets/rates-bonds/government-bonds/us Accessed 21 April
2019
Boseley, S. (2015). “Hon Lik invented the e-cigarette to quit smoking – but now he's a dual user”.
The Guardian. [Online] Available at:
https://www.theguardian.com/society/2015/jun/09/hon-lik-e-cigarette-inventor-quit-
smoking-dual-user Accessed 7 April 2019.
Bowman, J. (2019). “Why Philip Morris International Stock Tumbled 37% in 2018”. The Motley
Fool. [Online] Available at: https://www.fool.com/investing/2019/01/09/why-philip-morris-
international-stock-tumbled.aspx). Accessed 14 March 2019.
British American Tobacco (BAT). (2017). “BAT announces agreement to acquire Reynolds” [Online]
Available at:
https://www.bat.com/group/sites/UK__9D9KCY.nsf/vwPagesWebLive/DOAHNL68.
Accessed 9 May 2019.
British American Tobacco (BAT). (2019a). “The Global Market”. [Online] Available at:
https://www.bat.com/group/sites/UK__9D9KCY.nsf/vwPagesWebLive/DO9DCKFM
Accessed 28 March 2019
British American Tobacco (BAT). (2019b). “Paper”. [Online] Available at: https://www.bat-
science.com/groupms/sites/BAT_9GVJXS.nsf/vwPagesWebLive/DO7AXGBA Accessed 8
April 2019.
127
Caplinger, D. (2016). “Philip Morris International Takes a Big Step Forward”. The Motley Fool.
[Online] Available at: https://www.fool.com/investing/2016/09/28/philip-morris-
international-takes-a-big-step-forwa.aspx. Accessed 24 March 2019.
Caplinger, D. (2017). “Philip Morris International Stock: Where It's Been and Where It Might Go”.
The Motley Fool. [Online] Available at: https://www.fool.com/investing/2017/01/20/philip-
morris-international-stock-where-its-been-a.aspx Accessed 1 April 2019.
CDC (2018). “Economic Trends in Tobacco”. [Online] Available at:
https://www.cdc.gov/tobacco/data_statistics/fact_sheets/economics/econ_facts/index.htm.
Accessed 28 Feb 2019.
CFI. (2019). “What Is Systematic Risk”. Corporate Finance Institute. [Online] Available at:
https://corporatefinanceinstitute.com/resources/knowledge/finance/systematic-risk/.
Accessed 1 April 2019.
Cocco, F. (2017). “Emerging economies buck trend for decline in smoking”. [Online] Financial
Times. Available at: https://www.ft.com/content/35ad45ec-d280-11e6-b06b-
680c49b4b4c0. Accessed 15 March 2019.
Collinson, P. (2019). “The best investment of the past 35 years? Sadly, it was cigarettes”. The
Guardian. [Online] Available at: https://www.theguardian.com/money/2019/jan/26/the-
best-investment-of-the-past-35-years-sadly-it-was-cigarettes. Accessed 1 Mar 2019.
Damodaran, A. (n.d.a). “Growth Rates and Terminal Value” [Online] Available at:
http://www.stern.nyu.edu/~adamodar/pdfiles/ovhds/dam2ed/growthandtermvalue.pdf
Accessed 1 April 2019
Damodaran, A. (n.d.b). “It is all relative… Multiples, Comparables and Value!” [Online] Available
at: http://pages.stern.nyu.edu/~adamodar/pdfiles/country/relvalAIMR.pdf Accessed 23
April 2019
Damodaran, A. (1999). “Estimating Risk Parameters” [Online] Available at:
https://archive.nyu.edu/jspui/handle/2451/26789 Accessed 3 April 2019
Damodaran, A. (2019a). “Margins by Sector”. [Online] Available at:
http://pages.stern.nyu.edu/~adamodar/New_Home_Page/datafile/margin.html. Accessed 2
April 2019.
Damodaran, A. (2019b). “Beta Estimation”. [Online] Available at:
http://pages.stern.nyu.edu/~adamodar/New_Home_Page/datafile/totalbeta.html. Accessed 2
April 2019

128
Damodaran, A. (2019c). “Country Default Spreads and Risk Premiums”. [Online] Available at:
http://pages.stern.nyu.edu/~adamodar/New_Home_Page/datafile/ctryprem.html Accessed 8
April 2019
Damodaran, A. (2019d). “Ratings”. [Online] Available at:
http://pages.stern.nyu.edu/~adamodar/New_Home_Page/datafile/ratings.htm Accessed 3
April 2019
DBS Bank. (2018). “Treasury Concept: Foreign Exchange Controls” [Online] Available at:
https://treasuryprism.dbs.com/treasury-concepts/foreign-exchange-controls Accessed 1
April 2019.
Devex. (2019). “Tobacco Companies Will Not Bring About Sustainable Development”. Devex.
[Online] Available at:
https://www.devex.com/news/opinion-tobacco-companies-will-not-bring-about-sustainable-
development-94308. Accessed 18 March 2019.
Dulaney, C. (2016). “Philip Morris Revenue Cigarette Shipments Decline”. Wall Street Journal.
[Online] Available at: https://www.wsj.com/articles/philip-morris-revenue-cigarette-
shipments-decline-1454589322 Accessed 3 April 2019.
European Commission. (2019). “Product Regulation”. [Online] Available at:
https://ec.europa.eu/health/tobacco/products_en. Accessed 1 April 2019.
Forbes. (2015). “Altria In The U.S. Tobacco Industry”. [Online] Available at:
https://www.forbes.com/sites/greatspeculations/2015/08/17/altria-in-the-u-s-tobacco-
industry-a-porters-five-forces-analysis/#6a2fe98afaa3. Accessed 1 April 2019.
Forbes. (2018). “If You're OK With A 'Sin' Stock, There's Value In Tobacco”. [Online] Available at:
https://www.forbes.com/sites/moneyshow/2018/06/22/if-youre-ok-with-a-sin-stock-theres-
value-in-tobacco/#16826620ce68. Accessed 11 May 2019.
Forbes. (2019). ”The World’s Most Valuable Brands”. Forbes. [Online] Available at:
https://www.forbes.com/powerful-brands/list/#tab:rank Accessed 6 March 2019.
Genov, I. (2018). “Global Tobacco Regulation Overview” [PowerPoint Presentation]. Euromonitor
International. Available at: https://www.wtprocessandmachinery.com/europe/
contentimages/articles/24_-_Genov_4-3.pdf. Accessed 1 April 2019.

129
Hargreaves, R. (2017) “Is Philip Morris Worth Its Valuation”. Gurufocus. [Online] Available at:
https://www.gurufocus.com/news/544580/is-philip-morris-worth-its-valuation- Accessed 6
April 2019.
Harrington, R. (2014). “Philip Morris International: A Short SWOT Analysis” [Online] Available
at: http://www.valueline.com/Stocks/Highlights/Philip_Morris_International__A_Short_S
WOT_Analysis.aspx#.XKIOZpgzb-h. Accessed 10 March 2019.
IMF. (2019). “Real GDP Growth. Annual Percentage Change”. [Online] Available at:
https://www.imf.org/external/datamapper/NGDP_RPCH@WEO/CAN/AFQ/APQ/EUQ/MEQ/WH
Q. Accessed 5 May 2019.
Institute for Global Tobacco Control. (2019). “Country Laws Regulating E-cigarettes: A Policy
Scan”. Baltimore, MD: Johns Hopkins Bloomberg School of Public Health. Available at:
https://www.globaltobaccocontrol.org/e-cigarette_policyscan. Accessed 1 April 2019.
IARC. (2004). “Working Group on the Evaluation of Carcinogenic Risk to Humans”.[Online]
Available at: https://www.ncbi.nlm.nih.gov/books/NBK316400/ Accessed 1 Mar 2019.
Investopedia. (2017). “Equity Income”. Investopedia. [Online] Available at:
https://www.investopedia.com/terms/e/equityincome.asp Accessed 3 April 2019.
Investopedia. (2019a). “PEST Analysis” [Online]. Available at:
https://www.investopedia.com/terms/p/pest-analysis.asp. Accessed 6 May 2019.
Investopedia (2019b). “Invested Capital” [Online]. Available at:
https://www.investopedia.com/terms/i/invested-capital.asp. Accessed 30 April 2019.
Kenton, W. (2017). “Sinful Stocks”. Investopedia. [Online] Available
at: https://www.investopedia.com/terms/s/sinfulstock.asp Accessed 7 April 2019.
Kenton, W. (2019). “Enterprise Value-to-Sales”. Investopedia. [Online] Available at:
https://www.investopedia.com/terms/e/enterprisevaluesales.asp Accessed 6 April 2019
Larkin, P. (2011). “To Iterate Or Not To Iterate? Using The WACC In Equity Valuation”. [Online]
Journal of Business & Economics Research. Available at:
https://www.investopedia.com/terms/i/invested-capital.asp. Accessed 3 April 2019.
LaVito, A. (2018). “Philip Morris Shares Slide After PMI Says IQOS Growth in Japan Slows”.
CNBC. [Online] Available at: https://www.cnbc.com/2018/04/19/philip-morris-shares-
slide-after-pmi-says-iqos-growth-in-japan-slows.html. Accessed 14 March 2019.
130
Mackay, J & Eriksen, M. (2002). “The Tobacco Atlas. First Edition. Geneva: WHO”.
[Online] Available at: www.who.int/tobacco/resources/publications/tobacco_atlas/en/
Accessed 10 March 2019.
Maloney, J. & Chaudhuri, S. (2017). “Against All Odds, the U.S. Tobacco Industry Is Rolling in
Money” The Wall Street Journal. [Online] Available at: https://www.wsj.com/articles/u-s-
tobacco-industry-rebounds-from-its-near-death-experience-1492968698. Accessed 1 Mar
2019.
Mathis, W. (2018). “BAT Launches High-Tech Vape in U.K. to Fend Off Juul, IQOS”. Bloomberg.
[Online] Available at: https://www.bloomberg.com/news/articles/2018-12-11/bat-launches-
high-tech-vape-in-the-u-k-to-fend-off-juul-iqos. Accessed 15 March 2019.
Maverich, J. (2019). “Which Economic Factors Most Affect Demand on Consumer Goods”.
Investopedia. [Online] Available at:
https://www.investopedia.com/ask/answers/042815/which-economic-factors-most-affect-
demand-consumer-goods.asp Accessed 6 April 2019.
McClean, P. (2017). “Big Tobacco’s technology battle heats up”. Financial Times. [Online] Available
at: https://www.ft.com/content/3ccee21e-c7a8-11e6-8f29-9445cac8966f. Accessed 15
March 2019.
McClure, B. (2019). “Using Price-To-Book Value to Evaluate Companies”. Investopedia. [Online]
Available at: https://www.investopedia.com/investing/using-price-to-book-ratio-evaluate-
companies/ Accessed 6 April 2019.
McFarlane, G. (2014). “How Philip Morris International Lights Up Portfolios”. Forbes. [Online]
Available at: https://www.forbes.com/sites/investopedia/2014/05/23/how-philip-morris-
international-lights-up-portfolios/#49490583c40d. Accessed 22 March 2019.
Moody’s. (2016). “Financial Statement Adjustments in the Analysis of Non-Financial Corporations”.
[Online] Available at:
https://www.moodys.com/research/Moodys-publishes-update-to-methodology-for-Financial-
Statement-Adjustments-in--
PR_359993?WT.mc_id=AM~WWFob29fRmluYW5jZV9TQl9SYXRpbmcgTmV3c19Bb
GxfRW5n~20161221_PR_359993 Accessed 1 April 2019.
Mouratidis, Y. (2019). “How Technology Disrupts Smoking”. Forbes. [Online] Available at:
https://www.forbes.com/sites/yiannismouratidis/2019/02/25/how-technology-disrupts-
smoking/#1068303766b6 Accessed 1 April 2019.
131
Nasdaq. (2019). “Philip Morris International Inc Institutional Ownership”. [Online] Available at:
https://www.nasdaq.com/symbol/pm/institutional-holdings. Accessed 2 May 2019.
Nathan, R. (2019). “Philip Morris Stock Up 30% This Year: More Upside”. Market Realist. [Online]
Available at: https://marketrealist.com/2019/02/philip-morris-stock-up-30-this-year-more-
upside. Accessed 14 March 2019.
Page, B. (2014). “In depth: the e-cig industry’s strengths and weaknesses”. ECig Intelligence.
[Online] Available at: https://ecigintelligence.com/in-depth-strengths-weaknesses-
opportunities-threats-for-e-cigs/ Accessed 7 April 2019.
Pham, L. (2019). “Investors Lose a Major Justification for Holding Tobacco Stocks”.
Bloomberg. [Online] Available at: https://www.bloomberg.com/news/articles/2019-03-
13/tobacco-stocks-lose-world-beating-status-as-pension-funds-exit Accessed 1 May 2019.
PMI. (2019a). “Building Leading Brands” [Online] Available at:
https://www.pmi.com/who-we-are/building-leading-brands. Accessed 28 February 2019.
PMI. (2019b). “Designing a Smoke-Free Future” [Online] Available at: https://www.pmi.com/who-
we-are/designing-a-smoke-free-future. Accessed 28 February 2019.
PMI. (2019c). “E-Vapor Products” [Online] Available at: https://www.pmi.com/smoke-free-
products/mesh-taking-e-cigarettes-further. Accessed 21 April 2019.
PMI. (2019d). “Investor Relations: Stock, Dividends & Bonds” [Online] Available at:
https://www.pmi.com/investor-relations/pm-stock-and-bond-information. Accessed 5
March 2019.
PMI. (2019e). “Key Milestones” [Online] Available at:
https://www.pmi.com/who-we-are/key-milestones Accessed 26 February 2019.
Porter, E. Michael. (2008). “The Five Competitive Forces That Shape Strategy” Harvard Business
Review. [Online] Available at: https://hbr.org/2008/01/the-five-competitive-forces-that-
shape-strategy Accessed 5 Mar 2019.
Rehn, Adrian. (2014). “6 Mega Corporations Control Almost the Entire Global Cigarette Industry”.
Mic. [Online] Available at: https://www.mic.com/articles/81365/6-mega-corporations-
control-almost-the-entire-global-cigarette-industry. Accessed 14 March 2019.
Reuters. (2017). “Fitch Affirms Philip Morris International at 'A'; Outlook Negative”. Reuters.
[Online] Available at: https://www.reuters.com/article/fitch-affirms-philip-morris-
internationa-idAFFit5L7SFL Accessed 1 March 2019.

132
Robinson, D. & Bond, S. (2013). “Regulators take aim at high-margin tobacco products”. Financial
Times. [Online] Available at: https://www.ft.com/content/00c15862-4793-11e3-b1c4-
00144feabdc0. Accessed 1 April 2019.
Seeking Alpha. (2018). “Philip Morris International Dive Cash Flow Trends”. Seeking Alpha.
[Online] Available at:
https://seekingalpha.com/article/4227791-philip-morris-international-dive-cash-flow-
trends. Accessed 28 March 2019.
Stannard-Stockton, S. (2016). “Return on invested capital: Why it matters & how we calculate it”
[Online] Available at:
https://intrinsicinvesting.com/2016/04/12/return-on-invested-
capital-why-it-matters-how-we-calculate-it/. Accessed 28 April 2019.
Statista. (2019a). Statista Dossier ”Tobacco”. [Online] Available at: https://www-statista-com.esc-
web.lib.cbs.dk:8443/study/15892/tobacco-statista-dossier/. Accessed 1 Mar 2019.
Statista. (2019b). “Leading tobacco companies worldwide in 2018, based on net sales”. Statista.
[Online] Available at: https://www.statista.com/statistics/259204/leading-10-tobacco-
companies-worldwide-based-on-net-sales/ Accessed 21 March 2019
Stevenson, D. (2019). “Are Energy Stocks the New Tobacco”. City Wire. [Online] Available at:
https://citywire.co.uk/funds-insider/news/david-stevenson-are-energy-stocks-the-new-
tobacco/a1214957. Accessed 22 March 2019.
Tako, M. (2018). “What’s The Deal With Negative Shareholder Equity?”. Escapes. [Online]
Available at:
https://www.mrtakoescapes.com/whats-deal-negative-shareholder-
equity/?fbclid=IwAR1CCCOt4MOXEBPRaV5VkDcWs62B4chxEAINtfisaun9r0SlOIkpF
Rm0TKs Accessed 4 April 2019.
Telemacque, P. (2015). “Whether it's apartheid or fossil fuels, divestment is on the right side of
history”. The Guardian. [Online] Available at:
https://www.theguardian.com/commentisfree/2015/apr/27/divestment-fossil-fuels-
apartheid-barclays. Accessed 21 March 2019.
The Economist. (2017). “Philip Morris to invest US$560m in Romanian plant”. The Economist.
[Online] Available at:
http://www.eiu.com/industry/article/1415728725/philip-morris-to-invest-us560m-in-
romanian-plant/2017-07-27. Accessed 24 March 2019.
133
The Local. (2019). “Sweden's new laws to look out for in 2019”. [Online] Available at:
https://www.thelocal.se/20190102/swedens-news-laws-to-be-aware-of-in-2019. Accessed 1
April 2019.
The International Financial Reporting Standards (IFRS). (2019). “IAS 12 Income Taxes”. [Online]
Available at: https://www.ifrs.org/issued-standards/list-of-standards/ias-12-income
-taxes/. Accessed 30 April 2019.
Tobacco Atlas. (2019a). “Deaths”. [Online] Available at: https://tobaccoatlas.org/topic/deaths
Accessed 26 March 2019.
Tobacco Atlas. (2019b). “The Tobacco Industry is Not an Economic Development Partner” [Online]
Available at:
https://tobaccoatlas.org/2019/03/08/the-tobacco-industry-is-not-an-economic-
development-partner/ Accessed 21 March 2019.
Tobacco Atlas. (2019c). “Marketing”. [Online] Available at:
https://tobaccoatlas.org/topic/marketing/ Accessed 8 March 2019.
Tobacco Free Kids. (2018). “The Global Cigarette Industry”. [Online] Available at:
https://www.tobaccofreekids.org/assets/global/pdfs/en/Global_Cigarette_Industry_pdf.pdf.
Accessed 1 Mar 2019.
Tobacco Free Kids. (2019). “Increases illicit tobacco”. Tobacco Free Kids. [Online] Available at:
https://www.tobaccofreekids.org/microsites/plainpackaging/the-arguments/increases-illicit-
tobacco. Accessed 2 April 2019.
Trainer, D. (2017). “Explanation And Examples Of How Invested Capital Turns Matter”. Forbes.
[Online] Available at: https://www.forbes.com/sites/greatspeculations/2017/10/17/
explanation-and-examples-of-how-invested-capital-turns-matter/#51e613f06168. Accessed
1 April 2019.
Wachman, R. (2012). “Tobacco Industry Shares Beat Recession”. The Guardian. [Online] Available
at: https://www.theguardian.com/business/2012/feb/14/tobacco-industry-shares-
beat-recession. Accessed 26 February 2019.
Waldrep, J. (2019). “Why You Should Not Ignore Tobacco Stocks Anymore”. Forbes. [Online]
Available at:
https://www.forbes.com/sites/jordanwaldrep/2018/09/28/why-you-should-not-ignore-
tobacco-stocks-anymore/#458a71f130e3 Accessed 1 May 2019.
134
World Health Organization (WHO). (n.d.a). “Tobacco Tax Increases and the Consumer Price Index”.
[Online] Available at:
https://www.who.int/tobacco/economics/4_tobaccotaxincreasesandcpi.pdf Accessed 3 March
2019.
World Health Organization (WHO). (n.d.b) “Global and regional overview of cigarette prices and
taxation” Available at: https://www.who.int/tobacco/economics/
1globalregionaloverview.pdf. Accessed May 10 2019.
World Health Organization (WHO). (n.d.c.) “Tobacco tax levels and structure: A theoretical and
empirical overview” Available at: https://www.who.int/tobacco/publications/en_tfi_tob_
tax_chapter2.pdf?ua=1. Accessed: 10 May 2019.
World Health Organization (WHO). (2015b). “Prevalence of Tobacco Smoking”. [Online] Available
at: http://gamapserver.who.int/gho/interactive_charts/tobacco/use/atlas.html. Accessed 1
April 2019.
World Health Organization (WHO) (2017a). “WHO study group on tobacco product regulation”
[Online] Available at: https://apps.who.int/iris/bitstream/handle/10665/260245/
9789241210010-
eng.pdf;jsessionid=B1F2EF18846D32EEFC67AC17E7901B93?sequence=1 Accessed 23
April 2019.
World Health Organization (WHO) (2017b). “WHO Report on the Global Tobacco Epidemic 2017:
Monitoring Tobacco Use and Prevention Policies.” [Online] Available
at:https://www.who.int/tobacco/global_report/2017/en/ Accessed 5 April 2019.
World Health Organization (WHO). 2018. “Tobacco” [Online] Available at:
https://www.who.int/news-room/fact-sheets/detail/tobacco. Accessed 10 May 2019.
World Health Organization (WHO). (2019). “Prevalence of tobacco smoking”. [Online] Available at:
https://www.who.int/gho/tobacco/use/en/. Accessed 28 Feb 2019.
Williams-Grut, O. (2017). “The tobacco giant behind Lucky Strike is spending billions on 'next-gen
nicotine delivery systems'”. Business Insider. [Online] Available at:
https://nordic.businessinsider.com/bat-vaping-tobacco-heating-vype-disruption-innovation-tech-
2017-4?r=US&IR=T. Accessed 15 March 2019.
Williams, R. (2019). “Why Is an Internal Analysis Important?”. Chron. [Online] Available at:
https://smallbusiness.chron.com/internal-analysis-important-80513.html. Accessed 22 March 2019.
World Bank. (2017). “World Development Indicators” . [Online] Available at:

135
https://datacatalog.worldbank.org/dataset/world-development-indicators Accessed 29 March
2019.
World Bank. (2019a). “Tobacco”. [Online] Available at:
https://www.worldbank.org/en/topic/tobacco Accessed 5 April 2019.
World Bank. (2019b). “Global Economic Prospect” [Online] Available at:
http://www.worldbank.org/en/publication/global-economic-prospects Accessed 28 March
2019.
Yahoo Finance. (2019). “Juul surpasses Facebook as fastest startup to reach decacorn status”.
[Online] Available at: https://finance.yahoo.com/news/juul-surpasses-facebook-fastest-
startup-reach-decacorn-status-153728892.html. Accessed 1 April 2019.
Databases
IFRS
Bloomberg
Thomson Reuters
Reports
CDC, Centers for Disease Control and Prevention (2018). “Preventing and Reducing Illicit Tobacco
Trade in the United States”. Office on Smoking and Health, National Center for Chronic
Disease Prevention and Health Promotion.
Drope, J., Schluger, N., Cahn, Z., Drope, J., Hamill, S., Islami, F., Liber, A., Nargis, N., & Stoklosa,
M. (2018). The Tobacco Atlas. Atlanta: American Cancer Society and Vital Strategies
Euromonitor International (2018). The Global Cigarette Industry. Campaign for Tobacco Free Kids.
Tobacco Free Kids.
Kotzen, J. Plaschke, F. Olsen, E. (2012). The Rise of the Cash Machine. BCG Perspectives by The
Boston Consulting Group.
Williams, N. (2018). Tobacco: Reviewing the Global Financial Risks. Tobacco Free Portfolios.
World Health Organization (WHO). (2014). “Raising Tax on Tobacco: What You Need to Know”
Geneva: World Health Organization.
World Health Organization (WHO). (2015a). “WHO global report on trends in tobacco smoking
2000-2025” Second Edition. Geneva: World Health Organization.
136
World Health Organization (WHO). (2017). World Report on the Global Tobacco Epidemic, 2017:
Monitoring tobacco use and prevention policies. Geneva: World Health Organization.
World Health Organization (WHO) (2019) “WHO global report on trends in tobacco smoking 2000-
2025” Second Edition. Geneva: World Health Organization.
US Department of Health and Human Services. (1994) “Preventing Tobacco Use Among Young
People: A Report of the Surgeon General”. Atlanta (GA): US Department of Health and
Human Services, Public Health Service, Centers for Disease Control and Prevention,
National Center for Chronic Disease Prevention and Health Promotion, Office on Smoking
and Health.
US Department of Health and Human Services (2012). “Preventing Tobacco Use Among Youth and
Young Adults: A Report of the Surgeon General”. Atlanta, GA: US Department of Health
and Human Services, Centers for Disease Control and Prevention, National Center for
Chronic Disease Prevention and Health Promotion, Office on Smoking and Health.
Other
Bonsack, J.A. (1881). “Cigarette-Machine” (Patent No. 238640 dated 8 March 1881), United States
Patent Office [http://www.uspto.gov/patft/index.html]
World Health Organization (WHO). (2012). “Tobacco Supply and Trade” Economics of Tobacco and
Tobacco Control Session World Conference on Tobacco or Health Singapore, March 23,
2012

137
Appendix
Appendix Overview
Appendix 1: Analytical Financial Statements
Appendix 2: DuPont Summary
Appendix 3: Forecasting
Appendix 4: Regression Output
Appendix 5: Pro Forma Statements
Appendix 6: Cost of Capital
Appendix 7: Valuation
Appendix 8: Sensitivity Analysis
Appendix 1: Analytical Financial Statements
1.1: PMI Analytical Income Statement
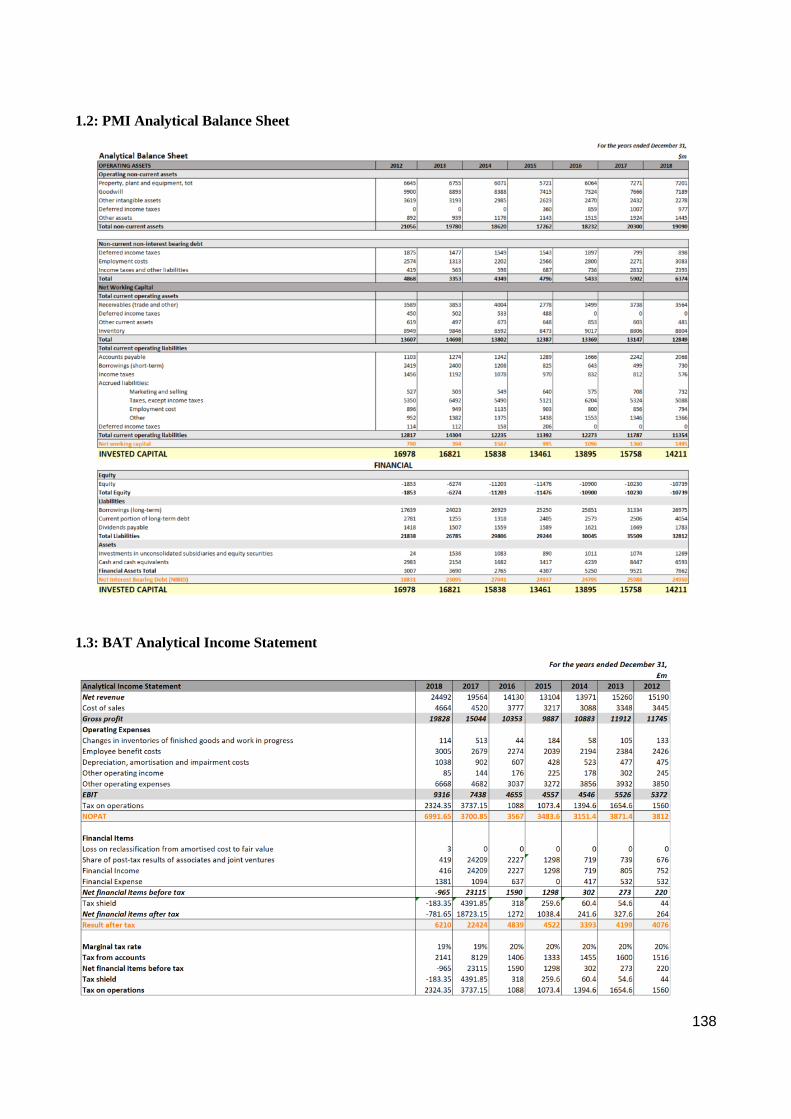
138
1.2: PMI Analytical Balance Sheet
1.3: BAT Analytical Income Statement
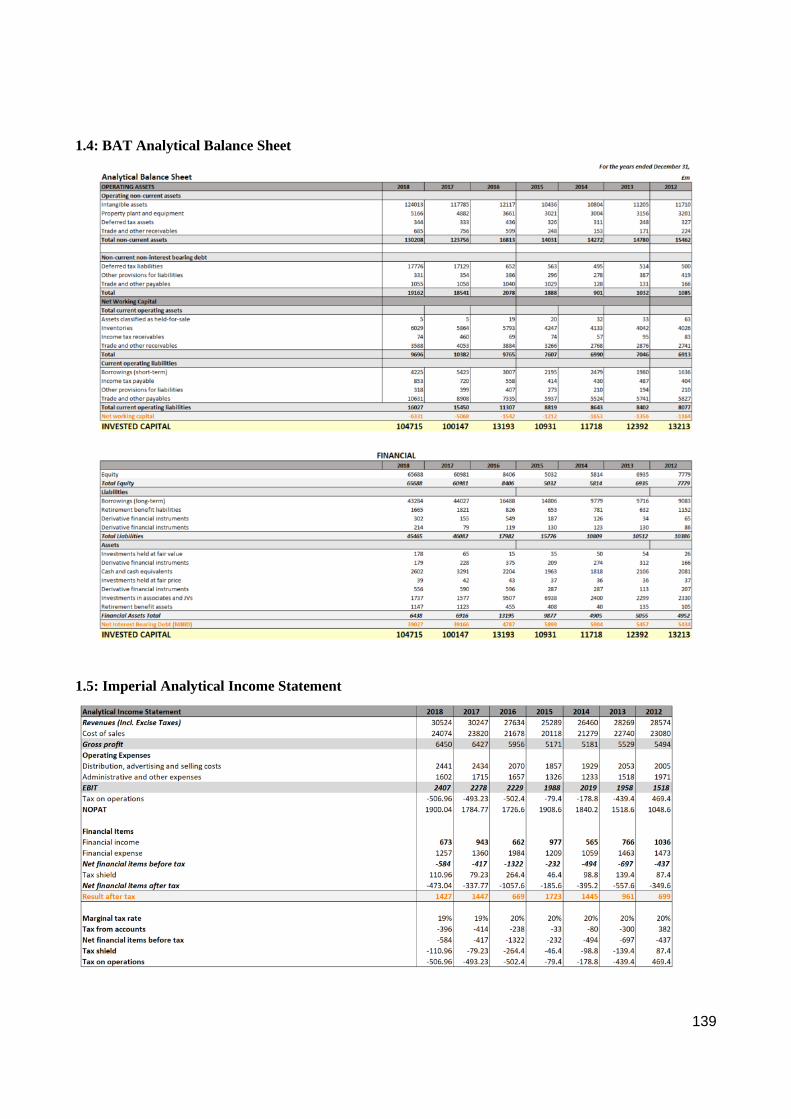
139
1.4: BAT Analytical Balance Sheet
1.5: Imperial Analytical Income Statement

140
1.6: Imperial Analytical Balance Sheet
1.7: Altira Analytical Income Statement
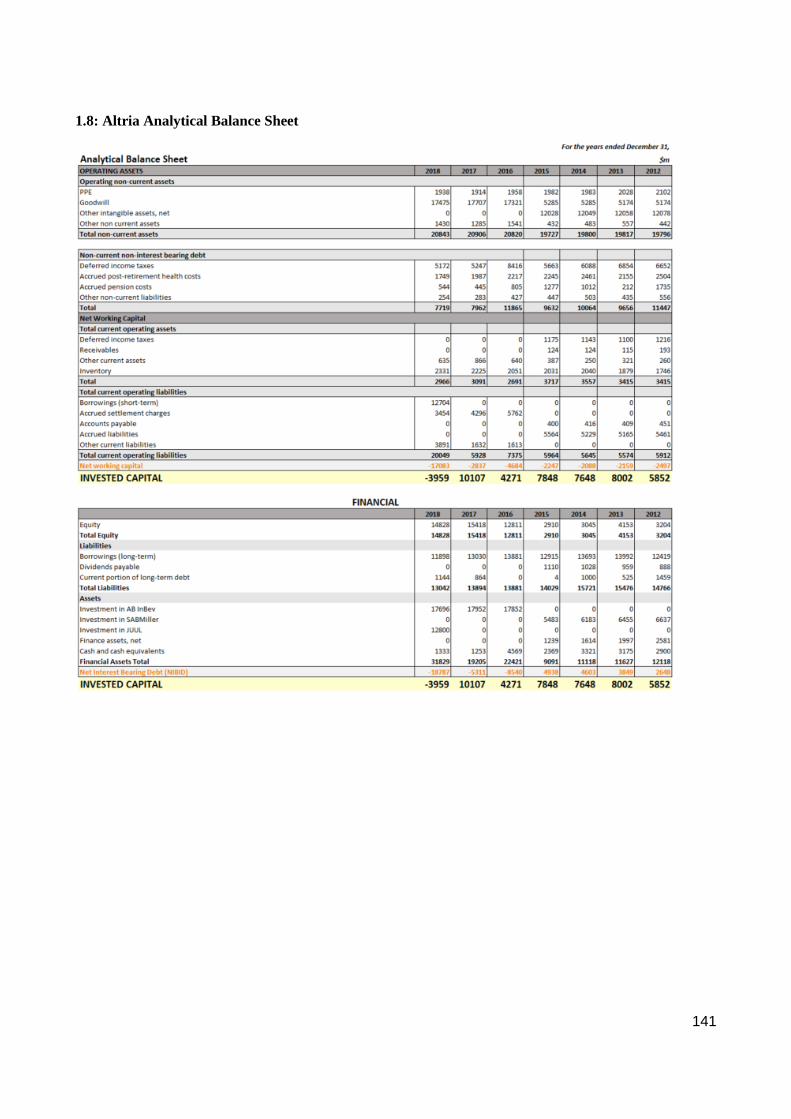
141
1.8: Altria Analytical Balance Sheet

142
Appendix 2: DuPont Summary
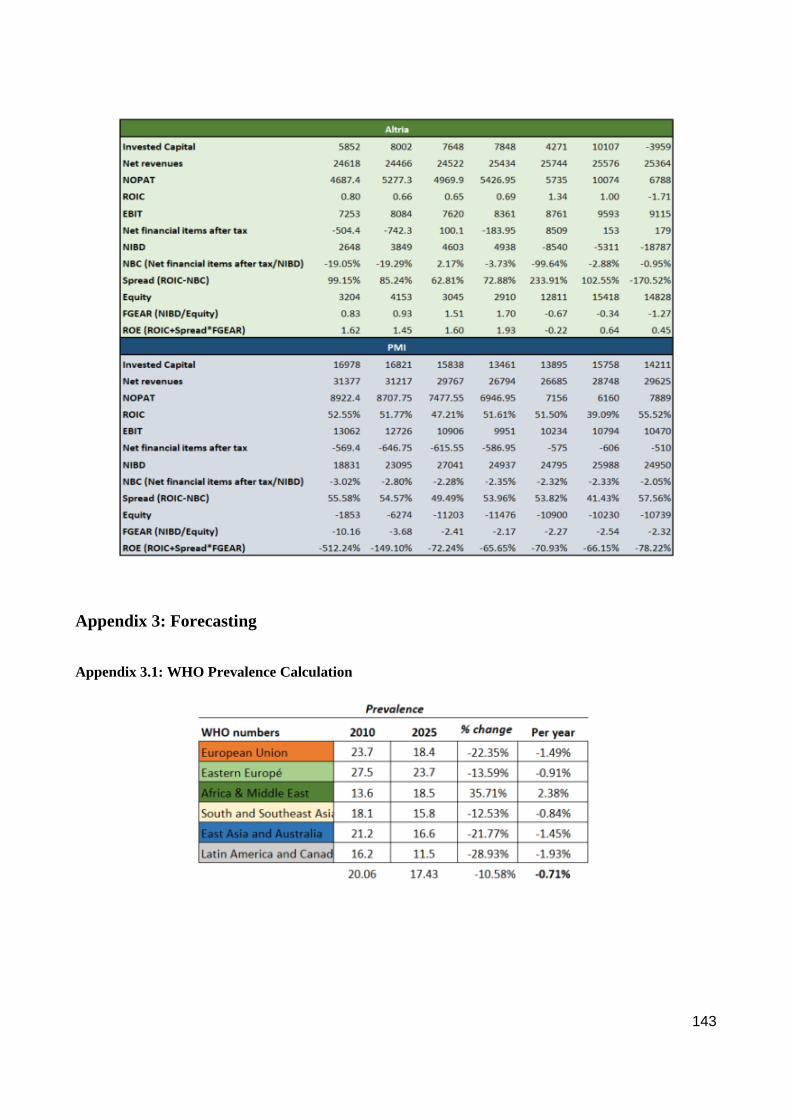
143
Appendix 3: Forecasting
Appendix 3.1: WHO Prevalence Calculation

144
Appendix 3.2: Historical Revenue & Revenue Forecast
Appendix 3.3: Historical Shipping Volumes & Shipping Volume Forecast

145
Appendix 3.4: PMI Calculation Average Annual Price Increase Between 2012-2018
Appendix 3.5: WHO Average Price and Tax Increases Between 2012-2018

146
Appendix 3.6: MAR & SG&A Expenses
Appendix 3.7: Correlation GDP & Combustible Product Revenues
Appendix 4: Regression Output
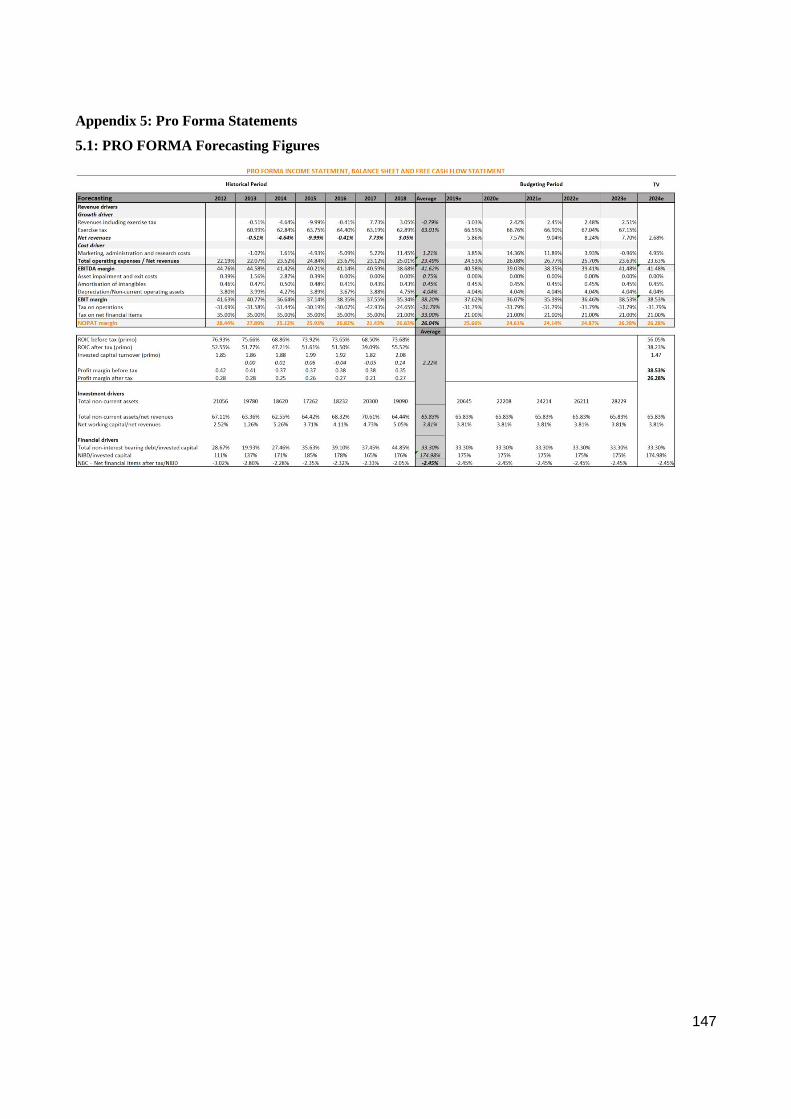
147
Appendix 5: Pro Forma Statements
5.1: PRO FORMA Forecasting Figures
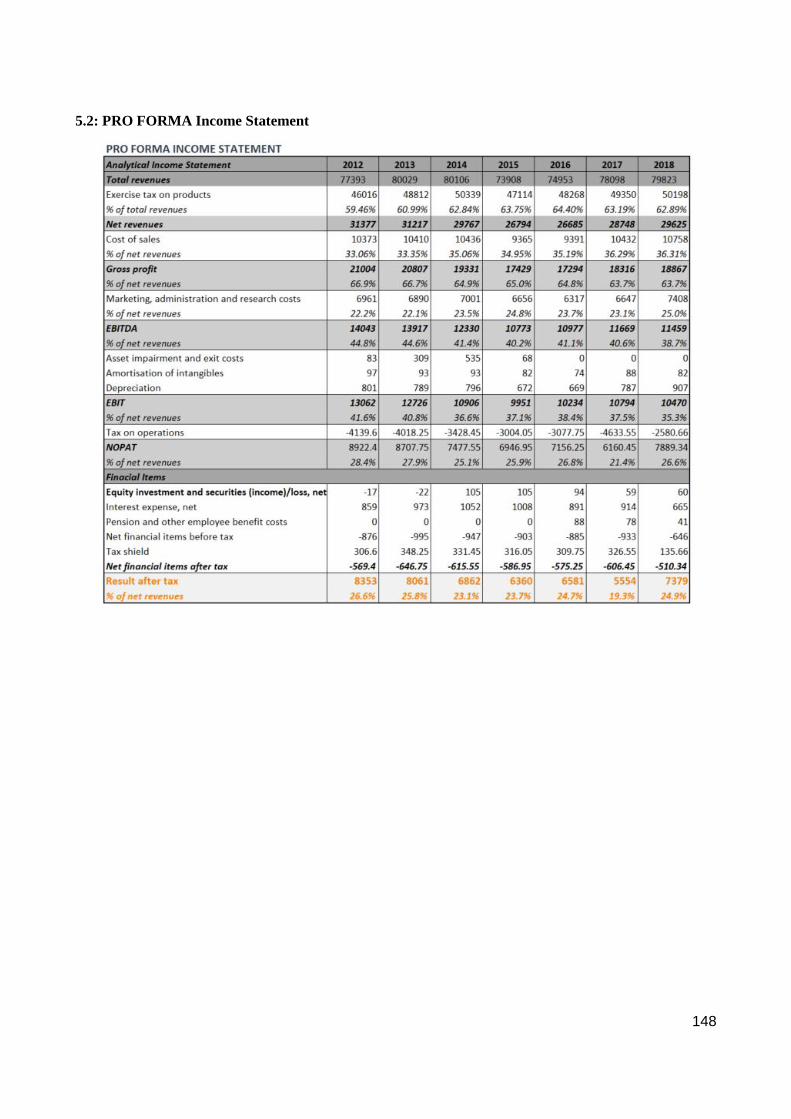
148
5.2: PRO FORMA Income Statement
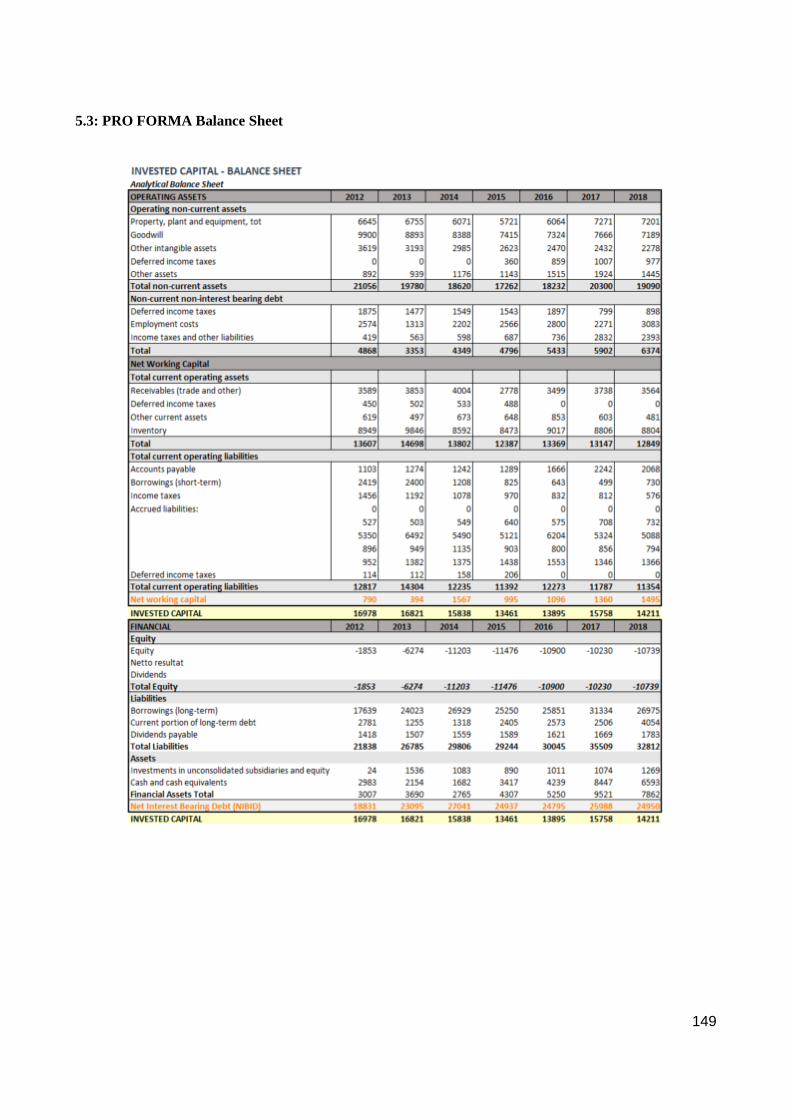
149
5.3: PRO FORMA Balance Sheet

150
5.4: Forecasted PRO FORMA Income Statement
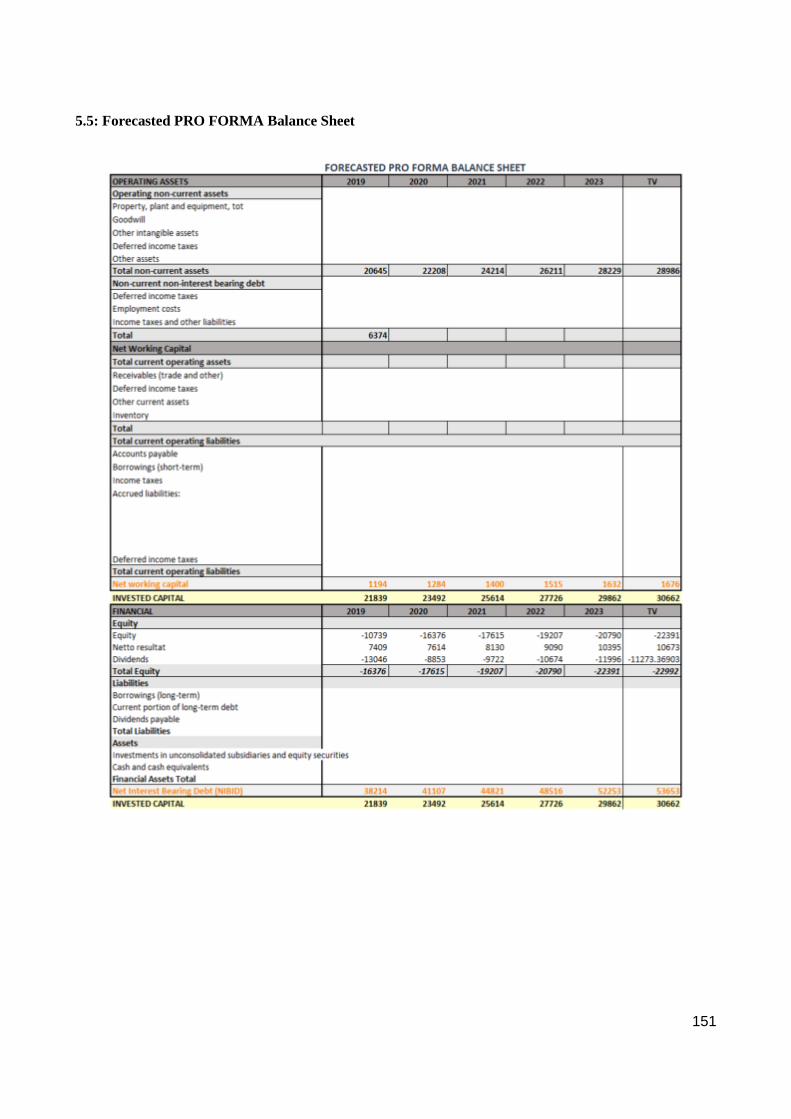
151
5.5: Forecasted PRO FORMA Balance Sheet
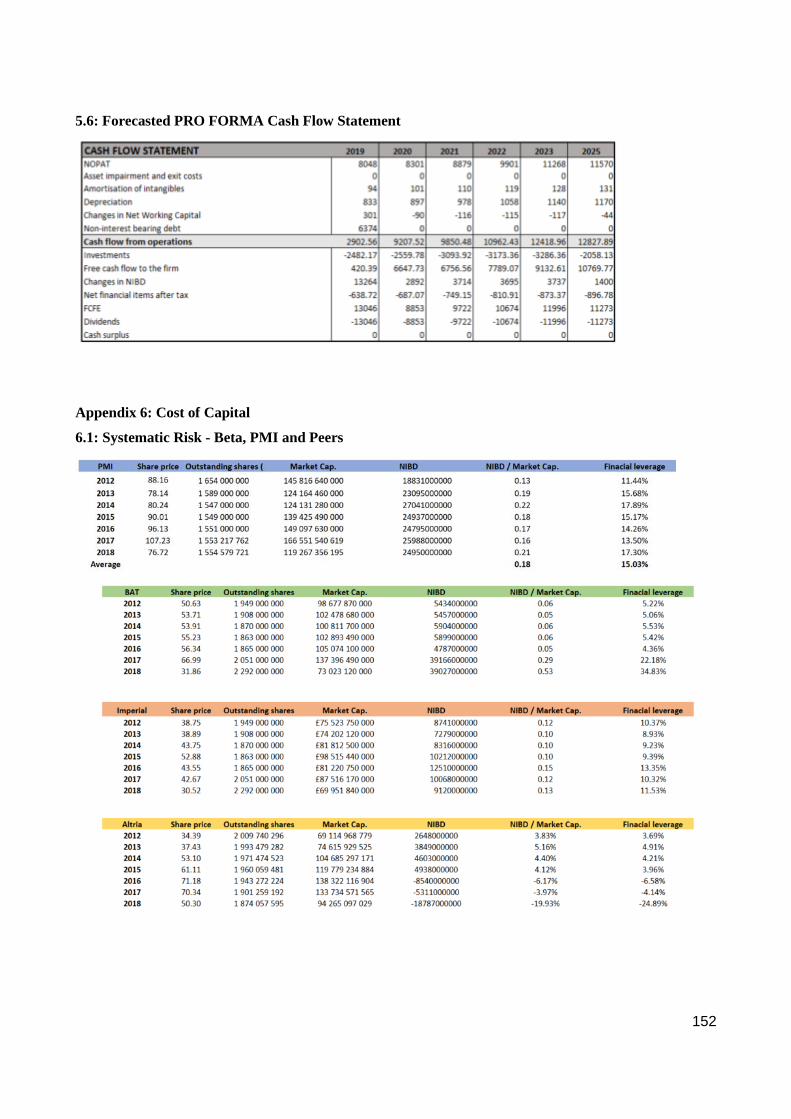
152
5.6: Forecasted PRO FORMA Cash Flow Statement
Appendix 6: Cost of Capital
6.1: Systematic Risk - Beta, PMI and Peers
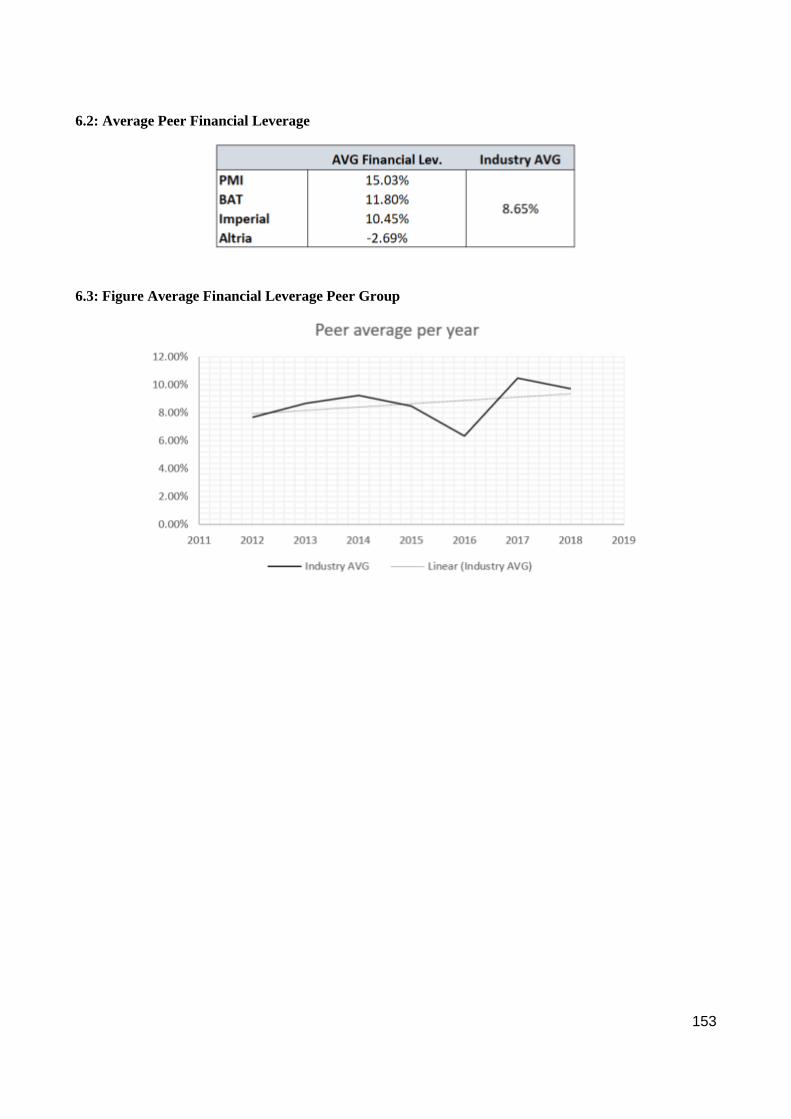
153
6.2: Average Peer Financial Leverage
6.3: Figure Average Financial Leverage Peer Group

154
6.4: Regression Beta Output

155
6.5: Peer Beta
6.6: Average Beta

156
6.7: Interest Coverage Ratios and Default Spreads
Appendix 6.8: Capital Structure – Iterative Process

157
Appendix 7: Valuation
7.1: DCF
7.2: EVA
8: Sensitivity Analysis
8.1: WACC, Growth & Share Price

158
8.2: Beta, Risk-free Rate and Share Price
8.3: Beta, Risk-free Rate and WACC
8.4: Cost of Equity, Cost of Debt After Tax and WACC
8.5: Cost of Equity, Cost of Debt After Tax and Share Price