Validation of candidate causal genes for obesity that affect shared metabolic pathways and networks
9
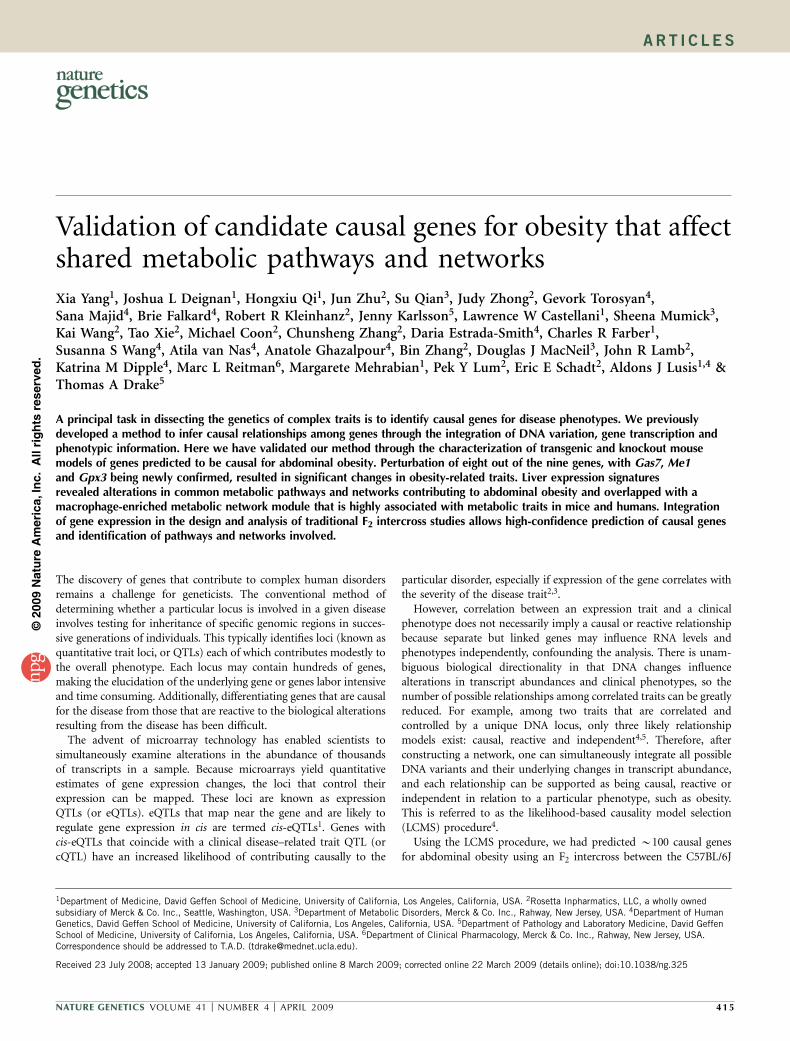
Validation of candidate causal genes for obesity that affect shared metabolic pathways and networks Xia Yang 1 , Joshua L Deignan 1 , Hongxiu Qi 1 , Jun Zhu 2 , Su Qian 3 , Judy Zhong 2 , Gevork Torosyan 4 , Sana Majid 4 , Brie Falkard 4 , Robert R Kleinhanz 2 , Jenny Karlsson 5 , Lawrence W Castellani 1 , Sheena Mumick 3 , Kai Wang 2 , Tao Xie 2 , Michael Coon 2 , Chunsheng Zhang 2 , Daria Estrada-Smith 4 , Charles R Farber 1 , Susanna S Wang 4 , Atila van Nas 4 , Anatole Ghazalpour 4 , Bin Zhang 2 , Douglas J MacNeil 3 , John R Lamb 2 , Katrina M Dipple 4 , Marc L Reitman 6 , Margarete Mehrabian 1 , Pek Y Lum 2 , Eric E Schadt 2 , Aldons J Lusis 1,4 & Thomas A Drake 5 A principal task in dissecting the genetics of complex traits is to identify causal genes for disease phenotypes. We previously developed a method to infer causal relationships among genes through the integration of DNA variation, gene transcription and phenotypic information. Here we have validated our method through the characterization of transgenic and knockout mouse models of genes predicted to be causal for abdominal obesity. Perturbation of eight out of the nine genes, with Gas7, Me1 and Gpx3 being newly confirmed, resulted in significant changes in obesity-related traits. Liver expression signatures revealed alterations in common metabolic pathways and networks contributing to abdominal obesity and overlapped with a macrophage-enriched metabolic network module that is highly associated with metabolic traits in mice and humans. Integration of gene expression in the design and analysis of traditional F 2 intercross studies allows high-confidence prediction of causal genes and identification of pathways and networks involved. The discovery of genes that contribute to complex human disorders remains a challenge for geneticists. The conventional method of determining whether a particular locus is involved in a given disease involves testing for inheritance of specific genomic regions in succes- sive generations of individuals. This typically identifies loci (known as quantitative trait loci, or QTLs) each of which contributes modestly to the overall phenotype. Each locus may contain hundreds of genes, making the elucidation of the underlying gene or genes labor intensive and time consuming. Additionally, differentiating genes that are causal for the disease from those that are reactive to the biological alterations resulting from the disease has been difficult. The advent of microarray technology has enabled scientists to simultaneously examine alterations in the abundance of thousands of transcripts in a sample. Because microarrays yield quantitative estimates of gene expression changes, the loci that control their expression can be mapped. These loci are known as expression QTLs (or eQTLs). eQTLs that map near the gene and are likely to regulate gene expression in cis are termed cis-eQTLs 1 . Genes with cis-eQTLs that coincide with a clinical disease–related trait QTL (or cQTL) have an increased likelihood of contributing causally to the particular disorder, especially if expression of the gene correlates with the severity of the disease trait 2,3 . However, correlation between an expression trait and a clinical phenotype does not necessarily imply a causal or reactive relationship because separate but linked genes may influence RNA levels and phenotypes independently, confounding the analysis. There is unam- biguous biological directionality in that DNA changes influence alterations in transcript abundances and clinical phenotypes, so the number of possible relationships among correlated traits can be greatly reduced. For example, among two traits that are correlated and controlled by a unique DNA locus, only three likely relationship models exist: causal, reactive and independent 4,5 . Therefore, after constructing a network, one can simultaneously integrate all possible DNA variants and their underlying changes in transcript abundance, and each relationship can be supported as being causal, reactive or independent in relation to a particular phenotype, such as obesity. This is referred to as the likelihood-based causality model selection (LCMS) procedure 4 . Using the LCMS procedure, we had predicted B100 causal genes for abdominal obesity using an F 2 intercross between the C57BL/6J Received 23 July 2008; accepted 13 January 2009; published online 8 March 2009; corrected online 22 March 2009 (details online); doi:10.1038/ng.325 1 Department of Medicine, David Geffen School of Medicine, University of California, Los Angeles, California, USA. 2 Rosetta Inpharmatics, LLC, a wholly owned subsidiary of Merck & Co. Inc., Seattle, Washington, USA. 3 Department of Metabolic Disorders, Merck & Co. Inc., Rahway, New Jersey, USA. 4 Department of Human Genetics, David Geffen School of Medicine, University of California, Los Angeles, California, USA. 5 Department of Pathology and Laboratory Medicine, David Geffen School of Medicine, University of California, Los Angeles, California, USA. 6 Department of Clinical Pharmacology, Merck & Co. Inc., Rahway, New Jersey, USA. Correspondence should be addressed to T.A.D. ([email protected]). NATURE GENETICS VOLUME 41 [ NUMBER 4 [ APRIL 2009 415 ARTICLES © 2009 Nature America, Inc. All rights reserved.
-
Upload
independent -
Category
Documents
-
view
2 -
download
0
Transcript of Validation of candidate causal genes for obesity that affect shared metabolic pathways and networks
Validation of candidate causal genes for obesity that affectshared metabolic pathways and networksXia Yang1, Joshua L Deignan1, Hongxiu Qi1, Jun Zhu2, Su Qian3, Judy Zhong2, Gevork Torosyan4,Sana Majid4, Brie Falkard4, Robert R Kleinhanz2, Jenny Karlsson5, Lawrence W Castellani1, Sheena Mumick3,Kai Wang2, Tao Xie2, Michael Coon2, Chunsheng Zhang2, Daria Estrada-Smith4, Charles R Farber1,Susanna S Wang4, Atila van Nas4, Anatole Ghazalpour4, Bin Zhang2, Douglas J MacNeil3, John R Lamb2,Katrina M Dipple4, Marc L Reitman6, Margarete Mehrabian1, Pek Y Lum2, Eric E Schadt2, Aldons J Lusis1,4 &Thomas A Drake5
A principal task in dissecting the genetics of complex traits is to identify causal genes for disease phenotypes. We previouslydeveloped a method to infer causal relationships among genes through the integration of DNA variation, gene transcription andphenotypic information. Here we have validated our method through the characterization of transgenic and knockout mousemodels of genes predicted to be causal for abdominal obesity. Perturbation of eight out of the nine genes, with Gas7, Me1and Gpx3 being newly confirmed, resulted in significant changes in obesity-related traits. Liver expression signaturesrevealed alterations in common metabolic pathways and networks contributing to abdominal obesity and overlapped with amacrophage-enriched metabolic network module that is highly associated with metabolic traits in mice and humans. Integrationof gene expression in the design and analysis of traditional F2 intercross studies allows high-confidence prediction of causal genesand identification of pathways and networks involved.
The discovery of genes that contribute to complex human disordersremains a challenge for geneticists. The conventional method ofdetermining whether a particular locus is involved in a given diseaseinvolves testing for inheritance of specific genomic regions in succes-sive generations of individuals. This typically identifies loci (known asquantitative trait loci, or QTLs) each of which contributes modestly tothe overall phenotype. Each locus may contain hundreds of genes,making the elucidation of the underlying gene or genes labor intensiveand time consuming. Additionally, differentiating genes that are causalfor the disease from those that are reactive to the biological alterationsresulting from the disease has been difficult.
The advent of microarray technology has enabled scientists tosimultaneously examine alterations in the abundance of thousandsof transcripts in a sample. Because microarrays yield quantitativeestimates of gene expression changes, the loci that control theirexpression can be mapped. These loci are known as expressionQTLs (or eQTLs). eQTLs that map near the gene and are likely toregulate gene expression in cis are termed cis-eQTLs1. Genes withcis-eQTLs that coincide with a clinical disease–related trait QTL (orcQTL) have an increased likelihood of contributing causally to the
particular disorder, especially if expression of the gene correlates withthe severity of the disease trait2,3.
However, correlation between an expression trait and a clinicalphenotype does not necessarily imply a causal or reactive relationshipbecause separate but linked genes may influence RNA levels andphenotypes independently, confounding the analysis. There is unam-biguous biological directionality in that DNA changes influencealterations in transcript abundances and clinical phenotypes, so thenumber of possible relationships among correlated traits can be greatlyreduced. For example, among two traits that are correlated andcontrolled by a unique DNA locus, only three likely relationshipmodels exist: causal, reactive and independent4,5. Therefore, afterconstructing a network, one can simultaneously integrate all possibleDNA variants and their underlying changes in transcript abundance,and each relationship can be supported as being causal, reactive orindependent in relation to a particular phenotype, such as obesity.This is referred to as the likelihood-based causality model selection(LCMS) procedure4.
Using the LCMS procedure, we had predicted B100 causal genesfor abdominal obesity using an F2 intercross between the C57BL/6J
Received 23 July 2008; accepted 13 January 2009; published online 8 March 2009; corrected online 22 March 2009 (details online); doi:10.1038/ng.325
1Department of Medicine, David Geffen School of Medicine, University of California, Los Angeles, California, USA. 2Rosetta Inpharmatics, LLC, a wholly ownedsubsidiary of Merck & Co. Inc., Seattle, Washington, USA. 3Department of Metabolic Disorders, Merck & Co. Inc., Rahway, New Jersey, USA. 4Department of HumanGenetics, David Geffen School of Medicine, University of California, Los Angeles, California, USA. 5Department of Pathology and Laboratory Medicine, David GeffenSchool of Medicine, University of California, Los Angeles, California, USA. 6Department of Clinical Pharmacology, Merck & Co. Inc., Rahway, New Jersey, USA.Correspondence should be addressed to T.A.D. ([email protected]).
NATURE GENETICS VOLUME 41 [ NUMBER 4 [ APRIL 2009 41 5
A R T I C L E S
©20
09 N
atu
re A
mer
ica,
Inc.
All
rig
hts
res
erve
d.
and DBA/2J strains of mice (the BXD cross)4. To validate thepredictive power of LCMS, we characterized phenotypes of transgenicor knockout mouse models for nine of the top candidate genes andfound eight out of the nine genes to influence obesity-related traits.We analyzed gene expression signatures in livers of the transgenic andknockout mice and demonstrated that all nine genes affect commonpathways and subnetworks that relate to metabolic pathways, suggest-ing that obesity is driven by a gene network instead of a single gene.
RESULTSKnockout or transgenic mouse models for the nine candidate causalgenes were constructed or obtained from vendors or institutionalinvestigators6–8 (Supplementary Table 1 online). Except for GAS7, asnoted below, transgene expression patterns were similar to those of theendogenous genes4,7 (Supplementary Fig. 1 online). We previouslyvalidated ZFP90, C3ar1, Tgfbr2, LACTB and Lpl in modifying adip-osity (ratio of total fat/body weight) in a preliminary analysis ofknockout or transgenic mice4,9. Here we present further validationfrom these mouse models, and the obesity-related phenotypic char-acteristics, gene expression signatures, and pathway and networkanalyses of four more candidate causal genes: GAS7 (transgenic),GPX3 (transgenic), Gyk (knockout) and Me1 (knockout).
In vivo characterization of mouse modelsWe previously showed that ZFP90tg mice had a significantly increasedfat mass to lean mass ratio4. Further phenotyping indicated thatZFP90tg mice also had significantly increased body weight, total fatpad mass, adiposity, and retroperitoneal, mesenteric and subcutaneousfat pad masses (Supplementary Table 2 online) compared to wild-type(WT) mice. Plasma lipid profiles showed nonsignificant trends for low-density lipoproteins and other parameters (Supplementary Table 3online), but our ability to assess these was limited because ZFP90tg micewere unable to breed and we studied only three transgenic founders.
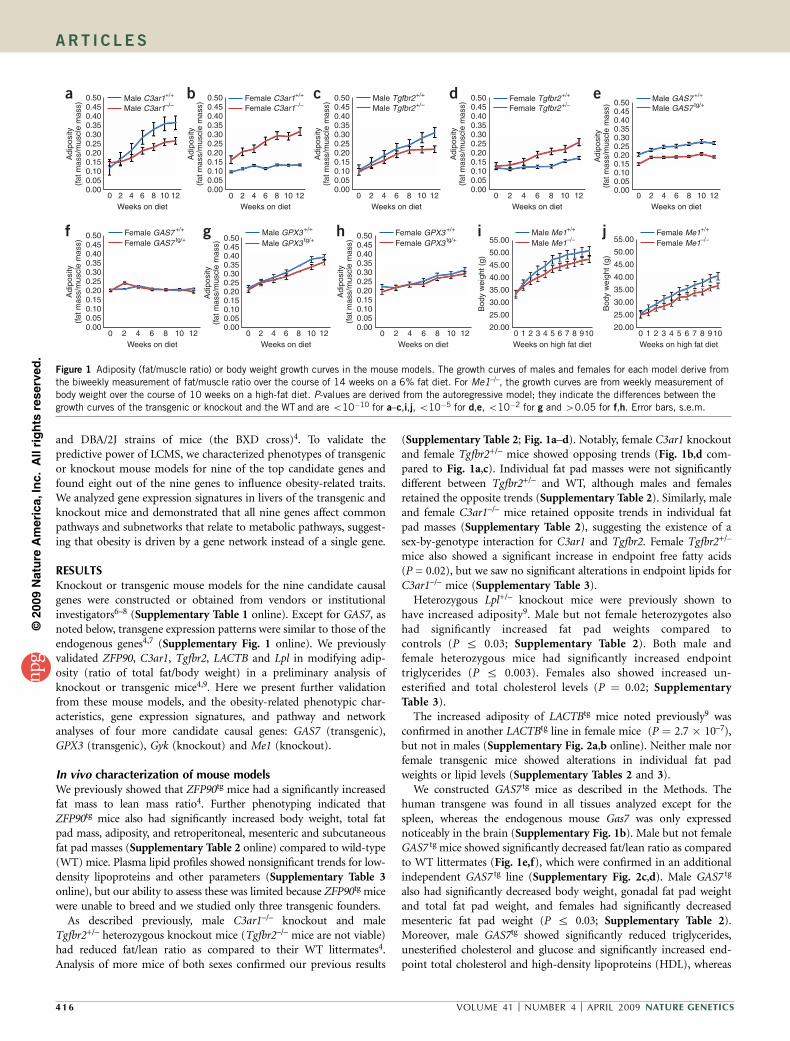
As described previously, male C3ar1–/– knockout and maleTgfbr2+/– heterozygous knockout mice (Tgfbr2–/– mice are not viable)had reduced fat/lean ratio as compared to their WT littermates4.Analysis of more mice of both sexes confirmed our previous results
(Supplementary Table 2; Fig. 1a–d). Notably, female C3ar1 knockoutand female Tgfbr2+/– mice showed opposing trends (Fig. 1b,d com-pared to Fig. 1a,c). Individual fat pad masses were not significantlydifferent between Tgfbr2+/– and WT, although males and femalesretained the opposite trends (Supplementary Table 2). Similarly, maleand female C3ar1–/– mice retained opposite trends in individual fatpad masses (Supplementary Table 2), suggesting the existence of asex-by-genotype interaction for C3ar1 and Tgfbr2. Female Tgfbr2+/–
mice also showed a significant increase in endpoint free fatty acids(P = 0.02), but we saw no significant alterations in endpoint lipids forC3ar1–/– mice (Supplementary Table 3).
Heterozygous Lpl+/– knockout mice were previously shown tohave increased adiposity9. Male but not female heterozygotes alsohad significantly increased fat pad weights compared tocontrols (P r 0.03; Supplementary Table 2). Both male andfemale heterozygous mice had significantly increased endpointtriglycerides (P r 0.003). Females also showed increased un-esterified and total cholesterol levels (P ¼ 0.02; SupplementaryTable 3).
The increased adiposity of LACTBtg mice noted previously9 wasconfirmed in another LACTBtg line in female mice (P ¼ 2.7 � 10–7),but not in males (Supplementary Fig. 2a,b online). Neither male norfemale transgenic mice showed alterations in individual fat padweights or lipid levels (Supplementary Tables 2 and 3).
We constructed GAS7 tg mice as described in the Methods. Thehuman transgene was found in all tissues analyzed except for thespleen, whereas the endogenous mouse Gas7 was only expressednoticeably in the brain (Supplementary Fig. 1b). Male but not femaleGAS7 tg mice showed significantly decreased fat/lean ratio as comparedto WT littermates (Fig. 1e,f), which were confirmed in an additionalindependent GAS7 tg line (Supplementary Fig. 2c,d). Male GAS7 tg
also had significantly decreased body weight, gonadal fat pad weightand total fat pad weight, and females had significantly decreasedmesenteric fat pad weight (P r 0.03; Supplementary Table 2).Moreover, male GAS7tg showed significantly reduced triglycerides,unesterified cholesterol and glucose and significantly increased end-point total cholesterol and high-density lipoproteins (HDL), whereas
0.50a b c d eMale C3ar1+/+
Male C3ar1–/–Female C3ar1+/+
Female C3ar1–/–Male Tgfbr2+/+
Male Tgfbr2+/–Male GAS7 +/+
Male GAS7 tg/+Female Tgfbr2+/+
Female Tgfbr2+/–0.450.400.350.300.25
Adi
posi
ty(f
at m
ass/
mus
cle
mas
s)
0.200.150.100.050.00
0.500.450.400.350.300.25
Adi
posi
ty(f
at m
ass/
mus
cle
mas
s)
0.200.150.100.050.00
0.500.450.400.350.300.25
Adi
posi
ty(f
at m
ass/
mus
cle
mas
s)
0.200.150.100.050.00
0.500.450.400.350.300.25
Adi
posi
ty(f
at m
ass/
mus
cle
mas
s)
0.200.150.100.050.00
0.500.450.400.350.300.25
Adi
posi
ty(f
at m
ass/
mus
cle
mas
s)
0.200.150.100.050.00
0 2 4 6Weeks on diet
8 10 12 0 2 4 6Weeks on diet
8 10 12 0 2 4 6Weeks on diet
8 10 12 0 2 4 6Weeks on diet
8 10 12 0 2 4 6Weeks on diet
8 10 12
f g h i jFemale GAS7 +/+
Female GAS7 tg/+Female GPX3 +/+
Female GPX3 tg/+Male GPX3 +/+
Male GPX3 tg/+Female Me1+/+
Female Me1–/–Male Me1+/+
Male Me1–/–0.500.450.400.350.300.25
Adi
posi
ty(f
at m
ass/
mus
cle
mas
s)
0.200.150.100.050.00
0.500.450.400.350.300.25
Adi
posi
ty(f
at m
ass/
mus
cle
mas
s)
0.200.150.100.050.00
0.500.450.400.350.300.25
Adi
posi
ty(f
at m
ass/
mus
cle
mas
s)
Bod
y w
eigh
t (g)
0.200.150.100.050.00
55.00
50.00
45.00
40.00
35.00
30.00
25.00
20.00
Bod
y w
eigh
t (g)
55.00
50.00
45.00
40.00
35.00
30.00
25.00
20.000 2 4 6
Weeks on diet8 10 12 0 2 4 6
Weeks on diet8 10 12 0 2 4 6
Weeks on diet8 10 12 0 1 2 3 4 5 6 7
Weeks on high fat diet8 910 0 1 2 3 4 5 6 7 8 910
Weeks on high fat diet
Figure 1 Adiposity (fat/muscle ratio) or body weight growth curves in the mouse models. The growth curves of males and females for each model derive from
the biweekly measurement of fat/muscle ratio over the course of 14 weeks on a 6% fat diet. For Me1–/–, the growth curves are from weekly measurement of
body weight over the course of 10 weeks on a high-fat diet. P-values are derived from the autoregressive model; they indicate the differences between the
growth curves of the transgenic or knockout and the WT and are o10�10 for a–c,i,j, o10�5 for d,e, o10�2 for g and 40.05 for f,h. Error bars, s.e.m.
4 16 VOLUME 41 [ NUMBER 4 [ APRIL 2009 NATURE GENETICS
A R T I C L E S
©20
09 N
atu
re A
mer
ica,
Inc.
All
rig
hts
res
erve
d.
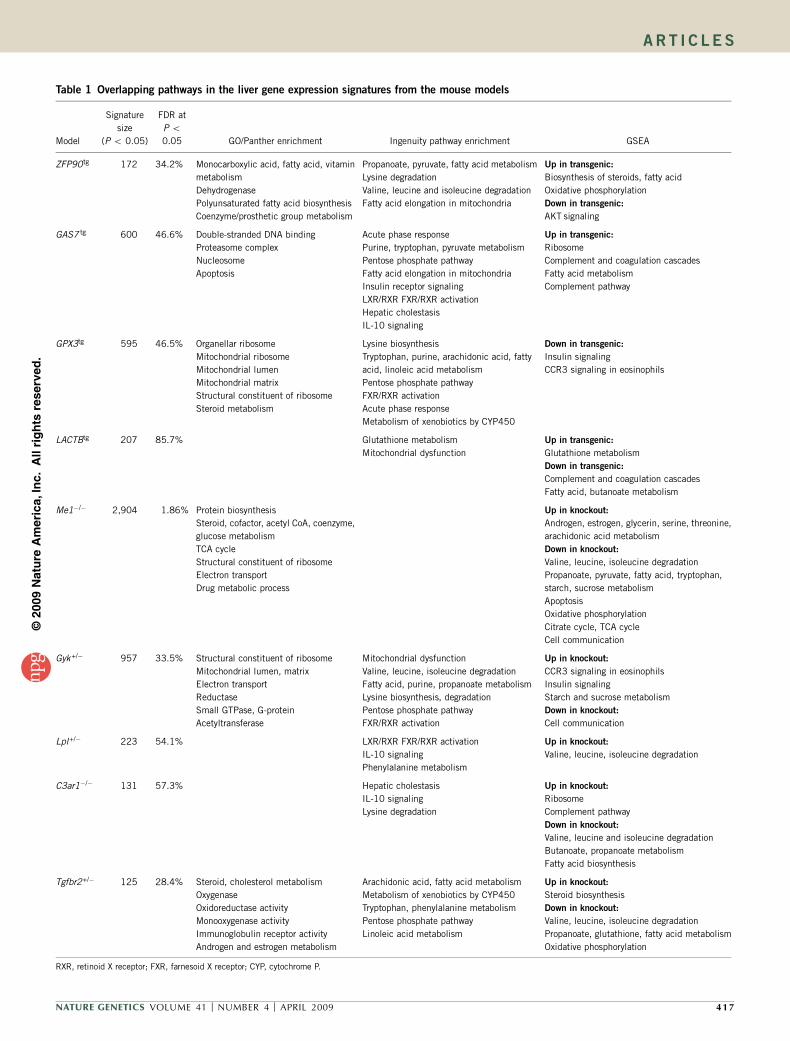
Table 1 Overlapping pathways in the liver gene expression signatures from the mouse models
Model
Signature
size
(P o 0.05)
FDR at
P o0.05 GO/Panther enrichment Ingenuity pathway enrichment GSEA
ZFP90tg 172 34.2% Monocarboxylic acid, fatty acid, vitamin
metabolism
Dehydrogenase
Polyunsaturated fatty acid biosynthesis
Coenzyme/prosthetic group metabolism
Propanoate, pyruvate, fatty acid metabolism
Lysine degradation
Valine, leucine and isoleucine degradation
Fatty acid elongation in mitochondria
Up in transgenic:
Biosynthesis of steroids, fatty acid
Oxidative phosphorylation
Down in transgenic:
AKT signaling
GAS7 tg 600 46.6% Double-stranded DNA binding
Proteasome complex
Nucleosome
Apoptosis
Acute phase response
Purine, tryptophan, pyruvate metabolism
Pentose phosphate pathway
Fatty acid elongation in mitochondria
Insulin receptor signaling
LXR/RXR FXR/RXR activation
Hepatic cholestasis
IL-10 signaling
Up in transgenic:
Ribosome
Complement and coagulation cascades
Fatty acid metabolism
Complement pathway
GPX3tg 595 46.5% Organellar ribosome
Mitochondrial ribosome
Mitochondrial lumen
Mitochondrial matrix
Structural constituent of ribosome
Steroid metabolism
Lysine biosynthesis
Tryptophan, purine, arachidonic acid, fatty
acid, linoleic acid metabolism
Pentose phosphate pathway
FXR/RXR activation
Acute phase response
Metabolism of xenobiotics by CYP450
Down in transgenic:
Insulin signaling
CCR3 signaling in eosinophils
LACTBtg 207 85.7% Glutathione metabolism
Mitochondrial dysfunction
Up in transgenic:
Glutathione metabolism
Down in transgenic:
Complement and coagulation cascades
Fatty acid, butanoate metabolism
Me1�/� 2,904 1.86% Protein biosynthesis
Steroid, cofactor, acetyl CoA, coenzyme,
glucose metabolism
TCA cycle
Structural constituent of ribosome
Electron transport
Drug metabolic process
Up in knockout:
Androgen, estrogen, glycerin, serine, threonine,
arachidonic acid metabolism
Down in knockout:
Valine, leucine, isoleucine degradation
Propanoate, pyruvate, fatty acid, tryptophan,
starch, sucrose metabolism
Apoptosis
Oxidative phosphorylation
Citrate cycle, TCA cycle
Cell communication
Gyk+/� 957 33.5% Structural constituent of ribosome
Mitochondrial lumen, matrix
Electron transport
Reductase
Small GTPase, G-protein
Acetyltransferase
Mitochondrial dysfunction
Valine, leucine, isoleucine degradation
Fatty acid, purine, propanoate metabolism
Lysine biosynthesis, degradation
Pentose phosphate pathway
FXR/RXR activation
Up in knockout:
CCR3 signaling in eosinophils
Insulin signaling
Starch and sucrose metabolism
Down in knockout:
Cell communication
Lpl+/� 223 54.1% LXR/RXR FXR/RXR activation
IL-10 signaling
Phenylalanine metabolism
Up in knockout:
Valine, leucine, isoleucine degradation
C3ar1�/� 131 57.3% Hepatic cholestasis
IL-10 signaling
Lysine degradation
Up in knockout:
Ribosome
Complement pathway
Down in knockout:
Valine, leucine and isoleucine degradation
Butanoate, propanoate metabolism
Fatty acid biosynthesis
Tgfbr2+/� 125 28.4% Steroid, cholesterol metabolism
Oxygenase
Oxidoreductase activity
Monooxygenase activity
Immunoglobulin receptor activity
Androgen and estrogen metabolism
Arachidonic acid, fatty acid metabolism
Metabolism of xenobiotics by CYP450
Tryptophan, phenylalanine metabolism
Pentose phosphate pathway
Linoleic acid metabolism
Up in knockout:
Steroid biosynthesis
Down in knockout:
Valine, leucine, isoleucine degradation
Propanoate, glutathione, fatty acid metabolism
Oxidative phosphorylation
RXR, retinoid X receptor; FXR, farnesoid X receptor; CYP, cytochrome P.
NATURE GENETICS VOLUME 41 [ NUMBER 4 [ APRIL 2009 41 7
A R T I C L E S
©20
09 N
atu
re A
mer
ica,
Inc.
All
rig
hts
res
erve
d.
female transgenic mice showed only significantly reduced unesterifiedcholesterol (P r 0.05; Supplementary Table 3).
For GAS7 tg males, the difference in adiposity appeared at the firstmeasurement time point at 11 weeks of age and the increase in thedifference with age was not as obvious as in the other models. Toassess a possible embryonic effect of the transgene, we measured bodyweights of male GAS7 mice at weaning (3 weeks) and found that thesewere not significantly different from littermate controls for bothtransgenic lines. The body weights at weaning from the GAS7tg lineanalyzed in Figure 1e are presented as Supplementary Figure 2e.
GPX3tg male but not female mice showed a significant decrease infat/lean ratio growth compared to controls (Fig. 1g,h). No differencesin individual fat pad weights were seen (Supplementary Table 2).Female GPX3tg mice showed increased endpoint total cholesterol andHDL levels as compared to female controls (P r 0.02; SupplementaryTable 3).
Gyk is located on the X chromosome, and knockout males die by4 d of age, whereas homozygous females probably die as embryos8.Therefore, only Gyk female heterozygous mice were characterized.There were no significant alterations in fat/lean ratio as comparedto their WT littermates (Supplementary Fig. 2f), nor in individualor total fat pad weights (Supplementary Table 2). They did, how-ever, show decreases in free fatty acids and glucose (P r 0.03;Supplementary Table 3).
The Me1–/– mice were characterized at a separate facility where thegrowth curves of body weight instead of adiposity were recorded whilemice were on several different diets, including a medium high fat diet
(44.9% kcal from fat) and a high sucrose diet (76.5% kcal fromcarbohydrate). Both male and female Me1–/– mice on a medium highfat diet showed decreased body weight (Fig. 1i,j). A similar trend wasalso observed in male (P = 4.6 � 10–13) though not female knockoutmice on a high sucrose diet (Supplementary Fig. 2g,h). We measuredadiposity by NMR at the beginning and the end of the diet period inthe Me1 mice fed on high fat and high sucrose diets and did not findsignificant differences in initial or endpoint adiposity in mice on eitherdiet (Supplementary Fig. 2i,j), though there was a trend towardreduced endpoint fat mass as determined by NMR in male knockoutmice on high sucrose diet (7.61 ± 0.31 in knockout and 6.75 ± 0.26 inWT; P ¼ 0.06), consistent with the decreased body weight. Me1–/–
mice on high fat but not a high sucrose diet showed a significantdifference in food intake (males only) relative to littermate controls(P r 0.017; Supplementary Fig. 3 online). Thus, food intakealone cannot account for the significantly decreased body weight inMe1–/– mice.
Gene expression profiling of mouse modelsTo explore the mechanisms underlying the observed phenotypicchanges, we profiled male liver tissue from each mouse model (withthe exception of the Gyk+/– female) to obtain gene expression signa-tures for each of the individual candidate causal genes. At P o 0.05(t-test), we observed hundreds to thousands of genes whose expressionlevels were altered in the livers of each of the transgenic or knockoutmouse strains compared to their WT littermates (Table 1). The falsediscovery rate (FDR) ranged from 1.9%–86% at this P-value cutoff.The high FDR values in most of the profiling experiments are likely tobe due to the relatively small number of mice (n ¼ 3 to 9). Thesignature genes can be found in Supplementary Tables 4–12 online.We reasoned that although the relatively high FDR valueswould influence the confidence in individual signature genesidentified, they should have less impact on the pathway analysesdiscussed below.
Propanoatemetabolism
Ascorbatemetabolism
Alaninemetabolism
Pyruvatemetabolism
γ-Hexachlorocyclohexanedegradation
Tryptophanmetabolism
2, 3, 5, 7, 9
Butanoatemetabolism
Propionyl CoA
Succinyl CoA
TCAFree fatty
acidmetabolism
Cholesterol Bile acidsynthesis
Glycerolipidmetabolism
Valine, isoleucine,leucine degradation
1, 5, 6, 8, 9 1, 5, 6, 7, 8, 9
1. ZFP90 tg (7 pathways)2. GAS7 tg (4 pathways)3. GPX3 tg (4 pathways)4. LACTBtg (2 pathways)5. Me1–/– (7 pathways)6. Gyk+/– (5 pathways)7. Lpl+/– (3 pathways)8. C3ar1–/– (7 pathways)9. Tgfbr2+/– (7 pathways)
1, 2, 3, 6, 7, 9
1, 4, 8
8
1, 9 1, 2, 5
1, 2, 3, 4,5, 6, 8, 9
3, 6, 8
5
Androgen andestrogen
metabolism
5, 9 8
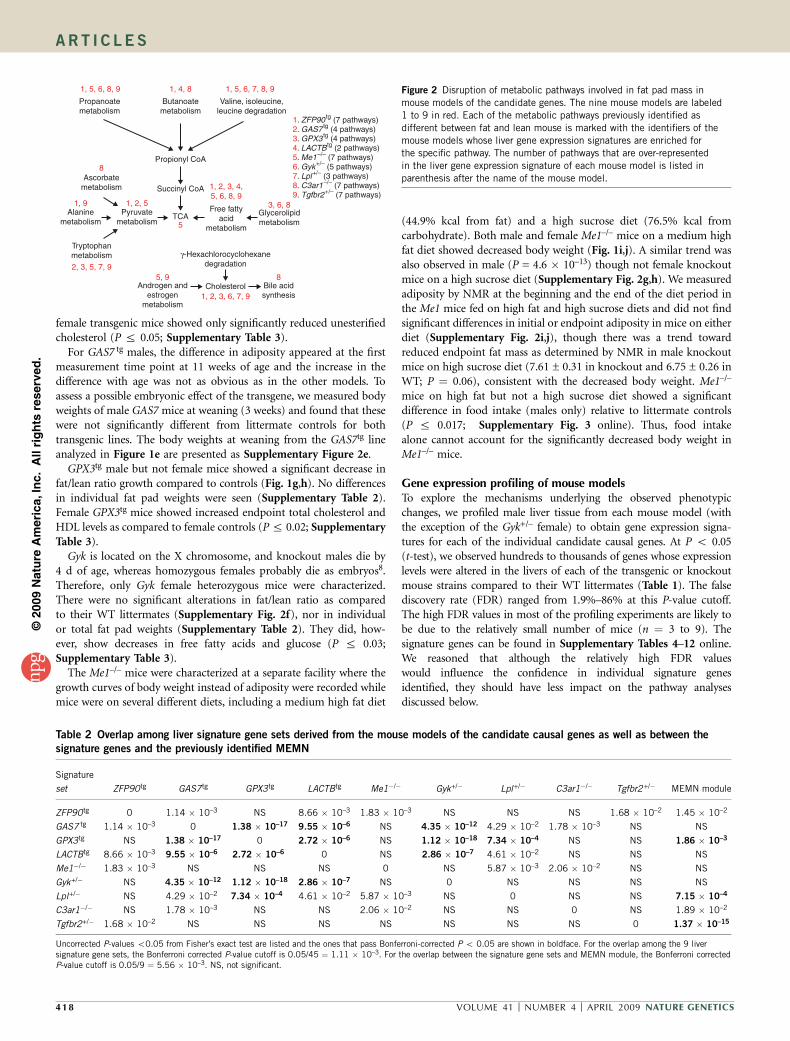
Figure 2 Disruption of metabolic pathways involved in fat pad mass in
mouse models of the candidate genes. The nine mouse models are labeled
1 to 9 in red. Each of the metabolic pathways previously identified as
different between fat and lean mouse is marked with the identifiers of the
mouse models whose liver gene expression signatures are enriched for
the specific pathway. The number of pathways that are over-represented
in the liver gene expression signature of each mouse model is listed in
parenthesis after the name of the mouse model.
Table 2 Overlap among liver signature gene sets derived from the mouse models of the candidate causal genes as well as between the
signature genes and the previously identified MEMN
Signature
set ZFP90tg GAS7tg GPX3tg LACTBtg Me1�/� Gyk+/� Lpl+/� C3ar1�/� Tgfbr2+/� MEMN module
ZFP90tg 0 1.14 � 10–3 NS 8.66 � 10–3 1.83 � 10–3 NS NS NS 1.68 � 10–2 1.45 � 10–2
GAS7 tg 1.14 � 10–3 0 1.38 � 10–17 9.55 � 10–6 NS 4.35 � 10–12 4.29 � 10–2 1.78 � 10–3 NS NS
GPX3tg NS 1.38 � 10–17 0 2.72 � 10–6 NS 1.12 � 10–18 7.34 � 10–4 NS NS 1.86 � 10–3
LACTBtg 8.66 � 10–3 9.55 � 10–6 2.72 � 10–6 0 NS 2.86 � 10–7 4.61 � 10–2 NS NS NS
Me1�/� 1.83 � 10–3 NS NS NS 0 NS 5.87 � 10–3 2.06 � 10–2 NS NS
Gyk+/� NS 4.35 � 10–12 1.12 � 10–18 2.86 � 10–7 NS 0 NS NS NS NS
Lpl+/� NS 4.29 � 10–2 7.34 � 10–4 4.61 � 10–2 5.87 � 10–3 NS 0 NS NS 7.15 � 10–4
C3ar1�/� NS 1.78 � 10–3 NS NS 2.06 � 10–2 NS NS 0 NS 1.89 � 10–2
Tgfbr2+/� 1.68 � 10–2 NS NS NS NS NS NS NS 0 1.37 � 10–15
Uncorrected P-values o0.05 from Fisher’s exact test are listed and the ones that pass Bonferroni-corrected P o 0.05 are shown in boldface. For the overlap among the 9 liversignature gene sets, the Bonferroni corrected P-value cutoff is 0.05/45 ¼ 1.11 � 10–3. For the overlap between the signature gene sets and MEMN module, the Bonferroni correctedP-value cutoff is 0.05/9 ¼ 5.56 � 10–3. NS, not significant.
4 18 VOLUME 41 [ NUMBER 4 [ APRIL 2009 NATURE GENETICS
A R T I C L E S
©20
09 N
atu
re A
mer
ica,
Inc.
All
rig
hts
res
erve
d.
We used two complementary methods—Fisher’s exact test–basedenrichment analysis of Gene Ontology (GO) functional categories10,Panther pathways11 or Ingenuity canonical pathways (IngenuitySystems); and Gene Set Enrichment Analysis (GSEA) of curatedfunctional gene sets from public databases based on weighted Kolmo-gorov-Smirnov–like statistics12— to analyze the functional relevanceof the liver gene expression profiles to the phenotypic traits. The livergene signatures from the mouse models were enriched for manyoverlapping metabolic pathways (Table 1; Supplementary Table 13online). Several mouse models showed enrichments for pathwaysrelated to steroid, fatty acid, amino acid and glutathione metabolismpathways, as well as purine metabolism, the pentose phosphate path-way and interleukin (IL)-10 signaling. Previously, we reported 13tricarboxylic acid (TCA) cycle–centered metabolic pathways as beingdifferentially affected in fat and lean mice from the F2 DBA/J andC57BL/6J intercross13. Two or more over-represented metabolic path-ways identified for each strain of mice in the current study overlappedwith these previously described pathways (Fig. 2). Therefore, thecausal genes identified by the LCMS procedure and tested in thisstudy are likely to affect adiposity by modifying similar obesity-related
pathways. Moreover, the signature genes from each of the mousemodels overlap significantly with the signature genes identified fromone or more of the other mouse models (Table 2).
Overlap with a macrophage-enriched metabolic networkOn the basis of the coexpression networks constructed from liver andadipose tissues collected from a mouse cross between C57BL/6J (B6)and C3H/HeJ on an apolipoprotein E null background (BXH/apoE),we previously identified a macrophage-enriched metabolic network(MEMN) that is highly associated with metabolic traits and seems tobe of macrophage origin9. Five of the nine genes under validation—namely, Zfp90, Lactb, Lpl, C3ar1 and Tgfbr2—were within thisMEMN subnetwork. In addition, the liver gene signatures derivedfrom five out of the nine validation mouse models—ZFP90 transgenic,GPX3 transgenic, Lpl knockout, C3ar1 knockout and Tgfbr2 knock-out—significantly overlapped with MEMN genes (Table 2).
These candidate genes had been identified as causal genes forobesity from a C57BL/6 � DBA/2J cross. Now, in a different mousecross setting (BxH/apoE), many of these candidate genes and theirdownstream genes were confirmed to be within or highly overlap with
a coexpression subnetwork that is relevant toobesity, diabetes and atherosclerosis traits.Furthermore, we recently uncovered ahuman MEMN that is associated with obe-sity-related traits and overlaps extensivelywith the mouse MEMN we describe here14.Therefore, it was not surprising to findC3AR1, LACTB and LPL as well as the pre-viously characterized HSD11B1 (ref. 15)among the human MEMN network genes,further highlighting the networks sharedbetween mice and humans and suggesting acommon mechanism leading to the develop-ment of obesity.
Bayesian network analysis of liversignatures in mouse modelsAs the sample sizes for defining perturbationsignatures were small, the quality of thesignatures derived could be noisy, thus limit-ing our ability to see further significant over-laps between these signatures. To overcomethe problem of noisy signatures, we projectedthem onto our liver transcriptional bayesiannetwork and then compared the subnet-works around the signatures instead ofsignatures themselves16.
Table 3 Overlap among the liver transcriptional subnetworks representing the liver signatures of the mouse models
Subnetwork ZFP90tg GAS7 tg GPX3tg LACTBtg Me1�/� Gyk+/� Lpl+/� C3ar1�/� Tgfbr2 +/� MEMN
ZFP90tg 0 2.99 � 10–81 2.93 � 10–65 1.57 � 10–24 4.36 � 10–153 1.40 � 10–66 9.35 � 10–58 2.91 � 10–40 1.55 � 10–61 2.07 � 10–28
GAS7 tg 2.99 � 10–81 0 2.55 � 10–223 5.78 � 10–67 1.88 � 10–299 5.99 � 10–185 7.97 � 10–69 2.48 � 10–93 1.39 � 10–68 1.32 � 10–17
GPX3tg 2.93 � 10–65 2.55 � 10–223 0 5.16 � 10–58 1.97 � 10–249 9.85 � 10–169 1.95 � 10–72 2.33 � 10–80 5.60 � 10–60 3.36 � 10–23
LACTBtg 1.57 � 10–24 5.78 � 10–67 5.16 � 10–58 0 3.77 � 10–82 1.88 � 10–59 1.68 � 10–25 3.47 � 10–16 4.17 � 10–18 5.51 � 10–7
Me1�/� 4.36 � 10–153 1.88 � 10–299 1.97 � 10–249 3.77 � 10–82 0 6.94 � 10–240 1.82 � 10–130 6.97 � 10–138 6.72 � 10–146 1.20 � 10–44
Gyk+/� 1.40 � 10–66 5.99 � 10–185 9.85 � 10–169 1.88 � 10–59 6.94 � 10–240 0 1.21 � 10–49 2.88 � 10–54 4.44 � 10–58 1.56 � 10–18
Lpl+/� 9.35 � 10–58 7.97 � 10–69 1.95 � 10–72 1.68 � 10–25 1.82 � 10–130 1.21 � 10–49 0 4.90 � 10–37 1.28 � 10–42 3.65 � 10–22
C3ar1�/� 2.91 � 10–40 2.48 � 10–93 2.33 � 10–80 3.47 � 10–16 6.97 � 10–138 2.88 � 10–54 4.90 � 10–37 0 1.40 � 10–39 1.74 � 10–12
Tgfbr2+/� 1.55 � 10–61 1.39 � 10–68 5.60 � 10–60 4.17 � 10–18 6.72 � 10–146 4.44 � 10–58 1.28 � 10–42 1.40 � 10–39 0 1.57 � 10–99
All P-values shown are derived from Fisher’s exact test and pass Bonferroni corrected P o 0.05.
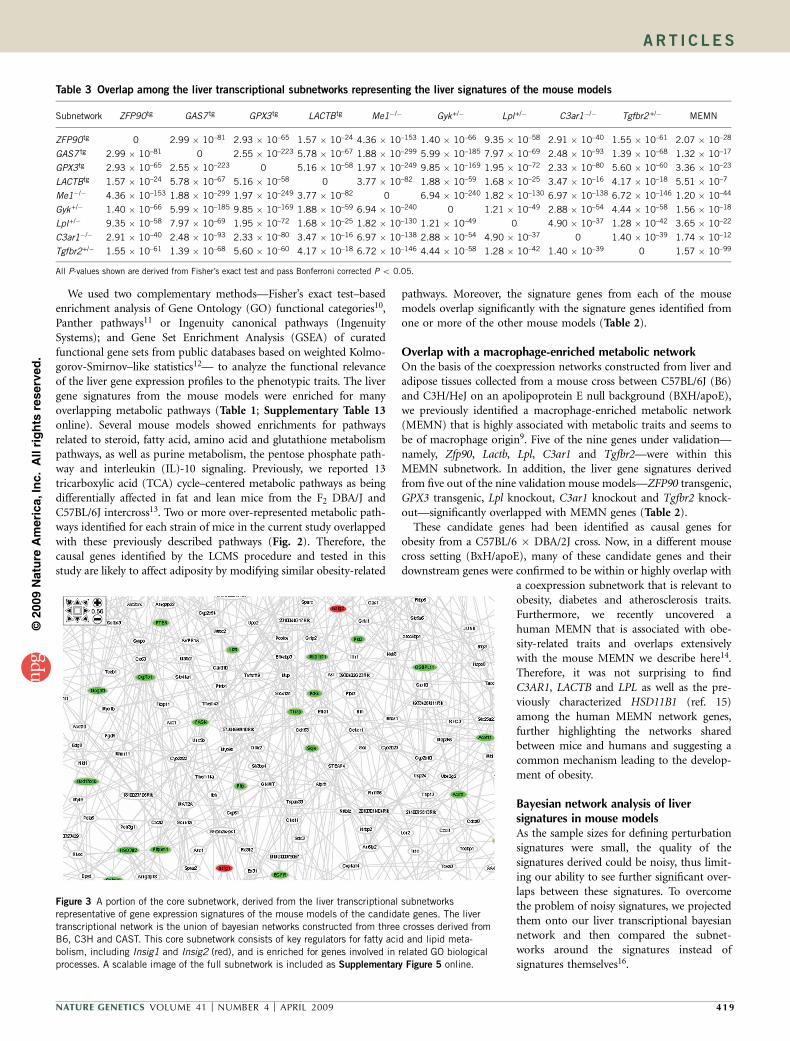
Figure 3 A portion of the core subnetwork, derived from the liver transcriptional subnetworks
representative of gene expression signatures of the mouse models of the candidate genes. The liver
transcriptional network is the union of bayesian networks constructed from three crosses derived from
B6, C3H and CAST. This core subnetwork consists of key regulators for fatty acid and lipid meta-
bolism, including Insig1 and Insig2 (red), and is enriched for genes involved in related GO biological
processes. A scalable image of the full subnetwork is included as Supplementary Figure 5 online.
NATURE GENETICS VOLUME 41 [ NUMBER 4 [ APRIL 2009 41 9
A R T I C L E S
©20
09 N
atu
re A
mer
ica,
Inc.
All
rig
hts
res
erve
d.
We previously described a method to reconstruct probabilistic,causal bayesian networks by integrating genetic and gene expressiondata4,17. A liver transcriptional network was constructed based onthree F2 intercross populations derived from the C57BL/6J, C3H/HeJand CAST/Ei strains described previously18 (see Methods). For eachperturbation signature, we extracted the largest connected subnetworkin the whole liver transcriptional network as described19 (see Meth-ods). All of these subnetworks overlapped significantly with oneanother and with the MEMN module (Table 3), again suggestingthat all causal genes affect a common pathway.
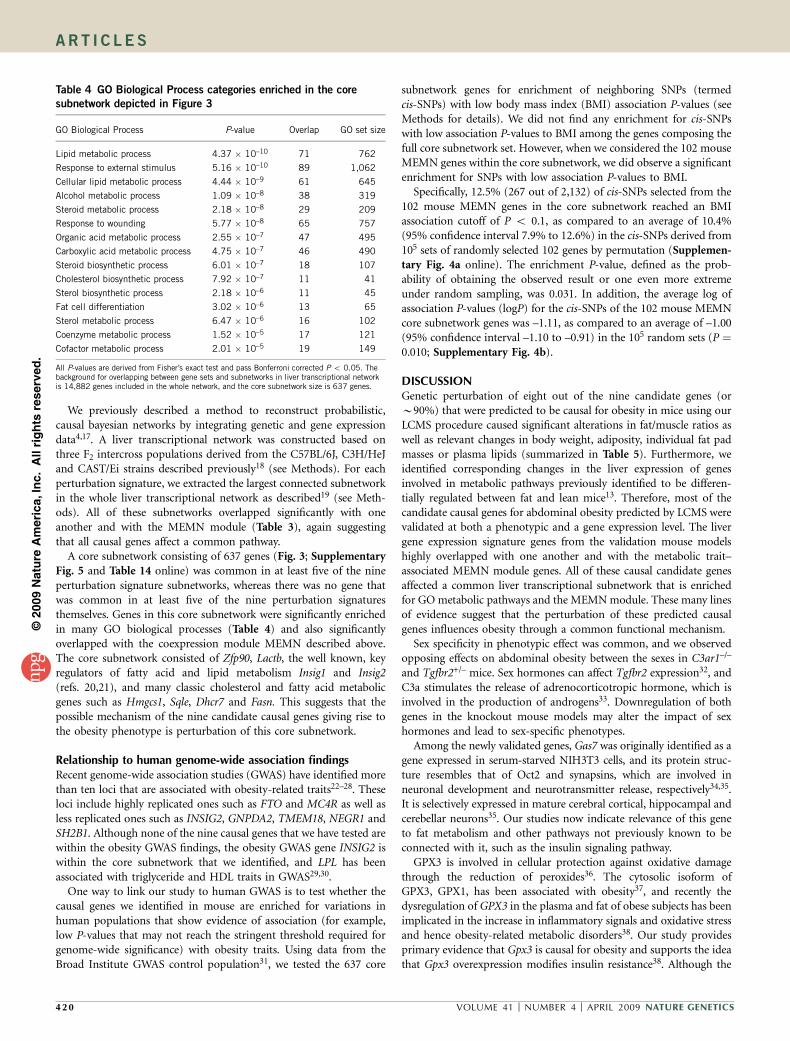
A core subnetwork consisting of 637 genes (Fig. 3; SupplementaryFig. 5 and Table 14 online) was common in at least five of the nineperturbation signature subnetworks, whereas there was no gene thatwas common in at least five of the nine perturbation signaturesthemselves. Genes in this core subnetwork were significantly enrichedin many GO biological processes (Table 4) and also significantlyoverlapped with the coexpression module MEMN described above.The core subnetwork consisted of Zfp90, Lactb, the well known, keyregulators of fatty acid and lipid metabolism Insig1 and Insig2(refs. 20,21), and many classic cholesterol and fatty acid metabolicgenes such as Hmgcs1, Sqle, Dhcr7 and Fasn. This suggests that thepossible mechanism of the nine candidate causal genes giving rise tothe obesity phenotype is perturbation of this core subnetwork.
Relationship to human genome-wide association findingsRecent genome-wide association studies (GWAS) have identified morethan ten loci that are associated with obesity-related traits22–28. Theseloci include highly replicated ones such as FTO and MC4R as well asless replicated ones such as INSIG2, GNPDA2, TMEM18, NEGR1 andSH2B1. Although none of the nine causal genes that we have tested arewithin the obesity GWAS findings, the obesity GWAS gene INSIG2 iswithin the core subnetwork that we identified, and LPL has beenassociated with triglyceride and HDL traits in GWAS29,30.
One way to link our study to human GWAS is to test whether thecausal genes we identified in mouse are enriched for variations inhuman populations that show evidence of association (for example,low P-values that may not reach the stringent threshold required forgenome-wide significance) with obesity traits. Using data from theBroad Institute GWAS control population31, we tested the 637 core
subnetwork genes for enrichment of neighboring SNPs (termedcis-SNPs) with low body mass index (BMI) association P-values (seeMethods for details). We did not find any enrichment for cis-SNPswith low association P-values to BMI among the genes composing thefull core subnetwork set. However, when we considered the 102 mouseMEMN genes within the core subnetwork, we did observe a significantenrichment for SNPs with low association P-values to BMI.
Specifically, 12.5% (267 out of 2,132) of cis-SNPs selected from the102 mouse MEMN genes in the core subnetwork reached an BMIassociation cutoff of P o 0.1, as compared to an average of 10.4%(95% confidence interval 7.9% to 12.6%) in the cis-SNPs derived from105 sets of randomly selected 102 genes by permutation (Supplemen-tary Fig. 4a online). The enrichment P-value, defined as the prob-ability of obtaining the observed result or one even more extremeunder random sampling, was 0.031. In addition, the average log ofassociation P-values (logP) for the cis-SNPs of the 102 mouse MEMNcore subnetwork genes was –1.11, as compared to an average of –1.00(95% confidence interval –1.10 to –0.91) in the 105 random sets (P ¼0.010; Supplementary Fig. 4b).
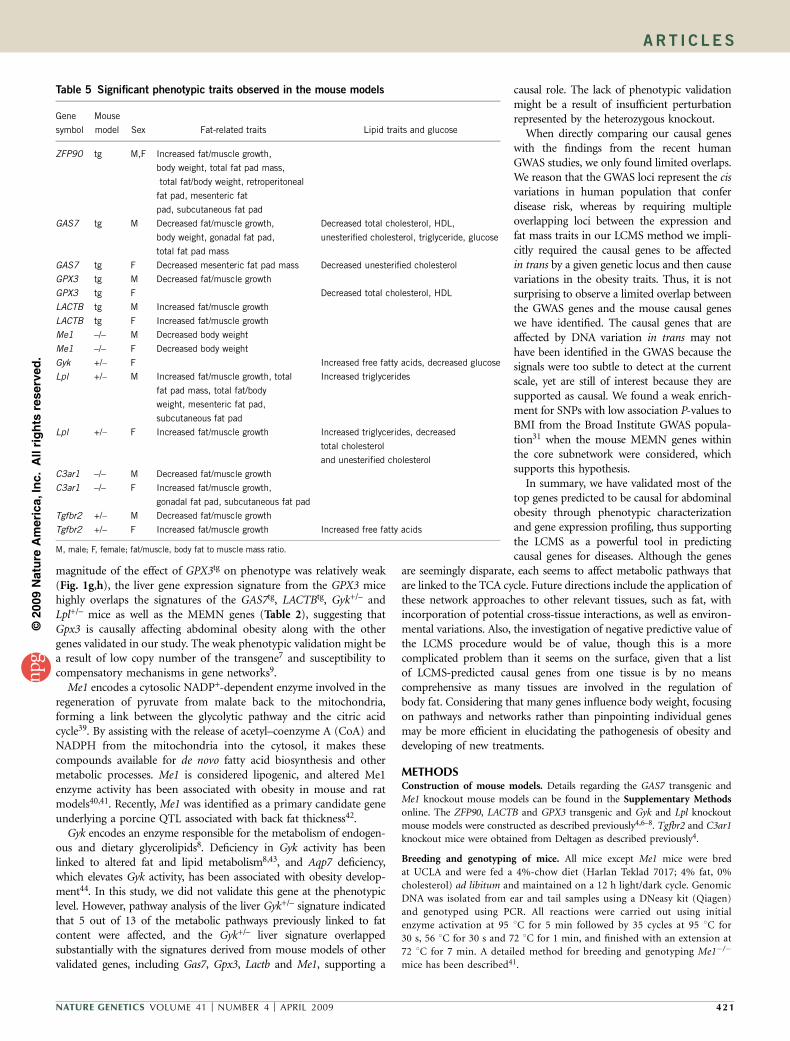
DISCUSSIONGenetic perturbation of eight out of the nine candidate genes (orB90%) that were predicted to be causal for obesity in mice using ourLCMS procedure caused significant alterations in fat/muscle ratios aswell as relevant changes in body weight, adiposity, individual fat padmasses or plasma lipids (summarized in Table 5). Furthermore, weidentified corresponding changes in the liver expression of genesinvolved in metabolic pathways previously identified to be differen-tially regulated between fat and lean mice13. Therefore, most of thecandidate causal genes for abdominal obesity predicted by LCMS werevalidated at both a phenotypic and a gene expression level. The livergene expression signature genes from the validation mouse modelshighly overlapped with one another and with the metabolic trait–associated MEMN module genes. All of these causal candidate genesaffected a common liver transcriptional subnetwork that is enrichedfor GO metabolic pathways and the MEMN module. These many linesof evidence suggest that the perturbation of these predicted causalgenes influences obesity through a common functional mechanism.
Sex specificity in phenotypic effect was common, and we observedopposing effects on abdominal obesity between the sexes in C3ar1–/–
and Tgfbr2+/– mice. Sex hormones can affect Tgfbr2 expression32, andC3a stimulates the release of adrenocorticotropic hormone, which isinvolved in the production of androgens33. Downregulation of bothgenes in the knockout mouse models may alter the impact of sexhormones and lead to sex-specific phenotypes.
Among the newly validated genes, Gas7 was originally identified as agene expressed in serum-starved NIH3T3 cells, and its protein struc-ture resembles that of Oct2 and synapsins, which are involved inneuronal development and neurotransmitter release, respectively34,35.It is selectively expressed in mature cerebral cortical, hippocampal andcerebellar neurons35. Our studies now indicate relevance of this geneto fat metabolism and other pathways not previously known to beconnected with it, such as the insulin signaling pathway.
GPX3 is involved in cellular protection against oxidative damagethrough the reduction of peroxides36. The cytosolic isoform ofGPX3, GPX1, has been associated with obesity37, and recently thedysregulation of GPX3 in the plasma and fat of obese subjects has beenimplicated in the increase in inflammatory signals and oxidative stressand hence obesity-related metabolic disorders38. Our study providesprimary evidence that Gpx3 is causal for obesity and supports the ideathat Gpx3 overexpression modifies insulin resistance38. Although the
Table 4 GO Biological Process categories enriched in the core
subnetwork depicted in Figure 3
GO Biological Process P-value Overlap GO set size
Lipid metabolic process 4.37 � 10–10 71 762
Response to external stimulus 5.16 � 10–10 89 1,062
Cellular lipid metabolic process 4.44 � 10–9 61 645
Alcohol metabolic process 1.09 � 10–8 38 319
Steroid metabolic process 2.18 � 10–8 29 209
Response to wounding 5.77 � 10–8 65 757
Organic acid metabolic process 2.55 � 10–7 47 495
Carboxylic acid metabolic process 4.75 � 10–7 46 490
Steroid biosynthetic process 6.01 � 10–7 18 107
Cholesterol biosynthetic process 7.92 � 10–7 11 41
Sterol biosynthetic process 2.18 � 10–6 11 45
Fat cell differentiation 3.02 � 10–6 13 65
Sterol metabolic process 6.47 � 10–6 16 102
Coenzyme metabolic process 1.52 � 10–5 17 121
Cofactor metabolic process 2.01 � 10–5 19 149
All P-values are derived from Fisher’s exact test and pass Bonferroni corrected P o 0.05. Thebackground for overlapping between gene sets and subnetworks in liver transcriptional networkis 14,882 genes included in the whole network, and the core subnetwork size is 637 genes.
4 20 VOLUME 41 [ NUMBER 4 [ APRIL 2009 NATURE GENETICS
A R T I C L E S
©20
09 N
atu
re A
mer
ica,
Inc.
All
rig
hts
res
erve
d.
magnitude of the effect of GPX3tg on phenotype was relatively weak(Fig. 1g,h), the liver gene expression signature from the GPX3 micehighly overlaps the signatures of the GAS7tg, LACTBtg, Gyk+/– andLpl+/– mice as well as the MEMN genes (Table 2), suggesting thatGpx3 is causally affecting abdominal obesity along with the othergenes validated in our study. The weak phenotypic validation might bea result of low copy number of the transgene7 and susceptibility tocompensatory mechanisms in gene networks9.
Me1 encodes a cytosolic NADP+-dependent enzyme involved in theregeneration of pyruvate from malate back to the mitochondria,forming a link between the glycolytic pathway and the citric acidcycle39. By assisting with the release of acetyl–coenzyme A (CoA) andNADPH from the mitochondria into the cytosol, it makes thesecompounds available for de novo fatty acid biosynthesis and othermetabolic processes. Me1 is considered lipogenic, and altered Me1enzyme activity has been associated with obesity in mouse and ratmodels40,41. Recently, Me1 was identified as a primary candidate geneunderlying a porcine QTL associated with back fat thickness42.
Gyk encodes an enzyme responsible for the metabolism of endogen-ous and dietary glycerolipids8. Deficiency in Gyk activity has beenlinked to altered fat and lipid metabolism8,43, and Aqp7 deficiency,which elevates Gyk activity, has been associated with obesity develop-ment44. In this study, we did not validate this gene at the phenotypiclevel. However, pathway analysis of the liver Gyk+/– signature indicatedthat 5 out of 13 of the metabolic pathways previously linked to fatcontent were affected, and the Gyk+/– liver signature overlappedsubstantially with the signatures derived from mouse models of othervalidated genes, including Gas7, Gpx3, Lactb and Me1, supporting a
causal role. The lack of phenotypic validationmight be a result of insufficient perturbationrepresented by the heterozygous knockout.
When directly comparing our causal geneswith the findings from the recent humanGWAS studies, we only found limited overlaps.We reason that the GWAS loci represent the cisvariations in human population that conferdisease risk, whereas by requiring multipleoverlapping loci between the expression andfat mass traits in our LCMS method we impli-citly required the causal genes to be affectedin trans by a given genetic locus and then causevariations in the obesity traits. Thus, it is notsurprising to observe a limited overlap betweenthe GWAS genes and the mouse causal geneswe have identified. The causal genes that areaffected by DNA variation in trans may nothave been identified in the GWAS because thesignals were too subtle to detect at the currentscale, yet are still of interest because they aresupported as causal. We found a weak enrich-ment for SNPs with low association P-values toBMI from the Broad Institute GWAS popula-tion31 when the mouse MEMN genes withinthe core subnetwork were considered, whichsupports this hypothesis.
In summary, we have validated most of thetop genes predicted to be causal for abdominalobesity through phenotypic characterizationand gene expression profiling, thus supportingthe LCMS as a powerful tool in predictingcausal genes for diseases. Although the genes
are seemingly disparate, each seems to affect metabolic pathways thatare linked to the TCA cycle. Future directions include the application ofthese network approaches to other relevant tissues, such as fat, withincorporation of potential cross-tissue interactions, as well as environ-mental variations. Also, the investigation of negative predictive value ofthe LCMS procedure would be of value, though this is a morecomplicated problem than it seems on the surface, given that a listof LCMS-predicted causal genes from one tissue is by no meanscomprehensive as many tissues are involved in the regulation ofbody fat. Considering that many genes influence body weight, focusingon pathways and networks rather than pinpointing individual genesmay be more efficient in elucidating the pathogenesis of obesity anddeveloping of new treatments.
METHODSConstruction of mouse models. Details regarding the GAS7 transgenic and
Me1 knockout mouse models can be found in the Supplementary Methods
online. The ZFP90, LACTB and GPX3 transgenic and Gyk and Lpl knockout
mouse models were constructed as described previously4,6–8. Tgfbr2 and C3ar1
knockout mice were obtained from Deltagen as described previously4.
Breeding and genotyping of mice. All mice except Me1 mice were bred
at UCLA and were fed a 4%-chow diet (Harlan Teklad 7017; 4% fat, 0%
cholesterol) ad libitum and maintained on a 12 h light/dark cycle. Genomic
DNA was isolated from ear and tail samples using a DNeasy kit (Qiagen)
and genotyped using PCR. All reactions were carried out using initial
enzyme activation at 95 1C for 5 min followed by 35 cycles at 95 1C for
30 s, 56 1C for 30 s and 72 1C for 1 min, and finished with an extension at
72 1C for 7 min. A detailed method for breeding and genotyping Me1�/�
mice has been described41.
Table 5 Significant phenotypic traits observed in the mouse models
Gene
symbol
Mouse
model Sex Fat-related traits Lipid traits and glucose
ZFP90 tg M,F Increased fat/muscle growth,
body weight, total fat pad mass,
total fat/body weight, retroperitoneal
fat pad, mesenteric fat
pad, subcutaneous fat pad
GAS7 tg M Decreased fat/muscle growth,
body weight, gonadal fat pad,
total fat pad mass
Decreased total cholesterol, HDL,
unesterified cholesterol, triglyceride, glucose
GAS7 tg F Decreased mesenteric fat pad mass Decreased unesterified cholesterol
GPX3 tg M Decreased fat/muscle growth
GPX3 tg F Decreased total cholesterol, HDL
LACTB tg M Increased fat/muscle growth
LACTB tg F Increased fat/muscle growth
Me1 –/– M Decreased body weight
Me1 –/– F Decreased body weight
Gyk +/– F Increased free fatty acids, decreased glucose
Lpl +/– M Increased fat/muscle growth, total
fat pad mass, total fat/body
weight, mesenteric fat pad,
subcutaneous fat pad
Increased triglycerides
Lpl +/– F Increased fat/muscle growth Increased triglycerides, decreased
total cholesterol
and unesterified cholesterol
C3ar1 –/– M Decreased fat/muscle growth
C3ar1 –/– F Increased fat/muscle growth,
gonadal fat pad, subcutaneous fat pad
Tgfbr2 +/– M Decreased fat/muscle growth
Tgfbr2 +/– F Increased fat/muscle growth Increased free fatty acids
M, male; F, female; fat/muscle, body fat to muscle mass ratio.
NATURE GENETICS VOLUME 41 [ NUMBER 4 [ APRIL 2009 42 1
A R T I C L E S
©20
09 N
atu
re A
mer
ica,
Inc.
All
rig
hts
res
erve
d.
Phenotypic characterization of the mouse models. Starting at 11 weeks of age,
mice (except Me1–/–) were fed a 6%-chow diet (Harlan Teklad 7013; 6.25% fat,
0% cholesterol) for 12 weeks. Each mouse was monitored for body weight and
evaluated by NMR (Brucker Minispec) for body weight composition including
lean mass, fat mass and water content over the course of the diet every 2 weeks.
At the end of the 12-week diet, we put mice to death using CO2 asphyxiation.
Gonadal (surrounding the gonads), retroperitoneal (beneath the kidneys),
mesenteric (attached to the intestines) and subcutaneous (below the surface
of the skin on the thighs) fat pads were collected and weighed. Liver was
collected for RNA profiling. All procedures were done in accordance with the
current US National Research Council Guide for the Care and Use of Laboratory
Animals and were approved by the University of California Los Angeles Animal
Research Committee. Further details regarding the characterization of the Gpx3
and Me1 mice can be found in the Supplementary Methods.
Analysis of phenotypic data. Student’s t-test was used to analyze the differences
in the phenotypic traits between transgenic or knockout mice and their WT
littermate controls. The significance level was set to P o 0.05. Significance of the
difference in the growth curves of fat/muscle ratio between transgenic or
knockout and WT controls for all mouse models except Me1–/– mice and in
growth curves of body weight for Me1–/– mice was determined using an auto-
regressive method described previously to enhance the power of difference dete-
ction by leveraging repeated measures, over several time points, for each mouse4.
RNA sample preparation and microarray processing. For the liver tissues
from the ZFP90 transgenics, the Tgfbr2+/–, the C3ar1–/–, the Lpl+/–, the Me1–/–
and each of their respective littermate control mice, RNA preparation and array
hybridizations were performed at Rosetta Informatics. For C3ar1, Tgfbr2 and
ZFP90 mouse strains, the custom ink-jet microarrays used in this study were
manufactured by Agilent Technologies and consisted of 23,574 non-control
oligonucleotides extracted from mouse Unigene clusters and combined with
US National Center for Biotechnology Information Reference Sequence
(RefSeq) sequences and RIKEN45 full-length cDNA clones. For Lpl and Me1
mouse strains, the Agilent array consisted of 39,556 non-control probes
representing 37,687 genes. For GAS7tg, GPX3tg, LACTBtg and Gyk+/– female,
microarray profiling of the liver tissues was performed using Illumina Mou-
seRef-8 beadchips. Each beadchip contained 24,886 oligonucleotide probes
(849 control and 24,837 non-control) designed on the basis of the Mouse
Exonic Evidence Based Oligonucleotide (MEEBO) set, the RIKEN FANTOM 2
database and the RefSeq database. More details can be found in the Supple-
mentary Methods.
Selection of active or expressed gene sets based on microarray profiling. As a
limited number of mice (n ¼ 3–9) per mouse model was used for gene
expression profiling and the statistical power was low considering the large
number of multiple tests for tens of thousands genes, we restricted attention to
the subsets of genes that are more biologically relevant. The Agilent arrays do
not provide a measure of ‘presence’ or ‘absence’, and therefore, we selected set
of ‘most transcriptionally active genes’ for mouse models profiled with Agilent
arrays using the program Resolver3,46,47. The active genes were defined as those
with significance level P o 0.05 (as determined by error model3,46,47) in at least
10% of the mice for each strain, including both transgenic or knockout and
controls. These active genes represent those whose expression varies across
samples and thus are more biologically relevant. For mouse strains that were
profiled with Illumina arrays, the program BeadArray was used to normalize
the expression intensity values across as well as within arrays using the
‘‘average’’ algorithm embedded in the software. Genes with detection scores
of 40.99 (corresponding to detection P o 0.01) in at least 10% of the mice for
each strain of mice were selected as ‘expressed’ genes. This active and expressed
gene selection procedure substantially reduced the size of starting gene sets for
subsequent analysis, from B24,000 to B1,000–9,000 genes per strain of
mouse, thus helping to alleviate multiple-testing concerns.
Selection of signature gene sets based on microarray profiling. A Student’s
t-test was used to identify genes with significant differences between transgenic
or knockout mice and the corresponding WT control mice. These genes were
defined as ‘‘signature’’ genes, representing the perturbed gene expression
signature as a result of single gene modification. The significance level was
set to P o 0.05. The false discovery rate at this significance level was calculated
using Q-value as reported48. All statistical analyses were carried out in the
R statistical environment.
Pathway analysis. Each signature gene set identified above was classified using
Gene Ontology (GO)10 and Panther pathway11 database assignments. The
Ingenuity Pathway Analysis software (Ingenuity Systems, http://www.ingenuity.
com) was used to analyze the enrichment of canonical pathways in the
signature genes identified above, and we also analyzed the enrichment of
B470 functional gene sets curated from public databases using GSEA12. More
details can be found in the Supplementary Methods.
Mouse crosses and tissue collection. Three mouse crosses constructed from
C57BL/6J (B6), C3H/HeJ (C3H) and CAST/Ei (CAST)—namely, B6 � C3H
wild-type (BXH/wt), B6 � C3H on an ApoE null background (BXH/apoE) and
B6 � CAST (BXC)—were described previously18,49. More details can be found
in the Supplementary Methods.
Identification of the macrophage-enriched metabolic network. The construc-
tion of the coexpression network using liver and adipose tissues from BXH cross
and the identification of the MEMN has been described previously9. Briefly,
both genotype and gene expression data were used to construct coexpression
networks that consisted of highly connected genes from each tissue and sex. An
iterative search algorithm was then used to detect highly interconnected
subnetworks. One particular subnetwork that was highly enriched for causal
genes for all metabolic traits tested, highly conserved between tissues and sexes,
and highly enriched for macrophage genes was referred to as MEMN.
Construction of bayesian network and subnetwork for candidate causal gene
perturbation signatures. Liver expression data generated from the above three
mouse cross populations BXH/WT, BXH/apoE and BXC was integrated with
the genotypic data also generated in the same populations to reconstruct the
bayesian networks as previously described21–24. More details can be found in
the Supplementary Methods.
The construction of a subnetwork for a set of signature genes in the network
is as follows: given a set of genes, we identified all of the nearest neighbors of
these genes in the network (that is, we identified all nodes in the network that
were either in the input set or directly connected to a node in the input set). This
first step produced a set of node pairs connected by an edge. In the next step,
direct connections (edges) among all the nodes in these pairs were identified and
added. The resulting largest connected subnetwork (that is, after removal of all
smaller subnetworks that disconnect from the largest connected subnetwork)
was used as the subnetwork to represent the input set of signature genes.
The core subnetwork was identified by searching for genes that were present
in more than half—in this case, five—of the subnetworks representing the nine
liver signature gene sets of the mouse models. The enrichment of the core
subnetwork for 2,283 gene sets from GO Biological Processes category was
analyzed using Fisher’s exact test. A statistical cutoff of 2.2 � 10–5 was applied
to the nominal P-values to reflect the Bonferroni correction of multiple testing.
Comparison of signature genes across mouse models, between signature
genes and the bayesian subnetwork, and between signature genes and
MEMN genes. The significance of overlap between different gene sets was
estimated using Fisher’s exact test statistics under the null hypothesis that the
frequency of the genes in one signature set was the same between a reference set
of 18,739 genes with Entrez Gene identifier and the comparison gene set. The
background for overlapping between gene sets and subnetworks in liver
transcriptional network was 14,882 genes included in the whole network.
Enrichment of core subnetwork for genes and loci with low association
P-values to obesity traits in GWAS. The raw association P-values between
SNPs and BMI from the GWAS conducted by the BROAD Institute31 were
downloaded from the official website (http://www.broad.mit.edu/diabetes/).
For each gene in the 637 core subnetwork and the 102 mouse MEMN module9
genes within the core subnetwork, SNPs within a 100 kb distance (50 kb
upstream and 50 kb downstream), termed cis-SNPs, were selected from dbSNP
database and their association P-values to BMI in the control population of the
BROAD GWAS study were extracted. We compared each set of cis-SNPs of
4 22 VOLUME 41 [ NUMBER 4 [ APRIL 2009 NATURE GENETICS
A R T I C L E S
©20
09 N
atu
re A
mer
ica,
Inc.
All
rig
hts
res
erve
d.
interest with 105 sets of cis-SNPs from randomly selected gene sets with
matched size on the Rosetta/Merck Human 44k 1.1 microarray (GEO platform
identifier GPL4372), such that the number of cis-SNPs from the random gene
sets roughly matched that of the gene sets of our interest. Two different tests
were used to estimate the significance of enrichment for low association
P-values as detailed in Supplementary Methods.
Accession codes. Microarray data have been submitted to the GEO database
under superseries accession number GSE12000.
Note: Supplementary information is available on the Nature Genetics website.
ACKNOWLEDGMENTSThe authors thank R. Davis, P. Wen, M. Rosales, X. Wu, K. Ranola and X. Xiafor helping with the tissue collection. We would also like to thank L. Ingram-Drake and S. Charugundla for technical support and O. Mirochnitchenko andI. Goldberg for providing mouse models. The study was funded by US NationalInstitutes of Health grants DK072206, HL28481 and HL30568.
AUTHOR CONTRIBUTIONST.A.D., A.J.L., E.E.S., P.Y.L., X.Y., K.M.D., M.L.R. and D.J.M. designed the study.X.Y., H.Q., G.T., S. Majid, B.F., S.Q., L.W.C., D.E.-S., S. Mumick, S.S.W., A.v.N.,A.G., M.M. and C.R.F. performed the experiments. X.Y., J.L.D., J. Zhu, G.T., J.K.,K.W, J.R.L., T.X., M.C., J. Zhong, C.Z. and B.Z. participated in data analysis. X.Y.,J.L.D., J. Zhu, S.Q. and J. Zhong wrote the manuscript, with advice and editingfrom T.A.D., A.J.L. and E.E.S. R.R.K. coordinated the study. T.A.D., thecorresponding author, certifies that all authors have agreed to all content in themanuscript, including the data as presented.
COMPETING INTERESTS STATEMENTThe authors declare competing financial interests: details accompany the full-textHTML version of the paper at http://www.nature.com/naturegenetics/.
Published online at http://www.nature.com/naturegenetics/
Reprints and permissions information is available online at http://npg.nature.com/
reprintsandpermissions/
1. Doss, S., Schadt, E.E., Drake, T.A. & Lusis, A.J. Cis-acting expression quantitative traitloci in mice. Genome Res. 15, 681–691 (2005).
2. Monks, S.A. et al. Genetic inheritance of gene expression in human cell lines. Am. J.Hum. Genet. 75, 1094–1105 (2004).
3. Schadt, E.E. et al. Genetics of gene expression surveyed in maize, mouse and man.Nature 422, 297–302 (2003).
4. Schadt, E.E. et al. An integrative genomics approach to infer causal associationsbetween gene expression and disease. Nat. Genet. 37, 710–717 (2005).
5. Sieberts, S.K. & Schadt, E.E. Moving toward a system genetics view of disease. Mamm.Genome 18, 389–401 (2007).
6. Merkel, M. et al. Inactive lipoprotein lipase (LPL) alone increases selective cholesterolester uptake in vivo, whereas in the presence of active LPL it also increases triglyceridehydrolysis and whole particle lipoprotein uptake. J. Biol. Chem. 277, 7405–7411(2002).
7. Mirochnitchenko, O., Palnitkar, U., Philbert, M. & Inouye, M. Thermosensitive pheno-type of transgenic mice overproducing human glutathione peroxidases. Proc. Natl.Acad. Sci. USA 92, 8120–8124 (1995).
8. Huq, A.H., Lovell, R.S., Ou, C.N., Beaudet, A.L. & Craigen, W.J. X-linked glycerolkinase deficiency in the mouse leads to growth retardation, altered fat metabolism,autonomous glucocorticoid secretion and neonatal death. Hum. Mol. Genet. 6,1803–1809 (1997).
9. Chen, Y. et al. Variations in DNA elucidate molecular networks that cause disease.Nature 452, 429–435 (2008).
10. Ashburner, M. et al. Gene ontology: tool for the unification of biology. The GeneOntology Consortium. Nat. Genet. 25, 25–29 (2000).
11. Mi, H. et al. The PANTHER database of protein families, subfamilies, functions andpathways. Nucleic Acids Res. 33, D284–D288 (2005).
12. Subramanian, A. et al. Gene set enrichment analysis: a knowledge-based approach forinterpreting genome-wide expression profiles. Proc. Natl. Acad. Sci. USA 102,15545–15550 (2005).
13. Ghazalpour, A. et al. Genomic analysis of metabolic pathway gene expression in mice.Genome Biol. 6, R59 (2005).
14. Emilsson, V. et al. Genetics of gene expression and its effect on disease. Nature 452,423–428 (2008).
15. Masuzaki, H. et al. A transgenic model of visceral obesity and the metabolic syndrome.Science 294, 2166–2170 (2001).
16. Liu, M. et al. Network-based analysis of affected biological processes in type 2diabetes models. PLoS Genet. 3, e96 (2007).
17. Zhu, J. et al. Increasing the power to detect causal associations by combininggenotypic and expression data in segregating populations. PLoS Comput. Biol. 3,e69 (2007).
18. Schadt, E.E. et al. Mapping the genetic architecture of gene expression in human liver.PLoS Biol. 6, e107 (2008).
19. Zhu, J. et al. Integrating large-scale functional genomic data to dissect the complexityof yeast regulatory networks. Nat. Genet. 40, 854–861 (2008).
20. Yabe, D., Brown, M.S. & Goldstein, J.L. Insig-2, a second endoplasmic reticulumprotein that binds SCAP and blocks export of sterol regulatory element-bindingproteins. Proc. Natl. Acad. Sci. USA 99, 12753–12758 (2002).
21. Janowski, B.A. The hypocholesterolemic agent LY295427 up-regulates INSIG-1,identifying the INSIG-1 protein as a mediator of cholesterol homeostasis throughSREBP. Proc. Natl. Acad. Sci. USA 99, 12675–12680 (2002).
22. Chambers, J.C. et al. Common genetic variation near MC4R is associated with waistcircumference and insulin resistance. Nat. Genet. 40, 716–718 (2008).
23. Frayling, T.M. et al. A common variant in the FTO gene is associated with body massindex and predisposes to childhood and adult obesity. Science 316, 889–894 (2007).
24. Loos, R.J. et al. Common variants near MC4R are associated with fat mass, weight andrisk of obesity. Nat. Genet. 40, 768–775 (2008).
25. Mutch, D.M. & Clement, K. Unraveling the genetics of human obesity. PLoS Genet. 2,e188 (2006).
26. Thorleifsson, G. et al. Genome-wide association yields new sequence variants at sevenloci that associate with measures of obesity. Nat. Genet. 41, 18–24 (2009).
27. Willer, C.J. et al. Six new loci associated with body mass index highlight a neuronalinfluence on body weight regulation. Nat. Genet. 41, 25–34 (2008).
28. Herbert, A. et al. A common genetic variant is associated with adult and childhoodobesity. Science 312, 279–283 (2006).
29. Wallace, C. et al. Genome-wide association study identifies genes for biomarkers ofcardiovascular disease: serum urate and dyslipidemia. Am. J. Hum. Genet. 82,139–149 (2008).
30. Willer, C.J. et al. Newly identified loci that influence lipid concentrations and risk ofcoronary artery disease. Nat. Genet. 40, 161–169 (2008).
31. Saxena, R. et al. Genome-wide association analysis identifies loci for type 2 diabetesand triglyceride levels. Science 316, 1331–1336 (2007).
32. Dhanasekaran, S.M. et al. Molecular profiling of human prostate tissues: insights intogene expression patterns of prostate development during puberty. FASEB J. 19,243–245 (2005).
33. Francis, K. et al. Complement C3a receptors in the pituitary gland: a novel pathway bywhich an innate immune molecule releases hormones involved in the control ofinflammation. FASEB J. 17, 2266–2268 (2003).
34. Ju, Y.T. et al. gas7: A gene expressed preferentially in growth-arrested fibroblasts andterminally differentiated Purkinje neurons affects neurite formation. Proc. Natl. Acad.Sci. USA 95, 11423–11428 (1998).
35. Moorthy, P.P., Kumar, A.A. & Devaraj, H. Expression of the Gas7 gene and Oct4 inembryonic stem cells of mice. Stem Cells Dev. 14, 664–670 (2005).
36. Ishibashi, N. & Mirochnitchenko, O. Chemokine expression in transgenic mice over-producing human glutathione peroxidases. Methods Enzymol. 353, 460–476 (2002).
37. McClung, J.P. et al. Development of insulin resistance and obesity in miceoverexpressing cellular glutathione peroxidase. Proc. Natl. Acad. Sci. USA 101,8852–8857 (2004).
38. Lee, Y.S. et al. Dysregulation of adipose GPx3 in obesity contributes to local andsystemic oxidative stress. Mol. Endocrinol. 22, 2176–2189 (2008).
39. MacDonald, M.J. Feasibility of a mitochondrial pyruvate malate shuttle in pancreaticislets. Further implication of cytosolic NADPH in insulin secretion. J. Biol. Chem. 270,20051–20058 (1995).
40. van Schothorst, E.M. et al. Adipose gene expression response of lean and obesemice to short-term dietary restriction. Obesity (Silver Spring) 14, 974–979(2006).
41. Qian, S. et al. Deficiency in cytosolic malic enzyme does not increase acetaminophen-induced hepato-toxicity. Basic Clin. Pharmacol. Toxicol. 103, 36–42 (2008).
42. Vidal, O. et al. Malic enzyme 1 genotype is associated with backfat thickness and meatquality traits in pigs. Anim. Genet. 37, 28–32 (2006).
43. Rahib, L., MacLennan, N.K., Horvath, S., Liao, J.C. & Dipple, K.M. Glycerol kinasedeficiency alters expression of genes involved in lipid metabolism, carbohydratemetabolism, and insulin signaling. Eur. J. Hum. Genet. 15, 646–657 (2007).
44. Hibuse, T. et al. Aquaporin 7 deficiency is associated with development ofobesity through activation of adipose glycerol kinase. Proc. Natl. Acad. Sci. USA102, 10993–10998 (2005).
45. Kawai, J. et al. Functional annotation of a full-length mouse cDNA collection. Nature409, 685–690 (2001).
46. Weng, L. et al. Rosetta error model for gene expression analysis. Bioinformatics 22,1111–1121 (2006).
47. He, Y.D. et al. Microarray standard data set and figures of merit for comparing dataprocessing methods and experiment designs. Bioinformatics 19, 956–965(2003).
48. Storey, J.D. & Tibshirani, R. Statistical significance for genomewide studies.Proc. Natl. Acad. Sci. USA 100, 9440–9445 (2003).
49. Yang, X. et al. Tissue-specific expression and regulation of sexually dimorphic genes inmice. Genome Res. 16, 995–1004 (2006).
NATURE GENETICS VOLUME 41 [ NUMBER 4 [ APRIL 2009 42 3
A R T I C L E S
©20
09 N
atu
re A
mer
ica,
Inc.
All
rig
hts
res
erve
d.