USING YOUR GRADE BOOK TO STORE COURSE RUBRIC INFORMATION
17
AC 2009-1060: USING YOUR GRADE BOOK TO STORE COURSE RUBRIC INFORMATION Walter Schilling, MSOE Walter Schilling is an assistant professor in the Software Engineering program at the Milwaukee School of Engineering in Milwaukee, WI. He received his BSEE from Ohio Northern University and his MSES and PhD. from the University of Toledo. He worked in the automotive industry as an embedded software engineer for several years prior to returning for doctoral work. He has spent time at NASA Glenn Research Center in Cleveland, OH. In addition to one US Patent, Schilling has numerous publications in refereed international conferences and other journals. He received the Ohio Space Grant Consortium Doctoral Fellowship, as well as awards from the Toledo and Southeastern Michigan Section IEEE. He is a member of IEEE, IEEE Computer Society, and ASEE. At MSOE, he coordinates courses in Software Quality Assurance, Software Verification, Software Engineering Practices, as well as teaching Embedded Systems Software and introductory programming courses. © American Society for Engineering Education, 2009
Transcript of USING YOUR GRADE BOOK TO STORE COURSE RUBRIC INFORMATION

AC 2009-1060: USING YOUR GRADE BOOK TO STORE COURSE RUBRICINFORMATION
Walter Schilling, MSOEWalter Schilling is an assistant professor in the Software Engineering program at the MilwaukeeSchool of Engineering in Milwaukee, WI. He received his BSEE from Ohio Northern Universityand his MSES and PhD. from the University of Toledo. He worked in the automotive industry asan embedded software engineer for several years prior to returning for doctoral work. He hasspent time at NASA Glenn Research Center in Cleveland, OH. In addition to one US Patent,Schilling has numerous publications in refereed international conferences and other journals. Hereceived the Ohio Space Grant Consortium Doctoral Fellowship, as well as awards from theToledo and Southeastern Michigan Section IEEE. He is a member of IEEE, IEEE ComputerSociety, and ASEE. At MSOE, he coordinates courses in Software Quality Assurance, SoftwareVerification, Software Engineering Practices, as well as teaching Embedded Systems Softwareand introductory programming courses.
© American Society for Engineering Education, 2009

Using Your Grade Book to Store Course Rubric
Information
Abstract
The usage of rubrics has been greatly shown to aid in consistent grading, faster grading,
and improved student understanding of grades. Traditionally, the rubric is used to
calculate a grade for the assignment, and then that final grade is recorded in the course
grade book. This article presents a practical method for retaining within a grade book not
only the final grade for an assignment, but also the individual sub-scores used to calculate
that final grade. Grades are stored in Microsoft Excel, with each major assignment being
stored on an individual workbook tab. Rows represent individual students, and the
columns indicate the sub-scores for each line item on a grading rubric. Rubric scores are
multiplied by a weighting factor to obtain an overall score for the assignment. From this
data store, grade sheets, including grading comments, can automatically be generated for
the students through a mail merge operation. These grade sheets can then either be
printed in hard copy or e-mailed to the students as pdf attachments. Individual student
performance can be tracked and graphed over time on multiple dimensions, allowing for
easier observation of students who may be struggling with key concepts in the course,
and the data can be used for overall assessment of course outcomes.
1. Introduction
One of the aspects that often surprises new engineering faculty members is the amount of
time which must be devoted to grading. This is especially true if one is at an
undergraduate teaching institution which does not have teaching assistants. In this
environment, faculty members are faced with grading for 2-4 courses per term. If one
factors in homework assignments, lab reports, and exams, it is possible that the professor
is grading at least two to three individual assignments per class per week. Optimal
efficiency is thus paramount.
One common problem which plagues new faculty members is trying to be efficient while
also maintaining grading consistency between class sections and classmates. One
technique that is often employed is the usage of grading rubrics. A scoring rubric
represents a quantitative schema developed to guide in the assessment student work.
First adopted in the K-12 educational arena, rubrics are now commonly being used in
colleges, including the engineering field. Scoring rubrics can be applied to writing
assignments, group activities, term projects, and oral presentations1. Grading rubrics
provide advantages to both the student as well as the faculty member.
From the student’s standpoint, rubrics offer many advantages. Students like the usage of
rubrics as they aid in determining the expectations for an assignment. Students also like
rubrics for grading as they allow them to better plan their working, gearing their
development towards what is expected rather than overachieving on an assignment.
Overall, students feel that rubrics result in them delivering a higher quality submission as
well as receiving a fairer grade when the submission is assessed. Students like rubrics

because they allow them to focus their efforts on areas of weakness, produce a higher
quality work product, earn better grades, and reduce anxiety about assignment grading2.
Grading rubrics also aid students in seeing that their grade is based upon overall course
objectives rather than impulsive responses3.
From the faculty member’s standpoint, grading rubrics also serve multiple purposes.
Assignments can be graded both faster and more accurately if the grading criterion is
clearly spelled out before grading commences. Furthermore, because the rubric provides
detailed criteria, there is often less need for detailed comments to be written on student
assignments. This improves grading efficiency. Faculty members who consistently use
grading rubrics tend to have fewer challenges to their grading and are better able to
defend their grading practice both to students and administrators.
But beyond the individual assignments, rubrics can also be applied to larger assessments
as well. At an institutional level, rubrics are commonly applied to evaluate student
outcomes for ABET assessment purposes. While this can be a burdensome process, if a
rubric based approach to grading is used, the overhead of performing assessment can be
greatly diminished, as the data required for overall assessment is often correlated with
what is required for individual assignment grading4.
Traditionally, most faculty members use their grade book to keep track of assignment
grades. At the end of the term, assignment grades are averaged and weighted according
predefined relationships, and final course grades are handed out. With this model of
development, all that is required is for the faculty member to store final assignment
grades in the grade book.
This, however, does not allow faculty members to compile student performance metrics
on a sub-assignment level. For example, the net final score would not reflect if half of
the students are having extreme difficulty expressing the problems they encountered
while performing a laboratory experiment. Simply recording grades also does not allow
one to readily factor in other aspects of grading, such as improvement with time in areas
of difficulty. However, by converting the grade book into an electronic rubric book,
multiple aspects of a student’s performance can be tracked, and these aspects can factor
into a final student grade.
Recording all fields in a grade book also allows for another important improvement, that
is, Computer-Assisted grading rubrics. Computer Assisted grading rubrics result in
decreased grading times and faster return time of assignments to students5.
2. Methodology
If one considers a traditional grade book, and its traditional implementation, it is two
dimensional in nature. Each row represents a student’s performance. Each column, in
general, represents a cumulative score on an assignment, be it a lab, a homework
assignment, or test. Grades may be recorded as points, percentages, or letter grades.
What is important is that the only aspect of the grade that is present for each assignment
is the final score. All of the other relevant history which created that score is missing. In
fact, all grading typically was done manually by the grader, and after all grading was
completed, the results were entered into the grade book for storage.
To convert our grade book into a rubric book, we need to shift our thinking from the flat
plane of a two dimensional grade book and think of the grade book as a three dimensional
collections of scores. Rows still delineate each student, and columns represent discrete
assignments. However, in the third dimension we can retain the individual assessments
that created the final grade. By doing so, we can then effectively monitor all aspects of a
student’s performance rather than just the final score. This concept is shown in Figure 1.
Figure 1 Three dimensional grading concept.
To make this system work effectively, grading is also done directly into the grade book.
As an assignment is being assessed, instead of marking up a paper copy with scores and
sub-score, these items are directly recorded into the grade book while the assignment is
scored. There is no need to go back through the assignments afterwards to “record”
grades, for the information is directly stored in the grade book when grading occurs. The
original may have random supporting comments, but the bulk of the grading is done
directly in the grade book.
3. Practical Implementation
While at the highest level, the usage of a three dimensional grade recording structure may
appear to be difficult and cumbersome. In reality, modern software allows this approach
to be implemented rather easily.

In principle, one of the easiest ways to keep track of grades is to use a spreadsheet
package, such as Microsoft Excel or Open Office. This allows the users complete control
over assignment weighting, grading scale, and other aspects. Furthermore, by using this
generic approach, performance metrics can readily be gathered which can be used to
assess overall class performance versus previous classes or other concurrent sections.
Using a traditional approach, all student data is entered onto a single tab. Each row
designates an individual student, and the columns represent attributes of the student,
include name, student id, final grade, and individual grades. Hard-copies can easily be
generated for archival purposes formatting printouts and sending them to a printer.
To record rubrics, a slight change to this schema is adapted in that multiple tabs are now
used for recording student information. As with the previous approach, one tab still holds
student information, such as name student id, final grade, and assignment grades.
However, different from the simple grade book, assignments that are graded using a
rubric require their own tab.
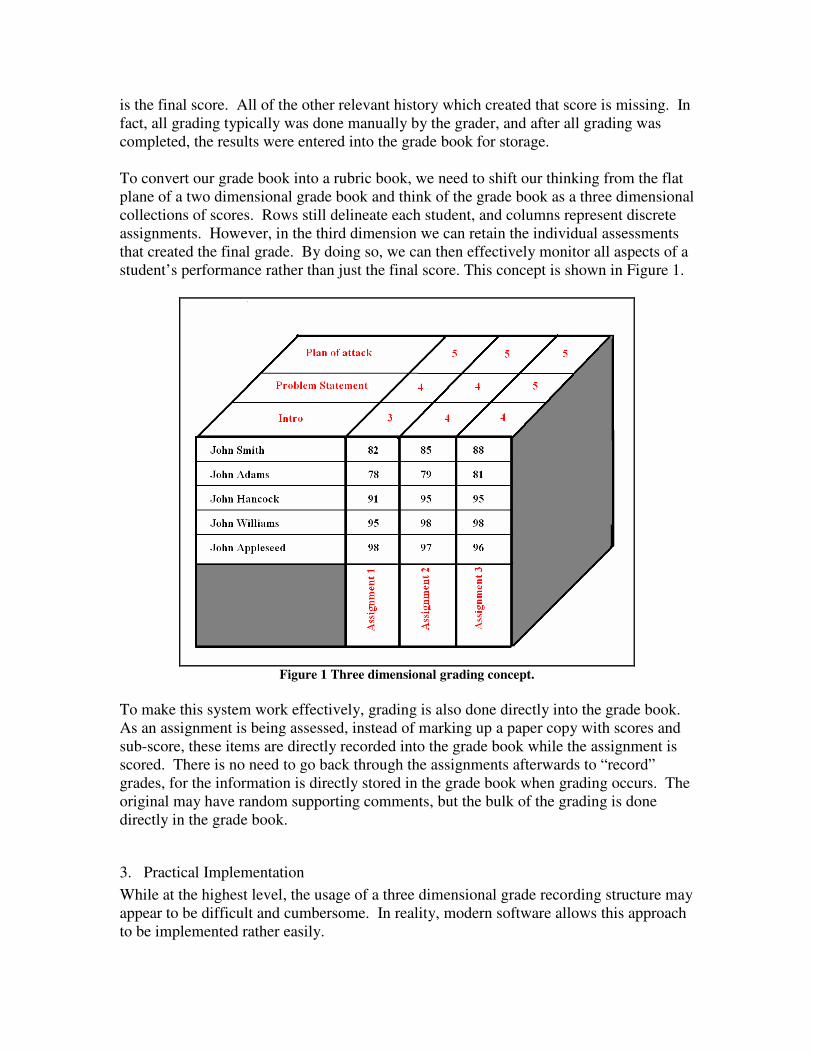
Figure 2 shows an actual rubric used for grading an assignment. In this example,
students worked on a two week lab assignment in groups. The grading rubric is divided
into two segments, a portion which reflects group performance as well as a portion which
reflects individual performance. In this particular assignment, students worked as a team
to complete a lab assignment. At the completion of lab, each student was assessed by
their peers using a rubric. These scores were tabulated and entered into the individual
performance area of the assignment. The group assignment grade was derived from
traditional grading of the group lab report excepting that grading was done entirely
electronically by markup up the pdf submission using pdf annotator.
Figure 2 Sample grading rubric for assignment

Figure 3 Sample grade book assignment entry
Figure 3 shows how grades are entered into the grade book. Major assignments have
each been given their own tab, and rubric values have been recorded for each entry.
Metrics for each rubric assessment are calculated. In this case, Lab 4/5 represents that
lab assignment that used to rubric of Figure 1. The grade book allows specific comments
to be recorded for each student, and automatically determines a total grade based on the
individual assessment scores.
4. Returning Student Work - Automatically generating Students rubric sheets
When it comes time to return assignments to students, this mechanism offers yet another
advantage, in that it is possible to return assignments to students electronically.
Using traditional grading techniques, once an assignment is graded, the faculty member
has two sets of paperwork. In one hand is a rubric sheet which denotes the scores for
each assessment. In the other hand is the original assignment, which may or may not
contain comments and other markups. To return assignments to students, and maintain
FERPA confidentiality, the professor must return each assignment to each student by
hand, guaranteeing that only the submitting student handles their assignment. For large
classes, this is a practical problem, as it may take a significant amount of time to return
assignments. And, if the assignment had group work but had individual grades assigned,
there is the difficulty of determining who in the group receives the original marked up
copy.
With this method, everything is handled electronically and it is possible to return private
scores to individual students as well as return the original submission to all group

members. To do this, the Word mail merge functionality is used to merge the data in the
gradebook with the rubric sheet. This results in rubric sheets being created, each being
customized to the performance of the individual student.
To perform this operation, the grading rubric is transformed into a mail merge template.
This involves linking the rubric sheet to the grade book and assigning the table entries to
locations in the template document. By running a mail merge operation, individual
grading sheets are generated for each student that can be returned. Figure 4 shows an
example of a completed student rubric that the student would receive.
Figure 4 Automatically generated student rubric.
The true advantage of this system, however, comes from being able to return assignments
completely electronically. When performing the mail merge, the default output is a
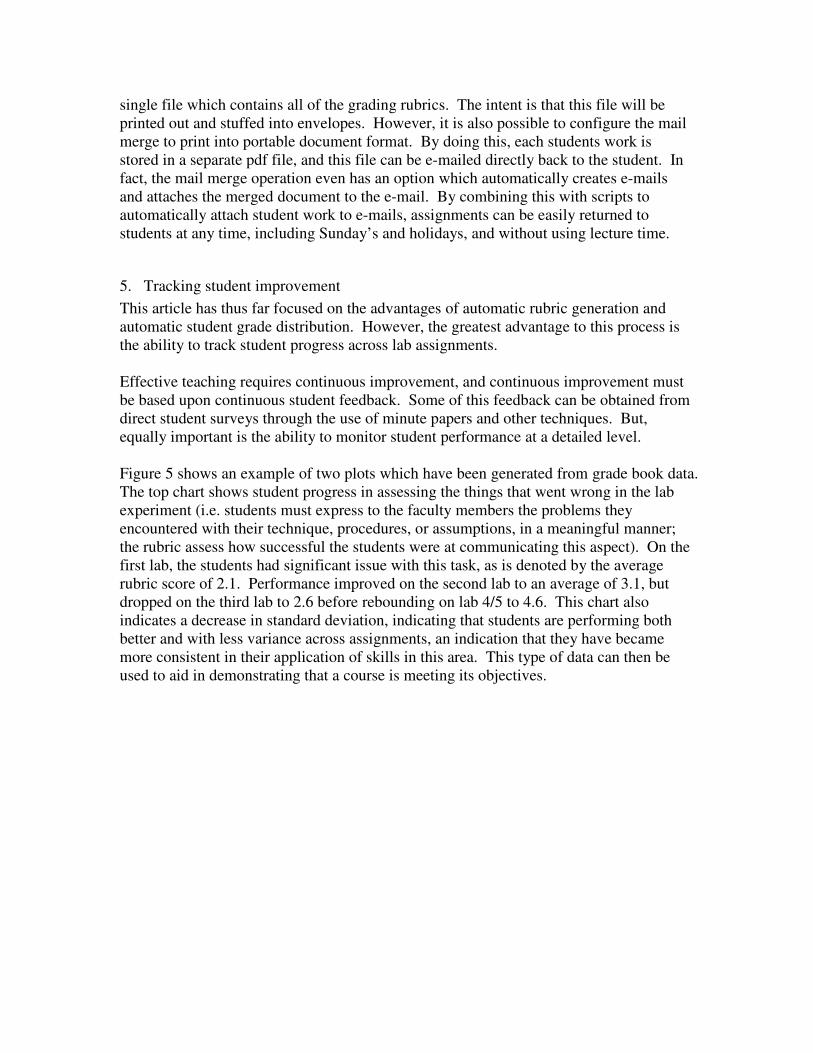
single file which contains all of the grading rubrics. The intent is that this file will be
printed out and stuffed into envelopes. However, it is also possible to configure the mail
merge to print into portable document format. By doing this, each students work is
stored in a separate pdf file, and this file can be e-mailed directly back to the student. In
fact, the mail merge operation even has an option which automatically creates e-mails
and attaches the merged document to the e-mail. By combining this with scripts to
automatically attach student work to e-mails, assignments can be easily returned to
students at any time, including Sunday’s and holidays, and without using lecture time.
5. Tracking student improvement
This article has thus far focused on the advantages of automatic rubric generation and
automatic student grade distribution. However, the greatest advantage to this process is
the ability to track student progress across lab assignments.
Effective teaching requires continuous improvement, and continuous improvement must
be based upon continuous student feedback. Some of this feedback can be obtained from
direct student surveys through the use of minute papers and other techniques. But,
equally important is the ability to monitor student performance at a detailed level.
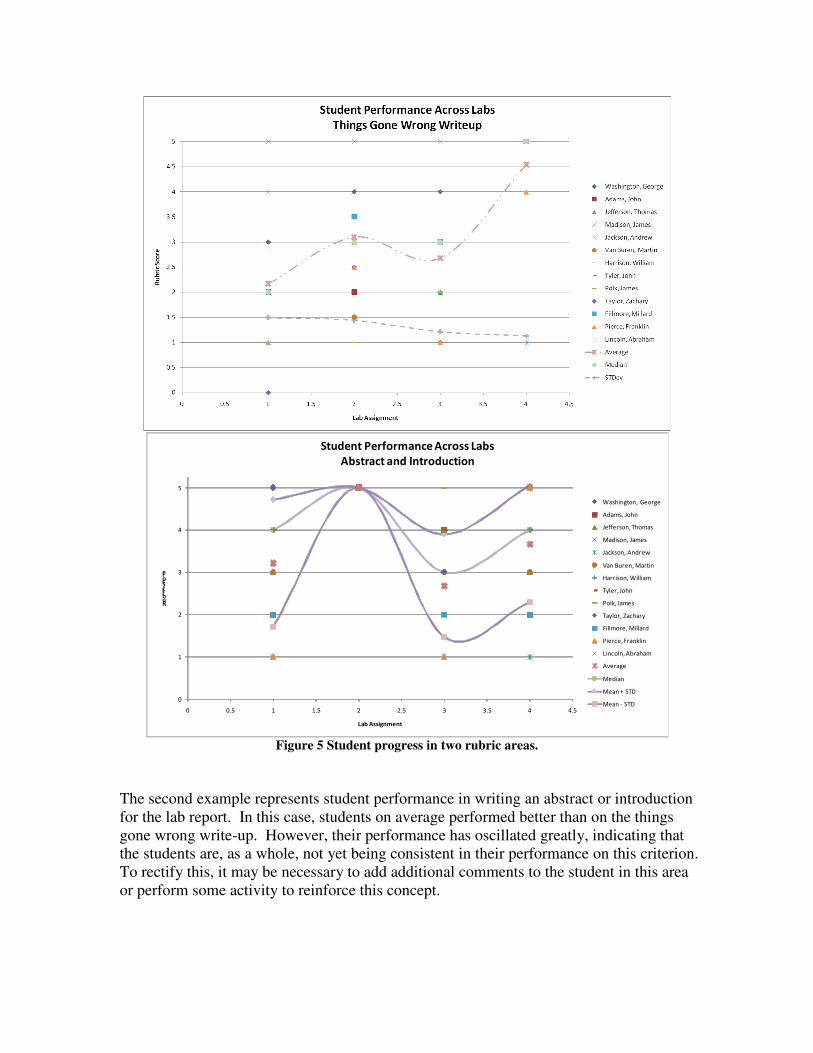
Figure 5 shows an example of two plots which have been generated from grade book data.
The top chart shows student progress in assessing the things that went wrong in the lab
experiment (i.e. students must express to the faculty members the problems they
encountered with their technique, procedures, or assumptions, in a meaningful manner;
the rubric assess how successful the students were at communicating this aspect). On the
first lab, the students had significant issue with this task, as is denoted by the average
rubric score of 2.1. Performance improved on the second lab to an average of 3.1, but
dropped on the third lab to 2.6 before rebounding on lab 4/5 to 4.6. This chart also
indicates a decrease in standard deviation, indicating that students are performing both
better and with less variance across assignments, an indication that they have became
more consistent in their application of skills in this area. This type of data can then be
used to aid in demonstrating that a course is meeting its objectives.
0
1
2
3
4
5
0 0.5 1 1.5 2 2.5 3 3.5 4 4.5
Rubric Score
Lab Assignment
Student Performance Across Labs
Abstract and Introduction
Washington, George
Adams, John
Jefferson, Thomas
Madison, James
Jackson, Andrew
Van Buren, Martin
Harrison, William
Tyler, John
Polk, James
Taylor, Zachary
Fillmore, Millard
Pierce, Franklin
Lincoln, Abraham
Average
Median
Mean + STD
Mean - STD
Figure 5 Student progress in two rubric areas.
The second example represents student performance in writing an abstract or introduction
for the lab report. In this case, students on average performed better than on the things
gone wrong write-up. However, their performance has oscillated greatly, indicating that
the students are, as a whole, not yet being consistent in their performance on this criterion.
To rectify this, it may be necessary to add additional comments to the student in this area
or perform some activity to reinforce this concept.

Figure 6 Rubric performance normalized to average and standard deviation.
This mechanism also allows for easy spotting of students whose performance is not
keeping pace with the class. Figure 6 shows a plot of student performance on the Things
Gone Wrong assessment normalized against the average score and standard deviation.
Most students either improve relative to the average or oscillate around the same score
relative to the average. However, in this plot, student Andrew Jackson has suffered
significantly poorer performance on each assignment. This chart does not tell us why this
is the case, but it certainly presents a warning that intervention may be required.
6. Challenges
While at the outset this method may seem daunting, from a technical standpoint there
have been very few issues with this model of implementation. Problems have occurred
with inadvertently entering the wrong rubric score in the wrong row when performing the
mail merge or attempting to send to an incorrect e-mail. Other problems have occurred
with outboxes overflowing when large documents were returned. But, aside from these
relatively minor technical problems, this mechanism has generally worked quite
effectively for all courses in which it has been applied.
The largest obstacle to this mechanism by far, however, has been the development of
valid and meaningful rubrics. While with practice this has gotten better, the largest effort
is in creating the measures that will be used for assessment. This is compounded by the
fact that, due to the nature of the courses being taught, the rubrics tend to be assignment
specific and re-use is not necessarily possible. Being that these courses were all being
taught for the first time, there is hope that the rubrics will be reusable in future course
offerings, though it is anticipated that there will be some improvements required due to
the knowledge gained from writing other rubrics.
The other obstacle to this problem has been students checking their e-mail. As part of the
student registration at Milwaukee School of Engineering, each student is provided an
official e-mail account. However, because most students already have other e-mail
accounts, they may not routinely check their “official” e-mail account. At best, this
results in the students delaying their review of the assignment, and at worst, it results in a
bounced e-mail if their account is full and can no longer receive e-mail.
7. Conclusions
This article has discussed an automated method for the creation and distribution of
grading rubrics to students. Student assignments are graded electronically using an
electronic rubric, and assignments are returned automatically via e-mail. By using this
mechanism, individual performance can be tracked across multiple assignments and
multiple dimensions.
References
1. B. Moskal. “Scoring Rubrics: What, When and How? Research and Evaluation,
7(3), 2000.
2. H. Andrade and Y. Du. “Students Perspectives on rubric-referenced assessment”,
Practical Assessment Research & Evaluation, April 3, 2005.
3. R. More. “Grading Rubrics: Communicating the Means of Grades to Students and
TAs”, The Teaching Exchange, Volume 8 Number 1. September, 2003.
4. S. Blanchard et al. “Rubrics Cubed: Tying Grades to Assessment to Reduce
Faculty Workloads” Proceedings of the 2004 ASEE Annual Conference, 2004.
5. L. Anglin, K. Anglin, P. Schumann, and J. Kaliski. “Improving the Efficiency and
Effectiveness of Grading Through the Use of Computer-Assisted Grading
Rubrics.” Decision Sciences Journal of Innovative Education: 6(1), January,
2008)
Appendix A: An Introduction to merging with Microsoft Office 97
Mail merging with Microsoft Office makes the generation of individualized grade sheets
and rubric sheets quite trivial. The amount of detail shown can be easily customized, and
the results can be distributed either via hard copy or e-mail attachment. This Appendix
provides an introductory tutorial for mail merging using Microsoft Office 97.
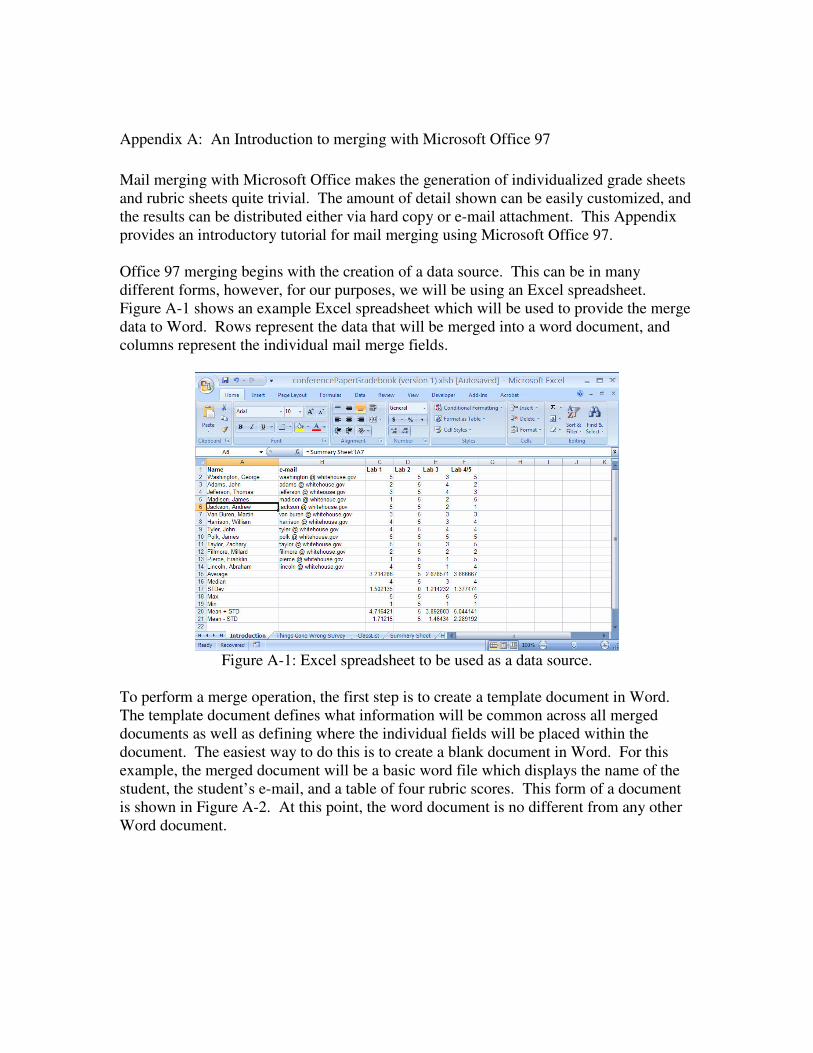
Office 97 merging begins with the creation of a data source. This can be in many
different forms, however, for our purposes, we will be using an Excel spreadsheet.
Figure A-1 shows an example Excel spreadsheet which will be used to provide the merge
data to Word. Rows represent the data that will be merged into a word document, and
columns represent the individual mail merge fields.
Figure A-1: Excel spreadsheet to be used as a data source.
To perform a merge operation, the first step is to create a template document in Word.
The template document defines what information will be common across all merged
documents as well as defining where the individual fields will be placed within the
document. The easiest way to do this is to create a blank document in Word. For this
example, the merged document will be a basic word file which displays the name of the
student, the student’s e-mail, and a table of four rubric scores. This form of a document
is shown in Figure A-2. At this point, the word document is no different from any other
Word document.
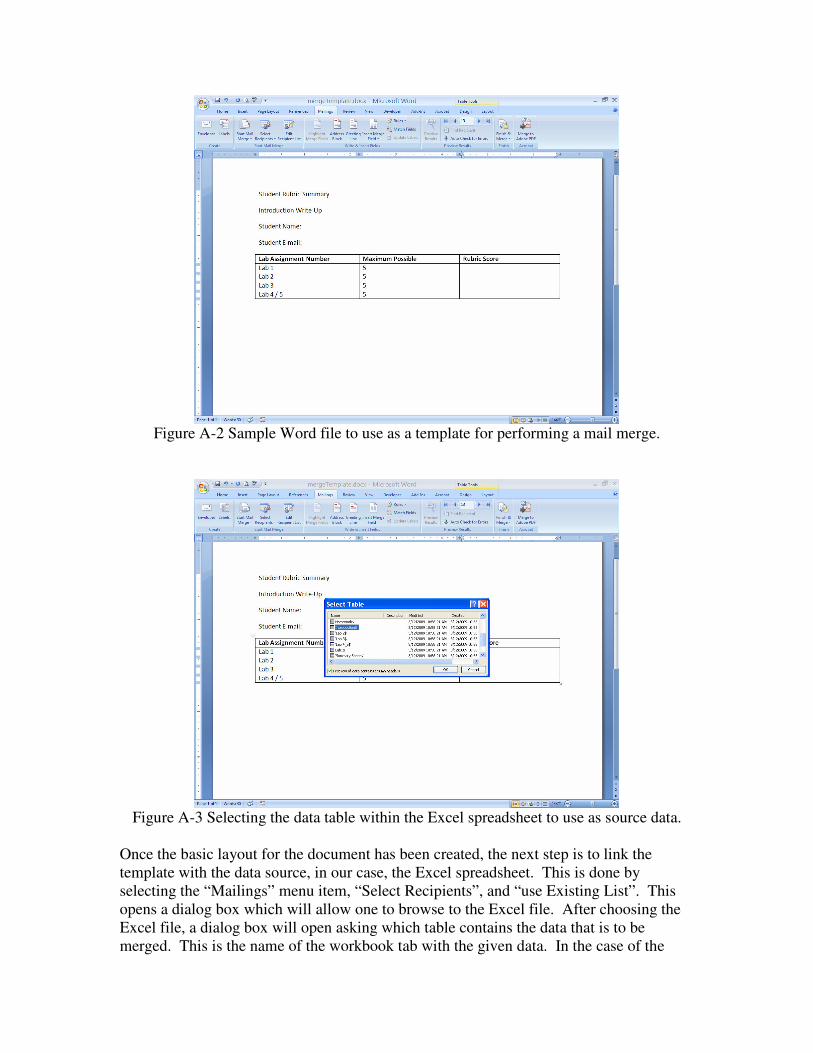
Figure A-2 Sample Word file to use as a template for performing a mail merge.
Figure A-3 Selecting the data table within the Excel spreadsheet to use as source data.
Once the basic layout for the document has been created, the next step is to link the
template with the data source, in our case, the Excel spreadsheet. This is done by
selecting the “Mailings” menu item, “Select Recipients”, and “use Existing List”. This
opens a dialog box which will allow one to browse to the Excel file. After choosing the
Excel file, a dialog box will open asking which table contains the data that is to be
merged. This is the name of the workbook tab with the given data. In the case of the
document shown in Figure A-1, this would be the “Introduction” tab. This is shown
graphically in Figure A-3.
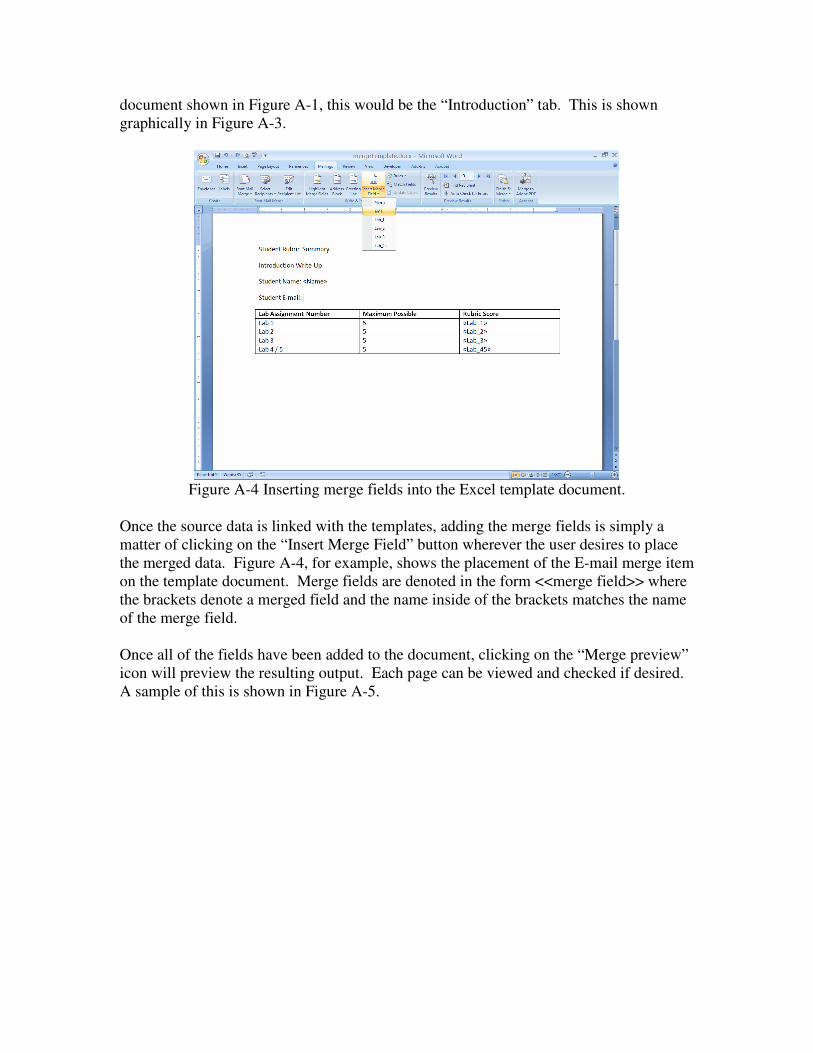
Figure A-4 Inserting merge fields into the Excel template document.
Once the source data is linked with the templates, adding the merge fields is simply a
matter of clicking on the “Insert Merge Field” button wherever the user desires to place
the merged data. Figure A-4, for example, shows the placement of the E-mail merge item
on the template document. Merge fields are denoted in the form <<merge field>> where
the brackets denote a merged field and the name inside of the brackets matches the name
of the merge field.
Once all of the fields have been added to the document, clicking on the “Merge preview”
icon will preview the resulting output. Each page can be viewed and checked if desired.
A sample of this is shown in Figure A-5.
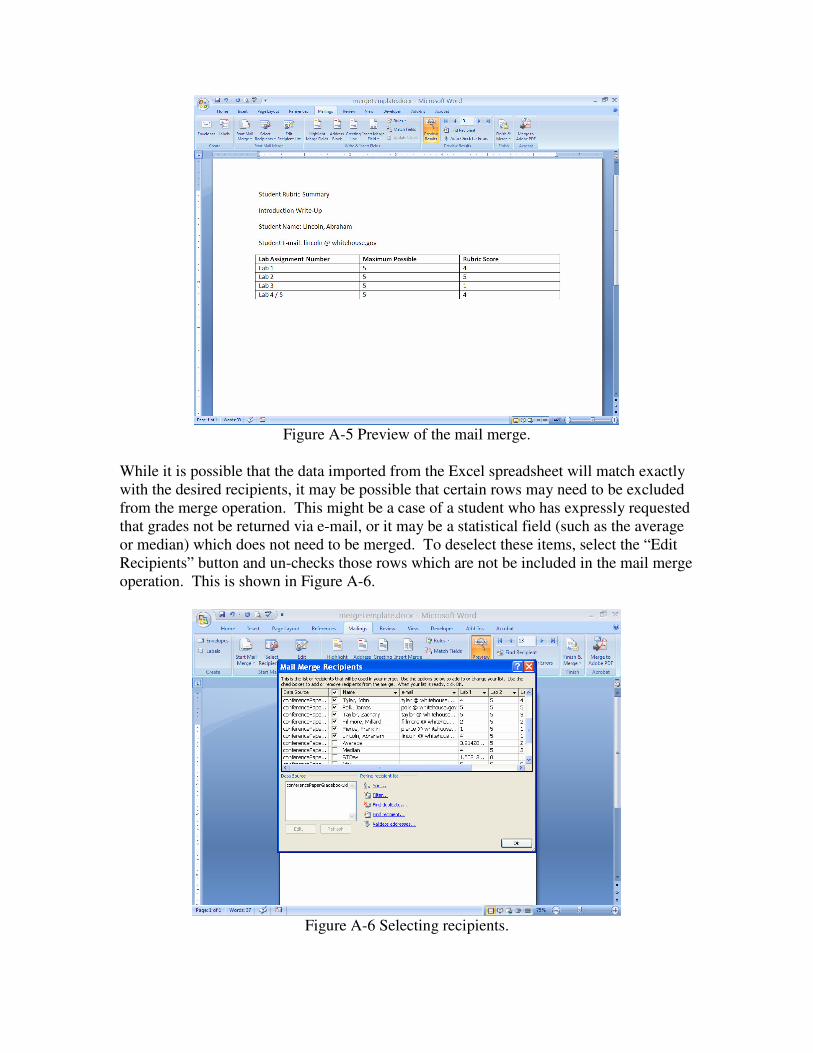
Figure A-5 Preview of the mail merge.
While it is possible that the data imported from the Excel spreadsheet will match exactly
with the desired recipients, it may be possible that certain rows may need to be excluded
from the merge operation. This might be a case of a student who has expressly requested
that grades not be returned via e-mail, or it may be a statistical field (such as the average
or median) which does not need to be merged. To deselect these items, select the “Edit
Recipients” button and un-checks those rows which are not be included in the mail merge
operation. This is shown in Figure A-6.
Figure A-6 Selecting recipients.

The final step is either printing the hard copies or creating the e-mails containing the
merged grade sheet. To create hard copies of the document, select the “Finish and
Merge” button to print the documents. This will open up a dialog box to select the printer
and perform routine printer configuration.
If one wishes to distribute the contents via e-mail as pdf attachments, one clicks on the
“Merge to Adobe PDF” button. This brings up the dialog box shown in Figure A-7. This
dialog box allows the user to specify which records are to be merged and the prefix for
the acrobat files which are created. By clicking on the e-mail options, one can select the
merge field which contains the e-mail address, enter the subject line for the e-mail that
will be sent, and type a short e-mail message. By clicking on OK, pdf files will be
created on the local computer from the mail merge. These files will then be
automatically attached to an e-mail and sent out via the e-mail client.
Figure A-7 Merging to Adobe PDF e-mail attachments.