Using NRI Data for ESD Development - Jornada Experimental ...
18
Patti Novak-Echenique N RCS-N V State Rangeland M anagement Specialist
-
Upload
khangminh22 -
Category
Documents
-
view
1 -
download
0
Transcript of Using NRI Data for ESD Development - Jornada Experimental ...

Pat t i Novak -Echenique NRCS-NV
State Rangeland M anagement Specialist
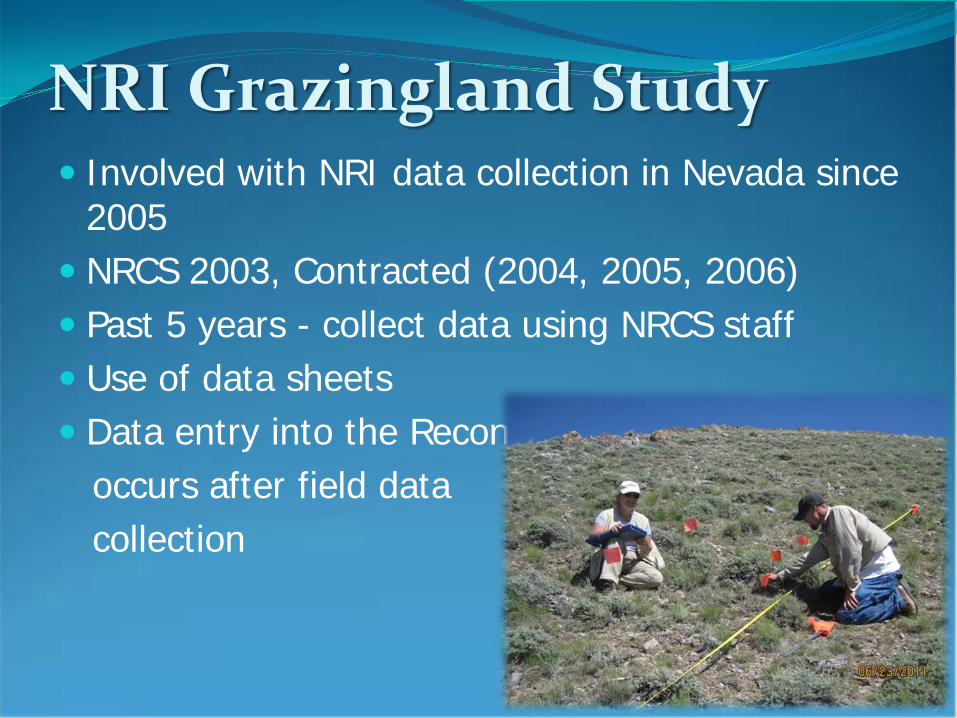
NRI Grazingland Study Involved with NRI data collection in Nevada since
2005 NRCS 2003, Contracted (2004, 2005, 2006) Past 5 years - collect data using NRCS staff Use of data sheets Data entry into the Recon occurs after field data collection
Data Collection Use of custom data sheets Data entry into RECON occurs after data
collection Initially used ESD option, now only NRI
option Data is summarized using “Summary
Statistics” in Recon
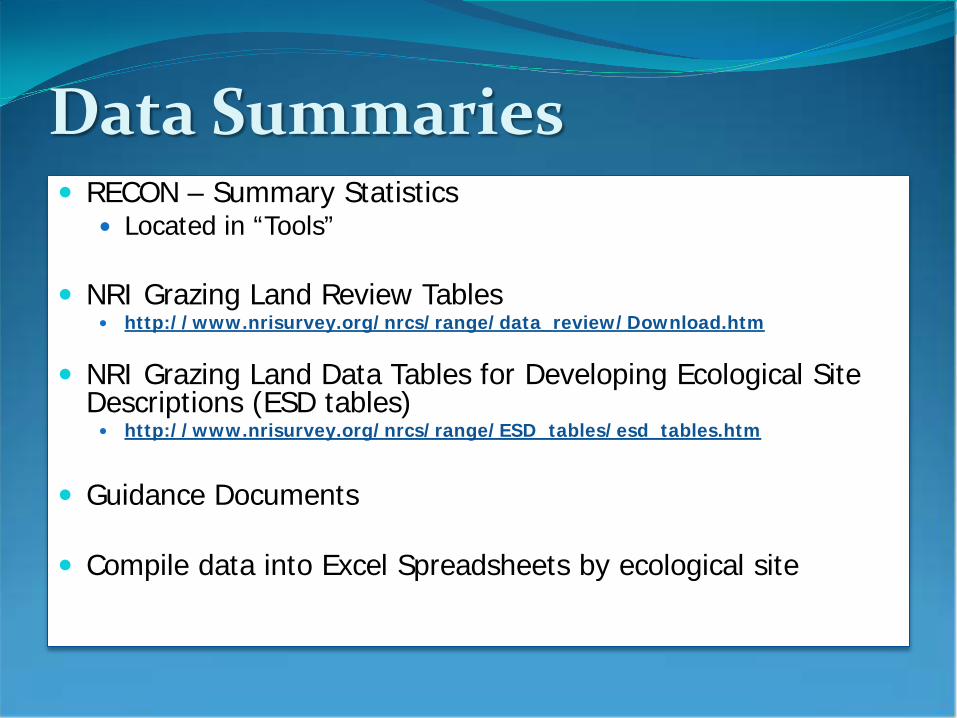
Data Summaries RECON – Summary Statistics
Located in “Tools” NRI Grazing Land Review Tables
http://www.nrisurvey.org/nrcs/range/data_review/Download.htm
NRI Grazing Land Data Tables for Developing Ecological Site Descriptions (ESD tables) http://www.nrisurvey.org/nrcs/range/ESD_tables/esd_tables.htm
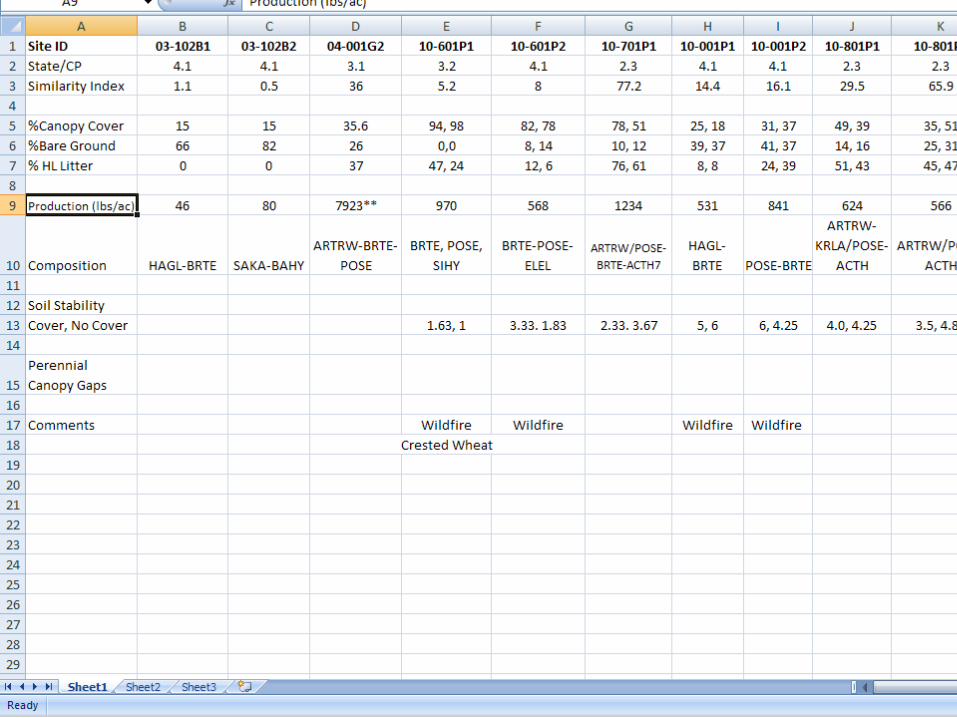
Guidance Documents Compile data into Excel Spreadsheets by ecological site
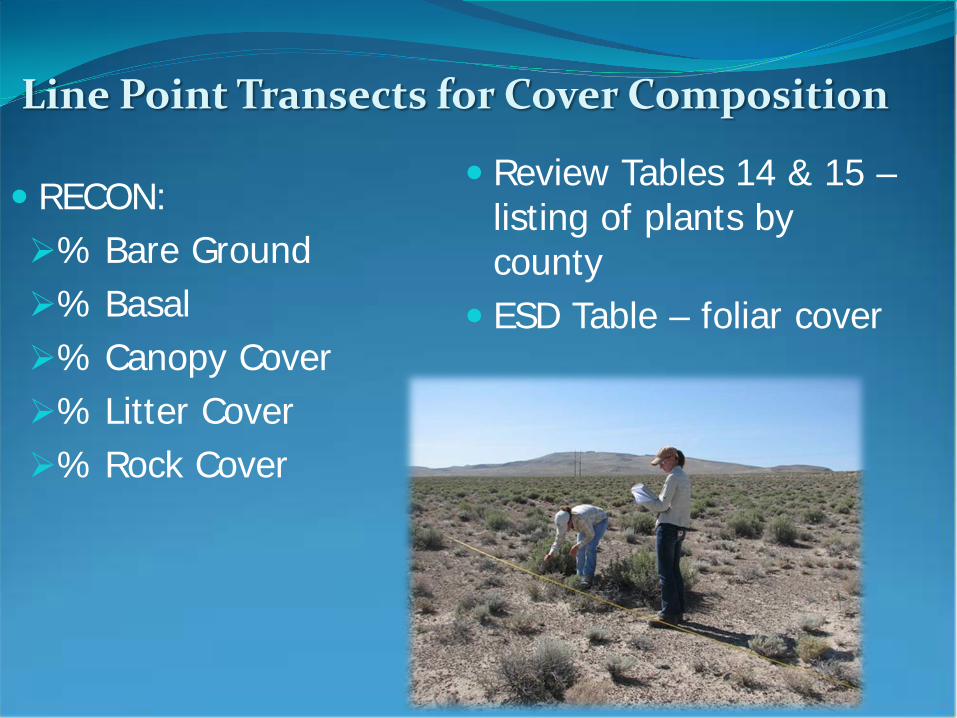
Line Point Transects for Cover Composition
RECON: % Bare Ground % Basal % Canopy Cover % Litter Cover % Rock Cover
Review Tables 14 & 15 – listing of plants by county
ESD Table – foliar cover
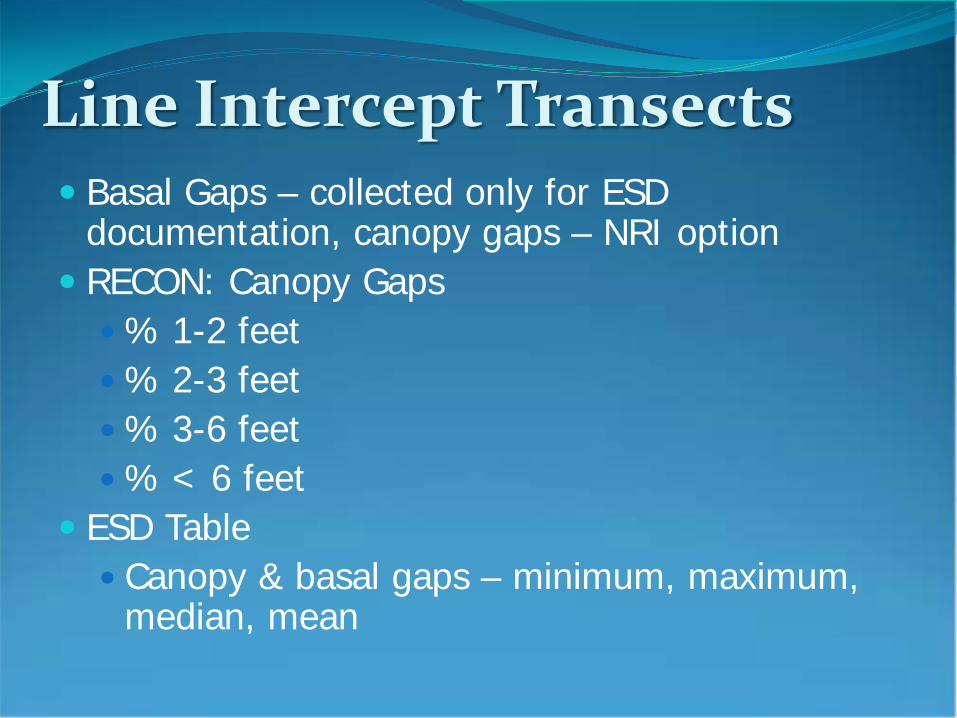
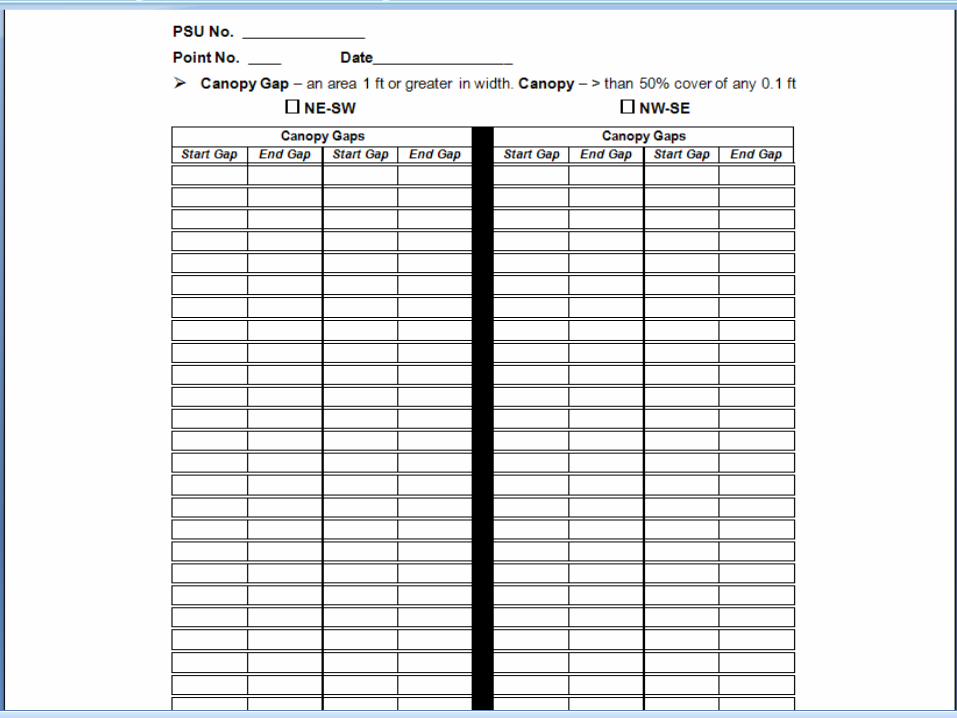
Line Intercept Transects Basal Gaps – collected only for ESD
documentation, canopy gaps – NRI option RECON: Canopy Gaps % 1-2 feet % 2-3 feet % 3-6 feet % < 6 feet
ESD Table Canopy & basal gaps – minimum, maximum,
median, mean
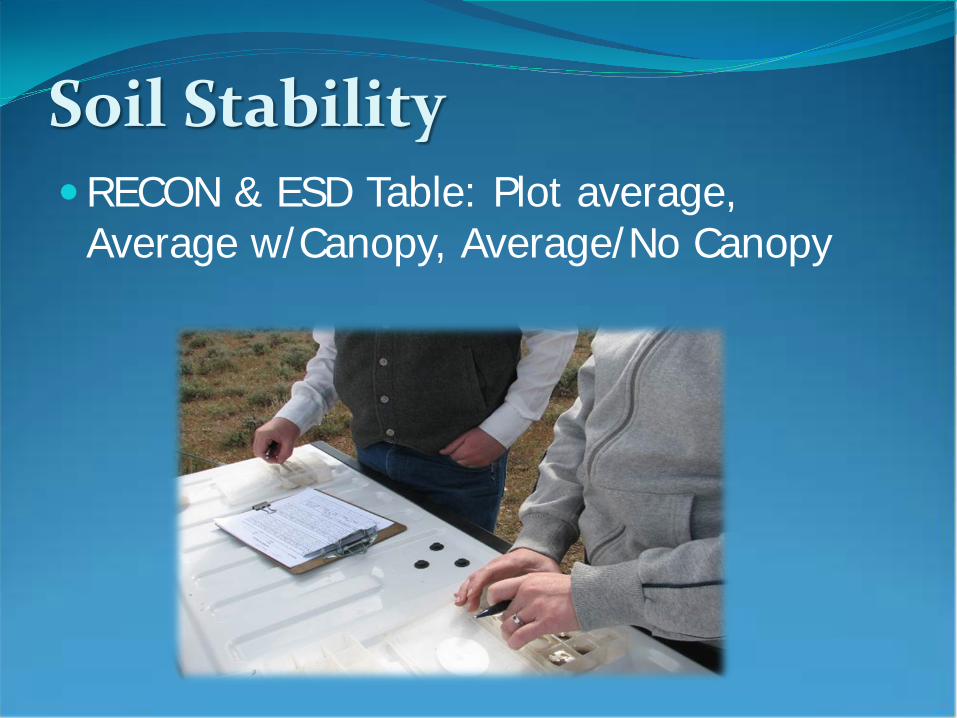
Soil Stability RECON & ESD Table: Plot average,
Average w/Canopy, Average/No Canopy
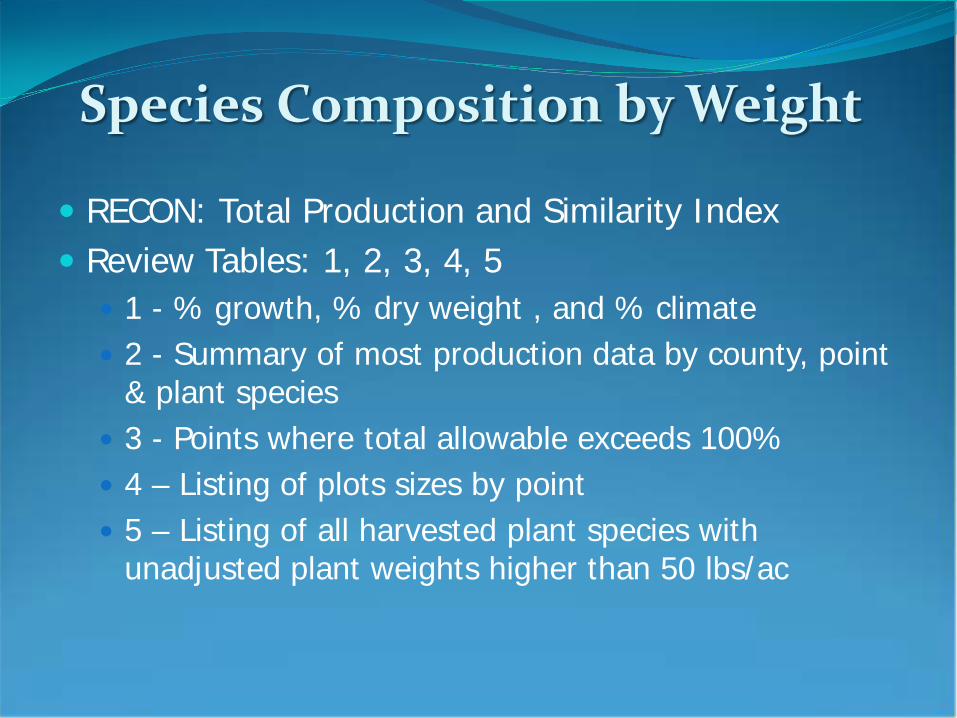
Species Composition by Weight
RECON: Total Production and Similarity Index Review Tables: 1, 2, 3, 4, 5
1 - % growth, % dry weight , and % climate 2 - Summary of most production data by county, point
& plant species 3 - Points where total allowable exceeds 100% 4 – Listing of plots sizes by point 5 – Listing of all harvested plant species with
unadjusted plant weights higher than 50 lbs/ac
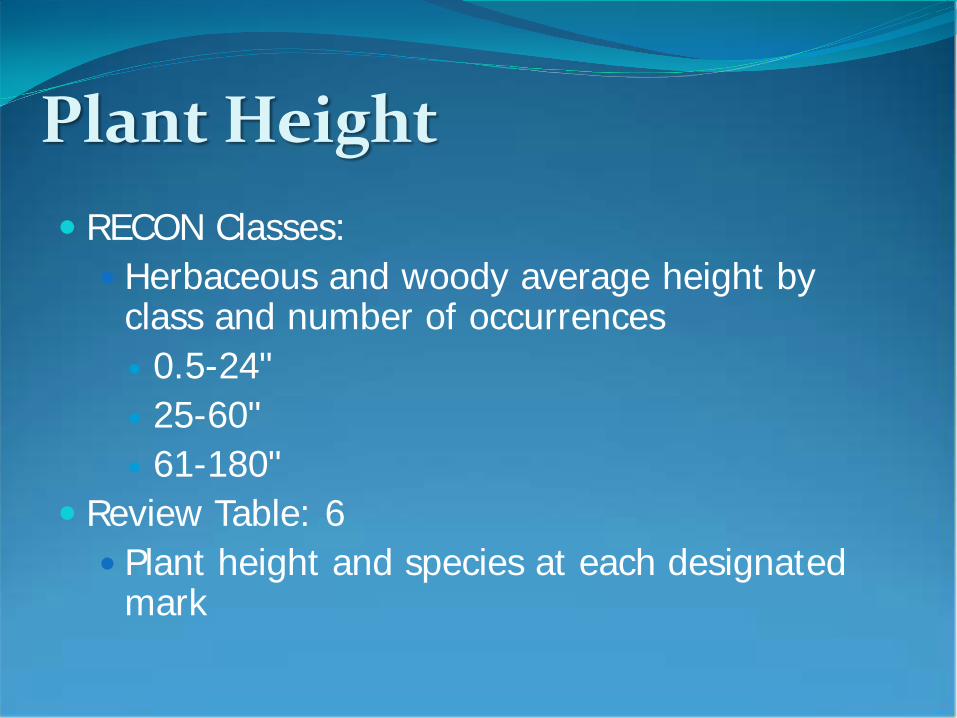
Plant Height RECON Classes: Herbaceous and woody average height by
class and number of occurrences 0.5-24" 25-60" 61-180"
Review Table: 6 Plant height and species at each designated
mark
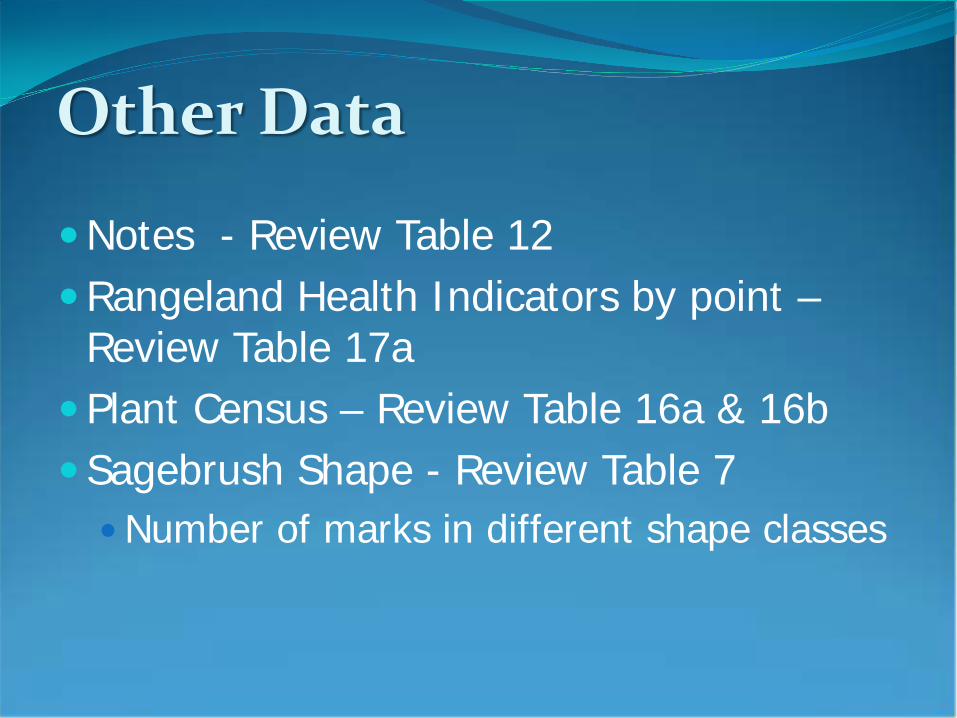
Other Data
Notes - Review Table 12 Rangeland Health Indicators by point –
Review Table 17a Plant Census – Review Table 16a & 16b Sagebrush Shape - Review Table 7 Number of marks in different shape classes
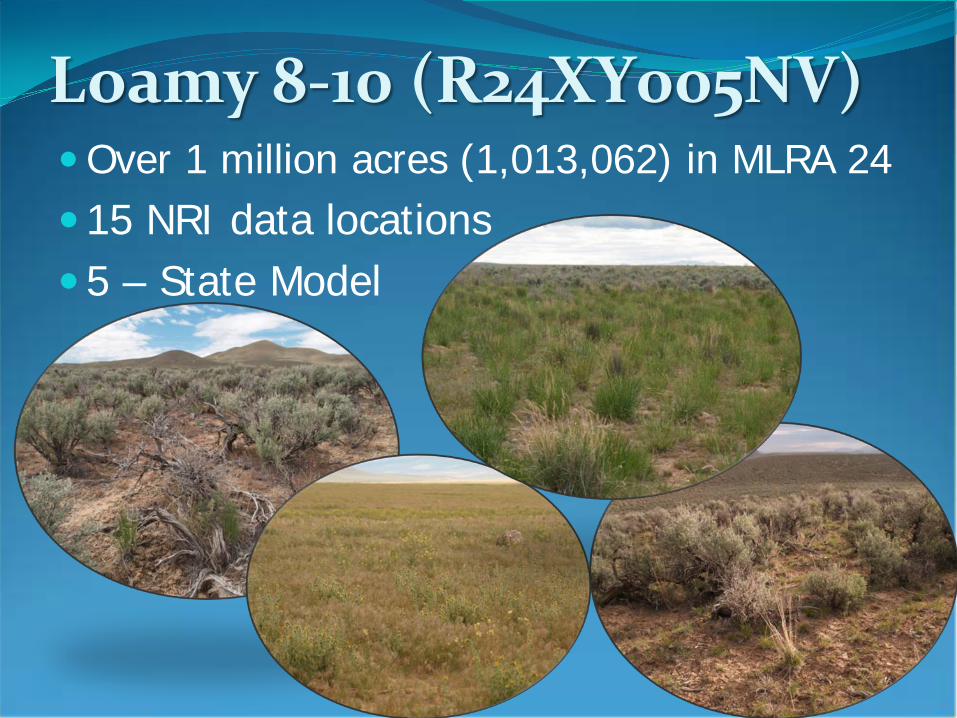
Loamy 8-10 (R24XY005NV) Over 1 million acres (1,013,062) in MLRA 24 15 NRI data locations 5 – State Model
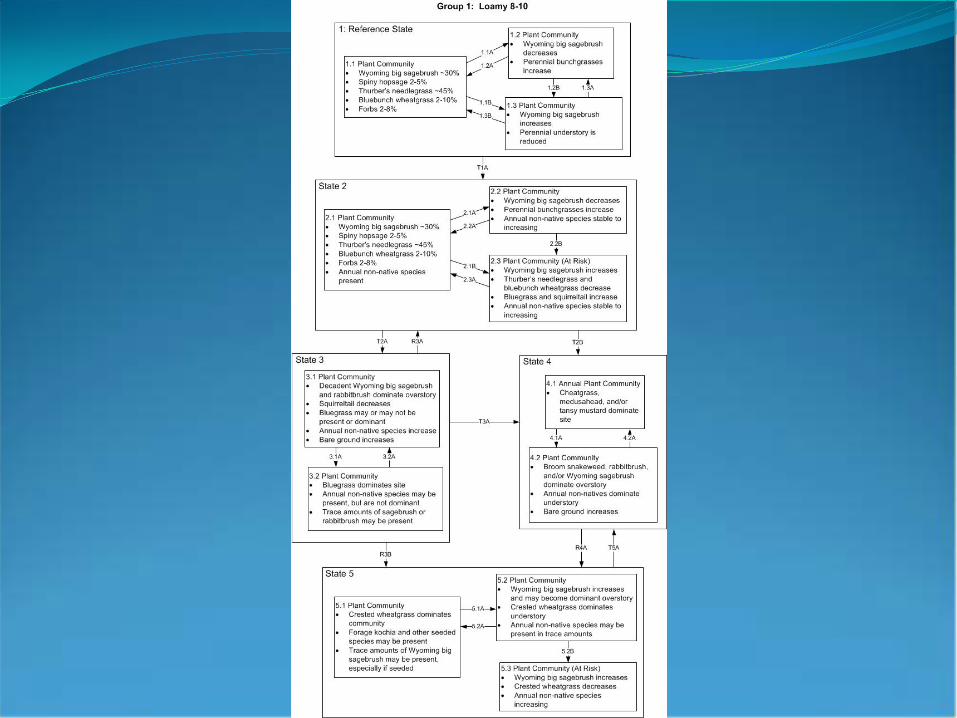
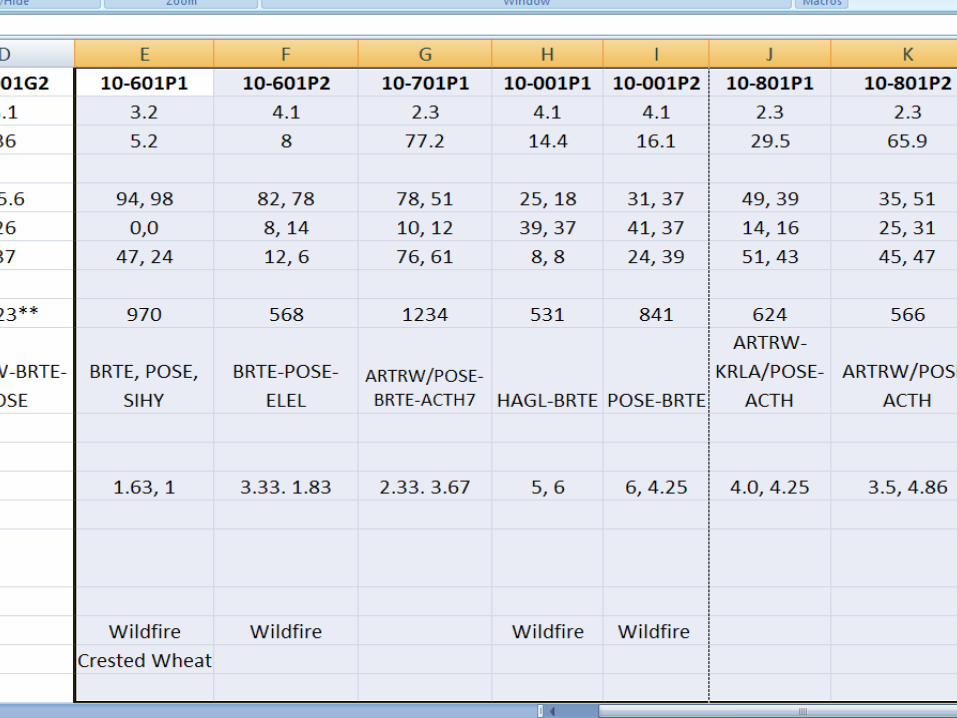

Use of Data Confirm community phases in STM’s Vegetation composition of community phases Production for community phases Non-native species documentation Vegetation height for structure table Proportion of canopy gaps for threshold indicators Rangeland health attributes: bare ground, litter, soil
stability Document disturbances: wild horse use, wildfires,
cheatgrass die-off
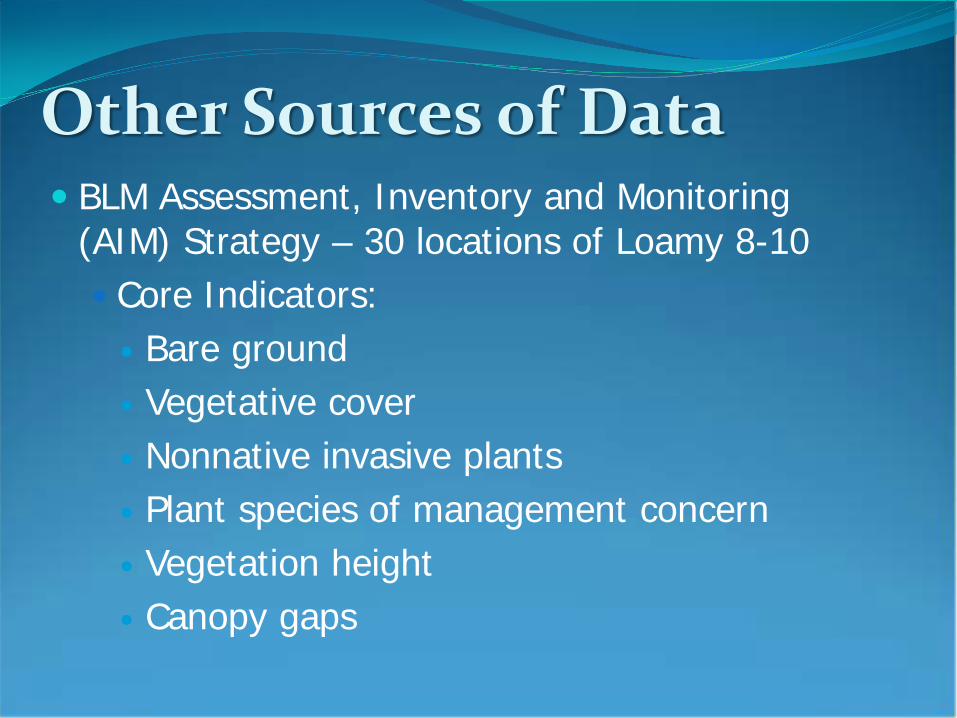
Other Sources of Data BLM Assessment, Inventory and Monitoring
(AIM) Strategy – 30 locations of Loamy 8-10 Core Indicators: Bare ground Vegetative cover Nonnative invasive plants Plant species of management concern Vegetation height Canopy gaps