Using multi-criteria analysis as a tool to select the feasible measures for sustainable development...
13
VNU Journal of Science, Earth Sciences 24 (2008) 66‐78 66 Using multi‐criteria analysis as a tool to select the feasible measures for sustainable development of brackish water shrimp culture in Quang Tri Province Nguyen Tien Giang 1, *, Tran Anh Phuong 1 , Tran Ngoc Anh 1 , Nguyen Thanh Son 1 , Nguyen Truong Khoa 2 1 College of Science, VNU 2 Department of Natural Resources and Environment of Quang Tri Province Received 7 July 2008; received in revised form 23 August 2008 Abstract. In recent years, brackish water shrimp culture in Quang Tri Province has developed rapidly. Thanks to this development, lives of many local farmers have been improved, contributing considerably to the poverty alleviation goal. However, together with this positive impact, policy‐ makers and shrimp farmers are facing several issues such as spread of shrimp’s diseases, water pollution and salinity intrusion. For the purpose of sustainable development, it is necessary to search for and implement those measures which can solve effectively these emerging problems. This paper presents the results on the application of a multi‐criteria analysis method to selecting the most feasible measures to these problems. The MCA results suggest the four most feasible measures and pinpoint that the combined option: sedimentation reservoir & reservoir with culture plus improved feeding and water management as the ʺbestʺ option. Keywords: Shrimp culture; Multi‐criteria analysis; Feasible measures; Sustainable development; Quang Tri Province. 1. Introduction * Quang Tri Province is located in the Central Vietnam. The province is bounded on the north by Quang Binh Province, on the south by Thua Thien Hue Province, on the west by Laos Republic and on the east by the sea (Fig.1). The Province includes 10 administrative units: two towns and 8 districts, in which Dong Ha is the provincial capital. _______ * Corresponding author. Tel.: 84‐4‐2173940. E‐mail: [email protected] As regards topography, Quang Tri has all types of topography: mountains, hills, plains and coastal sand dune with two main river systems: Thach Han and Ben Hai. Lying in the tropical monsoon region, the average temperature of Quang Tri is ranging from 20 0 C to 25 0 C, in which the highest and lowest temperature usually happens on July and January, respectively. Quang Tri has a total annual rainfall of about 2000‐2700 mm, but the rainfall is rather unequally distributed over time and space. The rainy season starts in September, ends in
-
Upload
independent -
Category
Documents
-
view
4 -
download
0
Transcript of Using multi-criteria analysis as a tool to select the feasible measures for sustainable development...

VNU Journal of Science, Earth Sciences 24 (2008) 66‐78
66
Using multi‐criteria analysis as a tool to select the feasible measures for sustainable development of brackish water
shrimp culture in Quang Tri Province
Nguyen Tien Giang1,*, Tran Anh Phuong1, Tran Ngoc Anh1, Nguyen Thanh Son1, Nguyen Truong Khoa2
1 College of Science, VNU
2 Department of Natural Resources and Environment of Quang Tri Province
Received 7 July 2008; received in revised form 23 August 2008
Abstract. In recent years, brackish water shrimp culture in Quang Tri Province has developed rapidly. Thanks to this development, lives of many local farmers have been improved, contributing considerably to the poverty alleviation goal. However, together with this positive impact, policy‐makers and shrimp farmers are facing several issues such as spread of shrimp’s diseases, water pollution and salinity intrusion. For the purpose of sustainable development, it is necessary to search for and implement those measures which can solve effectively these emerging problems. This paper presents the results on the application of a multi‐criteria analysis method to selecting the most feasible measures to these problems. The MCA results suggest the four most feasible measures and pinpoint that the combined option: sedimentation reservoir & reservoir with culture plus improved feeding and water management as the ʺbestʺ option.
Keywords: Shrimp culture; Multi‐criteria analysis; Feasible measures; Sustainable development; Quang Tri Province.
1. Introduction*
Quang Tri Province is located in the Central Vietnam. The province is bounded on the north by Quang Binh Province, on the south by Thua Thien Hue Province, on the west by Laos Republic and on the east by the sea (Fig.1). The Province includes 10 administrative units: two towns and 8 districts, in which Dong Ha is the provincial capital. _______ * Corresponding author. Tel.: 84‐4‐2173940. E‐mail: [email protected]
As regards topography, Quang Tri has all types of topography: mountains, hills, plains and coastal sand dune with two main river systems: Thach Han and Ben Hai. Lying in the tropical monsoon region, the average temperature of Quang Tri is ranging from 200C to 250 C, in which the highest and lowest temperature usually happens on July and January, respectively.
Quang Tri has a total annual rainfall of about 2000‐2700 mm, but the rainfall is rather unequally distributed over time and space. The rainy season starts in September, ends in
Nguyen Tien Giang et al. / VNU Journal of Science, Earth Sciences 24 (2008) 66‐78
67
January and accounts for 75% to 85% of the total yearly rainfall, whereas the dry season lasts up to 6 months, from February to July and occupies only 15‐25% of the total rainfall.
Fig. 1. Quang Tri Province.
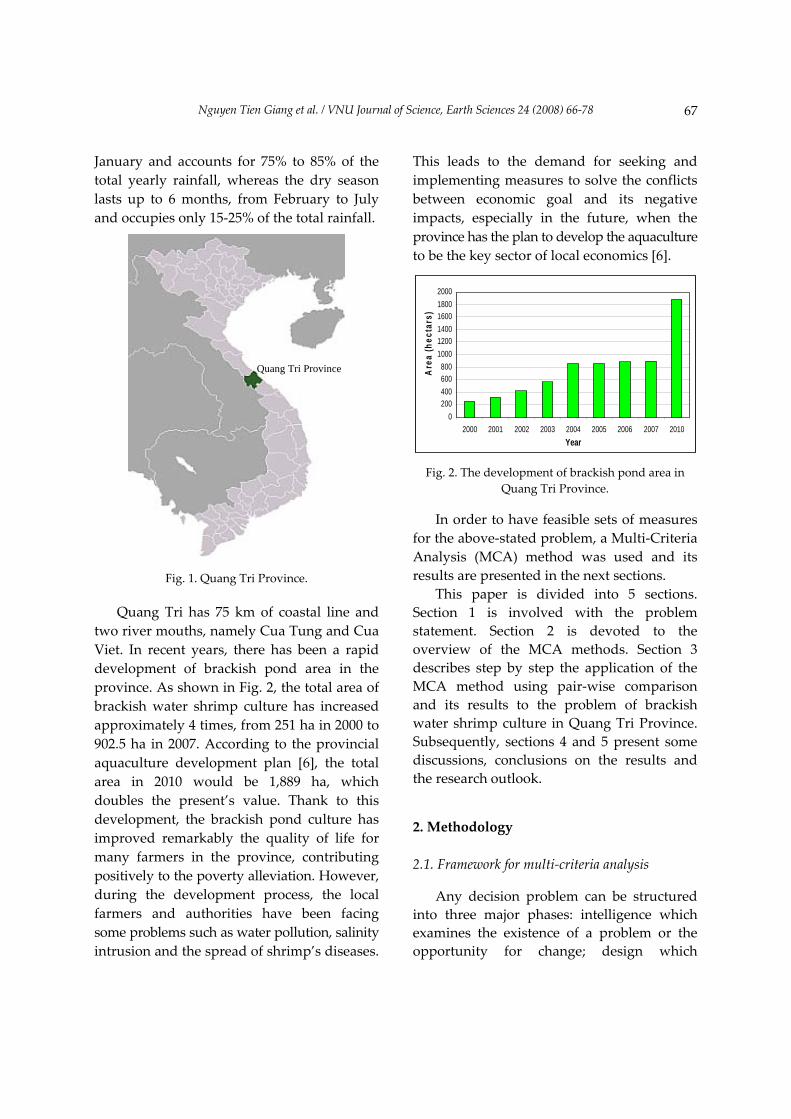
Quang Tri has 75 km of coastal line and two river mouths, namely Cua Tung and Cua Viet. In recent years, there has been a rapid development of brackish pond area in the province. As shown in Fig. 2, the total area of brackish water shrimp culture has increased approximately 4 times, from 251 ha in 2000 to 902.5 ha in 2007. According to the provincial aquaculture development plan [6], the total area in 2010 would be 1,889 ha, which doubles the present’s value. Thank to this development, the brackish pond culture has improved remarkably the quality of life for many farmers in the province, contributing positively to the poverty alleviation. However, during the development process, the local farmers and authorities have been facing some problems such as water pollution, salinity intrusion and the spread of shrimp’s diseases.
This leads to the demand for seeking and implementing measures to solve the conflicts between economic goal and its negative impacts, especially in the future, when the province has the plan to develop the aquaculture to be the key sector of local economics [6].
0200400600800
100012001400160018002000
2000 2001 2002 2003 2004 2005 2006 2007 2010Year
Are
a (h
ecta
rs)
Fig. 2. The development of brackish pond area in Quang Tri Province.
In order to have feasible sets of measures for the above‐stated problem, a Multi‐Criteria Analysis (MCA) method was used and its results are presented in the next sections.
This paper is divided into 5 sections. Section 1 is involved with the problem statement. Section 2 is devoted to the overview of the MCA methods. Section 3 describes step by step the application of the MCA method using pair‐wise comparison and its results to the problem of brackish water shrimp culture in Quang Tri Province. Subsequently, sections 4 and 5 present some discussions, conclusions on the results and the research outlook.
2. Methodology
2.1. Framework for multi‐criteria analysis
Any decision problem can be structured into three major phases: intelligence which examines the existence of a problem or the opportunity for change; design which
Quang Tri Province

Nguyen Tien Giang et al. / VNU Journal of Science, Earth Sciences 24 (2008) 66‐78
68
determines the alternatives; and choice which decides the best alternative [10]. MCA is an effective tool used in a decision process. The major elements involved in decision making process using a MCA method can be viewed systematically in a framework (Fig. 3).
Fig. 3. Framework for multi‐criteria analysis.
2.2. Problem definition
A decision problem is the difference between the desired and existing state of the real world. It is a gap recognized by the stakeholders (decision makers, scientists and/or farmers). Any decision making process begins with the recognition and the definition of the problem. This stage is in the intelligence phase of decision making and it involves in searching the decision environment for conditions, obtaining, processing and examining the raw data to identify the problems.
2.3. Constraints
After the problem has been defined, constraints (or boundary conditions) of this problem have to be determined for the following two reasons:
‐ The studied problems are usually complicate, they are relating to many aspects and sectors. Therefore, it is impossible to take into account all these effects in practice.
‐ On the other hand, for solving a problem, many measures would be suggested. The responsibility of the scientists is to screen among these alternatives the feasible measures based on applicability and suitability for the local conditions.
2.4. Evaluation criteria
After the problem and its constraints have been determined, the set of evaluation criteria should be designated [2]. This stage involves specifying a comprehensive set of objectives that reflects all concerns relevant to the decision problem and measures for achieving those objectives.
2.5. Criterion weights
Criteria weighting is one of the most important steps in the decision making process. A weight can be defined as a value assigned to an evaluation criterion which indicates its importance relative to other criteria under consideration. Assigning weights of importance to evaluation criteria accounts for: (i) the changes in the range of variation for each evaluation criterion and (ii) the different degrees of importance being attached to these ranges of variation [3]. Based on this general direction, a number of methods have been developed and applied. Each of them has its own advantages and disadvantages. Table 1 summarizes some these methods and their features.
In comparison with the ranking and rating methods, pairwise comparison and trade‐off analysis methods both have more precise and objective underlying theory.
Problem Definition
Constraints
Alternatives
Pairwise comparison matrix
Decision Maker’sPreferences
Decision Matrix
Select feasible measures
Criterion Weights
Evaluation Criteria

Nguyen Tien Giang et al. / VNU Journal of Science, Earth Sciences 24 (2008) 66‐78
69
Table 1. Methods for determining criterion weights [8, 9]
Methods/Features Ranking Rating Pairwise comparison Trade‐off analysis Number of judgments n n n(n‐1)/2 <n Response scale Ordinal Interval Ratio Interval Hierarchical Possible Possible Yes Yes Underlying theory None None Statistical/ heuristic Axiomatic/ deductive Ease of use Very easy Very easy Easy Difficult Trustworthiness Low High High Medium Precision Approximations Not precise Quite precise Quite precise Software availability Spreadsheets Spreadsheets Expert Choice Logical Decision
However, when it comes to the ease of use, pairwise comparison is much better than the trade‐off analysis. For these reasons, pairwise comparison method was applied in this study. The following paragraphs introduce this method.
The method involves pairwise comparisons to create a ratio matrix. It takes pairwise comparisons as input and produced relative weights as output. The pairwise comparison method involves two main steps:
‐ Development of a pairwise comparison matrix: the method uses a scale with values range from 1 to 9. The possible values are presented in Table 2.
Table 2. Scale for pairwise comparison [12]
Intensity of importance
Definition
1 Equal importance 2 Equal to moderately importance 3 Moderate importance 4 Moderate to strong importance 5 Strong importance 6 Strong to very strong importance 7 Very strong importance 8 Very to extremely strong importance 9 Extreme importance
‐ Computation of the weights: the computation of the weights involves three steps. The first one is summation of the values in each matrix column. Next, each element in the matrix should be divided by
its column total (the resulting matrix is referred to as the normalized pairwise comparison matrix). In the third step, computation of the average of the elements in each row of the normalized matrix should be made which includes dividing the sum of normalized scores for each row by the number of criteria. These averages provide an estimate of the relative weights of the criteria being compared.
The advantage of this method is that only two criteria have to be considered at a time, it can be implemented in a spreadsheet environment [3]. One of the disadvantages is that the relative importance of evaluation criteria is determined without considering the scales on which the criteria are measured. Another disadvantage is the large amount of pairwise comparisons if many criteria exist.
2.6. Determination of alternatives
Based on the constraints and objectives of the problem and the relating sectors, the measures or combinations of measures to solve the problem is to be suggested. These measures can be the ones that have been being applied elsewhere having features or new technologies that are firstly considered. Then, scores for these measures with respect to different criteria will be assessed after expert consultation.

Nguyen Tien Giang et al. / VNU Journal of Science, Earth Sciences 24 (2008) 66‐78
70
2.7. Selection of the feasible measures
The final stage in the decision making process is to estimate the scores for each of the alternatives and choose the most suitable measures for the objectives and conditions of the study. Two factors used to determine these scores are scores for the measures with respect to different criteria and weights of the criteria. The measures with highest scores will be selected to solve the problem.
3. Application of MCA to selecting feasible measures for sustainable development of brackish water shrimp culture in Quang Tri Province
3.1. Current and future problem
During the last couple of years, the spread of shrimp diseases occurred frequently in the study area. These diseases are spread by brackish water, which is taken in and out without proper pretreatment and post treatment by the shrimp farmers. The river water has a tendency to be polluted due to the wastewater from the shrimp farms and from other sectors such as industry and agriculture.
Another problem for the shrimp farmers is to keep a decent salinity rate for growing black tiger shrimps (Penaeus monodon). This salinity rate changes considerably over time because of the tidal regime. Only at certain periods water with the appropriate salinity rate can be taken in by the farmers.
3.2. Boundary conditions
There are several boundary conditions that need to be mentioned related to the problems and possible solutions of the wastewater
problems near shrimp ponds. These are: (i) Spatial boundaries: the location of the
shrimp farms has to stay nearby the river estuaries; The available space for a production pond remains 0.5‐1 ha.
(ii) Social boundaries: the standard of living for the farmers should not be lowered.
(iii) Ecological boundaries: the water quality in the ponds should be improved to the needed standards for black tiger shrimps; Water quality in the river and in the estuaries should be improved; No measures may have negative effects on the environment.
Measures suggested should meet these boundaries, otherwise they will be removed.
3.3. Objectives
Shrimp farmers want to make their living; they need to maintain their families. Also because of the relative large initial investment costs they are in debt and have to repay the banks in short terms.
The local government wants a growing economy in Quang Tri, and shrimp farming is a great opportunity for the people living in the lower parts of the province because of its unique brackish environment.
After all requirements of all factors are taken into account, the study comes to conclude that the major objective for MCA is to achieve a more stable economic environment. In trying to achieve this goal, sub‐goals can be reached like:
+ Better water quality in the rivers and estuaries;
+ Better water quality in the shrimp ponds; + Better well being of farmers and their
families / the communities; + Better functioning of all the land uses in
the surroundings.

Nguyen Tien Giang et al. / VNU Journal of Science, Earth Sciences 24 (2008) 66‐78
71
3.4. Evaluation criteria
To choose criteria that are useful for the multi‐criteria analysis, several aspects are kept in mind. First of all, the relating aspects can influence the water quality in the river, estuaries and shrimp ponds. Secondly, the related actors, every actor has his main interests, which are important to find a measure, or a combination of measures that is suitable for all the actors. Thirdly, all of the suggested criteria have to meet the demand of boundary conditions. Based on these requirements, the following criteria were taken into account in order to evaluate the effectiveness of alternatives:
‐ Costs of implementation: this criterion is quite logical, as it is important for the farmers and the local government that a measure will be affordable.
‐ Time of implementation: this is very important for the farmers. Many farmers now are already in debt because of the loans they took for their initial investment costs. For the local government it is also important to have a quick solution for the issues at the farms as the shrimp farming industry itself has great potential for development.
‐ Manageability by farmers: it is important that the measures are not difficult to implement, maintain and operate.
‐ Economic benefits: if measures are successfully implemented they could really contribute to a more stable economic environment for both local farmers and government.
‐ Effect on production: the survival rate of shrimps will increase differently per measure or in some cases another type of culture can be added to the production.
‐ Effect on diseases: if polluted substances in the water are reduced to the needed or desired water quality standards, the
occurrence of diseases will decrease. ‐ Environmental impact: measures can be
taken at the intake or outlet of the shrimp farms. In this way the impact can be different per measure.
‐ Needed policies: depending on each measure the government needs to apply policies to the area affected by the measure. This requires time‐consuming and costly efforts.
‐ Large scale effectiveness: It is important to see how large the influence of a measure can be, mostly for the future planning of aquaculture in Quang Tri Province.
3.5. Determination of criterion weights
When the criteria have been selected, the next step is to determine weights for these criteria based on the importance of each criterion. Because the main objective of the study is to create a more stable economic environment for the farmers and government, the two criteria, which are economic profit and environmental impact, will be assigned the highest weight. Other objectives are cost and time of implementation, effect on diseases. Finally, the impact and area of impact are important for the aquaculture, agriculture, industries and other land users. Based on these criteria and the preference order, the following paragraph discusses how to determine these weights by the pairwise comparison method: Establishment of pairwise comparison matrix:
Each pair of criteria was taken from the set of the criteria and compare with each other. Experts’ consultation was used for the relative important level of one criterion between a pair of criteria based on information in Table 2. The exercise was repeated for all the pairs of criteria and the result is presented in Table 3.

Nguyen Tien Giang et al. / VNU Journal of Science, Earth Sciences 24 (2008) 66‐78
72
Table 3. The pairwise comparison matrix
Criteria A B C D E F G H I A: Economic benefits 1.00 2.00 3.00 1.00 4.00 5.00 5.00 6.00 7.00 B: Costs of implementation 0.50 1.00 2.00 0.50 3.00 4.00 4.00 5.00 6.00 C: Time of implementation 0.33 0.50 1.00 0.33 2.00 3.00 3.00 4.00 5.00 D: Environmental impact 1.00 2.00 3.00 1.00 4.00 5.00 5.00 6.00 7.00 E: Effect on diseases 0.25 0.33 0.50 0.25 1.00 2.00 2.00 3.00 4.00 F: Manageability by farmers 0.20 0.25 0.33 0.20 0.50 1.00 1.00 2.00 3.00 G: Large scale effectiveness 0.20 0.25 0.33 0.20 0.50 1.00 1.00 2.00 3.00 H: Effect on production 0.17 0.20 0.25 0.17 0.33 0.50 0.50 1.00 2.00 I: Needed policies 0.14 0.17 0.20 0.14 0.25 0.33 0.33 0.50 1.00 Sum 3.79 6.70 10.62 3.79 15.58 21.83 21.83 29.50 38.00
Table 4. The standardized pairwise comparison matrix
Criteria A B C D E F G H I WeightA: Economic benefits 0.26 0.30 0.28 0.26 0.26 0.23 0.23 0.20 0.18 0.25 B: Costs of implementation 0.13 0.15 0.19 0.13 0.19 0.18 0.18 0.17 0.16 0.17 C: Time of implementation 0.09 0.07 0.09 0.09 0.13 0.14 0.14 0.14 0.13 0.11 D: Environmental impact 0.26 0.30 0.28 0.26 0.26 0.23 0.23 0.20 0.18 0.25 E: Effect on diseases 0.07 0.05 0.05 0.07 0.06 0.09 0.09 0.10 0.11 0.08 F: Manageability by farmers 0.05 0.04 0.03 0.05 0.03 0.05 0.05 0.07 0.08 0.05 G: Large scale effectiveness 0.05 0.04 0.03 0.05 0.03 0.05 0.05 0.07 0.08 0.05 H: Effect on production 0.04 0.03 0.02 0.04 0.02 0.02 0.02 0.03 0.05 0.03 I: Needed policies 0.04 0.02 0.02 0.04 0.02 0.02 0.02 0.02 0.03 0.02
Establishment of standardized comparison
matrix: This matrix can be estimated by dividing each element in the pairwise comparison matrix by its column total. The result is presented in Table 4. Computation of criterion weights: Weights
of each of the criteria were determined by computing the average of the elements in each row of the normalized matrix. The result is shown in the last column of Table 4.
3.6. Measures for Quang Tri’s brackish water shrimp culture
To solve the problems relating to Quang Tri’s brackish water shrimp culture, the study
considers those measures that are being used in the target areas as well as foreign countries, such as Indonesia, China, Bangladesh, Germany, Mexico, Colombia, USA. Some of them are introduced as follows.
3.6.1. Structural measures A1: Polyculture In the shrimp farm, the first crop will
remain the same as before, but the second crop (July to October) will be used to produce not only shrimp but also other culture, like oysters, crabs, mussels, fish, etc. In doing so, there will be two profits: the nutrients in the water stemming from the first crop will be reused in the second crop, and the farmers

Nguyen Tien Giang et al. / VNU Journal of Science, Earth Sciences 24 (2008) 66‐78
73
will have more economic certainty, because they can bet on two different horses. Some of the semi‐intensive shrimp farms have already used the polyculture method, with fish and rice. A2: Bio‐filter ‐ A2.1: Mangrove filter. This measure has
been already conducted by combining the shrimp farming industry with the placing of mangroves in Colombia [1]. The cost of the measure is around 100,000 USD (1995 price) for 120 ha of mangroves and 200 ha of production pond area [1]. Construction of the measure cost about 100,000 USD, which is very cheap in comparison with the cost of a constructed wetland as proposed by Schwartz and Boyd [1]. The most significant benefit of the system, followed by Gautier, is the BOD and TSS removal from pond effluent. Another potential financial benefit of the recirculation system is the possible prevention of blue‐green algae bloom in the estuary, which may cause an off‐flavor to develop in shrimp.
‐ A2.2: Wetland. A wetland also can be a solution to Quang Tri Province. The wetland is located near the shrimp ponds and consists of soil with a certain slope and obstacles in it, so that water will flow through in a certain direction. In this way the water gets cleaned before it reaches the discharge channel [11]. The costs of a constructed wetland depend on the size of the wetland needed, which on itself depends on the amount of flowing wastewater. The advantages of the constructed wetlands are that they can be very effective in improving water quality in the downstream waters. They also are effective in removing or stabilizing sediments, heavy metals and organic contaminants.
‐ A2.3: Sedimentation reservoir + reservoir with culture (oysters, crabs). This system
includes two basins: a sedimentation basin to settle the suspended substances in the water; and a basin with bacteria, or other cultures like oysters, mussels or crabs, to remove certain nutrients (Fig. 4). The cost of this measure is about 900 USD for 0.5 ha of reservoir.
Fig. 4. A hypothetical example of production ponds with sedimentation and culture reservoirs [4].
3.6.2. Non‐structural measures B1: Improved feeding management
(appropriate feeding, less antibiotics) The major problems with Nutrients,
Phosphates and BOD are mainly caused by feeding the shrimps more than they can eat and giving them too many antibiotics. The excess of these substances will remain in the water and will also get in the sludge on the bottom of the shrimp ponds. By reducing the feeding and the antibiotics, less substances will get into the wastewater. B2: Better water management. Reducing the
number of times that water is taken in should have a positive effect on the amount of polluted water taken in by farms. Though not

Nguyen Tien Giang et al. / VNU Journal of Science, Earth Sciences 24 (2008) 66‐78
74
changing the water often enough may have negative effects on the chances of diseases [5]. In order to conduct effectively this measure, the timing of the freshwater intake should be changed together with the output of wastewater, not only from shrimp farms but also the wastewater output of industries and agriculture. When these two events occur too close to each other, shrimp farms will take in polluted water. The pumping in and out of saline and wastewater should follow the tidal regime scientifically.
In practice, in order to have more effective measures, a number of alternatives (especially the non‐structural) are usually implemented simultaneously. Based on the Quang Tri’s local conditions and the feasibility of alternatives, 10 combinations below were taken into account in the MCA process:
A1 + A2.3: Polyculture + Sediment reservoir & reservoir with culture.
A1 + B1: Polyculture + Improved feeding management.
A1 + B2: Polyculture + Better water management.
A1 + B1 + B2: Polyculture + Improved feeding management + Better water management.
A2.1 + A2.3: Mangrove filter + Sedimentation reservoir & reservoir with culture.
A2.1 + B1: Mangrove filter + Improved feeding management.
A2.2 + A2.3: Wetland + Sedimentation reservoir & reservoir with culture.
A2.2 + B1: Wetland + Improved feeding management.
A2.3 + B1: Sedimentation reservoir & reservoir with culture + Improved feeding management.
A2.3 + B1 + B2: Sedimentation reservoir & reservoir with culture + Improved feeding management + Better water management
In order to score for each of the measures with the criteria, the meaning of the impact levels of measures on the criteria should be
defined. The meaning levels are as follows: Costs of implementation: The lower the
score the better. Time of implementation: The lower the
amount the better. Manageability by farmers: The easier the
better. Economic benefits: The higher the better. Effect on production: The higher the effect
the better. Effect on diseases: The higher the effect the
better. Environmental impact: The higher the better. Needed policies: The less the amount of
policies needed (or guidance by the government) the better. Large scale effectiveness: The higher the
scale the better Based on these meaning, the impact levels
and scores of the suggested measures for each of the criteria should be assessed.
The cost of implementation criterion: among measures, the measure with the highest and lowest cost will get the score of 0 and 1, respectively. The others will be interpolated from the lowest and highest cost.
The time of implementation criterion: if the implementing time of a measure is longer than 4 months, equal to 2‐3 months and shorter than 2 months, its score is 0, 0.5, and 1, respectively.
Other criteria: this study evaluates impact of the measures in 3 levels: hard/medium/ easy or high/medium/low with 3 respective standardized score of 0, 0.5, and 1.
The standardized scores for different criteria are shown in Table 5.
Based on the standardization scoring card, the study has consulted experts in the some of related sectors, local authorities and residents about the impact level of measures on each of the criteria. These evaluation results are shown in Table 6.

Nguyen Tien Giang et al. / VNU Journal of Science, Earth Sciences 24 (2008) 66‐78
75
Table 5. Standardization scoring card
Criteria Levels Standardization
Costs of implementation high/medium/low 0/0.5/1 Time of implementation 4/2‐3/1 0/0.5/1 Manageability by farmers hard/medium/easy 0/0.5/1 Economic benefits high/medium/low 1/0.5/0 Effect on production high/medium/low 0/0.5/1 Effect on diseases high/medium/low 1/0.5/0 Environmental impact high/medium/low 1/0.5/0 Needed policies high/medium/low 0/0.5/1 Large scale effectiveness high/medium/low 1/0.5/0
Table 6. Scoring card of combination of measures
Combination of Measures Criteria A1+A2.3 A1+B1 A1+B2 A1+B1+B2 A2.1+A2.3 Costs of implementation est: 335 est: 220 est: 220 est: 240 est: 737 Time of implementation 2‐3 2‐3 2‐3 2‐3 >4 Manageability by farmers medium medium medium medium medium Economic benefits high high high high medium Effect on production high high high high medium Effect on diseases medium medium medium medium medium Environmental impact medium medium medium medium high Needed policies medium medium medium medium low Large scale effectiveness low low low low high Combination of Measures Criteria A2.1+B1 A2.2+A2.3 A2.2+B1 A2.3+B1 A2.3+B1+B2 Costs of implementation est: 622 est: 8351 est: 8236 est: 155 est:175 Time of implementation >4 >4 >4 1‐2 1‐2 Manageability by farmers medium medium medium medium medium Economic benefits medium medium medium medium high Effect on production medium high high medium high Effect on diseases medium high high medium medium Environmental impact high high high low medium Needed policies medium medium medium high low Large scale effectiveness high medium medium low low
Next, the standardized score for the cost of implementation should be estimated so that the overall evaluation can be done. First of all, the cost of implementation and applied areas of some projects in other locations are collected [1, 11]. The research assumes that the cost to establish these measures in Quang Tri Province is equal to the cost in other
regions. These values, then, are divided by the shrimp pond area to get the standardized cost (USD/ha). The results are presented in Table 8. As a rule, the alternative A2.3 + B1 with lowest cost (155 USD) will be assigned a score of 1 and the combination A2.2 + A2.3 with highest cost (8,351 USD) will be assigned a score of 0. The others are

Nguyen Tien Giang et al. / VNU Journal of Science, Earth Sciences 24 (2008) 66‐78
76
interpolated from two of these values based on their cost per hectare. The scores for the costs of implementation corresponding to different measures are shown in Table 7.
Table 7. Standardized score for costs of combinations
Measure Standardized cost Standardized scoreA1+A2.3 335 0.978 A1+B1 220 0.992 A1+B2 220 0.992 A1+B1+B2 240 0.990 A2.1+A2.3 737 0.929 A2.1+B1 622 0.943 A2.2+A2.3 8351 0.000 A2.2+B1 8236 0.014 A2.3+B1 155 1.000 A2.3+B1+B2 175 0.998
The final step in evaluating the measures is to determine the weights for the alternatives. By referring to the standardized scores in Tables 5 and 7, and scoring card of combinations in Table 6, the scores of alternatives corresponding with different criteria are shown in Table 8. From these scores and weights of each of the criteria, the evaluation score of the alternatives is estimated as:
∑=
=n
jjiji wsA
1
,
in which, Ai is the score of the ith measure; wj is the weight of the jth criterion and sij is the score of the ith measure with respect to the jth criterion.
Table 8. Final results of MCA
Criteria A1+A2.3 A1+B1 A1+B2 A1+B1+B2 A2.1+A2.3 Weight
Costs of implementation 0.978 0.992 0.992 0.990 0.929 0.17 Time of implementation 0.5 0.5 0.5 0.5 0.0 0.11 Manageability by farmers 0.5 0.5 0.5 0.5 0.5 0.05 Economic benefits 1 1 1 1 0.5 0.25 Effect on production 1 1 1 1 0.5 0.03 Effect on diseases 0.5 0.5 0.5 0.5 0.5 0.08 Environmental impact 0.5 0.5 0.5 0.5 1 0.25 Needed policies 0.5 0.5 0.5 0.5 1 0.02 Large scale effectiveness 0 0 0 0 1 0.05 Total 0.701 0.704 0.704 0.703 0.683 Criteria A2.1+B1 A2.2+A2.3 A2.2+B1 A2.3+B1 A2.3+B1+B2 Weight
Costs of implementation 0.943 0.000 0.014 1.000 0.998 0.17 Time of implementation 0 0 0 1 1 0.11 Manageability by farmers 0.5 0.5 0.5 0.5 0.5 0.05 Economic benefits 0.5 0.5 0.5 0.5 1 0.25 Effect on production 0.5 1 1 0.5 1 0.03 Effect on diseases 0.5 1 1 0.5 0.5 0.08 Environmental impact 1 1 1 0 0.5 0.25 Needed policies 0.5 0.5 0.5 0 1 0.02 Large scale effectiveness 1 0.5 0.5 0 0 0.05 Total 0.675 0.545 0.547 0.485 0.770

Nguyen Tien Giang et al. / VNU Journal of Science, Earth Sciences 24 (2008) 66‐78
77
It can be seen from Table 8 that the measure which has the smallest score is option A2.3 + B1. Based on the MCA result, the 4 best combinations are: (1) A1 + A2.3; (2) A1 + B1; (3) A1 + B2; (4) A2.3 + B1 + B2. The last combination (Sedimentation reservoir & reservoir with culture + Improved feeding management + Better water management) is the ʺbestʺ alternative with overall score of 0.770.
4. Discussions
The application results of MCA method to the problem of brackish shrimp pond culture in Quang Tri suggest several points worth discussing.
First, sustainable development is a relatively new concept which requires taking both short and long term goals of multiple stakeholders into consideration. The use of MCA as a tool in this problem helps decision makers in Quang Tri Province to select the feasible measure(s) and ʺbestʺ option in a rational manner. Particularly, the option “Sedimentation reservoir & reservoir with culture + Improved feeding management + Better water management” is recommended due to its highest score with respect to nine criteria (Table 8).
Second, the two effective measures mangrove and wetland filters have low scores (Table 8) because, at present, the cost to implement these measures is too high compared to other measures. However, in the future, when the shrimp activity is invested more by the government, they should be considered again because their positive impacts on the shrimp pond as well as environment. This is related to the problem of changing management objective over time in a decision making process.
Third, the present research employs information regarding to the measure implementing costs from literature which stemmed from other abroad projects. Therefore, some assessments are relatively coarse estimation. In the future, it is necessary to have more precise data and a wider range of stakeholders serving for the assessment task.
5. Conclusions
This paper aims to present the results of an application of MCA to find out the most feasible measures for sustainable development of the brackish water shrimp culture in Quang Tri Province. The application of MCA includes determining the emerging problems, objectives and requirements of related factors, as well as the alternatives that have been used in the study area. From that it suggests the measures to solve the problems and apply the MCA approach for selecting the most suitable options.
The research determined that the combination of measures Sedimentation reservoir & reservoir with culture + Improved feeding management + Better water management is the most suitable for the Quang Tri’s condition for the time being.
From scientific point of view, the complexity of environmental problems makes necessary the development and application of new tools capable of processing not only the numerical aspects, but also the experience of experts and wide public participation, which are all needed in the decision‐making process [7].
MCA is a qualitative analysis method which allows the use of participatory approach in the decision making process. In other words, with MCA, all relevant

Nguyen Tien Giang et al. / VNU Journal of Science, Earth Sciences 24 (2008) 66‐78
78
stakeholders (farmers, scientists, decision makers) can be involved in this process. In doing so, the consensus on the problems and their solutions can be reached. However, it is noted that MCA is subjective in its nature. In case the quantitative data are available, quantitative analysis (i.e. numerical modelling) can be used in combination with MCA to arrive at the ʺbestʺ solution(s) in the decision making process. This is another part of our research.
Acknowledgements
This paper is resulted from a project funded by the Quang Tri Department of Natural Resources and Environment. The authors would like to thank all of the people who helped us to successfully accomplish that project. The comments of the reviewer have improved the structure and content of the paper. This reviewer is gratefully acknowledged.
References
[1] D. Gautier, The integration of Mangrove and Shrimp Farming: A case study on the Caribbean of Colombia, World Bank, NACA, WWF and FAO Consortium Program on Shrimp Farming and the Environment, 2002.
[2] R. L. Keeney, H. Raiffa, Decisions with multiple objectives‐preferences and value tradeoffs. Cambridge University Press, Cambridge, 1993.
[3] C.W. Kirkwood, Strategic decision making: Multiobjective decision analysis with spreadsheets, Duxbury Press, Belmont, California, 1997.
[4] M. Krutwagen, Impact of shrimp pond wastewater on estuaries and the issue of salinity intrusion in Quang Tri Province, Internship report, Hanoi University of Science and Twente University, Hanoi, 2007.
[5] P.S. Leung, L.T. Tran, A.W. Fast, A logistic regression of risk factors for disease occurrence on Asian shrimp farms, Diseases of Aquatic Organisms 41 (2000) 65.
[6] Nguyen Tien Giang et al., Impact assessment of aquaculture on water pollution, problem of salinity intrusion and proposed alternatives contributing to the socio‐economic development and environmental protection for Quang Tri Province, Final project report, Hanoi University of Science, Hanoi, 2007 (in Vietnamese).
[7] T.G. Nguyen, J.L. De Kok, M. Titus, A new approach to testing an integrated water systems model using qualitative scenarios, Environmental Modelling & Software 22, (2007) 1557.
[8] G.F. Pitz, J. McKillip, Decision analysis for programme evaluators, Sage Publications, Beverly Hills, 1984.
[9] P.J.H. Schoemaker, C.C. Waid, A probabilistic dominance measure for binary choices: Analytic aspects of a multi‐attribute random weights model, Journal of Mathematical Psychology 32 (2) (1988) 169.
[10] H.A. Simon, The new science of management decision, Harper and Row, New York, 1960.
[11] D.R. Tilley, H. Badrinarayanan, R. Rosati, and J. Son, Constructed wetlands as recirculation filters in large‐scale shrimp aquaculture, Aquacultural Engineering 26 (2002) 81.
[12] T. L. Saaty, Multicriteria decision making: the Analytic Hierarchy Process, Volume I, Pittsburgh, PA, RWS Publications, 1996.