Using mechanistic animal growth models to estimate genetic parameters of biological traits
11
Using mechanistic animal growth models to estimate genetic parameters of biological traits A. B. Doeschl-Wilson 1† , P. W. Knap 2 , B. P. Kinghorn 3 and H. A. M. Van der Steen 4 1 Sustainable Livestock Systems Research, Scottish Agricultural College, Bush Estates, Penicuik EH26 0PH, UK; 2 PIC International Group, Ratsteich 31, 24837 Schleswig, Germany; 3 Genus Chair of Genetic Information Systems, University of New England, Australia; 4 StoneBridge Breeding, The Gate House, Abbots Wood, Evesham, Worcestershire WR11 4NS, UK (Received 6 September 2006; Accepted 22 January 2006) Mechanistic animal growth models can incorporate a description of the genotype as represented by underlying biological traits that aim to specify the animal’s genetic potential for performance, independent from the environmental factors captured by the models. It can be argued that these traits may therefore be more closely associated to genetic potential, or components of genetic merit that are more robust across environments, than the environmentally dependent phenotypic traits currently used for genetic evaluation. The prediction of merit for underlying biological traits can be valuable for breeding and development of selection strategies across environments. Model inversion has been identified as a valid method for obtaining estimates of phenotypic and genetic components of the biological traits representing the genotype in the mechanistic model. The present study shows how these estimates were obtained for two existing pig breeds based on genetic and phenotypic components of existing performance trait records. Some of the resulting parameter estimates associated with each breed differ substantially, implying that the genetic differences between the breeds are represented in the underlying biological traits. The estimated heritabilities for the genetic potentials for growth, carcass composition and feed efficiency as represented by biological traits exceed the heritability estimates of related phenotypic traits that are currently used in evaluation processes for both breeds. The estimated heritabilities for maintenance energy requirements are however relatively small, suggesting that traits associated with basic survival processes have low heritability, provided that maintenance processes are appropriately represented by the model. The results of this study suggest that mechanistic animal growth models can be useful to animal breeding through the introduction of new biological traits that are less influenced by environmental factors than phenotypic traits currently used. Potential value comes from the estimation of underlying biological trait components and the explicit description of their expression across a range of environments as predicted by the model equations. Keywords: biological traits, genetic parameters, mechanistic models, pigs Introduction Successful breeding strategies rely on their ability to ident- ify animals whose genetic merit provides their offspring with the ability to perform better than their competitors across the prevailing range of environments. It is generally accepted that the expression of genes varies between environments and between growth stages, with at least partly different genes involved, and consequently that the genetic correlation of observable performance traits between environments and different growth stages is gen- erally not unity. This genotype by environment interaction (G £ E) imposes difficulties for the traditional methods of estimating genetic merit when specified in terms of obser- vable traits, since these generally assume a unit genetic correlation across environments. Statistical methods exist, such as covariance functions, that can deal with non-unity genetic correlations, but they rely on measurements from multiple environments, which are often difficult to obtain. Mechanistic growth models build upon an alternative description of the genotype by using traits that are con- sidered more closely related to the underlying biology (and hence to the genes) and more likely to be stable across a range of environments than the observable traits currently used in genetic evaluation. These characteristics make the model’s underlying biological traits potentially useful † E-mail: [email protected] Animal (2007), 1: Page 489–499 Q The Animal Consortium 2007 doi: 10.1017/S1751731107691848 animal 489
-
Upload
independent -
Category
Documents
-
view
1 -
download
0
Transcript of Using mechanistic animal growth models to estimate genetic parameters of biological traits

Using mechanistic animal growth models to estimate geneticparameters of biological traits
A. B. Doeschl-Wilson1†, P. W. Knap2, B. P. Kinghorn3 and H. A. M. Van der Steen4
1Sustainable Livestock Systems Research, Scottish Agricultural College, Bush Estates, Penicuik EH26 0PH, UK; 2PIC International Group, Ratsteich 31, 24837Schleswig, Germany; 3Genus Chair of Genetic Information Systems, University of New England, Australia; 4StoneBridge Breeding, The Gate House, Abbots Wood,Evesham, Worcestershire WR11 4NS, UK
(Received 6 September 2006; Accepted 22 January 2006)
Mechanistic animal growth models can incorporate a description of the genotype as represented by underlying biological traitsthat aim to specify the animal’s genetic potential for performance, independent from the environmental factors captured by themodels. It can be argued that these traits may therefore be more closely associated to genetic potential, or components of geneticmerit that are more robust across environments, than the environmentally dependent phenotypic traits currently used for geneticevaluation. The prediction of merit for underlying biological traits can be valuable for breeding and development of selectionstrategies across environments.
Model inversion has been identified as a valid method for obtaining estimates of phenotypic and genetic components of thebiological traits representing the genotype in the mechanistic model. The present study shows how these estimates were obtainedfor two existing pig breeds based on genetic and phenotypic components of existing performance trait records. Some of theresulting parameter estimates associated with each breed differ substantially, implying that the genetic differences between thebreeds are represented in the underlying biological traits. The estimated heritabilities for the genetic potentials for growth, carcasscomposition and feed efficiency as represented by biological traits exceed the heritability estimates of related phenotypic traitsthat are currently used in evaluation processes for both breeds. The estimated heritabilities for maintenance energy requirementsare however relatively small, suggesting that traits associated with basic survival processes have low heritability, provided thatmaintenance processes are appropriately represented by the model.
The results of this study suggest that mechanistic animal growth models can be useful to animal breeding throughthe introduction of new biological traits that are less influenced by environmental factors than phenotypic traits currently used.Potential value comes from the estimation of underlying biological trait components and the explicit description of theirexpression across a range of environments as predicted by the model equations.
Keywords: biological traits, genetic parameters, mechanistic models, pigs
Introduction
Successful breeding strategies rely on their ability to ident-ify animals whose genetic merit provides their offspringwith the ability to perform better than their competitorsacross the prevailing range of environments. It is generallyaccepted that the expression of genes varies betweenenvironments and between growth stages, with at leastpartly different genes involved, and consequently that thegenetic correlation of observable performance traitsbetween environments and different growth stages is gen-erally not unity. This genotype by environment interaction
(G £ E) imposes difficulties for the traditional methods ofestimating genetic merit when specified in terms of obser-vable traits, since these generally assume a unit geneticcorrelation across environments. Statistical methods exist,such as covariance functions, that can deal with non-unitygenetic correlations, but they rely on measurements frommultiple environments, which are often difficult to obtain.
Mechanistic growth models build upon an alternativedescription of the genotype by using traits that are con-sidered more closely related to the underlying biology (andhence to the genes) and more likely to be stable across arange of environments than the observable traits currentlyused in genetic evaluation. These characteristics makethe model’s underlying biological traits potentially useful† E-mail: [email protected]
Animal (2007), 1: Page 489–499 Q The Animal Consortium 2007doi: 10.1017/S1751731107691848
animal
489

predictors for genetic merit and promising traits for DNAmarker development. Although the potential benefits fromimplementing traits derived from biological productionfunctions into breeding programs have long been recog-nised (e.g. Fowler et al., 1976), their representation in cur-rent selection objectives is sparse. The most likely reasonfor this is the difficulty of measuring these traits in live ani-mals and in obtaining accurate estimates of the geneticparameters of these traits.
The present study explores the potential value of usingthe underlying biological traits derived from a mechanisticpig growth model for animal breeding purposes. This isdone by (i) illuminating the theoretical concepts that implythat these underlying traits are closely related to thebiology and likely to be more stable across environmentsthan conventionally used phenotypic traits, by (ii) present-ing a method for estimating variance components and phe-notypic means of these traits, and by (iii) comparing theestimated genetic and environmental components of thesetraits associated with two genetically different commercialbreeds and by comparing them with the correspondingcomponents of more conventional phenotypic traits.
Materials and methods
Knap’s mechanistic pig growth modelModel concepts. The mechanistic model used in this studyis a predictive, semi-stochastic model for the performancefor a population of pigs (Knap, 1999, 2000b and 2000c).Like many mechanistic pig growth models currently used inscience and industry, the model builds upon the principlesdeveloped by Whittemore and Fawcett (1976), Whittemore(1983), Moughan and Verstegen (1988), Black et al. (1995)and Emmans and Kyriazakis (1997), which can besummarised as follows: the genotype is characterised bybiological traits assumed to represent its genetic potential,defined as the animal’s biological upper limit for growthand for its ability to cope with various kinds of stressors.These upper limits refer to hypothetical optimalenvironmental conditions in which the genetic potentialcan be fully expressed. Knap et al. (2003) demonstratedthat these conditions generally differ between differenttraits and that the conditions in research or commercialfarms are generally suboptimal for at least one of thebiological traits describing the genetic potential. Bydefinition, the genetic potentials are assumed independentof the environmental conditions that are included in themodel. The interactions between the traits representingthe genetic potentials and the prevailing physiological,nutritional, social and environmental constraints aredescribed by a system of mathematical equationsthat integrate the present knowledge about the metabolicand physiological processes involved in pig growth. Modeloutputs are simultaneous predictions for variousobservable phenotypic performance traits (e.g. bodyweight, feed intake, body composition, etc.). Some of
these traits serve as inputs to the statistical methodscurrently used for genetic evaluations.
Model description. In addition to a description of thegenotype in the form of biological traits representinggenetic potentials, the mechanistic model uses as inputsthe pigs’ initial body weight, as well as a description ofthe diet composition, and the physical and socialenvironment.
Based on the provided pigs’ initial body weight themodel first calculates the chemical composition of thepig in terms of protein, lipid, ash and water mass atthe start of the simulation period according to the rulesof Emmans and Fisher (1996) and Emmans and Kyriaza-kis (1995). The pig genotype is characterised by threeGompertz function parameters Pmat, Lmat and B, whichspecify the animal’s potential for protein (Prot) and lipid(Lip) mass growth in optimal environmental conditionsaccording to
dðProtÞ=dt¼Prot £ B £ lnðPmat=ProtÞ ð1Þ
dðLipÞ=dt¼Lip £ B £ lnðLmat=LipÞ ð2Þ
where the same rate parameter B is used for proteinand lipid retention, assuming thus full allometrybetween body protein and lipid. The different asymp-totes Pmat and Lmat, correspond to protein and lipidmass at maturity. Protein and lipid growth constitutetwo of the resource demanding processes; all others arecharacterised as maintenance processes, which are alsoconsidered as genotype dependent.
Ad libitum feed intake is then predicted as the intakerequired satisfying both the protein and energy needs ofthe potential growth, as defined by equations (1) and (2),plus maintenance requirements, subject to capacity con-straints to feed intake volume. After the decomposition ofthe consumed feed into its nutrient components, the parti-tioning of the nutrients into growth and maintenance pro-cesses is modelled according to the concepts of Knap andSchrama (1996), with some modifications that take meta-bolic changes imposed by constraints of the physicalenvironment into account. For example, cold thermoregula-tory processes lead to increased feed intake in the model,whereas hot thermoregulatory actions includes reduction ofad libitum feed intake as well as reduction in physicalactivity, increase in body temperature and skin wetting,affecting thus body maintenance requirements.
The model follows these processes to iteratively calcu-late the actual protein and lipid mass growth on a dailybasis for a growth period between 16 and 110 kg bodyweight, subject to the physical, nutritional and environ-mental constraints that are captured by the model. Emptybody weight, which excludes gut fill and is assumed as95% of the full body weight, is calculated as the sum ofbody protein, lipid, ash and water mass. The latter twoare determined according to the rules of Emmans and
Doeschl-Wilson, Knap, Kinghorn and Van der Steen
490

Kyriazakis (1995 and 1997):
Asht ¼ Asht21 þ 0:21 £ PR
Water ¼ 3:04 £ Pmat0:145 £ Prot0:855
where PR is the daily protein retention and the subscript trefers to day t.
Backfat depth (BF) is calculated from the whole–bodysubcutaneous fat depth (FAT) via the regression equation(Knap, 2000c): BF ¼ 0.82 £ FAT1.212. Estimates of FATwere derived from body weight and volumes and densityof the subcutaneous tissue according to
FAT ¼ ð3:376 £ pP;SCT £ Prot þ 1:227 £ pL;SCT
£ LipÞ=0:097 £ BW0:633
where pP,SCT and pL,SCT are the proportions of proteinand lipid in subcutaneous tissue, respectively,calculated as pP,SCT ¼ 0.1285 þ 0.00 286 £ ln (Prot) andpL,SCT ¼ 0.2260 þ 0.1310 £ ln(Lip) (Knap, 2000c).
The multivariate model output includes the averagedaily feed intake (DFI), the body weight growth ratedescribed by the number of days to reach 110 kg (DAYS)and backfat depth (BF), which were used in this study toderive estimates for the underlying biological traitcharacteristics.
A more detailed description of the model concepts andthe mathematical equations, including a pseudo code, isprovided in Knap (1999 and 2000c).
The underlying biological traits representing the modelgenotypeThe model uses four traits to describe the pig’s geneticpotential for growth and energy efficiency. According toequations (1) and (2) the growth potential is characterisedby the three parameters Pmat, Lmat and B corresponding toprotein and lipid mass at maturity and a determinant ofthe rates of tissue mass retention, respectively.
The parameters are expected to be correlated. Forexample, ‘larger animals will have a lower growth raterelative to body size’ (Ferguson et al., 1997), implying thusa negative correlation between B and Pmat. According toEmmans (1988), this can be remedied by applying Taylor’sscaling rule (Taylor, 1985) to the parameter B to producethe scaled rate parameter B* ¼ B £ P0:27
mat , which is theor-etically uncorrelated to Pmat. Further, the parameter Lmat
has been replaced by its ratio to Pmat to produce LPmat (kg/kg), which is assumed to be uncorrelated to both B* andPmat. This leads to three presumed-independent model par-ameters Pmat, LPmat and B*, representing three of the fourunderlying biological traits describing the animal genotype.
The fourth genotype specific model parameter, MEm0,relates to the energy requirements of body maintenanceprocesses other than those required for protein turn-overand thermoregulation, which are explicitly captured in themodel. These maintenance energy requirements (MEmaint)are calculated according to Knap and Schrama (1996) as a
simple function of the metabolic body weight (BW0.75):
MEmaint ¼ MEm0 £ BW0:75 ð3Þ
MEmaint depends on Pmat, LPmat and B*, but the genotypespecific parameter MEm0 is assumed uncorrelated to allthree growth parameters. From now on, we will refer toMEmaint, Pmat, LPmat and B* as the four underlying biologi-cal traits.
Simulating populations with genetic variationFor simulation, a population of full-sib groups was created,which varied in their values of the four underlying biologi-cal traits Pmat, Lmat, B* and MEm0. A more complex gen-eral pedigree was not adopted as it would only introducecomplexities that are unrelated to the validity of any con-clusions to be made. The full-sibs were generated from anon-inbred and unrelated base population of n dams and nsires, with the number n chosen according to the criteriaoutlined below. It was assumed that each founder has abreeding value A for each of the four underlying biologicaltraits, which was sampled from N(0, s 2
A), where the gen-etic variance s 2
A ¼ h2s 2P is given by the model inputs for
the heritability h 2 and phenotypic variation s2P. The simu-
lated population of full-sib groups was generated by mat-ing randomly chosen dams and sire pairs of the basepopulation. Each pair produced n0 full-sib offspring. Thebreeding value of each offspring was 1
2 (ASire þ ADam) plusa Mendelian sampling deviation. The latter term wasdrawn from a multivariate N 0;
p1=2s2
A
� �; which is unaf-
fected by inbreeding due to the short pedigree adopted.The phenotypic value P for each of the four underlying bio-logical traits was obtained using the trait mean, the indi-vidual’s breeding value and an environmental deviation,sampled from a multivariate normal distributionN 0; 1 2 s2
A
� �according to:
Pi ¼ mþ Ai þ PEi; ð4Þ
where Pi is the phenotype of animal i, m is the populationmean for the trait, and Ai and PEi are its additive geneticand permanent environmental deviations. According to thisdecomposition, the value of the underlying biological traitof each animal is specified by the population mean m, theheritability h 2 and the phenotypic variance s2
P. Due to theabove described transformations of the underlying biologi-cal traits, Pmat, Lmat, B* and MEm0 are assumeduncorrelated.
The simulated population for which model predictionsare generated consists thus of n £ n0 full-sibs, withbetween animal variation in the four underlying biologicaltraits. The variation in the underlying biological traits leadsto variation in (and covariation between) the phenotypicmodel output traits for feed intake, growth rate and bodycomposition, for which means, genetic and phenotypic var-iances and covariances were calculated via sib analysis(e.g. Cameron (1997) chapter 5) based on the decompo-sition in equation (4).
Estimating genetic parameters of biological traits
491

The dataRecords describing feed consumption, growth rate andbody composition average were obtained in terms of dailyfeed intake (DFI) between weaning and 110 kg bodyweight, pig age (DAYS) and backfat depth (BF) at 110 kgbody weight for 13 268 pigs with four-generation pedigreeinformation of two PIC pig lines. From these records esti-mates of line specific trait means and heritabilities forthese traits as well as genetic and phenotypic correlationsbetween the three traits were derived (Table 1, ‘Data’values). Line A is a dam line selected mainly for goodreproductive performance, high robustness, and fastgrowth; Line B is a sire line selected mainly for high feedefficiency and leanness. Line differences in these character-istics are reflected by the differences in the phenotypicmeans of the three performance traits and – to a lesserdegree - in the heritabilities and genetic/phenotypic corre-lations of the phenotypic traits (Table 1). Animals werekept in normal performance test conditions (indoors, tem-perate climate, partly slatted floors, about 10 animals persingle-sex group, unrestricted feeding) with electronic feedintake recording. Animals were fed a diet containing14.80 MJ digestible energy, 0.207 kg crude protein and0.015 kg lysine per kg feed up to 60 kg body weight. Forhigher body weights, digestible energy, crude protein andlysine were set to 14.90 MJ/kg, 0.192 kg/kg and 0.0127 kg/kg, respectively. The variance components in Table 1 wereestimated (PIC-USA, unpublished) using VCE-v3 (Groene-veld, 1996) on data sets with 16 854 (5322 for DFI) recordsfor line A and 6414 (2070 for DFI) records for line B, witha four-generation pedigree for both lines.
Estimating means and variance components for theunderlying biological traits using model inversionDirect measurements of the underlying biological modeltraits are difficult to obtain in practice. Therefore the gen-etic and phenotypic characteristics of the recorded perform-ance traits DAYS, DFI and BF listed in Table 1 were used toinfer estimates for the components m, h 2 and s2
P of theunderlying biological traits. For the remainder of this paperthe inference of the components of the underlying biologi-cal traits from observed measures of performance traits isdenoted as model inversion process. The model is‘inverted’ in the sense that the conventional model inputtraits (the underlying biological traits) are treated as modeloutputs that need to be determined through the inversionprocess, and the parameters of the conventional modeloutput traits are treated as known inputs. Various methodsexist to carry out the inversion process, ranging from Baye-sian inference methods (Tarantola, 1987) to the analyticaland numerical methods presented by Doeschl-Wilson et al.(2006). Here, the inversion process was carried out by acomputational algorithm which determined the com-ponents m, h 2 and s2
P of the underlying biological traitsthat correspond to performance predictions for DAYS, DFIand BF at 110 kg body weight with statistical propertiesmost similar to those derived from the collected recordsshown in Table 1. In more detail, each iteration in the com-putational algorithm provides parameter estimates for theunderlying biological trait components which the modelthen uses to generate a population of full-sib groups asoutlined above. Consequently, the performance of thesepigs is simulated, producing simultaneous predictions for
Table 1 Genetic correlations (upper triangle of unshaded area), heritabilities (diagonal of white area) and phenotypic correlations (lower triangleof unshaded area), as well as phenotypic means (shaded area) for the two PIC lines, A (Table 1a) and B (Table 1b) as estimated from data anal-ysis (DATA) and predicted from model inversion (MODEL)†
Data/Model Days to 110 kg DFI (kg/day) BF (mm)
(a) Line ADays to 110 kg Data 0.373 (0.044) 20.740 (0.092) 20.047 (0.066)
Model 0.375 (0.002) 20.700 (0.008) 20.047 (0.0002)DFI Data 20.437 (0.011) 0.267 (0.063) 0.410 (0.118)
Model 20.454 (0.003) 0.257 (0.015) 0.411 (0.003)BF Data 20.040 (0.009) 0.233 (0.010) 0.480 (0.040)
Model 20.040 (0.0001) 0.233 (0.0009) 0.482 (0.0035)Phenotypic means Data 155 (0.097) 2.33 (0.004) 10.70 (0.021)
Model 154 (0.75) 2.13 (0.014) 11.56 (0.087)(b) Line BDays to 110 kg Data 0.396 (0.059) 20.735 (0.116) 20.042 (0.095)
Model 0.400 (0.0016) 20.704 (0.008) 20.042 (0.0002)DFI Data 20.438 (0.018) 0.267 (0.070) 0.411 (0.148)
Model 20.452 (0.0027) 0.257 (0.0014) 0.401 (0.0044)BF Data 20.044 (0.010) 0.238 (0.022) 0.550 (0.061)
Model 20.045 (0.0006) 0.242 (0.002) 0.556 (0.008)Phenotypic means Data 174 (0.170) 2.00 (0.007) 11.00 (0.031)
Model 175 (0.845) 1.97 (0.010) 11.23 (0.123)
† The ‘model’ results are the means of 15 independent optimisation runs per PIC line with different random number sequences for producing the pig populationsand different initial values in the optimization algorithm. The standard errors of the estimates are shown in brackets. Note that these cannot be directly comparedwith the corresponding standard errors from the data analysis. DFI ¼ daily feed intake; BF ¼ backfat depth.
Doeschl-Wilson, Knap, Kinghorn and Van der Steen
492
the traits DAYS, DFI and BF at 110 kg body weight for eachsimulated animal. This leads to phenotypic means, herit-abilities and genetic and phenotypic correlations for thesetraits that can be compared with those derived from realrecords. The goodness of fit was evaluated according tothe relative prediction error sum of squares (RPESS),defined as
RPESS ¼X12
j¼1
yj 2 yj
yj
!2
:
Here yj and yj are the values for the jth statistical measureof the performance traits DAYS, DFI or BF predicted by themodel (MODEL in Table 1) and obtained from data analysis(DATA in Table 1), respectively.
In an appropriate linear model, we would have a perfectfit for 12 parameters derived from 12 data points. How-ever, the non-linearity is such that we do not get a perfectfit. The correlated patterns of influence of the input par-ameters is such that we do not have the full 12 degrees offreedom available to explain the 12 data points, and theensuing residuals drive the RPESS criterion.
The computational algorithmThe differential evolution (DE) algorithm (Storn and Price,1997) was used to determine the set of statistical com-ponents of the underlying biological traits that minimisethe RPESS. The DE is an evolutionary genetic algorithmthat has been modified for improved efficiency for complexsearch spaces. Details of the algorithm are given in Stornand Price (1997). Briefly, the DE algorithm adapts the con-cepts of evolutionary theory to search efficiently throughthe multi-dimensional (12D in the present study) parameterspace to find the optimum solution. It is an iterative pro-cess consisting of many generations. In each generation anumber of solutions (12 in the present study) are simul-taneously produced, of which the best (according to tour-nament selection) contribute to the initial estimates of thenext generation. Each solution corresponds to a set of esti-mates for the 12 model parameters. Convergence towardsa final solution was assumed if the RPESS of the best sol-ution of a generation did not change by a relative magni-tude greater than 1026 in 1000 successive generations.
Numerous case studies have demonstrated that the DEalgorithm searches efficiently through large and complexsearch spaces before reaching the perceived global opti-mum, overcoming therefore problems of differentiability,non-smooth response surfaces including sharp cliffs andmultiple local optima, which are typically associated withagricultural models (Mayer et al., 2005). Due to the com-plex structure of the mechanistic model used in this study,the existence of a globally unique optimal parameter setcannot be guaranteed from mathematical theories. How-ever, insight into the topography of the search space couldbe obtained by monitoring the RPESS of the fittest candi-date per generation over successive generations and byrepeating the optimisation process several times for the
same animal population, with different initial DE candi-dates in the first generation of the optimisation algorithm.By tracking the RPESS value it could be determinedwhether different sets of parameters for the underlyingbiological traits correspond to similar RPESS values for thepredicted performance traits, and how sensitive the RPESSis to changes in these parameter values. The random pro-cesses embedded in the DE imply that different searchroutes are used in different repetitions of the optimisationprocess applied to the same simulated animal population.If the different optimisation processes associated withdifferent initial candidates converge to the same optimum,the optimum is considered satisfactory.
Stochasticity and population sizeThe stochastic nature of the mechanistic model impliesthat its predictions are influenced by the specific randomsampling used to generate the simulated animal popu-lations. Two simulations with identical values for all inputparameters will thus produce different predictions andpossibly different covariance estimates for the performancetraits. Likewise, the optimisation process applied to differ-ent simulated populations with the same means andcovariance estimates in the performance traits may pro-duce different estimates of the statistical measures for theunderlying biological traits. The influence of individual ran-dom drawings can be reduced by increasing the number ofreplicates in the simulated population, but this alsoincreases the run time of the model and the statistical cal-culations. In the inversion process the model is calledmany thousands of times and numerous statistical calcu-lations must be carried out for every run, mounting up to aconsiderable computing time for producing the estimatesof the specific model parameters. Our simulated popu-lations consisted of 7000 individuals comprising 700 full-sib families with 10 sibs per family (the average number inthe populations whose performance trait records wereused). For this population structure, the coefficient of vari-ation for the predicted means, variances and heritabilitiesof the predicted performance traits DAYS, DFI and BF wasless than 10%, with an average run time on a standard PCof 7 days per optimisation process, which was consideredas a good balance between model run time and variabilityin the results. For each PIC sire line, the optimisation wasrepeated 15 times, corresponding to 15 different popu-lations with the same genetic specifications.
Results and discussion
Performance of the optimisation algorithmIn all optimisation runs, convergence was obtained within10 000 generations in the DE algorithm. For every simu-lated animal population the optimisation process wasrepeated three times with different initial values for theparameters in question. For each animal population, thedifferent processes consistently converged to the same
Estimating genetic parameters of biological traits
493
solution, implying that the algorithm successfully found theglobal optimum instead of getting stuck at a local RPESSminimum. Tracking the best solution of every generation inthe DE algorithm together with its corresponding RPESSprovided the necessary evidence that the algorithmsearched widely through the parameter space and that theoptimum corresponding to each animal population wasunique, i.e. that there is no other parameter set outside agiven neighbourhood of the optimal set with a RPESS suffi-ciently similar to the RPESS corresponding to the optimum.More accurately, for every parameter set in the algorithm’ssearch trajectory, for which at least one of the parametersdeviated from the optimum by more than 10%, the corre-sponding RPESS was more than 30% higher than that cor-responding to the optimum. It could be easily verified thatan RPESS greater than 130% RPESS of the optimumimplies a deviation of more than 5% in at least one of thestatistical components of the predicted performance traitsfrom that corresponding to the optimum. Thus, any combi-nation of the underlying biological trait parameters forwhich one parameter deviates more than 10% from thederived optimum value implies a deviation of more than5% in at least one of the statistical components of the per-formance traits.
Sensitivity analysis was carried out to determine theeffects of changes in the parameters of the underlying bio-logical traits on the predictions for the genetic and pheno-typic parameters of the performance traits DAYS, DFI andBF. In this analysis one parameter was gradually altered ata time, while the others were kept fixed to their optimum(Table 1). As expected, gradual changes in the underlyingbiological trait parameters led to gradual changes in thephenotypic performance trait parameters, resulting inRPESS values greater than those referring to the optimum.The means of the traits DAYS, DFI and BF were primarilyaffected by changes in the means of the underlying bio-logical traits. The biggest effect was achieved by alteringaverage B*- a 5% variation in average B* resulted in a5% variation in the average growth rate (DAYS). Modifyingone biological trait parameter by up to 5% affected inmost cases simultaneously heritabilities, genetic and phe-notypic correlations at the order of magnitude of 1023.In all cases, the absolute difference was found less than0.03. Genetic and phenotypic correlations between the
traits DAYS and BF were found most sensitive to changesin the biological trait parameters. Overall, the model pre-dictions were found robust to gradual changes in theunderlying biological trait parameters.
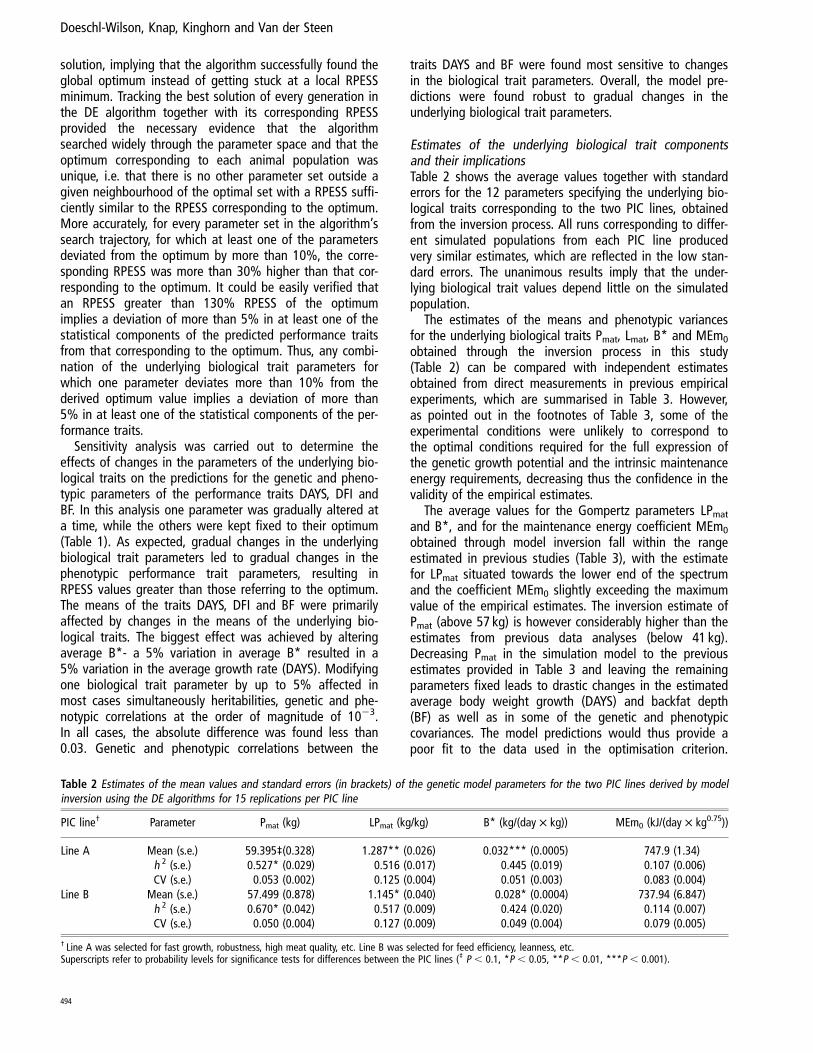
Estimates of the underlying biological trait componentsand their implicationsTable 2 shows the average values together with standarderrors for the 12 parameters specifying the underlying bio-logical traits corresponding to the two PIC lines, obtainedfrom the inversion process. All runs corresponding to differ-ent simulated populations from each PIC line producedvery similar estimates, which are reflected in the low stan-dard errors. The unanimous results imply that the under-lying biological trait values depend little on the simulatedpopulation.
The estimates of the means and phenotypic variancesfor the underlying biological traits Pmat, Lmat, B* and MEm0
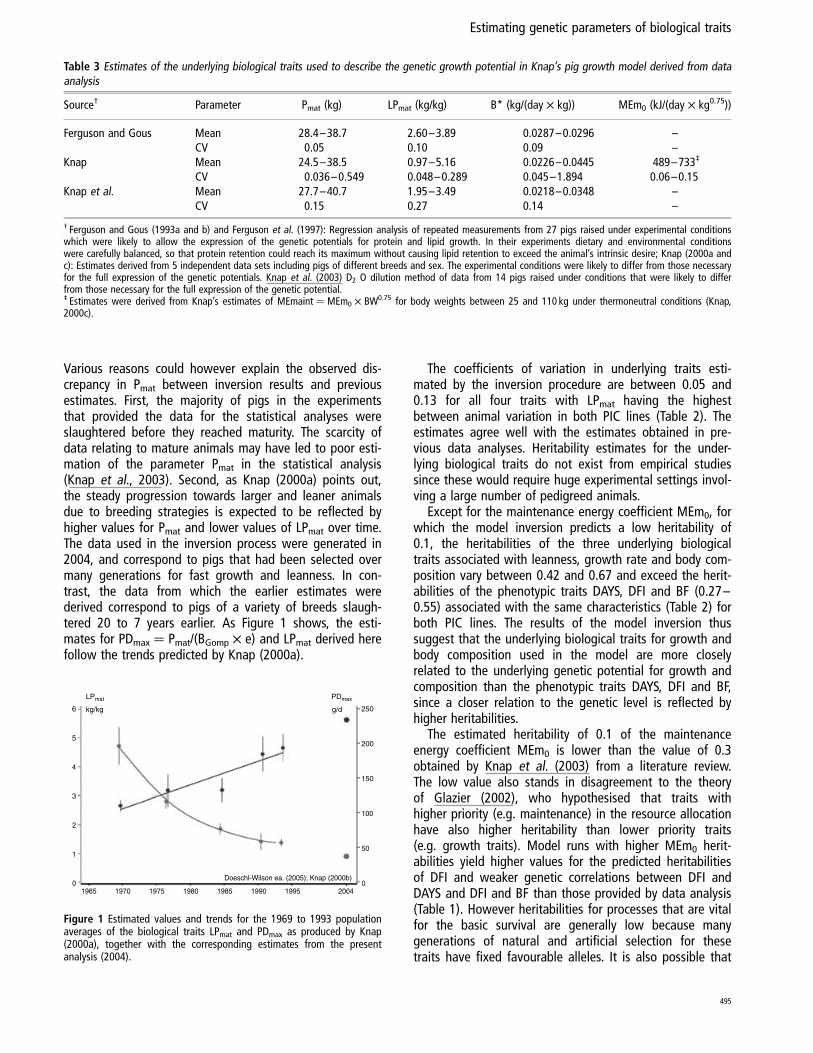
obtained through the inversion process in this study(Table 2) can be compared with independent estimatesobtained from direct measurements in previous empiricalexperiments, which are summarised in Table 3. However,as pointed out in the footnotes of Table 3, some of theexperimental conditions were unlikely to correspond tothe optimal conditions required for the full expression ofthe genetic growth potential and the intrinsic maintenanceenergy requirements, decreasing thus the confidence in thevalidity of the empirical estimates.
The average values for the Gompertz parameters LPmat
and B*, and for the maintenance energy coefficient MEm0
obtained through model inversion fall within the rangeestimated in previous studies (Table 3), with the estimatefor LPmat situated towards the lower end of the spectrumand the coefficient MEm0 slightly exceeding the maximumvalue of the empirical estimates. The inversion estimate ofPmat (above 57 kg) is however considerably higher than theestimates from previous data analyses (below 41 kg).Decreasing Pmat in the simulation model to the previousestimates provided in Table 3 and leaving the remainingparameters fixed leads to drastic changes in the estimatedaverage body weight growth (DAYS) and backfat depth(BF) as well as in some of the genetic and phenotypiccovariances. The model predictions would thus provide apoor fit to the data used in the optimisation criterion.
Table 2 Estimates of the mean values and standard errors (in brackets) of the genetic model parameters for the two PIC lines derived by modelinversion using the DE algorithms for 15 replications per PIC line
PIC line† Parameter Pmat (kg) LPmat (kg/kg) B* (kg/(day £ kg)) MEm0 (kJ/(day £ kg0.75))
Line A Mean (s.e.) 59.395‡(0.328) 1.287** (0.026) 0.032*** (0.0005) 747.9 (1.34)h 2 (s.e.) 0.527* (0.029) 0.516 (0.017) 0.445 (0.019) 0.107 (0.006)CV (s.e.) 0.053 (0.002) 0.125 (0.004) 0.051 (0.003) 0.083 (0.004)
Line B Mean (s.e.) 57.499 (0.878) 1.145* (0.040) 0.028* (0.0004) 737.94 (6.847)h 2 (s.e.) 0.670* (0.042) 0.517 (0.009) 0.424 (0.020) 0.114 (0.007)CV (s.e.) 0.050 (0.004) 0.127 (0.009) 0.049 (0.004) 0.079 (0.005)
† Line A was selected for fast growth, robustness, high meat quality, etc. Line B was selected for feed efficiency, leanness, etc.Superscripts refer to probability levels for significance tests for differences between the PIC lines (‡ P , 0.1, *P , 0.05, **P , 0.01, ***P , 0.001).
Doeschl-Wilson, Knap, Kinghorn and Van der Steen
494
Various reasons could however explain the observed dis-crepancy in Pmat between inversion results and previousestimates. First, the majority of pigs in the experimentsthat provided the data for the statistical analyses wereslaughtered before they reached maturity. The scarcity ofdata relating to mature animals may have led to poor esti-mation of the parameter Pmat in the statistical analysis(Knap et al., 2003). Second, as Knap (2000a) points out,the steady progression towards larger and leaner animalsdue to breeding strategies is expected to be reflected byhigher values for Pmat and lower values of LPmat over time.The data used in the inversion process were generated in2004, and correspond to pigs that had been selected overmany generations for fast growth and leanness. In con-trast, the data from which the earlier estimates werederived correspond to pigs of a variety of breeds slaugh-tered 20 to 7 years earlier. As Figure 1 shows, the esti-mates for PDmax ¼ Pmat/(BGomp £ e) and LPmat derived herefollow the trends predicted by Knap (2000a).
The coefficients of variation in underlying traits esti-mated by the inversion procedure are between 0.05 and0.13 for all four traits with LPmat having the highestbetween animal variation in both PIC lines (Table 2). Theestimates agree well with the estimates obtained in pre-vious data analyses. Heritability estimates for the under-lying biological traits do not exist from empirical studiessince these would require huge experimental settings invol-ving a large number of pedigreed animals.
Except for the maintenance energy coefficient MEm0, forwhich the model inversion predicts a low heritability of0.1, the heritabilities of the three underlying biologicaltraits associated with leanness, growth rate and body com-position vary between 0.42 and 0.67 and exceed the herit-abilities of the phenotypic traits DAYS, DFI and BF (0.27–0.55) associated with the same characteristics (Table 2) forboth PIC lines. The results of the model inversion thussuggest that the underlying biological traits for growth andbody composition used in the model are more closelyrelated to the underlying genetic potential for growth andcomposition than the phenotypic traits DAYS, DFI and BF,since a closer relation to the genetic level is reflected byhigher heritabilities.
The estimated heritability of 0.1 of the maintenanceenergy coefficient MEm0 is lower than the value of 0.3obtained by Knap et al. (2003) from a literature review.The low value also stands in disagreement to the theoryof Glazier (2002), who hypothesised that traits withhigher priority (e.g. maintenance) in the resource allocationhave also higher heritability than lower priority traits(e.g. growth traits). Model runs with higher MEm0 herit-abilities yield higher values for the predicted heritabilitiesof DFI and weaker genetic correlations between DFI andDAYS and DFI and BF than those provided by data analysis(Table 1). However heritabilities for processes that are vitalfor the basic survival are generally low because manygenerations of natural and artificial selection for thesetraits have fixed favourable alleles. It is also possible that
6
5
4
3
2
1
0
250
200
150
100
50
01965 1970 1975 1980 1985 1990 1995 2004
Doeschl-Wilson ea. (2005); Knap (2000b)
PDmaxLPmat
kg/kg g/d
Figure 1 Estimated values and trends for the 1969 to 1993 populationaverages of the biological traits LPmat and PDmax as produced by Knap(2000a), together with the corresponding estimates from the presentanalysis (2004).
Table 3 Estimates of the underlying biological traits used to describe the genetic growth potential in Knap’s pig growth model derived from dataanalysis
Source† Parameter Pmat (kg) LPmat (kg/kg) B* (kg/(day £ kg)) MEm0 (kJ/(day £ kg0.75))
Ferguson and Gous Mean 28.4–38.7 2.60–3.89 0.0287–0.0296 –CV 0.05 0.10 0.09 –
Knap Mean 24.5–38.5 0.97–5.16 0.0226–0.0445 489–733‡
CV 0.036–0.549 0.048–0.289 0.045–1.894 0.06–0.15Knap et al. Mean 27.7–40.7 1.95–3.49 0.0218–0.0348 –
CV 0.15 0.27 0.14 –
† Ferguson and Gous (1993a and b) and Ferguson et al. (1997): Regression analysis of repeated measurements from 27 pigs raised under experimental conditionswhich were likely to allow the expression of the genetic potentials for protein and lipid growth. In their experiments dietary and environmental conditionswere carefully balanced, so that protein retention could reach its maximum without causing lipid retention to exceed the animal’s intrinsic desire; Knap (2000a andc): Estimates derived from 5 independent data sets including pigs of different breeds and sex. The experimental conditions were likely to differ from those necessaryfor the full expression of the genetic potentials. Knap et al. (2003) D2 O dilution method of data from 14 pigs raised under conditions that were likely to differfrom those necessary for the full expression of the genetic potential.‡ Estimates were derived from Knap’s estimates of MEmaint ¼ MEm0 £ BW0.75 for body weights between 25 and 110 kg under thermoneutral conditions (Knap,2000c).
Estimating genetic parameters of biological traits
495

the estimated low heritabilities are partly an artifact of thecrude definition of maintenance processes in the model.The term maintenance in the model comprises all physio-logical and metabolic processes that are not involved inprotein or lipid retention, including resting metabolism,hair growth, basic activity, coping with infectious and otherstress, etc. Consequently, part of the genetic variation intrue maintenance could have been captured by the growthand body composition traits.
Differences between the PIC linesThe relatively high heritabilities of the underlying biologicaltraits used to represent the genotype in the growth modelsupport the contention that these traits may be more clo-sely related to the true genetic potential than the perform-ance traits DAYS, DFI and BF. One would then also expectthat the moderate differences in the means and co-var-iances of the performance traits DAYS, DFI and BF betweenPIC lines A and B manifest themselves into differences inthe genotypic model parameter values. The differences inthe estimated genotypic model parameters associated witheach line were assessed using the MANOVA option in theSAS procedure PROC GLM (Statistical Analysis SystemsInstitute, 1999). This was done under the assumption thatthe line-specific parameter estimates from DATA (Table 1)were made without error, such that sampling error relatesonly to repeatability of simulated dataset replicates. Theanalysis revealed a difference (P , 0.05) between the esti-mated parameter sets associated with each line. However,considering each parameter individually, differences withP , 0.05 were only found in the mean of LPmat and B*as well as in the heritability of Pmat (indicated by ** inTable 3). In addition, the average value for Pmat was founddifferent between both lines at P ¼ 0.057. The significantlyhigher values for B* and LPmat for PIC line A v. B portraythe faster body weight growth rate and lower backfatdepth, which characterise PIC line A on a phenotypiclevel (Table 2). The optimisation results suggest thatwithin-animal variations and heritabilities (with exceptionof Pmat) in the underlying biological traits are similar forboth PIC lines.
Model fit and validationAs Table 1 shows, the model predictions for the multiplephenotypic and genetic components of the performancetraits DAYS, DFI and BF including their phenotypic and gen-etic correlations closely match those derived from realmeasurements. Except for an 8% discrepancy between thepredicted and estimated average backfat depth, the predic-tions generally differ from the data estimates by less than5%. The low standard errors in the estimates of the geno-typic model parameters corresponding to the samplingerror derived from different simulated populations (Table 2)are accompanied by low standard errors in the predictionsfor the statistical measures (Table 1).
The close match between predictions and data estimatesin all 12 measures for two different breeds suggests thatthe growth model is capable of simultaneously accuratelypredicting several traits up to the level of their co-vari-ation, provided that the genotype and environment areappropriately specified.
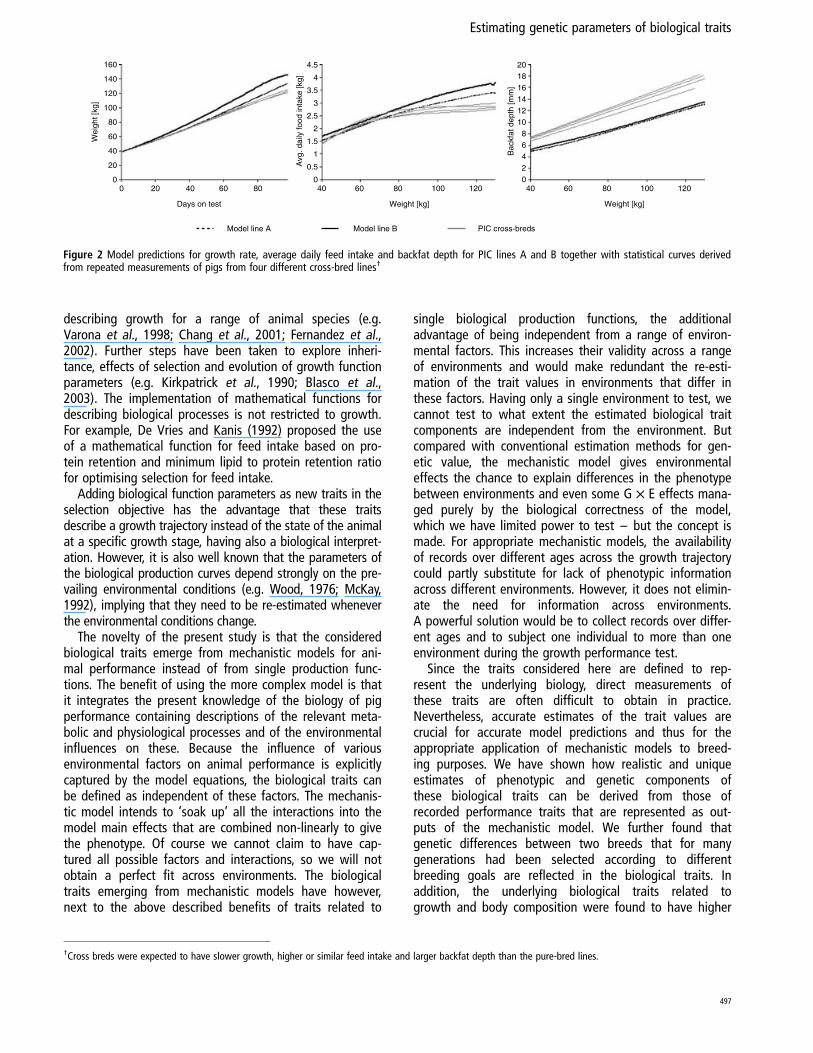
However, proper verification that the obtained estimatesfor the underlying biological trait components are genuinefor the corresponding PIC lines requires independentrecords of these lines derived from different environmentalsettings or covering different growth stages (the perform-ance trait components listed in Table 1 refer exclusively todata measured at 110 kg body weight). Unfortunately suchdata do not exist for the PIC lines considered in this study.Therefore validation of the results of the inversion processwas restricted to comparing predicted growth trajectoriesof various performance traits for the simulated PIC lines Aand B with those derived from repeated measurements ofvarious PIC cross-breeds for different environmental con-ditions. It was found that the predicted curves for PIC linesA and B generally matched the cross-breed curves reason-ably well, considering the differences in the genetic specifi-cations between the optimised lines and the cross-breeds.For example, as Figure 2 shows, compared with the cross-breeds, the selection lines A and B achieve 110 kg bodyweight faster, which is accompanied by higher feedconsumption during the faster growth period, and areconsiderably leaner at given body weights. The change inbackfat depth with increasing body weight, for which nosignificant difference was found between the differentcross-breeds, was also found not significantly differentfrom that of the PIC lines A and B (P ¼ 0.7). In particular,PIC line A, which was selected amongst other criteria forfast growth, has the highest growth rate according to thesimulations, whereas PIC line B that was selected amongstothers for higher feed efficiency and leanness, has lowerfeed intake and lower backfat depth for a given bodyweight than line A (Figure 2).
Implications for animal breedingIn this study attention has been called to a new set oftraits emerging from mechanistic animal growth modelsthat are defined as intrinsic drivers of phenotype. Thevalue of traits related to biological models for animalbreeding has long been recognised. Fowler et al. (1976)investigated the potential of biological models for con-structing selection objectives that can be applied to a var-iety of situations and concluded that these models wouldexceed classical index construction methods in their abilityto provide greater flexibility in a rapidly changing industry.Varona et al.’s (1997) seminal paper describes the method-ology for estimating genetic and phenotypic relationshipsbetween parameters of biological growth functions, whichis essential for the integration of these biological traits intobreeding programmes. It has been followed by numerousstudies of genetic and phenotypic variations and co-variations of traits emerging from a variety of functions
Doeschl-Wilson, Knap, Kinghorn and Van der Steen
496
describing growth for a range of animal species (e.g.Varona et al., 1998; Chang et al., 2001; Fernandez et al.,2002). Further steps have been taken to explore inheri-tance, effects of selection and evolution of growth functionparameters (e.g. Kirkpatrick et al., 1990; Blasco et al.,2003). The implementation of mathematical functions fordescribing biological processes is not restricted to growth.For example, De Vries and Kanis (1992) proposed the useof a mathematical function for feed intake based on pro-tein retention and minimum lipid to protein retention ratiofor optimising selection for feed intake.
Adding biological function parameters as new traits in theselection objective has the advantage that these traitsdescribe a growth trajectory instead of the state of the animalat a specific growth stage, having also a biological interpret-ation. However, it is also well known that the parameters ofthe biological production curves depend strongly on the pre-vailing environmental conditions (e.g. Wood, 1976; McKay,1992), implying that they need to be re-estimated wheneverthe environmental conditions change.
The novelty of the present study is that the consideredbiological traits emerge from mechanistic models for ani-mal performance instead of from single production func-tions. The benefit of using the more complex model is thatit integrates the present knowledge of the biology of pigperformance containing descriptions of the relevant meta-bolic and physiological processes and of the environmentalinfluences on these. Because the influence of variousenvironmental factors on animal performance is explicitlycaptured by the model equations, the biological traits canbe defined as independent of these factors. The mechanis-tic model intends to ‘soak up’ all the interactions into themodel main effects that are combined non-linearly to givethe phenotype. Of course we cannot claim to have cap-tured all possible factors and interactions, so we will notobtain a perfect fit across environments. The biologicaltraits emerging from mechanistic models have however,next to the above described benefits of traits related to
single biological production functions, the additionaladvantage of being independent from a range of environ-mental factors. This increases their validity across a rangeof environments and would make redundant the re-esti-mation of the trait values in environments that differ inthese factors. Having only a single environment to test, wecannot test to what extent the estimated biological traitcomponents are independent from the environment. Butcompared with conventional estimation methods for gen-etic value, the mechanistic model gives environmentaleffects the chance to explain differences in the phenotypebetween environments and even some G £ E effects mana-ged purely by the biological correctness of the model,which we have limited power to test – but the concept ismade. For appropriate mechanistic models, the availabilityof records over different ages across the growth trajectorycould partly substitute for lack of phenotypic informationacross different environments. However, it does not elimin-ate the need for information across environments.A powerful solution would be to collect records over differ-ent ages and to subject one individual to more than oneenvironment during the growth performance test.
Since the traits considered here are defined to rep-resent the underlying biology, direct measurements ofthese traits are often difficult to obtain in practice.Nevertheless, accurate estimates of the trait values arecrucial for accurate model predictions and thus for theappropriate application of mechanistic models to breed-ing purposes. We have shown how realistic and uniqueestimates of phenotypic and genetic components ofthese biological traits can be derived from those ofrecorded performance traits that are represented as out-puts of the mechanistic model. We further found thatgenetic differences between two breeds that for manygenerations had been selected according to differentbreeding goals are reflected in the biological traits. Inaddition, the underlying biological traits related togrowth and body composition were found to have higher
Wei
ght [
kg]
Days on test
Model line A Model line B PIC cross-breds
160
140
120
100
80
60
40
20
00 20 40 60 80 40
0
1
1.5
2
2.5
3
3.5
4
4.5
0.5
0
468
101214161820
2
60 80 100 120 40 60 80 100 120
Avg
. dai
ly fo
od in
take
[kg]
Bac
kfat
dep
th [m
m]
Weight [kg] Weight [kg]
Figure 2 Model predictions for growth rate, average daily feed intake and backfat depth for PIC lines A and B together with statistical curves derivedfrom repeated measurements of pigs from four different cross-bred lines†
†Cross breds were expected to have slower growth, higher or similar feed intake and larger backfat depth than the pure-bred lines.
Estimating genetic parameters of biological traits
497
heritabilities than performance traits corresponding togrowth and body composition. These properties combinedprovide some scientific evidence for the theoretical infer-ence of a close association of these traits to the geneticmakeup of the animals and may encourage further con-sideration of these traits for genetic improvement.
In this study, simulated populations with a simplebalanced pedigree structure (full-sibs) have been used toderive the estimates for the underlying biological trait com-ponents, since the more complex pedigree structures ofreal animal populations would complicate the estimationof genetic and phenotypic variance and covariance com-ponents without increasing the accuracy (and meaningful-ness) of the estimates. The approach presented here wasnot designed to and cannot produce estimates of thesetraits for individual animals of real pig populations. If thebiological traits however were to be integrated into geneticevaluation programs in the future, estimates of their valuesfor specific animal populations could be derived by adapt-ing the methods of Varona et al. (1997) to the correspond-ing mechanistic growth model. Also, in the decompositionof the phenotype (equation (4)) several other possible var-iance components, including those given by randomenvironmental effects, have been ignored. Inclusion ofadditional variance (and co-variance) components wouldbe theoretically possible, but would increase the number ofparameters to be estimated and therefore require mostlikely additional information to obtain robust solutions inthe inversion process.
By integrating mechanistic models into the genetic evalu-ation methodology, several shortcomings of the currentmethods for predicting genetic merit may be overcome.First, regression models, which lie at the heart of currentbreeding value estimation, are designed to fit a specificdata set rather than to represent the underlying biologicalprocesses. This approach usually results in useful statistics(estimated breeding values, EBVs) appropriate for the pre-vailing conditions. However, it provides a narrow scope ofuse; in particular, empirical models assume simple linearrelationships between (combinations of) individual modelcomponents, which are renowned to cause problems whenextrapolating to conditions not covered in the data. In orderto avoid unexpected poor performance in environments thatdiffer from the data conditions, new data need to be pro-duced and the covariances required for the EBVs need to bere-estimated whenever the production conditions change.This is not always feasible at the commercial level.
Second, genetic markers and quantitative trait loci (QTL)have proved valid contributions to the description of theanimal’s true genetic merit, since they refer directly to theanimal’s intrinsic capacities in the prevailing environment.However, in order to be useful for breeding purposes, theirassociation with the phenotypic performance traits of inter-est needs to be established in each environment and gen-etic background. In addition to the risk that thisassociation is not sufficiently strong to translate into a sig-nificant genetic gain, current methods for determining the
genotype-phenotype association generally lack the abilityto quantify how gene expression varies across differentenvironments and during different growth stages (Ma et al.,2002). Encapsulating both, validity across a range ofenvironments and describing the processes along part of orthe entire growth trajectory, the biological traits ofmechanistic growth models may add value to markerdevelopment.
It can be speculated that the underlying crux of theseshortcomings of the current methods for estimating geneticmerit is their lack of integrating knowledge of the bio-chemical, metabolic and physiological mechanisms thatdetermine how the genetic merit may be expressed in theprevailing conditions. In contrast, mechanistic animalgrowth models aim to describe the metabolic and physio-logical pathways that link the genotype with predictionsfor phenotypic performance traits. As a consequence of theexplicit description of the interactions between geneticpotential and physiological and environmental constraintsin the growth models, the mechanistic models are expectedto be more able to provide for proper extrapolation outsidethe data range.
Conclusions
This paper suggests a novel use of mechanistic growthmodels for estimating genetic components of biologicaltraits that could be advantageous for animal breeding. Thebiological traits specified as input parameters of mechanis-tic growth models are considered as intrinsic drivers of theobserved phenotype. They are considered less dependenton the environment, as environmental factors are alsofitted in these models.
It is therefore suggested that implementation of thesetraits into breeding programs would reduce the deleteriousimpact of G £ E, and give more robust genetic gains acrossenvironments. For example, genetic gain made underfavourable nucleus environments would give better corre-lated responses under less favourable commercial con-ditions that involve poorer nutrition, greater temperaturestress, etc.
Implementation of biological traits into breeding pro-grams requires the prediction of these traits for selectioncandidates, and this depends on having appropriateobserved traits and the prevailing environmental conditionsrecorded. Further implications would follow for QTL map-ping and/or marker association studies on the new set oftraits. Such associations may well be stronger than for themore easily measured but less heritable observed traits –conditions that are conducive to more efficient marker-assisted selection programmes.
Acknowledgements
The work has been carried out as a quantitative scienceproject in Sygen (now Genus).
Doeschl-Wilson, Knap, Kinghorn and Van der Steen
498
References
Black JL, Davies GT, Bray HJ, Giles LR and Chapple RP 1995. Modelling theeffects of the genotype, environment and health on nutrient utilization.In Modelling nutrient utilization in farm animals (ed. A Danfaer and P Les-coat), pp. 85-106. Danish Institute of Animal Science, Foulum.
Blasco A, Piles M and Varona L 2003. A Bayesian analysis of the effect ofselection for growth rate on growth curves in rabbits. Genetics SelectionEvolution 35, 21-41.
Cameron ND 1997. Selection Indices and prediction of genetic merit in animalbreeding. CAB International, Oxon, UK.
Chang Y-M, Rekaya R, Gianola D and Thomas DL 2001. Genetic variationof lactation curves in dairy sheep: a Bayesian analysis of Wood’s function.Livestock Production Science 71, 241-251.
De Vries AG and Kanis E 1992. A growth model to estimate economic valuefor food intake capacity in pig. Animal Production 55, 241-246.
Doeschl-Wilson AB, Knap PW and Kinghorn BP 2006. Specifying animal geno-types through model inversion. In Mechanistic pig and poultry models (ed.RM Gous and T Morris), pp. 163-187. CAB International, Oxon, UK.
Emmans GC 1988. Genetic components of potential and actual growth. InAnimal breeding opportunities (ed. RB Land and G Bulfield and WG Hill), Brit-ish Society of Animal Production, occasional publication no. 12, pp. 153-181.BSAS, Edinburgh.
Emmans GC and Kyriazakis I 1995. A general method for predicting theweight of water in the empty body of the pig. Animal Science 61, 103-108.
Emmans GC and Fisher C 1996. Problems in nutritional theory. In NutrientRequirements of poultry and nutritional research (ed. C Fisher and KNBoorman). pp. 9-39, Butterworths, London.
Emmans GC and Kyriazakis I 1997. Models of pig growth: problems and pro-posed solutions. Livestock Production Science 51, 119-129.
Fernandez A, Rodrguez MC, Rodriganez J, Silio L and Toro MA 2002. Use ofBayesian analysis of growth functions to estimate crossbreeding parametersin Iberian pigs. Livestock Production Science 73(2), 213-223.
Ferguson NS and Gous RM 1993a. Evaluation of pig genotypes. 1. Theoreticalaspects of measuring genetic parameters. Animal Production 56, 233-243.
Ferguson NS and Gous RM 1993b. Evaluation of pig genotypes. 2. Testingexperimental procedure. Animal Production 56, 245-249.
Ferguson NS, Gous RM and Emmans GC 1997. Predicting the effects of ani-mal variation on growth and food intake in growing pigs using simulationmodelling. Animal Science 64, 513-522.
Fowler VR, Bichard M and Pease A 1976. Objectives in pig breeding. AnimalProduction 23, 365-387.
Glazier DS 2002. Resource-allocation rules and the heritability of traits. Evol-ution 56(8), 1696-1700.
Groeneveld E 1996. REML VCE V3.2 user’s guide. Institute of Animal Husban-dry and. Animal Ethology, Neustadt-Mariensee, Germany.
Kirkpatrick M, Lofsvold D and Bulmer M 1990. Analysis of the Inheritance,Selection and Evolution of Growth Trajectories. Genetics 124, 979-993.
Knap PW 1999. Simulation of growth in pigs: evaluation of a model to relatethermoregulation to body protein and lipid content and deposition. AnimalScience 68, 655-679.
Knap PW 2000a. Time trends of Gompertz growth parameters in “meat type”pigs. Animal Science 70, 39-49.
Knap PW 2000b. Stochastic simulation of growth in pigs: relations betweenbody composition and maintenance requirements as mediated through proteinturnover and thermoregulation. Animal Science 71, 11-30.
Knap PW 2000c. Variation in maintenance requirements of growing pigs inrelation to body composition. A simulation study. PhD thesis, WageningenUniversity, The Netherlands.
Knap PW, Roehe R, Kolstad K, Pomar C and Luiting P 2003. Characterizationof pig genotypes for growth modelling. Journal of Animal Science 81,(E-suppl. 2) E187-E195, www.asas.org/symposia/03esupp2/jas2593.pdf.
Knap PW and Schrama JW 1996. Simulation of growth in pigs: approximationof protein turnover parameters. Animal Science 63, 533-547.
Ma Chang-Xing G, Casella G and Wu R 2002. Functional mapping of quanti-tative trait loci underlying the character process: a theoretical framework.Genetics 161, 1751-1762.
McKay RM 1992. Preweaning growth for Yorkshire, Hampshire and LandracePigs. Journal of Animal Science 72, 56-61.
Mayer DG, Kinghorn BP and Archer AA 2005. Differential evolution -an easyand efficient evolutionary algorithm for model optimization. AgriculturalSystems 83, 315-328.
Moughan PJ and Verstegen MWA 1988. The modelling of growth in the pigs.Netherlands Journal of Agricultural Research 36, 145-166.
Statistical Analysis Systems Institute 1999. SAS/STAT user’s guide, version 8.SAS Institute Inc., Cary, NC.
Storn R and Price K 1997. Differential evolution: A simple and efficient heuris-tic for global optimization over continuous spaces. Journal of Global Optimiz-ation 11, 341-359.
Tarantola A 1987. Inverse problem theory: methods for data fitting and modelparameter estimation. Elsevier Science Publishing Company Inc., New York.
Taylor St. CS 1985. Use of genetics size-scaling in evaluation of animalgrowth. J. Anim. Sci. 61, (Suppl. 2) 118-143.
Varona L, Moreno C, Cortes L and Altarriba J 1997. Multiple trait geneticanalysis of underlying biological variables of production functions. LivestockProduction Science 47, 201-209.
Varona L, Moreno C, Cortes L and Altarriba J 1998. Bayesian analysis ofWood’s lactation curve for Spanish dairy cows. Journal of Dairy Science 81,1469-1478.
Whittemore CT and Fawcett RH 1976. Theoretical aspects of a flexiblemodel to simulate protein and lipid growth in pigs. Animal Production22, 87-96.
Whittemore CT 1983. Development of recommended energy and proteinallowances for growing pigs. Agricultural Systems 11, 159-186.
Wood PDP 1976. Algebraic model of the lactation curve in cattle. Nature(London) 216, 164-165.
Estimating genetic parameters of biological traits
499