User's Guide to the Decentralization Mapping Tool (DMT ...
103
-
Upload
khangminh22 -
Category
Documents
-
view
0 -
download
0
Transcript of User's Guide to the Decentralization Mapping Tool (DMT ...


User’s Guide to the Decentralization Mapping Tool (DMT) Version 1.0
by Riitta-Liisa Kolehmainen-Aitken, MD, DrPH
Elizabeth Lewis, MBA

ii
© 2004 by Management Sciences for Health All rights reserved. Developed under the Latin America and Caribbean Regional Health Sector Reform Initiative (LACHSR), with funding provided by the US Agency for International Development (USAID) through the Management & Leadership (M&L) Program, Cooperative Agreement No. HRN-A-00-00-00014-00. The opinions expressed herein are those of the authors and do not necessarily reflect the views of the US Agency for International Development.

iii
Contents Acknowledgments.......................................................................................................................... iv Preface............................................................................................................................................ vi
How to use this guide................................................................................................................. vi Contents of the CD-ROM .......................................................................................................... vi
I. Introduction to the DMT..................................................................................................... 1 A. What is the DMT?............................................................................................................... 1 B. How health systems and organizations can benefit from the DMT.................................... 1 C. Orientation to the DMT instrument .................................................................................... 1 D. Components of the DMT instrument .................................................................................. 2 E. Requirements for using the DMT instrument ..................................................................... 4 F. Orientation to the DMT process ......................................................................................... 4
1. Phases of the process ...................................................................................................... 4 2. Roles of DMT sponsors, facilitators, and participants.................................................... 5
II. Part I: Getting ready............................................................................................................ 8 A. Step 1: Matching the DMT process to the local setting...................................................... 8
1. Clarifying the purpose of the DMT application.............................................................. 8 2. Defining required analyses ............................................................................................. 8 3. Identifying criteria for selecting discussion sites and participants ................................. 9
B. Step 2: Collecting relevant local documentation ................................................................ 9 C. Step 3: Adapting the DMT instrument to the local setting ............................................... 10
1. Adjusting the management levels ................................................................................. 11 2. Adjusting the functions and determining questions...................................................... 14
D. Step 4: Organizing the logistics ........................................................................................ 20 III. Part II: Collecting, analyzing, and presenting the data ..................................................... 23
A. Step 5: Using the DMT instrument to collect the data...................................................... 23 1. If you have a laptop....................................................................................................... 23 2. If you don’t have a laptop ............................................................................................. 26
B. Step 6: Analyzing and interpreting the data...................................................................... 27 1. The mechanics: Entering the data in the summary forms............................................. 27 2. The “thinking” part: Setting criteria for levels of agreement and determining
whether a function is centralized or decentralized........................................................ 30 C. Step 7: Presenting the findings ......................................................................................... 33
IV. Part III: Using the DMT findings to guide management decisions .................................. 36 A. Step 8: Taking action ........................................................................................................ 36
V. Appendices........................................................................................................................ 38 Appendix A: Samples ............................................................................................................... 39
1. Sample DMT worksheet (blank template).................................................................... 40 2. Sample DMT worksheet (filled) ................................................................................... 52 3. Sample DMT analysis (partial) ..................................................................................... 60 4. Sample DMT presentation of findings.......................................................................... 64
Appendix B: Making adaptations to the DMT ......................................................................... 79 Appendix C: Instructions for automating the data summary in Excel...................................... 84 Appendix D: Glossary of selected terms .................................................................................. 96
iv
Acknowledgments
The Decentralization Mapping Tool (DMT) is a practical tool for policymakers and managers in decentralized or decentralizing countries that illuminates health managers’ perceptions about their responsibility and authority. It was developed by the Health Reform and Financing Unit of Management Sciences for Health (MSH) and field-tested in the Dominican Republic, Ecuador, Guyana, and Jamaica. A modified version of the DMT was used in Nicaragua to collect data for restructuring the Ministry of Health. The DMT builds on MSH’s prior effort to design a tool to support health decision-makers who are coping with the management challenges of decentralization. Funding for the development of the Decentralization Planning Tool (DPT) by James (Kip) Eckroad, Riitta-Liisa Kolehmainen-Aitken, Judy Seltzer, Steve Solter, and Randy Wilson came from the US Agency for International Development (USAID), via the Family Planning Management Development II (FPMD II) project. Funding limitations prevented a thorough field-testing of the tool. When additional money became available a few years later, these earlier efforts catalyzed a rapid effort to substantially revise and field-test the DPT. Hector Colindres, Peter Cross, Riitta-Liisa Kolehmainen-Aitken, Lourdes de la Peza, and Judy Seltzer were responsible for rethinking and revising the tool. Gerry Rosenthal came up with its new and more appropriate name, the Decentralization Mapping Tool. Elizabeth Lewis designed the Excel formats for the DMT that greatly facilitated data entry and analysis. The field tests were invaluable for refining both the DMT and its application methodology. We are immensely grateful to the many colleagues in our field-test countries for their support. They “opened the doors,” eagerly participated in interviews, and made numerous valuable suggestions for revisions. The list of those to whom we owe our gratitude is long, but we wish to express our special thanks to Marjorie Holding-Cobham in Jamaica, Bheri Ramsaran and Jadunauth Raghunauth in Guyana, Patricio Murgueytio and his REDSALUD team in the Dominican Republic, and Lida Moreno and her team at CONAM and Santiago Medina and his colleagues at the ARD-3D Project in Ecuador. We would also like to thank Thomas Bossert of the Harvard School of Public Health, who provided useful suggestions as the tool was revised. Other MSH colleagues, including Jon Rohde and Scott McKeown, offered valuable input and feedback on specific sections of the tool. Special thanks go to Alexander (Sander) Robinson, who formed an integral part of the facilitator team, coordinating logistics and assisting in myriad ways. The input of the participants in the September 2003 Regional Workshop for Senior Public Sector Policy Makers in Cuernavaca, Mexico, was also very valuable for the revision. Our final thank-you goes to MSH staff and their counterparts in Nicaragua. The opportunity to use the DMT in a novel way to support that country’s health sector reform process opened our eyes for exciting possibilities for its future application. This guide was written by Riitta-Liisa Kolehmainen-Aitken and Elizabeth Lewis. Sander Robinson made an important contribution to the section on the logistics of DMT application. Barbara Timmons was the Publications liaison for the tool and reviewed the manuscript, and Ceallaigh Reddy copyedited and laid out this guide.

v
The support of USAID was fundamental to the development and field-testing of the DMT, and we are most grateful for it. The funding, provided under the Latin America and Caribbean Regional Health Sector Reform Initiative (LACHSR), was channeled through MSH’s Management & Leadership Program. These resources allowed us to finish what was started with USAID’s earlier investment under the FPMD II project, giving policy-makers and managers a practical tool with which to combat decentralization’s most important challenges.
vi
Preface
The Decentralization Mapping Tool (DMT) is a practical management tool for policymakers and managers in decentralized or decentralizing countries. It is designed to help senior-level staff identify those health management functions for which responsibility and management authority are most ambiguous. The underlying premise to the development of the DMT is that managers who do not perceive themselves as having power over particular management actions (even if on paper they possess them) are unlikely to take the responsibility or authority for them. Similarly, managers who do believe that they have been allocated such powers are likely to act, even if those powers are not formally theirs. It is thus important to understand clearly managers’ perceptions of their powers in order to foster appropriate management action and reduce conflict.
HOW TO USE THIS GUIDE
The DMT User’s Guide will take you through the entire process of applying the DMT in your country, beginning with an overview of the tool, how you can benefit from it, the process of applying it, how to collect and analyze the data, and how to make decisions based on the findings. If you are already familiar with the DMT, feel free to skim the Introduction and focus on other relevant section(s). If you used an earlier field-test version of the tool, the Introduction will orient you to how the tool has been modified, based on feedback received during the field tests. This Guide is structured as follows:
• Introduction. This section gives you an overview of the tool, how health systems and organizations can benefit from using the tool, an orientation to the DMT itself, what the tool consists of, requirements for using the tool, and an orientation to the entire process.
• Part I: Getting ready. This section helps you to match the DMT process to your local setting, adapt the DMT as necessary, and plan the data collection.
• Part II: Collecting, analyzing, and presenting the data. This section explains how the DMT is used to collect, analyze, and interpret the data, and how to present your findings.
• Part III: Using the DMT findings to guide management decisions. This section suggests ways to take action, depending upon the results of your analysis.
• Appendices. The Appendices show you samples of a DMT worksheet, analysis, and presentation; how to adapt the DMT if needed; and how to automate the data summary pages.
CONTENTS OF THE CD-ROM
The CD-ROM that accompanies this guide contains several files:
• electronic version of this User’s Guide in PDF – English version (DMT_User_Guide.pdf) – Spanish version (DMT_Guia_Usuario.pdf)
• electronic version of the DMT instrument in Excel (DMT_instrument.xls) • sample PowerPoint presentation with results of a DMT exercise
1
I. Introduction to the DMT
A. WHAT IS THE DMT?
The Decentralization Mapping Tool (DMT) is designed to bring out important information about two important concerns of decentralized management. The first concern is managers’ perceptions about the way responsibility and authority are distributed between management levels. The second is their views about the extent to which responsibility for and authority over the various functions have already been decentralized. The DMT assesses perceptions, not how things are supposed to be managed or whether the current roles and responsibilities are the appropriate ones. Understanding what the perceptions of managers at different levels are and how they differ from each other is essential for improving management in a decentralized or decentralizing health sector or organization. Health managers who do not perceive that they have any responsibility for or authority over management functions will not perform these functions, even if these powers have been decentralized to them. Conversely, managers who perceive that they do have certain powers will seek ways to exercise them, even if the management level above them is not in agreement.
B. HOW HEALTH SYSTEMS AND ORGANIZATIONS CAN BENEFIT FROM THE DMT
Decentralization changes the way health systems and organizations are managed. However, the new roles are rarely spelled out in sufficient detail to allow managers to be clear about their changed responsibilities and powers. Confusion and conflict are a common consequence and jeopardize decentralization’s potential gains. The DMT is a flexible tool and can be used for several different purposes. Those responsible for managing health systems and organizations can apply the DMT to:
• assess whether health managers at different levels currently share the same perceptions of how responsibility and authority are distributed;
• examine managers’ perceptions at different points in time to see whether management roles become clearer and whether the distribution of management responsibility and authority shifts in the desired direction over time;
• compare health managers’ current perceptions of their responsibility and authority with the country’s decentralization design.
By revealing managers’ perceptions about their functions and authority, the DMT allows policy-makers and high-level managers to identify and target the most critical management areas for action. Health systems and organizations benefit from the clearer definition of roles and responsibilities, reduced conflict, and better “fit” with the original decentralization design.
C. ORIENTATION TO THE DMT INSTRUMENT
The design of the DMT instrument is based on a functional analysis of a health system. The management of a health system or an organization requires action in several important functional areas. These include managing the delivery of health services, financial resources, and personnel.

2
Each functional area consists of a set of important management functions. “Defining and supervising clinical standards, protocols and procedures” is an example of such a function in the functional area of health service delivery. The DMT instrument consists of a set of matrices in Excel. All functional areas and functions that are critical for managing a health system or an organization and that are potentially affected by decentralization are listed in these matrices. For each function, the DMT matrices include one or more “determining questions.” The questions probe managers’ perceptions about the management level that has responsibility for or authority over the function. The questions are formulated, as far as possible, as closed questions in order to reduce ambiguity in responses. The DMT results are analyzed in two ways. The first analysis examines the degree of consensus about the management level that has responsibility for or authority over a particular management function. The second analysis looks at agreement among managers regarding whether a particular function is currently centralized or decentralized. Color-coded pie-charts are used to present the results for a full functional area.
D. COMPONENTS OF THE DMT INSTRUMENT
The DMT consists of a set of worksheets in Excel. The Excel file consists of one matrix for each functional area, and a summary matrix to show overall results. The nine functional areas all appear on the data collection worksheet (Data_collect_Recopilación_datos) and are as follows:
• Health Service Delivery • Public Health Surveillance and Response • Financial Resources • Personnel • Drugs, Vaccines, and Supplies • Equipment and Transport • Capital Construction and Maintenance • Health and Management Information • Health Communication
Several other worksheets comprise the DMT instrument:
• a worksheet with brief instructions (Read_first_Leer_primero)
• a worksheet for the user to enter basic data about the analysis: country, organization or institution, and groups interviewed (Assumptions_Suposiciones)
• a summary worksheet for each functional area; the names for each are shown in Table 1
• a worksheet that lists all the functions, questions, and other terms (Terms_Términos) Finally, the Excel file contains an example of a worksheet with formulas that have been created to automate the data analysis process.
3
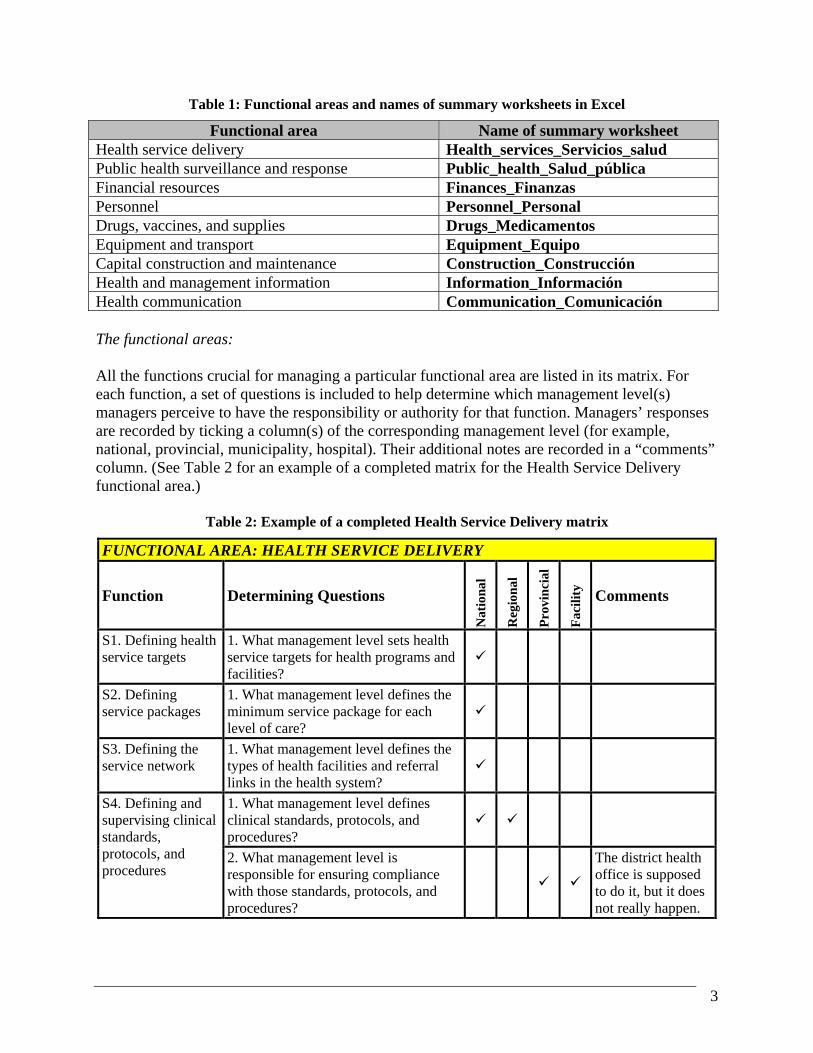
Table 1: Functional areas and names of summary worksheets in Excel
Functional area Name of summary worksheet Health service delivery Health_services_Servicios_salud Public health surveillance and response Public_health_Salud_pública Financial resources Finances_Finanzas Personnel Personnel_Personal Drugs, vaccines, and supplies Drugs_Medicamentos Equipment and transport Equipment_Equipo Capital construction and maintenance Construction_Construcción Health and management information Information_Información Health communication Communication_Comunicación The functional areas: All the functions crucial for managing a particular functional area are listed in its matrix. For each function, a set of questions is included to help determine which management level(s) managers perceive to have the responsibility or authority for that function. Managers’ responses are recorded by ticking a column(s) of the corresponding management level (for example, national, provincial, municipality, hospital). Their additional notes are recorded in a “comments” column. (See Table 2 for an example of a completed matrix for the Health Service Delivery functional area.)
Table 2: Example of a completed Health Service Delivery matrix
FUNCTIONAL AREA: HEALTH SERVICE DELIVERY
Function Determining Questions
Nat
iona
l
Reg
iona
l
Pro
vin
cial
Fac
ilit
y
Comments
S1. Defining health service targets
1. What management level sets health service targets for health programs and facilities?
S2. Defining service packages
1. What management level defines the minimum service package for each level of care?
S3. Defining the service network
1. What management level defines the types of health facilities and referral links in the health system?
1. What management level defines clinical standards, protocols, and procedures?
S4. Defining and
supervising clinical standards, protocols, and procedures
2. What management level is responsible for ensuring compliance with those standards, protocols, and procedures?
The district health office is supposed to do it, but it does not really happen.

4
FUNCTIONAL AREA: HEALTH SERVICE DELIVERY S5. Monitoring health service provision
1. What management level is responsible for ensuring the achievement of health service targets?
1. What management level has the authority to outsource clinical and/or technical services?
2. What management level has the authority to outsource support services (laundry, security, etc.)?
S6. Outsourcing services
3. What management level is responsible for ensuring contractual compliance by those who provide outsourced services?
The system of monitoring compliance does not function well.
E. REQUIREMENTS FOR USING THE DMT INSTRUMENT
The hardware and software requirements for using the DMT are:
• an IBM-compatible computer powerful enough to run Microsoft Excel 2000 and Adobe Acrobat Reader;
• a CD-ROM drive to access the Excel worksheets and the PDF files;
• the Windows-based spreadsheet program Microsoft Excel 2000 (or higher);
• Adobe Acrobat Reader (available free of charge from http://www.adobe.com), if you want to access the electronic version of the User’s Guide on the CD-ROM;
• a compatible printer that can print on A4, letter, or larger-sized paper. The minimum skill requirements for using the DMT are outlined in section F on the roles of facilitators.
F. ORIENTATION TO THE DMT PROCESS
1. Phases of the process
The DMT process consists of three phases:
• getting ready for the DMT field application • collecting, analyzing and presenting the DMT data • using the DMT findings for management decisions.
In the preparatory phase, the goals for undertaking the DMT exercise are clarified and agreed upon. The data collection methodology and the DMT instrument are both adjusted to match these goals and the local setting. The logistical aspects of data collection are planned and organized.

5
Data are collected through guided, multidisciplinary group interviews. The groups are composed of managers in charge of or knowledgeable about one of the nine functional areas of the DMT. All the managers in an interview work at the same management level (for example, the Ministry of Health). The group interviews are held in a location that is most convenient for the managers, usually close to their workplace. External facilitators conduct the guided interviews. Every group is asked the same “determining questions.” The responses of prior interview groups are not shared with later ones to avoid biasing the findings. At the start of the guided interview, participants are given blank copies of the DMT data collection matrix so that they can follow the line of questioning. The DMT process requires a minimum of two facilitators. While one runs the group interview, the other records the answers. If group members give different answers to a question, the facilitators wait until a consensus is reached, then record the answer. Any relevant clarifying comments are also noted in the DMT matrix. The DMT questions can generate a lively exchange among group members. The duration of the group interview depends on the ease or difficulty that the group experiences in reaching consensus answers. In most settings, one to two hours is sufficient for one interview. Unless travel time between locations is long, it is feasible to schedule one interview in the morning and another in the afternoon. After every two to three group interviews, a minimum of one day is needed for data entry, verification, and analysis. A half day is scheduled for the final reporting session, to which representatives of all stakeholders are invited. A written record of the most significant findings and recommendations, such as a print-out of a PowerPoint presentation, is provided to everyone attending the reporting session. All stakeholders participating in the DMT exercise are given CD-ROMs with the raw data and analyses so they can conduct additional analyses, as appropriate.
2. Roles of DMT sponsors, facilitators, and participants
The DMT process involves three main types of stakeholders: sponsors, facilitators, and group interview participants. This section of the DMT User’s Guide describes the responsibilities of these three groups in the different phases of the DMT process. Each stakeholder is important for ensuring that the DMT process goes smoothly, the data collected are valid, and the findings result in concrete action. Additional stakeholders may become involved, depending on the purpose of the DMT exercise. Those undertaking a DMT study need to keep in mind that decentralization is ultimately a political process. Thus, they should anticipate that political bodies and the news media may be interested in the findings, particularly in situations where decentralization is a controversial issue. Role of DMT sponsors: The DMT sponsors are individuals who recognize the benefit of undertaking a DMT analysis and initiate the process. Such individuals are either high-level personnel in the health system or
6
organization to be studied or have excellent contacts and relationship with them. Sponsors may work in a Ministry of Health, a national health reform commission, regional health office, or other such agency. Leaders of a donor-funded project supporting reform efforts may also sponsor a DMT exercise. In the latter case, it is essential to ensure that national counterparts have been consulted and are in agreement prior to launching the DMT study. The DMT process is designed to help pinpoint the management areas that need the most attention to reap the benefits of decentralization. Converting the DMT findings to concrete actions requires the full commitment of the sponsors and, where appropriate, their national counterparts. Before the start of DMT data collection, the sponsors should:
• understand the DMT instrument and process; • define the purpose of the DMT exercise; • help secure funding for the fieldwork; • “open doors” for the facilitators by making appropriate introductions; • collaborate in adjusting the DMT process and instrument to the local setting; • advise on and facilitate fieldwork logistics.
During the data collection phase, the sponsors should neither participate in nor observe the DMT group interviews. Ensuring that the participants can express their perceptions openly and frankly is essential for valid findings. Because of the sensitive and political nature of decentralization, such frankness may not be possible in the presence of sponsoring individuals, who may be perceived—rightly or wrongly—to have their own agendas. After the field work is completed and the data are analyzed, the sponsors have a very important role. They should:
• review and interpret the DMT findings; • disseminate the findings widely; • organize and participate in stakeholder discussions and debates of key findings; • instigate or catalyze follow-up action.
Role of facilitators: The facilitators of the DMT process may come from inside or outside the country in which the DMT exercise takes place. In either case, the facilitators should be external to the health system or organization to be studied, with no role in the reform processes of the health sector or organization. This is important to ensure that they are perceived as neutral in designing the field methodology and guiding the group interviews. It is essential that the facilitators be familiar with and understand key aspects of the local setting. These include the most important health indicators, the way the country or organization is governed, significant decentralization and other reform efforts, and who the main stakeholders of the reform process are. The facilitators must possess a good grasp of health management to be able to clarify vague or conflicting answers from participants. They must be skilled in fostering full participation by all group members and supporting consensus building. It is particularly important that they manage

7
the group discussion so that every participant has an equal opportunity to express her or his perceptions. The group should not be dominated by one or two people. The facilitators also need solid computer skills in Excel and PowerPoint to ensure accurate data entry and analysis, and effective presentation. Before the data collection phase, the facilitators should:
• be thoroughly familiar with the DMT instrument and process; • orient the sponsors to the DMT exercise; • adjust the DMT instrument and process to the local setting, jointly with the sponsors; • finalize local logistical arrangements for the field work.
During data collection, the facilitators should:
• explain the goals and process of the DMT exercise to the group interview participants; • manage the guided group interviews; • document the group decisions.
After data collection, the facilitators should:
• analyze the data; • report the findings; • suggest action steps, if requested; • provide or suggest technical assistance to implement the actions, if requested.
Role of participants: The sponsors initiate the DMT process, and the facilitators manage it. The participants are the heart of it. It is the honest perceptions of managers at the different levels of a health system or organization that the DMT instrument is designed to gauge. While the participants do not play a role prior to the data collection phase, the whole DMT exercise is futile without their full engagement during and after it. The most important role of the participants during data collection is to share their perceptions openly and honestly, and to participate in reaching a consensus. Every participant brings to the group in-depth knowledge that the other participants do not possess about the way one of the nine functional areas is managed. Experience in applying the DMT in the field has shown that the guided group interviews provide a valuable opportunity for sharing such information among group members. It is through such sharing that misconceptions are clarified and a consensus is reached. After the data collection phase, the participants should:
• join in examining and interpreting the analyzed findings, particularly as they pertain to their management level;
• suggest appropriate responses to identified weaknesses; • take action in those areas that fall within their area of responsibility.
8
II. Part I: Getting ready
A. STEP 1: MATCHING THE DMT PROCESS TO THE LOCAL SETTING
1. Clarifying the purpose of the DMT application
You need to understand the purpose of undertaking the DMT application if you are sponsoring or facilitating one. Is the goal to identify, in an already decentralized setting, those management functions about which managers are most confused or in conflict? Or is the main purpose to examine how well managers’ perceptions of their own roles fit with what was intended when decentralization was designed? Is the reason for the DMT application to collect baseline data of managers’ perceptions in a country, region, or organization where decentralization is imminent? If yes, does the sponsor intend to repeat the application in the future to assess changes in perceptions over time? The DMT is an easily adaptable instrument and can be applied for all the reasons mentioned above—and for many more. Each purpose, however, requires modifications to the methodology. To make sound decisions about such adjustments, both sponsors and facilitators must be clear and in agreement about the purpose of the DMT application.
2. Defining required analyses
If the purpose for undertaking the DMT is clear, the analyses can be designed to yield the desired information. It is crucial that you do carefully design the analyses before you finalize the field methodology. It is the required analyses that dictate where and with whom the group interviews will be conducted. Suppose that your purpose in applying the DMT is to identify management functions where the most confusion and conflict reign. To do so, you must compare managers’ perceptions, functional area by functional area. In defining the required analyses, you must first decide which groups of managers you want to compare. Are you most interested in differences in the perceptions of managers who work at the same level but in different geographic areas (for example, regional health staff)? Or is it more important to contrast the perceptions of managers who work at different levels? If the answer to the latter question is yes, what are the relevant management levels? Some will be obvious (for example, the central Ministry of Health or a provincial health office), but others may not be so straightforward. For example, should the semiautonomous national teaching hospital be considered a management level and thus included in your analysis? In your analysis, you might want to contrast the DMT data for a part of the country where the confusion and conflict are particularly severe with data from another area that seems to experience less confusion. If decentralization has a longer history in some parts of the country than others, you might decide to compare the perceptions of managers in these two areas.

9
3. Identifying criteria for selecting discussion sites and participants
You will probably not have enough resources to include all similar management entities (for example, all district health offices) in the DMT exercise. You have two choices in deciding where to arrange the group discussions and who to invite. You can either take a sample of similar management entities, interviewing all their relevant managers, or invite relevant managers from separate but similar management entities and interview them as a group. In the first instance, you select a few of the district health offices, and arrange a group interview in each. All relevant managers who work in each district health office are included in the group interview. In the second, you select a representative group of managers who among them have the relevant experience to answer the questions. They all work at the same management level and for a similar management entity (i.e., a district health office), but not in the same place. In both cases, you must define the criteria you use in sampling. In sampling management entities, is it important to choose at least one district health office from every province of the country? Do you want to contrast a decentralized area versus a nondecentralized area? Does the size of the district matter? In sampling managers, should the number of years of experience be used as one of the criteria? If yes, what is the minimum number to be considered for selection? These are the kinds of questions you must consider to ensure the best fit between the selection criteria and the purpose of the DMT exercise.
B. STEP 2: COLLECTING RELEVANT LOCAL DOCUMENTATION
Complete this step only if the facilitators are external to the local setting. Otherwise, you may proceed directly to Step 3. The facilitation team should collect documentation regarding governance, the health situation, and other relevant information about the country where the DMT is being applied before traveling to the country. This step can be accomplished by asking the counterpart (usually the Ministry of Health) or other local contacts to send what they think would be useful, either electronically or in hard copy, to the team leader. The team leader will then disseminate relevant documents to the other members of the team. Some examples of useful documents are national health plans, regional health plans, organizational charts, and legal documents that describe any past or current changes in the country’s health laws as they pertain to decentralization. This step is important for two main reasons:
• It is important to demonstrate to your local counterparts that you are aware of local customs, history, and politics, and that you respect their time by learning what you can in advance. You will be able to do a better job of facilitating the guided interviews if you understand any recent or planned changes that relate to health, and particularly to decentralization.
• Once the facilitation team arrives in-country, the schedule is likely to be tight, and you may not have a chance to read or review, and reflect on these types of documents. The more advance preparation the team has, the better prepared it will be to collaborate fully with local counterparts when the work in-country begins.

10
If you cannot obtain this type of documentation before your departure and there is no local counterpart office, it is the responsibility of the logistics coordinator to arrive in-country prior to the other members of the DMT facilitation team to organize, collect, and—if possible—send the information to the other team members before they travel to the country. If the logistics coordinator does not have time to obtain copies of relevant documents to send to the team members before they travel, he or she should ensure that copies of the documents are at the hotel for the members of the facilitation team to collect when they arrive.
C. STEP 3: ADAPTING THE DMT INSTRUMENT TO THE LOCAL SETTING
The DMT has been developed in Excel, and these instructions assume that you have basic spreadsheet skills. If you do not have these skills, you will want to recruit someone for your team who is comfortable using Excel. One reason for having the tool in Excel is to make it easier for you to modify the tool. The DMT uses the same data in various places and in different ways, and if you need to make a change in one place, you want it to be consistent throughout the tool. As described in the Introduction, the tool features the main data collection sheet, as well as analysis pages for each functional area. You may need to change the wording of a particular question to fit the local context, and you need the corrected wording to appear both on the data collection sheet and the summary page for that function. We have taken advantage of Excel’s capabilities with formulas to automate this process. How does it work? One of the worksheets in the file is called Terms_Términos; it includes all the questions and terms used in the tool, in English and Spanish. This is the page where you make changes. The data collection sheet and the summary analysis pages all link back to this page. You make changes once, and the other sheets will reflect those changes automatically. The step-by-step instructions that follow tell you how to modify various sections of the DMT to fit your local setting. In each case, you will need to share a copy of the data collection sheet with key people in the Ministry of Health (or at a senior level of your organization) who are knowledgeable about the different functional areas covered by the tool. You can either circulate a photocopy of the data collection sheet found in Appendix A of this Guide, or you can print out a copy from the Excel file found on the CD-ROM.
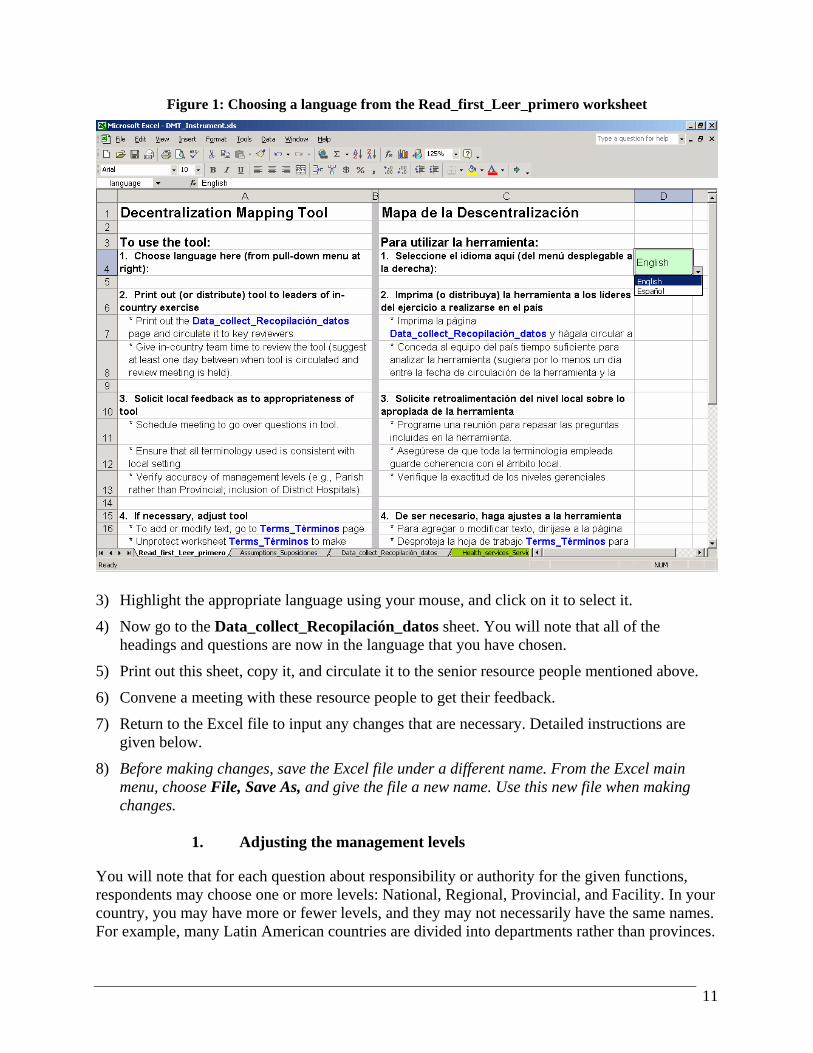
1) If you are printing a copy from the Excel file, open the Excel workbook and click on the worksheet tab entitled Read_first_Leer_primero, which is the first worksheet in the workbook. (Each worksheet is named in both English and Spanish to help you navigate the workbook more easily.)
2) Click in cell D4. You will see a drop-down menu with two choices: English and Español. See Figure 1.
11
Figure 1: Choosing a language from the Read_first_Leer_primero worksheet
3) Highlight the appropriate language using your mouse, and click on it to select it.
4) Now go to the Data_collect_Recopilación_datos sheet. You will note that all of the headings and questions are now in the language that you have chosen.
5) Print out this sheet, copy it, and circulate it to the senior resource people mentioned above.
6) Convene a meeting with these resource people to get their feedback.
7) Return to the Excel file to input any changes that are necessary. Detailed instructions are given below.
8) Before making changes, save the Excel file under a different name. From the Excel main menu, choose File, Save As, and give the file a new name. Use this new file when making changes.
1. Adjusting the management levels
You will note that for each question about responsibility or authority for the given functions, respondents may choose one or more levels: National, Regional, Provincial, and Facility. In your country, you may have more or fewer levels, and they may not necessarily have the same names. For example, many Latin American countries are divided into departments rather than provinces.

12
1) Begin by clicking on the Terms_Términos page and, if necessary, scrolling the worksheet
so that you are at the top of the page. See Figure 2. You will note that English terms appear in column A, and Spanish terms appear in column C. They have been laid out in parallel to remind the design team and future users of the tool that if changes happen in one language, the same changes must be made in the other language. If you are using the tool in one country and you decide that changes are necessary, you probably do not have to be concerned with making changes in the other language, unless you plan to present your results in both English and Spanish. Note: To make any of the following changes, you may need to unprotect the worksheet. To do this, click on Tools, Protections, Unprotect sheet.
Figure 2: Top of the Terms_Términos page, showing some of the terms used
2) If you need to change the name, but not the quantity, of the management levels:
a) Make changes by typing in the correct management level names in rows 13 through 16.
b) Enter the data in column A if you are using the tool in English, and in column C if you are using the tool in Spanish. (For instance, instead of Regional and Provincial, you may need to change the two intermediate levels to Department and District.)
c) Save the file (remember to give it a new name if you have not already done so).
13
3) If you need more management levels:
a) Look at rows 13 through 16 of the Terms_Términos page.
b) Decide where you need to insert an additional management level. For instance, you may need to add District between Provincial and Facility.
c) Put the cursor anywhere in the row below where you want to add a management level.
d) From the main menu, choose Insert, Row.
e) Type in the name of the additional management level (either in column A or C, depending on the language you have chosen).
f) Change other management levels if necessary.
g) Save the file.
4) If you need fewer management levels:
a) Look at rows 13 through 16 of the Terms_Términos page.
b) Decide which row is unnecessary. For instance, your health system may be organized in three tiers: National, Regional, and Facility. Thus, you do not have a Provincial management level.
c) Put the cursor anywhere in the row that you want to delete.
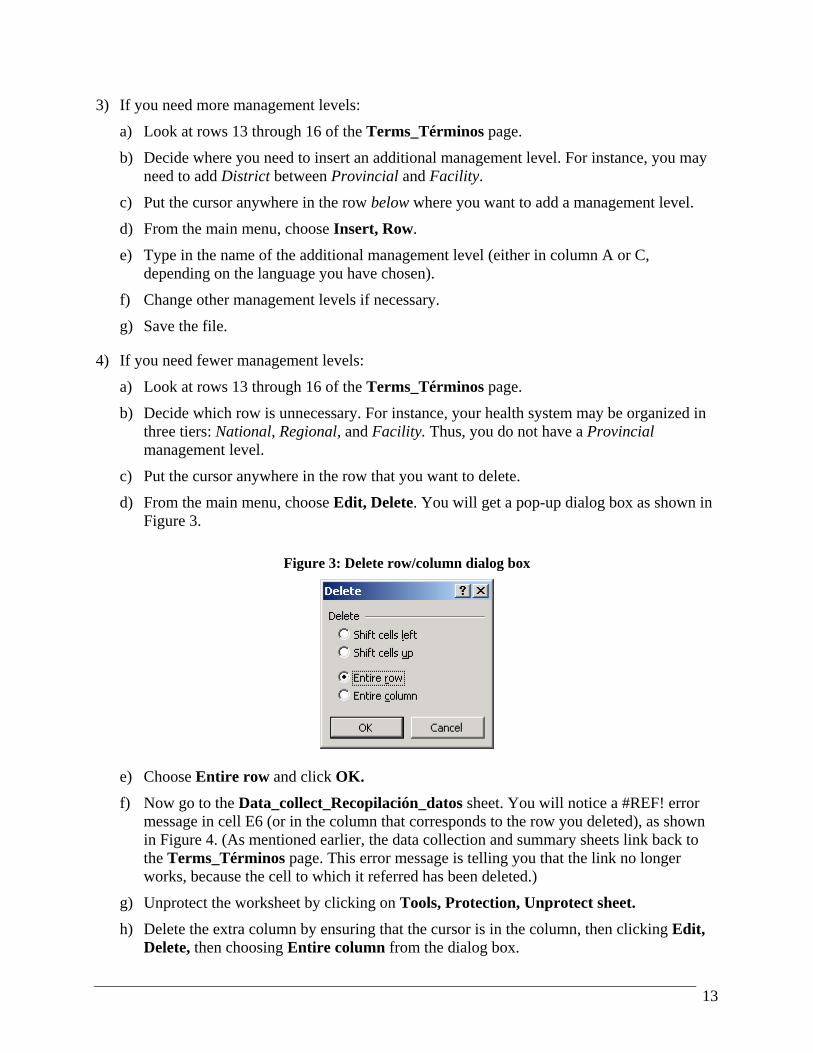
d) From the main menu, choose Edit, Delete. You will get a pop-up dialog box as shown in Figure 3.
Figure 3: Delete row/column dialog box
e) Choose Entire row and click OK.
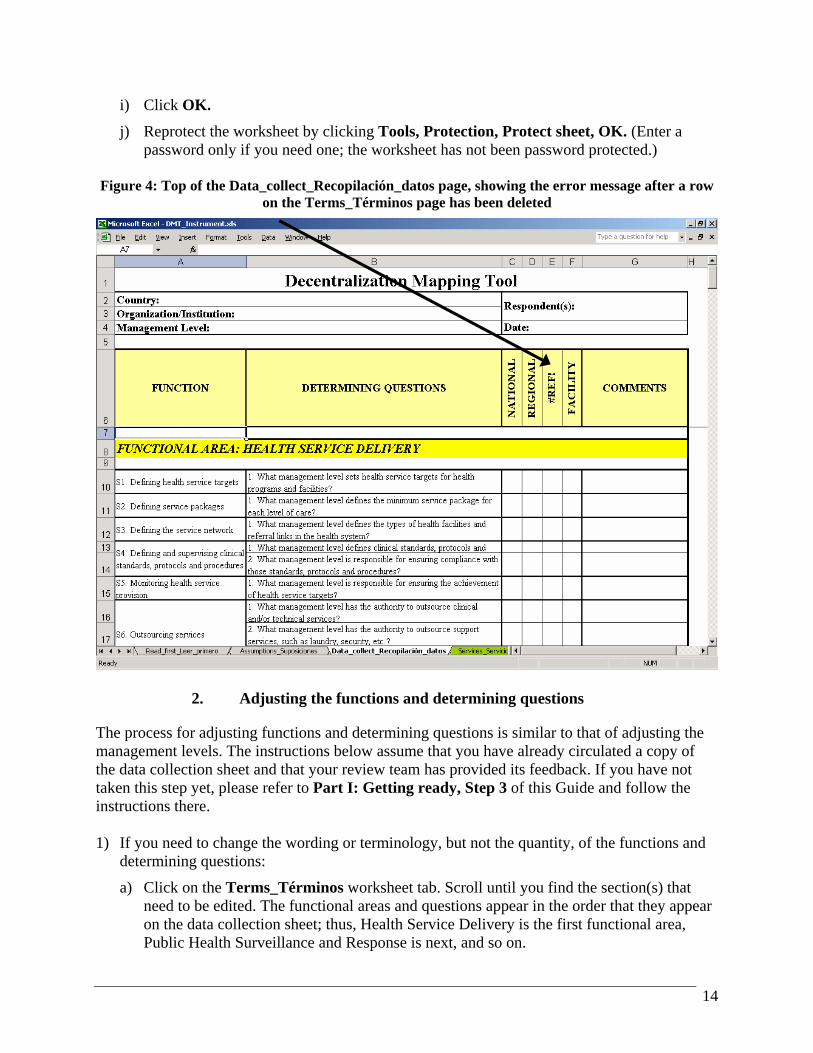
f) Now go to the Data_collect_Recopilación_datos sheet. You will notice a #REF! error message in cell E6 (or in the column that corresponds to the row you deleted), as shown in Figure 4. (As mentioned earlier, the data collection and summary sheets link back to the Terms_Términos page. This error message is telling you that the link no longer works, because the cell to which it referred has been deleted.)
g) Unprotect the worksheet by clicking on Tools, Protection, Unprotect sheet.
h) Delete the extra column by ensuring that the cursor is in the column, then clicking Edit, Delete, then choosing Entire column from the dialog box.
14
i) Click OK.
j) Reprotect the worksheet by clicking Tools, Protection, Protect sheet, OK. (Enter a password only if you need one; the worksheet has not been password protected.)
Figure 4: Top of the Data_collect_Recopilación_datos page, showing the error message after a row
on the Terms_Términos page has been deleted
2. Adjusting the functions and determining questions
The process for adjusting functions and determining questions is similar to that of adjusting the management levels. The instructions below assume that you have already circulated a copy of the data collection sheet and that your review team has provided its feedback. If you have not taken this step yet, please refer to Part I: Getting ready, Step 3 of this Guide and follow the instructions there. 1) If you need to change the wording or terminology, but not the quantity, of the functions and
determining questions:
a) Click on the Terms_Términos worksheet tab. Scroll until you find the section(s) that need to be edited. The functional areas and questions appear in the order that they appear on the data collection sheet; thus, Health Service Delivery is the first functional area, Public Health Surveillance and Response is next, and so on.

15
b) Make changes by typing in the updated information. You can press the function key F2 to edit the contents of the cell, or you can click in the cell, then click in the formula bar just above the worksheet and make the edits there. See Figure 5.
Figure 5: Editing text in the Formula Bar or within the cell
c) As before, you will enter the data in column A if you are using the tool in English, and in column C if you are using the tool in Spanish.
d) Note that a number of questions refer specifically to management levels. See, for example, the Financial Resources section, functions F4–F6, rows 77–93 on the Terms_Términos worksheet tab. If you made changes to the management levels in the step preceding this one, you will also need to edit the text of these questions so that they correspond to the management levels you have chosen.
e) Similarly, you will need to review and perhaps adjust the text in the Personnel section. The DMT assumes that there may be different processes for hiring, firing, and transfer of professional and other staff (or for staff hired at different management levels—the central level versus the local level in a decentralized environment). In your country, perhaps there is no distinction in human resource policies and procedures among different categories of staff. In any case, you will want to review the wording of questions P2, P3, P6, and P7 very carefully (see rows 99–110 and rows 119–124 of the Terms_Términos page).
16
f) Save the file. 2) If you need to delete any functions or determining questions:
It is possible that certain functions in your country are always carried out at the national level (or at a decentralized level). If this is so, you may not want to spend time asking people about these functions, since the answer will always be the same. Thus, you may want to eliminate these functions or some of the determining questions.
a) Go to the Terms_Términos page.
b) If the sheet is protected, you need to unprotect it in order to make changes. Unprotect the worksheet by clicking on Tools, Protection, Unprotect sheet.
c) Delete the row(s) that correspond to the unnecessary functions or determining questions. Ensure that the cursor is in the row that you want to delete, select Edit, Delete from the main menu, then choose Entire row from the dialog box.
d) Click OK.
e) Reprotect the worksheet by clicking Tools, Protection, Protect sheet, OK. (Enter a password only if you need one; the worksheet has not been password protected.)
f) If necessary, renumber the questions. (For example, if a function has five determining questions and you delete question 3, you need to renumber questions 4 and 5, which are now questions 3 and 4.)
g) Now go to the Data_collect_Recopilación_datos sheet. You will notice a #REF! error message in the cell(s) where you deleted functions or determining questions. (As mentioned earlier, the data collection and summary sheets link back to the Terms_Términos page. This error message is telling you that the link no longer works, because the cell to which it referred has been deleted.)
h) Unprotect the worksheet by clicking on Tools, Protection, Unprotect sheet.
i) Delete the extra row(s) by ensuring that the cursor is in the relevant row or rows (if you have to delete a few rows that are next to each other, you can select more than one row at a time by clicking in the topmost row, holding down the left mouse button, and dragging the mouse down until all relevant rows are highlighted), then clicking Edit, Delete, then choosing Entire row from the dialog box.
j) Click OK.
k) Reprotect the worksheet by clicking Tools, Protection, Protect sheet, OK. (Enter a password only if you need one; the worksheet has not been password protected.)
l) Finally, click on the relevant summary sheet in the Excel file (for example, if you deleted a question in the Financial Resources section, click on Finances_Finanzas). Rather than delete a row, it is probably easiest just to delete the #REF! error message, due to the way these summary pages are laid out.
17
3) If you need to add functions or determining questions:
Although every effort has been made to include a comprehensive set of functions and their associated determining questions, your review team may want to expand the research on some functions by adding more determining questions, or handle a particular function in a different way. If so, you may want to add either a function or determining question to capture the relevant information.
a) Go to the Terms_Términos page.
b) If the sheet is protected, you need to unprotect it in order to make changes. Unprotect the worksheet by clicking on Tools, Protection, Unprotect sheet.
c) Insert a row or rows in the relevant section of the worksheet. To do this, put the cursor anywhere in the row below where you want to add a function or question.
d) Next, from the main menu, choose Insert, Row.
e) In the new blank row, type in the new function or question (in either column A or C, depending on the language you have chosen).
f) Adjust the numbering of the functions or questions in the relevant section if necessary.
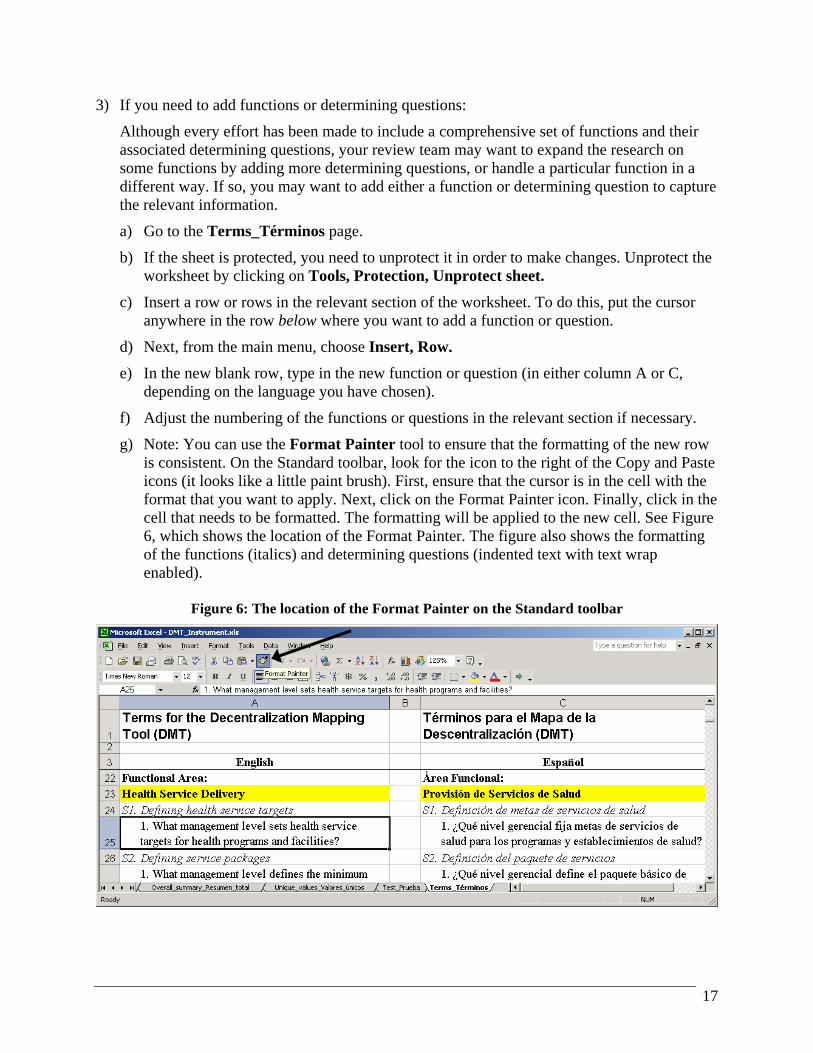
g) Note: You can use the Format Painter tool to ensure that the formatting of the new row is consistent. On the Standard toolbar, look for the icon to the right of the Copy and Paste icons (it looks like a little paint brush). First, ensure that the cursor is in the cell with the format that you want to apply. Next, click on the Format Painter icon. Finally, click in the cell that needs to be formatted. The formatting will be applied to the new cell. See Figure 6, which shows the location of the Format Painter. The figure also shows the formatting of the functions (italics) and determining questions (indented text with text wrap enabled).
Figure 6: The location of the Format Painter on the Standard toolbar

18
h) Reprotect the worksheet by clicking Tools, Protection, Protect sheet, OK. (Enter a password only if you need one; the worksheet has not been password protected.)
i) Save the file.
j) Now go to the Data_collect_Recopilación_datos sheet. You will also need to insert rows on this page to correspond to the additional functions or questions that you have added on the Terms_Términos page. (Recall that the data collection and summary sheets link back to the Terms_Términos page, so you will notice some gaps in the numbering that coincide with the additions that you have made.)
k) Unprotect the worksheet by clicking on Tools, Protection, Unprotect sheet.
l) Find the section of the worksheet that corresponds to where you added a function or question.
m) Insert as many rows as necessary in the relevant section of the worksheet. If you are inserting rows below any merged cells, it will be easier to “unmerge” the merged cells first. You will find merged cells in the FUNCTION column if a particular function has more than one determining question.
n) (This step is necessary only if you need to “unmerge” cells): Click in the merged cell, right-click with your mouse, choose Format Cells, click on the Alignment tab, and uncheck the box labeled Merge cells.
o) To add a row, put the cursor anywhere in the row below where the additional function or question should appear.
p) Next, from the main menu, choose Insert, Row.
q) Repeat this step until you have inserted sufficient rows.
r) In the new blank row or rows, you will need to copy and modify the formula that links in the text from the Terms_Términos page. The following example will show you how to do this.
s) Let’s assume that you want to insert a new determining question to supplement function S2, Defining Service Packages, of the Health Service Delivery section. In your country, you have both minimum (basic) and more comprehensive service packages, and you want to know managers’ perceptions about who is responsible or has authority for defining the elements of both service packages. Thus, you add a question about comprehensive service packages. Assume that you have already added the question to the Terms_Términos page, following the directions above.
t) On the Data_collect_Recopilación_datos sheet, copy the formula from the row above the empty row. You can do this by using the Copy icon, or you can put your cursor in the cell containing the formula and press Ctrl-C. (Hold down the Ctrl key and then press the letter C, while still holding the Ctrl key.)
u) Now place your cursor in the empty cell where the new function or question should appear.
v) Click on the Paste icon, or press Ctrl-V if you prefer to use the keyboard shortcut rather than the mouse.
19
w) If you “unmerged” any cells earlier, you can merge them again by highlighting the cells that you want to merge (click and drag with your mouse to highlight more than one cell), then right-click with your mouse, choose Format Cells, click on the Alignment tab, and click on the box labeled Merge cells so that a check mark appears in the box.
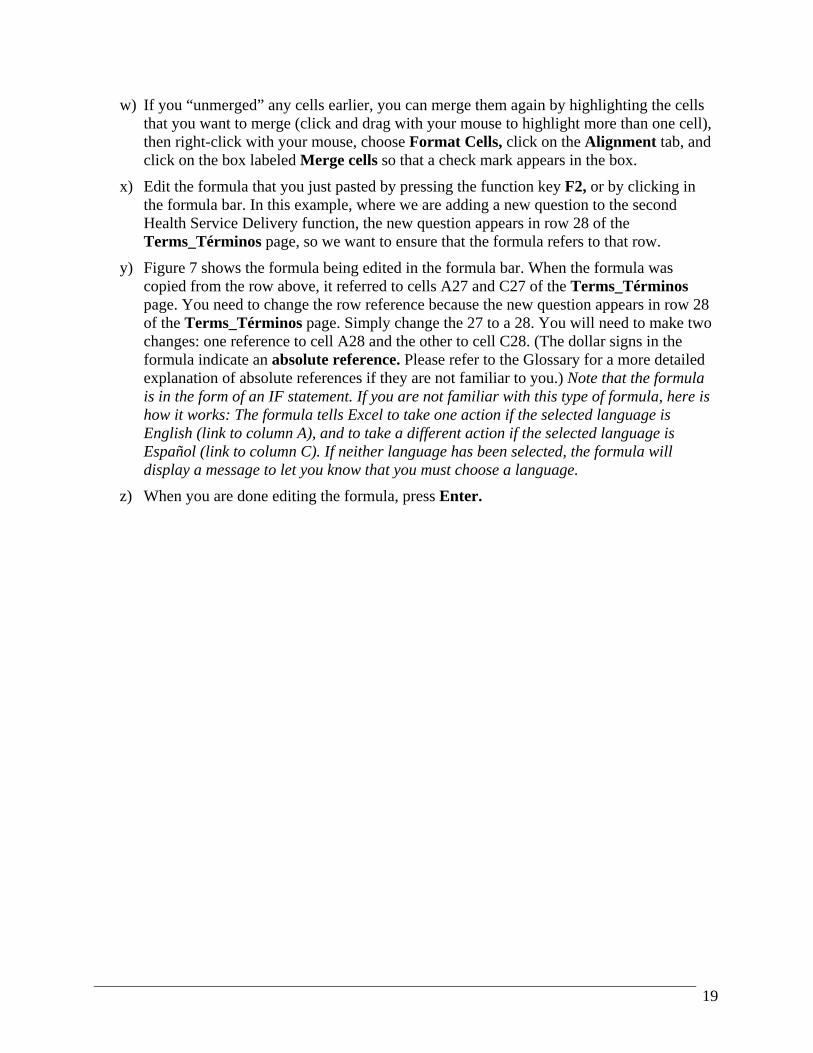
x) Edit the formula that you just pasted by pressing the function key F2, or by clicking in the formula bar. In this example, where we are adding a new question to the second Health Service Delivery function, the new question appears in row 28 of the Terms_Términos page, so we want to ensure that the formula refers to that row.
y) Figure 7 shows the formula being edited in the formula bar. When the formula was copied from the row above, it referred to cells A27 and C27 of the Terms_Términos page. You need to change the row reference because the new question appears in row 28 of the Terms_Términos page. Simply change the 27 to a 28. You will need to make two changes: one reference to cell A28 and the other to cell C28. (The dollar signs in the formula indicate an absolute reference. Please refer to the Glossary for a more detailed explanation of absolute references if they are not familiar to you.) Note that the formula is in the form of an IF statement. If you are not familiar with this type of formula, here is how it works: The formula tells Excel to take one action if the selected language is English (link to column A), and to take a different action if the selected language is Español (link to column C). If neither language has been selected, the formula will display a message to let you know that you must choose a language.
z) When you are done editing the formula, press Enter.
20
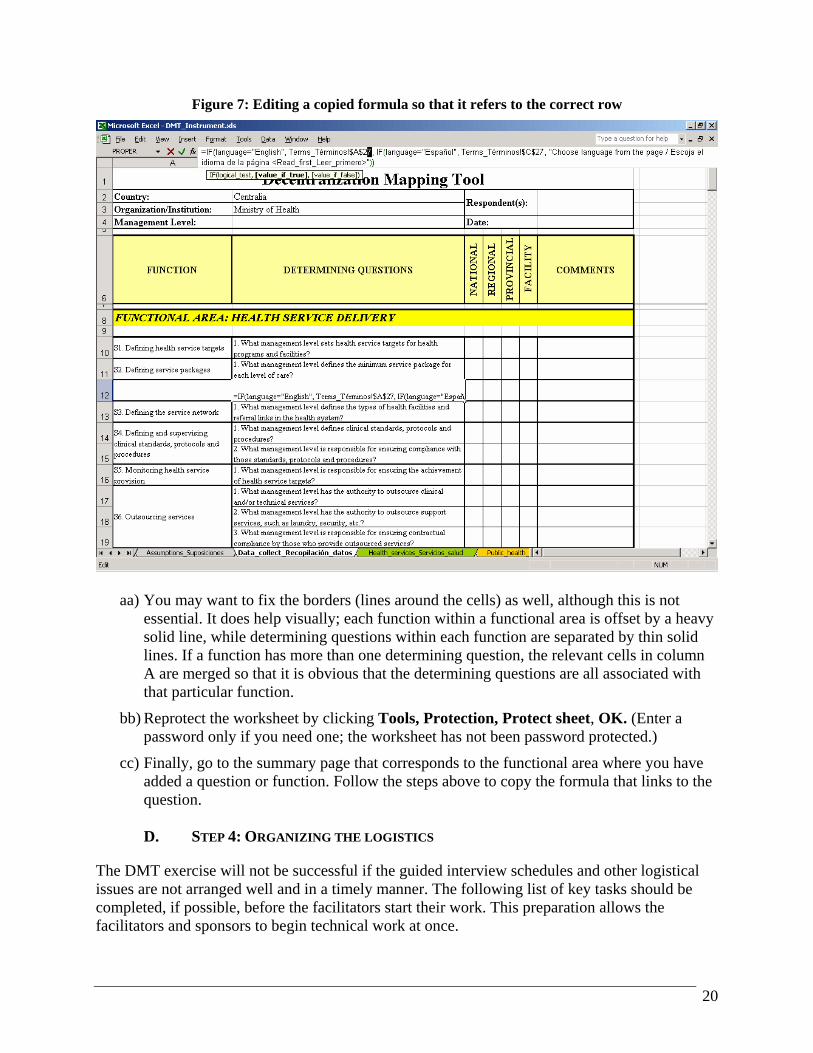
Figure 7: Editing a copied formula so that it refers to the correct row
aa) You may want to fix the borders (lines around the cells) as well, although this is not essential. It does help visually; each function within a functional area is offset by a heavy solid line, while determining questions within each function are separated by thin solid lines. If a function has more than one determining question, the relevant cells in column A are merged so that it is obvious that the determining questions are all associated with that particular function.
bb) Reprotect the worksheet by clicking Tools, Protection, Protect sheet, OK. (Enter a password only if you need one; the worksheet has not been password protected.)
cc) Finally, go to the summary page that corresponds to the functional area where you have added a question or function. Follow the steps above to copy the formula that links to the question.
D. STEP 4: ORGANIZING THE LOGISTICS
The DMT exercise will not be successful if the guided interview schedules and other logistical issues are not arranged well and in a timely manner. The following list of key tasks should be completed, if possible, before the facilitators start their work. This preparation allows the facilitators and sponsors to begin technical work at once.

21
The logistical arrangements may be made by the sponsors or by an external logistics coordinator hired by the facilitators. The list that follows, although not exhaustive, should be useful in either case. The arrangements will obviously differ from country to country, depending on who is funding the DMT exercise and whether the facilitator team comes from inside or outside the country concerned. Pre-trip logistical arrangements: 1) Agree on travel dates, if applicable (for facilitators who arrive from outside the country).
2) Agree on a rough schedule of guided interviews, including a time to present the findings to key stakeholders. You should know how many management levels (for example, national, regional, provincial, hospitals, health centers) will be interviewed, and whether and how long the facilitators will be traveling outside the capital city.
3) If necessary, arrange for tickets, hotel reservations, and advances to cover per diem payments and other anticipated costs (for example, meeting costs, rental of LCD projector, local transport).
4) If you work for the facilitators, identify a local logistical counterpart from the organization where the sponsors work. Obtain all of his/her contact information (e-mail, office, and mobile/cell phone) before departure.
5) Verify that it is possible to pay the hotel and other costs (if applicable) with a credit card. Determine which credit cards are accepted, and whether traveler’s checks are also accepted. If not, advise the facilitator team of any constraints.
6) Ensure that you have sufficient copies of the DMT and other relevant documents. Hotel arrangements: 1) Confirm hotel reservations for the facilitators and arrange for taxi or shuttle bus pick-up at
the airport.
2) Secure a meeting place where the facilitation team can work on the DMT analysis after the guided interviews have been conducted. Ensure that the room is clean, has functioning electrical outlets for laptop computers, and is well ventilated. If the meeting place is in the hotel where the facilitators are staying, include coffee breaks and food when negotiating the price of the room.
3) In addition, arrange for a larger room for a debriefing at the end of the DMT exercise.
a) You might have a breakfast or lunch meeting, depending on what works best with local customs and schedules.
b) Inspect the room to ensure that it is clean, has functioning electrical outlets for laptop computers, and is well ventilated.
c) If the room is in a hotel, inform hotel staff of the approximate number of attendees, and confirm the number as soon you have an accurate estimate.
22
4) Make sure that a working LCD projector and screen for the debriefing are available from the hotel or the sponsors. Rent this equipment if necessary. In addition, ensure the availability of supplies such as felt tip pens, CD-ROMs, flip chart paper, and diskettes.
5) If the team is traveling outside the capital city, make lodging arrangements for the team, keeping per diem limits in mind.
Transportation arrangements: 1) If you are an external logistics coordinator, and the sponsors are not able to provide in-
country transportation, the concierge at the hotel will usually be able to put you in contact with a vehicle or shuttle service. Prices are often negotiable, so do not hesitate to bargain (for instance, you may suggest 25% less than the initial price quoted to start).
2) Wherever possible, keep receipts of all costs incurred locally, especially if you are using an outside service that will not be billed automatically to your hotel room. Obtain all documentation necessary to satisfy auditing requirements. If you pay cash to an external driver, write up a receipt showing the amount and description of services provided for the driver to sign.
Initial meetings with sponsors and relevant counterparts: 1) If you are an external coordinator, schedule a meeting with your local logistics counterpart as
soon as possible after your arrival in country. Finalize with him/her the schedule for guided interviews at the various management levels (central, provincial, regional, etc). The process of arranging meetings and preparing the schedule should have begun before the trip; however, given competing demands on the time of key stakeholders, it is possible that some changes will be necessary. Thus, review the agenda soon after your arrival to ascertain if all the participants from the various levels have been advised of the importance of the DMT analysis, and of the date, time, and location of the scheduled interviews.
2) If appropriate, you can contact the participants directly to check if they know about the purpose and timing of the DMT exercise, and to emphasize the importance of their participation.
3) If the schedule of guided interviews is not finalized before your arrival, do your best to ensure that it is finalized before the facilitator team arrives. Doing so will minimize confusion and save time, and it should be your first priority as you work with your local logistics counterpart. If you feel that the arrangements are deviating from what was previously agreed on, check with the head of the facilitation team prior to committing to any changes. (There may be good reasons for schedule or other changes; your goal is to avoid last-minute surprises, and to ensure that the facilitators have time to plan for contingencies.)
4) If your local counterpart or other local stakeholders ask technical questions that are not within your realm of expertise, refer them to the head of the facilitation team.

23
III. Part II: Collecting, analyzing, and presenting the data
A. STEP 5: USING THE DMT INSTRUMENT TO COLLECT THE DATA
This section of the Guide has two sets of instructions. The first is based on the assumption that you are able to bring a laptop computer with you to the guided interviews, while the second assumes that you will not have access to a computer during the interviews. You should have already circulated the DMT instrument, solicited feedback on the questions and the terminology, and made any changes needed, following the instructions in Part I: Getting ready, Step 2. Be sure that at least two people are responsible for recording the responses to the interview questions. If you are using a laptop, it is crucial to have one person asking the questions, clarifying the responses, and taking notes, while the other has the responsibility of entering the data in the questionnaire. If you do not have a laptop, it is still very helpful to have one person whose primary responsibility is to ask the questions and take notes while the other records the responses on a printed copy of the questionnaire. Then the person conducting the interview can focus on the questions and on clarifying any ambiguous responses. After the interviews are completed, the facilitators should compare notes to confirm that they all have the same understanding of what was said during the interviews.
1. If you have a laptop
1) Once you have the validated version of the DMT instrument, you may want to remove the formulas from the Data_collect_Recopilación_datos page and convert everything to text. The main advantage of doing this is that it will minimize the size of your file (a worksheet that contains many links and formulas takes up more space than a worksheet that has only text in it). Because you need to create a separate data collection sheet for each guided interview that you carry out, you will want to keep the file size manageable, especially if you need to copy the file to a diskette at some point.
2) First, rename the file. Open the DMT_Instrument.xls worksheet, choose File, Save As, and save it under a new name (for example, DMT2004.xls). Now you can proceed to convert the formulas to text.
3) To begin this process, go to the Data_collect_Recopilación_datos page and unprotect the worksheet.
4) Place your cursor in cell A1, at the top left of the worksheet, and then hold down the Shift key. While holding the Shift key, press the End key, release the End key (still holding down the Shift key), and then press the Home key. This should highlight the entire questionnaire. (Note that if you press Ctrl-A instead—to “Select All”—you will select the entire worksheet, all 65,536 rows and 256 columns. You do not want to do this.)
5) Now that the entire questionnaire is selected, press the copy icon on the toolbar, or press Ctrl-C.
24
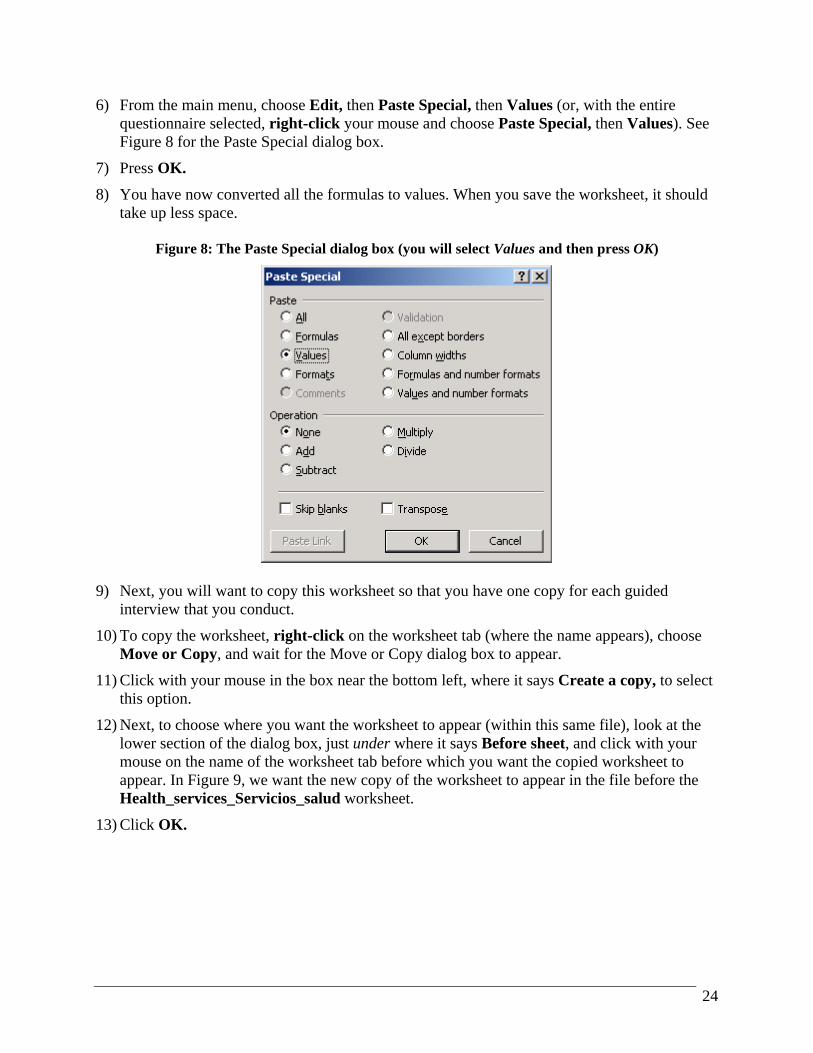
6) From the main menu, choose Edit, then Paste Special, then Values (or, with the entire questionnaire selected, right-click your mouse and choose Paste Special, then Values). See Figure 8 for the Paste Special dialog box.
7) Press OK.
8) You have now converted all the formulas to values. When you save the worksheet, it should take up less space.
Figure 8: The Paste Special dialog box (you will select Values and then press OK)
9) Next, you will want to copy this worksheet so that you have one copy for each guided
interview that you conduct.
10) To copy the worksheet, right-click on the worksheet tab (where the name appears), choose Move or Copy, and wait for the Move or Copy dialog box to appear.
11) Click with your mouse in the box near the bottom left, where it says Create a copy, to select this option.
12) Next, to choose where you want the worksheet to appear (within this same file), look at the lower section of the dialog box, just under where it says Before sheet, and click with your mouse on the name of the worksheet tab before which you want the copied worksheet to appear. In Figure 9, we want the new copy of the worksheet to appear in the file before the Health_services_Servicios_salud worksheet.
13) Click OK.

25
Figure 9: The Move or Copy dialog box, showing how to choose the location of the new worksheet
14) Repeat this process until you have enough copies of the questionnaire for all your guided
interviews.
15) Rename all the worksheet tabs to correspond to the groups being interviewed. For example, if you are interviewing people at a local health center, you might name the worksheet NorthRegion_HealthCenter; the name of a different worksheet to collect data from the national teaching hospital might be NationalHospital. We recommend that you not include spaces, hyphens, or other characters (such as *, &, ^, and #) in the worksheet names. You should limit worksheet tab names to letters of the alphabet. If you want to separate words, use the underscore _ character instead. Following these naming conventions makes it much easier for you to adjust formulas if necessary and helps Excel recognize and refer to these worksheets.
16) To rename a worksheet, double-click with your mouse on the worksheet tab. This will select the current worksheet name, which will probably be something like Data_collect_Recopilación_d (2). Excel takes the name of the worksheet you are copying and puts a number after it—so if you make six copies, the name of the last one would end with (6).
17) Type the new name and press Enter.
18) Repeat steps 16 and 17 for each worksheet that you need to name.
19) Reprotect each worksheet. This will prevent the questions from being altered or deleted by mistake, but you will still be able to enter data in the boxes.
20) Save the file. If you are connected to a network, save a copy to your laptop as well.
21) Now you are ready to go out to conduct your guided interviews.
22) Ensure that your laptop battery is charged (in case you are not able to plug the computer in during the interview).
23) Open your modified version of the file, with your newly created data collection sheets.
24) Click on the tab that corresponds to the interview you are conducting.
26
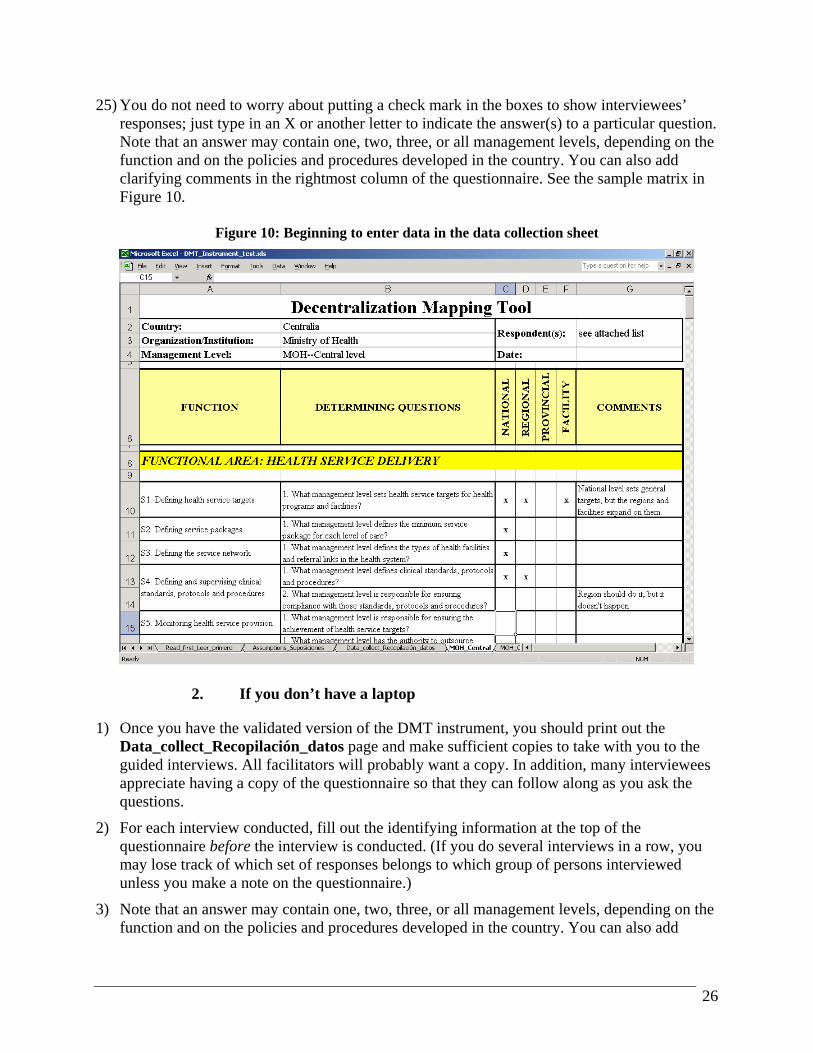
25) You do not need to worry about putting a check mark in the boxes to show interviewees’ responses; just type in an X or another letter to indicate the answer(s) to a particular question. Note that an answer may contain one, two, three, or all management levels, depending on the function and on the policies and procedures developed in the country. You can also add clarifying comments in the rightmost column of the questionnaire. See the sample matrix in Figure 10.
Figure 10: Beginning to enter data in the data collection sheet
2. If you don’t have a laptop
1) Once you have the validated version of the DMT instrument, you should print out the Data_collect_Recopilación_datos page and make sufficient copies to take with you to the guided interviews. All facilitators will probably want a copy. In addition, many interviewees appreciate having a copy of the questionnaire so that they can follow along as you ask the questions.
2) For each interview conducted, fill out the identifying information at the top of the questionnaire before the interview is conducted. (If you do several interviews in a row, you may lose track of which set of responses belongs to which group of persons interviewed unless you make a note on the questionnaire.)
3) Note that an answer may contain one, two, three, or all management levels, depending on the function and on the policies and procedures developed in the country. You can also add
27
clarifying comments in the rightmost column of the questionnaire. See the sample matrix in Figure 10.
B. STEP 6: ANALYZING AND INTERPRETING THE DATA
Now that you have collected all the data, you need to analyze and interpret the responses. This section of the Guide is divided into two parts:
• the “mechanical” part, which covers entering the data in the summary forms so that you can compare responses across groups;
• the “thinking” part, which will guide you through the analysis: how to determine if a function is centralized or decentralized, and how to set the criteria for the levels of agreement for the pie charts that will display the results of the analysis.
1. The mechanics: Entering the data in the summary forms
Whether or not you were able to enter survey data directly into Excel, you should now have a completed set of questionnaires from each guided interview that the facilitation team conducted. The next task is to summarize all the responses so that you have a better picture of how each function is perceived by the managers at all levels of the health system. The instructions below assume that you will be typing the responses into the summary sheets. If you have completed all the questionnaires electronically and wish to link the individual questionnaires to the summary worksheets, please refer to Appendix C, Instructions for Automating the Data Summary in Excel. We recommend the instructions below for most users.
Automating the Data Summary should be used only if you are very comfortable with Excel, because it involves a few advanced concepts and considerable cutting, copying, pasting, and using Find and Replace to ensure that the links are valid. Skim both sets of instructions—here and in Appendix C—and choose the method that fits your needs best. A few advantages of linking to the worksheets are that (1) you do not have to retype the answers—which may or may not save time, depending on how many interviews you conducted and how many comments are recorded in the “Comments” column, and (2) you reduce the possibility of data entry errors. However, the second advantage may be offset if you are not careful about linking to the proper places in the worksheets, because you will be pulling the correct data into the wrong place.
1) First, open the DMT file you have been using.
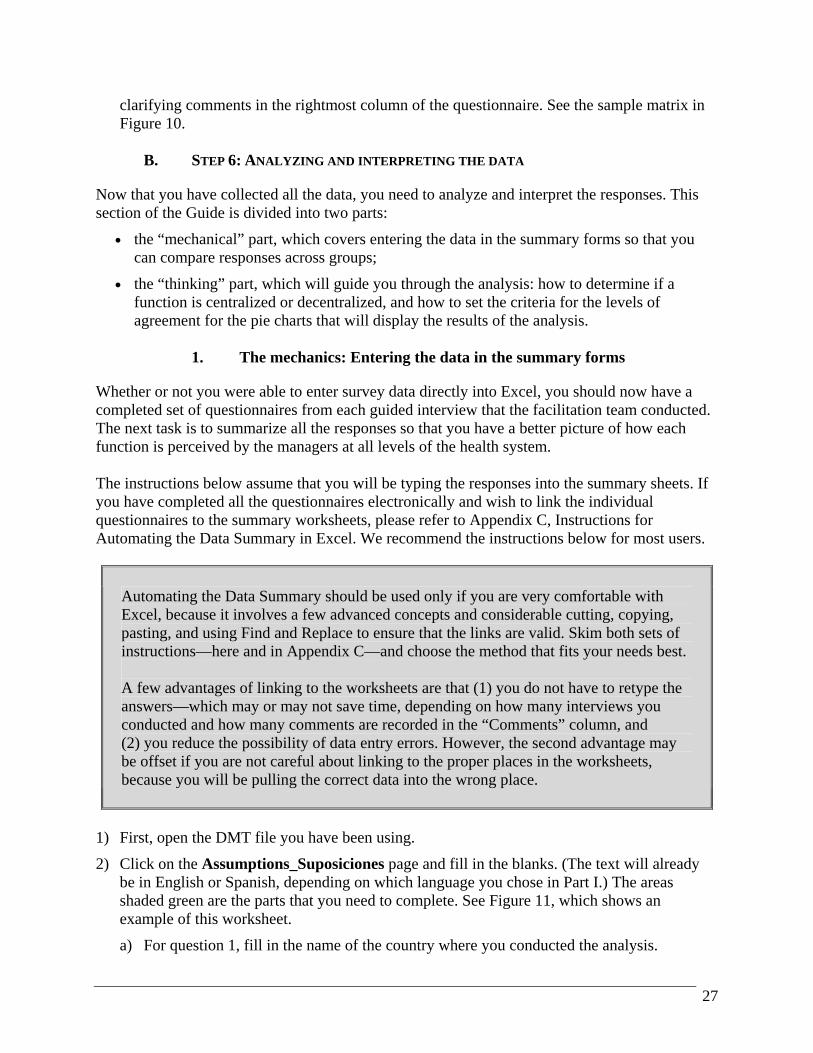
2) Click on the Assumptions_Suposiciones page and fill in the blanks. (The text will already be in English or Spanish, depending on which language you chose in Part I.) The areas shaded green are the parts that you need to complete. See Figure 11, which shows an example of this worksheet.
a) For question 1, fill in the name of the country where you conducted the analysis.

28
b) For question 2, fill in the name of the organization or institution you are analyzing. This might be the government health system, a specific region or province, or some other choice.
c) List the guided interview groups that you are comparing. The tool is set up so that you can compare up to eight groups.
d) The data that you have entered here will appear automatically on each of the summary pages; you do not need to re-enter them.
Figure 11: The Assumptions_Suposiciones page
3) Now you can proceed to the summary section. The DMT contains a summary page for each
functional area. As an example, see Figure 12, which shows an example of a completed summary page for the Health Service Delivery functional area. There are a few points to note:
a) On the data collection page, the functions within a functional area appear in the left column, and the determining questions for each function are arranged from top to bottom.
b) Here, on the summary page, you see the name of the function across the top of each section, and the determining questions appear from left to right.
c) As noted earlier in this Guide, the functions and the determining questions are linked back to the Terms_Términos page; any changes that you made in customizing the tool for your particular situation will be reflected here.

29
d) The identifying data that you entered on the Assumptions_Suposiciones page appear here: the name of the country, the organization or institution, and the names of the different management levels or groups of interviewees. You do not have to type these data into the tool again.
Figure 12: An excerpt from the Health_services_Servicios_salud summary page
4) Enter the responses from the questionnaires in the appropriate section. In the example above,
the response to function S1, question 1, for the Central Ministry of Health has been entered into cell D9, while the Southern Region Health Authority’s response is shown in cell D10. You can see from the figure above that abbreviations may be used. For example, rather than type the word “National,” you may use the letter “N” instead. Similarly, the example uses “R” for region and “F” for facility. Using abbreviations will speed data entry considerably.
5) It may be useful to have a colleague work with you to enter the results from the interviews. One of you can read the answers aloud, and the other can type in the responses. If this is not possible, be prepared to spend significantly more time doing the data entry.
6) Once all responses have been entered for each functional area, you are ready for the “thinking” part of the analysis and interpretation.
30
2. The “thinking” part: Setting criteria for levels of agreement and determining whether a function is centralized or decentralized
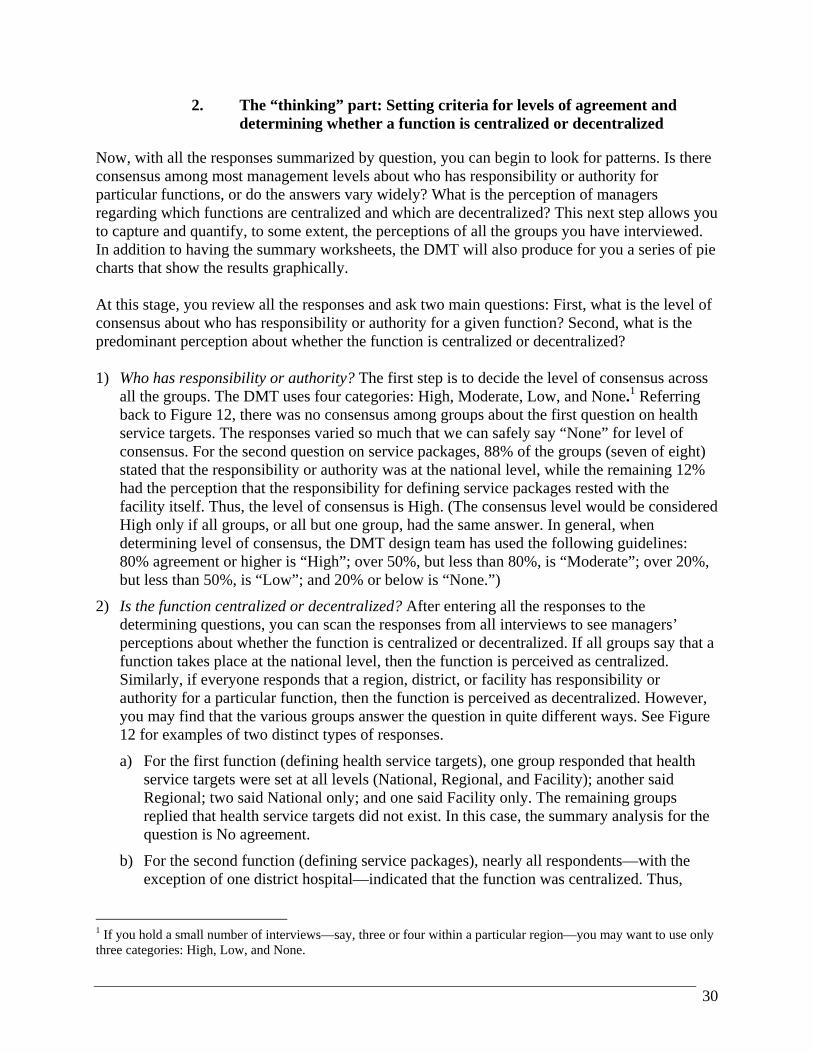
Now, with all the responses summarized by question, you can begin to look for patterns. Is there consensus among most management levels about who has responsibility or authority for particular functions, or do the answers vary widely? What is the perception of managers regarding which functions are centralized and which are decentralized? This next step allows you to capture and quantify, to some extent, the perceptions of all the groups you have interviewed. In addition to having the summary worksheets, the DMT will also produce for you a series of pie charts that show the results graphically. At this stage, you review all the responses and ask two main questions: First, what is the level of consensus about who has responsibility or authority for a given function? Second, what is the predominant perception about whether the function is centralized or decentralized? 1) Who has responsibility or authority? The first step is to decide the level of consensus across
all the groups. The DMT uses four categories: High, Moderate, Low, and None.1 Referring back to Figure 12, there was no consensus among groups about the first question on health service targets. The responses varied so much that we can safely say “None” for level of consensus. For the second question on service packages, 88% of the groups (seven of eight) stated that the responsibility or authority was at the national level, while the remaining 12% had the perception that the responsibility for defining service packages rested with the facility itself. Thus, the level of consensus is High. (The consensus level would be considered High only if all groups, or all but one group, had the same answer. In general, when determining level of consensus, the DMT design team has used the following guidelines: 80% agreement or higher is “High”; over 50%, but less than 80%, is “Moderate”; over 20%, but less than 50%, is “Low”; and 20% or below is “None.”)
2) Is the function centralized or decentralized? After entering all the responses to the determining questions, you can scan the responses from all interviews to see managers’ perceptions about whether the function is centralized or decentralized. If all groups say that a function takes place at the national level, then the function is perceived as centralized. Similarly, if everyone responds that a region, district, or facility has responsibility or authority for a particular function, then the function is perceived as decentralized. However, you may find that the various groups answer the question in quite different ways. See Figure 12 for examples of two distinct types of responses.
a) For the first function (defining health service targets), one group responded that health service targets were set at all levels (National, Regional, and Facility); another said Regional; two said National only; and one said Facility only. The remaining groups replied that health service targets did not exist. In this case, the summary analysis for the question is No agreement.
b) For the second function (defining service packages), nearly all respondents—with the exception of one district hospital—indicated that the function was centralized. Thus,
1 If you hold a small number of interviews—say, three or four within a particular region—you may want to use only three categories: High, Low, and None.

31
although there was not 100% agreement, all but one of the groups shared the perception that the function was centralized, and so it was coded as centralized.
3) You can summarize interviewees’ responses in the Summary row, directly beneath the codes for management level (that is, in the column on the left under the determining question), by entering a quick description. In the example above, the first question has the following summary statement: “Central level says all levels. RHA says regional. Two hospitals say national. Health Centers say facility. Others say targets do not exist.”
4) In the summary line below each question, click in the cell directly below the comments (that is, the right-hand column under the determining question) and choose one of four summary responses from the pull-down list: Centralized, Decentralized, No agreement, or Does not exist.
5) Color-code the summary responses to match the pie chart colors. Doing so will help you when you scan all questions within a functional area; you can see at a glance whether the groups had similar perceptions about who had responsibility or authority, as well as how centralized or decentralized the various functions are.2 The color scheme is as follows:
a) Levels of consensus: High: Green Moderate: Yellow Low: Orange None: Red
b) Whether a function is centralized or decentralized: Centralized: Pink Decentralized: Blue No agreement: Gray Does not exist: White
6) To change the color of a cell, click in the cell, look for the “paint can” icon on the formatting toolbar, click on the drop-down arrow immediately to the right of it, and choose the corresponding color from the drop-down menu that appears. See Figure 13. (You can also change the color from the Format, Cells dialog box. Click on the tab called Patterns and choose the color you need.)
2 Unfortunately, we could not automate this particular aspect of the tool. Excel does allow what is known as “conditional formatting,” but it works only for up to three different conditions. Since there are more than three choices here (Centralized, Decentralized, No agreement, and Does not exist), we could not build in this capability.
32
Figure 13: Choosing a color for a cell
7) Now that the cells have been color-coded, you can count the number of questions that fall
into each category described above. For example, there are nine questions in the Health Service Delivery functional area. As shown in Figure 14, the analysis produced the following results: one question in this functional area showed a High level of consensus about responsibility or authority, while six were coded as Moderate, one as Low, and one as None. For the second part of the analysis, there was a low level of agreement about whether the functions were centralized or decentralized; only two of the nine questions showed consistent responses and were coded as Centralized, while six questions were coded as No agreement and one was coded as Does not exist.
8) Enter the totals at the bottom of each summary page. The charts will be produced automatically. See Figure 14 for an example.
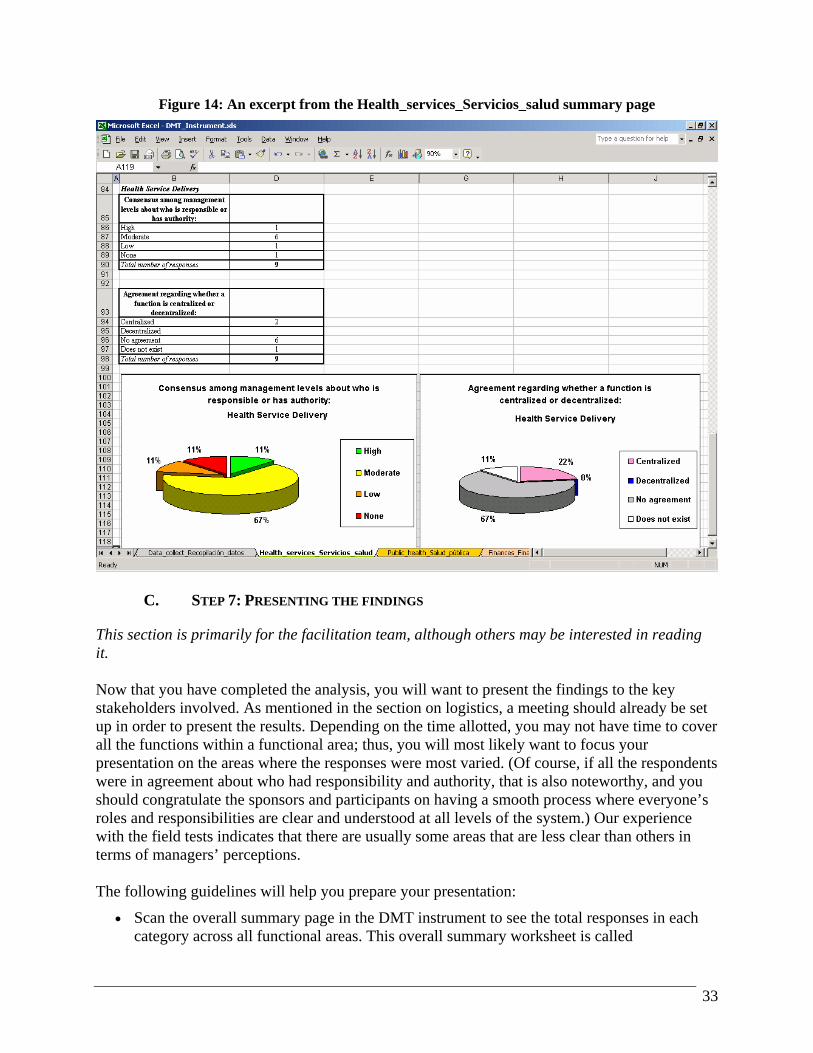
33
Figure 14: An excerpt from the Health_services_Servicios_salud summary page
C. STEP 7: PRESENTING THE FINDINGS
This section is primarily for the facilitation team, although others may be interested in reading it. Now that you have completed the analysis, you will want to present the findings to the key stakeholders involved. As mentioned in the section on logistics, a meeting should already be set up in order to present the results. Depending on the time allotted, you may not have time to cover all the functions within a functional area; thus, you will most likely want to focus your presentation on the areas where the responses were most varied. (Of course, if all the respondents were in agreement about who had responsibility and authority, that is also noteworthy, and you should congratulate the sponsors and participants on having a smooth process where everyone’s roles and responsibilities are clear and understood at all levels of the system.) Our experience with the field tests indicates that there are usually some areas that are less clear than others in terms of managers’ perceptions. The following guidelines will help you prepare your presentation:
• Scan the overall summary page in the DMT instrument to see the total responses in each category across all functional areas. This overall summary worksheet is called

34
Overall_summary_Resumen_global, and the charts there will give the stakeholders a broad view of the perceptions of those interviewed. You can start with this overall snapshot when you present detailed findings and then choose highlights to present from each functional area.
• Scan the summary page for each functional area, noting particular areas of high and low agreement.
• Note also the overall perception about whether functions are centralized or decentralized.
• Depending on the goals of the DMT exercise and the field methodology you chose, you may be comparing the perceptions of different management levels, different regions, or both. Your presentation should make clear which groups are being compared.
• You can copy the charts from the summary pages into a PowerPoint presentation and then supplement these visual displays with some short text, again highlighting areas of particular agreement or disagreement, as well as other findings that you want to bring to the attention of the key stakeholders. Some examples are shown below in Figures 15 and 16.
Figure 15: A sample slide from a summary presentation, showing the charts
Drugs, vaccines, and supplies
16 questions
Consensus among management levels about who is responsible or has authority:
31%
38%
0%31%
High
Moderate
Low
None
Drugs, Vaccines, and Supplies
Agreement regarding whether a function is centralized or decentralized:
31%
0%69%
0% Centralized
Decentralized
No agreement
Does not exist
Drugs, Vaccines, and Supplies

35
Figure 16: The corresponding short narrative to highlight specific findings
Highest overall consensus (31%)
No standard treatment protocols, except for a few vertical programs
No agreement on whether defining standard treatment protocols and verifying compliance are centralized or decentralized
Drugs, vaccines, and supplies
The following outline, based upon a recent MSH presentation, will help you structure your own presentation:
• Why develop DMT? (This section described the background and some basics on the decentralization process.)
• What does the DMT consist of? (This section contained a brief overview of the instrument itself.)
• Uses of the DMT (This section explained how managers can use the tool and apply the results.)
• Methodology of application (This section described the process outlined earlier in the Guide: holding guided interviews, collecting the data, and conducting the analysis.)
• Data analysis (This section briefly explained the two types of analysis: level of agreement about who is responsible or has authority, and consensus about whether a function is centralized or decentralized.)
• Results of the analysis in the country (The specific findings were presented here.)
• Next steps (This section described next steps in the development of the DMT; in your presentation, this section would cover the application of the tool.)
36
IV. Part III: Using the DMT findings to guide management decisions
A. STEP 8: TAKING ACTION
The DMT exercise has been completed, and the data analyzed and presented. What next? If the application of the DMT does not generate action to address the identified problems, the whole effort has been in vain. This section gives suggestions to decision-makers about how to determine what to address and how to take action. Who these decision-makers are depends on the issue concerned. The sponsors of the DMT analysis may be able to influence future action, either because they themselves have the appropriate powers or because they can act as catalysts. Other issues might more appropriately be decided by the high-level official at the central level in charge of the particular functional area or by managers at decentralized levels. The advice below is valid for all groups. In deciding how to respond to the DMT findings, you should first identify the functional areas and functions with least consensus. If you note, for example, that managers are reasonably clear about the way human resources are managed but confused about the management of financial resources, you should focus on the latter. When you examine individual functions, you may find that while the confusion in the financial resources functional area urgently needs attention, there are individual management functions in other functional areas where confusion about responsibility and authority is also acute. By writing down the functional areas and functions that need urgent action, you have prepared the first draft of your priority action list. Take a look at your list, and examine whether confusion in these functional areas and functions is more or less likely to impede service delivery. Those areas where confused roles and responsibilities are directly detrimental to the provision of services should rise to the top of your action list. Next, you must determine the reasons for the apparent role ambiguity. Does the confusion in responsibility and authority in particular functions come from a lack of clarity in the way that the roles were initially defined? Were the roles clearly defined but the definitions not properly communicated to managers who were expected to take them on? Or is the main reason for the confusion a persistent reluctance by managers either to relinquish their old roles or to accept new ones? These reasons demand very different actions in response, so it is important to be as clear as possible about the root causes. By taking action and evaluating whether your actions make a difference, you will help improve the decentralized management of your health system or organization. Of the many possible responses you could develop, you should focus your efforts on tackling the main causes of the problems. Roles may need to be defined better, if they were poorly delineated initially. New communication strategies may have to be developed and implemented to ensure that all managers are aware of their new roles. A management training program with a behavioral change component may be required to encourage managers’ transition to their roles. Guidelines may be necessary for certain management functions to ensure that all managers understand how they are supposed to be managed. This process will take time, and you may encounter resistance

37
to change.3 However, the effort that you invest will be well worth it in the longer term, as people are able to understand their new roles and how they contribute to improved health outcomes and better performance in the health sector.
3 You may want to refer to books or articles that focus specifically on change management to help you through this stage of the process.

V. Appendices

APPENDIX A: SAMPLES

40
1. Sample DMT worksheet (blank template)
Decentralization Mapping Tool Country: Organization/Institution:
Respondent(s):
Management Level: Date:
FUNCTION DETERMINING QUESTIONS
NA
TIO
NA
L
RE
GIO
NA
L
PR
OV
INC
IAL
FA
CIL
ITY
COMMENTS
FUNCTIONAL AREA: HEALTH SERVICE DELIVERY
S1. Defining health service targets
1. What management level sets health service targets for health programs and facilities?
S2. Defining service packages 1. What management level defines the minimum service package for each level of care?
S3. Defining the service network 1. What management level defines the types of health facilities and referral links in the health system?
1. What management level defines clinical standards, protocols and procedures?
S4. Defining and supervising clinical standards, protocols and procedures 2. What management level is responsible for ensuring compliance with
those standards, protocols and procedures?
S5. Monitoring health service provision
1. What management level is responsible for ensuring the achievement of health service targets?
1. What management level has the authority to outsource clinical and/or technical services?
2. What management level has the authority to outsource support services, such as laundry, security, etc.?
S6. Outsourcing services
3. What management level is responsible for ensuring contractual compliance by those who provide outsourced services?

41
FUNCTION DETERMINING QUESTIONS
NA
TIO
NA
L
RE
GIO
NA
L
PR
OV
INC
IAL
FA
CIL
ITY
COMMENTS
FUNCTIONAL AREA: PUBLIC HEALTH SURVEILLANCE AND RESPONSE
1. What management level is responsible for defining which diseases and syndromes are routinely monitored through the surveillance system?
2. What management level is responsible for examining the surveillance data for trends, and reporting findings?
3. What management level is responsible for collecting and integrating surveillance data from non-public providers (e.g. NGOs and private practitioners)?
R1. Defining and managing the surveillance system
4. What management level is responsible for taking action, if routine surveillance reports are not submitted on time or properly completed?
1. What management level is responsible for investigating and responding to an increase in infectious disease(s)?
2. What management level is responsible for investigating and responding to an increase in chronic disease(s)?
R2. Responding to epidemics
3. What management level is responsible for determining procedures and protocols for the management of disease outbreaks?
1. What management level is responsible for investigating, and organizing a response to health risks from substandard basic hygiene, water and sanitation?
2. What management level is responsible for investigating and organizing a response to health risks from environmental pollution (e.g., poor air quality, toxic waste, etc.)?
3. What management level is responsible for investigating and organizing a response to occupational health risks?
R3. Responding to risk factors
4. What management level is responsible for investigating and organizing a response to risks for accidental deaths and injuries (e.g., from automobile accidents)?
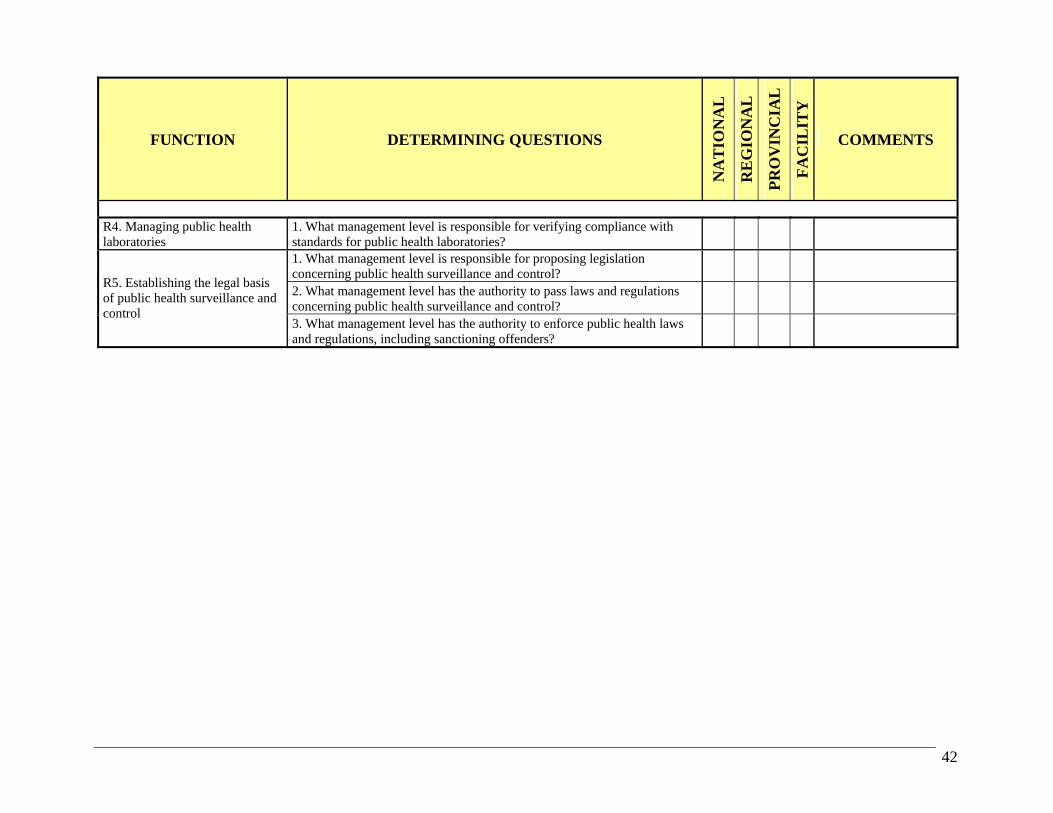
42
FUNCTION DETERMINING QUESTIONS
NA
TIO
NA
L
RE
GIO
NA
L
PR
OV
INC
IAL
FA
CIL
ITY
COMMENTS
R4. Managing public health laboratories
1. What management level is responsible for verifying compliance with standards for public health laboratories?
1. What management level is responsible for proposing legislation concerning public health surveillance and control?
2. What management level has the authority to pass laws and regulations concerning public health surveillance and control?
R5. Establishing the legal basis of public health surveillance and control
3. What management level has the authority to enforce public health laws and regulations, including sanctioning offenders?
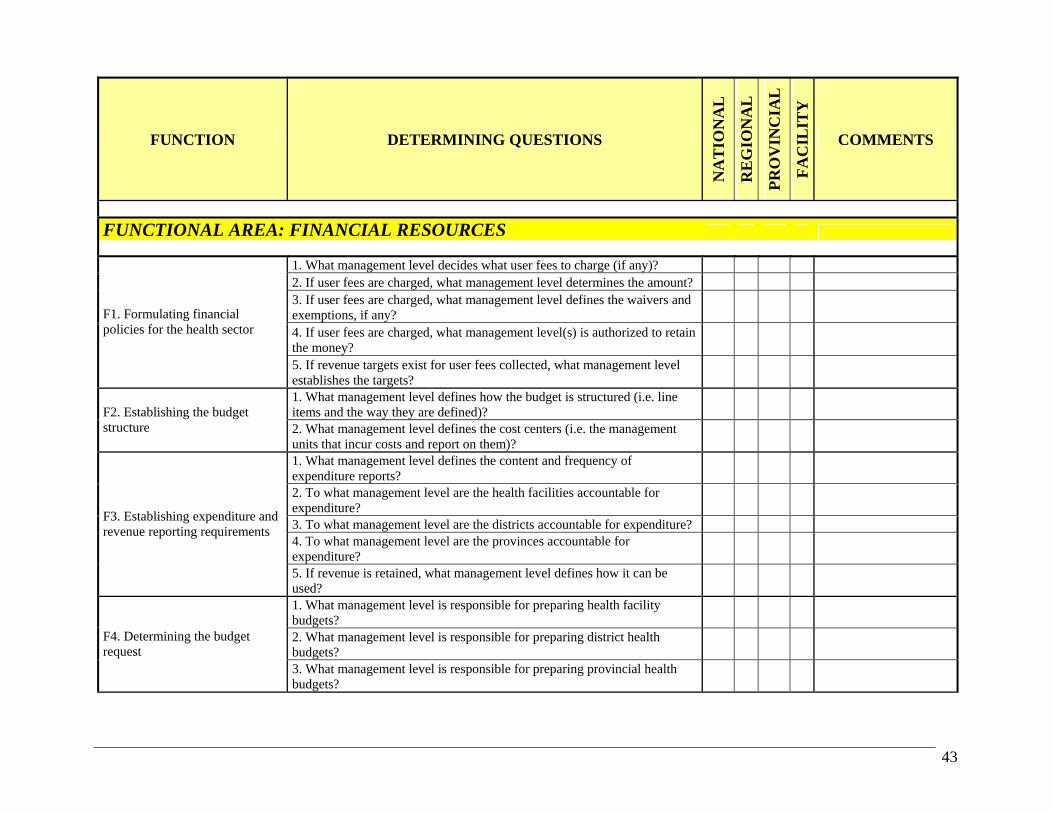
43
FUNCTION DETERMINING QUESTIONS
NA
TIO
NA
L
RE
GIO
NA
L
PR
OV
INC
IAL
FA
CIL
ITY
COMMENTS
FUNCTIONAL AREA: FINANCIAL RESOURCES
1. What management level decides what user fees to charge (if any)? 2. If user fees are charged, what management level determines the amount? 3. If user fees are charged, what management level defines the waivers and exemptions, if any?
4. If user fees are charged, what management level(s) is authorized to retain the money?
F1. Formulating financial policies for the health sector
5. If revenue targets exist for user fees collected, what management level establishes the targets?
1. What management level defines how the budget is structured (i.e. line items and the way they are defined)?
F2. Establishing the budget structure 2. What management level defines the cost centers (i.e. the management
units that incur costs and report on them)?
1. What management level defines the content and frequency of expenditure reports?
2. To what management level are the health facilities accountable for expenditure?
3. To what management level are the districts accountable for expenditure? 4. To what management level are the provinces accountable for expenditure?
F3. Establishing expenditure and revenue reporting requirements
5. If revenue is retained, what management level defines how it can be used?
1. What management level is responsible for preparing health facility budgets?
2. What management level is responsible for preparing district health budgets?
F4. Determining the budget request
3. What management level is responsible for preparing provincial health budgets?

44
FUNCTION DETERMINING QUESTIONS
NA
TIO
NA
L
RE
GIO
NA
L
PR
OV
INC
IAL
FA
CIL
ITY
COMMENTS
1. What management level has the final say on the amount of budgeted funds that health facilities actually receive?
2. What management level has the final say on the amount of budgeted funds that districts actually receive?
3. What management level has the final say on the amount of budgeted funds that provinces actually receive?
F5. Obtaining budgeted funds
4. What management level determines what can be done with unspent funds?
1. To what management level are health facilities accountable for managing their budgets?
2. To what management level are districts accountable for managing their budgets?
3. To what management level are provinces accountable for managing their budgets?
4. What management level has the authority to re-program (veer) budget lines?
5. What management level sets petty cash limits and/or imprest account limits for health facilities?
6. What management level sets petty cash limits and/or imprest account limits for the district health office?
F6. Managing the budget
7. What management level sets petty cash limits and/or imprest account limits for the provincial health office?

45
FUNCTION DETERMINING QUESTIONS
NA
TIO
NA
L
RE
GIO
NA
L
PR
OV
INC
IAL
FA
CIL
ITY
COMMENTS
FUNCTIONAL AREA: PERSONNEL
1. What management level is responsible for formulating personnel policy (e.g., policy on hiring, firing, compensation, etc.)?
P1. Formulating personnel policy and planning
2. What management level authorizes the creation of new posts? 1. What management level authorizes filling an open post for professional staff?
2. What management level decides who will be selected for this post? 3. What management level has the authority to formally hire the person? 4. What management level has the authority to fire an employee?
P2. Hiring, firing and transfer of professional staff (e.g., doctors, nurses, accountants, etc.)
5. What management level has the authority to approve staff transfers between management levels (e.g. from a district to a province or from one province to another)?
1. What management level authorizes filling an open post for other staff? 2. What management level decides who will be selected for this post? 3. What management level has the authority to formally hire the person? 4. What management level has the authority to fire an employee?
P3. Hiring, firing and transfer of other staff
5. What management level has the authority to approve staff transfers between management levels (e.g. from a district to a province or from one province to another)?
1. What management level has the authority to make changes in the compensation system (e.g. levels of pay, salary scales, etc.)?
2. What management level is responsible for defining retirement benefits? P4. Establishing compensation and incentive packages
3. What management level has the authority to define and establish a financial incentives package for employees?
1. If salary scales exist for a post, what management level has the authority to determine at what point on the scale a new employee will be paid?
2. If a financial incentives package exists, what management level has the authority to award it to an employee?
P5. Paying salaries and incentives
3. What management level has the authority to negotiate with labor unions over salaries and incentives?

46
FUNCTION DETERMINING QUESTIONS
NA
TIO
NA
L
RE
GIO
NA
L
PR
OV
INC
IAL
FA
CIL
ITY
COMMENTS
1. What management level defines the disciplinary measures that can be used to discipline professional staff?
P6. Managing disciplinary procedures for professional staff 2. What management level has the authority to apply such measures to
professional staff?
1. What management level defines the disciplinary measures that can be used to discipline other staff?
P7. Managing disciplinary procedures for other staff 2. What management level has the authority to apply such measures to
other staff?
1. What management level is responsible for providing legal support to employees in cases of alleged negligence or malpractice?
P8. Legal protection
2. What management level has the authority to represent the institution in the event of a labor-related lawsuit?
P9. Administering routine personnel matters
1. What management level authorizes sick leave or leave for personal reasons?
1. What management level defines the system used to evaluate staff performance?
2. What management level is responsible for carrying out performance evaluation of staff?
P10. Evaluating employee performance
3. What management level is responsible for responding to the findings of the performance evaluation?
1. What management level is responsible for carrying out a formal evaluation of personnel training needs?
2. What management level is responsible for arranging training for the employees?
P11. Developing personnel (career development and training)
3. What management level authorizes leave for training purposes? 1. What management level is responsible for conducting a formal assessment of employee satisfaction?
P12. Managing employee motivation 2. Following the assessment, what management level is responsible for
preparing an action plan to improve employee satisfaction?
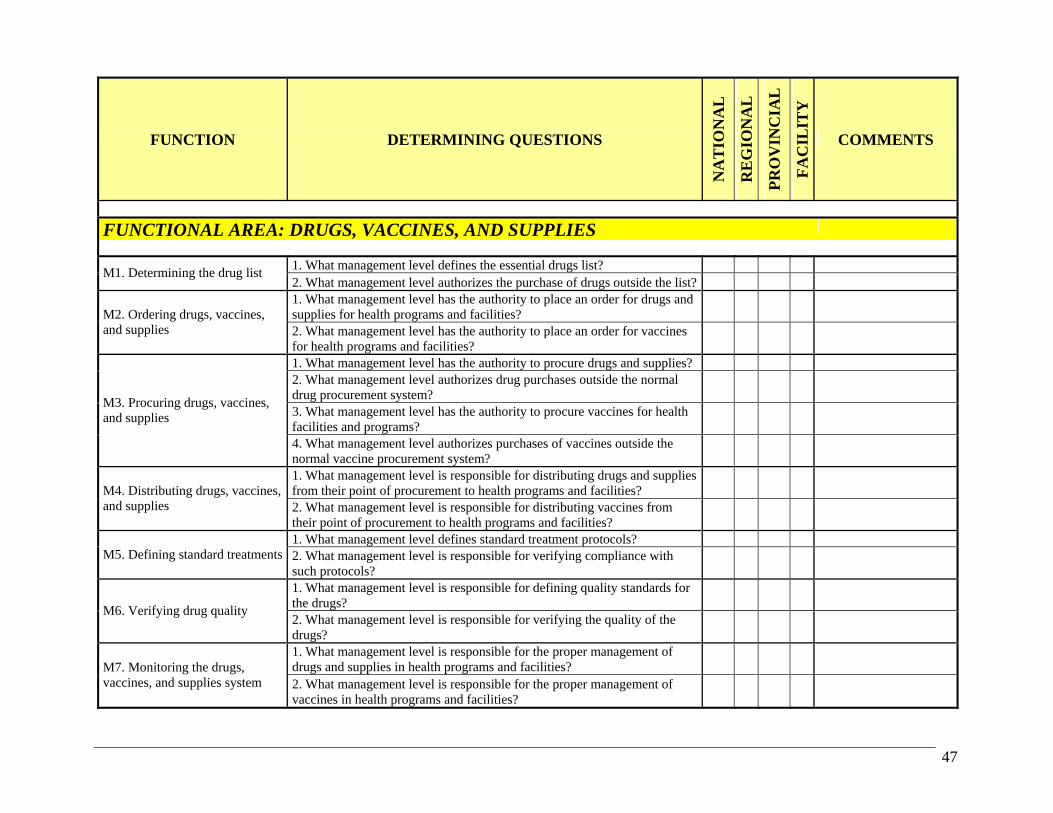
47
FUNCTION DETERMINING QUESTIONS
NA
TIO
NA
L
RE
GIO
NA
L
PR
OV
INC
IAL
FA
CIL
ITY
COMMENTS
FUNCTIONAL AREA: DRUGS, VACCINES, AND SUPPLIES
1. What management level defines the essential drugs list?
M1. Determining the drug list 2. What management level authorizes the purchase of drugs outside the list? 1. What management level has the authority to place an order for drugs and supplies for health programs and facilities?
M2. Ordering drugs, vaccines, and supplies 2. What management level has the authority to place an order for vaccines
for health programs and facilities?
1. What management level has the authority to procure drugs and supplies? 2. What management level authorizes drug purchases outside the normal drug procurement system?
3. What management level has the authority to procure vaccines for health facilities and programs?
M3. Procuring drugs, vaccines, and supplies
4. What management level authorizes purchases of vaccines outside the normal vaccine procurement system?
1. What management level is responsible for distributing drugs and supplies from their point of procurement to health programs and facilities?
M4. Distributing drugs, vaccines, and supplies 2. What management level is responsible for distributing vaccines from
their point of procurement to health programs and facilities?
1. What management level defines standard treatment protocols? M5. Defining standard treatments 2. What management level is responsible for verifying compliance with
such protocols?
1. What management level is responsible for defining quality standards for the drugs?
M6. Verifying drug quality
2. What management level is responsible for verifying the quality of the drugs?
1. What management level is responsible for the proper management of drugs and supplies in health programs and facilities?
M7. Monitoring the drugs, vaccines, and supplies system 2. What management level is responsible for the proper management of
vaccines in health programs and facilities?
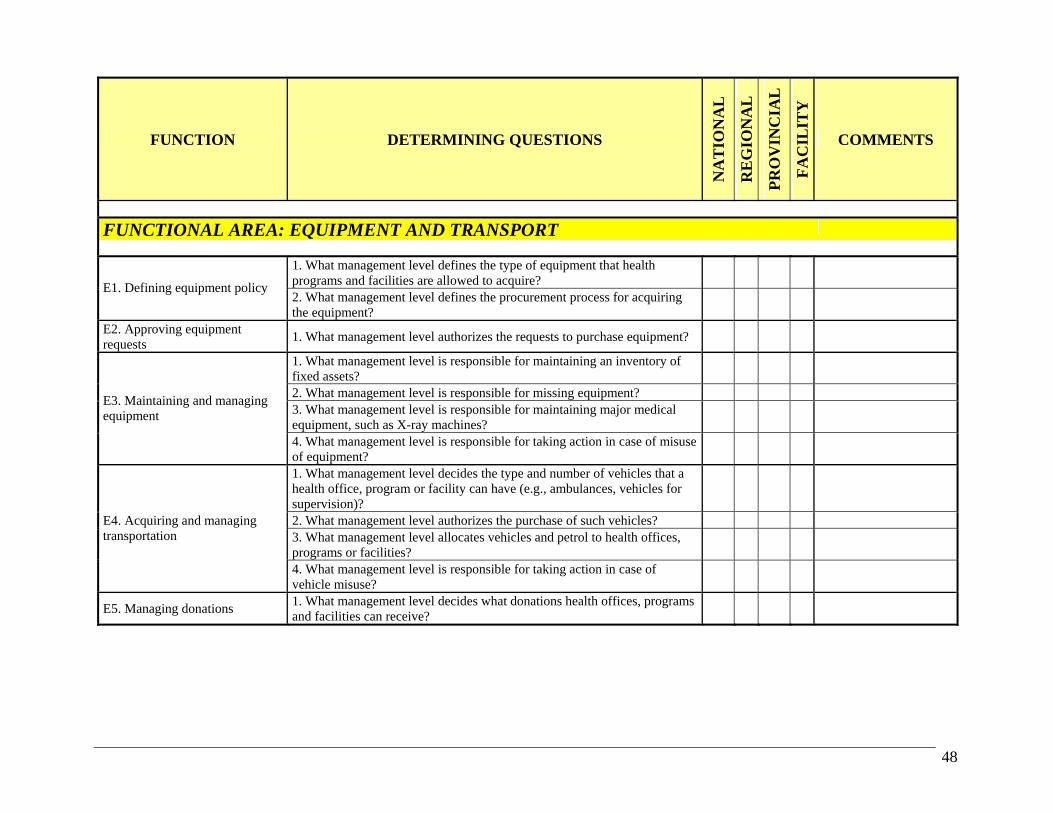
48
FUNCTION DETERMINING QUESTIONS
NA
TIO
NA
L
RE
GIO
NA
L
PR
OV
INC
IAL
FA
CIL
ITY
COMMENTS
FUNCTIONAL AREA: EQUIPMENT AND TRANSPORT
1. What management level defines the type of equipment that health programs and facilities are allowed to acquire?
E1. Defining equipment policy
2. What management level defines the procurement process for acquiring the equipment?
E2. Approving equipment requests
1. What management level authorizes the requests to purchase equipment?
1. What management level is responsible for maintaining an inventory of fixed assets?
2. What management level is responsible for missing equipment? 3. What management level is responsible for maintaining major medical equipment, such as X-ray machines?
E3. Maintaining and managing equipment
4. What management level is responsible for taking action in case of misuse of equipment?
1. What management level decides the type and number of vehicles that a health office, program or facility can have (e.g., ambulances, vehicles for supervision)?
2. What management level authorizes the purchase of such vehicles? 3. What management level allocates vehicles and petrol to health offices, programs or facilities?
E4. Acquiring and managing transportation
4. What management level is responsible for taking action in case of vehicle misuse?
E5. Managing donations 1. What management level decides what donations health offices, programs and facilities can receive?
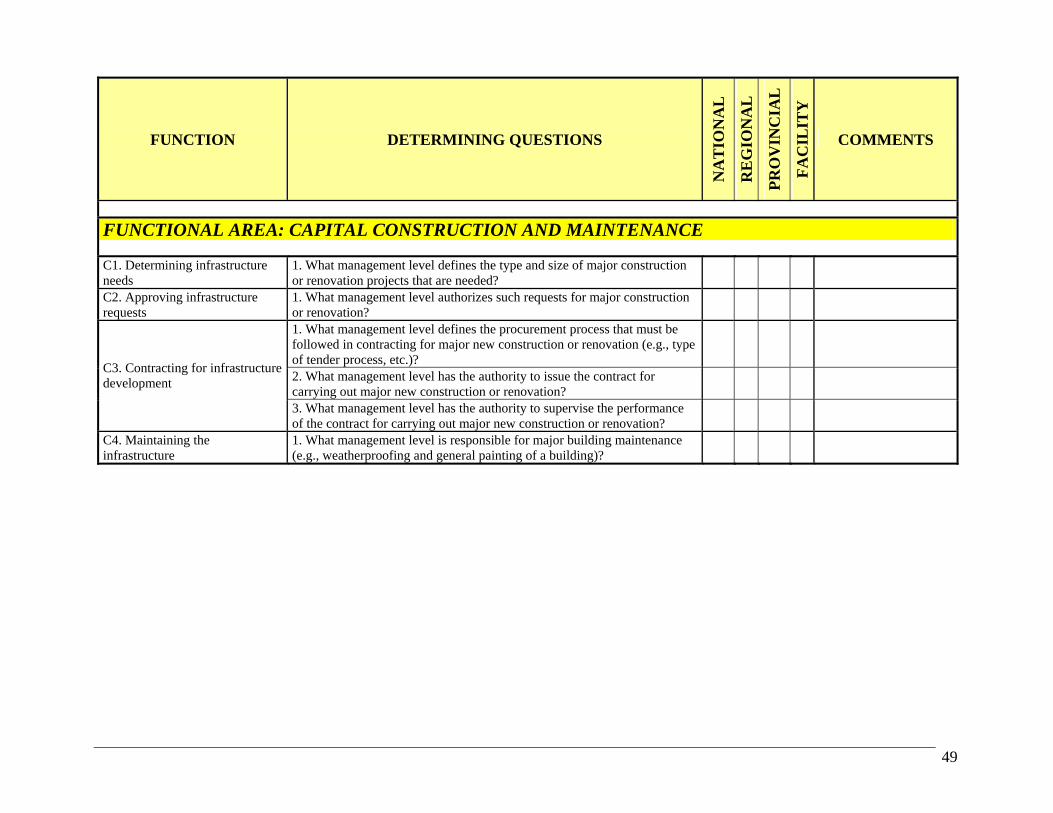
49
FUNCTION DETERMINING QUESTIONS
NA
TIO
NA
L
RE
GIO
NA
L
PR
OV
INC
IAL
FA
CIL
ITY
COMMENTS
FUNCTIONAL AREA: CAPITAL CONSTRUCTION AND MAINTENANCE C1. Determining infrastructure needs
1. What management level defines the type and size of major construction or renovation projects that are needed?
C2. Approving infrastructure requests
1. What management level authorizes such requests for major construction or renovation?
1. What management level defines the procurement process that must be followed in contracting for major new construction or renovation (e.g., type of tender process, etc.)?
2. What management level has the authority to issue the contract for carrying out major new construction or renovation?
C3. Contracting for infrastructure development
3. What management level has the authority to supervise the performance of the contract for carrying out major new construction or renovation?
C4. Maintaining the infrastructure
1. What management level is responsible for major building maintenance (e.g., weatherproofing and general painting of a building)?

50
FUNCTION DETERMINING QUESTIONS
NA
TIO
NA
L
RE
GIO
NA
L
PR
OV
INC
IAL
FA
CIL
ITY
COMMENTS
FUNCTIONAL AREA: HEALTH AND MANAGEMENT INFORMATION
1. What management level defines the type of data that the health and management information systems collect?
2. What management level determines changes that are needed in data collection forms, data flow and reporting frequency?
3. What management level authorizes these changes to be made?
I1. Designing the health and management information systems
4. What management level authorizes the purchase of computer hardware and software for the information systems?
1. What management level is responsible for consolidating and analyzing the data?
I2. Using health and management information 2. What management level is responsible for interpreting the data, and
providing feedback to the reporting level (with recommendations for action)?
1. What management level is responsible for ensuring that the collected information is complete, valid and timely?
I3. Maintaining the health and management information systems 2. What management level is responsible for ensuring the continuous
functioning of the health and management information systems?
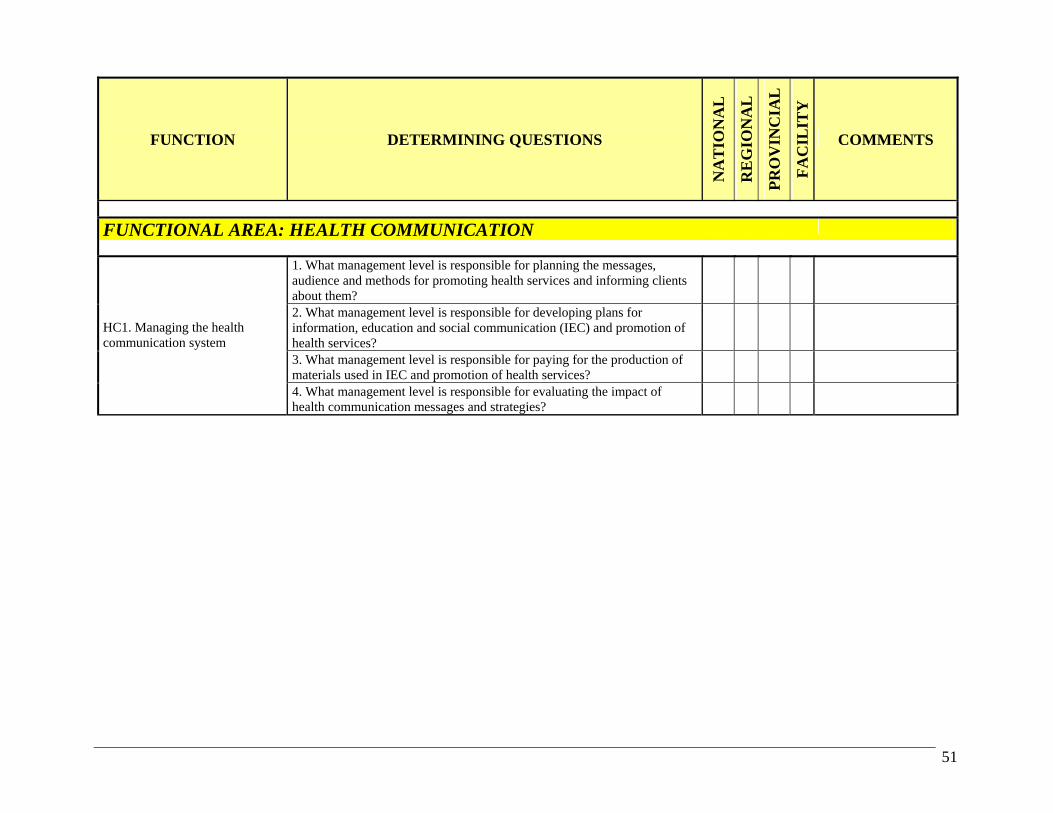
51
FUNCTION DETERMINING QUESTIONS
NA
TIO
NA
L
RE
GIO
NA
L
PR
OV
INC
IAL
FA
CIL
ITY
COMMENTS
FUNCTIONAL AREA: HEALTH COMMUNICATION
1. What management level is responsible for planning the messages, audience and methods for promoting health services and informing clients about them?
2. What management level is responsible for developing plans for information, education and social communication (IEC) and promotion of health services?
3. What management level is responsible for paying for the production of materials used in IEC and promotion of health services?
HC1. Managing the health communication system
4. What management level is responsible for evaluating the impact of health communication messages and strategies?

52
2. Sample DMT worksheet (filled)

53
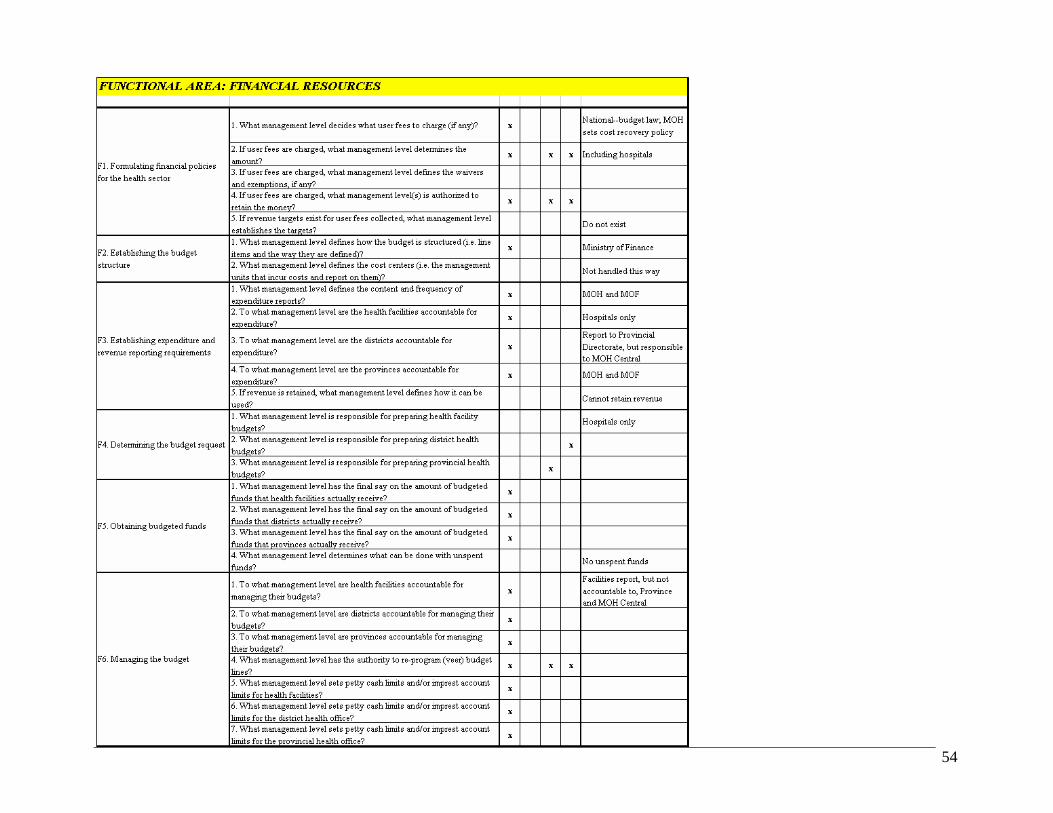
54
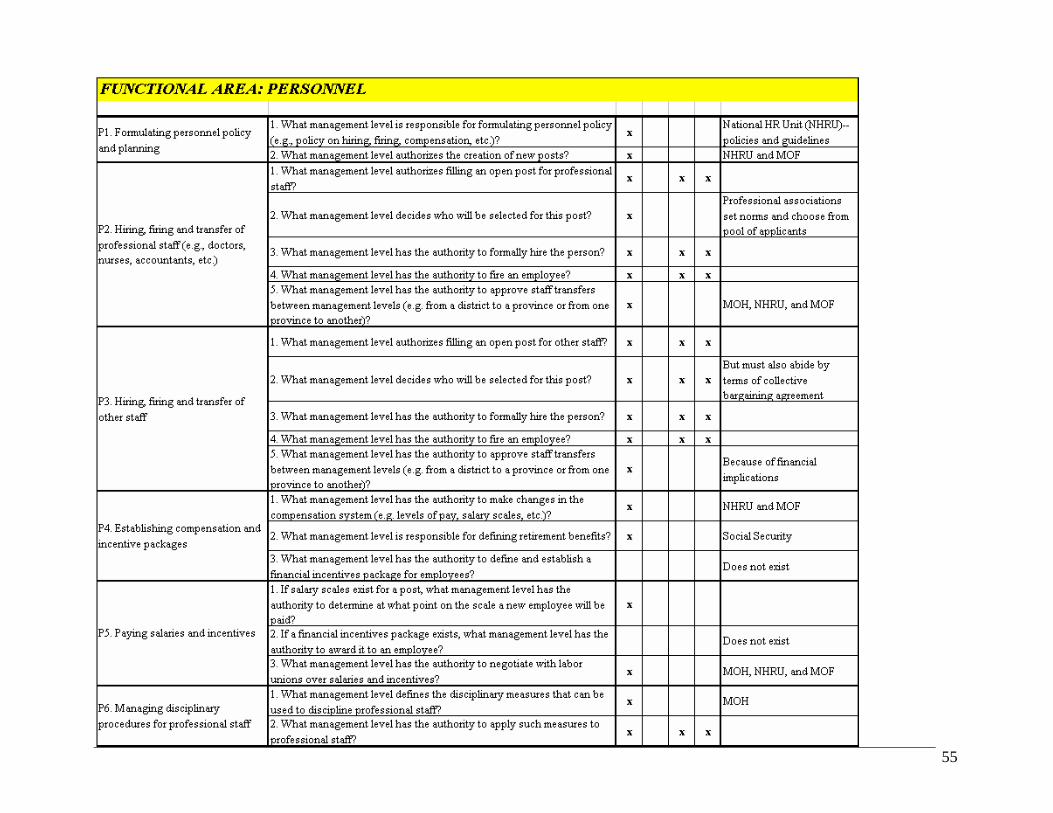
55

56
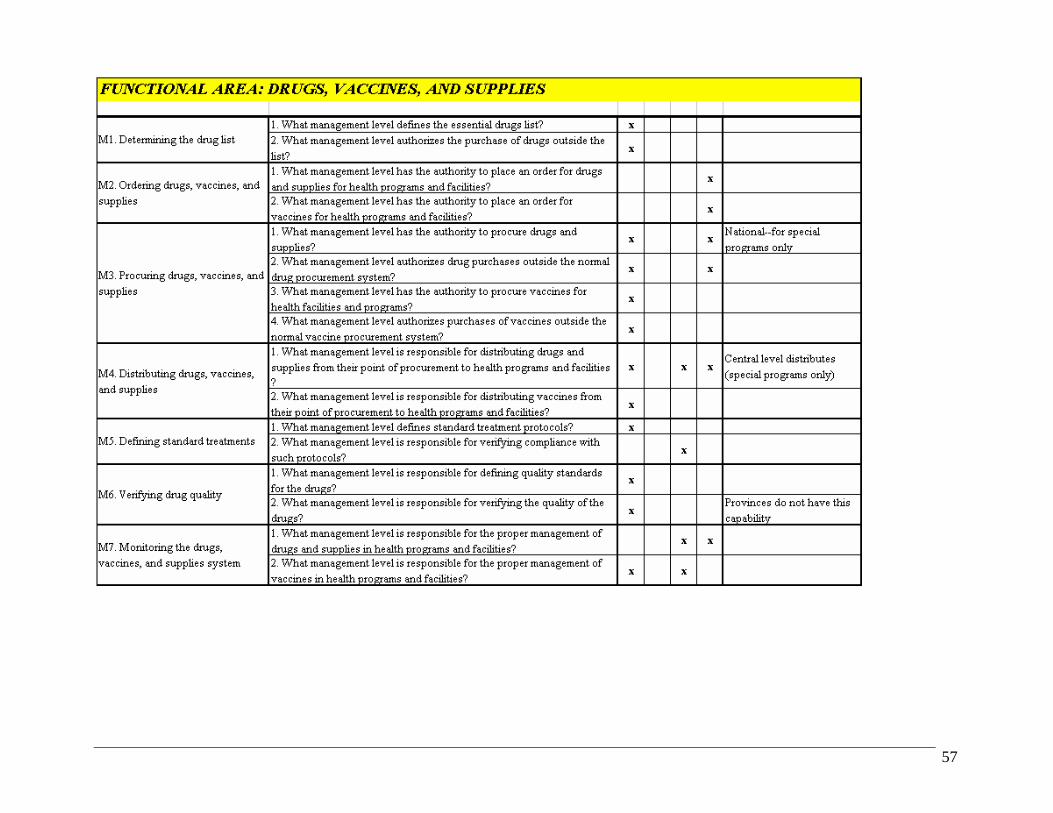
57
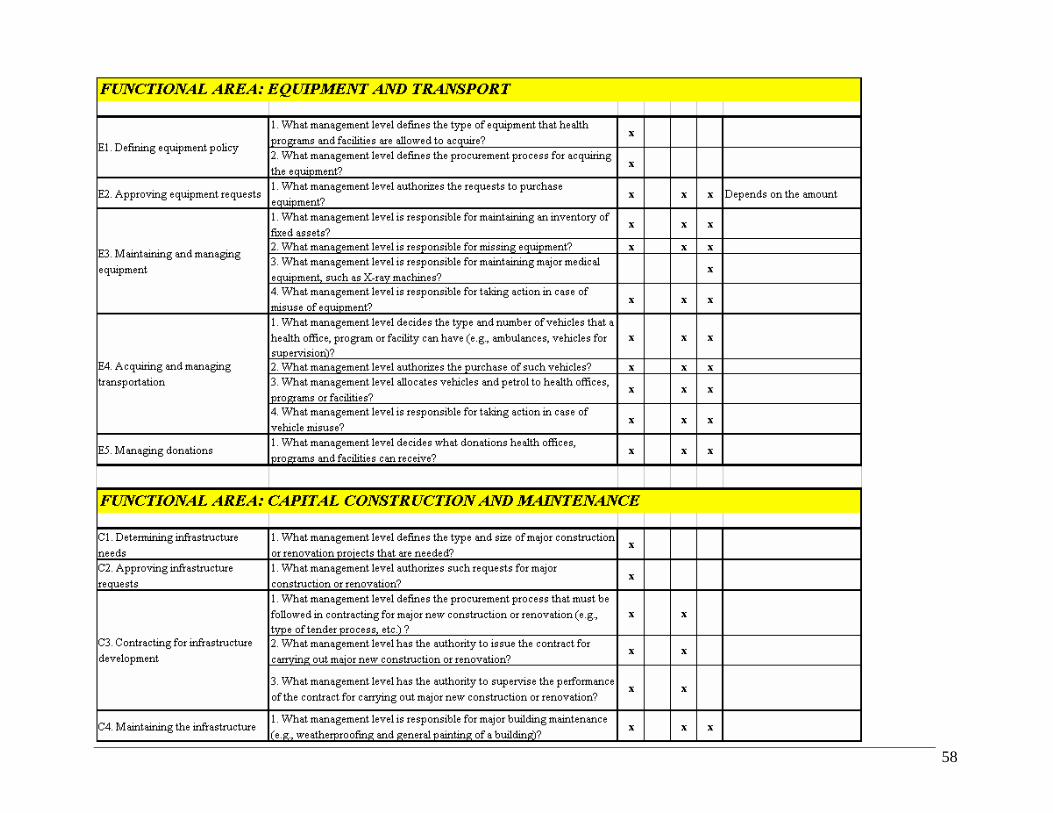
58

59

60
3. Sample DMT analysis (partial)

61
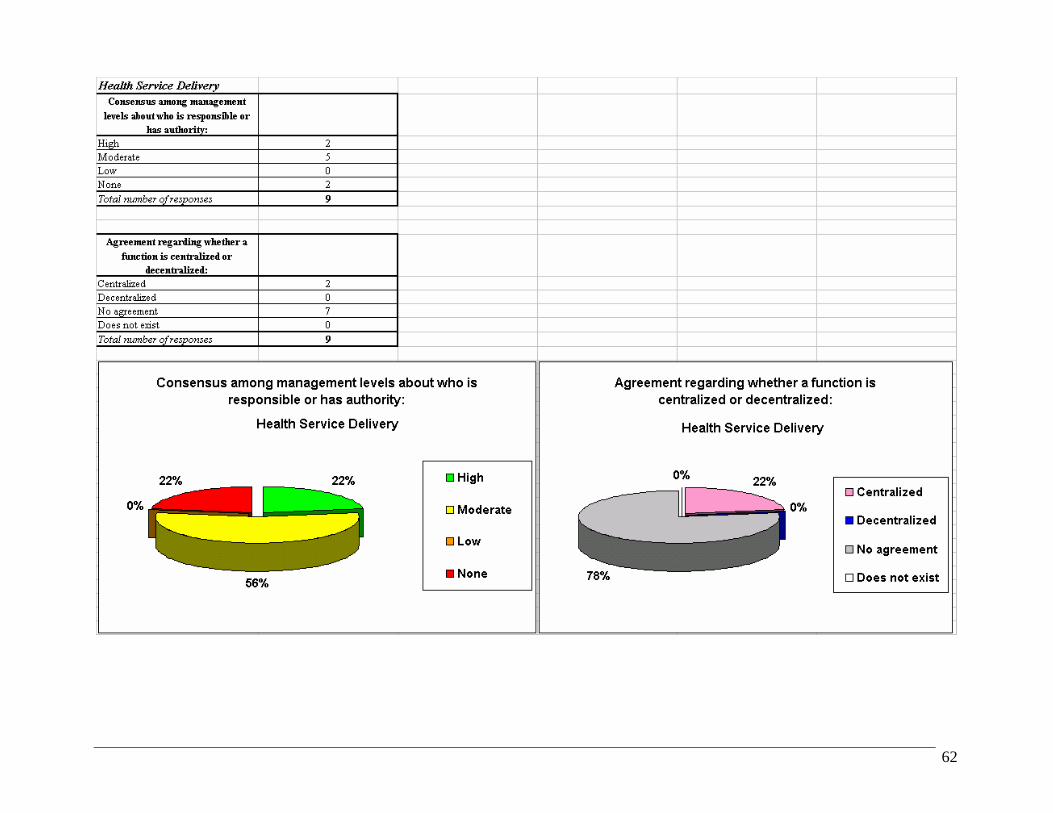
62

63

64
4. Sample DMT presentation of findings
The Decentralization Mapping Tool (DMT)
Why develop DMT? What does the DMT consist of?Objectives of DMTMethodology of applicationResults of field trialNext steps
Presentation outline

65
Why develop DMT?
Important part of health sector reformLacks a clear definitionDifferent modes with different management implicationsConfusion of roles common
Decentralization:
A s imple tool is needed to a s sess hea lth managers ’ unders tanding of
where new mana gement respons ibilities reside.
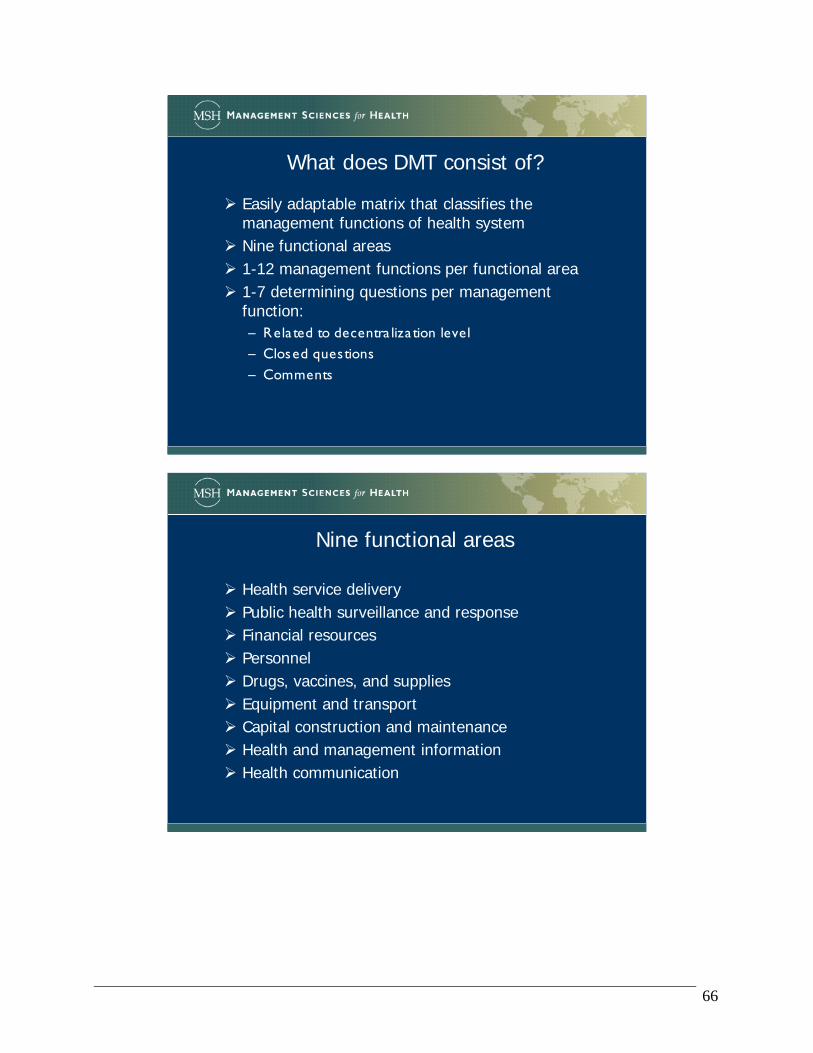
66
What does DMT consist of?
Easily adaptable matrix that classifies the management functions of health systemNine functional areas 1-12 management functions per functional area1-7 determining questions per management function:– Rela ted to decentra liza tion level– Closed questions– Comments
Nine functional areas
Health service deliveryPublic health surveillance and responseFinancial resourcesPersonnelDrugs, vaccines, and suppliesEquipment and transportCapital construction and maintenanceHealth and management informationHealth communication

67
FUNCTION DETERMINING QUESTIONS
NA
TIO
NA
L
RE
GIO
NA
L
PR
OV
INC
IAL
FA
CIL
ITY
COMMENTS
FUNCTIONAL AREA: HEALTH SERVICE DELIVERY
S1. Defining health service targets1. What management level sets health service targets for health programs and facilities?
S2. Defining service packages1. What management level defines the minimum service package for each level of care?
S3. Defining the service network1. What management level defines the types of health facilities and referral links in the health system?1. What management level defines clinical standards, protocols and procedures?2. What management level is responsible for ensuring compliance with those standards, protocols and procedures?
S5. Monitoring health service provision
1. What management level is responsible for ensuring the achievement of health service targets?1. What management level has the authority to outsource clinical and/or technical services?2. What management level has the authority to outsource support services, such as laundry, security, etc.?3. What management level is responsible for ensuring contractual compliance by those who provide outsourced services?
S4. Defining and supervising clinical standards, protocols and procedures
S6. Outsourcing services
Objectives of DMT
Assess if every management level has the same understanding of distribution of management responsibility between levels
Compare perceptions at various levels about distribution of responsibilities with the decentralization design
Compare managers’ understanding at different points in time
Practical tool to:

68
Interviews:– MOH (centra l level)– P rovincia l Hea lth Authority– Hea lth Area / Municipa lity
Analysis and report:– Deg ree of consensus among the manag ement
levels– Opinion about whether functions a re centra lized or
decentra lized
Methodology
Management Level (Reporting Level)
1. What management level defines the essential drugs list?
MOH--Central N
Provincial Health Authority (Southern Region)
N MOH
Local Health Areas (Northern Region) N MOH
Summary All say national. Centralized
Management Level (Reporting Level)
1. What management level has the authority to place an order for drugs and supplies for health programs and facilities?
MOH--Central A
Provincial Health Authority (Southern Region)
A Hospitals also have this authority
Local Health Areas (Northern Region) N, P, A
SummaryMOH and PHA say Area.
Area says all levels.Decentralized

69
Analysis of findings
All functional areas
Number of questions: 129
Consensus among management levels about who is responsible or has authority:
34%0%
37%29%
High
Moderate
Low
None
Overall Summary
Agreement regarding whether a function is centralized or decentralized:
18%
16%
61%
5%Centralized
Decentralized
No agreement
Does not exist
Overall Summary

70
Health service deliveryNumber of questions: 9
Consensus among management levels about who is responsible or has authority:
56%
0%
22% 22% High
Moderate
Low
None
Health Service Delivery
Agreement regarding whether a function is centralized or decentralized:
22%
0%
78%
0%Centralized
Decentralized
No agreement
Does not exist
Health Service Delivery
Health service delivery
Moderate level of consensus
– Consensus among a ll g roups reg a rding respons ibility for defining ba s ic packag e, a s well a s norms and protocols
– No consensus about respons ibility for ensuring a chievement of ta rg ets
No function was perceived by all groups as being decentralized
High level of confusion about degree of decentralization (78% of the questions)

71
Public health surveillance and responseNumber of questions: 15
Consensus among management levels about who is responsible or has authority:
60%0%
33%7% High
Moderate
Low
None
Public Health Surveillance and Response
Agreement regarding whether a function is centralized or decentralized:
7% 0%
93%
0%Centralized
Decentralized
No agreement
Does not exist
Public Health Surveillance and Response
Public health surveillance and response
Only one question had complete consensus: Authority to pass laws and regulations concerning public health surveillance and response
Low level of consensus regarding response to epidemics and risk factors
No function was perceived by all groups as being decentralized
High level of confusion about degree of decentralization (93% of the questions)

72
Financial resourcesNumber of questions: 26
Consensus among management levels about who is responsible or has authority:
4%0%
46%
50%
High
Moderate
Low
None
Financial Resources
Agreement regarding whether a function is centralized or decentralized:
19%
23%50%
8%Centralized
Decentralized
No agreement
Does not exist
Financial Resources
Financial resources
Establishing expenditure and revenue reporting requirements is a highly centralized function
In contrast, determining the budget request is a completely decentralized function
The answer to a number of questions was “This function does not exist” (8% of the questions)

73
Personnel
Number of questions: 33
Consensus among management levels about who is responsible or has authority:
30%0%
40%30%
High
Moderate
Low
None
PersonnelAgreement regarding whether a function is
centralized or decentralized:
18%
27%43%
12%Centralized
Decentralized
No agreement
Does not exist
Personnel
Personnel
High level of consensus regarding certain centralized functions (e.g., personnel policy formulation and establishment of compensation packages)
Much less consensus about the functions perceived as decentralized
The second most decentralized functional area, after Management and Health Information (27% of the questions)
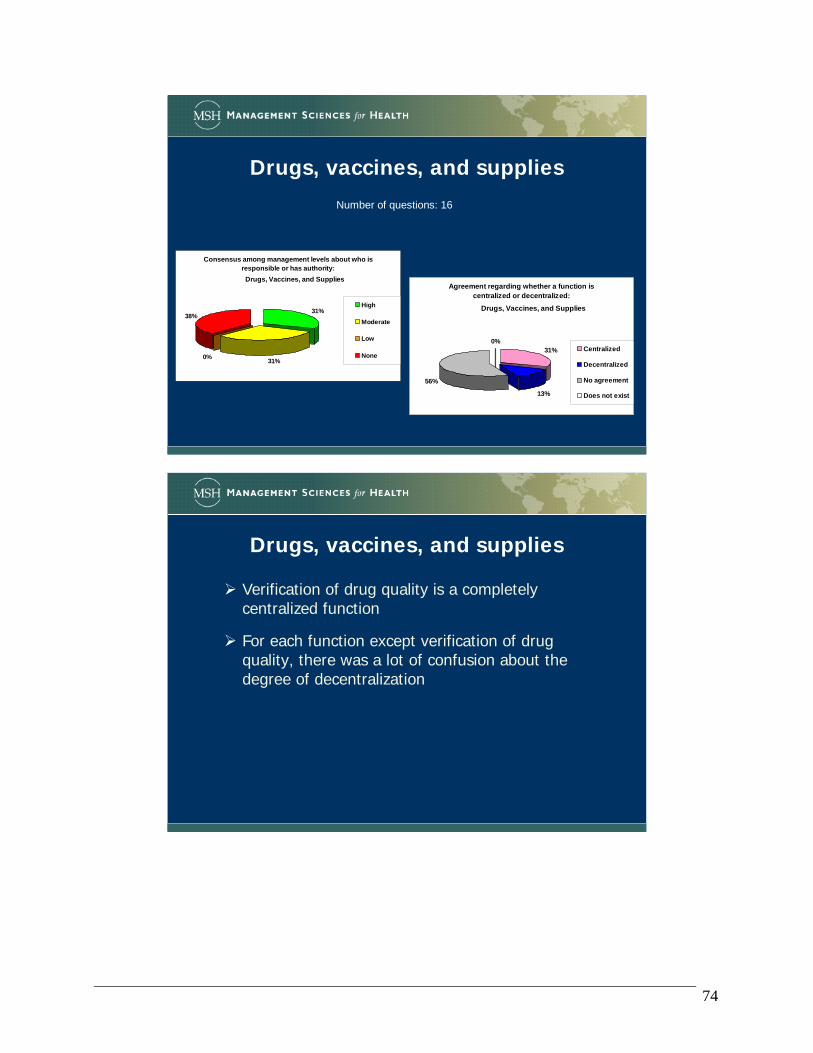
74
Drugs, vaccines, and supplies
Number of questions: 16
Consensus among management levels about who is responsible or has authority:
31%0%
38%31%
High
Moderate
Low
None
Drugs, Vaccines, and SuppliesAgreement regarding whether a function is
centralized or decentralized:
31%
13%
56%
0%Centralized
Decentralized
No agreement
Does not exist
Drugs, Vaccines, and Supplies
Drugs, vaccines, and supplies
Verification of drug quality is a completely centralized function
For each function except verification of drug quality, there was a lot of confusion about the degree of decentralization

75
Equipment and transportNumber of questions: 12
Consensus among management levels about who is responsible or has authority:
41%0%
42%
17% High
Moderate
Low
None
Equipment and TransportAgreement regarding whether a function is
centralized or decentralized:
8%8%
84%
0%Centralized
Decentralized
No agreement
Does not exist
Equipment and Transport
Equipment and transport
Complete consensus that definition of the procurement process for equipment is centralized
There is also complete consensus that the responsibility for maintaining major medical equipment is decentralized
Nevertheless, in general there is a high level of confusion about the degree of decentralization(84% of the questions)
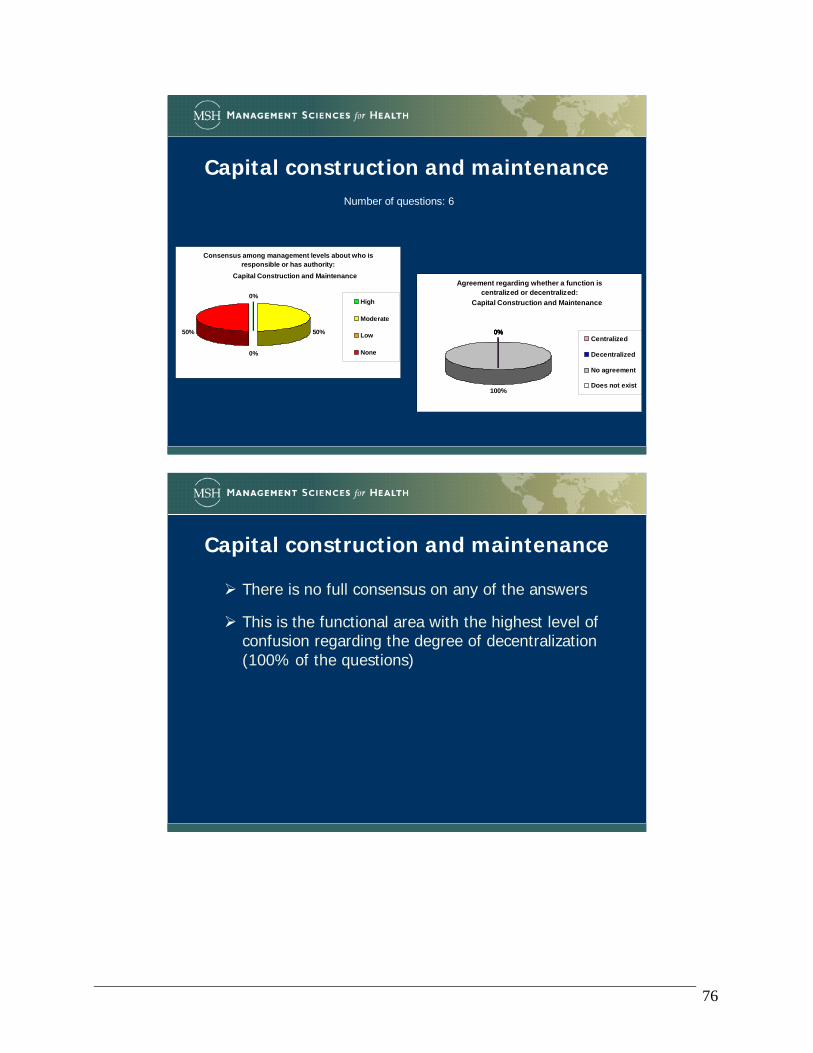
76
Capital construction and maintenanceNumber of questions: 6
Consensus among management levels about who is responsible or has authority:
50%
0%
50%
0%High
Moderate
Low
None
Capital Construction and MaintenanceAgreement regarding whether a function is
centralized or decentralized:
0%0%
100%
0%Centralized
Decentralized
No agreement
Does not exist
Capital Construction and Maintenance
Capital construction and maintenance
There is no full consensus on any of the answers
This is the functional area with the highest level of confusion regarding the degree of decentralization (100% of the questions)

77
Health and management information
Number of questions: 8
Consensus among management levels about who is responsible or has authority:
25%
0% 13%
62%
High
Moderate
Low
None
Health and Management Information
Agreement regarding whether a function is centralized or decentralized:
37%
38%
25%0%
Centralized
Decentralized
No agreement
Does not exist
Health and Management Information
Health and management information
Highest level of full consensus (62% of the questions)
Functional area with the greatest quantity of centralized functions (38% of the questions)
Interestingly, also the functional area with the greatest quantity of decentralized functions (38% of the questions)

78
Health communication
Number of questions: 4
Consensus among management levels about who is responsible or has authority:
100%
0%0%0%High
Moderate
Low
None
Health CommunicationAgreement regarding whether a function is
centralized or decentralized:
0%0%
100%
0%Centralized
Decentralized
No agreement
Does not exist
Health Communication
Health communication
Moderate level of consensus for all the determining questions
Total confusion about degree of decentralization (100% of the questions)
79
APPENDIX B: MAKING ADAPTATIONS TO THE DMT
1. Modifying the DMT for a specific purpose • Example: Adapting the DMT in Nicaragua
Our colleagues at the Ministry of Health (in Spanish, Ministerio de Salud, or MINSA) in Nicaragua made various adaptations to the DMT. They are in the midst of a reorganization process; instead of functional areas, they have defined 11 “organizational systems” within the Ministry. In addition, they wanted to measure opinions and perceptions—not only the current situation, but also the “desired situation” in the future. Therefore, the MINSA team made the following changes: Arranged the functions and determining questions by organizational system, not functional
area. For each organizational system, added an “Affirmations” section with an ideal vision, in order
to measure how closely they are meeting the ideal. In the Determining Questions section, included additional columns to note the responses
corresponding to “desired situation” as well as “current situation.” Instead of group interviews, the team handed out a copy of the questionnaire to each
participant and collected individual responses. The questionnaire asked for some identifying information: date, profession, and job title (in order to facilitate subsequent analysis by region, profession, or job classification).
The data analysis also incorporated some new elements; for example, the team prepared some histograms to show the frequency of responses for each group of affirmations. Some examples of these changes are shown below. Please note that all of the data screens are in Spanish; however, the general layout will give you some ideas of how you might adapt the DMT for your own circumstances.
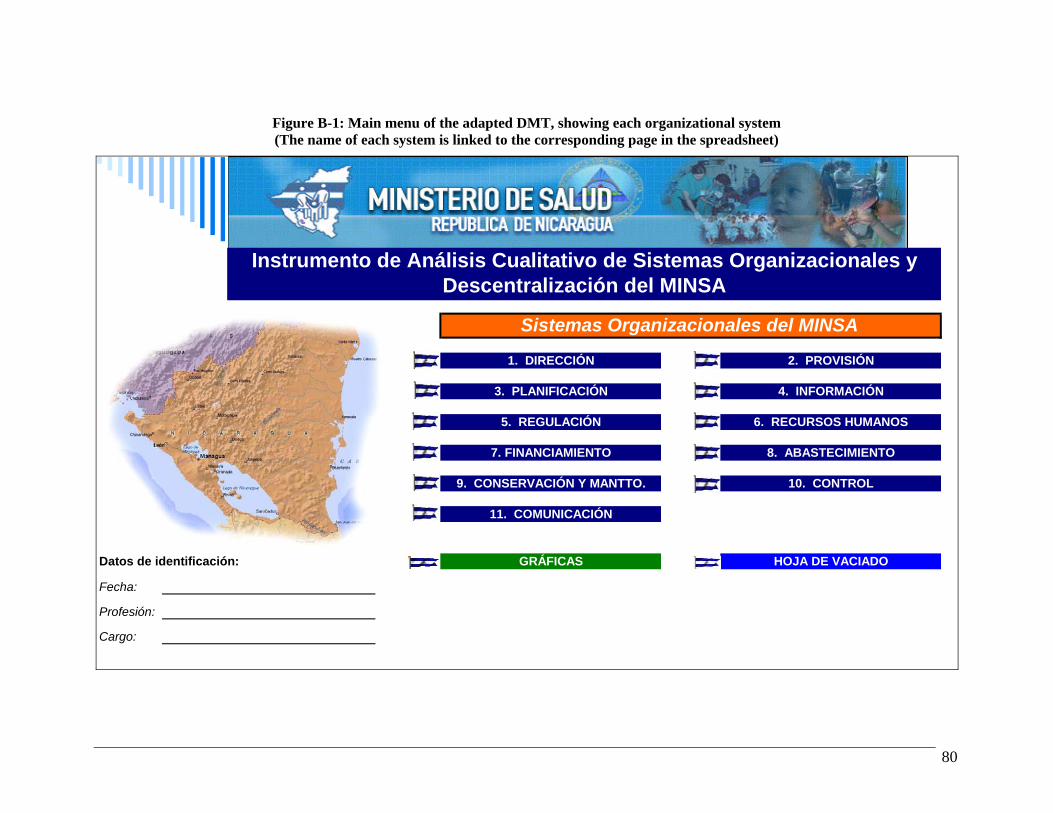
80
Figure B-1: Main menu of the adapted DMT, showing each organizational system (The name of each system is linked to the corresponding page in the spreadsheet)
Instrumento de Análisis Cualitativo de Sistemas Organizacionales y Descentralización del MINSA
Sistemas Organizacionales del MINSA
1. DIRECCIÓN 2. PROVISIÓN
3. PLANIFICACIÓN 4. INFORMACIÓN
5. REGULACIÓN 6. RECURSOS HUMANOS
7. FINANCIAMIENTO 8. ABASTECIMIENTO
9. CONSERVACIÓN Y MANTTO. 10. CONTROL
11. COMUNICACIÓN
Datos de identificación: GRÁFICAS HOJA DE VACIADO
Fecha:
Profesión:
Cargo:
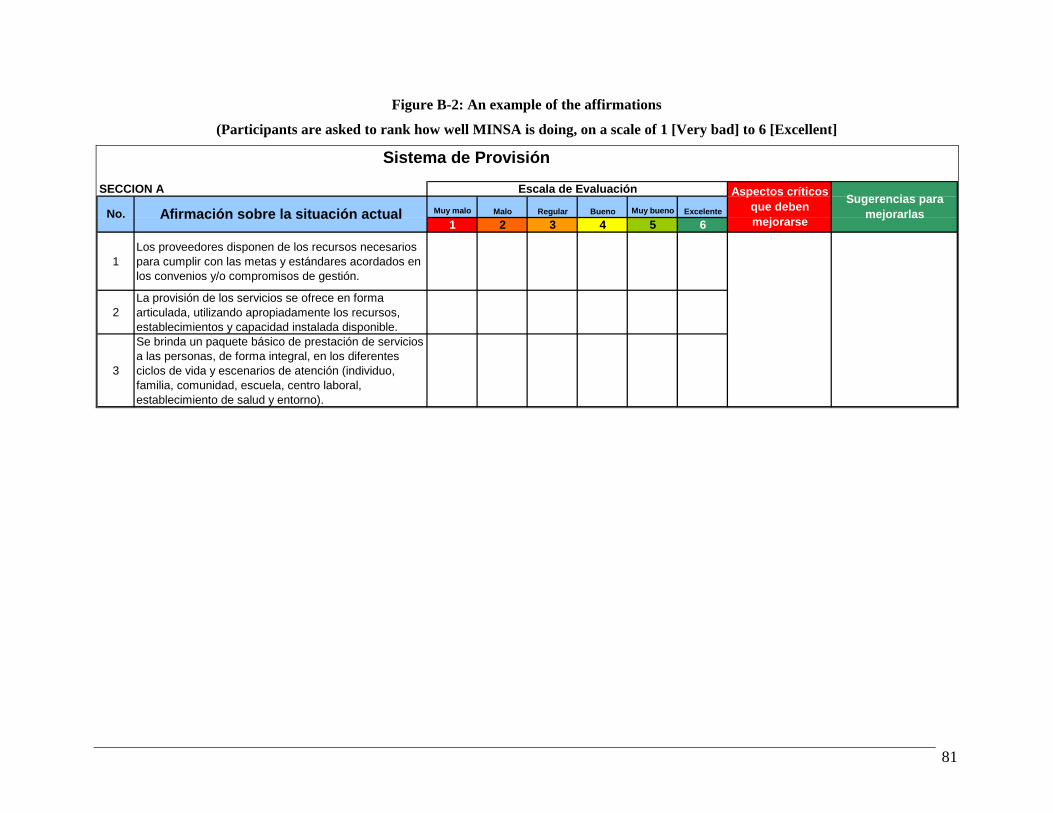
81
Figure B-2: An example of the affirmations
(Participants are asked to rank how well MINSA is doing, on a scale of 1 [Very bad] to 6 [Excellent]
Sistema de Provisión
SECCION A
Muy malo Malo Regular Bueno Muy bueno Excelente
1 2 3 4 5 6
1Los proveedores disponen de los recursos necesarios para cumplir con las metas y estándares acordados en los convenios y/o compromisos de gestión.
2La provisión de los servicios se ofrece en forma articulada, utilizando apropiadamente los recursos, establecimientos y capacidad instalada disponible.
3
Se brinda un paquete básico de prestación de servicios a las personas, de forma integral, en los diferentes ciclos de vida y escenarios de atención (individuo, familia, comunidad, escuela, centro laboral, establecimiento de salud y entorno).
Sugerencias para mejorarlasNo. Afirmación sobre la situación actual
Aspectos críticos que deben mejorarse
Escala de Evaluación

82
Figure B-3: An example of the additional columns to record responses for “desired situation” as well as “current situation”
SECCION B SITUACION ACTUAL SITUACION DESEADA
No. Preguntas sobre nivel de descentralización Central SILAIS Hospital Municipal Ninguno Central SILAIS Hospital Municipal Ninguno
1¿Qué nivel gerencial es responsable de investigar y responder al incremento en la incidencia de una o más enfermedades infecciosas o crónicas?
2
¿Qué nivel gerencial es responsable de investigar y organizar una respuesta a riesgos de salud causados por niveles de higiene, agua y saneamiento básico inferiores a la norma?
3
¿Qué nivel gerencial es responsable de investigar y organizar una respuesta a riesgos de salud causados por la contaminación ambiental (p. ej., mala calidad del aire, desechos tóxicos, etc.)?
4¿Qué nivel gerencial es responsable de investigar y organizar una respuesta a los riesgos de salud ocupacionales ?
5
¿Qué nivel gerencial es responsable de investigar y organizar una respuesta a riesgos por concepto de muerte accidental y lesiones (p. ej., por accidentes de automóvil)?
6 ¿Qué nivel gerencial tiene la autoridad para comprar servicios clínicos y/o técnicos a terceros?
7¿Qué nivel gerencial tiene la autoridad de comprar servicios de apoyo a terceros, tales como lavandería, seguridad, etc.?

83
Figure B-4: An example of the data analysis: Histogram showing the frequency of responses to the affirmations that correspond to Health Provision system
Histograma: Frecuencia de la respuesta a la afirmación:Provisión
0
2
4
6
8
10
12
14
16
18
1 2 3 4 5 6
Escala
Frec
uenc
ia

84
APPENDIX C: INSTRUCTIONS FOR AUTOMATING THE DATA SUMMARY IN EXCEL
For those of you who are interested in how to automate some of the data summary functions, here is a brief introduction to the theory behind the approach, and then a set of instructions for setting up the automation. Background: As developers of the tool, we faced the challenge of summarizing the data quickly and easily, and automating certain parts of the tool so that users would not have to enter the same information multiple times. We also thought about different features that we could include to make the tool more user-friendly. Of course, user-friendliness depends on people’s skills and expertise. If you are accustomed to entering data into the computer, but you are not familiar with Excel formulas, then some of these more complex Excel skills may be difficult for you. On the other hand, if you are quite comfortable with Excel (creating formulas, linking cells on one worksheet to another cell in a different worksheet, searching and replacing text in formulas, and so forth), and you have a set of completed questionnaires, but you do not do data entry yourself, you may be happier linking the individual questionnaire responses into the summary part of the DMT instrument. In this case, you will not have to retype the answers (reducing the possibility of transcription errors), and once you create your linked formulas, you can copy them to other parts of the worksheet and adjust the row and column references. You are probably the best judge of whether you want to use this more automated approach. The challenge: How do we automate this part of the tool? In the standard version of the DMT, before it has been customized for a particular country or setting, there are four different management levels: National, Regional, Provincial, and Facility. Respondents share their perceptions about which level has responsibility or authority for each component of each function. The answer could be any one of these levels, some combination of them, all of them, or none of them. It is not enough to count the number of responses. For instance, if you count the number of Xs in the boxes for each row of the table below, you get a number that ranges from 0 (where the function does not exist) to 4 (when all four levels have the authority to carry out a given function). Unless the count is 0 or 4, you do not necessarily know which level has the responsibility or authority. Look at the responses to Functions 3, 4, 5, and 6 in Table C-1. In each instance, three of four management levels have responsibility or authority, but the combination of responses is different for each one:
• Function 3: National, Regional, Province • Function 4: National, Regional, Facility • Function 5: National, Provincial, Facility • Function 6: Regional, Provincial, Facility

85
Table C-1: Sample responses to determining questions
Management Level Function National Regional Provincial Facility
Count
1 02 X X X X 43 X X X 34 X X X 35 X X X 36 X X X 37 X 1
A solution: find a way to summarize the responses in order to get a unique answer for each different combination of possibilities. One way to get a unique answer is to assign different numeric values to each level. In our example above, we could assign values as follows:
• If the function happens at the national level (i.e., the box under “National” is marked with an X), it gets a value of 1.
• If the function happens at the regional level (i.e., the box under “Regional” is marked with an X), it gets a value of 5.
• If the function happens at the provincial level (i.e., the box under “Provincial” is marked with an X), it gets a value of 10.
• If the function happens at the facility level (i.e., the box under “Facility” is marked with an X), it gets a value of 20.
You do not have to use these particular numeric values. The only criterion is that any two numbers added together must be smaller than the next highest value in the list. Thus, 1 (National) plus 5 (Regional) equals 6, which is less than 10 (the value for Provincial). Similarly, 5 (Regional) plus 10 (Provincial) equals 15, which is less than 20 (the value for Facility). Using the values shown above, you would get a numeric result that ranges from zero (if the function does not exist) to 36 (if the function happens at all levels: 1+5+10+20). Creating the formulas to produce the unique value: The simplest way to create the necessary formulas is to set up a new group of columns—one for each management level—to the right of the columns in the data collection form. You can then write a formula in each of the new columns and sum across to get the total numeric value. See the example in Figure C-1.
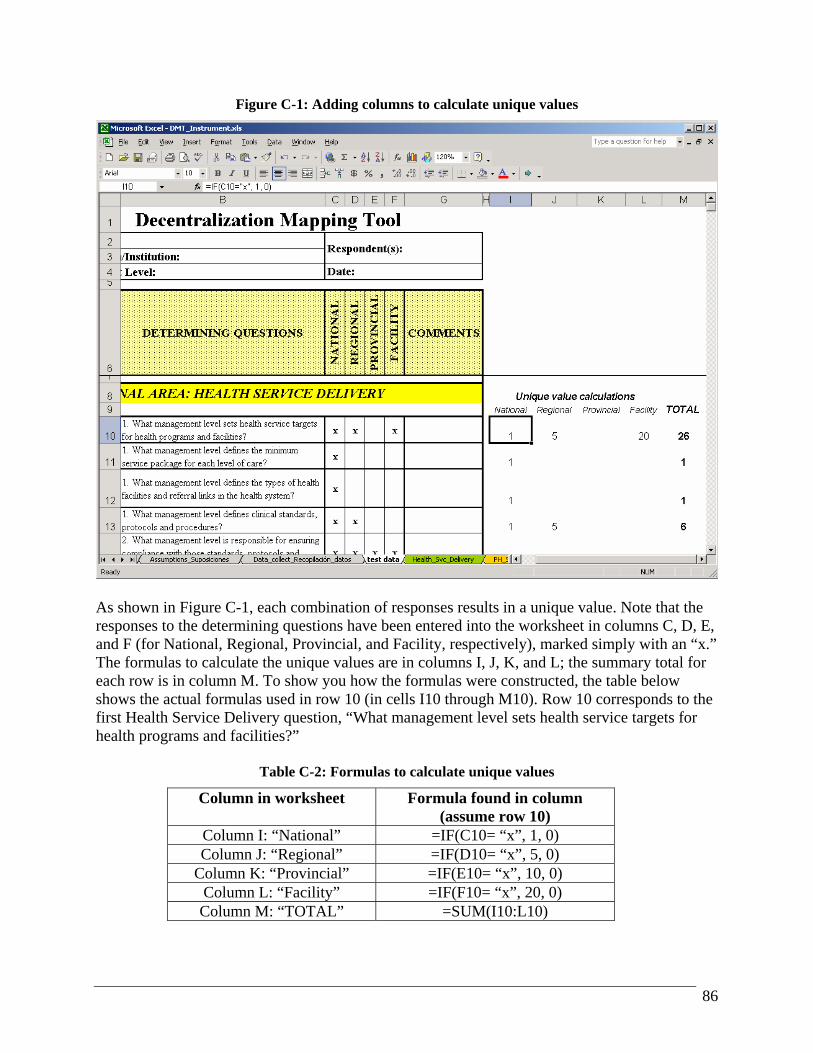
86
Figure C-1: Adding columns to calculate unique values
As shown in Figure C-1, each combination of responses results in a unique value. Note that the responses to the determining questions have been entered into the worksheet in columns C, D, E, and F (for National, Regional, Provincial, and Facility, respectively), marked simply with an “x.” The formulas to calculate the unique values are in columns I, J, K, and L; the summary total for each row is in column M. To show you how the formulas were constructed, the table below shows the actual formulas used in row 10 (in cells I10 through M10). Row 10 corresponds to the first Health Service Delivery question, “What management level sets health service targets for health programs and facilities?”
Table C-2: Formulas to calculate unique values
Column in worksheet Formula found in column (assume row 10)
Column I: “National” =IF(C10= “x”, 1, 0) Column J: “Regional” =IF(D10= “x”, 5, 0)
Column K: “Provincial” =IF(E10= “x”, 10, 0) Column L: “Facility” =IF(F10= “x”, 20, 0) Column M: “TOTAL” =SUM(I10:L10)

87
Now you can copy these formulas down the page for every question on the questionnaire, as well as to all the other worksheets where you have stored the interview responses. Be sure to copy the formulas to the same columns on all the data collection worksheets so that the values calculate properly. In the example above, the formulas are in columns I through M. So, as you copy these formulas to the other worksheets where you collected the data, be sure to copy the formulas to columns I through M on the other worksheets. Once you have the unique values calculated, you will need to link them to the summary sheets and set up a formula to display summary results. The linking process takes a bit of time for the first question, but after that you can use Excel’s text search and replace capabilities to speed the process. In addition, the summary sheets have been set up with hidden columns that you can use when you build your formula to link in the unique value for each set of responses. Use the following instructions to link the unique values to the summary sheets and set up a formula to display summary results. 1) You will have less trouble with the links if the data collection sheets are in the same Excel
file as the summary worksheets. This way, the results stay together and you do not need to worry about copying more than one file if you distribute the raw data and the results to the key stakeholders. If you have not done so already, move or copy the worksheets into your renamed file that contains the summary worksheets.
2) Unprotect each summary worksheet so that you can display the hidden columns. Figure C-2 shows the Health_services_Servicios_salud worksheet with all columns displayed. To unhide columns, click and drag your mouse to highlight the gray column indicators at the top of the worksheet, then right-click with your mouse and choose Unhide.
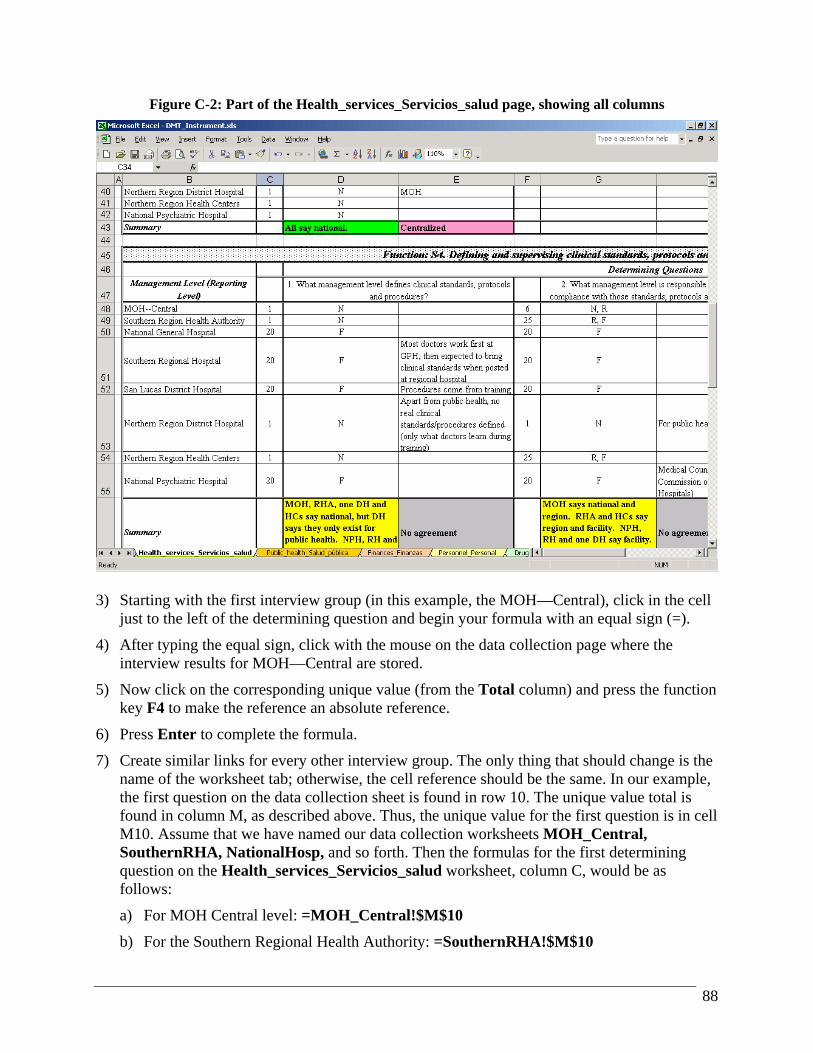
88
Figure C-2: Part of the Health_services_Servicios_salud page, showing all columns
3) Starting with the first interview group (in this example, the MOH—Central), click in the cell
just to the left of the determining question and begin your formula with an equal sign (=).
4) After typing the equal sign, click with the mouse on the data collection page where the interview results for MOH—Central are stored.
5) Now click on the corresponding unique value (from the Total column) and press the function key F4 to make the reference an absolute reference.
6) Press Enter to complete the formula.
7) Create similar links for every other interview group. The only thing that should change is the name of the worksheet tab; otherwise, the cell reference should be the same. In our example, the first question on the data collection sheet is found in row 10. The unique value total is found in column M, as described above. Thus, the unique value for the first question is in cell M10. Assume that we have named our data collection worksheets MOH_Central, SouthernRHA, NationalHosp, and so forth. Then the formulas for the first determining question on the Health_services_Servicios_salud worksheet, column C, would be as follows:
a) For MOH Central level: =MOH_Central!$M$10
b) For the Southern Regional Health Authority: =SouthernRHA!$M$10
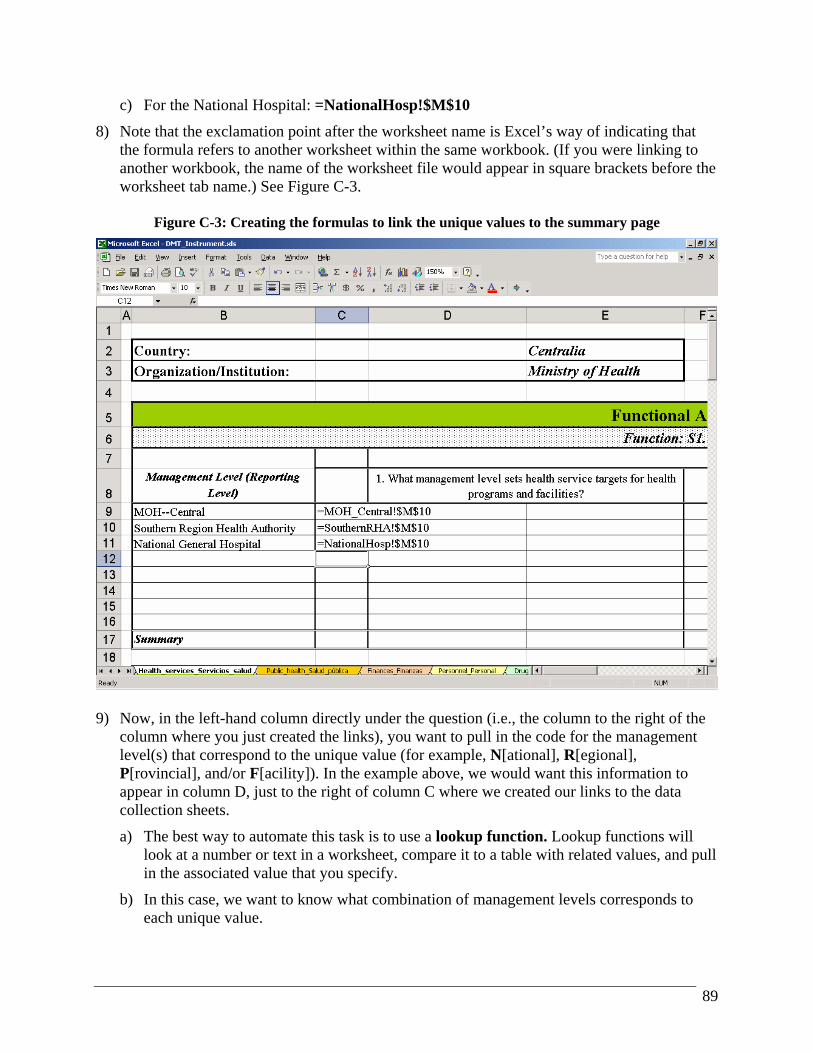
89
c) For the National Hospital: =NationalHosp!$M$10
8) Note that the exclamation point after the worksheet name is Excel’s way of indicating that the formula refers to another worksheet within the same workbook. (If you were linking to another workbook, the name of the worksheet file would appear in square brackets before the worksheet tab name.) See Figure C-3.
Figure C-3: Creating the formulas to link the unique values to the summary page
9) Now, in the left-hand column directly under the question (i.e., the column to the right of the
column where you just created the links), you want to pull in the code for the management level(s) that correspond to the unique value (for example, N[ational], R[egional], P[rovincial], and/or F[acility]). In the example above, we would want this information to appear in column D, just to the right of column C where we created our links to the data collection sheets.
a) The best way to automate this task is to use a lookup function. Lookup functions will look at a number or text in a worksheet, compare it to a table with related values, and pull in the associated value that you specify.
b) In this case, we want to know what combination of management levels corresponds to each unique value.
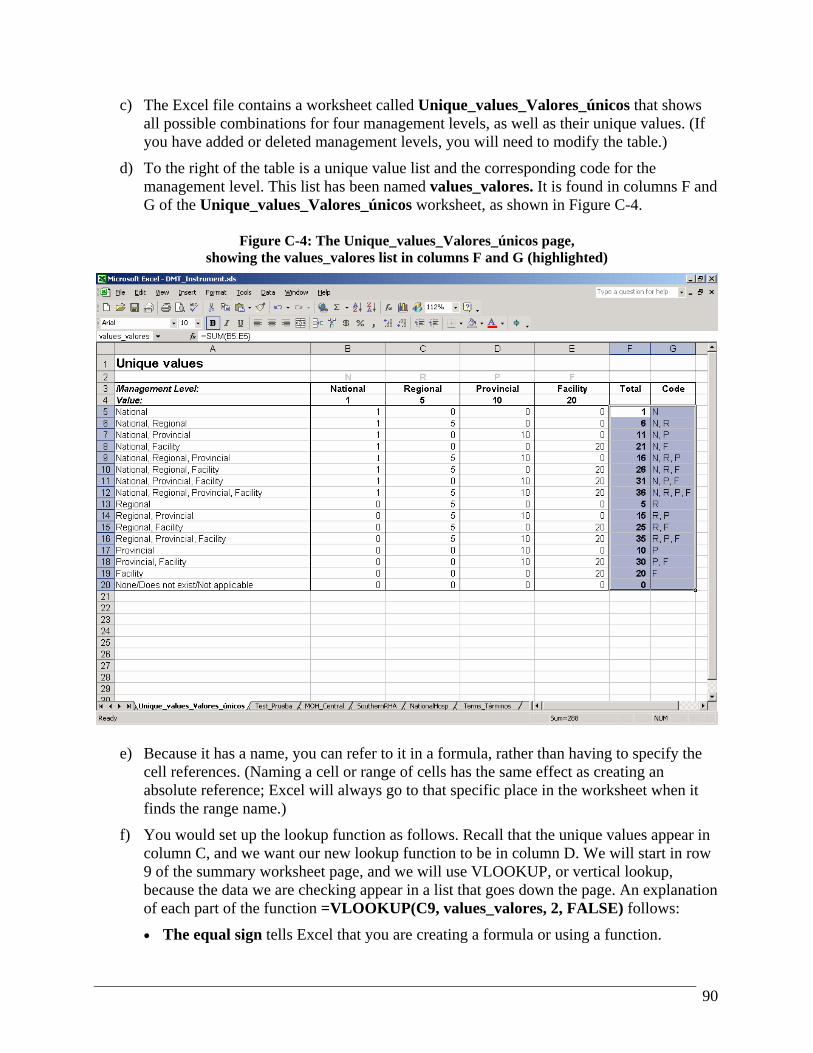
90
c) The Excel file contains a worksheet called Unique_values_Valores_únicos that shows all possible combinations for four management levels, as well as their unique values. (If you have added or deleted management levels, you will need to modify the table.)
d) To the right of the table is a unique value list and the corresponding code for the management level. This list has been named values_valores. It is found in columns F and G of the Unique_values_Valores_únicos worksheet, as shown in Figure C-4.
Figure C-4: The Unique_values_Valores_únicos page,
showing the values_valores list in columns F and G (highlighted)
e) Because it has a name, you can refer to it in a formula, rather than having to specify the cell references. (Naming a cell or range of cells has the same effect as creating an absolute reference; Excel will always go to that specific place in the worksheet when it finds the range name.)
f) You would set up the lookup function as follows. Recall that the unique values appear in column C, and we want our new lookup function to be in column D. We will start in row 9 of the summary worksheet page, and we will use VLOOKUP, or vertical lookup, because the data we are checking appear in a list that goes down the page. An explanation of each part of the function =VLOOKUP(C9, values_valores, 2, FALSE) follows:
• The equal sign tells Excel that you are creating a formula or using a function.
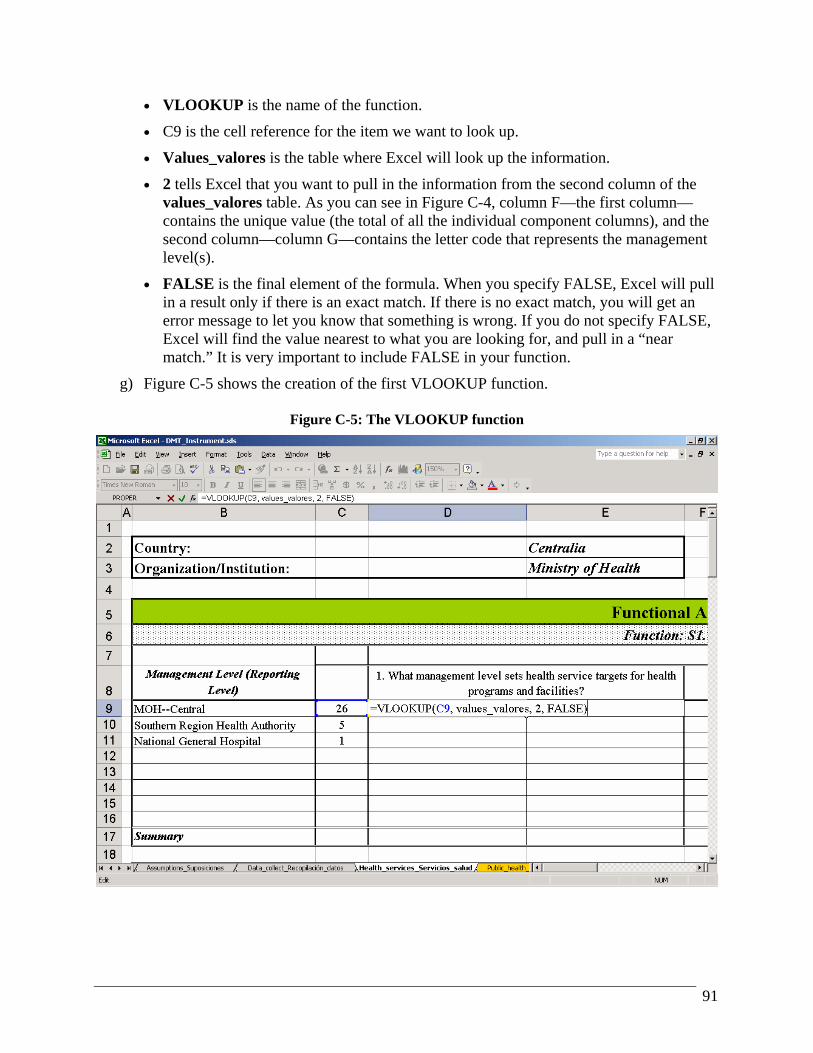
91
• VLOOKUP is the name of the function.
• C9 is the cell reference for the item we want to look up.
• Values_valores is the table where Excel will look up the information.
• 2 tells Excel that you want to pull in the information from the second column of the values_valores table. As you can see in Figure C-4, column F—the first column—contains the unique value (the total of all the individual component columns), and the second column—column G—contains the letter code that represents the management level(s).
• FALSE is the final element of the formula. When you specify FALSE, Excel will pull in a result only if there is an exact match. If there is no exact match, you will get an error message to let you know that something is wrong. If you do not specify FALSE, Excel will find the value nearest to what you are looking for, and pull in a “near match.” It is very important to include FALSE in your function.
g) Figure C-5 shows the creation of the first VLOOKUP function.
Figure C-5: The VLOOKUP function

92
h) Once you have created the formula, you can copy it down for all the rows in this question. The row reference (for example, C9) will update automatically, so when you copy it down one row, it will refer to C10 instead. The result is shown in Figure C-6.
Figure C-6: The VLOOKUP function at work, pulling in management level codes
10) Now you have one more part to link, and then you can copy this entire set of formulas to the
other questions. The final link is to the comment section of the data collection sheet. These comments are shown on the summary page in the right-hand column under the determining question—in this example, in column E, just to the right of your VLOOKUP function.
a) Highlight the columns and rows where you linked in the unique value (in this example, we would highlight cells C9, C10, and C11).
b) Press the Copy icon, or use Ctrl-C as a keyboard shortcut.
c) Click on cell E9.
d) Right-click with your mouse and choose Paste Special, Formulas.
e) Now highlight the new formulas (cells E9-E11) and choose Edit, Replace (or use the Ctrl-H keyboard shortcut for search and replace).
f) Ensure that you have more than one cell in column E selected. In the Find what: box, type $M, and in the Replace with: box, type $G. ($M is the absolute reference for

93
column M in the data collection sheet, and you want the formula to refer to column G instead—the column where you typed in any comments that were made during the interviews.) See Figure C-7 for an example. Note: Click on the Replace All button only if you have more than one cell selected. If you have only one cell selected, Excel will replace every $M reference throughout the worksheet. You do not want that; you want to change only the few cells in this part of the worksheet where you are working now.
Figure C-7: The Find and Replace dialog box (we are replacing references to column M with references to column G)
g) Excel will tell you how many replacements it has made. Click OK. (See Figure C-8)
Figure C-8: The dialog box after you click “Replace All”
h) Figure C-9 shows the completed question with all links in place.

94
Figure C-9: The completed question, with all responses linked to the summary page
11) Now the hard part is over. From here on, you can highlight this block and copy it to the other
questions in the worksheet, then use Find and Replace to change the row references. In our example above, the responses and unique values to the first question were found in row 10 of the data collection sheets. Thus, we know that the responses to the second question will be found in row 11.
a) Highlight the relevant cells (C9 through E11 in this case).
b) Click the Copy icon, or press Ctrl-C.
c) Go to the corresponding location in the summary sheet for the next question. Choose Find and Replace to change the row reference from $10 to $11. See Figure C-10.
d) Continue this process for each question in the worksheets.
e) Double-check the row references to ensure that you are copying the correct responses to each question. While row references within a functional area are sequential, recall that the data collection sheet has a few blank lines between functional areas. Be especially careful when updating the row references for the next functional area.
12) When you are ready to present your findings, you may want to hide the columns where the unique values appear. Simply click on the column indicator (the letter in gray at the top of the

95
worksheet), right-click with your mouse, and choose Hide. Figure C-11 shows the second question with the links updated.
Figure C-10: The new Find and Replace to update row references for the second question
Figure C-11: The second question with updated links

96
APPENDIX D: GLOSSARY OF SELECTED TERMS
Absolute references (in Excel): If you want all or part of your formula to refer to the same location in your worksheet, no matter where you copy your formula, you will need to use an absolute reference. This type of reference gets its name because the reference is “locked” or “fixed” to refer to a specific location in your worksheet. Many of the formulas in the DMT instrument use absolute references to ensure that the links from all pages refer to the correct place. If you have a formula that links to a particular determining question, you can copy that formula elsewhere in the workbook and it will always refer to that one question. Contrast this with relative references, defined below, where the formula is not “locked” and changes when you copy it from one cell to another. Relative references (in Excel): When you create formulas in Excel, you refer to other cells in the same workbook or in other workbooks. Normally, these references are relative. That is, they will change relative to where you are in the worksheet. If you create a formula and then copy it to the following row, the row reference will change, because Excel assumes that you want to perform a similar action on different data in your worksheet. Contrast this with absolute references, in which a formula always refers back to the same fixed location in a worksheet.