User engagement with mobile data collection apps: A new set of concerns
13
User engagement with mobile data collection apps: A new set of concerns Michael Link, Jennie Lai and Trent Buskirk ARF Experiential Learning Audience Measurement 7.0, 2012
Transcript of User engagement with mobile data collection apps: A new set of concerns

� User engagement with mobile data collection apps: A new set of concerns Michael Link, Jennie Lai and Trent Buskirk
ARF Experiential Learning
Audience Measurement 7.0, 2012 �
�
User engagement with mobile data collection apps: A new set of concerns
Michael Link, Jennie Lai and Trent Buskirk
The Nielsen Company
Abstract
We provide one of the first detailed assessments of smartphone applications as potential replacements for more traditional
survey methods. Smartphone applications (or "apps") provide researchers with a range of ready-made tools to collect both
customary and new forms of data in a more reliable manner than self-reports, such as location, visual data, barcode scanning,
in the moment surveys, and the like. Yet unlike traditional surveys, respondents have greater experience with and expectations
of smartphone apps, such as ease of use, speed, and functionality. Researchers need, therefore, to pay more attention to user
engagement. Techniques such as "gamification" (the application of sociological and psychological principles that drive
successful game interaction to measurement) and "social sharing" (allowing respondents to interact with others during the
course of measurement) are two examples, which have only recently begun to be applied to data collection.
Examining these and related issues, we report on a study in which a smartphone app was developed to capture television
viewing behaviors and to serve as a replacement for a current paper-and-pencil (PAPI) diary survey approach. The app
captures the critical data elements collected in the PAPI version, but also allows users to express their views on current shows
via a rating scale, comments, and "likes." The app also contains additional features designed to enhance user engagement,
including a points & status system and allowing respondents to share their viewing and comments with others using the app or
with their Facebook network.
We discuss some of the challenges encountered in developing a smartphone application to replace a long-standing PAPI
approach, and provide empirical data tracking data entry, feature use and overall compliance by respondents. Additionally,
using a split-sample design, with one set of respondents utilizing a "basic" app with no gamification and social sharing features
and another set of respondents using a "full feature" app, we assess the impact of these techniques for enhancing user
engagement in terms of increased participation and any changes in television viewing behaviors (a potentially negative
consequence). The findings are of interest not only to those developing other forms of smartphone applications or leveraging
ready-made app utilities, but more broadly to the survey field in terms of our understanding of how to engage with respondents
in a technology-driven world.
1.0 Introduction
���7LWOH� User engagement with mobile data collection apps: A new set of concerns���$XWKRU�V�� Michael Link, Jennie Lai and Trent Buskirk���6RXUFH� ARF Experiential Learning���,VVXH� Audience Measurement 7.0, 2012
�
Downloaded from warc.com
�
�
2
According to the latest Pew Internet Project, 88% of American adults age 18+ own a cell phone and 46% own a smartphone,
i.e., mobile phone that runs on the Android, Blackberry, iPhone, Palm or Windows platforms (Zickuhr & Smith, 2012). Young
adults age 18-29 continue to dominate the market for smartphone ownership regardless of income and education level.
Furthermore, Minority groups such as African-Americans and English-speaking Latinos are more likely to own a cell phone
than Whites as well as using more of its capabilities (the smartphone ownership for these minority groups is comparable to the
national average). For those with apps on their cell phone, they would typically download apps for game (60%) followed by
news/weather (52%), maps/navigation (51%), social networking (47%) and music (43%) (Purcell et al, 2010).
Considering the current trend of smartphone owners and app users, this opens new opportunities for survey researchers to
leverage smartphone apps for data collection especially with young adults and the ethnic minorities. Before initiating a
research study using these new technologies, it is important to first understand respondent expectations for user experience
related to form/function, reciprocity, gamification and social sharing (Link, 2011). Focusing on the latter two expectations, the
ultimate objective of applying game and social mechanics for engagement is to drive the desired behavior for respondents to
participate and comply with the survey task (without biasing their response). This research paper will provide an overview of
the respondent engagement techniques experimented with the development of a smartphone app to collect media usage
information. We will share insights on using game and social mechanics for engagement in order to help survey researchers
make an informed decision of its benefits and potential implications for long-term panel studies.
2.0 Background
Gamification is "the process of game thinking and game mechanics to engage users and solve problems" (Zichermann &
Cunningham, 2011). Gamification dates back to at least the 1980s when airlines first started using "miles" as the foundation of
their loyalty reward program in motivating flyers to earn miles on their airline then redeem these miles for membership benefits
(Lewis, 2011).
The application of gamification techniques has proliferated in the recent years in the marketing industry and by extension to
marketing research though their objectives are quite different. Even though both disciplines seek to promote engagement for
their respective needs, marketing uses gamification to keep consumers returning to a product or service while marketing
research is exploring its use to engage respondents to respond and comply fully with a survey task (Ewing, 2011). To address
the need for respondent engagement, survey researchers often look to minimize "respondent burden" through survey length,
difficulty of the task, time consideration, etc. In contrast, gamification seeks to engage respondents by involving them more
with the survey task through game-like processes.
In the award-winning paper by Puleston & Sleep (2011), they found that respondents provided more significant feedback for
online surveys on ad recall when the survey task was transformed into a game framework. The results of these specific game
experiments yielded richer data with increased word count for open-ended responses, greater variety of responses, more time
spent on the survey task, etc. However, these findings do raise the critical concern for potential response bias associated with
these gamification techniques. Ultimately, these techniques should not influence or change behaviors, attitudes or opinions
being measured.
2.1 Game Mechanics
It is important to distinguish transforming the entire survey task into a game-like environment versus using game mechanics
�
Downloaded from warc.com
�
�
3
such as badges, leaderboards or points to reward achievement when respondents comply with the survey task. Depending on
the approaches used to "gamify" the survey task, there are serious considerations for potential response bias and reliability of
the data collected, i.e., whether respondents would respond to the survey items or tasks the same way without the gamified
approach. While these engagement techniques can influence respondents to comply, but does it also influence respondents to
bias their response in an effort to "win" or advance in the game? These considerations clearly demonstrate the need for further
study on application of gamification techniques in survey research.
The term "game mechanics" is defined as the actions, behaviors and control mechanisms used to gamify an activity
(Bunchball, 2011). The full extent of game mechanics can include challenges, leaderboards, virtual goods (i.e., non-material
goods), gifts/charity, etc. in addition to the aforementioned mechanics to drive the desired behavior for achievement and
subsequently engagement of the (survey) task. This research paper will focus on badges, points and levels for respondent
engagement techniques.
Foursquare (2012), an application to connect users on "what's nearby, save money and unlock deals," popularized the reward
of badges to its users upon completion of a specific activity (such as checking into a specific establishment). Badges are
virtual goods in the context of mobile applications and intended to be given for promoting the status of the users of a
community. Furthermore, in order to maximize the value for achievement, the badges must be visible to others (thereby adding
a social dimension).
There are five social psychological functions of badges which include goal setting, instruction, reputation, status/affirmation
and group identification to consider for usage (Antin & Churchill, 2011). Badges used for the purpose of instruction can
indoctrinate new users on specific function and help existing users to expand their understanding of different functions. By
allowing the users to see a list of possible badges that can be earned, they can then understand the valued activities in return
(e.g., if there is a tutorial of the key functions of the mobile app for users, then a badge can be awarded upon completion of the
tutorial to promote better understanding for app users).
Points and levels are connected game mechanics to maximize sense of achievement. Like badges, points and levels drive
status achievement but are better leveraged for goal setting especially for longer term activities (e.g., survey panel). According
to Zichermann & Cunningham (2011), a point system can be designed for experience points, redeemable points, skill points,
karma points and reputation points. For survey research, experience points (XP) can be most relevant by assigning XP to
valued activities in order to align respondent behavior for long-term engagement. The XP system can also help set goals for
specific milestone for long-term activities and allow users to have a fresh start during each milestone.
Levels are used to indicate progress and advance through achieving point thresholds. More importantly, other than a status
indicator, levels should be meaningful and rewarded differently as users advance through the levels. Each level should offer
users a different experience (e.g., access to special content or app features that other users may not be privileged with) so
they are motivated to reach the next level. The number of levels should correspond to the duration of the activity so users are
motivated to reach a reasonable number of levels according to the length of time they are expected to participate.
2.3 Social Mechanics
According to the Pew Internet Project, 65% of all Internet users access social networking sites (Facebook is by far most
popular followed by Twitter, MySpace and LinkedIn), and 87% of Internet users under the age 30 use these social networking
sites compared to just 29% for age 65 or older (2012). The concept of social sharing online or within the app community may
�
Downloaded from warc.com
�
�
4
not necessarily appeal to everyone, therefore, the usage of this tool can be effective for the younger cohorts but may not be as
effective with older cohorts (due to privacy concerns). For apps with social sharing features, it is important to allow users to opt
out of these features in order to maximize engagement with targeted users but minimize break-offs with others due to privacy
concerns.
The premise of using social mechanics for respondent engagement is to promote interaction with other app users as an
additional source of motivation to comply with a task. The key tools used for social mechanics include sharing updates about
themselves or their activities; and the function to "like" and comment the updates or postings others share. These features can
allow users to build their "reputation" in these app communities and form relationships with other app users within a research
panel (Cooke and Buckley, 2008). Given the limited literatures available on the effect of social mechanics with ongoing
engagement, it is clearly an area that is worth further research.
This research study explored specific features of game and social mechanics that were deemed successful for engaging game
players and adapted these techniques to encourage respondents to comply with the survey task of a long-term panel. We will
cover the design of the game and social mechanics used for respondent engagement; evaluate the effectiveness of these
mechanics by key demographic groups; understand the game orientation of the pilot participants; share lessons learned on
implementation of these techniques based on qualitative feedback and important considerations for future app research.
3.0 Method
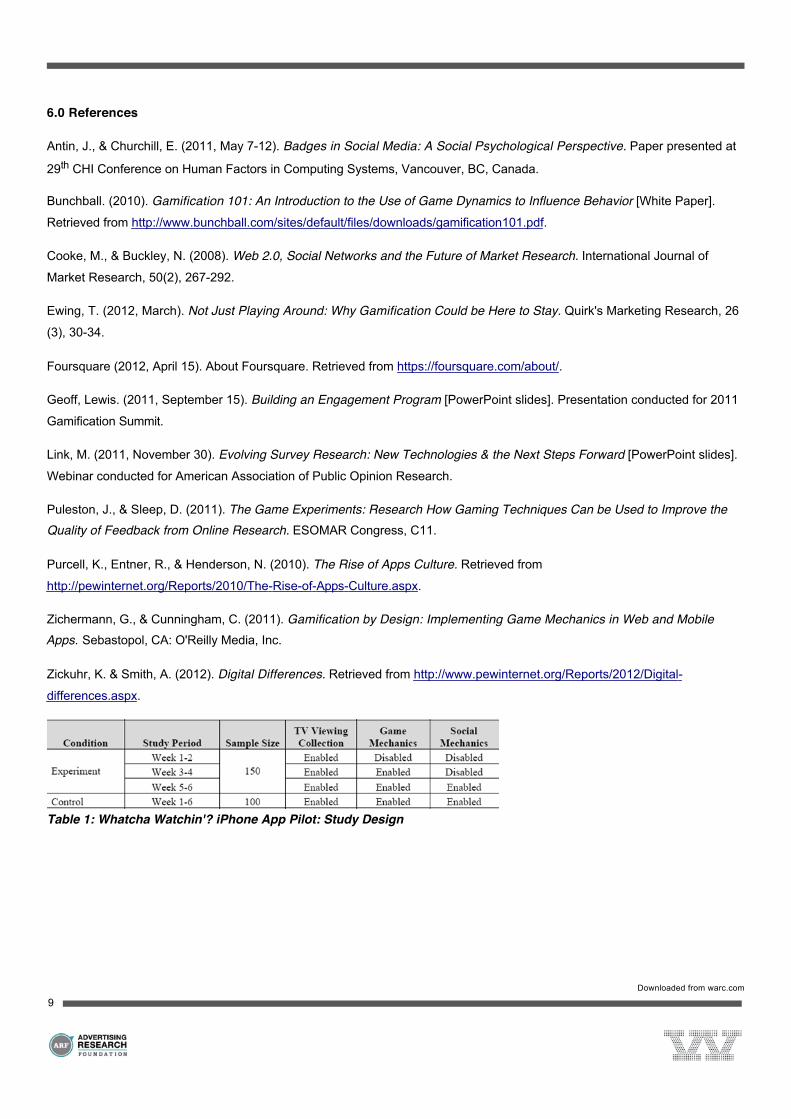
We recruited a total of 250 employees through convenience sample across four major cities (Tampa, FL; New York, New York; Schaumburg, IL and San Francisco, CA) to participate in a pilot study of using an iOS application called Whatcha Watchin'? to
collect media usage information on either iPhone or iPad devices. The study ran for six weeks from January 17, 2012 to
February 27, 2012. Each participant was offered the contingent incentive of a $50 gift card to enter their TV viewing
information in the application on their own iOS device. Of the 250 participants selected for the study, 100 were randomly
designated into a control condition which enabled all the app features for the duration of the 6-week data collection period and
the remaining 150 participants were upgraded with app features incrementally every two weeks (see Table 1 for study design).
3.1 Experimental Approach
An experiment was designed to assess the effectiveness of the game mechanics (i.e., badges, points and levels) and social
mechanics (i.e., social sharing of TV viewing information within the app and Facebook) used for respondent engagement (see
Table 1). For the participants designated for the experimental condition, they were asked to enter their TV viewing information
including program name/format, viewing device, viewing date/time, location of viewing, co-viewership, etc. during the first two
weeks of the study period. These participants were not presented with any of the game and social mechanics during the initial
two weeks while the participants in the control condition were presented with the aforementioned app features for the duration
of the six-week study period.
Beginning week 3, the participants in the experimental condition were prompted to update their iPhone app for the integration
of the game mechanics which included badges, points and levels. There were five possible badges participants can earn for
the remaining study period (see Table 2). The badges are intended for instructional purposes to provide positive reinforcement
for completion of specific high-value activities related to the survey task. For example, the Head Start Badge is presented
when the participants completed their first full TV viewing login (i.e., provided responses to all the questions related to their TV
viewing). In an effort not to bias their TV viewing behavior or falsely report their TV viewing information, the details of earning
�
Downloaded from warc.com
�
�
5
badges were not visible to the participants but the possible badges that can be earned were visible to them (i.e., any badges
not yet earned is gray-out under "Your Status" section of the app).
The participants were also rewarded with points based on the high-value activities of the survey task such as entering the TV
viewing information on a regular basis (but not based on volume of entries), responding to the push notifications, earning
badges, advancing to a higher level and completing trigger surveys (a short custom survey up to five questions triggered by a
specific activity such as watching a specific TV program or measuring engagement upon earning a badge). There was also a
great deal of consideration when designing the point system to minimize potential influence to participants' TV viewing
behavior or falsely reporting their TV viewing information to earn more points.
The last component of the game mechanics is the opportunity to advance to a different level based on the points rewarded.
The number of points can be earned were not visible to the participants until they are rewarded with the points for the high-
value activities. This was intended to preserve the mystery element of the game design and encourage participants to engage
throughout the study period. There were ten levels participants could advance to (starting from a TV Viewer to the highest
level of a Producer) which are associated to the ranking of a TV production team in order to simulate a fictional game
environment (see Table 3).
For the last two weeks of the study period, the participants in the experimental condition were prompted again to update their
iPhone app for the integration of the social mechanics which allow them to post their TV viewing information within the app
community or their own Facebook wall. The participants can choose to "like" or comment on any posting under "Your Social
Feed" section of the app. Moreover, participants could also share their achievement when they earn badges or advance
levels. These social sharing options were at the discretion of the participants, and they can choose to opt out of any of these
features on a per-use basis.
3.2 Follow-up Study
A total of 222 participants recruited for the pilot subsequently downloaded the iPhone app and registered for the study (90 out
of 100 participants from the control condition and 132 out of 150 participants from the experimental condition). In an effort to
gather in-depth insights on their user experience, a random selection of 22 participants was followed up for either one-on-one
qualitative interviews or focus groups for 60-minutes. The rest of the pilot participants were sent an online survey to collect
their user experience during the collection period.
4.0 Results
It is important to note at the outset that because the pilot used a non-probability sample, the results are not projectable to the
broader population. The findings do, however, yield important insights on respondent engagement with game and social
mechanics in addition to how game orientation interacts with these mechanics. Any references to "significant" differences in
the Results section are used to highlight the key differences in attitudes and behaviors across the subgroups (using statistical
significance testing) but, again, these results should not be construed as providing information generalizable to the broader
population.
4.1 Respondent Sentiment Towards Gamification Techniques
First we examine respondent perception of the key gamification features: badges and points & levels. As part of the debrief
survey, respondents were asked: "What did you think about receiving badges in the app?: Loved it, Liked it, Neither liked nor
�
Downloaded from warc.com
�
�
6
disliked, Disliked it, or Hated it." As shown on Figure 1, the majority of respondents (52%) were "neutral", neither liking or
disliking the badges, while 47 percent said they either loved or liked receiving them. Very few said that they disliked or hated
receiving the badges. Younger respondents as well as Asians and Hispanics were more likely to say they loved or liked
earning the badges. (Note: there were not enough Black participants to report separately for that population group).
Next, we asked a similar question regarding respondents' perceptions of the points & levels feature (see Figure 2). Overall,
respondents were less positive about this feature, with more than 60% saying they neither liked nor disliked the points &
statuses, and just over one-third saying they liked or loved the features. Although respondents aged 18 ± 29 years old had a
more positive view of these techniques than did those aged 40 or older, the majority in each age group had neutral feelings
towards the use of points and levels. Hispanics, however, were split nearly evenly between positive and neutral sentiment,
while a majority of Asian respondents said they liked or loved the features.
4.2x Respondent Use of Social Feed
While the use of gamification techniques appears to have some promise, particularly among particular subgroups of the
population, the inclusion of an internal app social feed was not as successful. When asked how often they used the internal
social feed, 43% said "never", 33% "rarely" and just 24% indicated often or every time they logged on (see Figure 3). A
majority of men and those aged 40 or older said they never used the social feed. Reported usage was highest among Asians,
with half of those respondents saying they used the feed often or every time they used the app, followed by Hispanics (43%)
and women (32%).
Asked which features of the social feed they typically used (multiple entries were accepted), nearly 85% said they liked to read
the entries made by other app users (see Figure 4). Far smaller percentages indicated they used the feed to indicate posts
they "liked" (19%), posted a comment (11%) or actively pushed feed content to their Facebook page (5%).
Those who did not use the social feed were asked why they did not (Figure 3). Nearly two-thirds said they did not want to
share their viewing, 32% did not feel connected to the "app community" (i.e., other app users), 12% felt it was too time-
consuming, and just under 2% said it was too hard to type on their mobile phones.
4.3 Impact of Gamification and Social Features on TV View Entries
Next, we examined the potential impact of the gamification features and social feed on user TV viewing entries over the six
week period. Figure 4 presents the average hours of viewing recorded by week for the two test groups (full app and
incremental app groups). Three conclusions can be drawn from this graph. First, the amount of viewing was nearly identical for
the two test groups during the first two weeks of data collection. Since the "full app" group had access to both the gamification
features and social feed and the "incremental app" group did not, this pattern would appear to indicate that neither the
gamification nor social feed had much of an impact in driving greater compliance (which we would expect to manifest in a
greater number of hours entered given that the number of hours for app users is significantly below that reported in the paper
Diary). With the introduction of the gamification (badges, points & levels) to the incremental group in week 3, however, we do
see a marked increase in the amount of viewing reported as compared to the "full app" group. The introduction of the
gamification features appear, therefore, to have "re-engaged" respondents to use the app. This effect appears to persist
throughout the final four weeks of data collection. In contrast, there is no additional "bump" in viewing when the social feed
was introduced in week 5 to the "incremental" group. Given the debrief survey results reviewed earlier; this is not surprising as
the social feed did not appear to pique respondents' interest in the same way as the gamification techniques. A similar pattern
�
Downloaded from warc.com
�
�
7
is shown across the six weeks when we look at the average number of days per week with at least 1 viewing entry (see Figure
5).
5.0 Conclusions
In consideration of the cost, time and effort spent to design and develop these game and social mechanics, it should
realistically be considered for long-term panel research (rather than point-in-time or one-off surveys) given the challenge to
sustain cooperation throughout a much longer data collection period. While traditional survey research focuses on minimizing
respondent burden such as reducing the time and effort required for the survey task, the techniques used for respondent
engagement in this research study are taking a different approach to further engage them with the data collection tool. There
are promising results for engagement with the hard-to-reach cohorts but also challenges to effectively implement these
techniques without influencing their behaviors as discussed below.
Gamification techniques appear to hold more promise for user engagement than does use of a social feed ± at least in the
context and manner in which each was utilized here. Gamification also has differential effects across the population, with a
more positive appeal for younger respondents, Hispanics and Asians ± classically hard-to-reach groups in any data collection
context. Badges had a somewhat stronger appeal then did points & levels. One reason may be that the points & levels
concept was not made clear to the respondents. In qualitative debrief interviews conducted after the completion of data
collection, a number of respondents indicated that while they noted the points and levels appearing in the app, they had little
conception as to how the points were earned and how they were changing levels. As a result, the potential impact of this
gamification technique was likely muted.
Similarly, the social feed appears to have had little appeal or impact. One of the key findings from the qualitative debriefs and
the debrief survey was that they did not feel "connected" to other app users who were contributing to the social feed. Unlike a
social network such as Facebook, where the user often has some level of relationship with others using the social feed, the
app feed used here did not facilitate this. As a result, the social feed was not readily used and appears to have had little
impact on respondent engagement.
Overall, the techniques appear to be more important for "re-engaging" a respondent who asked to be a part of a panel or a
longer-term data collection effort than for a shorter or point-in-time data collection effort or survey. This is underscored by the
lack of difference between the two test groups (one with and one without gamification and social techniques) during the first
two weeks of data collection. When introduced incrementally, the impact seems to have been more significant. It might well be
that some level of "changing the environment" can help with "re-engaging" users in a longer-term data collection effort.
Finally, this case study on the use of gamification techniques and social mechanics to improve user engagement with a TV
viewing app points to some critical areas for future research. Among these are the following questions: How might the use of
virtual rewards such as badges and levels allow us to expand on our current notions of incentives? When and how are game
mechanics most useful? Can they be applied meaningfully in a point-in-time survey context or are they most useful in a panel
context for "changing the game" periodically to keep the use experience "fresh"? When and how social mechanics might be
used in a meaningful way to engage respondents. And lastly, what are the trade-offs between use of these new techniques to
engage user experience while at the same time minimizing the potential for bias in our studies. Key to the successful
implementation of any of these techniques is ensuring that we are not influencing the attitudes and behavior we are trying to
measure.
�
Downloaded from warc.com
�
�
8
6.0 References
Antin, J., & Churchill, E. (2011, May 7-12). Badges in Social Media: A Social Psychological Perspective. Paper presented at
29th CHI Conference on Human Factors in Computing Systems, Vancouver, BC, Canada.
Bunchball. (2010). Gamification 101: An Introduction to the Use of Game Dynamics to Influence Behavior [White Paper].
Retrieved from http://www.bunchball.com/sites/default/files/downloads/gamification101.pdf.
Cooke, M., & Buckley, N. (2008). Web 2.0, Social Networks and the Future of Market Research. International Journal of
Market Research, 50(2), 267-292.
Ewing, T. (2012, March). Not Just Playing Around: Why Gamification Could be Here to Stay. Quirk's Marketing Research, 26
(3), 30-34.
Foursquare (2012, April 15). About Foursquare. Retrieved from https://foursquare.com/about/.
Geoff, Lewis. (2011, September 15). Building an Engagement Program [PowerPoint slides]. Presentation conducted for 2011
Gamification Summit.
Link, M. (2011, November 30). Evolving Survey Research: New Technologies & the Next Steps Forward [PowerPoint slides].
Webinar conducted for American Association of Public Opinion Research.
Puleston, J., & Sleep, D. (2011). The Game Experiments: Research How Gaming Techniques Can be Used to Improve the Quality of Feedback from Online Research. ESOMAR Congress, C11.
Purcell, K., Entner, R., & Henderson, N. (2010). The Rise of Apps Culture. Retrieved from
http://pewinternet.org/Reports/2010/The-Rise-of-Apps-Culture.aspx.
Zichermann, G., & Cunningham, C. (2011). Gamification by Design: Implementing Game Mechanics in Web and Mobile Apps. Sebastopol, CA: O'Reilly Media, Inc.
Zickuhr, K. & Smith, A. (2012). Digital Differences. Retrieved from http://www.pewinternet.org/Reports/2012/Digital-
differences.aspx.
Table 1: Whatcha Watchin'? iPhone App Pilot: Study Design
�
Downloaded from warc.com
�
�
9

Table 2: Whatcha Watchin'? Game Mechanics: Badges
Table 3: Whatcha Watchin'? Game Mechanics: Levels
�
Downloaded from warc.com
�
�
10
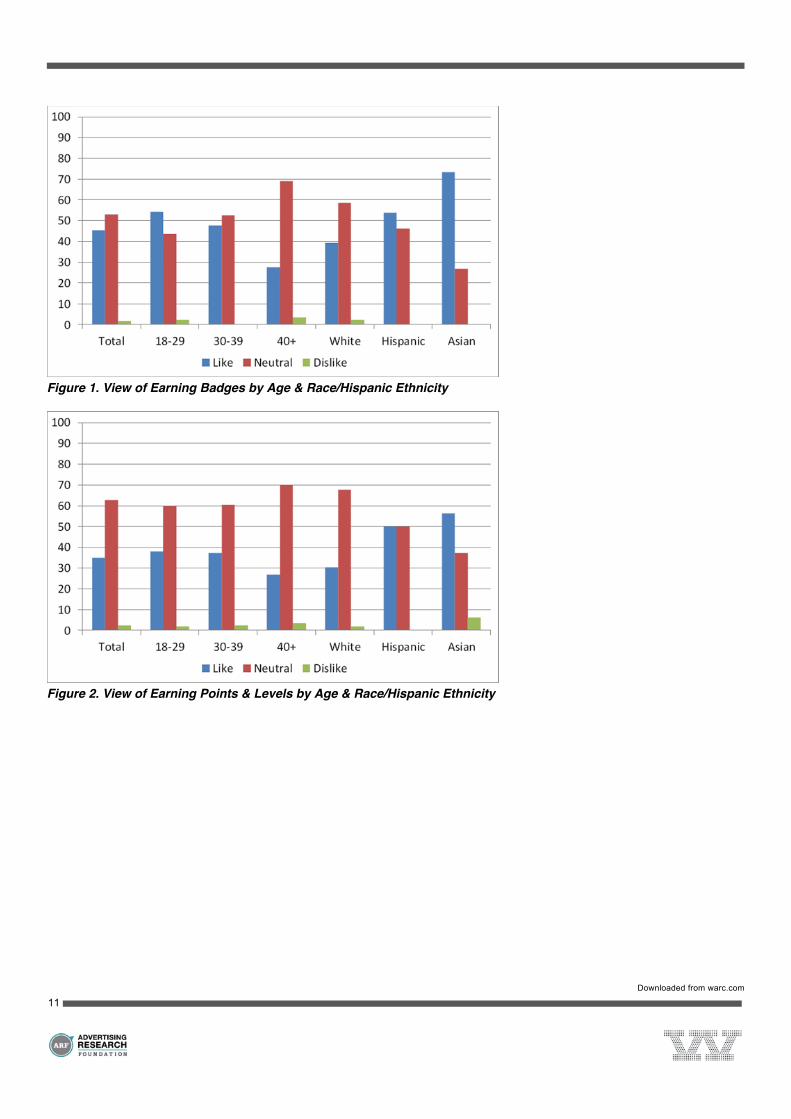
Figure 1. View of Earning Badges by Age & Race/Hispanic Ethnicity
Figure 2. View of Earning Points & Levels by Age & Race/Hispanic Ethnicity
�
Downloaded from warc.com
�
�
11
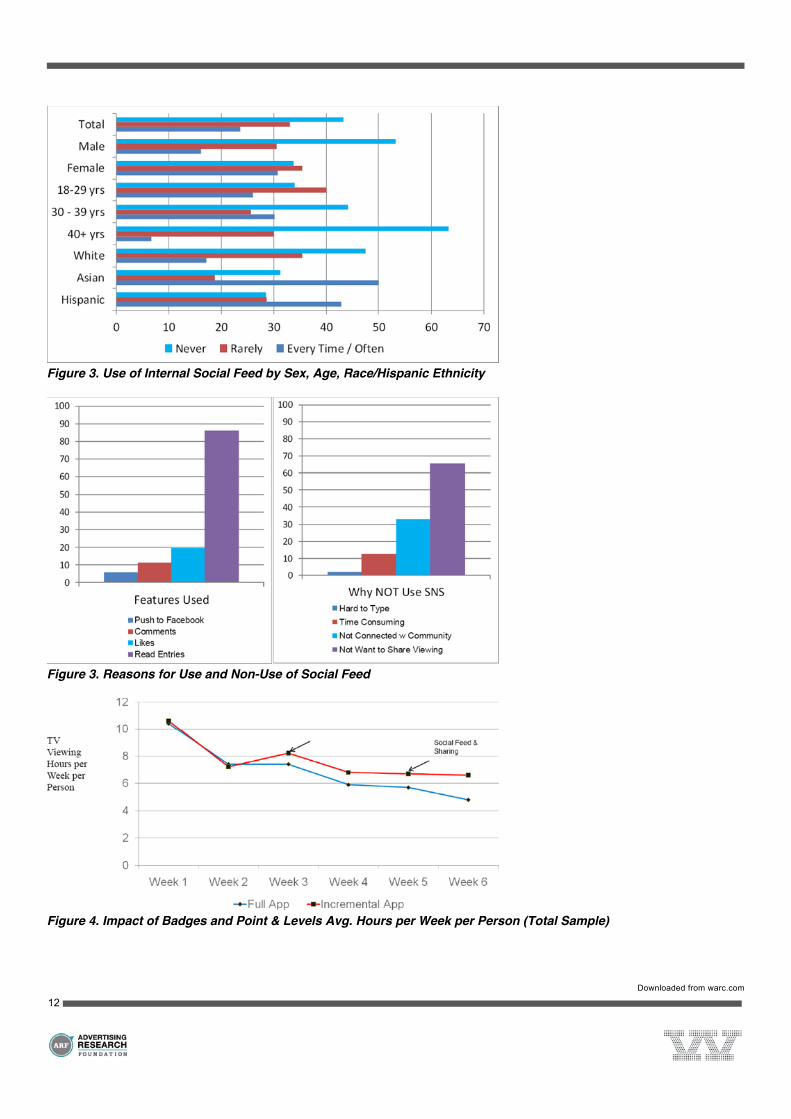
Figure 3. Use of Internal Social Feed by Sex, Age, Race/Hispanic Ethnicity
Figure 3. Reasons for Use and Non-Use of Social Feed
Figure 4. Impact of Badges and Point & Levels Avg. Hours per Week per Person (Total Sample)
�
Downloaded from warc.com
�
�
12
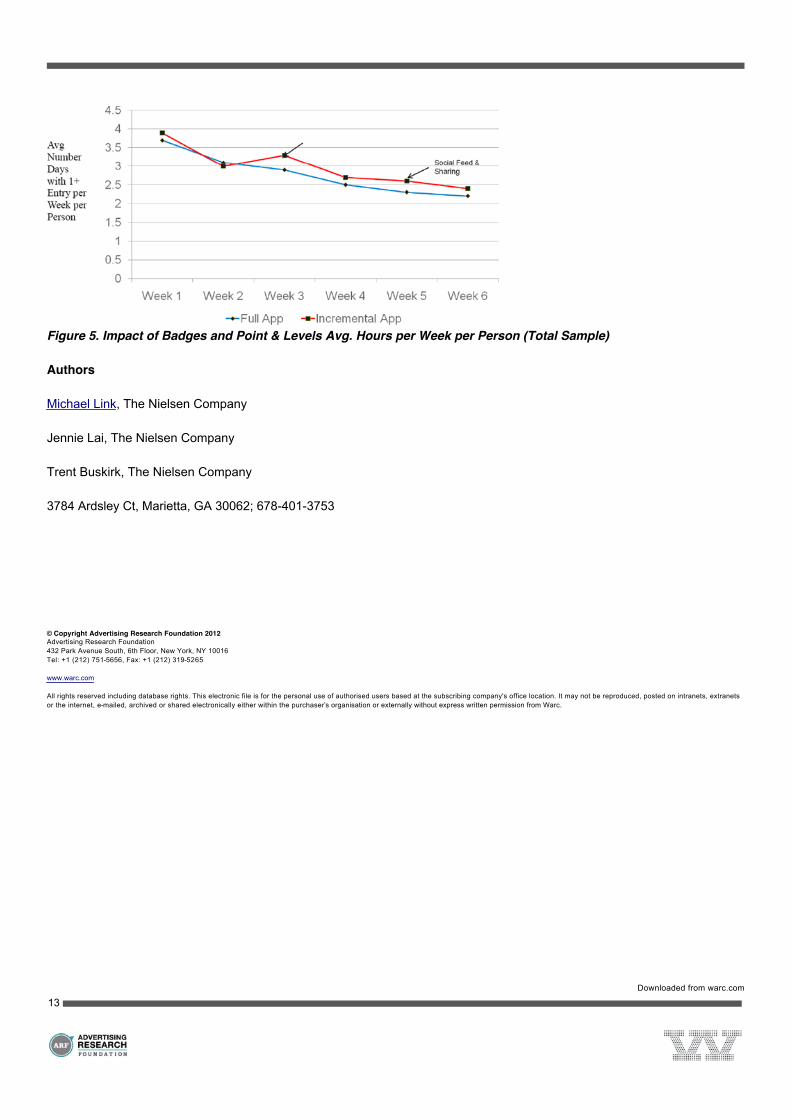
Figure 5. Impact of Badges and Point & Levels Avg. Hours per Week per Person (Total Sample)
Authors
Michael Link, The Nielsen Company
Jennie Lai, The Nielsen Company
Trent Buskirk, The Nielsen Company
3784 Ardsley Ct, Marietta, GA 30062; 678-401-3753
��Copyright Advertising Research Foundation 2012 Advertising Research Foundation 432 Park Avenue South, 6th Floor, New York, NY 10016 Tel: +1 (212) 751-5656, Fax: +1 (212) 319-5265 www.warc.com All rights reserved including database rights. This electronic file is for the personal use of authorised users based at the subscribing company's office location. It may not be reproduced, posted on intranets, extranets or the internet, e-mailed, archived or shared electronically either within the purchaser¶s organisation or externally without express written permission from Warc.
�
Downloaded from warc.com
�
�
13