USE OF GIS & REMOTE SENSING TO GENERATE SOIL EROSION RISK MAP CASE STUDY: IMBULPE DS DIVISION
32
USE OF GIS & REMOTE SENSING TO GENERATE SOIL EROSION RISK MAP CASE STUDY: IMBULPE DS DIVISION ABSTRACT The soil erosion is one of the acute and more severe threats to the conservation of soil in watershed areas and make a serious environmental problem in the country. Soil erosion is an important concern in Sri Lanka, which obstructs monitoring and mitigation of its effects. Taking this account, the main objective of this study was to identify the soil erosion risk in the Imbulpe Divisional Secretariat area which contains one of the main Hydropower Generating Station; “Samanalaweawa Power Station” in Sri Lanka. Imbulpe Divisional Secretariat area in Sri Lanka, was selected as the study area due to several reasons such as; the area is closer to the university and thereby data collection is easier in this area and Samanalawewa water reservoir is located within this area. Therefore, it is vital to generate soil erosion risk map in this area to monitor the capacity of the reservoir. By literature reviewing, it could be found that several models are available in the world to asses’ soil erosion, such as USLE, RUSLE, WEPP, CORINE and ROMSEM etc. Considering all these models, we decided to use CORINE model, which can be easily integrate with GIS and RS to generate erosion risk map in order to identify the areas with high soil erosion risk in Imbulpe Divisional Secretariat. Inputs to the CORINE model; erosivity, erodibility, topography and vegetation cover will be determined from meteorological data, field survey soil profile data and soil sample analysis, DEM and land use and land cover data respectively. KEY WORDS BGI Bagnouls-Gaussian aridity index
Transcript of USE OF GIS & REMOTE SENSING TO GENERATE SOIL EROSION RISK MAP CASE STUDY: IMBULPE DS DIVISION

USE OF GIS & REMOTE SENSING TO GENERATE SOIL EROSION RISK MAPCASE STUDY: IMBULPE DS DIVISION
ABSTRACT
The soil erosion is one of the acute and more severe threats tothe conservation of soil in watershed areas and make a seriousenvironmental problem in the country. Soil erosion is animportant concern in Sri Lanka, which obstructs monitoring andmitigation of its effects. Taking this account, the mainobjective of this study was to identify the soil erosion risk inthe Imbulpe Divisional Secretariat area which contains one of themain Hydropower Generating Station; “Samanalaweawa Power Station”in Sri Lanka. Imbulpe Divisional Secretariat area in Sri Lanka,was selected as the study area due to several reasons such as;the area is closer to the university and thereby data collectionis easier in this area and Samanalawewa water reservoir islocated within this area. Therefore, it is vital to generate soilerosion risk map in this area to monitor the capacity of thereservoir. By literature reviewing, it could be found thatseveral models are available in the world to asses’ soil erosion,such as USLE, RUSLE, WEPP, CORINE and ROMSEM etc. Considering allthese models, we decided to use CORINE model, which can be easilyintegrate with GIS and RS to generate erosion risk map in orderto identify the areas with high soil erosion risk in ImbulpeDivisional Secretariat. Inputs to the CORINE model; erosivity,erodibility, topography and vegetation cover will be determinedfrom meteorological data, field survey soil profile data and soilsample analysis, DEM and land use and land cover datarespectively.
KEY WORDS
BGI Bagnouls-Gaussian aridity index

CORINE Co-ordination of INformation on the Environment
DEM Digital Elevation Model
GIS Geographic Information System
GN GramaNiladari
MFI Modified Fournier index
ROMSEM ROManian Soil Erosion Model
RS Remote Sensing
RUSLE Revised Universal Soil Loss Equation
USLE Universal Soil Loss Equation
WEPP Water Erosion Prediction Project
INTRODUCTION
It is widely accepted that land degradation is one of the mostcritical problems affecting the future economic development inSri Lanka. The demands of a rapidly expanding population have setup pressures on the island’s natural resources and these in turnhave resulted in a high level of environmental degradation. Themore important signs are heavy soil losses; high sediment yields;soil fertility decline and reduction in crop yields;marginalization of agricultural land; salinization; landslidesand deforestation and forest degradation.
Figure 1.1 below prepared by Philippe Rekacewicz UNEP/GRID-Arendal and presented in the Atlas of desertification in theworld, second edition, Arnold Publishers, London, 1997 to show

the soil degradation of the world during the past 50 years. Thisfigure highlighted that Sri Lanka is under the “very degradedsoil” category alarming to make precautions.
Figure 3.1 Soil degradation in the world
According to the “ National Report on Desertification/LandDegradation in Sri Lanka, 2000” it has been estimated that nearlyone third of the land in Sri Lanka is subjected to soil erosion,the erodible proportion ranging from less than 10.0% in somedistricts to over 50.0% in others.
Severe erosion takes place in the hill country on sloping landsunder market gardens (vegetables and potatoes) tobacco, poorlymanaged seedling tea and chena cultivation. Soil erosion is alsoconsidered a threat to agricultural production in the rain fedfarming areas in the Dry Zone. Therefore, it can be conclude thatidentification of areas that are vulnerable to soil erosion canbe helpful for improving the knowledge about the extent of the
areas affected and ultimately for developing measures to controlthe problem.
Removing of the soil layer to other place from situated place byregularly is called as the soil erosion. It has gone long time tomaking the soil but short time for reducing. Because of thatlayer erosion, soil is unfertile and not suitable for growingplants.
On the other hand soil erosion is a natural process, occurringover geological time, and indeed it is a process that isessential for soil formation in the first place. The mostdominant effect is the loss of top soil, which is often notnoticeable but nevertheless potentially very damaging. Physicalfactors like climate, topography and soil characteristics areimportant in the process of soil erosion.
According to the literature review, there are several methods areavailable for soil erosion risk mapping such as CORINE, WEPP andROMSEM. CORINE model was developed based on USLE in the countriesof European Union. CORINE model can be easily integrated with GISand RS to identify the soil erosion risk area. The use of remotesensing and techniques makes soil erosion risk estimation and itsspatial distribution feasible with reasonable costs and betteraccuracy in larger areas. Also this provides facility toestimate soil erosion risk on a cell-by-cell basis based ondigital elevation model (DEM) data. GIS techniques use tointerpolate CORINE parameters for sample plot to determine wholestudy area.
METHODOLOGY
Study Area
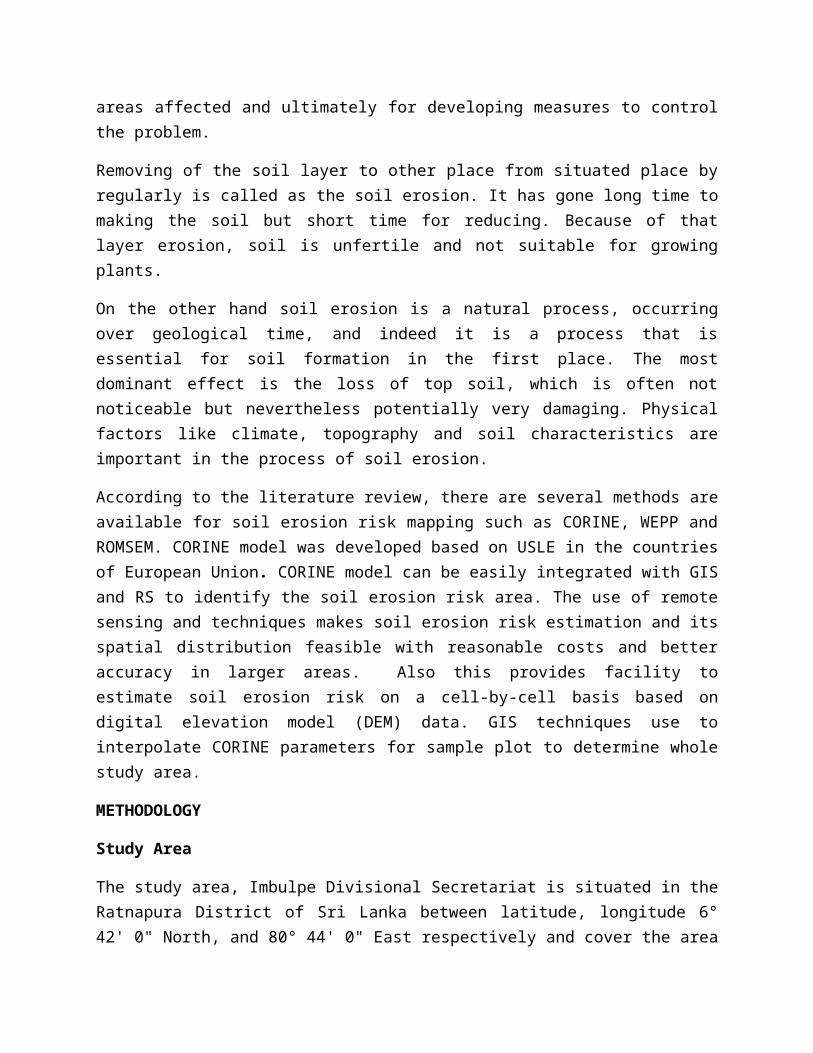
The study area, Imbulpe Divisional Secretariat is situated in theRatnapura District of Sri Lanka between latitude, longitude 6°42' 0" North, and 80° 44' 0" East respectively and cover the area
of 255.264403Km2. Total population is 44436 approximately. Thereare 50 GN divisions in this area.
Samanalawewa Hydroelectric power station which is the second-largest hydroelectric scheme in the country is located within thestudy area, producing 405 GWh of energy annually. It was built atthe confluence of the Walawe River and the BelihulOya, a location400 meters (1,300 ft) above mean sea level. This Reservoirproduces 60 to 120 MW, which is about 10 percent of country’stotal hydroelectricity generation (TEAMS, 1992; CEB, 2006).
The mean annual rainfall in the study area varies from 900mm to3,175mm. The main soil types are Red Yellow Podzolic, MountainRegosols, Brown Latosols, Red Yellow Podzols, immature BrownLoams, Reddish Brown earth, and immature Loams.
Study Area

Soil Texture
Soil Depth
Stoniness
Bagnouls-Gaussian Aridity Index
Fournier Index
Soil Erodibility
Topography
Erosivity
Potential Soil Erosion Risk
Land cover
Population Density
Actual Soil Erosion Risk
Soil erosion risk
Structure of edited CORINE model

Figure 3.1 Flow of the methodology of this study.

Figure 3.1 above illustrate the flow chart of the methodology ofour study. CORINE model was used to generate actual soil erosionrisk map. Main inputs to the CORINE model to estimate actualerosion risk are soil erodibility, erosivity, topography (slope),and land cover (vegetation cover). Soil erodibility, erosivity,and topography (slope)inputs are integrated together usingspatialanalysis tool in Arc GIS environment to estimate the potentialsoil erosion risk area. Then this potential risk area map isoverlaid with land cover data to get the output of the CORINEmodel which indicate the actual erosion risk area. It is wellknown that human activities are significantly affected to thesoil erosion. Assuming that there are more human activities inhigh population density areas, actual soil erosion risk map isoverlaid with population density map to see the effect of humanactivities on soil erosion.
Soil Erodibility
In CORINE methodology, soil Erodibility was calculated byconsidering soil texture, soil depth, and stoniness. Texture iscategorized using the size of the particles that made up thesoil. The terms sand, silt, and clay are referred to relativesizes of the soil particles. Sand, been the larger size ofparticles, felt gritty. Silt, been moderate in size, had asmooth or floury texture. Clay, been the smaller size ofparticles, felt sticky. (CMG Garden Notes# 214, December 2009)(http://www.ext.colostate.edu/mg/gardennotes/214.html , Retrievedon 03.01.2012) Silt, very fine sand and clay soils tend to beless erodible than sand, sandy loam and loamy soils.
If there are stones over the soil surface, it is caused to reducethe erosion by protecting soil from rain splash. On the otherhand existence of stones is caused undesirable effects bycheering rill erosion through water turbulences.

Higher water holding capacity is raised with the increase of soildepth and helped to prevent overland flow by absorbing largeramounts of rainfall.
Finally, the soil Erodibility index iscalculated as a combinationof soil texture, soil depth and stoniness as follows.
Soil Erodibility Index = Texture Class * Depth Class * StoninessClass …….Eq. 3.1
Erosivity
It principally depends on the intensity and the amount ofrainfall and defined as detachment and transportation of soil dueto raindrop impact and runoff. In CORINE model, erosivity wascalculated by integrating the Fournier index and Bagnouls-Gaussian aridity index (BGI)(http://www.mdpi.com/1424-8220/8/8/4851/). Fournier index was developed specially tomeasure Erosivity at a regional scale. The modified Fournierindex (MFI) was computed depending on total precipitation in amonth and total mean annual precipitation as follows.
The Moderate Fournier index=∑k=1
12pk2
/P
In this equation P is Total precipitation for month, pk is Totalmean annual precipitation, k is the number which is represent themonth from January to December.
Equation for the BGI was as follows.
The Bagnouls-Gaussian Aridity index=∑k=1
12
(2×Tk−pk )×mk
…….Eq. 3.2
………Eq 3.3

In this equation Tk is mean temperature for month, pkistotal
precipitation, mk is proportion of the month and k is the number
which is represent the month from January to December.
Proportion of the month during which (2×Tk−pk11 ) >0.BGI index was
calculated for eight known stations located surrounding the studyarea and with the help of IDW interpolation tool in SpatialAnalyst extension of ArcGIS 9.3 BGI map for the study area wascreated.
Erosivity index = Moderate Fournier index * Bagnouls-Gaussianaridity index
Then Erosivity index was also reclassified into three classessuch as low, moderate, and high.
Topography (Slope)
One of the important factors in soil loss was topography. Whenthe ground slope was exceeded a critical angle, soil erosion isconsiderable. The slope layer was generated in ArcGIS 9.3 fromDigital Elevation Model (DEM). In CORINE model, the topographicfactor was defined in terms of average regional slope. In thisstudy DEM was generated by using spot heights of the area. Thenslope layer was derived from the DEM and classified into fourclasses such as very gentle flat where slope percentage less than5%, gentle where slope percentage in between 5 to 15 steep whereslope percentage in between 15 – 30 , and very steep where slopegreater than 30. Value assigned for each class as 1, 2, 3, and 4respectively.
Vegetation Cover
………Eq 3.4

Sri Lanka (Around 1800’s)had nearly 80% of its land under naturalforest. Due to various human induced practices, mainly theopening of plantations and growth of human settlement Sri Lankahad lost much of its natural forest in the last two hundredyears. In fact this trend had accelerated after Independence.Deforestation was caused to increase the soil erosion. Thevegetation cover was resulted in better water-holding capacity,reduces runoff, and improves infiltration. Also vegetationreduced the erosion rate by intercepting raindrops. Goodvegetation was protected the soil as covering a layer. The landuse digital data was used to generate vegetation cover. Samefeatures were grouped using dissolve function in data managementextension of ArcGIS 9.3. Vegetation cover was classify into twoclasses such as fully protected and not fully protected. Fullyprotected class includes forest or permanent vegetation such as,frost, tea, rubber, rock, and scrub. Not fully protected meanscultivated or bare land such as Chena cultivation, homes, grass,paddy, other cultivations and water bodies.
Actual Erosion
First, soil Erodibility, Erosivity, and topography layers wereintegrated by applying Spatial Analyst tool in the 3D Analystextension of ArcGIS 9.3 in order to generate the potential soilerosion risk map of the study area as follows.
Potential Soil Erosion Risk Index= Soil Erodibility Index *Erosivity Index * Slope Index
Then vegetation cover was integrated with the potential soilerosion risk layer in ArcGIS 9.3 to generate the actual soilerosion risk map. Finally, actual soil erosion risk map wasclassified into three classes such as low, moderate, and high.
………Eq 3.5

Population
Population is another key factor that affect in soil erosion.Human activities were main reason for erosion in Sri Lanka aswell as all over the world. In the present time soil erosion ishappened in agricultural lands because of the unsystematic andinformal cultivations. People cut down many trees, but they don'tthink to plant any tree. People do mining for find gems, graphiteand then leave those lands carelessly. Also human activities suchas logging, improper farming, overgrazing, construction, off roadvehicles and intense foot traffic influence the erosion.Therefore it is cleared that humans' careless activities promotedthe soil erosion. Since in this study, population density map wasoverlaid with the actual soil erosion risk map to create soilerosion risk map. The population density map was classified intothree classes such as low, moderate and high.
Soil Erosion risk = Actual Soil Erosion * Population Density……Eq. 3.6
RESULTS
SOIL ERODOBILITY MAP
This map highlighted that about 42% of the study area was coveredby low erodible soils, while lower percentage (25%) of the areafall to highly erodible class. 33% of the area was covered bymoderately erodible soil.

Figure 4.7 Soil Erodibility Map

Figure 4.8 Soil Erodibility Graph
SOIL EROSIVITY MAP
Erosivity of the environment is primarily a result of climaticconditions. Traditionally, rainfall intensity is considered to bethe major determinant of Erosivity. Whilst the Fournier index isbelieved to give a board estimate of rainfall concentration, itis not considered satisfactory as a measure of Erosivity in itsown right. In particular, it can be argued that, in Mediterraneanareasaridity tends to encourage erosion by reducing vegetationcover and exposing the soil surface to raindrop impact (splasherosion).
The resultant Erosivity map is shown in figure and it wasclassified into three classes. Below mention bar graph displaysthat percentage of coverage of each of these classes.

Figure 5.1 Erosivity Map

Figure 5.2 Erosivity Graph
Map reveals that percentage of area covered by low and moderatelyerosivity classes are approximately equal and area fall intohighly erosivity class is less.

Figure 5.3 Slope Map
Slope is undoubtedly one of the most important determinants ofsoil erosion. Erosion may occur when slope exceeds a criticalangle and it increases with the absence of vegetation cover.

Figure 5.4 Slope Graph
Map and graph put on view that about 67% of the study area fallinto steep and very steep slope classes, which may significantlyincrease the soil erosion due to runoff. The rest of the studyarea has a slope ranging from very gentle flat to gentle slope

Figure 5.5 Land Cover Map
Vegetation cover is the most crucial element in erosion models,since it is the only factor that can readily be altered, andprovides effective soil erosion control. In addition, soilerosion has accelerated due to inappropriate land uses andcontinuous cultivation on steeper land. The land use data is

classified into two classes; fully protected and not fullyprotected based on CORINE method. In the study area, forest,rubber, rocky, scrub, and tea were classified as fully protected,while water bodies, grasses, homes, paddy, chena and othercultivation were classified as not fully protected. Resultant mapis shown in figure 5.6

Figure 5.6 Land Cover Map
POTENTIAL SOIL EROSION RISK MAP
Potential soil erosion risk which is taken to represent theinherent susceptibility of the land to erosion; it is derivedfrom the basic physical factors of soil, climate and topography.The potential soil erosion risk map was generated by integratingsoil Erodibility, Erosivity, and slope maps according to Eq.3.5and generated map is shown in figure 5.8. This map and graph puton view that amount of land susceptible to soil erosion risk isin less percentage. Further, they illustrate that total landmoderately disposed to soil erosion is considerable. Besides theyhighlighted that 46% of land subject to low erosion risk. But itis clearly know that soil erosion is significantly affected bylanduse/ land cover of the area. Therefore, actual soil erosionrisk can be varied from this potential erosion risk since landcover factor was not considered to calculate potential risk. InCORINE model landuse /land cover of the area were considered todetermine the actual erosion risk.

Figure 5.7 Potential Soil Erosion Risk Graph

Figure 5.8 Potential Soil Erosion Risk Map

ACTUAL SOIL EROSION RISK MAP
Figure 5.9 displays the actual soil erosion risk map of the areagenerated in this study. This map displays different level ofrisk in the area for soil erosion. It is determined by adjustingthe potential soil erosion risk with the protection afforded bythe present land cover.

Figure 5.9 Actual Soil Erosion map

Figure 6.0 Actual Soil Erosion Risk Graph
The map and graph say that small extent of the land is protectedfrom soil erosion. Percentage of land fall into high actual soilerosion risk class is 27% and moderate actual risk is 49%.
By comparing potential erosion risk and actual soil erosion riskmaps, it can be conclude followings. Percentage of lands havinghigh actual soil erosion risk has increased and amount of landshaving low actual erosion risk decreased. This resultsdemonstrate that soil erosion is highly affected by land use /land cover of the area.
To see how human activities affected to soil erosion, actual soilerosion risk map was overlay with population density mapaccording to the Eq. 3.6. Here, we assumed that high populationdensity areas have more human activities. Population density mapwas created by using population data collected from DistrictDivisional Office of Imbulpe. This map is shown in figure 6.1.

Figure 6.1 Population Density Map
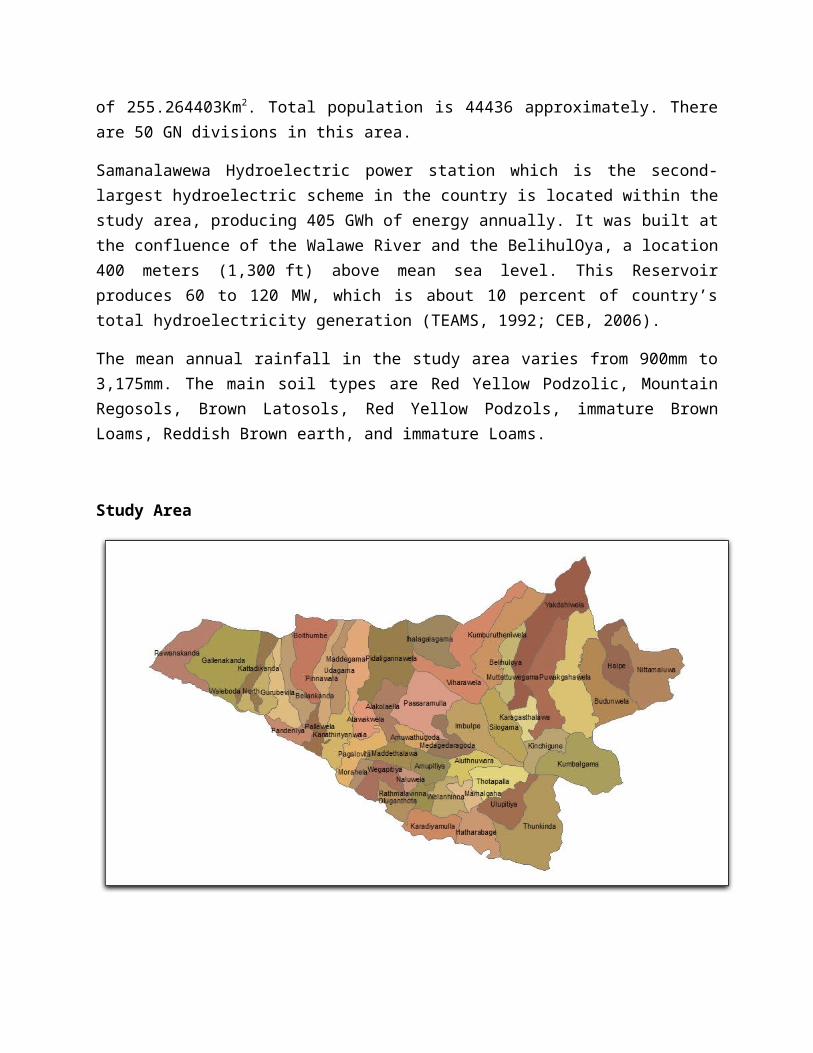
SOIL EROSION RISK MAP
Figure 6.2 Soil Erosion Risk Map
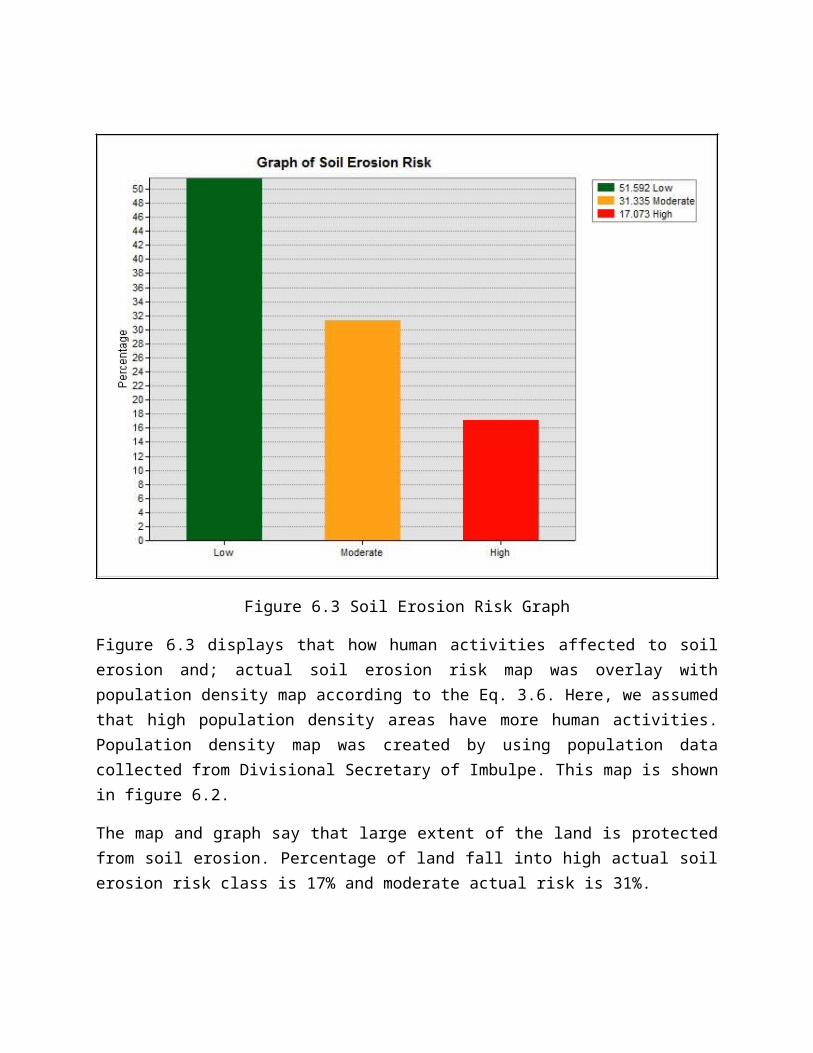
Figure 6.3 Soil Erosion Risk Graph
Figure 6.3 displays that how human activities affected to soilerosion and; actual soil erosion risk map was overlay withpopulation density map according to the Eq. 3.6. Here, we assumedthat high population density areas have more human activities.Population density map was created by using population datacollected from Divisional Secretary of Imbulpe. This map is shownin figure 6.2.
The map and graph say that large extent of the land is protectedfrom soil erosion. Percentage of land fall into high actual soilerosion risk class is 17% and moderate actual risk is 31%.

DISCUSSION
67% of our study area was fallen into steep and very steepclasses which indicate high soil erosion in the study area. Soilerosion risks mainly depend on the vegetation cover, becausestudy had several of cultivation such as tea, rubber, and gardenetc. Potential soil erosion risk map indicated erosion risk isvery low, but potential risk map comparing with vegetation coverindicated erosion risk was high in the study.
Actual soil erosion overlaid with population density obtainedSoil erosion risk map which indicated the study area was lowerosion. Human effects were not highly increase the soil erosion.
CONCLUSION
This study indicated that using GIS technologies for erosion riskmapping, based on the methodology implemented in CORINE model.Even though this method requires advanced GIS technologies andsophisticated computer involvement, the users with basic computerskills can implement it without any assistants from the computerspecialists. Parameters of CORINE method can easily found out.Acceptable Soil erosion risk map can produce within less timeperiod.
REFERENCE
Field Geogly Author: Frederic H.Lahee, Ph.D

DisasterRisk Reduction & Climate Change Adaptationat Sri LankaFoundation Institute (SLFI), Colombo Organized by DisasterManagement Centre of the Ministry of Disaster Management.
Mapping Soil Erosion Risk in Rondonia, Brazilian Amazonia: usingRUSLE, Remote Sensing and GIS. D. Lu, G. Li, G. S. Valladares andM. Batistella.
People’s perception and socioeconomic determinants of soilerosion: A case study of Samanalawewa watershed, Sri Lanka. E. P.N. UDAYAKUMARA, R. P. SHRESTHA, L. SAMARAKOON, and D. SCHMIDT-VOGT
Soil erosion in the West African Sahel: a review and anapplication of a `local political ecologya approach in South WestNiger. Andrew Warren, Simon Batterbury, HennyOsbahr.
Using the Remote Sensing and GIS Technology for Erosion RiskMapping of Kartalkaya Dam Watershed in Kaharamanmaras, Turkey.Aladdin Yuksel, RecepGundogan and Abdullah E.Akay
http://www.ars.usda.gov/Research/docs.htm?docid=6014
http://www.ars.usda.gov/SP2UserFiles/ad_hoc/36021500WEPP/weppHistory.pdf
http://www.ehow.com/how_8782513_calculate-modified-fournier-index.html
http://en.wikipedia.org/wiki/United_Nations_Convention_to_Combat_Desertification
http://www.evsc.virginia.edu/~alm7d/soils/handouts/USLE.pdf
http://www.desire-his.eu/wimba/WP2.1%20Indicators%20in%20the%20study%20sites%20(Report%2066%20D211%20Mar10)/page_06.htm
http://www.forestrynepal.org/wiki/354

http://www.geo.fu-berlin.de/fb/e-learning/geolearning/en/soil_erosion/types/index.html
http://www.greenfix.com/Channel%20Web/pdfs/RUSLE%20Guidelines.pdf
http://journals.tubitak.gov.tr/agriculture/issues/tar-05-29-6/tar-29-6-3-0408-4.pdf
http://www.omafra.gov.on.ca/english/engineer/facts/87-040.htm
http://www.sundayobserver.lk/2004/05/23/new22.html
http://www.teara.govt.nz/en/soil-erosion-and-conservation/3
http://www.unibas.it/desertnet/dis4me/indicator_descriptions/aridity_index_(1).htm
http://www.unibas.it/desertnet/dis4me/indicator_descriptions/rainfall.htm
http://www.unibas.it/desertnet/dis4me/indicator_descriptions/climate_quality_index.htm


![ksx ds funsZ'ku ds vUrxZr LukrdksŸkj] bfrgkl foHkkx dk ikB;Øe ...](https://static.fdokumen.com/doc/165x107/631bc8b3c2fddc481907b1c2/ksx-ds-funszku-ds-vurxzr-lukrdksykj-bfrgkl-fohkkx-dk-ikboe-.jpg)