Urban form and job access: disparate realities in the Randstad
16
WINDOW ON THE NETHERLANDS URBAN FORM AND JOB ACCESS: DISPARATE REALITIES IN THE RANDSTAD MAARTEN VAN HAM, PIETER HOOIMEIJER & CLARA H. MULDER Urban Research Centre Utrecht – NETHUR, Faculty of Geographical Sciences, Utrecht University, PO Box 80.115, 3508 TC Utrecht, The Netherlands. E-mail: [email protected] Received: July 2000; revised November 2000 ABSTRACT Deconcentration of employment is the driving force behind the rise of the complex urban forms of the polycentric city and the polynucleated metropolis. It is often assumed that the decon- centration process improves job access for average and highly skilled workers, allowing them to move to peripheral residential locations and triggering a new round of urban sprawl. It is also hypothesised that access to suitable job opportunities is withheld from low-skilled workers living in inner-city neighbourhoods as a result of the deconcentration of low-skilled employment beyond their commuting tolerance. In this contribution we illustrate how network-oriented GIS provides an instrument to enable the evaluation of the job access of residential locations at varying levels of commuting tolerance and for various types of employment. Application of this instrument to the metropolitan area of the Randstad shows that suburban locations in between major employment centres are clearly superior for households with highly skilled workers, making urban sprawl towards residential locations outside the Randstad unlikely. It is also shown that for poorly skilled workers with limited commuting tolerance the central city is still the best place to live. Key words: Job access, commuting tolerance, polycentric urban structures, network-oriented GIS INTRODUCTION The spatial mismatch between where workers live and where jobs are located is a cause of both wasteful commuting, creating inefficiencies, and of underemployment among those with limited commuting tolerance, creating in- equities. The deconcentration of employment – the dominant process in the rise of poly- centric urban forms – changes this spatial mismatch, bringing work closer to suburban residential locations and taking it farther away from inner-city neighbourhoods. New ques- tions arise, such as whether these suburban locations now provide better job access lead- ing to shorter commutes and whether poor workers in the inner-city become deprived of job opportunities. The answers to these ques- tions would seem self-evidently to be in the affirmative; however, inspection reveals that reality is somewhat more complex. The issue of varying commuting tolerance is prominent in the literature on urban land use. The classic land-use model (Alonso 1964) is constructed on the monocentric city in which all jobs are assumed to be located in the CBD. A worker’s choice of a residential location is made on the basis of a trade-off between hous- ing quality and commuting costs. Workers with lower incomes and therefore limited commuting tolerance tend to occupy the high density, low quality urban housing while those Tijdschrift voor Economische en Sociale Geografie – 2001, Vol. 92, No. 2, pp. 231–246. # 2001 by the Royal Dutch Geographical Society KNAG Published by Blackwell Publishers, 108 Cowley Road, Oxford OX4 1JF, UK and 350 Main Street, Malden MA 02148, USA
-
Upload
independent -
Category
Documents
-
view
9 -
download
0
Transcript of Urban form and job access: disparate realities in the Randstad
WINDOW ON THE NETHERLANDS
URBAN FORM AND JOB ACCESS: DISPARATEREALITIES IN THE RANDSTAD
MAARTEN VAN HAM, PIETER HOOIMEIJER & CLARA H. MULDER
Urban Research Centre Utrecht ± NETHUR, Faculty of Geographical Sciences, Utrecht University,PO Box 80.115, 3508 TC Utrecht, The Netherlands. E-mail: [email protected]
Received: July 2000; revised November 2000
ABSTRACTDeconcentration of employment is the driving force behind the rise of the complex urban formsof the polycentric city and the polynucleated metropolis. It is often assumed that the decon-centration process improves job access for average and highly skilled workers, allowing them tomove to peripheral residential locations and triggering a new round of urban sprawl. It is alsohypothesised that access to suitable job opportunities is withheld from low-skilled workers livingin inner-city neighbourhoods as a result of the deconcentration of low-skilled employmentbeyond their commuting tolerance. In this contribution we illustrate how network-oriented GISprovides an instrument to enable the evaluation of the job access of residential locations atvarying levels of commuting tolerance and for various types of employment. Application of thisinstrument to the metropolitan area of the Randstad shows that suburban locations in betweenmajor employment centres are clearly superior for households with highly skilled workers,making urban sprawl towards residential locations outside the Randstad unlikely. It is also shownthat for poorly skilled workers with limited commuting tolerance the central city is still the bestplace to live.
Key words: Job access, commuting tolerance, polycentric urban structures, network-orientedGIS
INTRODUCTION
The spatial mismatch between where workerslive and where jobs are located is a cause of bothwasteful commuting, creating inefficiencies,and of underemployment among those withlimited commuting tolerance, creating in-equities. The deconcentration of employment± the dominant process in the rise of poly-centric urban forms ± changes this spatialmismatch, bringing work closer to suburbanresidential locations and taking it farther awayfrom inner-city neighbourhoods. New ques-tions arise, such as whether these suburbanlocations now provide better job access lead-ing to shorter commutes and whether poor
workers in the inner-city become deprived ofjob opportunities. The answers to these ques-tions would seem self-evidently to be in theaffirmative; however, inspection reveals thatreality is somewhat more complex.
The issue of varying commuting tolerance isprominent in the literature on urban land use.The classic land-use model (Alonso 1964) isconstructed on the monocentric city in whichall jobs are assumed to be located in the CBD.A worker's choice of a residential location ismade on the basis of a trade-off between hous-ing quality and commuting costs. Workerswith lower incomes and therefore limitedcommuting tolerance tend to occupy the highdensity, low quality urban housing while those
Tijdschrift voor Economische en Sociale Geografie ± 2001, Vol. 92, No. 2, pp. 231±246.# 2001 by the Royal Dutch Geographical Society KNAGPublished by Blackwell Publishers, 108 Cowley Road, Oxford OX4 1JF, UK and 350 Main Street, Malden MA 02148, USA
with higher incomes and a greater commutingtolerance move to low density, high qualityhousing in the suburbs.
The deconcentration of employment has ledto polycentric urban structures with multiplecentres of employment and services and dis-persed patterns of residential locations. It hasrepeatedly been claimed (Hall 1984; Gordonet al. 1989; Batten 1995) that polycentric struc-tures are more efficient than monocentricstructures, because deconcentration reducesthe gap between job locations and housingdevelopments. The implicit assumption in thisargument is that while employment is dynamic,residential locations remain fixed. Clark andKuijpers-Linde (1994) question this assump-tion. In their view, the deconcentration ofemployment increases the scale of suburban-isation. Sites for residential development ata greater distance from the city centre comewithin the range of the deconcentrated em-ployment centres. The development of thesesites over a wider area causes urban sprawl andcommuters' increased automobile depen-dence, contributing to congestion.
This image of the expanding metropoliscreated by Clark and Kuijpers-Linde is basedon an implicit assumption. Even though bothresidence and employment are dynamic, theauthors assume the dominance of the work-place in the search for a residential location;people choose a dwelling within commutingrange of their place of work. This assumptionis increasingly becoming invalid. In an erawhen many dual-earner households have tocombine more than one workplace with oneplace of residence and where people changejobs more often, the choice of residencedepends less on one job in a fixed locationthan on the number of jobs (including thepresent ones) within reach of the residence.Rather than assume that within the radius ofa given employment centre the residentiallocation is immaterial, the location shouldbe evaluated in terms of access to multiplecentres. In polycentric urban structuresresidential locations will vary in job accessdepending on the distances to employmentnodes and the transportation structures link-ing the residence to these nodes.
The first objective of this contribution is todescribe an instrument to measure the job
access of residential locations. Job access is thenumber of employment opportunities thatcan be reached within a fixed commuting timefrom the residence via the transportationnetwork. The question addressed is: which(urban or suburban) residential locations arefavourable in terms of access to multiple jobs,given the level of commuting tolerance of thehouseholds involved?
The issue of underemployment among thosewith limited commuting tolerance is incor-porated in the literature on labour economics.Here the implicit assumption is one ofresidence place dominance. Job search isassumed to start at home and commutingenters the analyses in the form of monetaryor time expense. According to Fisher andNijkamp (1987), up to the late 1980s laboureconomists have neglected the spatial dimen-sion of labour markets. In the more recentdebate on the spatial mismatch for low-skilledworkers, two aspects are pervasive; commutingtolerance and segmentation of the labourmarket (Preston & McLafferty 1999). The firstaspect, limited commuting tolerance, createsa spatial barrier to job access (Holzer et al.1994). Commuting tolerance might be a prob-lem not only for low-skilled workers (becauseof the monetary costs of commuting relativeto the wage level), but also for part-time em-ployees (because of the time-costs relative tothe number of working hours) (Madden &White 1980). According to Hanson and Pratt(1992): `For the majority of the workforce, theset of job opportunities actually available, orseriously considered, is highly spatially con-strained.' It cannot be assumed that peoplecan access any job within a regional labourmarket defined on the basis of average com-muting tolerance. The second aspect is the seg-mentation of the labour market. The labourmarket consists of separate functional labourmarkets characterised by a specific demandfor labour (Batenburg & De Witte 1996). Thesegmentation is of particular relevance forworkers with highly specialised human capitaland for workers lacking the proper qualifi-cations to enter jobs requiring higher skills.For this group, the relevant market is notdetermined by the total number of jobs withincommuting tolerance, but by the number ofopportunities for which they qualify.
MAARTEN VAN HAM, PIETER HOOIMEIJER & CLARA H. MULDER232
# 2001 by the Royal Dutch Geographical Society KNAG
The second objective of the paper is todescribe the application of the instrumentthat measures job access in evaluating theeffect of variation in commuting toleranceand of the spatial distribution of job oppor-tunities in functional sub-markets. The questionsaddressed are: which residential locations aremore favourable to those with limited com-muting tolerance in general; to those whosejob search is constrained by a lack of higherskills in particular; to those with a highcommuting tolerance, but specialised humancapital.
The remainder of this paper is organisedin five sections. The next section presents atheoretical framework within which the jobaccess of individuals from the residence canbe understood. This is followed by an assess-ment of variation in the job access ofresidential areas as a result of their locationrelative to the geographical distribution of jobopportunities at two geographical levels: thesingle urban region; and the metropolitanregion of the Randstad. There, the commutersheds of several urban regions overlap, facil-itating the evaluation of the effects of variationin urban form. The next section describes theinstrument for measuring job access and thedata. The next section presents the empiricalresults in the form of a series of map images;the final section puts forward a conclusion.
COMMUTING AND MIGRATIONTOLERANCE
Job access depends on the geographical dis-tribution of job opportunities and on theindividual spatial flexibility in reaching theseopportunities. Spatial flexibility can be splitinto commuting tolerance (the possibility ofcovering the distance between home andwork) and migration tolerance (the possibilityof adjusting the residential location) (Hooi-meijer 1996). We consider first commutingtolerance, then migration tolerance, movingto the geographical distribution of jobs in thenext section.
In the neo-classical labour market ap-proach, the concept of commuting tolerancetakes the form of the monetary cost ofcommuting. Jobs are within reach as long ascommuting costs do not exceed a certain
percentage of the gross wage rate. Followingthis line of reasoning, Phelps (1970) picturedthe economy as a group of labour market islandsbetween which moves are costly. The cost ofcommuting deters workers on one islandfrom accepting jobs located on other islands.HaÈgerstrand (1970) recognised that, besidesmonetary costs, commuting time is also animportant constraint on spatial behaviour.From a fixed residential location, the journeyto and from work is only possible when thisoccurs within the daily activity space of anindividual. This constraint can seriously re-strict people's access to suitable jobs (Hanson& Pratt 1992).
By including skills in the definition of aworker's job search area, Simpson (1992)added an important principle to the theore-tical framework within which the job access ofindividuals can be understood. According tothe human capital theory (Becker 1962),workers invest in productivity enhancing skillsand strive to maximise the utility of thisaccumulated human capital. The stock ofhuman capital people accumulate duringtheir lifetime has three main components.The first is general human capital, commonlyacquired through the education system andenhancing productivity equally in all firms.The second component is sector-specific hu-man capital (Simpson 1992). This humancapital does not enhance productivity equallyin all firms, but only in a specific sector ofthe economy. The third component is theenterprise-specific human capital acquiredwith tenure (on-the-job training) and, incontrast with general and sector specifichuman capital, is not transferable acrossemployers. According to the human capitaltheory, people differ in the level and special-isation of human capital. Because the costs ofa job change are considerable when a workerwith specific human capital moves to a jobwhere these specific skills cannot be utilised,not all jobs are valued equally and only asubset of the total jobs available is suitable.
The skills of workers also have an influenceon their spatial flexibility or commuting toler-ance. According to BoÈrsch-Supan (1990), skillshave a double-edged impact on labour mo-bility. With an increasing level and specialis-ation of human capital, the probability of a job
URBAN FORM AND JOB ACCESS: DISPARATE REALITIES IN THE RANDSTAD 233
# 2001 by the Royal Dutch Geographical Society KNAG
change decreases while at the same timegeographic mobility increases. Highly special-ised jobs have a lower spatial density soworkers with specific skills have to be moreflexible spatially. An important aspect of thehuman capital theory is that human capitalaccumulates over the life course. In order toobtain a better return on investments inhuman capital, people need to change jobsseveral times. They do so especially at thebeginning of their labour career (Topel &Ward 1992). This so-called job shoppingenables individuals to try out several jobs todetermine their comparative advantage, findhigher quality job matches and achieve betterpay. Especially for higher educated workers atthe beginning of their labour career spatialflexibility is a necessity for career advance-ment. For low-skilled workers this is less thecase. The costs of spatial flexibility relative tothe potential increase in wage level are toohigh. Because jobs for low-skilled workers aremore evenly spread there is less to gain fromspatial flexibility. Their labour market flexi-bility consists of moving into another tradewithin the same local labour market. Whilethe job mobility of lower-skilled workers ishigher, their spatial flexibility is lower.
A generally accepted standard for commut-ing tolerance is 45 minutes for a single worktrip (Wachs & Taylor 1993; Van Ommeren1996). Research by Van Ommeren (1996)shows that for commutes up to 30±45 minutes,resistance does not increase much with com-muting time. When commuting time exceeds45 minutes, however, resistance to commutingincreases sharply. A commuting tolerance of45 minutes is just the average upper limit;however, since people differ markedly in theirtime-space restrictions, at the individual levellarge variations in commuting tolerance canbe expected.
Until now, there has been little empiricalresearch on differences in commuting toler-ance between socio-economic groups. Muchmore is known about variations in the actualcommuting times of workers. Wachs andTaylor (1993) find for the USA that almosttwo-thirds of all employees spend less than35 minutes commuting to work. Similar resultscan be obtained for the Netherlands. Basedon the 1996 Netherlands Labour Force Survey
(CBS 1997) we found that nearly 50% of thoseemployed in the Netherlands commute lessthan 15 minutes per single work trip. Morethan 80% commute less than 30 minutes.Fewer than 9% of the working populationcommute more than 45 minutes. Thesefindings indicate that indeed only a very smallproportion of the working population isprepared to undertake long commutes over45 minutes.
Many authors have pointed out that womenhave consistently shorter commuting tripsthan men (Madden 1981; Gordon et al.1989). According to Hanson and Pratt(1992) this can be explained by the fact thatwomen are faced with severe day-to-day space-time constraints, dictated in part by theirdomestic workload. The presence of youngchildren in the household particularly restrictsthe daily activity space of women. The aboveindicates that the household situation is animportant determinant of commuting toler-ance.
Commuting tolerance is only one aspect ofspatial flexibility; the alternative to long-distance commuting is migration. It has longbeen established that commuting both com-plements and substitutes for migration (Ter-mote 1980). Any change in workplace requiresa concurrent decision either to change theresidential location and the commuting (com-plements), or to adhere to the originalresidential location and change the commute(substitutes).
Over the last few decades commutingtolerance has increased and migration toler-ance has decreased as a result of the rise in theshare of dual-earner households. Dual-earnerhouseholds have a lower propensity to a resi-dential move than couples or families with asingle breadwinner (Mulder 1993; Mulder &Hooimeijer 1999; Jarvis 1999). Migrationtolerance is lower for dual-earner households,since they have to combine more than oneworkplace with one residential location. Thecommuting tolerance of the partners in thesehouseholds on the other hand is higher,because the household income provides alarger budget for fast modes of transportation.This effect has been exacerbated by the risingeducational level of women as this leads tohigher gross household wages, enabling the
MAARTEN VAN HAM, PIETER HOOIMEIJER & CLARA H. MULDER234
# 2001 by the Royal Dutch Geographical Society KNAG
purchase of more efficient means of trans-portation. This rise in human capital alsowidens the job search area, triggering geo-graphical mobility.
Lower migration tolerance makes thechoice of a residential location more strategic.Locations providing easy access to multiplejobs permit maximum spatial flexibility usingcommuting as a substitute for migration. Evenwhen people migrate because of an employ-ment transition, the choice of a new resi-dential location will depend not only on thelocation of the present job, but also on theaccess to other jobs (for the partner, or forjobs later in life). This strategy, which isperfectly rational at the level of the individualhousehold, shows up as wasteful commuting atthe aggregate level.
JOB ACCESS OF RESIDENTIAL AREAS ANDTHE VARIATION IN URBAN FORM
The shift in micro-level decision-making re-sulting from decreasing migration tolerancehas two important implications for the evalu-ation by individual households of the jobaccess of residential locations. The first is thathouseholds in residential areas with access tonumerous jobs migrate less in the case of anemployment transition. The second is thathouseholds that do move find residentialareas that provide access to a large numberof jobs more favourable. The job access ofresidential areas depends on the locationrelative to the geographical distribution ofemployment opportunities and therefore onthe macro-level development of urban form.In the Netherlands we observe a gradual shiftfrom monocentric into polycentric urbanstructures.
The monocentric urban model is based onthe city as a daily urban system with an urbancore of employment and a surroundingsuburban residential area (Van der Laan et al.1998). The deconcentration of employmenthas resulted in the emergence of subcentresand therefore more complex daily urbansystems with multi-directed patterns of trafficflow. Increasingly, commuter sheds of indi-vidual polycentric cities tend to overlap eachother. At a higher spatial level, this develop-ment leads to the emergence of large poly-
nucleated metropolitan regions which developfrom the integration of several older nodeslocated relatively close to each other (Van derLaan 1998). These large urban regions donot contain a primate city and are often per-ceived as a single functional unit. Examplesin Europe are the Rhine-Ruhr metropolitanregion in Germany, the Flemish Diamond inBelgium and the Randstad in the Netherlands(Dieleman & Faludi 1998).
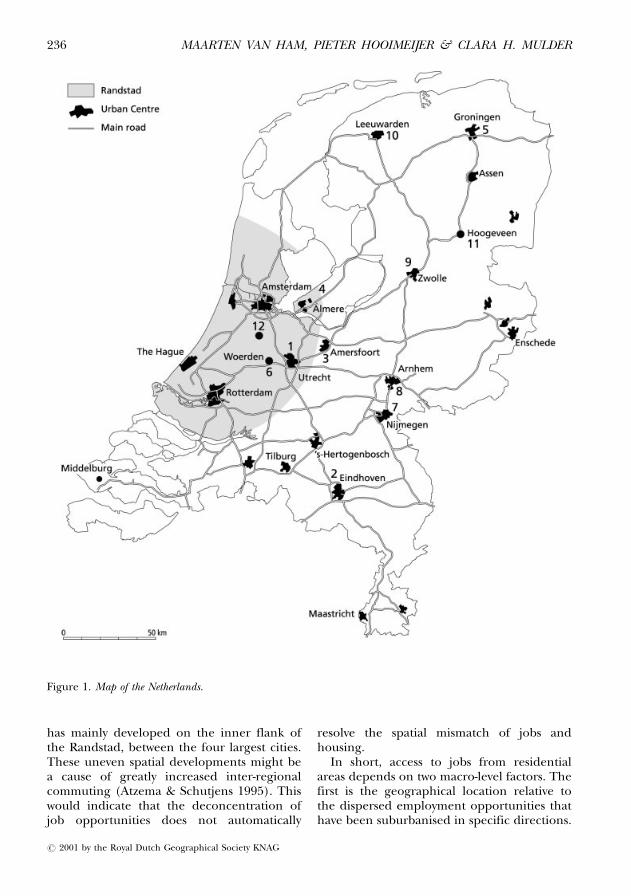
The Randstad is a classic example of apolynucleated metropolitan region (Figure 1).This complex urban region in the Westernpart of the Netherlands contains the cities ofAmsterdam, The Hague, Rotterdam andUtrecht ± the four main cities of the Nether-lands ± and several additional smaller nodes.These cities are located in close proximity toeach other and connected by intensive roadand rail networks. The Randstad has 7 millioninhabitants (almost 45% of the total popu-lation of the Netherlands) and contains amajor concentration of jobs (over 50% of allthe jobs in the Netherlands) on 20% of theterritory. The centre of the Randstad is a largeopen central area, the Green Heart, whereagriculture is still the dominant form of land-use. This characteristic has led the Britishplanner Gerald Burke (1956) to designate theRandstad Greenheart Metropolis.
In the past 25 years, two major changes havetaken place in the Netherlands' economy. Atthe level of individual cities, employment hasbecome suburbanised, moving from the centreto the edge of cities, locating at motorway exits(Hessels 1992). At the same time, a relativeshift has taken place from the Randstad toadjacent areas (Van der Vegt & Manshanden1996). These major changes in the economyhave led to a greater dispersal of job oppor-tunities in absolute terms. However, accordingto Batenburg and De Witte (1992) there arestill large regional differences in the Nether-lands in the qualitative employment structure(sector and job level).
It is not self-evident how the continuingdeconcentration of employment and the riseof polycentric structures will affect job accessin various residential areas in the metropolis.Priemus (1998) observed that many residentiallocations have been developed on the outeredge of the Randstad, whereas employment
URBAN FORM AND JOB ACCESS: DISPARATE REALITIES IN THE RANDSTAD 235
# 2001 by the Royal Dutch Geographical Society KNAG
has mainly developed on the inner flank ofthe Randstad, between the four largest cities.These uneven spatial developments might bea cause of greatly increased inter-regionalcommuting (Atzema & Schutjens 1995). Thiswould indicate that the deconcentration ofjob opportunities does not automatically
resolve the spatial mismatch of jobs andhousing.
In short, access to jobs from residentialareas depends on two macro-level factors. Thefirst is the geographical location relative tothe dispersed employment opportunities thathave been suburbanised in specific directions.
Figure 1. Map of the Netherlands.
MAARTEN VAN HAM, PIETER HOOIMEIJER & CLARA H. MULDER236
# 2001 by the Royal Dutch Geographical Society KNAG
The second is the position of the residentiallocation with respect to the transportation infra-structure, which provides access to centres ofemployment, particularly to the road infra-structure since new employment centres tendto locate at accessible locations along themotorways.
In evaluating the job access of residentialareas, the part played by micro-level factorsmust also be assessed. The first factor is thecommuting tolerance of the workers involved.For those with limited commuting tolerance,job searching will be restricted to a single orlimited number of employment concen-trations, while those with a wide commutingtolerance may reach several employmentcentres. The second factor is the level of skillof the workers involved. Those with mediumor high skill levels may choose to accept a jobrequiring less skill, but closer to home. Thosewith limited skills can only enter jobs forwhich they meet the requirements. The thirdfactor is the sector of the economy in whichthe worker has specialised. The evaluation ofthe job access of a residential location willdiffer for different groups. In combination,these factors lead to job access values thatdiffer substantially between socio-economicgroups for a vast number of residential areas.
METHODOLOGY AND DATA
From the above discussion it can be concludedthat an instrument to measure the job access ofa residential area for various socio-economicgroups has to meet four requirements. Thefirst is the spatial resolution. Both residentialand employment locations should be measuredat a detailed geographical level to evaluatevariation in access to a large number of jobsin dispersed locations, taking into account thevariation in commuting tolerance among thepopulation. The second requirement is ac-knowledgement of the crucial role of thetransportation networks linking residences tojobs, in particular the road networks, sincenearly 90% of commuters in the Netherlandsuse private modes of transport (CBS 1997).The quality of the connection, in terms of thespeed on the segments, is decisive in deter-mining the number of jobs that are withinreach. The third requirement is that the
instrument should be applicable at variousspatial scales, measuring the effects of boththe deconcentration of employment within asingle urban region and also of the overlap ofthe commuter sheds of individual cities withina wider metropolitan region. The fourth re-quirement is that the instrument should begeneric, that is to say no a priori delimitation ofgeographical area, functional submarkets, orhousehold groups should be needed.
To meet the first requirement, takingoptimal account of individual spatial restric-tions, the measurement would have to startfrom a very low spatial level (Louter 1997).Four-digit postal codes were chosen as thestarting point (almost 4,000 in the Nether-lands). To handle this geographical detail thechoice for a geographical information systemis obvious. However, few geographical infor-mation systems meet the second requirement,that distances should be measured in timespent using transportation infrastructure toget from one point to another. Flowmap, anetwork-oriented GIS extension developed atthe Faculty of Geographical Sciences, UtrechtUniversity (De Jong & Floor 1993), meets thisrequirement. The database includes the fullroad network, including the average travellingspeed on each segment. Algorithms to findthe shortest path (measured in time) can beused to calculate the full matrix of travellingtimes between every postal code area, meetingthe third requirement, as both short and longdistances are included in the output. Thesedistances can then be weighted on the basis ofthe total number of jobs, or a subset of jobsthat require specific skills within commutingreach of each postal code area.
In order to apply the instrument to measurejob access as described above to evaluate theeffect of variation in commuting toleranceand the spatial distribution of job oppor-tunities we made two choices. Because wewant to answer the question which residentiallocations are more favourable to workers withdifferent levels of commuting tolerance, thefirst choice is that we measure job access forthree different values of commuting tolerance(15, 30 and 45 minutes one-way commuting).These three levels reflect a low, middle andhigh level of commuting tolerance. Thesecond is that we use absolute measures of
URBAN FORM AND JOB ACCESS: DISPARATE REALITIES IN THE RANDSTAD 237
# 2001 by the Royal Dutch Geographical Society KNAG
the number of jobs within reach instead ofapplying some correction for the competitionfor these jobs from other job searchers resid-ing in the same area. We do so because whatwe are interested in is a measure of the totalopportunity set, which determines the prob-ability of a suitable job becoming available.
The data on the spatial distribution of jobsin the Netherlands by sector comes from aunique dataset: the National Information Systemon Employment (LISA).1 This dataset is aregistration of nearly all the establishments inthe Netherlands, including government andother non-commercial organisations. An estab-lishment is defined as an individual plant, store,or office ; multi-establishment firms have separ-ate listings for each establishment. The dataset includes information about total employ-ment per establishment (total number of full-time and part-time jobs), type of economicactivity, and the location of each job site byaddress. To estimate job access on the basis ofthe LISA dataset, all establishments are geo-coded to a postal code area using work siteaddresses. The data available was for 1997.
LISA does not contain information con-cerning job levels. To obtain this data analternative source had to be used. We used apooled sample of the Labour Force Surveys(EBBs) conducted by Statistics Netherlands in1994, 1995 and 1996. This pooled set of about300,000 respondents contains information onthe work location and job level of all workingrespondents in almost 600 municipalities.With this information we estimated a distri-bution of job levels for all four-digit postal codeareas (using the five job levels of StatisticsNetherlands).
Job access was estimated in a two-stepprocess. In the first step, the full matrix oftravelling times between postal code areas wascalculated. The travelling time between twolocations depends on the travel mode used.For the purpose of this paper, travelling timesby car over the road network2 were used. Thischoice is justified because more than 55% ofworkers in the Netherlands commute by car(CBS 1997). For workers who travel by bicycleor on foot this choice results in an over-estimation of their job access. The roadnetwork used includes data on average drivingspeeds per road segment. With the software
package Flowmap (De Jong & Floor 1993),travelling times by car where calculated fromthe centroid of each postal code area to allother postal code areas over the road network.Unfortunately it was not feasible to includecongestion. In the second step, for each postalcode i Flowmap identified all other postalcodes j whose centroids were within 15, 30, or45 minutes travelling time by car over the roadnetwork (a proximity count) and added up allthe jobs (full-time and part-time) within thisarea. This procedure was followed for all thealmost 4,000 postal codes in the Netherlands,which resulted in a unique value of job accessfor each postal code area.
JOB ACCESS IN MAPS
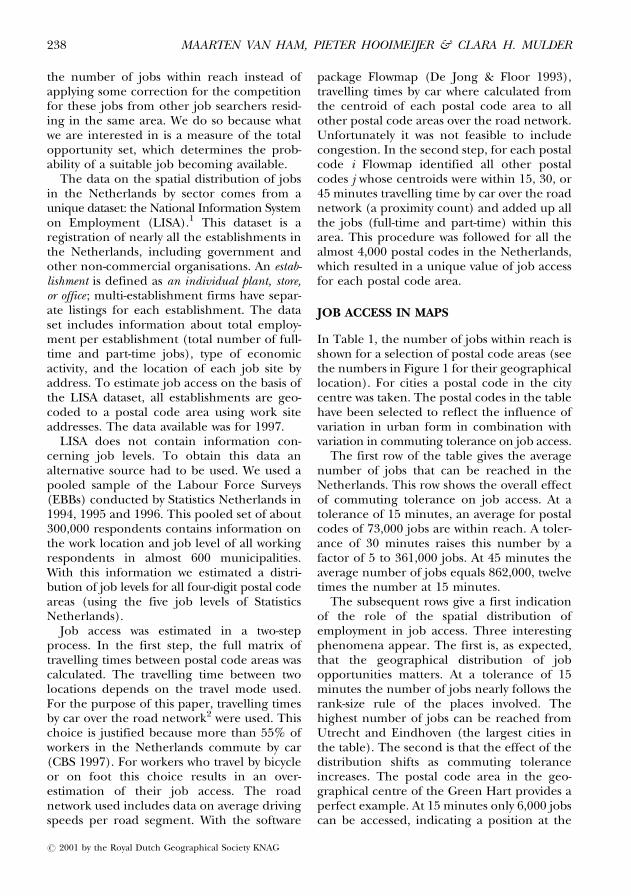
In Table 1, the number of jobs within reach isshown for a selection of postal code areas (seethe numbers in Figure 1 for their geographicallocation). For cities a postal code in the citycentre was taken. The postal codes in the tablehave been selected to reflect the influence ofvariation in urban form in combination withvariation in commuting tolerance on job access.
The first row of the table gives the averagenumber of jobs that can be reached in theNetherlands. This row shows the overall effectof commuting tolerance on job access. At atolerance of 15 minutes, an average for postalcodes of 73,000 jobs are within reach. A toler-ance of 30 minutes raises this number by afactor of 5 to 361,000 jobs. At 45 minutes theaverage number of jobs equals 862,000, twelvetimes the number at 15 minutes.
The subsequent rows give a first indicationof the role of the spatial distribution ofemployment in job access. Three interestingphenomena appear. The first is, as expected,that the geographical distribution of jobopportunities matters. At a tolerance of 15minutes the number of jobs nearly follows therank-size rule of the places involved. Thehighest number of jobs can be reached fromUtrecht and Eindhoven (the largest cities inthe table). The second is that the effect of thedistribution shifts as commuting toleranceincreases. The postal code area in the geo-graphical centre of the Green Hart provides aperfect example. At 15 minutes only 6,000 jobscan be accessed, indicating a position at the
MAARTEN VAN HAM, PIETER HOOIMEIJER & CLARA H. MULDER238
# 2001 by the Royal Dutch Geographical Society KNAG
bottom of the table. At 45 minutes thisnumber has increased to 1.9 million, makingthis postal code the third in the hierarchy ofjob access among the listed locations. Moregenerally, rising commuting tolerance hasa much larger effect in the polynucleatedmetropolitan region of the Randstad, wherecommuter sheds overlap, than in the singleurban regions in the more peripheral parts ofthe country. In the city of Groningen (in theNorth) a rise from 15 to 45 minutes generatesjust over three times the number of jobswithin reach, while in the city of Utrecht tentimes as many jobs come within reach ifcommuting tolerance is raised from 15 to 45minutes. The third phenomenon is that theposition with respect to the major road infra-structure makes a difference. This is illustratedby comparing Woerden, a small town locatedon one of the motorways (A12 between theHague and Utrecht) that cut through theGreen Hart with the postal code at the centreof the Green Hart. The geometrical locationof the two places hardly differs, but thelocation of Woerden on the motorway pro-vides more jobs locally and facilitates access toother employment centres along the A12 (at15 minutes) and connecting motorways (athigher levels of commuting tolerance).
An overall evaluation of the job access ofresidential areas in the Netherlands is possible
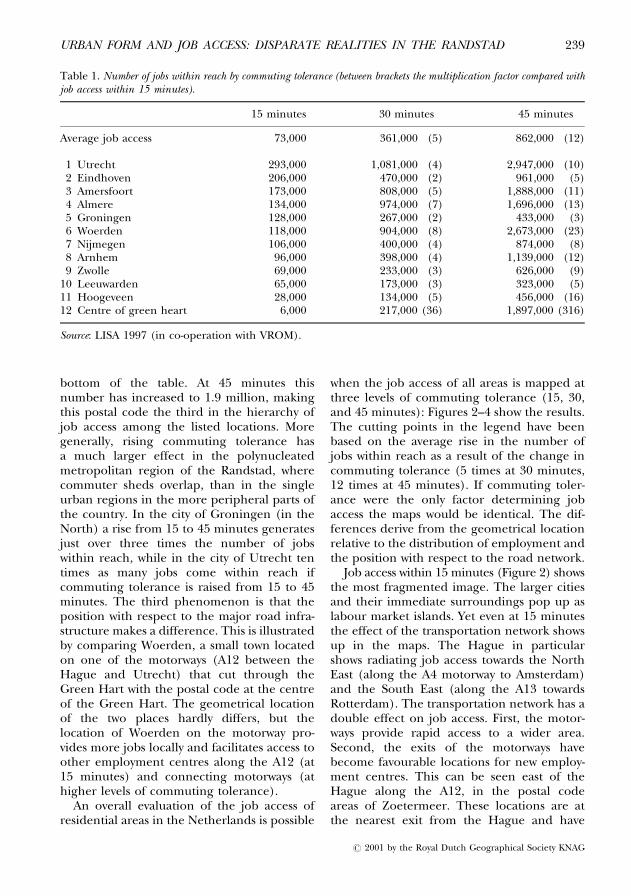
when the job access of all areas is mapped atthree levels of commuting tolerance (15, 30,and 45 minutes): Figures 2±4 show the results.The cutting points in the legend have beenbased on the average rise in the number ofjobs within reach as a result of the change incommuting tolerance (5 times at 30 minutes,12 times at 45 minutes). If commuting toler-ance were the only factor determining jobaccess the maps would be identical. The dif-ferences derive from the geometrical locationrelative to the distribution of employment andthe position with respect to the road network.
Job access within 15 minutes (Figure 2) showsthe most fragmented image. The larger citiesand their immediate surroundings pop up aslabour market islands. Yet even at 15 minutesthe effect of the transportation network showsup in the maps. The Hague in particularshows radiating job access towards the NorthEast (along the A4 motorway to Amsterdam)and the South East (along the A13 towardsRotterdam). The transportation network has adouble effect on job access. First, the motor-ways provide rapid access to a wider area.Second, the exits of the motorways havebecome favourable locations for new employ-ment centres. This can be seen east of theHague along the A12, in the postal codeareas of Zoetermeer. These locations are atthe nearest exit from the Hague and have
Table 1. Number of jobs within reach by commuting tolerance (between brackets the multiplication factor compared withjob access within 15 minutes).
15 minutes 30 minutes 45 minutes
Average job access 73,000 361,000 (5) 862,000 (12)
1 Utrecht 293,000 1,081,000 (4) 2,947,000 (10)2 Eindhoven 206,000 470,000 (2) 961,000 (5)3 Amersfoort 173,000 808,000 (5) 1,888,000 (11)4 Almere 134,000 974,000 (7) 1,696,000 (13)5 Groningen 128,000 267,000 (2) 433,000 (3)6 Woerden 118,000 904,000 (8) 2,673,000 (23)7 Nijmegen 106,000 400,000 (4) 874,000 (8)8 Arnhem 96,000 398,000 (4) 1,139,000 (12)9 Zwolle 69,000 233,000 (3) 626,000 (9)
10 Leeuwarden 65,000 173,000 (3) 323,000 (5)11 Hoogeveen 28,000 134,000 (5) 456,000 (16)12 Centre of green heart 6,000 217,000 (36) 1,897,000 (316)
Source: LISA 1997 (in co-operation with VROM).
URBAN FORM AND JOB ACCESS: DISPARATE REALITIES IN THE RANDSTAD 239
# 2001 by the Royal Dutch Geographical Society KNAG
developed as a local employment centre. Thecities and part of their surrounding suburbsare favourable locations in terms of accessto employment for people who can afford toown and use a car, but have restricted timebudgets. The 15 minutes map also gives anindication of the number of jobs that can bereached by people who go to work by bicycleor on foot, although at a much higher level ofcommuting tolerance.
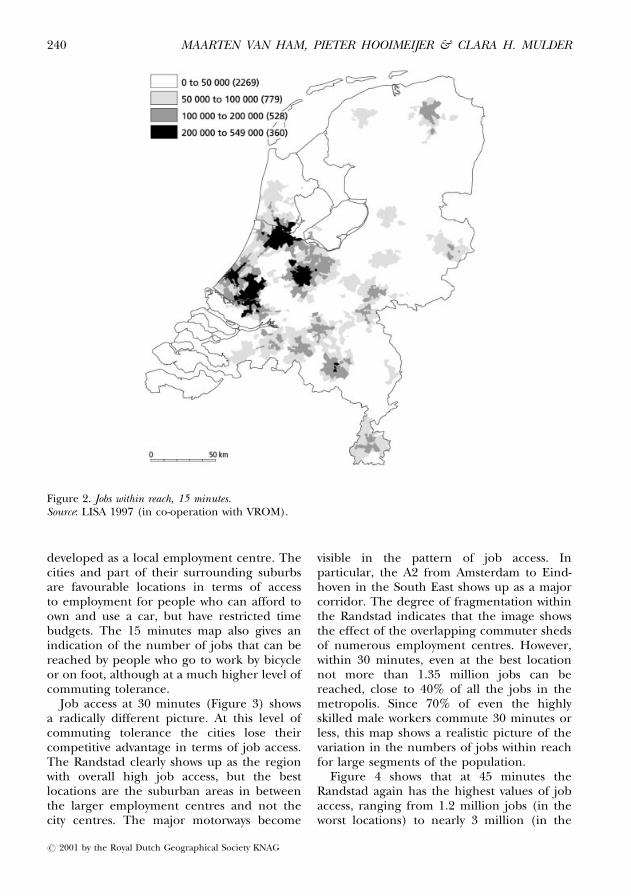
Job access at 30 minutes (Figure 3) showsa radically different picture. At this level ofcommuting tolerance the cities lose theircompetitive advantage in terms of job access.The Randstad clearly shows up as the regionwith overall high job access, but the bestlocations are the suburban areas in betweenthe larger employment centres and not thecity centres. The major motorways become
visible in the pattern of job access. Inparticular, the A2 from Amsterdam to Eind-hoven in the South East shows up as a majorcorridor. The degree of fragmentation withinthe Randstad indicates that the image showsthe effect of the overlapping commuter shedsof numerous employment centres. However,within 30 minutes, even at the best locationnot more than 1.35 million jobs can bereached, close to 40% of all the jobs in themetropolis. Since 70% of even the highlyskilled male workers commute 30 minutes orless, this map shows a realistic picture of thevariation in the numbers of jobs within reachfor large segments of the population.
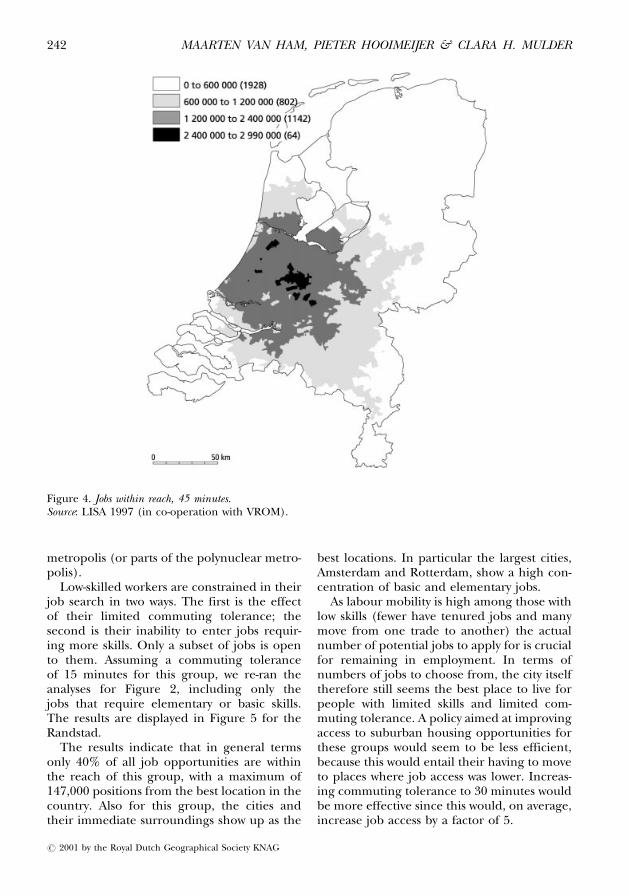
Figure 4 shows that at 45 minutes theRandstad again has the highest values of jobaccess, ranging from 1.2 million jobs (in theworst locations) to nearly 3 million (in the
Figure 2. Jobs within reach, 15 minutes.Source: LISA 1997 (in co-operation with VROM).
MAARTEN VAN HAM, PIETER HOOIMEIJER & CLARA H. MULDER240
# 2001 by the Royal Dutch Geographical Society KNAG
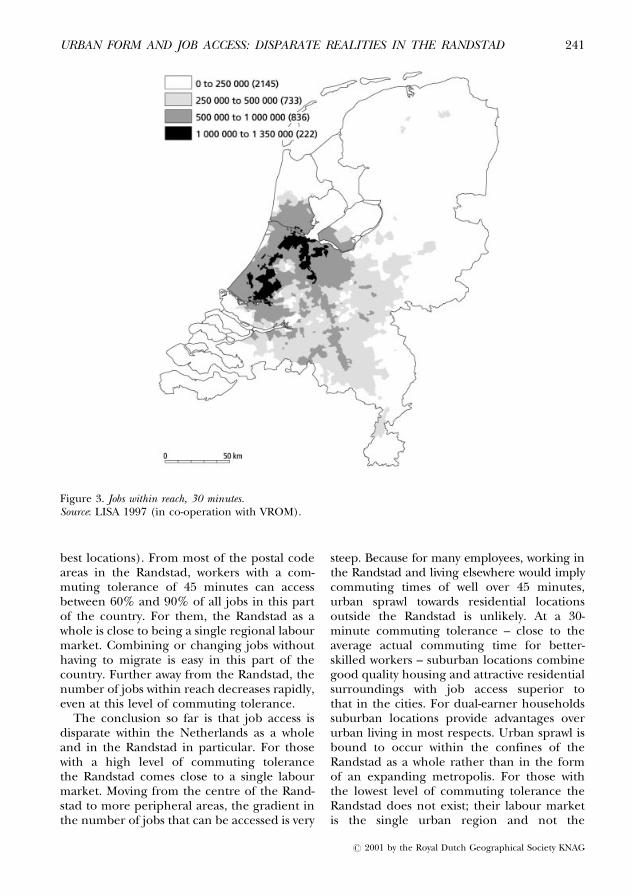
best locations). From most of the postal codeareas in the Randstad, workers with a com-muting tolerance of 45 minutes can accessbetween 60% and 90% of all jobs in this partof the country. For them, the Randstad as awhole is close to being a single regional labourmarket. Combining or changing jobs withouthaving to migrate is easy in this part of thecountry. Further away from the Randstad, thenumber of jobs within reach decreases rapidly,even at this level of commuting tolerance.
The conclusion so far is that job access isdisparate within the Netherlands as a wholeand in the Randstad in particular. For thosewith a high level of commuting tolerancethe Randstad comes close to a single labourmarket. Moving from the centre of the Rand-stad to more peripheral areas, the gradient inthe number of jobs that can be accessed is very
steep. Because for many employees, working inthe Randstad and living elsewhere would implycommuting times of well over 45 minutes,urban sprawl towards residential locationsoutside the Randstad is unlikely. At a 30-minute commuting tolerance ± close to theaverage actual commuting time for better-skilled workers ± suburban locations combinegood quality housing and attractive residentialsurroundings with job access superior tothat in the cities. For dual-earner householdssuburban locations provide advantages overurban living in most respects. Urban sprawl isbound to occur within the confines of theRandstad as a whole rather than in the formof an expanding metropolis. For those withthe lowest level of commuting tolerance theRandstad does not exist; their labour marketis the single urban region and not the
Figure 3. Jobs within reach, 30 minutes.Source: LISA 1997 (in co-operation with VROM).
URBAN FORM AND JOB ACCESS: DISPARATE REALITIES IN THE RANDSTAD 241
# 2001 by the Royal Dutch Geographical Society KNAG
metropolis (or parts of the polynuclear metro-polis).
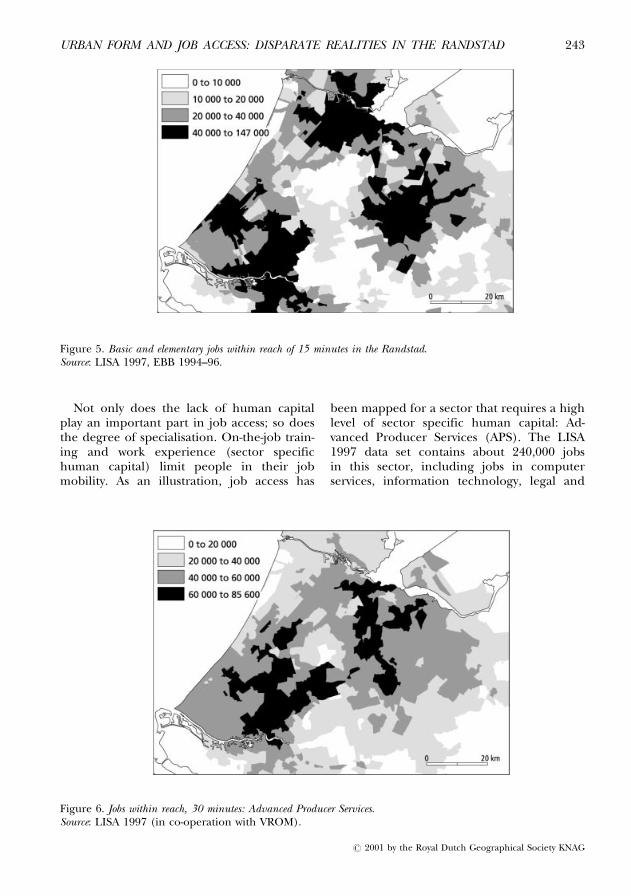
Low-skilled workers are constrained in theirjob search in two ways. The first is the effectof their limited commuting tolerance; thesecond is their inability to enter jobs requir-ing more skills. Only a subset of jobs is opento them. Assuming a commuting toleranceof 15 minutes for this group, we re-ran theanalyses for Figure 2, including only thejobs that require elementary or basic skills.The results are displayed in Figure 5 for theRandstad.
The results indicate that in general termsonly 40% of all job opportunities are withinthe reach of this group, with a maximum of147,000 positions from the best location in thecountry. Also for this group, the cities andtheir immediate surroundings show up as the
best locations. In particular the largest cities,Amsterdam and Rotterdam, show a high con-centration of basic and elementary jobs.
As labour mobility is high among those withlow skills (fewer have tenured jobs and manymove from one trade to another) the actualnumber of potential jobs to apply for is crucialfor remaining in employment. In terms ofnumbers of jobs to choose from, the city itselftherefore still seems the best place to live forpeople with limited skills and limited com-muting tolerance. A policy aimed at improvingaccess to suburban housing opportunities forthese groups would seem to be less efficient,because this would entail their having to moveto places where job access was lower. Increas-ing commuting tolerance to 30 minutes wouldbe more effective since this would, on average,increase job access by a factor of 5.
Figure 4. Jobs within reach, 45 minutes.Source: LISA 1997 (in co-operation with VROM).
MAARTEN VAN HAM, PIETER HOOIMEIJER & CLARA H. MULDER242
# 2001 by the Royal Dutch Geographical Society KNAG
Not only does the lack of human capitalplay an important part in job access; so doesthe degree of specialisation. On-the-job train-ing and work experience (sector specifichuman capital) limit people in their jobmobility. As an illustration, job access has
been mapped for a sector that requires a highlevel of sector specific human capital: Ad-vanced Producer Services (APS). The LISA1997 data set contains about 240,000 jobsin this sector, including jobs in computerservices, information technology, legal and
Figure 5. Basic and elementary jobs within reach of 15 minutes in the Randstad.Source: LISA 1997, EBB 1994±96.
Figure 6. Jobs within reach, 30 minutes: Advanced Producer Services.Source: LISA 1997 (in co-operation with VROM).
URBAN FORM AND JOB ACCESS: DISPARATE REALITIES IN THE RANDSTAD 243
# 2001 by the Royal Dutch Geographical Society KNAG
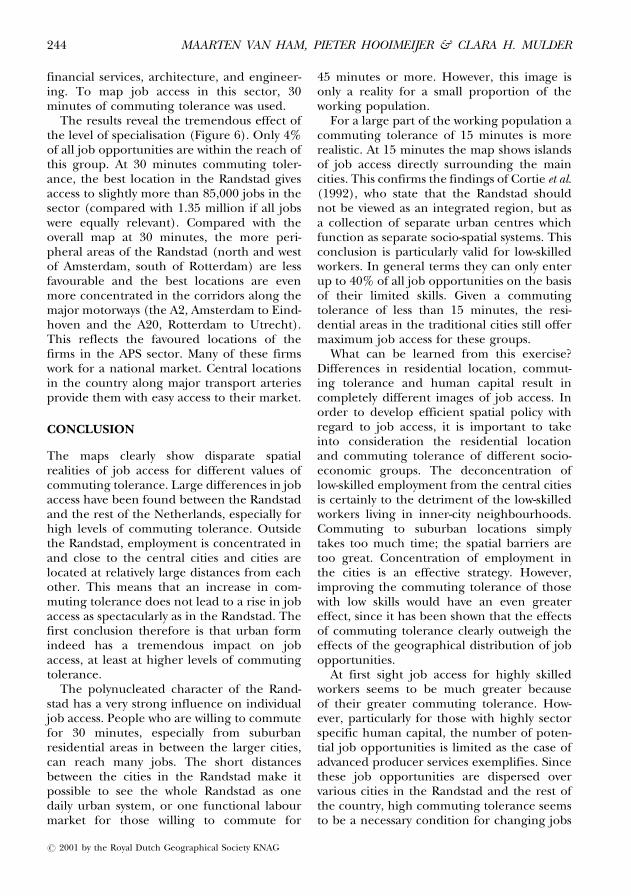
financial services, architecture, and engineer-ing. To map job access in this sector, 30minutes of commuting tolerance was used.
The results reveal the tremendous effect ofthe level of specialisation (Figure 6). Only 4%of all job opportunities are within the reach ofthis group. At 30 minutes commuting toler-ance, the best location in the Randstad givesaccess to slightly more than 85,000 jobs in thesector (compared with 1.35 million if all jobswere equally relevant). Compared with theoverall map at 30 minutes, the more peri-pheral areas of the Randstad (north and westof Amsterdam, south of Rotterdam) are lessfavourable and the best locations are evenmore concentrated in the corridors along themajor motorways (the A2, Amsterdam to Eind-hoven and the A20, Rotterdam to Utrecht).This reflects the favoured locations of thefirms in the APS sector. Many of these firmswork for a national market. Central locationsin the country along major transport arteriesprovide them with easy access to their market.
CONCLUSION
The maps clearly show disparate spatialrealities of job access for different values ofcommuting tolerance. Large differences in jobaccess have been found between the Randstadand the rest of the Netherlands, especially forhigh levels of commuting tolerance. Outsidethe Randstad, employment is concentrated inand close to the central cities and cities arelocated at relatively large distances from eachother. This means that an increase in com-muting tolerance does not lead to a rise in jobaccess as spectacularly as in the Randstad. Thefirst conclusion therefore is that urban formindeed has a tremendous impact on jobaccess, at least at higher levels of commutingtolerance.
The polynucleated character of the Rand-stad has a very strong influence on individualjob access. People who are willing to commutefor 30 minutes, especially from suburbanresidential areas in between the larger cities,can reach many jobs. The short distancesbetween the cities in the Randstad make itpossible to see the whole Randstad as onedaily urban system, or one functional labourmarket for those willing to commute for
45 minutes or more. However, this image isonly a reality for a small proportion of theworking population.
For a large part of the working population acommuting tolerance of 15 minutes is morerealistic. At 15 minutes the map shows islandsof job access directly surrounding the maincities. This confirms the findings of Cortie et al.(1992), who state that the Randstad shouldnot be viewed as an integrated region, but asa collection of separate urban centres whichfunction as separate socio-spatial systems. Thisconclusion is particularly valid for low-skilledworkers. In general terms they can only enterup to 40% of all job opportunities on the basisof their limited skills. Given a commutingtolerance of less than 15 minutes, the resi-dential areas in the traditional cities still offermaximum job access for these groups.
What can be learned from this exercise?Differences in residential location, commut-ing tolerance and human capital result incompletely different images of job access. Inorder to develop efficient spatial policy withregard to job access, it is important to takeinto consideration the residential locationand commuting tolerance of different socio-economic groups. The deconcentration oflow-skilled employment from the central citiesis certainly to the detriment of the low-skilledworkers living in inner-city neighbourhoods.Commuting to suburban locations simplytakes too much time; the spatial barriers aretoo great. Concentration of employment inthe cities is an effective strategy. However,improving the commuting tolerance of thosewith low skills would have an even greatereffect, since it has been shown that the effectsof commuting tolerance clearly outweigh theeffects of the geographical distribution of jobopportunities.
At first sight job access for highly skilledworkers seems to be much greater becauseof their greater commuting tolerance. How-ever, particularly for those with highly sectorspecific human capital, the number of poten-tial job opportunities is limited as the case ofadvanced producer services exemplifies. Sincethese job opportunities are dispersed overvarious cities in the Randstad and the rest ofthe country, high commuting tolerance seemsto be a necessary condition for changing jobs
MAARTEN VAN HAM, PIETER HOOIMEIJER & CLARA H. MULDER244
# 2001 by the Royal Dutch Geographical Society KNAG
without having to change residence. Furtherspecialization of parts of the Randstad mighthelp to arrive at a higher concentration of thissort of employment.
Most of the dual-earner households in theNetherlands consist of one full-time andone part-time worker. For them, residentiallocations along the ring roads of the majorcities are superior, because they combine thebest access to jobs at both 15 minutes and30 minutes commuting tolerance. The presentpolicies of both residential development (onthe outer side) and urban regeneration (onthe inner side) provides them with goodquality housing opportunities at the bestlocations in terms of job access. Continuationof these policies should therefore be favoured.
Notes
1. The LISA data sets were made available by theMinistry of Housing, Spatial Planning and theEnvironment, which commissioned the empiri-cal application of the research.
2. The basisnetwerk was purchased from Traffic andTransport Consultancy Group (Adviesgroepvoor Verkeer en Vervoer, Nieuwegein) in 1989and updated to the present day at the Faculty ofGeographical Sciences of Utrecht University.
Acknowledgements
Maarten van Ham's research was supported by theNetherlands Organization for Scientific Research(grant no. 42513002). Clara Mulder's research wasmade possible by a fellowship from the RoyalNetherlands Academy of Arts and Sciences. Theauthors express their gratitude to Tom de Jong ofthe Urban Research Centre Utrecht (URU), Facultyof Geographical Sciences, Utrecht University, forhis help with the use of Flowmap to calculate theproximity counts used in this paper. The authorsfurther express their gratitude to Statistics Nether-lands for the opportunity to analyse the LabourForce Surveys on-site (according to the WSA-CBSagreement).
REFERENCES
ALONSO, W. (1964), Location and Land Use. NewburyPark CA: Sage.
ATZEMA, O. & V. SCHUTJENS (1995), Gebrek aanwerk: regionale variaties. In: W. VAN DER VELDEN &E. WEVER, eds., Nederland is meer dan de Randstad:
de economische emancipatie van overig Nederland,pp. 105±127. Utrecht: Rabobank.
BATENBURG, R.S. & M.C. DE WITTE (1996), Functies-tructuur, verdringing en automatisering; region-ale verschillen binnen Nederland. In: O. ATZEMA
& J. VAN DIJK, eds., Technologie en de regionale
arbeidsmarkt, pp. 117±131. Assen: Van Gorcum.BATTEN, D.F. (1995), Network Cities: Creative
Urban Agglomerations for the 21st Century.Urban Studies 32, pp. 313±327.
BECKER, G. (1962), Human Capital: A Theoreticaland Empirical Analysis. Journal of Political Economy
70, pp. 9±46.BOÈ RSCH-SUPAN, A. (1990), Education and its Double-
Edged Impact on Mobility. Economics of Education
Review 9, pp. 39±53.BURKE, G.L. (1956), The Making of Dutch Towns, a
Study in Urban Development from the Tenth to the
Seventeenth Centuries. London: Cleaver-Hume Press.CENTRAAL BUREAU VOOR DE STATISTIEK (CBS) (1997),
EnqueÃte Beroepsbevolking 1996 (Labour ForceSurvey 1996). 'sGravenhage: Sdu.
CLARK, W.A.V. & M. KUIJPERS-LINDE (1994), Com-muting in Restructuring Urban Regions. Urban
Studies 31, pp. 465±483.CORTIE, C., M. DIJST & W. OSTENDORF (1992), The
Randstad a Metropolis? Tijdschrift voor Economische
en Sociale Geografie 83, pp. 278±288.DE JONG, T. & H. FLOOR (1993), Flowmap: een
programma voor het weergeven en analyserenvan interactiegegevens (Flowmap: A Software Pack-age for Displaying and Analysing Interaction Data).Planning, methodiek en toepassing 44, pp. 16±31.
DIELEMAN, F.M. & A. FALUDI (1998), Randstad,Rhine-Ruhr and Flemish Diamond as One Poly-nucleated Macroregion? Tijdschrift voor Econ-
omische en Sociale Geografie 89, pp. 320±327.FISHER, M.M. & P. NIJKAMP (1987), Spatial Labour
Market Analysis: Relevance and Scope. In: M.M.FISHER & P. NIJKAMP, eds., Regional Labour Markets.
Amsterdam: North Holland.GORDON, P., A. KUMAR & H.W. RICHARDSON (1989),
Gender Differences in Metropolitan Travel Be-haviour. Regional Studies 23, pp. 499±510.
HAÈ GERSTRAND, T. (1970), What About People inRegional Science? Papers of the Regional Science
Association 24, pp. 7±21.HALL, P. (1966), The World Cities, 3rd Ed., 1984.
London: Weidenfeld and Nicolson.HANSON, S. & G. PRATT (1992), Dynamic Depen-
dencies: A Geographic Investigation of LocalLabor Markets. Economic Geography 68, pp. 373±405.
URBAN FORM AND JOB ACCESS: DISPARATE REALITIES IN THE RANDSTAD 245
# 2001 by the Royal Dutch Geographical Society KNAG
HESSELS, M. (1992), Locational Dynamics of Busi-ness Services, an Intrametropolitan Study of theRandstad Holland. PhD thesis. University ofUtrecht: Netherlands Geographical Studies, 147.
HOLZER, H., K. IHLANFELD & D. SJOQUIST (1994),Work, Search and Travel Among White and BlackYouth. Journal of Urban Economics 35, pp. 320±345.
HOOIMEIJER, P. (1996), A life-Course Approach toUrban Dynamics: State of the Art in and ResearchDesign for the Netherlands. In: G.P. CLARKE, ed.,Microsimulation for Urban and Regional Policy
Analysis, pp. 28±63. London: Pion.JARVIS, H. (1999), Identifying the Relative Mobility
Prospects of a Variety of Household EmploymentStructures, 1981±1991. Environment and Planning
A 31, pp. 1031±1046.LOUTER, P.J. (1997), Regionale data voor beleids-
doeleinden. In: W. DE GRAAFF & F. BOEKEMA, eds.,Regionale data: vraag, aanbod en toepassing, pp. 5±26.Assen: Van Gorcum.
MADDEN, J.F. (1981), Why Women Work Closer toHome. Urban Studies 18, pp. 181±194.
MADDEN, J.F. & M.J. WHITE (1980), Spatial Impli-cations of Increases in the Female Labour Force:A Theoretical and Empirical Synthesis. Land
Economics 56, pp. 432±446.MULDER, C.H. (1993), Migration Dynamics: A Life
Course Approach. PhD thesis. University ofAmsterdam.
MULDER, C.H. & P. HOOIMEIJER (1999), ResidentialRelocations in the Life Course. In: L.J.G. VAN
WISSEN & P.A. DYKSTRA, eds., Population Issues. An
Interdisciplinary Focus, pp. 159±186. New York:Kluwer Academic/Plenum Publishers.
PHELPS, E.S. (1970), Introduction: The New Micro-economics in Employment and Inflation Theory.
In: E.S. PHELPS, ed., Microeconomic Foundations of
Employment and Inflation Theory, pp. 1±26. NewYork: Norton.
PRESTON, V. & S. MCLAFFERTY (1999), Spatial Mis-match Research in the 1990s: Progress and Poten-tial. Papers in Regional Science 78, pp. 387±402.
PRIEMUS, H. (1998), The Randstad and the CentralNetherlands Urban Ring: Planners Waver Be-tween Two Concepts. European Planning Studies 6,pp. 443±455.
SIMPSON, W. (1992), Urban Structure and the Labour
Market: Worker Mobility, Commuting and Under-
employment in Cities. Oxford: Clarendon Press.TERMOTE, M. (1980), Migration and Commuting: A
Theoretical Framework. Laxenburg Austria: IIASA.TOPEL, R.H. & M.P. WARD (1992), Job Mobility and
the Careers of Young Men. Quarterly Journal of
Economics 107, pp. 439±479.VAN DER LAAN, L. (1998), Changing Urban Systems:
An Empirical Analysis at Two Spatial Levels.Regional Studies 32, pp. 235±247.
VAN DER LAAN, L., J. Vogelzang & R. Schalke (1998),Commuting in Multi-Nodal Urban Systems: AnEmpirical Comparison of Three AlternativeModels. Tijdschrift voor Economische en Sociale
Geografie 89, pp. 384±400.VAN DER VEGT, C. & W.J.J. MANSHANDEN (1996),
Steden en stadsgewesten: economische ontwikkelingen
1970±2015. The Hague: Sdu Uitgevers.VAN OMMEREN, J. (1996), Commuting and Relo-
cation of Jobs and Residences: A Search Perspec-tive. PhD thesis. Vrije Universiteit Amsterdam.
WACHS, M. & B.D. TAYLOR (1993), The ChangingCommute: A Case Study of the Jobs-HousingRelationship Over Time. Urban Studies 30, pp.1711±1730.
MAARTEN VAN HAM, PIETER HOOIMEIJER & CLARA H. MULDER246
# 2001 by the Royal Dutch Geographical Society KNAG