Uralic genes in Europe
12
AMERICAN JOURNAL OF PHYSICAL ANTHROPOLOGY 83:57-68 (1990) Uralic Genes in Europe C.R. GUGLIELMINO, A. PIAZZA, P. MENOZZI, AID L.L. CAVALLI-SFORZA Dipartimento di Genetica e Microbiologia, Universita di Pavia and Istituto di Genetica Biochimica ed Evoluzionistica, C.N.R., Pavia, Italy, (C.R.G.), Dipartimento di Genetica, Biologia e Chimica Medica, Universitci di Torino, Torino, Italy IA.P.I, Istituto di Ecologia, Universitu di Parma, Parma, Italy (P.M.1, and Department of Genetics, Stanford University, California KEY WORDS cies, Genetic admixture Hungarians, Lapps, Finns, Uralics, Gene frequen- ABSTRACT We have analysed data of three European populations speak- ing non-Indoeuropean languages: Hungarians, Lapps, and Finns. Principal coordinate analysis shows that Lapps are almost exactly intermediate be- tween people located geographically near the Ural mountains and speaking Uralic languages, and central and northern Europeans. Hungarians and Finns are definitely closer to Europeans. An analysis of genetic admixture between Uralic and European ancestors shows that Lapps are slightly more than 50% European, Hungarians are 87% European, and Finns are 90% European. There is basic agreement between these conclusions and historical data on Hungary. Less is known about Finns and very little about Lapps. Inference from the linguistic affinities of human populations to their genetic affinities has presented a recurring problem for biolog- ical anthro 010 ‘sts. Linguistic studies often connections and the movements of popula- tions, and such data can usefully corroborate or am lif conclusions based on genetic data (Cavafdforza et al., 1988;Sokal, 1988). On the other hand, political conquest may in the course of a few generations change the lan- guage s oken in a region without signifi- producing ross discrepancies between the gion’s population. provide va P Y uab e historical data about the cantly a ! fecting the regional gene pool, thus genetic an i linguistic affinities of the re- Hungary may represent such language is not Indoeuropean; it the Ugric subfamily of the branch of the Uralic linguistic family. The Xanty and Mansi, who speak languages be- longing to the same Ugric group, live east of the Ural mountains, but no genetic data are available for them. Languages spoken by Lapps, by Finns, and by the Mari-Cheremis and Komi who live west of the Urals, also belong to the Finno-Ugric branch of the Uralic family (Fig. 1). We will refer to this branch as the Western branch because all the populations, except Xanty and Mansi, live west of the Ural mountains. The Eastern branch of the Uralic family includes lan- guages spoken in the northern part of Euro- pean and Asiatic USSR (see map, Fig. 1, which follows Ruhlens’classification). There is historical evidence that the ancient Mag- yars were Uralic-speaking herdsmen, orga- nized in seven major “hordes,”occupying a region between the Volga and Kama rivers. We know that in the 9th century they lived on the steppes west of the lower Don. The modern history of Hungary begins with the Magyar occupation of the country, which received its present name from the Slavonic pronunciation of the expression “On ogur” (Bloch, 19611, by which Magyars were known to the neighbours. Estimates of the number of Magyar invad- ers by different historians vary widely. Ac- cording to Dienes (1972) 20,000 horsemen might have crossed the Carpathians in 862 A.D. If we assume that one adult male in five was a horseman, this yields a total popula- Received January 20: 1989; revision accepted December 15, 1989. Address reprint requests to Dr. C. Guglielmino, Istituto di Genetica Biochimica ed Evoluzionistica. C.N.R., Via Abbiate- grasso, 207,27100 Pavia, Italy. @ 1990 WII,EY-LISS, INC.
-
Upload
universitaditorino -
Category
Documents
-
view
1 -
download
0
Transcript of Uralic genes in Europe
AMERICAN JOURNAL OF PHYSICAL ANTHROPOLOGY 83:57-68 (1990)
Uralic Genes in Europe C.R. GUGLIELMINO, A. PIAZZA, P. MENOZZI, AID L.L. CAVALLI-SFORZA Dipartimento di Genetica e Microbiologia, Universita di Pavia and Istituto di Genetica Biochimica ed Evoluzionistica, C.N.R., Pavia, Italy, (C.R.G.), Dipartimento di Genetica, Biologia e Chimica Medica, Universitci di Torino, Torino, Italy IA.P.I, Istituto di Ecologia, Universitu di Parma, Parma, Italy (P.M.1, and Department of Genetics, Stanford University, California
KEY WORDS cies, Genetic admixture
Hungarians, Lapps, Finns, Uralics, Gene frequen-
ABSTRACT We have analysed data of three European populations speak- ing non-Indoeuropean languages: Hungarians, Lapps, and Finns. Principal coordinate analysis shows that Lapps are almost exactly intermediate be- tween people located geographically near the Ural mountains and speaking Uralic languages, and central and northern Europeans. Hungarians and Finns are definitely closer to Europeans. An analysis of genetic admixture between Uralic and European ancestors shows that Lapps are slightly more than 50% European, Hungarians are 87% European, and Finns are 90% European. There is basic agreement between these conclusions and historical data on Hungary. Less is known about Finns and very little about Lapps.
Inference from the linguistic affinities of human populations to their genetic affinities has presented a recurring problem for biolog- ical anthro 010 ‘sts. Linguistic studies often
connections and the movements of popula- tions, and such data can usefully corroborate or am lif conclusions based on genetic data (Cavafdforza et al., 1988; Sokal, 1988). On the other hand, political conquest may in the course of a few generations change the lan- guage s oken in a region without signifi-
producing ross discrepancies between the
gion’s population.
provide va P Y uab e historical data about the
cantly a ! fecting the regional gene pool, thus
genetic an i linguistic affinities of the re-
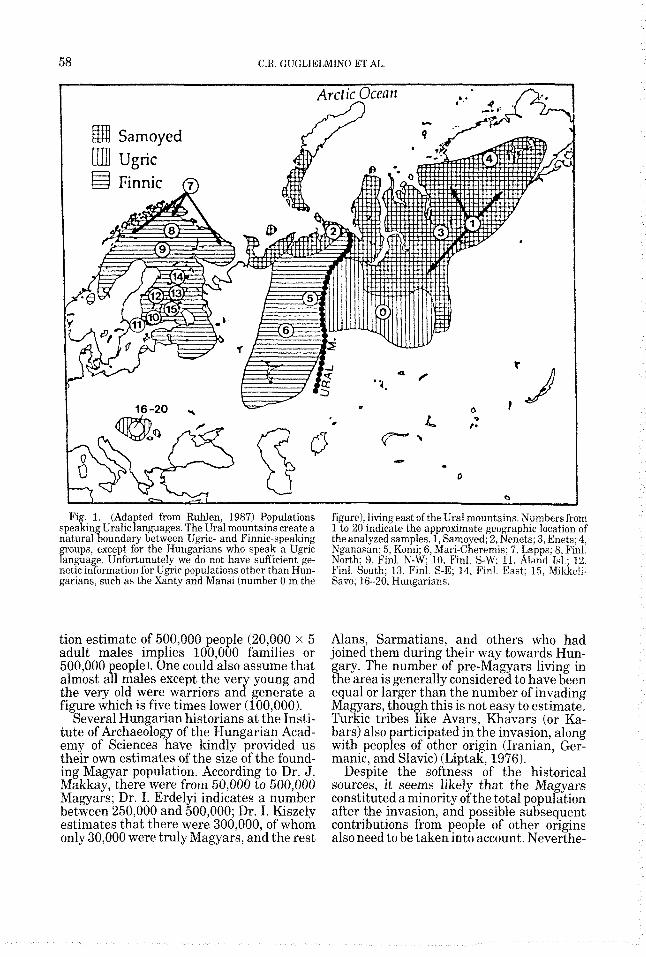
Hungary may represent such language is not Indoeuropean; it the Ugric subfamily of the branch of the Uralic linguistic family. The Xanty and Mansi, who speak languages be- longing to the same Ugric group, live east of the Ural mountains, but no genetic data are available for them. Languages spoken by Lapps, by Finns, and by the Mari-Cheremis and Komi who live west of the Urals, also belong to the Finno-Ugric branch of the Uralic family (Fig. 1). We will refer to this branch as the Western branch because all
the populations, except Xanty and Mansi, live west of the Ural mountains. The Eastern branch of the Uralic family includes lan- guages spoken in the northern part of Euro- pean and Asiatic USSR (see map, Fig. 1, which follows Ruhlens’ classification). There is historical evidence that the ancient Mag- yars were Uralic-speaking herdsmen, orga- nized in seven major “hordes,” occupying a region between the Volga and Kama rivers. We know that in the 9th century they lived on the steppes west of the lower Don. The modern history of Hungary begins with the Magyar occupation of the country, which received its present name from the Slavonic pronunciation of the expression “On ogur” (Bloch, 19611, by which Magyars were known to the neighbours.
Estimates of the number of Magyar invad- ers by different historians vary widely. Ac- cording to Dienes (1972) 20,000 horsemen might have crossed the Carpathians in 862 A.D. If we assume that one adult male in five was a horseman, this yields a total popula-
Received January 20: 1989; revision accepted December 15, 1989.
Address reprint requests to Dr. C. Guglielmino, Istituto di Genetica Biochimica ed Evoluzionistica. C.N.R., Via Abbiate- grasso, 207,27100 Pavia, Italy.
@ 1990 WII,EY-LISS, INC.
58 C.R. GUGLIELMINO ET AL.
Fig. 1. (Adapted from Ruhlen, 1987) Populations speaking Uralic languages. The Ural mountains create a natural boundary between Ugric- and Finnic-speaking groups, except for the Hungarians who speak a Ugric language. Unfortunately we do not have sufficient ge- iietic ii~fuririatiun fur Ugric populations other than Hun- garians, such as the Xanty and Mansi (number 0 in the
figure), living east of the Ural mountains. Numbers from 1 to 20 indicate the approximate geographic location of the analyzed samples. 1, Samoyed; 2, Nenets; 3, Enets; 4, Nganasan: 5. Komi; 6, Mari-Cheremis; 7. Lapps; 8, Finl. North; 9. Ftnl. N-W; 10, Finl. S-W, 11, Aland Id.; 12, P’ini. South: 13, Finl. S-E: 14, Finl. East; 15, Rlikke!i- Savo; 16-20, Hungarians.
tion estimate of 500,000 people (20,000 x 5 adult males implies 100,000 families or 500,000 people). One could also assume that almost all males except the very young and the very old were warriors and generate a figure which is five times lower (100,000).
Several Hungarian historians at the Insti- tute of Archaeology of the Hungarian Acad- emy of Sciences have kindly provided us their own estimates of the size of the found- ing Magyar population. According to Dr. J. Makkay, there were from 50,000 to 500,000 Magyars; Dr. I. Erdelyi indicates a number between 250,000 and 500,000; Dr. I. Kiszely estimates that there were 300,000, of whom only 30,000 were truly Magyars, and the rest
Alans, Sarmatians, and others who had joined them during their way towards Hun- gary. The number of pre-Magyars living in the area is generally considered to have been equal or larger than the number of invading Magyars, thou h this is not easy to estimate. Turkic tribes %ke Avars, Khavars (or Ka- bars) also articipated in the invasion, along
manic, and Slavic) (Liptak, 1976). Despite the softness of the historical
sources, it seems likely that the Magyars constituted a minority of the total population after the invasion, and possible subsequent contributions from people of other origins also need to be taken into account. Neverthe-
with peop P es of other origin (Iranian, Ger-
URALIC GENES IN EUROPE 59
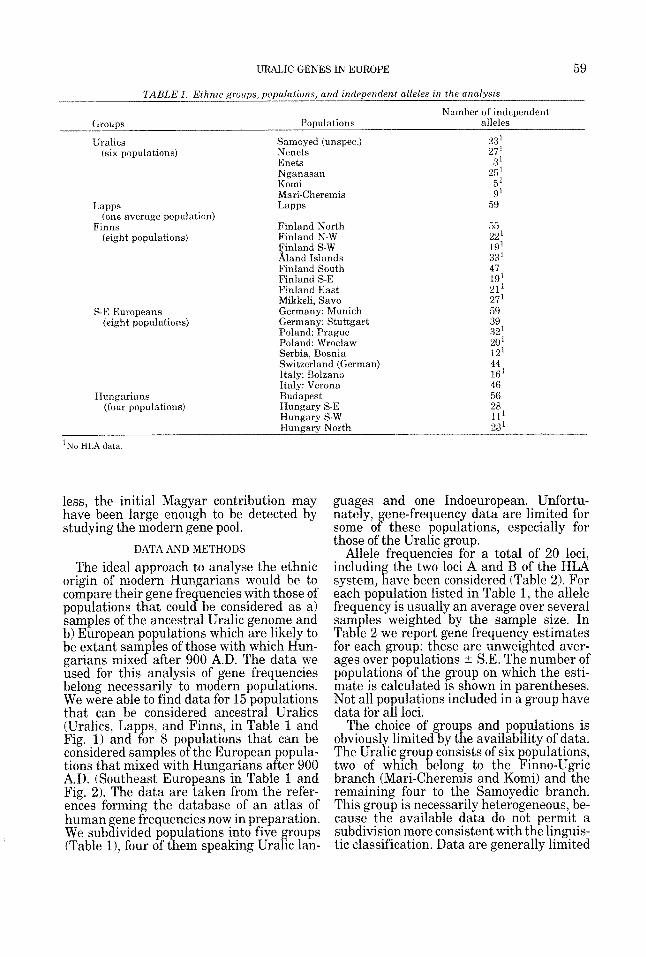
TABLE 1. Ethnic groups, populations, and independent alleles in the analysis
Number of independent Groups Populations alleles
(six populations) Nenets 27' iiralics Samoyed (unspec.) 23'
3:
$ Enets Nganasan 25 Komi Mari-Cheremis
Lapps Lapps 59
Finns Finland North 55 (eight populations) Finland N-W 22'
Finland S-W 19' h a n d Islands 33'
(one average population)
Finland South 47
S-E Europeans (eight populations)
Finland S-E Fin!and East Mikkeli, Savo Germany: Munich
19' 21' 27' 59
Germany: Stuttgart 39 Poland: Prague 32 Poland: Wrozlaw 201 Serbia, Bosnia 121 Switzerland (German) 44 Italy: Bolzano 16' Italy: Verona 46
Hungarians Budapest 56 (four populations) Hungary S-E 28
Hungary S-W 11' Hungary North 23'
'No HLA data
less, the initial Magyar contribution may have been large enough to be detected by studying the modern gene pool.
DATA AND METHODS
The ideal approach to analyse the ethnic origin of modern Hungarians would be to compare their gene fre uencies with those of
samples of the ancestral Uralic genome and b) European populations which are likely to be extant samples of those with which Hun- garians mixed after 900 A.D. The data we used for this analysis of gene frequencies belong necessarily to modern populations. We were able to find data for 15 PO ulations
populations that coul 8 be considered as a)
that can be considered ancestra P Uralics
A.D. (Southeast Europeans in Table 1 and Fig. 2). The data are taken from the refer- ences forming the database of an atlas of human ene frequencies now in preparation. We sub 3 ivided populations into five groups (Table l), four of them speaking Uralic lan-
guages and one Indoeuropean. Unfortu- data are limited for
especially for
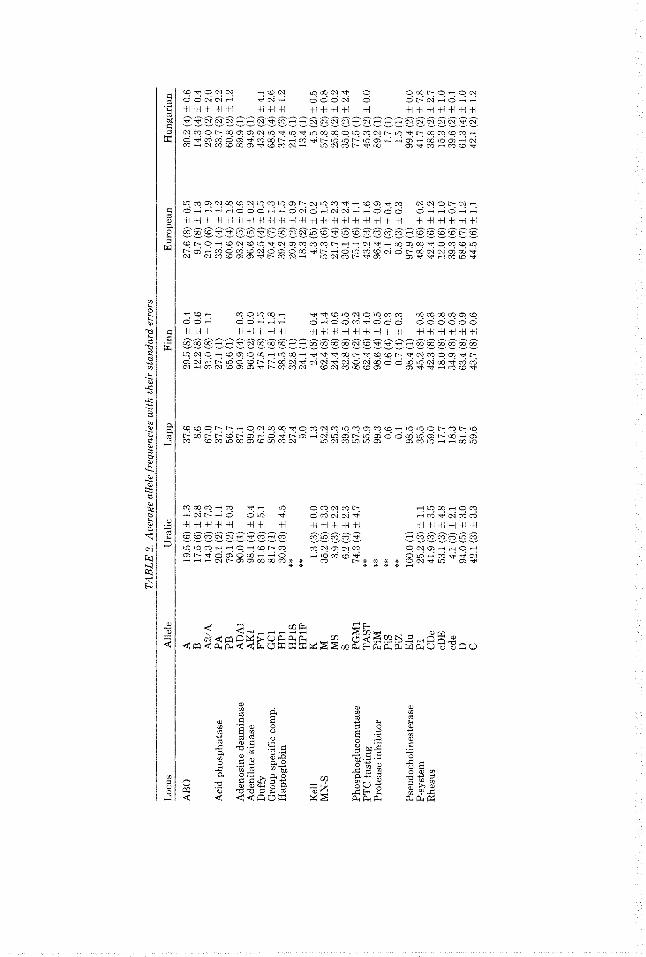
Allele frequencies for a total of 20 loci, includin the two loci A and B of the HLA
each population listed in Table 1, the allele frequency is usually an average over several Sam les weighted by the sample size. In
for each group: these are unweighted aver- ages over populations rt S.E. The number of populations of the group on which the esti- mate is calculated is shown in parentheses. Not all PO ulations included in a group have
The choice of grou s and populations is
The Urafic grou consists of six populations,
branch (Mari-Cheremis and Komi) and the remaining four to the Samoyedic branch. This group is necessarily heterogeneous, be- cause the available data do not permit a subdivision more consistent with the linguis- tic classification. Data are generally limited
system, a ave been considered (Table 2). For
Tab P e 2 we report gene frequency estimates
data for a F 1 loci.
obvious1 limited by t E e availability of data.
two of which 1 elong to the Finno-Ugric
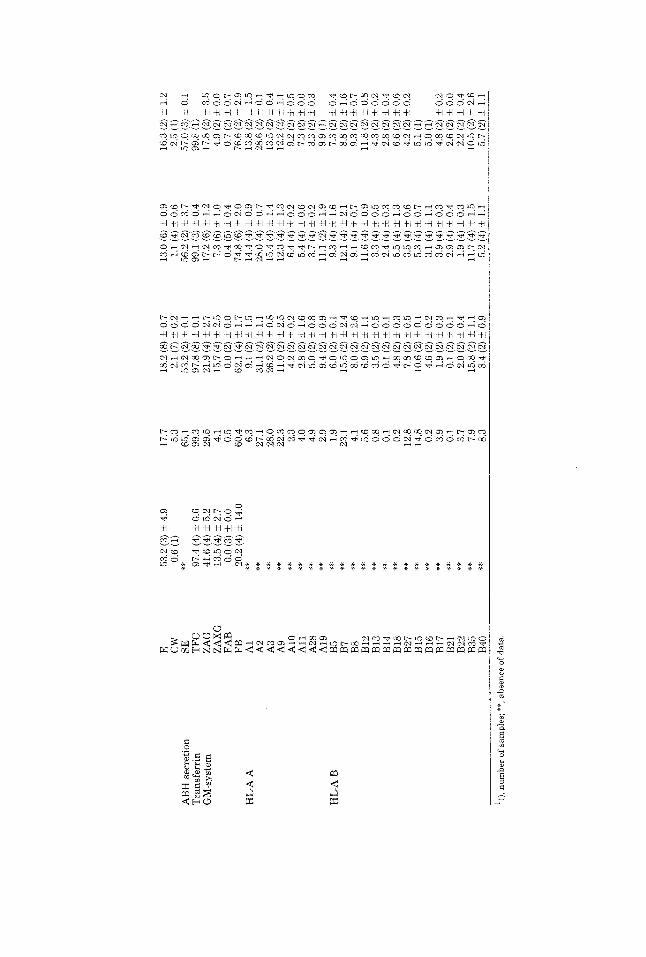
T.4R
LE 2
. Ave
rage
alle
le fr
eoue
ncie
s w
ith
thei
r st
anda
rd e
rror
s
Locu
s
ABO
Aci
d ph
osph
atas
e
Ade
nosi
ne d
eam
inas
e A
deni
late
kin
ase
Duf
fy
Gro
up s
peci
fic
com
p.
Hap
togl
obin
Kel
l M
N-S
Phos
phog
luco
mut
ase
PTC
tas
ting
Pr
otea
se in
hibi
tor
Pseu
doch
olin
este
rase
P-
syst
em
Rhe
sus
Alle
le
A B A2/
A
PA
P
B
AD
A1
AK
I PY
1 G
C1
HP1
H
PlS
H
PlF
K
M
M
S S PG
Ml
TA
ST
PiM
P
is
PiZ
Elu
P1
C
De
cDE
cde
D
C
Ura
lic
19.5
(6) i 1
.3
17.5
(6) i 2.
8 14
.3 (3
) i 7.
3 20
.1 (2
) i 1
.1
79.1
i2j i 0.
3 90
.0 (
1)
98.1
(4) i 0.4
81.6
(3) f 5
.1
81.7
(1)
30.3
(3) i 4.5
**
** 1.
3 (3
) i 0.
0 35
.2 (5
) I 3
.3
3.9
(3) -
c 2.2
6.
2 (3
) i 2.
3 74
.3 (4
) i 4.7
**
**
**
**
100.
0 (1)
25
.2 (
3) I 1
.1
41.9
(3) i 3.
5 53
.1 (3
) i 4.
8 4.
1 (3
) + 2.1
94
.0 (5
) i 3.
0 42
.1 (3
1 i 3.
3
Lap
p
37.6
8.
6 67
.0
37.7
56
.7
87.1
99
.0
61.2
80
.8
34.8
27
.4
9.0 1.3
52.2
25
.3
39.5
57
.3
55.9
99
.3
0.6
0.1
98.5
35
.5
59.0
17
.7
18.3
81
.7
59.5
Finn
29.5
(8) i 0.
4 12
.2 (8
) i 0.
6 31
.0 (
8) i 1.1
27
.1 (1
) 65
.6 (1
) 90
.9 (4
) i 0.
3 96
.0 (2
) i 0.
0 47
.8 (8
) i 1
.5
77.1
(8) i 1.
8 38
.3 (8
) i 1
.1
32.8
(1)
24.1
(1)
2.4
(8) i 0.4
62.4
(8)
i 1
.4
24.4
(8)
i 0.
6 32
.8 (8
) i 0.5
80.7
(2) i 3.
2 62
.4 (6
) i 4.
0 98
.6 (4
) i 0.
5 0.
6 (4
) i 0.
3 0.
7 (4
) i 0.
3 98
.4 (1
) 45
.2 (8
) I 0.
8 42
.3 (8
) i 0.
8 18
.0 (8
) I
0.8
34.9
(8)
f 0.
8 63
.4 (
8) +-
0.9
43
.7 (8
) 1. 0
.6
Eur
opea
n
27.6
(8)
I 0.
5 9.
7 (8
) i 1
.3
21.0
(6)
I 1
.9
33.1
(4)
i 1.
2 60
.6 (4
) i 1
.8
93.2
(5)
I 0.
6 96
.6 (5
) k 0.
2 42
.5 (
4) I 0.
5 70
.4 (7
) I1
.3
39.2
(8)
I 1
.5
20.9
(2)
i 0.
9 18
.3 (2
) f 2.
7 4.
3 (5
) i 0.
2 57
.3 (6
) i 1
.5
21.7
(4)
i 2.
3 30
.1 (
5) i2
.4
75.1
(6)
i 1
.1
43.2
(3) i 1
.6
96.4
13)
I0
.9
2.1
(3) r
t 0.
4 0.
8 (3
) i 0.
3 97
.9 (
1)
48.8
(6) I 0.
2 42
.4 (
6) i 1
.2
12.0
i6j i 1
.0
39.3
(6) i 0.
7 58
.6 (7
) i 1
.2
44.5
(6) i 1
.1
Hun
gari
an
30.2
(4) i 0.
6 14
.3 (4
) i 0.
4 23
.0 (
2) I 2
.0
33.7
12)
i 2.2
60.8
(2) i 1
.2
89.9
(1)
94.9
(1)
43.2
(2)
i 4.
1 68
.5 (
4) i 2.
6 37
.4 (
3) t 1
.2
21.5
(1)
13.4
(1)
4.5
12) i 0.
5 57
.8 i2
) i 0.8
25.8
(2)
I 0.
2 35
.0 (2
) i 2.
4 77
.5 (1
) 45
.3 (2
) Zk
0.0
89
.2 (1
) I .
7 (I
) 1.
5 (1
) 99
.4 (
2) i 0.
0 41
.7 @
) i 7.
8 38
.8 (
2) i 2.
7 15
.3 (2
) i 1
.0
39.6
(2)
i 0.
1 61
.3 (4
) i 1
.0
42.1
(2)
i1
.2
AB
H s
ecre
tion
Tra
nsfe
rrin
G
M-s
yste
m
HL
-A A
HL
-A B
16.3
(2) i 1
.2
E 53
.2 (3
) i 4.
9 17
.7
18.2
(8) i
0.7
13
.0 (6
) i 0.
9
**
65.1
53
.2 (2
) i 0.
1 56
.2 (2
) i 3.
7 57
.0 (
3) iO.
l CW
SE
T
FC
97.4
(4)
i 0.6
99.3
97
.8 (8
) i 0.
1 99
.1 (3
) t 0
.4
99.8
(1)
ZAG
41
.6 (
4) i 5.
2 29
.5
21.9
(4) i 2.
7 17
.2 (6
) t 1
.2
17.8
(2) i 3.
5 ZA
XG
13
.5 (4
) i 2.
7 4.
1 15
.7 (4
) i 2.
5 7.
3 (6
) i 1
.0
4.9
(2) t 0.
0 0.
7 (2
) i 0.
7 FA
B
0.0
(3) i 0.0
0.5
0.0
(2) i 0.
0 F
B
20.2
(4)
i 1
4.0
60.4
62
.1 (4
) i 1
.7
74.8
(6)
i 2.
0 76
.6 (2
) i 2.9
0.6
(1)
5.3
2.1
(7) i 0.
2 1.
1 (4
) i 0.
6 2.
5 (1
)
0.4
(5) i 0.4
**
**
**
**
**
**
**
**
**
**
**
**
**
**
**
**
**
**
**
**
**
A1
A2
A3
A9
A10
A
ll
A28
A
19
B5
B7
B8
B12
B
13
B14
B
18
B27
B
15
B16
B
17
B21
B
22
6.3
27.1
28
.0
22.3
2.
3 4.
0 4.
9 2.
9 1.
9 23
.1
4.1
5.6
0.8
0.1
12.8
14
.8
0.2
3.9
0.1
3.7
7.9
0.2
9.1
(2) i 1
.5
31.1
(2) f 1
.1
26.2
(2)
I 0
.8
11.0
(2) i 2.
5 4.
2 (2
) i 0.
2 2.
8 (2
) i 1
.6
5.0
(2) i 0.
8
6.0
(2) i 0.
1 15
.5 (2
) i 2.
4 8.
0 (2
1 i 2.
6
9.4
(2) i 0.
9
6.9
(2j i 1
.1
3.5
(2) t 0
.5
0.1
(2) i 0.
1 4.
8 (2
) t 0
.3
7.8
(2) i 0.
5 10
.6 (
2) i 0.
1 4.
6 (2
) i 0.
2 1.
9 (2
) I 0
.3
0.1
(2) i 0.
1 2.
0 (2
) i 0.
4 15
.8 (2
1 i 1
.1
14.4
(4) t 0.
9 28
.0 (
4) i 0
.7
15.4
(4) i 1
.4
12.3
(4) t 1
.3
6.4
(4) t 0.
2 5.
4 (4
) i 0.
6 3.
7 (4
) t 0.
2 11
.1 (2
) t 1
.9
9.3
(4) i 1.6
12.1
(4) i 2.
1 9.
1 (4
) t 0
.7
11.6
(4) t 0.
9 3.
3 (4
) i 0.
5 2.
4 (4
) t 0
.3
5.5
(4) i 1
.3
3.5
(4) I
0.6
5.3
(4)
50
.7
3.1
i4j
1.1
3.9
(4) i 0.
3 2.
9 (4
) i 0.
4 1.
9 (4
) k 0
.3
11.7
(4) i 1
.5
13.8
(2) i 1
.5
28.6
(2)
t 0.
1 13
.5 (2
) i 0.
4 12
.2 (2
) i 1
.1
9.2
tJj t 0.
5 7.
3 (2
) iO
.O
3.3
(2) i 0.
3 9.
9 (1
) 7.
3 (2
) i 0.4
8.8
(2) i-
1.6
9.3
(2) i 0
.7
11.8
(2) I
O.8
4.
3 (2
) 2 0
.2
2.8
(2) i 0.
4 6.
6 (2
) 10
.6
4.2
(2) 1
0.2
5.
1 (1
) 5.
0 (I
) 4.
8 (2
) I 0.
2 2.
6 (2
) i 0.
0 2.
2 (2
) t 0
.4
10.5
(2) ?
2.6
**
**
8.
3 8.
4 iaj
i 0.
9 5.
2 (4
j t 1
.1
5.7
(zj i 1.
1 B
35
B40
'0, nu
mbe
r of
sam
ples
; **,
abse
nce
of d
ata.
62 C.R. GUGLIELMINO ET AL.
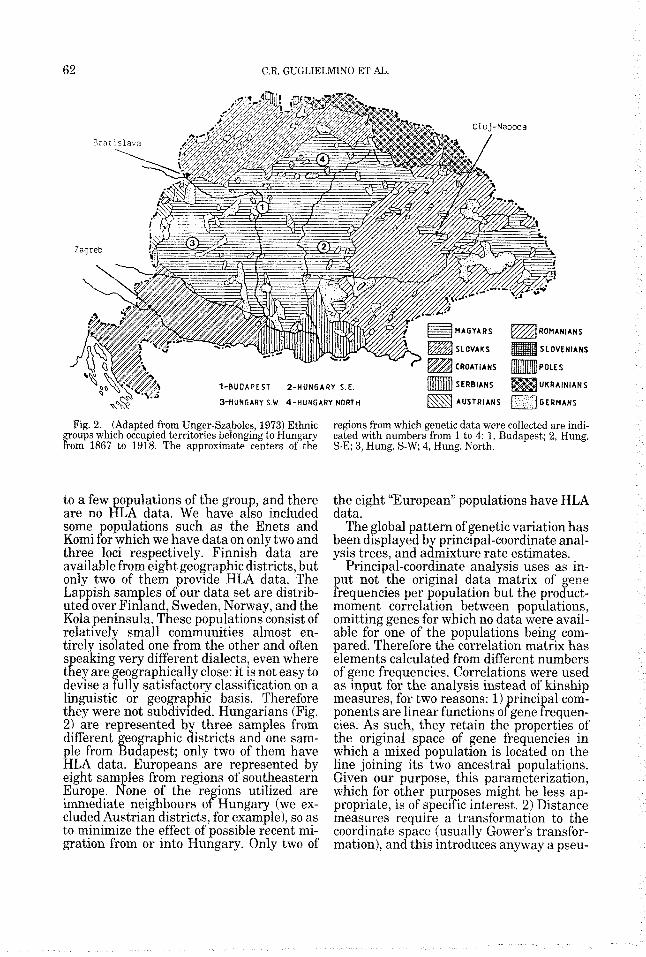
Fig. 2. (Adapted from Unger-Szabolcs, 1973) Ethnic groups which occupied territories belongmg to Hungary from 1867 to 1918. The approximate centers of the
to a few opulations of the grou , and there
some opulations such as the Enets and
three loci respectively. Finnish data are available from eight geographic districts, but only two of them provide HLA data. The Lap ish sam les of our data set are distrib-
Kola peninsula. These populations consist of relatively small communities almost en- tirely isolated one from the other and often
even where close: it is not easy to
classification on a linguistic or geographic basis. Therefore they were not subdivided. Hungarians (Fig. 2) are represented by three samples from different geo raphic districts and one sam-
HLA data. Europeans are represented by eight Sam les from regions of southeastern
immediate neighbours of Hungary (we ex- cluded Austrian districts, for example), so as to minimize the effect of possible recent mi- gration from or into Hungary. Only two of
are no R LA data. We have a P so included
Komi P or which we have data on only two and
Ute c f over Fin P and, Sweden, Norway, and the
ple from Bu bi apest; only two of them have
Europe. 8 one of the regions utilized are
regions from which genetic data were collected are indi- cated with numbers from 1 to 4: 1, Budapest; 2, Hung. S-E; 3, Hung. S-W, 4, Hung. North.
the eight “European” populations have HLA data.
The global pattern of genetic variation has been displayed by principal-coordinate anal- ysis trees, and admixture rate estimates.
Principal-coordinate analysis uses as in- put not the original data matrix of gene frequencies per population but the product- moment correlation between populations, omitting genes for which no data were avail- able for one of the populations being com- pared. Therefore the correlation matrix has elements calculated from different numbers of gene frequencies. Correlations were used as input for the analysis instead of kinship measures, for two reasons: 1) rinci a1 com-
cies. As such, they retain the properties of the original s ace of gene frequencies in
line joining its two ancestral populations. Given our purpose, this parameterization, which for other purposes might be less ap- propriate, is of specific interest. 2) Distance measures require a transformation to the coordinate space (usually Gower’s transfor- mation), and this introduces anyway a pseu-
ponents are linear functions o P F gene requen-
which a mixe dp population is located on the
URALIC GENES IN EUROPE 63
do-euclidean parameterization. By making use of the genetic distances proposed by Reynolds et al. (1983) (which are descent measures, in other circumstances more a - propriate than correlations) principal coo& nate anlaysis (in lieu of princi a1 component analysis) was also erformei: a relatively small chan e in the c f istribution of points has been intro f uced by this representation (not shown), which however does not alter our major conclusions.
A measure of the error associated with the projection of each population i in the two- dimensional plane of the two first principal axes is given by the formula:
where v j k is the eigenvector matrix element and Zik is the k-th principal coordinate of the population i.
In the plot each population is associated with a circle drawn with radius lle, so that the area of the circle is inversely propor- tional to the error. The more accurately posi- tioned points are correspondingly empha- sized.
The genetic distances proposed by Rey- nolds et al. (1983) were calculated for each
air of populations and a tree was obtained gy average linkage from the distance matrix. Multifurcations were displayed where bifur- cations were found not to be statistically significant on the basis of the pseudo-t" sta- tistics proposed and calculated in the SAS package (1987).
A test of admixture was also used, in which
0.8 HUNG. S-E f3 @HUNG. S-W
0.6 SWITZ.
0 4 BUDAPEST SERBIA-BOSNIA
PRAGUE 0.2 0 XLAND ISL.
SWITZ. ,.I. STUTTGART i
PRAGUE 0.2 0 XLAND ISL.
@ MARI-CHEREMIS
KOM I
HUNG. NORTH
0
0 VERONA SAMOVEN
8 LAPPS
- 0 . 2 0 F I N N S-W
-0.4
-0.6
-0 .8
FINN NORTH F INN SOUTH
MlKKELl SAVO
@ URAL @ LAPP 0 FINN @ HUNGARIAN 0 EUROPEAN
-1.0 -1.0 -0.8 -0.6 -0.4 -0.2 0 0.2 0.4 0.6 0.8 1.0
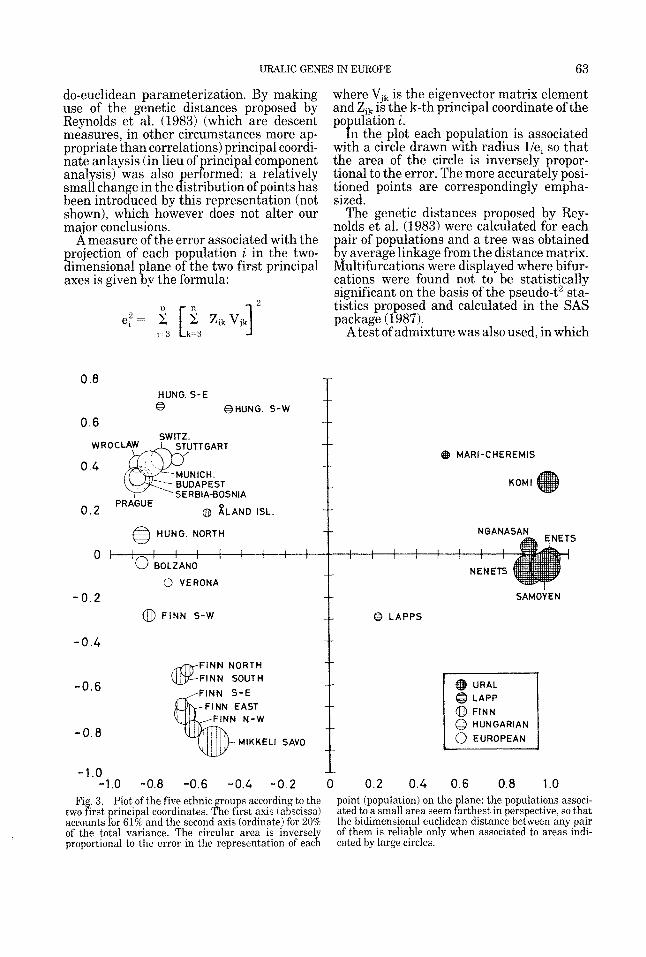
Fig. 3. Plot of the five ethnic groups according to the two first principal coordinates. The first axis (abscissa) accounts for 61% and the second axis (ordinate) for 20% of the total variance. The circular area is inversely proportional to the error in the representation of each
point (population) on the lane: the populations associ- ated to a small area seem Parthest in perspective, so that the bidimensional euclidean distance between any pair of them is reliable only when associated to areas indi- cated by large circles.
64 C.R. GUGLIELMINO ET AL.
a given group of populations is assumed as hybrid with respect to two groups of hypo- thetical parental populations. We used the multivariate method developed by Wijsman (1984) to estimate the relative amount of “admixture” for Hungarians, Lap s, and Finns, relative to the hypothesize$) Uralic and European parental populations.
RESULTS The plot of the first two principal coordi-
nates for the populations and independent alleles listed in Table 1 and 2 is shown in Figure 3. The first principal axis, which accounts for 61% of the total variance, defi- nitely separates the group of Uralic popula- tions from Finns, Hungarians, and Europe- ans. Along the same axis, Lapps occupy an intermediate position. The relative positions of all the populations do not change if we
0.6 SW I T 2 A
remove the Enets and Komi from the analy- sis. If they are included they appear close to the Uralic pole, with the Komi at a distance along the axis of the second principal coordi- nate. Their position should be considered with caution as their correlation with the other populations is based on three and five allele frequencies. The Nganasan, Samoyed, Nenets, and Enets, all populations living east of the Ural mountains, are a compact group with close values in the principal coor- dinates plot. The Mari-Cheremis and Komi, living west of the Ural mountains. are at some distance, with the Mari being further away. The second principal axis, which ac- counts for more than 20% of total variance, mostly separates Finns from European and Hungarian populations. Inhabitants of the &and islands are closest to the European- Hungarian groups, as, to a lesser degree, are
T t BOLZANO
STUTTGART 0
MUNICHO V 0.4
BLAND ISL
SERBIA-BOS 0 I I I ,: I I I I I I ~ I I MlKKELl ,~~ SAVO , 0.2 FINN N-W
FINN NORTQ 8 VERONA 0 BUDAPEST FINN SOUTH
0 t-++-t-(fp
-0.2
-0.4
-0.6
-0.8
-1.0
HUNG. S-E 4
HUNG. S-W 0
i i t
HUNG. NORTH t
FINN EAST
FINN S-W
8
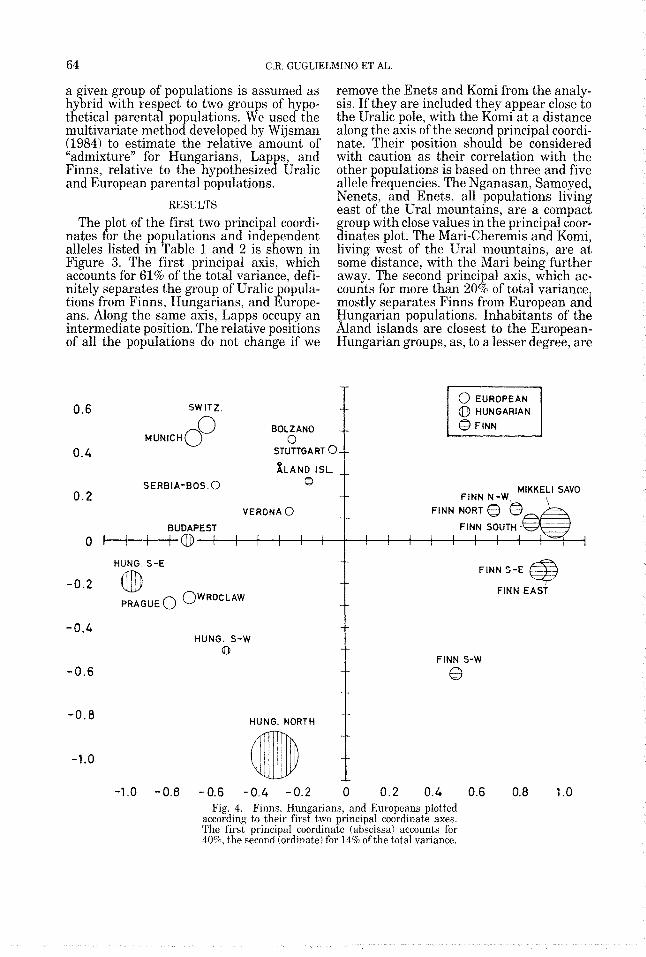
-1.0 -0.8 -0.6 -0.4 -0.2 0 0.2 0.4 0.6 0.8 1.0 Fig. 4. Finns, Hungarians, and Europeans plotted
according to their first two principal coordinate axes. The first principal coordinate (abscissa) accounts for 40%, the second (ordinate) for 14% of the total variance.
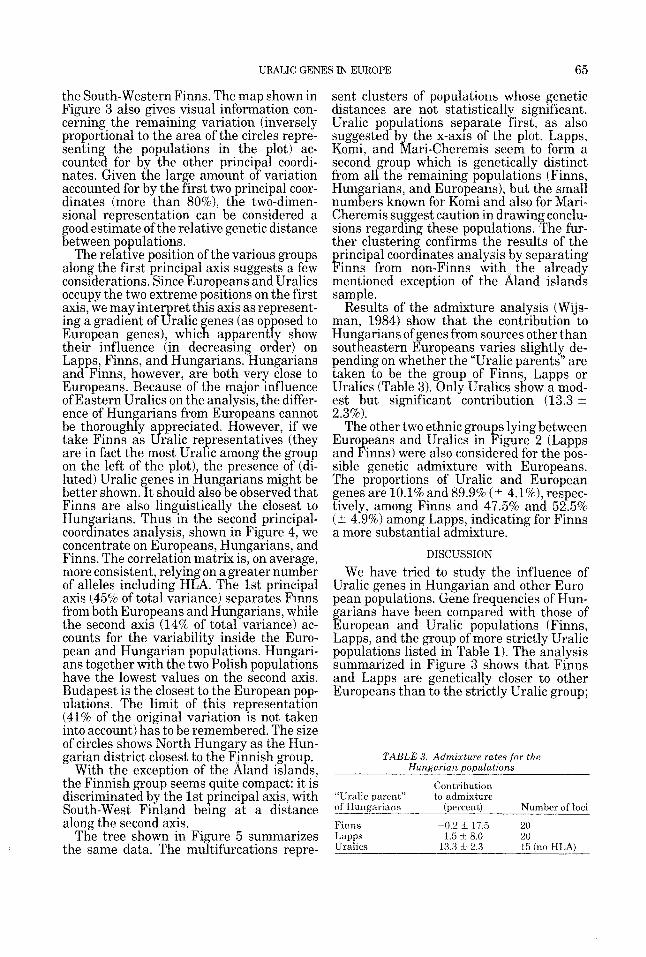
URALIC GENES IN EUROPE 65
the South-Western Finns. The map shown in Figure 3 also gives visual information con- cerning the remaining variation (inversely proportional to the area of the circles repre- senting the populations in the plot) ac- counted for by the other principal coordi- nates. Given the lar e amount of variation accounted for by the first two principal coor- dinates (more than 80%), the two-dimen- sional representation can be considered a ood estimate of the relative genetic distance
ietween opulations.
along the first principal axis suggests a few considerations. Since Europeans and Uralics occupy the two extreme positions on the first axis, we may interpret this axis as represent- ing a gradient of Uralic enes (as opposed to
their influence (in decreasing order) on La ps, Finns, and Hungarians. Hungarians
Europeans. Because of the major influence of Eastern Uralics on the analysis, the differ- ence of Hun arians from Europeans cannot
take Finns as Uralic re resentatives (they
on the left of the plot), the presence of (di- luted) Uralic genes in Hungarians might be better shown. It should also be observed that Finns are also linguistically the closest to Hungarians. Thus in the second principal- coordinates analysis, shown in Figure 4, we concentrate on Europeans, Hungarians, and Finns. The correlation matrix is, on average, more consistent, relying on a greater number of alleles including HLA. The 1st principal axis (45% of total variance) separates Finns from both Europeans and Hungarians, while the second axis (14% of total variance) ac- counts for the variability inside the Euro- pean and Hungarian populations. Hungari- ans together with the two Polish populations have the lowest values on the second axis. Budapest is the closest to the European pop- ulations. The limit of this representation (41% of the original variation is not taken into account) has to be remembered. The size of circles shows North Hungary as the Hun- garian district closest to the Finnish grou .
With the exception of the hand islanis, the Finnish group seems quite compact: it is discriminated by the 1st principal axis, with South-West Finland being at a distance along the second axis.
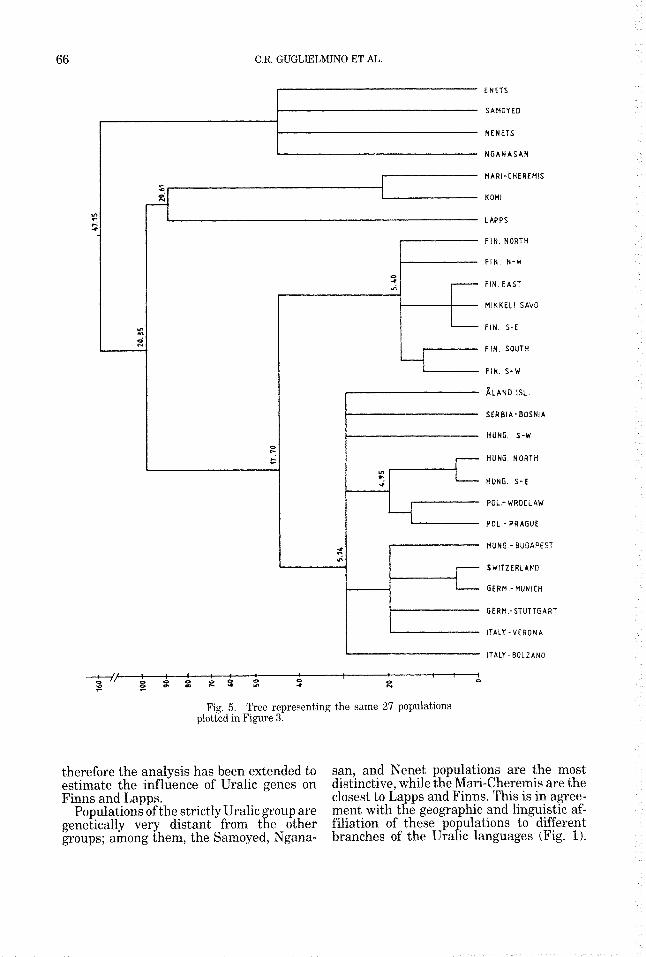
The tree shown in Fi ure 5 summarizes
The re P ative position of the various groups
European genes), whic a apparently show
an B Finns, however, are both very close to
be thorough K y appreciated. However, if we
are in fact the most Ura P ic among the group
the same data. The mu f tifurcations repre-
sent clusters of populatiow whose genetic distances are not statistically significant. Uralic populations separate first, as also suggested by the x-axis of the plot. Lapps, Komi, and Mari-Cheremis seem to form a second group which is genetically distinct from all the remaining populations (Finns, Hun arians, and Europeans), but the small num ers known for Komi and also for Mari- Cheremis suggest caution in drawin conclu- sions regarding these populations. $he fur- ther clusterin confirms the results of the rincipal coorinates analysis by separating
Finns from non-Finns with the already mentioned exception of the &and islands sample.
Results of the admixture analysis (W-ijs- man, 1984) show that the contribution to Hungarians of genes from sources other than southeastern Europeans varies slightly de- pending on whether the “Uralic parents” are taken to be the group of Finns, Lapps or Uralics (Table 3). Only Uralics show a mod- est but significant contribution (13.3 ? 2.3%).
The other two ethnic groups lying between Europeans and Uralics in Figure 2 (Lapps and Finns) were also considered for the pos- sible genetic admixture with Europeans. The proportions of Uralic and European genes are 10.1% and 89.9% (? 4.1%), respec- tively, among Finns and 47.5% and 52.5% (+ 4.9%) among Lapps, indicating for Finns a more substantial admixture.
DISCUSSION We have tried to study the influence of
Uralic genes in Hungarian and other Euro- pean populations. Gene frequencies of Hun- garians have been compared with those of European and Uralic populations (Finns, Lapps, and the group of more strictly Uralic populations listed in Table 1). The analysis summarized in Figure 3 shows that Finns and Lapps are genetically closer to other Europeans than to the strictly Uralic group;
TABLE 3. Admixture rates f o r the Hungarian populations
Contribution “Uralic parent” to admixture of Hungarians (oercenti Number of loci
Finns -0.2 i 17.5 20 Lapps 1.5 i 8.0 20 Uralics 13.3 F 2.3 15 (no HLA)
66 C.R. GUGLIELMINO ET AL.
E N E T S
SAMOYED
N E N E T S
N G A N A S A N
I-' MARI-CHEREMIS
1 KOMl
LAPPS
F I N . NORTH
F I N . N-W
0 I-
t:
F I N . EAST
- 1 4 . M I K K E L I S A W
F I N . S-E
F I N SOUTH
F I N S-W
XLAND 1st
SERBIA - BOSNIA
HUNG S-W
HUNG N O R T H
HUNG. S - E
POL.- WROCLAW
POL . PRAGUE
HUNG -BUDAPEST
SWITZERLAND
GERM - M U N I C H
GERM - S T U T T G A R T
ITALY - V E R O N A
U 7 in
ITALY -BOLZANO
3 0 D .. D - - % + k b 6 1 : : : .n 7 - * P ) : ! O I : : .- N
Fig. 5 . Tree representing the same 27 populations plotted in Figure 3.
therefore the analysis has been extended to estimate the influence of Uralic genes on Finns and Lapps.
Populations of the strictly Uralic group are genetically very distant from the other groups; among them, the Samoyed, Ngana-
san, and Nenet populations are the most distinctive, while the Mari-Cheremis are the closest to Lapps and Finns. This is in agree- ment with the geographic and linguistic af- filiation of these populations to different branches of the Uralic languages (Fig. 1).
URALIC GENES IN EUROPE 67
Specific genetic differences among the Finno-Ugrian and circumpolar populations were studied by Eriksson (1973) and Eriks- son et al. (1979).
Lapps occupy an intermediate genetic po- sition between Finns and Uralics. Like Finns, they had direct contacts with Europe- ans. They were the first inhabitans of the entire Scandinavian peninsula; the subse- quent arrival of Finns, Vikings, and Rus- sians pushed them towards the northern territories of Lappland. Intermarriage is common with Norwe ians, Swedes, Finns,
ture rate was estimated from our data at more than 50% (53 & 5%) European genes.
Finns show a still larger proportion of European genes (90 k 4%). This is most likely the outcome of a long history of close contact with the Germanic (Viking) popula- tions of Sweden, as witnessed also by the number of inhabitants who speak Swedish (13% in 1900,7% in 1960) (Sahavirta, 1963). This language is s oken by almost all the
artial political autonomy because of their [istory and ethnic composition) and it is the principal language along the western and south-western coastal regions of Finland. Our genetic data, which show &and island- ers and southwestern Finnish populations to be closer to Europeans (Figs. 3 and 41, con- firm these historical contacts. Migration in the &and Islands has been widely studied by Jorde (1982).
It must not be forgotten that these find- ings rely on the gene-frequency data from modern European populations (defined in Table 1); we do not know the ancestral fre- quencies. Furthermore, the contribution of Polish or German or Slavic genes to the Uralic gene pool might have been different. Last but not least, we used methods based on the assum tion that gene frequencies are
Lengyel (1979) described results on ABO blood groups from bone samples collected in 22 cemeteries of the Middle Danubian basin and dating from the 9th to the 13th centuries A.D. The frequency of the B group was 23.5% on average, which is higher than in present- day Hungarian populations (14.3%) and not dissimilar to that of modern populations in central Asia. Lengyel’s hy othesis that those
yar “Seven Tribes” has to be taken wit caution: the existence of a si ificant propor-
and Russians (Collin 6: er, 1949). The admix-
inhabitants of the d and islands (which have
not affecte a by natural selection.
5 cemeteries could possibly \ elong to the Ma
tion of untypable individua Y s (12.8%) intro-
duces a margin of uncertainty in his find- ings.
Our general conclusion, based on available genetic data, is that very few of the ancient Magyar enes remain among modern Hun-
From the principal-coordinates analysis shown in Figure 4, the Northern region of Hungary may have retained a greater pro- portion of Uralic genes, but more data have to be collected to confirm this finding. If the initial proportion of the Magyar population after invasion was 20 to 50%, as historical data indicate, later migrations from other European countries have reduced it substan- tially.
History seems to be in harmony with this conclusion. Invasions of other tribes contem- porary to the Magyars, decimations such as those by the Mongolian invasion in the 12th century, and many centuries of migrations from neighboring European populations could only reduce the ancestral Magyar con- tribution to the Hungarian gene pool. On the other hand, the cultural heritage of language could well be reserved independently of the
of the political and social structure of the Magyar society. From the beginning, the Magyars constituted a relatively powerful minority (Bloch, 1961); they imposed them- selves as the ruling class to simultaneous invaders or later immigrants to their terri- tory, but were probably not adverse to inter- marriage. In fact a blood relationship with
eople of Magyar origin (i.e., descending from the “Seven Hungarians”) was only a requisite for the community leaders in the early Hungarian nation, while each commu- nity was “composed of people of very differ- ent descent and ethnic origin” (Dienes, 1976).
Among these various people there were certainly others, e.g., Altaic peo le, whose
data. The presence of Altaic people in an- cient Hungary is documented by several facts. Of the invading ten tribes, three (Liptak, 1976) were Turkic (the Kabars, see introduction). The Avars (people of Turkic or mongolian origin, robably descending from
Also Iranian groups are on record (Liptak, 1976). Some of these groups, in particular those of Altaic origin, may not be easily distinguishable genetically from Uralic peo- ple. A more recise conclusion will depend on
garians. % he overall admixture rate is 13%.
genetic here cp ity, possibly as a consequence
genetic traces cannot be detecte 8 with our
Huns) were alrea B y present in the territory.
the availabi P ity of more genetic data.
68 C.R. GUGLIELMINO ET AL
ACKNOWLEDGMENTS
This work was partially supported by Isti- tuto di Genetica Biochimica ed Evoluzionis- tica (I.G.B.E.) of the Italian National Re- search Council (C.N.R.) and by NIH-GM grant 20467. The authors are very grateful to Professor Gyula Gyenis of Budapest Univer- sity, to Professor Gianguido Manzelli of Pa- via University, and to Professor Robert R. Sokal of the State University of New York at Stony Brook for the help in providing infor- mation, material, and translation. Thanks are also due to Nazario Cappello, Sabina Rendine (Torino University), and CSI-Pie- monte (Torino, Italy) for part of the computer work.
LITERATURE CITED
Bloch M (1961) Feudal Society. Vol. 1. The Growth ofTies of Dependence. Chicago: The University of Chicago Press.
Cavalli-Sforza LL, Piazza A, Menozzi P, and Mountain J (1988) Reconstruction of human evolution: Bringing together genetic, archeological and linguistic data.
Cavalli-Sforza LL and Feldman MW (1981) Cultural Transmission and Evolution: a Quantitative Ap- proach. Monographs in Population Biology, 16. Prince- ton: Princeton University Press.
Cavalli-Sforza LL and Bodmer WF (1971) The Genetics of Human Populations. San Francisco: Freeman.
Cockerham CC and Weir BS (1987) Correlations, de- scent measures: Drift with migration and mutations. Proc. Natl. Acad. Sci. U.S.A. 8423512-8514.
Collinder B (1949) The Lapps. Princeton: Princeton Uni- versity Press.
Collinder B (1965) An Introduction to the Uralic Lan- guages. Berkeley: University of California Press.
Dienes I (1972) The Hungarians Cross the Carpatians. Budapest.
Dienes I (19761 The Hungarians a t the time of the conquest and their ancient beliefs. In Hajdu’ !ed.i:
P.N.A.S., 85:6002-6006.
Ancient Cultures of the Uralian Peoples. Budapest: Corvina Press.
Eriksson AW (1973) Genetic Polymorphism in Finno- Ugrian Populations. Isr. J . Med. Sci. 9:1156-1170.
Eriksson AW, Lehmann W, and Simpson NE (1979) Genetic studies on circumpolar populations. In FA Milan (ed.): The Human Biology of Circumpolar Popu- lations. Cambridge: Cambridge University Press.
Gower JC (1966) Some distance properties of latent root and vector methods used in multivariate analysis. Biometrika 53:325-338.
Jorde LB, Workman PL, and Eriksson AW (1982) Ge- netic microevolution in the h a n d Islands, Finland. In MH Crawford and JH Mielke, (eds.): Current Develop- ments in Anthropological Genetics, New York: Ple- num Press Vol. 2.
Lengyel IA (19791 Blood group distrihntions, preserwd genetic information, in some early hungarian middle age cemeteries. J. Hum. Evol. 8:719-723.
Liptak P (1976) Anthropology of the Finno-Ugrian peo- ples. In Haidu’ (ed.): Ancient Cultures of the Uralian Peoples. Budapest: Corvina Press.
Menozzi P., Piazza A, and Cavalli-Sforza LL (1978) Synthetic maps of human gene frequencies in europe- ans. Science 201:786-792.
Morrison DF (1967) Multivariate Statistical Methods. New York: McGraw-Hill Book Company.
Reynolds J, Weir BS and Cockerman CC (1983) Estima- tion of the coancestry coefficient: Basis for a short- term genetic distance. Genetics 105:767-779.
Ruhlen M (1987) A Guide to the World’s Languages, Vol. 1. Genetic Classification.
Sahavirta A (1963) Statistical Tables. In W. S0derstrgm (ed.): Introduction to Finland 1963. Finland: Osakeyh- tie, Porvoo.
SAS Use’s Guide (1987) Statistics. Sokal RR (1988) Genetic, geographic, and linguistic dis-
tances in Europe. P.N.A.S. 85:1722-1726. Unger M. and Szabolcs 0. (1973) Magyarorszag Tor-
tenete. Budapest: Gondalat. Voegelin CF and Voegelin FM (1977) Classification and
Index of the Worlds Languages. New York: Elsevier. Wijsman EM (1984) Techniques for estimating genetic
admixture and applications to the problem of the origin of the Icelanders and the Ashkenazi Jews. Hum. Genet, 6’/:441448.