Uptake and agronomic efficiency of nitrogen in winter barley and winter wheat
10
European Journal of Agronomy 9 ( 1998) 11–20 Uptake and agronomic e ciency of nitrogen in winter barley and winter wheat G. Delogu a,*, L. Cattivelli a, N. Pecchioni a, D. De Falcis b,1, T. Maggiore c, A.M. Stanca a a Experimental Institute for Cereal Research, Via S. Protaso 302, 1-29017 Fiorenzuola d’Arda, Italy b Agrometeorology Laboratory, Piacenza, Italy c Institute of Agronomy, University of Milan, Via Celoria 2, I-20133 Milano, Italy Received 14 April 1997; accepted 7 December 1997 Abstract Nitrogen (N ) uptake and utilization e ciency (N UtE ) of the high-yielding cultivars ‘Gemini’ of wheat and ‘Jaidor’ of barley were tested with N rates of 0, 140 and 210 kg ha-1 and 0, 80 and 140 kg ha-1, respectively. The di erent grain yield response was linked to their di erence in nitrogen uptake and utilization e ciency. The highest yield in barley was recorded with 80 kg N ha-1 and in wheat with 210 kg N ha-1. Nitrogen application a ected the accumulation of biomass up to heading in wheat and barley. While N uptake during grain filling did not show any correlation to N applied in barley, it was markedly correlated in wheat. At N 0 and N 140 N applied, barley exhibited a 32 and 8% higher N UtE than wheat. N agronomic e ciency, a parameter representing the ability of the plant to increase yield in response to N applied, was similar in barley and wheat (8.7 and 9.2 kg kg-1 of N applied, respectively), suggesting that both species respond equally to nitrogen fertilization. Nevertheless, due to its lower N UtE , wheat requires high N fertilization to optimize yields; by contrast, in barley the lower N rate needed to achieve highest yields enables this crop to perform better in low-input conditions. As a results, the reduced N requirements for barley highest yield associated with a better R F value (apparent N fertilizer recovery of 63% in barley and 49% in wheat at N 140 ) makes barley crop a better choice to reduce ground-water pollution due to nitrate leaching in winter and early spring. © 1998 Elsevier Science B.V. Keywords: Grain yield; Nitrogen uptake; Nitrogen use e ciency; Winter barley; Winter wheat 1. Introduction crop’s physiological needs are both two of modern agriculture’s primary objectives. Growing atten- tion in this connection has been devoted to Reduced overhead costs and the development the nitrogen-use e ciency of plants. Although it of management practices more responsive to a is the determinant factor in cereal crop yield, nitrogen involves high energy-production costs * Corresponding author. Tel: +39 523 983758; fax: +39 523 and is, because of its mobility in the soil–plant– 983750; e-mail: iscfi[email protected] atmosphere system, easily dissipated in the envi- 1 Present address: A.R.S.S.A., Piazza Torlonia 91, I-67051 Avezzano (AQ), Italy. ronment if not properly applied (Giardini, 1989; 1161-0301/98/$19.00 © 1998 Elsevier Science B.V. All rights reserved. PII S1161-0301(98)00019-7
-
Upload
independent -
Category
Documents
-
view
10 -
download
0
Transcript of Uptake and agronomic efficiency of nitrogen in winter barley and winter wheat

European Journal of Agronomy 9 (1998) 11–20
Uptake and agronomic efficiency of nitrogenin winter barley and winter wheat
G. Delogu a,*, L. Cattivelli a, N. Pecchioni a, D. De Falcis b,1, T. Maggiore c,A.M. Stanca a
a Experimental Institute for Cereal Research, Via S. Protaso 302, 1-29017 Fiorenzuola d’Arda, Italyb Agrometeorology Laboratory, Piacenza, Italy
c Institute of Agronomy, University of Milan, Via Celoria 2, I-20133 Milano, Italy
Received 14 April 1997; accepted 7 December 1997
Abstract
Nitrogen (N ) uptake and utilization efficiency (NUtE) of the high-yielding cultivars ‘Gemini’ of wheat and ‘Jaidor’of barley were tested with N rates of 0, 140 and 210 kg ha−1 and 0, 80 and 140 kg ha−1, respectively. The differentgrain yield response was linked to their difference in nitrogen uptake and utilization efficiency. The highest yield inbarley was recorded with 80 kg N ha−1 and in wheat with 210 kg N ha−1. Nitrogen application affected theaccumulation of biomass up to heading in wheat and barley. While N uptake during grain filling did not show anycorrelation to N applied in barley, it was markedly correlated in wheat. At N0 and N140 N applied, barley exhibiteda 32 and 8% higher NUtE than wheat. N agronomic efficiency, a parameter representing the ability of the plant toincrease yield in response to N applied, was similar in barley and wheat (8.7 and 9.2 kg kg−1 of N applied,respectively), suggesting that both species respond equally to nitrogen fertilization. Nevertheless, due to its lowerNUtE, wheat requires high N fertilization to optimize yields; by contrast, in barley the lower N rate needed to achievehighest yields enables this crop to perform better in low-input conditions. As a results, the reduced N requirementsfor barley highest yield associated with a better RF value (apparent N fertilizer recovery of 63% in barley and 49% inwheat at N140) makes barley crop a better choice to reduce ground-water pollution due to nitrate leaching in winterand early spring. © 1998 Elsevier Science B.V.
Keywords: Grain yield; Nitrogen uptake; Nitrogen use efficiency; Winter barley; Winter wheat
1. Introduction crop’s physiological needs are both two of modernagriculture’s primary objectives. Growing atten-tion in this connection has been devoted toReduced overhead costs and the developmentthe nitrogen-use efficiency of plants. Although itof management practices more responsive to ais the determinant factor in cereal crop yield,nitrogen involves high energy-production costs
* Corresponding author. Tel: +39 523 983758; fax: +39 523and is, because of its mobility in the soil–plant–983750; e-mail: [email protected] system, easily dissipated in the envi-1 Present address: A.R.S.S.A., Piazza Torlonia 91, I-67051
Avezzano (AQ), Italy. ronment if not properly applied (Giardini, 1989;
1161-0301/98/$19.00 © 1998 Elsevier Science B.V. All rights reserved.PII S1161-0301 ( 98 ) 00019-7
12 G. Delogu et al. / European Journal of Agronomy 9 (1998) 11–20
Sequi and Vittori Antistari, 1989; Mahler et al., 2. Materials and methods1994; Guillard et al., 1995).
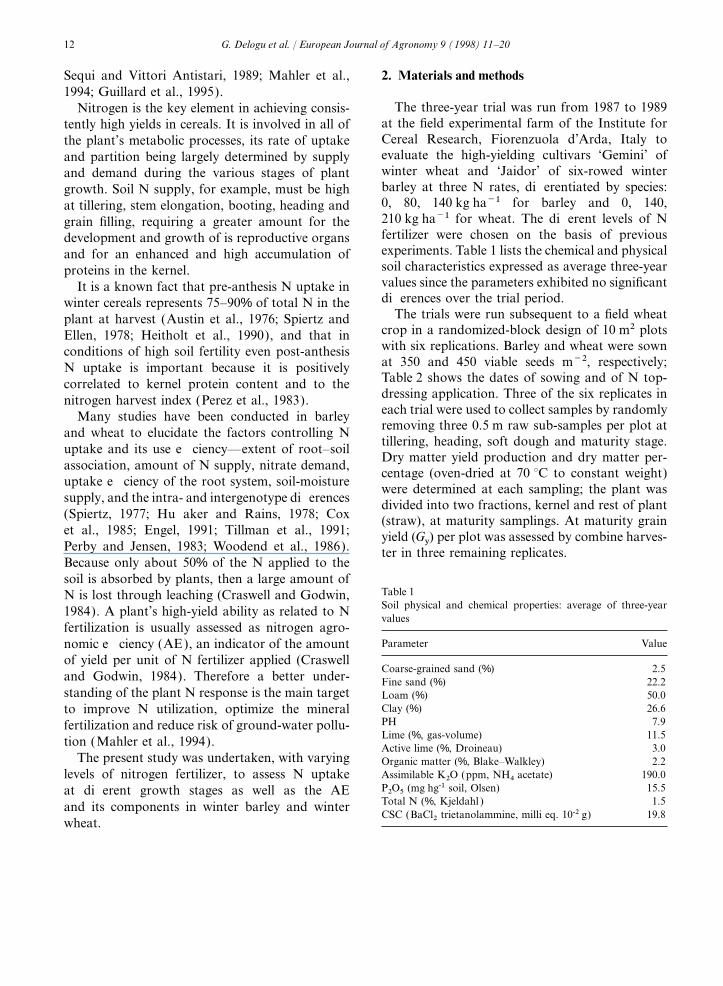
The three-year trial was run from 1987 to 1989Nitrogen is the key element in achieving consis-at the field experimental farm of the Institute fortently high yields in cereals. It is involved in all ofCereal Research, Fiorenzuola d’Arda, Italy tothe plant’s metabolic processes, its rate of uptakeevaluate the high-yielding cultivars ‘Gemini’ ofand partition being largely determined by supplywinter wheat and ‘Jaidor’ of six-rowed winterand demand during the various stages of plantbarley at three N rates, differentiated by species:growth. Soil N supply, for example, must be high0, 80, 140 kg ha−1 for barley and 0, 140,at tillering, stem elongation, booting, heading and210 kg ha−1 for wheat. The different levels of Ngrain filling, requiring a greater amount for thefertilizer were chosen on the basis of previousdevelopment and growth of is reproductive organsexperiments. Table 1 lists the chemical and physicaland for an enhanced and high accumulation ofsoil characteristics expressed as average three-yearproteins in the kernel.values since the parameters exhibited no significantIt is a known fact that pre-anthesis N uptake indifferences over the trial period.winter cereals represents 75–90% of total N in the
The trials were run subsequent to a field wheatplant at harvest (Austin et al., 1976; Spiertz andcrop in a randomized-block design of 10 m2 plotsEllen, 1978; Heitholt et al., 1990), and that inwith six replications. Barley and wheat were sownconditions of high soil fertility even post-anthesisat 350 and 450 viable seeds m−2, respectively;N uptake is important because it is positivelyTable 2 shows the dates of sowing and of N top-correlated to kernel protein content and to thedressing application. Three of the six replicates innitrogen harvest index (Perez et al., 1983).each trial were used to collect samples by randomlyMany studies have been conducted in barleyremoving three 0.5 m raw sub-samples per plot atand wheat to elucidate the factors controlling Ntillering, heading, soft dough and maturity stage.uptake and its use efficiency—extent of root–soilDry matter yield production and dry matter per-
association, amount of N supply, nitrate demand,centage (oven-dried at 70 °C to constant weight)
uptake efficiency of the root system, soil-moisture were determined at each sampling; the plant wassupply, and the intra- and intergenotype differences divided into two fractions, kernel and rest of plant(Spiertz, 1977; Huffaker and Rains, 1978; Cox (straw), at maturity samplings. At maturity grainet al., 1985; Engel, 1991; Tillman et al., 1991; yield (Gy) per plot was assessed by combine harves-Perby and Jensen, 1983; Woodend et al., 1986). ter in three remaining replicates.Because only about 50% of the N applied to thesoil is absorbed by plants, then a large amount of
Table 1N is lost through leaching (Craswell and Godwin,Soil physical and chemical properties: average of three-year1984). A plant’s high-yield ability as related to Nvalues
fertilization is usually assessed as nitrogen agro-Parameter Valuenomic efficiency (AE), an indicator of the amount
of yield per unit of N fertilizer applied (CraswellCoarse-grained sand (%) 2.5
and Godwin, 1984). Therefore a better under- Fine sand (%) 22.2standing of the plant N response is the main target Loam (%) 50.0
Clay (%) 26.6to improve N utilization, optimize the mineralPH 7.9fertilization and reduce risk of ground-water pollu-Lime (%, gas-volume) 11.5tion (Mahler et al., 1994). Active lime (%, Droineau) 3.0
The present study was undertaken, with varying Organic matter (%, Blake–Walkley) 2.2Assimilable K2O (ppm, NH4 acetate) 190.0levels of nitrogen fertilizer, to assess N uptakeP2O5 (mg hg-1 soil, Olsen) 15.5at different growth stages as well as the AETotal N (%, Kjeldahl ) 1.5and its components in winter barley and winterCSC (BaCl2 trietanolammine, milli eq. 10-2 g) 19.8
wheat.

13G. Delogu et al. / European Journal of Agronomy 9 (1998) 11–20
Table 2Sowing date and nitrogen application date for winter barley and wheat
Year Sowing datea Timings of N top-dressing (kg ha-1)
Date Rate Date Rate Date Rate
N0 N80 N140 N0 N80 N140 N0 N80 N140
Barley1987 7/11/86 9/3 - 30 60 16/4 - 20 501988 21/10/87 1/2 - 20 50 3/3 - 15 30 18/4 - 15 301989 3/11/88 13/2 - 20 50 29/3 - 15 30 2/5 - 15 30
Date Rate Date Rate Date Rate
N0 N140 N210 N0 N140 N210 N0 N140 N210
Wheat1987 7/11/86 9/3 - 50 80 16/4 - 60 1001988 21/10/87 1/2 – 50 80 3/3 - 30 50 18/4 - 30 501989 3/11/88 13/2 – 50 80 29/3 - 30 50 2/5 - 30 50
aBefore sowing 100 kg P2O5 ha−1 and 100 kg K2O ha−1 were applied to all plots and 30 kg N ha−1 to all plots, except N0.
The N precentage was determined after (7) physiological efficiency (PE) as the ratio of(yield at N
x-yield at N0) to (N uptake atKjeldahl’s micro-method analysis, followed by
calorimetric reading with an automatic CLA Nx−N uptake at N0);
(8) apparent recovery fraction (RF) (%) as theanalyser (Carlo Erba, Milano, Italy).Total N uptake (Nt) as kg ha−1 at the various ratio of (N uptake at N
x−N uptake at N0) to
applied N at Nx; (N efficiency terminologyharvests was calculated by multiplying above-
ground dry matter by the N percentage. according to Novoa and Loomis, 1981; Mollet al., 1982; Craswell and Godwin, 1984; andThe following parameters were calculated:
(1) post-heading N uptake (kg ha−1) as difference Huggins and Pan, 1993).Heading date (days from April 1st), plant heightin N content of the total whole plant at
maturity and at heading; (cm), grain yield (t ha−1 at 13% moisture), harvestindex (%), 1000-kernel weight (g) and spike(2) translocated N (kg ha−1) as the difference
between total whole plant N at heading and number m−2 were also assessed for each trial. Thestatistical analysis was run per species using aN content in straw at maturity;
(3) translocation efficiency (%) as the ratio of factorial model. The results here presented arethose in which statistical differences were found.translocated N to total whole plant N at
heading;(4) nitrogen harvest index (NHI) as the ratio of
total N in grain (Ng) to total above-ground 3. Resultsplant N at maturity (Nt);
(5) nitrogen utilization efficiency (NUtE) (kg kg−1) 3.1. Weather conditionsas the ratio of Gy to Nt;
(6) agronomic efficiency (AE) (kg kg−1) as the Weather data during the experimental period1986/1987–1988/1989 in comparison with theratio of (yield at N
x-yield at N0) to applied N
at Nx; 30 year mean values (1959–1989) are shown in

14 G. Delogu et al. / European Journal of Agronomy 9 (1998) 11–20
Fig. 1. Total precipitations in 1986/1987 and in mum temperatures in 1988/1989, except fromNovember to January, were approximately1987/1988 were approximately normal, whereas
the rainfall in 1988/1989 was 46% lower than normal; by contrast in 1986/1987 and 1987/1988the minimum temperature in February and Marchnormal, a condition promoting a reduced leaching
of nitrogen in the soil. The minimum and maxi- was lower than the 30 year mean value. The partic-ular trend of the 1988/1989 growing season wasthe principal cause of the year and year×N inter-action effects.
3.2. Biomass and grain yield
Barley grain yield, harvest index, 1000-kernelweight and heading date were significantly affectedby year and N rate, whereas only N rate affectedspike number m−2 (Table 3). Dry matter yield andN uptake varied significantly over plant growthstages, in relation to N rate, year (Fig. 2 and 3)and their interaction (data not shown). While drymatter yield increased at rising N rates (Fig. 2),grain yield registered its highest value at N80 andN140 (Table 3), a pattern essentially related to theharvest index, which dropped from 54% at N0 to50% at N140.
Wheat grain yield, harvest index, 1000-kernelweight and spike number m−2 were significantlyaffected by year, N rate and their interaction. Plantheight exhibited significant effects only in relationto N rate and its interaction with years, whereasthe variability of heading date was linked to yearalone (Table 4). Grain yield was highest at N210,when values for spike number m−2 and plantheight were also highest and harvest index and1000-kernel weight were lowest (Table 4).
Dry matter accumulation at the various plantgrowth stages was significantly affected by yearand N rate (Fig. 2), whereas their interaction wasonly significantly different at soft dough stage andmaturity (data not shown). Dry matter increasedwith increasing N rates and the average 1989biomass was higher than in the preceding years(Fig. 2).
3.3. N uptake and translocationFig. 1. Per-decade trends of maximum (———) and minimum( · · · ) temperatures and precipitation (vertical bars) for the
3.3.1. Barley30-year average (A) and for the growing seasons 1986/1987 (B),Above-ground plant N uptake rose at increasing1987/1988 (C), 1988/1989 (D) at Fiorenzuola d’Arda (PC),
Italy. N rate at all successive growth stages and the

15G. Delogu et al. / European Journal of Agronomy 9 (1998) 11–20
Table 3Winter barley: grain yield (t ha−1 at 13% moisture), harvest index (%), 1000-kernel weight (g), spike number m−2, plant height (cm)and heading date (d=days from April 1st); mean values for N rates and years
Fertilization, kg N ha−1 LSD(0.05) Year LSD(0.05)
N0 N80 N140 1987 1988 1989
Grain yield (t ha−1) 7.0 7.7 8.2 0.5 7.3 7.4 8.3 0.5Harvest index (%) 54 52 50 1 52 53 51 11000-kernel wt (g) 43 42 39 2 42 39 43 2Spike no. m−2 497 570 634 63 542 582 577 63Plant height (cm) 85 96 100 4 83 89 109 4Heading (d) 30 32 34 1 42 23 37 1
response of 1989 was significantly higher then the 165 kg ha−1 amounts for grain. The N content ofthe straw at maturity was closely correlated withtwo preceding years (Fig. 3).
The average values of years, of N rates for N the plant N content at is heading (r=0.99).Post-heading N uptake averaged 35 kg ha−1,content in whole plants at heading and its parti-
tioning in grain and straw accumulation at matu- unaffected by year, N rate or their interaction.Total grain N content increased with Nrity, as well as post-heading accumulation, N
amount translocated to the kernel, and transloca- application.The translocation amount was affectedby both year and rate and ranged from 63 (N0)tion efficiency, are shown in Table 5. Total N in
the whole plant (above-ground only), in the grain to 134 kg ha−1 (N140); translocation efficiencyaveraged 75% and showed no substantial effectsand in the straw was signficantly affected by
year, N rate and their interaction. Whole plant related to year and rate. The ‘year×N rate’ inter-action was significant for N content both in theN content at maturity was 121, 162 and
210 kg ha−1 for N0, N80 and N140, respectively, a grain and in the straw and highlighted cropresponse to the weather condiditions in 1989.trend related to the increasing 100, 131 and
Fig. 2. Mean values of dry matter at tillering (1), heading (2), soft dough (3) and maturity (4) stages. Bars represent the LSD0.05for mean values comparison. (A) Effect of N rate on winter barley (N0, – n –; N80, – & –; N140, – % –); (B) effect of years on winterbarley (1987, – n –; 1988, – & –; 1989, – % –; (C) effect of N rate on winter wheat (N0, – n –; N140, – & –; N210, – % –); (D) effectof years on winter wheat (1987, – n –; 1988, – & –; 1989, – % –).

16 G. Delogu et al. / European Journal of Agronomy 9 (1998) 11–20
Fig. 3. Mean values of total N uptake at tillering (1), heading (2), soft dough (3) and maturity (4) stages. Bars represent theLSD0.5 for mean values comparison. (A) Effect of N rate on winter barley (N0, – n –; N80, – & –; N140, – % –); (B) effect of yearson winter barley (1987, – n –; 1988, – & –; 1989, – % –); (C) effect of N rate on winter wheat (N0, – n –; N140, – & –; N210, – % –);(D) effect of years on winter wheat (1987, – n –; 1988, – & –; 1989, – % –).
3.3.2. Wheat 44 kg ha−1 at N210 (Table 6). While translocatedN in the grain rose from 70 kg ha−1 (N0) toAbove-ground plant N uptake over the various
growth stages was significantly affected by year 116 kg ha−1 (N210), no significant differences werefound between N140 and N210, and translocationand rate (Fig. 3), whereas their interaction proved
significant only at the soft dough and maturity efficiency dropped only at N210.stages (data not shown). N uptake rose at increas-ing rate, although the pattern differed from year 3.4. Nitrogen agronomic efficiency and its
componentsto year and in 1989 the highest values of N uptakewere recorded (Fig. 3).
Total N content in kernel and in straw at 3.4.1. BarleyThe average values of NUtE decreased as thematurity proved to be significantly affected only
by year and N rate (Table 6). Post-heading N input N rate increased, dropping from 58 (N0) to48 (N80) and to 39 (N140) kg of grain kg−1 of Nt.uptake was positively affected by both year and
rate, the values rising from 20 kg ha−1 at N0 to Similarly, the NHI significantly decreased from 83%
Table 4Winter wheat: grain yield (t ha−1 at 13% moisture), harvest index (%), 1000-kernel weight (g), spike number m−2, plant height (cm)and heading date (days from April 1st); mean values for N rates and years
Fertilization, kg N ha−1 LSD(0.05) Year LSD(0.05)
N0 N140 N210 1987 1988 1989
Grain yield (t ha−1) 5.6 6.9 7.5 0.4 6.4 5.7 8.0 0.4Harvest index (%) 51 47 45 1 48 51 45 11000-kernel wt (g) 41 39 36 1 42 36 38 1Spike no. m−2 582 680 730 23 651 636 706 23Plant height (cm) 63 71 75 3 71 69 71 3Heading (d) 40 41 42 2 47 34 42 2

17G. Delogu et al. / European Journal of Agronomy 9 (1998) 11–20
Table 5Winter barley: total N uptake at heading and maturity stage in aerial biomass and in grain, N uptake, N translocation after headingand its efficiency. Mean values for N rate and years
N uptake N translocation, N translocation(kg ha-1) efficiency, (%)
Heading Post-heading Maturitywhole plant whole plant
Straw Grain
N rate, kg ha-1N0 84 37 21 100 63 75N80 125 37 31 131 94 75N140 180 30 45 165 134 75LSD(0.05) 11 12 3 8 11 4Year1987 117 37 28 126 88 751988 115 28 27 115 87 761989 158 39 42 155 116 74LSD(0.05) 11 12 3 8 11 4
at N0 to 79% at N140. By contrast AE was not with a lower value at N210. Variations of AE andRF at different N rate were not significant, whilesignificantly different at the two levels of N rates.
RF increased from 51% at N80 to 63% at N140, PE decreased from 19 (N140) to 16 (N210) kg ofgrain kg−1 N (Table 7).while PE decreased from 17 (N80) to 13 (N140) kg
of grain kg−1 N (Table 7).
3.4.2. Wheat 4. DiscussionNUtE decreased as N applied increased. While
NUtE at N0 was 44 kg of grain kg−1 of Nt, it The overall findings indicate that the differenti-ated yield response of barley and wheat to N ratedropped to 36 for N140 and 31 for N210. The NHI
showed the same results between the N0 and N140 is linked to each crop’s varying N uptake and its
Table 6Winter wheat: total N uptake at heading and maturity stage in aerial biomass and grain, N uptake, N translocation after headingand its efficiency. Mean values for N rates and years
N uptake (kg ha−1) N translocation N translocation(kg ha-1) efficiency (%)
Heading Post-heading Maturitywhole plant whole plant
Straw Grain
N rate, kg ha-1N0 104 20 34 92 70 67N140 158 38 56 138 102 64N210 202 44 86 158 116 57LSD(0.05) 14 16 7 11 17 6Year1987 178 16 68 126 111 631988 105 46 40 111 65 631989 181 41 69 151 112 62LSD(0.05) 14 16 7 11 17 6

18 G. Delogu et al. / European Journal of Agronomy 9 (1998) 11–20
Table 7Winter barley and wheat: N utilization efficiency (NUtE), N harvest index (NHI), N agronomic efficiency (AE) and its components;mean values of N rates
N rate, Barley N rate, Wheatkg ha−1 kg ha−1
NUtE, NHI, AE, PE, RF, NUtE, NHI, AE, PE, RF,kg kg−1 % kg kg−1 kg kg−1 % kg kg−1 (%) kg kg-1 kg kg−1 %
N0 58 83 - - - N0 44 73 - - -N80 48 81 8.8 17 51 N140 36 71 9.3 19 49N140 39 79 8.6 13 63 N210 31 65 9.0 16 56LSD(0.05) 4 2 1.6 3 8 LSD(0.05) 4 4 0.8 2 7Mean 48 81 8.7 15 57 Mean 37 70 9.2 18 53
use capacity. Both barley and wheat without N N rate (N0=67%; N140=64%; N210=57%), afinding in agreement with Spiertz and Ellen (1978),fertilizer (N0) showed altogether similar plant N
uptake at season’s end—121 and 126 kg ha−1, Dalling (1985) and Campbell et al. (1983).N utilization efficiency (NUtE) reflects the abilityrespectively, although barley recorded a 25%
higher grain yield. of the plant to translate the N uptaken intoeconomic yield (grains). This parameter has beenDuring plant growth from germination up to
heading, nitrogen has a dominant role in dry extensively used to compare different species orcultivars at different levels of N fertility (Ortiz-matter formation and accumulation, both species
being enhanced by this action at rising N rates Monasterio et al., 1997). Comparing the NUtEvalues of the two cereals, barley outperformed(Austin et al., 1977; Heitholt et al., 1990). At
heading, barley N uptake was 70, 77 and 86% of wheat, registering a 32 and 8% NUtE increase overwheat at the N0 and N140, suggesting a highertotal N uptake for N0, N80 and N140, respectively,
and the average for wheat was 82%. With only ability of barley to generate yield, particularly atlow N input. This finding is connected to barley’s35 kg ha−1 for barley at the post-heading growth
stages, its assimilation appeared no longer to be higher NHI, which registered, respectively, for N0and N140, 14 and 11% higher values than wheat atlinked to the different N rates, whereas in wheat
the post-heading N uptake increased from N0 to the same rates. These results can be linked to pre-heading assimilitation processes and above all toN210 by about 50%. Barley’s grain yield was thus
not related to post-heading N uptake, a fact that a better translocation ability, indicating that barleyremoved more nitrogen from the straw to theunderscored this crop’s greater N demand in its
early growth stages (Penny et al., 1986). grain. Indeed, the amount of translocated Nin barley increased at rising rates, reachingBy contrast, wheat’s pre- and post-heading N
uptake were closely related to grain yield, however 134 kg ha−1 at N140. Wheat on the other handshowed only 102 kg ha−1 at N140, a value that didpost-heading N uptake is known to be more influ-
enced by such environmental factors as high tem- not significantly improve even at N210, therebyindicating the importance for wheat of post-head-peratures, N supply and moisture in the soil
(Papakosta and Gagianas, 1991). On the other ing N supply and uptake in achieving peak yields.Nitrogen agronomic efficiency (AE) representshand it is well known that late top-dressing nitro-
gen fertilization improves protein content of wheat the ability of the plant to increase yield in responseto N applied (Novoa and Loomis, 1981; Craswellgrain (Spiertz and Ellen, 1978; Perez et al., 1983).
Barley also exhibited a higher N translocation and Godwin, 1984).AE mean values of barley and wheat were similarefficiency in the grain (75%) that was not affected
by N rate, whereas the opposite was true of wheat (8.7 and 9.2 kg kg−1 of N applied) suggesting thatboth species respond equally to nitrogen fertiliza-in that its translocation efficiency dropped at rising

19G. Delogu et al. / European Journal of Agronomy 9 (1998) 11–20
Craswell, E.T., Godwin, D.C., 1984. The efficiency of nitrogention. Nevertheless RF in barley outperformedfertilizers applied to cereals in different climates. Adv. Plant.wheat, registering a 22% RF increase over wheatNutr. 1, 1–55.at N140. At the same N rate (N140), PE value was Dalling, M.J., 1985. The physiological basis of nitrogen redistri-
31% higher in wheat than in barley. bution during grain filling in cereals. In: Harper, J.E.,The present study’s overall findings indicate the Schrader, L.E., Howell, H.W. (Eds.), Exploitation of
Physiological and Genetic Variability to Enhance Cropdifferent roles that barley and wheat can play inProductivity. American Society of Plant Physiology,crop rotations designed to meet the demands ofRockville, MD, p. 55–71.modern agriculture. Because of its lower NUtE,
Engel, R.E., 1991. Soils. Simulated growing-season precipita-wheat requires high N rate to optimize yields, a tion and nitrogen effects on winter wheat yield. Agron. J.requirement that hardly matches the demands for 83, 180–185.
Giardini, L., 1989. Aspetti agronomici e fisiologici della conci-an eco-compatible agriculture at low energy inputs.mazione azotata in relazione con l’ambiente. Riv. di Agron.By contrast, in barley the lower N rate needed to23 (1), 3–22.achieve highest yields (N80 compared with N210 in
Guillard, K., Griffin, G.F., Allinson, D.W., Moosa Rafey, M.,wheat), due to greater NUtE, enables this crop to Yamartino, W.R., Pietrzyk, S.W., 1995. Nitrogen utilizationperform better in low-input conditions. As a result, of selected cropping systems in the U.S. Northeast: dry matter
yield, N uptake, apparent N recovery, and N use efficiency.the reduced N requirements for barley highestAgron. J. 87, 193–199.yield associated with a better RF value makes
Heitholt, J.J., Croy, L.I., Maness, N.O., Nguyen, H.T., 1990.barley crop a better choice wherever conditionsNitrogen partitioning in genotypes of winter wheat differing
demand full exploitation of residual fertility in in grain N concentration. Field Crops Res. 23, 133–144.crop rotation to reduce ground-water pollution Huffaker, R.C., Rains, D.W., Factors influencing nitratedue to nitrate leaching in winter and early spring. acquisition by plant: Assimilation and fate of reduced nitro-
gen. In: Nielson, D.R., MacDonald, J.G. (Eds.), Nitrogen inthe Environment, Vol. 2. Academic Press, New York, 1978,pp. 1–43.
Huggins, D.R., Pan, W.L., 1993. Nitrogen efficiency componentAcknowledgment analysis: an evaluation of cropping system differences in pro-
ductivity. Agron. J. 85, 898–905.Mahler, R.L., Koehler, F.E., Lutcher, L.K., 1994. Soils.We wish to thank Dr C. Delogu and Dr M.
Nitrogen source, timing of application, and placement: effectsCorbellini for the chemical analysis, R. Albericion winter wheat production. Agron. J. 86, 637–642.and M. Baravelli for the technical assistance. This Moll, R.H., Kamprath, E.J., Jackson, W.A., 1982. Analysis and
work was supported by the projects ‘MICIA’ and interpretation of is factors which contribute to efficiency of‘Fenologia in Agricoltura’, MIPA, Italy. nitrogen utilization. Agron. J. 74, 562–564.
Novoa, R., Loomis, R.S., 1981. Nitrogen and plant production.Plant and Soil 58, 177–204.
Ortiz-Monasterio, J.I., Sayre, K.D., Rajaram, S., McMahom,M., 1997. Genetic progress in wheat yield and nitrogen use
References efficiency under fuor nitrogen rates. Crop Sci. 37, 898–904.Papakosta, D.K., Gagianas, A.A., 1991. Nitrogen and dry
matter accumulation, remobilization, and losses of mediterra-Austin, R.B., Edrich, J.A., Ford, M.A., Blackwell, R.D., 1976.nean wheat during grain filling. Agron. J. 83, 864–870.Report of the Plant Breeding Institute, Cambridge for 1975,
Penny, A., Widdowson, F.V., Jenkyn, J.F., 1986. Results frompp. 140–141.experiments on winter barley measuring the effects of amountAustin, R.B., Ford, M.A., Edrich, J.A., Blackwell, R.D., 1977.and timing of nitrogen and some other factors on the yieldThe nitrogen economy of winter wheat. J. Agric. Sci., Camb.and nitrogen content of the grain. J. agric. Sci., Camb. 106,88, 159–167.537–549.Campbell, C.A., Davidson, H.R., McCaig, T.N., 1983.
Perby, H., Jensen, P., 1983. Varietal differences in uptake andDisposition of nitrogen and soluble sugars in Manitou springutilization of nitrogen and other macro-elements in seedlingswheat as influenced by N fertilizer, temperature and durationof barley, Hordeum vulgare. Physiol. Plant. 58, 223–230.and stage of moisture stress. Can. J. Plant Sci. 63, 73–90.
Perez, P., Martinez-Carrasco, R., Sanchez de La Puente, L.,Cox, M.C., Qualset, C.O., Rains, D.W., 1985. Genetic variation1983. Uptake and distribution of nitrogen in wheat plantsfor nitrogen assimilation and translocation in wheat.supplied with different amounts of nitrogen after stem elonga-Nitrogen assimilation in relation to grain yield and protein.
Crop Sci. 25, 435–440. tion. Ann. Appl. Biol. 102, 399–406.

20 G. Delogu et al. / European Journal of Agronomy 9 (1998) 11–20
Sequi, P., Vittori Antistari, L., 1989. Dinamismo chimico dell’a- assimilation and utilization of assimilates and nutrients.Neth. J. Agric. Sci. 26, 210–231.zoto: aspetti agronomici e ambientali. Riv. di Agron. 23
(1), 30–42. Tillman, B.A., Pan, W.L., Ullrich, S.E., 1991. Nitrogen use byNorthern-adapted barley genotypes under no-till. Agron. J.Spiertz, J.H.J., 1977. The influence of temperature and light
intensity on grain growth in relation to the carbohydrate and 83, 194–201.Woodend, J.J., Glass, A.D.M., Person, C.O., 1986. Intraspecificnitrogen economy of the wheat plant. Neth. J. Agric. Sci.
25, 182–231. variation for nitrate uptake and nitrogen utilization in wheat(T. aestivum L.) grown under nitrogen stress. J. Plant Nutr.Spiertz, J.H.J., Ellen, J., 1978. Effects of nitrogen on crop
development and grain growth of winter wheat in relation to 9, 1213–1225.