UPPER NORTH ISLAND KEY SECTOR TRENDS TO 2015 ...
102
UPPER NORTH ISLAND KEY SECTOR TRENDS TO 2015 AND LABOUR DEMAND TO 2020 Overview Report June 2016
-
Upload
khangminh22 -
Category
Documents
-
view
1 -
download
0
Transcript of UPPER NORTH ISLAND KEY SECTOR TRENDS TO 2015 ...

UPPER NORTH ISLAND KEY SECTOR TRENDS TO 2015 AND LABOUR DEMAND TO 2020
Overview Report
June 2016


CONTENTS
Preface 7
Introduction 1
Purpose 1
Format 1
Background 2
The UNI area 2
The UNI labour market 4
Summary of the UNI labour market 19
Identifying Key Sectors 21
Defining sectors 21
Identifying key sectors 24
Sector analysis by region 24
Skill Shortages 27
Labour market framework 27
Labour supply 28
Labour demand 34
Existing initiatives 46
A potential role for UNISA 57
Recommendations 61
Interview questions: future labour and skill shortages in the Upper North Island (UNI) 91
APPENDICES
Appendices 63
Appendix 1: UNI Sector Definitions 64
Appendix 2: Sector Analysis 77
Appendix 3: Labour Force Scenarios 81

Appendix 4: Labour supply and demand methodology 83
Appendix 5: Industry Consultation 86
TABLES Table 1: GDP and GDP growth by UNI region 9
Table 2: UNI region, job numbers and job growth 9
Table 3: Major occupations in the UNI 12
Table 4: Commuting patterns in the UNI, 2013 16
Table 5: Summary of sector definitions 22
Table 6: Overall rankings of sectors by region in the UNI area (whether the sector ranks in
the top 12 in each region across the criteria) 26
Table 7: Graduates from tertiary education in the UNI who are likely to make themselves
available for work, 2016 to 2020 31
Table 8: Forecast net migration (international and regional) of labour to the UNI by
qualification level, 2016 to 2020 32
Table 9: Forecast additional supply of labour in the UNI by field of study and qualification
level, 2016 to 2020 33
Table 10: New Zealand economy, 2015 to 2020 forecast 34
Table 11: Moderated employment forecasts by region and key sector, 2016 to 2020 36
Table 12: Job openings in the UNI by broad occupation, 2016 to 2020 37
Table 13: Job openings in the UNI by qualification level, 2016 to 2020 38
Table 14: Likely broad field of study and qualification level of people required to fill job
openings, 2016 to 2020 39
Table 15: Job openings by sector and by type, 2016 to 2020 40
Table 16: Job openings by sector and region, 2016 to 2020 41
Table 17: Skill imbalances in the UNI by qualification level, 2016 to 2020 42
Table 18: Occupations with the greatest forecast undersupply in the UNI, 2016 to 2020 44
Table 19: Relevant occupations forecast to be under-supplied, by key sector 45
Table 20. Skill and Labour Market Initiatives in the UNI 48
Table 21. Proposed next steps for UNISA 62
Table 22: Comparison of sector value chain definitions 64
Table 23: Definitions for UNI sectors 72
Table 24: Sector analysis for the Northland region 77

Table 25: Sector analysis for the Auckland region 78
Table 26: Sector analysis for Waikato 79
Table 27: Sector analysis for the Bay of Plenty region 80
Table 28: UNI labour force growth to 2033 under various scenarios 82
Table 29: Organisations consulted in second round of interviews 90
FIGURES Figure 1: Upper North Island area map 2
Figure 2: UNI area population in 2015 and 10, 3 and 1-year change 4
Figure 3: UNI population age composition, 2013 5
Figure 4: UNI population ethnic mix, 2013 6
Figure 5: UNI migrants by birthplace, 2013 7
Figure 6: UNI area GDP in 2015, and 10, 3 and 1-year change 8
Figure 7: UNI area filled jobs 2015 and 10, 3 and 1-year change 10
Figure 8: UNI labour force participation rates, 2005 to 2015 11
Figure 9: UNI unemployment rates, 2005 to 2015 12
Figure 10: UNI estimated productivity, 2000 to 2015 13
Figure 11: Proportion of the resident population (aged 15 years or over) with qualifications,
2013 14
Figure 12: Percentage of 18-year-olds with a minimum of NCEA level 2 or equivalent, 2014 14
Figure 13: Achievement levels among all school leavers, 2014 15
Figure 14: Youth NEET rates in the UNI and New Zealand, 2009 to 2015 15
Figure 15: Region of usual residence 5 years ago, total population, 2013 17
Figure 16: Source of inward-migration, Northland, 2013 17
Figure 17: Source of inward-migration, Auckland, 2013 18
Figure 18: Source of inward-migration, Waikato, 2013 18
Figure 19: Source of inward-migration, Bay of Plenty, 2013 19
Figure 20: Flow chart of Supply and Demand matching methodology 27
Figure 21: Projected labour force in the UNI to 2033, baseline scenario 29
Figure 22: School leavers in the UNI likely to make themselves available for work, 2010 to
2020 30

Figure 23: Forecast additional supply of labour in the UNI by qualification level by individual
year, 2016 to 2020 33
Figure 24: Historic and forecast new job (net) growth in the UNI and New Zealand, 2001 to
2020, BAU scenario 35
Figure 25: Job openings in the UNI by qualification level in individual years, 2016 to 2020 39
Figure 26: Skill imbalances in the UNI by individual year, 2016 to 2020 42
Figure 27: Labour force projections under various scenarios 82

PREFACE
This report has been prepared for the Upper North Island Strategic Alliance by Stephen Knuckey,
Jason Leung-Wai and Tim Borren from MartinJenkins (Martin, Jenkins & Associates Limited) and
Andrew Whiteford, Benje Patterson, Shaun Twaddle and David Kennedy from Infometrics Ltd.


1
INTRODUCTION
Purpose
At the end of August 2015, Upper North Island (UNI) councils1 commissioned MartinJenkins and
Infometrics to:
identify criteria for selecting key industry sectors for the UNI and identify a subset of such sectors
identify value chains for these sectors and the extent of connectedness across the UNI
identify emerging constraints to and opportunities for growth of these sectors
develop growth scenarios for the sectors in the UNI region and forecast the demand and supply
of labour and skills for these sectors, taking into account demographic, economic and
technological trends
identify and assess actions that could be taken to improve the matching of supply and demand by
reviewing existing skill-based initiatives in the selected sectors in the region
allow UNI councils to understand the extent to which the UNI operates as an economic unit and,
as a result, the extent to which it is important that industry development decisions are made
within a UNI context for the success of New Zealand and individual regions and cities.
Format
The study has been split into two parts – an overview report and a key sector report.
This overview report provides:
a description of the UNI area and its labour market to provide context for the forecasts and
subsequent analysis
a description of the selection of key sectors that will drive growth in the UNI area
the method for forecasting demand and supply by key sector and relevant occupations
overall forecasts for the demand and supply of labour and skills in the UNI area for the five years
to 2020 and the major occupational gaps that are likely to emerge
a summary of current initiatives focused on addressing skill and labour demands for key sectors
an assessment of the role of the Upper North Island Strategic Alliance (UNISA) in improving
labour market outcomes to support key sectors in the UNI area.
The second report presents detailed analysis of value chains, labour and occupational demand and
supply forecasts, and a review of current skill and labour initiatives for each key sector.
1 The Upper North Island Strategic Alliance (UNISA) is a grouping of seven councils. These are the four regional/unitary councils of
Northland, Auckland, Waikato and Bay of Plenty, and the major city/district councils in Whangārei, Hamilton and Tauranga. There are
several other councils that fall within the UNI area but are not part of the UNISA. These include the Far North, Kaipara, Hauraki, Matamata-
Piako, Thames-Coromandel, Waikato, Waipa, Waitomo, Otorohanga, South Waikato, Taupō, Rotorua, Ōpōtiki, Kawerau, and Western Bay
of Plenty. In all there are 22 local or regional authorities within the UNI area.

2
BACKGROUND The UNI area
The Upper North Island (UNI) area comprises Northland, Auckland, Bay of Plenty and Waikato as
shown in Figure 1.
Figure 1: Upper North Island area map
Source: UNISA
The UNI area accounts for over half of New Zealand’s population and is a major driver of population
growth nationally. As emphasised in the work of the National Institute of Demographic and Economic
Analysis (Jackson, 2014), the population of the UNI area has grown by over 50 percent over the last
three decades and is forecast to continue to grow by around another 25 percent over the next 15
years. Growth has not been uniform across the UNI, however, with over a quarter of the census area
units within the region declining in population between 2006 and 2013. Furthermore, future population
growth will occur in older age groups, with almost half of the UNI’s growth occurring in the 65 plus age
brackets. Again, there are differences across the UNI, with Northland and Bay of Plenty having
particularly aging populations, coupled with net migration loss of young adults, while Auckland has a
more youthful age structure.
These factors will impact on skills availability within UNI regions and across the UNI. In all UNI
regions, lifting skills and labour market engagement will be critical to unlock development
opportunities. However, there are already existing employment and skill issues:

3
Northland’s underperformance on measures of educational attainment and skills were highlighted
in the Tai Tokerau Regional Growth Study (MartinJenkins, 2015). The region has significant
potential for employment growth across primary industries but this potential may be constrained
by a lack of available skills. This is due to the shrinking working age population in the region,
perceptions of few attractive jobs and career paths in primary industries and because many
young people in the region are disengaged from education and employment. The study found that
employers and young people can find it difficult to access information about skill requirements
and the likely occupational demands of growth industries, which can make it difficult to plan for
the training and development of the future workforce.
The recession significantly impacted employment growth in Auckland although it has recovered to
previous levels. The fastest job growth over the last decade has been in health care, social
assistance, accommodation and food services. Previous research in Auckland has found that
several sectors are experiencing skill shortages, including health and medical, ICT, electronics
and engineering. Employers have expressed concerns about the difficulty in finding employees
with ‘soft’ skills as well as technical skills. Auckland’s working age population has relatively high
levels of educational attainment, although there is significant regional and ethnic variation, with
attainment levels below average in the South and for Māori and Pasifika.
Waikato also faces a range of existing skill constraints, including lower proportions of the working
age population with tertiary or other formal qualifications and a high proportion of youth not in
employment, education or training. Significant skill demands have been identified for the
construction, agriculture, retail, health and education industries. The ability to attract, develop and
retain skills was identified as a key issue by businesses consulted with as part of the Waikato
Economic Development Strategy process and they reported low levels of language, literacy and
numeracy in employees as concerns. Businesses also reported difficulties recruiting low and
semi-skilled occupations and management and technical staff. These skill issues exist despite a
large array of education and training providers in the region. The region is developing a region-
wide labour market strategy to tackle these issues.
Growth in Bay of Plenty’s economy will create increased employment demand for higher skilled
jobs in key primary industries and for service workers in the region’s urban areas. There have
been reported shortages for technicians, middle management, ICT specialists, farm managers,
forestry workers and heavy vehicle drivers. The region has mixed performance on key measures
of educational attainment, with the eastern sub-region underperforming relative to the central and
western sub-regions. Ensuring that the potential of the region’s youthful population is achieved is
a key challenge and opportunity. The region has a collaborative tertiary and industry environment
which provides a solid platform for skills development, as recently seen in the development of the
Bay of Plenty Tertiary Intentions Strategy (Simmonds, Stuart, & Barns, 2014).
Across the UNI, education and employment outcomes for Māori youth are lower than for Non-
Māori and their potential is not being fully realised.
Many initiatives are being delivered within UNI regions to lift skill levels at all levels – foundation,
school, tertiary and on-the-job. However, the impact and outcomes of these initiatives is often unclear.
Identifying initiatives that work and that can be scaled up across UNI will be important to meet future
growth demands.
Within this context, UNI councils commissioned MartinJenkins and Infometrics to undertake this
project.

4
The UNI labour market
Population
Size and growth
The UNI area had an estimated resident population of 2.46 million people, 54 percent of
New Zealand’s population in 2015. Within the UNI area, Auckland had the largest share of population
at 1.57 million (64 percent), followed by Waikato (439,000, 18 percent), Bay of Plenty (287,000, 12
percent), and then Northland (168,000, 7 percent) (Figure 2).
Figure 2: UNI area population in 2015 and 10, 3 and 1-year change
Source: Infometrics regional database

5
Growing at 1.4 percent annually over the last ten years, the population in the UNI area is expanding at
twice the rate of the rest of New Zealand. Within the UNI area, growth has been fastest in Auckland
(1.5 percent per annum), followed by Waikato (1.2 percent per annum), Bay of Plenty (0.9 percent per
annum), and then Northland (1.1 percent per annum).
Age composition
Figure 3 shows that the UNI area has a slightly younger population than the rest of New Zealand. 21.2
percent of the UNI population was under the age of 15 in 2013, compared to 19.5 percent of the
population of the rest of New Zealand. Similarly, the UNI had a slightly higher proportion of people in
the 15-29 age bracket. The rest of New Zealand had a greater proportion in the 65 plus bracket.
The four UNI regions had similar proportions in the 0-14 and 30-64 age groups. Northland had the
lowest proportion in the 15-29 age group while Auckland had the highest. Northland, Bay of Plenty and
Waikato all had a larger proportion of over 65 year olds than Auckland. Northland and Bay of Plenty
have a particularly high proportion of the population aged 65 years plus.
Figure 3: UNI population age composition, 2013
Source: Census 2013, Statistics New Zealand
Ethnicity
As seen in Figure 4, the UNI area has a more diverse ethnic mix than the rest of New Zealand. In
2013, 61.6 percent of people in the UNI area identified as European, compared to 79.3 percent in the
rest of New Zealand. Māori and Pacific Island people made up 25.1 percent of the UNI population
compared to 16.6 percent of the rest of New Zealand. The proportion of people identifying as Asian in
the UNI was two and a half times larger than in the rest of New Zealand.

6
Northland has the largest proportion of Māori (29.6 percent) while Auckland has the lowest (10.1
percent). However, Auckland has by far the largest proportion of Pacific and Asian people compared
to the other regions in the UNI area.
Figure 4: UNI population ethnic mix, 2013
Source: Census 2013, Statistics New Zealand
Note: MELAA stands for Middle Eastern/Latin American/African
Migrants
The 2013 census showed that 29 percent of people in the UNI were born overseas, compared with
23.6 percent for New Zealand as a whole. International migrants to the UNI are more likely to come
from the Pacific Islands and Asia. This is largely due to the number of Pacific Island and Asian
migrants in Auckland.
At a regional level:
Northland’s migrants are largely from the United Kingdom and Ireland (44 percent), followed by
Asia, Australia and Europe (12 percent each)
As noted, Auckland’s migrants are largely from Asia (39 percent) and Pacific Islands (21 percent),
with a large proportion also from the United Kingdom and Ireland (17 percent)
Waikato’s migrants are mainly from United Kingdom and Ireland (32 percent) and Asia (25
percent) although similar proportions are from Australia, Pacific Islands, Europe, and Middle East
and Africa (9-11 percent each)
Bay of Plenty’s migrants are also mainly from United Kingdom and Ireland (40 percent) and Asia
(22 percent), with similar proportions from Australia, Europe, and Middle East and Africa (9
percent each).

7
Figure 5: UNI migrants by birthplace, 2013
Source: Census 2013, Statistics New Zealand
Recent migrants (defined as those who arrived in New Zealand in the last two years) account for 3.7
percent of the UNI’s population compared to 3 percent of New Zealand’s population.
Economy
GDP
Size and growth
Figure 6 shows UNI area GDP in 2015 and GDP growth over the last 10 years, three years, and latest
year.
UNI GDP in 2015 was $117 billion or 53 percent of national GDP ($220 billion). Within the UNI area,
Auckland contributes the largest share of GDP at $80.6 billion (69 percent of UNI GDP), followed by
Waikato ($19.5 billion, 17 percent), Bay of Plenty ($10.7 billion, 9 percent), and then Northland ($6
billion, 5 percent).
Increasing by 2.1 percent annually over the last ten years, GDP in the UNI has been growing faster
than the 1.7 percent per annum in the rest of New Zealand. Over the last five years, the UNI’s average
GDP growth rate of 3.0 percent per annum was well ahead of the rest of the country (1.9 percent per
annum). However, over the last three years, the UNI’s GDP growth of 2.8 percent per annum was
slightly slower than the 3.0 percent generated in the rest of the country. In the latest year, GDP growth
within the UNI (3.7 percent) was slightly back ahead of the rest of New Zealand, at 3.6 percent.
In 2000, the UNI contributed just under 51 percent of the country’s GDP. By 2015, this had increased
to 53.2 percent. Over the same period, Auckland’s contribution to UNI GDP increased from 67.0
percent to 69.0 percent.

8
Figure 6: UNI area GDP in 2015, and 10, 3 and 1-year change
2010$m
Source: Infometrics regional database
Within the UNI, GDP growth has been fastest in Auckland over the medium and longer term (3.3
percent per annum over five years and 2.3 percent per annum over ten years). Over the medium and
longer term, GDP growth has been slowest in Northland (1.7 percent per annum over five years and
2.1 percent per annum over ten years), lagging the rest of the country (Table 1).

9
Table 1: GDP and GDP growth by UNI region
Source: Infometrics regional database
Filled Jobs
Number and growth
There were 1.19 million filled jobs in the UNI in 2015, close to 52 percent of all filled jobs in
New Zealand. Within the UNI, most of the jobs were in Auckland (787,000, 66 percent), followed by
Waikato (198,000, 17 percent), Bay of Plenty (135,000, 11 percent), then Northland (65,900, 6
percent) (Table 2).
Table 2: UNI region, job numbers and job growth
Source: Infometrics regional database
Growing at 1.3 percent annually over the last ten years, growth in filled jobs in the UNI has been over
40 percent faster than the 0.9 percent per annum in the rest of New Zealand. Growth in jobs in the
UNI has been faster than the rest of New Zealand over the last decade, three years and latest year
(Figure 7).
Estimated GDP,
2015 ($m 2010)
Real GDP growth,
2005–2015 (CAGR)
Real GDP growth,
2010–2015 (CAGR)
Northland 5,966 1.7% 2.1%
Auckland 80,562 2.3% 3.3%
Waikato 19,507 1.8% 2.4%
Bay of Plenty 10,682 1.8% 2.4%
UNI 116,717 2.1% 3.0%
Filled jobs, 2015Job growth,
2005–2015 (CAGR)
Job growth,
2010–2015 (CAGR)
Northland 65,895 0.7% 0.5%
Auckland 786,830 1.5% 2.2%
Waikato 197,833 1.0% 1.2%
Bay of Plenty 134,907 1.0% 1.0%
UNI 1,185,465 1.3% 1.8%
10
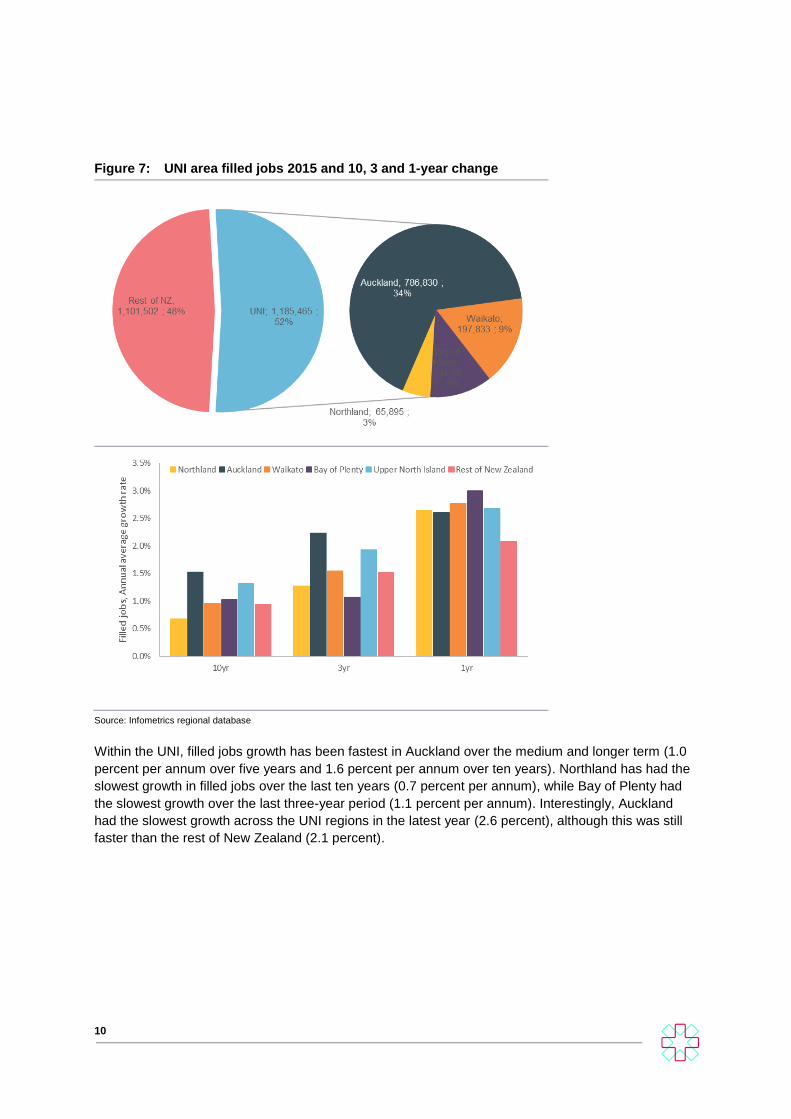
Figure 7: UNI area filled jobs 2015 and 10, 3 and 1-year change
Source: Infometrics regional database
Within the UNI, filled jobs growth has been fastest in Auckland over the medium and longer term (1.0
percent per annum over five years and 1.6 percent per annum over ten years). Northland has had the
slowest growth in filled jobs over the last ten years (0.7 percent per annum), while Bay of Plenty had
the slowest growth over the last three-year period (1.1 percent per annum). Interestingly, Auckland
had the slowest growth across the UNI regions in the latest year (2.6 percent), although this was still
faster than the rest of New Zealand (2.1 percent).

11
Labour force
Participation
Figure 8 shows that, over the last ten years, the UNI labour force participation rate has remained
relatively stable at around 67 percent, beneath the average for the rest of the country, which has been
around 69 percent. The current UNI rate is 66.9 percent, having risen from 66.5 percent in 2005 to a
maximum of 68.1 percent in 2008.
The Auckland labour force participation rate has increased by about one percentage point since 2005,
while the Waikato rate has declined slightly. The Bay of Plenty rate has shown the largest increase
from 64.6 percent in 2005 to almost 67 percent currently, due to considerable growth since 2012.
Northland has the lowest labour force participation rate in the UNI (62 percent), which has declined by
3 percent percentage points since 2005. Current rates in Auckland, Waikato and Bay of Plenty are
broadly similar. Lower labour force participation rates suggest areas where there is untapped labour
potential.
Figure 8: UNI labour force participation rates, 2005 to 2015
Source: Statistics New Zealand, Household Labour Force Survey
Notes: Participation rates are annual averages for the year ending September.
Occupations
The UNI’s key occupations mirror those for New Zealand as a whole, which reflects that it contributes
a significant proportion of the national population and workforce. The largest occupations are
specialist managers, education professionals, business and marketing professionals, and sales
assistants and sales persons, which together make up almost a quarter of all jobs.
The fastest growing occupations over 2005 to 2015 have been office managers and programme
administrators (6.7 percent per annum growth), ICT professionals (5.0 percent per annum), health and
welfare support workers (4.6 percent per annum) and health professionals (3.6 percent per annum).
These are occupations where there may be future labour market pressures.

12
Table 3: Major occupations in the UNI
Source: Infometrics regional database
Unemployment
As illustrated in Figure 9, all UNI regions show similar trends in unemployment rates. The UNI
unemployment rate has increased from around 4.0 percent prior to 2008 to 6.4 percent in 2015. Since
2008, the UNI rate has been slightly higher than that of the rest of New Zealand, though this gap has
closed recently.
Northland has consistently had the highest rate of unemployment in the UNI, currently 8.2 percent, two
percentage points above the UNI rate. Again, this suggests untapped labour potential in the region.
Although Waikato had the lowest unemployment rate in the UNI between 2008 and 2013, this has
risen since 2013 and the current rate is slightly greater than Auckland and Bay of Plenty.
Figure 9: UNI unemployment rates, 2005 to 2015
Source: Statistics New Zealand, Household Labour Force Survey
Notes: Unemployment rates are annual averages for the year ending September.
OccupationEmployment,
2015
Proportion of
all jobs
Specialist Managers 102,608 8.7%
Education Professionals 69,667 5.9%
Business, HR & Marketing Professionals 61,950 5.2%
Sales Assistants & Sales persons 60,856 5.1%
Chief Executives, General Managers, Legislators 47,018 4.0%
Health Professionals 46,532 3.9%
Hospitality, Retail and Service Managers 42,965 3.6%
Sales Representatives & Agents 39,308 3.3%
Design, Engineering, Science Professionals 37,951 3.2%
Carers & Aides 37,674 3.2%

13
Productivity
There are similar trends across UNI regions on estimated productivity levels (Figure 10).2 Estimated
productivity in the UNI has increased from around $104,700 in 2005 to $110,200 in 2015 and has
been above New Zealand’s over the period. Bay of Plenty has the lowest estimated productivity level
in the UNI, $89,000 in 2015, well below the UNI level. Auckland has the highest productivity level at
$114,400. Bay of Plenty’s low productivity is likely to be a consequence of a lack of higher value
industries such as mining, electricity, and some manufacturing subsectors combined with a high
proportion of employment in lower value industries associated with the primary sector and tourism.
Figure 10: UNI estimated productivity, 2000 to 2015
Source: Infometrics regional database
Similarly, Auckland had the highest average earnings level in 2014 ($59,180) compared to the
Waikato ($50,770), Bay of Plenty ($48,590) and Northland ($47,890).
Education and skill levels
Higher levels of qualifications are linked to improved labour force status. The UNI performs slightly
better than the rest of New Zealand on key indicators of educational attainment. In 2013, a higher
proportion of UNI residents (21 percent) had bachelor degree qualifications or higher than the rest of
New Zealand (19 percent), while a lower proportion (20 percent) had no qualifications (compared to 22
percent in the rest of New Zealand).
However, Northland, Waikato and Bay of Plenty each have a much higher proportion of residents with
no qualifications than Auckland and much smaller proportions of their resident populations with higher
level qualifications (Figure 11). This helps to explain some of the differences in participation rates and
productivity across the regions.
2 These labour productivity estimates are derived from estimates of GDP and employment.

14
Figure 11: Proportion of the resident population (aged 15 years or over) with qualifications,
2013
Source: Census, Statistics New Zealand
The Government has a target that 85 percent of 18 year olds will hold a National Certificate of
Educational Achievement (NCEA) level 2 qualification or equivalent by 2017. The proportion of 18
year olds in the UNI with NCEA level 2 in 2014 was 83 percent, around the same as the rest of
New Zealand (82.6 percent). Northland and the Waikato have the lowest proportion of 18 year-olds
without at least NCEA level, at around 80 percent each. This is shown in Figure 12.
Figure 12: Percentage of 18-year-olds with a minimum of NCEA level 2 or equivalent, 2014
Source: Education Counts
A similar proportion of UNI school leavers have at least an NCEA level 2 or equivalent qualification as
school leavers nationally. Northland and Waikato have higher proportions of school leavers with
qualifications below NCEA level 2 (30 percent and 26 percent respectively). A larger proportion of
Auckland school leavers have NCEA level 3 or university entrance (UE) (58 percent compared to 47
percent in Bay of Plenty, 43 percent in the Waikato and 38 percent in Northland). This is shown in
Figure 13.

15
Figure 13: Achievement levels among all school leavers, 2014
Source: Education Counts
Some of the differences across regions will be due to the higher proportion of Māori in Northland,
Waikato and Bay of Plenty. A higher proportion of Māori nationally have no qualifications than non-
Māori (33 percent compared to 21 percent) and a higher proportion of Māori 18 year olds do not have
NCEA level 2 or higher (33 percent compared to 14 percent). However, Bay of Plenty has a relatively
high proportion of Māori (28 percent) and its NCEA level 2 achievement rate is higher than the
Waikato, which has a lower proportion of Māori (22 percent).
Youth not in employment, education or training (NEET) represent untapped labour potential. Youth
rates in the UNI and New Zealand from 2009 to 2015 is presented in Figure 14.
Figure 14: Youth NEET rates in the UNI and New Zealand, 2009 to 2015
Source: Statistics New Zealand
In 2015, the UNI’s NEET rate of 11.5 percent was similar to the national rate. The UNI’s NEET rate
has declined over 2009 to 2015, from 15 percent in 2009. The NEET rate in Northland and Bay of
Plenty remains high. While they have been improving and fell significantly in 2014, they increased
again in 2015.

16
Inter-regional movement of people
Commuting
Commuting patterns across regions provide an indication of whether labour demands in a region can
be met by labour resident in another region in the short-term. In general people in the UNI tend to
reside in the area where they work and there is little inter-regional movement of people for work. The
commuting patterns of residents in the UNI is shown in Table 4.
Table 4: Commuting patterns in the UNI, 2013
Source: Census 2013
Most people who reside in Auckland (97.8 percent) work in Auckland. A further 1.1 percent commute
to other regions in the UNI, namely Waikato (0.5 percent), Northland (0.4 percent) and Bay of Plenty
(0.2 percent).
Waikato has the highest level of out-of-region commuting, with 4.9 percent of people commuting to
Auckland for work, and a further 1.1 percent commuting to Bay of Plenty.
Bay of Plenty is generally the residence for people who work there, although 2.3 percent of Bay of
Plenty residents commute to the Waikato and a further 1.0 percent work in Auckland.
About 2.5 percent of the people who reside in Northland commute to Auckland for work. Not
surprisingly, given the distances involved, there is little commuting between Northland and
Waikato/Bay of Plenty.
Inter-regional migration
Figure 15 shows the usual residence of the region’s population five years earlier, which provides an
indication of inter-regional migration and the ability of regions to meet labour demands from sourcing
labour from other regions in the medium to long-term.
Northland Auckland Waikato Bay of Plenty Rest of NI Rest of NZ Not fixed
Northland 96.0% 2.5% 0.2% 0.2% 0.5% 0.2% 0.5%
Auckland 0.4% 97.8% 0.5% 0.2% 0.6% 0.2% 0.4%
Waikato 0.5% 4.9% 91.5% 1.1% 0.6% 0.9% 0.5%
BOP 0.2% 1.0% 2.3% 96.0% 0.0% 0.0% 0.5%
Commuting
Patterns
Workplace Address
Usual r
esid
ence

17
Figure 15: Region of usual residence 5 years ago, total population, 2013
Source: Census 2013. Note that the proportions do not add up to 100 percent due to some residents not having been born five years earlier or
respondents not defining their place of earlier residence.
75 percent of people who indicated they lived in the UNI in 2013 lived there five years earlier, while 8
percent of residents lived overseas five years earlier. Auckland has demonstrated the lowest level of
inter-regional migration of the UNI regions, with close to 73 percent of residents having lived in
Auckland five years earlier. Auckland also has the highest proportion of residents who were living
overseas five years earlier (close to 10 percent). Waikato and Bay of Plenty had the highest proportion
of people that lived elsewhere in New Zealand five years ago (close to 11 percent each).
Of Northland’s population in 2013, 6 percent or over 8,700 lived in Auckland five years previously,
while 1.2 percent lived in the Waikato and only 0.6 percent were from Bay of Plenty (Figure 16).
Overseas migrants represented a larger proportion of Northland’s population in 2013 than those from
the rest of New Zealand.
Figure 16: Source of inward-migration, Northland, 2013
Northland
70%
Auckland
Bay of Plenty
Waikato
Rest of North
Island
South Island
Overseas
0.6%, 8616.0%, 8736
1.2%,
1710
1.4%,
1992
1.1%, 1539
4.1%, 5904
Source: MartinJenkins, based on Census 2013. Note that the proportions do not add up to 100 percent due to some residents not having been
born five years earlier or respondents not defining their place of earlier residence.

18
A relatively small proportion of Auckland’s population in 2013 came from other UNI regions (1.8
percent), although over 11,000 were from the Waikato (Figure 17). A higher proportion came from the
rest of New Zealand (2.4 percent). Significant numbers, close to 132,000 (or 9.6 percent), lived
overseas five years earlier.
Figure 17: Source of inward-migration, Auckland, 2013
Northland
Auckland
73%Bay of Plenty
Waikato
Rest of North
Island
South Island
Overseas0.5%,
6411
0.8%, 11301
1.3%, 17445
0.5%, 6897
1.1%, 14844
9.6%,
131796
Source: MartinJenkins, based on Census 2013. Note that the proportions do not add up to 100 percent due to some residents not having been
born five years earlier or respondents not defining their place of earlier residence.
Relatively high proportions of Waikato’s population in 2013 came from Auckland (4 percent or around
15,680) and Bay of Plenty (2.1 percent, 8175), with 5 percent living overseas five years earlier (more
than 20,400). Northland was a not a major contributor to Waikato’s population (Figure 18).
Figure 18: Source of inward-migration, Waikato, 2013
Northland
Auckland
Bay of Plenty
Waikato
71%
Rest of North
IslandSouth Island
Overseas
2.1%,
8175
2.5%, 96121.2%, 4821
0.6%, 2274
5.3%, 20418
4%, 15678
Source: MartinJenkins, based on Census 2013. Note that the proportions do not add up to 100 percent due to some residents not having been
born five years earlier or respondents not defining their place of earlier residence.

19
Similarly, Waikato and Auckland were the source of a relatively high proportion of Bay of Plenty’s
population (3 percent or around 7,800 people from each region). Again, a larger source of the region’s
population five years earlier was from overseas (5.4 percent or 13,900), with relatively few from
Northland (Figure 19).
Figure 19: Source of inward-migration, Bay of Plenty, 2013
Northland
Auckland
Bay of Plenty
70%
Waikato
Rest of North
Island
South IslandOverseas
5.4%,
13920
2.6%, 6615
1.5%, 3738
0.4%, 1041
3%,
7821
3%,
7770
Source: MartinJenkins, based on Census 2013. Note that the proportions do not add up to 100 percent due to some residents not having been
born five years earlier or respondents not defining their place of earlier residence.
In sum, although the numbers are relatively small, the largest volume of flows of people between UNI
regions has been from the larger urban regions to their neighbouring regions, i.e., Auckland to
Northland, between Auckland and Waikato, and from Waikato and Auckland to Bay of Plenty. A
relatively large source of migrants is from overseas. Assuming these flows continue, they suggest
where UNI regions are more likely to source labour over the medium- to long-term.
Summary of the UNI labour market
The picture that emerges is a large, growing and somewhat youthful labour market, with a larger
proportion of migrants than the rest of New Zealand (although this is due largely to Auckland’s
population and migrant base). The UNI economy is also growing relatively strongly and this is
reflected in stronger than average employment growth. However, there are variations across the UNI,
with slower economic and job growth in Northland than the other regions. The UNI has slightly better
educational attainment levels than the rest of New Zealand and a declining youth NEET rate in line
with national trends, which will support an improved future labour force. There is very limited inter-
regional commuting of people for work between UNI regions, which suggests that regional labour
markets are generally self-sufficient in the short-term, although there is some inter-regional movement
of people over the medium-term from larger regions to smaller adjacent regions.

20
Overall, the evidence suggests there is likely to continue to be growing demand for labour and skills to
meet employment growth in UNI, at rates above the national average. Although there are positive
signs about the quality of the labour pool that will be available in the UNI region, this labour pool does
not appear to be particularly mobile across regional boundaries in the short-term, although there is
greater mobility over the medium to long-term. This suggests that labour and skill demands facing
each UNI region will need to be largely dealt with at a regional level in the short-term.

21
IDENTIFYING KEY SECTORS
A key part of the project was to define and identify sectors that have the greatest potential for growth
in the UNI, as these will be the sectors driving labour and skill demands. In the discussion that follows
we use the term sector to refer to large groupings of common production activities, and industries to
refer to specific segments of activity within sectors.
Defining sectors
The Australia New Zealand Standard Industrial Classification has 504 separate industries at their most
disaggregated level (ANZSIC06 Level 4). At the most aggregated level there are 19 sectors. However,
in several cases, these 19 sectors are not consistent with value chains, especially in agriculture and
manufacturing.
Individual regions have defined their own sectors in earlier work (e.g., regional strategies, regional
growth studies). As shown in Appendix 1, which compares sector definitions across regional work, the
industry composition of sectors is sometimes defined quite differently across regions and some
industries can contribute to more than one sector (such as services to agriculture).
Our first step in defining sectors at the UNI level was to review the definitions used in earlier research
in the UNI region as well as national studies on sectors. We considered the following previous work:
the Tai Tokerau Northland Regional Growth Study; the Auckland Economic Development Strategy;
ATEED Sector Engagement Framework and subsequent Auckland Council sector profiles; the Toi
Moana Bay of Plenty Regional Growth Study; the Waikato Sector Specific Issues and Opportunities
report for the Waikato Economic Development Strategy; MBIE’s sector reports (which sometimes
include value chain maps); and government sector surveys.
In some cases, there were clear commonalities and definitions were relatively straightforward. For
example, the dairy & related processing sector is typically a combination of dairy farming and dairy
processing industries. In others, regions or studies had different combinations of industries
representing the same sector. In addition, some regions defined sectors very broadly with a number of
loosely related industries, while others included very tight definitions with only clearly related
industries.
Where the sector definitions across regions were reasonably consistent, such as dairy & related
processing, we initially accepted those as given. In other areas sectors were split, aggregated or
reworked based on balancing how they had been defined previously, national definitions, and our own
previous research on sector value chains. Major considerations were:
whether industries operate in similar value chains and deliver a similar set of products
whether the industries included in a sector are likely to have common labour requirements, given
the focus of the study.
The 504 ANZSIC level 4 classifications were grouped into 33 sectors. Sectors were defined by the
core production activity and immediate downstream processing or service activities. So, for example,
dairy & related processing includes dairy farming, dairy product processing industries and dairy
support services.

22
Upstream inputs and more distant downstream services were not included in the definitions of value
chains as an endless number of industries could contribute inputs and services to each sector value
chain (e.g., for the dairy & related processing value chain, we could have included industries within
minerals (e.g., fertiliser), machinery and equipment, materials, transport equipment, ICT, business &
professional services (e.g. farm consulting), freight & logistics, energy, water and waste etc.).
A summary of the sector definitions we arrived at is presented in Table 5, and details of the industries
that make up the sectors and a table with a full comparison of sector value chain definitions from each
region in the UNI area is included in the appendices.
Table 5: Summary of sector definitions
Sectors Definition
Dairy & related
processing
Dairy cattle farming; milk and cream, ice cream, cheese manufacturing; part of agriculture
support services.
Livestock farming &
related processing
Sheep and beef farming, grain, poultry, deer and pig farming; meat processing; part of
agriculture support services.
Food and beverage
cultivation & processing
Fruit and vegetable growing; eggs; beekeeping; fruit and vegetable processing; oil,
preservative, cereal, pasta, bread, biscuit, sugar, confectionery, chips, soft drink, beer,
wine, spirit manufacturing.
Forestry & wood
processing
Forestry, logging, sawmilling, wood chipping, wood product manufacturing, pulp and paper
manufacturing.
Aquaculture, fishing &
related processing
Aquaculture, line fishing, trawling, seafood processing.
Other agriculture
production & services
Nurseries, turf, floriculture, hunting and trapping, shearing, bloodstock leasing.
Chemical and
pharmaceutical manufacturing
Chemical manufacturing, pharmaceutical and medicine manufacturing, cosmetic and toiletry
manufacturing.
Machinery & electrical
equipment
manufacturing and repair
Photographic, medical and surgical, whiteware appliance, heating, cooling and ventilation,
agriculture machinery, mining and construction machinery, machine tools and parts, lifting and handling equipment manufacturing, repair and maintenance.
Metals & materials
manufacturing
Plastic, rubber, packaging, paints and coatings, iron, steel, aluminium, other metals, tank
and container, spring and wire, nut, bolt and screw, metal product manufacturing
Transport equipment
manufacturing & repair
Tyre, motor vehicle, vehicle parts, aircraft, rail, interior manufacturing, repair and
maintenance.
Marine manufacturing
& repair
Shipbuilding, boatbuilding and repair services.
Other manufacturing Tobacco, fibre, floor, clothing, footwear, furniture, mattress, toy and recreation product
manufacturing.
Minerals & related
processing
Coal, iron ore, copper, gold ore, mineral sand, silver, other metal mining; quarrying, fertilizer
manufacturing, glass, ceramic, brick, cement, concrete manufacturing.
Petroleum & related
processing
Oil and gas exploration, refining and manufacturing.
Construction & related
services
House building, road, bridge, civil engineering construction; land development, bricklaying,
plumbing, roofing, installation services, plastering, carpentry, tiling, carpeting, landscaping, hiring of construction machinery, architecture, surveying, engineering design services.

23
Sectors Definition
Health services Hospitals, general practice services, specialist services, dental services, optometry
services, physiotherapy services, chiropractic services, ambulance services, aged care residential services.
Creative services Publishing, recording, motion picture production, post production services, broadcasting,
photographic services, museum operation, performing arts.
Business &
professional services
Printing, research services, testing and analysis services, legal services, accounting
services, advertising services, management advisory services, recruitment services, call centre operation, building cleaning services.
ICT Electronic and communications equipment manufacturing, software, telecommunications, internet services, data processing, computer system design services.
Financial services Banks, credit unions, life insurance, health insurance, superannuation, financial and investment services.
Property services Property operators and real estate services.
International education Parts of primary, secondary, technical, vocational, sports and recreational, adult and
community education.
Freight & logistics Road and rail freight, air freight, water transport, postal services, customs services, freight
forwarding, warehousing and wholesaling services.
Passenger transport Inter-urban and rural bus transport, taxis, rail and water passenger transport.
Personal services Other rental and hiring services, education services, funeral services, laundry services,
child care services.
Retail Vehicle, furniture, floor, houseware, manchester, computer, electrical goods, hardware,
fuel, supermarket, liquor, food, sport, toy, clothing, book, jewellery, cosmetic, stationery, flower, antique and other good retailing.
Hospitality Accommodation, cafes and restaurants, takeaway foods, pubs, bars and clubs.
Recreational & cultural
services
Libraries, museums, gardens, reserves, parks, performing arts, sport clubs and facilities,
racing, amusement parks, gambling.
Government Central and local government administration, defence, police, fire, correction and other
public services.
Tourism Proportions of accommodation, food services, passenger transport, scenic and sightseeing
transport, travel agency services, vehicle rental, museum operation, gardens, parks and reserves, sport venues and facilities, amusement parks, casinos, retailing, education.
Energy Electricity generation and distribution, gas supply.
Water and waste Water supply, sewerage, waste collection, waste treatment and disposal.
Note that:
one industry, ‘other agriculture and fishing support services’ was split across the six primary
production sectors in each region on the basis of each sector’s contribution to employment
tourism spans a large range of hospitality, recreational and cultural, retail, transport, personal
services and educational industries. However, tourism values (GDP, employment, exports etc.)
were calculated using a methodology developed by Infometrics which uses Statistics
New Zealand’s Tourism Satellite Account (TSA), adjusted using regional data on guest nights and
visitor expenditure data from MBIE to account for tourism intensity in different regions. The
adjustment also takes into consideration each region’s relative exposure to tourism-related
industries and activities, including guest night shares.

24
Identifying key sectors
Having defined the 33 sectors in the UNI area, the next step was to identify the key sectors for further
analysis.
For the purpose of this study, key sectors are defined as those that offer the greatest potential for
output and employment growth within the UNI regions. Consistent with the regional growth studies,
growth potential was determined through three criteria:
1. Competitive strengths – the current or potential strength of the sector in the UNI region. This
was assessed by considering employment and value added scale and growth, estimated
productivity and growth, and the concentration of the sector (based on location quotients).
2. Market opportunities – the strength of demand for a sector’s products or services and hence
potential for investment, talent and business development. This was assessed by considering:
national growth (i.e., GDP and employment trends and forecasts of GDP and employment
nationally) – this is particularly relevant for service based industries that are predominantly
selling domestically (and hence growth suggests growing national demand)
Export demand potential based on trends in regional export estimates and trends in the value
of New Zealand’s exports worldwide and into key markets offshore. We also considered
growth in world input demand for the outputs of sectors.
3. Broader impacts on the economy – the extent to which the sector impacts on other industries
and incomes. Broader economic impacts were assessed by considering:
industry multipliers to determine the intermediate production that occurs within the UNISA
regions
industry earnings
whether the sector has been identified as an important driver for the region or sub-regions in
previous research.
Sector analysis by region
The Tables in Appendix 3 show the sector analysis for each of the four regions in the UNI area.3 The
tables provide an assessment of each sector in each region against the range of competitive strength,
market potential, and broader economic impact measures.
3 It was too complex (and didn’t add value to this project) to separate out the proportions of each contributing sector that are ‘non-tourism’
related (noting that all industries contribute to tourism to a degree). Although our tourism estimates incorporate the relevant proportions of each contributing sector (e.g., from hospitality, retail, cultural and recreational services, passenger transport etc.), the values provided separately for each contributing sector represent their total contribution. For example, the GDP and employment totals provided for passenger transport are the sector’s total contribution to the economy – not their non-tourism contribution. This means that tourism cannot simply be added to the other sectors in calculating total employment, GDP or exports for each region or for the UNI.

25
Note that the large Auckland economy skewed the analysis when comparing sectors at a UNI area
level. For example, agriculture sectors rank relatively low within the UNI area, while services sectors
rank relatively high. Therefore, we assessed the performance of the sectors in each of the four UNI
regions. If the sector ranked highly for most of the sub-regions, we considered it should be identified
as a key sector for the UNI as a whole (rather than a sector that only performs well because of
Auckland’s dominance).
Based on the selection criteria, sectors were categorised into three groups:
Key sector – these are sectors that ranked highly on several of the criteria, i.e., they are of
significant scale, are concentrated in the UNI area, have demonstrated growth in employment,
have large flow-on impacts to other sectors, and have further potential for growth based on what is
known about resource availability, national and/or offshore market demand.
Possible key sector - these are sectors that meet some of the criteria, e.g., they may be currently
small scale but concentrated in the region, or moderate scale and somewhat concentrated in the
region, they may have exhibited limited trend growth but are expected to grow more significantly in
future.
Unlikely to be a key sector or should not be considered further - these sectors meet only a
few of the criteria, e.g., they are likely to have experienced limited or negative growth, are not
concentrated in the region, have limited market potential, and more limited economic impacts.
Seven industries were identified as key sectors based on the selection criteria, while a further three
could possibly be considered. A summary of the analysis was prepared and presented to a Technical
Working Group (TWG)4 for their consideration (Table 6).
Feedback from the TWG suggested that one of the ‘possibles’ – food and beverage cultivation and
processing – should be included for labour demand and supply analysis, given it has been highlighted
as important in each region’s economic development strategy. Another ‘possible’ – aged care – was
incorporated into health services.
Based on the analysis and feedback from the TWG, the final selection of key sectors for labour
demand and supply analysis were:
• Forestry & wood processing
• Dairy & related processing
• Construction & construction-related services
• Business & professional services
• Food & beverage cultivation & processing
• Health services & residential care
• Freight & logistics
• Tourism.
4 The TWG provided peer review and advice at different stages of the project and comprised representatives from UNI councils, selected
EDAs and NZTA.

26
Table 6: Overall rankings of sectors by region in the UNI area (whether the sector ranks in
the top 12 in each region across the criteria)
Sector Northland Auckland WaikatoBay of
PlentySuggested Key Sector
Agriculture - other No No No No No
Aquaculture, f ishing & related processing Yes No No No No
Business & professional services No Yes Yes Yes Yes
Chemical & pharmaceutical manufacturing No Yes No No No
Construction & related services Yes Yes Yes Yes Yes
Creative No Yes No No No
Dairy & related processing Yes No Yes Yes Yes
Energy No No Yes Yes Possible
Financial services No Yes No Yes No
Food & beverage cultivation & processing Yes No Yes No Possible
Forestry & wood processing Yes No Yes Yes Yes
Freight & Logistics Yes Yes Yes Yes Yes
Health Services Yes Yes No Yes Yes
Hospitality No Yes No YesYes (incorporated in
tourism)
ICT No Yes No No No
International Education No No No No No
Other education No No No No No
Livestock farming & meat processing No No Yes No No
Machinery & electrical equipment
manufacturing & repairNo No Yes No No
Manufacturing - other No No No No No
Marine No No No No No
Metals & materials manufacturing No No No No No
Minerals & related processing Yes No Yes No No
Personal services No No Yes No No
Petroleum & related processing Yes No No No No
Property services No No No No No
Passenger transport Yes Yes No YesYes (incorporated in
tourism)
Recreational & cultural services No No No No No
Residential care Yes No No YesPossible (as a subset of
health services)
Retail No Yes No NoYes (incorporated in
tourism)
Transport equipment manufacturing & repair No No No No No
Tourism Yes Yes Yes Yes Yes
Water & w aste No No No No No

27
SKILL SHORTAGES This section provides an outline of the steps taken to arrive at our estimates of labour demand and
supply.
Labour market framework
The Infometrics labour market framework (Figure 20) used in this report estimates the future demand
for and supply of skills and identifies which skills are likely to be in shortage in the future.
Figure 20: Flow chart of Supply and Demand matching methodology
Supply side
On the supply side of the labour market we considered the flows of individuals into and out of the UNI
labour market. We estimated:
The number of young people leaving secondary school and who will be available for work. We
draw on Ministry of Education school roll projections, recent NCEA achievement rates of school
leavers and school leaver transition data.
Future Demand for Skills Future Supply of Skills
NZ Economy
UNI Economy
Sector/Industry Growth
Employment by Sector/Industry
Employment by Occupation
Demand for Qualifications
Net Replacement
Net Migration
Supply of
Qualifications
Matching in the Labour Market
Occupations in shortage / surplus
School Leavers
Tertiary Education
Providers
ITOs

28
The number of graduates from tertiary education organisations (universities, wānanga, institutes
of technology and polytechnics, private training establishments and industry training
organisations) by drawing on current and historic enrolment data by qualification and field of
study and high level enrolment forecasts and graduate outcomes data from the Ministry of
Education.
Net additions to the labour supply through international and inter-regional migration (from other
locations in New Zealand) using Infometrics national net migration forecasts, arrival and
departure card information, and regional information from the 2013 Census. We estimate this by
occupation and translate it to qualification by level and field of study.
By adding the above components, we estimated the net addition to the labour market by qualification
level and field of study over the forecast period.
Demand side
On the demand side we estimated the future demand for occupations and qualifications (qualification
level and broad field of study). First we translated our view of the macro-economic outlook for the
New Zealand and the global economy into an outlook for individual industries. This provides us with a
forecast of employment by sector.
We then translated our forecasts of employment by industry into employment by occupation using our
understanding of the occupational composition of employment in industries and how this has changed
over time. Most of this information is derived from successive population censuses. From the
employment forecasts we derive the number of new job openings over the forecast period. We also
estimate the number of job openings arising from replacement demand. These openings arise due to
people leaving positions for a variety of reasons, including retirement, migration, or leaving the
workforce. By summing new and replacement job openings we estimated total job openings by
occupation.
Job openings by occupation are translated into forecasts of job openings by grouped qualification level
(levels 1-3, 4, 5-6, 7+) based on the New Zealand Qualifications Framework (NZQF) and 11 fields of
study from the New Zealand Standard Classification of Education (NZSCED). For the translation we
use the link between occupation and qualification described in the Australian and New Zealand
Standard Classification of Occupations 2006 (ANZSCO06).
Labour market matching
We contrasted the number of job openings and net additions to the labour market by qualification level
and field of study over the forecast period. From this we were able to identify which qualifications are
likely to be oversupplied and undersupplied. Using the link between occupation and highest
qualification we could then identify which occupations are associated with each qualification and
hence identify occupations which are likely to be over or under supplied.
Labour supply
This section estimates the long term supply of labour in the UNI, before focusing on the medium-term
supply of labour and the supply of qualifications in the UNI over the five years to 2020.

29
Long term supply of labour
We initially prepared a baseline projection of growth in the labour force in the UNI out to 2033 based
on Statistics New Zealand’s medium population projections. The medium population projections are
based on assumptions related to fertility, life expectancy and annual net migration.
Baseline projection of labour supply
The labour force participation rate (LFPR) rates by sex and age measured in 2013 are applied to the
projected population to arrive at a baseline projection of labour force growth. The growth in the labour
force over this period is compared to historical growth in the UNI to give a broad indication of the likely
balance between labour supply and labour demand. A key assumption of this baseline scenario is that
LFPRs do not change over the forecast horizon. Figure 21 shows the baseline scenario of projected
labour force out to 2033. Note that this incorporates assumptions related to population aging.
Figure 21: Projected labour force in the UNI to 2033, baseline scenario
Source: Infometrics and Statistics New Zealand
The baseline projection suggests that the UNI labour force will grow from 1.24 million in 2013 to 1.53
million in 2033. This expected growth rate of 1.1 percent per annum is considerably lower than the
employment growth of 1.9 percent per annum experienced since 2000. This suggests that labour
supply could impose a constraint on growth in the future.
We considered how changes in productivity and demographic changes could influence future labour
supply in the UNI as shown in Appendix 3: Labour Force Scenarios.
Medium term supply of qualifications
Over the next five years, the supply of additional skilled labour under the baseline projection of labour
supply is likely to come from three areas:
1 School leavers: young people who leave school and make themselves available for work.
2 Tertiary education: people who graduate from tertiary education and make themselves available
for work.

30
3 Net migration: the net inflow/outflow of people as a consequence of international and inter-
regional migration to the UNI.
We estimated the supply of qualifications from these three sources over the period 2016 to 2020 by
qualification level and detailed field of study.
School leavers
Young people who leave school can go on to do further study, make themselves available for work or
pursue other options, such as going overseas.
Nationally, and in the UNI, the overall number of young people leaving our schools is not expected to
grow over the coming five years, with the overall number of school leavers in the UNI projected to
decline 1.7 percent (500 people) over the next five years. This is largely the result of a smaller cohort
of young people currently entering and transitioning through the secondary school system.
Drawing on Ministry of Education school roll projections, recent NCEA achievement rates of school
leavers and school leaver transition data, we estimated the number of young people leaving
secondary school between 2016 and 2020 who will be available for work. Figure 22 shows the number
of school leavers in the UNI who are likely to make themselves available for work in the year following
leaving school.
Figure 22: School leavers in the UNI likely to make themselves available for work, 2010 to 2020
Source: Infometrics
Despite the projected small decline in the number of young people leaving school over the 2016 to
2020 period, the number of school leavers with a NCEA level 3 qualification likely to make themselves
available for work is projected to increase while the reverse is the case for school leavers with NCEA
level 1. This trend is not specific to the UNI and reflects the increased focus by the Government over
recent years for school leavers to gain NCEA level 2 or above.

31
Tertiary education
People who graduate from a tertiary education organisation have very similar options to school leavers
in that they can: a) do further study, b) make themselves available for work or c) pursue other avenues
(e.g., migrate overseas, have children and not enter the workforce).
Drawing on current and historic enrolment and completion data at a regional level, high level
enrolment forecasts and graduate outcomes data from the Ministry of Education, we are able to
estimate the number of graduates from tertiary education organisations in the UNI that will be
available for work over the 2016 to 2020 period.
Table 7 shows the estimated numbers graduates from tertiary education in the UNI who will make
themselves available for work broken down by field and level of study between 2016 and 2020.
Table 7: Graduates from tertiary education in the UNI who are likely to make themselves
available for work, 2016 to 2020
Source: Infometrics
We estimate that, over the 5-year period, 228,000 graduates from tertiary education in the UNI will
make themselves available for work in the year after graduation. Just under half (49 percent) of these
graduates will have a level 1-3 qualification, while 27 percent will have a Bachelor Degree or higher.
Further investigation shows that majority of the graduates with a level 1-3 qualification who are
available for work are likely to have a level 2 or 3 qualification.
Net migration
The UNI will also gain workers through international migration and through regional migration (from
other locations in New Zealand).
As noted, we used national net migration forecasts, arrival and departure card information, and
regional information from the 2013 Census to estimate the net impact of international migration on the
UNI.
In the case of regional migration, other than from the Census, little information is known about inter-
regional migration flows in New Zealand at a detailed level. We thus considered the net flows of
people to the UNI (where people were residing at the Census and where they were five years ago) by
Levels 1-3 Level 4 Levels 5-6Bachelor degree
or higherTotal
Natural & Physical Sciences 115 6 260 4,132 4,512
Information Technology 1,532 792 690 1,384 4,398
Engineering & Related Technologies 24,009 9,447 1,942 2,193 37,590
Architecture & Building 2,640 5,935 620 1,292 10,486
Agriculture, Environ. & Related Studies 13,605 3,740 280 212 17,837
Health 6,935 834 1,347 4,346 13,462
Education 622 526 1,591 16,035 18,774
Management & Commerce 23,678 11,236 5,021 19,163 59,099
Society & Culture 23,657 2,593 1,492 9,220 36,962
Creative Arts 1,395 604 516 2,798 5,313
Food, Hospitality & Personal Services 13,544 3,743 1,765 391 19,443
Total 111,731 39,456 15,524 61,166 227,876
Field of study
Tertiary graduates available for work

32
occupation grouping. As the share of net migration by occupation grouping does not vary much over
time, we drew on flows from the 2013 Census to estimate the net impact of inter-regional migration on
the UNI between 2016 and 2020 (Table 8).
Table 8: Forecast net migration (international and regional) of labour to the UNI by
qualification level, 2016 to 2020
Source: Infometrics
Using the above, we estimated that a net additional 134,000 working age people could migrate to the
UNI between 2016 and 2020. Close to three quarters of these ‘migrants’ (73 percent) are likely to
come from overseas. Using the linkages between occupations and highest field of study from the
Census, we estimated that the majority of these ‘migrants’ (55,400 people or 57 percent) are likely to
have a Bachelor Degree or higher.
Overall supply
Drawing on the relationship between the people employed by occupation and their highest field of
study from the Census, we can translate the overall forecast of supply from the three sections above
into estimates of the supply of ‘qualifications’ between 2016 and 2020.
Table 9 shows that, over the 2016 to 2020 period, there will be an estimated additional 395,000
people in the UNI available for work. Of this additional pool of labour, 45 percent (176,800 people) will
have a level 1-3 qualification as their highest qualification and 33 percent (131,300 people) will have a
Bachelor Degree or Higher.
International Regional Total
Levels 1-3 19,847 12,081 31,928
Level 4 14,134 5,274 19,408
Levels 5-6 8,556 4,078 12,634
Bachelor degree or higher 55,379 14,722 70,102
Total 97,917 36,156 134,072
Ideal qualification levelNet migration to UNI

33
Table 9: Forecast additional supply of labour in the UNI by field of study and qualification
level, 2016 to 2020
Source: Infometrics
People who make themselves available for work who have a level 1-3 qualification are most likely to
have a qualification in the Management & Commerce, Society and Culture, and Engineering & Related
Technologies fields of studies. The estimated additional labour pool with a Bachelor Degree or higher
are most likely to have a qualification in the Management & Commerce, Education, and Society &
Culture fields of study.
Figure 23 breaks down the overall expected 395,000 people with qualifications available for work in
2016 to 2020 by individual year.
Figure 23: Forecast additional supply of labour in the UNI by qualification level by individual
year, 2016 to 2020
Source: Infometrics
Levels 1-3 Level 4 Levels 5-6
Bachelor
degree or
higher
Total
Natural & Physical Sciences 3,027 455 916 8,984 13,383
Information Technology 3,849 1,001 1,145 4,896 10,891
Engineering & Related Technologies 32,859 14,276 4,906 12,562 64,602
Architecture & Building 5,747 9,180 1,172 3,988 20,088
Agriculture, Environ. & Related Studies 16,815 5,071 519 1,365 23,770
Health 11,904 1,867 3,138 15,046 31,955
Education 4,507 976 2,175 24,481 32,139
Management & Commerce 39,749 13,530 7,317 31,073 91,669
Society & Culture 32,998 4,015 3,504 19,974 60,490
Creative Arts 6,115 1,500 1,083 7,880 16,577
Food, Hospitality & Personal Services 19,196 6,994 2,282 1,018 29,491
Total 176,765 58,864 28,158 131,267 395,054
Qualification level
Field of study

34
It is estimated that there will be 89,500 people with qualifications available for work in the 2015/16
period, declining to 70,500 in the 2019/20 period. The decline in people leaving tertiary education is
consistent with two broad observable trends:
a declining number of people entering tertiary education due to a demographic drop in people of
school leaver age, and
a tighter focus by the government on tertiary education outcomes rather than tertiary education
participation.
Labour demand
The first step for estimating the demand for labour in the UNI is to have a view of economic growth
over the forecast period.
New Zealand economy forecast to 2020
The baseline forecasts use Infometrics growth forecasts to 2020. The key growth measures for this
forecast are presented in Table 10.
Table 10: New Zealand economy, 2015 to 2020 forecast
Source: Infometrics
This baseline forecast is established on the view that the economy is going through a transition period.
Weaker global demand, combined with a sharp depreciation in the New Zealand dollar, is changing
the incentives faced by households and businesses. When these factors are combined with a drought
during 2015/16, they will drive down growth in consumer spending, non-building investment, and
imports. However, further strong net migration inflows and a lift in building activity will help maintain
economic activity. Economic growth will pick up even as population growth slows, with the faster
growth largely due to rising exports and improving domestic demand.
Against this backdrop, our forecasts estimate GDP growth averaging 2.6 percent per annum over the
five years to 2020, compared with 2.3 percent per annum over the five years to March 2015.
Employment is forecast to grow at 1.5 percent annually over five years to March 2020, easing slightly
from the 1.6 percent annual growth seen over the five years to March 2015. The Reserve Bank is
anticipated to raise interest rates again slightly later in 2016 as it works to keep inflation anchored at
its 2 percent per annum medium-term target.
From this, Infometrics developed a ‘business as usual’ (BAU) employment forecast for the UNI (Figure
24). This forecast estimates new jobs (net) that are likely to be required between 2016 and 2020.
GDP growth 2.3% 2.6%
Employment growth 1.6% 1.5%
Inflation 1.7% 2.0%
Interest rate (90-day bank bill) 3.0% 3.7%
Indicator5 years to March 2015
%pa
5 years to March 2020
%pa

35
The BAU model estimates that an additional 115,400 new jobs will be required by employers between
2016 and 2020. This equates to a growth rate of 1.9 percent per annum over the period, which is
faster than the forecast of 1.5 percent per annum for national employment growth.
Figure 24: Historic and forecast new job (net) growth in the UNI and New Zealand, 2001 to
2020, BAU scenario
Source: Infometrics
Moderation of forecasts
Forecast growth was broken down by region and by sector. These regional and sectoral employment
growth rates were tested against industry research and tested with a number of businesses and
industry organisations in the UNI. A list of the companies and organisations consulted and an example
questionnaire is attached in Appendix 5: Industry Consultation.
As a result of the more detailed research and feedback, employment forecasts were revised for some
sectors and regions (details are provided in the Sector Report). The moderated regional forecasts by
region and key sector for 2016 to 2020 are shown in Table 11.
-4%
-3%
-2%
-1%
0%
1%
2%
3%
4%
5%
2001
2002
2003
2004
2005
2006
2007
2008
2009
2010
2011
2012
2013
2014
2015
2016
2017
2018
2019
2020
fille
d jo
bs, a
nn
ua
l p
erc
en
t ch
an
ge
Year
UNI New Zealand

36
Table 11: Moderated employment forecasts by region and key sector, 2016 to 2020
Source: Infometrics
Note: annual average change
Auckland is the only region forecast to grow at a faster rate than nationally at 2.2 percent per annum
while Bay of Plenty (1.5 percent per annum) is forecast to grow at the same rate as nationally. The
weakest employment growth is forecast to be in Northland (0.9 percent per annum) then Waikato (1.3
percent per annum.
By sector, the fastest employment growth in the UNI is expected in construction, at 5.5 percent per
annum, again led by Auckland and Bay of Plenty (both 5.9 percent per annum) but with strong growth
in Waikato as well (4.3 percent per annum). Business and professional services, health services and
residential care, food and beverage cultivation and processing, freight and logistics, and tourism are
the other key sectors that are expected to grow at a faster than average rate.
New jobs (net) and replacement demand
The previous section estimated the new supply of qualifications over the five years to 2020 by
qualification level and field of study. On the demand side of the economy, we quantified the number of
likely job openings by occupation and qualification using the same measures of level and field of study
over the same period of time.
Two sources of job openings were investigated: new jobs created and job openings due to
replacement. These methods are discussed in more detail in Appendix 4: Labour supply and demand
methodology.
New jobs (net)
In general, as a business grows over time, new jobs are required to help the business keep up with
the pace of growth (subject to productivity improvements). Conversely, as the economic conditions for
a business deteriorate, employers may be required to shed jobs in order to either maintain profit
margin or stay afloat. Jobs are also created when new businesses are established and lost when
businesses shut down.
Replacement demand
Employers need to replace workers who leave jobs to work in a different industry/sector or region, or
who leave the labour market, either through retirement or for other reasons, such as leaving the
country.
Sector
Forestry &
wood
processing
Dairy &
related
processing
Construction
& related
services
Business &
professional
services
Food &
beverage
cultivation &
processing
Health
services &
residential
care
Freight &
logisticsTourism All sectors
Northland -0.4% -1.0% 3.5% 2.2% -0.6% 1.7% 0.5% 0.9% 0.9%
Auckland -2.0% 0.5% 5.9% 2.4% 0.6% 2.3% 0.8% 2.4% 2.2%
Waikato -0.9% -0.3% 4.3% 2.4% -0.2% 2.1% 0.6% 1.3% 1.3%
Bay of Plenty -1.1% 0.8% 5.9% 2.2% 1.0% 2.0% 0.5% 1.3% 1.5%
Total UNI -1.2% -0.1% 5.5% 2.4% 0.5% 2.2% 0.7% 2.0% 1.9%
New Zealand -0.7% 0.1% 3.6% 2.0% -0.5% 2.1% 0.6% 1.7% 1.5%

37
We developed a net replacement demand model that estimates job openings by occupation arising
from individuals leaving an occupation net of jobs taken by individuals re-entering the occupation. By
netting out individuals re-entering an occupation, net replacement rates are a commonly cited
measure of labour turnover rates.
Table 12 summarises the individual and cumulative impacts of the forecast new job growth and the
jobs that will be required to be replaced over the 2014 to 2019 period by broad occupation grouping.
Table 12: Job openings in the UNI by broad occupation, 2016 to 2020
Source: Infometrics
An additional 362,700 workers are likely to be required in the UNI over the 2016 to 2020 period. To put
this into context, this is 6.1 percent of the total number of filled jobs in 2015 on an annualised basis.
All broad occupation groups in the UNI are forecast to have additional job openings in excess of 26
percent of the 2015 level of employment, with the community and personal service workers forecast to
require 41 percent more jobs, and the Technicians and Trades Workers occupation forecast to require
33 percent more jobs, by 2020.
Reflecting the need for higher skill levels in an increasingly knowledge based economy, Professionals
and Managers are expected to make up 136,000 or 37.5 percent of all job openings in the UNI over
the 2016 to 2020 period.
Job openings as a result of net replacement are twice those resulting from new jobs. Net replacement
accounts for a higher proportion of total job openings in the lower qualification occupation groups. For
example, net replacement job openings in the Machinery, Operators & Drivers occupation are 3.1
times higher than new jobs whereas for Technicians & Trades Workers net replacement job openings
are only 1. 6 times higher. Replacement rates vary across occupations for a number of reasons. For
example, lower skilled occupations tend to have higher net replacement rates than higher skilled
occupations due to individuals’ up-skilling and moving into higher skilled occupations. The age profile
of employees in each occupation also has a significant effect on replacement rates. Relatively new
occupations (for example, IT related) tend to have a young age profile meaning that a smaller
proportion need to be replaced due to retirement.
New Jobs Net Replacement Total
Managers 20,192 36,926 57,119 5.2% 15.7%
Professionals 29,412 49,498 78,910 5.7% 21.8%
Technicians and Trades Workers 17,887 28,464 46,351 6.6% 12.8%
Community & Personal Service Workers 13,148 29,933 43,081 8.2% 11.9%
Clerical and Administrative Workers 12,805 31,558 44,363 6.1% 12.2%
Sales Workers 7,720 29,104 36,824 6.5% 10.2%
Machinery Operators and Drivers 4,292 13,147 17,439 5.3% 4.8%
Labourers 9,896 28,684 38,580 6.6% 10.6%
Total 115,353 247,314 362,667 6.1% 100%
OccupationJob openings annualised job
openings as a % of
2015 employment
Job openings
as a % of total
job openings

38
Demand for qualifications
The sections above estimate the growth in demand for broad occupations. In this section we translate
the change in demand for broad occupations into the change in demand for qualifications.
To do this, we examine the fields of study (essentially broad subject areas) and the associated ‘ideal’
qualification levels on the New Zealand Qualifications Framework (NZQF) where occupations are
likely to require workers with qualifications.
Table 13 highlights the ideal qualification levels associated with the forecast job openings in the UNI
between 2016 and 2020.
Table 13: Job openings in the UNI by qualification level, 2016 to 2020
Source: Infometrics
The greatest demand for jobs will be for people with a level 1-3 qualification (151,830, 42 percent of
total job openings). While 39,080 are new job openings, a further 112,745 people will be needed to
replace employees who have left the workforce. In total, the number of job openings is equivalent to a
third of the current workforce that has a level 1-3 qualification. Further analysis into level 1-3 job
openings shows that the majority are likely to require a level 3 qualification rather than a level 1 or 2
qualification.
There is also likely to be strong demand in jobs requiring people with a bachelor degree or higher, with
30 percent of all job openings in the UNI likely to require people with these qualifications.
Figure 25 shows the demand for qualification levels by individual year over the 2016 to 2020 period.
New Jobs Net Replacement Total
Levels 1-3 39,083 112,745 151,829 7.5%
Level 4 21,507 41,649 63,156 9.6%
Levels 5-6 13,758 24,198 37,956 3.9%
Bachelor Degree or higher 41,005 68,721 109,726 4.8%
Total 115,353 247,314 362,667 6.1%
Qualification Level
Job openings Annualised job
openings as a % of
2015 employment

39
Figure 25: Job openings in the UNI by qualification level in individual years, 2016 to 2020
Source: Infometrics
The greatest number of job openings will be for those with at level 7+ qualifications followed by levels
1-3. Consistent with our forecast of economic conditions, there is an increase in demand in 2016/17
before demand eases over the next two years before picking up again in 2019/20. The shift is most
prevalent in the high and low qualification groups.
The additional labour required to fill the job openings in the UNI between 2016 and 2020 can be
further broken down into demand for skilled labour by qualification level and field of study as shown in
Table 14.
Table 14: Likely broad field of study and qualification level of people required to fill job
openings, 2016 to 2020
Source: Infometrics
Levels 1-3 Level 4 Levels 5-6Bachelor Degree
or higherTotal
Natural & Physical Sciences 6,399 1,152 2,384 6,695 16,630
Information Technology 5,853 605 1,439 5,408 13,305
Engineering & Related Technologies 24,740 18,301 6,766 13,801 63,608
Architecture & Building 8,921 18,834 2,368 4,138 34,262
Agriculture, Environ. & Related Studies 7,131 3,084 867 2,081 13,164
Health 11,797 2,282 3,741 15,456 33,276
Education 8,192 1,164 1,670 14,947 25,973
Management & Commerce 34,439 6,134 8,971 22,749 72,294
Society & Culture 20,878 3,854 5,787 16,662 47,181
Creative Arts 10,841 2,015 1,927 6,544 21,328
Food, Hosp. & Personal Services 12,639 5,729 2,035 1,244 21,647
Total 151,829 63,156 37,956 109,726 362,667
Job openings by field of study and qualification level
Field of study

40
There is expected to be a large number of job openings for people in the Management & Commerce
field of study, with level 1-3 qualifications likely to be most in demand.
Other fields of study related to a large numbers of job openings include Engineering & Related
Technologies, Society & Culture and Architecture & Building.
Using the relationship between field of study and key sectors we can provide an indication of the
sectors in which job openings are likely to occur in. About 209,150 of these job openings are expected
to be in the key sectors.
Job openings by key sector and by type of job opening between 2016 and 2020 are shown in Table
15.
Table 15: Job openings by sector and by type, 2016 to 2020
Source: Infometrics
There is expected to be growth in new jobs in all sectors apart from forestry and wood processing.
However, when factoring in net replacement jobs, there are job openings in all key sectors. The
greatest number of job openings are in construction and related services and business and
professional services, although there are also large numbers in health services and residential care,
freight and logistics and tourism.
This analysis can also be estimated by region for each sector. This is shown in Table 16.
Sector New jobsNet
replacement
Total Job
openings
Forestry & w ood processing -1,017 3,593 2,576
Dairy & related processing -106 4,703 4,597
Construction & construction-related services 35,445 25,624 61,069
Business & professional services 18,140 28,627 46,767
Food & beverage cultivation & processing 693 5,898 6,591
Health services & residential care 10,910 20,355 31,265
Freight & logistics 4,409 23,476 27,885
Tourism 8,864 19,533 28,397
All key sectors 77,338 131,809 209,147

41
Table 16: Job openings by sector and region, 2016 to 2020
Source: Infometrics
Not surprisingly, Auckland is expected to have the largest absolute share of job openings, accounting
for 68 percent of all openings followed by Waikato (15 percent), Bay of Plenty (12 percent) and
Northland (5 percent).
Consistent with our understanding of where these job openings are occurring, Auckland accounts for
75 percent of all business & professional services job openings and 78 percent of the job openings in
the freight and logistics sector. Waikato, Bay of Plenty and Northland account for a relatively high
share of job openings in forestry and wood processing. Northland and Bay of Plenty account for a
relatively high share of job openings in the dairy and related processing sector. Bay of Plenty accounts
for a relatively high share of job openings in the food and beverage cultivation and processing sector.
Balance between supply of and demand for labour
Having derived forecasts of growth in demand for and the supply of qualifications in UNI between
2016 and 2020, we can then assess the balance between the supply of and demand for labour (Figure
26).
At an aggregate level, there is forecast to be an oversupply of labour in the UNI of 32,400 people
between 2016 and 2020. This equates to 2.7 percent of overall employment in the region in 2015.5
However, there are two years (2016/17 and 2017/18) where demand for labour exceeds the supply of
labour. In the final year (2019/20) there is a relatively small surplus of labour, which will make
matching skills to jobs difficult.
5 The estimated oversupply of labour assumes that baseline labour force growth over the next five years occurs. If growth in the labour force
over the next five years is higher or lower than projected, the overall mismatch of labour is likely to be different. We examine what labour
supply could look like under various scenarios in Appendix 3: Labour Force Scenarios.
Sector Northland Auckland WaikatoBay of
PlentyTotal UNI
Forestry & w ood processing 443 606 726 801 2,576
Dairy & related processing 428 596 2,439 1,133 4,597
Construction & construction-related services 2,723 42,408 8,893 7,044 61,069
Business & professional services 1,456 35,202 5,428 4,682 46,767
Food & beverage cultivation & processing 312 3,916 821 1,542 6,591
Health services & residential care 2,029 19,368 4,729 5,139 31,265
Freight & logistics 871 21,730 2,945 2,339 27,885
Tourism 1,351 18,321 5,201 3,525 28,397
All key sectors 9,613 142,146 31,182 26,206 209,147

42
Figure 26: Skill imbalances in the UNI by individual year, 2016 to 2020
Source: Infometrics
Table 17 shows that there is an expected oversupply of people with qualifications at higher and lower
levels of the NZQF (levels 1-3 and Bachelor Degree and higher) and an undersupply of people with
level 4-6 qualifications in the UNI between 2016 and 2020.
Table 17: Skill imbalances in the UNI by qualification level, 2016 to 2020
Source: Infometrics
Negative = undersupply
The undersupply of level 4-6 qualifications is expected to predominantly occur in occupations that
demand an Engineering & Related Technologies or an Architecture & Building field of study. These
fields of study are likely to be in demand due to strong residential building activity as well as large civil
infrastructure and construction projects in the UNI area over the next decade.
Levels 1-3 Level 4 Levels 5-6
Bachelor
degree or
higher
Total
Natural & Physical Sciences -3,371 -697 -1,468 2,321 -3,215
Information Technology -2,004 396 -294 -512 -2,414
Engineering & Related Technologies 8,118 -4,025 -1,860 -1,239 994
Architecture & Building -3,174 -9,655 -1,196 -150 -14,174
Agriculture, Environ. & Related Studies 9,684 1,987 -348 -716 10,606
Health 107 -415 -603 -410 -1,321
Education -3,685 -188 505 9,534 6,166
Management & Commerce 5,310 7,395 -1,654 8,324 19,375
Society & Culture 12,119 160 -2,282 3,312 13,309
Creative Arts -4,726 -516 -844 1,335 -4,750
Food, Hospitality & Personal Services 6,557 1,265 247 -226 7,844
Total 24,936 -4,292 -9,798 21,574 32,420
Field of study
Job openings by field of study and qualification level

43
The approach to identifying expected skill imbalances in the UNI area is taken at the qualification level
as this is where data enables a ‘match’ to occur. As qualifications are typically generic and largely skill
based in nature, individuals with a qualification are likely to be attractive to employers across a range
of occupations. Employees’ choices are also influenced by a range of factors including individuals’
career ambitions, potential earnings, ‘job attractiveness’, shortages in occupations and technological
changes. This added level of complexity makes looking at skill imbalances at an occupational level
more difficult.
To gain a broad understanding of future skill imbalances in the UNI at an occupational level, we can
draw on the historical relationship observed in the 2013 Census between individuals’ highest
qualifications and fields of study and their occupations. Such estimates should be treated as indicative
as the future relationship could differ from the one in 2013 for the reasons outlined above. Despite
these limitations, our approach of quantifying shortages enables the identification of future pressure
points at an occupational level.
Table 18 shows the forecast number of job openings over the 2016 to 2020 period in the UNI and the
corresponding estimated undersupply of skilled workers in the UNI, ranked by the top 20 occupations
likely to be undersupplied. The occupations with the largest expected levels of undersupply of
workers, i.e., skill shortages, across the UNI are: Project Builders, Chief Executives or Managing
Directors, Labourers, Office Managers, Retail Managers, Storepersons, Carpenters, Truck Drivers,
Kitchenhands and Painting Trades Workers.

44
Table 18: Occupations with the greatest forecast undersupply in the UNI, 2016 to 2020
Source: Infometrics
As mentioned above, there are a number of sectors that compete for skilled labour, especially for
people who work in occupations that require transferrable skills, such as managers. Factors such as
pay, working conditions, location and technological advances are all likely to have an impact on the
attractiveness of different occupations.
Although some occupations are common across a number of sectors, some occupations are more
specifically associated with certain sectors than others. For example, a chief executive or managing
director could work across all sectors. However, a dentist is most likely to work in the health services
sector. The occupations forecast to be undersupplied that are ‘most relevant’ for each of the key
sectors is shown in Table 19.
Occupation Job OpeningsUndersupply of
skilled workers
Project Builder 7,831 -4,409
Chief Executive or Managing Director 6,495 -2,394
Office Manager 4,653 -2,151
Retail Manager (General) 5,214 -2,134
Labourers nec 7,119 -1,771
Kitchenhand 3,258 -1,532
Corporate General Manager 5,372 -1,385
Painting Trades Worker 2,136 -1,273
Registered Nurse (Medical) 4,087 -1,149
Carpenter 3,261 -1,127
Checkout Operator 2,339 -1,091
Storeperson 3,025 -966
Waiter 4,860 -910
Truck Driver (General) 3,909 -802
Police Officer 1,806 -762
Cafe or Restaurant Manager 2,189 -707
Program or Project Administrator 2,378 -690
Secretary (General) 2,074 -673
Plumber (General) 1,674 -644
Roof Tiler 864 -641

45
Table 19: Relevant occupations forecast to be under-supplied, by key sector
Source: Infometrics
This suggests that the greatest expected undersupply of occupations will be in the construction and
related services sector, freight and logistics sector, business and professional services sector and
tourism.
The Identification of Key Sectors and Forecasts report provides a detailed analysis of each sector
value chain, forecasts of demand and supply of labour for that sector and over and undersupply of
relevant occupations.
Key Sector Relevant occupations in undersupply
Forestry & w ood processing Wood Processing Machine Operator (-178), Saw Mill or Timber Yard Worker (-77),
Production Manager - Forestry (-42), Cabinetmaker (-20)
Construction & construction-related
services
Project Builder (-4,409), Carpenter (-1,127), Painting Trades Worker (-1,273),
Plumber - General (-644), Roof Tiler (-641)
Dairy & related processing Chemistry Technician (-73), Agriculture Technician (-39),
Food & beverage cultivation &
processing
Container Filler (-484), Food and Drink Factory Workers nec (-163),
Baking Factory Worker (-12)
Health services & residential care Registered Nurse (Medical) (-1,149), Medical Laboratory Technician (-342),
Dental Assistant (-291), Practice Managers nec (-164), Nursing Support Worker (-169),
Registered Nurse - Mental Health (-151), Midw ife (-134)
Freight & logistics Storeperson (-966), Truck Driver - General (-802), Corporate Services Manager (-549),
Container Filler (-484), Motor Mechanic - General (-413)
Business & professional services Chief Executive or Managing Director (-2,427), Office Manager (-2,151),
Labourers nec (-1,771), Corporate General Manager (-1,385), Programme or Project
Administrator (-690)
Tourism Kitchenhand (-1,532), Waiter (-910), Café or Restaurant Manager (-707),
Office Cashier (-358) Hotel or Motel Manager (-322)

46
EXISTING INITIATIVES
Given the shortages that are expected, this section considers the range of initiatives that are in place
or being developed to meet the skills and labour market challenge.
Table 20 shows a range of skill programmes and initiatives that focus on addressing skill demands
across the UNI and for specific sectors (these are not exhaustive). Many of these are national
initiatives that are implemented in the regions and many are region-wide initiatives that apply to a
range of sectors.
In particular, each UNI region has a skills strategy or set of actions to address sector-based and cross-
cutting skills issues, including as part of the Tai Tokerau Northland Economic Action Plan, the ATEED
Skills, Education and Employment Plan, the Waikato Labour Market Strategy, the Toi Moana Bay of
Plenty Economic Action Plan and the Bay of Plenty Tertiary Intentions Strategy. All of these involve a
range of organisations (industry, iwi, education, central government and local government).
The main take-out is that there is a large range of initiatives in each region focused on addressing skill
and labour constraints, including in the key sectors where we forecast significant occupational
shortages. Where there are not existing initiatives for some sectors, new initiatives are under
consideration or being developed. For example, a new initiative of relevance to UNISA is the central
government Sector Workforce Engagement Programme, which aims to support businesses and
industry to grow through improving ways they can access appropriately skilled staff. This programme
is still being developed but is intended to involve engagement with several of the key sectors
highlighted in this report, including tourism, construction, road freight, dairy, and horticulture.
What we cannot determine is whether the initiatives in place or being developed for each sector will be
sufficient to meet the forecast demands. In some cases, this is because there is limited if any
information about the reach and impact of existing initiatives (e.g., the Auckland Construction
Roadmap). In other cases, as noted above, initiatives are relatively new or are still to be developed
and their scope and reach is not clear. What we do observe is quite a piecemeal range of approaches,
which are often focused on one component of the solution (e.g., supply of training, literacy and
numeracy, talent attraction) or for one part of the labour market (e.g., youth, Māori, migrants).
Our conjecture is that it is unlikely that the scope of current and planned initiatives for construction,
tourism and freight will be sufficient given the scale of demand for key occupations in each of these
sectors and the range of supply and demand (and matching) elements that need to be addressed.
To be successful, in our view, any new, altered or expanded approaches will need to:
Involve a combination of ‘attract, build, match and retain’ mechanisms for each sector (i.e., the
interaction of immigration, beneficiary and youth transition, and education and training
mechanisms and consideration of work conditions and career options in the sector). As noted, the
forecasts suggest that the major issue will not be about increasing labour supply overall, but
getting the right skills to the right sectors and places.

47
Involve committed partnerships between the sector involved, education and training organisations,
central government agencies (particularly the Ministry of Business, Innovation and Employment,
including Immigration NZ, the Ministry of Education, Tertiary Education Commission, and Ministry
of Social Development) and local government agencies. Such partnerships should be developed
for the long-term as changes to the system will take time to implement and bed-in and will need to
evolve as circumstances change.
Focus on actions that will materially improve the availability of skills and labour to the sectors.
This is consistent with the Sector Workforce Engagement Programme that central government is
developing and hence is an approach that UNISA should initially consider for wider applicability in the
UNI area.

48
Table 20. Skill and Labour Market Initiatives in the UNI
National / UNI Northland Auckland Bay of Plenty Waikato
Cro
ss S
ecto
r
Tertiary Education Strategy.
Government Apprenticeship
Reboot Subsidy. An expansion
of apprenticeship funding was announced in Budget 2016.
Māori & Pasifika Trades
Training Initiative (expansion of
this was announced in Budget 2016).
Got a Trade? Got it Made! Campaign.
TEC WorkPlace Literacy Fund and training.
STAR and Gateway programmes.
Youth Guarantee.
Trades Academies.
Vocational Pathways.
CareersNZ website.
MSD Industry partnerships.
Youth Transition Service.
Government Sector Workforce Engagement Programme.
Mayor's Taskforce for Jobs—
Youth to work Strategy, Industry
Training Graduations, Rangatahi
Mayoral leadership/mentoring programme.
Sector Workforce Engagement Programme.
Tai Tokerau Northland
Economic Action Plan
includes a range of
proposed actions to
increase the availability of
skills in the region, including:
- Kaikohe growth
industries pathway; Te
Hiku Pathways – focus
on youth NEET -
Collaborative prototypes
co-designed with
employers to better
connect local youth to
available jobs in growth industries.
- Workforce stocktake and
planning – shared
resource describing
current stock of labour &
skills in the region and
forecasts of additional
workforce needed to
meet growth
expectations.
- Embedding vocational
pathways - from
secondary to tertiary and through to employment.
ATEED Skills, Education
and Employment Action Plan includes the following:
- Address skills shortages
and talent attraction to
support performance
improvements to lift the
capability and scale of
our key sectors in Auckland.
- Facilitate and encourage
collaboration across our
key sectors and
businesses with the
Mayor’s Youth
Employment Traction Plan.
- Grow the international
education programme,
Young Enterprise
Scheme and Youth
Connections (as part of
the Mayor’s Youth
Employment Traction
Plan / Hub) by
developing pathways to
employment to enable
greater cultural
diversification and
opportunity; employer
engagement; and greater
retention rates of graduates.
The 2014 Bay of Plenty Tertiary
Intentions Strategy created a
framework for regional collaboration
between education providers, industry,
regional and central government to
address tertiary education needs in
support of the region’s economic and
social development. The Strategy recommends action in five key areas:
- collaborative leadership
- improving Māori engagement and participation
- improving secondary/tertiary/ employment transitions
- innovation for sustainable business and community development
- increasing international education.
A regional tertiary implementation
group has been established to
progress the strategy.
The Western Bay of Plenty
International Strategy 2016-2019
includes a range of actions to improve migrant attraction and settlement.
Tauranga City Council, Western Bay
of Plenty District Council, Priority One
and Immigration New Zealand have
developed the Western Bay of Plenty
Regional Partnership Agreement to
share research, information and best
practice and attraction and retention practices.
Under the Waikato Regional
Labour Market Strategy,
actions are being developed in the areas of:
- Workforce Mapping – the
workforce mapping project
will provide students and
trainees with better
information about training
and employment
opportunities, and changing
skills requirements, in the
region.
- Secondary School
Employer Partnerships
(SSEP) – the aim of this
project is to provide school
leavers with relevant
technical and soft skills
necessary to ensure they
are able to secure jobs and
provide the skills
demanded by employers.
This involves secondary
school faculties and local
employers working
together, and ensuring
knowledge is shared.
SSEP will be piloted in 5
secondary schools by the end of 2016.

49
National / UNI Northland Auckland Bay of Plenty Waikato
Cro
ss S
ecto
r
Job matching / info websites for
attracting offshore workers: e.g.,
WorkHere and NewZealandNow.
Migration – Skills Shortage lists and reviews of Essential skills.
- Establishing communities
of learning in Kaitaia,
Taipa, Kaikohe, Whangarei, Hokianga.
- Tertiary Education
Precinct/cluster in
Whangarei - a
collaborative
arrangement to build a
tertiary campus focused
on delivery of Diploma &
Degree level education to
people in the Northland region.
Other existing regional initiatives include:
- Engaging Taitamariki in
Learning.
- Enterprise Education
Programmes.
There is a range of youth
into employment initiatives
under the banner of Youth
Connections, including
Jobfests, Youth Hub and Employer Pledges.
COMET is facilitating a
range of literacy and
numeracy and youth
initiatives, including the
Youth Employability
Passport, Family Learning, SouthSci.
There has been a focus on
the Southern Initiative
apprenticeships and
employment placements: up
to 200 trainees per year into
apprenticeships and sustainable employment.
The Bay of Plenty Economic Action
Plan includes several skills initiatives, including:
- An education leadership and
advocacy group to develop a brief
for, and oversee development of, a
Bay-wide youth/rangatahi
education and skills strategy,
focused on the needs of the region’s young Māori.
- Establishing a greater uptake by
Māori youth in skills and
development training that aligns to
employment opportunities through
a youth incubator, scholarships,
internships, youth ambassador,
and integration into existing sector initiatives.
- The Tauranga Tertiary Education Precinct.
Social Sector Trials have been
undertaken in Whakatāne, Rotorua, Kawerau.
- Support to the Secondary/
Tertiary Alliance.
- Waikato Labour Market
Forum – The forum is a key
communication vehicle to
present Waikato Regional
Labour Market Strategy
initiatives and secure
commitment and buy-in
from businesses, councils,
government agencies,
members of parliament,
secondary schools and
tertiary education
organisations to support implementation.
- Developing and launching the Waikato Story website.
- Identifying and supporting NEET youth.
- Facilitating sector groups to explore sector needs.
- The OpenWaikato Website.

50
National / UNI Northland Auckland Bay of Plenty Waikato
Cro
ss S
ecto
r
Priority One is reviewing existing skills
attraction programmes to ensure that
they are effective and align with the
needs of key sectors and
forecasts. An integrated and targeted
approach is being developed to
promote the sub-region to skilled
people nationally, and through
appropriate job fairs and social media internationally.
INSTEP programme - provides a link
between local secondary schools and
business by harnessing the energy
and expertise from local businesses to
inspire students to make informed
career choices. Includes a number of
initiatives such as Western
Bay@Work, Young Leaders’ Forum,
Principals’ Day Out, Centres of Excellence.
Smart Waikato undertakes a
range of initiatives to build
better linkages between
secondary and tertiary
education and the Waikato
workforce. Projects include
the FutureForce Action
Network and careers services;
the Young Enterprise
Scheme, Secondary School-
Employer Partnerships, and
Social Progress Action Network.
Wintec has been delivering
Māori and Pasifika Trades
Training since 2013 by
working closely with Iwi,
Pasifika and employers in Waikato.
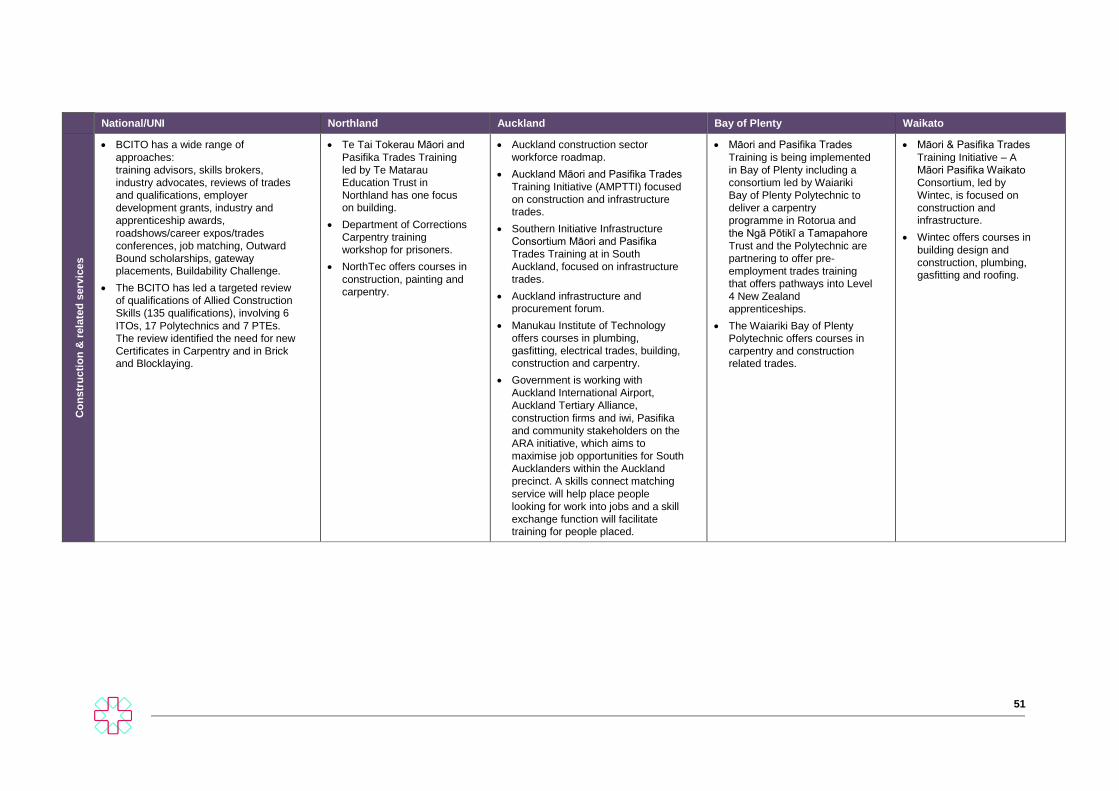
51
National/UNI Northland Auckland Bay of Plenty Waikato
Co
ns
tru
cti
on
& r
ela
ted
serv
ices
BCITO has a wide range of
approaches:
training advisors, skills brokers,
industry advocates, reviews of trades
and qualifications, employer
development grants, industry and
apprenticeship awards,
roadshows/career expos/trades
conferences, job matching, Outward
Bound scholarships, gateway placements, Buildability Challenge.
The BCITO has led a targeted review
of qualifications of Allied Construction
Skills (135 qualifications), involving 6
ITOs, 17 Polytechnics and 7 PTEs.
The review identified the need for new
Certificates in Carpentry and in Brick and Blocklaying.
Te Tai Tokerau Māori and
Pasifika Trades Training
led by Te Matarau
Education Trust in
Northland has one focus on building.
Department of Corrections
Carpentry training
workshop for prisoners.
NorthTec offers courses in
construction, painting and carpentry.
Auckland construction sector
workforce roadmap.
Auckland Māori and Pasifika Trades
Training Initiative (AMPTTI) focused
on construction and infrastructure trades.
Southern Initiative Infrastructure
Consortium Māori and Pasifika
Trades Training at in South
Auckland, focused on infrastructure
trades.
Auckland infrastructure and procurement forum.
Manukau Institute of Technology
offers courses in plumbing,
gasfitting, electrical trades, building, construction and carpentry.
Government is working with
Auckland International Airport,
Auckland Tertiary Alliance,
construction firms and iwi, Pasifika
and community stakeholders on the
ARA initiative, which aims to
maximise job opportunities for South
Aucklanders within the Auckland
precinct. A skills connect matching
service will help place people
looking for work into jobs and a skill
exchange function will facilitate training for people placed.
Māori and Pasifika Trades
Training is being implemented
in Bay of Plenty including a
consortium led by Waiariki
Bay of Plenty Polytechnic to
deliver a carpentry
programme in Rotorua and
the Ngā Pōtikī a Tamapahore
Trust and the Polytechnic are
partnering to offer pre-
employment trades training
that offers pathways into Level
4 New Zealand
apprenticeships.
The Waiariki Bay of Plenty
Polytechnic offers courses in
carpentry and construction related trades.
Māori & Pasifika Trades
Training Initiative – A
Māori Pasifika Waikato
Consortium, led by
Wintec, is focused on
construction and infrastructure.
Wintec offers courses in
building design and
construction, plumbing, gasfitting and roofing.

52
National/UNI Northland Auckland Bay of Plenty Waikato
Dair
y &
rela
ted
pro
cessin
g
Primary ITO has a wide range of
approaches: Primary Industry Trainee
awards, Agribusiness initiative, Aoraki
partnership, industry advocates, LLN
and Mentoring Programme,
assessment, volunteer mentors,
dyslexia screening and support, Youth
focused Trades Academy, Gateway
programme, Get Ahead Days, Māori
Agribusiness including: bespoke fit for
purpose training, engaging with post
treaty settlement entities, Whole Farm
Assessments, Tuhono Whenua
Productivity Project, Te Ao Māori
Governance SFF/MPI Project,
Whenua Kura initiative of Te Tapuae o
Rehua and Ngai Tahu, Ahuwhenua -
Young Māori Farmer of the Year,
Ahuwhenua Trophy BNZ Māori
Excellence in Farming Award, ‘AgExcel’ quality mark endorsement.
Landcorp/Venture Group
workplace literacy training pilot.
Research to better
understand primary sector
employers’ barriers to and
opportunities for
accessing the local labour
pool.
NorthTec-Taratahi
Agricultural Training
Centre and Lincoln
University-Northland
College Farm
partnerships, and the mid-
North community
Northland Training Hub.
NorthTec offers courses in
agriculture and farming skills.
Taratahi is establishing new
agricultural programmes in
partnership with UNITEC for the Auckland region.
The Waiariki Bay of Plenty
Polytechnic offers courses in cattle and dairy farming.
Taratahi’s base in Putaruru also serves Bay of Plenty.
Agribusiness initiative in
the Waikato involving
Dairy NZ, Wintec and
Dairy Training Ltd.
Focused on improving
awareness of the
Agribusiness Diploma,
exploring new delivery
options and improving learner support.
Taratahi is also involved in
developing additional
agricultural training in the
region in partnership with
Wintec.
Wintec offers the
Certificate in Dairy Technology.

53
National / UNI Northland Auckland Bay of Plenty Waikato
Fo
restr
y &
wo
od
pro
cessin
g
FITEC and CompeteNZ undertook a targeted review of
qualifications over 2011-2015 with NZQA which proposed a
range of changes in key qualifications for the sector. This
involved extensive consultation with industry and other stakeholders and the approach is well supported.
The Forest Industry Action Plan is a strategic document
designed to promote the forestry and wood manufacturing
industries to attract talent and promote career pathways into and
within the forestry sector. This plan supports skill development at all levels of the industry.
Te Tai Tokerau
Māori and
Pasifika Trades
Training led by
Te Matarau
Education Trust
in Northland is
also focused on
forestry industries.
NorthTec offers
a variety of
courses in
forestry and
harvesting operations.
The Waiariki Bay of Plenty Polytechnic has
forestry training courses for sawmill and harvest
workers, and for operators of mechanised
machinery. It has focused on shifting people from manual chainsaw tasks to skilled operators.
The forestry sector may get involved in the Bay
of Plenty House of Science programme, which is
focused on developing links between the local
science community and primary and secondary schools.
Te Teko “Tane Mahuta Forestry Cadetship” is
training 15-20 young Māori to work in forests
which have been transferred to Māori
ownership. Students work towards Level 1
National Certificate in planting, pruning and
thinning with one day per week in a classroom and four days in the forest.
Healt
h s
erv
ices &
resid
en
tial care
There are two regional training hubs in the Upper North Island
which are a collaboration between Health Workforce NZ, DHBs,
educational providers and professional associations. They
coordinate training and aim to make the education and training pathways of health professionals easier.
A review of education and training across health, science and
technical workforces is underway with a view to streamline
learning across different occupational groups and make it easier for students and trainees to gain new skills or switch disciplines.
The introduction of the first NZ Apprenticeships in health and
well-being was recently announced – in social and community
services, primary care practice assistance and rehabilitation support for brain injuries.
Careerforce and Health Workforce New Zealand have
developed the Kaiāwhina Workforce Action Plan and development programme for care support workers in the sector.
Auckland
University of
Technology
offers courses
and degrees in
health science
including
midwifery,
nursing and
health administration.
Manukau
Institute of
Technology
offers courses
nursing and health support.
The Waiariki Bay of Plenty Polytechnic offers
courses in healthcare and nursing.
Wintec
offers a
variety of
courses in
nursing,
health and
social
practice and midwifery.

54
National/UNI Northland Auckland Bay of Plenty Waikato
Fre
igh
t &
lo
gis
tics
There is a Youth Guarantee pathway into
Logistics/Services/Infrastructure.
The Road Transport Forum has launched a Women in
Transport Action Plan which includes initiatives to attract more women into the industry.
The Auckland Co-Design Lab has also undertaken the
Driver Licensing Challenge to examine potential ways of
overcoming barriers facing some groups in getting a
license, particularly youth.
MITO and NZQA undertook a Targeted Review of
Qualifications. As a result of the review, a new career pathway for log truck operators was launched in 2014.
The Upper North Island Freight Accord has, as one of
action areas, ‘a future-fit freight workforce’. Actions
underway include a working group to undertake further
analysis to determine the scope of the workforce capacity
and capability problem; and an assessment of the impact
of the Graduated Driver Licensing System on heavy
vehicle driver training as part of the review of the Driver Licensing Rule.
NorthTec offers
courses in road
transport and goods service.
MBIE is working with the
Auckland Chamber of
Commerce and the
transport sector to support a
potential joint venture with
the haulage and logistics
sector to develop a group
employment and training
scheme for Class 5 licensed
truck drivers in the Auckland region.
The Waiariki Bay of Plenty
Polytechnic is considering
expanding the truck driver course into Auckland.
Manukau Institute of
Technology offers courses
in logistics and supply chain management.
The Waiariki Bay of Plenty
Polytechnic has established the
Transport, Warehousing and
Logistics Training Centre, which
provides a hands-on learning
environment (e.g., students pick up
and deliver loads to the warehouse, students unload and store goods).
The Polytechnic offers a truck driver
course which accelerates the time it
takes students to get from class 1 to
class 5. It also offers courses in
commercial road transport, road
transport management and supply chain management.
The Waiariki Bay
of Plenty
Polytechnic truck
driver course has
been delivered in
the Waikato region.

55
National / UNI Northland Auckland Bay of Plenty Waikato
To
uri
sm
ServiceIQ programmes such as Gateway programmes
and partnerships, Tourism cultural camps, industry
awards, Future Leaders Programme, career planning tools, Pacifica success in the workplace
Service IQ is also developing regional tourism workforce
roadmaps that are focused on actions to address
shortages. Auckland is one of the first three roadmaps
being completed and it is intended that roadmaps will also be developed for Northland, Taupō and Bay of Plenty.
Restaurant Association NZ programmes (ProStart, Emerging Manager, Front of House Induction).
Hospitality NZ programmes (Training Academy, Skills for Industry, Future Leaders).
Hospro online benchmarking tool.
Grants to support People and Skills development from the
Tourism Industry New Zealand Trust, Hospitality Training Trust and others.
The Tourism Industry Association of NZ has developed
the People and Skills 2025 framework to guide how the
sector develops its workforce to meet the 2025 goals. The
framework identifies a set of actions for the industry to
address several labour demand and supply drivers
Joint work between the sector and government on
supporting and enabling the transition of beneficiaries into
employment into the tourism industry; and the promotion
and development of tourism as a career, including
promotion in schools and development of the tourism curriculum in schools.
QRC Tai Tokerau
Resort College -
Hospitality and
Tourism training
college supporting
rangatahi from
across Northland
into a pathway to
employment
and/or higher education.
NorthTec offers
courses in
hospitality, food
and beverage
service and cookery,
Service IQ regional
tourism workforce
roadmap being
developed for Auckland.
Auckland University of
Technology offers
courses and degrees
in hospitality and tourism management.
Manukau Institute of
Technology offers
courses in culinary,
hospitality, baking,
tourism management
and event management.
Waiariki Bay of Plenty Polytechnic
offers courses in food hygiene,
cookery, food and beverage service and baking.
Wintec offers courses
in hospitality, travel
and tourism and cookery.

56
National / UNI Northland Auckland Bay of Plenty Waikato
Fo
od
& b
evera
ge c
ult
ivati
on
& p
roc
essin
g
The Recognised Seasonal Employer (RSE) policy helps to
address seasonal labour and skills shortages in the
horticulture and viticulture industries that cannot be readily
filled from the available New Zealand labour pool. RSE
has annual cap of 9,000 workers (the cap increased from
8,000 in July 2014). Since February 2015, the RSE
scheme been supplemented with a similar scheme for
New Zealand workers, which is being piloted to fill
additional labour requirements in the main growing regions.
The Horticulture and Viticulture National Labour
Governance Group and MBIE are seeking to develop a
comprehensive labour demand and supply model for the
sector. This is intended to support more informed decision
making about labour supply (including the RSE cap) and
underpin the development of a longer-term labour and skills strategy for the sector.
Horticulture NZ and other industry groups have
established a Human Capability Group to develop and
implement a strategy to recruit thousands of trained
workers into the industry by 2025.
NorthTec offers
courses in
horticulture and rural development.
Manukau Institute of
Technology offers
courses in apiculture,
horticulture and landscaping.
Bay of Plenty Polytechnic offers
courses and certificates in horticulture and kiwifruit skills.
Katikati College offers a specialist horticultural programme.
Actions in the Economic Action Plan
include several for the horticulture industry:
- Engaged Mokopuna providing
future workforce for growing
regional industries via developing
partnerships between industry
and iwi through secondary
schools, including initiatives such
as internships, experience days, exchanges and scholarships.
- Development of Māori internships
and long-term training
programmes, including pastoral
care aspects, selection criteria
and promotion to increase Māori employment in the industry.
- Industry partnership between iwi
and employers to develop full-
time positions – target 180
workers.
- Increasing labour resources
through improving the perception
of employment in the horticulture industry.
- Industry auditing of labour conditions.
Wintec offers the
National Certificate in Horticulture.

57
A potential role for UNISA
Given all of the existing or proposed activity, is there a specific role for UNISA in addressing skill and
labour market challenges in the UNI?
In thinking about the role for UNISA, the usual tests of the appropriate roles of local and regional
government in economic development should be applied.
All councils undertake planning and manage regulatory functions, infrastructure and services that
impact on business and investment decisions. As such, councils have a natural role in working with
the private sector to ensure that these functions, assets and services facilitate economic growth.
Beyond these general roles in supporting business and industry growth, council investment in more
‘active’ economic development interventions, such as skills and labour market initiatives, can be
justified if the following three ‘tests’ are met:
i. there are significant problems impacting on industry and economic performance or major
opportunities for growth that are not being taken up, based on clear evidence.
Problems impacting on the performance of businesses and industries in regions or opportunities
for growth that are not being taken up are easy to find. The key is to determine that the problems
or opportunities are significant enough that they are having a detrimental impact (or will potentially
have a positive impact) on a large proportion of businesses or a significant part of the regional
economy; e.g., in this case, are skills and labour constraints impacting on the UNI significant?
In order to determine significance, councils and/or their agencies must gain a detailed knowledge
of the issues and organisations or industries impacted (for example, through this type of project).
The evidence should be based on hard data and robust research.
ii. local and regional government organisations have a clear role in helping businesses or
industries overcome the problems or pursue the opportunities, i.e., when:
a. the private and non-government sectors will not come to a solution (or to a less than socially
desirable outcome) if left to their own devices or, in other words, ‘market failures’ exist.
There are several possible areas of market failure that can be considered in determining
whether active economic development investments and activities by UNISA councils are
required. Some common types that can provide a rationale for skills development support are:
Information problems, i.e., individuals or organisations may have limited information
about the availability of skills, future prospects for growth and labour requirements, or
about available skill programmes, which may constrain investment in training. Councils
might be able to bring information to bear to improve decision-making (e.g., about skills
initiatives in a region).
Coordination problems, i.e., organisations or industries may be reluctant to partner with
others in investing in education or training because they are concerned about sharing
information with potential competitors, or simply because they do not know all the parties
they should be partnering with or how to work with them. Councils or their agencies
might be able to play a ‘neutral broker’ role in bringing the required parties together.

58
‘Spillovers’ or wider economic benefits, i.e., when the benefits of a project or investment
are likely to flow to a range of organisations beyond those actually investing or taking
part. For example, there might be a few businesses contemplating co-investing in a new
training programme to develop more highly skilled workers for their industry, but they
know that some of those workers will end up working for other businesses. So they are
unlikely to invest the full amount required. Councils could facilitate private and public
funding to get the training programme established on the basis of the broader industry
and regional benefits.
b. local and regional government (and/or their agencies) are well placed to improve the situation
with or relative to other organisations, for example, industry associations, education
organisations or central government agencies. In addition, in this case, UNISA would need to
be better placed to collectively address the situation than any existing local and regional
government initiatives.
This is more likely when UNISA councils collectively have some advantages to bring to bear.
For example, UNISA might have privileged access to some information (e.g., due to being
able to bring collective evidence from across councils together) or be regarded as a more
credible provider of the information. UNISA or its councils are also more likely to have a role if:
the industry or industries affected are new or diverse and not well organised (and hence are
unlikely to develop a solution on their own); when there are long-term horizons involved and
considerable uncertainty about the benefits of collective action; and/or when local and regional
government organisations are already involved in investments or policies that impact on the
industries.
In determining whether UNISA should take a lead role, it should consider:
the extent to which decision-making is required across councils relative to individual
councils, central government, industry or other organisations
whether local or regional government controls key levers that could address the issues.
c. involvement is consistent with the broader mandate and roles of local and regional
government.
Broader roles for local and regional government include:
Leadership and direction. This includes strategies and plans in partnership with the
community that set out economic priorities for the locality or region, including planning
for land, property and infrastructure in appropriate locations to meet industry needs. It
can also include ensuring that robust local economic development data and information
is available to inform strategising and planning and enable decision-making. Where
appropriate, it may include aligning local/regional priorities with national economic
priorities or other regions’ priorities.
Productive infrastructure and asset investment and management. This includes
investing in key assets and infrastructure where there is a good case, assessing whether
other investors may be able to add economic value to the councils’ assets, and
investigating opportunities to make council procurement more effective in stimulating
growth and innovation while achieving spending objectives and value for money.

59
Providing core services (e.g., water supply, waste, public transport, amenities), including
ensuring core services are reliable, accessible and priced appropriately for the
communities of interest that need them and identifying new ways of driving efficiencies in
services in order to keep costs to businesses and the public down (and hence improving
the quality of the business environment).
Regulating and ensuring that the councils various regulatory roles (e.g., resource
consenting) are administered responsively, consistently and cost effectively.
A role for UNISA in addressing labour and skill challenges is more likely if it is consistent with
the above roles.
iii. it is likely that UNISA involvement will succeed and the benefits of doing so will exceed the
costs. Benefits are more likely to exceed the costs when actions:
are designed to ensure additional activity beyond what organisations would have
undertaken anyway, i.e., actions are beyond business as usual, and provide long-term
certainty for organisations’ decision-making to encourage enduring changes in investment
and behaviours
generate wider economic benefits that would not have occurred without UNISA council
involvement. This is more likely when there are many potential beneficiaries (e.g., an
initiative is focused on a sector rather than a few firms)
aim to share risks and costs between the public and private sector
complement (rather than compete with or duplicate) other local government, non-
government, and private sector initiatives aimed at addressing related
problems/opportunities and market failures.
What is the implication for UNISA?
The first test has been met. It’s clear from the research, and indeed is well recognised, that there are
systemic issues impacting on the ability of some industries to obtain the skills they need and of the
education, training and immigration system to deliver these to industries when required.
The second test is more difficult to meet. On the one hand, we do consider that the skill challenges
we’ve highlighted are due to major information and coordination problems (e.g., between industry,
individuals and the education and training system). On the other hand, as highlighted in Table 20,
there is a significant range of initiatives being undertaken to address skill demands in the key sectors
across the UNI, beyond ‘standard’ education and training investments and programmes. Several of
these are regional skill strategy or action plan initiatives which already involve councils or council
agencies.
In addition to the large variety of sector-driven initiatives, two broad initiatives are worth noting:
Regional skills strategies or action plans. Every UNI region has a skills strategy or set of actions to
address sector-based and cross-cutting skills issues, including the Tai Tokerau Northland
Economic Action Plan, the ATEED Skills, Education and Employment Plan, the Waikato Labour
Market Strategy, the Toi Moana Bay of Plenty Economic Action Plan, and the Bay of Plenty
Tertiary Intentions Strategy. All of these involve councils and/or council agencies.

60
Central government’s Sector Workforce Engagement Programme, which aims to support
businesses and industry to grow through improving the ways in which they can access
appropriately skilled staff at the right time and place. The programme includes engagement with
several of the key sectors highlighted in this report (including in the UNI), such as tourism,
construction, road freight, dairy and horticulture.
UNISA would need to be able add value over and above such initiatives.
Whether the third test is met will depend on the nature of the intervention. If UNISA was to play a role
in relation to labour market and skill challenges, we consider that the following broad options would be
the most justifiable, consistent with appropriate roles of local and regional government, and more likely
to ensure benefits exceed the costs:
1) Information and promotion:
- providing information about skills issues and opportunities impacting on the UNI and its
regions (monitoring and research)
- promoting available skills initiatives available in the UNI and its regions. There are a number
of programmes that have been implemented with some success at a community level.
Successful models could be identified and, where relevant, applied in other regions in the
UNI
- providing information about planned local or regional projects in the UNI that involve
significant labour requirements (e.g., infrastructure projects).
2) Coordination, e.g., facilitating discussions and work between different organisations in the
system about how they could address the issues or opportunities at a UNI rather than regional
level. This could extend to coordinating local and regional government investment or planning
activities across the UNI where there are major flow-on employment impacts.
For example, there are a few sectors where there are stronger inter-regional linkages across the
UNI, such as freight & logistics and tourism, where joint effort to develop the UNI pool of required
labour may be important. UNISA may be better placed to encourage such efforts than many other
agencies or individual councils. In another sector, such as construction and related services, local
governments across UNI have a direct impact on the demand for skills through co-investing in
major infrastructure projects. Improved coordination of planning and procurement across the UNI
might be able to better smooth the demand for labour over time and across regions, and facilitate
cross-regional movement of labour.
In addition, given that overseas migrants are a relatively large source of arrivals and labour
across UNI regions, it may be worth UNISA considering whether there are any advantages from
coordinating immigration attraction and settlement efforts. Rather than competing against each
other for offshore skills, it would be worth testing whether the UNI as a whole could attract more
skilled (offshore) migrants required for particular sectors by promoting opportunities across the
UNI and improve migrant outcomes by collectively considering where settlement would be most
appropriate (and whether the benefits of doing so would exceed the costs). This would be an
extension of what some local councils are already doing together with Immigration New Zealand
to coordinate immigration attraction and retention within regions (e.g., the Western Bay of Plenty
Regional Partnership and Western Bay of Plenty International Strategy 2016-2019).

61
3) Supporting the local application of national policy and programmes. This could include
advocating for changes in policy and programme settings to meet UNI and regional needs. In
some cases, UNISA could also encourage joint work by local and regional government agencies
across the UNI to coordinate the local delivery of national skills initiatives and ensure they take
account of local and regional circumstances (which in some cases may require co-investment).
As noted earlier, this should also include consideration of Central Government’s engagement with
sectors on workforce issues and how engagements will be implemented in the UNI.
Recommendations
Table 21 below summarises our recommendations for the next steps for UNISA in addressing skill and
labour market challenges at a sectoral and cross-sectoral level. This takes into account the research
findings and the framework of questions for thinking about the role of UNISA noted above. There will
also continue to be roles for UNISA councils and council organisations at a regional rather than UNISA
level.
The major immediate recommended actions for UNISA are to:
promote the findings of this study to emphasise the importance of the issues and to encourage
industry and the education and training system to respond (and update the forecasts on a regular
basis to ensure currency)
identify those programmes that are operating successfully at a local/regional level and how they
might be applied in other areas of the UNI where there is a similar need. This should include
consideration of a UNI approach to immigration attraction and settlement for key sectors.
engage with central government to discuss the potential implementation of the government’s
Sector Workforce Engagement Programme in the UNI
assess whether the coordination of major infrastructure investment (e.g., planning and
procurement) across UNI regions could help smooth construction sector labour demand and
facilitate the movement of labour across regions (in consultation with the sector and central
government).
Depending on the outcomes of these next steps, there may well be further roles for UNISA (or subsets
of UNISA councils) in coordinating and co-investing in sector-based skill and labour market initiatives
across UNI regions.

62
Table 21. Proposed next steps for UNISA
Level UNISA Role Proposed Action
Cross-sectoral Information
Promotion
Coordination
Promote the findings of this study.
Update the forecasts every 3 years.
Share lessons about successful local/regional programmes
across the UNI area. Consider UNI-wide partnership approach to immigration attraction and settlement for key sectors.
Support the application of
national programmes to the UNI
Joint UNISA and central government workshop to discuss the
implementation of central government’s sector workforce engagement programme and regional action plans to the UNI
Forestry and related
processing None Local/regional councils and agencies continue to engage with
the industry through regional skill strategies and plans as
appropriate.
Construction and related
services Support the application of
national programmes to the UNI
Information, coordination
Assess the potential for the application of current Auckland-
focused construction workforce initiatives (e.g., Auckland
roadmap, ARA) to other regions in the UNI with central government.
Assess the timing of major infrastructure and construction
investment across the UNI and whether coordinated planning and procurement could smooth labour demand.
Dairy and related
processing None Local/regional councils and agencies continue to engage with
the industry through regional skill strategies and plans as appropriate.
Food and beverage
cultivation and processing
Support the application of
national programmes to the UNI
Monitor the implementation of the expansion of the RSE
scheme and outcomes of the demand/labour analysis being undertaken by the sector.
Local/regional councils and agencies continue to engage with
the industry through regional skill strategies and plans as appropriate.
Tourism Support the application of
national programmes to the UNI
Discuss with MBIE the implementation pathway for central
government’s joint skills work with the tourism industry.
Local/regional councils and agencies continue to engage with
industry through regional skill strategies and plans as appropriate.
Freight and logistics Information
Coordination
Monitor progress with the Transport Accord ‘future fit freight
workforce’ actions.
Discuss with the Auckland Chamber of Commerce, National
Roads Carrier Association, Bay of Plenty Polytechnic and
central government whether and how truck drivers programmes could/should be scaled up to the UNI level.
Local/regional councils and agencies continue to engage with
industry through regional skill strategies and plans as
appropriate.
Business and
professional services None None.
Health services and
aged care None Although we do not propose any major actions, UNISA should
discuss the scope of central government’s proposed work with
the aged care sector as part of the cross-sectoral work noted above.

63
APPENDICES

64
Appendix 1: UNI Sector Definitions
Table 22: Comparison of sector value chain definitions
Broad sector Northland definition Auckland definition Bay of Plenty definition Waikato definition National definitions Comment
Forestry and
related processing
Forestry, logging, log sawmilling, forestry
support services, veneer and plywood
manufacturing, wooden structural fitting
and component manufacturing,
reconstituted wood product
manufacturing, other wood product
manufacturing, timber resawing and
dressing, prefabricated wooden building
manufacturing, wood chipping, pulp, paper and paperboard manufacturing
N/A Forestry, logging, forestry support services, log
sawmilling, wood chipping, timber resawing and
dressing, prefabricated wooden building
manufacturing, wooden structural fittings and
components manufacturing, veneer and plywood
manufacturing, reconstituted wood product
manufacturing, pulp, paper and paperboard
manufacturing, corrugated paperboard an paperboard
container manufacturing, paper bag and sack
manufacturing, paper stationery manufacturing,
sanitary paper manufacturing, other converted paper product manufacturing.
Forestry, logging and related product
manufacturing. Included forestry;
logging; veneer and plywood
manufacturing; structural fitting and
component manufacturing; pulp,
paper and paperboard
manufacturing; paper product
manufacturing and forestry support services
N/A Consistent across
Northland, BOP and Waikato.
Dairy & related
processing
Dairy cattle farming, milk and cream
processing, cheese and other dairy
product manufacturing, proportion of
agriculture and fishing support services, proportion of packaging services
Had an agriculture category spanning dairy,
horticulture and livestock farming. Included:
Apple and pear growing, beef cattle farming,
beekeeping, berry fruit growing, citrus fruit
growing, dairy cattle farming, deer farming,
fish trawling, floriculture, forestry, grain sheep
and grain beef cattle farming, grape growing,
horse farming, hunting and trapping, kiwifruit
growing, nursery production, olive growing,
pig farming, poultry farming, sheep farming, stone fruit growing, vegetable growing
Dairy cattle farming, dairy product processing (milk
and cream, ice cream, cheese and other dairy product
manufacturing), and proportions of packaging services and other agriculture and fishing support services
Proportions of agriculture and fishing support services
and packaging services were based on the industry’s
GDP contribution relative to other industries using these services.
Dairy farming and dairy product
processing: Included dairy cattle
farming and dairy product
manufacturing (milk and cream
processing, ice cream
manufacturing, cheese and other
dairy product manufacturing. Did not include support services.
Dairy & related processing sector review
included dairy cattle farming, milk and
cream processing, cheese and other dairy
processing, dairy produce wholesale. Did
not include ice cream manufacturing, infant formula manufacturing.
Generally consistent
across Northland, Bay
of Plenty and Waikato,
with the exception of
inclusion or exclusion
of support and
packaging services.
National definition
includes wholesale activities.
Livestock
farming and
related
processing
Beef cattle farming, meat processing,
sheep-beef cattle farming, sheep farming,
shearing services, other livestock farming
nec, cured met and small goods
manufacturing, deer farming, pig farming,
poultry farming (meat), proportion of
agriculture and fishing support services; proportion of packaging services
Excludes: other grain growing other crop,
poultry farming (eggs), horse farming, wool scoring, beekeeping
As above. Also, meat product manufacturing
was included in food and beverage manufacturing.
Red meat industry - Sheep, beef, deer and other
livestock farming, meat product manufacturing and
support services. Included sheep farming, beef cattle
farming, sheep-beef cattle farming, grain-sheep and
grain-beef cattle farming, deer farming, pig farming,
other livestock farming, meat processing, cured meat
and small goods manufacturing, and proportions of
packaging services and other agriculture and fishing support services.
Proportions of agriculture and fishing support services
and packaging services are based on the industry’s
GDP contribution relative to other industries using these services.
Did not include poultry farming, poultry product manufacturing, shearing services.
Sheep farming, beef cattle farming
grain growing, meat processing,
cured meat and small goods
manufacturing.
Did not include poultry, deer farming,
pig farming, horse farming, dairy
goat and goat farming. These were
included in an ‘Other agriculture’ category.
Meat sector review included sheep-beef
farming, deer farming, other livestock
farming, pig farming, poultry meat farming,
meat processing, cured meat and
smallgoods manufacturing, poultry processing and meat wholesaling.
Differences across
Northland, Bay of
Plenty and Waikato
relate to inclusion or
exclusion of grain
growing, deer farming,
pig framing,
proportions of
packaging and other
agricultural support
services. National
definition includes wholesale activities.
Food &
beverage
cultivation & processing
Horticulture, arable and related
processing – includes vegetable growing,
kiwifruit growing, nursery production,
floriculture production, grape growing,
citrus fruit growing, berry fruit growing,
apple and pear growing, stone fruit
growing, olive growing, other crop
growing, other fruit and tree nut growing,
turf and floriculture production,
beekeeping, fruit and vegetable
processing, wine and other alcoholic
beverage manufacturing, soft drink,
cordial and syrup manufacturing, cereal
and grain manufacturing, pasta and
Food and beverage processing –includes
food manufacturing, beverage manufacturing
and food and beverage wholesaling activities.
Includes meat processing, poultry processing,
cured meat and smallgoods manufacturing,
seafood processing, milk and cream
processing, ice cream manufacturing, cheese
and other dairy product manufacturing, fruit
and vegetable processing, oil and fat
manufacturing, grain mill product
manufacturing, cereal, pasta and baking mix
manufacturing, bread manufacturing, cake
and pastry manufacturing, biscuit
manufacturing, sugar manufacturing,
Split in two: Kiwifruit and other food cultivation and
processing.
Kiwifruit included kiwifruit growing, proportions of fruit
and vegetable processing, other agriculture and fishing
support services, packaging services. Proportions of
fruit and vegetable processing, agriculture and fishing
support services and packaging services are based on
the industry’s GDP contribution relative to other industries using these services.
Other food cultivation and processing included prawn
fishing, rock lobster and crab potting, line fishing, fish
trawling, other fishing, poultry farming, poultry
processing, nursery production, mushroom growing,
vegetable growing, grape growing, berry fruit growing,
N/A Processed foods included sectors
representing products made from a
mixture or combination of ingredients, rather a single ingredient.
Beverages included soft drink
manufacturing, cider manufacturing, beer
manufacturing, spirit manufacturing, wine-
making, grocery wholesale, liquor
wholesaling. Included inputs of apple/pear
growing, other fruit growing and grape growing.
Different breadth of
definitions across UNI
regions although core
industries are the
same. National
definition included
inputs as well as wholesale activities.

65
Broad sector Northland definition Auckland definition Bay of Plenty definition Waikato definition National definitions Comment
baking mix manufacturing, bakery
product manufacturing, crisps and corn
chips manufacturing, prepared animal
and bird feed manufacturing,
confectionary manufacturing, cake and
pastry manufacturing, oil and fat
manufacturing, other food product
manufacturing, fruit and vegetable
processing, proportion of agricultural and
fishing support services; proportion of
packaging services; proportion of other food product manufacturing nec.
confectionary manufacturing, potato, corn and
other crisp manufacturing, prepared animal
and bird feed manufacturing, other food
product manufacturing soft drink, cordial and
syrup manufacturing, beer manufacturing,
spirit, manufacturing, wine and other alcoholic
beverage manufacturing, general line grocery
wholesaling, meat, poultry and smallgoods
wholesaling, dairy produce wholesaling, fish
and seafood wholesaling, fruit and vegetable
wholesaling, liquor and tobacco product wholesaling, other grocery wholesaling.
apple and pear growing, stone fruit growing, citrus fruit
growing, olive growing, other fruit and tree nut
growing, other grain growing, other crop growing,
beekeeping, oil and fat manufacturing, grain mill
product manufacturing, cereal, pasta and baking mix
manufacturing, bread manufacturing, cake and pastry
manufacturing, biscuit manufacturing, bakery product
manufacturing, sugar manufacturing, confectionary
manufacturing, potato crisp and corn chips
manufacturing, prepared animal and bird feed
manufacturing, soft drink, cordial and syrup
manufacturing, beer manufacturing, spirit
manufacturing, wine and other alcoholic beverage
manufacturing, and proportions of other agriculture
and fishing support services, seafood processing,
packaging services, fruit and vegetable processing.
Proportions of agriculture and fishing support services,
seafood processing, packaging services and fruit and
vegetable processing are based on the industry’s GDP
contribution relative to other industries using these services.
Aquaculture,
fishing and
related processing
Aquaculture, fishing and related
processing includes longline and rack
(offshore) aquaculture, caged (offshore)
aquaculture, onshore aquaculture, rock
lobster and crab potting, prawn fishing,
line fishing, fish trawling, seining and
netting, other fishing, seafood processing,
proportion of Other Agriculture and
Fishing Support Services; Proportion of packaging Services
Seafood processing was included in food and
beverage processing.
Included longline and rack (offshore) aquaculture,
caged (offshore aquaculture), onshore aquaculture,
proportions of seafood processing, other agriculture
and fishing support services, packaging services.
Proportions of agriculture and fishing support services,
seafood processing and packaging services are based
on the industry’s GDP contribution relative to other industries using these services.
Aquaculture, fishing and related
processing includes longline and
rack (offshore) aquaculture, caged
(offshore) aquaculture, onshore
aquaculture, rock lobster and crab
potting, prawn fishing, line fishing,
fish trawling, seining and netting, other fishing, seafood processing.
Seafood sector review included line
fishing, fish trawling, seining and netting,
other fishing, rock lobster and crab potting,
other fishing, longline and rack
aquaculture, caged aquaculture, other aquaculture, seafood wholesaling
Consistent across
Northland and Waikato
with the exception of
the inclusion or
exclusion of support
and packaging
services. National
definition includes
wholesale activities.
Bay of Plenty definition
was focused on
aquaculture not fishing.
Petroleum and
related processing
Oil and gas extraction, exploration,
petroleum refining and fuels
manufacturing, industrial gases manufacturing
N/A N/A Petroleum and chemical
manufacturing. Included: Petroleum
and coal product manufacturing,
Basic chemical and chemical
product manufacturing (industrial
gas, basic inorganic chemical
manufacturing, synthetic resin,
synthetic rubber, fertiliser
manufacturing, explosive manufacturing
Petroleum and minerals included all
sectors in ANZSIC Code B, i.e., oil and
gas extraction, coal mining, metal ore
mining, construction material mining,
petroleum and mineral exploration, mineral
support services.
Differences across
Northland and Waikato
(which also included
chemicals) were based
on regional industry
compositions.
Tourism Included proportions of the following
broad industries: Accommodation; Cafes
and Restaurants, Takeaway Food
Services, Catering Services, Pubs,
Taverns and Bars, Clubs (Hospitality); Air
and Space Transport; road, rail and water
transport; libraries, museums and the
arts; sport and recreation services and
activities; rental and hiring activities;
supermarket and grocery stores,
specialised food retailing, clothing
retailing, furniture, houseware and
appliance retailing, other personal and
household retailing, motor vehicle retailing and services
Included proportions of a range of segments
including accommodation, pubs, taverns and
bars, cafes and restaurants, clubs
(hospitality), long distance bus transport,
short distance bus transport, taxi and other
road passenger transport, rail transport, water
transport, air and space transport, other
transport, services to transport, storage,
machinery and equipment hiring and leasing,
libraries, museums and the arts, sport and
recreation, supermarket and grocery stores,
specialised food retailing, department stores,
clothing and soft good retailing, furniture,
houseware and appliance retailing, other
person and household good retailing,
Used Infometrics values. Estimates of tourism GDP
and employment make use of the Tourism Satellite
Accounts (TSA) published by StatsNZ, in conjunction
with data on guest nights, visitor expenditure data from
MBIE, and Infometrics’ regional GDP model. The TSA
estimates the contribution of the tourism industry to
GDP nationally. From 2009 Infometrics apportioned
tourism GDP from the TSA to each territorial authority
(TA) using constrained shares of visitor expenditure
from MBIE’s visitor expenditure data. For the years
before 2009, they calculated growth rates in each TA’s
tourism GDP, by adjusting TSA industry ratios (that
summarise the proportion each industry’s output
associated with tourism) and applying these adjusted
ratios to their estimates of the TA’s GDP. Infometrics’
adjustment takes into consideration each TA’s relative
Consistent with the tourism satellite
account definition, it included a wide
range of products and services,
ranging from adventure tourism,
culture and heritage, transport,
accommodation, to retail and hospitality.
A tourism-characteristic industry is one
where (1) at least 25 per cent of the
industry’s output is purchased by visitors;
or (2) industry output includes a tourism-
characteristic product. Uses tourism
satellite account definitions which include
proportions of holiday homes, air
passenger transport, travel agency
services, accommodation services, road,
rail and water passenger transport, motor
vehicle hire/rental, food and beverage
serving services, retail, gambling services,
education and training, other sport and
recreation services, libraries, archives, museums and other cultural services.
Generally consistent
across UNI regions.
However, proportions
need to be calibrated
to regional characteristics.

66
Broad sector Northland definition Auckland definition Bay of Plenty definition Waikato definition National definitions Comment
household equipment repair services, motor vehicle retailing and services.
exposures to industries and guest night shares
compared to the national economy. The estimates for
each TA are then benchmarked on the national total
from the TSA.
Minerals and
related processing
Iron ore, gold, other metal ore mining,
mineral sand mining; mineral exploration,
other mining support services, gravel and
sand quarrying, other construction
material mining, other non-metallic
mineral mining and quarrying. It also
includes manufacturing of: clay brick,
other ceramic product, cement and lime,
plaster and gypsum, ready-mixed
concrete, concrete product, other non-
metallic mineral product, glass and glass product and fertiliser.
N/A Includes coal, iron ore, gold ore, mineral sand, other
metal ore mining, gravel and sand quarrying, other
construction material mining, other non-metallic
mineral mining and quarrying, mineral exploration,
other construction material mining, other non-metallic
mineral mining and quarrying, mineral exploration,
other mining support services, fertiliser manufacturing,
glass and glass product manufacturing, clay brick
manufacturing, other ceramic product manufacturing,
cement and lime manufacturing, plaster and gypsum
product manufacturing, ready-mix concrete
manufacturing, concrete product manufacturing, other non-metallic mineral product manufacturing.
Mon-metallic mineral product
manufacturing, Metal ore mining,
mining and quarrying and mining support services
Petroleum and minerals included all
sectors in ANZSIC Code B, i.e. oil and gas
extraction, coal mining, metal ore mining,
construction material mining, petroleum
and mineral exploration, mineral support services.
Generally consistent
definitions across
Northland, Bay of Plenty and Waikato.
Creative Not part of the regional growth study. In
an economic impact report, creative
sector included arts, culture and heritage.
Comprised textile manufacturing, textile
product manufacturing, other wood
product manufacturing, printing, printing
support services, reproduction of
recorded media, glass and glass product
manufacturing, other ceramic product
manufacturing, jewellery and silverware
manufacturing, book and magazine
wholesaling, entertainment media
wholesaling and retailing, newspaper and
book retailing, newspaper publishing,
magazine and other periodical publishing,
book publishing, software publishing,
motion picture and video production and
distribution, motion picture exhibition,
post production services, music
publishing, radio broadcasting, free-to-air
television broadcasting, cable and other
subscription broadcasting, internet
publishing and broadcasting, libraries and
archives, video and other electronic
media rental and hiring, architectural
services, other specialised design
services, professional photographic
services, technical and vocational
education and training, sports and
physical recreation industries, arts
education, museum operation, performing
arts operation, creative artists, musicians,
writers and performers, performing arts venue operation.
Screen and digital content – includes software
publishing, motion picture and video
production, post production services and
other motion picture and video activities,
music publishing, music and other sound
recording activities, motion picture and video
distribution, motion picture exhibition, radio
broadcasting, television broadcasting, and
proportions of publishing, performing and creative arts segments.
Creative services – ceramic product
manufacturing, jewellery and silverware
manufacturing, newspaper publishing, book
publishing, motion picture and video
production, music publishing, radio and TV
broadcasting, internet publishing, data
processing, libraries, architectural services,
design services, advertising services, museum operation, performing arts
N/A N/A Screen industry survey includes:
Motion picture and video production,
Motion picture and video distribution,
Motion picture exhibition, Post-production
services and other motion picture and
video activities, Free-to-air television
broadcasting, cable and other subscription broadcasting, Other information services
Knowledge intensive services report
defines knowledge intensive services as
including software publishing, sound
recording and music publishing, internet
publishing and broad casting, photographic film processing.
Not surprisingly, was a
key sector for the
Auckland EDS but not for other regions.
ICT Digital content included software
Publishing, Motion Picture and Video
Production, Distribution and post
production services, Cable and other
Subscription Programming, Internet
Publishing and Broadcasting,
Telecommunications, Internet Access
Services, Data Processing and Web
Hosting Services, Electronic Information
ICT and digital content – ICT included: other
professional and scientific equipment
manufacturing, computer and electronic office
equipment manufacturing, communication
equipment manufacturing, other electronic
equipment manufacturing, electric cable and
wire manufacturing, professional and
scientific goods wholesaling, computer and
computer peripheral wholesaling,
telecommunication goods wholesaling, other
Included computer and electronic office equipment
manufacturing, communication equipment
manufacturing, other professional and scientific
equipment manufacturing, other electronic equipment
manufacturing, electric cable and wire manufacturing,
cable and other subscription Programming, Internet
Publishing and Broadcasting, wired
telecommunications network operation, other
telecommunications network operation, other
telecommunications services, Internet Access
N/A ICT sector report uses the OECD
definition, which includes
telecommunications, IT services and ICT
manufacturing, but excludes internet
publishing and broadcasting. The ICT
sector is defined as: goods and services
which enable the function of information
processing and communication by
electronic means including transmission
and display; and goods which use
Differences across
regions relate to
whether ICT includes
ICT manufacturing and
screen production industries.

67
Broad sector Northland definition Auckland definition Bay of Plenty definition Waikato definition National definitions Comment
Storage Service, Computer System Design and Related Services.
electrical and electronic goods wholesaling,
software publishing, wired
telecommunications network operation, other
telecommunication services, internet service
providers, data processing and web hosting
services, electronic information storage
services, computer system design and related
services, and electronic and precision equipment repair and maintenance.
Screen and digital content included
production and post-production activity, film
and video distribution, feature films, television
programming, gaming, animation and any
screen technology application or associated
software. Included proportions of toy, sporting
and recreational product manufacturing, toy
and sporting goods wholesaling, book and
magazine wholesaling, entertainment media
retailing, toy and game retailing, newspaper
and book retailing, newspaper publishing,
magazine and other periodical publishing,
book publishing, directory and mailing list
publishing, other publishing, software
publishing, motion picture and video
production, motion picture and video
distribution, motion picture exhibition, post-
production services, music publishing, music
and other sound recording activities, radio
broadcasting, free-to-air television
broadcasting, cable and other subscription
broadcasting, internet publishing and
broadcasting, internet service providers and
web search portals, data processing and web
hosting services, electronic information
storage services, libraries and archives, other
information services, video and other
electronic media rental and hiring, scientific
research services, architectural services,
surveying and mapping services, engineering
design and engineering consulting services,
other specialised design services, scientific
testing and analysis services, legal services,
accounting services, advertising services,
market research and statistical services,
management advice and related consulting
services, professional photographic services,
computer system design and related services,
museum operation, performing arts operation,
creative artists, musicians, writers and
performers, performing arts venue operation,
photographic film processing, other personal services.
Services, Data Processing and Web Hosting Services,
Electronic Information Storage Service, Computer System Design and Related Services.
electronic processing to detect, measure
and/or record physical phenomena or
control a physical process. Includes wired
telecommunications network operations,
other telecommunications network
operations, other telecommunications
services, internet service providers and
web search portals, telecommunication
goods wholesaling, computer system
design and related services, other goods
and equipment rental and hiring, software
publishing, data processing and web
hosting services, electronic information
storage services, electronic and precision
equipment repair and maintenance,
computer and electronic office equipment
manufacturing, electric cable and wire
manufacturing, other electronic equipment
manufacturing, communication equipment
manufacturing, other professional and scientific equipment manufacturing.
Specialised
manufacturing
and related
services
Other structural metal product
manufacturing, other sheet metal product
manufacturing, Structural steel
fabricating, sheet and other fabricated
metal product manufacturing, metal roof
and guttering manufacturing,
prefabricated metal building
manufacturing, fixed space heating,
cooling and ventilation equipment
manufacturing, metal coating and
Specialised manufacturing – includes
machinery and equipment, construction and engineering and advanced materials.
Machinery and equipment included
agricultural and construction machinery
manufacturing; fixed space heating, cooling,
ventilation equipment manufacturing; lifting
and material handling equipment
manufacturing; machine tool and parts
Split in three:
Metals and metal product manufacturing – structural
steel fabricating, prefabricated metal building
manufacturing, architectural aluminium product
manufacturing, metal roof and guttering
manufacturing, other structural metal product
manufacturing, boiler, tank and other heavy garage
metal container manufacturing, other metal container
manufacturing, other sheet metal product
Metals, machinery and equipment
manufacturing Included: polymer
and rubber product manufacturing;
iron, steel and aluminium
manufacturing; steel pipe and tube
manufacturing; silver, lead and zinc
smelting and refining; structural steel
fabricating; metal container
manufacturing; sheet metal product
manufacturing; metal coating and
High technology manufacturing report
uses OECD definition (which is based on
R&D expenditure), which includes sectors
within pharmaceutical and medicinal
manufacturing, aircraft manufacturing and
repair services, professional and scientific
manufacturing, computer and electronic
equipment manufacturing, basic chemical
and chemical product manufacturing,
Different definition
used across UNI
regions due to
specialisations in different regions.

68
Broad sector Northland definition Auckland definition Bay of Plenty definition Waikato definition National definitions Comment
finishing, rigid and semi-rigid polymer
product manufacturing, shipbuilding and
Repair Services, architectural aluminium
product manufacturing, Boatbuilding and
Repair Services, Aircraft Manufacturing
and Repair Services, Other Transport
Equipment Manufacturing, polymer
product manufacturing, machinery and
equipment manufacturing, mining and
construction machinery manufacturing,
agricultural machinery and equipment
manufacturing, other machinery
equipment repair and maintenance,
medical and surgical equipment
manufacturing, electronic equipment
manufacturing, electronic equipment
repair and maintenance, engineering design and consulting services.
manufacturing; mining and construction
machinery manufacturing; other electrical
equipment manufacturing; other electronic
equipment manufacturing; other professional
and scientific equipment manufacturing;
specialised industrial machinery and
equipment manufacturing; pumps and
compressors manufacturing; whiteware
appliance manufacturing; other domestic
appliance manufacturing, machine tools and
parts manufacturing; agricultural and
construction machinery manufacturing
wholesaling, other specialised industry
machinery and equipment wholesaling, other
electrical and electronic goods wholesaling,
other machinery and equipment wholesaling.
Advanced materials – includes adhesive
manufacturing; aluminium production, rolling,
drawing, extruding, smelting; copper, silver,
lead, zinc smelting and refining; glass and
glass product manufacturing; iron and steel
casting; non-ferrous metal casting and
manufacturing; non-ferrous metal product
manufacturing; basic polymer manufacturing;
other non-metallic product manufacturing;
other polymer product manufacturing; paint
and coatings manufacturing; polymer film and
sheet packaging material manufacturing;
polymer product manufacturing; reconstituted
wood product manufacturing; steel pipe and
tube manufacturing; synthetic resin and
rubber manufacturing; synthetic fibre textile
manufacturing; veneer and plywood manufacturing.
Also had a separate Marine industry –
includes shipbuilding and repair services,
boatbuilding and repair services, marine
equipment retailing, and proportions of natural
textile manufacturing, synthetic fibre textile
manufacturing rope, cordage and twine
manufacturing, cut and sewn textile product
manufacturing, clothing manufacturing, other
basic polymer product manufacturing, rigid
and semi-rigid polymer product
manufacturing, paint and coatings
manufacturing, other polymer product
manufacturing, other professional and
scientific equipment manufacturing, scenic
and sightseeing transport, other water
transport services, electronic and precision
equipment repair and maintenance, other repair and maintenance.
manufacturing, spring and wire product manufacturing,
nut, bolt, screw and rivet manufacturing, metal coating
and finishing, other fabricated metal product
manufacturing.
Machinery and equipment manufacturing – motor
vehicle manufacturing, automotive electrical
components manufacturing, other motor vehicle parts
manufacturing, railway rolling stock manufacturing and
repair services, aircraft manufacturing and repair
services, other transport equipment manufacturing,
photographic, optical and ophthalmic equipment
manufacturing, electric lighting equipment
manufacturing, other electrical equipment
manufacturing, whiteware appliance manufacturing,
other domestic appliance manufacturing, pumps and
compressors manufacturing, fixed space heating,
cooling and ventilation equipment manufacturing,
agricultural machinery and equipment manufacturing,
mining and construction machinery manufacturing,
machine tool and parts manufacturing, other
specialised machinery and equipment manufacturing,
lifting and handling equipment manufacturing, other machinery and equipment manufacturing
Marine - Boatbuilding and repair services, shipbuilding
and repair services.
finishing; medical equipment
manufacturing; boatbuilding; aircraft
manufacturing and repair; railway
rolling stock manufacturing and
repair; electrical equipment
manufacturing; electronic
manufacturing; agricultural
machinery and equipment
manufacturing; and lifting and
material handling equipment manufacturing
transport equipment manufacturing, machinery and equipment manufacturing
International
education
Proportions of Primary Education,
Secondary Education, Combined Primary
and Secondary Education Technical and
Vocational Education and Training,
Higher Education, Adult, Community and
Other Education nec, Educational Support Services.
International education – includes proportions
of the following segments: primary and
secondary education, technical and
vocational education and training, higher
education, adult and community and other education, educational support services.
Proportions of Primary Education, Secondary
Education, Combined Primary and Secondary
Education Technical and Vocational Education and
Training, Higher Education, Adult, Community and
Other Education nec, Educational Support Services.
Included all education rather than
focusing on international education.
Included adult community and other
education, preschool and school
education, tertiary education.
Education New Zealand
(ENZ) defines international students as
students who are non-residents of New Zealand who:
have entered into New Zealand
expressly with the intention to study, or
Generally consistent
definitions across UNI,
except for Waikato
which included all of
education. Proportions
of education industries
related to international
education alter year to year.

69
Broad sector Northland definition Auckland definition Bay of Plenty definition Waikato definition National definitions Comment
have enrolled in a New Zealand
provider offshore, where the
educational programme is delivered in-market.
It includes:
international PhD students
exchange students
NZ AID students
foreign research postgraduate students
offshore and onshore students.
Construction &
related services
All of construction services (residential,
non-residential, infrastructure, electrical,
site preparation, air conditioning, decorating, landscape etc.)
Construction and engineering (which was part
of a broader specialised manufacturing
industry) included air conditioning and heating
services, bricklaying services, carpentry
services, plumbing services, concreting,
electrical services, fire and security alarm
installation services, other building installation
services, glazing services, landscape
construction services, plastering and ceiling
services, roofing services, tiling and carpeting
services, painting and decorating services,
structural steel erection services, house
construction, other residential building
construction, non-residential building
construction, road and bridge construction,
other heavy and civil engineering
construction, land development and
subdivision, site preparation services, hire of
construction machinery with operator, other
construction services, architectural services,
surveying and mapping services, engineering design and engineering consulting services
House construction, other residential building
construction, non-residential building construction,
road and bridge construction, other heavy and civil
engineering construction, land development and
subdivision, site preparation services, concreting
services, bricklaying services, roofing services,
structural steel erection services, plumbing services,
electrical services, air conditioning and heating
services, fire and security alarm installation services,
plastering and ceiling services, carpentry services,
tiling and decorating services, glazing services,
painting and decorating services, glazing services,
landscape construction services, hire of construction machinery with operator, other construction services.
N/A Construction report included all of ANZSIC
Code E, i.e. residential building, non-
residential building, heavy and civil
engineering, land development and site
preparation, building structure services,
building installation services, building
completion services, other construction services.
Knowledge intensive services report
defines knowledge intensive services as
including architectural, engineering and
technical services.
Generally consistent
across Northland,
Auckland and Bay of
Plenty except for the
inclusion or exclusion
of related services
such as architecture and engineering.
Energy Included fossil fuel electricity generation,
hydro-electricity generation, other
electricity generation, electricity
transmission, electricity distribution, on-
selling electricity and electricity market operation, gas supply.
N/A Included fossil fuel electricity generation, hydro-
electricity generation, other electricity generation,
electricity transmission, electricity distribution, on-
selling electricity and electricity market operation, gas supply.
Electricity generation and supply.
Included electricity generation and
transmission, electricity distribution,
on selling electricity and electricity market operation.
N/A Definition consistent
across Northland,
Waikato and Bay of Plenty.
Transport and
logistics
Proportions (proportions that are not
captured in tourism) of road freight
transport, interurban and rural bus
transport, urban bus transport, taxi and
other road transport, rail freight transport,
rail passenger transport, water freight
transport, water passenger transport, air
and space transport, scenic and
sightseeing transport, pipeline transport,
other transport nec, postal services,
courier pick-up and delivery services,
stevedoring services, port and water
transport terminal operations, other water
transport support services, airport
operations and other air transport support
services, customs agency services,
freight forwarding services, other
transport support services, grain storage
Road freight transport, interurban and rural
bus transport, urban bus transport, taxi and
other road transport, rail freight transport, rail
passenger transport, water freight transport,
water passenger transport, air and space
transport, scenic and sightseeing transport,
pipeline transport, other transport nec, postal
services, courier pick-up and delivery
services, stevedoring services, port and water
transport terminal operations, other water
transport support services, airport operations
and other air transport support services,
customs agency services, freight forwarding
services, other transport support services,
grain storage services, other warehousing and storage services.
Proportions (proportions that are not captured in
tourism) of road freight transport, interurban and rural
bus transport, urban bus transport, taxi and other road
transport, rail freight transport, rail passenger
transport, water freight transport, water passenger
transport, air and space transport, scenic and
sightseeing transport, pipeline transport, other
transport nec, postal services, courier pick-up and
delivery services, stevedoring services, port and water
transport terminal operations, other water transport
support services, airport operations and other air
transport support services, customs agency services,
freight forwarding services, other transport support
services, grain storage services, other warehousing and storage services.
N/A N/A Consistent definitions
of transport across
Northland, Bay of Plenty and Auckland.

70
Broad sector Northland definition Auckland definition Bay of Plenty definition Waikato definition National definitions Comment
services, other warehousing and storage services.
Property
services
Residential Property Operators, Non-
Residential Property Operators, Real Estate Services.
N/A Includes residential property operators, non-residential
property operators, real estate services.
N/A N/A Not a focus sector for
UNI regions.
Financial
services
Banking, Building Society Operation,
Credit Union Operation, Other Depository
Financial Intermediation, Non-depository
Financing, Financial Asset Investing,
Insurance services, Superannuation
Funds, Financial Asset Broking Services,
Other Auxiliary Finance and Investment Services.
Business and financial services – includes
accounting services, advertising services,
architectural services, auxiliary insurance
services, banking, building and other
industrial cleaning services, building pest
control services, building society operation,
call centre operation, central banking,
corporate head office management services,
credit reporting and debt collection services,
computer system design and related services,
credit union operation, document preparation
services, employment placement and
recruitment services, engineering design and
engineering consulting services, financial
asset broking services, financial asset
investing services, general insurance, health
insurance, labour supply services, legal
services, life insurance, management advice
and related consultancy services, market
research and statistical services, non-
depository financing, office administration
services, other auxiliary finance and
investment services, other depository
financial intermediation, other professional,
scientific and technical services, other
specialised design services, packaging
services, professional photographic services,
scientific research services, superannuation funds, surveying and mapping services.
Banking, Building Society Operation, Credit Union
Operation, Other Depository Financial Intermediation,
Non-depository Financing, Financial Asset Investing,
Life insurance, health insurance, general insurance,
Superannuation Funds, Financial Asset Broking
Services, Other Auxiliary Finance and Investment Services, auxiliary insurance services.
N/A Knowledge intensive services report
defines knowledge intensive services as
including ANZSIC K financial and insurance services.
Was not a focus sector
in the previous UNI
studies or strategies
due to its domestic focus.
Health services Hospitals, Medical Services, Pathology
and Diagnostic Imaging Services, Dental
Services, Optometry and Optical
Dispensing, Physiotherapy Services,
Chiropractic and Osteopathic Services,
Other Allied Health Services, Ambulance
Services, Other Health Care Services,
Aged Care Residential Services, Other Residential Care Services
Focused on health technologies rather than
health services, although hospitals was included in biotechnology.
Hospitals, psychiatric hospitals, general practice
medical services, specialist medical services,
pathology and diagnostic imaging services, dental
services, optometry and optical dispensing,
physiotherapy services, chiropractic and osteopathic
services, other allied health services, ambulance
services, other health care services, aged care residential services, other residential care services.
N/A N/A Was not a key sector
in the previous UNI
studies or strategies
due to its domestic focus.
Business &
professional services
Architectural Services, Surveying and
Mapping Services, Other Specialised
Design Services, Scientific Testing and
Analysis Services, Legal Services,
Accounting Services, Advertising
Services, Market Research and Statistical
Services, Corporate Head Office
Management Services, Management
Advice and Other Consulting Services,
Veterinary Services, Professional
Photographic Services, Other
Professional, Scientific and Technical Services, Scientific Research Services.
Combined business and financial services,
which included: Business and financial
services – includes accounting services,
advertising services, architectural services,
auxiliary insurance services, banking, building
and other industrial cleaning services,
building pest control services, building society
operation, call centre operation, central
banking, corporate head office management
services, credit reporting and debt collection
services, computer system design and related
services, credit union operation, document
preparation services, employment placement
and recruitment services, engineering design
and engineering consulting services, financial
asset broking services, financial asset
investing services, general insurance, health
Scientific research services, architectural services,
surveying and mapping services, other specialised
design services, scientific testing and analysis
services, legal services, accounting services,
advertising services, market research and statistical
services, corporate head office management services,
management advice and other consulting services,
veterinary services, professional photographic
services, other professional, scientific and technical services.
N/A Knowledge intensive services report
defines knowledge intensive services as
including scientific research services,
architectural, engineering and technical
services, legal and accounting services,
advertising services, market research and
statistical services, management and other
consulting services, other professional,
scientific and technical services,
employment services, other administrative
services.
Was not a key sector
in the previous UNI
studies or strategies
due to its domestic
focus.

71
Broad sector Northland definition Auckland definition Bay of Plenty definition Waikato definition National definitions Comment
insurance, labour supply services, legal
services, life insurance, management advice
and related consultancy services, market
research and statistical services, non-
depository financing, office administration
services, other auxiliary finance and
investment services, other depository
financial intermediation, other professional,
scientific and technical services, other
specialised design services, packaging
services, professional photographic services,
scientific research services, superannuation funds, surveying and mapping services.
Retail Included in the definition of tourism. All of ANZSIC G – Retailing. Also included in
the definition of tourism.
All of ANZSIC G – Retailing. Also included in the
definition of tourism.
Included in the definition of tourism. Included in the definition of tourism. Not a focus sector in
its own right, but a
significant proportion is
included in Tourism
sector definition across UNI regions.

72
Table 23: Definitions for UNI sectors
UNI Sectors ANZSIC industries in the sector Comment
Agriculture and related processing
Dairy & related processing A016000 - Dairy Cattle Farming, C113100 - Milk and Cream Processing, C113200 - Ice Cream Manufacturing, C113300 -
Cheese and Other Dairy Product Manufacturing, A052900 - Other Agriculture and Fishing Support Services (part).
Generally consistent with definitions used in Bay of Plenty, Northland and Waikato. Not surprisingly, not a key
sector in Auckland Economic Development Strategy (EDS) or sector engagement framework. Packaging services
have been excluded as they have been included in business & professional services (and estimating the proportion of packaging for each of the many related sectors in the UNI is impractical and unlikely to be accurate).
Livestock farming and meat processing A014100 - Sheep Farming (Specialised), A014200 - Beef Cattle Farming (Specialised), A014300 - Beef Cattle Feedlots
(Specialised), A014400 - Sheep-Beef Cattle Farming, A014500 - Grain-Sheep and Grain-Beef Cattle Farming, A017100 -
Poultry Farming (Meat), A018000 - Deer Farming, A019200 - Pig Farming, A019900 - Other Livestock Farming nec, C111100
- Meat Processing, C111200 - Poultry Processing, C111300 - Cured Meat and Smallgoods Manufacturing, A052900 - Other Agriculture and Fishing Support Services (part).
The proposed definition is consistent with the Northland and Bay of Plenty definitions. The definition was narrower
in Waikato (focused on beef and sheep meat), while the industries were covered by a combination of agriculture
and food and beverage in Auckland. Packaging services have been excluded as they have been included in
business & professional services.
Food & beverage cultivation & processing A012100 - Mushroom Growing, A012200 - Vegetable Growing (Under Cover), A012300 - Vegetable Growing (Outdoors),
A013100 - Grape Growing, A013200 - Kiwifruit Growing, A013300 - Berry Fruit Growing, A013400 - Apple and Pear Growing,
A013500 - Stone Fruit Growing, A013600 - Citrus Fruit Growing, A013700 - Olive Growing, A013900 - Other Fruit and Tree
Nut Growing, A014600 - Rice Growing, A014900 - Other Grain Growing, A015100 - Sugar Cane Growing, A015900 - Other
Crop Growing nec, A017200 - Poultry Farming (Eggs), A019300 – Beekeeping, C114000 - Fruit and Vegetable Processing,
C115000 - Oil and Fat Manufacturing, C116100 - Grain Mill Product Manufacturing, C116200 - Cereal, Pasta and Baking Mix
Manufacturing, C117100 - Bread Manufacturing (Factory-based), C117200 - Cake and Pastry Manufacturing (Factory-based),
C117300 - Biscuit Manufacturing (Factory-based), C117400 - Bakery Product Manufacturing (Non-factory-based), C118100 -
Sugar Manufacturing, C118200 - Confectionery Manufacturing, C119100 - Potato Crisps and Corn Chips Manufacturing,
C119200 - Prepared Animal and Bird Feed Manufacturing, C119900 - Other Food Products Manufacturing nec, C121100 -
Soft Drink, Cordial and Syrup Manufacturing, C121200 - Beer Manufacturing, C121300 - Spirit Manufacturing, C121400 - Wine and Other Alcoholic Beverage Manufacturing, A052900 - Other Agriculture and Fishing Support Services (part).
Is similar to the Auckland definition. Bay of Plenty used a similar definition in the growth study but split out kiwifruit
and other food cultivation, and Northland used a variation (referred to as horticulture, arable and related
processing). Does not include wholesale activities, which have been included as part of the freight & logistics sector.
Forestry & wood processing A030100 – Forestry, A030200 – Logging, A051000 - Forestry Support Services, C141100 - Log Sawmilling, C141200 - Wood
Chipping, C141300 - Timber Resawing and Dressing, C149100 - Prefabricated Wooden Building Manufacturing, C149200 -
Wooden Structural Fittings and Components Manufacturing, C149300 - Veneer and Plywood Manufacturing, C149400 -
Reconstituted Wood Product Manufacturing, C149900 - Other Wood Product Manufacturing n.e.c., C151000 - Pulp, Paper
and Paperboard Manufacturing, C152100 - Corrugated Paperboard and Paperboard Container Manufacturing, C152200 -
Paper Bag and Sack Manufacturing, C152300 - Paper Stationery Manufacturing, C152400 - Sanitary Paper Product Manufacturing, C152900 - Other Converted Paper Product Manufacturing.
Consistent with definitions across Northland, Bay of Plenty and Waikato, apart from not including wooden furniture
manufacturing and upholstery (this was included in Northland). Furniture and upholstery but is more closely related
to creative. Not a key sector in Auckland EDS or Auckland sector engagement framework.
Aquaculture, fishing and related processing A020100 - Longline and Rack (Offshore) Aquaculture, A020200 - Caged (Offshore) Aquaculture, A020300 - Onshore
Aquaculture, A041100 - Rock Lobster and Crab Potting, A041200 - Prawn Fishing, A041300 - Line Fishing, A041400 - Fish
Trawling, Seining and Netting, A041900 - Other Fishing, C112000 - Seafood Processing, A052900 - Other Agriculture and
Fishing Support Services (part).
Generally consistent with Northland, BOP and Waikato definitions although we broaden the sector definition to
include fishing. We have excluded the part share of packaging services which are now captured in the business &
professional services sector. Similarly, we have excluded wholesale activities which are included in freight &
logistics.
Other agriculture production and services A011100 - Nursery Production (Under Cover), A011200 - Nursery Production (Outdoors), A011300 - Turf Growing, A011400 -
Floriculture Production (Under Cover), A011500 - Floriculture Production (Outdoors), A015200 - Cotton Growing’ A019100 -
Horse Farming, A042000 - Hunting and Trapping, A052100 - Cotton Ginning, A052200 - Shearing Services, L662000 - Farm Animals and Bloodstock Leasing, A052900 - Other Agriculture and Fishing Support Services (part).
Effectively the remainder of agricultural industries that are not clearly related to food production or wood
processing. Some of these were included in the horticulture and related processing sector in Northland.
Manufacturing and related processing
Chemical and pharmaceutical manufacturing C181200 - Basic Organic Chemical Manufacturing, C181300 - Basic Inorganic Chemical Manufacturing, C183200 - Pesticide
Manufacturing, C184100 - Human Pharmaceutical and Medicinal Product Manufacturing, C184200 - Veterinary
Pharmaceutical and Medicinal Product Manufacturing, C185100 - Cleaning Compound Manufacturing, C185200 - Cosmetic
and Toiletry Preparation Manufacturing, C189100 - Photographic Chemical Manufacturing, C189200 - Explosives Manufacturing, C189900 - Other Basic Chemical Product Manufacturing nec., C191500 - Adhesive Manufacturing.
A new grouping for completeness. Although there are similar inputs, there are quite different products and this
does not represent a coherent value chain per se. Pharmaceutical elements of this were included in health
technologies in Auckland. Chemical industries were included in petroleum and chemical manufacturing in Waikato. But it is unlikely to be a focus for UNI labour demand.
Machinery and electrical equipment
manufacturing and repair
C241100 - Photographic, Optical and Ophthalmic Equipment Manufacturing, C241200 - Medical and Surgical Equipment
Manufacturing, C243200 - Electric Lighting Equipment Manufacturing, C243900 - Other Electrical Equipment Manufacturing,
C244100 - Whiteware Appliance Manufacturing, C244900 - Other Domestic Appliance Manufacturing, C245100 - Pumps and
Compressors Manufacturing, C245200 - Fixed Space Heating, Cooling and Ventilation Equipment Manufacturing, C246100 -
Agricultural Machinery and Equipment Manufacturing, C246200 - Mining and Construction Machinery Manufacturing,
C246300 - Machine Tool and Parts Manufacturing, C246900 - Other Specialised Machinery and Equipment Manufacturing,
C249100 - Lifting and Material Handling Equipment Manufacturing, C249900 - Other Machinery and Equipment
Manufacturing nec, S942100 - Domestic Appliance Repair and Maintenance, S942200 - Electronic (except Domestic
Appliance) and Precision Equipment Repair and Maintenance, S942900 - Other Machinery and Equipment Repair and
Maintenance.
The proposed definition is consistent with (but slightly narrower than) the Bay of Plenty definition of machinery and
electrical equipment manufacturing in the growth study (part of specialised manufacturing, which also included transport equipment manufacturing. We consider the grouping of industries will have similar labour requirements.
Most of these industries were part of the specialised manufacturing sector in the Auckland EDS work and were
included in specialised manufacturing and related services in the Northland growth study. The Waikato EDS
combined machinery and materials industries into one grouping.
The sector value chain has been broadened to include downstream repair and maintenance industries.

73
UNI Sectors ANZSIC industries in the sector Comment
Metals and materials manufacturing C182100 - Synthetic Resin and Synthetic Rubber Manufacturing, C182900 - Other Basic Polymer Manufacturing, C191100 -
Polymer Film and Sheet Packaging Material Manufacturing, C191200 - Rigid and Semi Rigid Polymer Product Manufacturing,
C191300 - Polymer Foam Product Manufacturing, C191600 - Paint and Coatings Manufacturing, C191900 - Other Polymer
Product Manufacturing, C211000 - Iron Smelting and Steel Manufacturing, C212100 - Iron and Steel Casting, C212200 -
Steel Pipe and Tube Manufacturing, C213100 - Alumina Production, C213200 - Aluminium Smelting, C213300 - Copper,
Silver, Lead, and Zinc Smelting and Refining, C213900 - Other Basic Non-Ferrous Metal Manufacturing, C214100 - Non-
Ferrous Metal Casting, C214200 - Aluminium Rolling, Drawing, Extruding, C214900 - Other Basic Non-Ferrous Metal Product
Manufacturing, C221000 - Iron and Steel Forging, C223100 - Boiler, Tank and Other Heavy Gauge Metal Container
Manufacturing, C223900 - Other Metal Container Manufacturing, C224000 - Other Sheet Metal Product Manufacturing,
C229100 - Spring and Wire Product Manufacturing, C229200 - Nut, Bolt, Screw and Rivet Manufacturing, C229300 - Metal Coating and Finishing, C229900 - Other Fabricated Metal Product Manufacturing nec.
We consider the grouping of industries will have similar labour requirements and will contribute to similar
downstream sectors (e.g., marine, transport equipment, machinery equipment, and construction). This definition
includes a number of industries that were in the advanced materials and marine sectors in the Auckland EDS
sector work. All of these industries were included as part of the specialised manufacturing sector in the Bay of
Plenty growth study. Several of these industries were included in specialised manufacturing in the Northland
growth study and in metals, machinery and equipment manufacturing in the Waikato EDS. We consider this type of manufacturing is sufficiently distinctive from machinery manufacturing to be defined separately.
Transport equipment manufacturing and repair
C191400 - Tyre Manufacturing, C231100 - Motor Vehicle Manufacturing, C231200 - Motor Vehicle Body and Trailer
Manufacturing, C231300 - Automotive Electrical Components Manufacturing, C231900 - Other Motor Vehicle Parts
Manufacturing, C239300 - Railway Rolling Stock Manufacturing and Repair Services, C239400 - Aircraft Manufacturing and
Repair Services, C239900 - Other Transport Equipment Manufacturing n.e.c., S941100 - Automotive Electrical Services, S941200 - Automotive Body, Paint and Interior Repair, S941900 - Other Automotive Repair and Maintenance.
A new sector grouping to capture transport related manufacturing activities which have common labour demands.
Covers a number of industries that were captured in specialised manufacturing in Northland, machinery and
equipment manufacturing (Auckland), machinery and electrical equipment manufacturing (Bay of Plenty) and metals, machinery and equipment manufacturing (Waikato).
Marine manufacturing and repair C239100 - Shipbuilding and Repair Services, C239200 - Boatbuilding and Repair Services. Marine is narrowly defined and consistent with the Bay of Plenty definition. This sector was more broadly defined in
Auckland (which included a broader range of upstream industries such as textiles and materials). The marine
industries were grouped in specialised manufacturing and related services in Northland, and in metals and machinery in Waikato.
Other manufacturing C122000 - Cigarette and Tobacco Product Manufacturing, C131100 - Wool Scouring, C131200 - Natural Fibre Textile
Manufacturing, C131300 - Synthetic Fibre Textile Manufacturing, C132000 - Leather Tanning, Fur Dressing and Leather
Product Manufacturing, C133100 - Textile Floor Covering Manufacturing, C133200 - Rope, Cordage and Twine
Manufacturing, C133300 - Cut and Sewn Textile Product Manufacturing, C133400 - Textile Finishing and Other Textile
Product Manufacturing, C134000 - Knitted Product Manufacturing, C135100 - Clothing Manufacturing, C135200 - Footwear
Manufacturing, C192000 - Natural Rubber Product Manufacturing, C251100 - Wooden Furniture and Upholstered Seat
Manufacturing, C251200 - Metal Furniture Manufacturing, C251300 - Mattress Manufacturing, C251900 - Other Furniture Manufacturing, C259200 - Toy, Sporting and Recreational Product Manufacturing, C259900 - Other Manufacturing nec.
Effectively the remaining manufacturing industries. None of these is likely to be particularly important in terms of
labour demand in the UNI.
Mining and related processing
Minerals and related processing B060000 - Coal Mining, B080100 - Iron Ore Mining, B080200 - Bauxite Mining, B080300 - Copper Ore Mining, B080400 -
Gold Ore Mining, B080500 - Mineral Sand Mining, B080600 - Nickel Ore Mining, B080700 - Silver-Lead-Zinc Ore Mining,
B080900 - Other Metal Ore Mining, B091100 - Gravel and Sand Quarrying, B091900 - Other Construction Material Mining,
B099000 - Other Non-Metallic Mineral Mining and Quarrying, B101200 - Mineral Exploration, B109000 - Other Mining Support
Services, C183100 - Fertiliser Manufacturing, C201000 - Glass and Glass Product Manufacturing, C202900 - Other Ceramic
Product Manufacturing, C209000 - Other Non-Metallic Mineral Product Manufacturing, C202100 - Clay Brick Manufacturing,
C203100 - Cement and Lime Manufacturing, C203200 - Plaster and Gypsum Product Manufacturing, C203300 - Ready-Mixed Concrete Manufacturing, C203400 - Concrete Product Manufacturing.
Minerals and related processing as defined is consistent with the mining and quarrying sector (Waikato EDS) and
Minerals and related processing sector (BOP and Northland growth studies) definitions.
Petroleum and related processing B070000 - Oil and Gas Extraction, B101100 - Petroleum Exploration, C170100 - Petroleum Refining and Petroleum Fuels
Manufacturing, C170900 - Other Petroleum and Coal Product Manufacturing, C181100 - Industrial Gases Manufacturing.
This group is consistent with the petroleum and related processing sector in the Northland growth study. The
industries were captured in a broader petroleum and chemical sector in the Waikato EDS but, not surprisingly, were not a focus in the Bay of Plenty and Auckland strategies.
Services
Construction & related services E301100 - House Construction, E301900 - Other Residential Building Construction, E302000 - Non-Residential Building
Construction, E310100 - Road and Bridge Construction, E310900 - Other Heavy and Civil Engineering Construction,
E321100 - Land Development and Subdivision, E321200 - Site Preparation Services, E322100 - Concreting Services,
E322200 - Bricklaying Services, E322300 - Roofing Services, E322400 - Structural Steel Erection Services, E323100 -
Plumbing Services, E323200 - Electrical Services, E323300 - Air Conditioning and Heating Services, E323400 - Fire and
Security Alarm Installation Services, E323900 - Other Building Installation Services, E324100 - Plastering and Ceiling
Services, E324200 - Carpentry Services, E324300 - Tiling and Carpeting Services, E324400 - Painting and Decorating
Services, E324500 - Glazing Services, E329100 - Landscape Construction Services, E329200 - Hire of Construction
Machinery with Operator, E329900 - Other Construction Services nec, L663100 - Heavy Machinery and Scaffolding Rental
and Hiring, M692100 - Architectural Services, M692200 - Surveying and Mapping Services, M692300 - Engineering Design
and Engineering Consulting Services.
Consistent with the Auckland EDS/sector engagement framework definition and expands on the construction &
construction-related services sector as identified for Bay of Plenty and Northland by included related services (e.g.,
architecture, surveying, engineering design). This is consistent with an approach used by MBIE on a project examining immigration and labour market trends.
Health services
Residential care
Q840100 - Hospitals (except Psychiatric Hospitals), Q840200 - Psychiatric Hospitals, Q851100 - General Practice Medical
Services, Q851200 - Specialist Medical Services, Q852000 - Pathology and Diagnostic Imaging Services, Q853100 - Dental
Services, Q853200 - Optometry and Optical Dispensing, Q853300 - Physiotherapy Services, Q853400 - Chiropractic and
Health services is consistent with the groupings for Bay of Plenty and Northland. Health services was not identified
for Auckland per se (as there was a focus on health tech) or Waikato, although hospitals was included in the
definition of the biotech sector in the Auckland EDS. This grouping has a similar range of occupational requirements.

74
UNI Sectors ANZSIC industries in the sector Comment
Osteopathic Services, Q853900 - Other Allied Health Services, Q859100 - Ambulance Services, Q859900 - Other Health Care Services nec
Q860100 - Aged Care Residential Services, Q860900 - Other Residential Care Services.
Creative services C162000 - Reproduction of Recorded Media, C259100 - Jewellery and Silverware Manufacturing, J541100 - Newspaper
Publishing, J541200 - Magazine and Other Periodical Publishing, J541300 - Book Publishing, J541900 - Other Publishing
(except Software, Music and Internet), J551100 - Motion Picture and Video Production, J551200 - Motion Picture and Video
Distribution, J551300 - Motion Picture Exhibition, J551400 - Postproduction Services and Other Motion Picture and Video
Activities, J552100 - Music Publishing, J552200 - Music and Other Sound Recording Activities, J561000 - Radio
Broadcasting, J562100 - Free-to-Air Television Broadcasting, J562200 - Cable and Other Subscription Programming,
J570000 - Internet Publishing and Broadcasting, M692400 - Other Specialised Design Services, M699100 - Professional
Photographic Services, R891000 - Museum Operation, R900100 - Performing Arts Operation, R900200 - Creative Artists, Musicians, Writers and Performers, R900300 - Performing Arts Venue Operation.
Relatively consistent with the creative sector as defined for Auckland, although excludes some services such as
architectural, advertising, software publishing and computer system design and related services (these have been
included in this construction, business and ICT industries respectively). The redefined sector also includes some
additional industries that were previously classified as business & professional services or in digital content in the
Auckland, Bay of Plenty and Northland analysis.
Business & professional services C161100 – Printing, C161200 - Printing Support Services, J541400 - Directory and Mailing List Publishing, L664000 - Non-
Financial Intangible Assets (except Copyrights) Leasing, M691000 - Scientific Research Services, M692500 - Scientific
Testing and Analysis Services, M693100 - Legal Services, M693200 - Accounting Services, M694000 - Advertising Services,
M695000 - Market Research and Statistical Services, M696100 - Corporate Head Office Management Services, M696200 -
Management Advice and Other Consulting Services, M697000 - Veterinary Services, M699900 - Other Professional,
Scientific and Technical Services n.e.c., N721100 - Employment Placement and Recruitment Services, N721200 - Labour
Supply Services, N729100 - Office Administrative Services, N729200 - Document Preparation Services, N729300 - Credit
Reporting and Debt Collection Services, N729400 - Call Centre Operation, N729900 - Other Administrative Services n.e.c.,
N731100 - Buildings Cleaning Services, N731200 - Buildings Pest Control Services, N731300 - Gardening Services, N732000 - Packaging Services.
Broader than the business & professional services identified for Bay of Plenty and Northland as we have included
printing, business publishing and leasing services, employment and administration services, but a subset of the
business and financial services sector identified for Auckland under the EDS. This sector wasn’t analysed separately for the Waikato EDS.
Packaging services was previously split across a number of sectors for Bay of Plenty and Northland studies.
ICT C241900 - Other Professional and Scientific Equipment Manufacturing, C242100 - Computer and Electronic Office Equipment
Manufacturing, C242200 - Communications Equipment Manufacturing, C242900 - Other Electronic Equipment Manufacturing,
C243100 - Electric Cable and Wire Manufacturing, J542000 - Software Publishing, J580100 - Wired Telecommunications
Network Operation, J580200 - Other Telecommunications Network Operation, J580900 - Other Telecommunications
Services, J591000 - Internet Access Services, J592100 - Data Processing and Web Hosting Services, J592200 - Electronic
Information Storage Services, J602000 - Other Information Services, M700000 - Computer Systems Design and Related Services.
Consistent with the BOP definition. Expands upon the Northland definition by including ICT manufacturing. The
Auckland EDS included screen related industries in a broader sector grouping of ICT and digital content.
The revised grouping is relatively consistent with the MBIE/OECD definition for ICT, although that definition
included: electronic and precision equipment repair and maintenance (now under machinery and electrical
equipment manufacturing and repair in our proposed definition); other goods and equipment rental and hiring nec.
(under personal services and tourism); and computer and computer peripherals wholesaling (under Freight & logistics).
Financial services K622100 – Banking, K622200 - Building Society Operation, K622300 - Credit Union Operation, K622900 - Other Depository
Financial Intermediation, K623000 - Non-depository Financing, K624000 - Financial Asset Investing, K631000 - Life
Insurance, K632100 - Health Insurance, K632200 - General Insurance, K633000 - Superannuation Funds, K641100 -
Financial Asset Broking Services, K641900 - Other Auxiliary Finance and Investment Services, K642000 - Auxiliary Insurance Services.
Consistent with the definition of the financial services sector in Bay of Plenty and Northland studies. Was part of
the larger business and financial services sector in the Auckland analysis. Was not identified as a key sector in previous Waikato work.
Property services L671100 - Residential Property Operators, L671200 - Non-Residential Property Operators, L672000 - Real Estate Services. This grouping is consistent with the property services sector identified in Bay of Plenty and Northland. The sector
was not considered in Auckland or Waikato and has not been a focus sector in regional research.
International education P802100 - Primary Education (part), P802200 - Secondary Education (part), P802300 - Combined Primary and Secondary
Education (part), P810100 - Technical and Vocational Education and Training (part), P810200 - Higher Education (part),
P821100 - Sports and Physical Recreation Instruction (part), P821200 - Arts Education (part), P821900 - Adult, Community
and Other Education nec (part), P822000 - Educational Support Services (part).
Grouping is consistent with the definition of the sector used in all UNI regions. The international education sector is
a portion of the broader education sector that can be attributed to international students, the base assumption
being that the ratio of students to employment for international students is the same as it is for domestic students.
The share of international students in primary, secondary and tertiary education is determined from the Ministry of Education student datasets.
Freight & logistics I461000 - Road Freight Transport, I471000 - Rail Freight Transport, I481000 - Water Freight Transport, I490000 - Air and
Space Transport (part not in hospitality), I502100 - Pipeline Transport, I502900 - Other Transport nec, I510100 - Postal
Services, I510200 - Courier Pick-up and Delivery Services, I521100 - Stevedoring Services, I521200 - Port and Water
Transport Terminal Operations, I521900 - Other Water Transport Support Services, I522000 - Airport Operations and Other
Air Transport Support Services, I529100 - Customs Agency Services (part not in hospitality), I529200 - Freight Forwarding
Services, I529900 - Other Transport Support Services nec., I530100 - Grain Storage Services, I530900 - Other Warehousing
and Storage Services, F331100 - Wool Wholesaling, F331200 - Cereal Grain Wholesaling, F331900 - Other Agricultural
Product Wholesaling, F332100 - Petroleum Product Wholesaling, F332200 - Metal and Mineral Wholesaling, F332300 -
Industrial and Agricultural Chemical Product Wholesaling, F333100 - Timber Wholesaling, F333200 - Plumbing Goods
Wholesaling, F333900 - Other Hardware Goods WholesalingF341100 - Agricultural and Construction Machinery Wholesaling,
F341900 - Other Specialised Industrial Machinery and Equipment Wholesaling, F349100 - Professional and Scientific Goods
Wholesaling, F349200 - Computer and Computer Peripherals Wholesaling, F349300 - Telecommunication Goods
Wholesaling, F349400 - Other Electrical and Electronic Goods Wholesaling, F349900 - Other Machinery and Equipment
Wholesaling nec, F350100 - Car Wholesaling, F350200 - Commercial Vehicle Wholesaling, F350300 - Trailer and Other
Motor Vehicle Wholesaling, F350400 - Motor Vehicle New Part Wholesaling, F350500 - Motor Vehicle Dismantling and Used
Part Wholesaling, F360100 - General Line Groceries Wholesaling, F360200 - Meat, Poultry and Smallgoods Wholesaling,
Northland, Auckland, Bay of Plenty studies included a broad transport sector. Several other transport industries
that are not included in our proposed definition (e.g., passenger, scenic transport) are captured in the definition of the tourism sector.
A focus on freight rather than broader transport is consistent with current and expected labour demands.
Wholesale activity has been included due to the consistency of labour requirements with freight transport and close links with the value chain (e.g., handling and storage of freight).

75
UNI Sectors ANZSIC industries in the sector Comment
F360300 - Dairy Produce Wholesaling, F360400 - Fish and Seafood Wholesaling, F360500 - Fruit and Vegetable
Wholesaling, F360600 - Liquor and Tobacco Product Wholesaling, F360900 - Other Grocery Wholesaling, F371100 - Textile
Product Wholesaling, F371200 - Clothing and Footwear Wholesaling, F372000 - Pharmaceutical and Toiletry Goods
Wholesaling, F373100 - Furniture and Floor Coverings Wholesaling, F373200 - Jewellery and Watch Wholesaling, F373300 -
Kitchen and Dining Ware Wholesaling, F373400 - Toy and Sporting Goods Wholesaling, F373500 - Book and Magazine
Wholesaling, F373600 - Paper Product Wholesaling, F373900 - Other Goods Wholesaling nec, F380000 - Commission Based Wholesaling.
Passenger transport I462100 - Interurban and Rural Bus Transport, I462200 - Urban Bus Transport (Including Tramway), I462300 - Taxi and Other
Road Transport, I472000 - Rail Passenger Transport, I482000 - Water Passenger Transport,
Included for completeness. Will not be a focus sector in its own right as many of the industries are captured under
tourism (see comment under tourism).
Personal services L661900 - Other Motor Vehicle and Transport Equipment Rental and Hiring, L663200 - Video and Other Electronic Media
Rental, L663900 - Other Goods and Equipment Rental and Hiring n.e.c,P801000 - Preschool Education (part not in tourism),
P802400 - Special School Education, Q871000 - Child Care Services, Q879000 - Other Social Assistance Services, S949100
- Clothing and Footwear Repair, S949900 - Other Repair and Maintenance nec, S951200 - Diet and Weight Reduction Centre
Operation, S952000 - Funeral, Crematorium and Cemetery Services, S953200 - Photographic Film Processing, S953300 -
Parking Services, S953400 - Brothel Keeping and Prostitution Services, S953900 - Other Personal Services nec, S954000 -
Religious Services, S955100 - Business and Professional Association Services, S955200 - Labour Association Services,
S955900 - Other Interest Group Services nec, S960100 - Private Households Employing Staff, S960200 - Undifferentiated
Goods-Producing Activities of Private Households for Own Use, S960300 - Undifferentiated Service-Producing Activities of
Private Households for Own Use, L661100 - Passenger Car Rental and Hiring, N722000 - Travel Agency and Tour
Arrangement Services, S951100 - Hairdressing and Beauty Services, S953100 - Laundry and Dry-Cleaning Services.
Included for completeness. Will not be a focus sector in its own right as many of the industries are captured under
tourism (see comment under tourism). Three of these industries were included in Auckland EDS industries –
photographic film processing and other personal services nec (were in screen and creative digital content) and other repair and maintenance nec (was in Marine).
Retail G391100 - Car Retailing, G391200 - Motor Cycle Retailing, G391300 - Trailer and Other Motor Vehicle Retailing, G392100 -
Motor Vehicle Parts Retailing, G392200 - Tyre Retailing, G421100 - Furniture Retailing, G421200 - Floor Coverings Retailing,
G421300 - Houseware Retailing, G421400 - Manchester and Other Textile Goods Retailing, G422100 - Electrical, Electronic
and Gas Appliance Retailing, G422200 - Computer and Computer Peripherals Retailing, G422900 - Other Electrical and
Electronic Goods Retailing, G423100 - Hardware and Building Supplies Retailing, G423200 - Garden Supplies Retailing,
G424500 - Marine Equipment Retailing, G431000 - Non Store Retailing, G432000 - Retail Commission Based Buying and/or
Selling, G400000 - Fuel Retailing, G411000 - Supermarket and Grocery Stores, G412100 - Fresh Meat, Fish and Poultry
Retailing, G412200 - Fruit and Vegetable Retailing, G412300 - Liquor Retailing, G412900 - Other Specialised Food Retailing,
G424100 - Sport and Camping Equipment Retailing, G424200 - Entertainment Media Retailing, G424300 - Toy and Game
Retailing, G424400 - Newspaper and Book Retailing, G425100 - Clothing Retailing, G425200 - Footwear Retailing, G425300
- Watch and Jewellery Retailing, G425900 - Other Personal Accessories Retailing, G426000 - Department Stores, G427100 -
Pharmaceutical, Cosmetic and Toiletry Goods Retailing, G427200 - Stationery Goods Retailing, G427300 - Antique and Used Goods Retailing, G427400 - Flower Retailing, G427900 - Other Store-Based Retailing nec.
Not a focus sector in any previous regional strategy or study beyond its contribution to tourism. Will not be a focus
sector in its own right as many of these industries are already captured in tourism (see comment under tourism)
Hospitality Accommodation, H451100 - Cafes and restaurants, H451200 - Takeaway food services, H452000 – Pubs, taverns and bars,
H453000 - Clubs (hospitality)
Included for completeness. Will not be a focus sector in its own right as these industries are already captured in
tourism (see comment under tourism)
Recreational and cultural services J601000 - Libraries and Archives, R891000 – Museum operation, R892100 – Zoological and botanic gardens operation,
R892200 – Nature reserves and conservation parks operation, R900100 – Performing arts operation, R900200 – Creative
artists, musicians, writers and performers, R900300 – Performing arts venue operation, R911100 – health and fitness centres
and gymnasia operation, R911200 – Sport and Physical recreation clubs and sports professionals, R911300 – Sports and
physical recreation venues, grounds and facilities, R911400 – Sport and physical recreation administrative service, R912100
– Horse and dog racing administration and track operation, R912900 – Other horse and dog racing activities, R913100 –
Amusement parks and centres operation, R913900 – Amusement and other recreation activities nec, R920100 – Casino operation, R920200 – Lottery operation, R920900 – Other gambling activities
Included for completeness. Will not be a focus sector in its own right as these industries are already captured in
tourism (see comment under tourism)
Government K621000 - Central Banking, O751000 - Central Government Administration, O752000 - State Government Administration,
O753000 - Local Government Administration, O754000 – Justice, O755100 - Domestic Government Representation,
O755200 - Foreign Government Representation, O760000 – Defence, O771100 - Police Services, O771200 - Investigation
and Security Services, O771300 - Fire Protection and Other Emergency Services (except Ambulance Services), O771400 - Correctional and Detention Services, O771900 - Other Public Order and Safety Services, O772000 - Regulatory Services.
Government is not a key sector in the previous work in any of the UNI regions. Included for completeness.
Tourism Predominantly proportions of: H440000 - Accommodation, H451100 - Cafes and restaurants, H451200 - Takeaway food
services, H452000 - Pubs, taverns and bars, H453000 - Clubs (hospitality), I462100 – Interurban and rural bus transport,
I462200 Urban bus transport, I462300 - Taxi and other road passenger transport, I472000 - Rail passenger transport, I48200
- Water passenger transport, I490000 - Air and space transport, I50100 – Scenic and sightseeing transport, I502100 –
Pipeline transport, I502900 - Other transport nec, I529100 – Custom agency services, I529900 - Other transport support
services nec, N722000 – Travel agency and tour arrangement services, L661100 – Passenger car rental and hiring, L661900
– Other motor vehicle and transport equipment rental and hiring, L663900 – Other goods and equipment rental and hiring
nec, R891000 – Museum operation, R892100 – Zoological and botanic gardens operation, R892200 – Nature reserves and
conservation parks operation, R900100 – Performing arts operation, R900200 – Creative artists, musicians, writers and
performers, R900300 – Performing arts venue operation, R911100 – health and fitness centres and gymnasia operation,
Consistent with the definition used across UNI regions. Tourism is calculated using a methodology developed by
Infometrics – this uses Statistics New Zealand Tourism Satellite Account (TSA) adjusted using regional data on
guest nights and visitor expenditure data from MBIE to account for tourism intensity in different regions. The
adjustment takes into consideration each region’s relative exposures to industries and guest night shares
compared to the national economy. The estimates for each region are then benchmarked on the national total from
the TSA.

76
UNI Sectors ANZSIC industries in the sector Comment
R911200 – Sport and Physical recreation clubs and sports professionals, R911300 – Sports and physical recreation venues,
grounds and facilities, R911400 – Sport and physical recreation administrative service, R912100 – Horse and dog racing
administration and track operation, R912900 – Other horse and dog racing activities, R913100 – Amusement parks and
centres operation, R913900 – Amusement and other recreation activities nec, R920100 – Casino operation, R920200 –
Lottery operation, R920900 – Other gambling activities, G391100 – Car retailing, G391200 – Motor cycle retailing, G392200 –
Tyre retailing, G400000 – Fuel retailing, G411000 - Supermarket and grocery stores, G412100 Fruit and vegetable retailing,
G412300 – Liquor retailing, G412900 – Other specialised food retailing, G421100 – Furniture retailing, G421200 – Floor
coverings retailing, G421300 – Houseware retailing, G421400 – Manchester and other textile goods retailing, G422100 –
Electrical, electronic and gas appliance retailing, G422200 – Computer and computer peripherals retailing, G422900 – Other
electrical and electronic goods retailing, G423100 – Hardware and building suppliers retailing, G423200 – Garden supplies
retailing, G424100 – Sport and camping equipment retailing, G424200 – Entertainment media retailing, G424300 – Toy and
game retailing, G424400 Newspaper and book retailing, G424500 Marine equipment retailing, G425100 Clothing retailing,
G425200 – Footwear retailing, G425300 – Watch and jewellery retailing, G425900 – Other personal accessories retailing,
G426000 – Department stores, G427100 – Pharmaceutical, cosmetic and toiletry goods retailing, G427200 – Stationery
goods retailing, G427300 – Antique and used goods retailing, G427400 – Flower retailing, G427900 Other store based
retailing nec, G431000 Non store retailing, G432000 – Retail commission based buying and/or selling, P801000 – Preschool
education, P802100 - Primary Education, P802200 - Secondary Education, P802300 - Combined Primary and Secondary
Education, P802400 – Special school education, P810100 - Technical and Vocational Education and Training, P810200 -
Higher Education, P821100 - Sports and Physical Recreation Instruction, P821200 - Arts Education, P821900 - Adult,
Community and Other Education nec, P822000 - Educational Support Services. Tourism also includes a very small proportion of all remaining sectors.
Infrastructure
Energy D261100 - Fossil Fuel Electricity Generation, D261200 - Hydro-electricity Generation, D261900 - Other Electricity Generation,
D262000 - Electricity Transmission, D263000 - Electricity Distribution, D264000 - On Selling Electricity and Electricity Market Operation, D270000 - Gas Supply.
Consistent with the energy sector as defined in Bay of Plenty, Northland and Waikato studies and strategies.
Water and waste D281100 - Water Supply, D281200 - Sewerage and Drainage Services, D291100 - Solid Waste Collection Services, D291900
- Other Waste Collection Services, D292100 - Waste Treatment and Disposal Services, D292200 - Waste Remediation and
Materials Recovery Services.
Effectively the remainder of the infrastructure industries that were not considered in any of the previous regional
studies or strategies.
Other LL21 - Owner Occupied, T994000 - Don’t Know, T995000 - Refused to Answer, T997000 - Response Unidentifiable,
T998000 - Response Outside Scope, T999999 - Not Stated, UU11 – Residual.
Source: MartinJenkins, Infometrics

77
Appendix 2: Sector Analysis
Table 24: Sector analysis for the Northland region
In Northland, the sectors with the greatest number of highly ranked key indicators (light to dark green in the table) are freight & logistics, forestry & wood processing, health services (and residential care), dairy & related processing, food &
beverage cultivation & processing, and petroleum and related processing.
Rank Filled jobs Filled jobs Filled jobs RankLabour
productivityRank Rank
2009-2014,
%pa change
NZ 2009 -
2014
%pa
change
GDP Emp Lab prod GDP LQ Emp LQ GDP Emp Lab prod 2014 Exports GDP Emp Exports2013 2003-2013,
%pa change
Rank
2013
Agriculture - other 23 30 592 499 481 26 48,134 29 1.4 1.5 -1.2% -0.7% 0.9% -0.1% -0.2% 1.4% -0.7% 2.1% 33 13 3.0% -0.4% -1.3% -1.8% 36,712 4.2% 31
Aquaculture, fishing & related processing 26 29 490 447 391 28 66,188 19 1.4 1.5 -2.7% -2.2% -0.5% 0.4% 0.1% -3.2% -2.7% -0.6% 58 7 -1.7% -2.5% -1.8% 0.5% 51,763 3.1% 20
Business & professional services 218 12 3,545 4,559 4,391 5 49,729 28 0.5 0.6 1.8% 2.2% -0.4% 0.6% 1.2% 0.1% -0.7% 0.8% 19 19 -3.3% 1.8% 1.5% 0.5% 56,306 3.6% 15
Chemical & pharmaceutical manufacturing 18 33 70 53 53 34 339,622 2 0.6 0.4 -1.9% -2.7% 0.8% -1.9% -2.3% 2.0% 0.2% 1.8% 5 24 -5.1% 0.7% 0.2% 0.1% 64,530 3.2% 8
Construction & related services 383 2 5,641 7,857 6,379 2 59,970 21 0.9 1.0 1.8% 1.2% 0.5% -0.9% -1.0% -0.9% -4.1% 3.3% 7 22 -3.5% 3.5% 2.8% 1.9% 57,759 4.1% 13
Creative 40 26 641 800 778 22 51,543 26 0.5 0.6 2.2% 2.0% 0.2% 1.1% 1.7% 1.4% -0.6% 2.0% 16 20 2.0% 1.7% 0.8% 2.4% 53,419 3.7% 19
Dairy & related processing 369 3 3,868 3,391 3,244 9 113,711 10 2.1 2.1 -1.5% -1.7% 0.2% -2.1% -2.3% -0.4% -0.9% 0.5% 1,375 1 4.0% 1.3% 1.1% 9.6% 47,573 4.3% 23
Energy 142 15 323 388 486 25 293,307 3 1.0 2.4 0.4% 4.2% -3.7% -0.5% -1.2% -0.6% 4.6% -4.9% 0 27 0.0% 1.6% 6.0% 0.0% 87,366 3.3% 2
Financial services 129 17 772 992 958 17 134,500 7 0.4 0.5 2.7% 2.2% 0.5% 0.0% 0.1% -0.9% -0.7% -0.2% 8 21 7.0% 3.4% 2.6% 10.4% 83,177 4.2% 4
Food & beverage cultivation & processing 133 16 1,843 1,590 1,718 14 77,152 17 0.9 1.0 -0.6% -0.7% 0.1% -0.6% -0.6% 2.5% 1.6% 0.9% 179 5 7.9% 0.7% 0.4% 3.2% 45,174 4.0% 25
Forestry & wood processing 237 9 2,427 2,063 2,169 13 109,281 11 2.3 2.4 1.3% -1.1% 2.4% 1.2% 1.7% 4.0% 1.0% 2.9% 393 2 5.2% 0.8% -2.3% 8.4% 54,538 3.4% 17
Freight & Logistics 314 4 3,640 3,870 3,865 7 81,170 16 0.6 0.7 2.1% 0.6% 1.5% 0.7% 0.6% 2.3% 0.0% 2.3% 46 9 2.9% 2.1% 0.5% 0.4% 60,945 3.8% 10
Government 180 13 1,749 2,620 2,708 11 66,605 18 0.7 0.9 5.6% 4.5% 1.1% 2.0% 1.7% 0.3% 0.7% -0.4% 4 25 3.5% 4.3% 3.3% 4.1% 67,348 3.8% 7
Health Services 268 6 4,104 4,528 5,188 4 51,683 25 1.2 1.3 3.0% 2.4% 0.7% 0.5% 0.5% 2.6% 2.8% -0.1% 0 27 0.0% 3.3% 2.4% 0.0% 56,933 5.0% 14
Hospitality 112 19 3,772 4,192 3,836 8 29,226 34 0.9 1.0 0.6% 0.2% 0.4% -0.7% -0.8% -0.6% -1.8% 1.1% 70 6 -1.9% 2.0% 1.5% 0.7% as part of tourism 26,733 3.8% 34
ICT 19 31 171 230 232 32 82,213 15 0.1 0.1 1.7% 3.1% -1.4% -2.1% -0.4% 1.9% 0.2% 1.8% 3 26 -2.6% 4.6% 4.1% 0.7% 85,284 3.2% 3
International Education 11 34 157 213 232 32 45,571 31 0.7 0.8 2.5% 3.9% -1.4% 4.3% 4.2% 0.9% 1.7% -0.7% 0 27 -5.7% -1.1% 0.3% -6.8% 61,868 4.0% 9
Other education 255 8 4,763 5,120 5,536 3 46,134 30 1.0 1.2 0.1% 1.5% -1.4% 0.7% 0.6% 0.9% 1.6% -0.7% 0 27 0.0% 0.1% 1.5% 0.0% 54,577 3.6% 16
Livestock farming & meat processing 233 10 3,100 2,739 2,523 12 92,473 13 1.6 1.4 -2.1% -2.0% 0.0% -0.3% -0.2% -1.9% -1.6% -0.3% 301 4 -1.6% -1.1% -1.3% 0.7% 44,356 3.8% 26
Machinery & Electrical equipment manufacturing & repair 101 21 757 846 779 21 130,226 9 1.2 0.8 0.7% 0.3% 0.4% 0.9% 0.8% -1.1% -1.6% 0.5% 58 7 -3.3% 0.5% 0.0% -3.5% 60,452 3.9% 11
Manufacturing - other 40 26 502 442 396 27 101,831 12 1.1 0.6 -0.4% -2.3% 2.0% 3.1% 3.6% 1.1% -2.2% 3.3% 34 11 10.3% -2.7% -5.2% 1.1% 46,205 3.7% 24
Marine 43 25 477 540 317 30 134,331 8 5.3 3.1 -3.4% -4.0% 0.7% 0.9% 0.7% -8.3% -10.1% 2.0% 24 17 -8.8% -3.6% -4.2% -10.3% 69,570 3.9% 6
Metals & materials manufacturing 107 20 737 815 789 19 135,253 6 0.9 0.7 -1.8% 0.7% -2.4% 2.4% 2.4% 0.1% -0.6% 0.7% 36 10 -0.3% -3.4% -1.2% -3.8% 59,499 3.6% 12
Minerals & related processing 114 18 658 755 664 23 171,049 5 1.0 1.6 0.4% 0.1% 0.3% -1.9% -1.6% -1.0% -2.5% 1.6% 26 16 6.7% 3.1% 2.3% -7.7% 72,032 4.9% 5
Personal services 162 14 2,930 3,394 3,242 10 50,118 27 0.9 1.1 1.7% 1.0% 0.7% 0.1% -0.2% -0.3% -0.9% 0.6% 30 14 -6.4% 2.2% 1.7% -6.9% 37,374 3.7% 30
Petroleum & related processing 585 1 287 325 358 29 1,633,459 1 12.3 6.0 3.5% 2.3% 1.2% 3.0% 0.5% 3.8% 2.0% 1.8% 355 3 17.5% 1.1% 2.3% 1.1% 116,203 4.9% 1
Property Services 313 5 1,383 1,653 1,375 16 227,346 4 1.0 1.2 1.3% -0.1% 1.4% 0.4% 0.2% -1.1% -3.6% 2.6% 0 27 0.0% 1.6% 0.2% 0.0% 50,880 3.9% 21
Public Transport 48 23 495 524 577 24 83,136 14 1.3 1.2 2.9% 1.6% 1.3% 0.7% 0.6% 3.8% 1.9% 1.9% 34 11 3.3% 2.9% 1.5% 2.2% 41,027 4.0% 28
Recreational services 45 24 668 830 787 20 56,583 22 0.5 0.8 -0.3% 1.6% -1.9% 0.4% 0.5% 0.0% -1.1% 1.0% 6 23 -3.1% 0.0% 1.6% -1.9% as part of tourism 43,388 3.4% 27
Residential Care 86 22 1,188 1,451 1,636 15 52,643 24 1.2 1.2 4.1% 3.3% 0.8% 1.3% 1.2% 2.3% 2.4% -0.1% 0 27 0.0% 3.4% 2.6% 0.0% 33,069 5.0% 33
Retail 258 7 6,663 7,508 6,441 1 40,072 32 1.0 1.1 1.9% -0.3% 2.2% -0.2% -0.3% 0.2% -3.0% 3.3% 29 15 4.0% 2.8% 0.5% 6.4% as part of tourism 34,201 3.7% 32
Transport equipment manufacturing & repair 35 28 995 1,039 925 18 37,372 33 0.6 0.9 -1.9% -0.7% -1.2% -1.0% 0.1% -3.7% -2.3% -1.5% 21 18 -10.2% -0.2% -0.3% -7.8% 48,432 3.5% 22
Water & waste 19 31 209 306 306 31 62,860 20 0.7 1.5 -0.6% 3.9% -4.3% 1.4% 1.4% -3.0% 0.0% -2.9% 0 27 0.0% -1.3% 3.0% 0.0% 54,010 3.8% 18
Tourism 219 11 3,835 4,169 3,901 6 56,256 23 1.0 1.1 1.2% 0.2% 1.0% 0.0% -0.4% 1.0% -1.3% 2.3% 0 27 1.9% 1.2% 0.0% 40,499 3.8% 29
Grand Total 5,066 59,615 66,577 63,756 79,453 2.0% 1.4% 0.6% 1.9% 0.6% 1.3% 3,171 3.8% 1.8% 1.2% 2.4% 53,050 3.9%
Northland Emp
LQ
GDP
LQ
GDP,
2010$m
Broader Economic ImpactsMarket PotentialCompetitive Strength
Previously identif ied
as a key sector for
UNI economies
Exports,
2010$m
NZ Grow th 2004 - 2014
%pa change
Average Annual Earnings,
2010$
2014
2004 - 2014, %pa change 2009-2014, %pa change

78
Table 25: Sector analysis for the Auckland region
In Auckland, the sectors with the greatest number of highly ranked key indicators (light to dark green in the table) are service industries such as financial services, business & professional services, health services, freight & logistics, ICT,
construction & construction related services, creative, and tourism (including retail, hospitality and passenger transport). Petroleum and related processing ranks well on several criteria but is relatively small scale.
Rank Filled jobs Filled jobs Filled jobs RankLabour
productivityRank Rank
2009-2014,
%pa change
NZ 2009 -
2014
%pa
change
GDP Emp Lab prod GDP LQ Emp LQ GDP Emp Lab prod 2014 Exports GDP Emp Exports2013 2003-2013,
%pa change
Rank
2013
Agriculture - other 34 34 2,003 1,585 1,424 31 23,739 34 0.2 0.4 -1.4% -2.1% 2.1% -1.4% -2.5% 1.8% -2.1% 4.0% 27 26 0.3% -0.4% -1.3% -1.8% 36,712 4.2% 31
Aquaculture, fishing & related processing 71 33 1,087 829 809 33 87,743 15 0.3 0.3 -3.4% -2.9% -0.5% -1.3% -1.5% 0.1% -0.5% 0.6% 154 20 2.0% -2.5% -1.8% 0.5% 51,763 3.1% 20
Business & professional services 6,729 2 90,788 100,164 105,511 1 63,779 27 1.3 1.3 2.0% 1.5% 0.4% -0.3% -0.4% 2.4% 1.0% 1.4% 676 8 0.9% 1.8% 1.5% 0.5% 56,306 3.6% 15
Chemical & pharmaceutical manufacturing 579 23 2,387 2,366 2,732 27 211,853 4 1.5 1.6 2.0% 1.4% 0.7% 0.9% 0.8% 5.4% 2.9% 2.4% 381 16 1.0% 0.7% 0.2% 0.1% 64,530 3.2% 8
Construction & related services 5,205 4 56,977 69,366 69,325 3 75,076 21 0.9 0.9 2.7% 2.0% 0.7% -1.1% -1.2% 3.3% 0.0% 3.3% 161 19 1.5% 3.5% 2.8% 1.9% 57,759 4.1% 13
Creative 1,626 15 18,079 20,526 20,397 13 79,742 18 1.4 1.4 2.2% 1.2% 0.9% 0.1% 0.1% 2.1% -0.1% 2.2% 699 7 2.2% 1.7% 0.8% 2.4% 53,419 3.7% 19
Dairy & related processing 203 29 2,575 2,166 2,632 28 77,238 20 0.1 0.1 1.1% 0.2% 0.9% -0.6% -1.3% 5.7% 4.0% 1.7% 1,710 2 12.8% 1.3% 1.1% 9.6% 47,573 4.3% 23
Energy 705 20 858 1,295 1,339 32 526,452 1 0.4 0.5 -0.2% 4.5% -4.5% -2.1% -1.7% -4.6% 0.7% -5.3% 0 28 0.0% 1.6% 6.0% 0.0% 87,366 3.3% 2
Financial services 6,500 3 20,891 26,890 31,038 10 209,413 5 1.5 1.5 4.8% 4.0% 0.7% 1.0% 1.0% 3.6% 2.9% 0.7% 387 15 12.0% 3.4% 2.6% 10.4% 83,177 4.2% 4
Food & beverage cultivation & processing 1,824 14 15,193 15,688 16,212 15 112,484 10 0.9 0.8 0.6% 0.7% 0.0% -0.4% -0.1% 0.2% 0.7% -0.5% 1,669 3 3.8% 0.7% 0.4% 3.2% 45,174 4.0% 25
Forestry & wood processing 680 22 6,386 6,059 5,685 23 119,601 8 0.5 0.5 1.7% -1.2% 2.9% 0.5% 0.8% 2.8% -1.3% 4.1% 516 11 3.1% 0.8% -2.3% 8.4% 54,538 3.4% 17
Freight & Logistics 9,462 1 83,912 89,341 89,828 2 105,333 13 1.4 1.4 2.2% 0.7% 1.6% -0.2% -0.2% 2.1% 0.1% 2.0% 1,451 4 -0.2% 2.1% 0.5% 0.4% 60,945 3.8% 10
Government 2,366 12 20,419 26,253 30,525 11 77,518 19 0.7 0.8 4.8% 4.1% 0.7% 0.2% 0.4% 2.2% 3.1% -0.8% 53 25 4.7% 4.3% 3.3% 4.1% 67,348 3.8% 7
Health Services 2,877 9 30,609 38,271 45,600 7 63,090 28 1.0 0.9 4.8% 4.1% 0.7% 1.1% 1.3% 3.4% 3.6% -0.1% 0 28 0.0% 3.3% 2.4% 0.0% 56,933 5.0% 14
Hospitality 1,528 16 34,238 39,632 45,921 6 33,273 33 1.0 1.0 3.5% 3.0% 0.5% 1.0% 1.1% 4.2% 3.0% 1.2% 951 6 2.8% 2.0% 1.5% 0.7% as part of tourism 26,733 3.8% 34
ICT 4,048 6 18,460 23,866 29,495 12 137,244 6 1.6 1.5 6.1% 4.8% 1.3% 1.1% 0.3% 6.6% 4.3% 2.2% 422 13 1.0% 4.6% 4.1% 0.7% 85,284 3.2% 3
International Education 193 30 3,003 3,177 3,395 26 56,772 31 1.0 1.0 -0.2% 1.2% -1.4% 0.5% 0.6% 0.6% 1.3% -0.7% 7 27 -6.0% -1.1% 0.3% -6.8% 61,868 4.0% 9
Other education 3,171 8 45,112 50,419 55,019 5 57,639 30 1.0 1.0 0.6% 2.0% -1.4% 0.1% 0.2% 1.0% 1.8% -0.7% 0 28 0.0% 0.1% 1.5% 0.0% 54,577 3.6% 16
Livestock farming & meat processing 313 27 3,739 3,774 4,356 24 71,968 24 0.2 0.2 2.6% 1.5% 1.0% 3.3% 2.5% 3.8% 2.9% 0.8% 421 14 4.3% -1.1% -1.3% 0.7% 44,356 3.8% 26
Machinery & Electrical equipment manufacturing & repair1,206 17 11,892 12,871 12,287 17 98,186 14 1.1 1.1 0.7% 0.3% 0.3% -0.2% -0.1% 0.4% -0.9% 1.4% 1,160 5 -3.8% 0.5% 0.0% -3.5% 60,452 3.9% 11
Manufacturing - other 565 24 15,523 11,779 8,966 21 62,970 29 1.1 1.2 -3.1% -5.3% 2.4% -0.8% -0.5% -2.6% -5.3% 2.9% 550 10 -0.2% -2.7% -5.2% 1.1% 46,205 3.7% 24
Marine 145 31 2,799 2,757 1,756 30 82,439 16 1.4 1.5 -4.0% -4.6% 0.6% -0.8% -0.7% -6.9% -8.6% 1.9% 56 24 -10.5% -3.6% -4.2% -10.3% 69,570 3.9% 6
Metals & materials manufacturing 1,872 13 21,144 19,404 16,981 14 110,269 11 1.3 1.2 -3.9% -2.2% -1.8% -1.0% -1.4% -1.7% -2.6% 0.9% 1,735 1 -2.1% -3.4% -1.2% -3.8% 59,499 3.6% 12
Minerals & related processing 468 26 3,419 3,929 3,486 25 134,335 7 0.3 0.7 -0.3% 0.2% -0.5% -3.7% -2.4% -5.3% -2.4% -3.0% 75 23 1.2% 3.1% 2.3% -7.7% 72,032 4.9% 5
Personal services 2,697 10 28,453 33,433 36,122 8 74,659 22 1.1 1.0 2.7% 2.4% 0.3% 0.1% 0.3% 2.0% 1.6% 0.4% 663 9 -6.3% 2.2% 1.7% -6.9% 37,374 3.7% 30
Petroleum & related processing 118 32 283 406 316 34 374,902 2 0.2 0.4 9.1% 1.1% 7.9% 7.4% -1.5% -1.5% -4.9% 3.6% 112 22 10.1% 1.1% 2.3% 1.1% 116,203 4.9% 1
Property Services 4,290 5 13,902 13,958 13,782 16 311,268 3 1.1 1.0 1.3% -0.1% 1.3% -0.7% -0.7% 2.3% -0.3% 2.6% 0 28 0.0% 1.6% 0.2% 0.0% 50,880 3.9% 21
Public Transport 470 25 4,477 5,444 5,891 22 79,813 17 1.0 1.0 4.2% 2.8% 1.3% 0.8% 0.9% 3.6% 1.6% 1.9% 266 18 4.9% 2.9% 1.5% 2.2% 41,027 4.0% 28
Recreational services 1,112 18 9,326 10,861 10,385 20 107,087 12 0.9 0.8 -0.9% 1.1% -2.0% -1.3% -0.9% -1.1% -0.9% -0.2% 143 21 -1.6% 0.0% 1.6% -1.9% as part of tourism 43,388 3.4% 27
Residential Care 703 21 8,930 9,858 10,938 19 64,291 26 0.7 0.7 2.9% 2.0% 0.8% -0.9% -0.9% 2.0% 2.1% -0.1% 0 28 0.0% 3.4% 2.6% 0.0% 33,069 5.0% 33
Retail 3,456 7 61,700 67,434 67,981 4 50,839 32 1.0 1.0 3.2% 1.0% 2.2% 0.0% 0.1% 3.5% 0.2% 3.3% 373 17 6.9% 2.8% 0.5% 6.4% as part of tourism 34,201 3.7% 32
Transport equipment manufacturing & repair 792 19 11,963 11,410 11,170 18 70,943 25 1.1 0.9 -0.3% -0.7% 0.4% -0.5% -0.8% 0.6% -0.4% 1.0% 425 12 -7.2% -0.2% -0.3% -7.8% 48,432 3.5% 22
Water & waste 307 28 2,102 2,575 2,622 29 117,087 9 0.8 1.1 -2.0% 2.2% -4.1% -1.1% -1.1% -2.3% 0.4% -2.7% 0 28 0.0% -1.3% 3.0% 0.0% 54,010 3.8% 18
Tourism 2,578 11 31,364 34,627 35,779 9 72,062 23 0.9 0.8 2.0% 1.3% 0.7% -0.2% -0.2% 2.0% 0.7% 1.4% 0 28 1.9% 1.2% 0.0% 40,499 3.8% 29
Grand Total 66,316 652,628 727,780 763,923 86,810 2.0% 1.4% 0.6% 1.9% 0.6% 1.3% 15,242 1.3% 1.8% 1.2% 2.4% 53,050 3.9%
Previously identif ied
as a key sector for
UNI economies Exports,
2010$m
NZ Grow th 2004 - 2014
%pa change
Average Annual Earnings,
2010$
2014
Emp
LQ2004 - 2014, %pa change 2009-2014, %pa changeAuckland
Competitive Strength Market Potential Broader Economic Impacts
GDP,
2010$m
GDP
LQ

79
Table 26: Sector analysis for Waikato
In Waikato, the sectors with the greatest number of highly ranked key indicators (light to dark green in the table) are business & professional services, construction & construction related services, energy, financial services, food &
beverage cultivation & processing, freight & logistics, health services, residential care, dairy & related processing, forestry and related processing, machinery and electrical equipment manufacturing. Petroleum and related processing also
performs well on many indicators but is very small in scale.
Rank Filled jobs Filled jobs Filled jobs RankLabour
productivityRank Rank
2009-2014,
%pa change
NZ 2009 -
2014
%pa
change
GDP Emp Lab prod GDP LQ Emp LQ GDP Emp Lab prod 2014 Exports GDP Emp Exports2013 2003-2013,
%pa change
Rank
2013
Agriculture - other 94 26 1,250 1,364 1,440 26 65,266 22 1.9 1.5 2.7% 1.1% 1.3% 3.5% 2.9% 3.9% 1.1% 2.8% 64 16 -1.4% -0.4% -1.3% -1.8% 36,712 4.2% 31
Aquaculture, fishing & related processing 55 31 689 506 705 30 77,979 16 1.0 0.9 -0.5% 0.2% -0.7% 2.4% 2.3% 7.1% 6.8% 0.2% 98 11 8.4% -2.5% -1.8% 0.5% 51,763 3.1% 20
Business & professional services 889 5 13,453 16,903 16,963 3 52,434 32 0.7 0.8 2.6% 2.3% 0.3% 1.2% 1.0% 2.1% 0.1% 2.1% 96 13 1.9% 1.8% 1.5% 0.5% 56,306 3.6% 15
Chemical & pharmaceutical manufacturing 57 30 295 223 275 32 208,959 4 0.6 0.6 0.7% -0.7% 1.4% 0.4% -0.7% 6.3% 4.3% 1.9% 17 23 -16.8% 0.7% 0.2% 0.1% 64,530 3.2% 8
Construction & related services 1,322 2 15,386 20,555 18,532 1 71,357 20 1.0 1.0 2.4% 1.9% 0.5% -0.7% -0.8% 1.3% -2.1% 3.4% 24 21 -0.4% 3.5% 2.8% 1.9% 57,759 4.1% 13
Creative 119 25 1,875 1,980 1,980 24 60,271 27 0.4 0.5 1.2% 0.5% 0.7% -0.1% 0.0% 2.0% 0.0% 2.0% 47 17 2.0% 1.7% 0.8% 2.4% 53,419 3.7% 19
Dairy & related processing 1,771 1 14,071 13,574 14,239 5 124,352 9 3.2 3.0 0.3% 0.1% 0.2% -0.6% -0.8% 1.1% 1.0% 0.1% 4,614 1 12.2% 1.3% 1.1% 9.6% 47,573 4.3% 23
Energy 853 6 650 870 1,444 25 590,615 1 1.9 2.3 5.9% 8.3% -2.2% 4.6% 2.4% 7.0% 10.7% -3.3% 0 28 0.0% 1.6% 6.0% 0.0% 87,366 3.3% 2
Financial services 390 17 2,790 3,129 2,739 21 142,421 6 0.4 0.5 -0.2% -0.2% 0.0% -3.0% -2.5% -3.0% -2.6% -0.4% 24 21 4.4% 3.4% 2.6% 10.4% 83,177 4.2% 4
Food & beverage cultivation & processing 316 19 3,730 3,843 4,304 13 73,423 19 0.7 0.8 1.5% 1.4% 0.1% 1.2% 1.2% 2.5% 2.3% 0.2% 292 4 3.8% 0.7% 0.4% 3.2% 45,174 4.0% 25
Forestry & wood processing 526 14 6,113 4,464 4,149 15 126,773 8 1.6 1.5 -0.4% -3.8% 3.5% -0.8% -1.4% 2.8% -1.5% 4.4% 920 2 9.2% 0.8% -2.3% 8.4% 54,538 3.4% 17
Freight & Logistics 1,078 3 12,652 13,250 12,868 8 83,804 14 0.7 0.8 1.8% 0.2% 1.6% 0.1% -0.2% 1.3% -0.6% 1.9% 119 8 1.2% 2.1% 0.5% 0.4% 60,945 3.8% 10
Government 551 13 5,093 6,744 7,267 12 75,846 17 0.7 0.8 4.5% 3.6% 0.9% 0.6% 0.5% 1.1% 1.5% -0.4% 12 24 4.4% 4.3% 3.3% 4.1% 67,348 3.8% 7
Health Services 810 10 10,558 11,800 13,426 7 60,321 26 1.1 1.1 3.1% 2.4% 0.7% 0.2% 0.2% 2.5% 2.6% -0.1% 0 28 0.0% 3.3% 2.4% 0.0% 56,933 5.0% 14
Hospitality 332 18 10,439 11,958 11,694 9 28,361 34 0.9 1.0 1.6% 1.1% 0.4% 0.0% -0.2% 0.7% -0.4% 1.2% 206 6 -0.6% 2.0% 1.5% 0.7% as part of tourism 26,733 3.8% 34
ICT 187 24 1,491 2,079 2,008 23 92,897 11 0.3 0.4 1.7% 3.0% -1.3% -2.4% -0.8% -2.9% -0.7% -2.2% 33 20 0.1% 4.6% 4.1% 0.7% 85,284 3.2% 3
International Education 39 32 867 818 751 29 52,486 31 0.9 0.9 -2.7% -1.4% -1.3% -1.3% -1.5% -2.3% -1.7% -0.6% 2 27 -6.4% -1.1% 0.3% -6.8% 61,868 4.0% 9
Other education 828 8 13,873 14,482 15,591 4 53,077 30 1.1 1.1 -0.2% 1.2% -1.3% 0.1% -0.1% 0.8% 1.5% -0.7% 0 28 0.0% 0.1% 1.5% 0.0% 54,577 3.6% 16
Livestock farming & meat processing 749 12 8,803 8,794 8,287 10 90,362 13 1.7 1.5 -0.6% -0.6% 0.0% 0.9% 0.9% -1.1% -1.2% 0.1% 916 3 2.5% -1.1% -1.3% 0.7% 44,356 3.8% 26
Machinery & Electrical equipment manufacturing & repair 314 20 3,212 3,537 3,419 20 91,694 12 1.2 1.2 0.7% 0.6% 0.1% 0.6% 0.8% 1.1% -0.7% 1.7% 227 5 -3.6% 0.5% 0.0% -3.5% 60,452 3.9% 11
Manufacturing - other 61 29 1,467 1,178 974 28 62,274 23 0.5 0.5 -1.5% -4.0% 2.6% 1.7% 1.4% -0.6% -3.7% 3.3% 96 13 3.6% -2.7% -5.2% 1.1% 46,205 3.7% 24
Marine 12 33 201 172 155 33 80,501 15 0.5 0.5 -2.1% -2.6% 0.5% 1.9% 1.9% -0.5% -2.1% 1.7% 3 26 -8.3% -3.6% -4.2% -10.3% 69,570 3.9% 6
Metals & materials manufacturing 440 16 4,246 4,608 4,296 14 102,545 10 1.2 1.2 -2.1% 0.1% -2.2% 1.7% 1.5% -0.5% -1.4% 0.9% 183 7 0.4% -3.4% -1.2% -3.8% 59,499 3.6% 12
Minerals & related processing 826 9 1,728 2,133 2,209 22 373,799 2 2.3 1.7 1.6% 2.5% -0.8% -1.1% 0.4% -1.4% 0.7% -2.1% 105 10 10.5% 3.1% 2.3% -7.7% 72,032 4.9% 5
Personal services 490 15 6,788 7,625 8,286 11 59,190 28 0.9 1.0 2.6% 2.0% 0.6% 0.7% 0.4% 2.1% 1.7% 0.4% 109 9 -7.0% 2.2% 1.7% -6.9% 37,374 3.7% 30
Petroleum & related processing 5 34 20 20 32 34 147,640 5 0.0 0.2 5.6% 5.2% 0.4% 4.8% 3.0% 9.5% 9.8% -0.2% 5 25 25.4% 1.1% 2.3% 1.1% 116,203 4.9% 1
Property Services 1,017 4 3,429 3,584 3,425 19 297,056 3 1.1 1.0 1.3% 0.0% 1.3% 0.1% -0.1% 1.7% -0.9% 2.6% 0 28 0.0% 1.6% 0.2% 0.0% 50,880 3.9% 21
Public Transport 74 28 1,104 1,102 1,085 27 68,665 21 0.6 0.7 1.0% -0.2% 1.2% -1.5% -1.5% 1.4% -0.3% 1.8% 36 18 1.2% 2.9% 1.5% 2.2% 41,027 4.0% 28
Recreational services 274 21 3,101 3,726 3,709 16 73,873 18 1.0 1.2 -0.1% 1.8% -1.8% 0.3% 0.3% 0.8% -0.1% 0.9% 36 18 -2.1% 0.0% 1.6% -1.9% as part of tourism 43,388 3.4% 27
Residential Care 223 22 2,487 2,556 3,629 18 61,446 25 1.0 0.9 4.7% 3.9% 0.8% 1.6% 1.4% 7.2% 7.3% -0.1% 0 28 0.0% 3.4% 2.6% 0.0% 33,069 5.0% 33
Retail 794 11 17,691 19,243 18,319 2 43,329 33 1.0 1.0 2.6% 0.3% 2.2% 0.1% 0.0% 2.3% -1.0% 3.3% 85 15 6.1% 2.8% 0.5% 6.4% as part of tourism 34,201 3.7% 32
Transport equipment manufacturing & repair 207 23 3,554 3,987 3,704 17 55,977 29 1.2 1.2 1.1% 0.4% 0.7% 1.7% 0.9% -0.8% -1.5% 0.7% 98 11 -8.8% -0.2% -0.3% -7.8% 48,432 3.5% 22
Water & waste 75 27 537 613 586 31 128,123 7 0.8 1.0 -3.3% 0.9% -4.1% -1.7% -1.9% -3.8% -0.9% -2.9% 0 28 0.0% -1.3% 3.0% 0.0% 54,010 3.8% 18
Tourism 842 7 11,231 12,275 13,635 6 61,782 24 1.2 1.3 2.6% 2.0% 0.6% 1.1% 1.0% 4.1% 2.1% 1.9% 0 28 1.9% 1.2% 0.0% 40,499 3.8% 29
Grand Total 15,779 173,641 191,421 192,485 81,974 2.0% 1.4% 0.6% 1.9% 0.6% 1.3% 8,467 7.1% 1.8% 1.2% 2.4% 53,050 3.9%
Previously identif ied
as a key sector for
UNI economies Exports,
2010$m
NZ Grow th 2004 - 2014
%pa change
Average Annual Earnings,
2010$
2014
GDP
LQ
Emp
LQ2004 - 2014, %pa change 2009-2014, %pa changeWaikato
Competitive Strength Market Potential Broader Economic Impacts
GDP,
2010$m

80
Table 27: Sector analysis for the Bay of Plenty region
In Bay of Plenty, the sectors with the greatest number of highly ranked key indicators (light to dark green in the table) are energy, freight & logistics, tourism (including passenger transport and hospitality), health services (including
residential care), construction & construction related services, dairy & related processing and business & professional services.
Rank Filled jobs Filled jobs Filled jobs RankLabour
productivityRank Rank
2009-2014,
%pa change
NZ 2009 -
2014
%pa
change
GDP Emp Lab prod GDP LQ Emp LQ GDP Emp Lab prod 2014 Exports GDP Emp Exports2013 2003-2013,
%pa change
Rank
2013
Agriculture - other 34 30 806 841 710 28 48,599 27 1.2 1.1 0.7% -3.3% 2.0% 1.2% 0.1% 0.4% -3.3% 3.9% 47 15 -13.4% -0.4% -1.3% -1.8% 36,712 4.2% 31
Aquaculture, fishing & related processing 55 28 656 722 717 26 76,536 13 1.7 1.3 0.0% 0.9% -0.9% 2.6% 2.9% -0.3% -0.1% -0.2% 119 7 2.8% -2.5% -1.8% 0.5% 51,763 3.1% 20
Business & professional services 686 3 10,311 14,060 13,739 1 49,928 26 1.0 1.0 2.9% 2.9% 0.0% 1.1% 1.5% 1.6% -0.5% 2.1% 56 10 0.8% 1.8% 1.5% 0.5% 56,306 3.6% 15
Chemical & pharmaceutical manufacturing 26 31 193 203 165 33 157,666 4 0.5 0.6 -1.9% -1.5% -0.4% -2.5% -1.6% -2.3% -4.0% 1.8% 8 24 -10.7% 0.7% 0.2% 0.1% 64,530 3.2% 8
Construction & related services 892 2 10,672 13,916 12,989 2 68,660 18 1.2 1.0 3.1% 2.0% 1.1% -0.2% -0.7% 2.9% -1.4% 4.3% 17 18 -0.6% 3.5% 2.8% 1.9% 57,759 4.1% 13
Creative 72 25 1,673 1,620 1,529 22 47,345 29 0.5 0.6 -0.3% -0.9% 0.6% -1.9% -1.6% 0.7% -1.2% 1.9% 23 17 0.5% 1.7% 0.8% 2.4% 53,419 3.7% 19
Dairy & related processing 357 10 4,117 4,425 4,448 13 80,186 11 1.2 1.4 0.6% 0.8% -0.1% -0.6% -0.3% 0.3% 0.1% 0.2% 587 3 -0.2% 1.3% 1.1% 9.6% 47,573 4.3% 23
Energy 215 16 93 137 304 31 706,037 1 0.9 0.7 10.3% 12.6% -2.0% 8.7% 6.3% 13.3% 17.3% -3.4% 0 28 0.0% 1.6% 6.0% 0.0% 87,366 3.3% 2
Financial services 241 15 1,934 2,445 2,110 19 114,200 8 0.4 0.6 1.4% 0.9% 0.5% -1.8% -1.6% -3.1% -2.9% -0.2% 16 19 4.8% 3.4% 2.6% 10.4% 83,177 4.2% 4
Food & beverage cultivation & processing 314 12 5,441 5,624 5,612 10 56,032 20 1.2 1.5 0.0% 0.3% -0.3% -0.6% 0.0% 0.3% 0.0% 0.3% 875 2 -1.7% 0.7% 0.4% 3.2% 45,174 4.0% 25
Forestry & wood processing 619 4 7,035 5,470 5,029 11 123,020 6 3.5 2.7 -0.5% -3.3% 2.8% -1.2% -0.9% 2.1% -1.7% 3.9% 1,324 1 5.8% 0.8% -2.3% 8.4% 54,538 3.4% 17
Freight & Logistics 975 1 9,623 9,978 10,525 4 92,644 9 1.1 0.9 2.2% 0.9% 1.3% 0.2% 0.5% 2.9% 1.1% 1.8% 125 6 2.7% 2.1% 0.5% 0.4% 60,945 3.8% 10
Government 339 11 3,367 3,950 4,692 12 72,221 15 0.8 0.7 4.3% 3.4% 0.9% 0.1% 0.2% 3.4% 3.5% -0.1% 7 25 7.5% 4.3% 3.3% 4.1% 67,348 3.8% 7
Health Services 516 7 7,835 9,260 9,872 6 52,282 25 1.3 1.2 3.0% 2.3% 0.7% -0.2% 0.0% 1.1% 1.3% -0.1% 0 28 0.0% 3.3% 2.4% 0.0% 56,933 5.0% 14
Hospitality 245 14 7,556 8,244 8,296 8 29,477 34 1.2 1.0 1.4% 0.9% 0.5% -0.5% -0.5% 1.3% 0.1% 1.2% 152 5 0.0% 2.0% 1.5% 0.7% as part of tourism 26,733 3.8% 34
ICT 70 27 544 763 963 23 73,085 14 0.2 0.3 6.2% 5.9% 0.3% 1.6% 1.8% 6.7% 4.8% 1.8% 15 21 5.8% 4.6% 4.1% 0.7% 85,284 3.2% 3
International Education 17 32 399 402 396 30 43,599 31 0.7 0.7 -1.4% -0.1% -1.3% -0.2% -0.3% -1.0% -0.3% -0.7% 1 27 -6.2% -1.1% 0.3% -6.8% 61,868 4.0% 9
Other education 443 9 8,369 9,675 10,062 5 44,007 30 1.0 1.0 0.5% 1.9% -1.4% 0.5% 0.5% 0.1% 0.8% -0.7% 0 28 0.0% 0.1% 1.5% 0.0% 54,577 3.6% 16
Livestock farming & meat processing 158 20 2,932 3,173 2,637 15 59,885 19 0.6 0.7 -1.7% -1.1% -0.7% -0.5% 0.3% -4.6% -3.6% -1.0% 183 4 -5.3% -1.1% -1.3% 0.7% 44,356 3.8% 26
Machinery & Electrical equipment manufacturing & repair 170 17 2,283 2,363 2,391 18 71,287 16 1.2 1.2 0.6% 0.5% 0.1% 0.2% 0.5% 1.4% 0.2% 1.2% 109 8 -0.8% 0.5% 0.0% -3.5% 60,452 3.9% 11
Manufacturing - other 40 29 1,080 991 745 25 53,073 24 0.6 0.6 -1.8% -3.6% 2.0% 1.1% 1.7% -2.7% -5.6% 3.0% 27 16 -0.6% -2.7% -5.2% 1.1% 46,205 3.7% 24
Marine 15 33 353 283 215 32 68,714 17 1.1 1.0 -4.4% -4.9% 0.5% -0.8% -0.6% -3.8% -5.4% 1.7% 5 26 -11.4% -3.6% -4.2% -10.3% 69,570 3.9% 6
Metals & materials manufacturing 159 19 1,834 2,121 2,073 20 76,749 12 0.8 0.9 -0.4% 1.2% -1.6% 3.2% 2.5% 0.5% -0.5% 0.9% 54 11 -2.5% -3.4% -1.2% -3.8% 59,499 3.6% 12
Minerals & related processing 116 21 632 678 714 27 162,613 3 0.6 0.8 2.4% 1.2% 1.2% -0.6% -0.9% 4.1% 1.0% 3.0% 16 19 -0.5% 3.1% 2.3% -7.7% 72,032 4.9% 5
Personal services 284 13 4,717 5,346 5,876 9 48,324 28 0.9 1.0 2.4% 2.2% 0.1% 0.2% 0.5% 1.8% 1.9% -0.1% 53 12 -6.1% 2.2% 1.7% -6.9% 37,374 3.7% 30
Petroleum & related processing 7 34 50 47 56 34 120,216 7 0.1 0.5 1.5% 1.2% 0.2% 0.4% -1.0% 5.0% 3.9% 1.1% 9 23 35.7% 1.1% 2.3% 1.1% 116,203 4.9% 1
Property Services 596 5 2,637 2,705 2,463 17 241,823 2 1.1 1.1 0.7% -0.7% 1.3% -0.8% -0.8% 0.7% -1.9% 2.6% 0 28 0.0% 1.6% 0.2% 0.0% 50,880 3.9% 21
Public Transport 72 25 669 766 866 24 82,713 10 1.1 0.9 3.9% 2.6% 1.3% 1.0% 1.2% 4.3% 2.5% 1.8% 52 13 1.2% 2.9% 1.5% 2.2% 41,027 4.0% 28
Recreational services 106 23 1,635 2,072 1,997 21 53,282 22 0.7 0.9 0.2% 2.0% -1.8% 0.3% 0.5% 0.1% -0.7% 0.9% 14 22 -2.5% 0.0% 1.6% -1.9% as part of tourism 43,388 3.4% 27
Residential Care 169 18 2,357 2,611 3,164 14 53,260 23 1.3 1.2 3.8% 3.0% 0.8% 0.5% 0.5% 3.8% 3.9% -0.1% 0 28 0.0% 3.4% 2.6% 0.0% 33,069 5.0% 33
Retail 537 6 12,969 14,084 12,916 3 41,548 33 1.2 1.1 2.2% 0.0% 2.2% -0.5% -0.5% 1.5% -1.7% 3.3% 59 9 5.5% 2.8% 0.5% 6.4% as part of tourism 34,201 3.7% 32
Transport equipment manufacturing & repair 107 22 2,258 2,526 2,548 16 42,112 32 1.1 1.2 2.1% 1.2% 0.9% 2.4% 1.6% 2.0% 0.2% 1.8% 52 13 -7.1% -0.2% -0.3% -7.8% 48,432 3.5% 22
Water & waste 80 24 339 498 519 29 154,578 5 1.6 1.2 -0.2% 4.3% -4.3% 1.2% 1.4% -2.0% 0.8% -2.8% 0 28 0.0% -1.3% 3.0% 0.0% 54,010 3.8% 18
Tourism 500 8 8,282 8,822 9,096 7 55,004 21 1.3 1.2 1.6% 0.9% 0.7% -0.1% -0.1% 2.3% 0.6% 1.7% 0 28 1.9% 1.2% 0.0% 40,499 3.8% 29
Grand Total 8,731 117,368 132,000 131,337 66,478 2.0% 1.4% 0.6% 1.9% 0.6% 1.3% 4,004 0.7% 1.8% 1.2% 2.4% 53,050 3.9%
2014
Previously identif ied
as a key sector for
UNI economies Exports,
2010$m
NZ Grow th 2004 - 2014
%pa change
Average Annual Earnings,
2010$Bay of Plenty
Competitive Strength Market Potential Broader Economic Impacts
GDP,
2010$m
GDP
LQ
Emp
LQ2004 - 2014, %pa change 2009-2014, %pa change

81
Appendix 3: Labour Force Scenarios
Our baseline projection suggests that the labour force participation rate will grow from 1.24 million in
2013 to 1.53 million in 2033. This growth rate of 1.1 percent per annum is considerably lower than the
employment growth of 1.9 percent per annum since 2000. This suggests that labour supply could
impose a constraint on growth in the future.
For the UNI to match the economic growth of 2.7 percent per annum achieved between 2000 and
2014, with the labour force growing at only 1.1 percent, it will need to double its labour productivity
growth of 0.8 percent achieved between 2000 and 2014 to 1.6 percent over the twenty years to 2033.
The following sections investigate the extent to which various changes in the labour market can
increase the future supply of labour.
Additional scenarios
The baseline scenario suggests that the labour force will grow at 1.1 percent per annum over the 20
years to 2033. In this section we investigate the impact that changes in the labour market can have on
the potential supply of labour in UNI. We have developed scenarios of higher net migration, higher
older age labour force participation rates (LFPRs) and higher female LFPRs.
Higher net migration
Statistics New Zealand’s medium population projection for the UNI area for the period 2013 to 2018
assumes annual net migration of 98,000 dropping to 41,800 from 2018 onwards. A high net migration
projection for the five-year period reflects the much higher than average international net migration
currently being experienced. In this higher net migration scenario, we assume that net migration stays
at 98,000 for each five-year period after 2018.
Higher older age LFPR
In this scenario we assume that the LFPR of people aged 55 and above continues to increase at a
similar rate to the last 10 years. We assume that by 2023 the LFPR of each five-year age group above
55 will match the preceding five-year age groups’ LFPR and thereafter remain constant. Under this
assumption the overall LFPR of persons over 55 will increase from 45.9 percent in 2013 to 55.7
percent in 2023 (from 35.2 percent in 2001).
Higher female LFPR
We assume that the LFPRs of women increase at a similar rate between 2013 and 2023 as they did
between 2001 and 2013. Overall the LFPR of women in the UNI area increased from 60.1 percent in
2001 to 61.3 percent in 2013. We assume that it increases to 62.4 percent by 2023 and thereafter
stays constant.

82
Scenario results
Figure 27 shows the projected population for each scenario and Table 28 shows a summary of the
projections.
Figure 27: Labour force projections under various scenarios
Source: Infometrics and Statistics New Zealand
Table 28: UNI labour force growth to 2033 under various scenarios
Source: Infometrics
Each scenario has a sizeable impact on the labour supply with the higher net migration scenario
having the largest impact. While the labour force is expected to grow by 1.1 percent per annum over
the twenty years to 2033 in the baseline scenario, it is predicted to grow by 1.3 percent with higher
female labour force participation, 1.4 percent with higher older age participation and by 1.5 percent
with higher net migration. These scenarios assume that the changes to the labour market that bring
about increases to the labour supply are mutually exclusive. However, if they occurred simultaneously
then even higher rates of labour force growth could be achieved.
These results suggest that there is some scope to lift the growth in the labour force in the UNI area
above the baseline projection (e.g., by attracting higher numbers of migrants).
2013 2033 absolute %pa
Baseline 1.24 1.53 293,000 1.1%
Higher female LFPR 1.24 1.60 359,500 1.3%
Higher older LFPR 1.24 1.64 405,100 1.4%
Higher net migration 1.24 1.66 418,500 1.5%
Change 2013-2033Scenario
Labour Force (million)

83
Appendix 4: Labour supply and demand methodology
This Appendix provides more detail on the methodology used to estimate the supply of labour and
demand for labour in this report.
Supply of skills
Supply of skills: School leavers available for work
Secondary school estimates by NCEA qualification level for the UNI are estimated by drawing on
Ministry of Education school roll projections, school leaver data and recent NCEA achievement rates.
These estimates are then adjusted using school leaver outcome data at a national level from the
Ministry of Education to discount school leavers who transition into tertiary education or leave the
country. This enables us to identify school leavers in the UNI who will most likely be available for work
one year after leaving school.
Supply of skills: Tertiary education
Qualification enrolment and completion data were used to provide an oversight of the qualification
composition of education and training in the UNI area. Data from the Ministry of Education and Tertiary
Education Commission Single Data Return (SDR) database provided information about enrolments
and completions of qualifications funded under the Student Component Fund (e.g., qualifications
provided by Universities, Wananga, Institutes of Technology and Polytechnics and Private Training
Establishments). The Tertiary Education Commission’s Industry Training Register (ITR) provided
information on qualifications funded to industry trainees and New Zealand Apprentices via the Industry
Training Fund.
Qualification completions for the 2016 to 2020 period were estimated by drawing on Ministry of
Education tertiary education enrolment projections and the current relationship between qualification
completions and enrolments at a broad qualification and field of study level.
Qualification completion estimates were then discounted to only consider graduates who would be
most likely be available for work one year after completion. To do this we drew on Ministry of
Education graduate outcome data to remove the proportion of people who, one year after completion,
were still in tertiary education (e.g., had taken on further study) or were not captured in the system
(e.g., moved overseas). This was done at a broad qualification and field of study level.
Supply of skills: Migration
Arrival and departure card information and regional information from the 2013 census were used to
estimate the net impact of international migration to the UNI area. These estimates were then adjusted
to take into account future expectations around net migration in New Zealand using Infometrics
national forecasts of international net migration over the 2016 to 2020 period.

84
For net regional migration, there is little information available to draw on other than from the Census
about inter-regional migration flows in New Zealand at a detailed level. Our analysis therefore looked
at the net flows of people to the UNI area (where people were residing at the Census and where they
were five years ago) by occupational grouping. This was done using 2013 Census data, but we note
that trends do not vary greatly between recent censuses. Given the lack of information available, it is
assumed that the inter-regional migration flows by occupation from the 2013 Census will be similar to
those between 2016 and 2020.
Demand for skills
Demand for skills: New jobs
Infometrics forecasts were used to identify new job growth at a detailed occupational level for the 2016
to 2020 period. These forecasts and the underlying assumptions are discussed in the ‘New Zealand
forecasts to 2020’ section.
Demand for skills: Net replacement
The method used to estimate net replacement demand by occupation was based on the methodology
developed in Australia by Shah and Burke. This method takes into account all reasons people leave
occupations.
Matching supply and demand
To look at the match between the labour supply and labour demand, our forecasts - with the exception
of tertiary education and secondary school leavers’ forecasts, which are already by qualification - were
converted into forecasts by qualification. We derive estimates of employment by qualification using the
link between occupation and qualification used in the Australian New Zealand Standard Classification
of Occupations (ANZSCO). We assume that each occupation requires the qualification level indicated
by ANZSCO. We thus do not measure the qualification levels of the workforce as it is likely that many
individuals will have qualifications higher or lower (or no qualifications at all) than that suggested by
ANZSCO. Rather we measure the ideal mix of qualifications required by the economy.
Each occupation in the ANZSCO classification at the 6-digit level is uniquely matched to one of five
qualifications (or skill) categories. These five categories are:
Skill level 1 which is commensurate with a degree or higher qualifications, i.e., NZQA level 7 and
above.
Skill level 2 which is commensurate with a New Zealand Qualification Framework (NZQF)
Diploma, i.e., NZQA level 5 and 6.
Skill level 3 which is commensurate with a NZQF Level 4 qualification.
Skill level 4 and 5 which is commensurate with a NZQF Level 1 to 3 qualification.
85
We split our estimates of employment for each combination of occupation and qualification into fields
of study using data from the 2013 Census. From the Census we can estimate in which field of study
individuals have qualifications. By aggregating across the various combinations of occupations and
qualifications we arrive at the total for each field of study.
The resulting demand for labour by qualification and field of study is then driven by forecast demand
for labour by industry and changing shares of occupations in industry employment, while the shares of
field of study for each occupation/qualification combination remains constant according to what can be
observed in the 2013 Census.
This conversion enabled all forecasts to be by qualification and enabled the balance between the
future supply of labour and demand for labour to be examined.
As an additional step, forecasts by qualification were converted into estimates of occupations required
using the relationship between the qualifications (level and field of study) and occupations from the
2013 Census. These estimates should be treated as indicative as the underlying assumption is that
the 2013 relationship between qualifications and occupations holds over the 2016 to 2020 period.
Productivity improvements, technological changes, shortages, salaries, working conditions, job
perceptions and overall economic conditions may mean that this relationship changes over the 2016 to
2020 period.

86
Appendix 5: Industry Consultation
First round consultation
Industry representatives were presented with an employment growth forecast for their industry and
region and invited to provide feedback on our baseline employment growth forecasts. They were also
asked for their thoughts on their own employment intentions over the next five years, whether they
were experiencing skill/hiring constraints and for what occupations, where employees would be
sourced from, and whether existing training and education initiatives for skills and workers were
effective.
Forecasts and a questionnaire were emailed to 71 organisations. A total of 31 businesses and
organisations were either interviewed or responded electronically to the questionnaire.
Interviews were conducted over the phone. Where there was only one person interviewing, the
interview was recorded.
The following organisations were either interviewed or responded by email.
Interviewed Responded by email
Hawkins Construction
Miraka
Fonterra
Tatua Dairy Cooperative
Comvita
Horticulture New Zealand
New Zealand Kiwifruit Growers Incorporated
Tenon
Kiwirail
Health Workforce New Zealand (MoH)
Oceania Healthcare
Auckland DHB
Counties Manukau DHB
Mercy Integrated Hospital
Tourism Industry Association New Zealand
Auckland Tourism, Events and Economic Development
Tourism Bay of Plenty
New Zealand Building Industry Federation
Fulton Hogan
Juken New Zealand
Sumitomo (Summit Forest)
New Zealand Forest Owners Association
New Zealand Transport Agency
Summerset
Lakes DHB
Kensington Hospital
Braemar Hospital
Grace Hospital
Skyline
The questionnaire sent to each organisation was customised to their sector and or region of interest.
The following example was for Auckland construction.

87
Interview questions for current and future labour and skill
demands in the Upper North Island (UNI)
Respondent details
Organisation
Region Auckland
Respondent
Sector Construction and related services
Forecasts:
The following graph shows how your industry’s employment has changed in Auckland for the last five
years and provides forecasts for annual growth of employment for the industry over the next five
years:
Figure 1. Employment in Construction and related services - Auckland
Over the last five years, employment in your industry in your region remained relatively unchanged,
decreasing by about 10 employees each year. Over the next five years our forecasts suggest
significant employment growth for your sector, with employment rising, on average, by about 4,370
employees each year.
60,000
65,000
70,000
75,000
80,000
85,000
90,000
95,000
2009 2010 2011 2012 2013 2014 2015 2016 2017 2018 2019
Fill
ed J
obs
Year
actual forecast

88
How well do you think the forecasts reflect the likely employment change in the Construction
and related services sector in your region over the next five years?
Employment will change by
more
About right Employment will change by
less
Don’t know
Why do you think this? (please comment):
If you think that employment growth will be different to these forecasts, what would be your
ballpark estimate of employment growth in your industry over the next five years?
Will grow by less than
1,800 employees per year
Will grow by 1,800-
3,300 employees per year
Will grow by 5,300-
7,000 employees per year
Will grow by 7,000
plus employees per year
Don’t know
Do you know of any investments/projects that are likely to significantly impact on employment
demand for the Construction and related services sector in your region?
Comments (e.g., What are these investments/projects? How large are they?):
What are your business’ employment intentions over the next five years?
We will employ a
lot less people
We will
employ
slightly less people
We will employ the
same amount of people
We will employ
slightly more people
We will employ
a lot more people
Don’t know
What key factors are influencing your employment intentions (e.g., likely increase/decrease in
demand; improved technology; expansion of production)?
Is your business currently experiencing skill/hiring constraints?
Yes – continue to question 6 below
No - skip question 6 and go to question 7.
What are the key occupations in which your business is experiencing skill/hiring constraints?
Name up to 3 occupations:

89
If you have to hire new employees over the next few years, where do you think most of your
new employees will come from?
Within your region From the wider Upper North
Island (includes Northland,
Auckland, Waikato, Bay of Plenty)
From wider New Zealand From overseas
Do you think existing training and education initiatives for skills and workers in your industry
are effective?
Is there a sufficient number of people being trained? Yes / No
Are existing programmes of sufficient quality? Yes / No
What improvements, if any, would you like to see in training and education for your industry?
Please comment:
How much of your business’ supplies (e.g., materials, technology, transport, professional
services) are sourced from within your region?
Not at all A little
(e.g., less than 25
percent of the value of your supplies)
Some
(e.g., 25 to 50 percent
of the value of your supplies)
A fair amount (e.g., 50
percent to 75 percent
of the value of your supplies)
A lot
(more than 75 percent
of the value of your supplies)
If you source more than 50 percent of the value of your supplies from outside the region, where
do these supplies mainly come from?
From the wider Upper North Island
(includes Northland, Auckland, Waikato, Bay of Plenty)
From wider New Zealand From overseas
How much of your business’ products are sold within your region?
None A little
(e.g., less than 25
percent of the value of products)
Some
(e.g., 25 to 50 of the value of your products)
A fair amount (e.g., 50
percent to 75 percent
of the value of your products))
A lot
(more that 75 percent
of the value of your products)
If you sell more than 50 percent of the value of your products outside the region, where do you
mainly sell these products to?
To the wider Upper North Island
(includes Northland, Auckland, Waikato, Bay of Plenty)
Top wider New Zealand To overseas markets

90
Second round consultation
The second round of consultation focussed mainly on industry training organisations and polytechnics,
but also included central and local government representatives (see Table 29). Organisations were
asked whether our forecast skill shortages aligned with their experiences and expectations, whether
there were existing programmes or initiatives addressing these shortages, any new initiatives they
would like to see established and if there was a role for UNISA in addressing skill shortages in their
industry.
Table 29: Organisations consulted in second round of interviews
Interviewed Responded by email
Primary ITO
CompeteNZ (two interviews: 1) food and beverage cultivation and processing and 2) forestry and wood processing)
BOP Forestry Wood Action Group
Auckland Chamber of Commerce
BOP Polytech
MITO (freight and logistics)
BOP Freight and Logistics Action Group
Careerforce ITO (health)
Service IQ (tourism)
Priority 1
Ministry of Business, Innovation and Employment (different areas)
Auckland, Tourism, Events and Economic Development
Building and Construction ITO
The questionnaire sent to each organisation was customised to their sector. The following example
was for tourism.

91
Interview questions: future labour and skill shortages in the Upper North Island (UNI)
Respondent details
Organisation ServiceIQ
Region Northland, Auckland, Waikato, Bay of Plenty
Respondent
Sector Tourism
Forecasts
Upper North Island
The following graph shows how the tourism industry’s employment has changed in the Upper North
Island (Northland, Auckland, Waikato and Bay of Plenty) for the last five years and provides forecasts
for annual growth of employment for the industry over the next five years:
Figure 1. Employment in Tourism - Upper North Island
Over the last five years, employment in your industry in the Upper North Island increased by about 500
employees each year (a per annum increase of 0.8%). Over the next five years, forecasts suggest
greater employment growth for your sector, with employment rising, on average, by about 1,530
employees each year (a per annum increase of 2.3%).
52,000
54,000
56,000
58,000
60,000
62,000
64,000
66,000
68,000
70,000
72,000
2009 2010 2011 2012 2013 2014 2015 2016 2017 2018 2019
Fill
ed J
obs
Year
actual forecast

92
Table 1 shows how forecast growth will differ across regions.
Table 1: Regional employment growth forecast 2014-2019
Region Forecast (p.a.)
Jobs %
Northland 70 1.7
Auckland 1014 2.7
Waikato 289 2.0
Bay of Plenty 158 1.7
Labour/skill shortages
Table shows the forecast job openings in the tourism sector in each Upper North Island region
between 2014 and 2019, including both new jobs and positions that will need to be filled to replace
existing staff who leave (net replacement).
Table 2: Job openings in the Tourism sector by UNI region, 2014 to 2019
Source: Infometrics
Our forecasts suggest there will be around 22,000 job openings in the four regions comprising the
Upper North Island.
Table 3 shows a breakdown of occupations in the sector and our forecast of likely oversupply or
undersupply of labour in that occupation across the Upper North Island. Occupations which are likely
to experience a shortage of labour are shown in red, occupations which are likely to be oversupplied
are shown in black. The occupations facing the largest shortages are likely to be Kitchen hands,
Waiters, Café or Restaurant managers, Hotel or Motel managers and Accommodation and Hospitality
managers.
Sector New jobs Net replacement Total job openingsJob openings as
a % of 2014 jobs
Northland 351 886 1,237 31.7%
Auckland 5,072 8,236 13,308 37.2%
Waikato 1,446 3,103 4,549 33.4%
Bay of Plenty 791 2,050 2,841 31.2%
Total UNI 7,660 14,275 21,935 35.1%

93
Table 3: Demand and supply of labour by key occupation, Tourism, 2014 to 2019
Source: Infometrics
Industry perspective
Discussions with industry suggest there are currently labour shortages in the following occupations:
Chefs
Wait staff
Hotel/accommodation managers
The sector has a relatively high reliance on temporary migrant labour and an issue identified by the
industry is attracting the right type of person, as tourism is viewed as a “non-academic” option within
secondary schools. Industry representatives said that generally the quality of existing training is
sufficient. Many in the sector believe it is poorly promoted as a career and there is not a clear
education and training pathway into some tourism occupations. Continued expected increase of
visitors from Asia, particularly China, will require workers to have language skills and an understanding
of these cultures.
Questions
1. Do the skill shortages we have forecast align with your expectations?
2. How do you think the occupational shortages identified should be overcome?
- Are existing programmes/initiatives having the desired outcomes?
- Should any existing initiatives be expanded?
Tourism Total UNI % in Tourism
Flight Attendant Level 4 300 521 58% 700 180
Travel Consultant Levels 1-3 456 854 53% 1,743 888
Hotel or Motel Manager Levels 5-6 535 1,055 51% 674 -380
Aeroplane Pilot Level 7+ 205 400 51% 239 -161
Commercial Housekeeper Levels 1-3 217 494 44% 464 -30
Hotel Service Manager Level 4 398 1,168 34% 1,301 133
Waiter Levels 1-3 1,527 4,878 31% 4,003 -875
Chef Level 4 916 2,943 31% 4,261 1,318
Cafe or Restaurant Manager Levels 5-6 690 2,262 30% 1,527 -735
Bar Attendant Levels 1-3 490 1,673 29% 1,526 -146
Barista Levels 1-3 351 1,218 29% 1,813 595
Kitchenhand Levels 1-3 865 3,202 27% 1,718 -1,483
Cafe Worker Levels 1-3 632 2,333 27% 2,146 -187
Accommodation and Hospitality Managers nec Levels 5-6 171 649 26% 384 -266
Cook Levels 1-3 315 1,276 25% 1,987 711
Office Cashier Levels 1-3 156 901 17% 579 -322
Job openings TOTAL UNI
Workers
Available
TOTAL UNI Wide
over/undersupply
of labour
OccupationIdeal qualif ication
level required

94
3. Are there any new education/training initiatives you would like to see established?
4. Is there a role the Upper North Island Strategic Alliance council group can play in helping to
address the shortages identified?