Untitled - Iowa Department of Administrative Services
236
-
Upload
khangminh22 -
Category
Documents
-
view
0 -
download
0
Transcript of Untitled - Iowa Department of Administrative Services

Cover: Dixie Cornell Gebhardt with the State of Iowa Flag Cira 1917 Handwritten note by Dixie Cornell Gebhardt, “One picture is worth a thousand words. Original photo was taken by Hostetter Des Moines, upon request of Iowa’s Governor. Flag used in above [front cover photo] is the Iowa flag presented by Iowa D.A.R. to Historical Society after World War I and never been replaced”.
Dixie Cornell Gebhardt Scrapbooks, Volume I, inside cover, State Historical Society of Iowa, Des Moines. Cira 1917.
Symbolism of Iowa’s State Flag The State of Iowa was almost 75 years old when the General Assembly adopted an official state flag. On March 29, 1921 the Iowa Legislature accepted the design, made by Mrs. Dixie Cornell Gebhardt of Knoxville, Iowa, as the official Iowa State Flag.
Mrs. Gebhardt was asked to explain the significance of its symbols. She responded that she felt the flag should reflect the teachings of the Stars and Stripes, and, at the same time embrace the history of Iowaland from the Indian Era, its discovery by the French, its purchase from Napoleon by President Jefferson, its admission to the union and its present grandeur.
It should be so simple that every school child could recognize its symbolism and know that it meant “IOWA”.
Blue, white and red are the colors. Those were the hues of France’s Tricolor, the insignia of Iowaland until the Louisiana Purchase in 1803. And in reverse, of course, they are the colors of America’s flag.
In Iowa’s flag, a vertical blue panel is at the left and a red panel is at the right. For the sake of symmetry and clarity, the white panel at the center is twice as wide as the red and blue stripes and forms the background for the central design.
Inspired By Seal For this design, Mrs. Gebhardt obtained inspiration from the Great Seal of Iowa. From that seal she selected the soaring eagle, our national bird, bearing in its beak blue streamers with Iowa’s state motto - “Our liberties we prize and our rights we will maintain”. Beneath in large crimson capitals, the name“IOWA”, so christened by the Indians, meaning “Beautiful land”.
“Thus”, Mrs., Gebhardt explains, “we have a state flag of blue, white and red, with perhaps if we so desire, a touch of gold. As in our national emblem the red is for courage, zeal and fervency; the white for purity, clean living and rectitude of conduct; and the blue for loyalty, devotion, friendship, justice and truth”.
Dixie Cornell Gebhardt Scrapbooks, State Historical Society of Iowa, Des Moines.

ANNUAL COMPREHENSIVE FINANCIAL REPORT
For the Fiscal Year Ended June 30, 2021
GOVERNOR: Kim Reynolds
PREPARED BY: Iowa Department of Administrative Services – State Accounting Enterprise
1

INTRODUCTORY SECTION
Letter of Transmittal 6-10
GFOA Certificate of Achievement 11
State of Iowa Organizational Chart 12
Principal Officials 13
FINANCIAL SECTION
INDEPENDENT AUDITOR'S REPORT 16-18
MANAGEMENT'S DISCUSSION AND ANALYSIS 19-33
BASIC FINANCIAL STATEMENTS
Government-wide Financial Statements
Statement of Net Position 36-37
Statement of Activities 39
Governmental Fund Financial Statements
Balance Sheet 42
Reconciliation of the Balance Sheet - Governmental Funds to the Statement of Net Position 43
Statement of Revenues, Expenditures and Changes in Fund Balances 44
Reconciliation of the Statement of Revenues, Expenditures and Changes in Fund Balances -
Governmental Funds to the Statement of Activities 45
Proprietary Fund Financial Statements
Statement of Net Position 48-49
Statement of Revenues, Expenses and Changes in Fund Net Position 50
Statement of Cash Flows 51-52
Fiduciary Fund Financial Statements
Statement of Fiduciary Net Position 54
Statement of Changes in Fiduciary Net Position 55
Component Unit Financial Statements
Statement of Net Position 58-59
Statement of Activities 60-61
Notes to the Financial Statements 63-143
REQUIRED SUPPLEMENTARY INFORMATION
Budgetary Comparison Schedule - General Fund 146-147
Budgetary Comparison Schedule - Budget to GAAP Reconciliation - General Fund 148
Notes to Required Supplementary Information - Budgetary Reporting 149-151
Schedule of the Proportionate Share of the Net Pension Liability 152
Schedules of Changes in Net Pension Liability and Related Ratios 153-154
Schedules of Contributions 155-157
Notes to Required Supplementary Information - Schedules of Contributions 158-161
Schedules of Changes in Total OPEB Liability and Related Ratios 162-163
Notes to Required Supplementary Information - Schedules of Changes in Total OPEB Liability
and Related Ratios 164-166
STATE OF IOWA
Annual Comprehensive Financial Report
Table of Contents
For the Fiscal Year Ended June 30, 2021
2

SUPPLEMENTARY INFORMATION
Nonmajor Governmental Funds
Combining Balance Sheet - By Fund Type 168
Combining Statement of Revenues, Expenditures and Changes in Fund Balances - By Fund Type 169
Nonmajor Special Revenue Funds
Combining Balance Sheet 172
Combining Statement of Revenues, Expenditures and Changes in Fund Balances 173
Combining Schedule of Revenues, Expenditures and Changes in Fund Balances - Budget and
Actual - Budgetary Basis 175-177
Nonmajor Capital Projects Funds
Combining Balance Sheet 180
Combining Statement of Revenues, Expenditures and Changes in Fund Balances 181
Nonmajor Permanent Funds
Combining Balance Sheet 184
Combining Statement of Revenues, Expenditures and Changes in Fund Balances 185
Proprietary Funds
Nonmajor Enterprise Funds
Combining Statement of Net Position 188
Combining Statement of Revenues, Expenses and Changes in Fund Net Position 189
Combining Statement of Cash Flows 190
Internal Service Funds
Combining Statement of Net Position 192
Combining Statement of Revenues, Expenses and Changes in Fund Net Position 193
Combining Statement of Cash Flows 194
Fiduciary Funds
Pension and Other Employee Benefit Funds
Combining Statement of Fiduciary Net Position 196
Combining Statement of Changes in Fiduciary Net Position 197
Private Purpose Trust Funds
Combining Statement of Fiduciary Net Position 200
Combining Statement of Changes in Fiduciary Net Position 201
Custodial Funds
Combining Statement of Fiduciary Net Position 204
Combining Statement of Changes in Fiduciary Net Position 205
STATISTICAL SECTION Schedule
Schedule of Net Position by Component 1 209
Schedule of Changes in Net Position 2 210-211
Schedule of Fund Balances of Governmental Funds 3 212
Schedule of Changes in Fund Balances of Governmental Funds 4 213
Schedule of Tax Revenue by Source - Governmental Funds 5 214
Schedule of Individual Income Tax Returns Filed and Tax Rates 6 215
Schedule of Retail Sales by Business Classification 7 216
Schedule of Ratios of Outstanding Debt by Type 8 217
Schedule of Revenue Bond Coverage 9 218-223
Schedule of Demographic and Economic Statistics 10 224
Schedule of Principal Non-governmental Employers 11 225
Schedule of Significant Classes of Capital Assets by Function 12 226-227
Schedule of Operating Indicators by Function 13 228
Schedule of Number of Employees - Primary Government 14 229
Schedule of Current Expenditures - General Fund 15 230
ACKNOWLEDGMENTS
3

1846Iowa State Capitol Iowa City, Iowa
2021Iowa State CapitolDes Moines, Iowa
State Historical Library and Archives of Iowa, State Historical Society of Iowa, Des Moines.
4

I N T R O D U C T O R Y
S E C T I O N
5

August 5, 2022
TO THE CITIZENS, GOVERNOR AND MEMBERS OF THE IOWA GENERAL ASSEMBLY
In accordance with Iowa Code Section 8A.502(8), we are pleased to submit the Annual Comprehensive
Financial Report for the State of Iowa for the fiscal year ended June 30, 2021. As required by State
statute, this report has been prepared in accordance with U.S. Generally Accepted Accounting Principles
(GAAP) for governments as promulgated by the Governmental Accounting Standards Board (GASB).
The Department of Administrative Services and the Department of Management are responsible for both
the accuracy of the presented data and the completeness and fairness of the presentation. We believe
the information presented is accurate in all material respects and the necessary disclosures have been
made in order to enable the reader to understand the State’s financial activity.
The State’s system of internal controls over assets recorded in the accounting system have been designed
to provide reasonable, but not absolute, assurance that assets are safeguarded against unauthorized
use or disposition and financial records from all appropriate sources are reliable for preparing financial
statements and maintaining accountability. The concept of reasonable assurance recognizes the cost of
internal controls should not exceed the benefits likely to be derived from their use. To monitor the
adequacy of internal controls, the Auditor of State reviews internal control procedures as an integral
part of departmental audits.
The Auditor of State is required by Iowa Code Chapter 11 to audit annually all departments of the State.
The accompanying basic financial statements of the State of Iowa have been audited by the Auditor of
State in accordance with U.S. generally accepted auditing standards and the standards applicable to
financial audits contained in Government Auditing Standards, issued by the Comptroller General of the
United States. The Auditor of State’s report appears elsewhere herein. In addition, the Auditor of State
conducts a single audit under the requirements set forth in the Single Audit Act of 1984, the Single
Audit Amendments of 1996 and Title 2, U.S. Code of Federal Regulations, Part 200, Uniform
Administrative Requirements, Cost Principles and Audit Requirements for Federal Awards (Uniform
Guidance) which is issued separately.
GAAP requires that management provide a narrative introduction, overview and analysis to accompany
the basic financial statements in the form of the Management’s Discussion and Analysis (MD&A). This
letter of transmittal is designed to complement the MD&A and should be read in conjunction with it.
The MD&A can be found immediately following the Independent Auditor’s Report.
6

PROFILE OF THE GOVERNMENT
The State of Iowa was admitted into the Union as the 29th state in 1846. Iowa is a midsize state with a
mid-continent location. It covers 56,272 square miles, making it the 26th largest state in the United
States. The Mississippi River carves out Iowa’s eastern border, while the flow of the Missouri River and
Big Sioux River forms the western border. Iowa has a population of 3.19 million.
In Iowa, government power is distributed among three branches. The Legislative branch creates laws
that establish policies and programs; the Executive branch carries out the policies and programs created
in the laws; and the Judicial branch resolves any conflicts arising from interpretation or application of
the laws. The Executive branch agencies are the Governor, Lieutenant Governor, Secretary of State,
Treasurer of State, Secretary of Agriculture, Attorney General, and Auditor of State, as well as 37
agencies led by appointed State officials. The Legislative branch is comprised of two houses, a 50
member Senate and a 100 member House of Representatives. The Judicial branch is presided over by
the Iowa Supreme Court, which is led by the Chief Justice of the Iowa Supreme Court.
The State provides a range of services such as education, health and human services, highway
maintenance and construction, natural resources and agriculture management, law enforcement, public
safety, and economic development programs.
This report includes all of the fund types, departments and agencies of the State, as well as the boards,
commissions, authorities and universities for which the State is financially accountable. Component
units also included in the report are the Iowa Finance Authority, Iowa Economic Development Authority,
Iowa State Fair Authority, Iowa Lottery Authority, University of Iowa Center for Advancement & Affiliate,
Iowa State University Foundation, University of Northern Iowa Foundation, University of Iowa Research
Foundation, and University of Iowa Health System. The reader is directed to Note 1.B in the Notes to
the Financial Statements for a more complete description of the factors used to define the reporting
entity.
State Budget and Budgetary Controls. The annual budgetary process serves as the foundation for the
State’s financial planning and control. Each year State departments submit budget requests to the
Governor’s Office by October 1. The State’s budget is prepared by the Governor on an annual basis and
is required to be submitted, along with proposed appropriation bills, to the General Assembly by
February 1 prior to the new fiscal year. The General Assembly approves appropriation bills which
establish spending authority for the upcoming fiscal year. The Governor has the ability to approve, veto
or item veto appropriation bills as they are presented to the Governor.
Departments may request revisions to allotments, appropriation transfers, or supplemental
appropriations. The Department of Management approves revised allotments within an appropriation,
subject to the Governor’s review. The Governor and the Department of Management approve all
appropriation transfers. The General Assembly and the Governor act on supplemental appropriation
bills in a manner similar to original appropriations. Appropriations lapse at fiscal year-end and all
unencumbered or unobligated balances revert to the State treasury, unless otherwise provided.
All claims presented for payment must be approved by the appropriate department. The expenditure
must be for a purpose intended by law and a sufficient existing and unexpended appropriation balance
must be available. Budgetary controls are incorporated into State accounting systems. The annual
budget of the State is established through separate appropriations to individual departments for specific
7

purposes, special outlays and/or operating expenditures. Budgetary control is essentially maintained
at the department level, except for certain grant and aid programs where control is maintained at the
program level.
ECONOMIC CONDITION AND OUTLOOK
COVID-19
The outbreak of the COVID-19 pandemic has globally affected travel, commerce and financial markets,
and is widely impacting economic growth worldwide. As vaccines have become available, markets are
opening back up and economic growth is coming back. While not at the levels before the pandemic, all
economic indicators are growing both nationally and at the State level.
National Economic Outlook 2021-2022
During calendar year 2020, real gross domestic product reduced by 3.4 percent due to the COVID-19
pandemic, reflecting a decrease from calendar year 2019 growth of 2.3 percent. According to Moody’s
Analytics, the projection for gross domestic product growth in calendar year 2021 is for a growth of 5.8
percent and continued growth into calendar year 2022 of 4.3 percent.
Job growth has been impacted by the COVID-19 pandemic. During calendar year 2020, 5.7 million jobs
were lost nationally. Projections provided by Moody’s Analytics for calendar year 2021 are for a recovery
of 2.8 million jobs, with growth to 3.9 million jobs in 2022.
State and Local Economy
Iowa’s economy is supported by a diverse mixture of industry, agriculture, services and government
employment. In calendar year 2020, 17.3 percent of the State’s gross domestic product was in
manufacturing, down from 18.9 percent 10 years ago. The finance, insurance, and real estate sectors have continued to be the largest part of the State’s economy at 25.6 percent during calendar year 2020,
up from 20.7 percent 10 years ago. Agriculture has dropped slightly from 4.5 percent in 2010 to 3.8
percent in 2020. However, with the continued impact of the COVID-19 pandemic in calendar year 2020,
Iowa’s real gross domestic product decreased 2.3 percent, ranking Iowa 8th nationally. The United
States’ average reduction in real gross domestic product during the calendar year was 3.5 percent
Personal Income. Personal income, as reported by the U.S. Department of Commerce, for the nation
increased 6.1 percent during calendar year 2020. Iowa’s personal income rose 6.8 percent for calendar
year 2020, ranking Iowa 18th in growth rate nationally.
Employment. Over the past 10 years, Iowa’s unemployment rate has been below the national average.
As of September 2021, the State’s unemployment rate stood at 4.0 percent, while the national average
stood at 4.8 percent. During calendar year 2020, nonfarm employment on a seasonally adjusted basis
decreased a net 71,200 jobs as the impact from the COVID-19 pandemic swept across the nation
impacting all sectors of the economy. During this time period, the leisure & hospitality sector lost 26,300
jobs, the education and health sector lost 10,900 jobs, the government sector lost 13,100 jobs and
manufacturing lost 7,900 jobs.
Exports. Exporting industries have been an important factor in Iowa’s economic growth since the 1990s.
Growth in exports of various agriculture and manufacturing commodities have helped diversify Iowa’s
economy. In calendar year 2020, according to the U.S. Census Bureau, the value of Iowa exports
decreased 4.4 percent, after decreasing 8.0 percent in calendar year 2019 and increasing 7.1 percent in
calendar year 2018.
8

For exported goods, Canada and Mexico remain Iowa’s first and second best trading partners,
respectively. In 2020, Iowa’s agricultural export value was second only to California nationally
Farmland Values. The Federal Reserve Bank of Chicago, in their August 2021 public release, reported
that farmland values for the Seventh Federal Reserve District (Chicago) had increased 14.0 percent from
a year ago for the second quarter of 2021. Farmland values in Iowa increased 18.0 percent for the period
July 1, 2020 to July 1, 2021. According to survey respondents, District farmland values were expected
to keep rising in the near future.
Manufacturing. Iowa’s manufacturing employment decreased from the 2019 average of 226,100 jobs to
the 2020 average of 216,600 jobs. During calendar year 2020, durable goods products accounted for
about 56.2 percent of manufacturing employment.
Financial Policies
The Governor and General Assembly have statutory responsibility to balance the budget.
• Spending is limited to 99.0 percent of adjusted revenues, 95.0 percent of any new revenue
implemented in a fiscal year, and any carry-over from the previous year.
• The Governor and the Legislature are required to use the revenue estimates agreed to by the
December Revenue Estimating Conference, or the spring estimate if it is lower, as a basis to
determine the General Fund budget for the following fiscal year.
• Two reserve funds have been created: The Cash Reserve Fund and the Economic Emergency Fund.
Expenditures from these funds are limited by statute for nonrecurring, emergency expenditures.
MAJOR INITIATIVES AND ISSUES
Tax Relief. During the 2021 legislative session, the General Assembly passed and Governor Reynolds
signed into law, SF 619 which provided $300 million in income tax cuts by removing triggers, $100
million in property tax relief by fully removing the mental health levy, and phase out the inheritance tax
with complete removal by January 2025.
Investing in Education. The General Assembly passed and the Governor signed legislation ensuring
every child and family in Iowa has an opportunity to attend school 100% in-person during the pandemic,
allowing parents to make health care decisions for their children by prohibiting schools from requiring
masks, expand charter schools, expanding open enrollment opportunities for families, invest a record
$3.418 billion in Prek-12 education, increase transportation equity and further reduce the pupil equity
gap to $145.
Ensuring Universal Broadband. The General Assembly passed and Governor Reynolds signed into law
HF 867 which invests $100 million in broadband to transform our infrastructure into a powerful
network, enabling fast, high quality connectivity across the entire state and resulting in one of the most
significant broadband build-outs in the nation.
9

10

Government Finance Officers Association
Certificate of Achievementfor Excellence
in Financial Reporting
Presented to
State of Iowa
For its Annual ComprehensiveFinancial Report
For the Fiscal Year Ended
June 30, 2020
Executive Director/CEO
11

Voters
Legislative BranchLegislative Branch Legislative BranchExecutive Branch Legislative BranchJudicial Branch
SenateSenateSupreme
CourtSupreme
Court
State CourtAdministrator
State CourtAdministrator
DistrictCourtDistrictCourt
Court ofAppealsCourt ofAppeals
SecretaryOf StateSecretaryof State
Auditorof StateAuditorof State
LieutenantGovernorLieutenantGovernor
Governor
Governor TreasurerOf StateTreasurerof State
AttorneyGeneralAttorneyGeneral
Secretaryof Agriculture
Secretaryof Agriculture
Department ofAdministrative
Services
Department ofAdministrative
ServicesDepartment ofManagementDepartment ofManagement
SenateDepartment of
Commerce
SenateIowa WorkforceDevelopment
SenateDepartment of
Inspections andAppeals
SenateDepartment of
Natural Resources
SenateDepartment on
Aging
SenateDepartment ofHuman Rights
SenateDepartment of
Human Services
SenateDepartment ofPublic Health
SenateDepartment of
Veterans Affairs
SenateDepartment for
the Blind
SenateCollege Student Aid Commission
SenateDepartment ofCultural Affairs
SenateDepartment of
Education
SenateIowa
CommunicationsNetwork
SenateDepartment of
Corrections
SenateIowa Law
EnforcementAcademy
SenateDepartment ofPublic Defense
SenateDepartment ofPublic Safety
SenateDepartment ofTransportation
Legislative ServiceAgency
Legislative ServicesAgency
House of Representatives
House of Representatives
SenateCivil RightsCommission
Department of Agriculture &
Land Stewardship
Iowa Finance Authority
SenateDepartment of
Revenue
Department of Justice
Citizen’sAid/Ombudsman
Citizens’Aide/Ombudsman
State of Iowa Organizational Chart
SenateIowa Veterans
Home
SenateDepartment of
Homeland Security
SenateIowa Economic Development
Authority
SenateIowa Fair
BoardSenate
Iowa Public Employees’ Retirement
System
SenateIowa Public Information
BoardSenate
Public Employment
Relations Board
SenateBoard of RegentsSenateBoard of Parole
SenateOffice of Drug Control Policy
Senate
Iowa Ethics and Campaign
Disclosure Board
Executive Branch
Agencies
SenateOffice of Chief
InformationOfficer
SenateIowa Lottery
Authority
12

GOVERNOR - Kim Reynolds
LIEUTENANT GOVERNOR - Adam Gregg
SECRETARY OF STATE - Paul D. Pate
AUDITOR OF STATE - Rob Sand
TREASURER OF STATE - Michael L. Fitzgerald
SECRETARY OF AGRICULTURE - Mike Naig
ATTORNEY GENERAL - Thomas J. Miller
PRESIDENT OF THE SENATE - Jake Chapman
SPEAKER OF THEHOUSE OF REPRESENTATIVES - Pat Grassley
CHIEF JUSTICE OFTHE SUPREME COURT - Susan Christensen
Elected Officials
Principal Officials
Legislative Branch
Judicial Branch
as of June 30, 2021
13

Crew working on excavation of Iowa State Capitol grounds. Des Moines, Iowa ca 1871
Crew laying foundation for Iowa’s new State CapitolBuilding, Des Moines, Iowa 1871
State Historical Library and Archives of Iowa, State Historical Society of Iowa, Des Moines.
14

F I N A N C I A LS E C T I O N
15

OFFICE OF AUDITOR OF STATESTATE OF IOWA
State Capitol Building
Des Moines, Iowa 50319-0006
Telephone (515) 281-5834 Facsimile (515) 281-6518
Rob Sand Auditor of State
Independent Auditor’s Report
To the Governor and Members of the General Assembly:
Report on the Financial Statements
We have audited the accompanying financial statements of the governmental activities, the business-type activities, the aggregate discretely presented component units, each major fund and the aggregate remaining fund information of the State of Iowa, as of and for the year ended June 30, 2021, and the related Notes to Financial Statements, which collectively comprise the State’s basic financial statements listed in the table of contents.
Management’s Responsibility for the Financial Statements
Management is responsible for the preparation and fair presentation of these financial statements in accordance with U.S. generally accepted accounting principles. This includes the design, implementation and maintenance of internal control relevant to the preparation and fair presentation of financial statements that are free from material misstatement, whether due to fraud or error.
Auditor’s Responsibility
Our responsibility is to express opinions on these financial statements based on our audit. We did not audit the financial statements of the Tobacco Settlement Authority, which is a major fund and represents less than 1% of the assets, the net position and the revenues of the governmental activities. We did not audit the Iowa PBS Foundation and the Iowa Public Radio, Inc., which represent less than 1% of the assets, the net position and the revenues of the governmental activities and less than 1% of the assets, the net position and the revenues of the aggregate remaining funds. We also did not audit the financial statements of the Iowa Finance Authority, the University of Iowa Center for Advancement and Affiliate, the Iowa State University Foundation, the University of Northern Iowa Foundation and the University of Iowa Health System, which represent a total of 95%, 93% and 67%, respectively, of the assets, the net position and the revenues of the aggregate discretely presented component units. Those financial statements were audited by other auditors whose reports have been furnished to us, and our opinion, insofar as it relates to the amounts included for the Tobacco Settlement Authority, the Iowa PBS Foundation, the Iowa Public Radio, Inc., the Iowa Finance Authority, the University of Iowa Center for Advancement and Affiliate, the Iowa State University Foundation, the University of Northern Iowa Foundation and the University of Iowa Health System, is based solely on the reports of the other auditors. We conducted our audit in accordance with U.S. generally accepted auditing standards and the standards applicable to financial audits contained in Government Auditing Standards, issued by the Comptroller General of the United States. Those standards require that we plan and perform the audit to obtain reasonable assurance about whether the financial statements are free from material misstatement. The financial statements of the Iowa PBS Foundation, the University of Iowa Center for Advancement and Affiliate, the Iowa State University Foundation and the University of Northern Iowa Foundation were not audited in accordance with Government Auditing Standards.

An audit involves performing procedures to obtain audit evidence about the amounts and disclosures in the financial statements. The procedures selected depend on the auditor’s judgment, including the assessment of the risks of material misstatement of the financial statements, whether due to fraud or error. In making those risk assessments, the auditor considers internal control relevant to the State of Iowa’s preparation and fair presentation of the financial statements in order to design audit procedures that are appropriate in the circumstances, but not for the purpose of expressing an opinion on the effectiveness of the State of Iowa’s internal control. Accordingly, we express no such opinion. An audit also includes evaluating the appropriateness of accounting policies used and the reasonableness of significant accounting estimates made by management, as well as evaluating the overall presentation of the financial statements.
We believe the audit evidence we have obtained is sufficient and appropriate to provide a basis for our audit opinions.
Opinions
In our opinion, based on our audit and the reports of the other auditors, the financial statements referred to above present fairly, in all material respects, the respective financial position of the governmental activities, the business-type activities, the aggregate discretely presented component units, each major fund and the aggregate remaining fund information of the State of Iowa as of June 30, 2021, and the respective changes in its financial position and, where applicable, its cash flows thereof for the year then ended in accordance with U.S. generally accepted accounting principles.
Other Matters
Required Supplementary Information
U.S. generally accepted accounting principles require Management’s Discussion and Analysis, the Budgetary Comparison Information, the Schedule of the Proportionate Share of the Net Pension Liability, the Schedules of Changes in Net Pension Liability and Related Ratios, the Schedules of Contributions and the Schedules of Changes in Total OPEB Liability and Related Ratios on pages 19 through 33 and 146 through 166 be presented to supplement the basic financial statements. Such information, although not a part of the basic financial statements, is required by the Governmental Accounting Standards Board who considers it to be an essential part of financial reporting for placing the basic financial statements in an appropriate operational, economic or historical context. We and the auditors of the Tobacco Settlement Authority, the Iowa Public Radio, Inc., the Iowa Finance Authority and the University of Iowa Health System have applied certain limited procedures to the required supplementary information in accordance with U.S. generally accepted auditing standards, which consisted of inquiries of management about the methods of preparing the information and comparing the information for consistency with management’s responses to the auditor’s inquiries, the basic financial statements and other knowledge obtained during our audit of the basic financial statements. We do not express an opinion or provide any assurance on the information because the limited procedures do not provide us with sufficient evidence to express an opinion or provide any assurance.
Supplementary and Other Information
Our audit was conducted for the purpose of forming opinions on the financial statements that collectively comprise the State of Iowa’s basic financial statements. The supplementary information identified in the Table of Contents and the Introductory and Statistical Sections are presented for purposes of additional analysis and are not a required part of the basic financial statements.
17
The supplementary information is the responsibility of management and was derived from and relates directly to the underlying accounting and other records used to prepare the basic financial statements. Such information has been subjected to the auditing procedures applied in the audit of the basic financial statements and certain additional procedures, including comparing and reconciling such information directly to the underlying accounting and other records used to prepare the basic financial statements or to the basic financial statements themselves, and other additional procedures in accordance with U.S. generally accepted auditing standards by us and the other auditors. In our opinion, based on our audit, the procedures performed as described above, and the reports of the other auditors, the supplementary information is fairly stated, in all material respects, in relation to the basic financial statements taken as a whole.
The Introductory and Statistical Sections have not been subjected to the auditing procedures applied in the audit of the basic financial statements and, accordingly, we do not express an opinion or provide assurance on them.
Other Reporting Required by Government Auditing Standards
Our report on the State of Iowa’s internal control over financial reporting and other tests of its compliance with certain provisions of laws, regulations, contracts and grant agreements and other matters required by Government Auditing Standards will be issued under separate cover. The purpose of that report is to describe the scope of our testing of internal control over financial reporting and compliance and the results of that testing, and not to provide an opinion on the internal control over financial reporting or on compliance. That report is an integral part of an audit performed in accordance with Government Auditing Standards and should be considered in assessing the results of our audits.
Ernest H. Ruben, Jr., CPA Deputy Auditor of State
August 5, 2022
18

MANAGEMENT’S DISCUSSION AND ANALYSIS
The Management’s Discussion and Analysis of the State of Iowa’s Annual Comprehensive Financial Report (ACFR) presents a discussion and analysis of the State’s financial performance during the fiscal year that ended on June 30, 2021. Readers are encouraged to consider this information in conjunction with the letter of transmittal located at the front of the Annual Comprehensive Financial Report and the State’s financial statements, which follow this section of the Annual Comprehensive Financial Report.
FINANCIAL HIGHLIGHTS – PRIMARY GOVERNMENT
Government-wide Highlights
• The assets and deferred outflows of resources of the State of Iowa exceeded its liabilities and deferred inflowsof resources at the close of fiscal year 2021 by $22,475.4 million (net position). Of this amount, $3,836.2million (unrestricted net position) is available to be used to meet the State’s ongoing obligations to citizens andcreditors.
• Total net position increased $2,354.4 million over the June 30, 2020 balance. Net position of governmentalactivities increased $1,810.8 million, or 15.6%, while net position of business-type activities increased $543.6million, or 6.4%.
• In the State’s governmental activities, revenues increased 13.2% to $21,982.3 million while expenses increased10.8% to $19,477.8 million.
• For business-type activities, revenues increased 12.0% to $8,176.9 million while expenses increased 5.2% to$8,327.0 million.
Fund Highlights
• The State’s governmental funds reported a combined ending fund balance of $3,924.4 million, a $1,084.0million increase over the prior year. Of this amount, $138.9 million represents nonspendable fund balances,$838.1 million represents spendable restricted fund balances, $3,389.1 million represents spendablecommitted fund balances and a negative $441.8 million represents unassigned fund balances.
• The General Fund total fund balance increased $1,101.1 million to $3,752.7 million.
• The proprietary funds reported net position at year-end of $9,290.3 million, an increase of $573.0 million overthe June 30, 2020 net position.
Long-term Debt
• The State’s total long-term debt decreased $137.4 million to $3,115.2 million during the current fiscal year.
OVERVIEW OF THE FINANCIAL STATEMENTS
The Financial Section of the Annual Comprehensive Financial Report consists of four parts – management’s discussion and analysis (this section), the basic financial statements, required supplementary information and an optional section that presents supplementary information.
Basic Financial Statements
The basic financial statements include the government-wide financial statements, the fund financial statements and the notes to the financial statements.
Government-wide Financial Statements
The government-wide financial statements are designed to provide readers with a broad overview of the State’s financial activity. These statements are prepared using the accrual basis of accounting and the economic resources measurement focus, in a manner similar to a private-sector business.
• The Statement of Net Position presents financial information on all of the State’s assets, liabilities, anddeferred outflows/inflows of resources, with the difference reported as net position. Over time, increasesor decreases in net position may serve as a useful indicator of whether the financial position of the State isimproving or deteriorating, respectively.
19

• The Statement of Activities presents information showing how the State’s net position changed during themost recent fiscal year. This statement is formatted to report direct expenses, program revenues and thenet revenues or expenses for each of the State’s governmental functions and business-type activities. Thisformat identifies the extent to which each function is self-financed or is supported by the general revenuesof the State.
The government-wide financial statements of the State are divided into three categories:
• Governmental activities – Most services generally associated with State government, such as administration& regulation, education, health & human rights, human services, justice & public defense, economicdevelopment, transportation and agriculture & natural resources, are included in this category.
• Business-type activities – State operations such as the Universities and the Unemployment Benefits Fundthat charge fees to external customers and function similarly to private businesses are included here.
• Component units – These are operations that are legally separate from the State, but for which the State isfinancially accountable. The State’s discretely presented component units are:
- Iowa Finance Authority (Business-type)
- Iowa Economic Development Authority (Business-type)
- Iowa State Fair Authority (Business-type)
- Iowa Lottery Authority (Business-type)
- University of Iowa Center for Advancement & Affiliate (Business-type)
- Iowa State University Foundation (Business-type)
- University of Northern Iowa Foundation (Business-type)
- University of Iowa Research Foundation (Business-type)
- University of Iowa Health System (Business-type)
Additional information about the State’s component units is presented in NOTE 1-B of the Notes to the Financial Statements.
Fund Financial Statements
The fund financial statements provide more detailed information about the State’s most significant funds. The State has three types of funds:
• Governmental funds – Most of the basic services provided by the State are accounted for in governmentalfunds. Governmental funds use the modified accrual basis of accounting and the flow of current financialresources measurement focus. Modified accrual accounting is used to show the flow of financial assets ofthe funds and the balances available for spending at year-end. These statements provide a detailed short-term view that assists in determining whether there are adequate financial resources available to meet thecurrent needs of the State. Because this information does not encompass the long-term focus of thegovernment-wide statements, reconciliation schedules accompany the governmental funds statements. TheGeneral Fund, Tobacco Settlement Authority and Tobacco Collections Fund are the State’s majorgovernmental funds. Nonmajor governmental funds are reported by fund type in the Combining FinancialStatements – Nonmajor Funds.
• Proprietary funds – Services for which the State charges customers a fee are generally reported in proprietaryfunds. Proprietary funds use the accrual basis of accounting and, like the government-wide statements,provide both long-term and short-term financial information.
- The State’s enterprise funds (one type of proprietary fund) are used to report activities, such as theuniversities, that are presented as business-type activities in the government-wide statements.
- The State’s internal service funds (the other type of proprietary fund) are used to account for activitiesthat provide supplies and services for other State programs and activities – such as the Workers’Compensation Fund.
The University Funds and the Unemployment Benefits Fund are the State’s major proprietary funds. Nonmajor proprietary funds are reported by fund type in the Combining Financial Statements – Nonmajor Funds.
• Fiduciary funds – These funds are used to report the resources of individuals or organizations, outside theState, which the State holds as trustee or similar arrangement, or controls without administrative
20

involvement, such as the Iowa Public Employees’ Retirement System and the Iowa Educational Savings Plan Trust. Similar to proprietary funds, these funds use the accrual basis of accounting. Because the State cannot use these assets to finance its operations, fiduciary funds are not included in the government-wide financial statements discussed above.
Notes to the Financial Statements
The notes provide additional information that is essential to fully understand the government-wide and fund financial statements. The notes also explain some of the information contained in the financial statements and present more detail than is practical in the financial statements.
Required Supplementary Information
In addition to this Management’s Discussion and Analysis, Required Supplementary Information (RSI) includes the Budgetary Comparison Schedule. This schedule presents both the original and final appropriated budget for major funds. The Budgetary Comparison Schedule is accompanied by a Budget to GAAP Reconciliation and by Notes to
Governmental Funds Proprietary Funds Fiduciary Funds
Scope Entire State government
(except fiduciary funds)
and the State's component
units
The activities of the State
that are not proprietary or
fiduciary, such as Human
Services and
Transportation
Activities the State
operated similar to private
businesses; the
Universities and the Iowa
Communications Network
Instances in which the
State or a component unit
is the trustee or controls
resources held for the
benefit of others, such as
the retirement plan for
public employees
Statement of net position Balance sheet Statement of net position Statement of fiduciary net
position
Statement of activities Statement of revenues,
expenditures, and changes
in fund balances
Statement of revenues,
expenses, and changes in
fund net position
Statement of cash flows
Statement of changes in
fiduciary net position
Accounting
basis and
measurement
focus
Accrual accounting and
economic resources focus
Modified accrual
accounting and current
financial resources focus
Accrual accounting and
economic resources focus
Accrual accounting and
economic resources focus
Type of asset/
liability
information
All assets and liabilities,
both financial and capital,
and short-term and long-
term
Only assets expected to be
used up and liabilities that
come due during the year
or soon thereafter; no
capital assets included
All assets and liabilities,
both financial and capital,
and short-term and long-
term
All assets and liabilities,
both short-term and long-
term, and capital assets
Type of
deferred
outflow/inflow
information
Consumption/acquisition
of net position that is
applicable to a future
reporting period
Consumption/acquisition
of fund balance that is
applicable to a future
reporting period
Consumption/acquisition
of net position that is
applicable to a future
reporting period
Consumption/acquisition
of net position that is
applicable to a future
reporting period
Type of inflow/
outflow
information
All revenues and expenses
during the year, regardless
of when cash is received or
paid
Revenues for which cash is
received during or soon
after the end of the year;
expenditures when goods
or services have been
received and payment is
due during the year or
soon thereafter
All revenues and expenses
during the year,
regardless of when cash is
received or paid
All revenues and expenses
during the year, regardless
of when cash is received or
paid
Table 1
Major Features of the State's Government-wide and Fund Financial Statements
Government-wide
Statements
Fund Statements
Required
financial
statements
21
RSI. Schedules of Net Pension Liability and a Schedule of Contributions for each pension plan along with accompanying Notes to RSI and a Schedule of Changes in Total OPEB Liability and Related Ratios for each OPEB plan along with accompanying Notes to RSI are also presented.
Supplementary Information
The Supplementary Information includes combining financial statements for non-major governmental funds, non-major enterprise funds, internal service funds and fiduciary funds, which are added together and presented in single columns in the basic financial statements.
FINANCIAL ANALYSIS OF THE STATE AS A WHOLE
Net Position
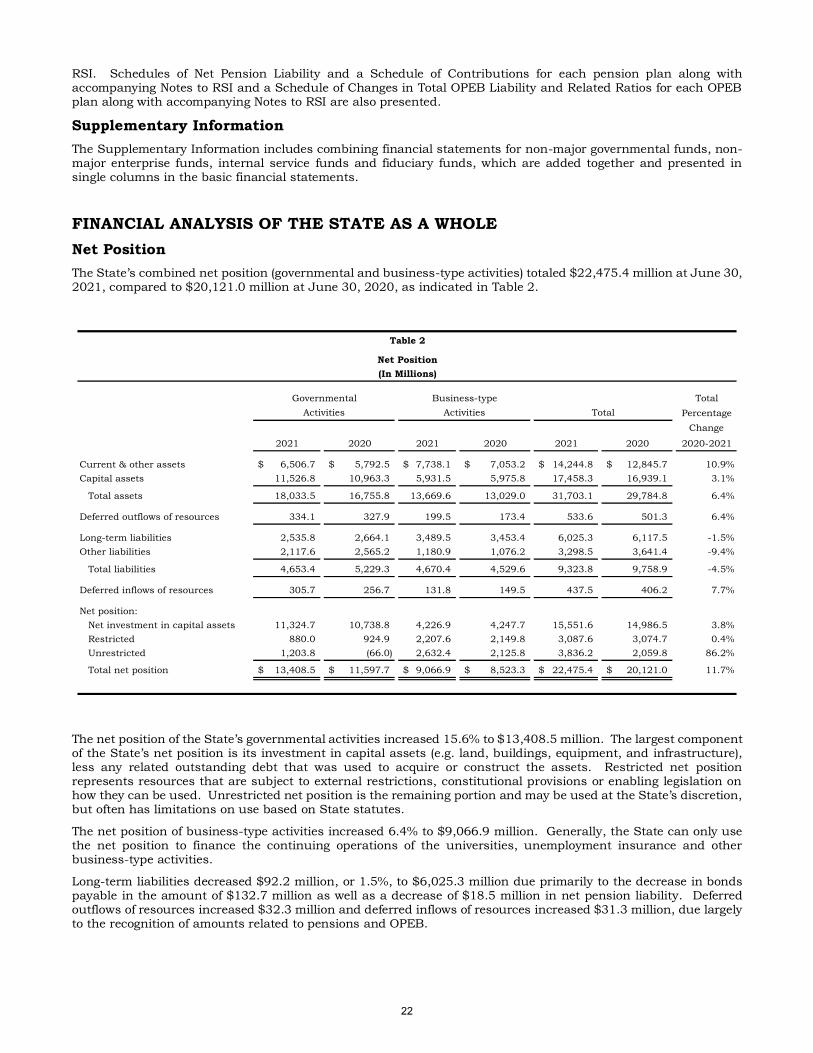
The State’s combined net position (governmental and business-type activities) totaled $22,475.4 million at June 30, 2021, compared to $20,121.0 million at June 30, 2020, as indicated in Table 2.
The net position of the State’s governmental activities increased 15.6% to $13,408.5 million. The largest component of the State’s net position is its investment in capital assets (e.g. land, buildings, equipment, and infrastructure), less any related outstanding debt that was used to acquire or construct the assets. Restricted net position represents resources that are subject to external restrictions, constitutional provisions or enabling legislation on how they can be used. Unrestricted net position is the remaining portion and may be used at the State’s discretion, but often has limitations on use based on State statutes.
The net position of business-type activities increased 6.4% to $9,066.9 million. Generally, the State can only use the net position to finance the continuing operations of the universities, unemployment insurance and other business-type activities.
Long-term liabilities decreased $92.2 million, or 1.5%, to $6,025.3 million due primarily to the decrease in bonds payable in the amount of $132.7 million as well as a decrease of $18.5 million in net pension liability. Deferred outflows of resources increased $32.3 million and deferred inflows of resources increased $31.3 million, due largely to the recognition of amounts related to pensions and OPEB.
Total
Percentage
Change
2021 2020 2021 2020 2021 2020 2020-2021
Current & other assets 6,506.7$ 5,792.5$ 7,738.1$ 7,053.2$ 14,244.8$ 12,845.7$ 10.9%
Capital assets 11,526.8 10,963.3 5,931.5 5,975.8 17,458.3 16,939.1 3.1%`
Total assets 18,033.5 16,755.8 13,669.6 13,029.0 31,703.1 29,784.8 6.4%
Deferred outflows of resources 334.1 327.9 199.5 173.4 533.6 501.3 6.4%
Long-term liabilities 2,535.8 2,664.1 3,489.5 3,453.4 6,025.3 6,117.5 -1.5%
Other liabilities 2,117.6 2,565.2 1,180.9 1,076.2 3,298.5 3,641.4 -9.4%`
Total liabilities 4,653.4 5,229.3 4,670.4 4,529.6 9,323.8 9,758.9 -4.5%
Deferred inflows of resources 305.7 256.7 131.8 149.5 437.5 406.2 7.7%
Net position:
Net investment in capital assets 11,324.7 10,738.8 4,226.9 4,247.7 15,551.6 14,986.5 3.8%
Restricted 880.0 924.9 2,207.6 2,149.8 3,087.6 3,074.7 0.4%
Unrestricted 1,203.8 (66.0) 2,632.4 2,125.8 3,836.2 2,059.8 86.2%`
Total net position 13,408.5$ 11,597.7$ 9,066.9$ 8,523.3$ 22,475.4$ 20,121.0$ 11.7%
Activities Activities Total
Table 2
Net Position
(In Millions)
Governmental Business-type
22

Other liabilities decreased 9.4% to $3,298.5 million. The $342.9 million decrease resulted mostly from increases of $191.4 million in accounts payable & accruals, a decrease of $510.9 million in unearned revenue, as well as a decrease of $13.3 million in short-term bonds payable.
The chart presented below provides a visual representation of the three components of the State’s total net position of $22,475.4 million at June 30, 2021.
(Continued on next page.)
Net Investment in Capital Assets,
$15,551.6
Restricted, $3,087.6
Unrestricted, $3,836.2
Total Net Position (In Millions)
23

Changes in Net Position The State’s total net position increased by $2,354.4 million from June 30, 2020 to June 30, 2021, as indicated in
Table 3.
Governmental Activities
Overall, total revenues for governmental activities increased 13.2% over the prior year. Program revenues increased $1,547.5 million, or 15.9%, with most of the increase in operating grants & contributions. General revenues increased $1,008.2 million, or 10.4%, with taxes comprising the largest change.
Operating grants & contributions increased $1,540.6 million, or 22.2%. The largest contributors to this increase were: a $839.7 million increase in human services revenues, largely due to a pandemic related increase in the federal participation rate for medical assistance, a $306.9 million increase in education revenues, directly associated with the receipt of pandemic funding for child nutrition programs, and a $193.9 million increase in administration & regulation revenues, resulting directly from the receipt of federal assistance for pandemic relief.
Total
Percentage
Change
2021 2020 2021 2020 2021 2020 2020-2021
Program revenues
Charges for services 2,269.5$ 2,238.3$ 4,946.3$ 4,745.7$ 7,215.8$ 6,984.0$ 3.3%
Operating grants & contributions 8,491.4 6,950.8 2,563.1 2,283.9 11,054.5 9,234.7 19.7%
Capital grants & contributions 520.3 544.6 33.2 31.7 553.5 576.3 -4.0%
General revenues
Personal income tax 4,224.6 3,945.9 - - 4,224.6 3,945.9 7.1%
Corporate income tax 799.5 634.5 - - 799.5 634.5 26.0%
Sales & use tax 3,510.0 3,121.6 - - 3,510.0 3,121.6 12.4%
Other tax 902.7 812.9 11.0 8.3 913.7 821.2 11.3%
Restricted for transportation purposes:
Motor fuel tax 673.7 670.2 - - 673.7 670.2 0.5%
Road use tax 444.5 382.8 - - 444.5 382.8 16.1%
Unrestricted investment earnings 14.6 55.7 473.8 162.8 488.4 218.5 123.5%
Other 131.5 69.3 149.5 70.1 281.0 139.4 101.6%
Total revenues 21,982.3 19,426.6 8,176.9 7,302.5 30,159.2 26,729.1 12.8%
Expenses
Administration & regulation 2,500.6 2,077.5 - - 2,500.6 2,077.5 20.4%
Education 4,839.7 4,418.4 - - 4,839.7 4,418.4 9.5%
Health & human rights 565.0 455.8 - - 565.0 455.8 24.0%
Human services 8,497.2 7,687.3 - - 8,497.2 7,687.3 10.5%
Justice & public defense 1,207.7 1,136.2 - - 1,207.7 1,136.2 6.3%
Economic development 173.5 140.9 - - 173.5 140.9 23.1%
Transportation 1,367.6 1,354.5 - - 1,367.6 1,354.5 1.0%
Agriculture & natural resources 268.1 238.5 - - 268.1 238.5 12.4%
Interest expense 58.4 65.4 - - 58.4 65.4 -10.7%
University Funds - - 5,600.8 5,349.6 5,600.8 5,349.6 4.7%
Unemployment Benefits Fund - - 2,353.8 2,234.6 2,353.8 2,234.6 5.3%
Other - - 372.4 334.7 372.4 334.7 11.3%
Total expenses 19,477.8 17,574.5 8,327.0 7,918.9 27,804.8 25,493.4 9.1%
Increase (decrease) in net position
before special item and transfers 2,504.5 1,852.1 (150.1) (616.4) 2,354.4 1,235.7 90.5%
Transfers (693.7) (968.9) 693.7 968.9 - - 0.0%
Increase in net position 1,810.8 883.2 543.6 352.6 2,354.4 1,235.8 90.5%
Net position - July 1 11,597.7 10,714.5 8,523.3 8,170.7 20,121.0 18,885.2 6.5%
Net position - June 30 13,408.5$ 11,597.7$ 9,066.9$ 8,523.3$ 22,475.4$ 20,121.0$ 11.7%
Activities Activities Total
Table 3
Changes in Net Position
(In Millions)
Governmental Business-type
24

Charges for services increased $31.2 million, or 1.4%. The largest fluctuations include an increase of $93.7 million, or 9.0% in administration and regulation and a net decrease of $117.6 million, or 14.2%, in human services.
Capital grants & contributions decreased $24.3 million, or 4.5%. This change is attributable to a decrease of $22.1 million in transportation resulting from annual fluctuations in the completion of projects and the receipt of the related federal funding, and to smaller changes that occurred in other functions.
General revenues experienced a net increase of $1,008.2 million, or 10.4%, over fiscal year 2020. This is due in part to increases in sales & use tax of $388.4 million, or 12.4%, in personal income tax of $278.7 million, or 7.1%, in corporate income tax of $165.0 million, or 26.0%, and in other taxes of $89.8 million, or 11.0%. Investment income decreased by $41.1 million or 73.8%.
A significant amount of the fluctuation in tax revenues in fiscal year 2021 were a consequence of the lessening of measures taken during fiscal year 2020 to mitigate the impact of the pandemic, creating a rebounding effect. Other factors contributing to the change in sales and use tax were an increase to receipts due to greater consumer spending during fiscal year 2021 as well as an expansion on the sales and use tax base to include digital goods and the requirement for online retailers and marketplace facilitators to collect the tax. The largest factor contributing to the change in other taxes was a $10.7 million decrease in local transit guest tax receipts due to a decline in travel in response to the pandemic.
Revenues by Source
Overall, total expenses for governmental activities increased 10.8% over the prior year.
Expenses increased most significantly in human services, $809.9 million, administration & regulation, $423.1 million, education, $421.3 million, and health & human rights, $109.2 million. The increase in human services is largely related to medical assistance and food assistance programs where payments increased most significantly as a result of the pandemic. Increases in administration & regulation and health & human rights functions also occurred primarily as a result of payments made for various activities and programs in response to the pandemic emergency. The increase in education is primarily due to an increase in state aid to schools of $114.0 million, accompanied by the addition of $186.4 million in CARES School Emergency Relief.
Taxes48.0%
Other0.7%
Grants & Contributions41.0%
Charges for Services10.3%
25

Expenses by Function
Program Revenues and Expenses
Education24.9%
Health & Human Rights2.9%Administration & Regulation
12.9%
Justice & Public Defense6.2%
Transportation7.0%
Other2.3%
Human Services43.8%
268.1
1,367.6
173.5
1,207.7
8,497.2
565.0
4,839.7
2,500.6
144.5
707.9
88.7
452.6
6,474.3
447.4
948.8
2,017.0
Agriculture & NaturalResources
Transportation
Economic Development
Justice & Public Defense
Human Services
Health & Human Rights
Education
Administration & Regulation
Dollars - Expressed in Millions
Program Revenues Expenses
26

The cost of all governmental activities this fiscal year was $19,477.8 million. However, the amount that taxpayers paid for these activities through State taxes was $10,555.0 million. Part of the cost was paid by:
- Those who directly benefited from the programs ($2,269.5 million) or
- Other governments and organizations that subsidized certain programs with operating and capitalgrants and contributions ($9,011.7 million).
Business-type Activities
• University Funds had $5,600.8 million in expenses and $4,934.4 million in program revenues for netexpenses of $666.4 million. The largest change in revenues occurred in charges for services, whichincreased $152.0 million, or 3.9%. The increase was mainly due to an increase in patient services at theUniversity of Iowa Hospitals and Clinics (UIHC) and continued services to patients during COVID-19.Operating grants & contributions only increased by $1.0 million, or 0.1%, capital grants & contributionsrevenue increased $1.5 million, or 4.8%, due mainly to private gifts for the Sports Performance Center,Gerdin Business Building, Poultry Farm teaching and research facilities, and the Curtiss Farm feed milland grain science complex at Iowa State University. Operating expenses increased $267.8 million, or 5.1%.The increase is largely attributed to the provision of patient services at the UIHC during the COVID-19pandemic. Investment income increased $318.8 million, or 242.7%, due to the rebounding marketperformance following COVID-19. Assets increased $694.9 million to $11,970.6 million due to an increaseof $708.7 million in noncurrent cash & investments largely due to the increase in investment returns fromthe previous year. Liabilities increased $193.7 million, due mainly to bond issuances at ISU and UNI.Deferred outflows of resources increased $25.2 million and deferred inflows of resources decreased $17.8million, both primarily due to the recognition of amounts related to pensions and OPEB.
• The Unemployment Benefits Fund had $2,353.8 million in expenses, $2,096.5 million in program revenueswith net expenses of $257.3 million. Employer contributions decreased $3.3 million, or 0.8%, due toreductions in workforce as a result of the COVID-19 pandemic. Unemployment benefit payments increased$119.2 million, or 5.3%, due to the continued increase in claim filings as a result of the UnemploymentBenefits program expansion in response to the economic situation due to the pandemic.
• Other business-type activities expenses increased $37.7 million and program revenues increased $52.0million. The Liquor Control Act Fund which accounts for the revenues and expenses related to the sale ofalcoholic beverages experienced a $49.9 million increase in operating revenues and a $35.6 million increasein operating expenses. In addition, the Iowa Prison Industries experienced a $2.3 million increase inoperating revenue and a $2.4 million increase in operating expenses.
• In total, business-type activities had net expenses of $784.3 million, $634.3 million in net general revenuesand $693.7 million in net transfers, for a net increase of $543.7 million, to end with a net position of$9,066.9 million.
FINANCIAL ANALYSIS OF THE STATE’S FUNDS
Governmental Funds
The governmental funds reported total fund balances of $3,924.4 million, an increase of 38.2% over the previous year. Net revenues totaled $21,950.9 million with expenditures of $20,210.5 million.
Fund balance classifications for governmental funds are reported in categories which describe the extent to which certain resources may be spent. Resources are categorized as spendable or nonspendable.
Nonspendable fund balances include inventory, prepaid items, noncurrent receivables and the principal of endowments. These resources cannot be spent because they are either not in spendable form or are legally required to remain intact. When the proceeds from noncurrent receivables are restricted, committed or assigned, the fund balances for those amounts will be reported in the appropriate spendable fund balance classification.
Spendable fund balances include resources that are in spendable form (e.g. cash) and are available for spending. Spendable fund balances are further classified as restricted, committed, assigned or unassigned. The following describes the different levels of constraint, if any, on spendable fund balance classifications for the total governmental funds:
• Restricted – $838.1 million and $1,006.4 million for FY2021 and FY2020, respectively, includes amountsthat can be spent only for the specific purposes stipulated by constitution, external resource providers (e.g.creditors, grantors and contributors) or enabling legislation.
27

• Committed – $3,389.1 million and $2,161.1 million for FY2021 and FY2020, respectively, includes amountsthat can be used only for the specific purposes determined by a formal action of the State’s highest level ofdecision-making authority. The Iowa Legislature and Governor represent the State’s highest level ofdecision-making authority. Formal action consists of legislation passed by both the House and Senate andsigned by the Governor and is required to establish, modify or rescind a limitation.
• Assigned – Includes amounts intended to be used by the State for a specific purpose but do not meet thecriteria to be classified as restricted or committed. Currently, the State does not have a policy whichauthorizes the establishment of assigned fund balances.
• Unassigned – Negative $441.8 million and negative $442.6 million for FY2021 and FY2020, respectively,includes the residual amount of the General Fund not included in the categories above, which is availablefor any purpose, and any negative fund balances in the other governmental fund types.
The State’s modified accrual revenue recognition policy for governmental fund statements recognizesrevenues if received within sixty days of year-end and deferred inflows of resources if received past sixtydays. This creates a negative impact when the payables/expenditures related to the deferred inflows ofresources are recognized in the statements. A portion of the negative unassigned fund balance is due todeferral of federal receivables/revenues while associated payables/expenditures have been recognized. Inaddition, a portion of the negative unassigned fund balance relates to the Tobacco Collections Fund deficit(See NOTE 21 – DEFICIT FUND BALANCE).
General Fund
The General Fund is the chief operating fund of the State. Total fund balance increased from $2,651.6 million for fiscal year 2020 to $3,752.7 million for fiscal year 2021. The fiscal year 2021 General Fund consists of the following fund balances: $122.3 million nonspendable, an increase of 23.0%, $679.6 million restricted, a decrease of 11.7%, $3,349.0 million committed, an increase of 56.5%, and negative $398.2 million unassigned, an increase of 11.3%. For fiscal year 2021, the committed fund balance includes $795.4 million in reserve (rainy day) funds, an increase of 2.0%.
Gross revenues of the General Fund increased $2,552.3 million, or 12.0%, in fiscal year 2021. Receipts from other entities increased $1,611.3 million, mainly due to federal pandemic aid. Fiscal year 2021 federal revenues included an additional $329.4 million in Food Assistance – SNAP EBT due to increased costs associated with the pandemic, a net increase of $418.6 million in Medical Assistance, $114.0 million for federal school pandemic economic aid, and $103.6 million for information technology and broadband. Taxes increased $933.8 million over fiscal year 2020, to $11,314.2 million in fiscal year 2021. Major contributors to the tax revenue increase include a $384.6 million increase in sales and use tax, as a result of greater consumer spending with online retailers and a $429.1 million increase in wagering tax following the due to the reopening of casinos following the pandemic. Investment income decreased $48.2 million and fees, licenses & permits increased $158.5 million. Net revenues were negatively impacted as tax refunds increased $71.0 million, or 3.6% over 2020 refunds.
Total expenditures of the General Fund increased $1,994.2 million in fiscal year 2021, primarily due to the pandemic emergency. Examples include an increase in Education expenditures of $422.6 million due to a $210.5 million increase for child nutrition programs related to the pandemic as well as expenditures of $183.0 million for health safety education. Human Services expenditures increased $366.0 million for EBT and other COVID related services.
Capital outlays increased $75.3 million due primarily to fluctuations in Department of Transportation projects as well as an increase in capital outlays of $18.7 million by the Department of Natural Resources including $13.7 million of depreciable land improvements and $5 million in land purchases. Additionally, the Judicial Department implemented new audio/visual recorders for every courthouse resulting in an increase of $6.1 million.
Tobacco Settlement Authority
The Tobacco Settlement Authority (Authority), a blended component unit of the State of Iowa classified as a special revenue fund, receives money from the Tobacco Collections Fund to pay operating expenditures and for repayment of debt. During 2021, the Authority issued approximately $688.8 million of Tobacco Settlement Asset-backed Bonds with a par amount of $2,022.4 million. The proceeds of the 2021 Bonds were used to refund the series 2005 Bonds, fund a debt service reserve account and pay costs of issuance. The Authority’s ending fund balance decreased $91.1 million to $75.1 million. The decrease was due to the combined effects of receipt of funds from the Tobacco Collections Fund which reduced the interfund advance (receivable), removal of the Guaranteed Insurance Contract required for the 2005 Bonds but not the required 2021 Bonds, and a decrease in liabilities primarily due to the favorable pricing on the 2021 Bonds. Funds of the Authority were primarily used to pay principal and interest on bonds totaling $90.8 million and $36.8 million, respectively.
28

Tobacco Collections Fund
The Tobacco Collections Fund, a special revenue fund, accounts for the tobacco settlement moneys received pursuant to a Master Settlement Agreement between the State of Iowa and the five largest tobacco manufacturers. The ending fund balance in the Tobacco Collections Fund increased $41.3 million to a deficit balance of $43.5 million. The increase is due to the reduction of the interfund advance (liability) for the tobacco settlement moneys remitted to the Tobacco Settlement Authority during the year.
Proprietary Funds
The State of Iowa’s proprietary funds provide the same type of information found in the government-wide financial statements, but in more detail.
Total net position of the University Funds increased $544.2 million to $7,481.2 million, while unrestricted net position increased $505.5 million to $2,614.8 million.
The total net position of the Unemployment Benefits Fund, which is entirely restricted for unemployment benefits, decreased $1.6 million to end fiscal year 2021 at $1,535.9 million.
The nonmajor enterprise funds total net position decreased $0.3 million, or 0.5%, to $55.6 million. The Iowa Communications Network net position decreased $1.5 million, or 12.0%, to $10.7 million. The decrease in net position is primarily due to a decrease in outdated equipment that has been replaced by an upgraded network over the course of several prior years.
Other factors concerning the finances of proprietary funds have previously been addressed in the discussion of the State of Iowa’s business-type activities.
University Funds, 80.5%
Unemployment Benefits Fund,
16.5%
Nonmajor Enterprise
Funds, 0.6%Internal Service
Funds, 2.4%
Total Net Position - Proprietary Funds
29

General Fund Budgetary Highlights
Over the course of the year, the State revised the budget several times. These budget amendments fall into two categories:
• Supplemental appropriations: $44,230,000
• Adjustments to standing appropriations: $4,111,898
The 2020 legislative session started on January 13, 2020. However, due to the COVID-19 pandemic, the session was suspended on March 16, 2020. Before the Legislature reconvened, the REC met on May 29, 2020 to review the impact the COVID-19 pandemic and subsequent closures had on the national and state economies. The REC lowered the fiscal year 2021 estimate from March 2020 by $64.6 million to $7,876.6 million or -0.8 percent reduction from fiscal year 2020. The legislative session reconvened on June 3, 2020 and finished its work on June 14, 2020.
The originally enacted General Fund budget for fiscal year 2021 of $7,778.5 million was predicated on $7,876.6 million, or a slightly less than 1% decrease in General Fund revenues, as projected by the State’s Revenue Estimating Conference (REC) on May 29, 2020.
At the October 13, 2020 meeting, the REC revised its fiscal year 2021 General Fund revenue estimate upward $35.1 million and with a finalized FY2020 base, the revenue growth was flat. This change was based upon the finalized base for fiscal year 2020 at nearly 1%. On December 11, 2020, the REC increased the estimate to $7,969.3 million, an increase of $38.7 million. On March 19, 2021, the REC raised the revenue estimate to $8,078.9 million, or 1.9 percent growth.
During the 2021 legislative session, the legislature passed and Governor Reynolds signed two appropriation bills which contained supplemental appropriations from the General Fund totaling $44.2 million for fiscal year 2021, both to provide funding for the purchase and installation of the new ERP system for the State.
The State of Iowa has various statutory standing appropriations where a fixed amount is not appropriated. These are either formula-driven (as in the case of the largest General Fund appropriation, for school foundation aid to local school districts), or for items such as paying claims against the State through the State Appeal Board. These are either increases or decreases to the estimates made at the beginning of the year. For fiscal year 2021, these standing appropriations were more than the original estimates by $4.1 million. A variety of standing appropriations make up the changes to standing appropriations.
During April, May and June of 2021, and throughout the accrual period, actual General Fund revenue collections continued to run ahead of the revised projections. At the close of fiscal year 2021, revenue collections totaled $8,800.6 million, which is 11.0 percent growth over fiscal year 2020.
30

CAPITAL ASSET AND DEBT ADMINISTRATION
Capital Assets
At June 30, 2021, the State had $17,458.3 million invested in capital assets, net of accumulated depreciation of $16,923.2 million. Depreciation charges totaled $1,120.6 million in fiscal year 2021. The details of these assets are presented in Table 4. Additional information about the State’s capital assets is presented in NOTE 6 of the financial statements.
In the governmental activities, capital assets, net of accumulated depreciation, increased $563.5 million, or 5.1%, to $11,526.8 million. The largest changes were in infrastructure (an increase of $495.0 million, or 6.0%), computer software in progress (an increase of $35.4 million, or 85.5%), computer software (an increase of $23.4 million, or 11.9%) and land (an increase of $20.7 million, or 2.1%). Infrastructure increased due to the completion of $1,079.2 million of highway and bridge construction projects by the Department of Transportation (DOT), offset by the recognition of depreciation expense of $588.8 million for the year. Computer software in progress increased as a result of the increase in ongoing software projects at the Department of Human Services as well as the Department of Revenue. Computer software increased due to the completion of computer software projects for the Department of Human Services. Land increased primarily due to acquisitions for road construction at DOT.
Capital assets, net of accumulated depreciation, in the business-type activities decreased $44.3 million, or 0.7%, to $5,931.5 million. The largest changes were in construction in progress (a decrease of $149.0 million, or 40.8%) as well as buildings & improvements (an increase of $107.6 million, or 2.7%). These changes were primarily the result of the completion of construction projects at the University of Iowa, Iowa State University, and the University of Northern Iowa.
Outstanding commitments for future capital expenditures as of June 30, 2021 include $938.4 million (net of $684.7 million in anticipated federal funding) for highway and bridge construction, $175.7 million for various projects at
the three State universities, $16.2 million for the Iowa Statewide Interoperable Communications System (ISICS), an emergency public safety communication system, $29.4 million for statewide 911 and mass notification systems, $34.8 million for State facilities and buildings, $10.9 million for State parks, recreational areas, fisheries and wetland projects, $11.3 million for public defense improvements at various locations, $36.1million for the modernization of the State’s unemployment compensation system, and $33.3 million for the modernization of the State’s human resources and accounting systems.
Total
Percentage
Change
2021 2020 2021 2020 2021 2020 2020-2021
Land 998.8$ 978.1$ 100.3$ 99.7$ 1,099.1$ 1,077.8$ 2.0%
Land improvements 80.2 67.9 54.2 46.6 134.4 114.5 17.4%
Construction in progress 52.4 94.2 215.8 364.8 268.2 459.0 -41.6%
Computer software in progress 76.8 41.4 8.5 7.2 85.3 48.6 75.5%
Infrastructure 8,756.9 8,261.9 480.6 482.3 9,237.5 8,744.2 5.6%
Buildings & improvements 1,067.4 1,081.4 4,121.8 4,014.2 5,189.2 5,095.6 1.8%
Equipment 272.4 239.9 414.7 421.7 687.1 661.6 3.9%
Works of art & collections 1.1 1.1 472.7 468.0 473.8 469.1 1.0%
Computer software 220.8 197.4 62.2 70.4 283.0 267.8 5.7%
Other intangibles - - 0.7 0.9 0.7 0.9 -22.2%
Total 11,526.8$ 10,963.3$ 5,931.5$ 5,975.8$ 17,458.3$ 16,939.1$ 3.1%
Activities Activities Total
Table 4
Capital Assets, Net of Depreciation
(In Millions)
Governmental Business-type
31

Long-term Debt
At year-end, the State had $3,115.2 million in revenue bonds and leases & other financing arrangements
outstanding as shown in Table 5. More detailed information about the State’s long-term liabilities is presented in NOTE 7 through NOTE 10 to the financial statements.
Revenue bonds issued by the Primary Government totaled $3,044.8 million outstanding at fiscal year-end. This amount consisted of $1,763.8 million in revenue bonds issued by the three State universities (for equipment and facilities), $715.0 million in revenue bonds issued by the Tobacco Settlement Authority, $6.5 million in revenue bonds issued by the State of Iowa for the Iowa Utilities Board, $481.3 million in revenue bonds issued by the State of Iowa for the IJOBS program, and $78.2 million in revenue bonds issued by the State of Iowa for Prison Infrastructure. These bonds are backed by the revenues of the issuing program.
Governmental activities outstanding revenue bonds decreased $104.1 million, due to the issuance of $2,113.2 million of refunding bonds to refund $874.5 million of outstanding bonds, as well as the payment of principal during fiscal year 2021. Leases & other financing arrangements decreased $3.5 million, due to new capital leases and new other financing arrangement agreements totaling $1.1 million along with the payment of principal in the amounts of $4.2 million and $0.4 million for capital leases and other financing arrangements, respectively
Business-type activities outstanding revenue bonds decreased $41.9 million, due to the issuance of $97.4 million, $23.0 million, and $15.4 million of new debt at the University of Iowa, Iowa State University, and the University of Northern Iowa, respectively; and the payment of principal by the three State universities. Leases & other financing arrangements increased $12.1 million, due to new capital leases and other new financing arrangement agreements totaling $27.8 million along with the payment of principal in the amounts of $2.5 million and $13.3 million for capital leases and other financing arrangements, respectively.
ECONOMIC FACTORS AND NEXT YEAR’S BUDGET AND RATES
The Governor and General Assembly finished their work on May 19, 2021. Amounts available for appropriation in fiscal year 2022, based on the 99 percent budget limitation for the General Fund budget, were $8,287.9 million. General Fund appropriations totaled $8,118.5 million.
At the REC meeting in October 2021, the fiscal year 2022 revenue estimate was increased from a revised $8,288.5 million to $8,934.2 million, largely as a reflection of actual revenue collections in fiscal year 2020, law changes passed during the 2021 Legislative Sessions, and current year to date revenue growth. The revised estimate reflects projected revenue growth of 1.5 percent compared to actual revenues for the previous fiscal year.
The unemployment rate nationally stands at 4.8 percent for the month of September 2021, down from a revised 5.2 percent in August 2021. This measure is down considerably from the high at the end of the February-April 2020 recession. However, it remains above the level prior to the COVID-19 pandemic of 3.5 percent. Nationally, GDP growth has been high the first half of the calendar year 2021, growing at 6.3 percent in the first quarter and 6.7 percent in the second quarter. Moody’s Analytics expects the third quarter to be slower at 3.4 percent with the fourth quarter coming back at 6.2 percent. Moody’s expects 4.3 percent growth for 2022.
Total
Percentage
Change
2021 2020 2021 2020 2021 2020 2020-2021
Revenue bonds 1,281.0$ 1,385.1$ 1,763.8$ 1,805.7$ 3,044.8$ 3,190.8$ -4.6%
Leases & other financing arrangements 21.0 24.5 49.4 37.3 70.4 61.8 13.9%
Total 1,302.0$ 1,409.6$ 1,813.2$ 1,843.0$ 3,115.2$ 3,252.6$ -4.2%
Activities Activities Total
Table 5
State of Iowa's Outstanding Debt
(In Millions)
Governmental Business-type
32

CONTACTING THE STATE’S FINANCIAL MANAGEMENT
This financial report is designed to provide our citizens, legislators, customers, investors and creditors with a general overview of the State’s finances and to demonstrate the State’s accountability for the money it receives. If you have questions about this report or need additional financial information, contact:
Iowa Department of Administrative Services State Accounting Enterprise Hoover State Office Building Des Moines, IA 50319
33

Building our State Capitol !
Construction of the Iowa State Capitol September 1, 1880
State Historical Library and Archives of Iowa, State Historical Society of Iowa, Des Moines.
34

S T A T E M E N T S
B A S I C
F I N A N C I A L
35

STATE OF IOWA
Statement of Net Position
June 30, 2021
(Expressed in Thousands)
GOVERNMENTAL BUSINESS-TYPE COMPONENT
ACTIVITIES ACTIVITIES TOTAL UNITS
ASSETS
Current assets:
Cash & investments 3,952,182$ 1,932,417$ 5,884,599$ 1,783,949$
Cash & investments - restricted - - - 795
Deposits with trustees 60,752 40,043 100,795 -
Accounts receivable (net) 2,412,937 830,444 3,243,381 125,488
Interest receivable - 1,792 1,792 6,165
Loans receivable (net) 5,150 3,002 8,152 158,877
Internal balances (208,944) 208,944 - -
Inventory 74,132 102,186 176,318 4,091
Prepaid expenses 69,118 59,114 128,232 944
Other assets - - - 33,033
Total current assets 6,365,327 3,177,942 9,543,269 2,113,342
Noncurrent assets:
Cash & investments - 4,469,287 4,469,287 3,897,947
Deposits with trustees 26,252 2,776 29,028 -
Accounts receivable (net) 104,188 18,777 122,965 238,394
Interest receivable - 618 618 -
Loans receivable (net) 10,972 43,301 54,273 2,235,547
Capital assets - nondepreciable 1,128,014 761,112 1,889,126 35,479
Capital assets - depreciable (net) 10,398,803 5,170,383 15,569,186 121,596
Prepaid expenses - 9,097 9,097 -
Other assets - 16,254 16,254 39,072
Total noncurrent assets 11,668,229 10,491,605 22,159,834 6,568,035
TOTAL ASSETS 18,033,556 13,669,547 31,703,103 8,681,377
DEFERRED OUTFLOWS OF RESOURCES
Accumulated decrease in fair value of hedging
derivatives - - - 7,307
Debt refunding loss 39,019 16,830 55,849 10,529
Excess consideration provided for acquisition - 167 167 -
Related to other postemployment benefits 13,135 102,078 115,213 437
Related to pensions 281,940 80,399 362,339 5,457
TOTAL DEFERRED OUTFLOWS OF RESOURCES 334,094 199,474 533,568 23,730
(continued on next page)
PRIMARY GOVERNMENT
36

STATE OF IOWA
Statement of Net Position
June 30, 2021
(Expressed in Thousands)
GOVERNMENTAL BUSINESS-TYPE COMPONENT
ACTIVITIES ACTIVITIES TOTAL UNITS
LIABILITIES
Current liabilities:
Accounts payable & accruals 1,681,212 711,147 2,392,359 83,753
Interest payable 3,035 23,652 26,687 33,776
Unearned revenue 200,849 136,353 337,202 201,571
Compensated absences 146,342 129,338 275,680 2,994
Capital leases 4,363 2,870 7,233 -
Bonds payable 69,884 155,818 225,702 74,276
Other financing arrangements payable 121 943 1,064 -
Other postemployment benefits liability 11,842 18,631 30,473 -
Refundable allowances on student loans - 1,472 1,472 -
Funds held in custody - 613 613 122,000
Total current liabilities 2,117,648 1,180,837 3,298,485 518,370
Noncurrent liabilities:
Accounts payable & accruals 73,041 42,818 115,859 63,800
Unearned revenue 2,825 22,250 25,075 -
Compensated absences 182,446 128,987 311,433 2,821
Capital leases 16,166 19,622 35,788 -
Bonds payable 1,211,116 1,608,030 2,819,146 2,537,629
Other financing arrangements payable 379 25,970 26,349 -
Net pension liability 854,808 222,366 1,077,174 24,510
Other postemployment benefits liability 194,975 243,331 438,306 3,845
Advance From Concessionaire - 1,133,044 1,133,044 -
Refundable allowances on student loans - 43,096 43,096 -
Funds held in custody - - - 13,809
Total noncurrent liabilities 2,535,756 3,489,514 6,025,270 2,646,414
TOTAL LIABILITIES 4,653,404 4,670,351 9,323,755 3,164,784
DEFERRED INFLOWS OF RESOURCES
Accumulated increase in fair value of hedging
derivatives - - - 1,937
Debt refunding gain 5,542 1,919 7,461 -
Grants received in advance of meeting timing
requirements - 144 144 -
Related to other postemployment benefits 14,033 121,689 135,722 450
Related to pensions 285,989 7,997 293,986 1,806
Unconditional remainder interest 146 - 146 -
TOTAL DEFERRED INFLOWS OF RESOURCES 305,710 131,749 437,459 4,193
NET POSITION
Net investment in capital assets 11,324,737 4,226,846 15,551,583 155,475
Restricted for:
Education 64,202 - 64,202 -
Human services 36,120 - 36,120 -
Justice & public defense 15,698 - 15,698 -
Transportation 483,721 - 483,721 -
Agriculture & natural resources 6,201 - 6,201 -
Underground Storage Tank Program 5,556 - 5,556 -
Capital projects 5,389 - 5,389 -
University Funds - expendable - 578,962 578,962 -
University Funds - nonexpendable - 92,728 92,728 -
Permanent Funds - nonexpendable 16,180 - 16,180 -
Unemployment Benefits Fund - 1,535,944 1,535,944 -
Other 246,944 - 246,944 5,030,867
Unrestricted 1,203,788 2,632,441 3,836,229 349,788
TOTAL NET POSITION 13,408,536$ 9,066,921$ 22,475,457$ 5,536,130$
The notes are an integral part of the financial statements.
PRIMARY GOVERNMENT
(continued)
37

Iowa State Capitol Building from the North, with some exterior construction still underway.
Des Moines, Iowa ca 1885
Iowa State Capitol Building and neighborhood to the
Southwest.Des Moines, Iowa 1885
State Historical Library and Archives of Iowa, State Historical Society of Iowa, Des Moines.
38

STATE OF IOWA
Statement of Activities
For the Year Ended June 30, 2021
(Expressed in Thousands)
CHARGES OPERATING CAPITAL BUSINESS-
FOR GRANTS & GRANTS & GOVERNMENTAL TYPE COMPONENT
FUNCTIONS/PROGRAMS EXPENSES SERVICES CONTRIBUTIONS CONTRIBUTIONS ACTIVITIES ACTIVITIES TOTAL UNITS
PRIMARY GOVERNMENT:
Governmental activities:
Administration & regulation 2,500,552$ 1,131,855$ 885,096$ -$ (483,601)$ $ (483,601)$
Education 4,839,703 20,311 929,699 - (3,889,693) (3,889,693)
Health & human rights 565,016 78,464 364,699 4,277 (117,576) (117,576)
Human services 8,497,262 711,411 5,762,932 - (2,022,919) (2,022,919)
Justice & public defense 1,207,698 137,035 313,250 1,145 (756,268) (756,268)
Economic development 173,455 4,823 83,851 - (84,781) (84,781)
Transportation 1,367,551 92,727 104,832 510,329 (659,663) (659,663)
Agriculture & natural resources 268,107 92,937 47,012 4,506 (123,652) (123,652)
Interest expense 58,436 - - - (58,436) (58,436)
Total governmental activities 19,477,780 2,269,563 8,491,371 520,257 (8,196,589) (8,196,589)
Business-type activities:
University Funds 5,600,805 4,021,078 880,076 33,205 (666,446) (666,446)
Unemployment Benefits Fund 2,353,780 413,464 1,682,997 - (257,319) (257,319)
Other 372,382 511,758 - - 139,376 139,376
Total business-type activities 8,326,967 4,946,300 2,563,073 33,205 (784,389) (784,389)
TOTAL PRIMARY GOVERNMENT 27,804,747$ 7,215,863$ 11,054,444$ 553,462$ (8,196,589) (784,389) (8,980,978)
COMPONENT UNITS:
Iowa Finance Authority 323,918$ 30,400$ 263,282$ -$ (30,236)$
Iowa Economic Development Authority 269,571 2,963 237,940 - (28,668)
Iowa State Fair Authority 16,653 3,198 818 2,801 (9,836)
Iowa Lottery Authority 452,528 452,603 - - 75
University of Iowa Center for Advancement & Affiliate 131,725 - 103,873 - (27,852)
Iowa State University Foundation 111,943 - 147,668 - 35,725
University of Northern Iowa Foundation 16,807 - 32,902 - 16,095
University of Iowa Research Foundation 4,686 3,389 - - (1,297)
University of Iowa Health System 20,778 18,721 - - (2,057)
TOTAL COMPONENT UNITS 1,348,609$ 511,274$ 786,483$ 2,801$ (48,051)
GENERAL REVENUES:
Personal income tax 4,224,590 - 4,224,590 -
Corporate income tax 799,466 - 799,466 -
Sales & use tax 3,510,049 - 3,510,049 -
Other tax 902,673 11,008 913,681 -
Motor fuel tax restricted for transportation purposes 673,745 - 673,745 -
Road use tax restricted for transportation purposes 444,548 - 444,548 -
Unrestricted investment earnings 14,595 473,811 488,406 851,604
Other 129,563 149,487 279,050 22,449
Gain (loss) on sale of assets 1,920 29 1,949 18
(693,712) 693,712 - -
10,007,437 1,328,047 11,335,484 874,071
1,810,848 543,658 2,354,506 826,020
11,597,688 8,523,263 20,120,951 4,710,110
Transfers
TOTAL GENERAL REVENUES & TRANSFERS CHANGE IN NET POSITION
NET POSITION - JULY 1
NET POSITION - JUNE 30 13,408,536$ 9,066,921$ 22,475,457$ 5,536,130$
PROGRAM REVENUES PRIMARY GOVERNMENT
NET (EXPENSES) REVENUES & CHANGES IN NET POSITION
The notes are an integral part of the financial statements.
39

Crews grading Iowa State Capitol grounds. ca 1891
State Historical Library and Archives of Iowa, State Historical Society of Iowa, Des Moines.
40

GOVERNMENTAL FUND FINANCIAL STATEMENTS
Major Funds
General Fund - This is the State's operating fund. It accounts for the financialresources and transactions not accounted for in other funds.
Tobacco Settlement Authority - The Tobacco Settlement Authority, a blendedcomponent unit of the State of Iowa, receives money from the Tobacco Collections Fundto pay for operating expenditures and repayment of debt.
Tobacco Collections Fund - The Tobacco Collections Fund accounts for tobaccosettlement monies received pursuant to a Master Settlement Agreement between theState of Iowa and the five largest tobacco manufacturers. The funds are then distributedto the Tobacco Settlement Authority and the Endowment for Iowa's Health Fundpursuant to the terms of a Sales Agreement (dated October 1, 2001, and amendedNovember 1, 2005) between the State and the Tobacco Settlement Authority. Per Code ofIowa Section 12E.12.1.b(3)(b), the State's portion is then transferred to the Rebuild IowaInfrastructure Fund.
Nonmajor Governmental Funds are presented, by fund type, in the SupplementaryInformation section.
41
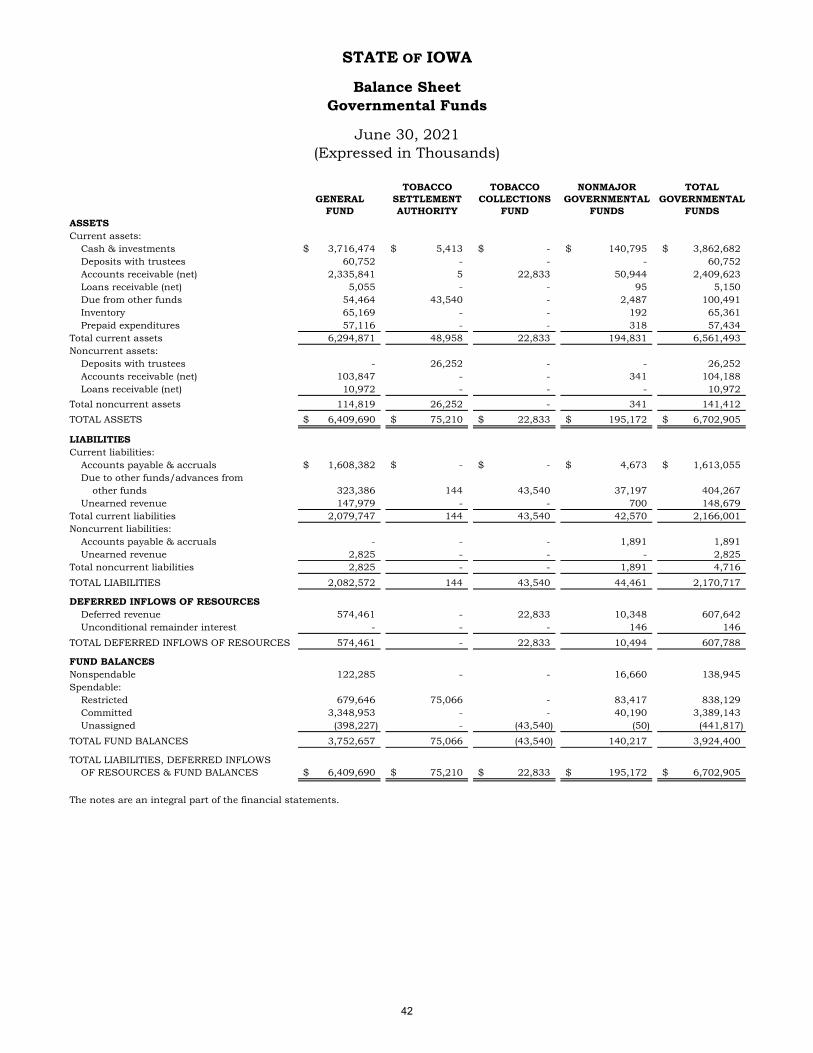
STATE OF IOWA
Balance Sheet
Governmental Funds
June 30, 2021
(Expressed in Thousands)
TOBACCO TOBACCO NONMAJOR TOTAL
GENERAL SETTLEMENT COLLECTIONS GOVERNMENTAL GOVERNMENTAL
FUND AUTHORITY FUND FUNDS FUNDS
ASSETS
Current assets:
Cash & investments 3,716,474$ 5,413$ -$ 140,795$ 3,862,682$
Deposits with trustees 60,752 - - - 60,752
Accounts receivable (net) 2,335,841 5 22,833 50,944 2,409,623
Loans receivable (net) 5,055 - - 95 5,150
Due from other funds 54,464 43,540 - 2,487 100,491
Inventory 65,169 - - 192 65,361
Prepaid expenditures 57,116 - - 318 57,434
Total current assets 6,294,871 48,958 22,833 194,831 6,561,493
Noncurrent assets:
Deposits with trustees - 26,252 - - 26,252
Accounts receivable (net) 103,847 - - 341 104,188
Loans receivable (net) 10,972 - - - 10,972
Total noncurrent assets 114,819 26,252 - 341 141,412
TOTAL ASSETS 6,409,690$ 75,210$ 22,833$ 195,172$ 6,702,905$
LIABILITIES
Current liabilities:
Accounts payable & accruals 1,608,382$ -$ -$ 4,673$ 1,613,055$
Due to other funds/advances from
other funds 323,386 144 43,540 37,197 404,267
Unearned revenue 147,979 - - 700 148,679
Total current liabilities 2,079,747 144 43,540 42,570 2,166,001
Noncurrent liabilities:
Accounts payable & accruals - - - 1,891 1,891
Unearned revenue 2,825 - - - 2,825
Total noncurrent liabilities 2,825 - - 1,891 4,716
TOTAL LIABILITIES 2,082,572 144 43,540 44,461 2,170,717
DEFERRED INFLOWS OF RESOURCES
Deferred revenue 574,461 - 22,833 10,348 607,642
Unconditional remainder interest - - - 146 146
TOTAL DEFERRED INFLOWS OF RESOURCES 574,461 - 22,833 10,494 607,788
FUND BALANCES
Nonspendable 122,285 - - 16,660 138,945
Spendable:
Restricted 679,646 75,066 - 83,417 838,129
Committed 3,348,953 - - 40,190 3,389,143
Unassigned (398,227) - (43,540) (50) (441,817)
TOTAL FUND BALANCES 3,752,657 75,066 (43,540) 140,217 3,924,400
TOTAL LIABILITIES, DEFERRED INFLOWS
OF RESOURCES & FUND BALANCES 6,409,690$ 75,210$ 22,833$ 195,172$ 6,702,905$
The notes are an integral part of the financial statements.
42

STATE OF IOWA
Reconciliation of the Balance Sheet -
Governmental Funds to the Statement of Net Position
June 30, 2021
(Expressed in Thousands)
Total fund balances - governmental funds 3,924,400$
11,343,477
223,417
607,642
Pension related deferred outflows of resources
Pension related deferred inflows of resources
Net pension related deferred (7,276)
OPEB related deferred outflows of resources
OPEB related deferred inflows of resources
Net OPEB related deferred (929)
33,477
Bonds payable
Accrued interest payable
Compensated absences
Capital leases
Other financing arrangements payable
Pollution remediation
Early retirement/termination benefits
Risk management
Net pension liability
Other postemployment benefits liability
Other long-term liabilities
Total long-term liabilities (2,715,672)
13,408,536$
The notes are an integral part of the financial statements.
Long-term liabilities are not due and payable in the current year and, therefore, are not
reported as liabilities in governmental funds. Long-term liabilities at year-end consist
of:
Amounts reported for governmental activities in the Statement of Net Position are different
because:
Capital assets used in governmental activities are not financial resources and, therefore,
are not reported as assets in governmental funds. The cost of assets, excluding internal
service funds, is $22,344,815 and the accumulated depreciation is $(11,001,338).
Internal service funds are used by management to charge the costs of certain activities
to individual funds. A portion of the assets and liabilities of the internal service funds
are included in governmental activities in the Statement of Net Position.
Certain revenues are earned but not available and, therefore, are recognized as deferred
inflows of resources in governmental funds.
Debt refunding losses/gains are reported as current expenditures/revenues in
governmental funds. However, debt refunding losses/gains are amortized over the life of
the bonds and are included as deferred outflows/inflows of resources in governmental
activities in the Statement of Net Position.
Pension related and other postemployment benefits (OPEB) deferred amounts are not
due and payable in the current year and, therefore, are not reported in the
governmental funds:
276,559$
(283,835)
12,892
(13,821)
Net position of governmental activities
(1,281,000)
(3,035)
(322,278)
(20,529)
(500)
(5,303)
(20,692)
(25,000)
(833,712)
(203,057)
(566)
43

STATE OF IOWA
Statement of Revenues, Expenditures and Changes in Fund Balances
Governmental Funds
For the Year Ended June 30, 2021
(Expressed in Thousands)
TOBACCO TOBACCO NONMAJOR TOTAL
GENERAL SETTLEMENT COLLECTIONS GOVERNMENTAL GOVERNMENTAL
FUND AUTHORITY FUND FUNDS FUNDS
REVENUES
Taxes 11,314,249$ -$ -$ -$ 11,314,249$
Receipts from other entities 9,849,820 - - 13,548 9,863,368
Investment income 3,441 2,041 - 9,075 14,557
Fees, licenses & permits 1,587,065 - - 124,652 1,711,717
Refunds & reimbursements 723,627 - 52,930 5,789 782,346
Sales, rents & services 29,543 - - 5,644 35,187
Miscellaneous 272,318 - - 29,422 301,740
GROSS REVENUES 23,780,063 2,041 52,930 188,130 24,023,164
Less revenue refunds 2,068,448 - - 3,825 2,072,273
NET REVENUES 21,711,615 2,041 52,930 184,305 21,950,891
EXPENDITURES
Current:
Administration & regulation 2,461,615 5,442 - 31,125 2,498,182
Education 4,815,441 - - 19,359 4,834,800
Health & human rights 552,064 - - 353 552,417
Human services 8,495,835 - - 254 8,496,089
Justice & public defense 1,171,264 - - 1,578 1,172,842
Economic development 169,241 - - - 169,241
Transportation 605,948 - - 73 606,021
Agriculture & natural resources 226,838 - - 9,601 236,439
Capital outlay 1,419,721 - - 22,534 1,442,255
Debt service:
Principal 48,800 90,787 - - 139,587
Interest & fiscal charges 25,877 36,777 - - 62,654
TOTAL EXPENDITURES 19,992,644 133,006 - 84,877 20,210,527
EXCESS (DEFICIENCY) OF REVENUES
OVER (UNDER) EXPENDITURES 1,718,971 (130,965) 52,930 99,428 1,740,364
OTHER FINANCING SOURCES (USES)
Transfers in 260,593 - - 26,313 286,906
Transfers out (875,970) - (11,645) (93,003) (980,618)
Leases, installment purchases & other 1,147 - - - 1,147
Premium on revenue refunding bonds 26,811 56,500 - - 83,311
Revenue refunding bonds issued 90,825 688,806 - - 779,631
Payment to refunded bond agent (121,355) (705,418) - - (826,773)
TOTAL OTHER FINANCING SOURCES (USES) (617,949) 39,888 (11,645) (66,690) (656,396)
NET CHANGE IN FUND BALANCES 1,101,022 (91,077) 41,285 32,738 1,083,968
FUND BALANCES - JULY 1 2,651,635 166,143 (84,825) 107,479 2,840,432
FUND BALANCES - JUNE 30 3,752,657$ 75,066$ (43,540)$ 140,217$ 3,924,400$
The notes are an integral part of the financial statements.
44

STATE OF IOWA
Reconciliation of the Statement of Revenues, Expenditures
and Changes in Fund Balances -
Governmental Funds to the Statement of Activities
Net change in fund balances - total governmental funds 1,083,968$
Amounts reported for governmental activities in the Statement of Activities are different because:
Capital outlay
Depreciation expense
Excess of capital outlay over depreciation expense 547,622
(12,341)
Bonds
Capital leases
Other financing arrangements
Total (864,089)
Bond principal retirement
Capital lease payments
Other financing arrangements payments
Total long-term debt repayments 970,992
29,301
35,569
Pension related deferred outflows of resources
Pension related deferred inflows of resources
Net pension related deferred (37,859)
OPEB related deferred outflows of resources
OPEB related deferred inflows of resources
Net OPEB related deferred (8,883)
Compensated absences
Early retirement/termination benefits
Net pension liability
Other postemployment benefits liability
Other
Total additional expenses 66,568
1,810,848$
The notes are an integral part of the financial statements.
4,210
421
Internal service funds are used by management to charge the cost of certain activities to
individual funds. A portion of the net revenue of the internal service funds is reported with
governmental activities.
(862,942)
(600)
(547)
For the Year Ended June 30, 2021
(Expressed in Thousands)
Capital outlays are reported as expenditures in governmental funds. However, in the
Statement of Activities, the cost of capital assets is allocated over their estimated useful lives
as depreciation expense. In the current year, these amounts are:
$ 1,247,707
(1,905)
Pension related and other postemployment benefits (OPEB) related deferred amounts are not
due and payable in the current year and, therefore, are not reported in governmental funds:
1,103
(38,962)
(700,085)
Because some revenues will not be collected for several months after the State's fiscal year-
end, they are not considered available revenues and are deferred in the governmental funds as
deferred inflows of resources.
In the Statement of Activities, only the gain or loss on the sale of capital assets is reported,
whereas the proceeds from the sale increase financial resources in governmental funds.
Some capital additions were financed through capital leases, other financing arrangements
and installment purchases. In governmental funds, these financing arrangements are
considered a source of funding, but in the Statement of Net Position, the obligations are
reported as liabilities. In the current year, these amounts consist of:
Repayment of long-term debt is reported as an expenditure in governmental funds, but the
repayment reduces long-term liabilities in the Statement of Net Position. In the current year,
these amounts consist of:
966,361
(6,978)
Change in net position of governmental activities
Some items reported in the Statement of Activities do not require the use of current financial
resources and, therefore, are not reported as expenditures in the governmental funds. The
(increases) decreases in these activities consist of:
(11,527)
88
73,360
(652)
5,299
45

Iowa State Capitol Building during fire.January 4, 1904
Photographer - T.F. Shannon
State Historical Library and Archives of Iowa, State Historical Society of Iowa, Des Moines.
46

PROPRIETARY FUND FINANCIAL STATEMENTS
Major Funds
University Funds are maintained to account for the operations of the State's publicinstitutions of higher education. The State University of Iowa, Iowa State University andthe University of Northern Iowa comprise this group.
Unemployment Benefits Fund receives contributions from employers and federal fundsto provide benefits to eligible unemployed workers.
Nonmajor Proprietary Funds are presented by fund in the Supplementary Informationsection.
47

STATE OF IOWA
Statement of Net Position
Proprietary Funds
June 30, 2021
(Expressed in Thousands)
GOVERNMENTAL
ACTIVITIES -
UNEMPLOYMENT NONMAJOR INTERNAL
UNIVERSITY BENEFITS ENTERPRISE SERVICE
FUNDS FUND FUNDS TOTAL FUNDS
ASSETS
Current assets:
Cash & investments 706,133$ 1,166,738$ 53,620$ 1,926,491$ 95,426$
Deposits with trustees 40,043 - - 40,043 -
Accounts receivable (net) 607,191 207,035 16,218 830,444 3,313
Interest receivable 1,792 - - 1,792 -
Loans receivable (net) 3,002 - - 3,002 -
Due from other funds/advances to
other funds - 237,840 787 238,627 100,648
Inventory 95,583 - 6,603 102,186 8,771
Prepaid expenses 57,316 - 1,798 59,114 11,684
Total current assets 1,511,060 1,611,613 79,026 3,201,699 219,842
Noncurrent assets:
Cash & investments 4,469,287 - - 4,469,287 -
Deposits with trustees 2,776 - - 2,776 -
Accounts receivable (net) 18,777 - - 18,777 -
Interest receivable 618 - - 618 -
Loans receivable (net) 43,301 - - 43,301 -
Capital assets - nondepreciable 757,741 - 3,371 761,112 27,103
Capital assets - depreciable (net) 5,141,648 - 28,735 5,170,383 156,237
Prepaid expenses 9,097 - - 9,097 -
Other assets 16,254 - - 16,254 -
Total noncurrent assets 10,459,499 - 32,106 10,491,605 183,340
TOTAL ASSETS 11,970,559 1,611,613 111,132 13,693,304 403,182
DEFERRED OUTFLOWS OF
RESOURCES
Debt refunding loss 16,830 - - 16,830 -
Excess consideration provided for
acquisition 167 - - 167 -
Related to other postemployment benefits 101,753 - 325 102,078 244
Related to pensions 76,493 - 3,906 80,399 5,381
TOTAL DEFERRED OUTFLOWS OF
RESOURCES 195,243 - 4,231 199,474 5,625
(continued on next page)
BUSINESS-TYPE ACTIVITIES -
ENTERPRISE FUNDS
48

STATE OF IOWA
Statement of Net Position
Proprietary Funds
June 30, 2021
(Expressed in Thousands)
GOVERNMENTAL
ACTIVITIES -
UNEMPLOYMENT NONMAJOR INTERNAL
UNIVERSITY BENEFITS ENTERPRISE SERVICE
FUNDS FUND FUNDS TOTAL FUNDS
LIABILITIES
Current liabilities:
Accounts payable & accruals 646,159 44,555 20,431 711,145 44,380
Due to other funds/advances from
other funds - 1,626 17,256 18,882 16,617
Interest payable 23,652 - - 23,652 -
Unearned revenue 104,297 29,488 1,532 135,317 53,206
Compensated absences 127,238 - 2,100 129,338 2,965
Capital leases 2,870 - - 2,870 -
Bonds payable 155,818 - - 155,818 -
Other financing arrangements payable 943 - - 943 -
Other postemployment benefits liability 18,508 - 123 18,631 215
Refundable allowances on student loans 1,472 - - 1,472 -
Funds held in custody 613 - - 613 -
Total current liabilities 1,081,570 75,669 41,442 1,198,681 117,383
Noncurrent liabilities:
Accounts payable & accruals 42,625 - 193 42,818 43,369
Unearned revenue 22,250 - - 22,250 -
Compensated absences 127,224 - 1,763 128,987 3,545
Capital leases 19,622 - - 19,622 -
Bonds payable 1,608,030 - - 1,608,030 -
Other financing arrangements payable 25,970 - - 25,970 -
Net pension liability 211,610 - 10,756 222,366 21,096
Other postemployment benefits liability 241,196 - 2,135 243,331 3,545
Advance From Concessionaire 1,133,044 - - 1,133,044 -
Refundable allowances on student loans 43,096 - - 43,096 -
Total noncurrent liabilities 3,474,667 - 14,847 3,489,514 71,555
TOTAL LIABILITIES 4,556,237 75,669 56,289 4,688,195 188,938
DEFERRED INFLOWS OF
RESOURCES
Debt refunding gain 1,919 - - 1,919 -
Grants received in advance of meeting
timing requirements 144 - - 144 -
Related to other postemployment benefits 121,168 - 521 121,689 211
Related to pensions 5,089 - 2,908 7,997 2,154
TOTAL DEFERRED INFLOWS OF
RESOURCES 128,320 - 3,429 131,749 2,365
NET POSITION
Net investment in capital assets 4,194,740 - 32,106 4,226,846 183,340
Restricted for:
Expendable 578,962 - - 578,962 -
Nonexpendable 92,728 - - 92,728 -
Unemployment benefits - 1,535,944 - 1,535,944 -
Unrestricted 2,614,815 - 23,539 2,638,354 34,164
TOTAL NET POSITION 7,481,245$ 1,535,944$ 55,645$ 9,072,834 217,504$
Adjustment to reflect the consolidation of internal service fund activities related to enterprise funds (5,913)
9,066,921$
The notes are an integral part of the financial statements.
NET POSITION OF BUSINESS-TYPE ACTIVITIES
BUSINESS-TYPE ACTIVITIES -
ENTERPRISE FUNDS
(continued)
49

STATE OF IOWA
Statement of Revenues, Expenses and Changes in Fund Net Position
Proprietary Funds
For the Year Ended June 30, 2021
(Expressed in Thousands)
GOVERNMENTAL
ACTIVITIES -
UNEMPLOYMENT NONMAJOR INTERNAL
UNIVERSITY BENEFITS ENTERPRISE SERVICE
FUNDS FUND FUNDS TOTAL FUNDS
OPERATING REVENUES
Employer contributions -$ 413,453$ -$ 413,453$ -$
Receipts from other entities - 1,682,997 18 1,683,015 214,349
Fees, licenses & permits 3,400,353 - 23,259 3,423,612 -
Refunds & reimbursements - 9 1,258 1,267 56,493
Sales, rents & services 386,207 - 481,241 867,448 1,754
Grants & contracts 674,593 - - 674,593 -
Independent/auxiliary operations 234,517 - - 234,517 -
Miscellaneous 76,061 2 5,982 82,045 17,147
TOTAL OPERATING REVENUES 4,771,731 2,096,461 511,758 7,379,950 289,743
OPERATING EXPENSES
General & administrative - - 10,602 10,602 -
Scholarship & fellowship 59,973 - - 59,973 -
Depreciation 396,090 - 5,094 401,184 19,337
Direct & other - - 42,378 42,378 -
Personal services 3,152,006 - 7,036 3,159,042 37,555
Travel & subsistence 11,753 - 254 12,007 18,362
Supplies & materials 916,153 - 335 916,488 46,543
Contractual services 173,939 - 12,891 186,830 71,354
Equipment & repairs 759,646 - 5,665 765,311 36,733
Claims & miscellaneous 63,649 - 284,767 348,416 29,528
Licenses, permits & refunds 6,905 - 1,224 8,129 16
State aid & credits - 2,353,780 2,638 2,356,418 -
TOTAL OPERATING EXPENSES 5,540,114 2,353,780 372,884 8,266,778 259,428
OPERATING INCOME (LOSS) (768,383) (257,319) 138,874 (886,828) 30,315
NONOPERATING REVENUES (EXPENSES)
Gifts 205,483 - - 205,483 -
Taxes - - 11,008 11,008 -
Investment income 450,170 23,371 29 473,570 292
Interest expense (50,648) - - (50,648) -
Miscellaneous revenue 73,428 - - 73,428 -
Gain (loss) on sale of capital assets (10,281) - (347) (10,628) 50
NET NONOPERATING REVENUES (EXPENSES) 668,152 23,371 10,690 702,213 342
INCOME (LOSS) BEFORE CONTRIBUTIONS
& TRANSFERS (100,231) (233,948) 149,564 (184,615) 30,657
Capital contributions & grants 33,205 - - 33,205 -
Transfers in 611,210 237,470 2,071 850,751 -
Transfers out - (5,102) (151,937) (157,039) -
CHANGE IN NET POSITION 544,184 (1,580) (302) 542,302 30,657
TOTAL NET POSITION - JULY 1 6,937,061 1,537,524 55,947 186,847
TOTAL NET POSITION - JUNE 30 7,481,245$ 1,535,944$ 55,645$ 217,504$
Adjustment to reflect the consolidation of internal service fund activities related to enterprise funds 1,356
543,658$
The notes are an integral part of the financial statements.
BUSINESS-TYPE ACTIVITIES -
ENTERPRISE FUNDS
CHANGE IN NET POSITION OF BUSINESS-TYPE ACTIVITIES
50
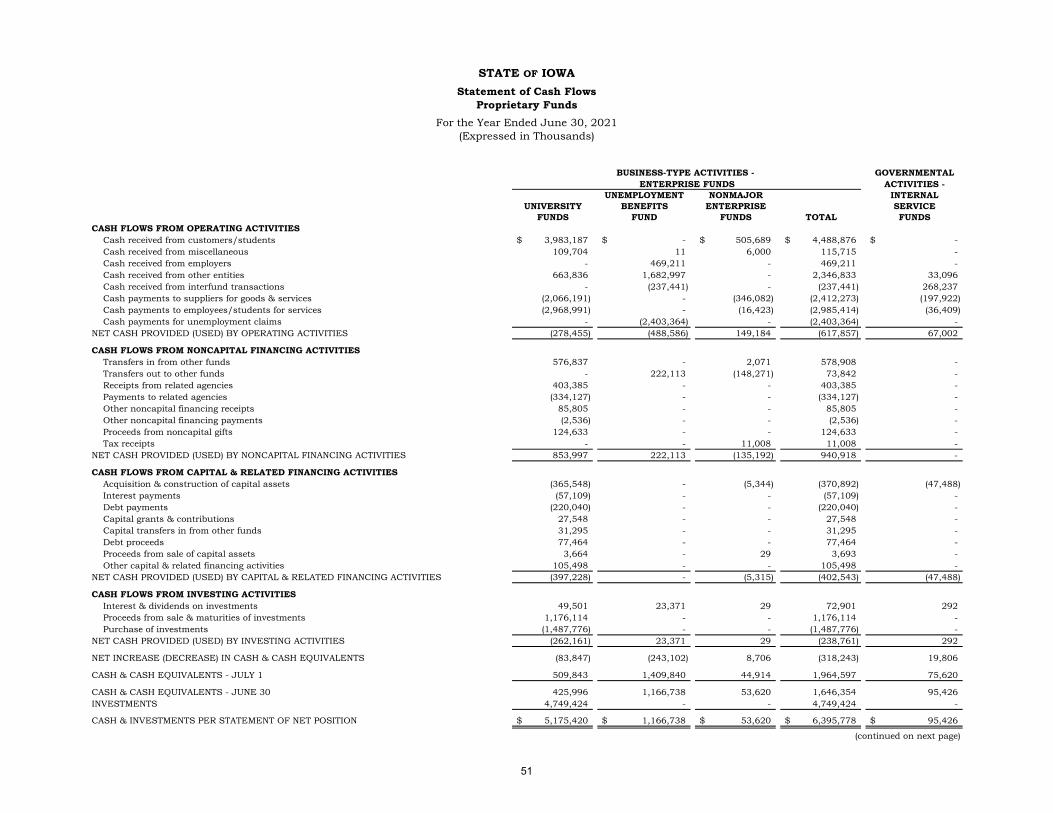
STATE OF IOWA
Statement of Cash Flows
Proprietary Funds
For the Year Ended June 30, 2021
(Expressed in Thousands)
GOVERNMENTAL
ACTIVITIES -
UNEMPLOYMENT NONMAJOR INTERNAL
UNIVERSITY BENEFITS ENTERPRISE SERVICE
FUNDS FUND FUNDS TOTAL FUNDS
CASH FLOWS FROM OPERATING ACTIVITIES
Cash received from customers/students 3,983,187$ -$ 505,689$ 4,488,876$ -$
Cash received from miscellaneous 109,704 11 6,000 115,715 -
Cash received from employers - 469,211 - 469,211 -
Cash received from other entities 663,836 1,682,997 - 2,346,833 33,096
Cash received from interfund transactions - (237,441) - (237,441) 268,237
Cash payments to suppliers for goods & services (2,066,191) - (346,082) (2,412,273) (197,922)
Cash payments to employees/students for services (2,968,991) - (16,423) (2,985,414) (36,409)
Cash payments for unemployment claims - (2,403,364) - (2,403,364) -
NET CASH PROVIDED (USED) BY OPERATING ACTIVITIES (278,455) (488,586) 149,184 (617,857) 67,002
CASH FLOWS FROM NONCAPITAL FINANCING ACTIVITIES
Transfers in from other funds 576,837 - 2,071 578,908 -
Transfers out to other funds - 222,113 (148,271) 73,842 -
Receipts from related agencies 403,385 - - 403,385 -
Payments to related agencies (334,127) - - (334,127) -
Other noncapital financing receipts 85,805 - - 85,805 -
Other noncapital financing payments (2,536) - - (2,536) -
Proceeds from noncapital gifts 124,633 - - 124,633 -
Tax receipts - - 11,008 11,008 -
NET CASH PROVIDED (USED) BY NONCAPITAL FINANCING ACTIVITIES 853,997 222,113 (135,192) 940,918 -
CASH FLOWS FROM CAPITAL & RELATED FINANCING ACTIVITIES
Acquisition & construction of capital assets (365,548) - (5,344) (370,892) (47,488)
Interest payments (57,109) - - (57,109) -
Debt payments (220,040) - - (220,040) -
Capital grants & contributions 27,548 - - 27,548 -
Capital transfers in from other funds 31,295 - - 31,295 -
Debt proceeds 77,464 - - 77,464 -
Proceeds from sale of capital assets 3,664 - 29 3,693 -
Other capital & related financing activities 105,498 - - 105,498 -
NET CASH PROVIDED (USED) BY CAPITAL & RELATED FINANCING ACTIVITIES (397,228) - (5,315) (402,543) (47,488)
CASH FLOWS FROM INVESTING ACTIVITIES
Interest & dividends on investments 49,501 23,371 29 72,901 292
Proceeds from sale & maturities of investments 1,176,114 - - 1,176,114 -
Purchase of investments (1,487,776) - - (1,487,776) -
NET CASH PROVIDED (USED) BY INVESTING ACTIVITIES (262,161) 23,371 29 (238,761) 292
NET INCREASE (DECREASE) IN CASH & CASH EQUIVALENTS (83,847) (243,102) 8,706 (318,243) 19,806
CASH & CASH EQUIVALENTS - JULY 1 509,843 1,409,840 44,914 1,964,597 75,620
CASH & CASH EQUIVALENTS - JUNE 30 425,996 1,166,738 53,620 1,646,354 95,426
INVESTMENTS 4,749,424 - - 4,749,424 -
CASH & INVESTMENTS PER STATEMENT OF NET POSITION 5,175,420$ 1,166,738$ 53,620$ 6,395,778$ 95,426$
(continued on next page)
BUSINESS-TYPE ACTIVITIES -
ENTERPRISE FUNDS
51

STATE OF IOWA
Statement of Cash Flows
Proprietary Funds
For the Year Ended June 30, 2021
(Expressed in Thousands)
GOVERNMENTAL
ACTIVITIES -
UNEMPLOYMENT NONMAJOR INTERNAL
UNIVERSITY BENEFITS ENTERPRISE SERVICE
FUNDS FUND FUNDS TOTAL FUNDS
RECONCILIATION OF OPERATING INCOME (LOSS) TO NET CASH PROVIDED
(USED) BY OPERATING ACTIVITIES
Operating income (loss) (768,383)$ (257,319)$ 138,874$ (886,828)$ 30,315$
Adjustments to reconcile operating income (loss) to net cash provided (used)
by operating activities:
Depreciation 396,090 - 5,094 401,184 19,337
(Increase) decrease in accounts receivable (72,515) 62,801 609 (9,105) (1,721)
(Increase) decrease in due from other funds/advances to other funds (237,441) (443) (237,884) (4,505)
(Increase) decrease in inventory (13,574) - 2,736 (10,838) 219
(Increase) decrease in prepaid expenses (4,013) - (447) (4,460) (2,244)
(Increase) decrease in loans receivable 6,487 - - 6,487 -
(Increase) decrease in other assets 84 - - 84 -
(Increase) decrease in deferred outflows of resources (27,873) - (910) (28,783) (286)
Increase (decrease) in accounts payable 126,115 (51,366) 2,371 77,120 6,638
Increase (decrease) in due to other funds/advances from other funds - - 194 194 31
Increase (decrease) in unearned revenue 46,524 (5,260) (235) 41,029 17,785
Increase (decrease) in compensated absences 18,740 - 262 19,002 417
Increase (decrease) in net pension liability 50,392 - 953 51,345 3,445
Increase (decrease) in other postemployment benefits liability 7,810 - 84 7,894 110
Increase (decrease) in Adance From Concessionaire (26,974) - - (26,974) -
Increase (decrease) in deferred inflows of resources (17,365) - 42 (17,323) (2,540)
NET CASH PROVIDED (USED) BY OPERATING ACTIVITIES (278,455)$ (488,585)$ 149,184$ (617,856)$ 67,001$
Capital assets contributed 318,415$ -$ -$ 318,415$ -$
Unrealized loss on investments 378,672 - - 378,672 -
TOTAL NONCASH INVESTING, CAPITAL & RELATED FINANCING ACTIVITIES 697,087$ -$ -$ 697,087$ -$
The notes are an integral part of the financial statements.
BUSINESS-TYPE ACTIVITIES -
ENTERPRISE FUNDS
(continued)
52

FIDUCIARY FUND FINANCIAL STATEMENTS
Fiduciary Funds are presented by fund in the Supplementary Information section.
53

STATE OF IOWA
Statement of Fiduciary Net Position
Fiduciary Funds
June 30, 2021
(Expressed in Thousands)
PENSION PRIVATE
& OTHER PURPOSE
EMPLOYEE TRUST CUSTODIAL
BENEFIT FUNDS FUNDS FUNDS
ASSETS
Cash & cash equivalents 522,076$ 8,623$ 217,001$
Receivables:
Accounts - - 9,187
Contributions 75,352 - -
Investments sold 743,139 - -
Foreign exchange contracts 317,903 - -
Taxes for other governments - - 301,628
Interest & dividends 83,528 - 1
Miscellaneous 7 - -
Total receivables 1,219,929 - 310,816
Investments, at fair value:
Fixed income securities 12,849,403 - 5,456
Equity investments 19,767,097 6,956,570 14,313
Real estate partnerships 69,906 - -
Investment in private equity/debt 8,652,675 - -
Real assets 2,360,617 - -
Securities lending collateral pool 580,774 - -
Total investments 44,280,472 6,956,570 19,769
Capital assets:
Land 500 - -
Other - depreciable (net) 12,627 - 125
Total capital assets 13,127 - 125
Other assets 628 - 508
TOTAL ASSETS 46,036,232 6,965,193 548,219
DEFERRED OUTFLOWS OF RESOURCES
Related to other postemployment benefits 99 - -
LIABILITIES
Accounts payable & accruals 60,913 243 55,629
Accounts payable to other governments - - 422,915
Foreign exchange contracts payable 317,154 - -
Payable for investments purchased 1,062,696 - -
Payable to brokers for rebate & collateral 580,675 - -
TOTAL LIABILITIES 2,021,438 243 478,544
DEFERRED INFLOWS OF RESOURCES
Related to other postemployment benefits 78 - -
NET POSITION
Restricted for:
Pension/other postemployment benefits 44,014,815 - -
Individuals, organizations & other entities - 6,964,950 69,675
TOTAL NET POSITION 44,014,815$ 6,964,950$ 69,675$
The notes are an integral part of the financial statements.
54

STATE OF IOWAStatement of Changes in Fiduciary Net Position
Fiduciary Funds
For the Year Ended June 30, 2021
(Expressed in Thousands)
PENSION PRIVATE
& OTHER PURPOSE
EMPLOYEE TRUST CUSTODIAL
BENEFIT FUNDS FUNDS FUNDS
ADDITIONS
Contributions:
Member/participant contributions 561,086$ 485,115$ 457,764$
Employer contributions 849,472 - -
Buy-back/buy-in contributions 5,220 - -
Other contributions - 1,514 73,118
Gifts, bequests & endowments - - 3,638
Total contributions 1,415,778 486,629 534,520
Investment income:
Net increase in fair value of investments 9,673,605 1,251,589 5,266
Interest 394,806 1,035 -
Dividends 124,147 - -
Other 67,035 - -
Total investment income 10,259,593 1,252,624 5,266
Less investment expense 72,073 - -
Net investment income 10,187,520 1,252,624 5,266
Tax collections for other governments - - 1,259,371
Court revenue collections for others - - 293,265
Miscellaneous - - 47,299
TOTAL ADDITIONS 11,603,298 1,739,253 2,139,721
DEDUCTIONS
Pension & annuity benefits 2,415,494 - 409,419
Distributions to participants - 541,262 -
Payments in accordance with agreements 2,040 - 101,425
Administrative expense 14,156 - 30,017
Payments of tax collections to other entities - - 1,259,640
Payment of court collections to others - - 292,362
Refunds 53,636 - -
Other - 1,189 35,537
TOTAL DEDUCTIONS 2,485,326 542,451 2,128,400
Extraordinary item -settlement payment1
7,600 - -
CHANGE IN NET POSITION 9,125,572 1,196,802 11,321
NET POSITION - JULY 1 34,889,243 5,768,148 58,354
NET POSITION - JUNE 30 44,014,815$ 6,964,950$ 69,675$
1Iowa Public Employees' Retirement System (IPERS) received the final settlement payment from the Westridge Capital
fraud case, CFTC V. Walsh/SEC v. WG. The payment resulted in an extraordinary item.
The notes are an integral part of the financial statements.
55

Celebration at Iowa State Capitol Building in honor ofPresident Theodore Roosevelt's visit.
President Roosevelt is standing in carriage in foreground.
State Historical Library and Archives of Iowa, State Historical Society of Iowa, Des Moines.
56

COMPONENT UNIT FINANCIAL STATEMENTS
Iowa Finance Authority issues bonds to assist in attainment of adequate housing forspecial needs individuals such as the low to moderate income and the disabled and toprovide limited types of financing to small businesses.
Iowa Economic Development Authority undertakes programs to promote economicdevelopment including financing programs and the issuance of bonds.
Iowa State Fair Authority conducts the annual State Fair and Exposition and otherinterim events on the Iowa State Fairgrounds.
Iowa Lottery Authority is used to account for lottery revenues, administrative andoperating expenses of the Lottery Authority and the distribution of revenue to theGeneral Fund.
The University of Iowa Center for Advancement & Affiliate, Iowa State UniversityFoundation and University of Northern Iowa Foundation act primarily as fund-raising organizations to supplement the resources available to the State universities.
University of Iowa Research Foundation commercializes University of Iowa developedtechnologies and inventions through licensing and new venture formation.
University of Iowa Health System supports clinical, academic, and research programsof the University of Iowa College of Medicine and the University of Iowa Hospitals andClinics.
57

STATE OF IOWA
Statement of Net Position
Component Units
June 30, 2021
(Expressed in Thousands)
IOWA IOWA UNIVERSITY
IOWA ECONOMIC STATE IOWA OF IOWA CENTER
FINANCE DEVELOPMENT FAIR LOTTERY FOR ADVANCEMENT
AUTHORITY AUTHORITY AUTHORITY AUTHORITY & AFFILIATE
ASSETS
Current assets:
Cash & investments 1,056,254$ 168,291$ 23,623$ 29,383$ 102,799$
Cash & investments - restricted - - - 795 -
Accounts receivable (net) - 12,765 1,296 5,429 51,294
Interest receivable 6,116 - 45 4 -
Loans receivable (net) 152,669 6,208 - - -
Inventory - - 262 3,367 -
Prepaid expenses - 314 26 59 -
Other assets 32,847 - - 59 -
Total current assets 1,247,886 187,578 25,252 39,096 154,093
Noncurrent assets:
Cash & investments 846,025 - - - 1,578,964
Accounts receivable (net) - - 1,067 - 115,513
Loans receivable (net) 2,167,397 67,953 - - -
Capital assets - nondepreciable 1,208 - 31,596 1,592 123
Capital assets - depreciable (net) 12,748 - 84,753 5,343 15,964
Other assets 24,443 - - 5,636 -
Total noncurrent assets 3,051,821 67,953 117,416 12,571 1,710,564
TOTAL ASSETS 4,299,707 255,531 142,668 51,667 1,864,657
DEFERRED OUTFLOWS OF RESOURCES
Accumulated decrease in fair value of
hedging derivatives 4,827 - - - -
Debt refunding loss 10,529 - - - -
Related to other postemployment benefits 136 61 131 109 -
Related to pensions 1,432 1,555 1,032 1,438 -
TOTAL DEFERRED OUTFLOWS OF RESOURCES 16,924 1,616 1,163 1,547 -
LIABILITIES
Current liabilities:
Accounts payable & accruals 21,697 16,301 1,375 32,709 4,942
Interest payable 33,776 - - - -
Unearned revenue 197,399 5 3,959 208 -
Compensated absences - 609 341 1,020 -
Bonds payable 74,276 - - - -
Funds held in custody - - - - 99,559
Total current liabilities 327,148 16,915 5,675 33,937 104,501
Noncurrent liabilities:
Accounts payable & accruals 8,600 45 58 5,718 22,970
Compensated absences - 1,087 780 954 -
Bonds payable 2,537,629 - - - -
Net pension liability 6,026 6,914 5,040 6,530 -
Other postemployment benefits liability 909 1,016 817 1,103 -
Funds held in custody - - - - -
Total noncurrent liabilities 2,553,164 9,062 6,695 14,305 22,970
TOTAL LIABILITIES 2,880,312 25,977 12,370 48,242 127,471
DEFERRED INFLOWS OF RESOURCES
Accumulated increase in fair value of
hedging derivatives 1,937 - - - -
Related to other postemployment benefits 90 131 54 175 -
Related to pensions 785 488 137 396 -
TOTAL DEFERRED INFLOWS OF RESOURCES 2,812 619 191 571 -
NET POSITION
Net investment in capital assets 13,956 - 116,349 6,935 16,087
Restricted for:
Bond resolutions 1,138,102 - - - -
Clean water and drinking water programs 176,286 - - - -
Title guaranty program 54,788 - - - -
Economic development - 53,514 - - -
Other purposes 43,655 - 11,392 - 1,694,409
Nonexpendable - foundations - - - - -
Expendable - foundations - - - - -
Unrestricted 6,720 177,037 3,529 (2,534) 26,690
TOTAL NET POSITION 1,433,507$ 230,551$ 131,270$ 4,401$ 1,737,186$
(continued on next page)
58

STATE OF IOWA
Statement of Net Position
Component Units
June 30, 2021
(Expressed in Thousands)
UNIVERSITY UNIVERSITY
IOWA STATE OF NORTHERN OF IOWA UNIVERSITY TOTAL
UNIVERSITY IOWA RESEARCH OF IOWA COMPONENT
FOUNDATION FOUNDATION FOUNDATION HEALTH SYSTEM UNITS
ASSETS
Current assets:
Cash & investments 356,758$ 30,654$ 544$ 15,643$ 1,783,949$
Cash & investments - restricted - - - - 795
Accounts receivable (net) 49,097 1,296 2,069 2,242 125,488
Interest receivable - - - - 6,165
Loans receivable (net) - - - - 158,877
Inventory - - - 462 4,091
Prepaid expenses 9 - 74 462 944
Other assets - 127 - - 33,033
Total current assets 405,864 32,077 2,687 18,809 2,113,342
Noncurrent assets:
Cash & investments 1,268,809 184,336 8,452 11,361 3,897,947
Accounts receivable (net) 104,597 17,217 - - 238,394
Loans receivable (net) - - 197 - 2,235,547
Capital assets - nondepreciable 960 - - - 35,479
Capital assets - depreciable (net) 2,399 96 2 291 121,596
Other assets 7,878 865 250 - 39,072
Total noncurrent assets 1,384,643 202,514 8,901 11,652 6,568,035
TOTAL ASSETS 1,790,507 234,591 11,588 30,461 8,681,377
DEFERRED OUTFLOWS OF RESOURCES
Accumulated decrease in fair value of
hedging derivatives - - - 2,480 7,307
Debt refunding loss - - - - 10,529
Related to other postemployment benefits - - - - 437
Related to pensions - - - - 5,457
TOTAL DEFERRED OUTFLOWS OF RESOURCES - - - 2,480 23,730
LIABILITIES
Current liabilities:
Accounts payable & accruals 1,935 1,450 1,516 1,828 83,753
Interest payable - - - - 33,776
Unearned revenue - - - - 201,571
Compensated absences 1,024 - - - 2,994
Bonds payable - - - - 74,276
Funds held in custody 16,710 - - 5,731 122,000
Total current liabilities 19,669 1,450 1,516 7,559 518,370
Noncurrent liabilities:
Accounts payable & accruals 24,213 2,196 - - 63,800
Compensated absences - - - - 2,821
Bonds payable - - - - 2,537,629
Net pension liability - - - - 24,510
Other postemployment benefits liability - - - - 3,845
Funds held in custody 13,809 - - - 13,809
Total noncurrent liabilities 38,022 2,196 - - 2,646,414
TOTAL LIABILITIES 57,691 3,646 1,516 7,559 3,164,784
DEFERRED INFLOWS OF RESOURCES
Accumulated increase in fair value of
hedging derivatives - - - - 1,937
Related to other postemployment benefits - - - - 450
Related to pensions - - - - 1,806
TOTAL DEFERRED INFLOWS OF RESOURCES - - - - 4,193
NET POSITION
Net investment in capital assets 1,855 - 2 291 155,475
Restricted for:
Bond resolutions - - - - 1,138,102
Clean water and drinking water programs - - - - 176,286
Title guaranty program - - - - 54,788
Economic development - - - - 53,514
Other purposes - - - - 1,749,456
Nonexpendable - foundations 1,252,462 - - - 1,252,462
Expendable - foundations 390,750 215,509 - - 606,259
Unrestricted 87,749 15,436 10,070 25,091 349,788
TOTAL NET POSITION 1,732,816$ 230,945$ 10,072$ 25,382$ 5,536,130$
The notes are an integral part of the financial statements.
(continued)
59

STATE OF IOWA
Statement of Activities
Component Units
For the Year Ended June 30, 2021
(Expressed in Thousands)
IOWA IOWA UNIVERSITY
IOWA ECONOMIC STATE IOWA OF IOWA CENTER
FINANCE DEVELOPMENT FAIR LOTTERY FOR ADVANCEMENT
AUTHORITY AUTHORITY AUTHORITY AUTHORITY & AFFILIATE
Expenses 323,918$ 269,571$ 16,653$ 452,528$ 131,725$
Program revenues:
Charges for services 30,400 2,963 3,198 452,603 -
Operating grants & contributions 263,282 237,940 818 - 103,873
Capital grants & contributions - - 2,801 - -
Total program revenues 293,682 240,903 6,817 452,603 103,873
Net program (expenses) revenues (30,236) (28,668) (9,836) 75 (27,852)
General revenues:
Investment income 72,938 471 411 59 348,065
Other - 7,531 4,944 - -
Gain (loss) on sale of assets - - - 18 -
Total general revenues 72,938 8,002 5,355 77 348,065
CHANGE IN NET POSITION 42,702 (20,666) (4,481) 152 320,213
NET POSITION - JULY 1 1,390,805 251,217 135,751 4,249 1,416,973
NET POSITION - JUNE 30 1,433,507$ 230,551$ 131,270$ 4,401$ 1,737,186$
(continued on next page)
60

STATE OF IOWA
Statement of Activities
Component Units
For the Year Ended June 30, 2021
(Expressed in Thousands)
UNIVERSITY UNIVERSITY
IOWA STATE OF NORTHERN OF IOWA UNIVERSITY TOTAL
UNIVERSITY IOWA RESEARCH OF IOWA COMPONENT
FOUNDATION FOUNDATION FOUNDATION HEALTH SYSTEM UNITS
Expenses 111,943$ 16,807$ 4,686$ 20,778$ 1,348,609$
Program revenues:
Charges for services - - 3,389 18,721 511,274
Operating grants & contributions 147,668 32,902 - - 786,483
Capital grants & contributions - - - - 2,801
Total program revenues 147,668 32,902 3,389 18,721 1,300,558
Net program (expenses) revenues 35,725 16,095 (1,297) (2,057) (48,051)
General revenues:
Investment income 383,985 42,432 212 3,031 851,604
Other 6,028 1,267 120 2,559 22,449
Gain (loss) on sale of assets - - - - 18
Total general revenues 390,013 43,699 332 5,590 874,071
CHANGE IN NET POSITION 425,738 59,794 (965) 3,533 826,020
NET POSITION - JULY 1 1,307,078 171,151 11,037 21,849 4,710,110
NET POSITION - JUNE 30 1,732,816$ 230,945$ 10,072$ 25,382$ 5,536,130$
The notes are an integral part of the financial statements.
(continued)
61

Mason Motor Company car climbing steps of theIowa State Capitol Building in a promotional
exhibition of the automobile's power.Des Moines, Iowa 1907
Photographer: A.O. Harpel, Des Moines
State Historical Library and Archives of Iowa, State Historical Society of Iowa, Des Moines.
62

STATE OF IOWA
NOTES TO THE FINANCIAL STATEMENTS
NOTE 1 – SUMMARY OF SIGNIFICANT ACCOUNTING POLICIES
A. Basis of Presentation
The accompanying financial statements of the State of Iowa have been prepared in conformity with U.S. generally accepted accounting principles (GAAP) as prescribed by the Governmental Accounting Standards Board (GASB).
B. Financial Reporting Entity
For financial reporting purposes, the State of Iowa includes all funds, departments, agencies and universities of the State. The State has also considered all potential component units for which it is financially accountable and other organizations for which the nature and significance of their relationship with the State are such that exclusion would cause the State’s financial statements to be misleading or incomplete. The GASB has set forth criteria to be considered in determining financial accountability. These criteria include appointing a voting majority of an organization’s governing body and (1) the ability of the State to impose its will on that organization or (2) the potential for the organization to provide specific financial benefits to, or impose specific financial burdens on, the State.
As required by GAAP, these financial statements present the State of Iowa (the primary government) and its component units. The component units are included in the State’s reporting entity because of the significance of their operational or financial relationships with the State. The individual component unit financial statements, except for the Iowa Economic Development Authority (a single fund type) and the University of Iowa Strategic Fund (a blended component unit of the University of Iowa), which does not issue separate financial statements, can be obtained by contacting: Iowa Department of Administrative Services, State Accounting Enterprise, Hoover State Office Bldg., 3rd Floor, Des Moines, IA 50319.
Blended Component Units
These component units are legally separate organizations for which the State is financially accountable. The State appoints a voting majority of their boards and is able to impose its will on the organizations. In addition, these organizations provide specific financial benefits to, or impose specific financial burdens upon, the State. Each of the following component units are reported as part of the State’s primary government and are blended with the appropriate funds as they provide services entirely to the State or exclusively benefit the State.
• Tobacco Settlement Authority (Special Revenue Fund) was created to issue bonds to securitize paymentsdue to the State pursuant to the Master Settlement Agreement between the State and the five largest tobaccomanufacturers. The Authority’s board consists of the Treasurer of State, Auditor of State and the Directorof the Department of Management. The State has the ability to impose its will on the Authority and its solepurpose is to provide a secure and stable source of revenue from the tobacco settlement for the State.
• Iowa PBS Foundation, formerly Iowa Public Television Foundation, (Special Revenue and Permanent Funds)promotes and serves as a funding medium for Iowa PBS, a department of the State of Iowa. It solicits andmanages gifts of money or property for the exclusive purpose of granting gifts of money or property to IowaPBS which has sole discretion as to the use of the money or property. Iowa PBS provides support to theFoundation, including office space, website, legal services, television studio space and equipment, as wellas, broadcast production staff. The State has the ability to control fundraising activities and operations aswell as personnel decisions regarding the management of the Foundation. The Foundation exclusivelybenefits the State and provides services entirely to the State.
• Iowa Public Radio (Special Revenue Fund) manages the day-to-day operations of the State University radiostations and ensures compliance with Federal Communications Commission requirements on behalf of theIowa Board of Regents (Regents). The Regents appoints the board of directors and has assumed theobligation to provide financial support to, and finance deficits of, Iowa Public Radio. It serves as the primaryfundraising entity for the stations and exclusively benefits the State and provides services entirely to theState.
• The University of Iowa Strategic Fund (Enterprise Fund) is a non-profit corporation organized and operatedexclusively for charitable, educational and scientific purposes for the benefit of the University of Iowa. Itmanages the funds under the long-term lease and concession agreement for the University of Iowa UtilitySystem; selects and supervises the independent investment manager(s); grants money to the University ofIowa to support the concessionaire payments of the public-private partnership (P3) agreement; determinesthe annual payout of the endowment for the purpose of granting gifts of money to the University of Iowa forscientific research and educational activities; and reviews all grant requests received by the Budget ReviewBoard to ensure that each grant advances the University of Iowa’s strategic plans and to advance the causeof education and research.
63

STATE OF IOWA
NOTES TO THE FINANCIAL STATEMENTS
Discretely Presented Component Units
These component units are entities which are legally separate from the State, but are financially accountable to the State, or their relationship with the State is such that exclusion would cause the State’s financial statements to be misleading or incomplete. The component units include the financial data of these entities:
• Iowa Finance Authority (Proprietary) issues bonds to assist in attainment of adequate housing for specialneeds individuals such as low to moderate income and the disabled, and to provide limited types of financingto small businesses. The nine members of the board of directors are appointed by the Governor andconfirmed by the Senate. The State has the ability to impose its will upon the Authority.
• Iowa Economic Development Authority (Proprietary) undertakes programs to enhance economicdevelopment and to provide financing programs. The eleven members of the board of directors areappointed by the Governor and confirmed by the Senate. The State has the ability to impose its will on theAuthority.
• Iowa State Fair Authority (Proprietary) conducts the annual State Fair and Exposition and other interimevents on the Iowa State Fairgrounds. The State is financially accountable for the Authority through fiscaldependency and imposition of a financial burden. Bonds issued by the Authority must be approved by theState and there is a history of financial support. (October 31 year-end)
• Iowa Lottery Authority (Proprietary) was created to operate the State Lottery. The five members of the boardof directors are appointed by the Governor and confirmed by the Senate. The State has the ability to imposeits will on the Authority. The Authority’s purpose is to produce the maximum amount of net revenues forthe State in a dignified manner that maintains the general welfare of the people, while providing a financialbenefit to the State.
During the year ended June 30, 2021, the Iowa Lottery Authority provided $101.7 million to the State ofIowa.
• The University of Iowa Center for Advancement & Affiliate, Iowa State University Foundation and theUniversity of Northern Iowa Foundation (Foundations) are private, nonprofit organizations that report underFinancial Accounting Standards Board (FASB) standards, including FASB Statement No. 117, (FinancialReporting for Not-for-Profit Organizations). As such, certain revenue recognition criteria and presentationfeatures are different from GASB revenue recognition criteria and presentation features. No modificationshave been made to the financial information; however, the assets, liabilities, revenues and expenses werereformatted to correspond to the State’s reporting format for the Statement of Net Position and Statementof Activities. The University of Iowa Research Foundation and the University of Iowa Health System reportunder GASB standards.
o The Foundations are legally separate, tax exempt entities. They act primarily as fundraisingorganizations to supplement the resources available to the State Universities (Universities) insupport of their programs. Although the State does not control the timing or amount of receiptsfrom the Foundations, the majority of resources they hold and invest, and income thereon, arerestricted to the activities of the Universities by the donors. Because the majority of these restrictedresources can only be used by, or for the benefit of, the Universities, they are considered acomponent unit of the State and are discretely presented in the financial statements.
During the year ended June 30, 2021, the Foundations distributed $196.1 million to the
Universities for academic and institutional support.
• University of Iowa Research Foundation (UIRF) (Proprietary) commercializes University of Iowa developedtechnologies and inventions through licensing and new venture formation and manages the subsequentrevenue streams. The intention of the UIRF is to effectively manage University intellectual property tosuccessful outcomes including: transferring University inventions to the marketplace for public benefit,generating significant income, operating as a self-sustaining operation, and supporting the researchmission. Because the majority of these restricted resources can only be used by, or for the benefit of, theUniversity of Iowa, they are considered a component unit of the State and are discretely presented in thefinancial statements.
• University of Iowa Health System (Proprietary) was formed to support clinical, academic, and researchprograms of the University of Iowa College of Medicine and the University of Iowa Hospitals and Clinics.Because the majority of these restricted resources can only be used by, or for the benefit of, the University
64

STATE OF IOWA
NOTES TO THE FINANCIAL STATEMENTS
of Iowa, they are considered a component unit of the State and are discretely presented in the financial statements.
Related Organizations
These related organizations are excluded from the reporting entity because the State’s accountability does not extend beyond appointing a voting majority of the organizations’ board members. Financial statements are available from the respective organizations.
• Iowa Student Loan Liquidity Corporation
• Iowa Comprehensive Health Association
• Iowa Higher Education Loan Authority
C. Government-Wide and Fund Financial Statements
Government-Wide Financial Statements
The Statement of Net Position and Statement of Activities report information on all non-fiduciary activities of the primary government and its component units. Primary government activities are distinguished between governmental and business-type activities. Governmental activities generally are financed through taxes, intergovernmental revenues and other non-exchange revenues. Business-type activities are financed in whole, or in part, by fees charged to external parties for goods or services.
The Statement of Net Position presents the State’s non-fiduciary assets, liabilities and deferred outflows/inflows of resources, with the difference reported as net position. Net position is reported in three categories:
• Net investment in capital assets consists of capital assets, net of accumulated depreciation and reduced byoutstanding balances for bonds, notes and other debt that are attributed to the acquisition, constructionor improvement of those assets.
• Restricted net position results when constraints placed on net position use are either externally imposed orimposed by law through constitutional provisions or enabling legislation.
• Unrestricted net position consists of net position that does not meet the definition of the two precedingcategories. Unrestricted net position often has constraints on resources that are imposed by managementbut can be removed or modified.
When both restricted and unrestricted resources are available for use, generally it is the State’s policy to use restricted resources first.
The Statement of Activities demonstrates the degree to which the direct expenses of a given function or segment are offset by program revenues. Direct expenses are those clearly identifiable with a specific function. Program revenues include 1) charges to customers who purchase, use or directly benefit from goods, services or privileges provided by a given function and 2) grants and contributions that are restricted to meeting the operational or capital requirements of a particular function. Taxes and other items not meeting the definition of program revenues are reported as general revenues.
Fund Financial Statements
Separate financial statements are provided for governmental funds, proprietary funds and fiduciary funds even though the latter are excluded from the government-wide statements. Major individual governmental funds and major individual proprietary funds are reported as separate columns in the fund financial statements, with non-major funds combined into a single column.
Governmental Fund Balance Reporting
The fund balance classifications for governmental funds are reported in categories which describe the extent to which certain resources may be spent. Resources are categorized as spendable or nonspendable.
Nonspendable fund balances include inventory, prepaid items, noncurrent receivables and principal of endowments. These resources cannot be spent because they are either not in spendable form or are legally required to remain intact. When the proceeds from noncurrent receivables are restricted, committed or assigned, the fund balances for those amounts will be reported in the appropriate spendable fund balance classification.
65

STATE OF IOWA
NOTES TO THE FINANCIAL STATEMENTS
Spendable fund balances include resources that are in spendable form (e.g. cash) and are available for spending. Spendable fund balances are further classified as restricted, committed, assigned or unassigned. The following describes the different levels of constraint, if any, on spendable fund balance classifications:
Restricted – includes amounts that can be used only for the specific purposes stipulated by constitution, external resource providers (e.g. creditors, grantors and contributors) or enabling legislation.
Committed – includes amounts that can be used only for the specific purposes determined by a formal action of the State’s highest level of decision-making authority. The Iowa Legislature and Governor represent the State’s highest level of decision-making authority. Formal action consists of legislation passed by both the House and Senate and signed by the Governor and is required to establish, modify or rescind a limitation.
Assigned – includes amounts intended to be used by the State for a specific purpose but do not meet the criteria to be classified as restricted or committed. Currently, the State does not have a policy which authorizes the establishment of assigned fund balances.
Unassigned – includes the residual amount of the General Fund not included in the categories above, which is available for any purpose, and any negative fund balances in the other governmental fund types.
When both restricted and unrestricted (committed, assigned, unassigned) resources are available for use, generally it is the State’s policy to use restricted resources first. Also, when committed and unassigned resources are available to be spent for the same purpose, the State’s policy is, in general, to spend committed resources first.
D. Financial Statement Presentation
The State reports the following major governmental funds:
General Fund
The General Fund is the State’s principal operating fund. It accounts for all financial resources except those accounted for in another fund.
Special Revenue Funds
Tobacco Settlement Authority – The Tobacco Settlement Authority, a blended component unit of the State of Iowa, receives money from the Tobacco Collections Fund to pay for operating expenses and repayment of debt.
Tobacco Collections Fund – The Tobacco Collections Fund accounts for tobacco settlement moneys received pursuant to a Master Settlement Agreement between the State of Iowa and the five largest tobacco manufacturers. The funds are then distributed to the Tobacco Settlement Authority and the Endowment for Iowa’s Health Fund pursuant to the terms of a Sales Agreement (dated October 1, 2001, and amended November 1, 2005) between the State and the Tobacco Settlement Authority (a collateralized borrowing per GASB Statement No. 48). Per Code of Iowa Section 12E.12.1.b(3)(b), the State’s portion is then transferred to the Rebuild Iowa Infrastructure Fund.
The State reports the following major proprietary funds:
Enterprise Funds
University Funds account for the operations of the State’s public institutions of higher education. The State University of Iowa, Iowa State University and the University of Northern Iowa comprise this group.
The Unemployment Benefits Fund receives contributions from employers and federal funds to provide benefits to eligible unemployed workers.
In addition, the State reports the following fund types:
Governmental Funds
Special Revenue Funds account for the proceeds of specific revenue sources (other than permanent or capital projects) that are legally restricted to expenditures for a specified purpose.
Capital Projects Funds account for financial resources to be used for the acquisition or construction of major capital facilities (other than those financed by proprietary funds).
66

STATE OF IOWA
NOTES TO THE FINANCIAL STATEMENTS
Permanent Funds account for resources legally restricted to the extent that only earnings, and not principal, may be used for the benefit of the government or its citizenry.
Proprietary Funds
Enterprise Funds account for the activities for which fees are charged to external users for goods and services. This fund type is also used when the activity is financed with debt that is secured with fees and charges, as well as when the pricing policy of the activity is designated to recover its costs.
Internal Service Funds account for the financing of goods or services provided by one department or agency to other departments or agencies of the State, or to other governmental units, on a cost reimbursement basis. The activities accounted for in internal service funds include information technology, workers’ compensation, fleet operations, printing and mail services, and property management.
Fiduciary Funds
Pension and Other Employee Benefit Trust Funds account for fiduciary activities (1) for pension plans and other postemployment benefits (OPEB) plans that are administered through trusts or equivalent arrangements (hereafter jointly referred to as trusts) that meet the criteria in paragraph 3 of GASB Statement No. 67 or paragraph 3 of GASB Statement No. 74, respectively, and (2) for other employee benefit plans when (a) resources are held in a trust where assets associated with the activity are administered through a trust in which the government is not a beneficiary, are dedicated to providing benefits to recipients in accordance with the benefit terms, and are legally protected from the creditors of the government and (b)
contributions to the trust and earnings on those contributions are irrevocable. The pension plans included are the Iowa Public Employees’ Retirement System (IPERS), Peace Officers’ Retirement, Accident and Disability System (PORS) and the Judicial Retirement System (JRS).
Private Purpose Trust Funds account for all fiduciary activities that are (1) not required to be reported in pension (and other employee benefit) trust funds or investment trust funds and (2) assets associated with the activity are administered through a trust in which the government is not a beneficiary, are dedicated to providing benefits to recipients in accordance with the benefit terms, and are legally protected from the creditors of the government. Examples include Iowa Educational Savings Plan Trust and Iowa ABLE Savings Plan Trust.
Custodial Funds account for fiduciary activities that are not required to be reported in pension (and other employee benefit) trust funds, investment trust funds, or private purpose trust funds. These funds include local sales and services tax collections, offender/resident deposits, fines, fees and settlements.
E. Measurement Focus and Basis of Accounting
Basis of accounting refers to when revenues and expenditures or expenses are recognized in the accounts and reported in the financial statements. Basis of accounting relates to the timing of the measurements made, regardless of the measurement focus applied.
The government-wide statements are reported using the economic resources measurement focus and the accrual basis of accounting. Revenues are recorded when earned and expenses are recorded when a liability is incurred, regardless of the timing of cash flows.
Amounts reported as program revenues include 1) charges to customers or applicants for goods, services or privileges provided, 2) operating grants and contributions and 3) capital grants and contributions. General revenues include all taxes and investment income.
Governmental fund statements are reported using the current financial resources measurement focus and the modified accrual basis of accounting. Revenues are recognized as they become susceptible to accrual; generally when they are both measurable and available. Revenues are considered to be available when they are collected within the current period or soon enough thereafter to pay liabilities of the current period. Most revenues, including taxes, fees, charges for services, refunds and reimbursements and receipts from other entities, are considered by the State to be available if collected within 60 days of the end of the fiscal year. Investment earnings are recorded as earned since they are measurable and available.
Expenditures are recognized when the related fund liability is incurred. An exception to the general modified accrual expenditure recognition criteria is the principal and interest on general long-term debt, which is recognized when due. Income tax refunds are accrued for claims related to tax periods ended by June 30th, of the fiscal year, and paid within 60 days.
67

STATE OF IOWA
NOTES TO THE FINANCIAL STATEMENTS
Proprietary and fiduciary fund statements are reported using the economic resources measurement focus and the accrual basis of accounting. Revenues are recorded when earned and expenses are recorded when a liability is incurred, regardless of the timing of cash flows. Fiduciary fund liabilities are incurred when an event has happened that compels the government to disburse resources or when no further action, approval or condition is required to be taken or met by the beneficiary to release the assets.
Proprietary funds distinguish operating revenues and expenses from nonoperating items. Operating revenues and expenses generally result from providing services and producing and delivering goods in connection with a proprietary fund’s principal ongoing operations. Operating expenses for enterprise funds and internal service funds include the cost of sales and services, administrative expenses and depreciation on capital assets. All revenues and expenses not meeting this definition are reported as nonoperating revenues and expenses.
In fiscal year 2021, the State of Iowa implemented the following GASB standards:
• GASB Statement No. 93, Replacement of Interbank Offered Rates. This statement addresses accountingand financial reporting implications that result from the replacement of an interbank offered rate. Allparagraphs were implemented except for 11b, 13 and 14, which are effective for fiscal 2022.
• GASB Statement No. 98, The Annual Comprehensive Financial Report, was early implemented for the State’s2021 annual financial statements. This statement updates the term “comprehensive annual financialreport” or “CAFR” to “annual comprehensive financial report” or “ACFR”.
F. Cash, Investments and Securities Lending
Cash in most funds is held in the State treasury and is commingled in State bank accounts and investments. The moneys of most funds are pooled together and invested as an investment pool by the Treasurer of State (Treasurer). However, moneys of some funds may be invested separately from the investment pool where permitted by statute.
Investment earnings of the investment pool are allocated to the individual funds as provided by statute. Income of $4.6 million associated with certain funds has been assigned to other funds for fiscal year 2021.
The Treasurer’s deposits in financial institutions throughout the year and at year-end were entirely covered by the Federal Deposit Insurance Corporation, collateral held by the Treasurer’s custodial banks in the Treasurer’s name or by the bank assessment provisions of Section 12C.23 of the Code of Iowa.
The Treasurer may invest in obligations of the United States government, its agencies and instrumentalities; certificates of deposit in Iowa financial institutions; prime bankers’ acceptances, commercial paper or other short-term corporate debt; repurchase agreements; investments authorized for the Iowa Public Employees’ Retirement System in Section 97B.7A; money market mutual funds organized in trust form; obligations of the Iowa Finance Authority issued pursuant to Chapter 16 of the Code of Iowa and other investments as permitted by Section 12B.10 of the Code of Iowa.
Investments are reported at fair value in accordance with GASB Statement No. 31, Accounting and Financial Reporting for Certain Investments and for External Investment Pools, and GASB Statement No. 72, Fair Value
Measurement and Application. (See NOTE 2 – CASH, INVESTMENTS AND SECURITIES LENDING.) IPERS has derivatives that are reported on the Statement of Fiduciary Net Position at fair value. (See NOTE 15 – PENSION PLANS.)
Certain State institutions participate in the Iowa Public Agency Investment Trust (IPAIT), a state and local government pooled investment account, created by Chapter 28E of the Code of Iowa. IPAIT is managed by Investors Management Group and is registered with the Securities and Exchange Commission. IPAIT follows established money market mutual fund parameters designed to maintain a $1 per unit net asset value.
Cash and cash equivalents include currency on hand, demand deposits with banks or other financial institutions, investments readily convertible to known amounts of cash and investments so near their maturity they present insignificant risk of changes in value because of changes in interest rates. In the Statements of Cash Flows, investments with an original maturity of three months or less are considered cash equivalents.
IPERS, PORS and JRS (together the “Systems”) participate in a securities lending program administered by the Treasurer of State with Deutsche Bank as the lending agent. The participation of IPERS is authorized by the Code of Iowa and the participation of PORS and JRS is authorized by their Boards of Trustees. The lending agent is responsible for operating the program and is permitted to lend any of the securities it holds in custody for the Systems to broker-dealers and other entities in exchange for collateral. The lending agent is permitted to accept
68

STATE OF IOWA
NOTES TO THE FINANCIAL STATEMENTS
collateral in the form of cash in U.S. dollars, U.S. government securities or irrevocable letters of credit. The types of securities on loan included equity investments and fixed income securities.
A borrower is required to initially deliver collateral in an amount equal to 102% of the fair value of any U.S. securities lent and 105% of the fair value of any non-U.S. securities lent. Borrowers are required to provide additional collateral any time the value of the collateral drops below 100% of the value of the security lent plus accrued interest income.
At year-end, IPERS had $7.6 million in risk exposure due to the amount on loan by IPERS exceeding the amount owed to IPERS. This was because of a timing issue on the receipt of payment and was resolved the next day. PORS and JRS had no credit risk exposure to borrowers because the amounts the borrowers owed PORS and JRS did not exceed the amount the PORS and JRS owed the borrowers. The contracts with Deutsche Bank require it to indemnify the Systems if a borrower becomes insolvent, or if a loss is incurred from an investment of collateral in an overnight repurchase agreement. The securities lending contracts do not allow the Systems to pledge or sell collateral securities received unless the borrower defaults. As of June 30, 2021, the Systems had securities on loan, including accrued interest income, with a total value of $560.7 million against collateral with a total value of $580.7 million.
The majority of securities loans are open loans, i.e. one day maturity, where the rebate rate due to the borrower is renegotiated daily. All securities loans can be terminated on demand by either the Systems or the borrower. Cash collateral received from borrowers is invested in a cash collateral investment account which is managed by Deutsche Bank in accordance with investment guidelines established by the Treasurer of State and reviewed by the Systems. The investment guidelines do not require a matching of investment maturities with loan maturities, but do establish minimum levels of liquidity and other investment restrictions designed to minimize the interest rate risk associated with not matching the maturity of the investments with the loans. PORS and JRS bear interest rate risk if the custodian bank invests in securities which decrease in value or default. (See NOTE 2.)
The effective duration of the cash collateral pool at June 30, 2021, for IPERS was 0.00. Credit quality and years to maturity statistics for the cash collateral pool at June 30, 2021, for the Systems are as follows (expressed in thousands):
G. Accounts Receivable
Accounts receivable have been established and offset with proper provisions for estimated uncollectible accounts where applicable. Practically all receivables of governmental funds are due from other governmental entities, primarily the federal government, and are considered collectible. Receivables in other funds have arisen in the ordinary course of business.
Taxes receivable represent amounts due to the State at June 30, which will be collected sometime in the future. In the government-wide financial statements, a corresponding amount is recorded as revenue. In the governmental fund financial statements, the portion considered “available” is recorded as revenue; the remainder is recorded as deferred inflows of resources – deferred revenue.
H. Inventories
Inventories are valued at cost, which approximates market. The first-in/first-out (FIFO) cost flow method is used for the majority of inventories. Throughout the year, costs of inventories are recorded as expenditures when purchased. For financial reporting purposes, expenditures are adjusted at fiscal year-end for material inventory
Investment Redemption
Maturity Redemption Notice
Investment Type Fair Value * AAA A-1 Not Rated (Years) Frequency Period
Money market funds 356,629$ 356,629$ -$ -$ Less than 1 N/A on demand
Overnight repurchase
agreements 210,290 - 184,500 25,790 Less than 1 Daily on demand
566,919$ 356,629$ 184,500$ 25,790$
* Investments are measured at the net asset value. See NOTE 2 - CASH, INVESTMENTS AND SECURITIES LENDING for
additional information about fair value measurement.
Securities Lending Collateral Pool
Credit Risk: S&P Quality Rating
69

STATE OF IOWA
NOTES TO THE FINANCIAL STATEMENTS
amounts to correlate with the consumption method. Inventory asset amounts are not available for budgetary appropriation as they have been charged to expenditures when purchased rather than when used.
I. Prepaid Items
Payments made to vendors for services that will benefit periods beyond June 30 are recorded as prepaid items in both government-wide and fund financial statements. In governmental funds, prepaid items are accounted for using the consumption method and a portion of fund balance equal to the prepaid items has been classified as nonspendable to indicate it is not available for appropriation.
J. Capital Assets
Capital assets are reported in the government-wide and proprietary fund financial statements at historical cost. Donated capital assets acquired before July 1, 2015, are reported at their estimated fair market value at the date of acquisition. Donated capital assets acquired after June 30, 2015, are reported at their acquisition value at the date of acquisition. Capital assets utilized in governmental funds are reported as expenditures when purchased in the governmental fund financial statements. Interest incurred during the construction phase of capital assets of enterprise funds is generally included as part of the capitalized value of the assets constructed. Infrastructure (acquired after June 30, 1980) and intangible assets (acquired after June 30, 2009), as defined by the State’s policy are reported. Reportable capital assets are defined by the State as assets above the following thresholds:
Infrastructure $ 1,000,000
Intangible assets $ 500,000
Land, buildings & improvements $ 50,000
Equipment $ 5,000
Capital assets are depreciated over their useful lives using the straight-line depreciation method. The government-wide, proprietary fund and component unit financial statements report depreciation expense. The following useful lives are used:
Infrastructure 10-50 years
Buildings and improvements other than buildings 20-50 years
Intangible assets 5-20 years
Equipment 2-20 years
Vehicles 3-10 years
Each University sets its own capitalization threshold and useful life policies. See individual University financial reports.
K. Deferred Outflows of Resources
In addition to assets, the government-wide and fund financial statements may report a separate section of deferred outflows of resources. This separate financial statement element represents a consumption of net position or fund balance that applies to future period(s) and so will not be recognized as an outflow of resources (expense/expenditure) until then.
L. Compensated Absences
Employees’ compensated absences are accrued when earned. Accrued vacation is paid at 100% of the employee’s hourly rate upon retirement, death or termination. With certain exceptions, accrued sick leave is paid at 100% of the employee’s hourly rate to a maximum of $2,000 upon retirement. Employees may elect to use a portion of accrued sick leave balances to pay the state share of group health insurance premiums upon retirement. The liability for accrued compensated absences as reported in the government-wide and proprietary fund financial statements is based on the current rate of pay.
M. Long-term Liabilities
In the government-wide and proprietary fund financial statements, long-term debt and long-term liabilities are reported as liabilities. Bonds payable are reported net of the applicable bond premium or discount. Bond discounts for proprietary fund types are generally amortized over the terms of the bonds using the bonds-outstanding method
70

STATE OF IOWA
NOTES TO THE FINANCIAL STATEMENTS
or straight-line method, which approximates the effective interest method. In governmental fund types, bond discounts are recognized in the current period.
Long-term liabilities due within one year of the date of the statements are classified as current liabilities.
N. Deferred Inflows of Resources
In addition to liabilities, the government-wide and fund financial statements may report a separate section for deferred inflows of resources. This separate financial statement element represents an acquisition of net position or fund balance that applies to future period(s) and so will not be recognized as an inflow of resources (revenue) until that time.
O. Interfund Activity and Balances
Interfund Activity
As a general rule, the effect of interfund activity has been eliminated from the government-wide financial statements. Exceptions to this rule are: 1) activities between funds reported as governmental activities and funds reported as business-type activities and 2) activities between funds reported in different functional categories in either the governmental or business-type activities column. Elimination of these activities would distort the direct costs and program revenues for the functions concerned.
Interfund Balances
Interfund receivables and payables have been eliminated from the Statement of Net Position, except for the residual amounts due between governmental and business-type activities.
P. Encumbrances
The State utilizes encumbrance accounting for budgetary control purposes. Obligations incurred for goods or services not received or rendered are recorded to reserve that portion of the applicable fund balance. Section 8.33, unnumbered paragraph 2, of the Code of Iowa, states, “No payment of an obligation for goods and services shall be charged to an appropriation subsequent to the last day of the fiscal year for which the appropriation is made unless the goods or services are received on or before the last day of the fiscal year, except that repair projects, purchase of specialized equipment and furnishings, and other contracts for services and capital expenditures for the purchase of land or the erection of buildings or new construction or remodeling, which were committed and in progress prior to the end of the fiscal year are excluded from this provision.” That is, except for the above stated exceptions, the State must have received the goods or services on or before June 30, creating an actual liability, or the encumbrance
is cancelled against that fiscal year. If the encumbrances are still valid after June 30, they become expenditures/expenses of the next fiscal year.
Q. Stabilization Arrangements (Reserve Funds)
The State maintains two reserve funds: The Cash Reserve Fund and the Iowa Economic Emergency Fund, created in Sections 8.56 and 8.55 of the Code of Iowa. These funds were established by formal action of the highest level of decision making authority as they were created by legislation passed by both the House and Senate and signed by the Governor. The law restricts the use and purpose of each fund. Formal action is required to use resources in the funds, modify their purpose or change the balances of the funds. Fund balances for both funds are included in the committed spendable fund balance classification.
The Cash Reserve Fund is separate from the General Fund of the State and is not to be considered part of the General Fund of the State except in determining the cash position of the State. The moneys in the Cash Reserve Fund cannot be transferred, used, obligated, appropriated or otherwise encumbered except as provided under Iowa Code Section 8.56. Interest or earnings on moneys deposited in the Cash Reserve Fund are credited to the Rebuild Iowa Infrastructure Fund. Moneys in this fund may be used for cash flow purposes provided that moneys so allocated are returned to the Cash Reserve Fund by the end of each fiscal year. The maximum balance of the fund is equal to 7.5% of the adjusted revenue estimated for the General Fund for the current fiscal year. The moneys in this fund may only be appropriated by the General Assembly for nonrecurring emergency expenditures and shall not be appropriated for payment of any collective bargaining agreement or arbitrator’s decision negotiated or awarded. The balance in the Cash Reserve Fund may be used in determining the cash position of the General Fund of the State for payment of State obligations. An appropriation shall not be made from the Cash Reserve Fund if the appropriation would cause the fund’s balance to be less than 3.75% of the adjusted revenue estimate for the year for which the appropriation is made unless the bill or joint resolution is approved by vote of at least three-fifths of the members of both chambers of the General Assembly and is signed by the Governor. Also, the appropriation
71

STATE OF IOWA
NOTES TO THE FINANCIAL STATEMENTS
must be contained in a bill or joint resolution in which the appropriation is the only subject matter of the bill or joint resolution, and the bill or joint resolution states the reasons the appropriation is necessary.
The Iowa Economic Emergency Fund is separate from the General Fund of the State and the fund is not to be considered part of the balance of the General Fund of the State. The moneys in the fund do not revert to the General Fund. The maximum balance of the fund is equal to 2.5% of the adjusted revenue estimate for the General Fund for the current fiscal year. Interest or earnings on moneys deposited in the Iowa Economic Emergency Fund are credited to the Rebuild Iowa Infrastructure Fund. Moneys in this fund may be used for cash flow purposes provided that moneys so allocated are returned to the Iowa Economic Emergency Fund by the end of each fiscal year. The balance may be used in determining the cash position of the General Fund of the State for payment of State obligations. Amounts in excess of the maximum balance are distributed as follows: (1) the difference between the actual net revenue for the General Fund of the State and the adjusted revenue estimate for the fiscal year is transferred to the Taxpayers Trust Fund, (2) the remainder of the excess, if any, shall be transferred to the General Fund of the State.
The General Assembly can only appropriate moneys in the fund for emergency expenditures. A maximum of 1% of the adjusted revenue estimate for the fiscal year may be used to prevent a deficit in the General Fund when all of the following have occurred: (1) the balance of the General Fund of the State at the end of the fiscal year prior to the appropriation made in this paragraph was negative; and (2) the Governor has issued an official proclamation and has notified the Legislative fiscal committee and the Legislative Services Agency that the balance of the General Fund is negative and that an appropriation made pursuant to Iowa Code section 8.55 brings the General Fund of the State into balance. Additionally, the Executive Council may receive an amount sufficient to pay expenses authorized in 7D.29 of the Code of Iowa.
R. Minimum Fund Balance Requirements
Currently, the State has four governmental funds which are required by statute, federal regulations or bonding requirements to maintain minimum fund balances. However, the State does not have a formally adopted policy
regarding minimum fund balances.
S. Budgeting and Budgetary Control
There are no material violations of finance-related legal and contractual provisions. Budgetary comparison schedules and related disclosures are reported as Required Supplementary Information (RSI).
(Notes continue on next page.)
72

STATE OF IOWA
NOTES TO THE FINANCIAL STATEMENTS
NOTE 2 – CASH, INVESTMENTS AND SECURITIES LENDING
A. Primary Government and Fiduciary Funds
Fair Value Measurement
Fair value is defined as the price that would be received to sell an asset or paid to transfer a liability in an orderly transaction between market participants at the measurement date. Generally accepted accounting principles provide a hierarchy that prioritizes the inputs to fair value measurements based on the extent inputs to valuation techniques are observable in the marketplace. The hierarchy assigns a higher priority to observable inputs that would reflect the State’s assumptions about how market participants would value an asset or liability based on the best information available. Fair value measurements should maximize the use of observable inputs and minimize the use of unobservable inputs.
The three levels of the fair value hierarchy are as follows:
• Level 1 – Unadjusted quoted prices in active markets for identical assets or liabilities that are available atthe measurement date.
• Level 2 – Inputs other than quoted prices included within Level 1 that are observable for an asset or liability,either directly or indirectly.
• Level 3 – Unobservable inputs for an asset or liability that are used to measure fair value when observableinputs are not available. These inputs are developed based upon the best information available in suchcircumstances.
The categorization of fair value measurements by level of the hierarchy is based upon the lowest level input that is significant to the overall fair value measurement for a given asset or liability. The assessment of the significance of particular inputs to these fair value measurements requires judgment and considers factors specific to each asset or liability.
In the event that changes in the inputs used in the fair value measurement of an asset or liability result in a transfer into a different level, such transfers are recognized at the end of the reporting period.
Valuation techniques – Treasurer: The custodian for the Treasurer’s investments, Bank of New York Melon (BNYM),
prices securities based on information from third-party vendors. Where available, BNYM uses more than one vendor for securities of each asset type, class, or issue. Vendor-provided prices are subjected to automated tolerance checks to identify and avoid, where possible, the use of inaccurate prices. Data received from vendors is checked to test for possible errors, which are researched manually. Vendor prices or prices from other specified alternative sources which are considered to be reliable are then applied for all customer accounts.
When a portfolio includes limited partnerships, commingled funds, real estate funds or other similar private investment vehicles that do not actively trade through established exchange mechanisms, such positions are usually valued by a general or managing partner (or functional equivalent). Certain private placements, or other difficult to price holdings, where there is no, or limited, information in the market place are frequently priced by investment managers whose portfolio holds the asset.
Valuation techniques – IPERS: Short-term securities generally include investments in money market-type securities reported at cost plus accrued interest, which approximates fair value.
Debt, equity and derivative instrument securities classified in Level 1 are valued using prices quoted in active markets for those securities. Derivative instrument securities classified in Level 2 are securities whose values are either derived daily from associated traded securities or are determined by using a market approach that considers benchmark interest rates.
Debt and debt derivative instrument securities classified in Level 2 and Level 3 are valued using either a bid evaluation or a matrix pricing technique. Bid evaluations may include market quotations, yields, maturities, call features, and ratings. Matrix pricing is used to value securities based on the securities’ relationship to benchmark quoted prices. Level 2 debt securities have nonproprietary information that is readily available to market participants, from multiple independent sources, which are known to be actively involved in the market. Level 3 debt securities are solely composed of bank loans and these investments use proprietary information or single-source pricing.
Other real assets and private real estate separate accounts classified in Level 3 are investments generally valued using one or a combination of the following accepted valuation approaches: market, cost, or income. Independent
73
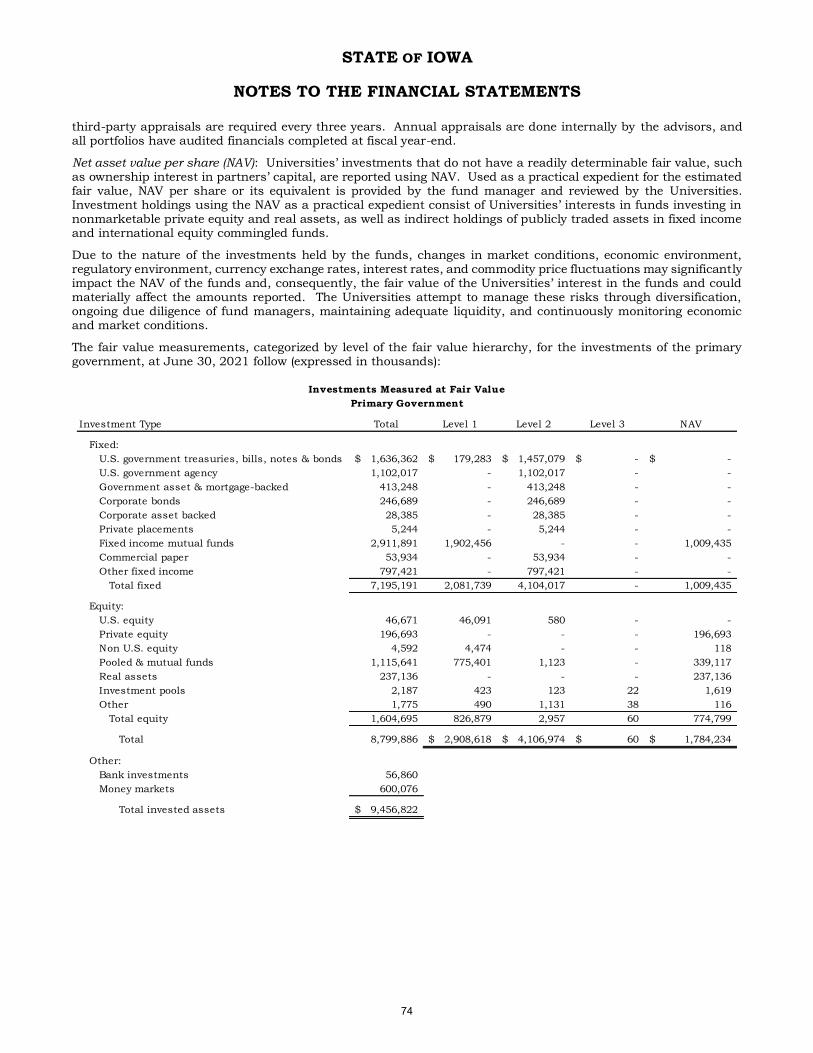
STATE OF IOWA
NOTES TO THE FINANCIAL STATEMENTS
third-party appraisals are required every three years. Annual appraisals are done internally by the advisors, and all portfolios have audited financials completed at fiscal year-end.
Net asset value per share (NAV): Universities’ investments that do not have a readily determinable fair value, such as ownership interest in partners’ capital, are reported using NAV. Used as a practical expedient for the estimated fair value, NAV per share or its equivalent is provided by the fund manager and reviewed by the Universities. Investment holdings using the NAV as a practical expedient consist of Universities’ interests in funds investing in nonmarketable private equity and real assets, as well as indirect holdings of publicly traded assets in fixed income and international equity commingled funds.
Due to the nature of the investments held by the funds, changes in market conditions, economic environment, regulatory environment, currency exchange rates, interest rates, and commodity price fluctuations may significantly impact the NAV of the funds and, consequently, the fair value of the Universities’ interest in the funds and could materially affect the amounts reported. The Universities attempt to manage these risks through diversification, ongoing due diligence of fund managers, maintaining adequate liquidity, and continuously monitoring economic and market conditions.
The fair value measurements, categorized by level of the fair value hierarchy, for the investments of the primary government, at June 30, 2021 follow (expressed in thousands):
Investment Type Total Level 1 Level 2 Level 3 NAV
Fixed:
U.S. government treasuries, bills, notes & bonds 1,636,362$ 179,283$ 1,457,079$ -$ -$
U.S. government agency 1,102,017 - 1,102,017 - -
Government asset & mortgage-backed 413,248 - 413,248 - -
Corporate bonds 246,689 - 246,689 - -
Corporate asset backed 28,385 - 28,385 - -
Private placements 5,244 - 5,244 - -
Fixed income mutual funds 2,911,891 1,902,456 - - 1,009,435
Commercial paper 53,934 - 53,934 - -
Other fixed income 797,421 - 797,421 - -
Total fixed 7,195,191 2,081,739 4,104,017 - 1,009,435
Equity:
U.S. equity 46,671 46,091 580 - -
Private equity 196,693 - - - 196,693
Non U.S. equity 4,592 4,474 - - 118
Pooled & mutual funds 1,115,641 775,401 1,123 - 339,117
Real assets 237,136 - - - 237,136
Investment pools 2,187 423 123 22 1,619
Other 1,775 490 1,131 38 116
Total equity 1,604,695 826,879 2,957 60 774,799
Total 8,799,886 2,908,618$ 4,106,974$ 60$ 1,784,234$
Other:
Bank investments 56,860
Money markets 600,076
Total invested assets 9,456,822$
Investments Measured at Fair Value
Primary Government
74

STATE OF IOWA
NOTES TO THE FINANCIAL STATEMENTS
The following table summarizes investments measured at the net asset value per share, or equivalent, for the primary government, at June 30, 2021 (expressed in thousands):
The following information is provided for the investments of the primary government that are valued using the net
asset value per share as a practical expedient:
• Fixed income mutual funds – This category includes investments in mutual funds holding assets thatprovide stability, generate income, and diversify market risk.
• Private equity – This category includes funds that invest in strategies such as venture capital, leveragedbuyouts and mezzanine debt.
• Pooled & mutual funds – This category includes investments in global equities including both developedand emerging markets.
• Real assets – This category includes investments in private real estate and natural resource equities funds.
• For the private equity and real assets investment types, capital is committed during the course of theinvestment period, typically four years, of each fund, after which point capital commitments stop. TheUniversities’ interest in the nonredeemable funds is considered to be illiquid in that distributions fromliquidation of the underlying asset of the fund are at the discretion of the general partner per the terms ofthe limited partnership agreement. Funds are typically liquidated over a period of 5 to 10 years, and includea mechanism to extend the length of the partnership with approval from the limited partners.
Unfunded Redemption Redemption
Investment Type Fair Value Commitments Frequency Notice Period
Fixed:
Fixed income mutual funds 1,009,435$ -$ daily - quarterly 5 - 60 days
Equity:
Private equity 196,693 113,514 N/A N/A
Non U.S. equity - redeemable 118 35 daily - monthly 1 - 30 days
Pooled & mutual funds 339,117 - daily - monthly 2 - 30 days
Real assets - redeemable 176,488 - quarterly 60 - 90 days
Real assets - nonredeemable 60,648 4,707 N/A N/A
Investment Pool 1,619 - N/A N/A
Other 116 - quarterly 60 - 90 days
Total equity 774,799 118,256
Total 1,784,234$ 118,256$
Investments Measured at the Net Asset Value
Primary Government
75

STATE OF IOWA
NOTES TO THE FINANCIAL STATEMENTS
The fair value measurements, categorized by level of the fair value hierarchy, for the investments of the fiduciary funds, at June 30, 2021 follow (expressed in thousands):
The following table summarizes investments measured at the net asset value per share, or equivalent, for the fiduciary funds, at June 30, 2021 (expressed in thousands):
Investment Type Total Level 1 Level 2 Level 3 NAV
Fixed:
U.S. government treasuries, bills, notes & bonds 1,621,704$ 1,557,682$ 64,022$ -$ -$
U.S. government agency 556,582 1,349 555,233 - -
Government asset & mortgage-backed 1,521,455 - 1,521,455 - -
Corporate bonds 2,815,801 - 2,637,666 178,135 -
Corporate asset backed 148,428 - 148,428 - -
Private placements 2,368,350 - 2,368,350 - -
Fixed income mutual funds 1,233,333 3,125 - 7,923 1,222,285
Commingled bond funds 2,745,647 - - - 2,745,647
Other fixed income 404,085 4,662 45,584 353,839 -
Total fixed 13,415,385 1,566,818 7,340,738 539,897 3,967,932
Equity:
U.S. equity 6,660,769 6,268,991 388,703 3,075 -
Private equity 7,498,079 - - - 7,498,079
Commingled & mutual funds 19,958,169 6,475,135 484,246 - 12,998,788
Real assets 3,580,158 - - 2,430,523 1,149,635
Other 54,721 7,735 46,986 - -
Total equity 37,751,896 12,751,861 919,935 2,433,598 21,646,502
Total 51,167,281 14,318,679$ 8,260,673$ 2,973,495$ 25,614,434$
Other:
Bank investments 41
Money markets 211
Total invested assets 51,167,533$
Investments Measured at Fair Value
Fiduciary Funds
Unfunded Redemption Redemption
Investment Type Fair Value Commitments Frequency Notice Period
Fixed:
Fixed income mutual funds 1,222,285$ -$ daily - monthly 5 - 60 days
Commingled bond funds 2,745,647 - daily 2 days
Total fixed 3,967,932 -
Equity:
Private equity 7,498,079 2,484,644 N/A N/A
Commingled & mutual funds 12,998,788 - daily - monthly 1 - 30 days
Real assets - redeemable 286 - quarterly 60 - 90 days
Real assets - nonredeemable 1,149,349 449,696 N/A N/A
Total equity 21,646,502 2,934,340
Total 25,614,434$ 2,934,340$
Investments Measured at the Net Asset Value
Fiduciary Funds
76

STATE OF IOWA
NOTES TO THE FINANCIAL STATEMENTS
The following information is provided for the investments of the fiduciary funds that are valued using the net asset value per share as a practical expedient:
• Commingled bond funds and commingled & mutual funds – Consists of various collective trust funds whereassets are commingled for investment purposes. Each are valued at the net asset value of the units heldat the end of the period based upon the fair value of the underlying investments.
• Private equity – Consists of 153 active partnerships within the legacy program and a fund-of-oneinvestment, which invests primarily in buyout funds, with some exposure to venture capital, specialsituations, and distressed debt funds. The fair values of these funds and the fund-of-one have beendetermined using net assets valued one quarter in arrears plus current quarter cash flows. These fundsare not eligible for redemption. Distributions are received as underlying investments within the funds areliquidated, which on average can occur over the span of 5 to 10 years.
• Real assets – nonredeemable – Consists of nine partnerships. Four of the funds determine fair value byutilizing net asset values from one quarter in arrears plus current quarter cash flows. Three of the fundsdetermine fair value by utilizing net asset values from the current quarter. Two funds have not yet beenfunded. None of the private credit funds are eligible for redemption. Distributions are received asunderlying investments are liquidated, which on average can occur over the span of 3 to 7 years.
Credit Risk
Credit risk is the risk that an issuer or other counterparty to an investment will not fulfill its obligations. The State’s exposure to credit risk for the fixed income investments of the primary government and fiduciary funds at June 30, 2021, is summarized as follows (expressed in thousands):
The Treasurer’s investment policy authorizes the investment in U.S. Treasuries, agencies and instrumentalities; certificates of deposit and other evidences of deposit at federally insured depository institutions approved pursuant to Chapter 12C of the Code of Iowa; domestic prime bankers’ acceptances that are eligible for purchase by a federal reserve bank and which mature within 270 days from the date of purchase; domestic commercial paper maturing within 270 days from the date of purchase having a rating of A1+/P1 or A1/P1 by Standard & Poor’s and Moody’s on the date of purchase; short-term corporate debt, other than commercial paper, maturing within 270 days from the date of purchase having one of the two highest ratings of either Standard & Poor’s or Moody’s on the date of purchase, provided that at the time of purchase no more than 5% of amounts invested in short-term corporate debt or commercial paper maturing within 270 days are rated in the second highest rating classification; perfected repurchase agreements; obligations or guaranteed investment contracts of domestic corporations with maturities greater than 270 days from the date of purchase which have long-term ratings of not less than A2 by Moody’s and not less than A by Standard & Poor’s; asset-backed securities rated AAA by Standard & Poor’s or Aaa by Moody’s which are purchased at par value or at a discount to par value and have an expected average time to receipt of principal (average life) of less than two years and a final maturity of less than three years at the time of purchase; and money market mutual funds which are open-end investment management companies organized in trust form registered with the SEC under the Investment Company Act of 1940.
S & P S & P
Quality Ratings Fair Value Percentage Quality Ratings Fair Value Percentage
TSY 213,362$ 2.97% TSY 2,658,482$ 19.82%
AGY 7,600 0.11% AGY 256,679 1.91%
AAA 113,399 1.58% AAA 1,089,182 8.12%
AA 4,315,204 59.97% AA 966,461 7.20%
A 725,510 10.08% A 1,359,755 10.14%
BBB 253,563 3.52% BBB 2,478,202 18.47%
BB 184,821 2.57% BB 1,158,311 8.63%
B 371,321 5.16% B 709,517 5.29%
Below B 51,732 0.72% Below B 211,174 1.57%
Not rated 958,679 13.32% Not rated 2,527,622 18.85%
Total 7,195,191$ 100.00% Total 13,415,385$ 100.00%
Primary Government Fiduciary Funds
77
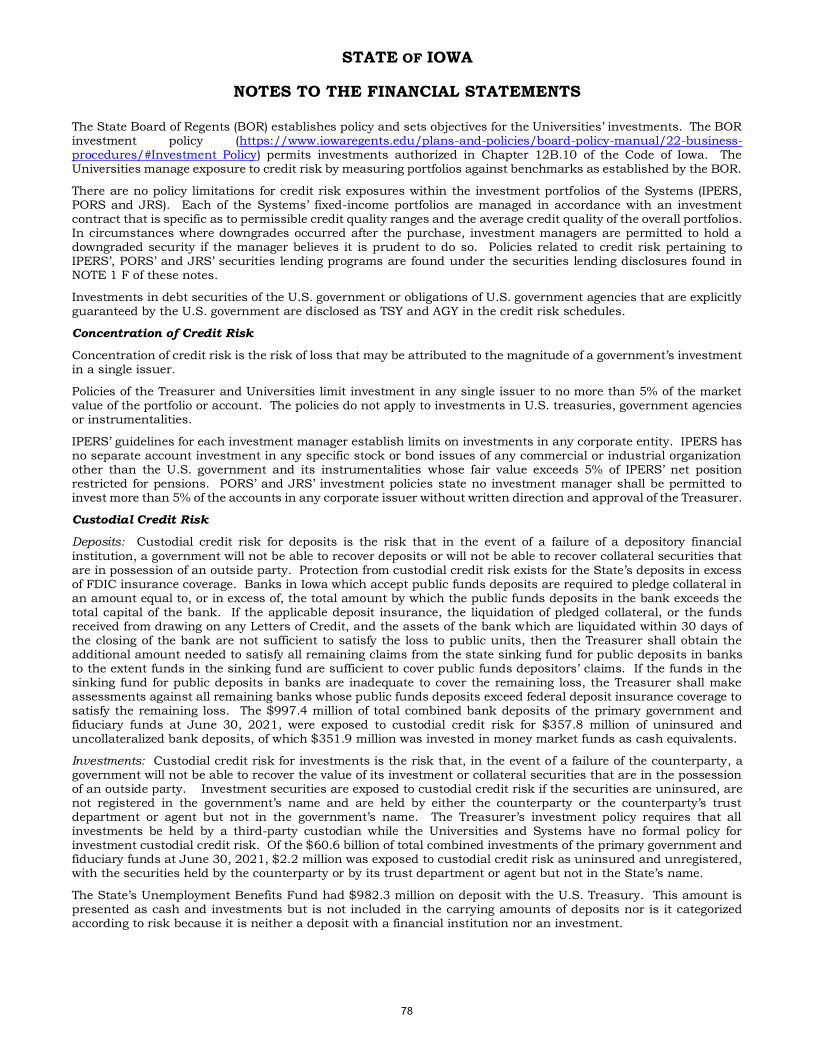
STATE OF IOWA
NOTES TO THE FINANCIAL STATEMENTS
The State Board of Regents (BOR) establishes policy and sets objectives for the Universities’ investments. The BOR investment policy (https://www.iowaregents.edu/plans-and-policies/board-policy-manual/22-business-procedures/#Investment Policy) permits investments authorized in Chapter 12B.10 of the Code of Iowa. The Universities manage exposure to credit risk by measuring portfolios against benchmarks as established by the BOR.
There are no policy limitations for credit risk exposures within the investment portfolios of the Systems (IPERS, PORS and JRS). Each of the Systems’ fixed-income portfolios are managed in accordance with an investment contract that is specific as to permissible credit quality ranges and the average credit quality of the overall portfolios. In circumstances where downgrades occurred after the purchase, investment managers are permitted to hold a downgraded security if the manager believes it is prudent to do so. Policies related to credit risk pertaining to IPERS’, PORS’ and JRS’ securities lending programs are found under the securities lending disclosures found in NOTE 1 F of these notes.
Investments in debt securities of the U.S. government or obligations of U.S. government agencies that are explicitly guaranteed by the U.S. government are disclosed as TSY and AGY in the credit risk schedules.
Concentration of Credit Risk
Concentration of credit risk is the risk of loss that may be attributed to the magnitude of a government’s investment in a single issuer.
Policies of the Treasurer and Universities limit investment in any single issuer to no more than 5% of the market value of the portfolio or account. The policies do not apply to investments in U.S. treasuries, government agencies or instrumentalities.
IPERS’ guidelines for each investment manager establish limits on investments in any corporate entity. IPERS has no separate account investment in any specific stock or bond issues of any commercial or industrial organization other than the U.S. government and its instrumentalities whose fair value exceeds 5% of IPERS’ net position restricted for pensions. PORS’ and JRS’ investment policies state no investment manager shall be permitted to invest more than 5% of the accounts in any corporate issuer without written direction and approval of the Treasurer.
Custodial Credit Risk
Deposits: Custodial credit risk for deposits is the risk that in the event of a failure of a depository financial
institution, a government will not be able to recover deposits or will not be able to recover collateral securities that are in possession of an outside party. Protection from custodial credit risk exists for the State’s deposits in excess of FDIC insurance coverage. Banks in Iowa which accept public funds deposits are required to pledge collateral in an amount equal to, or in excess of, the total amount by which the public funds deposits in the bank exceeds the total capital of the bank. If the applicable deposit insurance, the liquidation of pledged collateral, or the funds received from drawing on any Letters of Credit, and the assets of the bank which are liquidated within 30 days of the closing of the bank are not sufficient to satisfy the loss to public units, then the Treasurer shall obtain the additional amount needed to satisfy all remaining claims from the state sinking fund for public deposits in banks to the extent funds in the sinking fund are sufficient to cover public funds depositors’ claims. If the funds in the sinking fund for public deposits in banks are inadequate to cover the remaining loss, the Treasurer shall make assessments against all remaining banks whose public funds deposits exceed federal deposit insurance coverage to satisfy the remaining loss. The $997.4 million of total combined bank deposits of the primary government and fiduciary funds at June 30, 2021, were exposed to custodial credit risk for $357.8 million of uninsured and uncollateralized bank deposits, of which $351.9 million was invested in money market funds as cash equivalents.
Investments: Custodial credit risk for investments is the risk that, in the event of a failure of the counterparty, a government will not be able to recover the value of its investment or collateral securities that are in the possession of an outside party. Investment securities are exposed to custodial credit risk if the securities are uninsured, are not registered in the government’s name and are held by either the counterparty or the counterparty’s trust department or agent but not in the government’s name. The Treasurer’s investment policy requires that all investments be held by a third-party custodian while the Universities and Systems have no formal policy for investment custodial credit risk. Of the $60.6 billion of total combined investments of the primary government and fiduciary funds at June 30, 2021, $2.2 million was exposed to custodial credit risk as uninsured and unregistered, with the securities held by the counterparty or by its trust department or agent but not in the State’s name.
The State’s Unemployment Benefits Fund had $982.3 million on deposit with the U.S. Treasury. This amount is presented as cash and investments but is not included in the carrying amounts of deposits nor is it categorized according to risk because it is neither a deposit with a financial institution nor an investment.
78

STATE OF IOWA
NOTES TO THE FINANCIAL STATEMENTS
Interest Rate Risk
Interest rate risk is the risk changes in interest rates will adversely affect the fair value of an investment.
The Treasurer manages interest rate risk by utilizing a buy-and-hold strategy, maturity limitations, and maturity diversification parameters and liquidity funding requirements set by the Investment Committee.
Maturity Limitations: No investment shall be made in a U.S. Treasury note or bond, a U.S. government agency note or bond or a U.S. government instrumentality note or bond with a maturity that exceeds 61 months at the time of purchase. (The 61-month maturity limitation for government agency or instrumentality securities does not apply to such securities if accepted as collateral under a repurchase agreement.) No investment shall be made in an asset-backed security that has an expected average life greater than two years at the time of purchase and a final maturity greater than three years at the time of purchase. The maturities of commercial paper and bankers acceptances shall not exceed 270 days at the time of purchase. The maturities of all other investments shall not exceed 25 months at the time of purchase.
Maturity Diversification: The Investment Committee shall set permitted maximum dollar amounts that can be invested in specific maturity sectors that are consistent with the overall portfolio strategy and the investment policy.
Liquidity Reserve: The Investment Committee shall specify how much liquidity shall be reserved to ensure that adequate cash is available to meet any unexpected expenditures that may occur. The liquidity reserve should be continuously invested in money market mutual funds or money market accounts with Iowa financial institutions.
The Universities’ policies for the operating portfolio prohibit investment in securities that at the time of purchase have effective maturities exceeding 63 months. There is no explicit limit on the average maturity of fixed income securities in the endowment portfolios. Each fixed income portfolio is managed to an appropriate benchmark.
The Systems measure interest rate risk within the portfolios using the effective duration (or option-adjusted) methodology. The methodology takes into account optionality on bonds and scales the risk of price changes on
bonds depending upon the degree of change in rates and the slope of the yield curve. There are no organization-wide policies for interest rate risk exposure within the overall fixed-income portfolios. IPERS’ core-plus fixed-income investment contracts generally require the effective duration of the manager’s portfolio to remain between 80% and 120% of the effective duration measure of a specific fixed-income index. However, all of IPERS’ core-plus managers have authority under their contracts to reduce the interest rate sensitivity of their core-plus portfolios to less than 80% of the benchmark’s effective duration (up to zero effective duration) if the managers forecast a period of rising interest rates. For high-yield bond portfolios, the effective duration must remain between 75% and 125% of the benchmark’s effective duration.
The State’s exposure to interest rate risk for the fixed income investments of the primary government and the fiduciary funds at June 30, 2021, is summarized using the effective duration method, as follows (expressed in thousands):
Effective Effective
Duration Duration
Investment Type Fair Value (Years) Investment Type Fair Value (Years)
U.S. government treasuries, U.S. government treasuries,
bills, notes & bonds 1,636,362$ 0.75 bills, notes & bonds 1,621,704$ 8.89
U.S. government agency 1,102,017 1.89 U.S. government agency 556,582 8.63
Government asset & Government asset &
mortgage-backed 413,248 2.16 mortgage-backed 1,521,455 4.03
Corporate bonds 246,689 4.46 Corporate bonds 2,815,801 6.77
Corporate asset backed 28,385 0.60 Corporate asset backed 148,428 1.48
Private placements 5,244 0.67 Private placements 2,368,350 4.16
Fixed income mutual funds 2,911,891 3.26 Fixed income mutual funds 1,233,333 0.10
Commercial paper 53,934 0.10 Commingled bond funds 2,745,647 6.59
Other fixed income 797,421 0.52 Other fixed income 404,085 8.58
Total 7,195,191$ 2.12 Total 13,415,385$ 5.68
Primary Government Fiduciary Funds
79

STATE OF IOWA
NOTES TO THE FINANCIAL STATEMENTS
Foreign Currency Risk
Foreign currency risk is the risk that changes in exchange rates will adversely impact the fair value of an investment.
IPERS’ currency policy is to allow its investment managers the discretion to hedge their foreign currency exposures. PORS’ external managers may or may not hedge the portfolio’s foreign currency exposures with forward foreign exchange contracts, currency options, currency futures or options on currency futures depending upon their views on a specific foreign currency relative to the U.S. dollar. IPERS generally does not allow its investment managers to enter into currency positions greater than 100% or less than 0% of the underlying asset exposure in their respective portfolios. The only exceptions are (1) as it relates to specific cross-hedging activity, which may be permitted in certain investment manager contracts, and (2) in liquid absolute return strategies (LARS) where the managers are permitted to tactically allocate across several asset classes and strategies, including currency. IPERS’ net foreign currency exposure of the LARS managers was less than 1% of IPERS’ total foreign currency exposure on June 30, 2021.
Foreign currency risk by investment type for the fiduciary funds, at June 30, 2021, follows (expressed in thousands):
Total Cash Derivatives Equity Fixed Income
Argentine peso 68$ -$ -$ -$ 68$
Australian dollar 155,537 920 567 154,050 -
Brazilian real 41,862 623 - 39,113 2,126
British pound 303,151 (4,588) 162 297,821 9,756
Canadian dollar 52,728 815 655 50,993 265
Chilean peso 9,682 128 (156) 9,710 -
Chinese yuan renminbi 103,690 283 - 103,407 -
Chinese yuan (28,186) (28,186) - - -
Colombian peso 1,278 1 - 1,277 -
Czech koruna 878 26 - 852 -
Danish krone 65,256 652 - 64,604 -
Egyptian pound 845 (418) - 1,263 -
Euro 745,009 (97,457) (960) 736,212 107,214
Hong Kong dollar 214,640 1,500 245 212,895 -
Hungarian forint 14,512 12 - 14,500 -
Indian rupee 99,929 4,714 - 95,213 2
Indonesian rupiah 8,413 165 - 8,248 -
Israeli shekel 15,144 6 - 15,138 -
Japanese yen 557,075 2,888 673 553,514 -
Malaysian ringgit 6,469 24 309 6,136 -
Mexican peso 74,812 (4,610) 362 34,482 44,578
New Zealand dollar 8,838 96 - 8,742 -
Norwegian krone 22,924 206 (221) 22,939 -
Philippine peso 12,202 41 - 12,161 -
Polish zloty 38,659 20 - 38,639 -
Qatari riyal 3,448 127 - 3,321 -
Russian ruble 550 139 - 411 -
Singapore dollar 50,897 152 (56) 50,801 -
South African rand 55,231 94 153 54,984 -
South Korean won 164,574 216 - 164,358 -
Swedish krona 105,006 701 (175) 104,480 -
Swiss franc 170,471 2,771 - 167,700 -
Taiwanese dollar 159,061 452 - 158,609 -
Thai baht 22,647 20 (9) 22,636 -
Turkish lira 18,239 1 170 18,068 -
United Arab Emirates dirham 3,009 107 - 2,902 -
Total 3,278,548$ (117,359)$ 1,719$ 3,230,179$ 164,009$
80

STATE OF IOWA
NOTES TO THE FINANCIAL STATEMENTS
Deposits with Trustees
Deposits with trustees totaled $129.8 million at June 30, 2021. $100 thousand was invested in fixed U.S. government agency securities with an effective duration of .25 years and a credit quality rating of AAA, $87 million was invested in equity securities not subject to credit quality ratings, and the remaining $42.7 million was cash and cash equivalents.
University Endowments
For donor restricted endowments, Chapter 540A of the Code of Iowa permits the Universities to spend the net appreciation of realized and unrealized earnings as the Universities determine to be prudent.
The Universities’ policies are to retain the realized and unrealized appreciation with the endowments pursuant to the spending rules of the Universities. Spending rules for the Universities are as follows:
• The University of Iowa’s spending rule adjusts dollar payouts by the trailing calendar year Consumer PriceIndex (inflation rate). Total payout is banded at no less than 4% and no greater than 5% of calendar year-end market values.
• Iowa State University’s spending rule is 5.5%, which includes a 1.25% administrative fee, of a three-yearmoving average market value.
• The University of Northern Iowa’s spending rule is 5% of the three-year moving average of the fair value ofthe endowment.
Net appreciation of endowment funds available to meet spending rate distributions are as follows (expressed in thousands):
B. Component Units
Fair Value Measurement
Fair value is defined as the price that would be received to sell an asset or paid to transfer a liability in an orderly transaction between market participants at the measurement date. Generally accepted accounting principles provide a hierarchy that prioritizes the inputs to fair value measurements based on the extent inputs to valuation techniques are observable in the marketplace.
The Iowa Finance Authority (Authority) obtains its fair value pricing on fixed income investments from its third- party custodian. There are multiple pricing methodologies which are used to value the Authority’s fixed income investments. These methods include, but are not limited to, gathering pricing from multiple market sources and vendor credit information, observed market movements, sector news into the pricing applications and models, or manual methods. Since none of the Authority’s fixed income investments are actively traded on an exchange, yet rely on significant observable inputs for fair value pricing, these securities are classified as Level 2.
The Authority also holds investments in governmental money market mutual funds, guaranteed investment contracts and the State of Iowa Treasurer pooled money fund. These investments are valued using cost-based measures. The State Treasurer manages the investments and accepts all risks with respect to the investments in the pool. The pool has no limitations or restrictions on withdrawals and transacts with the Authority at a value of $1 per share.
The Authority obtains its fair value pricing on interest rate swaps and cap derivative instruments from a third- party vendor. The fair value of the forward mortgage-backed securities (MBS) sales and MBS purchase commitments are estimated based on internal valuation models. See NOTE 2 C, for further description of the fair value methodology for derivative instruments.
Amount Net Position Classification
University of Iowa 27,340$ Restricted nonexpendable net position
Iowa State University 6,289 Restricted expendable net position
University of Northern Iowa 1,014 Restricted expendable net position
81

STATE OF IOWA
NOTES TO THE FINANCIAL STATEMENTS
The fair value measurements, categorized by level of the fair value hierarchy, for the investments of the component units, at June 30, 2021 follow (expressed in thousands):
The University Foundations’, discretely presented component units, cash and investments of $3.5 billion are not subject to GASB disclosure requirements.
Credit Risk
Credit risk is the risk that an issuer or other counterparty to an investment will not fulfill its obligations.
The Iowa Finance Authority’s (Authority) investment of funds may be governed by the Authority’s investment policy approved by the Authority’s board of directors, the Authority’s various bond indentures and the State. Permitted
investments include direct obligations of, or obligations guaranteed by or issued by, certain agencies of the federal government; repurchase agreements fully collateralized and secured by the U.S. Treasury; corporate bonds issued or guaranteed by a domestic U.S. corporation meeting certain credit rating standards; municipal bonds backed by the full faith and credit of the municipality; pooled money funds; money market funds; certificates of deposits; commercial paper with qualified corporations; and guaranteed investment contracts with financial institutions meeting certain credit rating standards. The Authority minimizes credit risk by limiting securities to the credits and types of investments authorized in the investment policy or relevant bond indentures; and prequalifying the financial institutions, brokers, dealers, and advisers with whom the Authority does business, as outlined in the Authority’s investment policy.
The other component units have no formal policy to manage credit risk.
Investment Type Total Level 2 Level 3
Fixed:
U.S. government treasuries, bills, notes & bonds 3,762$ 3,762$ -$
U.S. government agency 3,601 3,601 -
Government asset & mortgage-backed 848,615 848,615 -
Corporate bonds 20,920 20,920 -
Certificates of deposit 1,555 1,555 -
Commercial paper 28,475 28,475 -
Total fixed 906,928 906,928 -
Equity:
Other 955 - 955
Total 907,883 906,928$ 955$
Other:
Money markets 693,108
State of Iowa Treasurer pooled money fund 57,966
Healthcare joint ventures 11,408
Total invested assets 1,670,365$
Investments Measured at Fair Value
82

STATE OF IOWA
NOTES TO THE FINANCIAL STATEMENTS
The exposure to credit risk for the component units fixed income investments at June 30, 2021, is summarized as follows (expressed in thousands):
Concentration of Credit Risk Concentration of credit risk is the risk of loss that may be attributed to the magnitude of a government’s investment in a single issuer.
The Iowa Finance Authority’s investment policy outlines the allowable concentrations of various investment categories. Bond indentures restrict the types of permitted investments. Portfolio maturities are staggered to avoid undue concentration of assets within a specific maturity period which provides for stability of income and reasonable liquidity.
The other component units have no formal policy to manage concentration of credit risk.
Interest Rate Risk
Interest rate risk is the risk changes in interest rates will adversely affect the fair value of an investment.
The Iowa Finance Authority’s strategy, as discussed in its investment policy, is to minimize interest rate risk by structuring investment portfolios so that securities mature to meet cash requirements for ongoing operations, thereby avoiding the need to sell securities on the open market prior to maturity.
The other component units do not have formal policies limiting investment maturities as a means of managing exposure to interest rate risk.
The component units’ exposure to interest rate risk for the fixed income investments at June 30, 2021, is summarized using the weighted average maturity method, as follows (expressed in thousands):
C. Derivatives
Fiduciary Funds
GAAP requires the fair value of financial arrangements called “derivative instruments” to be reported in the financial statements of state and local governments. Further, derivative instruments are required to be categorized as either hedging derivative instruments or investment derivative instruments. All of IPERS’ derivative instrument exposures at June 30, 2021, are categorized as investment derivative instruments and, therefore, hedge accounting provisions are not applicable.
S & P
Quality Ratings Fair Value Percentage
AAA 28,475$ 3.14%
AA 28,283$ 3.12%
Not rated 850,170 93.74%
Total 906,928$ 100.00%
Weighted Average
Investment Type Fair Value Maturity (Years)
U.S. government treasuries, bills, notes & bonds 3,762$ 1.40
U.S. government agency 3,601 2.69
Government asset & mortgage-backed 848,615 22.66
Corporate bonds 20,920 2.82
Certificates of deposit 1,555 0.93
Commercial paper 28,475 0.53
Total 906,928$ 21.31
83

STATE OF IOWA
NOTES TO THE FINANCIAL STATEMENTS
Some of the IPERS’ external investment managers may be permitted through their individual investment contracts to use derivative instruments, subject to IPERS’ derivative instruments policy. Derivative instruments are contracts or securities whose returns are derived from the returns of other securities, indexes, or derivative instruments. While this definition includes the most common type of derivative instrument, collateralized mortgage obligations (which typically make up a portion of IPERS’ fixed-income portfolio), it is also intended to include (but not be limited to) futures, forwards, options, options on futures, swaps, and swaptions. IPERS’ managers are not permitted to utilize derivative instruments for speculative purposes, but may use them to efficiently access desired markets and to control and manage portfolio risk. Examples of appropriate applications of derivative instrument strategies include hedging interest rate and currency risk, maintaining exposure to a desired asset class while effecting asset allocation changes, managing duration risk, augmenting index fund performance through index arbitrage, and implementing portable alpha strategies, including liquid absolute return strategies.
The various derivative instruments utilized by IPERS’ investment managers are described below. Although the notional values associated with these derivative instruments are not recorded in the financial statements, the fair value amounts of exposure (unrealized gains/losses) are reported in the Statement of Fiduciary Net Position. IPERS holds investments in limited partnerships and commingled investment funds, which may occasionally utilize derivative instruments for hedging purposes; however, any derivative instruments held by these types of investment vehicles are not included in this Note. IPERS could be exposed to risk if the counterparties to derivative instrument contracts are unable to meet the terms of the contracts. IPERS’ investment managers seek to control this risk through counterparty credit evaluations and approvals, counterparty credit limits, exposure monitoring procedures, and in some cases the collateralization of gains or losses. IPERS anticipates the counterparties will be able to satisfy their obligations under the contracts. Limited partnerships and commingled investment vehicles in which IPERS invests may also have exposure to counterparty risk from the use of derivative instruments for hedging purposes.
Futures and Options Contracts: IPERS had investments in various futures and options during the year. The Statement of Fiduciary Net Position reports these contracts at fair value.
Futures and options can potentially offer lower-cost, more efficient alternatives to buying the underlying securities or currency. They can also serve to minimize certain unwanted risks within the portfolio. The market, currency,
and credit risk of the futures were the same as if IPERS had owned the underlying securities or currency.
Summaries of futures and options contracts by sector outstanding at June 30, 2021, follow (expressed in thousands):
Number Notional Fair % of Total
of Contracts Value Value Fund NAV
Long Futures:
Agriculture 199 5,627$ 125$ 0.00029
Currency 1,164 85,534 (972) (0.00227)
Energy 404 28,333 653 0.00152
Index 1,792 194,761 (141) (0.00033)
Interest 19,483 3,106,287 8,113 0.01893
Metal 552 44,451 797 0.00186
Total 23,594 3,464,993$ 8,575$ 0.02000
Short Futures:
Agriculture (59) (1,606)$ (11)$ (0.00003)
Currency (2,458) (245,315) 5,998 0.01400
Energy (50) (1,674) (151) (0.00035)
Index (50) (975) 6 0.00001
Interest (13,726) (2,499,625) (6,056) (0.01413)
Metal (441) (35,004) (626) (0.00146)
Total (16,784) (2,784,199)$ (840)$ (0.00196)
Futures Exposure Summary
84

STATE OF IOWA
NOTES TO THE FINANCIAL STATEMENTS
Credit Default Swaps: IPERS had investments in credit default swaps during the year. The credit default swaps are derivative instruments used to hedge or to replicate investments in debt obligations of corporate bond issuers. The risk of the credit default swap is comparable to the credit risk of the reference security. At June 30, 2021, the net notional value of the credit default swaps held in IPERS’ fixed-income portfolio was $51.3 million. The credit default swaps are reported at a fair value of $1.7 million in the Statement of Fiduciary Net Position.
Interest Rate Swaps: Interest rate swaps are transactions between two parties in which interest payments from different indexes are swapped. Interest rate swaps are often used to alter the portfolios’ exposure to interest rate fluctuations by swapping fixed-rate obligations for floating-rate obligations or vice versa. By utilizing interest rate swaps, IPERS’ investment managers are able to alter their interest rate exposure and bring it in line with their strategic objectives for interest rate risk. At June 30, 2021, the net notional value of the interest rate swaps held in IPERS’ fixed-income portfolio was $9.2 billion. All interest rate swaps held by IPERS are reported at a fair value of $13.7 million in the Statement of Fiduciary Net Position.
Mortgage-Backed Securities: IPERS invests in mortgage-backed securities, which are reported in the Statement of
Fiduciary Net Position at fair value based on estimated future cash flows from the interest and principal payments of the underlying mortgages. Mortgage-backed securities prices are sensitive to prepayments by mortgagees, a scenario that is more likely in declining-interest-rate environments. IPERS invests in mortgage-backed securities to diversify the portfolio and earn the return premium associated with prepayment risk.
Component Units
Iowa Finance Authority (Authority) uses derivative instruments to manage and reduce exposure to adverse fluctuations in interest rates and to lower the overall cost of financing. All derivative instruments are recorded at fair value. Certain of the derivatives consist of interest rate swap and interest rate cap agreements entered into in connection with its issuance of variable rate mortgage revenue bonds. These derivative instruments are considered hedging derivative instruments and recorded as other assets or other liabilities in the Statement of Net Position.
The Authority’s additional derivative instruments are commitments to purchase mortgage-backed securities (MBS). These derivative instruments consist of forward sales of MBS in the To-Be-Announced market, which hedge changes in the fair value of mortgage loan inventory and commitments. These contracts are considered investment derivative instruments and recorded as other assets or other liabilities in the Statement of Net Position.
The Authority reports hedging derivative instruments’ accumulated change in fair value as either deferred inflows or outflows of resources in the Statement of Net Position, and investment derivative instruments’ accumulated changes in fair value as part of the net increase/decrease in fair value of investments within the Statement of Revenues, Expenses and Changes in Net Position.
% of Total
Fair Value Fund NAV
Options purchased:
Interest 1,173$ 0.00274
Total 1,173$ 0.00274
Options written:
Interest (1,669)$ (0.00389)
Total (1,669)$ (0.00389)
Options Exposure Summary
85

STATE OF IOWA
NOTES TO THE FINANCIAL STATEMENTS
Aggregate debt service requirements of the Authority’s hedged variable-rate debt and net receipts/payments on associated derivative instruments at June 30, 2021, follow (expressed in thousands):
The amounts presented in the table above assume that current interest rates on variable-rate bonds and the current reference rates of hedging derivative instruments will remain the same for their term. As these rates vary, interest payments on variable-rate bonds and net receipts/payments on hedging derivative instruments will vary. Not all variable rate debt is associated with a derivative instrument.
Hedging Derivatives – Swaps: Swap agreements allow the Authority to raise funds at variable rates and swap them into fixed rates that are lower than those available to the Authority if fixed-rate borrowings were made directly. These contracts involve the exchange of variable-rate for fixed-rate payments between the parties, without the exchange of the underlying debt, based on a common notional amount and maturity date. The terms of the authority’s swap hedging derivative instruments outstanding at June 30, 2021, follow (expressed in thousands):
Variable-rate Variable-rate
Year Ending Bonds Bonds Interest Rate
June 30, Principal Interest Swaps, Net Total
2022 -$ 56$ 3,177$ 3,233$
2023 1,300 55 3,157 4,512
2024 4,720 55 3,146 7,921
2025 1,440 53 2,982 4,475
2026 1,520 53 2,930 4,503
2027-2031 15,460 252 13,662 29,374
2032-2036 39,348 209 9,982 49,539
2037-2041 42,953 142 6,625 49,720
2042-2046 52,191 67 3,152 55,410
2047-2051 17,858 5 278 18,141
Total 176,790$ 947$ 49,091$ 226,828$
2020
Bond Notional Effective Termination S & P Global
Series Amount Date Date Pay Receive Rating
SF 2015 B 2,185$ 09/01/06 01/01/36 3.766% Enhanced LIBOR A+
MF 2008 A 3,350 04/17/08 06/01/24 3.971% SIFMA + 0.08% A+
SF 2015 B 27,765 01/01/17 01/01/46 2.518% 67% of USD LIBOR AA-
SF 2016 B* 14,800 07/01/16 07/01/21 2.206% 67% of USD LIBOR AA-
SF 2016 B* 135 12/12/07 07/01/21 4.373% 100% of USD LIBOR AA-
SF 2016 E 5,355 01/01/18 07/01/46 2.292% 67% of USD LIBOR A+
SF 2017 D 13,125 01/01/18 01/01/47 2.126% 67% of USD LIBOR A+
SF 2018 B 15,000 07/01/18 07/01/47 2.490% 70% of USD LIBOR AA-
SF 2018 D 11,250 07/01/19 07/01/48 2.638% 70% of USD LIBOR AA-
SF 2019 B 15,000 07/01/19 07/01/30 1.939% SIFMA A+
SF 2019 E 11,250 01/01/20 01/01/49 1.605% SIFMA Swap Index until AA-
1/1/2029; 67% of USD
LIBOR thereafter
SF 2020 B 15,000 07/01/20 07/01/49 1.691% SIFMA Swap Index until A+
7/1/2029; 67% of USD
LIBOR thereafter
SF 2020 E 11,250 07/01/21 07/01/35 1.051% SIFMA A+
SF 2016 B 15,000 07/01/21 01/01/28 0.870% SIFMA AA-
160,465$
* Swap was terminated on 07/01/2021
Terms
86

STATE OF IOWA
NOTES TO THE FINANCIAL STATEMENTS
Hedging Derivatives – Caps: Interest rate cap derivatives are when the Authority receives payments at the end of each period, based on a notional amount, when the interest rate exceeds the agreed-upon strike rate. Terms of the Authority’s cap derivative instruments outstanding at June 30, 2021, follow (expressed in thousands):
Investment Derivatives: The Authority’s investment derivative instruments had the following maturities as of June 30, 2021 (expressed in thousands):
Fair Values of Derivatives: The Authority’s fair value of derivative instruments outstanding at June 30, 2021, classified by type, and changes in the fair value of such derivative instruments as reported in the financial statements are as follows (expressed in thousands):
2021
Bond Notional Effective Maturity S & P Global
Series Amount Date Date Strike Rate Rating
MF 2007 B 9,300$ 06/14/07 01/01/24 SIFMA = 5.5% AA-
MF 2007 A 11,305 07/01/18 07/01/21 SIFMA = 3% AA-
MF 2007 A 11,030 07/01/21 07/01/24 SIFMA = 3% AA-
MF FHLB B-1 9,839 07/01/18 07/01/22 USD LIBOR = 6% AA-
41,474$
Notional Fair
Investment Type Value Value Less than 1 1 - 5
Investment derivative instruments:
Swaps 7,900$ (348)$ -$ (348)$
Forward MBS sales 28,350 (45) (45) -
MBS purchase commitments 125,803 1,169 1,169 -
Total 162,053$ 776$ 1,124$ (348)$
(in Years)
Investment Maturities
Fair Value Change in Fair Value
Bond Series Type June 30, 2021 Fair Value June 30, 2020
Hedging derivatives:
SF 2015 B Swap (142)$ 70$ (212)$
SF 2015 B Swap (372) 477 (849)
SF 2016 B Swap (64) 49 (113)
SF 2016 E Swap (254) 64 (318)
SF 2017 D Swap (398) 223 (621)
SF 2018 B Swap (885) 402 (1,287)
SF 2018 D Swap (822) 367 (1,189)
SF 2019 B Swap (1,206) 764 (1,970)
SF 2019 E Swap (156) 391 (547)
SF 2020 B Swap (338) 549 (887)
SF 2020 E Swap 353 353 -
MF 2007 A Cap 6 6 -
MF 2007 B Cap 1 (1) 2
MF 2008 A Swap (332) 135 (467)
Total hedging derivatives (4,609)$ 3,849$ (8,458)$
Investment derivatives:
NONE Swap (366)$ 227$ (593)$
NONE Basis swap 18 (1) 19
NONE Swap - 12 (12)
Forward MBS sales Forward (45) (53) 8
MBS purchase commitments Commitment 1,169 (1,283) 2,452
Total investment derivatives 776$ (1,098)$ 1,874$
87

STATE OF IOWA
NOTES TO THE FINANCIAL STATEMENTS
The fair values, categorized by level of the fair value hierarchy, for the hedging and investment derivative instruments of the Authority, at June 30, 2021 follow (expressed in thousands):
Methodology: The fair values of the interest rate derivative transactions were estimated based on an independent pricing service. The valuations provided were derived from proprietary models based upon well-recognized principles and estimates about relevant future market conditions. The expected transaction cash flows are calculated using the zero-coupon discounting method which takes into consideration the prevailing benchmark interest rate environment, the specific terms and conditions of a given transaction, and assumes that the current forward rates implied by the benchmark yield curve are the market’s best estimate of future spot interest rates. The income approach is then used to obtain the fair value of the transactions, where future amounts (the expected transaction cash flows) are converted to a single current (discounted) amount, using a rate of return that takes into account the relative risk of nonperformance associated with the cash flows and time value of money. Where applicable under the income approach (which takes into consideration the risk of nonperformance) an option pricing model technique is applied such as the Black-Scholes-Merton model, the Black-Derman-Toy model, one of the short-rate models, or other market standard models consistent with accepted practices in the market for interest rate option products. The option models would consider probabilities, volatilities, time, settlement prices, and other variables pertinent to the transactions. This valuation technique is applied consistently across all transactions.
The fair value of the forward MBS sales are estimated based on an internal valuation model, which includes current trade pricing for similar financial instruments in active markets that the Authority has the ability to access.
The fair value of the MBS purchase commitments are estimated using an internal valuation model, which includes grouping the commitments by interest rate and terms, applying an estimated closing ratio, and then multiplying by
quoted investor prices determined to be reasonably applicable to the commitment groups based on interest rate, terms, and commitment expiration dates of the commitment group. The closing ratio calculation, which represents the percentage of commitments that management estimates it will ultimately fund, takes into consideration historical data and loan-level data. The weighted average closing ratio at June 30, 2021, was 77.25%.
Risks Associated with Derivative Transactions:
Credit risk: The Authority is exposed to credit risk on hedging derivative instruments that are in asset positions. The aggregate fair value of hedging derivative instruments in asset positions at June 30, 2021 was $378,000. This represents the maximum loss that would be recognized at the reporting date if all counterparties failed to perform as contracted.
Bank of New York Mellon, Goldman Sachs Bank USA, Royal Bank of Canada, and Wells Fargo Bank, N.A. are currently counterparties under the derivatives agreements with the Authority.
With respect to counterparty risk, the Authority will also manage the agreements and all transactions entered into with its counterparties to ensure that the Authority’s exposure to any of its counterparties does not exceed a proper amount.
Interest rate risk: The Authority is exposed to interest rate risk on its derivatives. On its pay-fixed, receive-variable derivatives, as the LIBOR or SIFMA swap index decreases, the Authority’s net payment on the derivatives increases.
Basis risk: Basis risk refers to a mismatch between the interest rate received from the derivative counterparty and the interest rate actually owed on the Authority’s bonds. Specifically, the Authority’s basis risk is that the variable interest payment received from the counterparty will be less than the actual variable interest payments owed on the Authority’s variable rate bonds. The mismatch between the Authority’s actual bond rate and the derivative rate is the Authority’s basis risk. As of June 30, 2021, the SIFMA swap index rate is 0.03% and US 1-month LIBOR is 0.1005%.
Termination risk: Termination risk is the risk that the swap could be terminated as a result of any of several events, which may include a ratings downgrade of the Authority’s single-family mortgage bonds or of a derivative counterparty covenant violation, bankruptcy, swap payment default, and default events as defined in the
Derivative Type Total Level 2 Level 3
Hedging derivative instruments (4,609)$ (4,609)$ -$
Investment derivative instruments 776 (393) 1,169
88

STATE OF IOWA
NOTES TO THE FINANCIAL STATEMENTS
Authority’s Single-Family Mortgage Bonds Resolution; however, the Authority believes that the likelihood of any such termination event is remote.
Rollover risk: Rollover risk is the risk that the term of a particular swap contract is not coterminous with the related bonds. If an issuer entered into a swap to hedge for a specified period of time and then decides at swap maturity it wishes to maintain the same or similar hedge position, it may incur additional costs at that time. The Authority minimizes this risk by matching the term of the swaps with the maturity of the related bonds.
(Notes continue on next page.)
89

STATE OF IOWA
NOTES TO THE FINANCIAL STATEMENTS
NOTE 3 – TRANSFERS
Interfund transfers for the year ended June 30, 2021, consisted of the following (expressed in thousands):
Transfers are used to move: 1) revenues from the fund that statute requires to collect them to the fund that statute requires to expend them, 2) unrestricted revenues collected in the General Fund to finance various programs accounted for in other funds in accordance with budgetary authorization and 3) profits from the Liquor Control Act Fund as required by law.
NOTE 4 – RECEIVABLES
Receivables at June 30, 2021, consisted of the following (expressed in thousands):
Nonmajor Unemployment Nonmajor
General Governmental University Benefits Enterprise
Transferred Out Fund Funds Funds Fund Funds Total
General Fund -$ 25,219$ 611,210$ 237,470$ 2,071$ 875,970$
Tobacco Collections Fund 11,645 - - - - 11,645
Nonmajor Governmental Funds 91,909 1,094 - - - 93,003
Unemployment Benefits Fund 5,102 - - - - 5,102
Nonmajor Enterprise Funds 151,937 - - - - 151,937 -
Total 260,593$ 26,313$ 611,210$ 237,470$ 2,071$ 1,137,657$
Transferred In
`
Internal
Governmental Enterprise Service Component
Funds Funds Funds Units
Accounts receivable:
Taxes 796,320$ 1,173$ -$ -$
Pledges 2,580 - - 335,390
Benefit overpayments - 72,374 - -
Employer contributions - 150,810 - -
Grants & contracts 1,486,755 1,491,902 429 -
Other 1,022,033 125,647 2,884 67,549
Less:
Allowance for doubtful accounts 793,877 992,685 - 6,802
Discount to present value - - - 32,255
Accounts receivable (net) 2,513,811$ 849,221$ 3,313$ 363,882$
Current 2,409,623$ 830,444$ 3,313$ 125,488$
Noncurrent 104,188 18,777 - 238,394
Total 2,513,811$ 849,221$ 3,313$ 363,882$
Loans receivable:
Loans receivable 24,836$ 48,449$ -$ 2,508,565$
Less:
Allowance for doubtful accounts 8,714 2,146 - 114,141
Loans receivable (net) 16,122$ 46,303$ -$ 2,394,424$
Current 5,150$ 3,002$ -$ 158,877$
Noncurrent 10,972 43,301 - 2,235,547
Total 16,122$ 46,303$ -$ 2,394,424$
Proprietary Funds
90

STATE OF IOWA
NOTES TO THE FINANCIAL STATEMENTS
NOTE 5 – INTERFUND BALANCES Interfund balances for the year ended June 30, 2021, consisted of the following (expressed in thousands):
$63.6 million is due from the General Fund to the Workers’ Compensation Fund (an Internal Service Fund) to fund the cost of claims incurred. Remaining interfund balances result mainly from the time lag between the dates (1) interfund goods and services are provided or reimbursable expenditures occur, (2) transactions are recorded in the accounting system and (3) payments between funds are made.
(Notes continue on next page.)
Tobacco Nonmajor Unemployment Nonmajor Internal
Due To Other Funds/ General Settlement Governmental Benefits Enterprise Service
Advances From Other Funds Fund Authority Funds Fund Funds Funds Total
General Fund -$ -$ 2,115$ 237,840$ 180$ 83,251$ 323,386$
Tobacco Settlement Authority 144 - - - - - 144
Tobacco Collections Fund - 43,540 - - - - 43,540
Nonmajor Governmental Funds 34,570 - 9 - 606 2,012 37,197
Unemployment Benefits Fund 1,626 - - - - - 1,626
Nonmajor Enterprise Funds 17,102 - - - - 154 17,256
Internal Service Funds 1,022 - 363 - 1 15,231 16,617
Total 54,464$ 43,540$ 2,487$ 237,840$ 787$ 100,648$ 439,766$
Due From Other Funds/Advances To Other Funds
91

STATE OF IOWA
NOTES TO THE FINANCIAL STATEMENTS
NOTE 6 – CAPITAL ASSETS
Capital asset activity for the year ended June 30, 2021, was as follows (expressed in thousands):
`
Beginning Reclass- Ending
Balance ifications Increases Decreases Balance
Governmental activities
Capital assets not being depreciated:
Land 978,092$ 48$ 22,234$ 1,593$ 998,781$
Construction in progress 94,205 (75,833) 34,021 - 52,393
Computer software in progress 41,437 (31,775) 67,178 - 76,840
Total capital assets not being depreciated 1,113,734 (107,560) 123,433 1,593 1,128,014
Capital assets being depreciated:
Infrastructure 17,267,911 7,751 1,079,050 14 18,354,698
Buildings & improvements 2,011,232 26,598 18,332 17,146 2,039,016
Machinery, equipment & vehicles 680,424 31,511 51,906 29,856 733,985
Land improvements 105,767 9,925 5,778 60 121,410
Works of art & historical treasures 1,426 - - - 1,426
Computer software 300,552 31,775 18,433 - 350,760
Total capital assets being depreciated 20,367,312 107,560 1,173,499 47,076 21,601,295
Less accumulated depreciation for:
Infrastructure 9,005,980 - 591,877 12 9,597,845
Buildings & improvements 929,803 144 48,639 6,970 971,616
Machinery, equipment & vehicles 440,542 (144) 48,728 27,601 461,525
Land improvements 37,882 - 3,426 60 41,248
Works of art & historical treasures 312 - 16 - 328
Computer software 103,192 - 26,738 - 129,930
Total accumulated depreciation 10,517,711 - 719,424 34,643 11,202,492
Total capital assets being depreciated (net) 9,849,601 107,560 454,075 12,433 10,398,803
Governmental activities capital assets (net) 10,963,335$ -$ 577,508$ 14,026$ 11,526,817$
(continued on next page)
92

STATE OF IOWA
NOTES TO THE FINANCIAL STATEMENTS
(continued)
Beginning Reclass- Ending
Balance ifications Increases Decreases Balance
Business-type activities
Capital assets not being depreciated:
Land 99,658$ -$ 642$ -$ 100,300$
Land improvements 6,026 - - - 6,026
Library collections 390,544 - 11,893 924 401,513
Works of art 29,001 - 28 - 29,029
Construction in progress 364,834 (395,765) 246,849 146 215,772
Computer software in progress 7,237 (2,735) 4,033 63 8,472
Total capital assets not being depreciated 897,300 (398,500) 263,445 1,133 761,112
Capital assets being depreciated:
Infrastructure 1,215,157 35,265 - - 1,250,422
Buildings & improvements 7,318,325 347,654 22 13,054 7,652,947
Machinery, equipment & vehicles 1,368,176 - 98,251 71,060 1,395,367
Land improvements 103,162 12,846 - - 116,008
Library collections 309,381 - 7,623 15,441 301,563
Computer software 168,444 2,735 2,274 1,058 172,395
Goodwill 2,302 - - - 2,302
Trademarks 107 - - - 107
Total capital assets being depreciated 10,485,054 398,500 108,170 100,613 10,891,111
Less accumulated depreciation for:
Infrastructure 732,826 - 37,035 - 769,861
Buildings & improvements 3,304,129 - 236,232 9,234 3,531,127
Machinery, equipment & vehicles 946,470 - 100,226 66,015 980,681
Land improvements 62,646 - 5,125 - 67,771
Library collections 260,907 - 9,199 10,672 259,434
Computer software 98,027 - 13,208 1,058 110,177
Goodwill 1,450 - 153 - 1,603
Trademarks 67 - 7 - 74
Total accumulated depreciation 5,406,522 - 401,185 86,979 5,720,728
Total capital assets being depreciated (net) 5,078,532 398,500 (293,015) 13,634 5,170,383
Business-type activities capital assets (net) 5,975,832$ -$ (29,570)$ 14,767$ 5,931,495$
93

STATE OF IOWA
NOTES TO THE FINANCIAL STATEMENTS
Depreciation was charged to functions of the primary government as follows (expressed in thousands):
Discretely Presented Component Units (expressed in thousands)
Governmental activities:
Administration & regulation 12,169$
Education 7,644
Health & human rights 8,460
Human services 20,512
Justice & public defense 46,431
Economic development 861
Transportation 592,210
Agriculture & natural resources 11,800
Subtotal 700,087
Depreciation on capital assets held by the State's
internal service funds is allocated to the various
functions based on their use of the assets 19,337
Total 719,424$
Business-type activities:
Enterprise 401,185$
Capital assets not being depreciated:
Land 19,530$
Construction in progress 15,454
Goodwill 495
Total capital assets not being depreciated 35,479
Capital assets being depreciated:
Infrastructure 28,663
Buildings & improvements 163,918
Machinery, equipment & vehicles 16,825
Land improvements 700
Computer software 1,803
Total capital assets being depreciated 211,909
Less accumulated depreciation 90,313
Total capital assets being depreciated (net) 121,596
Discretely presented component units capital assets (net) 157,075$
94
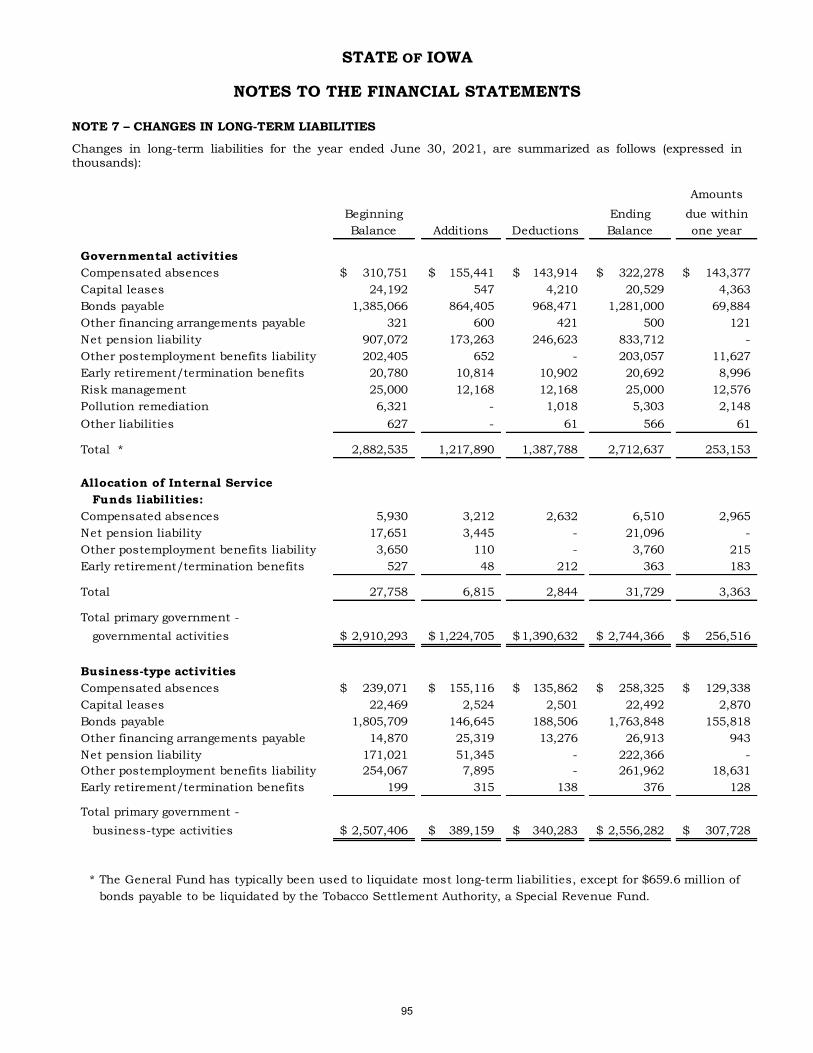
STATE OF IOWA
NOTES TO THE FINANCIAL STATEMENTS
NOTE 7 – CHANGES IN LONG-TERM LIABILITIES
Changes in long-term liabilities for the year ended June 30, 2021, are summarized as follows (expressed in thousands):
Amounts
Beginning Ending due within
Balance Additions Deductions Balance one year
Governmental activities
Compensated absences 310,751$ 155,441$ 143,914$ 322,278$ 143,377$
Capital leases 24,192 547 4,210 20,529 4,363
Bonds payable 1,385,066 864,405 968,471 1,281,000 69,884
Other financing arrangements payable 321 600 421 500 121
Net pension liability 907,072 173,263 246,623 833,712 -
Other postemployment benefits liability 202,405 652 - 203,057 11,627
Early retirement/termination benefits 20,780 10,814 10,902 20,692 8,996
Risk management 25,000 12,168 12,168 25,000 12,576
Pollution remediation 6,321 - 1,018 5,303 2,148
Other liabilities 627 - 61 566 61
Total * 2,882,535 1,217,890 1,387,788 2,712,637 253,153
Allocation of Internal Service
Funds liabilities:
Compensated absences 5,930 3,212 2,632 6,510 2,965
Net pension liability 17,651 3,445 - 21,096 -
Other postemployment benefits liability 3,650 110 - 3,760 215
Early retirement/termination benefits 527 48 212 363 183
Total 27,758 6,815 2,844 31,729 3,363
Total primary government -
governmental activities 2,910,293$ 1,224,705$ 1,390,632$ 2,744,366$ 256,516$
Business-type activities
Compensated absences 239,071$ 155,116$ 135,862$ 258,325$ 129,338$
Capital leases 22,469 2,524 2,501 22,492 2,870
Bonds payable 1,805,709 146,645 188,506 1,763,848 155,818
Other financing arrangements payable 14,870 25,319 13,276 26,913 943
Net pension liability 171,021 51,345 - 222,366 -
Other postemployment benefits liability 254,067 7,895 - 261,962 18,631
Early retirement/termination benefits 199 315 138 376 128
Total primary government -
business-type activities 2,507,406$ 389,159$ 340,283$ 2,556,282$ 307,728$
* The General Fund has typically been used to liquidate most long-term liabilities, except for $659.6 million of
bonds payable to be liquidated by the Tobacco Settlement Authority, a Special Revenue Fund.
95

STATE OF IOWA
NOTES TO THE FINANCIAL STATEMENTS
NOTE 8 – CAPITAL LEASES
The State has entered into agreements to lease various equipment and property. The agreements have interest rates ranging from 1.64% to 15.40% and expire before June 30, 2035.
The State has also entered into a few installment purchase agreements. Because the amounts involved are not material, and the accounting treatment is similar, such agreements are reported together with capital leases.
Primary Government
Governmental Activities
The following is a schedule by year of the future minimum payments required (expressed in thousands):
The historical cost of assets acquired under capital leases and included in capital assets in the government-wide financial statements at June 30 follows (expressed in thousands):
Business-type Activities
The following is a schedule by year of the future minimum payments required (expressed in thousands):
The historical cost of assets acquired under capital leases and included in capital assets in the financial statements at June 30 follows (expressed in thousands):
Year Ending
June 30, Principal Interest
2022 4,363$ 398$
2023 4,456 297
2024 3,905 191
2025 3,914 128
2026 3,891 64
Total 20,529$ 1,078$
Equipment 3,341$
Accumulated depreciation (1,121)
Net 2,220$
Year Ending
June 30, Principal Interest
2022 2,870$ 696$
2023 2,969 851
2024 2,642 733
2025 2,676 623
2026 2,625 510
2027-2031 8,412 1,178
Thereafter 298 17
Total 22,492$ 4,608$
Buildings & improvements 35,199$
Equipment 2,007
Total 37,206
Accumulated depreciation (10,859)
Net 26,347$
96

STATE OF IOWA
NOTES TO THE FINANCIAL STATEMENTS
NOTE 9 – OTHER FINANCING ARRANGEMENTS PAYABLE
Loans and Contracts Payable – Primary Government
Governmental Activities
The Iowa Department of Public Defense has entered into agreements for land for a total of $500,000 with an interest rate of 2.00%. The following is a schedule by year of the future minimum payments required (expressed in thousands):
Business-type Activities
University of Northern Iowa and the University of Iowa have entered into agreements for buildings and equipment for a total of $28,419,000 with interest rates ranging from 0.00% to 3.19%. The following is a schedule by year of future minimum payments required (expressed in thousands):
(Notes continue on next page.)
Year Ending
June 30, Principal Interest
2022 121$ 10$
2023 124 8
2024 126 5
2025 129 2
Total 500$ 25$
Year Ending
June 30, Principal Interest
2022 943$ 1,164$
2023 2,060 1,313
2024 2,314 1,224
2025 2,651 1,132
2026 2,124 1,042
2027-2031 9,929 3,913
2032-2036 3,446 2,231
Thereafter 3,446 836
Total 26,913$ 12,855$
97

STATE OF IOWA
NOTES TO THE FINANCIAL STATEMENTS
NOTE 10 – BONDS PAYABLE
Revenue bonds payable at June 30, 2021, are as follows (expressed in thousands):
MATURITY
ISSUE ORIGINAL INTEREST DATE OUTSTANDING
DATES ISSUANCE RATES RANGE PRINCIPAL
PRIMARY GOVERNMENT
Governmental activities
Revenue bonds
Term bonds
Tobacco Settlement Authority 2021 308,255$ .375-4.00 2030-2049 279,650$
Serial bonds
Refunding, Prison Infrastructure - 2016 2017 79,790 5.00 2021-2027 69,990
Refunding, IJOBS - 2016 2017 265,425 2.00-5.00 2017-2029 172,745
Refunding, IJOBS - 2019 2019 143,675 5.00 2029-2034 143,675
Refunding, Iowa Utilities Board - 2020 2020 7,230 1.88 2021-2029 6,490
Refunding, IJOBS - 2020 2021 90,825 5.00 2021-2034 87,695
Tobacco Settlement Authority 2021 106,610 .51-5.00 2021-2040 104,550
Total 585,145
Capital appreciation bonds
Tobacco Settlement Authority (2) 2021 1,607,504$ 4.00-4.05 2049-2065 1,607,540
Total revenue bonds 2,472,335
Unamortized premium 140,801
Unamortized appreciation discount (1,332,136)
Total governmental activities 1,281,000$
Business-type activities
Revenue bonds
University of Iowa 2010-2021 1,373,930$ 0.30-5.00 2012-2050 1,103,420$
Iowa State University 2009-2021 617,200 1.50-5.00 2011-2043 490,870
University of Northern Iowa 2012-2020 148,103 1.00-5.00 2012-2040 106,216
Total revenue bonds 1,700,506
Unamortized premium 64,242
Unamortized discount (900)
Total business-type activities 1,763,848$
COMPONENT UNITS
Revenue bonds
Iowa Finance Authority 2007-2021 3,164,316$ variable (1) 2012-2052 2,342,997$
Unamortized premium 268,908
Total component units 2,611,905$
(1) Variable rates are as of June 30, 2021
(2) Accreted value at maturity
98

STATE OF IOWA
NOTES TO THE FINANCIAL STATEMENTS
A. Primary Government – Governmental Activities
Vision Iowa
The State of Iowa has issued Vision Iowa Special Fund Bonds to provide grants or loans to communities to enhance local recreational, cultural and entertainment opportunities.
The State has pledged a portion of the future revenues to be deposited into the Vision Iowa Fund to repay $196.4 million of bonds issued in November 2001. These revenues include a standing appropriation of $15 million annually from gaming revenues, certain earnings on the Vision Iowa Fund and Bond Reserve Fund (including any amounts appropriated to replenish the Bond Reserve Fund to its required balance) and, to the extent of any shortfall in gaming revenues, Lottery revenues. The bonds are payable solely and only from certain revenues deposited into the Vision Iowa Fund and the Bond Reserve Fund and are payable through fiscal year 2021. Annual principal and interest payments on the bonds are expected to require less than 100% of total deposits into the Vision Iowa Fund. Principal and interest paid for the current year and total deposits into the Vision Iowa Fund were $15.7 million and $0.5 million, respectively. As of June 30, 2021, there is no principal and interest remaining to be paid on the debt.
Tobacco Settlement Authority
The Tobacco Settlement Authority (Authority) has issued Tobacco Settlement Asset-Backed Bonds to advance refund outstanding tobacco settlement asset-backed bonds and to provide funding to the State for various capital projects.
Pursuant to a Sales Agreement between the State and the Authority, the State has pledged, as security for bonds issued by the Authority, 78% of the amounts payable to the State under the Master Settlement Agreement (the “MSA”) entered into by participating cigarette manufacturers (the “PMs”), 46 states (including the State) and six other U.S. jurisdictions in November 1998 in the settlement of certain smoking-related litigation, including the State’s right to receive future initial, annual and strategic contribution payments (the “TSRs”), to be made by the PMs under the MSA.
On April 13, 2021, the Authority issued Tobacco Settlement Asset-Backed, Series 2021 Senior Bonds to refund Tobacco Settlement Asset-Backed Series 2005 Bonds, in the par amount of $2,022.4 million. The Authority has pledged, as the sole security for the bonds, 78% of the future TSRs payable under the terms of the Sales Agreement, investment earnings on certain accounts pledged under the bond indenture and amounts held in accounts established under the bond indenture (i.e. collection, debt service reserve, turbo redemption, etc.). As of June 30,
2021, total principal and interest remaining on the debt is $2,151.1 million with annual requirements ranging from $49.1 million in 2022 to $1,607.5 million in the final year. For the current year, principal and interest paid by the Authority and the total TSRs recognized by the State were $127.6 million and $52.9 million, respectively.
The bonds are not a general obligation or general indebtedness of the Authority and do not constitute an obligation or indebtedness of the State or any political subdivision of the State. The State has no obligation or intention to satisfy any deficiency or default of any payment on the bonds.
IJOBS – 2010
The State of Iowa has issued IJOBS Program Special Obligation Bonds to finance certain infrastructure projects of the State and certain grant and loan programs of the State. The State has pledged a portion of future revenues to repay $151.3 million in State of Iowa IJOBS Program Special Obligation Bonds, Series 2010A issued in October 2010. These revenues include amounts to be deposited in the Revenue Bonds Debt Service Fund including a standing appropriation of $55.0 million annually from gaming revenues and, to the extent of any shortfall in gaming revenues, beer and liquor revenues. The bonds are payable from the Bond Reserve Fund including any amounts appropriated to replenish such fund and are payable through fiscal year 2038.
In September 2020, the State issued $90.8 million of IJOBS Program Special Obligation Refunding Bonds, Series 2020A, with an interest rate of 5.00%, to refund the outstanding State of Iowa IJOBS Program Special Obligation Bonds, Taxable Series 2010A bonds. $117.8 million of proceeds and $3.6 million of existing reserve funds were used to refund the $121.4 million on Series 2010A bonds. The advanced refunding of these bonds permitted the State to realize an economic gain (difference between present value of the old and new debt service payments) of $41.4 million; and reduced the aggregate debt service payments by $46.7 million over the next 13 years.
There were no principal and interest paid in the current year for the Series 2010A bonds. As of June 30, 2021, there is no principal or interest remaining to be paid on the Series 2010A Bonds.
Refunding, Prison Infrastructure – 2016
99
STATE OF IOWA
NOTES TO THE FINANCIAL STATEMENTS
The State of Iowa has issued Special Obligation Refunding Bonds (Prison Infrastructure Fund), Series 2016 to advance refund a portion of the outstanding Special Obligation Bonds (Prison Infrastructure Fund), Series 2010 and to pay certain costs of issuance. The State has pledged all funds deposited in the Prison Infrastructure Fund from fines, fees, costs, and forfeited bail collected by the clerks of the district court in criminal cases, including those collected for both scheduled and nonscheduled violations, but excluding fines and fees attributable to commercial vehicle violation citations not reverting to the State’s General Fund at the end of each fiscal year, plus interest earnings on moneys in the Prison Infrastructure Fund to repay $79.8 million in refunding bonds issued in July 2016. The bonds are payable from the Debt Service Reserve Fund and are payable through fiscal year 2027. Annual principal and interest payments on the bonds are expected to require less than 91.5% of total deposits into the Prison Infrastructure Fund. As of June 30, 2021, total principal and interest remaining to be paid on the debt is $82.7 million. Principal and interest paid in the current year and total deposits into the Prison Infrastructure Fund were $13.8 million and $15.1 million, respectively.
The bonds are limited special obligations of the State. The bonds and interest thereon do not constitute nor give rise to a pecuniary liability, general obligation or a pledge of the full faith and credit of the State or any political subdivision of the State within the meaning of any constitutional or statutory limitation.
Refunding, IJOBS – 2016
The State of Iowa has issued IJOBS Program Special Obligation Refunding Bonds, Series 2016A to refund the IJOBS Program Special Obligation Bonds, Series 2009A, fund a Bond Reserve Fund and pay costs of issuance. The State has pledged a portion of future revenues to repay $265.4 million of bonds issued in July 2016. These revenues include amounts to be deposited in the Revenue Bonds Debt Service Fund, including a standing appropriation of $55.0 million annually from gaming revenues which would otherwise be deposited in the State’s General Fund and, to the extent of any shortfall in gaming revenues, beer and liquor revenues. The bonds are payable from the Bond Reserve Fund including any amounts appropriated to replenish such fund and are payable through fiscal year 2029. Annual principal and interest payments on the bonds are expected to require less than 52.9% of total deposits into the Revenue Bonds Debt Service Fund. As of June 30, 2021, total principal and interest remaining to be paid on the debt is $208.5 million. Principal and interest paid for the current year and total deposits into the Revenue Bonds Debt Service Fund were $29.1 million and $55.0 million, respectively.
The bonds are limited special obligations of the State and do not constitute a debt or indebtedness of the State, nor
any political subdivision of the State, or a pledge of the full faith and credit of the State or a charge against the general credit or General Fund of the State.
Refunding, IJOBS – 2019
The State of Iowa has issued IJOBS Program Special Obligation Refunding Bonds, Series 2019A to refund the IJOBS Program Special Obligation Bonds, Taxable Series 2009B, fund a Bond Reserve Fund and pay costs of issuance. The State has pledged a portion of future revenues to repay $143.7 million of bonds issued in June 2019. These revenues include amounts to be deposited in the Revenue Bonds Debt Service Fund, including a standing appropriation of $55.0 million annually from gaming revenues which would otherwise be deposited in the State’s General Fund and, to the extent of any shortfall in gaming revenues, beer and liquor revenues. The bonds are payable from the Bond Reserve Fund including any amounts appropriated to replenish such fund and are payable through fiscal year 2034. Annual principal and interest payments on the bonds are expected to require less than 13.1% of total deposits into the Revenue Bonds Debt Service Fund. As of June 30, 2021, total principal and interest remaining to be paid on the debt is $221.0 million. Interest paid for the current year and total deposits into the Revenue Bonds Debt Service Fund were $7.2 million and $55.0 million, respectively.
The bonds are limited special obligations of the State and do not constitute a debt or indebtedness of the State, nor any political subdivision of the State, or a pledge of the full faith and credit of the State or a charge against the general credit or General Fund of the State.
Refunding, Iowa Utilities Board and Consumer Advocate State Building – 2020
The State of Iowa has issued Iowa Utilities Board and Consumer Advocate State Building Special Obligation Refunding Bonds, Series 2020 to refund the Iowa Utilities Board and Consumer Advocate State Building Special Obligation Bonds, Series 2009, fund a Debt Service Reserve Fund, and pay certain costs of issuance. The Series 2020 bonds will be payable solely and only out of moneys, assets, or revenues of the Chargeable Expenses Fund (as defined in Iowa Code Section 12.91(1)(c)). In accordance with Iowa Code Section 12.91, the Treasurer shall deposit in the Chargeable Expenses Fund all amounts collected by the Iowa Utilities Board in accordance with Iowa Code Sections 476.10 and 476.10B as chargeable expenses in each fiscal year until the amount on deposit in the Chargeable Expenses Fund is equal to the amount of principal and interest on the Series 2020 bonds due in that
100
STATE OF IOWA
NOTES TO THE FINANCIAL STATEMENTS
fiscal year. The bonds are payable from the Bond Fund and are payable through fiscal year 2029. As of June 30, 2021, total principal and interest remaining to be paid on the debt is $7.1 million.
The bonds are not debts of the State or of any political subdivision of the State, and do not constitute a pledge of the faith and credit of the State or a charge against the general credit or General Fund of the State.
Refunding, IJOBS 2020
The State of Iowa has issued IJOBS Program Special Obligation Refunding Bonds, Series 2020A to refund the IJOBS program Special Obligation Bonds, Taxable Series 2010A, fund a Bond Reserve Fund and pay costs of issuance. The State has pledged a portion of future revenues to repay $90.8 million of bonds issued in September 2020. These revenues include amounts to be deposited in the Revenue Bonds Debt Service Fund, including a standing appropriation of $55.0 million annually from gaming revenues which would otherwise be deposited in the State’s General fund and, to the extent of any shortfall in gaming revenues, beer and liquor revenues. The bonds are payable from the Bond Reserve Fund including any amounts appropriated to replenish such fund and are payable through fiscal year 2034. Annual principal and interest payments on the bonds are expected to require less than 11.3% of total deposits into the Revenue Bonds Debt Service Fund. As of June 30, 2021, total principal and interest remaining to be paid on the debt is $124.5 million. Principal and interest paid for the current year and total deposits into the Revenue Bonds Debt Service Fund were $6.2 million and $55.0 million, respectively.
The bonds are limited special obligations of the State and do not constitute a debt or indebtedness of the State, nor any political subdivision of the State, or a pledge of the full faith and credit of the State or a charge against the general credit or General Fund of the State.
Prior Year Bond Defeasances
In a prior year, the State defeased the School Infrastructure Special Fund Refunding Bonds, Series 2012, and the 2021-2027 maturities of the Special Obligation Bonds (Prison Infrastructure Fund), Series 2010, by placing proceeds from existing resources into irrevocable trusts with escrow agents to provide for all future debt service payments. Accordingly, trust account assets and the liabilities for the defeased bonds are not included in the State’s financial statements. As of June 30, 2021, bonds totaling $195.7 million are considered defeased.
101

STATE OF IOWA
NOTES TO THE FINANCIAL STATEMENTS
Future bond debt service requirements of the Primary Government – Governmental Activities are as follows (expressed in thousands):
B. Primary Government – Business-type Activities
Universities
During the current year, the University of Iowa issued the following revenue refunding bonds:
• $6.8 million of Academic Building Revenue Bonds, Series S.U.I 2020, with an average interest rate of 3.45%and accrued interest of $19,000 to current refund $7.8 million of outstanding Academic Building RevenueBonds, Series S.U.I 2010, with interest rates ranging between 3.35% and 4.20%. Net bond proceeds of $7.9million were placed in an escrow account with the University as trustee. The escrow account was sufficientto fully service all remaining principal and interest due on the bonds. The Academic Building RevenueRefunding Bonds, Series S.U.I 2010 were called on October 1, 2020. The refunding permitted the Universityto realize an economic gain (difference between present values of the old and new debt service payments) of
$1.5 million; and reduced the aggregate debt service payments by $1.6 million over the next 12 years.
• $20.9 million of Hospital Revenue Refunding Bonds, Series S.U.I. 2020, with an average interest reate of3.03% and accrued interest of $53,000 to current refund $23.3 million of outstanding Hospital RevenueBonds, Series S.U.I. 2010, with interest rates ranging between 3.38% and 4.50%. Net bond proceeds of $23.8million were placed in an escrow account with the University as trustee. The escrow account was sufficientto fully service all remaining principal and interest due on the bonds. The Hospital Revenue Refunding Bonds,Series S.U.I 2010 were called on September 1, 2020. The refunding permitted the University to realize aneconomic gain (difference between present values of the old and new debt service payments) of $5.3 million;and reduced the aggregate debt service payments by $5.7 million over the next 16 years.
• $13.6 million of Athletics Facilities Revenue Refunding Bonds, Series S.U.I. 2021, with an average interestrate of 3.03% and accrued interest of $16,000 to current refund $15.2 million of outstanding Athletic FacilitiesRevenue Bonds, Series S.U.I. 2010, with interest rates ranging between 3.00% and 4.00%. Net bond proceedsof $15.6 million were placed in an escrow account with the University as trustee. The escrow account issufficient to fully service all remaining principal and interest due on the bonds. The Athletic Facilities RevenueRefunding Bonds, Series S.U.I. 2010 will be called on July 1, 2021. The refunding permitted the Universityto realize an economic gain (difference between present values of the old and new debt service payments) of$2.7 million; and reduced the aggregate debt service payments by $2.7 million over the next 15 years.
• $5.8 million of Telecommunications Facilities Revenue Refunding Bonds, Series S.U.I. 2021, with an averageinterest rate of the 3.51% and accrued interest of $8,000 to current refund $7.6 million of outstandingTelecommunications Facilities Revenue Bonds, Series S.U.I 2011, with interest rates ranging between 3.00%and 4.50%. Net bond proceeds of $6.7 million were placed in an escrow account with the University astrustee. The escrow account is sufficient to fully service all remaining principal and interest due on the
Year Ending
June 30, Principal Interest
2022 69,884$ 38,186$
2023 67,669 35,616
2024 69,983 32,700
2025 72,783 29,664
2026 75,783 26,480
2027-2031 255,623 88,557
2032-2036 140,965 37,574
2037-2041 36,765 19,590
2042-2046 44,385 11,651
2047-2051 30,955 2,508
2052-2056 - -
2057-2061 - -
Thereafter 1,607,540 -
Total 2,472,335$ 322,526$
102

STATE OF IOWA
NOTES TO THE FINANCIAL STATEMENTS
bonds. The Telecommunications Facilities Revenue Refunding Bonds, Series S.U.I. 2011 will be called on July 1, 2021. The refunding permitted the University to realize an economic gain (difference between present values of the old and new debt service payments) of $1.5 million; and reduced the aggregate debt service payments by $1.5 million over the next 11 years.
• $31.2 million of University of Iowa Facilities Corporation Revenue Refunding Bonds, Series 2021, with anaverage interest rate of 3.73% and accrued interest of $45,000 to current refund $6.4 million of outstandingUniversity of Iowa Facilities Corporation Revenue Refunding Bonds (Roy J. and Lucille A. Carver BiomedicalResearch Building Project), Series 2012, with an interest rate of 3.00%, $13.1 million of outstandingUniversity of Iowa Facilities corporation Revenue Refunding Bonds (Roy j. and Lucille A. Carver BiomedicalResearch Building Project), Series 2012 A, with interest rates ranging between 3.00% and 3.38%, and $20.4
million of outstanding University of Iowa Facilities Corporation Revenue Bonds (John and May PappajohnBiomedical Discover Building Project), Series 2012, with interest rates ranging between 2.00% and 3.30%.Net bond proceeds of $36.4 million were placed in an escrow account with the University as trustee. Theescrow account is sufficient to fully service all remaining principal and interest due on the bonds. TheUniversity of Iowa Facilities Corporation Revenue Bonds will be called on July 1, 2021. The refundingpermitted the University to realize an economic gain (difference between present values of the old and newdebt service payments) of $5.4 million; and reduced the aggregate debt service payments by $5.7 million overthe next 17 years.
In prior years, the University of Iowa defeased certain revenue bonds by placing the proceeds of new bonds in an irrevocable trust to provide for all future debt service payments on the old bonds. Accordingly, the trust account assets and the liability for the defeased bonds are not included in the State’s financial statements. As of June 30, 2021, bonds totaling $113.3 million for the University of Iowa were considered defeased.
During the current year, Iowa State University issued $23.0 million of Academic Building Revenue Refunding Bonds, Series I.S.U 2020. The bond proceeds were placed in an irrevocable trust to refund $26.0 million of Academic Building Refunding Revenue Bonds, Series I.S.U. 2010. The current refunding of these bonds permitted the University to realize an economic gain (the difference between the present values of the debt service payments on the old and new debt) of $5.7 million and will reduce future aggregate debt service payments by $6.1 million over the next 14 years.
During the current year, the University of Northern Iowa issued $14.5 million of Dormitory Revenue Bonds, Series U.N.I. 2017, with an interest rate of 2.00%. The proceeds were used to advance refund $24.9 million of outstanding Dormitory Revenue Bonds, Series U.N.I 2001, with interest rates ranging between 2.00% and 4.00% and pay the costs of issuing the Bonds. Net bond proceeds of $15.3 million were placed in an irrevocable trust with an escrow agent to provide funds for the future debt service payment on the refunded bonds. The Dormitory Revenue Bonds, Series U.N.I. 2011 were called on July 1, 2021. The advanced refunding resulted in an economic gain of $1.4 million and reduced the aggregate debt service payments by $1.9 million over the next 13 years.
In prior years, the University of Northern Iowa defeased certain revenue bonds by placing the proceeds of new bonds in an irrevocable trust to provide for all future debt service payments on the old bonds. Accordingly, the trust account assets and the liability for the defeased bonds are not included in the State’s financial statements. As of June 30, 2021, bonds totaling $16.2 million for the University of Northern Iowa were considered defeased.
103

STATE OF IOWA
NOTES TO THE FINANCIAL STATEMENTS
Future bond debt service requirements for bonds of the Primary Government – Business-type Activities are as follows (expressed in thousands):
C. Component Units
Iowa Finance Authority
The Iowa Finance Authority (Authority) is authorized and has issued bonds to provide affordable mortgage financing and to meet the 20% State match required for federal capitalization grants which are used to provide loans for construction of wastewater and drinking water facilities. The bonds are payable principally from repayments of such loans. The obligations do not constitute a debt of the State of Iowa and the State is not liable for any repayments.
The bonds are secured, as described in the applicable bond resolution, by the revenues, moneys, investments, loans and other assets in the programs and accounts established by the respective bond resolutions.
Direct placement bonds have been issued to the U.S. Treasury and Federal Home Loan Bank. These bonds are secured with the mortgaged-backed securities or loans purchased with the bond proceeds and have both principal and interest receipts pledged to the bondholders.
The Single-Family Mortgage Bonds Resolution and the Multifamily Housing Bonds Master Trust Indenture contain covenants that require the Authority to make payments of principal and interest from amounts available in the Authority’s General Account should deficiencies occur in the accounts established for such payments by the respective bond resolutions.
During the current fiscal year, the Authority issued five new bond series totaling $533.5 million to purchase mortgage-backed securities (MBS) and State Revolving Fund (SRF) loans. The Authority made bond payments of $250.2 million.
On June 28, 2021, the Authority placed cash into an irrevocable trust to provide funds for debt service payments on July 1, 2021. Cash for the irrevocable trust came from $7.3 million of Single-Family Mortgage bonds that were issued on June 17, 2021, in addition to $0.2 million contributed from accounts related to the defeased debt. The funds required for this transaction equaled the net carrying value of the defeased debt.
In prior years, the Authority defeased certain SRF revenue bonds by issuing bonds to provide resources to purchase investment securities that were placed into an irrevocable trust to provide funds for future debt service payments. The irrevocable trust account assets and the liabilities for the defeased bonds are not included in the Authority’s financial statements. As of June 30, 2021, bonds totaling $214.9 million were considered defeased.
Year Ending
June 30, Principal Interest
2022 155,818$ 54,158$
2023 99,180 50,772
2024 103,560 47,265
2025 106,301 43,557
2026 104,996 39,796
2027-2031 506,227 142,974
2032-2036 404,573 66,093
2037-2041 186,135 17,163
2042-2046 26,970 2,392
Thereafter 6,746 447
Total 1,700,506$ 464,617$
104

STATE OF IOWA
NOTES TO THE FINANCIAL STATEMENTS
Future bond debt service requirements for the bonds of the Component Units are as follows (expressed in thousands):
(Notes continue on next page.)
Year Ending
June 30, Principal Interest
2022 74,276$ 81,760$
2023 86,395 82,753
2024 99,039 79,553
2025 96,109 76,237
2026 107,231 72,842
2027-2031 491,500 308,141
2032-2036 503,720 204,801
2037-2041 467,345 105,817
2042-2046 264,617 42,032
2047-2051 146,310 10,175
Thereafter 6,455 109
Total 2,342,997$ 1,064,220$
105

STATE OF IOWA
NOTES TO THE FINANCIAL STATEMENTS
NOTE 11 – ACCOUNTS PAYABLE AND ACCRUALS
Accounts payable and accruals at June 30, 2021, consisted of the following (expressed in thousands):
Pollution Remediation Obligations
An estimate for pollution remediation obligations is recorded when the State knows or reasonably believes a site is polluted and when any one of the following events occurs: (1) the State is compelled to take remediation action because pollution creates an imminent endangerment to public health/welfare or the environment, (2) the State is in violation of a pollution prevention-related permit or license, (3) the State is named, or will likely be named, by a regulator as a responsible party or potentially responsible party for remediation, (4) the State is named, or will likely be named, in a lawsuit to compel it to participate in remediation or (5) the State commences or legally obligates itself to commence cleanup activities or monitoring/maintenance of remediation efforts.
For the year ended June 30, 2021, pollution remediation obligations totaled $5.3 million for the Iowa Petroleum Underground Storage Tank Program.
Leaking underground storage tanks meeting certain eligibility requirements are covered by the Iowa Petroleum Underground Storage Tank Program. Statutory authority for this program is found in Chapter 455G of the Code of Iowa. The program was established to expend funds for remedial action and underground storage tank improvements. Estimated remediation outlays for leaking underground storage tanks are developed by groundwater professionals. The estimations are based on a range of expected outlays, net of expected cost recoveries, if any, for the type and amount of pollution contamination detected. All estimates for pollution remediation obligations are reviewed and adjusted periodically for price changes, additional contamination and any other changes detected.
The pollution remediation obligation does not include outlays for certain site cleanup activities or operation/maintenance costs because those outlays were not reasonably estimable.
Current Noncurrent
PRIMARY GOVERNMENT
Governmental activities
Salaries & fringes 29,549$ -$
Early retirement/termination benefits 9,179 11,876
Risk management 12,576 12,424
Pollution remediation 2,148 3,155
State aid 759,756 -
Trade & other payables 868,004 45,586
Total governmental activities 1,681,212$ 73,041$
Business-type activities
Salaries & fringes 285,778$ -$
Early retirement/termination benefits 128 248
General claims 79,508 -
Unemployment benefits 44,555 -
Trade & other payables 301,178 42,570
Total business-type activities 711,147$ 42,818$
COMPONENT UNITS
Annuity & life income obligations 354$ 24,842$
Lotto prizes & annuity prizes payable 5,360 896
Other 78,039 38,062
Total component units 83,753$ 63,800$
106

STATE OF IOWA
NOTES TO THE FINANCIAL STATEMENTS
NOTE 12 – NET POSITION/GOVERNMENTAL FUND BALANCES
A. Net Position Restricted By Enabling Legislation
The Governmental Activities Statement of Net Position reports $880.0 million of Restricted Net Position, of which $27.1 million is restricted by enabling legislation.
B. Governmental Fund Balances
Fund balances for governmental funds are reported in classifications that comprise a hierarchy based primarily on the extent to which the State is bound to honor constraints on the specific purposes for which amounts in those funds can be spent. The nonspendable fund balance classification includes amounts that cannot be spent because they are either not in a spendable form or legally or contractually required to remain intact. Restricted fund balances are reported when constraints placed on the use of resources are externally imposed by creditors, grantors, contributors, or laws or regulations of other governments or imposed by law through constitutional provisions or enabling legislation. Committed fund balance amounts can only be used for specific purposes pursuant to constraints imposed by formal action of the State’s highest level of decision making authority. The Iowa Legislature and Governor represent the State’s highest level of decision-making authority. Formal action consists of legislation passed by both the House and Senate and signed by the Governor and is required to establish, modify or rescind a limitation. Unassigned fund balance is the residual classification for the General Fund. Other governmental funds may report a negative unassigned fund balance if expenditures incurred for specific purposes exceed the amounts restricted, committed or assigned to those purposes.
The nonspendable and spendable fund balances for governmental funds at June 30, 2021, are as follows (expressed in thousands):
`
TOBACCO TOBACCO NONMAJOR TOTAL
GENERAL SETTLEMENT COLLECTIONS GOVERNMENTAL GOVERNMENTAL
FUND AUTHORITY FUND FUNDS FUNDS
NONSPENDABLE
Inventory & prepaid expenditures 122,285$ -$ -$ 510$ 122,795$
Permanent fund principal - - - 16,150 16,150
Total nonspendable 122,285 - - 16,660 138,945
SPENDABLE
Restricted:
Administration & regulation 209,888 75,066 - 4,817 289,771
Education 46,659 - - 65,764 112,423
Health & human rights 9,878 - - 2,514 12,392
Human services 9,200 - - 36 9,236
Justice & public defense 23,557 - - 4,725 28,282
Economic development 9 - - - 9
Transportation 379,851 - - 5,514 385,365
Agriculture & natural resources 604 - - 47 651
Total restricted 679,646 75,066 - 83,417 838,129
Committed:
Cash reserve 587,868 - - - 587,868
Economic emergency 207,547 - - - 207,547
Administration & regulation 1,822,844 - - 5,683 1,828,527
Education 50,310 - - 17 50,327
Health & human rights 75,913 - - 20 75,933
Human services 314,951 - - 20,261 335,212
Justice & public defense 89,143 - - 3,203 92,346
Economic development 19,339 - - - 19,339
Transportation 43,839 - - 120 43,959
Agriculture & natural resources 137,199 - - 10,886 148,085
Total committed 3,348,953 - - 40,190 3,389,143
Unassigned (398,227) - (43,540) (50) (441,817)
TOTAL FUND BALANCES 3,752,657$ 75,066$ (43,540)$ 140,217$ 3,924,400$
107

STATE OF IOWA
NOTES TO THE FINANCIAL STATEMENTS
The State maintains two reserve funds: the Cash Reserve Fund and the Iowa Economic Emergency Fund. These funds were established by formal action of the highest level of decision making authority as they were created by legislation passed by both the House and Senate and signed by the Governor. The law restricts the use and purpose of each fund. Formal action is required to use resources in the funds, modify their purpose or change the balances of the funds. Fund balances for both funds are included in the committed spendable fund balance classification.
See NOTE 1, section Q for additional information on the two reserve funds and section R for minimum fund balance requirements.
NOTE 13 – OPERATING LEASES
The State has leased office space and equipment. These leases have been classified as operating leases and expire before June 30, 2051. In most cases, management expects the leases will be renewed or replaced by other leases.
A. Primary Government
Governmental Activities
The future minimum lease payments for these leases are as follows (expressed in thousands):
All leases contain nonappropriation clauses indicating continuation of the lease is subject to funding by the Legislature.
Rental expense for the year ended June 30, 2021 for all operating leases, except those with terms of a month or less that were not renewed, totaled $14.8 million. Rental expense has not been adjusted for sublease rentals totaling $0.6 million for the year ended June 30, 2021.
Business-type Activities
The future minimum lease payments for these leases are as follows (expressed in thousands):
Rental expense for the year ended June 30, 2021 for all operating leases, except those with terms of a month or less that were not renewed, totaled $20.1 million.
Year Ending
June 30,
2022 11,936$
2023 9,781
2024 6,791
2025 5,054
2026 3,411
2027-2031 6,350
2032-2036 688
2037-2041 352
2042-2046 17
Thereafter 2
Total 44,382$
Year Ending
June 30,
2022 20,074$
2023 18,539
2024 17,545
2025 12,013
2026 10,348
2027-2031 40,775
2032-2036 13,489
Thereafter 436
Total 133,219$
108

STATE OF IOWA
NOTES TO THE FINANCIAL STATEMENTS
B. Component UnitsThe future minimum lease payments for these leases are as follows (expressed in thousands):
Rental expense for the year ended June 30, 2021 for all operating leases, except those with terms of a month or less that were not renewed, totaled $3.0 million.
NOTE 14 – LESSOR OPERATING LEASES
The Iowa Department of Natural Resources leases tracts of land for agricultural purposes valued at $12.3 million. Glenwood Resource Center leases building space that is fully depreciated (net of accumulated depreciation of $6.4 million). Iowa PBS leases antenna and building space, Woodward Resource Center and Iowa Workforce Development leases building space, for which no value has been assigned to the leased portions. The Iowa Department of Transportation leases land and office space valued at $2.7 million. Iowa State University leases building space valued at $2.4 million (net of accumulated depreciation of $1.8 million), tower space valued at $0.3 million (net of accumulated depreciation of $0.2 million), equipment with an original value of $0.6 million, and tracts of land for agricultural purposes valued at $0.3 million. The University of Northern Iowa leases buildings valued at $0.1 million (net of accumulated depreciation of $0.8 million), tracts of land for agricultural purposes valued at $0.2 million and tower space for which no value has been assigned to the lease portions.
The following is a schedule by year of minimum future rentals on operating leases as of June 30, 2021 (expressed in thousands):
Year Ending
June 30,
2022 2,025$
2023 1,949
2024 1,469
2025 1,382
2026 1,416
2027-2031 4,201
Thereafter 2,400
Total 14,842$
Year Ending
June 30,
2022 4,026$
2023 2,823
2024 2,109
2025 1,577
2026 1,086
2027-2031 2,488
2032-2036 1,258
2037-2041 764
2042-2046 632
2047-2051 632
2052-2056 632
2057-2061 631
2062-2066 631
Thereafter 316
Total 19,605$
109

STATE OF IOWA
NOTES TO THE FINANCIAL STATEMENTS
NOTE 15 – PENSION PLANS
A. Summary of Significant Accounting Policies & Pension Totals
Pensions
The financial statements of the Iowa Public Employees’ Retirement System (IPERS), Peace Officers’ Retirement, Accident and Disability System (PORS) and the Judicial Retirement System (JRS) are prepared using the accrual basis of accounting. Plan member contributions are recognized in the period in which the contributions are due. Employer contributions to each plan are recognized when due and the employer has made a formal commitment to provide contributions. Benefits, refunds and annuities are recognized when due and payable in accordance with the terms of each plan.
Deferred Outflows and Inflows of Resources Related to Pensions
Deferred outflows of resources represent a consumption of net position that applies to a future period(s) and will not be recognized as an outflow of resources (expense/expenditure) until then. Deferred outflows of resources related to pensions consist of unrecognized items not yet charged to pension expense and contributions from the employer after the measurement date but before the end of the employer’s reporting period, unamortized portion of the net difference between projected and actual earnings on pension plan investments. Deferred inflows of resources represent an acquisition of net position that applies to a future period(s) and will not be recognized as an inflow of resources (revenue) until that time. Deferred inflows of resources related to pensions consist of unrecognized items not yet credited to pension expense.
Investments
IPERS – All investments are reported at fair value.
IPERS has no investment in any specific stock or bond issues of any commercial or industrial organization, other than the U.S. government and its instrumentalities, whose fair value exceeds 5.00% of the plan net position available for benefits.
PORS and JRS – Investments are reported at fair value. Short-term investments are reported at cost, which approximates fair value.
PORS’ and JRS’ investments in governmental bonds and treasury notes constitute approximately 4.99 % and 8.00%, respectively, of total assets. PORS and JRS are not permitted to invest more than 5.00% of their System accounts in any one corporate issuer without written direction and approval of the Treasurer of State of Iowa.
Pension Totals
At June 30, 2021, the State of Iowa recognized the following amounts related to pensions in financial statements prepared using the economic resources measurement focus and accrual basis of accounting (expressed in thousands):
Cost-sharing, Cost-sharing,
Multiple-employer Multiple-employer
IPERS - Total IPERS -
Primary Primary Discretely Presented
Government PORS JRS Government Component Units
Net pension liability (asset) 1,163,545$ (27,444)$ (58,928)$ 1,077,173$ 24,510$
Deferred outflows of resources related to pensions 321,147 34,486 6,705 362,338 5,457
Deferred inflows of resources related to pensions 73,723 157,776 62,486 293,985 1,806
Pension expense for the period associated with net
pension liabilities 189,205 (18,124) (8,358) 162,723 3,446
Defined Benefit
Single-employer
110

STATE OF IOWA
NOTES TO THE FINANCIAL STATEMENTS
B. Pension Plans
Iowa Public Employees’ Retirement System (IPERS)
General Information about the Plan
Plan Description. IPERS, a public employee retirement system, was created in 1953 by the Iowa Legislature. IPERS benefits are established under Chapter 97B of the Iowa Code. IPERS is the administrator of the cost-sharing, multiple-employer, contributory defined benefit public employee retirement system.
Participation in IPERS is mandatory for most state, county and local public employees, employees of school districts and certain elected officials. Membership is optional for some individuals, including the members of the Iowa Legislature. At June 30, 2021, IPERS had 1,943 public employers with 173,186 active members contributing to the system.
Plan Membership.
IPERS has three membership classes: (1) Regular, (2) Sheriffs and Deputies, and (3) Protection Occupation. Each membership class has different retirement benefits and contribution rates. The regular membership accounts for approximately 95% of all members.
Benefits Provided. Members are eligible for all rights and benefits once they become vested. Regular members,
prior to July 1, 2012, vested after completing four years of covered service or upon reaching the age of 55 while in IPERS-covered employment. Beginning July 1, 2012, regular members vested after seven years of covered service or upon reaching the age of 65 while in IPERS-covered employment. Special Service members (Sheriffs and Deputies and Protection Occupation) vest when they complete four years of covered service or reach the age of 55 while in covered employment.
At retirement, members have six benefit options. Each option provides for lifetime monthly member benefits and available death benefits. The benefit amounts are dependent upon the option selected, but once calculated, remain constant. However, members which began receiving benefits before July 1, 1990, receive a guaranteed dividend with their November payment per Iowa Code Section 97B.49F(1)(b).
• Regular members are eligible for full benefits at normal retirement which occurs at: (1) age 65, (2) age 62with 20 or more years of covered employment, or (3) when years of service plus age equal or exceed 88.This membership class cannot receive benefits before 55, and those who are 70 and still working for acovered employer may receive benefits while still employed. Monthly benefits are equal to a member’shighest five-year average salary multiplied by a percentage based on years of service, up to a maximum of65%. Members with service before June 30, 2012, the highest three-year average salary as of that date willbe used if it is greater than the highest five-year average salary. If retirement occurs prior to normalretirement, an early-retirement reduction is permanently applied to benefits. For service earned prior toJuly 1, 2012, the reduction is 0.25% for each month benefits are received before the earliest normalretirement. For service earned on or after July 1, 2012, the reduction increases to 0.50% per month benefitsare received before the member reaches age 65.
• Special Service members have different retirement eligibility requirements than regular members. Bothspecial service member classes are eligible for monthly benefits equal to the average of the highest threeyears’ salary multiplied by a percentage based on years of service, up to a maximum of 72%.
o Sheriffs and deputies are eligible for retirement benefits at age 50, with 22 years of qualifiedservice.
o Protection occupation members are eligible for retirement benefits if vested, no longer workingfor an IPERS-covered employer, and reach age 55.
2021 2020
Inactive employees or beneficiaries currently receiving benefits 129,026 126,600
Inactive employees entitled to but not yet receiving benefits 79,710 78,360
Active employees 173,186 170,380
Total 381,922 375,340
Fiscal Years Ended June 30,
111

STATE OF IOWA
NOTES TO THE FINANCIAL STATEMENTS
Disability Benefits. A vested member that is awarded federal Social Security disability or Railroad Retirement disability benefits is eligible to claim IPERS benefits regardless of age. Disability benefits are not reduced for early retirement. Special service members that retire due to a disability may be eligible for regular member or special service member disability benefits.
Death Benefits. If a member dies before retirement, their designated beneficiary may receive a lump-sum payment based on the greater of two formulas: (1) actuarial present value of the member’s accrued benefit as of the date of death, or (2) actual years of service divided by either 30 years for a regular member/22 years for special service member multiplied by the member’s highest annual covered wage plus the member’s accumulated contributions. If the member’s beneficiary is a sole individual, they will be offered either a lump sum or life time annuity. If a member dies after retirement, the beneficiary is paid according to the benefit option selected by the member at the time of retirement.
Contributions. A valuation of the liabilities and assets of the IPERS Trust Fund is performed annually by IPERS’ actuary in accordance with Iowa Code Section 97B.4(4)(d). The actuary also calculates an actuarial contribution rate for each membership group, which is the contribution rate necessary to fully fund the benefits provided under Iowa Code Chapter 97B.
IPERS’ Contribution Rate Funding Policy requires that the actuarial contribution rate be determined using the entry age normal actuarial cost method and the actuarial assumptions and methods approved by the IPERS Investment Board. The actuarial contribution rate covers normal cost plus the unfunded actuarial liability contribution. The unfunded actuarial liability contribution is determined as a level percentage of payroll based on the actuarial amortization method adopted by the Investment Board.
Although the actuarial contribution rates are calculated each year for all three membership groups, the required contribution rates for the Regular membership were set in law through June 30, 2012. From fiscal year 2002
through fiscal year 2013, the rate required was less than the actuarial rate, in spite of rate increases passed by the Iowa Legislature in 2006 and 2010. Effective July 1, 2012, as a result of a 2010 law change, the contribution rates are established by IPERS following the annual actuarial valuation, which applies IPERS’ Contribution Rate Funding Policy and actuarial amortization method. Iowa statute limits the amount rates can vary to 1.0 percentage point each year for Regular members.
Iowa statute authorizes the required contribution rate for certain members and employers engaged in law enforcement, fire safety and protection occupations to be set to the Contribution Rate Funding Policy. Therefore, these groups have consistently paid the rate needed to fully fund their benefits.
In fiscal year 2021, the contribution rates for all members exceeded the actuarial rates.
Contributions are remitted by participating employers. Wages were covered up to the Internal Revenue Code Section 401(a)(17) compensation limit of $285,000 for calendar year 2020 and $290,000 for calendar year 2021. There are no non-employer contributing entities to IPERS.
The State’s employer contributions to IPERS for the years ended June 30, 2021 and 2020 were $144,855,000 and $139,227,000, respectively.
Actuarial Methods and Assumptions. The total pension liability was determined by an actuarial valuation as of June 30, 2020, using the following actuarial assumptions and the entry age normal actuarial cost method.
• Inflation rate: 2.60%
• Long-term rate of return: 7.00%
• Projected salary increases: 3.25% – 16.25%
Mortality rates were based on the RP-2014 Generational Mortality Tables, with age setbacks and age set forwards as well as other adjustments based on different membership groups. Future mortality improvements are anticipated using Projection Scale MP-2017. Different adjustments apply to pre-retirement, post-retirement, and
Employee Employer Total
Regular members 6.29% 9.44% 15.73%
Sheriffs and deputies 9.26% 9.26% 18.52%
Protection occupation members 6.41% 9.61% 16.02%
Fiscal Year 2021
112

STATE OF IOWA
NOTES TO THE FINANCIAL STATEMENTS
post-disability mortality tables. Pre-retirement mortality rates were based on the RP-2014 Employee Table, post-retirement mortality rates were based on the RP-2014 Healthy Annuitant Table, and post-disability mortality rates were based on the RP-2014 Disabled Mortality Table.
The actuarial assumptions used in the June 30, 2020 valuation are based on the results of the most recent actuarial experience study, which covered the four-year period ending June 30, 2017. That experience study report is dated June 28, 2018.
The long-term rate of return, 7.00% effective June 30, 2020, is reviewed as part of regular experience studies, prepared every four years for IPERS. The Investment Board elected to accelerate the experience study of the economic assumptions by one year, performing the study in early 2017. That recent analysis of economic assumptions is outlined in a report dated March 24, 2017. Several factors are considered in evaluating the long-term rate of return including long-term historical data, estimates inherent in current market data, and an analysis in which best-estimate ranges of expected future real rates of return (expected return, net of investment expense and inflation) along with estimates of variability and correlations for each asset class, were developed by the investment consultant. These ranges were combined to develop the long-term expected rate of return by weighting the expected future real rates of return by the target asset allocation percentage and then adding expected inflation. The capital market assumptions developed by the investment consultant are intended for use over a 10-year horizon and may not be useful in setting the long-term rate of return for funding pension plans, whichcover a longer timeframe. The assumption is intended to be a long-term assumption and is not expected to changeabsent a significant change in the asset allocation, a change in the inflation assumption, or a fundamental changein the market that alters expected returns in future years.
Best estimates of arithmetic real rates of return for each major asset class included in IPERS’ target asset allocation as of June 30, 2020, are shown in the following table:
`
Discount Rate. The discount rate used to measure the total pension liability was 7.00%. The projection of cash flows used to determine the discount rate assumed plan contributions from members and the State will be made according to the current Contribution Rate Funding Policy. That policy is currently: (1) employee contributions are 40% of the required contribution rate for regular and protection occupation members and 50% of the required contribution rate for sheriffs and deputies; and (2) employer contributions are 60% of the required contribution rate for regular and protection occupation members and 50% of the required contribution rate for sheriffs and deputies; and (3) administrative expense in the prior year were projected forward with inflation as an estimate for administrative expense in the current and future years. The portion of the expenses in future years allocated to the current members was based on the proportionate share of covered payroll in each year for the remainder of existing members to the total covered payroll for all members. Based on those assumptions, the pension fiduciary
net position was projected to be available to make all projected future benefit payments of current members. Therefore, the long-term expected rate of return on plan investments of 7.00% was applied to all periods of projected benefit payments to determine the total pension liability. The municipal bond rate was not used in determining the discount rate, but if it were required, the rate would have been 2.19%. The projected future benefit payments for all current plan members were projected through 2120.
Asset Class
Core-plus fixed income 28.00% -0.29%
Domestic equity 22.00% 4.43%
International equity 17.50% 5.15%
Private equity 11.00% 3.11%
Private real assets 7.50% 4.48%
Public credit 4.00% 2.29%
Private credit 3.00% 6.54%
Global smart beta equity 6.00% 4.87%
Cash 1.00% -0.78%
Total 100.00%
Target Allocation Real Rate of Return
Long-Term Expected
113

STATE OF IOWA
NOTES TO THE FINANCIAL STATEMENTS
The components of the IPERS’ total net pension liability (asset) (NPL) at June 30 are (expressed in thousands):
IPERS issues a publicly available financial report that includes financial statements and required supplementary information. That report may be obtained by writing to IPERS, P.O. Box 9117, Des Moines, IA 50306-9117, at [email protected], or by calling 515-281-0020.
Pension Plan Fiduciary Net Position. Detailed information about the pension plan’s fiduciary net position is
available in the separately issued IPERS financial report, as well as the fiduciary combining statements included in the supplementary information section of this report.
State of Iowa Proportionate Share of the Collective Net Pension Liability Assumptions and Inputs
At June 30, 2021, the State reported a total of $1,188.1 million for its proportionate share of the net pension liability, with $1,163.5 million in the primary government and $24.6 million in the discretely presented component units. The net pension liability was measured as of June 30, 2020, and the total pension liability as of June 30, 2020, used to calculate the net pension liability was determined based on the June 30, 2020 actuarial valuation for funding, dated October 29, 2020.
The State’s proportion of the net pension liability was based on the State’s share of contributions to the pension plan relative to the contributions of all participating employers, actuarially determined. At June 30, 2020, the State’s total proportion was 16.912445% (16.563546% in the primary government and 0.348899% in the discretely presented component units). This was an increase of 0.402674% from the State’s total proportion (an increase of 0.408322% in the primary government and a decrease of 0.005648% in the discretely presented component units), measured as of June 30, 2019.
For the year ended June 30, 2021, the State recognized IPERS pension expense of $189.2 million for the primary government and $3.4 million for the discretely presented component units. The State also reported deferred outflows of resources and deferred inflows of resources related to IPERS pensions from the following sources:
2021 2020
Total pension liability 42,544,649$ 41,072,427$
Plan fiduciary net position 42,889,876 34,047,692
Employers' net pension liability (asset) (345,227)$ 7,024,735$
Plan fiduciary net position as a percentage
of the total pension liability (asset) 100.81% 82.90%
Primary Discretely Presented
Government Component Units
Differences between expected and actual experience 3,284$ 27$
Changes in assumptions 65,183 1,258
Net difference between projected and actual earnings on
pension plan investments 74,993 1,378
Changes in proportion and differences between contributions
and proportionate share of contributions 32,617 445
Contributions subsequent to the measurement date 145,070 2,349
Total 321,147$ 5,457$
Deferred Outflows of Resources
(expressed in thousands)
114

STATE OF IOWA
NOTES TO THE FINANCIAL STATEMENTS
The primary government and discretely presented component units reported deferred outflows of resources relating to pensions of $145.1 million and $2.3 million, respectively, as a result of employer contributions subsequent to the measurement date which will be recognized as a reduction of net pension liability in the year ended June 30, 2022. Amounts reported as deferred outflows of resources and deferred inflows of resources related to pensions will be recognized in pension expense as follows (expressed in thousands):
There are no non-employer contributing entities to IPERS.
Sensitivity Analysis. The State’s proportionate share of the net pension liability was calculated using a discount rate of 7.00%, as well as a discount rate that is 1-percentage-point lower (6.00%) or 1-percentage-point higher (8.00%) than the current rate. The sensitivity of the State’s proportionate share of the net pension liability to changes in the discount rate is presented below (expressed in thousands):
Payables to the Pension Plan
At June 30, 2021, the State had remitted to IPERS all legally required employer contributions and employee contributions which had been withheld from employee wages.
Primary Discretely Presented
Government Component Units
Differences between expected and actual experience 27,482$ 581$
Changes in assumptions 301 -
Changes in proportion and differences between contributions
and proportionate share of contributions 45,940 1,225
Total 73,723$ 1,806$
Deferred Inflows of Resources
(expressed in thousands)
Year Ending Primary Discretely Presented
June 30, Government Component Units
2022 20,844$ 257$
2023 22,172 266
2024 25,595 301
2025 28,305 405
2026 5,438 73
Total 102,354$ 1,302$
Current
1% Decrease Discount Rate 1% Increase
(6.00%) (7.00%) (8.00%)
State's proportionate share of the net pension liability:
Primary government 2,033,570$ 1,163,545$ 434,164$
Discretely presented component units 40,867 24,510 10,793
Total 2,074,437$ 1,188,055$ 444,957$
115

STATE OF IOWA
NOTES TO THE FINANCIAL STATEMENTS
Peace Officers’ Retirement, Accident and Disability System (PORS)
General Information about the Plan
Plan Description. PORS was created under Chapter 97A of the Code of Iowa to provide retirement and other benefits for the peace officers of the Iowa Department of Public Safety. PORS is the administrator of the single-employer defined benefit pension plan.
A member that leaves employment before attaining retirement age but after completing at least four years of covered service is vested and entitled to receive a service retirement benefit upon attaining the minimum retirement age provided their accumulated contributions have not been withdrawn.
Plan Membership. At June 30, 2021, the following employees were covered by the benefit terms:
Benefits Provided. PORS provides service retirement benefits, ordinary disability retirement benefits, accidental disability benefits, ordinary death benefits, accidental death benefits and line of duty death benefits. Benefits vest after four years of credited service.
• Service retirement benefits are calculated as 60.5% of the member’s average final compensation plus anadditional 2.75% for each year of service over 22 years, not to exceed ten additional years, or a maximumof 88%. The member's average final compensation is the average earnable compensation of the memberduring the member's highest three years of service as a member of the Iowa Department of Public Safety.A member may retire with a service allowance after completing 22 years of creditable service and attainingthe minimum service retirement age of 55.
• Ordinary disability retirement benefits are equal to 50% of the member's average final compensation,except if the member has not had five or more years of membership service. Then the member will receivea pension equal to 25% of the member's average final compensation. If the member has had 22 or moreyears of membership service, the member shall receive the greater of the benefit that would be payableunder a service retirement if the member were 55 years of age or 50% of the member's average finalcompensation. A member may receive ordinary disability retirement benefits if the medical board, aftera medical examination of the member, has certified the member is mentally or physically incapacitatedfor further performance of duty and such incapacity is likely to be permanent and the member should beretired.
• Accidental disability benefit is equal to 60% of the member's average final compensation. If the memberhas had 22 or more years of membership service, the member will receive the greater of the benefit payableunder a service retirement if the member were 55 years of age or 60% of the member's average finalcompensation. A member who has become totally and permanently incapacitated for duty as the resultof an injury, disease or exposure occurring while in the actual performance of duty will be retired, providedthe medical board has certified such member is mentally or physically incapacitated for furtherperformance of duty, such incapacity is likely to be permanent and the member should be retired.
• Ordinary death benefit is provided to the beneficiaries of a member with one or more years of service andno pension payable for accidental death benefits an amount equal to 50% of the final year ofcompensation. If the member was in service at the time of death, the beneficiary, if qualified, may electto receive a pension equal to 40% of the average final compensation, but not less than an amount equalto 25% of the compensation paid to an active member having the rank of senior patrol officer of the Iowahighway safety patrol payable immediately upon the death of the member. If the member was not inservice at the time of death, the pension will be reduced to a prorated service allowance payablecommencing when the member would have attained the age of 55. In addition, each child of the memberwill be paid a monthly pension equal to 6% of the monthly earnable compensation payable to an activemember having the rank of senior patrol officer.
Inactive employees or beneficiaries currently receiving benefits 654
Inactive employees entitled to but not yet receiving benefits 41
Nonvested terminations 6
Active employees 547
Total 1,248
116

STATE OF IOWA
NOTES TO THE FINANCIAL STATEMENTS
• Accidental death benefit is payable to the member’s surviving spouse, children or dependent parent uponthe death of a member as a result of an accident or exposure occurring in the performance of duty in anamount equal to 50% of the average final compensation of the member. If there is a surviving spouse,each child of a member will be paid a monthly pension equal to 6% of the monthly earnable compensationpayable to an active member having the rank of senior patrol officer. If there is no surviving spouse,children or dependent parent, the death will be treated as an ordinary death and the benefit will bepayable to the member's estate.
• Line of duty death benefit is provided upon the receipt of evidence and proof the death of a member inservice was the direct and proximate result of a traumatic personal injury incurred in the line of duty,the person authorized to receive an accidental death benefit will receive a lump sum payment equal to$100,000.
Adjustments to Benefits. All benefits payable to retired members and to beneficiaries, except children of a deceased member, are adjusted on July 1 and January 1, for changes in salary scales. An amount equal to a percentage of the difference between the monthly earnable compensation payable to an active member of the same rank and position in the salary scale as was held by the retired or deceased member at the time of the member’s retirement or death, for July of the current year less that of the preceding July will be added to the monthly benefit of each member as follows:
• 40% for members receiving a service retirement allowance, beneficiaries receiving an accidental deathbenefit, members with five or more years of membership who are receiving an ordinary disability benefit,and members receiving an accidental disability benefit.
• 24% for members with less than five years of membership who are receiving an ordinary disability benefitand for beneficiaries receiving an ordinary death benefit.
• Surviving spouses of retirees receive 50% of the amounts above, as applicable, but the amount shall notbe less than 25% of the monthly earnable compensation paid to an active member having the rank ofsenior patrol officer.
For each adjustment occurring on July 1, an additional fixed amount is added to the initial monthly pension based on the years since the member retired: 0-4 years $15; 5-9 years $20; 10-14 years $25; 15-19 years $30; and 20 or more years $35.
Surviving children’s pensions are adjusted each July to equal 6% of monthly earnable compensation payable to an active member having the rank of senior patrol officer of the state patrol.
Contributions. Contributions to PORS were made pursuant to Chapter 97A of the Code of Iowa and were not based upon actuarial determinations. Therefore, actual contributions differ from the annual required contribution. The member contribution rate is 11.4%. The employer contribution rate is the lessor of 37.0% of payroll and the actuarial rate, but not less than 17.0% of payroll. In addition, the State contributed an additional $5 million and will continue the supplemental contribution until the funded status of PORS attains 85%. Contribution provisions are established by State law and may be amended only by the State Legislature. The
State of Iowa has historically followed a contribution policy of appropriating funds based upon a percentage of the current salaries for which funds are appropriated.
The member contribution required and contributed was $5,458,000, representing 11.4% of the current year covered payroll. The State contribution required by statute and the amount actually contributed was $22,711,000. $5,000,000 of the State contribution was an annual appropriation, which was in addition to the required employer 37.0% contribution rate. Costs of administering the plan are financed through employer contributions and investment income.
An actuarial valuation of PORS’ assets and liabilities is required at least once every two years per Chapter 97A of the Code of Iowa.
PORS issues a publicly available financial report that includes financial statements and required supplementary information. That report may be obtained by writing to the Iowa Department of Public Safety, Peace Officers’ Retirement and Disability System, Public Safety Building, 215 East 7th Street, Des Moines, IA 50319 or at [email protected].
117

STATE OF IOWA
NOTES TO THE FINANCIAL STATEMENTS
Net Pension Liability (Asset)
The net pension liability (asset) was measured as of June 30, 2021, and the total pension liability used to calculate the net pension liability (asset) was determined by an actuarial valuation as of that date.
Actuarial Assumptions. The total pension liability was determined by an actuarial valuation as of July 1, 2021, using the following actuarial assumptions and the entry age normal actuarial cost method, applied to all periods included in the measurement:
• Inflation: 2.50%
• Salary increases: 4.00% to 8.50%, including inflation
• Investment rate of return: 7.00% compounded annually, net of investment expense, and including inflation
Pre-retirement mortality rates were based on the RP-2014 Total Dataset Mortality Table with a one-year age set-back for males and Generational Projection, using MP-2016. Post-retirement mortality rates were based on the RP-2014 Total Dataset Mortality Table with a one-year age set-back for males and Generational Projection, using MP-2016. Disability mortality rates were based on the RP-2014 Total Dataset Mortality Table with a four-year age set-forward for males and Generational Projection, using MP-2016.
The actuarial assumptions used in the July 1, 2021 valuation are based on the results of the most recent actuarial experience study, which covered the five-year period ending June 30, 2016. The experience study report is dated June 19, 2017.
The long-term expected rate of return on pension plan investments is reviewed as part of the experience study. The most recent economic experience study was performed in March 2020. Several factors are considered in evaluating the long-term rate of return assumption including the long-term historical data, estimates inherent in current market data and an analysis in which best-estimate ranges of expected future real rates of return (expected returns, net of investment expense and inflation) were developed for each major asset class. These ranges were combined to produce the long-term expected rate of return by weighting the expected future real rates of return by the target asset allocation percentage and then adding expected inflation. The capital market
assumptions developed by investment consultants are often intended for use over a 10-year investment horizon and are not always useful in setting the long-term rate of return for funding pension plans which covers a longer timeframe. The long-term rate of return assumption is intended to be a long-term assumption (30 to 50 years) and is not expected to change absent a significant change in the asset allocation, a change in the inflation assumption, or a fundamental change in the market that alters expected returns in future years.
The target allocation and best estimates of arithmetic real rates of return for each major asset class are summarized in the following table:
Discount Rate. The discount rate used to measure the total pension liability was 7.00%. The projection of cash flows used to determine the discount rate assumed plan contributions from members and the State will be made at the current contribution rates as set in State statute: (1) employee contribution rate: 11.4%; (2) employer contribution rate: the lessor of 37.0% of payroll and the actuarial rate, but not less than 17.0% of payroll; and (3) supplemental State contributions: $5 million until PORS is 85% funded. Based on those assumptions, the pension fiduciary net position was projected to be available to make all projected future benefit payments of current members. Therefore, the long-term expected rate of return on plan assets was applied to all periods of
Asset Class
Large cap equities 25.00% 5.41%
Small/mid cap equities 15.00% 6.39%
International equity - unhedged 18.75% 6.28%
International equity - emerging 6.25% 9.92%
Core bonds 22.75% 1.09%
High-yield bonds 2.25% 3.81%
Real estate 10.00% 4.21%
Total 100.00%
Target Allocation
Long-Term Expected
Real Rate of Return
118

STATE OF IOWA
NOTES TO THE FINANCIAL STATEMENTS
projected benefit payments to determine the total pension liability. The municipal bond rate was not used in determining the discount rate, but if it were required, the rate would have been 2.13%. The projected future benefit payments for all current plan members were projected through 2120.
Sensitivity Analysis. The net pension liability (asset) was calculated using a discount rate of 7.00%, as well as a discount rate that is 1-percentage-point lower (6.00%) or 1-percentage-point higher (8.00%) than the current rate. The sensitivity of the net pension liability to changes in the discount rate is presented below (expressed in thousands):
Pension Plan Fiduciary Net Position. Detailed information about the pension plan’s fiduciary net position is available in the separately issued PORS financial report, as well as the fiduciary combining statements included in the supplementary information section of this report.
Changes in the Net Pension Liability (Asset)
Pension Expense and Deferred Outflows of Resources and Deferred Inflows of Resources Related to Pensions
For the year ended June 30, 2021, the State recognized pension expense related to PORS of negative $18.1 million. At June 30, 2021, the State reported deferred outflows of resources and deferred inflows of resources related to pensions for PORS from the following sources (expressed in thousands):
Current
1% Decrease Discount Rate 1% Increase
(6.00%) (7.00%) (8.00%)
Net pension liability (asset) 83,792$ (27,444)$ (118,032)$
Total Plan Fiduciary Net Pension
Pension Liability Net Position Liability (Asset)
(a) (b) (a) - (b)
Balances at June 30, 2020 751,077$ 604,573$ 146,504$
Changes for the year:
Service cost 14,707 - 14,707
Interest 51,368 - 51,368
Differences between expected and actual experience (1,917) - (1,917)
Contributions - employer - 22,711 (22,711)
Contributions - employee - 5,458 (5,458)
Net investment income - 210,222 (210,222)
Benefit payments, including refunds of employee contributions (35,085) (35,085) -
Administrative expense - (285) 285
Net changes 29,073 203,021 (173,948)
Balances at June 30, 2021 780,150$ 807,594$ (27,444)$
Increase (Decrease) Expressed in Thousands
Deferred Outflows Deferred Inflows
of Resources of Resources
Differences between expected and actual experience -$ 7,965$
Changes in assumptions 34,486 -
Net difference between projected and actual earnings on
pension plan investments - 149,811
Total 34,486$ 157,776$
119

STATE OF IOWA
NOTES TO THE FINANCIAL STATEMENTS
Amounts reported as deferred outflows of resources and deferred inflows of resources related to pensions will be recognized in pension expense as follows (expressed in thousands):
There are no non-employer contributing entities to PORS.
Payables to the Pension Plan
At June 30, 2021, the State reported payables of $671,000 for legally required employer contributions and $207,000 for legally required employee contributions which had been withheld from employee wages but not yet remitted to PORS.
Judicial Retirement System (JRS)
General Information about the Plan
Plan Description. JRS was created under Chapter 602 of the Code of Iowa to provide pension benefits to judges
serving on the Supreme Court, District Courts and the Court of Appeals. JRS is the administrator of a single-employer defined benefit pension plan.
Plan Membership. At June 30, 2021, the following employees were covered by the benefit terms:
Benefits Provided. JRS provides retirement annuities to judges with at least four years of service as a judge of one or more of the above courts and is at least age 65 or has served 20 years of consecutive service as a judge of one or more of the above courts and is at least age 50.
The annual annuity benefits available under JRS are:
• Judge – 3.25% of the average annual basic salary for the highest three years as a judge multiplied by thejudge’s years of service, not to exceed an amount equal to a specified percentage of the highest basicannual salary the judge received at the time the judge separated from service.
• Senior judge – 3.00% (retirement prior to July 1, 2006) or 3.25% (retirement on or after July 1, 2006) ofthe basic senior judge salary multiplied by the judge’s years of service, not to exceed an amount equal toa specified percentage of the basic senior judge salary as of the time the senior judge separated fromservice. The basic senior judge salary is equal to the highest salary the judge is receiving or received atthe time the judge separated from full time service plus 75% of the difference between that salary and thebasic current salary of the office the judge last served as a judge. Effective January 1, 2018, a judgemust be 62 years of age or older at the time a judge assumes senior status. Senior judges may only servefor a total of six years and shall cease holding office upon reaching age 78. These requirements do notapply to judges who have 20 years of service prior to January 1, 2018.
• The specified percentages to determine maximum annuity benefits for judges and senior judges are: (1)50% for judges who retired prior to July 1, 1998, (2) 52% for judges who retired and received an annuityon or after July 1, 1998 but before July 1, 2000, (3) 56% for judges who retired and received an annuityon or after July 1, 2000 but before July 1, 2001, (4) 60% for judges who retired and received an annuity
Year Ending
June 30,
2022 (29,604)$
2023 (29,591)
2024 (33,577)
2025 (30,356)
2026 (162)
Total (123,290)$
Inactive employees or beneficiaries currently receiving benefits 230
Inactive employees entitled to but not yet receiving benefits 3
Active employees 205
Total 438
120

STATE OF IOWA
NOTES TO THE FINANCIAL STATEMENTS
on or after July 1, 2001 but before July 1, 2006, and (5) 65% for judges who retired and received an annuity on or after July 1, 2006.
• Disability – any member who has served as a judge for a total of four years or more and is deemedpermanently incapacitated, mentally or physically, to perform his/her duties shall be entitled to anannuity that would be the same as computed under a retirement annuity.
• Survivor – annuity is equal to 50% of the amount the retired judge was receiving or would have receivedat the time of their death.
Contributions. The contributions to JRS are made pursuant to Section 602.9104 of the Code of Iowa and are not based upon actuarial determinations. Therefore, actual contributions differ from the annual required contribution.
Judges contribute to JRS at the rate of 9.35% multiplied by the basic salary of the judge. The State contributes an amount equal to 30.60% of the basic salary of all covered judges. Commencing with the first fiscal year in which JRS attains fully funded status, and for each subsequent fiscal year, the member contribution shall be 40% of the required contribution rate and the State contribution shall be 60% of the required contribution rate.
The member contribution required and contributed was $2,811,000, representing 9.35% of the current year covered payroll. The State contribution required by statute and the amount contributed was $9,200,000. The State share is to be based on 30.60% of actual salaries. Costs of administering the plan are financed through State appropriation, member contributions and investment income.
An actuarial valuation of JRS’ assets and liabilities is required at least once every four years per Section 602.9116 of the Code of Iowa.
JRS issues a publicly available financial report that includes financial statements and required supplementary information. That report may be obtained by writing to Judicial Retirement System, Iowa Judicial Branch, 1111 East Court Avenue, Des Moines, IA 50319 or at [email protected].
Net Pension Liability (Asset)
The net pension liability (asset) was measured as of June 30, 2021, and the total pension liability used to calculate the net pension liability (asset) was determined by an actuarial valuation as of that date.
Actuarial Assumptions. The total pension liability was determined by an actuarial valuation as of July 1, 2021, using the following actuarial assumptions and the entry age normal actuarial cost method, applied to all periods included in the measurement:
• Inflation: 2.60%
• Salary increases: 3.75%, including inflation
• Investment rate of return: 6.75%, net of investment expense, and including inflation
Mortality rates were based on the RP-2014 White Collar Mortality Tables with a two-year age setback and generational improvements using MP-2017.
The actuarial assumptions used in the July 1, 2021 valuation are based on the results of the most recent actuarial experience study, which covered the five-year period ending June 30, 2018. The experience study report is dated
September 28, 2018.
The long-term expected rate of return on pension plan investments is reviewed as part of the experience study. Several factors are considered in evaluating the long-term rate of return assumption including the long-term historical data, estimates inherent in current market data, and an analysis in which best-estimate ranges of expected future real rates of return (expected returns, net of investment expense and inflation) along with estimates of variability and correlations were developed for each major asset class. These ranges were combined to develop the long-term expected rate of return by weighting the expected future real rates of return by the target asset allocation percentage and then adding expected inflation. The capital market assumptions developed by investment consultants are often intended for use over a 10-year investment horizon and are not always useful in setting the long-term rate of return for funding pension plans which covers a longer timeframe. The long-term rate of return assumption is intended to be a long-term assumption (30 to 50 years) and is not expected to change absent a significant change in the asset allocation, a change in the inflation assumption, or a fundamental change in the market that alters expected returns in future years.
121
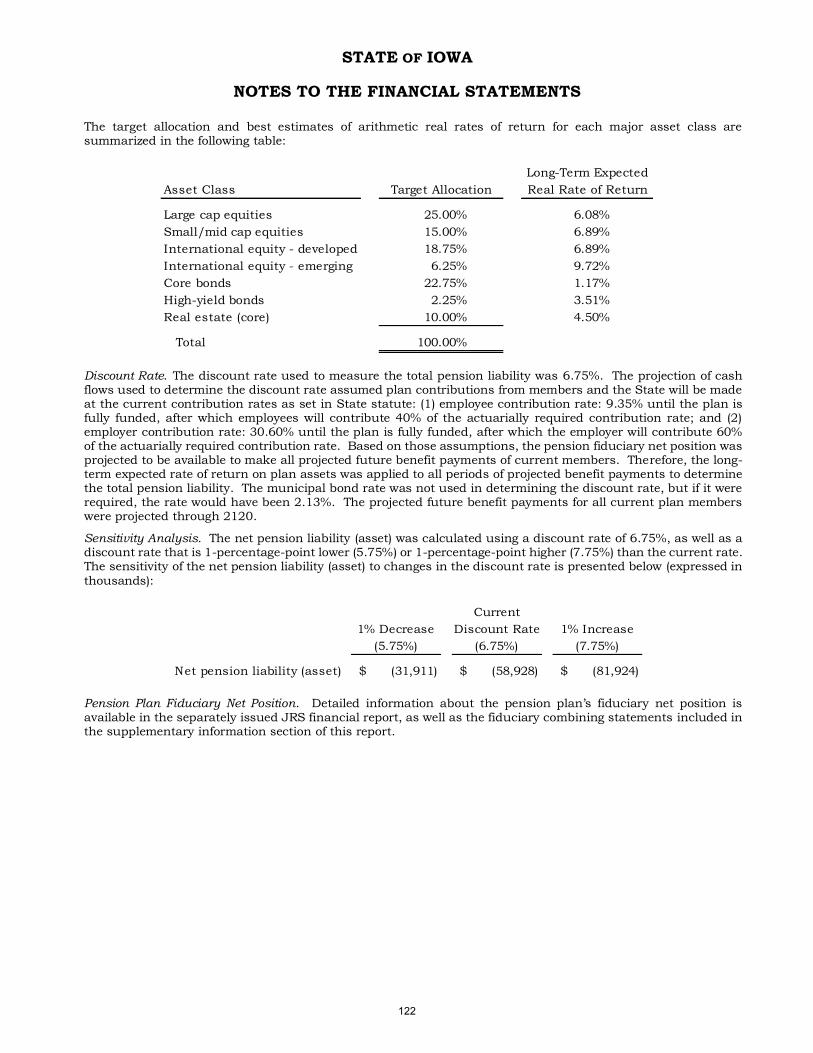
STATE OF IOWA
NOTES TO THE FINANCIAL STATEMENTS
The target allocation and best estimates of arithmetic real rates of return for each major asset class are summarized in the following table:
Discount Rate. The discount rate used to measure the total pension liability was 6.75%. The projection of cash flows used to determine the discount rate assumed plan contributions from members and the State will be made at the current contribution rates as set in State statute: (1) employee contribution rate: 9.35% until the plan is fully funded, after which employees will contribute 40% of the actuarially required contribution rate; and (2) employer contribution rate: 30.60% until the plan is fully funded, after which the employer will contribute 60% of the actuarially required contribution rate. Based on those assumptions, the pension fiduciary net position was projected to be available to make all projected future benefit payments of current members. Therefore, the long-term expected rate of return on plan assets was applied to all periods of projected benefit payments to determine the total pension liability. The municipal bond rate was not used in determining the discount rate, but if it were required, the rate would have been 2.13%. The projected future benefit payments for all current plan members were projected through 2120.
Sensitivity Analysis. The net pension liability (asset) was calculated using a discount rate of 6.75%, as well as a discount rate that is 1-percentage-point lower (5.75%) or 1-percentage-point higher (7.75%) than the current rate. The sensitivity of the net pension liability (asset) to changes in the discount rate is presented below (expressed in
thousands):
Pension Plan Fiduciary Net Position. Detailed information about the pension plan’s fiduciary net position is available in the separately issued JRS financial report, as well as the fiduciary combining statements included in the supplementary information section of this report.
Asset Class
Large cap equities 25.00% 6.08%
Small/mid cap equities 15.00% 6.89%
International equity - developed 18.75% 6.89%
International equity - emerging 6.25% 9.72%
Core bonds 22.75% 1.17%
High-yield bonds 2.25% 3.51%
Real estate (core) 10.00% 4.50%
Total 100.00%
Long-Term Expected
Target Allocation Real Rate of Return
Current
1% Decrease Discount Rate 1% Increase
(5.75%) (6.75%) (7.75%)
Net pension liability (asset) (31,911)$ (58,928)$ (81,924)$
122

STATE OF IOWA
NOTES TO THE FINANCIAL STATEMENTS
Changes in the Net Pension Liability (Asset)
Pension Expense and Deferred Outflows of Resources and Deferred Inflows of Resources Related to Pensions
For the year ended June 30, 2021, the State recognized pension expense related to JRS of negative $8.4 million. At June 30, 2021, the State reported deferred outflows of resources and deferred inflows of resources related to pensions for JRS from the following sources (expressed in thousands):
Amounts reported as deferred outflows of resources and deferred inflows of resources related to pensions will be recognized in pension expense as follows (expressed in thousands):
There are no non-employer contributing entities to JRS.
Payables to the Pension Plan
At June 30, 2021, the State reported payables of $354,000 for legally required employer contributions and $108,000 for legally required employee contributions which had been withheld from employee wages but not yet remitted to JRS.
Total Plan Fiduciary Net Pension
Pension Liability Net Position Liability (Asset)
(a) (b) (a) - (b)
Balances at June 30, 2020 245,233$ 231,485$ 13,748$
Changes for the year:
Service cost 7,823 - 7,823
Interest 16,048 - 16,048
Differences between expected and actual experience (2,634) - (2,634)
Contributions - employer - 9,200 (9,200)
Contributions - employee - 2,811 (2,811)
Net investment income - 81,921 (81,921)
Benefit payments, including refunds of employee contributions (15,233) (15,233) -
Administrative expense - (19) 19
Net changes 6,004 78,680 (72,676)
Balances at June 30, 2021 251,237$ 310,165$ (58,928)$
Increase (Decrease) Expressed in Thousands
Deferred Outflows Deferred Inflows
of Resources of Resources
Differences between expected and actual experience -$ 7,740$
Changes in assumptions 6,705 -
Net difference between projected and actual earnings on
pension plan investments - 54,746
Total 6,705$ 62,486$
Year Ending
June 30,
2022 (10,768)$
2023 (14,345)
2024 (15,682)
2025 (14,623)
2026 (363)
Total (55,781)$
123

STATE OF IOWA
NOTES TO THE FINANCIAL STATEMENTS
C. Teachers Insurance and Annuity Association – College Retirement Equities Fund (TIAA-CREF) RetirementProgram
The Universities, Board of Regents, Iowa Braille and Sight Saving School, Iowa School for the Deaf and Iowa Public Radio contribute to the TIAA-CREF retirement program, which is a defined contribution plan. TIAA-CREF administers the retirement plan for the institutions listed above. The defined contribution retirement plan provides individual annuities for each plan participant. As required by the Board of Regents and the Code of Iowa, all eligible employees must participate in a retirement plan from the date they are employed.
Benefit terms, including contribution requirements, are established in accordance with the Board of Regents, State of Iowa policy and specified by the contract with TIAA-CREF. Contributions made by both employer and employee vest immediately, except at Iowa State University where employer contributions vest after three years. As specified by the contract agreement with TIAA-CREF, each employee through the fifth year of employment contributes 3.33% of the first $4,800 of earnings and 5.00% on the balance of earnings. The employer through the fifth year of employment contributes 6.67% of the first $4,800 of earnings and 10.00% on the balance of earnings. Upon completion of five years of service, the employee contributes 5.00% and the employer contributes 10.00% on all earnings.
During fiscal years 2021 and 2020, the employers’ required and actual contributions amounted to $171,076,000 and $178,260,000, respectively. During fiscal years 2021 and 2020, the employees’ required and actual contributions amounted to $88,926,000 and $89,802,000, respectively. As of June 30, 2021, the employers reported payables of $13,720,000 for legally required employer contributions and $7,142,000 for legally required employee contributions which had been withheld from employee wages but not yet remitted to TIAA-CREF.
NOTE 16 – OTHER POSTEMPLOYMENT BENEFITS
A. Other Postemployment Benefits Totals
At June 30, 2021, the State of Iowa recognized the following amounts related to other postemployment benefits (OPEB) in financial statements prepared using the economic resources measurement focus and accrual basis of accounting (expressed in thousands):
B. State Plan
Plan Description
The State of Iowa provides access to postretirement medical benefits to all retirees as required by Chapter 509A.13 of the Code of Iowa. Although the retirees generally must pay 100% of the premium rate, GASB Statement No. 75, Accounting and Financial Reporting for Postemployment Benefits Other Than Pensions (GASB No. 75), requires that
employers recognize the Implicit Rate Subsidy that exists in postretirement medical plans provided by governmental employers.
The Implicit Rate Subsidy refers to the concept that retirees under the age of 65 (i.e. not eligible for Medicare) generate higher claims on average than active participants. When a medical plan is self-insured or fully insured through a third-party administrator, a premium is usually determined by analyzing the claims of the entire population in the plan and adjusting for administrative costs. The resulting premium is called a blended premium because it blends the claims of active and retired participants. Since individuals generally have more and higher claims as they get older, the blended premium paid for retirees is lower than their expected claims. Another way of considering this is that if the retirees were removed from the plan, the premium for the active group would be lower; therefore, the retirees’ premiums are being subsidized by the active group. Since the employer generally pays a
State Plan University Plan Total State Plan
Primary Primary Primary Discretely Presented
Government Government Government Component Units
Total OPEB liability 209,075$ 259,704$ 468,779$ 3,845$
Deferred outflows of resources related to OPEB 13,460 101,753 115,213 437
Deferred inflows of resources related to OPEB 14,554 121,168 135,722 450
OPEB expense for the period associated with total
OPEB liabilities 21,921 10,951 32,872 413
Defined Benefit - Single-employer
124
STATE OF IOWA
NOTES TO THE FINANCIAL STATEMENTS
large portion or all of the premiums for the active group, this subsidy creates a liability for the employer. The difference between the expected claims for the retiree group and the blended premium is called the Implicit Rate Subsidy.
The State of Iowa Postretirement Medical Plan operates as a single-employer retiree benefit plan which provides medical insurance benefits for retirees. No assets are accumulated in a trust that meets the criteria in paragraph 4, of GASB No. 75. The State currently finances the retiree benefit plan on a pay-as-you-go basis.
A copy of the plan’s separately issued actuarial valuation may be obtained by writing to the Iowa Department of Administrative Services, Hoover State Office Building, Des Moines, Iowa 50319.
Plan Membership
There are 17,448 active and 2,227 retired participants in the plan.
Plan Benefits
The State currently offers three plans which are available to participants: Iowa Choice, National Choice and SPOC (Alliance Select). The contribution requirements of the plan participants are established and may be amended by the State Legislature.
Total OPEB Liability
The total OPEB liability of $212,920,000 ($209,075,000 in the primary government and $3,845,000 in the discretely presented component units), was measured as of June 30, 2021, and was determined by an actuarial valuation as of January 1, 2020. The total OPEB liability was rolled forward from the valuation date to the plan’s fiscal year ended June 30, 2021.
Actuarial Assumptions
The total OPEB liability in the January 1, 2020 actuarial valuation was determined using the following actuarial assumptions and other inputs, applied to all periods included in the measurement:
• Inflation: 2.60%
• Salary increases: 3.25% to16.25%, based on years of service
• Discount rate: 2.16%, as of June 30, 2021
• Healthcare cost trend rate – non SPOC - Medical: 7.00% initial, decreasing to 4.50%
• Healthcare cost trend rate – non SPOC - Rx: 8.00% initial, decreasing to 4.50%
• Healthcare cost trend rate – SPOC- Medical & Rx: 7.25% initial, decreasing to 4.50%
The majority of State of Iowa employees are participants in the Iowa Public Employees’ Retirement System (IPERS). For this reason, the individual salary increases, the mortality rates, withdrawal, retirement and age of spouse assumptions are based on the assumptions used for the IPERS Actuarial Valuation Report as of June 30, 2019. The plan participation and coverage at retirement assumptions are based upon the recent experience of the State of Iowa Postretirement Medical Plan.
The discount rate is based on the municipal bond rate of 2.16% using the 20-year Bond Buyer GO Index as of June 30, 2021.
Mortality rates for general population pre-retirement employees were based on the RP-2014 Employee Table, Generational using MP-2017, set back 4 years for both males and females. Mortality rates for postretirement employees were based on the RP-2014 Healthy Annuitant Table, Generational using MP-2017, with an 8.5% increase in rates above age 75 for males and no age adjustment for females.
Mortality rates for the SPOC population pre-retirement employees were based on the RP-2014 Employee Table, Generational using MP-2017, set back 3 years for males and 4 years for females. Mortality rates for postretirement employees were based on the RP-2014 Healthy Annuitant Table, Generational using MP-2017, set forward I year for males with an 10.0% increase in rates above age 75, and no age adjustment for females.
125

STATE OF IOWA
NOTES TO THE FINANCIAL STATEMENTS
Changes in the Total OPEB Liability
The following changes in assumptions are also reflected in the change in the total OPEB liability:
• Decreased the discount rate from 2.21% to 2.16%.
• Updated medical claims costs to reflect recent experience.
• Updated annual medical trend rates to reflect recent experience and future expectations.
Sensitivity Analysis – Changes to the Discount Rate. The total OPEB liability was calculated using a discount rate of 2.16%, as well as a discount rate that is 1-percentage-point lower (1.16%) or 1-percentage-point higher (3.16%) than the current rate. The sensitivity of the total OPEB liability to changes in the discount rate is presented below (expressed in thousands):
Sensitivity Analysis – Changes to the Healthcare Cost Trend Rate. The total OPEB liability was calculated using a healthcare cost trend rate of 7.00% for non SPOC - Medical, 8.00% for non SPOC – Rx and 7.25% SPOC Medical & Rx for as well as a healthcare cost trend rate that is 1-percentage-point lower (6.00%. 7.00%, and 6.25%) or 1-percentage-point higher (8.00%, 9.00% and 8.25%) than the current rate. The sensitivity of the total OPEB liability to changes in the healthcare cost trend rate is presented below (expressed in thousands):
Primary Discrete
Government Component Units
Balances at June 30, 2020 208,229$ 3,826$
Changes for the year:
Service cost 16,944 312
Interest 4,840 89
Difference between expected and
actual experience (5,790) (107)
Change in assumptions (3,012) (55)
Benefit payments - implicit subsidy (12,136) (220)
Net changes 846 19
Balances at June 30, 2021 209,075$ 3,845$
Increase (Decrease)
Expressed in Thousands
Current
1% Decrease Discount Rate 1% Increase
(1.16%) (2.16%) (3.16%)
Total OPEB liability
Primary government 222,360$ 209,075$ 196,566$
Discretely presented component units 4,089 3,845 3,615
Total 226,449$ 212,920$ 200,181$
Current
Healthcare Cost
1% Decrease Trend Rate 1% Increase
(6.00%, 7.00% (7.00%, 8.00% (8.00%, 9.00%
& 6.25%) & 7.25%) & 8.25%)
Total OPEB liability
Primary government 185,607$ 209,075$ 237,075$
Discretely presented component units 3,413 3,845 4,360
Total 189,020$ 212,920$ 241,435$
126

STATE OF IOWA
NOTES TO THE FINANCIAL STATEMENTS
OPEB Expense and Deferred Outflows of Resources and Deferred Inflows of Resources Related to OPEB
For the year ended June 30, 2021, the State of Iowa recognized OPEB expense related to the Plan of $22,334,000 ($21,921,000 in the primary government and $413,000 in the discretely presented component units). At June 30, 2021, the State reported deferred outflows of resources and deferred inflows of resources related to OPEB for the Plan from the following sources (expressed in thousands):
Amounts reported as deferred outflows of resources and deferred inflows of resources related to OPEB will be recognized in OPEB expense as follows (expressed in thousands):
C. University Plans
Plan Description
The University of Iowa (U of I), Iowa State University (ISU) and the University of Northern Iowa (UNI) operate single employer benefit plans which provide medical, dental and life insurance benefits for retirees and their spouses. No assets are accumulated in a trust that meets the criteria in paragraph 4, of GASB No. 75.
Plan Benefits
Detailed plan benefit information is available in the Universities’ separately issued financial reports. These reports may be obtained by writing to the Iowa Department of Administrative Services, Hoover State Office Building, Des Moines, Iowa 50319.
Primary Discretely Presented
Government Component Units
Changes in assumptions 12,662$ 298$
Changes in proportion and differences between contributions
and proportionate share of contributions 798 139
Total 13,460$ 437$
Primary Discretely Presented
Government Component Units
Differences between expected and actual experience 11,047$ 160$
Changes in assumptions 2,754 80
Changes in proportion and differences between contributions
and proportionate share of contributions 753 210
Total 14,554$ 450$
Deferred Outflows of Resources
Deferred Inflows of Resources
Year Ending Primary Discretely Presented
June 30, Government Component Units
2022 134$ (1)$
2023 134 (1)
2024 134 (1)
2025 134 (1)
2026 106 (2)
Thereafter (1,736) (7)
Total (1,094)$ (13)$
127

STATE OF IOWA
NOTES TO THE FINANCIAL STATEMENTS
Plan Membership
Total OPEB Liability
The total OPEB liability of $259,704,000 is reported based on the following measurement dates, actuarial valuation dates, and actuarial assumptions:
Discount Rate. The U of I discount rate of 2.21% is based on the Bond Buyer 20 Year GO Municipal Bond Index as
of June 30, 2020. The ISU discount rate of 2.12% is based on the Bond Buyer GO 20-Bond Municipal Bond Index as of January 1, 2021. The UNI discount rate of 2.19% is based on the S&P Municipal Bond 20-Year High Grade Index as of June 30, 2021.
Mortality Rates. The U of I rates are from the Pub-2010 Aggregate Mortality Table projected using Scale MP-2018. The ISU rates are from the Pub-2010 Total Dataset Mortality Table fully generational using Scale MP-2019. The UNI rates are from Pub-2010 Total Dataset Headcount Weighted Mortality Table fully generational using Scale MP-2019.
Changes in the Total OPEB Liability
U of I ISU UNI
Inactive employees or beneficiaries currently receiving benefits 2,790 2,932 676
Active employees 18,785 6,494 1,761
Total 21,575 9,426 2,437
2021
U of I ISU UNI
Measurement date June 30, 2020 January 1, 2021 June 30, 2021
Actuarial valuation date June 30, 2020 January 1, 2020 June 30, 2021
Actuarial cost method Entry age normal Entry age normal - level Entry age normal - level
% of salary % of salary
Amortization method Level percentage of pay on an Linearly on a principal Linearly on a principal
open basis only basis only basis
Amortization period 10.18 years (LDT 12.37 years) 7 years 7 years
Discount rate 2.21% 2.12% 2.19%
Medical trend rate 6.19% (7.00% for post age 65) 7.50% 7.50%
Ultimate medical trend rate 4.50% 4.50% 4.50%
Inflation rate 2.50% 2.60% 2.60%
Payroll growth rate 3.00% 3.25% 1.50%
U of I ISU UNI
Balances at June 30, 2020 176,421$ 60,279$ 15,193$
Changes for the year:
Service cost 7,028 5,470 1,123
Interest 6,214 2,052 427
Difference between expected and actual experience (181) (22,902) (267)
Change in assumptions 27,290 3,243 (3,537)
Benefit payments (11,931) (5,669) (549)
Net changes 28,420 (17,806) (2,803)
Balances at June 30, 2021 204,841$ 42,473$ 12,390$
Increase (Decrease) Expressed in Thousands
128

STATE OF IOWA
NOTES TO THE FINANCIAL STATEMENTS
The following changes in assumptions are also reflected in the change in the total OPEB liability:
U of I
• Decreased the discount rate from 3.50% to 2.21%.
• Removed the impact of the excise tax on high cost plans from future medical trend rate assumptions.
ISU
• Decreased the discount rate from 3.26% to 2.12%.
UNI
• Decreased the discount rate from 2.66% to 2.19%.
Sensitivity Analysis – Changes to the Discount Rate. The total OPEB liability was calculated using a discount rate of 2.21%, 2.12% and 2.19% for the University of Iowa, Iowa State University, and the University of Northern Iowa, respectively, as well as a discount rate that is 1-percentage-point lower (1.21%, 1.12% and 1.19%) or 1-percentage-point higher (3.21%, 3.12% and 3.19%) than the current rate. The sensitivity of the total OPEB liability to changes in the discount rate is presented below (expressed in thousands):
Sensitivity Analysis – Changes to the Healthcare Cost Trend Rate. The total OPEB liability was calculated using a healthcare cost trend rate of 6.19%, 7.50% and 7.50% for the University of Iowa, Iowa State University, and the University of Northern Iowa, respectively, as well as a healthcare cost trend rate that is 1-percentage-point lower (5.19%, 6.50% and 6.50%) or 1-percentage-point higher (7.19%, 8.50% and 8.50%) than the current rate. The sensitivity of the total OPEB liability to changes in the healthcare cost trend rate is presented below (expressed in thousands):
Current
1% Decrease Discount Rate 1% Increase
(1.21%, 1.12% & 1.19%) (2.21%, 2.12% & 2.19%) (3.21%, 3.12% & 3.19%)
Total OPEB liability
U of I 223,431$ 204,841$ 188,015$
ISU 45,630 42,473 39,609
UNI 13,641 12,390 11,266
Current
1% Decrease Healthcare Cost Trend Rate 1% Increase
(5.19%, 6.50% & 6.50%) (6.19%, 7.50% & 7.50%) (7.19%, 8.50% & 8.50%)
Total OPEB liability
U of I 187,297$ 204,841$ 227,279$
ISU 39,015 42,473 46,521
UNI 11,107 12,390 13,912
129

STATE OF IOWA
NOTES TO THE FINANCIAL STATEMENTS
OPEB Expense and Deferred Outflows of Resources and Deferred Inflows of Resources Related to OPEB
For the year ended June 30, 2021, the U of I, ISU, and UNI recognized OPEB expense related to the Plans of $13.0 million, $(1.7) million, and $(0.7) million, respectively. At June 30, 2021, the U of I, ISU, and UNI reported deferred outflows of resources and deferred inflows of resources related to OPEB for the Plans from the following sources (expressed in thousands):
Employer contributions subsequent to the measurement date will be recognized as a reduction of total OPEB liability in the year ended June 30, 2021. Amounts reported as deferred outflows of resources and deferred inflows of resources related to OPEB will be recognized in OPEB expense as follows (expressed in thousands):
NOTE 17 – OTHER TERMINATION BENEFITS
A. State Police Officers Council
The State Police Officers Council (SPOC) Collective Bargaining Agreement provides upon retirement, including disability retirement, credit for all unused sick leave.
Accumulated unused sick leave in both the active and banked sick leave accounts shall be converted at current value and credited to the employee’s account for the purpose of paying the cost of the monthly premiums of a health insurance and/or life insurance policy.
Upon written authority from or upon the death of a retired employee, or upon the death of an active employee, the spouse or the surviving spouse shall be entitled to the value of the sick leave bank in both the active and banked
sick leave accounts, as converted in the previous paragraph, for the purpose of paying the cost of monthly premiums of the health insurance and/or life insurance policy for the employee’s spouse or dependents.
If the carrier of either the health or life insurance policy is not a current contracted carrier with the State of Iowa, SPOC or any of its suborganizations, the employee or spouse shall be eligible for reimbursement of a premium
U of I ISU UNI
Differences between expected and actual experience 33,645$ 1,318$ -$
Changes in assumptions 46,892 6,616 957
Contributions subsequent to the measurement date 12,324 - -
Total 92,861$ 7,934$ 957$
U of I ISU UNI
Differences between expected and actual experience 953$ 37,581$ 9,616$
Changes in assumptions 68,034 1,900 3,084
Total 68,987$ 39,481$ 12,700$
Deferred Outflows of Resources
Deferred Inflows of Resources
`
Year Ending
June 30, U of I ISU UNI
2022 (200)$ (9,262)$ (2,259)$
2023 (200) (9,262) (2,259)
2024 (200) (9,262) (2,259)
2025 (184) (3,761) (2,370)
2026 (71) - (2,051)
Thereafter 12,405 - (545)
Total 11,550$ (31,547)$ (11,743)$
130

STATE OF IOWA
NOTES TO THE FINANCIAL STATEMENTS
payment to that carrier upon submission of proof of payment. If there is dissolution of marriage or divorce, it is the employee’s responsibility to withdraw their authority.
The benefits are funded on a pay-as-you-go basis for Department of Public Safety retirees and are fully funded for Department of Natural Resources retirees.
For the year ended June 30, 2021, 340 SPOC retirees received benefits totaling $2.0 million.
B. Other Voluntary Termination Benefit Programs
Voluntary termination benefit programs have been established through collective bargaining for Executive branch AFSCME and IUP employees, Judicial branch AFSCME and PPME employees and Community Based Corrections employees. The programs are also offered to Executive branch non-contract employees, Judicial branch non-contract employees, Legislative employees and Community Based Corrections non-contract employees, except for judicial officers. The programs allow employees who are eligible upon a bona fide retirement to use the value of their unused sick leave to pay the employer share of the monthly premium of the State’s group health insurance plan after their retirement.
Upon retirement, employees shall first receive cash payment for accumulated, unused sick leave converted at the employee’s current regular hourly rate of pay, up to $2,000, payable with the final payroll warrant that includes the employee’s retirement date. The value of the remaining balance of the accrued sick leave will be converted based upon the original balance (before the cash payment). The remainder of the sick leave value is calculated as follows, based on the number of sick hours the employee had before the cash payment:
If the sick leave balance is: The conversion rate is:
Zero to 750 hours 60% of the value
Over 750 hours to 1,500 hours 80% of the value
Over 1,500 hours 100% of the value
The final calculated dollar value will be credited to the employee’s Sick Leave Insurance Program (SLIP) account. Each month, the retiree’s former employing department will pay 100% of the employer share of the selected state group health insurance premium from the retiree’s SLIP account. The retiree is responsible for any additional premiums associated with the employee/retiree share.
The employer will continue to pay the employer’s share of the health insurance premium each month until the converted value of the employee’s sick leave balance is exhausted, the employee is eligible for Medicare, the employee
waives the benefit or the employee dies, whichever comes first. The retired employees may stay with the same health insurance program as when employed or switch down at any time without underwriting. The converted value of the sick leave can only be applied to the employer’s share of health insurance premium payments. It has no cash value and it is not transferable to another use or to an heir.
If a retired employee who has utilized this benefit returns to permanent State employment, all remaining balances in the SLIP account will be forfeited.
All program benefits are financed on a pay-as-you-go basis by the department from which the employee retired. Amounts due for this program have been recorded as a liability in the government-wide financial statements.
For the year ended June 30, 2021, 1,128 employees from the Executive and Legislative branches have retired and received benefits totaling $9.3 million under SLIP. In addition, 189 employees from the Judicial branch and Community Based Corrections have retired and received benefits totaling $2.0 million under SLIP.
131

STATE OF IOWA
NOTES TO THE FINANCIAL STATEMENTS
NOTE 18 – RISK MANAGEMENT
A. Self-Insurance/Retention of Risk
It is the policy of the State not to purchase commercial insurance, except as detailed below in section B, for the risks of losses to which it is exposed. Instead, State management believes it is more economical to manage its risks internally and set aside assets for claim settlement in its internal service funds or to pay claims from the General Fund.
Specific claim adjustment expenditures/expenses and estimated recoveries on unsettled claims are included in the determination of claims liability. Other allocated or unallocated claims adjustment expenditures/expenses are not included.
The State is self-insured for various risks of loss related to work injuries of its employees. The Workers’ Compensation Fund, an internal service fund, services workers’ compensation claims. The liability for unpaid claims is estimated based on the average cost per claim-type determined from an actuarial review. Changes in the balances for estimated claims liabilities for fiscal years 2020 and 2021 were (expressed in thousands):
The State is self-insured for various risks of loss related to its motor vehicle fleet. The Vehicle Dispatcher Self-Insurance Fund, an internal service fund, services liability and property damage claims. The liability for unpaid claims is estimated based on historical experience and the application of an industry standard of 40% for IBNR claims. Changes in the balances for estimated claims liabilities for fiscal years 2020 and 2021 were (expressed in thousands):
The State is self-insured for various risks of loss related to the operation of the Board of Regents Institutions’ motor vehicle fleets. The Regent’s Motor Vehicle Liability Self-Insurance Fund, an internal service fund, services liability and property damage claims. The liability for unpaid claims is estimated based on statistical techniques that reflect recent settlements, similar claim history and other economic and social factors. Changes in the balances for estimated claims liabilities for fiscal years 2020 and 2021 were (expressed in thousands):
The State is self-insured for risks of loss related to property damage and torts. All claims must be filed with the State Appeal Board which has the authority to approve or reject claims. Claims allowed in an amount greater than $5,000 require the unanimous approval of all members of the Board, the Attorney General and the District Court of the State of Iowa for Polk County. The liability for unpaid claims is estimated based on historical experience and analysis. Changes in the balances for estimated claims liabilities for fiscal years 2020 and 2021 were (expressed in thousands):
Beginning Ending
Balance Balance
FY 2020 66,550$ 28,243 25,219 69,574$
FY 2021 69,574 27,426 25,064 71,936
Current Year Claims
& Changes in Estimates
Claim
Payments
Beginning Ending
Balance Balance
FY 2020 4,036$ (2,635) 1,120 281$
FY 2021 281 3,978 1,162 3,097
Current Year Claims Claim
& Changes in Estimates Payments
`
Beginning Ending
Balance Balance
FY 2020 1,157$ 474 770 861$
FY 2021 861 465 290 1,036
Current Year Claims Claim
& Changes in Estimates Payments
132

STATE OF IOWA
NOTES TO THE FINANCIAL STATEMENTS
The Universities retain risk liability for medical faculty malpractice; medical, dental, unemployment and workers’ compensation coverage for some employees; and for various property damage not covered as described below. The estimates of claim liabilities for faculty medical malpractice and employee medical, dental, unemployment and workers’ compensation are based on actuarial analysis. The estimates of the claims liabilities for various property
damages are based on historical analysis. Changes in the balances for estimated claims liabilities for fiscal years 2020 and 2021 were (expressed in thousands):
B. Insurance/Transfer of Risk
The State insures with commercial insurers for certain risks of loss assuming liability for any deductibles and claims in excess of coverage limitations.
• State employee benefits for health, dental, long-term disability and life insurance coverage are fully insured.
• The State maintains an employee fidelity bond for up to $2.0 million.
• The University of Iowa is insured for $2.0 billion for catastrophic property loss for general fund propertieswith a $2.0 million deductible on general University buildings. Additional coverage is provided for auxiliaryenterprises. The fine art collections are insured for $207.4 million.
• Iowa State University is insured for $2.7 billion for catastrophic property loss for general fund propertieswith various deductibles on general University buildings. Additional coverage is provided for auxiliaryenterprises.
• The University of Northern Iowa is insured for $1.2 billion for catastrophic property loss for general fundproperties with a $1.0 million deductible on general University buildings. Additional coverage is providedfor auxiliary enterprises.
• The Iowa School for the Deaf is insured for catastrophic loss liabilities for $79.9 million after a $1.0 milliondeductible.
• The eight Judicial Districts individually insure buildings and contents with coverage ranging from $4.3million to $29.9 million.
• Iowa Workforce Development is insured for $25.2 million for buildings and contents.
• Iowa PBS insures broadcasting trucks and contents for $3.4 million.
• The Iowa Department of Administrative Services is insured for construction projects for up to $2.0 million,with additional coverage for the value of individual projects in excess of $2.0 million.
• The Iowa Lottery Authority is insured for $12.1 million for buildings and contents. Additional coverage of$10.0 million is provided for commercial umbrella liability.
• The Iowa Finance Authority is insured for $15.1 million for buildings and contents.
There were no settlements in excess of coverage for the past three fiscal years, except for the University of Iowa 2020 COVID-19 claim settlement that exceeded the Communicable Disease sublimit of $1 million on the property policy.
Beginning Ending
Balance Balance
FY 2020 25,000$ 16,738 16,738 25,000$
FY 2021 25,000 12,168 12,168 25,000
Current Year Claims Claim
& Changes in Estimates Payments
Beginning Ending
Balance Balance
FY 2020 65,907$ 447,673 447,077 66,503$
FY 2021 66,503 488,005 480,465 74,043
Current Year Claims Claim
& Changes in Estimates Payments
133

STATE OF IOWA
NOTES TO THE FINANCIAL STATEMENTS
NOTE 19 – LITIGATION, CONTINGENCIES AND COMMITMENTS
The Iowa Public Employees’ Retirement System (IPERS) has commitments to fund an additional $2.5 billion to various private equity/debt partnerships, $121.5 million to various real estate debt partnerships, $528.1 million to corporate debt partnerships and $300.0 million to private real assets at June 30, 2021.
IPERS monitors, evaluates, and takes the necessary actions related to litigation for or against IPERS. This includes, but is not limited to, federal and state court actions and defending administrative appeals filed against IPERS.
IPERS participates in federal securities class-actions as the lead plaintiff, co-lead plaintiff, a named plaintiff, or a member of the class action. During the fiscal year, IPERS made 28 recoveries in the amount of $1.3 million that are reflected in the financial statements for the year ended June 30, 2021.
IPERS successfully defended several appeals filed under the Iowa Administrative Procedures Act. No administrative appeal resulted in a loss to the Trust Fund.
The following commitments and obligations remain at June 30, 2021:
• Iowa Department of Transportation has contractual obligations for construction and other contracts of $938.4million (net of $684.7 million in anticipated federal funding).
• University of Iowa has outstanding construction contract commitments of $142.2 million.
• Iowa State University has outstanding construction contract commitments of $90.1 million.
• University of Northern Iowa has outstanding construction contract commitments of $12.2 million.
• Iowa Department of Natural Resources has outstanding construction contract commitments of $10.9 million.
• Iowa Department of Administrative Services has outstanding construction contract commitments of $24.1million.
• Iowa Workforce Development has outstanding contractual obligations of $36.1 million.
• Iowa Department of Human Rights has outstanding contractual obligations of $35.8 million.
• Iowa Department of Human Services has outstanding contractual obligations of $715.2 million.
• Iowa Office of the Chief Information Officer has outstanding contractual obligations of $76.9 million.
• Iowa Department of Public Defense has outstanding contractual obligations for construction and other contractsof $11.6 million.
• Iowa Department of Homeland Security and Emergency Management has outstanding contractual obligations of$39.4 million.
• Iowa Department of Public Safety has outstanding construction contract commitments of $16.2 million.
• Iowa Finance Authority has signed loan agreements under the State Revolving Fund for which $315.6 millionhad not been disbursed.
• Iowa Economic Development Authority has outstanding contractual commitments of $161.0 million.
The State of Iowa has encumbrances at June 30, 2021 totaling $43.6 million ($35.1 million in the General Fund and $8.5 million in the nonmajor governmental funds).
134

STATE OF IOWA
NOTES TO THE FINANCIAL STATEMENTS
NOTE 20 – TAX ABATEMENTS
High Quality Jobs Program (HQJP)
The High Quality Jobs Program, as described in Iowa Code Sections 15.326 through 15.336, provides tax incentives dependent on the number of jobs created or retained and the qualifying investment made. Actual award amounts will be based on the business’s level of need, the quality of the jobs, the percentage of created jobs defined as high-quality, and the economic impact of the project. The new and retained jobs must have a wage which is at least equal to the applicable laborshed wage and provide sufficient benefits to be eligible for these tax credits. To be eligible to receive incentives, a business shall meet all of the following requirements:
• The community has approved the project by ordinance or resolution, if the qualifying investment is over $10million.
• The business has not closed or substantially reduced operations in one area of the state and relocatedsubstantially the same operations in a community in another area of the state. This requirement does notprohibit a business from expanding its operation in a community if existing operations of a similar nature inthe state are not closed or substantially reduced.
• The business shall meet the qualifying wage thresholds (the laborshed wage estimated for the geographic areasurrounding the employment center in which the business is locating or expanding).
• If the business is creating jobs, the business shall demonstrate that the jobs will pay at least 100% of thequalifying wage threshold at the start of the project completion period, at least 120% of the qualifying wagethreshold by the project completion date, and at least 120% of the qualifying wage threshold until themaintenance period completion date. If the business is retaining jobs, the business shall demonstrate thatthe jobs retained will pay at least 120% of the qualifying wage threshold throughout both the projectcompletion period and the maintenance period. A business located at a Brownfield or a Grayfield site or inan economically distressed area may be awarded incentives for jobs that will pay less than 120% of thequalifying wage threshold.
• The business shall provide a sufficient package of benefits to each employee holding a created or retained job.
• The business shall demonstrate that the jobs created or retained will have a sufficient impact on State andlocal government revenues.
• The business shall not be a retail business, a business where entrance is limited by a cover charge ormembership requirement, or a service business where a service business is a business providing services toa local consumer market which does not have a significant portion of its sales coming from outside the state.
The maximum tax credit awards available to a business range from up to 1% Investment Tax Credit (ITC) for qualifying investments of less than $100 thousand for modernization or retention projects only, to up to 10% ITC, Sales Tax Refund, Supplemental Research Activities Credit (SRAC), and property tax exemption, for qualifying investments of more than $10 million for projects creating or retaining more than 100 jobs.
The ITC is amortized equally over a 5-year period at the inception of the project instead of the entire credit being available when the asset is placed in service. An ITC in excess of the tax liability can be credited to the tax liability for the following seven years.
A SRAC may be awarded to a company participating in the program. The supplemental credit could allow the company to as much as double their Research Activities Tax Credit for up to five years for awards made prior to July 1, 2010. For awards made on or after July 1, 2010, the SRAC available is a function of the annual gross receipts of the company and can be claimed over five years up to the total amount of the award.
Credits are awarded based on application to the Iowa Economic Development Authority (IEDA). The Sales Tax Refund applies to the sales and use taxes and requires filing the Construction Contract Claim for Refund form. The Corporation Tax Credit for Third Party Sales Tax applies to corporation income, franchise, insurance premium, and moneys and credits taxes. The ITC applies to corporation income, individual income, franchise, insurance premium, and moneys and credits taxes. The SRAC applies to corporation income and individual income taxes.
The maximum Sales Tax Refund or Corporation Tax Credit for Third Party Sales Tax is awarded by IEDA prior to construction. To claim the refund or credit after construction, the business must submit to the Iowa Department of Revenue (IDR) a refund claim or tax credit application within one year of project completion. If the taxpayer received a Sales Tax Refund award, IDR will issue a refund for all eligible sales tax paid based on submitted contractor's statements and invoices up to the initial award amount; if the taxpayer received a Corporation Tax Credit for Third Party Sales Tax, IDR will issue a tax credit certificate with the final amount of the tax credit, based on that same information, up to the initial award amount.
135

STATE OF IOWA
NOTES TO THE FINANCIAL STATEMENTS
Historic Preservation and Cultural and Entertainment District Tax Credit
The Historic Preservation and Cultural and Entertainment District Tax Credit as described in Iowa Code Chapter 404A, is available for 25% of the qualified rehabilitation expenditures incurred for the substantial rehabilitation of eligible property in Iowa.
To qualify, the property or district must meet one or more of the following criteria:
• The property must be listed on the National Register of Historic Places or be eligible for such a listing.
• The property is designated as having historic significance to a district listed in the National Register of HistoricPlaces or be eligible for such a listing.
• The property or district is designated as a local landmark by a city or county ordinance.
• The property is a barn constructed before 1937.
Substantial rehabilitation for commercial property means rehabilitation costs must equal at least $50,000 or 50% of the assessed value of the property, prior to rehabilitation, excluding the land, whichever is less. For residential property or barns, in order to meet the standard of substantial rehabilitation, rehabilitation costs must equal at least $25,000 or 25% of the property’s assessed value, prior to rehabilitation, excluding the land, whichever is less.
Credits are allocated to projects based on applications including a description of the proposed rehabilitation project to the IEDA. Prior to receiving the tax credit award certificate, the applicant must complete the proposed rehabilitation and have those expenditures approved by IEDA, in consultation with the State Historic Preservation Office, Part 3 of the Historic Preservation Tax Credit Application.
The Historic Preservation and Cultural and Entertainment District Tax Credit applies to individual income, corporation income, franchise, and insurance premium taxes.
Iowa Industrial New Jobs Training Program
The Iowa Industrial New Jobs Training Program, as described by Iowa Code Chapter 260E, assists businesses, which are creating new positions, with new employee training. Eligible businesses may be new, expanding their Iowa workforce, or relocating to the state. Employees qualifying for training services must fill newly-created positions and be subject to Iowa withholding tax.
A business must be engaged in interstate or intrastate commerce for the purpose of manufacturing, processing, assembling products, warehousing, wholesaling, or conducting research and development. A business which provides services must have customers outside of Iowa. A business cannot have closed or substantially reduced its employment base at any of its other business sites in Iowa in order to relocate substantially the same operation to another area of the state. The employees who will receive training must occupy job positions which did not exist during the six months prior to the date that the business and community college agree to pursue a training project. As part of the project, costs expended for on-the-job training can be no more than 50% of the annual gross payroll for up to one year of the new jobs.
The company’s partner community college sells bonds to finance the cost of the established training. Dollars available through the program are dependent upon the training and development needs and the projected tax revenue from the new positions created. The business diverts 1.5% of gross payroll from the State withholding taxes generated by the new positions to the community college to retire the bonds. The employee whose wages are subject to a withholding agreement will receive full credit for the amount withheld when filing their individual income tax returns. Participating businesses must remit payments to the community colleges before making claims to the withholding tax credit.
A Supplemental New Jobs Withholding Tax Credit is also available to businesses who have an Enterprise Zone Program award from IEDA or who surpass the established wage threshold. If eligible, the business diverts an additional 1.5% of gross payroll from the State withholding taxes generated by the new positions. According to the statute, the bonds can also be paid off through tax increment financing (TIF).
Credits are awarded based on application to one of Iowa’s 15 community colleges. Community colleges or the IEDA issues a tax credit certificate number. The New Jobs Credit from Withholding and the Supplemental New Jobs Credit from Withholding apply to withholding tax. Companies are required to pay withholding taxes semi-monthly, monthly, or quarterly. Companies can reduce semi-monthly and monthly payments by these credits, but file claims for the New Jobs Credit from Withholding and Supplemental New Jobs Credit from Withholding using their tax credit certificate number on the quarterly return after making payments to the community colleges.
136

STATE OF IOWA
NOTES TO THE FINANCIAL STATEMENTS
Redevelopment Tax Credit
The Redevelopment Tax Credit, as described by Iowa Code sections 15.291, 15.293A, 15.293B, and 15.294, is available to taxpayers that invest in redeveloping a Brownfield or Grayfield site in Iowa. A Brownfield site is defined as an abandoned, idled, or underutilized industrial or commercial facility where expansion or redevelopment is complicated by real or perceived environmental contamination. A Grayfield site is defined as a property that has been developed and has infrastructure in place but the property’s current use is outdated or prevents a better or more efficient use of the property. Such property includes vacant, blighted, obsolete, or otherwise underutilized property, including an abandoned public building.
A project must apply for the tax credit with the IEDA. Applications, reviewed by the Brownfield Redevelopment Advisory Council, are scored based on feasibility, quality, and financial need of the projects. Successful applications result in registration of the project and a preliminary determination as to the amount of the tax credit for which the applicant qualifies. After registering the project, IEDA shall issue a letter notifying the applicant of successful registration and the preliminary amount of the tax credit. The amount of the issued tax credit certificate is contingent upon the completion of the project and submission of a project audit performed by an independent certified public accountant licensed in Iowa. A registered project must be completed within 30 months of the project’s approval unless IEDA provides additional time (not to exceed 12 months) to complete the project.
The amount of the tax credit shall equal, at most, one of the following: 12% of the qualifying costs in a Grayfield site, 15% of the qualifying costs in a Grayfield site if the redevelopment meets the green development standards, 24% of the qualifying costs in a Brownfield site, or 30% of the qualifying costs in a Brownfield site if the redevelopment meets the green development standards.
Credits are awarded based on application to the IEDA. The Redevelopment Tax Credit applies to corporation income, individual income, franchise, insurance premium, and moneys and credits taxes. The credits are nonrefundable and transferable; however, non-profit entities can be awarded a refundable tax credit.
Renewable Energy Tax Credit
The Renewable Energy Tax Credit, as described in Iowa Code Chapter 476C, is available for a producer or purchaser of energy from an eligible renewable energy facility approved by the Iowa Utilities Board (IUB). A power-purchase agreement is signed between the purchaser and producer which sets forth which party will receive the tax credit. The credit can also be received for renewable energy produced for on-site consumption by the producer provided
the facility is capable of producing not less than ¾ megawatts.
A renewable energy facility includes a wind energy conversion facility, a biogas recovery facility, a biomass conversion facility, a methane gas recovery facility, a solar energy conversion facility, or a refuse conversion facility. The facility must be located in Iowa and placed in service between July 1, 2005 and January 1, 2018. A producer or purchaser of renewable energy may receive Renewable Energy Tax Credits for a 10-year period for each eligible renewable energy facility.
Participants in the program receive Renewable Energy Tax Credits equal to $0.015 per kilowatt-hour of electricity, or $4.50 per million British thermal units of heat for a commercial purpose, or $4.50 per million British thermal units of methane gas or other biogas used to generate electricity, or $1.44 per one thousand standard cubic feet of hydrogen fuel generated by and purchased from an eligible renewable energy facility.
The Small Wind Innovation Zone Program, effective in tax years starting on or after January 1, 2009, allows Renewable Energy Tax Credits for small wind energy systems in small wind innovation zones. A small wind energy system is defined as a wind energy conversion system that collects and converts wind into energy to generate electricity which has a nameplate generating capacity of one hundred kilowatts or less. A small wind innovation zone is defined as a political subdivision of the State.
Facilities must be approved as eligible through an application to the IUB and energy production and sales must be shown. The purchaser or producer notifies IUB of the amount of eligible renewable energy generated and purchased, and IUB then notifies the IDR. IDR issues tax credit certificates to the designated awardee under the agreement. The nonrefundable and transferrable Renewable Energy Tax Credit applies to corporation income, individual income, franchise, insurance premium, consumer’s use, and replacement taxes.
Targeted Jobs Tax Credit from Withholding
The Targeted Jobs Tax Credit from Withholding program, as described by Iowa Code Section 403.19A, authorized four pilot project cities, each of which must contain three or more census tracts, and are approved by IEDA. One
137

STATE OF IOWA
NOTES TO THE FINANCIAL STATEMENTS
city must be in a county bordering South Dakota, one city in a county bordering Nebraska, and two cities must be in counties bordering a state other than South Dakota or Nebraska.
Current pilot project cities include: Sioux City, Council Bluffs, Burlington, Keokuk, and Fort Madison. Because Keokuk and Fort Madison are in the same county and have a total population of fewer than 45,000, they are considered as one pilot project city.
A pilot project city, in conjunction with IEDA, must enter into a withholding agreement with an employer. An agreement cannot be entered into with a business currently located in Iowa unless the business either creates or retains ten jobs, each paying a wage at least equal to the average county wage, or makes a qualifying investment of at least $500,000 within the city. The withholding agreement may have a term of up to ten years. A copy of the withholding agreement must be provided to the IDR. A pilot project city cannot enter into a withholding agreement with an employer after June 30, 2018.
The withholding credit is equal to 3% of the gross wages paid by the employer to each employee covered under the withholding agreement. If the amount of withholding is less than 3% of the gross wages paid to employees covered under the withholding agreement, the employer shall receive a credit against other withholding taxes due or may carry the credit forward for up to ten years. The employer shall remit the amount of the credit quarterly to the pilot project city, and the city must use this amount for a project related to the employer. The employee whose wages are subject to a withholding agreement will receive full credit for the amount withheld when filing their individual income tax returns. The amount of tax credits awarded cannot exceed the qualifying investment.
A retained job is defined as a full-time equivalent position in existence at the time an employer applies to IEDA for approval of a withholding agreement and which remains continuously filled and which is at risk of elimination if the project for which the employer is seeking assistance under the withholding agreement does not proceed.
If IEDA determines the employer no longer meets the requirements of the withholding agreement, the agreement is terminated and the tax credit will also cease. IEDA can negotiate a new agreement or terminate the agreement early if, after three years, it is determined the employer is incapable of meeting the original job or investment promises.
An employer may enter into a New Jobs Tax Credit from Withholding Agreement or a Supplemental New Jobs Tax Credit from Withholding at the same time as the employer is participating in a withholding agreement with a pilot project city. The credits are collected and disbursed first to the community college before the withholding is collected and disbursed to a pilot project city.
Credits are awarded based on application to a pilot project city and IEDA. The Targeted Jobs Tax Credit from Withholding applies to withholding tax. Companies are required to pay withholding taxes semi-monthly, monthly, or quarterly. Companies can reduce semi-monthly and monthly payments by the amount of payments made to the city, but file claims for the Targeted Jobs Tax Credit from Withholding using their tax credit certificate number on the quarterly return.
Enterprise Zone Program
The Enterprise Zone (EZ) Program, as most recently described in the 2013 Code of Iowa, Section 15E.191 through 15E.196, provided incentives to encourage investment in Iowa’s economically distressed areas. State tax credits, refunds, and exemptions were available for qualifying companies that expanded or located in designated EZs. This program was repealed effective July 1, 2014.
To receive these benefits the business: must make a minimum capital investment of $500,000, must create or retain at least 10 full-time equivalent positions and maintain them until the maintenance period completion date, shall provide a sufficient package of benefits to each employee holding a created or retained job, cannot be a retail establishment or a business whose entrance is limited by cover charge or membership, must pay an average wage that is at least 90% of the qualifying wage threshold, if only partially located in an EZ, must be located on contiguous parcels of land, cannot close or reduce its operation in one area of the state and relocate substantially the same operation in the EZ, and must be approved by the local EZ Commission and IEDA prior to project initiation.
A business locating or expanding in an EZ may have received multiple tax incentives, including:
• Supplemental New Jobs Credit from Withholding, which provides additional funding for training newemployees. Credit applied to the withholding tax.
• Refund of State sales, service, or use taxes paid to contractors or subcontractors during construction. Refundapplied to the sales and use tax.
138
STATE OF IOWA
NOTES TO THE FINANCIAL STATEMENTS
• Investment Tax Credit of up to 10% of the new investment in machinery and equipment, land, buildings, andimprovements to existing buildings. Credit applied to corporation income, individual income, franchise,insurance premium, and moneys and credits taxes.
• Housing Investment Tax Credit of up to 10% of the new investment which is directly related to the buildingor rehabilitating of a minimum of four single-family homes or one multiple dwelling unit building containingthree or more individual dwelling units located in that part of a city or county in which there is a designatedEZ. Credit applied to corporation income, individual income, franchise, and insurance premium taxes.
• Supplemental Research Activities Tax Credit that could allow the participating company to as much as doubletheir Research Activities Tax Credit for up to five years for awards made prior to July 1, 2010. Credit appliedto corporation income and individual income taxes.
Credits were awarded based on application to the IEDA. IEDA would issue tax credit certificates to eligible housing businesses that were awarded Housing Investment Tax Credits. A Supplemental New Jobs Credit required a valid agreement with a community college under Iowa Code Chapter 260E.
Accelerated Career Education Program
The Accelerated Career Education Program (ACE), as described in Iowa Code Chapter 206G, assists Iowa's community colleges to either establish or expand programs that train individuals in the occupations most needed by Iowa businesses. The ACE program allows participating companies to divert a portion of the company’s current Iowa individual income withholding tax based on the number of seats in a training program sponsored by a business, up to an annual capped award amount. Businesses participating in the program divert taxes up to 10% of the hiring wage that a sponsoring business would pay to an individual that completes the program’s requirements (with a minimum wage level of no less than 200% of the federal poverty guideline for a family of two). The diversion goes to the community college over the life of the agreement (usually 5 years). The business also provides cash or in-kind contributions equal to at least 20% of the program costs.
To be eligible for the program a business must be engaged in interstate or intrastate commerce for the purpose of manufacturing, processing, or assembling products; construction; conducting research and development; or providing services in interstate or intrastate commerce.
Credits are awarded based on application to one of Iowa’s 15 community colleges, and withholding tax credits are
issued by the IEDA which monitors the program. Companies can reduce semi-monthly and monthly payments by the credit, but file claims for the ACE Credit from withholding using their tax credit certificate number on the quarterly return.
Beginning Farmer Tax Credit Program
The Agricultural Assets Transfer Tax Credit is allowed for an owner of agricultural assets that are subject to a lease or rental agreement with a beginning farmer under the program as defined in Iowa Code Sections 16.78 through 16.82. The lease must be for a term of at least 2 years, but not more than 5 years. The tax credit equals 7% of the amount paid to the taxpayer under the rental agreement or 17% of the amount paid to the taxpayer from crops or animals sold under an agreement in which the payment is exclusively made from the sale of crops or animals. If the beginning farmer is also a veteran, landowners may claim an additional 1% of eligible rent or crop share payments.
The lease or rental agreement may be terminated by either the taxpayer or the beginning farmer. If the Iowa Agricultural Development Division (IADD) determines that the taxpayer is not at fault for the termination, IADD will not issue a tax credit certificate for subsequent years, but any prior tax credit certificates issued will be allowed. If IADD determines that the taxpayer is at fault for the termination, any prior tax credit certificates issued will be disallowed, and the tax credits can be recaptured by the IDR.
The Custom Farming Contract Tax Credit is available for landowners who hire a beginning farmer to do custom work and allows the landowner to claim 7% of the value of the contract as a tax credit. If the beginning farmer is a veteran, the credit is 8% for the first year. The Custom Farming Contract Tax Credit was repealed effective January 1, 2018.
An eligible applicant for the Beginning Farmer Tax Credit Program is defined as a state resident aged 18 or older with a net worth of less than $672,171 for 2016. The allowed maximum net worth is indexed annually based on the October 1 annual change in the U.S. Department of Agriculture's Prices Paid by Farmers Index. The applicant must materially participate in the farm and have sufficient education, training, or experience in farming.
Credits are awarded based on application to the IADD. The Agricultural Assets Transfer Tax Credit and the Custom Farming Contract Tax Credit apply to corporation and individual income taxes.
139

STATE OF IOWA
NOTES TO THE FINANCIAL STATEMENTS
Workforce Housing Tax Incentive Program
The Workforce Housing Tax Incentive Program, as described by Iowa Code Sections 15.351 through 15.356, provides tax incentives to taxpayers who complete a housing project in Iowa. Eligible projects include four or more single-family dwelling units, one or more multiple dwelling unit buildings each containing three or more individual dwelling units, or two or more dwelling units located in the upper story of an existing multi-use building. The project consists of rehabilitation, repair, or redevelopment at a Brownfield or Grayfield site that results in new dwelling units, the rehabilitation, repair, or redevelopment of dilapidated dwelling units, the rehabilitation, repair, or redevelopment of dwelling units located in the upper story of an existing multi-use building, or the new construction, rehabilitation, repair, or redevelopment of dwelling units in a distressed workforce housing community as determined by IEDA based on application by the communities. Each fiscal year, $5 million of the $20 million allocation of incentives is reserved for projects in small cities, defined as a city located in any Iowa county but the 11 most populous.
Projects must be registered with IEDA in order to receive tax credits, and only work completed after registration is eligible. A qualifying new investment eligible for tax incentives includes costs directly related to the acquisition, repair, or redevelopment of a housing project, but is limited to $200,000 per dwelling unit or $250,000 per unit if the property is considered historic. A housing business is required to complete the housing project within three years from the date the housing project is registered by IEDA.
Sales tax refunds are allowed for sales and use taxes paid that are directly related to the housing project. Investment tax credits are available for up to 10 percent of the qualifying new investment in the housing project; for projects in a small city, the investment tax credits equal 20 percent of the qualifying new investment. For corporation income, individual income, and franchise tax, the increase in the basis of the property that would otherwise result from the investment made under this project must be reduced by the amount of tax credit received.
Credits are awarded based on application to IEDA. The Workforce Housing Investment Tax Credit applies to corporation income, individual income, franchise, insurance premium, and moneys and credits taxes. Sales tax refund applies to the sales and use tax.
140

STATE OF IOWA
NOTES TO THE FINANCIAL STATEMENTS
The following is a schedule by program of the amount of taxes abated during the year ended June 30, 2021, (expressed in thousands):
NOTE 21 – DEFICIT FUND BALANCE
The Tobacco Collections Fund, a major special revenue fund, had a deficit fund balance of $43.5 million at June 30, 2021. In accordance with GASB Statement No. 48, Sales and Pledges of Receivables and Future Revenues and Intra-Entity Transfers of Assets and Future Revenues, in fiscal year 2008, an interfund advance was recorded in the Tobacco Collections Fund, causing a deficit fund balance. As future tobacco collections are received in the Tobacco Collections Fund and remitted to the Tobacco Settlement Authority for repayment of debt, the interfund advance will be reduced and the deficit eliminated.
General Services Capitals Fund, a Capital Projects Fund, had a deficit fund balance of $35,000 at June 30, 2021. The deficit resulted from the timing of revenues recognized and the recognition of building project liabilities.
NOTE 22 – UTILITY SYSTEM LEASE & CONCESSION AGREEMENT
On December 20, 2019, the University of Iowa entered into a 50-year agreement, a public-private-partnership (P3), to lease the university’s utility system to the University of Iowa Energy Collaborative LLC (UIEC) and grant it the exclusive right to operate the utility system and provide utility services to the university campus. On March 10, 2020, the university received an upfront payment of $1.2 billion. The upfront payment is reported as an Advance from Concessionaire and is being amortized as an increase to operating revenue on a straight-line basis over the term of the agreement. At June 30, 2021, the balance of the Advance from Concessionaire is $1.1 billion.
Under the agreement, UIEC operates, maintains, and makes capital investments in the utility system and charges the university a utility fee, which includes fixed, variable and operating & maintenance (O&M) components. UIEC capital investments in the utility system are recognized as capital assets and a related long-term payable to the concessionaire. The fixed and O&M components of the utility fee are recognized as operating expense. The variable
component of the utility fee will be recognized as a reduction in the long-term payable to the concessionaire and as interest expense.
The University recognized fixed and O&M utility fees totaling $55.4 million for the year ended June 30, 2021. The carrying amounts of UIEC capital investments and related payable to concessionaire at June 30, 2021 was $13.8 million.
Individual Corporate Insurance
Sales & Income Income Franchise Premium Withholding
Use Tax Tax Tax Tax Tax Tax Total
High Quality Jobs Program (HQJP) 10,419$ 3,892$ 11,635$ -$ 1,512$ -$ 27,458$
Historic Preservation Tax Credit - 20,564 3,745 6,279 - - 30,588
Iowa Industrial New Jobs Training Program - - - - - 37,034 37,034
Redevelopment Tax Credit - 1,446 1,302 2,150 1,309 - 6,207
Renewable Energy Tax Credit* 116 1,822 253 18 309 - 2,518
Targeted Jobs Tax Credit from Withholding - - - - - 4,460 4,460
Enterprise Zone Program - 1,317 1,735 992 - - 4,044
Accelerated Career Education Program - - - - - 3,905 3,905
Beginning Farmer Tax Credit Program - 5,205 175 - - - 5,380
Workforce Housing Tax Incentive Program 2,824 2,326 1,408 7,538 3,907 - 18,003
Total 13,359$ 36,572$ 20,253$ 16,977$ 7,037$ 45,399$ 139,597$
* The table does not include $27 thousand of Replacement Tax abated.
141

STATE OF IOWA
NOTES TO THE FINANCIAL STATEMENTS
NOTE 23 – SUBSEQUENT EVENTS
In July 2021, the University of Iowa received approval from the State Board of Regents to issue Hospital Revenue and Refunding Bonds, Series S.U.I. 2021A, in the amount of $112.3 million and the Hospital Revenue Refunding Bond Anticipation Note, Series S. U. I. 2021B, in the amount of $148.7 million for the purpose of defeasing and current refunding the Hospital Revenue Bonds, Series S. U. I. 2011 and 2011A, for defeasing and advance refunding the Hospital Revenue Bonds, Series S. U. I. 2012 and for paying a portion of the costs of constructing, equipping, installing and extending certain Hospital and Clinic facilities related to the Hospital system of the State University of Iowa and paying costs of issuance. The 2021A bonds will bear interest at varying rates between 2.00% and 5.00% and will mature in varying amounts from September 1, 2021 through September 1, 2051. The 2021B bonds will bear interest of .20% and will mature October 1,2022.
The State Health Facilities Council, in August, 2021, approved an extension of the University of Iowa Hospitals & Clinics academic campus with the construction of a new facility. In September, 2021 the State Board of Regents approved plans for the construction of a new hospital and academic and clinic building. The proposed budget for the project is $395 million, with funding provided by hospital revenue bonds, gifts, and university hospital building usage funds.
In January 2022, the University of Iowa received approval from the State Board of Regents to issue Hospital Revenue Bonds, Series S.U.I. 2022A in the amount of $181.7 million. The proceeds of the bonds will be used to pay a portion of the costs of constructing, equipping, installing, and expanding certain hospital and clinic facilities related to the Hospital System of the State University of Iowa and pay the costs of issuing the bonds. The bonds will bear interest at varying rates between 2.38% and 5.00% and will mature in varying amounts from 2022 through 2051.
In January 2022, the University of Iowa received approval from the State Board of Regents to issue Hospital Revenue Bonds, Series S.U.I. 2022B in the amount of $100.2 million. The proceeds of the bonds will be used to pay a portion of the costs of constructing, equipping, installing, and expanding certain hospital and clinic facilities related to the Hospital System of the State University of Iowa and pay the costs of issuing the bonds. The bonds will bear interest at 3.00% and will mature in varying amounts from 2052 through 2061.
In June 2022, the University of Iowa received approval from the State Board of Regents to issue Hospital Revenue Bonds, Series S.U.I. 2022C in the amount of $130.7 million. The proceeds of the bonds will be used to provide for the current refunding of the outstanding principal of the Hospital Revenue Bonds, Series S.U.I. 2021B and paying the cost of issuing the bonds. The bonds will bear interest at varying rates between 4.00% and 5.00% and will mature in varying amounts from 2023 through 2038.
Subsequent to June 30, 2021, Iowa State University received approval from the State Board of Regents to issue Athletic Facilities Revenue Refunding Bonds, Series I.S.U. 2021 for $16.4 million to be issued on December 1, 2021. These bonds will bear interest at varying rates and will mature in varying amounts from July 1, 2022 through July 1, 2037. The proceeds of the bonds will be used to provide for the current refunding of the outstanding principal of the July 1, 2022 through July 1, 2037 maturities of the Athletic Facilities Revenue Bonds, Series I.S.U. 2012, and to pay the costs of issuing the bonds. The bonds will be payable solely from the net revenues of the athletic facilities system of the University.
Iowa State University received approval from the State Board of Regents to issue Memorial Union Revenue Bonds, Series I.S.U. 2021 for $10.0 million to be issued on December 1, 2021. These bonds will bear interest at varying rates and will mature in varying amounts from July 1, 2022 through July 1, 2042. The proceeds of the bonds will be used to finance the cost of improving, remodeling, repairing, and constructing additions to the Memorial Union building and parking structure. The bonds will be payable solely from the net revenues of the Memorial Union.
In February 2022, the State Board of Regents approved a plan to transfer ownership of three university licensee radio stations and certain related assets to Iowa Public Radio, Inc. (IPR), an Iowa Chapter 504 public benefit corporation, for the purchase price of $1. IPR Board of Directors and the Federal Communications Commission (FCC) must approve the transfer of broadcast licenses before ownership transfer is finalized. IPR has been managing broadcast operations for the universities’ radio stations since 2007. The transfer will allow the universities to redirect resources to other major institutional initiatives and support the mission of public radio. The transfer remains in the FCC’s approval process.
142

STATE OF IOWA
NOTES TO THE FINANCIAL STATEMENTS
In June 2022, the State Board of Regents ended the 2-year phased retirement program that was approved July 1, 2017, effective June 2, 2022. The Board approved a 3-year phased retirement program for the University of Iowa to begin June 3, 2022.
On September 29, 2021, the Iowa Finance Authority (IFA) issued Single Family Mortgage Bonds in the par amount of $99.6 million. Proceeds will be used to purchase mortgage-backed securities under IFA FirstHome and Homes for Iowans program and finance closing costs and down payment assistance. In conjunction with the issue, IFA entered into an interest rate swap agreement with Royal Bank of Canada.
Iowa Finance Authority (IFA) issued Single Family Mortgage Bonds, 2022 Series C (Taxable) in the amount of $16.1 million on January 26, 2022, 2022 Series A (Non-AMT) in the amount of $61.7 million and 2022 Series B (Non-AMT) in the amount of $20.0 million on February 10, 2022. IFA also issued Single Family Mortgage Bonds, 2022 Series D (Non-AMT) in the amount of $63.4 million, 2022 Series E in the amount of $20.0 million and 2022 Series F in the amount of $15.0 million on May 3, 2022. These will primarily be used to provide financing for new lower-interest mortgage loans to certain purchasers of single family owner-occupied residences located throughout the State of Iowa.
On May 3, 2022, IFA also issued State Revolving Fund Revenue Bonds, Series 2022A, in the amount of $198.0 million and State Revolving Fund Revenue Bonds Taxable, Series 2022B, in the amount of $8.2 million. Proceeds will be used for the financing or refinancing of projects that adhere to the federal Clean Water Act and the Safe Drinking Water Act, as determined by the Environmental Protection Agency (the “EPA).
The Department of Human Services completes reviews and cost settlements for federal programs including Medicaid. As the reviews and settlements are finalized, the impact is reflected in the State’s financial statements. Obligations related to reviews and settlements not yet completed, if any, are undeterminable at this time.
Effective July 1, 2022, the Iowa Department of Human Services and the Iowa Department of Public Health will begin the process of becoming a single department. Currently, expenditures are reported under different functional areas. Once effective, expenditures will be reported under a single functional area.
On April 7, 2022, the Office of the Governor of Iowa announced that the state intends to close Glenwood Resource Center in 2024. Glenwood Resource Center provides residential care and other services for Iowans with intellectual developmental disabilities. Over the next two years, Glenwood Resource Center will continue to provide care for its
residents while working with their guardians and families to transition them to community placements or the Woodward Resource Center.
NOTE 24 – COVID-19 PANDEMIC
On January 30, 2020, the World Health Organization declared the coronavirus outbreak (COVID-19) a “Public Health Emergency of International Concern” and on March 11, 2020, declared it to be a pandemic. Actions taken around the world to help mitigate the spread of the coronavirus include restrictions on travel, quarantines in certain areas, and forced closures for certain types of public places and businesses. COVID-19 and actions taken to mitigate its spread have had, and are expected to continue to have, an adverse impact on the economies and financial markets of many countries and their political subdivisions.
It is not known how long the adverse conditions associated with COVID-19 will last, and it is uncertain to what extent these conditions and future developments will impact the State’s financial operations and position.
NOTE 25 – PROSPECTIVE ACCOUNTING CHANGE
Governmental Accounting Standards Board has issued Statement No. 87, Leases. This statement will be implemented for the fiscal year ending June 30,2022. This statement requires recognition of certain lease assets and liabilities not previously reported in the Statements of Net Position.
143

Victory Arch over Locust Street erected forcelebration of the 168th Infantry’s homecoming
at the Iowa State Capitol grounds.
~ May 15, 1919 ~
“The End of the Rainbow in Iowa…From the Rhine to the Mississippi.”
State Historical Library and Archives of Iowa, State Historical Society of Iowa, Des Moines.
144

I N F O R M A T I O N
R E Q U I R E D
S U P P L E M E N T A R Y
145

STATE OF IOWA
Required Supplementary Information
Budgetary Comparison Schedule - General Fund
ORIGINAL
BUDGET
FINAL
BUDGET ACTUAL
FINAL TO
ACTUAL
APPROPRIATED REVENUE
Special taxes:
Personal income tax 4,866,400$ 5,031,900$ 5,192,140$ 160,240$
Sales/use tax 3,190,300 3,299,300 3,574,035 274,735
Corporation income tax 620,300 747,100 877,986 130,886
Inheritance tax 86,800 89,600 102,053 12,453
Insurance premium tax 152,300 140,300 143,901 3,601
Beer & liquor tax 12,900 12,100 18,208 6,108
Franchise tax 69,800 58,800 66,748 7,948
Miscellaneous tax 20,400 23,000 21,588 (1,412)
Total special taxes 9,019,200 9,402,100 9,996,659 594,559
Reimbursements & fees:
Institutional reimbursements 11,200 10,300 7,548 (2,752)
Liquor transfers 130,100 141,700 149,826 8,126
Interest 15,100 3,000 2,217 (783)
Fees 30,800 26,200 29,788 3,588
Judicial revenue 95,700 63,500 86,907 23,407
Miscellaneous receipts 52,000 57,300 74,918 17,618
Racing and gaming receipts 2,200 2,200 2,250 50
Total receipts 9,356,300 9,706,300 10,350,113 643,813
Transfers 105,000 121,000 125,408 4,408
Economic emergency fund surplus 268,800 246,724 246,724 -
TOTAL APPROPRIATED REVENUE 9,730,100 10,074,024 10,722,245 648,221
Other taxes 602 1,397 1,397 -
Multi suspense 32,661 32,661 26,971 (5,690)
Federal support 5,095,276 5,616,998 5,328,097 (288,901)
Local governments 50,700 29,722 31,165 1,443
Internal service transfers 607,328 607,896 619,620 11,724
Reimbursements from other departments 6,052 6,052 5,940 (112)
Government fund type transfers:
Attorney General 20,388 20,566 20,502 (64)
Auditor of State 4,652 4,652 3,855 (797)
Other agencies 41,418 44,326 46,242 1,916
Interest 286 286 25 (261)
Fees, licenses & permits 54,660 55,464 43,380 (12,084)
Refunds & reimbursements 634,183 640,165 630,418 (9,747)
Sale of equipment & salvage 11 11 1 (10)
Rents & leases 2,003 1,695 1,379 (316)
Agricultural sales - 2 295 293
Other sales & services 4,841 4,780 (406) (5,186)
Unearned receipts 68,539 76,378 76,260 (118)
Other 12,145 13,342 10,534 (2,808)
TOTAL APPROPRIATED RECEIPTS 6,635,745 7,156,393 6,845,675 (310,718)
TOTAL ALL REVENUE 16,365,845 17,230,417 17,567,920 337,503
SCHOOL INFRASTRUCTURE TRANSFER (519,800) (531,500) (560,425) (28,925)
REFUNDS OF TAXES COLLECTED (1,104,000) (1,232,300) (1,114,467) 117,833
TOTAL REVENUES AVAILABLE 14,742,045 15,466,617 15,893,028 426,411
(continued on next page)
For the Year Ended June 30, 2021
(Expressed in Thousands)
RECEIPTS CREDITED TO APPROPRIATIONS
146

STATE OF IOWA
Required Supplementary Information
Budgetary Comparison Schedule - General Fund
ORIGINAL
BUDGET
FINAL
BUDGET ACTUAL
FINAL TO
ACTUAL
EXPENDITURES
Administration & regulation 736,976 776,144 750,289 25,855
Agriculture & natural resources 183,064 183,880 179,312 4,568
Economic development 55,225 59,116 53,788 5,328
Education 4,629,505 4,638,153 4,724,749 (86,596)
Health & human services 8,135,979 8,418,345 7,957,777 460,568
Justice 640,576 659,695 671,085 (11,390)
Judicial 187,537 187,538 188,026 (488)
Legislature 36,004 36,004 36,250 (246)
TOTAL EXPENDITURES 14,604,866 14,958,875 14,561,276 397,599
REVENUES AVAILABLE OVER (UNDER)
EXPENDITURES & TRANSFERS 137,179 507,742 1,331,752 824,010
OTHER FINANCING SOURCES (USES)
Balances credited to appropriations 201,910 264,281 264,281 -
Unexpended appropriations (6,284) (284,726) (357,619) (72,893)
TOTAL OTHER FINANCING SOURCES (USES) 195,626 (20,445) (93,338) (72,893)
REVENUES AVAILABLE OVER EXPENDITURES
& OTHER ITEMS 332,805 487,297 1,238,414 751,117
BEGINNING FUND BALANCE (BUDGETARY) - - - -
REMAINING FUND BALANCE (BUDGETARY) 332,805$ 487,297$ 1,238,414$ 751,117$
ENDING FUND BALANCE (BUDGETARY) 332,805$ 487,297$ 1,238,414$
AUTHORIZED TRANSFER TO THE:
Cash Reserve Fund (332,805) (487,297) (1,238,414)
REMAINING FUND BALANCE (BUDGETARY) -$ -$ -$
(continued)
For the Year Ended June 30, 2021
(Expressed in Thousands)
147

STATE OF IOWA
Required Supplementary Information
Budgetary Comparison Schedule - Budget to GAAP Reconciliation - General Fund
June 30, 2021
Fund balance - budgetary/legal 1,238,414$
Basis of accounting differences:
Balance sheet accounts:
Accounts receivable 457,448
Due from other funds 3,743
Prepaid expenditures 36,906
Accounts payable & accruals (332,585)
Due to other funds (76,289)
Unearned revenue (3,861)
Deferred revenue (304,641)
Budgetary unexpended appropriations 357,619
Timing differences:
Petty cash & inventory expensed in budgetary accounting 59,264
Perspective differences 2,316,639
Total fund balance - GAAP basis 3,752,657$
(Expressed in Thousands)
148

STATE OF IOWA
Required Supplementary Information
Notes to Required Supplementary Information – Budgetary Reporting
BUDGETARY EXPENDITURES IN EXCESS OF APPROPRIATIONS
During the year ended June 30, 2021, actual expenditures exceeded budgeted expenditures in the General Fund, in the Education, Justice, Judicial and Legislature functions. For the Education function, the Department of Education received additional federal and state funding for State Foundation School Aid and the School Food Service program over budget and expended those funds for allowable program expenditures. For the Justice function, the Attorney General and the Department of Public Defense received additional federal funding and expended those funds for allowable program expenditures. The Department of Corrections received additional state funding over budget and expended those funds for allowable program expenditures. For the Judicial function, the Judicial Branch received additional federal funds and other State funds over budget and expended those funds for allowable purposes. For the Legislature, the Legislative Branch received additional state funds over budget and expended those funds for allowable purposes.
BUDGETARY PRESENTATION
The budget encompasses the General Fund of the State and some Special Revenue Funds: Primary Road Fund, Fish and Game Trust Fund, Environment First Fund, Health Care Trust Fund and Other Funds. Other Funds include: IOWAccess Revolving Fund, Consumer Education Fund, Real Estate Education, Medicaid Fraud Fund, Unclaimed Winnings, Sports Wagering Receipts Fund, Technology Reinvestment Fund, Address Confidentiality Program Revolving Fund, Revenue Bonds Capital II Fund, Revenue Bonds Capital Fund, Underground Storage Tank Unassigned Revenue, Tobacco Tax Exempt Bond Proceeds Restricted Capital, Endowment for Iowa’s Health Restricted Capitals Fund, Resources Enhancement and Protection Fund, Land Recycling Fund, Conservation Administration Fund, Forestry Management Enhancement Fund, Water Quality Protection, National Pollutant Discharge Elimination System Permit, Workforce Development Withholding, Wine and Beer Promotion Board Fund, Grow Iowa Values Fund, Renewable Fuel Infrastructure Fund, State Housing Trust Fund, Special Contingency Fund, Stafford Loan Program Fund, Pharmaceutical Settlement Fund, Hospital Health Care Access Trust Fund, Quality Assurance Fund, State Aviation Fund, and Court Technology and Modernization Fund. There is a perspective difference between budget and financial reporting due to the difference in fund structures. The budgetary presentation will vary from the financial presentation for funds displayed in the supplementary information due to this difference. The General Fund is displayed in the Required Supplementary Information (RSI) Budgetary Comparison Schedule. The major Special Revenue Funds, Tobacco Settlement Authority and Tobacco Collections Fund, do not have legally adopted budgets and, therefore, are not displayed. The nonmajor Special Revenue Funds are displayed with the combining financial statements and schedules for nonmajor funds in the Supplementary Information section.
The original budget and related estimated revenues and expenditures represent the spending authority enacted into law by the appropriations bills as of July 1, 2020 and includes estimated approved budgetary carry-forwards from the prior fiscal year.
The final appropriations budget represents original and supplemental appropriations, actual budgetary carry-forwards, approved transfers, executive order reductions and timing differences.
The State’s budget is prepared annually by the Governor on a modified cash basis and is required to be submitted along with proposed appropriation bills to the General Assembly by the first of February prior to the new fiscal year. When an appropriation bill is passed by both houses of the General Assembly, the bill is enrolled and sent to the Governor. The Governor may sign it into law or veto it in whole or in part on a line item basis. Funds may be disbursed only after appropriations have been allotted by the Department of Management, subject to the review of the Governor, with the exception of standing unlimiteds and certain receipts that the Departments are authorized
to expend.
Departments may request revisions to allotments, appropriations transfers, or supplemental appropriations. The Department of Management approves revised allotments within an appropriation, subject to the Governor’s review. The Governor and the Department of Management approve all appropriation transfers. The General Assembly and the Governor act on supplemental appropriation bills in a manner similar to original appropriations. Appropriations lapse at the fiscal year-end and all unencumbered or unobligated balances revert to the State treasury, unless otherwise provided.
The State utilizes encumbrance accounting for budgetary control purposes. Obligations incurred for goods or services that have not been received or rendered are recorded to reserve that portion of the applicable fund balance.
149

STATE OF IOWA
Required Supplementary Information
Notes to Required Supplementary Information – Budgetary Reporting
Section 8.33, unnumbered paragraph 2, of the Code of Iowa, states, “No payment of an obligation for goods and services shall be charged to an appropriation subsequent to the last day of the fiscal year for which the appropriation is made unless the goods or services are received on or before the last day of the fiscal year, except that repair projects, purchase of specialized equipment and furnishings, and other contracts for services and capital expenditures for the purchase of land or the erection of buildings or new construction or remodeling, which were committed and in progress prior to the end of the fiscal year are excluded from this provision.” That is, except for the above stated exceptions, the State must have received the goods or services on or before June 30, creating an actual liability or the encumbrance is cancelled against that fiscal year. If the encumbrances are still valid after June 30, they become expenditures/expenses of the next fiscal year.
Budgetary control is essentially maintained at the department fund level except for certain grant and aid programs where control is maintained at a program level. Revenues and expenditures are monitored on a continuing basis. State law authorizes the Governor to impose across-the-board pro rata reductions in allotments to ensure revenues and other available funds are sufficient to pay expenses of a given fiscal year.
Separate reports for the General Fund and budgeted Special Revenue Funds presenting detail of the legal level of control and actual expenditures are available from the Department of Management.
GENERAL FUND EXPENDITURE LIMITATION
The Code of Iowa, Section 8.54, establishes a State General Fund expenditure limitation of 99.0% of the adjusted revenue estimate. The adjusted revenue estimate is the appropriated revenue estimate for the General Fund for the following fiscal year as determined by the Revenue Estimating Conference, adjusted by subtracting estimated tax refunds payable from that estimated revenue and as determined by the Conference, adding any new revenues which may be considered to be eligible for deposit into the General Fund. “New revenues” means moneys which are received by the State due to increased tax rates and fees or newly created taxes and fees over and above those moneys which are received due to State taxes and fees which are in effect as of January 1 following the December Revenue Estimating Conference. “New revenues” also includes moneys received by the General Fund of the State due to new transfers over and above those moneys received by the General Fund of the State due to transfers which are in effect as of January 1 following the December Revenue Estimating Conference. The Department of Management shall obtain concurrence from the Revenue Estimating Conference on the eligibility of transfers to the General Fund which are to be considered as new revenue in determining the General Fund expenditure limitation.
This limitation shall be used by the Governor in the preparation of the budget and by the General Assembly in the budget process. If a source for new revenues is proposed, the budget revenue projection used for that new revenue source for the period beginning on the effective date of the new revenue source and ending in the fiscal year in which the source is included in the revenue base shall be an amount determined by subtracting estimated tax refunds payable from the projected revenue from the new revenue source, multiplied by 95.0%. If a new revenue source is established and implemented, the original General Fund expenditure limitation amount shall be readjusted to include 95.0% of the estimated revenue from the new source.
For fiscal years in which the Iowa Economic Emergency Fund transfers money to the General Fund, the original General Fund expenditure limitation amount provided for shall be readjusted to include the moneys which are so transferred.
The scope of the expenditure limitation shall not encompass federal funds, donations, constitutionally dedicated moneys and moneys in expenditures from State retirement system moneys. The Governor shall submit and the General Assembly shall pass a budget that does not exceed the State General Fund expenditure limitation. The Governor shall not submit and the General Assembly shall not pass a budget which in order to balance assumes reversion of a specific amount for the total of the appropriations included in the budget.
150

STATE OF IOWA
Required Supplementary Information
Notes to Required Supplementary Information – Budgetary Reporting
RESERVE FUNDS
The State maintains two reserve funds: the Cash Reserve Fund and the Iowa Economic Emergency Fund, created in Sections 8.56 and 8.55 of the Code of Iowa. These funds were established by formal action of the highest level of decision making authority as they were created by legislation passed by both the House and Senate and signed by the Governor. The law restricts the use and purpose of each fund. Formal action is required to use resources in the funds, modify their purpose or change the balances of the funds. Fund balances for both funds are included in the committed spendable fund balance classification.
The Cash Reserve Fund is separate from the General Fund of the State and is not to be considered part of the General Fund of the State except in determining the cash position of the State. The moneys in the Cash Reserve Fund cannot be transferred, used, obligated, appropriated or otherwise encumbered except as provided under Iowa Code Section 8.56. Interest or earnings on moneys deposited in the Cash Reserve Fund are credited to the Rebuild Iowa Infrastructure Fund. Moneys in this fund may be used for cash flow purposes provided that moneys so allocated are returned to the Cash Reserve Fund by the end of each fiscal year. The maximum balance of the fund is equal to 7.5% of the adjusted revenue estimated for the General Fund for the current fiscal year. The moneys in this fund may only be appropriated by the General Assembly for nonrecurring emergency expenditures and shall not be appropriated for payment of any collective bargaining agreement or arbitrator’s decision negotiated or awarded. The balance in the Cash Reserve Fund may be used in determining the cash position of the General Fund of the State for payment of State obligations. An appropriation shall not be made from the Cash Reserve Fund if the appropriation would cause the fund’s balance to be less than 3.75% of the adjusted revenue estimate for the year for which the appropriation is made unless the bill or joint resolution is approved by vote of at least three-fifths of the members of both chambers of the General Assembly and is signed by the Governor. Also, the appropriation must be contained in a bill or joint resolution in which the appropriation is the only subject matter of the bill or joint resolution, and the bill or joint resolution states the reasons the appropriation is necessary.
The Iowa Economic Emergency Fund is separate from the General Fund of the State and the fund is not to be considered part of the balance of the General Fund of the State. The moneys in the fund do not revert to the General Fund. The maximum balance of the fund is equal to 2.5% of the adjusted revenue estimate for the General Fund for the current fiscal year. Interest or earnings on moneys deposited in the Iowa Economic Emergency Fund are credited to the Rebuild Iowa Infrastructure Fund. Moneys in this fund may be used for cash flow purposes provided that moneys so allocated are returned to the Iowa Economic Emergency Fund by the end of each fiscal year. The balance may be used in determining the cash position of the General Fund of the State for payment of State obligations. Amounts in excess of the maximum balance are distributed as follows: (1) the difference between the actual net revenue for the General Fund of the State and the adjusted revenue estimate for the fiscal year is transferred to the Taxpayers Trust Fund, (2) the remainder of the excess, if any, shall be transferred to the General Fund of the State.
The General Assembly can only appropriate moneys in the fund for emergency expenditures. A maximum of 1% of the adjusted revenue estimate for the fiscal year may be used to prevent a deficit in the General Fund when all of the following have occurred: (1) the balance of the General Fund of the State at the end of the fiscal year prior to
the appropriation made in this paragraph was negative; and (2) the Governor has issued an official proclamation and has notified the Legislative Fiscal Committee and the Legislative Services Agency that the balance of the General Fund is negative and that an appropriation made pursuant to Iowa Code section 8.55 brings the General Fund of the State into balance. Additionally, the Executive Council may receive an amount sufficient to pay expenses authorized in 7D.29 of the Code of Iowa.
151

STATE OF IOWA
Required Supplementary Information
Schedule of the Proportionate Share of the Net Pension Liability
2021 2020 2019 2018 2017
State's proportion of the net
pension liability 16.563546% 16.155224% 16.561596% 16.960683% 17.130052%
State's proportionate share of the
net pension liability 1,163,545$ 935,567$ 1,048,060$ 1,129,772$ 1,078,059$
State's covered payroll 1,475,401$ 1,419,476$ 1,414,609$ 1,431,290$ 1,388,017$
State's proportionate share of the
net pension liability as a
percentage of its covered payroll 78.86% 65.90% 74.09% 78.93% 77.67%
Plan fiduciary net position as a
percentage of the total pension
liability 82.90% 85.45% 83.62% 82.21% 81.82%
2016 2015
State's proportion of the net
pension liability 16.899393% 17.009515%
State's proportionate share of the
net pension liability 834,918$ 674,583$
State's covered payroll 1,356,263$ 1,342,673$
State's proportionate share of the
net pension liability as a
percentage of its covered payroll 61.56% 50.24%
Plan fiduciary net position as a
percentage of the total pension
liability 85.19% 87.61%
In accordance with GASB Statement No. 68, the amounts presented were determined as of the measurement date of
the collective net pension liability, which is June 30 of the preceding fiscal year.
* GASB Statement No. 68 requires ten years of information to be presented in this schedule; however, until a full
10-year trend is compiled, the State will present information for those years for which information is available.
See accompanying independent auditor's report.
Iowa Public Employees' Retirement System (IPERS)
Last Seven Fiscal Years as of June 30 *
(Expressed in Thousands)
152

STATE OF IOWA
Required Supplementary Information
Schedule of Changes in Net Pension Liability and Related Ratios
2021 2020 2019 2018 2017 2016 2015 2014
Total pension liability
Service cost 14,707$ 12,692$ 12,194$ 12,109$ 13,071$ 12,207$ 11,847$ 11,551$
Interest 51,368 50,117 48,185 46,564 42,298 41,661 40,222 38,880
Changes in benefit terms - - - - - - - (164)
Differences between expected & actual experience (1,917) (5,567) (1,471) (5,279) (1,886) (5,613) (6,609) (7,444)
Changes in assumptions - 42,755 - - 33,549 23,791 - -
Benefit payments, including refunds of employee
contributions (35,085) (33,672) (32,643) (30,966) (29,362) (28,284) (26,693) (25,432)
Net change in total pension liability 29,073 66,325 26,265 22,428 57,670 43,762 18,767 17,391
Total pension liability - beginning 751,077 684,752 658,487 636,059 578,389 534,627 515,860 498,469
Total pension liability - ending (a) 780,150$ 751,077$ 684,752$ 658,487$ 636,059$ 578,389$ 534,627$ 515,860$
Plan fiduciary net position
Contributions - employer 22,711$ 22,364$ 21,840$ 21,498$ 17,274$ 20,519$ 18,601$ 17,715$
Contributions - employee 5,458 5,535 5,486 5,124 5,053 5,080 4,991 4,755
Net investment income (loss) 210,222 71,219 16,147 65,058 72,488 (4,581) 21,722 65,436
Benefit payments, including refunds of employee
contributions (35,085) (33,672) (32,643) (30,966) (29,362) (28,284) (26,693) (25,432)
Administrative expense (285) (235) (250) (233) (237) (248) (217) (199)
Net change in fiduciary net position 203,021 65,211 10,580 60,481 65,216 (7,514) 18,404 62,275
Plan fiduciary net position - beginning 604,573 539,362 528,782 468,301 403,085 410,599 392,195 329,920
Plan fiduciary net position - ending (b) 807,594$ 604,573$ 539,362$ 528,782$ 468,301$ 403,085$ 410,599$ 392,195$
Net pension liability (asset) - ending (a) - (b) (27,444)$ 146,504$ 145,390$ 129,705$ 167,758$ 175,304$ 124,028$ 123,665$
Plan fiduciary net position as a percentage of the
total pension liability 103.52% 80.49% 78.77% 80.30% 73.63% 69.69% 76.80% 76.03%
Covered payroll 47,869$ 46,931$ 45,514$ 44,589$ 42,212$ 47,028$ 43,873$ 43,845$
Net pension liability (asset) as a percentage
of covered payroll -57.33% 312.17% 319.44% 290.89% 397.42% 372.77% 282.70% 282.05%
* GASB Statement No. 68 requires ten years of information to be presented in this schedule; however, until a full 10-year trend is
compiled, the State will present information for those years for which information is available.
See accompanying independent auditor's report.
Peace Officers' Retirement, Accident and Disability System (PORS)
Last Eight Fiscal Years as of June 30 *
(Expressed in Thousands)
153

STATE OF IOWA
Required Supplementary Information
Schedule of Changes in Net Pension Liability and Related Ratios
2021 2020 2019 2018 2017 2016 2015 2014
Total pension liability
Service cost 7,823$ 7,666$ 7,124$ 6,230$ 6,235$ 6,231$ 6,438$ 6,503$
Interest 16,048 15,957 15,417 14,396 13,880 13,548 13,392 13,022
Changes in benefit terms - - - (1,208) - - - -
Differences between expected & actual experience (2,634) (7,323) (328) (3,222) (865) (3,655) (6,586) (3,957)
Changes in assumptions - - - 33,526 - - - -
Benefit payments, including refunds of employee
contributions (15,233) (14,699) (13,724) (12,812) (11,950) (11,460) (10,891) (10,377)
Net change in total pension liability 6,004 1,601 8,489 36,910 7,300 4,664 2,353 5,191
Total pension liability - beginning 245,233 243,632 235,143 198,233 190,933 186,269 183,916 178,725
Total pension liability - ending (a) 251,237$ 245,233$ 243,632$ 235,143$ 198,233$ 190,933$ 186,269$ 183,916$
Plan fiduciary net position
Contributions - employer 9,200$ 9,211$ 8,771$ 8,503$ 8,544$ 8,667$ 8,724$ 8,630$
Contributions - employee 2,811 2,814 2,680 2,598 2,611 2,648 2,665 2,637
Net investment income (loss) 81,921 17,776 7,237 26,227 26,632 (2,673) 7,533 26,172
Benefit payments, including refunds of employee
contributions (15,233) (14,699) (13,724) (12,812) (11,950) (11,460) (10,891) (10,377)
Administrative expense (19) (22) (26) (20) (18) (20) (15) (17)
Net change in fiduciary net position 78,680 15,080 4,938 24,496 25,819 (2,838) 8,016 27,045
Plan fiduciary net position - beginning 231,485 216,405 211,467 186,971 161,152 163,990 155,974 128,929
Plan fiduciary net position - ending (b) 310,165$ 231,485$ 216,405$ 211,467$ 186,971$ 161,152$ 163,990$ 155,974$
Net pension liability (asset) - ending (a) - (b) (58,928)$ 13,748$ 27,227$ 23,676$ 11,262$ 29,781$ 22,279$ 27,942$
Plan fiduciary net position as a percentage of the
total pension liability 123.46% 94.39% 88.82% 89.93% 94.32% 84.40% 88.04% 84.81%
Covered payroll 30,065$ 30,100$ 28,664$ 27,788$ 27,922$ 28,322$ 28,510$ 28,203$
Net pension liability(asset) as a percentage
of covered payroll -196.00% 45.67% 94.99% 85.20% 40.33% 105.15% 78.14% 99.07%
* GASB Statement No. 68 requires ten years of information to be presented in this schedule; however, until a full 10-year trend is
compiled, the State will present information for those years for which information is available.
See accompanying independent auditor's report.
Judicial Retirement System (JRS)
Last Eight Fiscal Years as of June 30 *
(Expressed in Thousands)
154

STATE OF IOWA
Required Supplementary Information
Schedule of Contributions
2021 2020 2019 2018 2017
Statutorily required contribution 144,855$ 139,227$ 134,356$ 126,868$ 128,532$
Contributions in relation to
statutorily required contributions 144,855 139,227 134,356 126,868 128,532
Contribution deficiency (excess) -$ -$ -$ -$ -$
State's covered payroll 1,541,309$ 1,475,401$ 1,419,476$ 1,414,609$ 1,431,290$
Contributions as a percentage of
covered payroll 9.40% 9.44% 9.47% 8.97% 8.98%
2016 2015 2014 2013 2012
Statutorily required contribution 124,718$ 122,279$ 121,161$ 116,630$ 110,123$
Contributions in relation to
statutorily required contributions 124,718 122,279 121,161 116,630 110,123
Contribution deficiency (excess) -$ -$ -$ -$ -$
State's covered payroll 1,388,017$ 1,356,263$ 1,342,673$ 1,322,751$ 1,327,065$
Contributions as a percentage of
covered payroll 8.99% 9.02% 9.02% 8.82% 8.30%
See Notes to Required Supplementary Information - Schedules of Contributions.
See accompanying independent auditor's report.
Iowa Public Employees' Retirement System (IPERS)
Last Ten Fiscal Years as of June 30
(Expressed in Thousands)
155

STATE OF IOWA
Required Supplementary Information
Schedule of Contributions
2021 2020 2019 2018 2017
Actuarially determined contribution 22,996$ 19,378$ 19,403$ 20,306$ 17,746$
Actual employer contribution 22,711 22,364 21,840 21,498 17,274
Contribution deficiency (excess) 285$ (2,986)$ (2,437)$ (1,192)$ 472$
Covered payroll 47,869$ 46,931$ 45,514$ 44,589$ 42,212$
Contributions as a percentage of
covered payroll 47.45% 47.65% 47.99% 48.21% 40.92%
2016 2015 2014 2013 2012
Actuarially determined contribution 17,081$ 16,957$ 18,187$ 18,665$ 16,623$
Actual employer contribution 20,519 18,601 17,715 11,778 10,741
Contribution deficiency (excess) (3,438)$ (1,644)$ 472$ 6,887$ 5,882$
Covered payroll 47,028$ 43,873$ 43,845$ 43,621$ 42,965$
Contributions as a percentage of
covered payroll 43.63% 42.40% 40.40% 27.00% 25.00%
See Notes to Required Supplementary Information - Schedules of Contributions.
See accompanying independent auditor's report.
Peace Officers' Retirement, Accident and Disability System (PORS)
Last Ten Fiscal Years as of June 30
(Expressed in Thousands)
156

STATE OF IOWA
Required Supplementary Information
Schedule of Contributions
2021 2020 2019 2018 2017
Actuarially determined contribution 7,691$ 8,567$ 8,674$ 5,688$ 6,201$
Actual employer contribution 9,200 9,211 8,771 8,503 8,544
Contribution deficiency (excess) (1,509)$ (644)$ (97)$ (2,815)$ (2,343)$
Covered payroll 30,065$ 30,100$ 28,664$ 27,788$ 27,922$
Contributions as a percentage of
covered payroll 30.60% 30.60% 30.60% 30.60% 30.60%
2016 2015 2014 2013 2012
Actuarially determined contribution 6,667$ 7,709$ 8,376$ 8,445$ 8,364$
Actual employer contribution 8,667 8,724 8,630 8,232 8,216
Contribution deficiency (excess) (2,000)$ (1,015)$ (254)$ 213$ 148$
Covered payroll 28,322$ 28,510$ 28,203$ 26,903$ 26,849$
Contributions as a percentage of
covered payroll 30.60% 30.60% 30.60% 30.60% 30.60%
See Notes to Required Supplementary Information - Schedules of Contributions.
See accompanying independent auditor's report.
Judicial Retirement System (JRS)
Last Ten Fiscal Years as of June 30
(Expressed in Thousands)
157
STATE OF IOWA
Required Supplementary Information
Notes to Required Supplementary Information – Schedules of Contributions
A. Iowa Public Employees’ Retirement System (IPERS)
Changes of Benefit and Funding Terms
There are no significant changes in benefit terms.
Changes in Assumptions
Valuation date: July 1, 2018:
● Mortality assumption was changed to the family of RP-2014 Mortality Tables for all groups, with mortalityimprovements modeled using Scale MP-2017.
● Retirement rates for Regular members was lowered to better reflect actual experience. The Sheriffs andDeputies retirement assumption was modified to reflect lower retirement rates at younger ages. TheProtection Occupation retirement rates were modified both higher and lower across age ranges.
Valuation date: July 1, 2017:
● Decreased the inflation assumption from 3.00% to 2.60%.
● Decreased the assumed rate of interest on member accounts from 3.75% to 3.50% per year.
● Decreased the long-term rate of return assumption from 7.50% to 7.00%.
● Decreased the wage growth and payroll growth assumption from 4.00% to 3.25%.
● Decreased the salary increase assumption by 0.75%.
Valuation date: July 1, 2014:
● Decreased the inflation assumption from 3.25% to 3.00%.
● Decreased the assumed rate of interest on member accounts from 4.00% to 3.75% per year.
● Adjusted male mortality rates for retirees in the Regular membership group.
● Reduced retirement rates for sheriffs and deputies between the ages of 55 and 64.
● Moved from an open 30-year amortization period to a closed 30-year amortization period for the UALbeginning June 30, 2014. Each year thereafter, changes in the UAL from plan experience will be amortizedon a separate closed 20-year period.
B. Peace Officers’ Retirement, Accident and Disability System (PORS)
Valuation date: July 1, 2021
PORS is funded with fixed contribution rates for both the employee and employer (State). The actuarially determined contributions are calculated as of the beginning of the fiscal year in which contributions are reported.
The following actuarial methods and assumptions were used to determine the actuarially determined employer contribution reported for the fiscal year ended June 30, 2021 (based on the July 1, 2020 actuarial valuation):
● Actuarial cost method: Entry age normal
● Amortization method: Level percentage of payroll, closed
● Amortization period: 20 years
● Asset valuation method: 5-year-smoothed market
● Inflation: 2.50%
● Salary increase: 4.00% to 8.50%, including inflation
● Investment rate of return: 7.00% compounded annually, net of investment expense, including inflation
● Post-retirement adjustment: Pensions are adjusted by a percentage, which varies by type of retirement, ofthe change in the compensation of active members of the same rank. In addition, a dollar adjustment ismade which varies by a schedule based on the number of years since the member retired.
● Mortality: Pre-retirement mortality rates were based on the RP-2014 Total Dataset Mortality Table with aone-year age set-back for males and Generational Projection, using MP-2016. Post-retirement mortalityrates were based on the RP-2014 Total Dataset Mortality Table with a one-year age set-back for males andGenerational Projection, using MP-2016. Disability mortality rates were based on the RP-2014 Total atasetMortality Table with a four-year age set-forward for males and Generational Projection, using MP-2016.
158

STATE OF IOWA
Required Supplementary Information
Notes to Required Supplementary Information – Schedules of Contributions
Changes of Benefit and Funding Terms
The following changes to the plan provisions were made by the Iowa Legislature and are reflected in the valuation performed as of July 1 listed below:
2017: The State’s contribution rate increased from 35% to 37% of payroll. In May, 2016, legislation was signed which reduced the State’s supplemental contribution from $5.0 million to $2.5 million for fiscal year 2017.
2016: The State’s contribution rate increased from 33% to 35% of payroll.
2015: The State’s contribution rate increased from 31% to 33% of payroll. There was an increase in the reemployment limit for disability retirees under the age of 55. This change had no impact on the valuation results.
2014: The 2014 Legislature passed House File 2450 which provided that cancer and infectious disease, as defined in the bill, will be presumed to have been contracted while the member was on active duty as a result of that duty. The presumption means that such members will be eligible for an accidental disability benefit rather than an ordinary disability benefit. The member contribution rate increased from 10.85% to 11.35% of payroll. The House File also increased the member contribution rate 0.05% to cover the cost of the benefit change so the total member contribution rate is 11.40%. The State’s contribution rate increases from 29% to 31% of payroll, as scheduled by law.
2013: The member contribution rate increased from 10.35% to 10.85% of payroll and the State’s contribution rate increased from 27% to 29% of payroll.
2012: The member contribution rate increased from 9.85% to 10.35% of payroll and the State’s contribution rate increased from 25% to 27% of payroll. The first payment of the supplemental state appropriation of $5 million per year until PORS is 85% funded was delayed one year to fiscal year 2014.
Changes in Assumptions
July 1, 2020 valuation:
• The price inflation assumption was decreased from 2.75% to 2.50%.
• The productivity assumption was increased from 0.75% to 1.00%.
• The payroll growth assumption was decreased from 3.00% to 2.75%.
• The long-term investment return assumption was decreased from 7.50% to 7.00%.
July 1, 2017 valuation:
• The mortality assumption was changed to the RP-2014 Mortality Table, with a one-year age setback formales. Generational mortality improvements are modeled using the MP-2016 scale.
• Retirement rates were modified for employees with less than 30 years of service.
• Accidental and Ordinary Disability rates were adjusted to better reflect actual experience.
• Termination rates were adjusted to better reflect actual experience.
• The salary increase assumption was adjusted to better reflect actual experience.
• The amortization of the UAAL was changed to a “layered” approach with new pieces of the UAAL amortizedover a closed 20-year period, beginning with the July 1, 2018 valuation. The legacy UAAL (at July 1, 2017)continues to be amortized on its current schedule.
• The asset smoothing method was modified to recognize investment gains and losses over a five-year periodrather than four.
July 1, 2016 valuation:
• The price inflation assumption was decreased from 3.00% to 2.75%.
• The wage inflation assumption was decreased from 3.75% to 3.50%.
• The payroll growth assumption was decreased from 3.75% to 3.00%.
• The long-term investment return assumption was decreased from 8.00% to 7.50%.
159

STATE OF IOWA
Required Supplementary Information
Notes to Required Supplementary Information – Schedules of Contributions
July 1, 2014 valuation:
• The disability assumption was modified to assume a higher portion of total disabilities will be payable asaccidental disabilities as a result of a law passed which provides for a presumption of cancer and infectiousdiseases are contracted while on active duty.
July 1, 2012 valuation:
• The merit scale component of the salary increase assumption was increased for years of service less than20 and decreased for years of service more than 20.
• Retirement rates were changed to be age and service based instead of only age based. There are two setsof retirement rates, one if the member has less than 30 years of service and another if the member has 30or more years of service.
• Wage increase assumption for annual readjustment of pensions was lowered from 4.00% to 3.75%.
• Consumer price inflation was lowered from 3.50% to 3.00%.
• Economic productivity component of the general wage increase assumption was increased from 0.50% to0.75%.
C. Judicial Retirement System (JRS)
Valuation date: July 1, 2021
JRS is funded with fixed contribution rates for both the employee and employer (State). The actuarially determined contributions are calculated as of the beginning of the fiscal year in which contributions are reported.
The following actuarial methods and assumptions were used to determine the actuarially determined employer contribution reported for the fiscal year ended June 30, 2021 (based on the July 1, 2020 actuarial valuation):
● Actuarial cost method: Entry age normal
● Amortization method: Level dollar, closed
● Amortization period: Initial base established July 1, 2009, over a closed 25-year period. A new base isestablished in each subsequent year equal to the difference in actual versus expected experience. The newbase is amortized over a new, closed 25-year period commencing on the date it is established.
● Asset valuation method: 75% expected value plus 25% market value
● Inflation: 2.60%
● Salary increase: 3.75% including inflation
● Investment rate of return: 6.75% compounded annually, net of investment expense, including inflation
● Mortality: RP-2014 White Collar Mortality Tables with a two-year age setback and generational improvements using MP-2017.
Changes of Benefit and Funding Terms
The following changes to the plan provisions were made by the Iowa Legislature and are reflected in the valuation performed as of July 1 listed below:
2018: Effective January 1, 2018, a judge must be 62 years of age or older at the time a judge assumes senior
status. Senior judges may only serve for a total of six years and shall cease holding office upon reaching age 78. These requirements do not apply to judges who have 20 years of service prior to January 1, 2018.
160

STATE OF IOWA
Required Supplementary Information
Notes to Required Supplementary Information – Schedules of Contributions
Changes in Assumptions
July 1, 2018 valuation:
• Decreased the inflation assumption from 3.00% to 2.60%.
• Decreased the long-term investment return assumption from 7.50% to 6.75%.
• Decreased the salary increase assumption from 4.25% to 3.75%.
• Decreased the Senior Judge benefit adjustment from 3.1875% to 3.00%.
• Adopted an explicit assumption of the annual administrative expense.
• Changed the mortality assumption to the RP-2014 White Collar Mortality Tables with a two-year age setbackand generational improvements using MP-2017.
July 1, 2013 valuation:
• Decreased the salary increase assumption from 4.50% to 4.25%.
• Increased retirement rates to reflect earlier retirement ages.
• The assumption that retiring judges will elect Senior Judge Status was changed from an 80% election, with50% relinquishing at age 74 to an 80% election, with 60% relinquishing after 6 years if before 78.
• The adjustment to Senior Judge’s benefit was reduced to reflect the change in the salary increaseassumption.
161

STATE OF IOWA
Required Supplementary Information
Schedule of Changes in Total OPEB Liability and Related Ratios
2021 2020 2019 2018
Total OPEB liability
Service cost 17,256$ 13,491$ 12,374$ 12,964$
Interest 4,929 7,244 7,448 6,520
Differences between expected & actual experience (5,897) (6,842) - (1,066)
Changes in assumptions (3,067) 10,426 4,773 2,642
Change in proportion - - - (23)
Benefit payments - implicit subsidy (12,356) (11,338) (11,073) (9,191)
Net change in total OPEB liability 865 12,981 13,522 11,846
Total OPEB liability - beginning 212,055 199,074 185,552 173,706
Total OPEB liability - ending 212,920$ 212,055$ 199,074$ 185,552$
Covered payroll 1,407,753$ 1,365,553$ 1,249,303$ 1,254,711$
Total OPEB liability as a percentage of covered payroll 15.12% 15.53% 15.93% 14.79%
* GASB Statement No. 75 requires ten years of information to be presented in this schedule; however, until a full
10-year trend is compiled, the State will present information for those years for which information is available.
See Notes to Required Supplementary Information - Schedules of Changes in Total OPEB Liability and Related Ratios.
See accompanying independent auditor's report.
State Plan
Last Four Fiscal Years as of June 30 *
(Expressed in Thousands)
162

STATE OF IOWA
Required Supplementary Information
Schedule of Changes in Total OPEB Liability and Related Ratios
U of I ISU UNI U of I ISU UNI
Total OPEB liability
Service cost 7,028$ 5,470$ 1,123$ 3,860$ 6,714$ 1,769$
Interest 6,214 2,052 427 5,604 3,382 885
Differences between expected
& actual experience (181) (22,902) (267) 4,430 (24,818) (10,479)
Changes in assumptions 27,290 3,243 (3,537) 26,867 2,251 (74)
Changes in benefit terms - - - - - -
Benefit payments (11,931) (5,669) (549) (10,497) (5,571) (711)
Net change in total OPEB liability 28,420 (17,806) (2,803) 30,264 (18,042) (8,610)
Total OPEB liability - beginning 176,421 60,279 15,193 146,157 78,321 23,803
Total OPEB liability - ending 204,841$ 42,473$ 12,390$ 176,421$ 60,279$ 15,193$
Covered payroll 1,384,343$ 462,527$ 162,977$ 1,384,343$ 465,055$ 171,815$
Total OPEB liability as a percentage
of covered payroll 14.80% 9.18% 7.60% 12.74% 12.96% 8.84%
U of I ISU UNI U of I ISU UNI
Total OPEB liability
Service cost 4,193$ 7,335$ 1,767$ 33,734$ 6,464$ 1,690$
Interest 4,971 3,084 980 18,168 2,868 807
Differences between expected
& actual experience 1 (7,719) (3,327) 48,567 3,076 -
Changes in assumptions (13,968) (3,800) 1,091 (95,303) 6,260 779
Changes in benefit terms 21,519 - - (465,008) - -
Benefit payments (10,394) (5,713) (533) (8,001) (4,654) (600)
Net change in total OPEB liability 6,322 (6,813) (22) (467,843) 14,014 2,676
Total OPEB liability - beginning 139,835 85,134 23,825 607,678 71,120 21,149
Total OPEB liability - ending 146,157$ 78,321$ 23,803$ 139,835$ 85,134$ 23,825$
Covered payroll 1,308,289$ 457,651$ 172,925$ 1,291,758$ 443,245$ 169,533$
Total OPEB liability as a percentage
of covered payroll 11.17% 17.11% 13.76% 10.83% 19.21% 14.05%
* GASB Statement No. 75 requires ten years of information to be presented in this schedule; however, until a full
10-year trend is compiled, the State will present information for those years for which information is available.
See Notes to Required Supplementary Information - Schedules of Changes in Total OPEB Liability and Related Ratios.
See accompanying independent auditor's report.
20202021
University Plans
Last Four Fiscal Years as of June 30 *
(Expressed in Thousands)
2019 2018
163

STATE OF IOWA
Required Supplementary Information
Notes to Required Supplementary Information – Schedules of Changes in Total OPEB Liability and Related Ratios
A. State Plan
No assets are accumulated in a trust that meets the criteria in paragraph 4, of GASB No. 75.
Changes in Assumptions
2021:
● Decreased the discount rate from 2.21% to 2.16%.
● Updated medical claims costs based on recent experience.
● Updated annual medical trend rates based on recent experience and future expectations.2020:
● Decreased the discount rate from 3.50% to 2.21%.
● Updated medical claims costs and premiums based on recent experience.
● Updated annual medical trend rates based on industry observations and the current SOA-Getzen model.
● Updated mortality assumptions and the salary scale to be consistent with the assumptions used in theJune 30, 2019 IPERS actuarial valuation.
2019:
● Decreased the discount rate from 3.87% to 3.50%.
2018:
● Increased the discount rate from 3.58% to 3.87%.
● Decreased the inflation rate from 3.00% to 2.6%.
B. University Plans
No assets are accumulated in a trust that meets the criteria in paragraph 4, of GASB No. 75.
Changes of Benefit and Funding Terms
2020:
ISU:
• An eligibility cut-off date for life insurance has been implemented such that only employees retiring priorto July 1, 2020, are eligible for life insurance coverage. The impact of this change is a decrease in liabilities.
• An eligibility cut-off date for long-term disability has been implemented such that only employees approvedfor LTD and participating in the subsidy program prior to July 1, 2020 are eligible for LTD coverage. Theimpact of this change is a decrease in liabilities.
• A new Retirement Incentive Option Program has been implemented for fiscal year 2020/21, which includesthree options that provide retirees with a one-time, up-front payout of pension-related employercontributions, medical/dental coverage, or a combination of both. As part of this change, the retirementrates for FY 2020/21 only have been increased by 133% to reflect expected increased retirements in2020/21. The impact of these changes is an increase in liabilities.
• The Affordable Care Act Excise Tax was repealed in December 2019, so this valuation no longer reflects anyliabilities associated with the Tax. The impact of this change is a slight decrease in liabilities.
2018:
U of I:
● Implemented a cap on the University’s contribution for retiree health at the current $288 per month forcurrent and future retirees.
164

STATE OF IOWA
Required Supplementary Information
Notes to Required Supplementary Information – Schedules of Changes in Total OPEB Liability and Related Ratios
Changes in Assumptions
2021:
U of I:
• Decreased the discount rate from 3.50% to 2.21%.
• Removed the impact of the excise tax on high cost plans from future medical trend rate assumptions.ISU:
• Decreased the discount rate from 3.26% to 2.12%.
UNI:
• Decreased the discount rate from 2.66 to 2.19%.
2020:
U of I:
• Decreased the discount rate from 3.58% to 3.50%.
• Changed the mortality assumption for healthy lives from the RP-2014 Aggregate Mortality Table projectedusing Scale MP-2016 to the Pub-2010 Aggregate Mortality Table projected using Scale MP-2018, and fordisabled lives from the CIA 1988-94 LTD Table to the Pub-2010 Disabled Mortality Table projected usingScale MP-2018.
• Updated the healthcare trend rates to a schedule of rates beginning at 6.65% in 2019, grading down to4.50% in 2028 and beyond for pre-65 participants and 7.61% in 2019 grading down to 4.50% in 2029 andbeyond for post-65 participants.
• Changed the marginal cost adjustment factors for pre-65 participants from 60.10% to 62.90% and for post-65 participants from 87.60% to 89.50%.
• Updated the impact of the excise tax on high cost plans based on current claims and medical trendassumptions.
ISU:
• Decreased the discount rate from 4.11% to 3.26%.
• Changed the mortality assumption for actives and healthy retirees from the RPH-2017 Total DatasetMortality Table fully generational using Scale MP-2017 to Pub-2010 General Headcount Weighted MortalityTable fully generational using Scale MP-2019, for surviving spouses from the RPH-2017 Total DatasetMortality Table fully generational using Scale MP-2017 to Pub-2010 Contingent Survivor HeadcountWeighted Mortality Table fully generational using Scale PM-2019, and for disabled retirees from the RPH-2017 Disabled Retiree Mortality Table fully generational using Scale MP-2017 set forward 10 years to Pub-2010 Non-Safety Disabled Retiree Headcount Weighted Mortality Table fully generational using Scale MP-2019 .
• Medical trend rates have been set to an initial rate of 8.00% decreasing by 0.50% annually to an ultimaterate of 4.50%.
UNI:
• Decreased the discount rate from 3.51% to 2.66%.
• Changed the mortality assumption from the RPH-2017 Total Dataset Mortality Table fully generationalusing Scale MP-2017 to Pub-2010 General Total Dataset Headcount Weighted Mortality Table fullygenerational using Scale MP-2019 for non-faculty employees and retirees, to Pub-2010 Teachers TotalDataset Headcount Weighted Mortality Table fully generational using Scale MP-2019 for faculty employeesand retirees, and to Pub-2010 Contingent Survivor Total Dataset Headcount Weighted Mortality Table fullygenerational using Scale MP-2019 for surviving spouses.
• Updated the termination and retirement rates to follow the actuarial assumptions from the IPERS actuarialvaluation as of June 30, 2019.
• Medical trend rates have been set to an initial rate of 8.00% decreasing by 0.50% annually to an ultimaterate of 4.50%.
165

STATE OF IOWA
Required Supplementary Information
Notes to Required Supplementary Information – Schedules of Changes in Total OPEB Liability and Related Ratios
2019:
U of I:
• Increased the discount rate from 3.58% to 3.87%.
• Changed the Merit employees demographic assumptions from State to University assumptions.
ISU:
• Increased the discount rate from 3.44% to 4.11%.
UNI:
• Decreased the discount rate from 3.87% to 3.51%.
2018:
U of I:
• Decreased the discount rate from 6.75% to 3.58%.
• Changed the withdrawal rates for staff to better anticipate future experience.
• Changed the mortality assumption from the RP-2014 Aggregate Mortality Table projected using Scale MP-2014 to the RP-2014 Aggregate Mortality Table projected using Scale MP-2016.
• Changed the healthcare trend rate for pre-65 participants to 7.55% in 2017 grading down to 4.50% in 2026and for post-65 participants to 9.17% in 2017 grading down to 4.50% in 2026.
• Changed the marginal cost adjustment factors for pre-65 participants from 59.40% to 60.10% and for post-65 participants from 86.80% to 87.60%.
• Updated the impact of the excise tax on high cost plans based on current claims and medical trendassumptions.
ISU:
• Decreased the discount rate from 3.78% to 3.44%.
• Reset medical trend rates to an initial rate of 9.00% decreasing by 0.50% to an ultimate rate of 5.00%.
• Updated the mortality assumption to RPH-2017 Total Dataset Mortality Table fully generational using ScaleMP-2017.
• Updated the excise tax threshold trend rate from 3.0% starting in 2020 to 3.50% in 2022 and 2.50%subsequently.
UNI:
• Increased the discount rate from 3.58% to 3.87%.
• Increased the healthcare trend rate for pre-65 participants to an initial 9.00% grading down to 4.50% andreset the rate for post-65 participants to an initial 6.50% grading down to 4.50%.
• Updated the mortality assumption to RPH-2017 Total Dataset Mortality Table fully generational using ScaleMP-2017.
• Updated the healthcare coverage election rate for pre-65 retirees to 45.00% from 65.00%.
166

S U P P L E M E N T A R Y
I N F O R M A T I O N
167

STATE OF IOWA
Combining Balance Sheet
Nonmajor Governmental Funds - By Fund Type
June 30, 2021
(Expressed in Thousands)
TOTAL
SPECIAL CAPITAL NONMAJOR
REVENUE PROJECTS PERMANENT GOVERNMENTAL
FUNDS FUNDS FUNDS FUNDS
ASSETS
Current assets:
Cash & investments 101,803$ 22,812$ 16,180$ 140,795$
Accounts receivable (net) 50,360 584 - 50,944
Loans receivable (net) 95 - - 95
Due from other funds 910 1,577 - 2,487
Inventory 192 - - 192
Prepaid expenditures 318 - - 318
Total current assets 153,678 24,973 16,180 194,831
Noncurrent assets:
Accounts receivable (net) 311 - 30 341
TOTAL ASSETS 153,989$ 24,973$ 16,210$ 195,172$
LIABILITIES
Current liabilities:
Accounts payable & accruals 2,887$ 1,786$ -$ 4,673$
Due to other funds 19,930 17,267 - 37,197
Unearned revenue 169 531 - 700
Total current liabilities 22,986 19,584 - 42,570
Noncurrent liabilities:
Accounts payable & accruals 1,891 - - 1,891
TOTAL LIABILITIES 24,877 19,584 - 44,461
DEFERRED INFLOWS OF RESOURCES
Deferred revenue 9,827 491 30 10,348
Unconditional remainder interest 146 - - 146
TOTAL DEFERRED INFLOWS OF
RESOURCES 9,973 491 30 10,494
FUND BALANCES
Nonspendable 510 - 16,150 16,660
Spendable:
Restricted 83,387 - 30 83,417
Committed 35,257 4,933 - 40,190
Unassigned (15) (35) - (50)
TOTAL FUND BALANCES 119,139 4,898 16,180 140,217
TOTAL LIABILITIES, DEFERRED
INFLOWS OF RESOURCES &
FUND BALANCES 153,989$ 24,973$ 16,210$ 195,172$
168

STATE OF IOWA
Combining Statement of Revenues, Expenditures and Changes in Fund Balances
Nonmajor Governmental Funds - By Fund Type
TOTAL
SPECIAL CAPITAL NONMAJOR
REVENUE PROJECTS PERMANENT GOVERNMENTAL
FUNDS FUNDS FUNDS FUNDS
REVENUES
Receipts from other entities 11,108$ 2,440$ -$ 13,548$
Investment income 9,075 - - 9,075
Fees, licenses & permits 124,652 - - 124,652
Refunds & reimbursements 5,781 8 - 5,789
Sales, rents & services 5,644 - - 5,644
Miscellaneous 28,813 - 609 29,422
GROSS REVENUES 185,073 2,448 609 188,130
Less revenue refunds 3,825 - - 3,825
NET REVENUES 181,248 2,448 609 184,305
EXPENDITURES
Current:
Administration & regulation 31,116 9 - 31,125
Education 19,359 - - 19,359
Health & human rights 353 - - 353
Human services 254 - - 254
Justice & public defense 1,578 - - 1,578
Transportation 73 - - 73
Agriculture & natural resources 1,579 8,022 - 9,601
Capital outlay:
Administration & regulation 3 3,057 - 3,060
Education 33 - - 33
Health & human rights 6 6,372 - 6,378
Human services - 559 - 559
Justice & public defense 198 1,162 - 1,360
Transportation 3,935 - - 3,935
Agriculture & natural resources - 7,209 - 7,209
TOTAL EXPENDITURES 58,487 26,390 - 84,877
EXCESS (DEFICIENCY) OF REVENUES
OVER (UNDER) EXPENDITURES 122,761 (23,942) 609 99,428
OTHER FINANCING SOURCES (USES)
Transfers in 1,116 25,197 - 26,313
Transfers out (92,255) (748) - (93,003)
TOTAL OTHER FINANCING SOURCES (USES) (91,139) 24,449 - (66,690)
NET CHANGE IN FUND BALANCES 31,622 507 609 32,738
FUND BALANCES - JULY 1 87,517 4,391 15,571 107,479
FUND BALANCES - JUNE 30 119,139$ 4,898$ 16,180$ 140,217$
For the Year Ended June 30, 2021
(Expressed in Thousands)
169
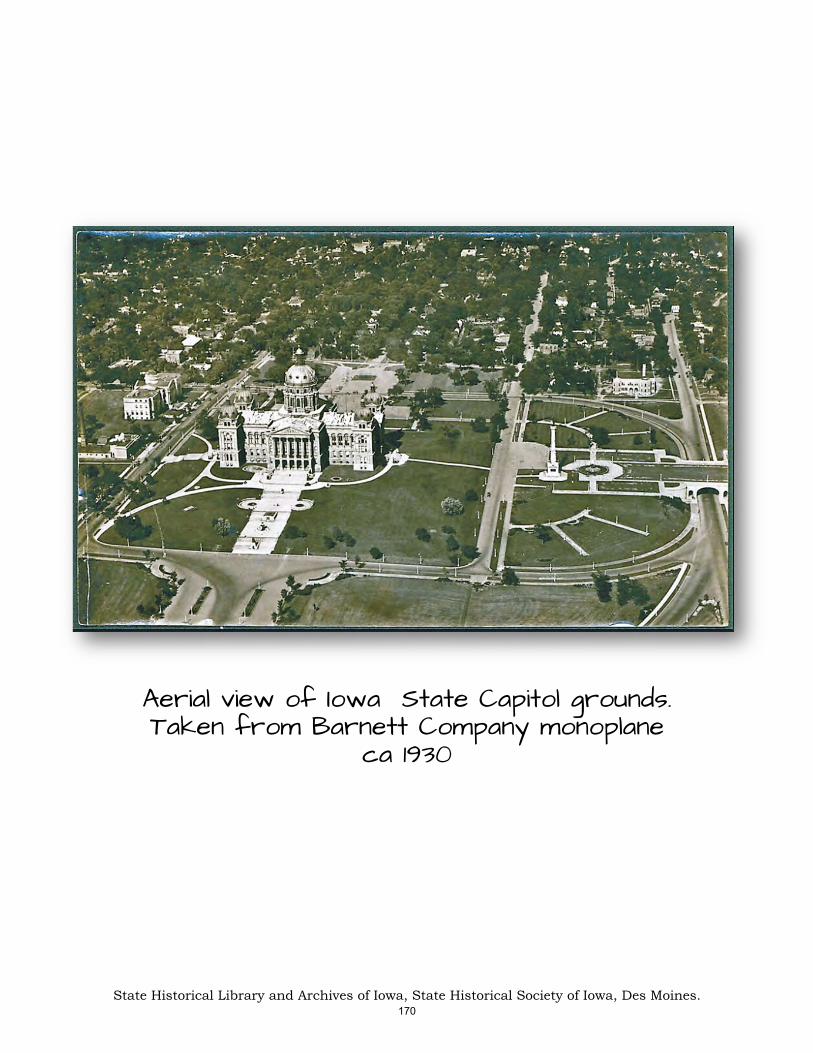
Aerial view of Iowa State Capitol grounds.Taken from Barnett Company monoplane
ca 1930
State Historical Library and Archives of Iowa, State Historical Society of Iowa, Des Moines.
170

COMBINING FINANCIAL STATEMENTS
Nonmajor Special Revenue Funds
Special Revenue Funds are used to account for specific revenues that arelegally restricted to expenditure for particular purposes.
Guaranty Agency Operating fund receives collections on defaulted studentloans, default aversion fees, account maintenance fees and interest to pay forthe operating of the Iowa guaranteed loan program.
Hospital Health Care Access Trust Fund receives hospital health care accessassessments imposed by Chapter 249M of the Code of Iowa. These funds areto be used to reimburse participating hospitals the medical assistanceprogram upper payment limit for inpatient and outpatient hospital services.Following payment of such upper payment limit to participating hospitals, anyremaining funds on an annual basis may be used for any of the followingpurposes: (a) to support medical assistance program utilization shortfalls, (b)to maintain the state's capacity to provide access to and delivery of services forvulnerable Iowans, (c) to fund the health care workforce support initiative, (d)to support access to health care services for uninsured Iowans, and (e) tosupport Iowa hospital programs and services which expand access to healthcare services for Iowans.
Quality Assurance Trust Fund receives nursing facility quality assuranceassessments imposed by Chapter 249L of the Code of Iowa. These funds areto be used for reimbursement of services for which federal financialparticipation under the medical assistance program is available to match statefunds.
Iowa PBS Foundation is a non-profit corporation that solicits and managesgifts of money and property for Iowa PBS.
Other Special Revenue Funds are aggregated for reporting purposes andaccount for various other revenues which must be used for specific purposes.
171
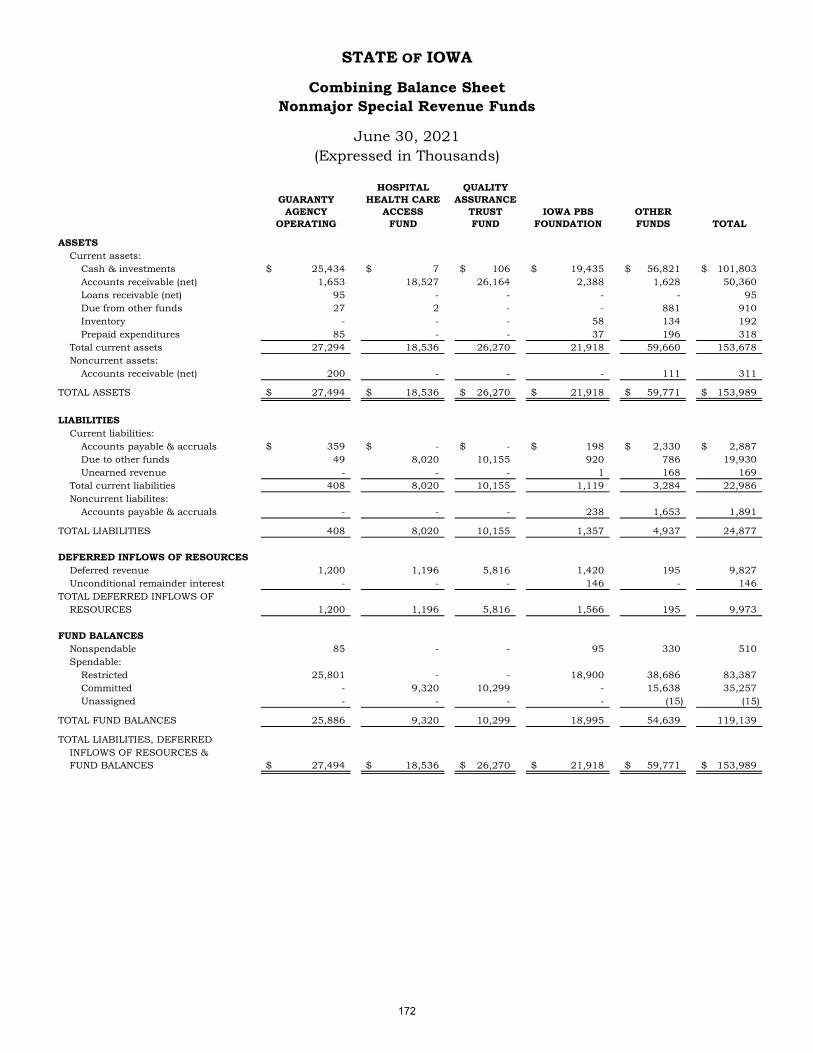
STATE OF IOWA
Combining Balance Sheet
Nonmajor Special Revenue Funds
June 30, 2021
(Expressed in Thousands)
HOSPITAL QUALITY
GUARANTY HEALTH CARE ASSURANCE
AGENCY ACCESS TRUST IOWA PBS OTHER
OPERATING FUND FUND FOUNDATION FUNDS TOTAL
ASSETS
Current assets:
Cash & investments 25,434$ 7$ 106$ 19,435$ 56,821$ 101,803$
Accounts receivable (net) 1,653 18,527 26,164 2,388 1,628 50,360
Loans receivable (net) 95 - - - - 95
Due from other funds 27 2 - - 881 910
Inventory - - - 58 134 192
Prepaid expenditures 85 - - 37 196 318
Total current assets 27,294 18,536 26,270 21,918 59,660 153,678
Noncurrent assets:
Accounts receivable (net) 200 - - - 111 311
TOTAL ASSETS 27,494$ 18,536$ 26,270$ 21,918$ 59,771$ 153,989$
LIABILITIES
Current liabilities:
Accounts payable & accruals 359$ -$ -$ 198$ 2,330$ 2,887$
Due to other funds 49 8,020 10,155 920 786 19,930
Unearned revenue - - - 1 168 169
Total current liabilities 408 8,020 10,155 1,119 3,284 22,986
Noncurrent liabilites:
Accounts payable & accruals - - - 238 1,653 1,891
TOTAL LIABILITIES 408 8,020 10,155 1,357 4,937 24,877
DEFERRED INFLOWS OF RESOURCES
Deferred revenue 1,200 1,196 5,816 1,420 195 9,827
Unconditional remainder interest - - - 146 - 146
TOTAL DEFERRED INFLOWS OF
RESOURCES 1,200 1,196 5,816 1,566 195 9,973
FUND BALANCES
Nonspendable 85 - - 95 330 510
Spendable:
Restricted 25,801 - - 18,900 38,686 83,387
Committed - 9,320 10,299 - 15,638 35,257
Unassigned - - - - (15) (15)
TOTAL FUND BALANCES 25,886 9,320 10,299 18,995 54,639 119,139
TOTAL LIABILITIES, DEFERRED
INFLOWS OF RESOURCES &
FUND BALANCES 27,494$ 18,536$ 26,270$ 21,918$ 59,771$ 153,989$
172

STATE OF IOWA
Combining Statement of Revenues, Expenditures and Changes in Fund Balances
Nonmajor Special Revenue Funds
HOSPITAL QUALITY
GUARANTY HEALTH CARE ASSURANCE
AGENCY ACCESS TRUST IOWA PBS OTHER
OPERATING FUND FUND FOUNDATION FUNDS TOTAL
REVENUES
Receipts from other entities 4,969$ -$ -$ -$ 6,139$ 11,108$
Investment income 11 6 7 5,394 3,657 9,075
Fees, licenses & permits - 42,121 56,743 - 25,788 124,652
Refunds & reimbursements 1,680 - - - 4,101 5,781
Sales, rents & services - - - - 5,644 5,644
Miscellaneous - - - 11,133 17,680 28,813
GROSS REVENUES 6,660 42,127 56,750 16,527 63,009 185,073
Less revenue refunds - - - - 3,825 3,825
NET REVENUES 6,660 42,127 56,750 16,527 59,184 181,248
EXPENDITURES
Current:
Administration & regulation - - - - 31,116 31,116
Education 8,169 - - 4,004 7,186 19,359
Health & human rights - - - - 353 353
Human services - - - - 254 254
Justice & public defense - - - - 1,578 1,578
Transportation - - - - 73 73
Agriculture & natural resources - - - - 1,579 1,579
Capital outlay:
Administration & regulation - - - - 3 3
Education 33 - - - - 33
Health & human rights - - - - 6 6
Justice & public defense - - - - 198 198
Transportation - - - - 3,935 3,935
TOTAL EXPENDITURES 8,202 - - 4,004 46,281 58,487
EXCESS (DEFICIENCY) OF REVENUES
OVER (UNDER) EXPENDITURES (1,542) 42,127 56,750 12,523 12,903 122,761
OTHER FINANCING SOURCES (USES)
Transfers in 73 - - - 1,043 1,116
Transfers out (299) (33,921) (46,615) (6,037) (5,383) (92,255)
TOTAL OTHER FINANCING SOURCES
(USES) (226) (33,921) (46,615) (6,037) (4,340) (91,139)
NET CHANGE IN FUND BALANCES (1,768) 8,206 10,135 6,486 8,563 31,622
FUND BALANCES - JULY 1 27,654 1,114 164 12,509 46,076 87,517
FUND BALANCES - JUNE 30 25,886$ 9,320$ 10,299$ 18,995$ 54,639$ 119,139$
For the Year Ended June 30, 2021
(Expressed in Thousands)
173

Aerial view of Iowa State Capitol groundsfrom Northwest of State Capitol Building.
March 1948
State Historical Library and Archives of Iowa, State Historical Society of Iowa, Des Moines.
174

STATE OF IOWACombining Schedule of Revenues, Expenditures and Changes in Fund Balances
Budget and Actual - Budgetary Basis
Nonmajor Special Revenue Funds
ORIGINAL FINAL FINAL TO ORIGINAL FINAL FINAL TO
BUDGET BUDGET ACTUAL ACTUAL BUDGET BUDGET ACTUAL ACTUAL
APPROPRIATED REVENUE:
Transfers 372,607$ 631,067$ 774,802$ 143,735$ 203$ 203$ 686$ 483$
RECEIPTS CREDITED TO APPROPRIATIONS:
Beer tax - - - - - - - -
Cigarette tax - - - - - - - -
Tobacco products tax - - - - - - - -
Liquor tax - - - - - - - -
Other taxes - - - - - - - -
Wagering tax receipts - - - - - - - -
Individual income tax quarterly - - - - - - - -
Federal support 586,000 591,000 540,786 (50,214) 15,000 15,000 17,161 2,161
Local governments 10,952 10,952 12,926 1,974 - - - -
Other states 79,705 80,704 29,053 (51,651) - - - -
Reimbursements from other agencies - - - - 5 5 104 99
Governmental fund type transfers from other agencies 150,872 145,872 146,309 437 10 10 500 490
Interest - - - - 150 150 42 (108)
Bonds & loans 12,411 12,411 2,720 (9,691) - - - -
Fees, licenses & permits 1,700 5,700 5,405 (295) 35,700 35,700 36,304 604
Refunds & reimbursements - - - - 400 400 380 (20)
Sale of real estate 2,100 2,335 854 (1,481) - - 211 211
Sale of equipment & salvage - - - - 2 2 2 -
Rents & leases 15 15 - (15) 500 500 443 (57)
Agricultural sales - - - - 75 75 329 254
Other sales & services - - - - 1,000 1,000 576 (424)
Unearned receipts - - (1) (1) 265 265 429 164
Income tax checkoffs - - - - 150 150 182 32
Other 68,107 70,807 (3,126) (73,933) 1,540 1,540 404 (1,136)
TOTAL APPROPRIATED RECEIPTS 911,862 919,796 734,926 (184,870) 54,797 54,797 57,067 2,270
TOTAL REVENUES AVAILABLE 1,284,469 1,550,863 1,509,728 (41,135) 55,000 55,000 57,753 2,753
EXPENDITURES:
Administration & regulation - - - - - - - -
Agriculture & natural resources - - - - - - - -
Economic development - - - - - - - -
Education - - - - - - - -
Health & human services - - - - - - - -
Transportation 799,476 1,266,488 1,213,306 53,182 - - - -
Judicial - - - - - - - -
TOTAL EXPENDITURES 799,476 1,266,488 1,213,306 53,182 - - - -
TRANSFERS 484,993 358,266 395,300 (37,034) 62,274 62,274 55,639 6,635
TOTAL EXPENDITURES & TRANSFERS 1,284,469 1,624,754 1,608,606 16,148 62,274 62,274 55,639 6,635
REVENUES AVAILABLE OVER (UNDER)
EXPENDITURES & TRANSFERS - (73,891) (98,878) (24,987) (7,274) (7,274) 2,114 9,388
FUND BALANCES - JULY 1 (BUDGETARY) - 274,011 274,011 - 11,595 16,647 16,647 -
FUND BALANCES - JUNE 30 (BUDGETARY) -$ 200,120$ 175,133$ (24,987)$ 4,321$ 9,373$ 18,761$ 9,388$
(continued on next page)
For the Year Ended June 30, 2021
(Expressed in Thousands)
PRIMARY ROAD FUND FISH AND GAME TRUST FUND
175

STATE OF IOWACombining Schedule of Revenues, Expenditures and Changes in Fund Balances
Budget and Actual - Budgetary Basis
Nonmajor Special Revenue Funds
ORIGINAL FINAL FINAL TO ORIGINAL FINAL FINAL TO
BUDGET BUDGET ACTUAL ACTUAL BUDGET BUDGET ACTUAL ACTUAL
APPROPRIATED REVENUE:
Transfers 42,000$ 42,000$ 42,000$ -$ -$ -$ -$ -$
RECEIPTS CREDITED TO APPROPRIATIONS:
Beer tax - - - - - - - -
Cigarette tax - - - - 173,630 173,630 172,592 (1,038)
Tobacco products tax - - - - 32,310 32,310 32,023 (287)
Liquor tax - - - - - - - -
Other taxes - - - - - - - -
Wagering tax receipts - - - - - - - -
Individual income tax quarterly - - - - - - - -
Federal support - - - - - - - -
Local governments - - - - - - - -
Other states - - - - - - - -
Reimbursements from other agencies - - - - - - - -
Governmental fund type transfers from other agencies - - - - - - - -
Interest - - - - 130 130 73 (57)
Bonds & loans - - - - - - - -
Fees, licenses & permits - - - - - - - -
Refunds & reimbursements 109 109 655 546 - - - -
Sale of real estate - - - - - - - -
Sale of equipment & salvage - - - - - - - -
Rents & leases - - - - - - - -
Agricultural sales - - - - - - - -
Other sales & services - - - - - - - -
Unearned receipts - - - - - - - -
Income tax checkoffs - - - - - - - -
Other - - 2 2 - - - -
TOTAL APPROPRIATED RECEIPTS 109 109 657 548 206,070 206,070 204,688 (1,382)
TOTAL REVENUES AVAILABLE 42,109 42,109 42,657 548 206,070 206,070 204,688 (1,382)
EXPENDITURES:
Administration & regulation 11,848 12,734 13,024 (290) * - - - -
Agriculture & natural resources - - - - - - - -
Economic development - - - - - - - -
Education - - - - - - - -
Health & human services - - - - - - - -
Transportation - - - - - - - -
Judicial - - - - - - - -
TOTAL EXPENDITURES 11,848 12,734 13,024 (290) - - - -
TRANSFERS 33,471 33,545 29,901 3,644 208,460 208,460 204,900 3,560
TOTAL EXPENDITURES & TRANSFERS 45,319 46,279 42,925 3,354 208,460 208,460 204,900 3,560
REVENUES AVAILABLE OVER (UNDER)
EXPENDITURES & TRANSFERS (3,210) (4,170) (268) 3,902 (2,390) (2,390) (212) 2,178
FUND BALANCES - JULY 1 (BUDGETARY) 4,681 13,935 13,935 - 3,255 3,596 3,596 -
FUND BALANCES - JUNE 30 (BUDGETARY) 1,471$ 9,765$ 13,667$ 3,902$ 865$ 1,206$ 3,384$ 2,178$
(continued on next page)
ENVIRONMENT FIRST FUND HEALTH CARE TRUST FUND
For the Year Ended June 30, 2021
(Expressed in Thousands)(continued)
176

STATE OF IOWACombining Schedule of Revenues, Expenditures and Changes in Fund Balances
Budget and Actual - Budgetary Basis
Nonmajor Special Revenue Funds
ORIGINAL FINAL FINAL TO ORIGINAL FINAL FINAL TO
BUDGET BUDGET ACTUAL ACTUAL BUDGET BUDGET ACTUAL ACTUAL
APPROPRIATED REVENUE:
Transfers 50,425$ 67,816$ 69,472$ 1,656$ 465,235$ 741,086$ 886,960$ 145,874$
RECEIPTS CREDITED TO APPROPRIATIONS:
Beer tax 110 110 219 109 110 110 219 109
Cigarette tax - - - - 173,630 173,630 172,592 (1,038)
Tobacco products tax - - - - 32,310 32,310 32,023 (287)
Liquor tax 175 225 293 68 175 225 293 68
Other taxes 9,222 9,223 2,587 (6,636) 9,222 9,223 2,587 (6,636)
Wagering tax receipts - - 6,092 6,092 - - 6,092 6,092
Individual income tax quarterly 6,000 6,000 6,000 - 6,000 6,000 6,000 -
Federal support 4,324 4,824 4,803 (21) 605,324 610,824 562,750 (48,074)
Local governments 7,145 6,095 7,013 918 18,097 17,047 19,939 2,892
Other states - - - - 79,705 80,704 29,053 (51,651)
Reimbursements from other agencies 3,115 3,115 4,317 1,202 3,120 3,120 4,421 1,301
Governmental fund type transfers from other agencies 3,247 3,257 15,659 12,402 154,129 149,139 162,468 13,329
Interest 1,583 1,583 378 (1,205) 1,863 1,863 493 (1,370)
Bonds & loans 1,164 1,164 1,560 396 13,575 13,575 4,280 (9,295)
Fees, licenses & permits 104,956 105,166 92,819 (12,347) 142,356 146,566 134,528 (12,038)
Refunds & reimbursements 6,792 6,827 7,949 1,122 7,301 7,336 8,984 1,648
Sale of real estate - - 1 1 2,100 2,335 1,066 (1,269)
Sale of equipment & salvage 50 60 30 (30) 52 62 32 (30)
Rents & leases - - - - 515 515 443 (72)
Agricultural sales - - - - 75 75 329 254
Other sales & services 408 408 432 24 1,408 1,408 1,008 (400)
Unearned receipts 101 101 133 32 366 366 561 195
Income tax checkoffs - - - - 150 150 182 32
Other 226 226 223 (3) 69,873 72,573 (2,497) (75,070) - - -
TOTAL APPROPRIATED RECEIPTS 148,618 148,384 150,508 2,124 1,321,456 1,329,156 1,147,846 (181,310)
TOTAL REVENUES AVAILABLE 199,043 216,200 219,980 3,780 1,786,691 2,070,242 2,034,806 (35,436)
EXPENDITURES:
Administration & regulation 24,766 27,676 24,274 3,402 36,614 40,410 37,298 3,112
Agriculture & natural resources 18,059 18,059 14,268 3,791 18,059 18,059 14,268 3,791
Economic development 31,375 36,077 42,304 (6,227) * 31,375 36,077 42,304 (6,227)
Education 8,618 8,618 8,373 245 8,618 8,618 8,373 245
Health & human services 25 25 - 25 25 25 - 25
Transportation 2,003 4,202 5,002 (800) * 801,479 1,270,690 1,218,308 52,382
Judicial 11,185 9,708 9,982 (274) * 11,185 9,708 9,982 (274)
TOTAL EXPENDITURES 96,031 104,365 104,203 162 907,355 1,383,587 1,330,533 53,054
TRANSFERS 127,328 130,204 99,193 31,011 916,526 792,749 784,933 7,816
TOTAL EXPENDITURES & TRANSFERS 223,359 234,569 203,396 31,173 1,823,881 2,176,336 2,115,466 60,870
REVENUES AVAILABLE OVER (UNDER)
EXPENDITURES & TRANSFERS (24,316) (18,369) 16,584 34,953 (37,190) (106,094) (80,660) 25,434
FUND BALANCES - JULY 1 (BUDGETARY) 105,025 120,645 122,706 2,061 124,556 428,834 430,895 2,061
FUND BALANCES - JUNE 30 (BUDGETARY) 80,709$ 102,276$ 139,290$ 37,014$ 87,366$ 322,740$ 350,235$ 27,495$
* Actual expenditures exceeded budgeted expenditures as a result of the receipt and legal expenditure of other non-state funds which have been received for restricted purposes. In the Special Revenue Funds this occurred
in the Environment First Fund in the Administration & Regulation function; the Grow Iowa Value Fund, Renewable Fuel Infrastuture Fund, state Housing Trust Fund, and Special Contingency Fund in the Economic
Development function; State Aviation fund in the Transportation function; and the Court Technology & Modernization Fund in the Judicial function.
TOTALOTHER FUNDS
For the Year Ended June 30, 2021
(Expressed in Thousands)(continued)
177

Dixie Cornell Gebhardt Scrapbooks, State Historical Society of Iowa, Des Moines.
178
COMBINING FINANCIAL STATEMENTS
Nonmajor Capital Projects Funds
Capital Projects Funds are used to account for the construction of majorcapital facilities other than those financed by proprietary funds and trustfunds.
General Services Capitals Fund is used to account for various buildingprojects.
Endowment for Iowa's Health Restricted Capitals Fund receives the tax-exempt portion of the Tobacco Settlement Authority's refunding of thetobacco bonds for capital project expenditures as allowed in the taxcertificate of the refinancing.
Marine Fuel Tax Capitals Fund is used to account for the acquisition ofwater access, development projects, water safety stations, marinas and anyother project which improves water recreation.
Fish & Game Capitals Fund is used to account for land acquisition andcapital projects related to fish and wildlife.
179

STATE OF IOWA
Combining Balance Sheet
Nonmajor Capital Projects Funds
June 30, 2021
(Expressed in Thousands)
GENERAL ENDOWMENT FOR MARINE FISH &
SERVICES IOWA'S HEALTH FUEL TAX GAME
CAPITALS RESTRICTED CAPITALS CAPITALS
FUND CAPITALS FUND FUND FUND TOTAL
ASSETS
Current assets:
Cash & investments 18,408$ 16$ 4,270$ 118$ 22,812$
Accounts receivable 487 - 75 22 584
Due from other funds 446 - 381 750 1,577
TOTAL ASSETS 19,341$ 16$ 4,726$ 890$ 24,973$
LIABILITIES
Current liabilities:
Accounts payable & accruals 1,163$ -$ 206$ 417$ 1,786$
Due to other funds 17,191 16 60 - 17,267
Unearned revenue 531 - - - 531
TOTAL LIABILITIES 18,885 16 266 417 19,584
DEFERRED INFLOWS OF RESOURCES
Deferred revenue 491 - - - 491
FUND BALANCES
Spendable:
Committed - - 4,460 473 4,933
Unassigned (35) - - - (35)
TOTAL FUND BALANCES (35) - 4,460 473 4,898
TOTAL LIABILITIES, DEFERRED
INFLOWS OF RESOURCES &
FUND BALANCES 19,341$ 16$ 4,726$ 890$ 24,973$
180

STATE OF IOWA
Combining Statement of Revenues, Expenditures and Changes in Fund Balances
Nonmajor Capital Projects Funds
GENERAL ENDOWMENT FOR MARINE FISH &
SERVICES IOWA'S HEALTH FUEL TAX GAME
CAPITALS RESTRICTED CAPITALS CAPITALS
FUND CAPITALS FUND FUND FUND TOTAL
REVENUES
Receipts from other entities 2,308$ -$ 132$ -$ 2,440$
Refunds & reimbursements 8 - - - 8
NET REVENUES 2,316 - 132 - 2,448
EXPENDITURES
Current:
Administration & regulation 9 - - - 9
Agriculture & natural resources - - 1,146 6,876 8,022
Capital outlay:
Administration & regulation 3,057 - - - 3,057
Health & human rights 6,372 - - - 6,372
Human services 559 - - - 559
Justice & public defense 1,146 16 - - 1,162
Agriculture & natural resources - - 2,029 5,180 7,209
TOTAL EXPENDITURES 11,143 16 3,175 12,056 26,390
EXCESS (DEFICIENCY) OF REVENUES
OVER (UNDER) EXPENDITURES (8,827) (16) (3,043) (12,056) (23,942)
OTHER FINANCING SOURCES (USES)
Transfers in 8,798 - 4,074 12,325 25,197
Transfers out (6) - (736) (6) (748)
TOTAL OTHER FINANCING SOURCES
(USES) 8,792 - 3,338 12,319 24,449
NET CHANGE IN FUND BALANCES (35) (16) 295 263 507
FUND BALANCES - JULY 1 - 16 4,165 210 4,391
FUND BALANCES - JUNE 30 (35)$ -$ 4,460$ 473$ 4,898$
For the Year Ended June 30, 2021
(Expressed in Thousands)
181

Dixie Cornell Gebhardt Scrapbooks, State Historical Society of Iowa, Des Moines.
182

COMBINING FINANCIAL STATEMENTS
Nonmajor Permanent Funds
Permanent Funds report resources that are legally restricted to the extent that only earnings, and not principal, may be used for the benefit of the government or its citizens.
Permanent School Principal Fund accounts for the principal derived from the sale of specific land. The interest is to be used for educational purposes.
Iowa Cultural Trust Fund accounts for assets held for the Iowa Cultural Trust. The principal is preserved and applicable interest is transferred to the Cultural Grant Fund to be used for purposes consistent with the Trust.
Iowa PBS Foundation Endowment is used to hold a restricted gift made to Iowa PBS. While the corpus of the gift is not available to spend, the earnings of the gift are restricted for the acquisition and/or production of quality family programming. Earnings are transferred to the Iowa PBS Foundation.
Pilot Grove Trust Fund accounts for a $10,000 donation in support and maintenance of the Pilot Grove area. Interest is credited to the Pilot Grove Maintenance Fund, a Special Revenue Fund.
Henry Albert Trust Fund accounts for a bequest to the State of Iowa. Interest is credited to the Department of Public Health.
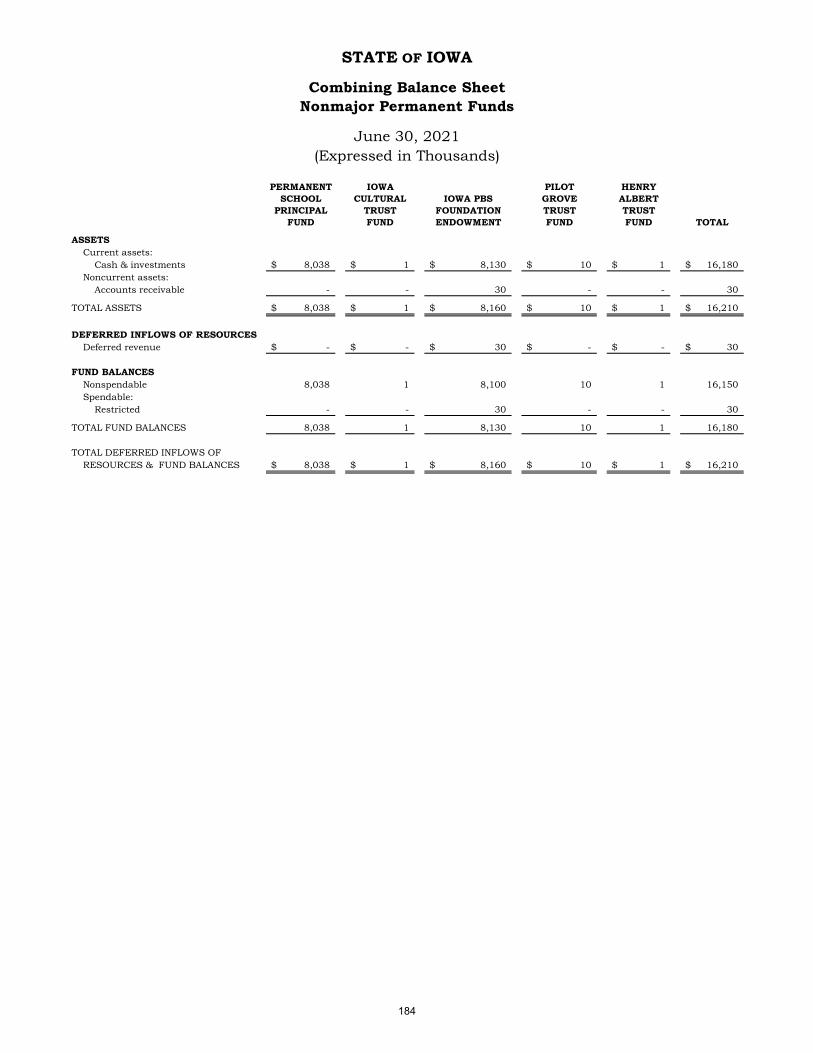
STATE OF IOWA
Combining Balance Sheet
Nonmajor Permanent Funds
June 30, 2021
(Expressed in Thousands)
PERMANENT IOWA PILOT HENRY
SCHOOL CULTURAL IOWA PBS GROVE ALBERT
PRINCIPAL TRUST FOUNDATION TRUST TRUST
FUND FUND ENDOWMENT FUND FUND TOTAL
ASSETS
Current assets:
Cash & investments 8,038$ 1$ 8,130$ 10$ 1$ 16,180$
Noncurrent assets:
Accounts receivable - - 30 - - 30
TOTAL ASSETS 8,038$ 1$ 8,160$ 10$ 1$ 16,210$
DEFERRED INFLOWS OF RESOURCES
Deferred revenue -$ -$ 30$ -$ -$ 30$
FUND BALANCES
Nonspendable 8,038 1 8,100 10 1 16,150
Spendable:
Restricted - - 30 - - 30
TOTAL FUND BALANCES 8,038 1 8,130 10 1 16,180
TOTAL DEFERRED INFLOWS OF
RESOURCES & FUND BALANCES 8,038$ 1$ 8,160$ 10$ 1$ 16,210$
184

STATE OF IOWA
Combining Statement of Revenues, Expenditures and Changes in Fund Balances
Nonmajor Permanent Funds
PERMANENT IOWA PILOT HENRY
SCHOOL CULTURAL IOWA PBS GROVE ALBERT
PRINCIPAL TRUST FOUNDATION TRUST TRUST
FUND FUND ENDOWMENT FUND FUND TOTAL
REVENUES
Miscellaneous -$ -$ 609$ -$ -$ 609$
NET CHANGE IN FUND BALANCES - - 609 - - 609
FUND BALANCES - JULY 1 8,038 1 7,521 10 1 15,571
FUND BALANCES - JUNE 30 8,038$ 1$ 8,130$ 10$ 1$ 16,180$
For the Year Ended June 30, 2021
(Expressed in Thousands)
185

Dixie Cornell Gebhardt Scrapbooks, State Historical Society of Iowa, Des Moines.
186

COMBINING FINANCIAL STATEMENTS
Nonmajor Enterprise Funds
Enterprise Funds account for activities for which fees are charged to externalusers for goods and services. This fund type is also used when the activity isfinanced with debt that is secured with fees and charges, as well as when thepricing policy of the activity is designated to recover its costs.
Iowa Communications Network accounts for a statewidetelecommunications system and its related revenues and expenses.
Iowa State Prison Industries accounts for the revenues and expensesrelated to the sale of products made by prison industries.
Liquor Control Act Fund is used to account for the revenues and expensesrelated to the sale of alcoholic beverages.
Elevator Safety Fund accounts for fees collected and pays the actual costsand expenses necessary to operate the elevator safety board and perform theduties of the labor commissioner as described in Chapter 89A of the Code ofIowa.
Other Enterprise Funds are aggregated for reporting purposes and accountfor other miscellaneous activities that meet the definition of EnterpriseFunds.
187

STATE OF IOWA
Combining Statement of Net Position
Nonmajor Enterprise Funds
June 30, 2021
(Expressed in Thousands)
IOWA IOWA STATE LIQUOR ELEVATOR
COMMUNICATIONS PRISON CONTROL SAFETY OTHER
NETWORK INDUSTRIES ACT FUND FUND FUNDS TOTAL
ASSETS
Current assets:
Cash & investments 8,424$ 8,920$ 27,076$ 2,838$ 6,362$ 53,620$
Accounts receivable (net) 3,770 4,175 7,958 143 172 16,218
Due from other funds - 3 616 109 59 787
Inventory 1,060 3,950 90 - 1,503 6,603
Prepaid expenses 914 154 281 180 269 1,798
Total current assets 14,168 17,202 36,021 3,270 8,365 79,026
Noncurrent assets:
Capital assets - nondepreciable - 222 2,729 - 420 3,371
Capital assets - depreciable (net) 8,999 7,814 10,965 129 828 28,735
Total noncurrent assets 8,999 8,036 13,694 129 1,248 32,106
TOTAL ASSETS 23,167 25,238 49,715 3,399 9,613 111,132
DEFERRED OUTFLOWS OF RESOURCES
Related to other postemployment
benefits 128 46 66 29 56 325
Related to pensions 1,371 1,755 244 333 203 3,906
TOTAL DEFERRED OUTFLOWS OF
RESOURCES 1,499 1,801 310 362 259 4,231
LIABILITIES
Current liabilities:
Accounts payable & accruals 2,643 1,263 16,436 28 61 20,431
Due to other funds/advances from
other funds - - 16,994 10 252 17,256
Unearned revenue 1,532 - - - - 1,532
Compensated absences 1,159 584 133 104 120 2,100
Other postemployment benefits
liability 45 42 15 9 12 123
Total current liabilities 5,379 1,889 33,578 151 445 41,442
Noncurrent liabilities:
Accounts payable & accruals - 193 - - - 193
Compensated absences 818 643 80 84 138 1,763
Net pension liability 6,182 1,987 956 951 680 10,756
Other postemployment benefits
liability 831 696 249 147 212 2,135
Total noncurrent liabilities 7,831 3,519 1,285 1,182 1,030 14,847
TOTAL LIABILITIES 13,210 5,408 34,863 1,333 1,475 56,289
DEFERRED INFLOWS OF RESOURCES
Related to other postemployment
benefits 160 86 269 - 6 521
Related to pensions 622 950 1,239 27 70 2,908
TOTAL DEFERRED INFLOWS OF
RESOURCES 782 1,036 1,508 27 76 3,429
NET POSITION
Net investment in capital assets 8,999 8,036 13,694 129 1,248 32,106
Unrestricted 1,675 12,559 (40) 2,272 7,073 23,539
TOTAL NET POSITION 10,674$ 20,595$ 13,654$ 2,401$ 8,321$ 55,645$
188

STATE OF IOWA
Combining Statement of Revenues, Expenses and Changes in Fund Net Position
Nonmajor Enterprise Funds
IOWA IOWA STATE LIQUOR ELEVATOR
COMMUNICATIONS PRISON CONTROL SAFETY OTHER
NETWORK INDUSTRIES ACT FUND FUND FUNDS TOTAL
OPERATING REVENUES
Receipts from other entities -$ -$ 15$ -$ 3$ 18$
Fees, licenses & permits - - 19,395 1,877 1,987 23,259
Refunds & reimbursements - - 704 - 554 1,258
Sales, rents & services 32,094 31,950 415,973 (10) 1,234 481,241
Miscellaneous - 1,159 4,364 - 459 5,982
TOTAL OPERATING REVENUES 32,094 33,109 440,451 1,867 4,237 511,758
OPERATING EXPENSES
General & administrative 10,602 - - - - 10,602
Depreciation 2,848 726 1,252 52 216 5,094
Direct & other 13,988 27,859 - - 531 42,378
Personal services - 1,803 1,912 1,617 1,704 7,036
Travel & subsistence - 7 245 7 (5) 254
Supplies & materials - 19 175 37 104 335
Contractual services - 1,875 9,590 570 856 12,891
Equipment & repairs - 8 5,273 21 363 5,665
Claims & miscellaneous 8,203 1,131 275,280 6 147 284,767
Licenses, permits & refunds - - 1,198 6 20 1,224
State aid & credits - - 2,638 - - 2,638
TOTAL OPERATING EXPENSES 35,641 33,428 297,563 2,316 3,936 372,884
OPERATING INCOME (LOSS) (3,547) (319) 142,888 (449) 301 138,874
NONOPERATING REVENUES
(EXPENSES)
Taxes - - 11,008 - - 11,008
Investment income 18 8 - 1 2 29
Gain on sale of capital assets - 2 - 11 16 29
Loss on sale of capital assets - (376) - - - (376)
NET NONOPERATING REVENUES
(EXPENSES) 18 (366) 11,008 12 18 10,690
INCOME (LOSS) BEFORE TRANSFERS (3,529) (685) 153,896 (437) 319 149,564
Transfers in 2,072 - - - (1) 2,071
Transfers out - - (151,937) - - (151,937)
CHANGE IN NET POSITION (1,457) (685) 1,959 (437) 318 (302)
TOTAL NET POSITION - JULY 1 12,131 21,280 11,695 2,838 8,003 55,947
TOTAL NET POSITION - JUNE 30 10,674$ 20,595$ 13,654$ 2,401$ 8,321$ 55,645$
For the Year Ended June 30, 2021
(Expressed in Thousands)
189

STATE OF IOWA
Combining Statement of Cash Flows
Nonmajor Enterprise Funds
For the Year Ended June 30, 2021
(Expressed in Thousands)
IOWA IOWA STATE LIQUOR ELEVATOR
COMMUNICATIONS PRISON CONTROL SAFETY OTHER
NETWORK INDUSTRIES ACT FUND FUND FUNDS TOTAL
CASH FLOWS FROM OPERATING ACTIVITIES
Cash received from customers 31,982$ 31,212$ 436,807$ 1,924$ 3,764$ 505,689$
Cash received from miscellaneous - 1,159 4,379 - 462 6,000
Cash payments to suppliers for goods & services (23,582) (28,489) (291,502) (659) (1,850) (346,082)
Cash payments to employees for services (9,279) (1,721) (2,230) (1,542) (1,651) (16,423)
NET CASH PROVIDED (USED) BY OPERATING ACTIVITIES (879) 2,161 147,454 (277) 725 149,184
CASH FLOWS FROM NONCAPITAL FINANCING ACTIVITIES
Transfers in from other funds 2,072 - - - (1) 2,071
Transfers out to other funds - - (148,271) - - (148,271)
Tax receipts - - 11,008 - - 11,008
NET CASH PROVIDED (USED) BY NONCAPITAL FINANCING ACTIVITIES 2,072 - (137,263) - (1) (135,192)
CASH FLOWS FROM CAPITAL & RELATED FINANCING ACTIVITIES
Acquisition & construction of capital assets (219) (933) (4,062) (62) (68) (5,344)
Proceeds from sale of capital assets - 2 - 11 16 29
NET CASH PROVIDED (USED) BY CAPITAL & RELATED FINANCING ACTIVITIES (219) (931) (4,062) (51) (52) (5,315)
CASH FLOWS FROM INVESTING ACTIVITIES
Interest & dividends on investments 18 8 - 1 2 29
NET CASH PROVIDED (USED) BY INVESTING ACTIVITIES 18 8 - 1 2 29
NET INCREASE (DECREASE) IN CASH & CASH EQUIVALENTS 992 1,238 6,129 (327) 674 8,706 - - - - - -
CASH & CASH EQUIVALENTS - JULY 1 7,432 7,682 20,947 3,165 5,688 44,914
CASH & CASH EQUIVALENTS - JUNE 30 8,424$ 8,920$ 27,076$ 2,838$ 6,362$ 53,620$
RECONCILIATION OF OPERATING INCOME (LOSS) TO NET CASH
PROVIDED (USED) BY OPERATING ACTIVITIES
Operating income (loss) (3,547)$ (319)$ 142,888$ (449)$ 301$ 138,874$
Adjustments to reconcile operating income (loss) to net cash
provided (used) by operating activities:
Depreciation 2,848 726 1,252 52 216 5,094
(Increase) decrease in accounts receivable 122 (738) 1,111 107 7 609
(Increase) decrease in due from - 1 (376) (50) (18) (443)
(Increase) decrease in inventory 299 2,386 50 - 1 2,736
(Increase) decrease in prepaid expenses (208) (84) (115) (18) (22) (447)
(Increase) decrease in deferred outflows of resources 2 (917) 81 (26) (50) (910)
Increase (decrease) in accounts payable (698) 108 2,962 5 (6) 2,371
Increase (decrease) in due to - - - 1 193 194
Increase (decrease) in unearned revenue (234) (1) - - - (235)
Increase (decrease) in compensated absences 264 (60) 58 (10) 10 262
Increase (decrease) in net pension liability 750 774 (940) 201 168 953
Increase (decrease) in other postemployment benefits liability 9 (35) 51 14 45 84
Increase (decrease) in deferred inflows of resources (486) 320 432 (104) (120) 42
NET CASH PROVIDED (USED) BY OPERATING ACTIVITIES (879)$ 2,161$ 147,454$ (277)$ 725$ 149,184$
190

COMBINING FINANCIAL STATEMENTS
Internal Service Funds
Internal Service Funds account for State activities that provide goods andservices to other State departments or agencies on a cost reimbursementbasis.
Workers' Compensation Fund receives funds associated with the workers'compensation program to pay claims and administrative support costs.
Materials & Equipment Revolving Fund accounts for the purchase, repair,maintenance and replacement of equipment, machinery and supplies usedby the Department of Transportation.
Depreciation Revolving Fund receives monthly depreciation payments fromState departments owning vehicles. The money is used to purchasereplacement vehicles for the departments.
Office of Chief Information Officer Fund provides data processing servicesto other State departments and agencies.
Other Internal Service Funds are aggregated for reporting purposes andaccount for other miscellaneous activities that meet the definition of InternalService Funds.
191

STATE OF IOWA
Combining Statement of Net Position
Internal Service Funds
June 30, 2021
(Expressed in Thousands)
MATERIALS OFFICE OF CHIEF
WORKERS' & EQUIPMENT DEPRECIATION INFORMATION
COMPENSATION REVOLVING REVOLVING OFFICER OTHER
FUND FUND FUND FUND FUNDS TOTAL
ASSETS
Current assets:
Cash & investments 6,735$ 16,121$ 36,036$ 18,227$ 18,307$ 95,426$
Accounts receivable (net) 17 3 91 475 2,727 3,313
Due from other funds/advances to
other funds 65,567 17 3,879 12,487 18,698 100,648
Inventory - 7,035 - 44 1,692 8,771
Prepaid expenses 1 - - 8,709 2,974 11,684
Total current assets 72,320 23,176 40,006 39,942 44,398 219,842
Noncurrent assets:
Capital assets - nondepreciable - 852 - 26,251 - 27,103
Capital assets - depreciable (net) - 153,391 - 776 2,070 156,237
Total noncurrent assets - 154,243 - 27,027 2,070 183,340
TOTAL ASSETS 72,320 177,419 40,006 66,969 46,468 403,182
DEFERRED OUTFLOWS OF RESOURCES
Related to other postemployment
benefits 1 87 - 21 135 244
Related to pensions 50 808 - 2,325 2,198 5,381
TOTAL DEFERRED OUTFLOWS OF
RESOURCES 51 895 - 2,346 2,333 5,625
LIABILITIES
Current liabilities:
Accounts payable & accruals 28,860 5,074 - 5,921 4,525 44,380
Due to other funds/advances from
other funds 113 - - 2,204 14,300 16,617
Unearned revenue - - 36,128 15,972 1,106 53,206
Compensated absences 15 434 - 1,456 1,060 2,965
Other postemployment benefits
liability 1 48 - 70 96 215
Total current liabilities 28,989 5,556 36,128 25,623 21,087 117,383
Noncurrent liabilities:
Accounts payable & accruals 43,187 84 - 80 18 43,369
Compensated absences 4 795 - 1,855 891 3,545
Net pension liability 174 3,368 - 9,377 8,177 21,096
Other postemployment benefits
liability 11 790 - 1,151 1,593 3,545
Total noncurrent liabilities 43,376 5,037 - 12,463 10,679 71,555
TOTAL LIABILITIES 72,365 10,593 36,128 38,086 31,766 188,938
DEFERRED INFLOWS OF RESOURCES
Related to other postemployment
benefits 1 28 - 117 65 211
Related to pensions 5 247 - 1,238 664 2,154
TOTAL DEFERRED INFLOWS OF
RESOURCES 6 275 - 1,355 729 2,365
NET POSITION
Net investment in capital assets - 154,243 - 27,028 2,069 183,340
Unrestricted - 13,203 3,878 2,846 14,237 34,164
TOTAL NET POSITION -$ 167,446$ 3,878$ 29,874$ 16,306$ 217,504$
192

STATE OF IOWA
Combining Statement of Revenues, Expenses and Changes in Fund Net Position
Internal Service Funds
MATERIALS OFFICE OF CHIEF
WORKERS' & EQUIPMENT DEPRECIATION INFORMATION
COMPENSATION REVOLVING REVOLVING OFFICER OTHER
FUND FUND FUND FUND FUNDS TOTAL
OPERATING REVENUES
Receipts from other entities 29,878$ 10,825$ 7,090$ 113,300$ 53,256$ 214,349$
Refunds & reimbursements 235 51,008 402 1,044 3,804 56,493
Sales, rents & services - - 1,550 - 204 1,754
Miscellaneous - 17,125 - - 22 17,147
TOTAL OPERATING REVENUES 30,113 78,958 9,042 114,344 57,286 289,743
OPERATING EXPENSES
Depreciation - 17,925 - 966 446 19,337
Personal services 304 6,330 - 15,795 15,126 37,555
Travel & subsistence - 8,420 - 5 9,937 18,362
Supplies & materials 1 30,955 - 720 14,867 46,543
Contractual services 2,318 2,226 - 50,833 15,977 71,354
Equipment & repairs - 7,603 7,462 19,997 1,671 36,733
Claims & miscellaneous 27,490 2 - 323 1,713 29,528
Licenses, permits & refunds - 15 - - 1 16
TOTAL OPERATING EXPENSES 30,113 73,476 7,462 88,639 59,738 259,428
OPERATING INCOME (LOSS) - 5,482 1,580 25,705 (2,452) 30,315
NONOPERATING REVENUES
(EXPENSES)
Investment income - - - 48 244 292
Gain on sale of capital assets - 48 - - 2 50
NET NONOPERATING REVENUES
(EXPENSES) - 48 - 48 246 342
CHANGE IN NET POSITION - 5,530 1,580 25,753 (2,206) 30,657
TOTAL NET POSITION - JULY 1 - 161,916 2,298 4,121 18,512 186,847
TOTAL NET POSITION - JUNE 30 -$ 167,446$ 3,878$ 29,874$ 16,306$ 217,504$
For the Year Ended June 30, 2021
(Expressed in Thousands)
193

STATE OF IOWA
Combining Statement of Cash Flows
Internal Service Funds
For the Year Ended June 30, 2021
(Expressed in Thousands)
MATERIALS OFFICE OF CHIEF
WORKERS' & EQUIPMENT DEPRECIATION INFORMATION
COMPENSATION REVOLVING REVOLVING OFFICER OTHER
FUND FUND FUND FUND FUNDS TOTAL
CASH FLOWS FROM OPERATING ACTIVITIES
Cash received from other entities 235$ 28,501$ 1,459$ 931$ 1,970$ 33,096$
Cash received from reciprocal interfund activity 30,451 52,305 8,997 124,689 51,795 268,237
Cash payments to suppliers for goods & services (27,551) (47,246) (7,540) (76,763) (38,822) (197,922)
Cash payments to employees for services (268) (6,158) - (15,097) (14,886) (36,409)
NET CASH PROVIDED (USED) BY OPERATING ACTIVITIES 2,867 27,402 2,916 33,760 57 67,002
CASH FLOWS FROM CAPITAL & RELATED FINANCING ACTIVITIES
Acquisition & construction of capital assets - (27,525) - (19,586) (377) (47,488)
NET CASH PROVIDED (USED) BY CAPITAL & RELATED FINANCING ACTIVITIES - (27,525) - (19,586) (377) (47,488)
CASH FLOWS FROM INVESTING ACTIVITIES
Interest & dividends on investments - - - 48 244 292
NET CASH PROVIDED (USED) BY INVESTING ACTIVITIES - - - 48 244 292
NET INCREASE (DECREASE) IN CASH & CASH EQUIVALENTS 2,867 (123) 2,916 14,222 (76) 19,806 - - - - - -
CASH & CASH EQUIVALENTS - JULY 1 3,868 16,244 33,120 4,005 18,383 75,620
CASH & CASH EQUIVALENTS - JUNE 30 6,735$ 16,121$ 36,036$ 18,227$ 18,307$ 95,426$
RECONCILIATION OF OPERATING INCOME (LOSS) TO NET CASH
PROVIDED (USED) BY OPERATING ACTIVITIES
Operating income (loss) -$ 5,482$ 1,580$ 25,705$ (2,452)$ 30,315$
Adjustments to reconcile operating income (loss) to net cash
provided (used) by operating activities:
Depreciation - 17,925 - 966 446 19,337
(Increase) decrease in accounts receivable (8) 551 (91) (113) (2,060) (1,721)
(Increase) decrease in due from other funds/advances to other funds 553 1,297 (1,346) (2,487) (2,522) (4,505)
(Increase) decrease in inventory - (223) - (3) 445 219
(Increase) decrease in prepaid expenses (1) - - (4,306) 2,063 (2,244)
(Increase) decrease in deferred outflows of resources 21 (114) - 124 (317) (286)
Increase (decrease) in accounts payable 2,258 2,198 (78) (576) 2,836 6,638
Increase (decrease) in due to other funds/advances from other funds 28 - - (902) 905 31
Increase (decrease) in unearned revenue - - 2,851 14,778 156 17,785
Increase (decrease) in compensated absences 4 32 - 309 72 417
Increase (decrease) in net pension liability 28 624 - 1,267 1,526 3,445
Increase (decrease) in other postemployment benefits liability - 32 - 37 41 110
Increase (decrease) in deferred inflows of resources (17) (402) - (1,039) (1,082) (2,540)
NET CASH PROVIDED (USED) BY OPERATING ACTIVITIES 2,866$ 27,402$ 2,916$ 33,760$ 57$ 67,001$
194

COMBINING FINANCIAL STATEMENTS
Pension and Other Employee Benefit Funds
Pension Funds account for transactions, assets, liabilities and net positionavailable for plan benefits of the various State employee retirement systems.See NOTE 15 - PENSION PLANS.
Insurance Fund receives converted sick leave dollars of Department of PublicSafety retirees under the Peace Officers contract to pay health and/or lifebenefits.
SPOC Insurance Fund receives converted sick leave dollars of Department ofNatural Resources retirees under the Peace Officers contract to pay healthand/or life benefits.
195

STATE OF IOWA
Combining Statement of Fiduciary Net Position
Pension and Other Employee Benefit Funds
IOWA PUBLIC PEACE
EMPLOYEES' OFFICERS' JUDICIAL SPOC
RETIREMENT RETIREMENT RETIREMENT INSURANCE INSURANCE
SYSTEM SYSTEM SYSTEM FUND FUND TOTAL
ASSETS
Cash & cash equivalents 510,184$ 3,041$ 4,771$ 1,656$ 2,424$ 522,076$
Receivables:
Contributions 70,353 1,247 652 3,100 - 75,352
Investments sold 743,009 22 108 - - 743,139
Foreign exchange contracts 317,903 - - - - 317,903
Interest & dividends 82,517 1,010 - 1 - 83,528
Miscellaneous 7 - - - - 7
Total receivables 1,213,789 2,279 760 3,101 - 1,219,929
Investments, at fair value:
Fixed income securities 12,676,858 125,052 47,493 - - 12,849,403
Equity investments 18,900,697 608,716 257,684 - - 19,767,097
Real estate partnerships - 69,906 - - - 69,906
Investment in private equity/debt 8,652,675 - - - - 8,652,675
Real assets 2,360,617 - - - - 2,360,617
Securities lending collateral pool 560,618 18,483 1,673 - - 580,774
Total investments 43,151,465 822,157 306,850 - - 44,280,472
Capital assets:
Land 500 - - - - 500
Other - depreciable (net) 12,627 - - - - 12,627
Total capital assets 13,127 - - - - 13,127
Other assets 628 - - - - 628
TOTAL ASSETS 44,889,193 827,477 312,381 4,757 2,424 46,036,232
DEFERRED OUTFLOWS OF RESOURCES
Related to other postemployment
benefits 99 - - - - 99
LIABILITIES
Accounts payable & accruals 60,119 482 312 - - 60,913
Foreign exchange contracts payable 317,154 - - - - 317,154
Payable for investments purchased 1,061,545 919 232 - - 1,062,696
Payable to brokers for rebate & collateral 560,520 18,482 1,673 - - 580,675
TOTAL LIABILITIES 1,999,338 19,883 2,217 - - 2,021,438
DEFERRED INFLOWS OF RESOURCES
Related to other postemployment
benefits 78 - - - - 78
NET POSITION
Restricted for pension/other
postemployment benefits 42,889,876$ 807,594$ 310,164$ 4,757$ 2,424$ 44,014,815$
June 30, 2021
(Expressed in Thousands)
196

STATE OF IOWA
Combining Statement of Changes in Fiduciary Net Position
Pension and Other Employee Benefit Funds
IOWA PUBLIC PEACE
EMPLOYEES' OFFICERS' JUDICIAL SPOC
RETIREMENT RETIREMENT RETIREMENT INSURANCE INSURANCE
SYSTEM SYSTEM SYSTEM FUND FUND TOTAL
ADDITIONSContributions:
Member contributions 549,091$ 5,458$ 2,811$ 3,381$ 345$ 561,086$
Employer contributions 817,561 22,711 9,200 - - 849,472
Buy-back/buy-in contributions 5,220 - - - - 5,220
Total contributions 1,371,872 28,169 12,011 3,381 345 1,415,778
Investment income:
Net increase in fair value of
investments 9,389,337 205,106 79,162 - - 9,673,605
Interest 388,896 4,919 989 2 - 394,806
Dividends 118,249 3,684 2,214 - - 124,147
Other 66,999 28 8 - - 67,035
Total investment income 9,963,481 213,737 82,373 2 - 10,259,593
Less investment expense 68,106 3,515 452 - - 72,073
Net investment income 9,895,375 210,222 81,921 2 - 10,187,520
TOTAL ADDITIONS 11,267,247 238,391 93,932 3,383 345 11,603,298
DEDUCTIONS
Pension & annuity benefits 2,365,175 35,086 15,233 - - 2,415,494
Payments in accordance with
agreements - - - 1,528 512 2,040
Administrative expense 13,852 284 20 - - 14,156
Refunds 53,636 - - - - 53,636
TOTAL DEDUCTIONS 2,432,663 35,370 15,253 1,528 512 2,485,326
Extraordinary item -settlement -payment
17,600 - - - - 7,600
CHANGE IN NET POSITION 8,842,184 203,021 78,679 1,855 (167) 9,125,572
NET POSITION - JULY 1 34,047,692 604,573 231,485 2,902 2,591 34,889,243
NET POSITION - JUNE 30 42,889,876$ 807,594$ 310,164$ 4,757$ 2,424$ 44,014,815$
1Iowa Public Employees' Retirement System (IPERS) received the final settlement payment from the Westridge Capital
fraud case, CFTC V. Walsh/SEC v. WG. The payment resulted in an extraordinary item.
For the Year Ended June 30, 2021
(Expressed in Thousands)
197

Dixie Cornell Gebhardt Scrapbooks, State Historical Society of Iowa, Des Moines.
198

COMBINING FINANCIAL STATEMENTS
Private Purpose Trust Funds
Private Purpose Trust Funds are used to report trust arrangements underwhich principal and income benefit individuals, private organizations orother governments.
Iowa Educational Savings Plan Trust receives contributions fromparticipants for investment for future application towards payment of highereducation costs for designated beneficiaries.
Iowa ABLE Savings Plan Trust receives contributions to be invested for thefuture payment of disability-related costs of an individual.
Iowa Braille & Sight Saving School Trust receives donations andcontributions to be spent for the benefit of students.
Wagner Award Trust received a bequest by Ruth Wagner to present anannual recognition to the outstanding soil district commissioner who is 40years or younger to be presented each year at the annual state conference.
199

STATE OF IOWA
Combining Statement of Fiduciary Net Position
Private Purpose Trust Funds
IOWA IOWA IOWA
EDUCATIONAL ABLE BRAILE & WAGNER
SAVINGS SAVINGS SIGHT SAVING AWARD
PLAN TRUST PLAN TRUST SCHOOL TRUST TRUST TOTAL
ASSETS
Cash 3,334$ 5,275$ -$ 14$ 8,623$
Investments 6,949,443 6,385 742 - 6,956,570
TOTAL ASSETS 6,952,777 11,660 742 14 6,965,193
LIABILITIES
Accounts payable & accruals 227 16 - - 243
NET POSITION
Restricted for individuals, organizations
& other entities 6,952,550$ 11,644$ 742$ 14$ 6,964,950$
For the Year Ended June 30, 2021
(Expressed in Thousands)
200

STATE OF IOWA
Combining Statement of Changes in Fiduciary Net Position
Private Purpose Trust Funds
IOWA IOWA IOWA
EDUCATIONAL ABLE BRAILE & WAGNER
SAVINGS SAVINGS SIGHT SAVING AWARD
PLAN TRUST PLAN TRUST SCHOOL TRUST TRUST TOTAL
ADDITIONS
Contributions:
Participant contributions 479,885$ 5,230$ -$ -$ 485,115$
Other contributions 1,310 204 - - 1,514
Total contributions 481,195 5,434 - - 486,629
Investment income:
Net increase (decrease) in fair value of
investments 1,251,436 - 153 - 1,251,589
Interest 1 1,014 20 - 1,035
Total investment income 1,251,437 1,014 173 - 1,252,624
TOTAL ADDITIONS 1,732,632 6,448 173 - 1,739,253
DEDUCTIONS
Distributions to participants 540,121 1,103 38 - 541,262
Other 1,098 91 - - 1,189
TOTAL DEDUCTIONS 541,219 1,194 38 - 542,451
CHANGE IN NET POSITION 1,191,413 5,254 135 - 1,196,802
NET POSITION - JULY 1 5,761,137 6,390 607 14 5,768,148
NET POSITION - JUNE 30 6,952,550$ 11,644$ 742$ 14$ 6,964,950$
For the Year Ended June 30, 2021
(Expressed in Thousands)
201

Dix
ie C
orn
ell G
ebh
ard
t Scra
pbooks, S
tate
His
toric
al S
ocie
ty o
f Iow
a, D
es M
oin
es.
202

COMBINING FINANCIAL STATEMENTS
Custodial Funds
Custodial Funds account for the receipt and distribution of various taxes,deposits, and property collected for individuals, organizations or othergovernments, which are not required to be reported in other fiduciary fundtypes.
Local Sales & Services Tax Fund is used to account for local option salestaxes collected by retailers and deposited with the State. The taxes aredistributed to the counties which have jurisdictions imposing local optionsales tax.
Child Support Collection & Refund Fund receives child support collectionsfrom employers, obligors, federal and state tax offsets, debtors offsets, andothers. The child support collections are distributed to families inaccordance with federal distribution laws.
Judicial - Clerks of District Court act as a collecting agency for many feesand taxes that are distributed to the proper local government or recipient.
School District Surtax Fund collects and distributes surtax to the schooldistricts according to the surtax formula set by the districts.
Other Custodial Funds are aggregated for reporting purposes and representamounts held at the Universities, offender and resident deposits held at theState institutions, and other deposits and taxes collected for others.
203

STATE OF IOWA
Combining Statement of Fiduciary Net Position
Custodial Funds
June 30, 2021
(Expressed in Thousands)
CHILD
LOCAL SUPPORT JUDICIAL - SCHOOL
SALES & COLLECTION CLERKS OF DISTRICT
SERVICES & REFUND DISTRICT SURTAX OTHER
TAX FUND FUND COURT FUND FUNDS TOTAL
ASSETS
Cash 34,389$ 13,944$ 40,693$ 86,337$ 41,638$ 217,001$
Receivables:
Accounts - 2,187 - - 7,000 9,187
Taxes for other governments 292,680 - - 8,453 495 301,628
Interest - - - - 1 1
Total receivables 292,680 2,187 - 8,453 7,496 310,816
Investments - - - - 19,769 19,769
Capital assets - depreciable (net) - - - - 125 125
Prepaid expenses - - - - 499 499
Inventory - - - - 9 9
TOTAL ASSETS 327,069 16,131 40,693 94,790 69,536 548,219
LIABILITIES
Accounts payable & accruals - 12,502 40,693 - 2,434 55,629
Accounts payable to other governments 327,069 - - 94,790 1,056 422,915
TOTAL LIABILITIES 327,069 12,502 40,693 94,790 3,490 478,544
NET POSITION
Restricted for individuals, organizations
& other entities -$ 3,629$ -$ -$ 66,046$ 69,675$
204

STATE OF IOWA
Combining Statement of Changes in Fiduciary Net Position
Custodial Funds
CHILD
LOCAL SUPPORT JUDICIAL - SCHOOL
SALES & COLLECTION CLERKS OF DISTRICT
SERVICES & REFUND DISTRICT SURTAX OTHER
TAX FUND FUND COURT FUND FUNDS TOTAL
ADDITIONS
Contributions:
Participant contributions -$ 374,208$ -$ -$ 83,556$ 457,764$
Other contributions - - - - 73,118 73,118
Gifts, bequests & endowments - - - - 3,638 3,638
Total contributions - 374,208 - - 160,312 534,520
Investment income:
Net increase in fair value of
investments - - - - 5,266 5,266
Total investment income - - - - 5,266 5,266
Tax collections for other governments 1,044,961 - - 101,589 112,821 1,259,371
Court revenue collections for others - - 292,362 - - 292,362
Court settlements - - - - 903 903
Miscellaneous - - - - 47,299 47,299
TOTAL ADDITIONS 1,044,961 374,208 292,362 101,589 326,601 2,139,721
DEDUCTIONS
Distributions to participants - 376,492 - - 32,927 409,419
Payments in accordance with agreements - - - - 101,425 101,425
Adminstrative expense - - - - 30,017 30,017
Payments of tax collections to other
entities 1,044,961 - - 101,589 113,090 1,259,640
Payment of court collections to others - - 292,362 - - 292,362
Other - - - - 35,537 35,537
TOTAL DEDUCTIONS 1,044,961 376,492 292,362 101,589 312,996 2,128,400
CHANGE IN NET POSITION - (2,284) - - 13,605 11,321
NET POSITION - JULY 1 - 5,913 - - 52,441 58,354
NET POSITION - JUNE 30 -$ 3,629$ -$ -$ 66,046$ 69,675$
For the Year Ended June 30, 2021
(Expressed in Thousands)
205

Dix
ie C
orn
ell G
ebh
ard
t Scra
pbooks, S
tate
His
toric
al S
ocie
ty o
f Iow
a, D
es M
oin
es.
206

S T A T I S T I C A L
S E C T I O N
207

Schedule
Financial Trends 1 - 4
Revenue Capacity 5 - 7
Debt Capacity 8 - 9
Demographic and Economic Information 10 - 11
Operating Information 12 - 15
Sources: Unless otherwise noted, the information in these schedules is derived from the Annual
Comprehensive Financial Reports for the relevant year.
STATE OF IOWA
STATISTICAL SECTION
TABLE OF CONTENTS
This part of the State of Iowa's annual comprehensive financial report presents detailed information as a
context for understanding what the information in the financial statements, note disclosures and
required supplementary information says about the State's overall financial health.
These schedules contain trend information to help the reader understand how the
State's financial performance and well-being have changed over time.
These schedules contain information to help the reader assess the State's most
significant revenue source, individual income tax.
These schedules present information to help the reader assess the affordability of
the State's current levels of outstanding debt and the State's ability to issue
additional debt in the future.
These schedules offer demographic and economic indicators to help the reader
understand the environment within which the State's financial activities take place.
These schedules contain service and infrastructure data to help the reader
understand how the information in the State's financial report relates to the services
the State provides and the activities it performs. A schedule of current
expenditures is also included.
208

STATE OF IOWA
Net Position by Component Schedule 1
2012 (1)
2013 (2)
2014 2015 (3)
2016 2017 2018 (4)
2019 2020 (5)
2021
Governmental activities
Net investment in capital assets 7,297,964$ 7,579,657$ 7,960,096$ 8,360,410$ 8,751,926$ 9,242,231$ 9,775,608$ 10,186,385$ 10,738,785$ 11,324,737$
Restricted 1,066,451 1,085,008 1,064,266 855,856 922,557 941,514 941,197 1,004,597 924,880 880,011
Unrestricted 90,401 525,989 413,880 (515,129) (808,123) (999,603) (1,013,268) (522,156) (65,977) 1,203,788
Total governmental activities net position 8,454,816$ 9,190,654$ 9,438,242$ 8,701,137$ 8,866,360$ 9,184,142$ 9,703,537$ 10,668,826$ 11,597,688$ 13,408,536$
Business-type activities
Net investment in capital assets 2,534,247$ 2,700,019$ 2,916,998$ 3,224,968$ 3,600,966$ 3,858,357$ 3,981,137$ 4,101,636$ 4,247,671$ 4,226,846$
Restricted 1,368,589 1,538,055 1,662,891 1,713,840 1,788,374 1,864,113 1,894,868 2,001,983 2,149,841 2,207,634
Unrestricted 1,687,242 1,734,657 1,921,118 1,861,341 1,816,683 1,768,131 1,845,650 2,057,362 2,125,751 2,632,441
Total business-type activities net position 5,590,078$ 5,972,731$ 6,501,007$ 6,800,149$ 7,206,023$ 7,490,601$ 7,721,655$ 8,160,981$ 8,523,263$ 9,066,921$
Primary government
Net investment in capital assets 9,832,211$ 10,279,676$ 10,877,094$ 11,585,378$ 12,352,892$ 13,100,588$ 13,756,745$ 14,288,021$ 14,986,456$ 15,551,583$
Restricted 2,435,040 2,623,063 2,727,157 2,569,696 2,710,931 2,805,627 2,836,065 3,006,580 3,074,721 3,087,645
Unrestricted 1,777,643 2,260,646 2,334,998 1,346,212 1,008,560 768,528 832,382 1,535,206 2,059,774 3,836,229
Total primary government net position 14,044,894$ 15,163,385$ 15,939,249$ 15,501,286$ 16,072,383$ 16,674,743$ 17,425,192$ 18,829,807$ 20,120,951$ 22,475,457$
(1) - Fiscal Year 2012 amounts reported include prior period adjustments made in 2013 to reflect the effect of implementation of GASB No. 61 and the inclusion of new component units at the University of Iowa.
(2) - Fiscal Year 2013 amounts reported include prior period adjustments made in 2014 to reflect the effect of implementation of GASB No. 65.
(3) - Fiscal Year 2015 was the first year of implementation of GASB No. 68 and GASB No. 71; therefore, recognized the net pension liability and related deferred amounts.
(4) - Fiscal Year 2018 was the first year of implementation of GASB No. 75; therefore, reflecting the total other postemployment benefits and related deferred amounts and Fiscal Year 2018 amounts
also include prior period adjustments made in 2019 for capital assets.
(5) - Fiscal Year 2020 reflects the implementation of GASB No. 84; fiscal year 2019 was not restated.
For the Last Ten Fiscal Years
(Accrual Basis of Accounting Expressed in Thousands)
Fiscal Year
209

STATE OF IOWA
Changes in Net Position Schedule 2
2012 (1)
2013 (2)
2014 2015 2016 2017 2018 (3)
2019 2020 (4)
2021
Expenses
Governmental activities:
Administration & regulation 1,411,797$ 1,385,398$ 1,436,485$ 1,595,922$ 1,799,186$ 1,864,959$ 1,862,199$ 1,902,217$ 2,077,536$ 2,500,552$
Education 3,551,294 3,582,770 3,749,195 3,909,866 4,005,597 4,162,360 4,185,133 4,244,257 4,418,383 4,839,703
Health & human rights 423,202 420,844 423,723 422,677 436,330 445,057 435,776 434,416 455,753 565,016
Human services 5,466,172 5,509,926 5,757,061 6,463,802 6,708,824 6,585,944 6,772,755 7,103,013 7,687,332 8,497,262
Justice & public defense 1,082,774 1,095,300 1,255,597 1,202,362 1,097,646 1,041,523 999,154 997,681 1,136,219 1,207,698
Economic development 254,902 186,948 159,964 158,632 144,472 157,288 133,810 132,911 140,858 173,455
Transportation 1,206,924 1,149,919 1,236,035 1,340,548 1,321,540 1,396,315 1,419,426 1,446,090 1,354,468 1,367,551
Agriculture & natural resources 214,526 219,948 219,159 223,916 227,612 233,883 224,382 230,063 238,515 268,107
Interest expense 101,849 99,311 95,312 92,011 90,105 79,424 78,773 76,984 65,434 58,436
Total governmental activities expenses 13,713,440 13,650,364 14,332,531 15,409,736 15,831,312 15,966,753 16,111,408 16,567,632 17,574,498 19,477,780
Business-type activities:
University Funds 3,842,314 3,960,727 4,156,145 4,339,376 4,580,247 4,843,267 5,052,039 5,232,658 5,349,571 5,600,805
Unemployment Benefits Fund 718,611 554,883 439,937 396,842 416,582 430,068 384,371 361,076 2,234,620 2,353,780
Other 246,673 257,011 260,564 264,092 273,939 285,205 294,471 309,649 334,712 372,382
Total business-type activities expenses 4,807,598 4,772,621 4,856,646 5,000,310 5,270,768 5,558,540 5,730,881 5,903,383 7,918,903 8,326,967
Total primary government expenses 18,521,038$ 18,422,985$ 19,189,177$ 20,410,046$ 21,102,080$ 21,525,293$ 21,842,289$ 22,471,015$ 25,493,401$ 27,804,747$
Program revenues
Governmental activities:
Charges for services:
Administration & regulation 1,060,902$ 1,099,289$ 1,061,265$ 1,064,230$ 1,106,530$ 1,118,233$ 1,103,732$ 1,135,177$ 1,038,168$ 1,131,855$
Education 52,686 21,787 18,057 20,656 17,374 17,714 26,308 20,003 12,936 20,311
Health & human rights 66,922 68,865 69,159 80,767 77,168 75,320 75,204 75,144 80,002 78,464
Human services 666,496 438,915 519,909 544,631 550,432 823,549 772,301 732,181 829,034 711,411
Justice & public defense 104,969 89,888 106,730 95,952 97,638 97,779 116,771 108,876 90,690 137,035
Economic development 3,672 3,864 3,374 1,749 2,049 1,739 1,662 4,392 1,269 4,823
Transportation 93,908 106,081 122,683 100,322 79,955 100,598 168,402 143,928 106,007 92,727
Agriculture & natural resources 84,912 78,476 79,777 72,634 86,807 72,052 76,734 84,729 80,161 92,937
Operating grants & contributions 4,489,138 4,619,136 4,905,617 5,349,944 5,500,402 5,194,216 5,251,400 5,646,598 6,950,835 8,491,371
Capital grants & contributions 494,715 426,350 472,885 501,378 440,783 503,121 509,091 448,902 544,550 520,257
Total governmental activities program revenues 7,118,320 6,952,651 7,359,456 7,832,263 7,959,138 8,004,321 8,101,605 8,399,930 9,733,652 11,281,191
Business-type activities:
Charges for services:
University Funds 2,590,308 2,687,569 2,845,788 3,037,054 3,273,055 3,390,227 3,639,063 3,865,376 3,869,117 4,021,078
Unemployment Benefits Fund 643,970 543,535 471,738 410,209 448,914 493,643 427,407 409,293 416,798 413,464
Other 325,699 342,596 355,988 366,129 378,533 391,346 403,102 428,109 459,798 511,758
Operating grants & contributions 1,044,159 848,672 783,036 746,633 777,368 801,120 798,834 808,427 2,283,904 2,563,073
Capital grants & contributions 61,339 61,948 90,263 173,150 101,682 57,588 15,131 71,706 31,680 33,205
Total business-type activities program revenues 4,665,475 4,484,320 4,546,813 4,733,175 4,979,552 5,133,924 5,283,537 5,582,911 7,061,297 7,542,578
Total primary government program revenues 11,783,795$ 11,436,971$ 11,906,269$ 12,565,438$ 12,938,690$ 13,138,245$ 13,385,142$ 13,982,841$ 16,794,949$ 18,823,769$
Net expense
Governmental activities (6,595,120)$ (6,697,713)$ (6,973,075)$ (7,577,473)$ (7,872,174)$ (7,962,432)$ (8,009,803)$ (8,167,702)$ (7,840,846)$ (8,196,589)$
Business-type activities (142,123) (288,301) (309,833) (267,135) (291,216) (424,616) (447,344) (320,472) (857,606) (784,389)
Total primary government net expense (6,737,243)$ (6,986,014)$ (7,282,908)$ (7,844,608)$ (8,163,390)$ (8,387,048)$ (8,457,147)$ (8,488,174)$ (8,698,452)$ (8,980,978)$
Fiscal Year
(Accrual Basis of Accounting Expressed in Thousands)
For the Last Ten Fiscal Years
(continued on next page)
210

STATE OF IOWA
Changes in Net Position Schedule 2
2012 (1)
2013 (2)
2014 2015 2016 2017 2018 (3)
2019 2020 (4)
2021
General revenues & other changes in net position
Governmental activities:
Personal income tax 3,040,391$ 3,446,857$ 3,206,504$ 3,456,503$ 3,542,419$ 3,637,895$ 3,862,624$ 4,078,355$ 3,945,877$ 4,224,590$
Corporate income tax 430,395 428,991 387,232 464,121 374,559 432,056 443,698 529,969 634,508 799,466
Sales & use tax 2,454,156 2,509,817 2,625,302 2,670,084 2,758,405 2,793,825 2,850,789 2,989,537 3,121,580 3,510,049
Other tax 756,713 759,681 756,237 771,702 803,003 791,607 773,204 828,992 812,882 902,673
Motor fuel tax restricted for transportation
purposes 438,953 438,009 446,449 524,569 677,999 674,603 671,936 665,799 670,238 673,745
Road use tax restricted for transportation purposes 303,368 307,821 322,470 346,901 360,993 371,361 374,701 381,003 382,757 444,548
Unrestricted investment earnings 21,155 6,240 21,406 19,175 22,156 16,257 29,730 75,371 55,748 14,595
Other 27,504 29,746 35,357 36,680 35,013 38,369 50,091 72,097 68,188 129,563
Gain on sale of assets 732 871 1,011 1,401 1,197 2,260 804 1,250 1,141 1,920
Loss on extinguishment of debt - - (5,679) - - - - - - -
Special items - disposal of operations - 5,728 - - - - - - - -
Transfers (456,940) (500,210) (575,626) (534,103) (538,347) (478,019) (515,933) (489,382) (968,910) (693,712)
Total governmental activities 7,016,427$ 7,433,551$ 7,220,663$ 7,757,033$ 8,037,397$ 8,280,214$ 8,541,644$ 9,132,991$ 8,724,009$ 10,007,437$
Business-type activities:
Other tax 7,031$ 7,463$ 7,527$ 7,765$ 7,649$ 8,078$ 8,167$ 8,220$ 8,348$ 11,008$
Unrestricted investment earnings 90,891 109,987 186,857 46,888 78,133 162,438 110,237 190,955 162,806 473,811
Other 76,091 67,096 68,072 57,303 68,961 60,590 59,863 71,220 70,118 149,487
Gain on sale of assets 688 78 27 20 4,000 69 658 21 - 29
Special items - change in OPEB - - - - - - 465,008 - - -
Extraordinary items - impairment of assets & other 991 (2,580) - - - - - - - -
Transfers 456,940 500,210 575,626 534,103 538,347 478,019 515,933 489,382 968,910 693,712
Total business-type activities 632,632$ 682,254$ 838,109$ 646,079$ 697,090$ 709,194$ 1,159,866$ 759,798$ 1,210,182$ 1,328,047$
Change in net position
Governmental activities 421,307$ 735,838$ 247,588$ 179,560$ 165,223$ 317,782$ 531,841$ 965,289$ 883,163$ 1,810,848$
Business-type activities 490,509 393,953 528,276 378,944 405,874 284,578 712,522 439,326 352,576 543,658
Total primary government 911,816$ 1,129,791$ 775,864$ 558,504$ 571,097$ 602,360$ 1,244,363$ 1,404,615$ 1,235,739$ 2,354,506$
(1) - Fiscal Year 2012 amounts reported include prior period adjustments made in 2013 to reflect the effect of implementation of GASB No. 61 and the inclusion of new component units at the University of Iowa.
(2) - Fiscal Year 2013 amounts reported include prior period adjustments made in 2014 to reflect the effect of implementation of GASB No. 65.
(3) - Fiscal Year 2018 amounts reported include a special item due to benefit changes to an OPEB plan at the University of Iowa, unrelated to the implementation of GASB No. 75.
(4) - Fiscal Year 2020 reflects the implementation of GASB No. 84; fiscal year 2019 was not restated.
For the Last Ten Fiscal Years
Fiscal Year
(continued)
(Accrual Basis of Accounting Expressed in Thousands)
211

STATE OF IOWA
Fund Balances of Governmental Funds Schedule 3
2012 2013 2014 2015 2016 2017 2018 2019 2020 2021
General Fund
Nonspendable 41,382$ 43,138$ 41,248$ 44,528$ 44,917$ 46,445$ 52,577$ 53,235$ 99,455$ 122,285$
Spendable:
Restricted 1,062,771 1,017,927 1,045,227 861,583 835,913 883,016 807,570 810,448 769,625 679,646
Committed 1,732,552 2,145,980 1,912,518 1,676,632 1,323,878 1,274,404 1,335,606 1,784,658 2,140,303 3,348,953
Unassigned (210,684) (156,800) (214,660) (273,102) (214,504) (328,131) (395,625) (384,360) (357,748) (398,227)
Total General Fund 2,626,021$ 3,050,245$ 2,784,333$ 2,309,641$ 1,990,204$ 1,875,734$ 1,800,128$ 2,263,981$ 2,651,635$ 3,752,657$
All other governmental funds
Nonspendable 16,192$ 16,376$ 16,327$ 16,451$ 16,846$ 10,813$ 11,115$ 11,181$ 16,031$ 16,660$
Spendable:
Restricted 667,541 (1)
570,702 (1)
489,259 (1)
437,487 (1)
389,796 (1)
347,117 (1)
304,512 (1)
275,598 (1)
236,808 (1)
158,483 (1)
Committed 26,453 28,346 29,124 24,038 41,215 22,225 20,732 19,021 20,791 40,190
Unassigned (461,801) (1)
(410,619) (1)
(354,758) (1)
(305,015) (1)
(253,068) (1)
(201,706) (1)
(162,019) (1)
(123,345) (1)
(84,833) (1)
(43,590) (1)
Total all other governmental funds 248,385$ 204,805$ 179,952$ 172,961$ 194,789$ 178,449$ 174,340$ 182,455$ 188,797$ 171,743$
(1) - Due to the implementation of GASB No. 48, interfund advances were recorded in the Tobacco Settlement Authority and Tobacco Collections funds.
For the Last Ten Fiscal Years
Fiscal Year
(Modified Accrual Basis of Accounting Expressed in Thousands)
212

STATE OF IOWA
Changes in Fund Balances of Governmental Funds Schedule 4
2012 2013 2014 2015 2016 2017 2018 2019 2020 2021
Revenues
Taxes 7,985,697$ 8,456,345$ 8,414,849$ 8,917,337$ 9,263,248$ 9,503,731$ 9,846,473$ 10,307,880$ 10,380,464$ 11,314,249$
Receipts from other entities 5,626,029 5,400,502 5,655,703 5,943,765 6,064,791 5,971,601 5,981,877 6,291,339 8,251,760 9,863,368
Investment income 21,766 6,244 21,370 19,141 22,093 16,228 29,604 75,009 55,573 14,557
Fees, licenses & permits 1,226,093 1,268,880 1,324,029 1,358,661 1,409,339 1,425,131 1,455,332 1,495,057 1,537,320 1,711,717
Refunds & reimbursements 537,219 527,456 576,484 601,812 711,301 849,553 805,250 798,210 923,093 782,346
Sales, rents & services 33,225 32,639 35,827 39,765 39,665 41,714 36,851 44,113 36,990 35,187
Miscellaneous 141,461 150,035 158,048 177,710 209,066 213,667 207,692 254,099 255,457 301,740
Gross revenues 15,571,490 15,842,101 16,186,310 17,058,191 17,719,503 18,021,625 18,363,079 19,265,707 21,440,657 24,023,164
Less revenue refunds 918,524 909,631 1,039,704 1,066,067 1,155,612 1,215,155 1,269,478 1,258,773 2,001,394 2,072,273
Net revenues 14,652,966 14,932,470 15,146,606 15,992,124 16,563,891 16,806,470 17,093,601 18,006,934 19,439,263 21,950,891
Expenditures
Administration & regulation 1,403,974 1,364,608 1,419,879 1,596,272 1,792,103 1,836,187 1,848,943 1,880,653 2,041,416 2,498,182
Education 3,544,428 3,575,186 3,731,639 3,908,485 4,000,660 4,154,268 4,177,218 4,236,228 4,409,475 4,834,800
Health & human rights 417,306 414,981 418,906 420,907 431,555 437,703 424,547 426,720 443,743 552,417
Human services 5,461,157 5,540,912 5,783,311 6,454,924 6,720,396 6,601,224 6,759,205 7,099,933 7,660,699 8,496,089
Justice & public defense 1,027,435 1,035,912 1,199,871 1,173,037 1,054,586 986,780 947,730 947,720 1,073,702 1,172,842
Economic development 255,299 184,877 159,626 158,282 145,436 156,032 136,717 131,231 140,168 169,241
Transportation 548,629 552,228 580,831 646,481 610,992 626,535 673,706 680,525 642,878 606,021
Agriculture & natural resources 201,838 200,439 201,194 207,823 210,453 213,091 204,893 197,969 211,546 236,439
Capital outlay 1,136,378 1,012,032 1,128,589 1,238,409 1,217,290 1,299,102 1,360,623 1,279,182 1,379,577 1,442,255
Debt service:
Payment to escrow agent - - 73,940 - - 3,246 - - - -
Principal 72,555 49,815 69,215 45,625 53,050 58,295 46,960 270,465 59,360 139,587
Interest & fiscal charges 101,327 98,242 94,875 89,659 87,219 79,960 79,898 77,968 67,174 62,654
Total expenditures 14,170,326 14,029,232 14,861,876 15,939,904 16,323,740 16,452,423 16,660,440 17,228,594 18,129,738 20,210,527
Excess of revenues over expenditures 482,640 903,238 284,730 52,220 240,151 354,047 433,161 778,340 1,309,525 1,740,364
Other financing sources (uses)
Transfers in 197,567 215,291 229,136 200,611 220,599 220,253 211,240 208,551 292,255 286,906
Transfers out (651,385) (713,290) (804,762) (734,713) (758,946) (743,522) (727,173) (697,933) (1,261,165) (980,618)
Leases, installment purchases & other 562 9 131 199 587 37,227 3,057 2,744 452 1,147
Premium (discount) on bonds 1,643 - - - - 74,176 - 36,591 - 83,311
Revenue refunding bonds issued 20,910 - - - - 345,215 - 143,675 7,230 779,631
Payment to refunded bond escrow agent - - - - - (418,206) - - - (826,773)
Total other financing sources (uses) (430,703) (497,990) (575,495) (533,903) (537,760) (484,857) (512,876) (306,372) (961,228) (656,396)
Special items - disposal of operations - (24,604) - - - - - - - -
Net change in fund balances 51,937$ 380,644$ (290,765)$ (481,683)$ (297,609)$ (130,810)$ (79,715)$ 471,968$ 348,297$ 1,083,968$
Debt service as a percentage of noncapital
expenditures 1.3% 1.1% 1.7% 0.9% 0.9% 0.9% 0.8% 2.2% 0.8% 1.1%
(Modified Accrual Basis of Accounting Expressed in Thousands)
Fiscal Year
For the Last Ten Fiscal Years
213

STATE OF IOWA
Tax Revenue by Source - Governmental Funds Schedule 5
2012 2013 2014 2015 2016 2017 2018 2019 2020 2021
Individual income tax 3,677,240$ 4,080,794$ 3,984,543$ 4,224,097$ 4,364,229$ 4,503,420$ 4,754,464$ 4,938,615$ 4,895,257$ 5,169,294$
Sales tax 2,066,024 2,097,466 2,171,915 2,251,636 2,332,220 2,344,828 2,390,342 2,438,260 2,471,213 2,766,208
Use tax 439,772 464,126 489,764 501,073 497,160 515,740 566,509 647,016 743,581 833,211
Fuel tax 490,377 481,120 493,999 575,844 746,601 768,810 751,064 731,710 732,345 737,010
Corporate tax 550,343 563,016 507,522 579,881 510,664 564,423 580,805 699,007 727,390 882,489
Inheritance tax 79,670 86,785 90,791 89,807 88,759 88,093 85,245 79,243 78,277 102,053
Insurance premium tax 101,406 104,885 105,532 109,634 119,675 114,809 121,863 153,428 143,464 143,901
Cigarette & tobacco tax 225,499 226,300 225,375 223,069 227,901 221,077 212,567 202,135 211,600 204,614
Wagering tax 287,680 283,168 275,659 280,706 290,004 291,980 295,333 294,629 244,602 337,074
Franchise tax 41,121 43,860 40,330 47,482 50,354 53,831 48,581 64,440 67,653 66,748
Beer tax 14,726 13,865 14,187 14,489 14,214 13,941 13,593 13,439 9,435 18,208
Other 11,839 10,960 15,232 19,619 21,467 22,779 26,107 45,958 55,647 53,439
Gross taxes 7,985,697 8,456,345 8,414,849 8,917,337 9,263,248 9,503,731 9,846,473 10,307,880 10,380,464 11,314,249
Less refunds 820,178 871,332 1,000,031 1,028,612 1,111,432 1,173,495 1,229,918 1,213,022 1,200,953 1,198,193
Net taxes 7,165,519$ 7,585,013$ 7,414,818$ 7,888,725$ 8,151,816$ 8,330,236$ 8,616,555$ 9,094,858$ 9,179,511$ 10,116,056$
Source: State Accounting System and adjusting journal entries from GAAP packages.
Fiscal Year
For the Last Ten Fiscal Years
(Modified Accrual Basis of Accounting Expressed in Thousands)
214

STATE OF IOWA
Individual Income Tax Returns Filed and Tax Rates Schedule 6
Tax Year 2011 Tax Year 2012 Tax Year 2013
Net Taxable Income Number of Returns Net Taxable Income Number of Returns Net Taxable Income Number of Returns Net Taxable Income Number of Returns Net Taxable Income Number of Returns
No AGI 52,101 No AGI 52,301 No AGI 53,992 No AGI 58,373 No AGI 61,291
$1 - 9,999 337,187 $1 - 9,999 326,822 $1 - 9,999 315,190 $1 - 9,999 311,378 $1 - 9,999 311,295
$10,000 - 19,999 332,596 $10,000 - 19,999 324,978 $10,000 - 19,999 320,585 $10,000 - 19,999 315,860 $10,000 - 19,999 310,750
$20,000 - 29,999 314,841 $20,000 - 29,999 309,181 $20,000 - 29,999 303,974 $20,000 - 29,999 300,205 $20,000 - 29,999 294,558
$30,000 - 39,999 272,314 $30,000 - 39,999 272,654 $30,000 - 39,999 273,340 $30,000 - 39,999 273,584 $30,000 - 39,999 274,223
$40,000 - 49,999 202,716 $40,000 - 49,999 207,046 $40,000 - 49,999 210,320 $40,000 - 49,999 214,873 $40,000 - 49,999 218,392
$50,000 - 74,999 253,213 $50,000 - 74,999 268,326 $50,000 - 74,999 278,264 $50,000 - 74,999 294,842 $50,000 - 74,999 308,245
$75,000 - 99,999 89,113 $75,000 - 99,999 96,439 $75,000 - 99,999 103,702 $75,000 - 99,999 111,906 $75,000 - 99,999 118,823
$100,000 & above 121,578 $100,000 & above 138,830 $100,000 & above 144,703 $100,000 & above 156,687 $100,000 & above 163,513
1,975,659 1,996,577 2,004,070 2,037,708 2,061,090
Net Taxable Income Tax Rate* Net Taxable Income Tax Rate* Net Taxable Income Tax Rate* Net Taxable Income Tax Rate* Net Taxable Income Tax Rate*
$0 - 1,439 0.36% $0 - 1,469 0.36% $0 - 1,494 0.36% $0 - 1,515 0.36% $0 - 1,539 0.36%
$1,439 - 2,878 0.72% $1,469 - 2,938 0.72% $1,494 - 2,988 0.72% $1,515 - 3,030 0.72% $1,539 - 3,078 0.72%
$2,878 - 5,756 2.43% $2,938 - 5,876 2.43% $2,988 - 5,976 2.43% $3,030 - 6,060 2.43% $3,078 - 6,156 2.43%
$5,756 - 12,951 4.50% $5,876 - 13,221 4.50% $5,976 - 13,446 4.50% $6,060 - 13,635 4.50% $6,156 - 13,851 4.50%
$12,951 - 21,585 6.12% $13,221 - 22,035 6.12% $13,446 - 22,410 6.12% $13,635 - 22,725 6.12% $13,851 - 23,085 6.12%
$21,585 - 28,780 6.48% $22,035 - 29,380 6.48% $22,410 - 29,880 6.48% $22,725 - 30,300 6.48% $23,085 - 30,780 6.48%
$28,780 - 43,170 6.80% $29,380 - 44,070 6.80% $29,880 - 44,820 6.80% $30,300 - 45,450 6.80% $30,780 - 46,170 6.80%
$43,170 - 64,755 7.92% $44,070 - 66,105 7.92% $44,820 - 67,230 7.92% $45,450 - 68,175 7.92% $46,170 - 69,255 7.92%
$64,755 & above 8.98% $66,105 & above 8.98% $67,230 & above 8.98% $68,175 & above 8.98% $69,255 & above 8.98%
Tax Year 2016 Tax Year 2017
Net Taxable Income Number of Returns Net Taxable Income Number of Returns Net Taxable Income Number of Returns Net Taxable Income Number of Returns Net Taxable Income Number of Returns
No AGI 48,908 No AGI 48,804 No AGI 47,981 No AGI 48,614 No AGI 66,701
$1 - 9,999 225,555 $1 - 9,999 219,061 $1 - 9,999 208,384 $1 - 9,999 210,503 $1 - 9,999 204,063
$10,000 - 19,999 210,605 $10,000 - 19,999 206,883 $10,000 - 19,999 201,124 $10,000 - 19,999 202,061 $10,000 - 19,999 195,193
$20,000 - 29,999 190,879 $20,000 - 29,999 188,232 $20,000 - 29,999 184,891 $20,000 - 29,999 184,805 $20,000 - 29,999 180,224
$30,000 - 39,999 167,467 $30,000 - 39,999 166,897 $30,000 - 39,999 167,834 $30,000 - 39,999 172,010 $30,000 - 39,999 170,468
$40,000 - 49,999 131,987 $40,000 - 49,999 134,985 $40,000 - 49,999 136,926 $40,000 - 49,999 140,805 $40,000 - 49,999 143,251
$50,000 - 74,999 222,665 $50,000 - 74,999 224,795 $50,000 - 74,999 228,665 $50,000 - 74,999 234,764 $50,000 - 74,999 237,315
$75,000 - 99,999 145,455 $75,000 - 99,999 145,603 $75,000 - 99,999 148,240 $75,000 - 99,999 150,024 $75,000 - 99,999 149,288
$100,000 & above 259,266 $100,000 & above 270,641 $100,000 & above 289,139 $100,000 & above 300,350 $100,000 & above 312,836
1,602,787 1,605,901 1,613,184 1,643,936 1,659,339
Net Taxable Income Tax Rate* Net Taxable Income Tax Rate* Net Taxable Income Tax Rate* Net Taxable Income Tax Rate* Net Taxable Income Tax Rate*
$0 - 1,554 0.36% $0 - 1,573 0.36% $0 - 1,598 0.36% $0 - 1,638 0.33% $0 - 1,666 0.33%
$1,554 - 3,108 0.72% $1,573 - 3,146 0.72% $1,598 - 3,196 0.72% $1,638 - 3,276 0.67% $1,666 - 3,332 0.67%
$3,108 - 6,216 2.43% $3,146 - 6,292 2.43% $3,196 - 6,392 2.43% $3,276 - 6,552 2.25% $3,332 - 6,664 2.25%
$6,216 - 13,986 4.50% $6,292 - 14,157 4.50% $6,392 - 14,382 4.50% $6,552 - 14,742 4.14% $6,664 - 14,994 4.14%
$13,986 - 23,310 6.12% $14,157 - 23,595 6.12% $14,382 - 23,970 6.12% $14,742 - 24,570 5.63% $14,994 - 24,990 5.63%
$23,310 - 31,080 6.48% $23,595 - 31,460 6.48% $23,970 - 31,960 6.48% $24,570 - 32,760 5.96% $24,990 - 33,320 5.96%
$31,080 - 46,620 6.80% $31,460 - 47,190 6.80% $31,960 - 47,940 6.80% $32,760 - 49,140 6.25% $33,320 - 49,980 6.25%
$46,620 - 69,930 7.92% $47,190 - 70,785 7.92% $47,940 - 71,910 7.92% $49,140 - 73,710 7.44% $49,980 - 74,970 7.44%
$69,930 & above 8.98% $70,785 & above 8.98% $71,910 & above 8.98% $73,710 & above 8.53% $74,970 & above 8.53%
Source: Iowa Individual Income Tax Annual Statistical Report, compiled by the Iowa Department of Revenue, Research and Policy Division
* Iowa is one of three states that allow all taxpayers full deductibility of net federal tax payments.
For the Last Ten Calendar Years
Tax Year 2020Tax Year 2019Tax Year 2018
Tax Year 2014 Tax Year 2015
215

STATE OF IOWA
Retail Sales by Business Classification Schedule 7
Number of Taxable Number of Taxable Number of Taxable Number of Taxable Number of Taxable
Classification Returns Sales Returns Sales Returns Sales Returns Sales Returns Sales
(in thousands) (in thousands) (in thousands) (in thousands) (in thousands)
Utilities & transportation 14,737 3,405,479$ 15,053 3,335,512$ 14,701 3,483,048$ 14,357 3,632,047$ 14,134 3,669,812$
Building materials 6,530 2,704,879 6,504 2,712,261 6,059 2,538,244 6,118 2,706,767 5,943 2,763,359
General merchandise 6,211 5,530,952 6,151 5,475,235 3,156 4,650,592 3,093 4,711,009 3,073 4,719,728
Food dealers 6,776 1,772,985 6,729 1,782,829 12,807 3,156,659 12,790 3,297,011 12,724 3,478,201
Motor vehicles 13,723 2,108,205 13,612 2,124,416 9,534 1,704,501 9,428 1,793,580 9,340 1,860,126
Apparel 6,224 972,815 6,316 1,011,028 6,256 1,044,542 6,221 1,063,320 6,225 1,067,251
Home furnishings & appliances 7,474 1,205,592 7,398 1,202,792 6,246 1,208,754 6,169 1,216,924 5,917 1,235,700
Eating & drinking places 30,248 3,635,252 30,430 3,732,685 30,035 3,827,209 29,889 4,056,025 30,362 4,228,185
Specialty retail stores 58,914 2,759,729 59,103 2,909,350 56,330 2,771,512 55,786 2,911,596 56,083 3,052,179
Services 125,225 4,877,162 126,867 4,945,765 125,773 4,889,626 126,249 5,188,730 126,900 5,324,603
Wholesale goods 16,945 2,568,014 16,659 2,552,248 18,059 3,772,090 17,698 3,929,422 17,346 3,937,460
All other 50,937 2,996,903 50,965 3,016,466 48,831 2,800,836 49,219 3,019,888 49,763 3,082,894
Total 343,944 34,537,967$ 345,787 34,800,587$ 337,787 35,847,613$ 337,017 37,526,319$ 337,810 38,419,498$
Number of Taxable Number of Taxable Number of Taxable Number of Taxable Number of Taxable
Returns Sales Returns Sales Returns Sales Returns Sales Returns Sales
(in thousands) (in thousands) (in thousands) (in thousands) (in thousands)
Utilities & transportation 13,029 3,929,813$ 12,973 3,889,513$ 15,954 3,975,371$ 15,788 3,818,914$ 17,618 3,859,075$
Building materials 5,695 2,862,822 5,592 2,908,678 5,477 2,930,829 5,423 3,212,510 5,435 3,807,841
General merchandise 3,067 4,676,612 3,112 4,708,984 3,157 4,613,828 3,355 4,586,447 3,516 4,810,055
Food dealers 12,607 3,519,738 12,419 3,550,649 12,317 3,638,167 11,991 3,796,789 12,132 4,048,441
Motor vehicles 9,241 1,904,414 9,196 1,951,368 9,089 2,044,357 8,852 2,126,945 9,441 2,346,410
Apparel 6,215 1,025,902 6,252 977,631 6,552 986,377 6,653 835,162 6,923 976,638
Home furnishings & appliances 5,750 1,227,997 5,504 1,206,237 5,360 1,179,722 5,146 1,122,915 4,979 1,325,063
Eating & drinking places 30,720 4,306,324 30,988 4,394,774 31,196 4,527,602 30,955 4,238,738 31,423 4,524,619
Specialty retail stores 56,480 3,082,359 56,593 3,031,680 56,462 3,057,059 55,910 3,166,684 56,172 3,894,417
Services 127,633 5,409,162 127,468 5,544,380 130,089 5,830,492 131,156 5,462,049 130,457 5,670,482
Wholesale goods 17,139 3,889,348 16,712 3,950,029 16,615 3,914,185 16,597 4,039,534 16,792 4,697,337
All other 49,819 3,122,021 49,761 3,216,042 50,407 3,399,148 51,033 3,605,962 50,353 3,706,251
Total 337,395 38,956,512$ 336,570 39,329,965$ 342,675 40,097,137$ 342,859 40,012,649$ 345,241 43,666,629$
Source: Iowa Retail Sales and Use Taxes Annual Report, compiled by the Iowa Department of Revenue, Tax Research Bureau
The sales tax rate had remained at 5% since 1992. In September 2008 the rate increased from 5% to 6%.
(1) - In 2014 the Iowa Department of Revenue reclassified the business group and classification of gas stations/convenience stores selling gas from motor vehicles to food dealers.
2015
2020 2021
Sales Tax Annual Period July 1 through June 30 of the following year 2012 through 2021
2012 2013 2014 (1)
2016
2017 2018 2019
216

STATE OF IOWA
Ratios of Outstanding Debt by Type Schedule 8
Percentage
Fiscal Revenue Capital Loans & Revenue Capital Loans & Total Primary of Personal
Year Bonds Leases Contracts Bonds Leases Contracts Government Income Per Capita
2012 (1) 1,881,714 2,884 2,141 1,549,938 173,504 19,021 3,629,202 2.92 1,185
2013 (2) 1,858,333 206 1,834 1,787,778 39,323 35,195 3,722,669 2.87 1,211
2014 1,720,281 180 1,600 1,852,319 35,606 69,369 3,679,355 2.64 1,191
2015 1,675,590 76 1,474 1,903,485 34,200 64,214 3,679,039 2.62 1,184
2016 1,623,980 52 1,801 1,936,944 31,865 54,134 3,648,776 2.60 1,168
2017 1,587,738 32,843 1,548 1,916,145 29,487 46,004 3,613,765 2.46 1,153
2018 1,535,957 29,665 2,783 1,984,189 25,604 33,118 3,611,316 2.50 1,148
2019 1,442,712 28,169 956 1,945,238 23,688 24,771 3,465,534 2.25 1,098
2020 1,385,066 24,192 321 1,805,709 22,469 14,870 3,252,627 1.95 1,024
2021 1,281,000 20,529 500 1,763,848 22,492 26,913 3,115,282 1.84 977
(1) - Fiscal Year 2012 amounts reflect the prior period adjustments made in 2013 due to the implementation of GASB No. 61 and the inclusion of new component
units at the University of Iowa.
(2) - Fiscal Year 2013 amounts reported include prior period adjustments made in 2014 to reflect the effect of implementation of GASB No. 65.
For the Last Ten Fiscal Years
Personal income and population are based on the calendar year that ends within the fiscal year (See Schedule 10).
Governmental Activities Business-type Activities
(Expressed in Thousands Except Per Capita)
217

Schedule 9
IJOBS - 2009
Less: Net Available
Gross Revenues Operating Expenses Revenues Principal Interest Total Coverage
2012 47,750$ 9$ 47,741$ 14,335$ 32,686$ 47,021$ 1.02
2013 47,523 1 47,522 14,955 32,069 47,024 1.01
2014 49,394 - 49,394 15,580 31,443 47,023 1.05
2015 49,339 3 49,336 16,330 30,720 47,050 1.05
2016 49,569 11 49,558 17,120 29,905 47,025 1.05
2017 16,131 - 16,131 - 14,914 14,914 1.08
2018 16,099 - 16,099 - 14,914 14,914 1.08
2019** 20,069 - 20,069 - 14,914 14,914 1.35
Pledged revenues consist of casino and racetrack gaming revenues.
** The outstanding revenue bonds were refunded.
IJOBS - 2010
Less: Net Available
Gross Revenues Operating Expenses Revenues Principal Interest Total Coverage
2012 12,470$ 3$ 12,467$ 4,370$ 7,878$ 12,248$ 1.02
2013 12,470 - 12,470 4,470 7,792 12,262 1.02
2014 10,450 - 10,450 3,160 6,866 10,026 1.04
2015 10,636 1 10,635 3,395 6,741 10,136 1.05
2016 10,486 2 10,484 3,480 6,571 10,051 1.04
2017 11,302 - 11,302 3,650 6,432 10,082 1.12
2018 11,273 - 11,273 3,835 6,249 10,084 1.12
2019 10,278 - 10,278 4,025 6,077 10,102 1.02
2020** 12,097 2 12,095 4,225 5,916 10,141 1.19
Pledged revenues consist of casino and racetrack gaming revenues.
** The outstanding revenue bonds were refunded September 2020.
IJOBS - 2016
Less: Net Available
Gross Revenues Operating Expenses Revenues Principal Interest Total Coverage
2017 32,633$ -$ 32,633$ 18,735$ 10,374$ 29,109$ 1.12
2018 32,537 - 32,537 17,155 11,951 29,106 1.12
2019 29,614 - 29,614 18,015 11,093 29,108 1.02
2020 34,722 7 34,715 18,915 10,192 29,107 1.19
2021 37,653 5 37,648 19,860 9,246 29,106 1.29
Pledged revenues consist of casino and racetrack gaming revenues.
IJOBS - 2019
Less: Net Available
Gross Revenues Operating Expenses Revenues Principal Interest Total Coverage
2020 8,355$ 2$ 8,353$ -$ 7,004$ 7,004$ 1.19
2021 9,293 1 9,292 - 7,184 7,184 1.29
Pledged revenues consist of casino and racetrack gaming revenues.
IJOBS - 2020
Less: Net Available
Gross Revenues Operating Expenses Revenues Principal Interest Total Coverage
2021 8,080$ 1$ 8,079$ 3,130$ 3,116$ 6,246$ 1.29
Pledged revenues consist of casino and racetrack gaming revenues.
(continued on next page)
STATE OF IOWA
Revenue Bond Coverage
For the Last Ten Fiscal Years
Governmental Activities - General Fund
(Expressed in Thousands)
Debt Service
Debt Service
Debt Service
Debt Service
Debt Service
218

STATE OF IOWA
Revenue Bond Coverage
For the Last Ten Fiscal Years(continued)
Schedule 9
Vision Iowa
Less: Net Available
Gross Revenues Operating Expenses Revenues Principal Interest Total Coverage
2012 15,910$ 8$ 15,902$ 9,390$ 6,512$ 15,902$ 1.00
2013 15,934 3 15,931 9,890 6,041 15,931 1.00
2014 15,958 3 15,955 10,445 5,510 15,955 1.00
2015 15,980 3 15,977 11,025 4,939 15,964 1.00
2016 15,987 3 15,984 11,645 4,339 15,984 1.00
2017 16,018 8 16,010 12,295 3,709 16,004 1.00
2018 16,019 3 16,016 12,980 3,036 16,016 1.00
2019 16,050 3 16,047 13,715 2,332 16,047 1.00
2020** 16,026 3 16,023 14,445 1,578 16,023 1.00
Pledged revenues consist of casino and racetrack gaming revenues.
** Bonds were paid off in August 2020.
Iowa Utilities Board and Consumer Advocate State Building
Less: Net Available
Gross Revenues Operating Expenses Revenues Principal Interest Total Coverage
2012 1,064$ -$ 1,064$ 440$ 624$ 1,064$ 1.00
2013 1,062 - 1,062 460 602 1,062 1.00
2014 1,064 - 1,064 485 579 1,064 1.00
2015 1,065 - 1,065 510 555 1,065 1.00
2016 1,064 - 1,064 535 529 1,064 1.00
2017 1,062 - 1,062 560 502 1,062 1.00
2018 1,064 - 1,064 590 474 1,064 1.00
2019 1,064 - 1,064 620 444 1,064 1.00
2020** 1,060 - 1,060 650 404 1,054 1.01
Pledged revenues are from utility company assessments.
**Current refunding of bonds in June 2020.
Iowa Utilities Board & Consumer Advocate State Building 2020
Less: Net Available
Gross Revenues Operating Expenses Revenues Principal Interest Total Coverage
2021 879$ -$ 879$ 740$ 139$ 879$ 1.00
Prison Infrastructure 2010
Less: Net Available
Gross Revenues Operating Expenses Revenues Principal Interest Total Coverage
2012 6,522$ -$ 6,522$ 435$ 6,087$ 6,522$ 1.00
2013 6,518 - 6,518 440 6,078 6,518 1.00
2014 6,514 - 6,514 445 6,069 6,514 1.00
2015 8,728 9 8,719 2,660 6,060 8,720 1.00
2016 11,853 4 11,849 5,855 5,994 11,849 1.00
2017 10,698 5 10,693 9,120 1,573 10,693 1.00
2018 10,696 4 10,692 9,445 1,247 10,692 1.00
2019 10,700 4 10,696 9,795 901 10,696 1.00
2020** 10,700 4 10,696 10,235 461 10,696 1.00
Pledged revenues are from fines, fees and forfeited bail receipts.
** Bonds matured 2020.
Prison Infrastructure 2016
Less: Net Available
Gross Revenues Operating Expenses Revenues Principal Interest Total Coverage
2017 3,513$ -$ 3,513$ -$ 3,513$ 3,513$ 1.00
2018 3,990 - 3,990 - 3,990 3,990 1.00
2019 3,990 - 3,990 - 3,990 3,990 1.00
2020 3,990 - 3,990 - 3,990 3,990 1.00
2021 13,790 - 13,790 9,800 3,990 13,790 1.00
Pledged revenues are from fines, fees and forfeited bail receipts.
(continued on next page)
Debt Service
Governmental Activities - General Fund
(Expressed in Thousands)
Debt Service
Debt Service
Debt Service
Debt Service
219

STATE OF IOWA
Revenue Bond Coverage
For the Last Ten Fiscal Years(continued)
Schedule 9
Tobacco Settlement Authority
Less: Net Available
Gross Revenues Operating Expenses Revenues Principal Interest Total Coverage
2012 68,283$ * 1,437$ 66,846$ 9,590$ 42,970$ 52,560$ 1.27
2013 68,265 * 1,477 66,788 9,835 42,347 52,182 1.28
2014 74,226 * 786 73,440 16,365 41,708 58,073 1.26
2015 66,405 * 702 65,703 11,735 40,644 52,379 1.25
2016 69,218 * 1,054 68,164 14,415 39,881 54,296 1.26
2017 68,541 * 1,216 67,325 13,935 38,944 52,879 1.27
2018 53,559 * 1,778 51,781 2,955 38,038 40,993 1.26
2019 52,180 * 467 51,713 3,345 37,846 41,191 1.26
2020 51,978 * 612 51,366 3,350 37,629 40,979 1.25
2021** 52,930 * 538 52,392 - 18,706 18,706 2.80
*
** Bonds refunded April 2021.
Tobacco Settlement Authority: Series 2021
Less: Net Available
Gross Revenues Operating Expenses Revenues Principal Interest Total Coverage
2021 52,930$ * 538$ 52,392$ 30,665$ 1,964$ 32,629$ 1.61
*
(continued on next page)
Governmental Activities - Special Revenue Funds
Debt Service
Due to implementation of GASB Statement No. 48, the Tobacco Settlement Authority no longer reports tobacco settlement
revenues. All tobacco settlement revenues are reported in the Tobacco Collections Fund and funds are then advanced to the
Tobacco Settlement Authority for debt repayment. The amount shown represents the amount advanced and interest income.
(Expressed in Thousands)
220
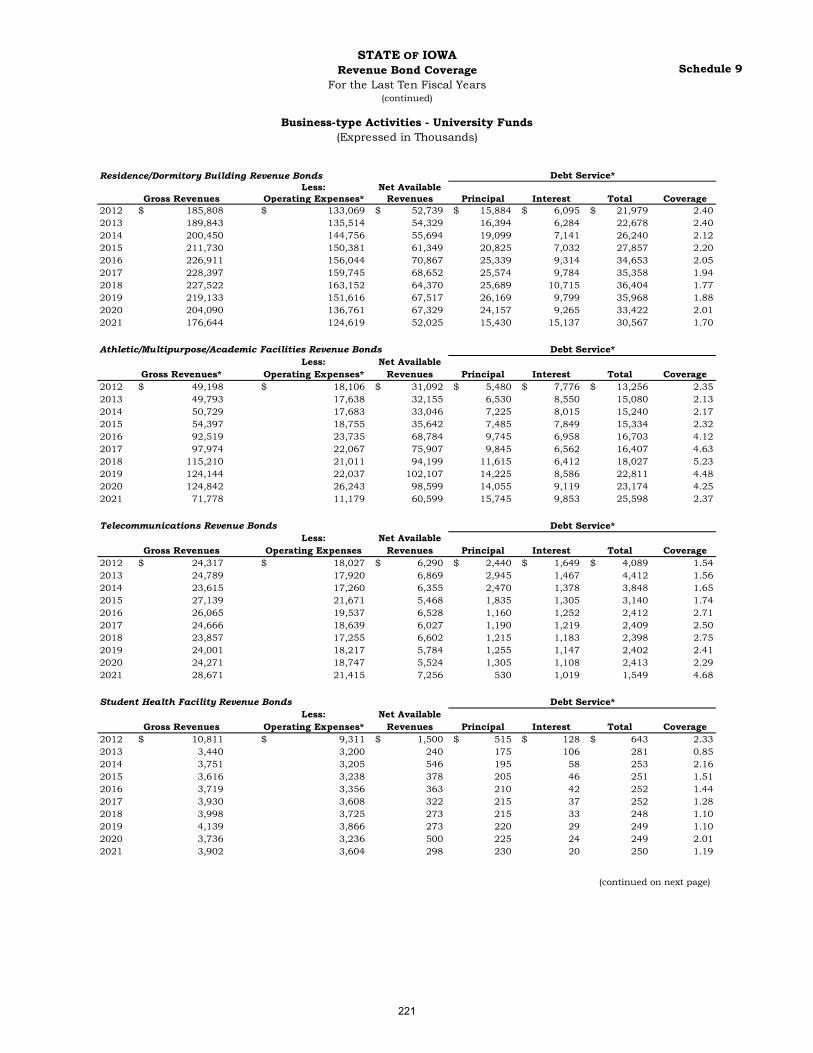
STATE OF IOWA
Revenue Bond Coverage
For the Last Ten Fiscal Years(continued)
Schedule 9
Residence/Dormitory Building Revenue Bonds
Less: Net Available
Gross Revenues Operating Expenses* Revenues Principal Interest Total Coverage
2012 185,808$ 133,069$ 52,739$ 15,884$ 6,095$ 21,979$ 2.40
2013 189,843 135,514 54,329 16,394 6,284 22,678 2.40
2014 200,450 144,756 55,694 19,099 7,141 26,240 2.12
2015 211,730 150,381 61,349 20,825 7,032 27,857 2.20
2016 226,911 156,044 70,867 25,339 9,314 34,653 2.05
2017 228,397 159,745 68,652 25,574 9,784 35,358 1.94
2018 227,522 163,152 64,370 25,689 10,715 36,404 1.77
2019 219,133 151,616 67,517 26,169 9,799 35,968 1.88
2020 204,090 136,761 67,329 24,157 9,265 33,422 2.01
2021 176,644 124,619 52,025 15,430 15,137 30,567 1.70
Athletic/Multipurpose/Academic Facilities Revenue Bonds
Less: Net Available
Gross Revenues* Operating Expenses* Revenues Principal Interest Total Coverage
2012 49,198$ 18,106$ 31,092$ 5,480$ 7,776$ 13,256$ 2.35
2013 49,793 17,638 32,155 6,530 8,550 15,080 2.13
2014 50,729 17,683 33,046 7,225 8,015 15,240 2.17
2015 54,397 18,755 35,642 7,485 7,849 15,334 2.32
2016 92,519 23,735 68,784 9,745 6,958 16,703 4.12
2017 97,974 22,067 75,907 9,845 6,562 16,407 4.63
2018 115,210 21,011 94,199 11,615 6,412 18,027 5.23
2019 124,144 22,037 102,107 14,225 8,586 22,811 4.48
2020 124,842 26,243 98,599 14,055 9,119 23,174 4.25
2021 71,778 11,179 60,599 15,745 9,853 25,598 2.37
Telecommunications Revenue Bonds
Less: Net Available
Gross Revenues Operating Expenses Revenues Principal Interest Total Coverage
2012 24,317$ 18,027$ 6,290$ 2,440$ 1,649$ 4,089$ 1.54
2013 24,789 17,920 6,869 2,945 1,467 4,412 1.56
2014 23,615 17,260 6,355 2,470 1,378 3,848 1.65
2015 27,139 21,671 5,468 1,835 1,305 3,140 1.74
2016 26,065 19,537 6,528 1,160 1,252 2,412 2.71
2017 24,666 18,639 6,027 1,190 1,219 2,409 2.50
2018 23,857 17,255 6,602 1,215 1,183 2,398 2.75
2019 24,001 18,217 5,784 1,255 1,147 2,402 2.41
2020 24,271 18,747 5,524 1,305 1,108 2,413 2.29
2021 28,671 21,415 7,256 530 1,019 1,549 4.68
Student Health Facility Revenue Bonds
Less: Net Available
Gross Revenues Operating Expenses* Revenues Principal Interest Total Coverage
2012 10,811$ 9,311$ 1,500$ 515$ 128$ 643$ 2.33
2013 3,440 3,200 240 175 106 281 0.85
2014 3,751 3,205 546 195 58 253 2.16
2015 3,616 3,238 378 205 46 251 1.51
2016 3,719 3,356 363 210 42 252 1.44
2017 3,930 3,608 322 215 37 252 1.28
2018 3,998 3,725 273 215 33 248 1.10
2019 4,139 3,866 273 220 29 249 1.10
2020 3,736 3,236 500 225 24 249 2.01
2021 3,902 3,604 298 230 20 250 1.19
(continued on next page)
Business-type Activities - University Funds
Debt Service*
(Expressed in Thousands)
Debt Service*
Debt Service*
Debt Service*
221

STATE OF IOWA
Revenue Bond Coverage
For the Last Ten Fiscal Years(continued)
Schedule 9
Utility System Revenue Bonds
Less: Net Available
Gross Revenues* Operating Expenses* Revenues Principal Interest Total Coverage
2012 122,367$ 83,958$ 38,409$ 12,540$ 7,221$ 19,761$ 1.94
2013 126,495 87,043 39,452 14,845 7,949 22,794 1.73
2014 131,716 93,079 38,637 13,845 7,539 21,384 1.81
2015 130,696 89,181 41,515 8,915 7,100 16,015 2.59
2016 133,687 86,424 47,263 11,405 7,386 18,791 2.52
2017 136,677 96,620 40,057 11,725 7,187 18,912 2.12
2018 139,436 93,268 46,168 13,590 7,514 21,104 2.19
2019 153,198 100,209 52,989 15,115 7,912 23,027 2.30
2020 49,734 37,802 11,932 3,965 2,065 6,030 1.98
2021 49,054 34,868 14,186 4,590 2,419 7,009 2.02
Parking System Revenue Bonds
Less: Net Available
Gross Revenues Operating Expenses Revenues Principal Interest Total Coverage
2012 19,984$ 12,655$ 7,329$ 1,605$ 1,068$ 2,673$ 2.74
2013 21,076 13,108 7,968 1,680 930 2,610 3.05
2014 22,574 13,679 8,895 1,750 1,677 3,427 2.60
2015 24,214 14,266 9,948 1,970 2,049 4,019 2.48
2016 25,366 13,531 11,835 3,220 1,832 5,052 2.34
2017 26,907 13,974 12,933 3,205 1,743 4,948 2.61
2018 26,884 14,487 12,397 3,310 1,656 4,966 2.50
2019 28,153 16,400 11,753 3,345 1,564 4,909 2.39
2020 23,938 12,792 11,146 2,700 1,473 4,173 2.67
2021 22,809 12,384 10,425 2,775 1,399 4,174 2.50
Recreational/Regulated Materials Facility Revenue Bonds
Less: Net Available
Gross Revenues Operating Expenses Revenues Principal Interest Total Coverage
2012 28,573$ 10,573$ 18,000$ 2,260$ 5,529$ 7,789$ 2.31
2013 34,787 11,649 23,138 4,005 5,449 9,454 2.45
2014 38,799 12,880 25,919 4,380 5,244 9,624 2.69
2015 42,613 12,921 29,692 3,635 5,094 8,729 3.40
2016 46,479 13,668 32,811 3,870 4,975 8,845 3.71
2017 50,828 14,864 35,964 3,816 5,086 8,902 4.04
2018 56,196 15,543 40,653 4,250 3,949 8,199 4.96
2019 54,971 15,172 39,799 4,900 3,548 8,448 4.71
2020 47,683 14,889 32,794 5,150 3,414 8,564 3.83
2021 38,151 12,114 26,037 4,950 3,262 8,212 3.17
Memorial/Maucker Union Revenue Bonds
Less: Net Available
Gross Revenues* Operating Expenses* Revenues Principal Interest Total Coverage
2012 34,367$ 26,657$ 7,710$ 1,950$ 1,427$ 3,377$ 2.28
2013 32,567 24,820 7,747 1,925 1,362 3,287 2.36
2014 31,881 23,760 8,121 2,130 1,033 3,163 2.57
2015 31,259 22,579 8,680 2,210 894 3,104 2.80
2016 32,317 23,091 9,226 2,285 816 3,101 2.98
2017 32,403 23,473 8,930 2,330 771 3,101 2.88
2018 34,193 24,029 10,164 2,375 724 3,099 3.28
2019 37,697 26,629 11,068 2,425 674 3,099 3.57
2020 34,414 21,902 12,512 2,510 617 3,127 4.00
2021 31,067 18,289 12,778 2,570 553 3,123 4.09
(continued on next page)
Business-type Activities - University Funds
(Expressed in Thousands)
Debt Service*
Debt Service*
Debt Service*
Debt Service*
222

STATE OF IOWA
Revenue Bond Coverage
For the Last Ten Fiscal Years(continued)
Schedule 9
Hospital Revenue Bonds
Less: Net Available
Gross Revenues* Operating Expenses* Revenues Principal Interest Total Coverage
2012 1,098,292$ 981,872$ 116,420$ 3,680$ 5,891$ 9,571$ 12.16
2013 1,125,336 1,013,711 111,625 4,870 10,159 15,029 7.43
2014 1,189,532 1,061,304 128,228 5,905 13,797 19,702 6.51
2015 1,314,267 1,155,470 158,797 11,205 13,469 24,674 6.44
2016 1,456,666 1,276,516 180,150 11,510 13,023 24,533 7.34
2017 1,502,410 1,385,284 117,126 8,190 10,925 19,115 6.13
2018 1,666,437 1,364,481 301,956 11,990 10,949 22,939 13.16
2019 1,834,928 1,633,577 201,351 12,815 11,469 24,284 8.29
2020 1,939,629 1,778,270 161,359 13,440 12,999 26,439 6.10
2021 2,158,883 1,965,411 193,472 14,745 11,985 26,730 7.24
Center For University Advancement Revenue Bonds
Less: Net Available
Gross Revenues* Operating Expenses Revenues Principal Interest Total Coverage
2012 865$ -$ 865$ 610$ 255$ 865$ 1.00
2013 876 - 876 645 231 876 1.00
2014 874 - 874 670 204 874 1.00
2015 865 - 865 690 175 865 1.00
2016 869 - 869 725 144 869 1.00
2017 851 - 851 740 111 851 1.00
2018 856 - 856 780 76 856 1.00
2019** 864 - 864 825 39 864 1.00
All University Funds pledged revenues consist of charges for services which include room and board fees.
* Certain amounts have been revised to reflect changes made by the Universities.
** The outstanding revenue bonds were refunded.
Source: Information provided by the Treasurer of State, Tobacco Settlement Authority and Universities.
Debt Service
Debt Service*
Business-type Activities - University Funds
(Expressed in Thousands)
223

STATE OF IOWA
Demographic and Economic Statistics
For the Last Ten Calendar Years
Schedule 10
2011 2012 2013 2014 2015 2016 2017 2018 2019 2020
Population (in thousands ) 3,062 3,074 3,090 3,107 3,124 3,135 3,146 3,156 3,155 3,189
Personal income (in millions ) 123,933$ 129,503$ 139,422$ 140,177$ 140,501$ 146,685$ 144,691$ 154,091$ 166,070$ 169,182$
Per capita personal income 40,470$ 42,126$ 45,114$ 45,115$ 44,971$ 46,794$ 45,996$ 48,823$ 52,636$ 53,057$
Resident civilian labor force & employment (annual averages )
Civilian labor force (in thousands ) 1,663.6 1,638.8 1,671.3 1,704.4 1,701.3 1,701.0 1,678.5 1,686.8 1,739.0 1,682.3
Resident employment (in thousands ) 1,565.5 1,553.1 1,593.7 1,630.4 1,638.9 1,638.3 1,626.0 1,644.3 1,691.0 1,595.8
Resident unemployed (in thousands ) 98.0 85.7 77.6 74.0 62.5 62.4 52.5 42.6 47.8 86.4
Percent unemployed 5.9 5.2 4.6 4.3 3.7 3.7 3.1 2.5 2.7 5.1
Employment by industry, non-agricultural (in thousands)
Construction 62.5 64.6 67.4 74.4 78.6 80.9 76.2 77.4 78.1 76.6
Manufacturing 207.4 210.4 214.5 216.8 216.1 213.3 216.3 223.0 226.2 216.6
Trade, transportation & utilities 301.9 306.8 311.4 312.9 316.0 316.2 314.8 312.8 310.3 300.9
Information 27.9 27.1 26.1 25.6 24.7 22.6 22.0 22.0 21.3 19.1
Financial activities 100.3 101.6 103.4 104.2 105.7 108.5 109.2 109.1 109.7 109.3
Professional & business 123.5 129.5 131.9 136.1 139.2 138.6 139.4 140.9 139.3 134.9
Education & health 215.9 220.6 223.2 223.2 225.0 228.6 231.6 234.7 235.2 224.2
Leisure & hospitality 130.6 134.2 136.7 137.9 139.7 142.6 143.5 143.8 144.7 118.4
Other services 56.5 57.7 60.2 61.3 62.4 61.7 59.9 60.0 60.9 56.7
Government 249.8 254.0 255.4 255.5 254.8 257.9 260.3 260.5 260.3 251.9
Total non-agricultural employment 1,476.3 1,506.5 1,530.2 1,547.9 1,562.2 1,570.9 1,573.2 1,584.2 1,586.0 1,508.6
Source: U.S. Department of Commerce, Bureau of Economic Analysis and Iowa Workforce Development, Labor Market Information Unit in cooperation with the U.S. Department of
Labor, Bureau of Labor Statistics.
224

STATE OF IOWA
Principal Non-governmental Employers
Prior Calendar Year and Nine Years Ago
Schedule 11
Rank Employer Type of Business
1 Hy-Vee Food Stores Retail Food
2 Wal-Mart Retail General Merchandise
3 Wells Fargo Financial Activities
4 Mercy Health Services Health Care Services
5 Tyson Fresh Meats Food Manufacturing
6 Deere and Company Machinery Manufacturing
7 Casey's General Store Convenience Stores
8 Rockwell Collins, Inc. Equipment Manufacturing
9 Fareway Food Stores Retail Food
10 Principal Financial Group Finance & Insurance
Rank Employer Type of Business
1 Hy-Vee Food Stores, Inc. Retail Food
2 Wal-Mart Stores, Inc. Retail General Merchandise
3 Wells Fargo Bank NA Finance
4 Deere and Company Machinery Manufacturing
5 Rockwell Collins, Inc. Equipment Manufacturing
6 Principal Life Insurance Company Life Insurance
7 Tyson Fresh Meats, Inc. Food Manufacturing
8 Fareway Food Stores, Inc. Retail Food
9 Casey's General Store Convenience Stores
10 Iowa Health Systems Health Services
Source: Iowa Workforce Development
The Code of Iowa defines employee counts as confidential data; as such, this information is not available.
CALENDAR YEAR 2020
CALENDAR YEAR 2011
225

STATE OF IOWA
Significant Classes of Capital Assets by Function Schedule 12
2012 2013 2014 2015 2016 2017 2018 2019 2020 2021
ADMINISTRATION & REGULATION
Department of Administrative Services
Land (acres) 138 138 138 138 138 138 150 150 150 150
Buildings & improvements (square footage) 1,810,569 2,708,428 2,454,890 2,454,890 2,558,182 2,489,205 2,468,257 2,468,257 2,468,257 2,468,257
Machinery & equipment 985 594 627 341 321 300 282 284 275 270
Alcoholic Beverages Division
Land (acres) 15 15 15 15 15 15 15 15 15 15
Buildings & improvements (square footage) 181,966 181,966 181,966 181,966 181,966 181,966 181,996 181,996 206,996 206,996
EDUCATION
Iowa Public Television
Land (acres) 208 208 208 208 208 209 209 209 209 209
Buildings & improvements (square footage) 75,500 75,500 75,500 75,500 75,500 75,500 75,500 75,500 75,500 75,500
Machinery & equipment 927 876 873 801 797 786 780 786 776 739
Iowa Braille & Sight Saving School
Buildings & improvements (square footage)* 190,612 190,612 190,612 190,612 190,612 190,612 190,612 190,612 190,612 -
Iowa School for the Deaf
Buildings & improvements (square footage) 407,426 407,426 407,426 407,426 407,426 407,426 407,426 407,426 407,426 407,426
HEALTH & HUMAN RIGHTS
Department for the Blind
Buildings & improvements (square footage) 100,000 100,000 100,000 100,000 100,000 120,000 120,000 120,000 120,000 120,000
Machinery & equipment 199 198 194 182 177 176 166 167 183 246
Veterans Home
Land (acres) 158 158 158 158 158 158 158 158 158 158
Buildings & improvements (square footage) 886,711 886,711 891,811 891,811 891,811 891,811 909,073 909,073 909,073 909,073
Machinery & equipment 298 373 509 561 629 640 720 789 790 811
Department of Public Health
Machinery & equipment 466 471 478 504 593 502 553 417 453 575
HUMAN SERVICES
Department of Human Services & Institutions
Land (acres) 1,965 1,965 1,965 1,965 1,965 1,965 1,965 1,757 1,757 1,757
Buildings & improvements (square footage) 4,243,591 4,243,591 4,243,591 4,222,668 4,222,668 3,448,804 3,448,804 3,448,804 3,376,656 3,376,656
Machinery & equipment 1,807 1,900 1,946 1,930 1,823 1,738 1,728 1,740 1,526 1,524
Capital Intensive Departments Only
For the Last Ten Fiscal Years
(continued on next page)
226

STATE OF IOWA
Significant Classes of Capital Assets by Function Schedule 12
2012 2013 2014 2015 2016 2017 2018 2019 2020 2021
JUSTICE & PUBLIC DEFENSE
Department of Corrections & Correctional
Facilities
Land (acres) 484 476 476 238 238 238 238 238 238 1,738
Buildings & improvements (square footage) 3,958,161 3,978,657 4,213,108 4,213,108 4,685,047 5,328,016 5,304,224 5,306,324 5,303,181 5,304,643
Machinery & equipment 1,500 1,610 1,793 1,895 2,181 1,922 2,278 2,320 2,299 2,364
Judicial Districts
Land (acres) 66 66 66 68 68 68 68 68 68 68
Buildings & improvements (square footage) 568,765 645,656 663,644 663,203 663,203 663,203 663,203 663,203 663,183 663,203
Machinery & equipment 310 305 320 334 336 338 354 340 334 346
Department of Public Defense
Land (acres) 2,688 2,688 2,688 2,769 2,769 2,994 3,113 3,121 3,121 3,293
Buildings & improvements (square footage) 2,702,403 2,909,624 2,887,427 2,857,147 2,857,147 2,807,365 2,815,120 2,723,484 2,611,437 261,437
Machinery & equipment 401 466 486 490 490 496 493 488 530 549
Department of Public Safety
Land (acres) 60 60 60 60 60 60 60 60 60 60
Buildings & improvements (square footage) 151,160 151,160 151,160 151,160 151,160 151,160 151,160 151,160 151,160 162,584
Machinery & equipment 1,806 1,904 1,929 1,950 2,122 2,098 2,112 2,206 2,303 2,931
ECONOMIC DEVELOPMENT
Iowa Workforce Development
Buildings & improvements (square footage) 129,822 129,822 129,822 129,822 129,822 129,822 129,822 129,822 129,822 129,822
Machinery & equipment 262 282 262 241 234 185 181 184 177 180
TRANSPORTATION
Department of Transportation
Land (acres) 7,069 7,138 6,943 5,245 4,580 4,233 3,984 4,082 3,908 3,881
Buildings & improvements (square footage) 2,413,888 2,474,076 2,494,219 2,560,921 2,590,038 2,565,443 2,604,705 2,618,644 2,625,310 2,634,956
Highway lane miles 237,115 237,394 237,391 237,588 237,637 238,364 236,814 236,968 231,690 237,397
Heavy equipment 6,101 6,238 6,416 6,463 6,695 6,779 7,102 7,407 7,878 8,202
Machinery & equipment 3,313 3,276 3,621 3,532 3,839 3,901 3,952 4,055 4,124 4,183
AGRICULTURE & NATURAL RESOURCES
Department of Natural Resources
Land (acres) 173,921 174,632 176,972 180,710 184,546 189,678 192,337 196,322 200,304 202,830
Buildings & improvements (square footage) 662,577 784,815 810,633 584,218 850,613 859,335 901,579 911,063 917,092 909,456
State parks 71 71 71 71 71 72 72 72 72 72
Wildlife management areas 16 16 16 16 16 16 16 16 16 16
Machinery & equipment 2,343 2,186 2,083 2,065 2,265 2,217 2,118 2,184 2,245 2,155
Source: Information provided by the Departments.
* Iowa Braille and Sight Saving School sold all buildings in 2021
Capital Intensive Departments Only
For the Last Ten Fiscal Years
(continued)
227

STATE OF IOWA
Operating Indicators by Function
For the Last Ten Fiscal Years or as Identified
Schedule 13
2012 2013 2014 2015 2016 2017 2018 2019 2020 2021
ADMINISTRATION & REGULATION
Department of Administrative Services
State employees covered by benefit plans 19,315 18,421 18,145 17,966 17,602 17,224 16,474 16,333 16,459 16,484
Number of State payroll warrants processed * 502,198 495,234 485,222 461,371 488,231 461,197 441,669 440,578 444,908 447,035
EDUCATION
Department of Education
Enrollment:
Public schools 473,504 476,245 478,921 480,772 483,451 485,147 486,264 487,651 490,094 484,159
Universities 73,948 74,811 76,465 78,047 80,132 81,899 80,066 77,860 75,128 71,795
Community colleges 105,975 100,519 94,234 93,722 93,074 91,430 90,531 89,894 88,375 81,749
HEALTH & HUMAN RIGHTS
Department for the Blind
Number of clients served 6,971 6,617 9,158 7,024 6,150 6,835 7,284 6,840 6,745 6,601
HUMAN SERVICES
Department of Human Services
Average number of residents/patients 911 872 834 690 680 668 646 630 614 541
Average number of Medicaid recipients 393,664 401,129 405,704 406,155 416,285 424,916 423,924 428,601 427,797 468,144
JUSTICE & PUBLIC DEFENSE
Department of Corrections
Average number of inmates 10,022 9,635 9,622 9,731 9,742 9,865 9,902 10,034 9,663 7,527
ECONOMIC DEVELOPMENT
Iowa Workforce Development
Number of unemployment claims
accepted (calendar year) 99,107 94,474 93,158 92,606 88,566 79,125 74,064 78,695 315,701 75,639
Unemployment insurance regular benefits
paid (in millions, calendar year) 417.0 418.8 402.6 417.6 423.5 402.6 364.7 381.8 1,254.2 404.7
TRANSPORTATION
Department of Transportation
Automobile driver licenses issued 810,494 1,052,641 1,122,199 981,512 873,457 793,156 1,000,189 991,867 793,587 754,178
Vehicles weighed (in thousands, federal fiscal year) 793 1,043 812 837 760 880 890 755 571 546
AGRICULTURE & NATURAL RESOURCES
Department of Natural Resources
Hunting & fishing licenses issued 1,413,309 1,559,955 1,330,709 1,443,919 1,935,104 1,431,849 1,431,008 1,452,288 1,629,460 1,233,878
Source: Information provided by Departments.
* - Centralized State Payroll system only - excludes the Universities, Department of Transportation, Judicial Districts and certain other departments.
228

STATE OF IOWA
Number of Employees - Primary Government
For the Last Ten Fiscal Years
Schedule 14
2012 2013 2014 2015 2016 2017 2018 2019 2020 2021
Administration & regulation 2,073 1,993 1,936 1,910 1,925 1,928 1,924 1,904 1,921 1,917
Education 1,067 1,036 1,019 1,026 1,028 1,018 1,092 1,080 1,117 1,075
Health & human rights 1,710 1,746 1,755 1,743 1,767 1,801 1,620 1,637 1,632 1,625
Human services 5,441 5,395 5,170 4,986 4,838 4,689 4,450 4,235 4,251 4,309
Justice & public defense 6,415 6,371 6,327 6,339 6,195 6,059 5,769 5,761 5,891 5,871
Economic development 853 757 711 668 662 663 644 607 629 644
Transportation 2,908 2,899 2,996 2,883 2,992 2,913 2,833 2,703 2,760 2,833
Agriculture & natural resources 1,450 1,482 1,468 1,469 1,449 1,433 1,333 1,407 1,444 1,417
Universities 39,736 39,315 42,284 42,723 43,463 44,339 45,065 44,390 46,187 43,591
Other enterprise funds 178 174 172 169 171 174 174 164 253 168
Total primary government 61,831 61,168 63,838 63,916 64,490 65,017 64,904 63,888 66,085 63,450
Source: Department of Administrative Services
229

STATE OF IOWA
Schedule of Current Expenditures - General Fund
Year Ended June 30, 2021
(Expressed in Thousands)
Schedule 15
Licenses Total
Personal Travel & Contractual Equipment Claims & Permits Plant Current
Services Subsistence Supplies Services & Repairs Miscellaneous & Refunds State Aid Improvement Adjustments Expenditures
Administration &
regulation 152,672$ 4,891$ 6,065$ 93,106$ 4,257$ 1,411,283$ 77$ 996,548$ 21,715$ (228,999)$ 2,461,615$
Education 86,416 488 5,052 43,386 2,217 5,929 6 4,647,672 - 24,275 4,815,441
Health & human rights 128,919 619 11,481 313,858 6,789 324 4 55,884 - 34,186 552,064
Human services 372,136 2,941 17,572 193,498 20,034 1,403 41 7,995,414 50 (107,254) 8,495,835
Justice & public defense 603,379 13,056 48,174 219,868 35,092 9,921 38 134,775 13,503 93,458 1,171,264
Economic development 77,504 366 2,696 83,423 3,435 1,228 - 12,056 - (11,467) 169,241
Transportation 249,371 33,036 60,309 175,583 14,450 1,539 87 78,053 1,261,831 (1,268,311) 605,948
Agriculture &
natural resources 120,764 3,988 6,524 54,092 4,097 884 8 38,855 25,351 (27,725) 226,838
Total primary government 1,791,161$ 59,385$ 157,873$ 1,176,814$ 90,371$ 1,432,511$ 261$ 13,959,257$ 1,322,450$ (1,491,837)$ 18,498,246$
Source: State Financial Accounting System, Judicial Districts, Iowa School for the Deaf and Iowa Braille & Sight Saving School financial statements, and adjusting journal entries from GAAP packages.
230

Dixie Cornell Gebhardt Scrapbooks, State Historical Society of Iowa, Des Moines.
231
231
Department of Administrative Services - Adam Steen, Director
State Accounting Enterprise - Jay Cleveland, Chief Operating Officer
Julie West
GAAP Implementation Section - Stephanie Bernard
Randy Lagerblade
Anieta O'Hair
Marta Sobieszkoda
Lisa Brown
Richard Schoeppner
Marilyn Hanson
Department of Management - Joel Lunde
Brett Conner
ADDITIONAL ASSISTANCE PROVIDED BY
A C K N O W L E D G M E N T S
REPORT PREPARED BY
232

Back Cover: Portrait of the State of Iowa Flag, Hand Drawn by Dixie Cornell Gebhardt Cira 1917
Dixie Cornell Gebhardt created this drawing of the State of Iowa Flag for her scrapbook, and included the following quote:
“I do the very best I know how, the very best I can, and I mean to keep doing so until the end. If the end brings me out all right, what is said against me won’t amount to anything.” Abraham Lincoln
Dixie Cornell Gebhardt Scrapbooks, State Historical Society of Iowa, Des Moines.

Iowa Department of Administrative Services
State Accounting Enterprise
Hoover State Office Building
Des Moines, IA 50319
Phone: 515-281-4840
https://das.iowa.gov/state-accounting
Printed on Recycled Paper