UNIVERSITY OF ROCHESTER LABORATORY FOR LASER ...
61
UNIVERSITY OF ROCHESTER LABORATORY FOR LASER ENERGETICS Volume 70 January-March 1997 DOE/SF/l9460- 164
-
Upload
khangminh22 -
Category
Documents
-
view
0 -
download
0
Transcript of UNIVERSITY OF ROCHESTER LABORATORY FOR LASER ...

UNIVERSITY OF ROCHESTER LABORATORY FOR LASER ENERGETICS
Volume 70 January-March 1997 DOE/SF/l9460- 164

Printed in the United States of America Avalable from
National Technical Information Services U S Department of Commerce 5285 Port Royal Road Spnngfield,VA 22161
Price codes PrintedCopy A03 Microfiche A01
About the Cover:
During the weekly maintenance inspection, Amy Rigatti, a se- nior laboratory engineer, uses a white-light fiber-optic probe to check the surface of one of the 60 final turning mirrors for pos- sible plasma scalds. These mirrors, located in the OMEGA target area, are some of the largest conventional optics on the system. The largest mirror is 14 in. x 27 in. x 3 in. and weighs approxi- mately 70 lbs.
This report was prepared as an account of work conducted by the Laboratory for Laser Energetics and sponsored by New York State Energy Research and Development Authority, the Univer- sity of Rochester, the U.S. Department of Energy, and other agencies. Neither the above named sponsors, nor any of their employees, makes any warranty, expressed or implied, or assumes any legal liability or responsibility for the accuracy, complete- ness, or usefulness of any information, apparatus, product, or process disclosed, or represents that its use would not infringe privately owned rights. Reference herein to any specific com- mercial product, process, or service by trade name, mark, manufacturer, or otherwise, does not necessarily constitute or imply its endorsement, recommendation, or favoring by the United States Government or any agency thereof or any other sponsor. Results reported in the LLE Review should not be taken as nec- essarily final results as they represent active research. The views and opinions of authors expressed herein do not necessarily state or reflect those of any of the above sponsoring entities.
The work described in this volume includes current research at the Laboratory for Laser Energetics: which is supported by New York State Energy Research and Development Authority, the University of Rochester, the U.S. Department of Energy Of- fice of Inertial Confinement Fusion under Cooperative Agreement No. DE-FC03-92SF19460, and other agencies.
For questions or comments, contact 'Richard Town, Editor, Laboratory for Laser Energetics, 250 East River Road, Roches- ter, NY 14623-1299, (716) 275-1440.

DISCLAIMER
,,: y; .,. , . , . , , I .
This report was prepared as an account of work sponsored by an agency of the United States Government. Neither the United States Government nor any agency thereof, nor any of their employees, makes any warranty, express or implied, or assumes any legal liability or responsi- bility for the accuracy, completeness, or usefulness of any information, apparatus, product, or process disclosed, or represents that its use would not infringe privately owned rights. Refcr- ence herein to any specific commercial product, process, or service by trade name, trademark, manufacturer, or otherwise does not necessarily constitute or imply its endorsement, recom- mendation, or favoring by the United States Government or any agency thereof. The views and opinions of authors expressed herein do not necessarily state or reflect those of the United States Government or any agency thereof.
E a
00 4 N P
m 00 0
W 3. %
L. L. L.
13
in 0
ip" 0 er 3 rc c.3

DECLAIMER
Portions of this document may be illegible in electronic image products. fmapes are pFodpc?ed from the best available original document.

In Brief
This volume of the LLE Review, covering the period January-March 1997, includes an article on the status of the optics on the OMEGAlaser system after the first 18 months of operation. Avigorous program to monitor the performance of the optics has been followed since the inception of the OMEGAlaser. The article presents results from these observations and defines the various types of possible damage. Many of the optics have not damaged, such as the frequency-conversion crystals, polarizers, calorimeters, and liquid crystal optics. The most significant damage has been sustained by the fused-silica spatial filter lenses. There has been no evidence of any propagation of damage downstream of damaged optics. In fact, after 1000 target shots the OMEGA laser has sustained remarkably little damage.
Other highlights of research presented in this issue are
The development of a single-beam, ponderomotive optical trap for energetic free electrons. Numerical results show that a phase mask can form a central intensity minimum, producing a three-dimensional ponderomotive trap. A novel segmented wave plate has been manufactured and used on the T3 laser to experimentally confirm the existence of this three-dimensional structure. Work continues to confirm the trapping properties of this unique optical device.
A description of the new diode-pumped Nd:YLF master oscillator for the OMEGA laser. Special attention is paid to ensure long pulse operation and high stability. Experimental results are presented that confirm the excellent amplitude stability, low timing jitter, and long-term frequency stability of the new master oscillator.
Simulations of heat transfer from localized absorbing defects to the host coating material inHfOz/Si02 35 1 -nm high reflectors. Atomic-force microscopy has shown laser-induced submicron cratering of UV multilayers, which has been attributed to nanoscale, localized absorbers. A description of the model used to simulate these absorbers is presented. When thermal conduction is the only heat- transport mechanism, very high defect temperatures are required to explain the measured damage; consequently, other physical mechanisms must be considered.
An experimental study of target performance and mixing in titanium-doped target implosions on OMEGA. Results from arecent experiment show the predicted absorption features from a thinTi layer. These features were used to estimate the core temperature and pR of the compressed target. In addition the EXAFS spectrum above the Ti K edge was observed for the first time in an implosion experiment that enabled the density of the Ti layer to be measured. These experimental techniques will be important in measuring improvements in target performance as OMEGA’S uniformity improves.
A theoretical calculation of the dephasing time of an electron accelerated by a laser pulse. The trajectory of a charged particle, determined analytically for various pulse shapes, is then used to determine the dephasing time of an accelerated particle.
Richard Town Editor
... 111

Status of Optics on the OMEGA Laser after Eighteen Months of Operation
The OMEGA laser has sustained approximately 1000 target shots over its first 18 months of operation without significant damage to the optics. Both rod and disk amplifiers are used in the OMEGA laser chain; after each amplification stage at 1 w the beams are spatially filtered to remove high-spatial-fre- quency noise in the beam and to ensure correct image relaying. Optical damage thresholds dictated the minimum beam diam- eter in each stage and fixed the magnification between stages. The final 28-cm beam propagates through thin-film polarizers before reaching the frequency-conversion cells. 1-3 Frequency conversion to the third harmonic (35 1 nm) is carried out using the polarization-mismatch method developed at LLE.435 A set of mirrors transports the 3w beams through a final focus lens, and the last optic in the beam path serves as the vacuum barrier for the target chamber.
Fundamental to LLE’s OMEGA operating philosophy is a maintenance plan to ensure (1) prevention of costly damage to system components and (2) reliable and efficient operation of the system.6 One part of this preventative maintenance plan involves an estimated 3000 optics on the OMEGA laser sys- tem, not including laser glass, driver-line optics, and diagnostic components. The Optical Manufacturing Group is responsible for coordinating the inspection of these optics and tracking this information. On a periodic basis, the optical components are inspected for laser damage, coating degradation, and particu- late contamination. During planned shutdown periods, extensive maintenance (cleaning, recoating) and replacement of optics occur. To date, the majority of optics on the OMEGA laser system have not been damaged, and there is no propagating bulk or surface damage to components downstream of dam- aged optics. While the current optics replacement rate is below the anticipated rate of 10% per year, this rate is expected to increase as the laser ages. In the sections that follow, a review of the types of optical component degradation is presented.
Laser-Damage Classification In discussing laser damage, a distinction is made between
operational and accidental system damage. An optic damaged when the laser operates within normal design limits is classi-
fied under operational damage; whereas, accidental damage occurs when the laser operates outside the design limits. This classification is useful because accidental damage can result in significant damage to an optic, but it is not an indication of continuing problems with that component. Tracking optics damaged due to routine laser operation results in statistical information about the longevity of a particular optic; this information is incorporated into decisions regarding an appro- priate spare optic inventory. Observations of an optic’s mean lifetime are necessary to determine an effective and economi- cal spares program.
1. Operational Laser Damage As the laser continues to operate, it is not surprising to
observe operational damage in optics located at high-fluence positions of the laser. Figure 70.1 shows a staging diagram that plots the peak design fluence-average fluence times a 1.8 intensity modulation factor-at each stage of a single beamline on OMEGA.7 The bold lines indicate areas where laser damage is occurring at present. Specific damage morphologies are presented on p. 52.
2. Accidental Laser Damage While accidental laser damage occurs infrequently, it can
result in significant optics damage. During the activation stage of OMEGA, six optics were damaged in a single shot when light back-propagated after striking the edge of an improperly positioned spatial filter pinhole assembly. The ring of damage is located at the edge of the beam diameter and was caused by the radial edge gain from the rod amplifiers. This beam imprint was observed on several mirrors and the liquid crystal compo- nent shown in Fig. 70.2.
Another instance of accidental damage was the develop- ment of a small damage site in one-third of the 3wfinal focus lenses. A design analysis that locates the focus of unwanted surface reflections eliminated the possibility of a ghost reflec- tion as the cause of this damage site.8 The single, bulk damage site is less than I rnm in diameter and is located at the optic’s center near the exit surface. The damage has not propagated to
LLE Review, Volume 70 51

STATUS OF OPTICS ON THE OMEGA LASER
10 Damage occurring in system 3 0
Stage A B C D E F - \ -\ 90 \ W W W 90
Rod M=1.46 Rod M=1.0 Rod M=1.724 Disk M=1.33 Disk M=1.4 FCC
G4060
"P "P "P amp 4x15 4x20
Figure 70.1 Peak design fluence plotted at each stage of the OMEGA laser. Operational laser damage is occurring at the high fluence positions.
G3887
Figure 70.2 A malfunctioning spatial filter pinhole assembly caused the accidental damage to this liquid crystal polarizer component (135-mm diameter).
the blastshield optic located about 75 mm in front of the lens or to opposing beam port optics. Figure 70.3 shows a timeline of the discovery of damaged focus lenses. At the end of OMEGA activation, a large number of focus lenses were suspected to have damage, with only a slight increase since the initial observation. We believe this damage does not result from the normal operation of the laser because the plot of energy does not correlate with the number of damaged lenses
reported. However, continued laser operation does contribute to the growth of the existing accidentally damaged site. During activation, a train of short pulses propagated down the system and were frequency converted to 2w, instead of 30, which may have caused the damage. Since the sol-gel coating was designed for 313, a 2%-3% surface reflection occurs at 20.1. Analysis of multiple beam reflections inside the lens results in the formation of a 2w caustic at the lens' center position 2 mm from the exit ~ur face .~
Damage Morphologies The damage observed on an optic can be classified as either
stable or unstable. Given that the optical components will damage, it becomes important to distinguish between damage that is catastrophic to laser operation and damage that is tolerable. Stable damage does not affect the laser's perfor- mance and does not cause propagation of damage to other downstream optics. In addition, this type of damage does not appear to grow significantly on successive laser shots. Un- stable damage does grow on subsequent laser shots and eventually prevents the safe operation of the laser. Unstable damage may result in catastrophic failure of a component; additionally, this type of damage could cause propagation of damage to other optics in a beamline. For these reasons, optics with unstable damage are monitored frequently for changes in damage size, and replacement occurs before the damage reaches a critical value.
52 LLE Review, Volume 70

STATUS OF OPTICS ON THE OMEGA LASER
5 s .3
G4105
20
15
10
5
0
OMEGA activation 25
8’
P’
N’
3/95 5/95 1/95 9/95 11/95 1/96 3/96 5/96 7/96
1. Stable Damage The occurrence of stable damage on OMEGA has been
documented since activation of the laser system. Two forms of damage have been observed: (1) self-focusing damage in spatial filter lenses and (2) plasma scalds on transport mirrors.
Self-focusing damage is seen infrequently in OMEGA lenses. Currently, nine fused silica lenses have evidence of “angel-hair” tracking, which occurs in the bulk material. These tracks appear as a linear sequence of microscopic damage in the bulk of the optic aligned with the propagation axis. Table 70.1 provides a list of the damaged components and the peak fluences they are subject to.
Figure 70.4 shows a photograph of self-focusing damage observed on an OMEGAlens. The large white spot is in the exit surface of the lens, and the typical diameter of this damage area is 1 mm. This large area contains a number of smaller, indi- vidual damage sites formed when the self-focusing tracks intercepted the output surface of the lens. These sites do not seem to grow on successive laser shots.
Plasma scalds are frequently seen on OMEGA’S 3 0 transport mirrors. As seen in Fig. 70.5, scalds appear as a
160 140 120 f 100 a, E $ 2 80 3 60 E %
5 40 3
I -
m 20 0
Figure 70.3 Observation timeline of OMEGA final focus lenses. The left axis plots the number of damaged focus lenses observed over the lifetime of the laser. The right axis plots the 3w cumulative energy per beam over that same time frame.
S2 interface k t l Bulk
G4097
w 1 mm
Figure 70.4 “Angel-hair” tracking damage observed in the bulk glass of an OME( stage-F input lens. The large bright area is the exit surface of the lens.
Table 70.1: Summary of the number of optics with self-focusing damage.
Component Damaged Lenses/ Design Peak Fluence Total Lenses (J/cm2) with 1.1-ns pulse
Stage-E input spatial filter lens (lo) 1/60 5.0
Stage-F input spatial filter lens (lo) 5/60 6.6
Primary pickoff lens ( 3 ~ ) 3/60 2.9
LLE Review, Volume 70 53

STATUS OF OPTICS ON THE OMEGA LASER
G4061 H 5.0 mm
Figure 70.5 Plasma scalds are frequently seen on OMEGA's 3w transport mirrors.
discoloration on the coated surface of the mirror. Scalds are initiated where particulates are on the mirror surface during a laser shot and are caused by an increase of temperature on the surface during plasma formation. OMEGA transport mirrors are not contained in enclosed structures but are mounted in open, upward/downward-facing structures. This open archi- tecture, which allows personnel access to target chamber equipment, results in an increased level of contamination on target bay optics as opposed to laser bay optics, which are vertically mounted with protecting covers on the structures. These plasma-scald defects do not grow in size on subsequent
.-- --e-
0 1 6 5 6 5 5 11 ' ' I I ' I I
5/95 7/95 9/95 11/95 1/96 3/96 5/96 7/96 G4062
laser shots, but the number of scalds per surface may increase. At this time, no reflectance data is available to determine how plasma scalds affect performance of the mirror coating.
2. Unstable Damage OMEGA optics that exhibit unstable damage include
(1) tantalalsilica-coated beam splitters, ( 2 ) BK-7 spatial filter lenses, and ( 3 ) fused-silica, input spatial filter lenses. Damage to these optics continues to grow on subsequent laser shots. The rate of growth and size of damage are dependent upon the type of damage observed.
All tantala/silica beam splitters located in OMEGA's C-split region (which is the region with the highest fluence of any multilayer coating) have significant damage after 18 months of laser operation. From Fig. 70.6, it is apparent that this damage was not accidental but operational laser damage. As the beam splitters continued to see an increase in 1 w cumula- tive energy, the observed number of damaged beam splitters increased. Microscopic evaluation of a beam splitter revealed coating-damage sites that were initially 50 to 100 pm in size and 7 pm deep. This depth indicates that the tantala/silica coating is damaged at the substrate interface. The size of these damage sites continues to grow on successive laser shots. Figure 70.7 shows a photograph of a beam splitter with the damage sites illuminated within the beam diameter.
During the OMEGA Upgrade, two types of beam splitters were produced using either the tantalalsilica design or the hafnia(metal)/silica design. Hafnia(metal)/silica-coated beam splitters located in the same area as the tantala/silica beam splitters show no signs of coating damage, even though they have the same test damage threshold.ll These test damage thresholds (reported in Fig. 70.8) were taken on a limited num- ber of sites, and, as a result of this limited statistical process,
300
250 i? ? F j
200 8 150 3 5 100 E 0 8
3 50 - 0
Figure 70.6 Observation timeline of OMEGA's stage-C beam splitters. The left axis plots the number of damaged beam splitters observed over the lifetime of the laser. The right axis plots the 1 w cumulative energy per beam over that same time frame.
54 LLE Review, Volume 70

STATUS OF OPTICS ON THE OMEGA LASER
Figure 70.7 Coating damage observed on a 5.5-in. x 7.5-in. OMEGA stage-C, tantala/ silica beam splitter. The highest fluence seen by a multilayer coating is in the C-split area.
defect sites may have been missed. The results on OMEGA are equivalent to full-aperture testing, and this type of testing has revealed significant differences in damage thresholds between the two materials. The highest fluence seen by a multilayer coating is in the C-split area (which is 4.1 J/cm2). Beam split- ters in other areas see a lower fluence (typically -1 J/cm2), and neither design has demonstrated any sign of significant dam- age in these low fluence areas.
Isolated bulk damage sites have been seen in a number of OMEGA BK-7 spatial filter lenses. A summary of the loca- tion and number of damaged optics is provided in Table 70.11. The peak design fluence is the average fluence times a 1.8 intensity modulation factor.
Each lens has one to four damage sites, ranging in size from 50 to 800 pm, occurring at varying depths within the bulk glass. Photographs of damage sites from an OMEGA lens are shown in Fig. 70.9. Microscopic evaluation revealed damage sites
lo beam splitters
16
2o i Maximum
6 7 E 2 3 z d 2 G
0
0.0 cd
- _ n O 1 ; ; 4 o-+ -7
Minimum 0
Ta2O5/ HfOz (metal)/SiOZ Si02
G4084a
Figure 70.8 Damage thresholds for tantalalsilica and hafnia(metal)/silica beam-splitter coatings measured at 1054 nm with a 1-ns pulse at p-polarization.
with radial fractures forming a circular pattern perpendicular to the beam. This type of fracture pattern is characteristic of platinum-inclusion damage. l2 Previous data reported by LLNL showed that platinum inclusions in phosphate glass cause fractures when irradiated by laser pulses above a threshold value of 2.5 to 3.0 J/cm2 with a 1-ns pulse.13 These fractured sites do grow upon repeated irradiation, but this growth rate is slow with respect to a bimonthly inspection cycle. During inspection cycles, sizes are visually estimated by observation with a white-light source. Quantitative microscopic evaluation is difficult on in-situ optics inspection, so an accurate estimate of damage growth rate is not available. Currently, we have not observed any damage propagation from these lenses to other optics in the beam path.
Table 70.11: Summary of the number of optics with bulk damage sites.
Damaged Lenses/ Design Peak Fluence Component Total Lenses (J/cm2) w/l.l-ns pulse
Stage-C relay lens (idout) 8/60 2.3
Stage-E output lens 7/60 3.0
I Stage-F output lens I 34/60 I 3.6 I
LLE Review, Volume 70 5

STATUS OF OPTICS ON THE OMEGA LASER
Large-scale fractured damage sites have been observed in OMEGA'S stage-C, -D, -E, and -F input fused-silica spatial filter lenses. These areas of the system see some of the highest 1 w fluences and exceed the 2.5 J/cm2 criterion for the use of fused silica as opposed to BK7 glass (see Fig. 70.1 for the peak fluence in the OMEGA laser chain). The highest peak design 1 w fluence is at the F-input lenses with a fluence of 6.6 J/cm2. The lowest lw fluence seen by these lenses is the C input, which has a fluence of 4.1 J/cm2. Figure 70.10 shows a good correlation between the number of damaged lenses and the 1 w cumulative energy per beam plotted over the same time frame. As the 1 w cumulative energy per beam increases, the number of lenses with fractured damage sites also increases, indicating a form of operational damage.
The damage occurs on the exit vacuum side of the lens at random locations, and the sites grow in size on subsequent laser shots. The damage does not correlate to hot spots in the beam and is believed to be initiated at surface particulate sites. Some possible contamination sources are particulate blowoff from the pinhole and debris from fabrication of the spatial filter vacuum tubes. A fraction of the beam strikes the edge of the pinhole, causing material to vaporize and redeposit on the vacuum side of the input spatial filter lens. Investigation into the cause of this damage is ongoing. The fracture pattern from one of these damage sites is seen in Fig. 70.1 1.
The vacuum surface of an OMEGA spatial filter lens is under tensile stress, and any damage to this vacuum surface can
Figure 70.9 Damage patterns observed on an OMEGA stage-F, BK-7, output spa- tial filter lens. Fracture patterns indicate platinum-inclusion damage.
25 I I I I I I I I I I I I I I 300
250 A
i? 200 8
a, + 150 '2 3 ;
3 50 - 0
100 g
Figure 70.10 Observation timeline of OMEGA fused-silica, input spatial filter lenses. The left axis plots the number of damaged spatial filter lenses observed over the lifetime of the laser. The right axis plots the lw cumulative energy per beam over that same time frame.
5/95 7/95 9/95 11/95 1/96 3/96 5/96 7/96
LLE Review. Volume 70

STATUS OF OPTICS ON THE OMEGA LASER
Figure 70.1 1 Fractured damage site observed on an OMEGA stage-C input, spatial filter lens.
lead to catastrophic crack growth if the flaw size reaches a critical value a,. The critical flaw depth a, depends on the shape of the flaw with respect to the applied stresses and can be calculated from14
where K, = fracture toughness of the glass, Y = geometrical factor of the flaw, and CY = bending stress induced by atmo- spheric pressure.
Actual defects on OMEGA spatial filter lenses are shallow and elliptical, and these defects can be simulated with a half- penny-shaped defect (Y = 1) that has a surface diameter twice the defect depth. For an OMEGA stage-F input lens, 25 mm thick and 283 mm in diameter, a critical flaw depth of 8 mm is calculated for a half-penny defect on the vacuum side of a lens subjected to a tensile stress of 615 psi. Adefect of this size will be easily detected before catastrophic failure occurs.
It is also important to understand how these lenses will fracture to avoid implosion of the lens when it is under a full vacuum load. Lens fracture on Nova and Beamlet was modeled at LLNL, where it was reported that the design of a “fail-safe” lens probably requires a stress (r < 700 psi.15 A fail-safe lens would generate one large fracture and would not implode. The
maximum bending stress for an OMEGA stage-F input lens is 615 psi and occurs at the center of the lens. If the model is correct, these lenses under full vacuum should not implode into several fragments when defects reach their critical flaw size but should crack into two pieces and lock together as long as the mount restrains the radial motion of the fragments. Although damage on the vacuum side of OMEGA spatial filter lenses has been observed, there has been no incident where an OMEGA spatial filter lens has cracked into several pieces. For safety concerns, OMEGA optics will be removed when defects reach one-half their critical flaw size (Le., when the depth is 4 mm). For convenience we measure the surface trace in situ and replace any lenses with a surface trace of 8 mm (which would imply a depth of 4 mm if the flaw is penny shaped). We have replaced two lenses that had surface traces of 8 mm. Later depth measurements showed only a depth of 2 mm, well within the criteria for failure.
Optical Property Changes OMEGA’S sol-gel coatings show a significant change in
reflectivity when exposed to a vacuum. A guided wave spec- trometer is used to measure the reflectivity of optics mounted on OMEGA. While the instrument is not photometrically accurate, the shape of the spectral curve does provide informa- tion on the performance of the coating. The spectral data in Fig. 70.12 was taken on a 1 ~(1053-nm) sol-gel-coated spatial filter lens. While the S 1, non-vacuum-side, reflectivity curve is as expected for a 1 u antireflection coating, the S2, vacuum- side data indicates that the porous sol-gel coating has adsorbed some organic material, which has affected its coating perfor- mance. Evaluation of the contaminated sol-gel coating by gas chromatography mass spectrometry detected the presence of
3.5
I I I I I I I I I I 1 8 ’ 1
300 466 633 799 966 1133 1300
G4064 Wavelength (nm)
Figure 70.12 Reflectance data measured on a sol-gel-coated spatial filter lens. The S2 (in) surface is the vacuum interface. The S1 (out) surface is not exposed to a vacuum.
LLE Review, Volume 70 57

STATUS OF OPTICS ON THE OMEGA LASER
vacuum pump oil. This coating problem is seen on all OMEGA sol-gel-coated spatial filter lenses that are pumped by a me- chanically pumped system. Hard-oxide dielectric coatings pumped under similar vacuum conditions and sol-gel coatings pumped by an ion sublimation pump show no change in reflectivity after exposure to a vacuum. Since OMEGAS optical layout was designed with the assumption of a 4% light loss per surface, damage is not expected from ghost reflections and no system damage has occurred as a result of this coating problem. Two solutions to this sol-gel-coating problem are being investigated: (1 j replace the sol-gel coatings with hard- oxide dielectric coatings and (2) improve the spatial filter pumping system. Sol-gel coatings were used on all fused silica spatial filter lenses since these lenses have the highest lo fluence on the system and sol-gel coatings have, in the past, shown considerably higher damage threshold than hard-oxide coatings. Recent improvements in the hard-oxide coating pro- cess have resulted in increased damage thresholds, which now make them viable replacements to the sol-gel type.
Target Chamber Optics After 1000 target shots, no target chamber optics have been
replaced because of damage. The inside target surface of the blastshield optics has degraded from the impact of target debris, and the damage is in the form of shallow pits ranging in size from 50 pm to 1 mm. Recently, self-focusing damage has been observed in several blastshields’ optics, which serve as the vacuum barrier for the target chamber. Damage to the outside blastshield surface (non-vacuum side) is minimal and usually occurs as a result of mishandling during blastshield replacement. Degradation in the blastshields’ sol-gel coating occurs with prolonged exposure (over 100 days) to the target chamber. This degradation leads to reduced transmission of laser energy to target center. The on-target imaging system (OTIS) diagnostic is used to measure the irradiation unifor- mity and can therefore be used as an in-situ measurement of the performance of the sol-gel coating. We use the OTIS measurement to recommend replacement of the optics with the lowest UV transmission. The baseline replacement rate of blastshield optics is 20 per month; optics are replaced during a regular maintenance day.
Conclusion LLE has implemented a plan to maintain the quality of
OMEGA optics. This preventative maintenance plan involves frequent inspections and in-situ cleaning of optics by a skilled support group as well as proper training of laser operations personnel to prevent optics handling damage. Damaged optics are placed on a critical optics list and are tracked frequently for damage growth. This critical optics list is used to report the current condition of OMEGA optics to the Laser Facility Manager.
This article has focused on specific optics that have started to damage after 18 months of OMEGA laser operation. Com- ponents that have not damaged include frequency-conversion crystals, polarizers, calorimeters, and liquid-crystal optics. In addition, there has been no propagating bulk or surface damage to components downstream of damaged optics.
ACKNOWLEDGMENT This work was supported by the U.S. Department of Energy Office of
Inertial Confinement Fusion under Cooperative Agreement No. DE-FC03- 92SF19460, the University of Rochester, and the New York State Energy Research and Development Authority. The support of DOE does not consti- tute an endorsement by DOE of the views expressed in this article.
REFERENCES 1. T. R. Boehly, R. S. Craxton, T. H. Hinterman, P. A. Jaanimagi, J. H.
Kelly, T. J. Kessler, R. L. Kremens, S. A. Kumpan, S. A. Letzring, R. L. McCrory, S. F. B. Morse, W. Seka, S. Skupsky, J. M. Soures, and C. P. Verdon, Fusion Technol. 26,722 (1994).
2. Laboratory for Laser Energetics LLE Review 55, NTIS document No. DOE/DP/40200-257, 1993 (unpublished), p. 179.
3. Laboratory for Laser Energetics LLE Review 57, NTIS document No. DOE/SF/19460-02, 1993 (unpublished), p. 32.
4. W. Seka, S. D. Jacobs, J. E. Rizzo, R. Boni, and R. S. Craxton, Opt. Commun. 34,469 (1980).
5. R. S. Craxton, IEEE J. Quantum Electron. QIE-17, 1771 (1981).
6. OMEGA System Operations Manual Volume III - Subsystem and Component Maintenance (S-AA-M-14), Laboratory for Laser Energet- ics, University of Rochester (1995), p. 1.
58 LLE Review, Volume 70

STATUS OF OPTICS ON THE OMEGA LASER
7. OMEGA System Operations Manual Volume I - System Description (S-M-M-12) , Laboratory for Laser Energetics, University of Roches- ter (1993, p. 43.
8. C. T. Cotton, in 1995 International Symposium on Optical Science, edited by J. M. Sasian (SPIE, Bellingham, WA, 1995), Vol. 2537, pp. 308-315.
9. C. T. Cotton (private communication).
10. C. Stolz, presented at the Laboratory for Laser Energetics, University of Rochester, Rochester, New York, April 1996.
D. J. Smith, presented at the XXVIII Annual Symposium on Optical Materials for High Power Lasers, Boulder, CO, 7-9 October 1996.
11.
LLE Review,
12. J. H. Campbell, Energy and Technology Review, Lawrence Livermore National Laboratory, UCRL-52000-86-4/5 (1986), p. 12.
13. J. H. Campbell, Lawrence Livermore National Laboratory Laser Pro- gram Annual Report 1985, UCRL-50021-85 (1986), p. 6-2.
14. J. C. Lambropoulos, “Critical Flaw Size for Catastrophic Failure of Fused Silica Spatial Filter Lens,” 1995 (unpublished).
15. J. H. Campbell, G. J. Edwards, and J. E. Marion, in Solid State Lasers for Application to Inertial Confinement Fusion, edited by M. Andr6 and H. T. Powell (SPIE, Bellingham, Wa, 1995), Vol. 2633, pp. 522-534.
16. C. T. Cotton (private communication).
‘olume 70 59

A Single-Beam, Ponderomotive-Optical Trap for Energetic Free Electrons
Traditionally, there have been many advantages to using laser beams with Gaussian spatial profiles in the study of high-field atomic physics. High peak intensities are achieved due to their focusability, they are easily generated in most laser systems, and their focal region can be described analytically. However, free electrons interacting with such a field are rapidly acceler- ated out of the high-intensity region via the ponderomotive force (which is proportional to the gradient of the laser inten- sity).1.2 As a result, the electrons’ interaction time with the intense portions of the laser focus can be much shorter than the pulse duration. In order to observe harmonic generation from oscillating free electrons, one must first control the expulsion of electrons from the focal r e g i ~ n . ~ This confinement can be most easily achieved by creating an intensity minimum at the focus, thereby using the ponderomotive force to push the electrons toward the central minimum. If this intensity mini- mum is non-zero, then the electrons can interact with intense fields while remaining trapped. Such ponderomotive trapping has been proposed in the and specific laser-based schemes to trap electrons in the radial direction have been de~c r ibed .~?~ To our knowledge, such focal spots have not been generated with a high-power laser. In addition, these proposed traps would not confine electrons in the axial (laser propaga- tion) direction. In this article we will present anovel scheme to trap electrons in three dimensions with a single laser beam.
Numerical Results A“trapping” focal region consists of an intensity minimum
surrounded on all sides by higher intensities. To understand how to create such aregion, it is important to adopt aformalism to describe the propagation of light. Huygens’ principle, which states that we can consider every point on a wave front to be a point source for a spherical wave, makes it possible to find the field distribution in some “observation” plane if the field distribution in an earlier “source” plane is known.8Acomputer program has been written to calculate the three-dimensional focal region from an arbitrary, monochromatic laser beam. The “source” plane is the field distribution at the lens, and the “observation” plane is scanned through the focal region. The incident intensity distribution can be created mathematically
(Gaussian, super-Gaussian, flat-top, etc.) or can be entered as a digitized image. The incident phase front is assumed to be uniform, and the lens is assumed to be perfect (although the addition of aberrations is possible). The beam can be passed through phase and amplitude masks on-line in an effort to alter the shape of the focal region.
By passing the beam through amplitude masks, losses are introduced into the system, yet the shape of the focal region is changed only slightly. Figure 70.13(a) shows an incident Gaussian beam [where w is the l/e2 (intensity) radius]. Fig- ure 70.13(b) shows the intensity distribution of the focal region as a function of z (axial or laser propagation direction) and Y (radial direction). The Rayleigh range (zoj and the l/e2 waist (wg) are shown in the figure. Figure 70.13(c) shows the focal spot at z = 0. Blocking the center of the beam [Figs. 70.13(dj- 70.13(f)] or blocking an annular section [Figs. 70.13(g)- 70.13(i)] has little effect on the intensity distribution near the focus. A centrally peaked distribution is formed in all cases.9
As Casperson has shown,1° modulating the phase of the incident beam can result in deep far-field amplitude modula- tion with little loss in total energy. This can be accomplished by placing phase masks in the path of the beam. Of particular interest is the effect of binary phase plates, which add either zero or nphase to portions of the beam. If half of the Huygens’ spherical waves encounter a n-phase shift while the other half do not, we can expect complete destructive interference where they meet. For a focused laser beam, this occurs at the center of the focal region. A simple, two-zoned binary phase plate is shown in Fig. 70.14(a). By passing a Gaussian beam through this plate and focusing it, an altered intensity distribution [Fig. 70.14(b)] is formed. It is important to note that this distribution is not symmetric about the z axis and, therefore, would confine particles in only one dimension. The focal spot is shown in Fig. 70.14(c). A beam similar to the TEM;, mode (commonly referred to as a “donut” mode) can be generated by passing a GaussianTEMoo through a smoothly varying helical phase plate [Fig. 70.14(d)]. Such a phase plate has been generated for millimeter” as well as optical wavelengths. 12,13
60 LLE Review. Volume 70

A SINGLE-BEAM, PONDEROMOTIVE-OPTICAL TRAP FOR ENERGETIC FREE ELECTRONS
The resulting focal region [Figs. 70.14(e) and 70.14(f)] con- fines electrons in the radial direction only. It is also difficult to “tune” the trap minimum away from zero. A scheme has been proposed that combines a donut beam focus with a centrally peaked focus.6 The added complexity of mixing two beams results in a focal region with a tunable center intensity, but the trap would not confine particles in the axial direction.
The binary phase plate shown in Fig. 70.14(g) contains only two zones, yet the focal spot [Fig. 70.14(i)] is surprisingly similar to the one generated by the complicated helical plate. The donut shape near z = 0 confines electrons in the radial direction, and the centrally peaked regions away from z = 0 provide axial trapping [see Fig. 70.14(h)]. The focal region is shown in detail in Fig. 70.15. The zregion of the phase plate
W
E8409
H
wn
Figure 70.13 The effects of amplitude masking on the intensity distributions of a focused Gaussian beam. The first column shows three different near-field intensity distributions. The second column shows the intensity distributions as a function of z and Y (the center of each image corresponds to z = 0, r = 0). The third column shows the focal spots. In order to show the maximum contrast, each image is normalized to its peak value. Note that all of the focal regions are centrally peaked.
LLE Review, Volume 70 61

A SINGLE-BEAM, PONDEROMOTIVE-OPTICAL TRAP FOR ENERGETIC FREE ELECTRONS
has a diameter of 1.65 w [where w is the l/e2 (intensity) radius of the incident Gaussian beam]. This results in a z-phase shift for half of the incident field. The calculated intensity in the focus is normalized to the peak intensity in the absence of the phase plate. The r and z positions are normalized to the unaltered beam waist wo ( l/e2 radius) and the unaltered beam Rayleigh range zO, respectively. Figure 70.15(a) shows a sur- face plot and Fig. 70.15(b) shows a contour plot of the trapping region. There is an exact zero in intensity at the center of the
focus, with intensity walls ranging from -8% to -30% (of the unaltered peak intensity) in all directions. The trapping region has a volume of complete trapping of - 2 ~ 0 2 ~ 0 (bound by the solid contour line of 8.2%). By changing the size of the z region of the phase plate (or, equivalently, by changing the size of the incident beam), the destructive interference at the center of the focus will not be complete, creating a non-zero minimum. Figure 70.16(a) shows the calculated focal distribu- tion for a Gaussian beam incident on a phase plate with a
0
E8410
~
Figure 70.14 The effects of phase masking on the intensity distributions of a focused Gaussian beam. The first column shows three different phase masks. The second column shows the intensity distributions as a function of z and r (the center of each image corresponds to z = 0, Y = 0) when the phase mask is placed before the incident beam. The third column shows the focal spots. In order to show the maximum contrast, each image is normalized to its peak value.
62 LLE Review, Volume 70

A SINGLE-BEAM, PONDEROMOTIVE-OPTICAL TRAP FOR ENERGETIC FREE ELECTRONS
n-region diameter of 2.20 w. Figure 70.16(b) shows a contour plot of the trapping region. In this case, the bottom of the trap is -17% of the unaltered beam peak intensity, and the trap walls range from -24% to -50%. The trapping volume is - wiz0. This focal region is ideal for trapping electrons in a high-field region.
Experimental Setup The phase masks described above can be made by using
photolithographic techniques. However, for the particularly simple geometry that produces a suitable trapping region, a novel segmented wave-plate approach has been developed. A half-wave plate is typically used to rotate the polarization angle of an incident, linearly polarized beam of light. This is a result of the retardation of nphase between two orthogonal incident polarizations. However, if part of the incident beam can be
0.5
0.4 F
1 .0
g 0.0 2
-1 .o
-1.0 0.0 1 .o ZIZO
E8339
made to travel through the plate as a fast wave while the other travels as a slow wave, a n-phase shift will be created between the two portions. To accomplish this, a 4-cm disk was cut from the center of an 8-cm mica half-wave plate. The disk and annulus were then mounted individually on cross hairs and alignedto the beampath (as showninFig. 70.17). InFig. 70.17, the laser is polarized in the vertical direction, and the annulus is arranged such that its e axis is vertical, while the disk has its o axis vertical. This results in a n-phase shift of a portion of the incident field. The size of the disk was chosen such that approximately half of the incident field passed through it. This resulted in near-zero intensity at the center of the focus. By rotating the two pieces as a unit, one can rotate the polarization of the incident beam without introducing additional optics or changing the shape of the focal region. Also, as long as one does not require a single polarization direction in the focal
1 .0
i? 0.0 s=
- 1 .o
-1.0 0.0 1 .o E8340 z/z0
Figure 70.15 (a) A computer-generated trapping focal region with zero intensity at its center (n-region diameter = 1.65 w). (b) A contour plot of the trapping region. The volume of complete trapping is bound by the solid contour line at 8.2%.
Figure 70.16 (a) A computer-generated trapping focal region with 17% intensity at its center (n-region diameter = 2.20 w). (b) A contour plot of the trapping region. The volume of complete trapping is bound by the solid contour line at 23.6%.
LLE Review, Volume 70 63

A SINGLE-BEAM, PONDEROMOTIVE-OPTICAL TRAP FOR ENERGETIC FREE ELECTRONS
Figure 70.17 The experimental setup for the segmented wave-plate technique for generating a trap- ping focal region.
region, the depth of the trap can be tuned by rotating the central disk away from 90". This results in a polarization rotation of the inner portion of the beam, which will put some of the field into the noninterfering orthogonal polarization, thereby filling in the minimum. The extreme case is to rotate the disk a full 90°, back to its original position, which produced an ordinary, centrally peaked focus.
Experimental Results To image the altered focal spot, the wave-plate arrangement
was aligned to the beam path of the tabletop terawatt laser (T3) directly before the focusing lens (f = 212 cm).14 The focal region was imaged with a CCD camera coupled to a lox microscope objective (Fig. 70.18). The camera-objective com- bination was moved together to map out the focal region. A single laser shot was taken at each position, and each image was minimally smoothed and background subtracted. The scan was generated with -40-mJ, -2-ps infrared laser pulses. By firing the final, single-pass amplifier, energies of -1 J are achieved with no noticeable change in the near- or far-field characteristics of the beam. The unaltered beam's peak inten- sity typically reaches 10l8 W/cm2.
Figure 70.19(a) shows the focal spot created without the wave-plate arrangement in place. The beam diameter is ap- proximately 1 . 5 ~ the diffraction limit. Figure 70.19(b) shows the focal spot with the wave-plate arrangement set to 90". Despite the deviation of the unaltered beam from the diffrac- tion limit, there is a well-defined minimum in the center of the altered spot. Figure 70.19(c) shows the focal spot with the wave-plate arrangement in place, but set to 0". Here, the wave plate is set to its original, unaltered configuration, and the beam has returned to its original shape. Figures 70.20(a) and 70.20(b) show the lineouts of the altered beam in the x and y directions at z = 0. The x and y positions are normalized to the experimentally determined beam waist of the unaltered beam. Figure 70.20(c) shows the intensity of the beam at Y = 0 as a function of z. The intensities in Fig. 70.20 are normalized to the peak intensity of the unaltered beam.
A more detailed scan was made with a continuous-wave beam (the oscillator of the T3 laser). Figure 70.21 shows two slices through the focal volume along the z axis. Fig- ure 70.21(a) shows the intensity distribution in the plane y=O, andFig. 70.21(b) shows thedistributionforx=O. Ineach
E8411
212 cm )I
\
15 cm -1
CCD
Figure 70.18 The experimental setup for imaging the altered focal region. Here z = 0; i.e., the object plane of the microscope objective coincides with the focal plane of the lens.
64 LLE Review, Volume 70

A SINGLE-BEAM, PONDEROMOTWE-OPTtCAL TRAP FOR ENERGETIC FREE ELECTRONS
2
a,
" 0 -. B h
-2
E8425
-2 0
~ W O exp
2 -2 0
X/WO exp
2 -2 0
X/WO exp
2
Figure 70.19 Focal spots (a) without the wave-plate arrangement in place, (b) wave-plate setup in place and set to 90°, and (c) wave-plate setup in place and set to 0'
E5426
0.1
0.0 -2 0 2
Y/WO exp
-2 0 2 X/WO exp
0.4
0 9 0.2 s
(c> I I I rn
0.0 -4 -2 0 2 4
Z/ZO exp
Figure 70.20 Lineouts of the trapping focal region. (a) Lineout in the x direction, (b) lineout in they direction, and (c) the intensity at I = 0 as a function of z. All axes are normalized to the experimentally determined values for the unaltered beam (spot size for the x and y positions, Rayleigh range for the z positions, and unaltered beam peak intensity for the intensity values).
1 .0
0.5
-1 .o
0.0
Z/ZO exp
0.0
Z/ZO exp
Figure 70.21 Contour plots of the trapping focal region. (a) In the planey = 0 and (b) in the plane x = 0. The experimentally observed volume of complete trapping is bound by the solid contour line at 10%.
-0.5
E8412
LLE Review, Volume 70
0.5 -0.5 0.5
65

A SINGLE-BEAM, PONDEROMOTIVE-OPTICAL TRAP FOR ENERGETIC FREE ELECTRONS
plot, there is a region of complete trapping bound by intensity walls of 10% (solidline) of theunaltered beam’speakintensity. Although the incident beam size was not matched with the size of the wave-plate pieces, a sufficiently large portion of the incident field was shifted to create a trapping region. These experimentally obtained distributions (using a pulsed or cw beam) exhibit a local minimum in intensity at the origin along all three dimensions, making them suitable focal regions for ponderomotive trapping.
Summary In summary, we have produced, for the first time to our
knowledge, a tunable, single-beam, three-dimensional, ponderomotive-optical trap for free electrons with a high- peak-power laser system. Neutral atoms and macroscopic, low-index particles could also be trapped in the low-field region. We have presented a novel, segmented-wave-plate approach as an alternative to a phase mask, along with experi- mental confirmation of the intensity distribution of the altered focal region. Experiments to image the linearly and nonlinearly scattered light (both lw and 20) from the trapped electrons are being carried out.
ACKNOWLEDGMENT The author wishes to thank A. Maltsev for machining the half-wave plate.
This study is supported by the National Science Foundation with additional support from the U.S. Department of Energy Office of Inertial Confinement Fusion under Cooperative Agreement No. DE-FC03-92SF19460, the Uni- versity of Rochester, and the New York State Energy Research and Development Authority. The support of DOE does not constitute an endorse- ment by DOE of the views expressed in this article.
Appendix A: Huygens’ Principle Huygens’ principle states that we can consider every point
on a wavefront to be a point source for a spherical wave.8 As a result, if one knows the field in some “source plane (S’ j,” it is then possible to add the contributions from the individual spherical waves to find the field distribution in an “observation plane (S)” (see Fig. 70.22). The spherical wave emanating from a tiny element of area Aa’, surrounding the point (x’,y’,O) in the source plane, results in a contribution to the field in the observation plane,
where
112 Y = [ (x - x ’)2 + ( y - y ’)2 + 21 ,
k = 2n/& A d = dx’dy‘, and E(x‘,y‘,O) is the electric field (magnitude and phase) in the source plane. For most applica- tions, we may make the Fresnel approximation
and sum up all of the field contributions with the integral
exp ik (x - x ’ ) ~ + ( y - y’)’]/2z} dx’dy’. (A4) I [ To calculate the field at the point ( x , y , z ) , ~(x’,y’,O) must be known for all (x’,y’). Equation (A4) can then be solved numerically.
For the case of a laser beam incident on a positive lens, the intensity distribution can be assumed to be Gaussian (as is typical for many laser systems) or it can be determined experi- mentally by imaging the near-field distribution. Determining the phase of the incident field is more complicated, as it involves interferometric methods. l5 If the laser is well colli- mated and is found to focus to a spot size close to the diffraction limit, then the phase front can be assumed to be uniform. The effect of the lens is to simply add a phase proportional to the thickness of the lens material at any point. A plano-convex lens results in a “spherical” phase distribution,
wherefis the focal length of the lens and rr2 = xr2 + Y ‘ ~ is the square of the radial location in the source plane. If we assume that f2 >> Y ’ ~ (the paraxial approximation), then we can perform a binomial expansion,
@(r’)=kf(1-rj2/2f2 - ~ ‘ ~ / 8 f ~ -...). (A6)
The first term adds a constant phase to the entire beam and can be discarded, as can the higher-order terms since they are vanishingly small. By keeping only the quadratic term, we are left with a “perfect” lens in the context of this approach (in practice, aspherical lenses are not purely parabolic). A Gaussian laser beam that has passed through this lens will have the field distribution
66 LLE Review, Volume 70

A SINGLE-BEAM, PONDEROMOTIVE-OPTICAL TRAP FOR ENERGETIC FREE ELECTRONS
(source plane) E8510
AE (x, Y, 4 2 - - -
7 S
(observation plane)
&(x’,y’,O) = Aexp(-rj2/w2 - iW2/2f), (A7)
where A is the field amplitude and w is the beam radius at the l/e point in the electric field amplitude (which is equivalent to the l/e2 point in intensity). It should be pointed out that all calculations in both this article and the computer codes use the scalar-wave approach.
REFERENCES 1. H. A. H. Boot and R. B. R.-S.-Harvie, Nature 180, 1187 (1957).
2. C. I. Moore, J. P. Knauer, and D. D. Meyerhofer, Phys. Rev. Lett. 74, 2439 (1995).
3. E. S. Sarachik and G. T. Schappert, Phys. Rev. D 1,2738 (1970).
4. V. Gaponov and M. A. Miller, J. Exptl. Theoret. Phys. (U.S.S.R.) 34, 242 (1958).
Figure 70.22 The geometry of the Huygens’ wave approach to the propagation of light. The source and observation planes are separated by a distance z. The locations in the source plane are denoted with a prime ( I ) , while the locations in the observation plane are left unprimed.
6. C. I. Moore, J. Mod. Opt. 39,2171 (1992).
7. U. Mohideen et al., J. Opt. SOC. Am. B 9,2190 (1992).
8. P. W. Milonni and J. H. Eberly, Lasers (Wiley, New York, 1988).
9. J. Peatross, J. L. Chaloupka, and D. D. Meyerhofer, Opt. Lett. 19, 942 (1994).
10. L. W. Casperson, Opt. Quantum Electron. 10,483 (1978).
11. G. A. Turnbull et al., Opt. Commun. 127, 183 (1996).
12. M. W. Beijersbergen et al., Opt. Commun. 112, 321 (1994).
13. K. T. Gahagan and G. A. Swartzlander, Jr., Opt. Lett. 21, 827 (1996).
14. Y.-H. Chuang, D. D. Meyerhofer, S. Augst, H. Chen, J. Peatross, and S. Uchida, J. Opt. SOC. Am. B 8, 1226 (1991).
15. Laboratory for Laser Energetics LLE Review 31, NTIS document No. DOEDPi40200-47, 1987 (unpublished), p. 114.
5. N. J. Phillips and J. J. Sanderson, Phys. Lett. 21, 533 (1966).
LLE Review, Volume 70 67

A Diode-Pumped Nd:YLF Master Oscillator for the OMEGA Laser
The OMEGA laser is a 60-beam laser-fusion system capable of producing a total of 30 kJ of ultraviolet (351-nm) energy on target,l where the temporal profile of the optical pulse applied to a laser-fusion target can be specified in advance. To accom- plish this, the laser system consists of a master oscillator, a pulse-shaping system,2 regenerative amplifiers (regens), large-aperture regenerative amplifiers (LARA), rod and disk amplifier chains, and frequency converters. A schematic of the laser chain is shown in Fig. 70.23. The pulse-shaping system (Fig. 70.24) is based on LLNL's conceptual design3 and includes integrated-optics (IO) modulators driven by electrical waveform generators. The pulse-shaping system produces an optical pulse with a specific temporal pulse shape at the nanojoule energy level, which seeds the regens. The temporal profile of this low-energy seed pulse, when amplified and frequency tripled by the laser system, will compensate (1) for the temporal distortions caused by gain saturation in the regens and amplifiers and (2) for distortions caused by the tripling process and will produce the desiredpulse shape on target. The overall gain of the OMEGA laser system from the pulse- shaping modulator to the target is approximately This large gain puts extremely severe requirements on stability, reproducibility, and reliability of the pulse-shaping system and master oscillator performance. This article details the OMEGArequirements, describes the new diode-pumped mas-
ter oscillator, and presents results from this newly fielded master oscillator.
OMEGA'S Master Oscillator Design Requirements
satisfy a number of requirements: The master oscillator for the OMEGA laser system must
1. The wavelength of the oscillator must match that of OMEGA's Nd:phosphate glass amplifiers (1053 nm). This requirement automatically defines the choice of the laser medium for the master oscillator to Nd:YLF.
2. The oscillator must operate in a single-frequency regime. This requirement enables the stable and reproducible gen- eration of complex optical pulse shapes and assures opti- mal frequency conversion.
3. The master oscillator must be Q-switched to produce enough energy to split among four or more pulse-shaping channels and to properly seed the various regens.
4. The duration of the master oscillator's Q-switched pulse must be >lo0 ns, and the timing jitter must be within -10 ns to provide a constant pulse amplitude within the required 10-ns pulse-shaping window.
Target chamber
I I !
I L I converters I - A I disk amplifiers IT 1 I
E8370 \ / 60 beams
Figure 70.23 OMEGA laser system for ICF experiments.
68 LLE Review, Volume 70

A DIODE-PUMPED ND:YLF MASTER OSCILLATOR FOR THE OMEGA LASER
Laser system
waveform generator -1 ........................... / 1 for electrical
_.____
E8371
> ................ Main
SSD * Shaped .---> .-____..________
pulses Backlighter to regens
Fiducial
................
- - _ _ _ _ _ _ _ _ _ _ _ _ _ _
5. The master oscillator’s Q-switched pulse must be exter- nally synchronizable to the OMEGA timing system.
At present a flashlamp-pumped Nd:YLF laser is used on OMEGA. Although this laser satisfies all of the above conditions: maintenance and reliability considerations have led us to develop a new diode-pumped version with signifi- cantly improved performance. The long-term maximum amplitude has been increased, and frequency stability has been dramatically improved, while the complexity, mainte- nance requirements, and footprint of this new laser have shrunk significantly.
Currently there are two major areas of interest in diode- pumped Nd:YLF laser development: high-power cw lasers and short-pulse Q-switched lasers. Even the most powerful cw lasers5 cannot provide enough energy within a 10-ns pulse- shaping window to meet our requirement of >lo0 nJ in a 10-ns pulse in each of four channels. Q-switched, diode- pumped Nd:YLF lasersc9 are usually designed to generate short (3- to 10-ns) pulses with high peak powers. The short pulse width makes this type of laser unacceptable for satis- fying the requirement for a constant pulse amplitude within a 10-ns pulse-shaping window. Passively Q-switched, diode- pumped lasers (for example see Refs. 10 and 11) cannot be precisely synchronized.
Figure 10.24 Block diagram of the pulse-shaping system for the OMEGA laser.
To ensure that the laser generates a single frequency, the laser should operate unidirectionally. The most commonly used technique to achieve this involves using an optical diode (Faraday rotator). This technique does require additional intracavity elements and consequently increases resonator losses, thus rendering it unsuitable for our use. Kane and Byer12 have used nonplanar monolithic ring lasers; however, their use is restricted to laser materials with a large Verdet constant and no birefringence (Nd:YAG is such a material, but Nd:YLF is not). The most suitable way to provide unidirec- tional operation and &-switching in a Nd:YLF laser is to employ an acousto-optic (A-0) Q-switch, which can be used for both birefringent13 and n~nbirefringent’~ materials.
The A-0 Q-switched Nd:YLF laser meets most of the important requirements for the OMEGA master oscillator, namely the 1053-nm wavelength, single-frequency operation, high energy, and externally synchronizable requirements. However, close attention must be paid to the long (>100-ns) pulse width generation and high stability requirements.
There are no commercially available lasers with the specifications required for use on the OMEGA laser. In par- ticular the wavelength (1053 nm) and long pulse duration (>lOO-ns) requirements are not commonly required in com- mercial systems.
LLE Review. Volume 70 69

A DIODE-PUMPED ND:YLF MASTER OSCILLATOR FOR THE OMEGA LASER
Laser Design The diode-pumped, single-frequency Nd:YLF laser
(Fig. 70.25) is based on a triangular ring cavity with two spherical mirrors and aprism that doubles as an active element. The resonator is very similar to the Nd:YAG laser described in Ref. 15. In that design one of the resonator mirrors was deposited on the laser element; however, in our design we have moved the active element away from one of the mirrors to avoid spatial hole buming.16 This residual hole-burning effect, when an active element is located at one of the ring cavity mirrors, cannot be fixed in our case by displacing the pumped volume from the cavity TEMoo mode as suggested in Ref. 17 because we use a fiber-coupled pumping diode and the pumped volume is larger than the TEMoo-mode volume. We use afiber- coupled pumping diode so that the water-cooled laser diode can be removed from the laser head for enhanced laser stability. The diameter of the pumped volume for fiber-coupled diodes is relatively large (-0.4 mm) compared to other designs. This large volume reduces the efficiency of the laser but increases the overall stability of the diode-pumped laser. For our appli- cation the enhanced stability is more important than the efficiency of the master oscillator. The ring cavity has been chosen to provide traveling-wave unidirectional lasing and hence easier single-frequency operation. Both cavity mirrors are spherical with a 10-cm radius of curvature. The distance between the mirrors is approximately 30 mm. The angle of incidence for both mirrors is -1 1". The end mirror has maxi-
mum transmission for the pump radiation (797 nm) and maxi- mum reflection for the 1053-nm laser wavelength. The output coupler has a 95% reflection coefficient at 1053 nm.
A 4 x 4-mm-cross-section, a-cut Nd:YLF element has Brewster-angled entrance and exit surfaces cut for 1053-nm operation (c axis is perpendicular to the resonator plane). Its on-axis thickness is 8 mm and has been calculated to compen- sate for the astigmatism from the two off-axis spherical cavity mirrors. * To provide maintenance-free operation no adjust- able mounts were used for cavity alignment. The laser was assembled on a 50 x 30 x 30-mm Zerodur base plate to minimize thermal drift and improve long-term stability. A precisely machined metal template allows accurate placement of the carefully machined mirrors (flattened barrels) to elimi- nate the necessity for fine alignment of these mirrors. The active element is glued to a miniature piezo-translator (Physik Instrumente) for cavity-length adjustment, which is in turn mounted on a Zerodur standoff glued to the Zerodur base plate. The A-0 modulator (QS080-2G-RU1, Gooch & Housego) assures a unidirectional prelase phase prior to Q-switching. The A-0 Q-switch has plane-parallel surfaces (AR coated for 1053 nm) and can be aligned without disturbing the cavity alignment. Unidirectional operation is achieved by using the self-feedback mechanism in the A-0 Q-switch, which is de- scribed in detail in Ref. 19.
5.5 x 11.5-in. footprint
Fibers feedback circuit
Two fiber m- sensors !I!+ Fringes
I+- Etalon
I3 _ - - ...... i;/ .......... --> >
P Fiber
E8374
70
Figure 70.25 Schematic of the diode-pumped, single-frequency, pulsed OMEGA master oscillator with amplitude and frequency feedback systems.
LLE Review. Volume 70

A DIODE-PUMPED ND:YLF MASTER OSCILLATOR FOR THE OMEGA LASER
The laser is pumped by 700-ys square pulses at a 5-Hz repetition rate generated by an SDL-3490-P5 fiber-coupled laser diode (nominal 5-W output). The OMEGA front-end laser system operates at 5-Hz repetition rate that reduces thermal problems in the master oscillator and extends the lifetime of the diode. The image of the output 0.4-mm-diam fiber surface is relayed into the active element of the laser by using two 25-mm-focal-length spherical lenses AR coated for 797 nm. Both lenses are aligned and assembled together with the fiber port. The position of the pumped volume can be aligned to the TEMoo cavity mode by adjusting the whole lens- fiber unit.
The low duty cycle of the oscillator obviates the need for a cooling system on the active element. The laser resonator is thermally uncoupled from the environment. The laser requires only two adjustments: alignment of the pumped volume in the
active element and the A-0 Q-switch position for unidirec- tional operation. The laser layout is shown in Fig. 70.26.
Experimental Results We have found that a low rf power of -5 mWd is sufficient
for unidirectional operation. We have achieved a very high contrast for the counter-propagating beams (>1500: 1). As mentioned above, unidirectional operation is essential to main- tain the single-frequency regime. In this operating mode the prelase stage exhibits regular, slowly decaying relaxation oscillations [Fig. 70.27(a)], which cause significant amplitude and temporal jitter of the subsequent @switched pulse. To stabilize the prelase phase we have developed a negative amplitude feedback with a constant offset. The offset provides the required rf power level to achieve unidirectional operation during the prelase phase. One of the beams diffracted by the A-0 modulator is coupled into the 0.4-mm multimode fiber
E8360
I I I I I
0.06 5 l i
g 0.02 0 m
0.00 0 5 10 15 20
Figure 70.26 The OMEGA master oscillator layout. It consists of three units: laser cavity (no adjustments required); A-0 modulator (adjusted for unidirectional operation); and pump unit (adjusted for maximum laser output).
Figure 70.27 Oscillograms of the prelase phase: (a) single-frequency operation, no amplitude feedback; (b) same with the feedback.
E8375
LLE Review, Volume 70
Time (ps)
71

A DIODE-PUMPED ND:YLF MASTER OSCILLATOR FOR THE OMEGA LASER
and sent to a diode that generates the feedback signal. In- creased feedback increases the rf power to the A-0 modulator, thus increasing the cavity losses and stabilizing the laser output. With amplitude feedback stabilization a very smooth prelase phase is observed [Fig. 70.27(b)], and the externally triggerable &-switch leads to high amplitude stability and low temporal jitter of the output pulse.
At the lowest rf power required for unidirectional operation (-5 mWrf) the laser generates a -300-ns pulse of -5-pJ energy. The pulse width is defined by the removable &-switch loss. To maintain unidirectional operation and obtain high stability and low jitter, the laser must work close to threshold. For a given resonator configuration the energy content of the Q-switched pulse is closely related to the pulse width. The self-feedback mechanism of the A - 0 enforced unidirectional operation19 is crucial for generating long single-frequency pulses because of the very low rf power required for the unidirectional prelase phase and hence low removable loss level. By increasing the offset in the amplitude feedback system and the pumping energy, we have been able to obtain stable single-frequency pulses with widths as short as 30 ns and energies of -18 pJ. For use in the OMEGA laser chain the laser has been adjusted to generate an externally triggerable single-mode pulse of -160-ns duration and -10-pJ pulse energy. As a test of the laser stability and reproducibility, 100 laser pulses taken within 0.5 h with the laser operating at 5 Hz were recorded using a
1-GHz, 4-GS/s Hewlett-Packard 54720A digitizing oscillo- scope. Figure 70.28(a) shows the average pulse shape (solid line) and its amplitude and temporal rms deviations (dashed lines). Figure 70.28(b) shows the same experimental data as Fig. 70.28(a), but the effect of the build-up jitter has been removed. By comparing Figs. 70.28(a) and 70.28(b) we con- clude that the fluctuations seen in Fig. 70.28(a) are mostly due to the build-up time jitter (the long-term temporal jitter of the peak of the pulse is <7 ns rms). These data clearly show that the laser demonstrates excellent amplitude stability and pulse- shape reproducibility. The short-term (0.5-h) amplitude stability of the pulse has been measured to be -0.3% rms. The long-term (8-h) stability is -0.6% rms. The variation of the pulse width (which has an average FWHM of 159 ns) is -0.7 ns rms. The achieved pulse duration and the remarkable stability of the pulse provide a constant pulse amplitude, with a variation of <1%, within the 10-ns pulse-shaping window. To maintain these excellent properties, the output beam must be handled very carefully. Even immeasurably small amounts of back reflections (from such sources as diagnostics, fibers, or fiber couplers) can reduce the stability significantly.
In all the experiments reported here, the laser was operated in the TEMoo mode despite the large pump volume. This mode of operation, which involves operating close to threshold with an extended prelase phase, helps the laser maintain a single longitudinal and spatial cavity mode.
1 .o 0 -0 a 0.8
0.6 .+ + a
2 .$? 0.4 3
2 0.2 ' 2 0.0
E8376
-200 -100 0 100 200
Time (ns)
(average over 100
I I . I . I . I . I . I
-200 -100 0 100 200
Time (ns)
Figure 70.28 (a) The average pulse shape (solid line) and amplitude and temporal rms deviations (dashed lines) from the output Q-switched pulse for 100 shots taken within 0.5 h. (b) The data as in (a), but with the build-up jitter removed (all three lines, average and average b m s fluctuations, virtually overlap). This indicates that all fluctuations in the left graph are mostly due to build-up time jitter of 7 ns rms, which is very small compared to the 159-11s pulse width (FWHM).
72 LLE Review, Volume 70

A DIODE-PUMPED ND:YLF MASTER OSCILLATOR FOR THE OMEGA LASER
The optical efficiency in this Q-switched laser is -5%. This relatively low optical efficiency is due to several factors: (1) the pump volume is large, exceeding the TEMoo cavity-mode volume: (2) the output coupler has not been optimized; and (3) the pump beam is slightly vignetted by the cavity mirror. However, for this application, optimal efficiency is not of major importance.
Long-term, single-frequency operation and stability are achieved by incorporating a frequency stabilization scheme. In this design 10% of the laser output is expanded and sent through a low-finesse, solid, temperature-controlled etalon to create fringes. Two fiber sensors straddle one of the fringes such that the difference between optical signals in the fibers is zero. Any fringe shift leads to a signed error signal that feeds into the (biased) PZT driver; this corrects the cavity length and drives the error signal to zero.
Conclusions We have developed a diode-pumped, single-frequency,
pulsed Nd:YLF master oscillator for the OMEGA laser sys- tem. Output pulses have been generated that have 30- to 300-ns duration and 5- to IS-pJ energy with high amplitude stability (<0.6% rms), low timing jitter (<7 ns rms), and long-term frequency stability of <lo0 MHz over periods of many hours without observable dual-mode operation. The laser adjusted for 160-ns pulse width and 10-pJ pulse energy satisfies all OMEGA requirements and is currently being incorporated into the OMEGA laser system.
ACKNOWLEDGMENT This work was supported by the US. Department of Energy Office of
Inertial Confinement Fusion under Cooperative Agreement No. DE-FCO3- 92SF19460, the University of Rochester, and the New York State Energy Research and Development Authority. The support of DOE does not consti- tute an endorsement by DOE of the views expressed in this article.
REFERENCES
1. J. M. Soures, R. L. McCrory, C. P. Verdon, A. Babushkin, R. E. Bahr, T. R. Boehly, R. Boni, D. K. Bradley, D. L. Brown, R. S. Craxton, J. A. Delettrez, W. R. Donaldson,R. Epstein, P.A. Jaanimagi, S. D. Jacobs, K. Keamey, R. L. Keck, J. H. Kelly, T. J. Kessler, R. L. Kremens, J. P. Knauer, S. A. Kumpan, S. A. Letzring, D. J. Lonobile, S. J. Loucks, L. D. Lund, E J. Marshall, P. W. McKenty, D. D. Meyerhofer, S. E B. Morse, A. Okishev, S. Papemov, G. Pien, W. Seka, R. Short, M. J. Shoup III, M. Skeldon, S. Skupsky, A. W. Schmid, D. J. Smith, S. Swales, M. Wittman, and B. Yaakobi, Phys. Plasmas 3,2108 (1996).
2.
3.
4.
5.
6.
7.
8.
9.
10.
11.
12.
13.
14.
15.
16.
17.
18.
19.
A. Okishev, M. D. Skeldon, S. A. Letzring, W. R. Donaldson, A. Babushkin, and W. Seka, in Superintense Laser Fields, edited by A. A. Andrew and V. M. Gordienko (SPIE, Bellingham, WA, 1996), Vol. 2770, pp. 10-17.
R. B. Wilcox et al., in Laser Coherence Control: Technology and Applications, edited by H. T. Powell and T. J. Kessler (SPIE, Belling- ham, WA, 1993), Vol. 1870, pp. 53-63.
W. Seka, I. Will, J. Chow, D. L. Brown, M. D. Skeldon, C. K. Merle, R. G. Roides, and W. Ragg, in Conference on Lasers and Electro- Optics, Vol. 16,1993 OSATechnical Digest Series (Optical Society of America, Washington, DC, 1993), p. 250.
J. Harrison, P. E Moulton, and G. A. Scott, presented at CLEO ’95, Baltimore, MD, 21-26 May 1995, paper CPD20-1.
W. M. Grossman, M. Gifford, and R. W. Wallace, Opt. Lett. 15, 622 (1990).
M. D. Selker, R. S. Afzal, and P. Reichert, IEEE J. Quantum Electron. 30, 1616 (1994).
B. Frei and J. E. Balmer, Opt. Commun. 94, 537 (1992).
Th. Graf and J. E. Balmer, Opt. Lett. 18, 1317 (1993).
T. T. Kajava and A. L. Gaeta, Opt. Lett. 21, 1244 (1996).
A. Agnesi, S. Dell’Acqua, and G. C. Reali, Opt. Commun. 133, 211 (1997).
T. J. Kane and R. L. Byer, Opt. Lett. 10,65 (1985).
W. A. Clarkson and D. C. Hanna, Opt. Commun. 84,51 (1991).
L. J. Bromley and D. C. Hanna, Opt. Lett. 16,378 (1991).
C. Bollig, W.A. Clarkson, andD. C. Hanna,Opt.Lett.20,1383 (1995).
K. I. Martin, W. A. Clarkson, and D. C. Hanna, Opt. Commun. 125, 359 (1996).
K. I. Martin, W. A. Clarkson, and D. C. Hanna, Opt. Commun. 133, 180 (1997).
H. W. Kogelnik et al., IEEE J. Quantum Electron. QE-8, 373 (1972).
W. A. Clarkson, A. B. Neilson, and D. C. Hanna, IEEE J. Quantum Electron. 32, 311 (1996).
LLE Review, Volume 70 73

Heat Transfer from Localized Absorbing Defects to the Host Coating Material in Hf02/Si02 351-nm High Reflectors
Recent atomic-force microscopy (AFM) studies of laser-in- duced damage morphology in Hf02/Si02 UV multilayers, caused by 35 1 -nm, 1 -ns laser pulses, revealed submicron-sized craters as the dominant damage morphology in these films [see Fig. 70.29(a)]. The origin of such craters was attributed to nanoscale, localized absorbers in the film matrix, the smallest size of which was estimated to be <IO nm. However, at this time, both the exact physical nature of these absorbers and the mechanism of energy transfer to the host coating material in the promotion of damage remain speculative. Empirical evidence1 suggests that, at some time in the damage evolution, melting occurs; furthermore, near damage threshold, even the smallest absorbing defects are able to induce such melting to extend to about 50 nm inside the coating. For incident fluences 5%-20% above this threshold, the crater-depth distribution shifts dra- matically, as measured by AFM (see Fig. 70.29), while for the lower fluences the melt processes and crater formation are largely confined to the top HfO, layer [Fig. 70.29(b)]-these processes penetrate into the next-from-the-top, SiO, layer at fluences -20% above threshold [Fig. 70.29(d)].
In this work, by carrying out heat-transfer calculations for the same Hf02/Si02 multilayer system, our goal was to answer the following questions:
for 35 1 -nm laser light, a damage model commensurate with empirical, AFM evidence must account for energy-transfer mechanisms other than heat conduction alone.
Methodology Heat-transfer modeling was accomplished by using the
finite-element analysis code ANSYS2 in rigid-grid form. The equation of motion was treated in matrix form
where [c] represents the specific-heat matrix, [a the conduc- tivity matrix, { T } the nodal temperature vector, and { Q } the nodal heat-flow vector. The model assumed convective heat transfer at the film/air interface and conduction inside both the defect and the host material. The model geometry, depicted in Fig. 70.30, contains alternating quarter-wave layers (A = 35 1 nm) of HfO, and Si02 of cylindrical geometry with the Y axis along the film/air interface, and they axis oriented perpen- dicular to the layer stack. A single, cylindrical defect is placed at the thickness midpoint of the top Hf02 layer, its size taking on values in accordance with data in Fig. 70.30.
a. How high a temperature must an absorbing defect reach to support film-crater formation of the type observed experi- mentally by AFM?
b. How does heat conduction affect the damage kinetics at these temperatures and for different defect and host char- acteristics?
Heat generation inside the defect is based on uniform volume absorption of the laser light at a constant rate through- out the 1-ns laser pulse. We assume that non-Beer’s law of absorption holds for these defects that are much smaller than a “skin depth.” For an absorbed fraction p of the light normally incident on the defect of length d, the heat-generation rate inside the defect becomes
c. May heat conduction be considered the dominant energy- transfer mechanism, or must other mechanisms be included for the process physics to remain plausible?
In the following, the model assumptions and simulation results will be presented. From these results, one concludes that, for realistically sized defects and absorption conditions
where iPth is the damage-threshold fluence (5.6 J/cm2) and z is the I-ns laser-pulse duration. As reliable absorption- coefficient data are absent for most nanoscale absorbers, p was fixed at a value of 0.1. For a value of d= 27 nm, this yields a heat-generation rate Hgen = 2 x 10²⁰ J/m3 s. To evaluate the relative influence of various other parameters, such as the
74 LLE Review. Volume 70

HEAT TRANSFER FROM LOCALIZED ABSORBING DEFECTS TO THE HOST COATING MATERIAL
L I
G4041
Depth (nm)
(c)
1.2
cc + 1 3
c 0.8
.& ? U
i cd
2 0.4 %*
Depth (nm)
40
cc U 5 30
%
O 20 5
z 10
e 5
n "0 50 100
Depth (nm)
( 4
Figure 70.29 (a) Conventional laser-damage craters formed by 35 1-nm radiation in the HfOz/Si02 film. Crater-depth distributions in the Hf02/SiOz system and the electric fieldE of the incident light for different laser-fluence conditions: (b) -5% above threshold fluence, (c) 10%-15% above threshold fluence, and (d) -20% above threshold fluence.
thermal-conductivity anisotropy and defect size and type, this Hgen value was initially kept constant. Later, when agreement between empirically obtained AFM results and simulations was sought, Hgen values were parametrically varied.
Material Properties Two types of absorbing defects were considered:
1. Metallic Hf nanoclusters with bulk-metal thermal param- eter values for K (thermal conductivity), H (enthalpy), and T, (melting point);
2. Off-stoichiometric Hf02 film with the following param- eters: K - HfO2 thin-jilm thermal conductivity, H - Hf02 bulk enthalpy, and T, - Hf02 bulk melting point.
The absorbing-defect thermal parameter values are listed in Table 70.111.
Thin-film material property values are summarized in Table 70.IV, where K,, Ky, and K, are the Cartesian-
LLE Review, Volume 70 15

HEAT TRANSFER FROM LOCALIZED ABSORBING DEFECTS TO THE HOST COATING MATERIAL
-
t + i Defect-size variation 5
e z[ 2 k-120nm-4 x
0 f R, = 5 nm; d, = 11.4 nm (small) R, = 10 nm; d, = 17.0 nm (medium) R, = 20 nm; d, = 26.7 nm (large)
4
s: .i vl
G4042
Table 70.111: Absorbing-defect thermal parameters.
i vl W
Figure 70.30 Model geometry employed for the finite- element analysis of heat transfer in the HfOdSi02 system.
K H Trn (W/m"K) (J/kg) ("K)
Defect Type
Hf - metal 17.2 Hf - bulka 2506 Hf02 0.1 Hf02 - bulka 3085
aReference 3.
Table 70.IV: Thin-film thermal Darameters.
HfO2 0.10 0.10 y Bulka 3085
SiO, 0.25 0.25 y Bulka 1986
coordinate components of the thermal conductivity and y is the anisotropy parameter for the thermal conductivity, Le., y = 1 for perfect isotropy. In these simulations, y= 0.1 was chosen for the most anisotropic case. Also, in distinguishing metallic defects from Hf02-type defects, thin-film anisotropy values were used for Hf02-defect properties.
Latent heat of fusion was accounted for in these calcula- tions by enthalpy H.
Modeling Results and Discussion Instantaneous temperature contours in 2-D space
(Fig. 70.3 1) show the temperature-field evolution within the
76 LLE Review, Volume 70

HEAT TRANSFER FROM LOCALIZED ABSORBING DEFECTS TO THE HOST COATING MATERIAL
I
...................... ...........
G4043 I
Figure 70.31 Temperature contours [T(’K)] obtained for the case of large HfOz defect and y= 0.1 at various times after the beginning of the laser pulse: (a) 1 ns, (b) 10 ns, (c) 20 ns, and (d) 40 ns.
film at various times after the beginning of the laser pulse. These contours represent the case of a “large” Hf02 defect (R = 20 nm; d = 26.7 nm) located in the top Hf02 layer. Note that in these contours the adfilm interface is located at the bottom of each grid and the successive film layers stack upward. One finds [Fig. 70.31(a)] that at the end of the excitation pulse the heat generated is essentially confined to the defect itself, within which the temperature reaches a value of 2.7 x lo4 OK. As time progresses, the locus of the peak temp- erature moves from the defect center toward the air/film inter- face [Fig. 70.31(b)]. As a consequence, 17 ns after the end of the pulse, the interface reaches a temperature of 1.5 x lo4 OK. On the nanosecond time scale considered in Figs. 70.31(a)- 70.31 (d), convective heat transport at this interface remains physically irrelevant and, in effect, renders this interface an adiabatic boundary, fostering the modeled temperature buildup.
Critical to the comparison with empirical crater information are the lateral temperature contours, defining the lateral scale of the melting process. One can see that in the highly anisotro- pic ( y = 0.1) heat-conduction case represented in these fig- ures, lateral melt-front propagation is fairly restricted-the melt radius remains <30 nm inside Hf02, which is nearly a factor of 2 smaller than observed during AFM mapping of craters.
To determine the vertical-melt propagation through the film stack, Fig. 70.32 shows the vertical temperature around a “large” Hf02 defect as a function of depth (here the adfilm interface is located at the origin) at various times after the end of the laser pulse. From Fig. 70.32 it becomes apparent that within only 3 ns after the pulse, melting starts inside the Si02 layer (note the broken, vertical-layer-demarcation line be- tween Hf02 and Si02) and, by 10 ns after the pulse, reaches nearly halfway into the S O 2 layer. Eventually the system starts to cool down, which sets the limit on the vertical-melt propa- gation. Similarly, Figs. 70.33 and 70.34 show the maximum temperature reached at any instant during the process at vari- ous depths below the defect as a function of conductivity anisotropy and defect type, respectively. For all anisotropy ratios chosen (Fig. 70.33), the Si02 layer experiences melting to some extent, up to -75% of the entire layer. The same strong dependence of melting on anisotropy also holds for the “large” Hf-metal defect (Fig. 70.34), which at the fixed, identical heating rate is completely molten and itself isotropic (T, = 2506 OK). In Figs. 70.33 and 70.34 there is a small, systematic error. The code recognizes and accounts for the change in conductivity anisotropy upon melting, but during the cool- down phase reinstates anisotropy as if the material had recovered initial crystallinity. Preliminary simulations show that this error in no way alters the seminal features or conclusions.
LLE Review, Volume 70 77

HEAT TRANSFER FROM LOCALIZED ABSORBING DEFECTS TO THE HOST COATING MATERIAL
(34044
Si02 HfO2 I
O O io i o i o i o i o 60 i o so 90 Io0 Distance (nm)
Figure 70.32 Vertical (along the y axis of the model) temperature profile kinetics (1 to 10 ns after the beginning of the laser pulse) for a “large” Hf02 defect.
I I I I I I
Metallic Hf defect; large
R W
2 ...... *.., \ - -
b
I \ - - *
I ’ ‘\ \ ? - - \-
1000 T I \ -
Hf02 I Si02
(34122
20 30 40 50 60 70 80 90 Distance (nm)
Figure 70.34 Maximum-temperature Tmax vertical profiles as a function of conductivity anisotropy y for a “large” metallic Hf defect case.
Ignoring the differences in absorption between a metallic and an off-stoichiometric defect and simply assuming that, over the laser pulse length, equal amounts of energy have been deposited in either one, the relative importance of defect heat capacity and internal heat conductivity for energy transfer to the surrounding film is outlined in Fig. 70.35. Due to its higher conductivity, the metallic defect attains a uniform temperature and delivers heat rapidly to its surface. This causes the sur- rounding Hf02 film to reach higher temperatures than if the defect consisted of off-stoichiometric HfO2. At the HfO2/
.o,ooo
(34045
1000 y<; ....... ......... - -
- - - 1
........... - - ........ - -
Si02 Y t I I I I 1 I l l
20 30 40 50 60 70 80 90 Distance (nm)
Figure 70.33 Maximum-temperature Tmax vertical profiles as a function of conductivity anisotropy y for a “large” Hf02 defect case.
Si02 interface this difference has been mediated away by the poor conductivity of the dielectric film. The melting behavior of the Si02 layer is insensitive to the nature of the defect.
The issue now remains how, for equal energy volume density at the end of an excitation pulse, defects of various sizes (i.e., of various surface areas) affect the melting behavior of the host layer as well as that of the next-nearest neighboring layer. For the three sizes (small/medium/large) considered, the vol- umes scale as 1:6:37. Figures 70.36 and 70.37 plot the maxi- mum temperatures reached inside the Hf02 and Si02 layers for the three cases-Fig. 70.36 representing a dielectric defect and Fig. 70.37 ametallic defect. For the same reason as given in the discussion of Fig. 70.35 @e., the higher thermal conductivity of the metal), the metallic defects shed heat effectively during the laser pulse, providing for larger maximum-temperature differences between the defects with the various surface-to- volume ratios than for defects of dielectric composition. At threshold, neither dielectric nor metallic, small defects contain enough heat to melt the Si02 layer, indicating a critical defect size for melting to occur (at threshold) inside the Si02 layer. Tables 70.V and 70.VI list the melt-penetration depth e, normalized, for comparison convenience with AFM measure- ments, to the Hf02/Si02 layer interface for both types of medium and large defects, as well as Q, dependence upon a range of conductivity anisotropies. The emphasis here is on weak anisotropies: for medium defects, no melt events are recorded, and even for large defects the melt penetration into Si02 is very shallow.
78 LLE Review. Volume 70

y = 0.2; large defect
g 10,000 W
G4046
I I 1 I
HfO2 I Si02
30 40 50 60 70 80 90 1ooo20 I I l l
I I I
Distance (nm)
FROM LOCALIZED ABSORBING DEFECTS TO THE HOST COATING MATERIAL
I I I I I I
I HfO2 - defect y= 0.1 -
- Large .......... Medium
...... ..... ....... .I..
' \ I b. ........
1000 r I .. - I
I HfO2 I sio,'-- - - - _ , I I l l I I I
20 30 40 50 60 70 80 90
G4123 Distance (nm)
Figure 70.35 Maximum-temperature Tmax vertical profiles as a function of defect type. Metallic Hf versus off-stoichiometric Hf02.
Figure 70.36 Maximum-temperature Tmax vertical profiles as a function of the defect size for an HfOz defect case.
I I I I I I I Hf02 - defect y = 0.1
- Large - .......... Medium
Small : - 10,000 ?- - -, - - - ? v
....... ..... .....
k! ti
'I ........ 1 - - 1000 r I . . -. I HfO2 I si02 + - - - -
I I l l I I I
20 30 40 50 60 70 80 90 G4124 Distance (nm)
Figure 70.37 Maximum-temperature Tmax vertical profiles as a function of the defect size for a metallic Hf defect case.
By raising the value for Hgen and simulating fluence condi- tions above thueshold, one may address the question of how high a temperature a given defect must reach to generate damaging melt-penetration depths comparable to experimen- tally observed ones. For small- and medium-sized metallic defects the corresponding melt-penetration depths l , and defect peak temperatures are listed inTables 70.VII and 70.VIII as a function of increasing HgeW From these tables it becomes immediately apparent that experimentally measurable melt penetration occurs only for very high defect temperatures. For either defect size a temperature of 3 to 4 x lo4 O K is required. Such temperatures are alarming inasmuch as the physical mechanisms so far ignored in these simulations start to play a role in the overall laser-damage model. They also point toward the inability of the current model to simulate laser damage by thermal-conductivity-dominated energy transfer alone.
Table 70.V: Melt-penetration depth e, (nm) values, large-defect case, as a function of parameter y
Defect Type y= 0.1 y= 0.2 y= 0.5 y= 1.0
HfO2 47 35 18 9
Metallic 49 38 24 14
Tmax (Hf02) = 27,000 K; T,, (met) = 30,000 K.
LLE Review, Volume 70 79

HEAT TRANSFER FROM LOCALIZED ABSORBING DEFECTS TO THE HOST COATING MATERIAL
Two mechanisms that spring immediately to mind have the potential for significantly altering the kinetics of laser damage by providing sources for energy absorption from the laser field at a distance from the original defect: thermoionically emitted electrons and blackbody radiation in both the IR and, more importantly, the UV portion of its spectrum. Still, during the excitation pulse, when the thermal energy is mostly bottled up inside the defect and its temperature is highest, free carriers directly emitted into or ionized by UV photons within the surrounding dielectric layer stack provide starting electrons for “avalanche-type” or other energy-transfer processes at locations that, in effect, constitute an electronic ballooning of the defect. Table 70.K emphasizes this aspect by listing the fraction of integrated blackbody radiation with photon energy above the Hf02 bandgap as a function of defect tem- perature, emitted by a heated defect into its surrounding. From Table 70.M we see that 10% of the emitted blackbody spec-
trum lies above 5.6 eV for temperatures as low as 1 x lo4 OK. At the temperatures predicted by the current simulations this fraction increases to nearly 90%. The potential significance of such a UV ionization mechanism was pointed out in 1978 by Manenkov and his group.4 Based on this earlier work, the Grenoble Group5 evaluated the role of such preionization in single-layer films on melting and mechanical breaking of the film matrix.
Such a “larger-effective-defect’’ mechanism is also a plausible answer to the earlier-mentioned discrepancy be- tween the calculated lateral-melt penetration range and the empirical AFM data. While part of this discrepancy can be assuaged by choosing a less-severe conductivity anisotropy, the lateral seeding of heating sources by ionizing radiation is an equally provocative concept whose merit must be tested in expanded simulations.
Table 70.VI: Melt-penetration depth 1, (nm) values, medium-defect case, as a function of parameter y.
Defect Type y= 0.1 y= 0.2 y= 0.5 y= 1.0
HfO, 13 5 0 0
I Metallic 14 I 6 0 0
T,,, (HfO,) = 25,000 K, T,, (met) = 17,000 K.
Table 70.VII: Melt-penetration depth fm, as a function of heat-generation rate Hgen, small-defect case.
4 18760 1 5 221 10 4
~~~~~
6 24750 6 7 31890 9
I 8 37750 12 10 42990 15
80 LLE Review, Volume 70

HEAT TRANSFER FROM LOCALIZED ABSORBING DEFECTS TO THE HOST COATING MATERIAL
Table 70.VIII: Melt-penetration depth im, as a function of heat-generation rate Hgen, medium-defect case.
Hgen Tmax .em
(w/rn3> (OK) (nm> I 1 x 10²⁰ I 8652 I 2 I
2 16600 14 3 27070 23 4 36970 30 5 44880 35
Table 70.IX: Fraction of thermal radiation f rom the absorbing defect with photon energy exceeding Hf02 bandgap (5.6 eV).
T (OK) Fion
I 10,000 I 10 I I 20,000 I 57 I I 30,000 I 80 I
~~ ~~
40,000 89
Summary In considering thermal conduction as the only energy trans-
port mechanism, the current simulations show that relevant comparison with empirical damage morphology necessitates such high defect temperatures (T > 30,000"K) that other physical mechanisms start to attain dominance. These calcula- tions point toward a mechanism in which the thermally trapped defect (thermally trapped on a nanosecond time scale) emits ionizing radiation into the surrounding film matrix. In response to such ionization, a volume larger than the defect itself becomes absorptive to the laser field and mediates direct energy transfer to the film at locations distant from the defect.
REFERENCES
1. S. Papemov, A. W. Schmid, J. Anzelotti, D. Smith, and Z. R. Chrzan, in Laser-Induced Damage in Optical Materials: 1995, edited by H. E. Bennett etal. (SPIE, Bellingham, WA, 1996), Vol. 2714, pp. 384-392.
2. ANSYS, Inc., P.O. Box 65, JohnsonRoad, Houston, PA 15342-0065.
3. I. Barin and 0. Knacke, Thermochemical Properties of Inorganic Substances (Springer-Verlag. Berlin, 1973).
4. Yu. K. Danileiko, A. A. Manenkov, and V. S. Nechitailo, Sov. J. Quantum Electron. 8, 116 (1978).
5. J. Dijon et al., in Laser-Induced Damage in Optical Materials: 1995, editedbyH.E. Bennettetal. (SPIE,Bellingham,WA, 1996),Vol. 2714, pp. 416419.
ACKNOWLEDGMENT This work was supported by the U.S. Department of Energy Office of
Inertial Confinement Fusion under Cooperative Agreement No. DE-FC03- 92SF19460, the University of Rochester, and the New York State Research and Development Authority. The support of DOE does not constitute an endorsement by DOE of the views expressed in this article. The authors thank M. Shoup for valuable assistance in software system management.
LLE Review, Volume 70 81

Signatures of Target Performance and Mixing in Titanium-Doped Target Implosions on OMEGA
In recently published work we discussed the signatures of mixing' and of target performance2 provided by incorporating a titanium-doped layer within the shell of imploding targets. We report here on the results of an experiment on OMEGA using such targets. We observe the predicted absorption fea- tures formed by the titanium layer: absorption lines due to 1s-2p transitions in titanium ions of incomplete L shell, as well as K-edge absorption in cold titanium. We also observe oscillations due to extended x-ray absorption fine structure (EXAFS) above the Ti K edge. The observed spectra are simulated by a radiative-transport model that uses LILAC profiles and OPLIB opacity values. The observed core tem- perature and shell areal density are found to fall short of the one-dimensional predicted values. We attribute this shortfall to a lack of irradiation symmetry, which leads to hydrodynamic instability and mixing [distributed phase plates (DPP's) were not used in this experiment, although the SSD modulator was activated]. The introduction of a sharp density jump at the interfaces of the titanium layer introduces a Rayleigh-Taylor (RT) unstable layer, which makes the target more unstable. Signatures of mixing include the emission of the He-a line of Ti+2o due to titanium migrating to the core, as well as the EXAFS spectrum indicating cold titanium close to peak com- pression. The spectral signatures due to the titanium layer are shown to provide very useful signatures of target performance.
and compared with simulation predictions. Highly performing targets require only alow percentage (-1 %) of titanium doping to give significant absorption;2 the need to use a pure-titanium layer in this experiment is an indication of lower compression.
The sharp density jump at the interfaces of the titanium layer becomes unstable during acceleration and deceleration; however, a thin layer cannot support unstable modes of long wavelength. Areduction factor multiplying the RT growth rate, due to the finite thickness of an unstable layer, has been derived by Landau andLif~hitz.~One-dimensional code simulations of shot 8207 (see below) show that during the acceleration phase (when the shell and Ti layer are still thin) the reduction factor ranges from -0.2 to -0.5 for modes .! = 10 to .! = 50. Thus, the contribution of the titanium interface to the overall RT growth should be small.
In this article we concentrate on a single shot on the OMEGA laser5-shot No. 8207. The target was a polymer shell of 882-pm inner diameter and 4.6-pm thickness, coated with a 0.3-pm layer of titanium, a 15-pm layer of polymer, and finally a 0.1-pm layer of aluminum as a shinethrough barrier.6 The fill gas was atmospheric air. The 19.9-kJ laser pulse had a 1-ns flat top (to within +5%) with 150-ps rise and fall times. SSD7 was used in this experiment, but not DPP's.~
A titanium layer was placed within a polymer-shell target, between a mandrel and an overcoat layer. The overcoat is much thicker than the laser-ablated layer to prevent emission of titanium lines from laser heating. Likewise, the titanium layer was sufficiently far from the inner-shell interface to ensure that the titanium lines are not emitted in the absence of mixing.l The titanium layer is thus cold for the most part and should give rise to absorption lines.3 The measured area enclosed within the absorption lines yields the areal density of the titanium and, by implication, of the total compressed shell. The intensity distribution of the absorption lines yields the temperature of the cold titanium layer. Additionally, the intensity slope of the continuum at higher photon energies yields the core tempera- ture. These parameters are deduced from the measured spectra
Experimental Results Spectrally dispersed images were obtained with a
Kirkpatrick-Baez x-ray microscope of resolution <5 pm, fitted with a dispersing grating.9 The images show a highly nonuniform core of -60-pm FWHM, indicating an unstable implosion. This is further indicated by the spectral results discussed below.
The x-ray spectrum in the range of -4 to 9 keV was recorded by a Ge( 11 1) crystal spectrometer fitted with a 100-pm-wide spatially resolving slit. The slit acts to discriminate core radiation from coronal emission. The calibrated x-ray spec- trum obtained with a Ge(l1l) diffracting crystal is shown in Fig. 70.38. Ti absorption lines are seen around 4.6 keV as well
82 LLE Review, Volume 70

SIGNATURES OF TARGET PERFORMANCE AND MIXING IN TITANIUM-DOPED TARGET IMPLOSIONS ON OMEGA
as absorption above the Ti K edge at 4.966 keV. These absorp- tion features take place when the radiation emitted by the hot, compressed core is absorbed by the colder Ti layer within the shell. The calibration procedure is explained in more detail in Ref. 10. For the calibration of the Kodak DEF film we relied on the measurements and modeling of Herike et uZ.;ll for the calibration of the Ge( 11 1) crystal we relied on the measure- ments of Burek and Yaakobi,12 which agree well with the Darwin-Prins model calculations of Henke et u1.13 Fig- ure70.39 shows themeasured andcalculatedcrystalreflectivity. It should be noted that the crystal sensitivity is a weak function
1 1014
4 5 6 7 8 9
E8347 Photon energy (keV)
Figure 70.38 Calibrated, time-integrated x-ray spectrum obtained on shot 8207. Ti absorp- tion lines are seen around 4.6 keV and the Ti K edge at 4.966 keV. These absorptions take place when the radiation emitted by the hot, compressed core is absorbed by the colder Ti layer within the shell.
1.00 - I I I I I I I
3 Darwin-Pins
model Experiment v 8 h
> 0
.3 + (Burek & Yaakobi) -
.3 c.'
2 0.10 : I
E8381 Photon energy (keV)
Figure 70.39 Measuredl2 and calculated13 integrated reflectivity of Ge( 11 1) crystal.
of energy in the range of interest (4 to 8 keV). In Fig. 70.40 we magnify the part of the spectrum showing various absorption features that are of particular interest in this experiment. As explained below, the lines around 4.6 keV are absorbed within a cool titanium layer (T, -200 to 500 eV), whereas radiation above the Ti Kedge at 4.966 keV is absorbed by much colder titanium. The EXAFS oscillations also indicate cold titanium. On the other hand, the Ti He-a line is emitted in a high- temperature region (-1 keV).
1 0 1 7 . ' I I I I I I I I e
Ti He-a Shot 8207
% a a) 0
1 L 3
1016 - 4.4 4.6 4.8 5.0 5.2 5.4 5.6
E8348 Photon energy (keV)
Figure 70.40 Part of the spectrum of Fig. 70.38, where absorption features appear. The lines around 4.6 keV are absorbed within a cool titanium layer (Te -200 to 500 eV), whereas radiation above the Ti K edge at 4.966 keV is absorbed by much colder titanium. The EXAFS oscillations also indicate cold titanium. On the other hand, the Ti He-a line is emitted in a high-temperature region.
K-Edge Absorption The spectrum shows a drop in intensity at the K edge of cold
titanium at 4.966 keV. This indicates the existence of cold titanium around the time of peak compression, when the observed core emission of continuum radiation is significant. To estimate the temperature of the absorbing titanium we note that for each electron ionized from a titanium atom, the K edge shifts to higher energies. A simple method for estimating the energy of these edges is discussed in Ref. 14. When the 12 M-shell electrons in Ti are removed, the edge shifts progres- sively from 4.966 keV up to about 5.2 k e y when the eight L-shell electrons are removed, the edge shifts progressively from -5.2 to -6.2 keV. The sharpness of the K-edge absorption indicates that no more than a few M-shell electrons are ionized, indicating a temperature lower than -10 to 20 eV. The EXAFS spectrum discussed below indicates a still lower temperature.
The drop above the Kedge corresponds to an absorption by a cold titanium layer of an areal density of 1.3 mg/cm2
LLE Review, Volume 70 83

SIGNATURES OF TARGET PERFORMANCE AND MIXING IN TITANIUM-DOPED TARGET IMPLOSIONS ON OMEGA
(equivalent to a 2.9-pm-thick solid titanium foil). This is 9.3 times higher than the original areal density of the titanium layer, 0.135 mg/cm2. Using this value of areal density we can derive the spectrum emitted by the core before being attenu- ated by the cold titanium layer. This is simply given by Z(E)/exp[-pAr z(E)], where I(E) is the observed spectrum and <E) is the absorption (or opacity) of cold titanium; the result is shown in Fig. 70.41. The continuum is indeed seen to fall along a smooth exponential curve whose slope indicates a core electron temperature of 0.94 keV. This could have also been deduced from the high-energy part of the continuum in Fig. 70.38, where the attenuation by the cold titanium is negligible.
1014 4 5 6 7 8 9
E8346 Photon energy (keV)
Figure 70.41 The calculated core emission before being absorbed by the cold titanium layer. The core electron temperature obtained by the continuum slope is 0.94 keV.
EXAFS Spectrum Above the K edge the spectrum shows oscillations due to
EXAFS. EXAFS15 is observed in solids (even amorphous ones) and is due to the interference of the photoelectron waves emitted from the absorbing ion and those reflected from the neighboring ions. It was previously observed in laser-heated flat targets16 but not in imploded targets. The analysis of the EXAFS oscillations yields the interparticle distance and, hence, the density. EXAFS data for solid titanium have been published17-19 and can be used for comparison.
The theory of EXAFS15 yields an expression for ~ ( k ) = , u ( k ) / , u ~ ( k ) - 1, where y(k) is the absorption (or opac- ity) and po(k) is the absorption of the isolated atom (i.e., without the EXAFS oscillations). The wave number of the ejectedphotoelectronkis givenby hZk2/2m = E - EK ,where
84
E is the absorbed photon energy and EK is the energy of the K edge. The expression for ~ ( k ) is
x sin [ 2kRj + q5j (k)]/kRj2 ,
where Nj is the number of atoms surrounding the absorbing atom at a distance Rj. The backscattering amplitude Fj(k) and phase shift factor qj(k) for titanium were taken from the detailed calculations by Teo and LeeFO and the mean free path of the ejected electron in titanium, A@), was taken from calculations of Blanche et a1.17 The vibration amplitude o2 in the Debye-Waller factor and the interparticle distance Rj will be adjustable parameters in fitting the experimental EXAFS spectrum to Eq. (1).
Figure 70.42 shows the calculated absorption p(k) of the cold titanium layer in shot 8207 (shown above to have an areal density of 1.3 mg/cm2), compared with an EXAFS spectrum of a 6 - p n titanium foil absorber, obtained with synchrotron irradiation.19 The latter curve was multiplied by the ratio of thicknesses (2.9/6) in order to normalize it to the effective thickness (2.9 pm) of the absorbing layer in shot 8207. For both curves, the absorption was reduced by the much smaller absorption due to L-shell electrons, given by the absorption below the K edge (thus the absorption curves equal zero below the edge). The oscillations in the present result have a slightly larger period (thus a smaller R) and larger amplitude than the solid-titanium oscillations; both are consistent2 with slightly
1.2 I A I I I I I I - - 1.0
6 0.8
0.6
-
% - -
G i - v
- .e
0.4 -
0.2 I- -
0.0 N A d I I I I I I 1 4.8 5 .O 5.2 5.4 5.6
E8343 Photon energy (keV)
Figure 70.42 Comparison of the absorption due to the cold titanium layer in shot 8207 and in a 6-pm-thick solid titanium foil, irradiated by synchrotron radiation. The latter curve was normalized to the effective thickness (2.9 p) of the titanium layer in shot 8207.
LLE Review, Volume 70

SIGNATURES OF TARGET PERFORMANCE AND MIXING IN TITANIUM-DOPED TARGET IMPLOSIONS ON OMEGA
higher than solid density in our case. The more gradual rise above the K edge in the curve obtained here is partly the result of fmite spectral resolution and partly due to the ionization of a few M-shell electrons.
The isolated-atom absorption curve &(k) is given by a smooth average through the EXAFS oscillations; thus, the ratio ~ ( k ) = p(k)/,uo ( k ) - 1 retains the changes in the absorp- tion due only to the EXAFS oscillations. Before fitting the experimental EXAFS spectrum to Eq. (1), a Fourier transfor- mation is applied (yielding the radial charge distribution around the absorbing atom) to single out the contribution of only the first term in Eq. (l), that of the closest shell of atoms around the absorbing atom. Also, rather than transforming ~ ( k ) , the quan- tity k3x(k) is normally chosen,15 putting more weight on the part of the spectrum away from the K edge (i.e., on higher k values). This choice is advantageous because Eq. (1) is impre- cise at small kvalues; also, the effect of uncertainty in the value of EK (due to valence-band energy structure) diminishes with increasing k values. The range of 2 to 10 k' was used for the analysis of k3x(k). Below 2 k1 the curve is negligibly small; above k - 10 k1 the EXAFS spectrum is obscured by the rise of the Ti He-P line (albeit weak) at 5.582 keV and its dielec- tronic satellites.
The result of Fourier transforming the quantity k3x(k) (using a Hanning window22 to avoid spurious oscillations) is seen in Fig. 70.43. Only one peak, at 2.2 A, has a significant contribution. This distance is not exactly equal to the interpar- ticle distance because of the effect of the phase factor @(k) in
' , ' , ' , ' I '
Shot 8207
0 2 4 6 8 1 E8344 Radial distance (A)
Figure 70.43 The result of Fourier transforming the k 3 ~ ( k ) curve obtained from Fig. 70.42. The peak at 2.2 A corresponds to the shell of ions closest to the ion absorbing the photon.
Eq. (1). We next filter out this peak (extending from -1 to -3 A) by multiplying the curve of Fig. 70.43 by an appropriate super-Gaussian curve, and finally apply an inverse Fourier transformation back to the k space. The resulting curve (Fig. 70.44) was fitted by the first term of Eq. (l), multiplied by k3. As mentioned above, the functions F(k) , i l(k), and $(k) for titanium have been calculated in great detail, and thus the two remaining parameters, B and R, serve as adjustable param- eters in the fit; no additional normalization was applied. Fig- ure 70.44 shows the best fit, with o2 = 0.013 A2 and R = 2.6 A. The parameter R depends primarily on the oscillation fre- quency of k3x(k), whereas B2depends primarily on the ampli- tude decay rate at large k values (the amplitude rises at small k values because of the k3 factor). Additionally, o2 determines the location and magnitude of the maximum in the k3x(k) curve. It should be emphasized that no amplitude normaliza- tion was applied to obtain this fit.
In solid titanium each atom is surrounded by two sub-shells of six atoms each, at distances of 2.889 A and 2.940 A. The unresolved peak in Fig. 70.43 thus corresponds to N = 12 backscattering atoms at an average distance of 2.6 A [hence the choice N = 12 in Eq. (l)]. This indicates a titanium layer of density -1.4 higher than that of solid titanium, i.e., a density of 6.4 g/cm3. The Debye-Waller parameter 0 (the amplitude of ion thermal oscillations) is proportional to By compari- son with room-temperature EXAFS spectra of titanium, the spectrum of Fig. 70.44 corresponds to an ion temperature below -1 eV. The values of density and temperature deduced here from the EXAFS spectrum are similar to those found with
I I I I lo - - Shot d207 I
- - - Model *'I
:r
1
-7 I v, 4= 0.013 A2
-10 ,1 2 3 4 5 6 7 8 9 10
E8345 Wave number (A-1)
Figure 70.44 Fitting Eq. (1) to the experimental k3x(k) curve, obtained by the inverse Fourier transform of the curve in Fig. 70.43. Two adjustable parameters were used (interparticle distance R and Debye-Waller amplitude 02) with no additional normalization.
L E Review, Volume 70 85
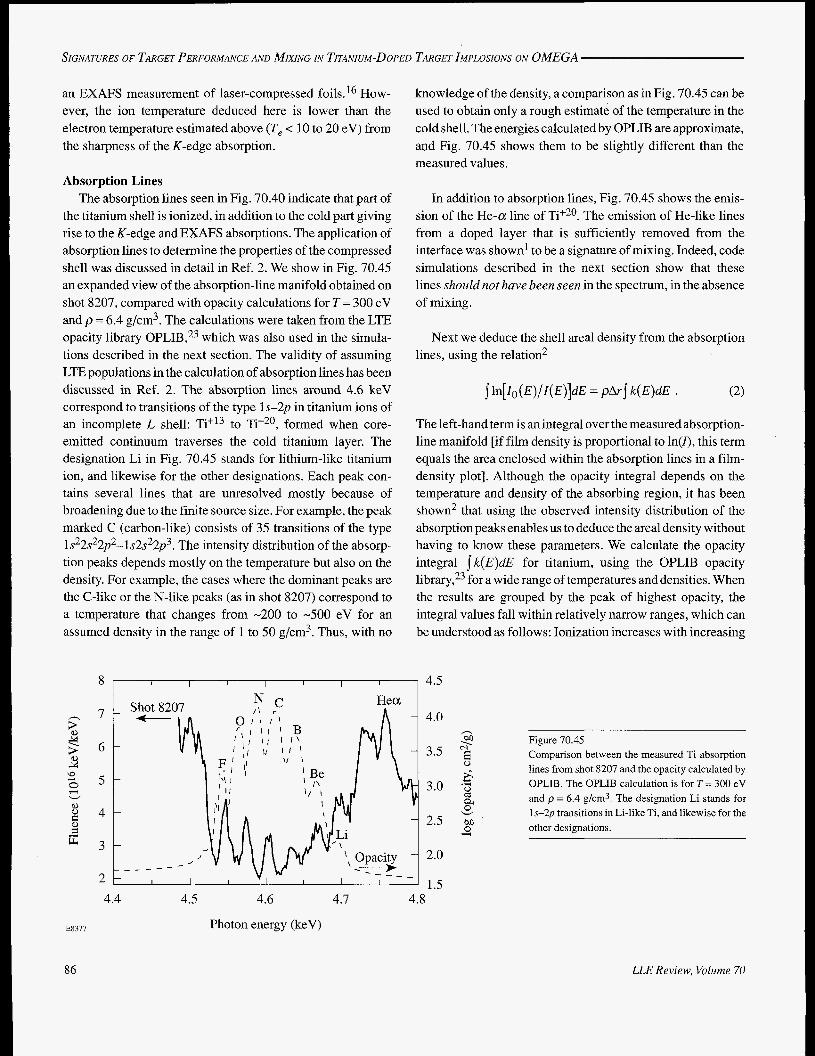
SIGNATURES OF TARGET PERFORMANCE AND MIXING IN TITANIUM-DOPED TARGET IMPLOSIONS ON OMEGA
an EXAFS measurement of laser-compressed foils.16 How- ever, the ion temperature deduced here is lower than the electron temperature estimated above (T, < 10 to 20 eV) from the sharpness of the K-edge absorption.
Absorption Lines The absorption lines seen in Fig. 70.40 indicate that part of
the titanium shell is ionized, in addition to the cold part giving rise to the K-edge and EXAFS absorptions. The application of absorption lines to determine the properties of the compressed shell was discussed in detail in Ref. 2. We show in Fig. 70.45 an expanded view of the absorption-line manifold obtained on shot 8207, compared with opacity calculations for T = 300 eV and p = 6.4 g/cm3. The calculations were taken from the LTE opacity library OPLIB,23 which was also used in the simula- tions described in the next section. The validity of assuming LTE populations in the calculation of absorption lines has been discussed in Ref. 2. The absorption lines around 4.6 keV correspond to transitions of the type 1s-2p in titanium ions of an incomplete L shell: Ti+'3 to Tif20, formed when core- emitted continuum traverses the cold titanium layer. The designation Li in Fig. 70.45 stands for lithium-like titanium ion, and likewise for the other designations. Each peak con- tains several lines that are unresolved mostly because of broadening due to the finite source size. For example, the peak marked C (carbon-like) consists of 35 transitions of the type ls22s22p2-ls2s22p3. The intensity distribution of the absorp- tion peaks depends mostly on the temperature but also on the density. For example, the cases where the dominant peaks are the C-like or the N-like peaks (as in shot 8207) correspond to a temperature that changes from -200 to -500 eV for an assumed density in the range of 1 to 50 g/cm3. Thus, with no
knowledge of the density, a comparison as in Fig. 70.45 can be used to obtain only a rough estimate of the temperature in the cold shell. The energies calculated by OPLIB are approximate, and Fig. 70.45 shows them to be slightly different than the measured values.
I I I I I I I I 4.5
In addition to absorption lines, Fig. 70.45 shows the emis- sion of the He-a line of Tif20. The emission of He-like lines from a doped layer that is sufficiently removed from the interface was shown' to be a signature of mixing. Indeed, code simulations described in the next section show that these lines should not have been seen in the spectrum, in the absence of mixing.
Next we deduce the shell areal density from the absorption lines, using the relation2
jln[Zo(E)/Z(E)]dE = PAYS k(E)dE .
The left-hand term is an integral over the measured absorption- line manifold [if film density is proportional to ln(I), this term equals the area enclosed within the absorption lines in a film- density plot]. Although the opacity integral depends on the temperature and density of the absorbing region, it has been shown2 that using the observed intensity distribution of the absorption peaks enables us to deduce the areal density without having to know these parameters. We calculate the opacity integral jk(E)dE for titanium, using the OPLIB opacity library,23 for a wide range of temperatures and densities. When the results are grouped by the peak of highest opacity, the integral values fall within relatively narrow ranges, which can be understood as follows: Ionization increases with increasing
_ _ _ - - -
4.0
3.5
3.0
2.5
2.0
1.5
Figure 70.45 Comparison between the measured Ti absorption lines from shot 8207 and the opacity calculated by OPLIB. The OPLIB calculation is for T = 300 eV and p = 6.4 g/cm3. The designation Li stands for 1s-2p transitions in Li-like Ti, and likewise for the other designations.
4.4 4.5 4.6 4.7 4.8
E8377 Photon energy (keV)
86 LLE Review, Volume 70

SIGNATURES OF TARGET PERFORMANCE AND MIXING IN TITANIUM-DOPED TARGET IMPLOSIONS ON OMEGA
temperature but decreases with increasing density (because the three-body recombination rises faster with density than other, two-body processes). Thus, a given ionization level is obtained for pairs of (T,p) values where both increase simultaneously. Since opacity increases with density but decreases with tem- perature, the integrated opacity for such pairs tends to be reasonably constant. We show in Fig. 70.46 the calculated opacity integral, arranged according to the strongest opacity peak (marked Li for cases where the lithium-like peak is the strongest, etc.). Thus, simply knowing the strongest absorption peak narrows down the uncertainty in the integrated opacity and, hence, in the deduced areal density. For example, for cases where the C-like peak is the strongest, the uncertainty in the integrated opacity is 5!5%. Applying Fig. 70.46 and Eq. (2) to the spectrum of shot 8207, we find pAr - 0.4 mg/cm2 for the titanium layer with a temperature in the range of -200 to 500 eV. Adding the areal density found above for the cold titanium (1.3 mg/cm2), we find a total PAY for the titanium layer of 1.7 mg/cm2. In adding the areal densities we have assumed that the line- and K-edge absorptions occur at the same time, signifying a temperature gradient within the tita- nium layer. This is indeed indicated by Fig. 70.40. Suppose the two absorptions take place at two different times: the K edge is absorbed at time tl and the lines are absorbed at a time t2. The observed fluence above the K edge (-1.2 x 10l6 keV/keV) consists then of three parts: (a) the fluence that was emitted at t l but survived the K-edge absorption, (b) the fluence emitted
- 1.5 2 5 N - 1.0 2 v
x 0 m i4 .3
8 0.5 z Y
G 3 - 0.0 FI
E8363
I I I I I I I
Ionization state of titanium ions
Figure 70.46 Area under the opacity-spectrum peaks of titanium (corresponding to the absorption-line manifold around 4.6 keV). For temperatures in the range of 300 to 1000 eV and densities in the range of 1 to 50 g/cm3, the points are grouped according to the strongest absorption peak in the opacity spectrum (Li stands for cases where the lithium-like peak is the strongest, and likewise for the other designations).
at t2, and (c) the fluence emitted at other times. Thus, the fluence at t2 must be smaller than the observed fluence above the K edge. However, this level of fluence is much smaller than the depth of the absorption lines (-4 x 1OI6 keV/keV), indicat- ing insufficient fluence to absorb the lines in those times.
Using the measured par of the titanium layer we can estimate the phi- of the entire compressed shell. Figure 70.47 shows the ratio Q = ( ~ A Y ) ~ ~ ~ ~ ~ /(pAr), calculated by the one- dimensional hydrodynamic code LILAC24 for shot 8207 as a function of the compression ratio (defined as rob, where Y is the radius of the gas-shell interface and yo is its initial value). Also shown is the result of a simple geometrical model where the unablated part of the shell is assumed to be incompressible as it implodes inward. Since charge-collector measurements (and simulations) indicate that an overcoat thickness of -9 pm is ablated, the model uses the inner 10.9 pm as the unablated part of the shell. Thus, a lower bound Q - 10 can be used, giving pAr > 17 mg/cm2 for the compressed shell.
""r-----I Model ;.-::::-----; LILAC
'E 15
10
O O " " 10 ' " ' ' 20 ' I ' " 30 I " " 40 I " ' I ' 50 Compression ratio
A
4
c,
Q --. cl
v
2 5
E8394
Figure 70.47 The ratio of pAv for the total shell and for the titanium layer. The model assumes that the unablated shell implodes incompressibly. The compression ratio is defined as ro/v, where r is the radius of the gas-shell interface and ro is its initial value.
It should be pointed out that the use of time-integrated spectra yields an underestimate of the areal density because emission during times when absorption is insignificant dimin- ishes the absorption contrast (typically2 by a factor of -2).
Comparison with Simulations In this section we compare the observed spectrum with that
predicted by LILAC.24 The Ti spectral signatures are shown to reflect the reduced target performance that was a consequence of the poor irradiation uniformity in this experiment.
LLE Review, Volume 70 87
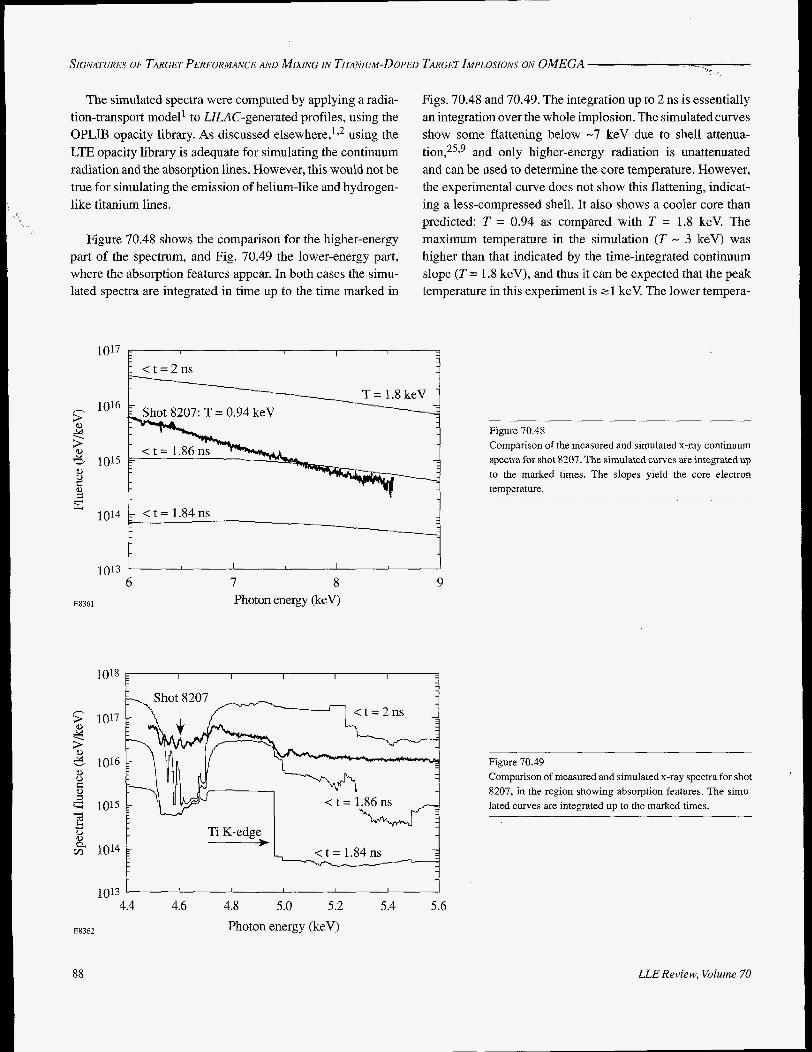
SIGNATURES OF TARGET PERFORMANCE AND MIXING IN TITANIUM-DOPED TARGET IMPLOSIONS ON OMEGA 2 .
The simulated spectra were computed by applying a radia- tion-transport model' to LILAC-generated profiles, using the OPLIB opacity library. As discussed using the LTE opacity library is adequate for simulating the continuum radiation and the absorption lines. However, this would not be true for simulating the emission of helium-like and hydrogen- like titanium lines.
Figure 70.48 shows the comparison for the higher-energy part of the spectrum, and Fig. 70.49 the lower-energy part, where the absorption features appear. In both cases the simu- lated spectra are integrated in time up to the time marked in
1017 E I I 3
Figs. 70.48 and 70.49. The integration up to 2 ns is essentially an integration over the whole implosion. The simulated curves show some flattening below -7 keV due to shell attenua-
and only higher-energy radiation is unattenuated and can be used to determine the core temperature. However, the experimental curve does not show this flattening, indicat- ing a less-compressed shell. It also shows a cooler core than predicted: T = 0.94 as compared with T = 1.8 keV. The maximum temperature in the simulation (T - 3 keV) was higher than that indicated by the time-integrated continuum slope (T = 1.8 keV), and thus it can be expected that the peak temperature in this experiment is 2 1 keV. The lower tempera-
[ < t = 2 n s
1016
55 2 & 1015 e, 0
1 5 E 1014 1 <t=~.;ns I , I , 1
6 7 8 9 E8361 Photon energy (keV)
1013
3
2 & u 0
v)
E8362
1017
1016
1015
1014
1013 4.4 4.6 4.8 5.0 5.2 5.4 5.6
Photon energy (keV)
Figure 70.48 Comparison of the measured and simulated x-ray continuum spectra for shot 8207. The simulated curves are integrated up to the marked times. The slopes yield the core electron temperature.
Figure 70.49 Comparison of measured and simulated x-ray spectra for shot 8207, in the region showing absorption features. The simu- lated curves are integrated up to the marked times.
88 LLE Review, Volume 70

SIGNATURES OF TARGET PERFORMANCE AND MIXING IN TITANIUM-DOPED TARGET IMPLOSIONS ON OMEGA
ture and compression result in a much lower core-radiation fluence than predicted. Figure 70.48 shows that the implosion in this experiment falls short of the 1-D code predictions; in particular, the target fails to undergo the final compression stage that is predicted to occur between -1.86 ns and peak compression at -1.9 ns.
Similar conclusions can be drawn from the comparison in Fig. 70.49. The simulated time-integrated spectrum (<2 ns) shows much deeper absorption lines than observed, indicating a higher areal density, and little K-edge absorption, indicating a higher shell temperature. In fact, the saturated absorption of the simulated absorption lines shows that almost all radiation emitted after -1.84 ns at the wavelengths of these lines is absorbed. As time progresses, the simulated spectra show a gradual shift from K-edge absorption to line absorption, indi- cating heating of the titanium layer by the core. Also, the absorption-line manifold is seen to shift toward higher ioniza- tions, again indicating an increase in shell temperature. By contrast, the experimental curve shows (a) a lower total ab- sorption, indicating a lower areal density [see Eq. (2)], and (b) prominence of K-edge absorption over line absorption, indicating a cooler shell. As in Fig. 70.48, the results show that the implosion is effectively aborted after -1.86 ns. At inter- mediate times (-1.84 to 1.86 ns) K-edge and line absorptions occur simultaneously, which was shown above to be the case in the experiment.
We also note absorption features above -5 keV in the simulated spectra but not in the measured spectrum. These are K-edge absorption in ionized Ti, as well as transitions of the type 1s-31 (K-shell to M-shell transitions) in various titanium ions.
The measured pAr of the titanium layer was found above to be -1.7 mg/cm2. The same pAr value in the simulation occurs at 1.7 ns, consistent with the conclusion of incomplete com- pression suggested above. At 1.7 ns the predicted titanium density is 11 g/cm3, compared with the value 6.4 g/cm3 de- duced from the EXAFS spectrum. The predicted electron temperature is -50 eV, compared with the estimate T <10 to 20 eV from the sharpness of the K-edge absorption. The simulated spectra also predict no emission of helium-like Ti lines (even though LTE opacity modeling tends to overesti- mate their intensity).
The appearance of the He-a line in the experiment (see Fig. 70.45) is clear evidence of shell-core mixing,' which transports titanium into high-temperature regions. Titanium
LLE Review, Volume 70
can be driven out to the ablation region (during acceleration) or into the compressed core (during deceleration). To deter- mine which is the case in this experiment, we examine the spatial profile of the He-a line, as measured by the crystal spectrometer. Figure 70.50 shows the profiles (in the target plane) at the wavelength of the He-aline, as well as at a nearby wavelength; the net He-a emission is given by their differ- ence. The sharpness of the core emission profile indicates a smaller core than the slit width (100 pm), consistent with the 60-pm width measured by the x-ray microscope. Figure 70.50 clearly shows that most of the He-a emission comes from the core, indicating mixing during the deceleration phase. The peak core temperature (21 keV) is sufficiently high to excite the He-a line. The observed intensity of the He-a line can be used to obtain a rough estimate of the amount of titanium reaching the core due to mixing. To that end, we repeat the simulations of Fig. 70.49 while assuming that a small fraction of the titanium mass is uniformly spread throughout the shell layers lying inward of the original titanium layer. Figure 70.5 1 shows the result for the case of mixing 3% of the total titanium mass into the core. The He-a line (as well as its adjacent satellite line) now appears in the calculated spectrum. A comparison is made between the experimental spectrum and the simulated spectrum integrated up to 1.86 ns, as suggested by Figs. 70.48 and 70.49. In calculating the spectrum of Fig. 70.51, a correction was made to account for the LTE calculations' overestimate of the intensity of the emission lines. A steady-state, non-LTEi model was used to calculate the relative populations of the lithium-like, helium-like, and hy- drogen-like Ti species, from which the intensity of the major
1.2 , I , I , , I I I I b I I , , I I I I
- Shot 8207 5 1.0 - -
% + At He-a 2 0.8 - - A r- - "0 0.6 - 3 v
8 0.4 - - E E 0.2 - s -
o . o - ~ - - " " " " " " " " ~ -40 -20 0 20 40
E8395 Radial distance (pm)
Figure 70.50 Spatial profile of emission at the wavelength of the Ti He-aline (4.75 keV), and at a nearby wavelength. The difference (i.e., the net He-a emission) indicates mixing of titanium into the compressed core.
89
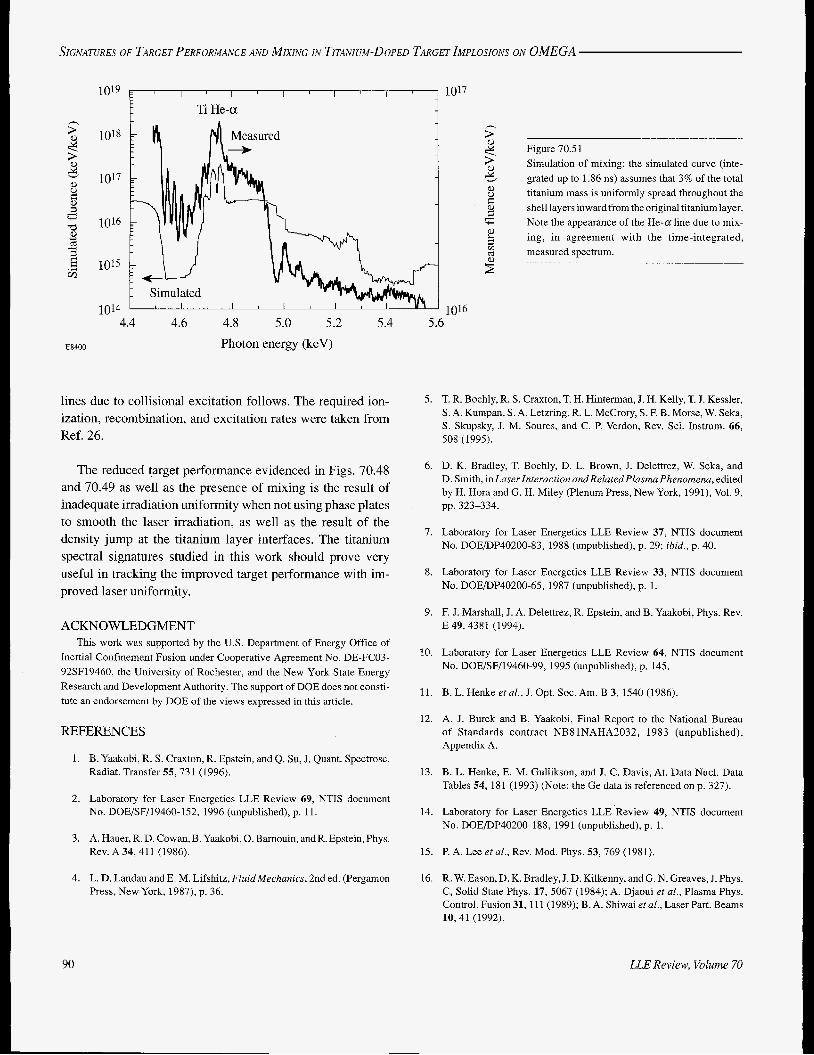
SIGNATURES OF TARGET PERFORMANCE AND MIXING IN TITANIUM-DOPED TARGET IMPLOSIONS ON OMEGA
E8400
1019 I I I I I 1017 Ti He-a
Simulated 1014
4.4 4.6 4.8 5.0 5.2 5.4 5.6 Photon energy (keV)
lines due to collisional excitation follows. The required ion- ization, recombination, and excitation rates were taken from Ref. 26.
The reduced target performance evidenced in Figs. 70.48 and 70.49 as well as the presence of mixing is the result of inadequate irradiation uniformity when not using phase plates to smooth the laser irradiation, as well as the result of the density jump at the titanium layer interfaces. The titanium spectral signatures studied in this work should prove very useful in tracking the improved target performance with im- proved laser uniformity.
ACKNOWLEDGMENT This work was supported by the U.S. Department of Energy Office of
Inertial Confinement Fusion under Cooperative Agreement No. DE-FCO3- 92SF19460, the University of Rochester, and the New York State Energy Research and Development Authority. The support of DOE does not consti- tute an endorsement by DOE of the views expressed in this article.
REFERENCES
B. Yaakobi, R. S. Craxton, R. Epstein, and Q. Su, J. Quant. Spectrosc. Radiat. Transfer 55,731 (1996).
Laboratory for Laser Energetics LLE Review 69, NTIS document No. DOE/SF/19460-152, 1996 (unpublished), p. 11.
A. Hauer, R. D. Cowan, B. Yaakobi, 0. Barnouin, andR. Epstein,Phys. Rev. A 34,411 (1986).
L. D. Landau and E. M. Lifshitz, Fluid Mechanics, 2nd ed. (Pergamon Press, New York, 1987), p. 36.
% Figure 70.51 Simulation of mixing: the simulated curve (inte- grated up to 1.86 ns) assumes that 3% of the total titanium mass is uniformly spread throughout the shell layers inward from the original titanium layer. Note the appearance of the He-a line due to mix- ing, in agreement with the time-integrated,
5 5 8 2 2 5 measured spectrum.
5
5.
6.
7.
8.
9.
10.
11.
12.
13.
14.
15.
16.
T. R. Boehly, R. S. Craxton, T. H. Hinterman, J. H. Kelly, T. J. Kessler, S. A. Kumpan, S. A. Letzring, R. L. McCrory, S. F. B. Morse, W. Seka, S. Skupsky, J. M. Soures, and C. P. Verdon, Rev. Sci. Instrum. 66, 508 (1995).
D. K. Bradley, T. Boehly, D. L. Brown, J. Delettrez, W. Seka, and D. Smith, in Laser Interaction and Related Plasma Phenomena, edited by H. Hora and G. H. Miley (Plenum Press, New York, 1991), Vol. 9, pp. 323-334.
Laboratory for Laser Energetics LLE Review 37, NTIS document No. DOEDP40200-83, 1988 (unpublished), p. 29; ibid., p. 40.
Laboratory for Laser Energetics LLE Review 33, NTIS document No. DOEDP40200-65, 1987 (unpublished), p. 1.
F. J. Marshall, J. A. Delettrez, R. Epstein, and B. Yaakobi, Phys. Rev. E 49,4381 (1994).
Laboratory for Laser Energetics LLE Review 64, NTIS document No. DOE/SF/19460-99, 1995 (unpublished), p. 145.
B. L. Henke etal. , J. Opt. SOC. Am. B 3, 1540 (1986).
A. J. Burek and B. Yaakohi, Final Report to the National Bureau of Standards contract NB81NAHA2032, 1983 (unpublished), Appendix A.
B. L. Henke, E. M. Gullikson, and J. C. Davis, At. Data Nucl. Data Tables 54, 181 (1993) (Note: the Ge data is referenced on p. 327).
Laboratory for Laser Energetics LLE 'Review 49, NTIS document No. DOEDP40200-188, 1991 (unpublished), p. 1.
P. A. Lee et al., Rev. Mod. Phys. 53,769 (1981).
R. W. Eason, D. K. Bradley, J. D. Kilkenny, and G. N. Greaves, J. Phys. C, Solid State Phys. 17, 5067 (1984); A. Djaoui et al., Plasma Phys. Control. Fusion31,lll (1989); B. A. Shiwai etal., Laser Part. Beams 10,41 (1992).
90 LLE Review, Volume 70

SIGNATURES OF TARGET PERFORMANCE AND MIXING IN TITANIUM-DOPED TARGET IMPLOSIONS ON OMEGA
17. G. Blanche et al., Ultramicroscopy 50, 141 (1993).
18. D. Denley et al., Phys. Rev. B 19, 1762 (1979); G. Blanche e6 al., J. Phys. IV 4, 145 (1994).
19. A. Balzarotti, M. De Crescenzi, and L. Incoccia, Phys. Rev. B 25, 6349 (1982).
20. B.-K. Teo and P. A. Lee, J. Am. Chem. SOC. 101,2815 (1979).
21. R. C. Albers, A. K. McMahan, and J. E. Muller, Phys. Rev. B 31, 3435 (1985).
22. A. V. Oppenheim and R. W. Schafer, Digital Signal Processing (Prentice-Hall, Englewood Cliffs, NJ, 1975), Chap. 5.
23. M. E Argo and W. E Heubner, J. Quant. Spectrosc. Radiat. Transfer 16, - 1091 (1976).
24. Laboratory for Laser Energetics Report No. 16, 1983 (unpublished); Laboratory for Laser Energetics LLE Review 36, NTIS document No. DOEDP40200-79, 1986 (unpublished).
25. B. Yaakobi, R. Epstein, and E J. Marshall, Phys. Rev. A 44, 8429 (1991).
26. R. C. Elton, in Plasma Physics, edited by H. R. Griem and R. H. Loveberg, Methods of Experimental Physics, Vol. 9A (Academic Press, New York, 1970), pp. 115-168.
LLE Review, Volume 70 91

Dephasing Time of an Electron Accelerated by a Laser Pulse
d,(v + a) = 0. In a recent paper1 we described the motion of electrons in the electromagnetic field of a circularly polarized laser pulse propagating through a plasma. Electrons that are in front of the pulse initially can be accelerated to high energies and extracted easily. Although this direct acceleration scheme is less than ideal because the pulse can generate a parasitic wake,
pulses have been observed r e ~ e n t l y , ~ ? ~ and future experi- ments will study the interaction of electron bunches with these wake fields. One would only need to change the timing of an electron bunch in these experiments to test the scientific feasibility of direct acceleration. In this article we study the dephasing time of an electron accelerated by a pulse of infinite width to determine the propagation time and plasma length required to observe direct acceleration.
For a particle that is in front of the pulse initially, and is not moving transversely,
its simplicity is noteworthy. The wake fields produced by short v = - a . (3)
By using Eq. (3), one can rewrite the longitudinal components of Eq. (1) as
d,y = Jt(v2/2), d,u = -JX(v2/2).
For a circularly polarized field
(4)
In the following sections, the trajectory of achargedparticle is determined analytically for arepresentative pulse profile; the
u p = ( o , ~ , a cos #,a sin 4)/&. (5)
dephasing time of an accelerated particle is determined; its dependence on the speed, length, and intensity of the pulse along with the injection energy of the particle is studied in detail; and finally, the main results are summarized.
Particle Motion in a Planar Field
electromagnetic field is governed by the equation4
We assume that the phase 4 = 2-sx, where s < 1 is the inverse phase speed of the pulse, and the amplitude a is a function of 9 = t-rx, where r > 1 is the inverse group speed of the pulse. Equations (3)-(5) were solved in Ref. 1 for a particle that is at rest initially. The solution of these equations for a particle that is moving initially is similar. Since the ponderomotive poten- tial v2/2 is independent of 4, it follows from Eqs. (4) that
The motion of a particle, of charge q and mass m, in an
d,(ry-u)=O.
where u p is the four-velocity of the particle divided by c, z is the proper time of the particle multiplied by c, and c# is the four-potential of the field multiplied by q/mc2. The metric four-tensor gP, = diag( 1 ,-1,-1,-1).
By combining Eq. (6) with the definition of 3: one can show that
For a planar field a p has y and z components that are functions of t and x. It is convenient to denote the transverse (two-vector) component of u p by a, the transverse component of up by v, and the longitudinal components of up by yand u. In this notation, the transverse component of Eq. (1) is where
(7)
92 LLE Review, Volume 70

DEPHASING TIME OF AN ELECTRON ACCELERATED BY A LASER PULSE
w = ryo - uo)2 - (r2 - 1)(1+ v2)]1!2. [(
In Eqs. (7) the - sign applies to the case in which y > ru, which corresponds to a particle that is moving more slowly than the pulse, and the + sign applies to the case in which y< ru, which corresponds to a particle that is moving more quickly than the pulse. By using the fact that 1 = yo2 - u;, one can rewrite Eq. (8) in the convenient form
(9)
For the case in which yo = 1 and uo = 0, Eqs. (7) and (9) reduce to the corresponding equations of Ref. 1. A particle that is moving more slowly than the pulse initially will be repelled by the pulse if w = 0. For this to happen the pulse intensity must equal the repelling intensity1
a2 =2(yo -ruo)2/(r2 --I),
in which case the gain in particle energy1
a(+) = esin(n+/2Zr),
where e2 is the peak intensity of the pulse and 1 is its full-width at half-maximum. For this profile
OJ (4 = (Yo - ruo)[l-m2 ~ i n ~ ( q h / 2 1 r ) ] ” ~ , (14)
where
is the ratio of the pulse intensity to the repelling intensity.
When m < 1, the pulse overtakes the particle completely. In this case + varies between 0 and 2Zr, and the solution of Eq. (1 2) is
where F denotes the incomplete elliptic integral of the first kind, of modulus m.5 It follows from Eqs. (7) and (9) that
For completeness, a covariant analysis of particle motion in a circularly polarized field is given in Appendix A, and a brief description of particle motion in an elliptically polarized field is given in Appendix B.
Equations (3), (7), and (9) define u p as a function of (li. By combining the equation d& = y - ru with Eqs. (7), one can show that
The particle motion is illustrated in Fig. 70.52 for the case in which yp = 30, yo = 7, and e2 = 7 [The Lorentz factor yp is defined in the first of Eqs. (22)]. In Fig. 70.52(a) the phase, normalized to lr, is plotted as a function of time, normalized to y;Z. As the particle is accelerated by the front of the pulse, the rate of phase slippage decreases. However, since the peak intensity of the pulse is lower than the repelling intensity, the particle speed never equals the pulse speed and the pulse overtakes the particle. As the particle is decelerated by the back of the pulse, the rate of phase slippage increases. It is evident from Fig. 70.52(a) that the deceleration time equals the accel- eration time. In Fig. 70.52(b) the longitudinal momentum is plotted as a function of the normalized time. Although the particle speed never exceeds the pulse speed, the energy
dr /d+ = kl /u ($),
where the + sign applies to the case in which y< ru and the - sign applies to the case in which y > ru. If the solution of Eq. (12) can be inverted, u p can be expressed as an explicit function of z.
To illustrate the particle motion we consider the simple profile
LLE Review, Volume 70 93

DEPHASING TIME OF AN ELECTRON ACCELERATED BY A LASER PULSE
associated with the transverse particle motion allows the par- ticle momentum to exceed the pulse momentum. Because the longitudinal momentum is a symmetric function of time, the deceleration distance equals the acceleration distance.
When m > 1, the particle is repelled by the pulse. In this case + increases from 0 to (2h/~)s in-~( l /m) as the particle as- cends the ponderomotive potential and decreases from (21r/n) sin-'(l/m> to 0 as the particle descends the pondero- motive potential. The solution of Eq. (12) is
where
e(+) = sin-l[msin(~+/21r)] (19)
40
30 a
Y ; 20
10 E
0 ' I I I I I I 0.0 0.2 0.4 0.6 0.8 1.0 1.2 1.4
P1714 Normalized time
and K denotes the complete elliptic integral of the first kind, of modulus m.5 The first form of Eq. (18) applies to the ascent and the second form applies to the descent. Equations (17) apply to both the ascent and descent, provided that Tis defined by Eqs. (18) and (19). The particle motion is illustrated in Fig. 70.53 for the case in which yp = 30, yo = 7, and e2 = 10. In Fig. 70.53(a) the normalized phase is plotted as a function of the normalized time. Initially, the pulse overtakes the particle and the rate of phase slippage is positive. Since the peak intensity of the pulse is higher than the critical intensity, the particle is accelerated until its speed equals the pulse speed and the rate of phase slippage is zero. Subsequently, the particle overtakes the pulse and the rate of phase slippage is negative. The descent time is longer than the ascent time because the time dilation associated with a particle moving faster than the pulse is larger than that associated with-a par- ticle moving slower than the pulse. In Fig. 70.53(b) the longitudinal momentum is plotted as a function of the normal-
0.8
0.6
a 3 0.4 a
0.2
0.0
120
E 3 80
2 5 40
I I I I I I
0 0.0 0.5 1.0 1.5 2.0 2.5 3.0
P1715 Normalized time
Figure 70.52 Particle trajectory for the case in which yp = 30 and yo = 7. The pulse intensity e2 = 7 is slightly lower than the repelling intensity [Eq. (IO)]. (a) Normalized phase $//lrplotted as a function of the normalized time t / y$ ; (b) longitudinal momentum u plotted as a function of the normalized time.
Figure 70.53 Particle trajectory for the case in which yp = 30 and yo = 10. The pulse inten- sity e2 = 10 is slightly higher than the repelling intensity [Eq. (lo)]. (a) Normalized phase $/Zrplotted as a function of the normalized time t /y$ ; (b) longitudinal momentum u plotted as a function of the normalized time.
94 LLE Review, Volume 70

DEPHASING TIME OF AN ELECTRON ACCELERATED BY A LASER PULSE
ized time. Since the particle does not reach the peak of the pulse, the x component of the ponderomotive force is always positive and the longitudinal momentum of the particle in- creases monotonically. Because the longitudinal momentum is an asymmetric function of time, the descent distance is longer than the ascent distance.
Dephasing Time of an Accelerated Particle The previous analysis shows how an intense pulse repels a
charged particle that is in front of the pulse. The relation between the pulse intensity, the particle injection energy, and the gain in particle energy was studied in Ref. 1. In this section the time required for the pulse to catch and repel the particle, and, subsequently, for the particle to outrun the pulse, is studied. This time is referred to as the dephasing time and is denoted by T. The distance traveled by the particle during the dephasing time is referred to as the dephasing distance and is denoted by X . It follows from Eqs. ( 1 7) and ( 1 8) that
41r2(ryo - uo) K(l /m) xm(r2 - 1) (yo - rug)
T = (20)
and X = T/r. For future reference, notice that K(l /m) + log [4/(m2-l)1’2] as m -+ 1 and K ( l / m ) + x/2 as m -+ C Q . ~
Formula (20) for the dephasing time exhibits a compli- cated dependence on the pulse intensity and speed and the initial particle momentum. One can gain insight into the underlying physics by performing a pulse-frame analysis of the acceleration process. In the notation of Ref. 1, ’ denotes a pulse-frame quantity, the subscript A denotes the initial posi- tion of the particle, and B denotes the position at which the particle is repelled.
The pulse-frame energy and momentum of the particle are related to the laboratory-frame energy and momentum by the equations
y r = y p y - u p u , Id’= y p u - u p y , (21)
group speed of the pulse to estimate the Lorentz factor, y p = wo /we , where cq, is the carrier frequency of the pulse and we is the electron-plasma frequency.6
In the pulse frame v2 is time-independent. It follows from the first of Eqs. (4) that y’ is constant and, hence, that ( u ’ ) ~ + v2 = (~2)’. Since dx’ldt’ = u’/yi , it follows that
In Eq. (23) the factor of 2 arises because the pulse-frame descent time equals the pulse-frame ascent time. The factor of y; arises because of the difference between proper time and pulse-frame time. Provided one ignores the distinction be- tween momentum and velocity, the integral in Eq. (23) repre- sents the ascent time of a nonrelativistic particle in the poten- tial well u2(x’)/2. In the pulse frame a = esin(-xx‘/21’), where I‘ = yp l . For this profile
The factor of 21’/x arises because the ponderomotive force associated with the pulse is inversely proportional to the pulse length. Although Eq. (24) is complicated, the origin of each factor is well understood.
In the pulse frame the particle begins and ends its inter- action with the pulse at point A. Since X’ = 0, it follows that
Notice that X = T/r, as stated after Eq. (20). It follows from Eqs. (21) and (22) that r(ryo -u0)/(r2 -1) = y p y i and 4h /xm(yo -rue) = 2(21’/7r)(&/e). Thus, Eq. (24) and the first of Eqs. (25) agree with Eq. (20).
It is convenient to define the normalized dephasing time where
y p = r/(? -1 ) 112 , u p = l/(? - 1 y 2 .
In these equations yp is the Lorentz factor associated with the pulse speed l / r and u p = ( y p 2 - 1 )”2 . If one uses the linear
which is the dephasing time divided by y;l. The factor of I was due to the inverse dependence of the ponderomotive force on the pulse length. One factor of yp was due to the Lorentz
LLE Review, Volume 70 95

DEPHASING TIME OF AN ELECTRON ACCELERATED BY A LASER PULSE
transformation of the pulse length from the laboratory frame to the pulse frame; the other factor was due to the Lorentz transformation of the dephasing time from the pulse frame to the laboratory frame. These factors do not depend on the physical origin or shape of the potential well in which the particle moves. Thus, it was inevitable that they should be the same as the factors that control the dephasing time of an electron in the laser beat-wave accelerator7 or the laser wake- field a~celerator .~,~ For completeness, a brief analysis of the particle motion and dephasing time associated with these indirect acceleration schemes is given in Appendix C.
energy uX = -e/2, yk = (1 + e2/4)1’2, and the saturation time is 1.7 (1 + 4/e2)1’2, independent of yp. In the low-intensity regime the dephasing time is long because the pondero- motive force is weak. In the high-intensity regime the dephasing time is almost independent of pulse intensity because the increase in ponderomotive force that accompanies an increase in pulse intensity is offset by the corresponding decrease in injection energy. It follows from Eq. (27) and the preceding discussion that the energy gain equals upe. As the pulse intensity increases, the energy gain increases and the required injection energy decreases.
Just as a pulse-frame analysis of the acceleration process fosters insight into the dephasing time, so also does it foster insight into the energy gain. In the pulse frame the particle energy is constant, and the final particle momentum has the same magnitude as the initial particle momentum and the opposite sign: 6y’ = 0 and 6u‘ = 2\41. It follows from these results and Eqs. (21) that
The normalized dephasing time is plotted as a function of injection energy in Fig. 70.55 for the case in which yp = 30. In Fig. 70.55(a) the pulse intensity e2 = 10. The solid line denotes the exact dephasing time [Eq. (26)], and the broken line denotes the approximate dephasing time 2&yL / e . For the chosen values of yp and e the approximate dephasing time is
in agreement with Eq. (1 1).
The normalized dephasing time is plotted as a function of pulse intensity in Fig. 70.54 for the case in which yp = 30. In Fig. 70.54(a) the injection energy yA = 7. The solid line denotes the exact dephasing time [Eq. (26)], and the broken line denotes the approximate dephasing time 2&yX/e. For the chosen values of yp and yA the approximate dephasing time is 6.4/e. When the pulse intensity is close to the repelling inten- sity, the particle lingers near the peak of the pulse and the dephasing time is long. As the pulse intensity increases, point B moves toward the front of the pulse and the dephasing time decreases. In the high-intensity regime this decrease is gradual. Since the pulse energy located behind point B is wasted, there is little to be gained by using pulse intensities that exceed the critical intensity by more than a factor of 2. Since the injection energy is constant, so also is the energy gain [Eq. (27)]. In Fig. 70.54(b) the injection energy
where p = (1 + ~ ” / 4 ) ” ~ is a measure of the pulse intensity. This choice of injection energy ensures that the repelling intensity is one-half of the pulse intensity. For this injection
I I I I
0 2* 0 5 10 15 20 25 30
PI716
I
1
Intensity
Figure 70.54 Normalized dephasing time [Eq. (26)J plotted as a function of pulse intensity for the case in which yp = 30. (a) The particle injection energy YA = 7. (b) The particle injection energy [Eq. (28)] ensures that the repelling intensity [Eq. (lo)] is one-half of the pulse intensity.
96 LLE Review, Volume 70

-DEPHASING TIME OF AN ELECTRON ACCELERATED BY A LASER PULSE
0 ' I I I I
M c .3 m
2 8 a
P1717
50
40
30
20
10
0 0 5 10 15 20 25 30
Injection energy
Figure 70.55 Normalized dephasing time [Eq. (26)] plotted as a function of particle injection energy for the case in which p = 30. (a) The pulse intensity e2 = 10. (b) The pulse intensity [Eq. (29)] is twice the repelling intensity [Eq. (lo)].
0.89 72. When the injection energy is close to the repelling energy, the particle lingers near the peak of the pulse and the dephasing time is long. As the injection energy increases, point B moves toward the front of the pulse and the dephasing time decreases. In the high-energy regime the dephasing time is almost independent of the injection energy because y6 = 1. The energy gain decreases as the injection energy increases. In Fig. 70.55(b) the pulse intensity
2 e2 = 4 ( 4 )
is twice the repelling intensity and the dephasing time is 1.7 y i / l u61. In the low-energy regime the dephasing time is almost independent of the injection energy because y i = y p and u6 = -yp .The ratio yk / l u i I is almost independent of yp. In the high-energy regime the dephasing time is long and the energy gain is small because yk = 1 and I .ai<< 1.
Summary The motion of an electron in the electromagnetic field
associated with a circularly polarized laser pulse of infinite width was studied analytically. When the pulse intensity is lower than the repelling intensity [Eq. (lo)], the pulse over- takes the electron completely. When the pulse intensity is higher than the repelling intensity, the electron is repelled by the pulse and eventually outruns it. The time taken for the electron to outrun the pulse is called the dephasing time and is the product of two terms. The first term is y;l, where yp is the Lorentz factor associated with the pulse speed and 1 is the pulse length. The second term [Eq. (26j1 depends on the pulse intensity, the pulse shape, and the electron injection energy. As a rough guideline, the second term is of order unity unless the pulse intensity is close to the repelling intensity. For a pulse of finite width, an electron that is not close to the pulse axis initially will be expelled from the pulse by the radial compo- nent of the ponderomotive force.9 Further work is needed to quantify this snowplow effect.
ACKNOWLEDGMENT This work was supported by the National Science Foundation under
contract No. PHY-9415583, the U S . Department of Energy Office of Inertial Confinement Fusion under Cooperative Agreement No. DE-FC03- 92SF19460, the University of Rochester, and the New York State Energy Research and Development Authority. The support of DOE does not consti- tute an endorsement by DOE of the views expressed in this article.
Appendix A: Covariant Analysis of the Particle Motion in a Planar Field
The resolution of Eq. (1 j into longitudinal and transverse components is facilitated by the introduction of the four-vector kp, which is defined by the equation 9 = kVxv , and the four- vector lp, which is defined by the equations lVlv = -kvkv, P"', = 0 , and lVav = 0, where u p is the transverse four- potential of a planar field of arbitrary polarization. In the laboratory frame kp = (l,r,O,Oj and l p = (r,l,O,O). By using these four-vectors, one can write
xp = y p + +kp/kvkv + 8lp/ lVlv ,
where y p is transverse and 8 = lVxv In a similar way, one can write
up = v p + ( k V ~ , ) k p / k V k v + ( l v ~ , , ) ~ p / l v l v , (A2)
where vp = dypldz is transverse, kVuv = d&, and lvuv = d,8.
LLE Review, Volume 70 97

DEPHASING TIME OF AN ELECTRON ACCELERATED BY A LASER PULSE
The transverse component of Eq. (1) is
from which Eq. (A9) follows. from which it follows that
Equation (A4) is the analog of Eq. (3).
By using Eq. (A4), one can rewrite the right side of Eq. (1) as -dp(vV74,/2). Since vvvv was assumed to be a function of $, d p = kpd$. It follows from these results that the longitudi- nal components of Eq. (1) are
It follows from the second of Eqs. (A5) that
Finally, since vvvv is a function of +, Eqs. (A4), (A6), and (A9) express up as a function of $. To express up as a function of z one must invert the solution of the phase equation
where (1) is the square root of the terms on the right side of Eq. (A9).
Appendix B: Guiding-Center Motion in a Planar Field Equation (6) is valid when the v2 terms in Eqs. (4) are
independent of 9. To satisfy this condition we assumed that the field is circularly polarized and that the particle is in front of the pulse initially and not moving transversely. Equations (7), (9), and (10) follow from Eq. (6) and the definition of x which requires that
One way to obtain an expression for kVuv is to use the iden- tity uvuv = 1, which can be rewritten as
vVuv +(kVuv)2/kvkv +(Ivuv)2/~vZv = 1. (A7)
It follows from Eq. (A7) that
[kvuv(z)] 2 = [Zvuv(z)]2 +kvkv[ l -vVvv(z )] . (AS)
Equations (A6) and (A8) are the analogs of Eqs. (7) and (8). By using the expression for kVuv(0) that follows from Eq. (A@, and Eq. (A6), one can show that
[kVuv(z)] 2 = [kVuv(0)]2 +kvkv[vvvv(0)-avvv(z)]. (A9)
Equation (A9) is the analog of Eq. (9). Another way to obtain an expression for kVuv is to change the independent variable in the first of Eqs. (A5) from z to +. Since d,$ = kVuv, the first of Eqs. (A5) becomes
For the elliptically polarized field
where ay = a6 and a, = ail - 62)y2, the v2 terms in Eqs. (4) are not independent of $, and Eq. (6) is not valid. However, the particle motion is known to consist of a fast oscillation about a guiding center and a guiding-center drift that varies slowly. In a vacuum, the guiding-center motion is governed by the equation9
where ( ) denotes a $-average and (avav)=-a2/2. We expect Eq. (B3) to provide a reasonable description of the guiding-center motion in a rarefied plasma, in which the phase speed of the field is slightly higher than the speed of light. Equation (B3) has associated with it the conservation equation
98 LLE Review, Volume 70

DEPHASING TIME OF AN ELECTRON ACCELERATED BY A LASER PULSE
Since the ponderomotive potential a2/4 is independent of 4, it follows from Eq. (B3) that
Equation (B5) is the analog of Eq. (6). Since (v) is constant, Eq. (B4) reduces to
d z ( ( y ) 2 -(u)~ -u2/2) = 0.
Equation (B6) is the analog of Eq. (Bl). Thus, for a particle that is in front of the pulse initially, ( y ) and (u) are given by Eqs. (7) and (9), in which v2 is replaced by u2/2, and the repelling conditions are described by Eq. (10).
Appendix C: Particle Motion in a Planar Electrostatic Field
The four-potential of an electrostatic field can be written as
up = pkp /kvkv + qlp/ lv lv ,
where k p and l p were defined in Appendix A. We assume that up is a function of $, from which it follows that d p = kpdG. Since the electrostatic field is unaffected by the gauge trans- formation up --+ up + dpb , where b is an arbitrary function of $, p is redundant. In the Lorentz gauge p = 0.
By substituting decomposition (Cl) in Eq. (1) and contract- ing the resulting equation with kp, one can show that
d,(kpup + p ) = (kvuv)dQp-(Z 'u , )d~q.
Since k'u, = dz$ , thep terms inEq. (C2) cancel, as they must do. By substituting decomposition (Cl) inEq. (1) and contract- ing the resulting equation with lp, one can show that
dz ( P u p + q) = 0.
It follows from Eq. (C3) that
l&Lp (z) = P u p (0) + q(0) - q( 7).
One way to obtain an expression for kvuv is to use the identity
uvuv = 1, which can be rewritten as
2 2 , [k"u,(t)] = [P",(z)] - lvZv.
Another way to obtain an expression for kvuv is to solve Eq. (C2) directly. By changing the independent variable from z to $, one can rewrite Eq. (C2) as
from which Eq. (C5) follows.
Since q is a function of $, Eqs. (C4) and (CS) express up as a function of $. To express up as a function of z, one must invert the solution of the phase equation
d z / d $ = kl/U($),
where w is the square root of the terms on the right side of Eq. (C5).
In the wave frame k;L = (0, I , 0,O) and 1; = ( I , 0, 0,O) , where 1 = (r2 - 1)"2. It follows from these results that $ = - I d , kVuv = -1u' , l'u, = l y ' , and q = lqS, where 4 is the electro- static potential. Thus, Eq. (C4) can be rewritten as
y'(z)=y'(O)+qY(O)-@'(z)=O,
Eq. (C5) can be rewritten as
[.'(.)I2 = [y,(z)l2 - 1,
and Eq. (C7) can be rewritten as
dr/dx' = T l / ~ ( x ' ) ,
where w is the square root of the terms on the right side of Eq. (C9). The dephasing time of an accelerated particle can be determined from Eq. (C10) in a manner similar to that de- scribed previously. In particular, by considering the relations between laboratory-frame and wave-frame quantities, one can show that the dephasing time is proportional to y$A, where 3zy is the Lorentz factor associated with the phase speed of the wave and A is the wavelength.
LLE Review, Volume 70 99

DEPHASING TIME OF AN ELECTRON ACCELERATED BY A LASER PULSE
The potential associated with a large-amplitude plasma wave is described by elliptic functions. Simple formulas for the injection energy and energy gain associated with this potential were determined by Esarey and Piloff.l0 The dephasing times associated with this and other potentials were studied by Teychenn6, Bonnaud, and Bobin.l17l2
REFERENCES
1. C. J. McKinstrie and E. A. Startsev, Phys. Rev. E 54, R1070 (1996).
2. J. R. Marqubs et al., Phys. Rev. Lett. 76,3566 (1996).
3. C. W. Siders et al., Phys. Rev. Lett. 16, 3570 (1996).
4. H. Goldstein, Classical Mechanics, 2nd ed. (Addison-Wesley, Read- ing, MA, 1980), pp. 21-24 and pp. 303-309.
5. P. F. Byrd and M. D. Friedman, Handbook of Elliptic Integrals for Scientists and Engineers, 2nd rev. ed. (Springer-Verlag, New York, 1971).
6. W. L. Kruer, The Physics of Laser Plasma Interactions, Frontiers in Physics, Vol. 73 (Addison-Wesley, Redwood City, CA, 1988).
7. T. Tajima and J. M. Dawson, Phys. Rev. Lett. 43,267 (1979).
8. P. Sprangle et al., Appl. Phys. Lett. 53, 2146 (1988).
9. E. A. Startsev and C. J. McKinstrie, “Multiple Scale Derivation of the Relativistic Ponderomotive Force,” to be published in Physical Review E.
10. E. Esarey and M. Piloff, Phys. Plasmas 2, 1432 (1995).
11. D. Teychenni, G. Bonnaud, and J.-L. Bobin, Phys. Rev. E 49, 3253 (1994).
12. D. Teychenni, G. Bonnaud, and J.-L. Bobin, Physica D 82, 205 (1995).
100 LLE Review, Volume 70

Publications and Conference Presentations
Publications
E. L. Alfonso, S.-H. Chen, M. D. Wittman, S. Papernov, and D. Harding, “A Parametric Study of Microencapsulation Approach to the Preparation of Polystyrene Shells,” Polymer 38, 1639 (1997).
T. R. Boehly, D. L. Brown, R. S. Craxton, R. L. Keck, J. P. Knauer, J. H. Kelly, T. J. Kessler, S. A. Kumpan, S. J. Loucks, S. A. Letzring, F. J. Marshall, R. L. McCrory, S. F. B. Morse, W. Seka, J. M. Soures, and C. P. Verdon, “Initial Performance Results of the OMEGA Laser System,” Opt. Commun. 133, 495 (1997).
S.-H. Chen, J. C. Mastrangelo, H. Shi, T. N. Blanton, and A. Bashir-Hashemi, “Novel Glass-Forming Organic Materi- als. 3. Cubane with Pendant Nematogens, Carbazole, and Disperse Red 1,” Macromol. 30, 93 (1997).
S.-H. Chen, H. Shi, J. C. Mastrangelo, and J. J. Ou, “Thermo- tropic Chiral Nematic Side-Chain Polymers and Cyclic Oligomers,” Prog. Polym. Sci. 21, 1211 (1996).
J. H. Kelly, T. R. Boehly, J. M. Soures, D. L. Brown, R. Boni, R. S. Craxton, R. L. Keck, T. J. Kessler, R. L. Kremens, S. A. Kumpan, S. A. Letzring, S. J. Loucks, R. L. McCrory, S. F. B. Morse, W. Seka, S. Skupsky, and C. P. Verdon, “The Activation of the Upgraded OMEGA Laser at the University of Roches- ter,” in the 8th Laser Optics Conference Technical Digest (SPIE, Bellingham, WA, 1996), Vol. 11, pp. 121-122.
A. K. Lal, K.A. Marsh, C. E. Clayton, C. Joshi, C. J. McKinstrie, J. S. Li, and T. W. Johnston, “Transient Filamentation of a Laser Beam in a Thermal Force Dominated Plasma,” Phys. Rev. Lett. 78,670 (1997).
F. J. Marshall and J. A. Oertel, “A Framed Monochromatic X- Ray Microscope for ICF,” Rev. Sci. Instrum. 68,735 (1997).
J. C. Mastrangelo, B. M. Conger, and S.-H. Chen, “Novel Glass-Forming Organic Materials. 2. Structure and Fluores- cence of Pyrene- and Carbazole-Containing Cyclohexane, Bicyclooctene, and Adarnantane,” Chem. Mater. 9, 227 (1997).
C. J. McKinstrie, V.A. Smalyuk, R. E. Giacone, andH. X. Vu, “Power Transfer between Crossed Laser Beams and the Asso- ciated Frequency Cascade,” Phys. Rev. E 55,2044 (1997).
S. J. McNaught, J. P. Knauer, and D. D. Meyerhofer, “Mea- surement of the Initial Condition of Electrons Ionized by a Linearly Polarized, High-Intensity Laser,” Phys. Rev. Lett. 78, 626 (1997).
A. V. Okishev and W. Seka, “Diode-Pumped, Single-Fre- quency Nd:YLF Laser for 60-Beam OMEGA Laser Pulse- Shaping System,” in Solid State Lasers VI, edited by R. Scheps (SPIE, Bellingham, WA, 1997), Vol. 2986, pp. 93-98.
J. Z. Roach and S. W. Swales, “A Network-Based Imaging System for the OMEGA Laser System,” in the Proceedings of the International Society for Optical Engineering (SPIE, Bellingham, WA, 1997), Vol. 2874, pp. 145-152.
B. Yaakobi, F. J. Marshall, and J. A. Delettrez, “Abel hver- sion of Cryogenic Laser Target Images,” Opt. Commun. 133, 43 (1997).
LLE Review, Volume 70

PUBLICATIONS AND CONFERENCE PRESENTATIONS
Forthcoming Publications
S. Alexandrou, C.-C. Wang, M. Currie, R. Sobolewski, and T. Y. Hsiang, “Characterization of Coplanar Transmission Lines at Subterahertz Frequencies,” to be published in IEEE Transactions on Microwave Theory and Techniques.
J. F. Anzellotti, D. J. Smith, R. J. Sczupak, and Z. R. Chrzan, “Stress and Environmental Shift Characteristics of Hf02/Si02 Multilayer Coatings,” to be published in the Proceedings of the XXVII Annual Symposium on Optical Materials for High Power Lasers, Boulder, CO, 7-9 October 1996.
A. Babushkin, W. Seka, S.A. Letzring, W. Bittle, M. Labuzeta, M. Miller, and R. G. Roides, “Multicolor Fiducial Laser for Streak Cameras and Optical Diagnostics for the OMEGA Laser System,” to be published in the Proceedings of the 22nd International Congress on High-speed Photography and Photonics, Santa Fe, NM, 27 October-1 November 1996.
R. Betti, V. N. Goncharov, R. L. McCrory, and C. P. Verdon, “Linear Theory of the Ablative Rayleigh-Taylor Instability,” to be published in the Proceedings of the 24th ECLIM, Madrid, Spain, 3-7 June 1996.
T. R. Boehly, R. L. Keck, C. Kellogg, J. H. Kelly, T. J. Kessler, J. P. Knauer,Y. Lin, D. D. Meyerhofer, W. Seka, S. Skupsky, V. A. Smalyuk, S. F. B. Morse, and J. M. Soures, “Demonstration of Three Enhancements to the Uniformity of OMEGA: 2-D SSD, New DPP’s, and DPR’s,” to be published in the Proceed- ings of the Second Annual International Conference on Solid-state Lasers for Application to Inertial Confinement Fusion (ICF), Paris, France, 22-25 October 1996.
D. K. Bradley and P. M. Bell, “Implementation of 30-ps Temporal Resolution Imaging on the OMEGA Laser System,” to be published in the Proceedings of the 22nd International Congress on High-speed Photography and Photonics, Santa Fe, NM, 27 October-1 November 1996.
J. L. Chaloupka, T. J. Kessler, and D. D. Meyerhofer, “A Single-Beam, Ponderomotive-Optical Trap for Free Electrons and Neutral Atoms,” to be published in Optics Letters.
A. V. Chirokikh, W. Seka, A. Simon, and R. S. Craton, “Brillouin Scattering in Long-Scale-Length Laser Plasmas,” to be published in Physics of Plasmas.
B. M. Conger, J. C. Mastrangelo, and S.-H. Chen, “Fluores- cence Behavior of Low Molar Mass and Polymer Liquid Crystals in Solution and Ordered Solid Film,” to be published in Macromolecules.
B. DeMarco, C. W. Barnes, K. Kearney, and R. L. Kremens, “Neutron Yield Measurement on the OMEGA Laser System,” to be published in the Review of Scientific Instruments.
R. Epstein, “Properties of the Speckle of Focused, Phase- Converted Laser Beams and the Reduction of Time- Averaged Irradiation Nonuniformity in Laser-Driven Plasmas due to Target Ablation,” to be published in the Journal of Applied Physics.
P. M. Fauchet, “Photoluminescence and Electrolumi- nescence from Porous Silicon,” to be published in the Journal of Photoluminescence (invited).
P. M. Fauchet, “Porous Silicon: Photoluminescence and Electroluminescent Devices,” to be published in the Light Emission in Silicon, Semiconductors, and Semimetals Series.
P. M. Fauchet, Ju. V. Vandyshev, Z. Xu, C. W. Rella, H. A. Schwettman, and G. W. Wicks, “Mid-Infrared Femtosecond Spectroscopy of Intersubband Hot-Hole Relaxation in Quan- tum Wells,” to be published in the Proceedings of OSA’s Tenth International Topical Meeting on Ultrafast Phenomena, San Diego, CA, 28 May-1 June 1996.
D. Fried, R. E. Glena, J. D. B. Featherstone, and W. Seka, “Permanent and Transient Changes in the Reflectance of C02 Laser-Irradiated Dental Hard Tissues at A = 9.3,9.6, 10.3, and 10.6pm and at Fluences between 1-20 J/cm2,” to be published in Lasers in Surgery and Medicine.
B. E. Gillman, Y. Zhou, and S. D. Jacobs, “Coolant/Tool Interactions in Deterministic Microgrinding of Glass,” to be published in Superabrasives Technology 1996, Livermore, CA, 7-8 November 1996.
V. N. Goncharov and R. Betti, “Growth Rate of the Ablative Rayleigh-Taylor Instability for Indirect-Drive ICF,” to be published in Physics of Plasmas.
LLE Review. Volume 70

PUBLICATIONS AND CONFERENCE PRESENTATIONS
M. J. Guardalben, “Canoscopic Alignment Methods for Bire- fringent Optical Elements in Fusion Lasers,” to be published in Optics & Photonics News.
0. E. Hanuch, V. B. Agrawal, S. Papernov, M. delCerro, and J. V. Aquavella, “Posterior Capsular Polishing with the Nd:YLF Picosecond Laser: Model Eye Study,” to be pub- lished in Investigative Ophthalmology.
D. Jacobs-Perkins, M. Currie, C.-C. Wang, C. Williams, W. R. Donaldson, R. Sobolewski, and T. Y. Hsiang, “Subpicosecond Imaging System Based on Electro-optic Ef- fect,” to be published in the lEEE Journal on Selected Topics in Quantum Electronics.
J. H. Kelly, T. R. Boehly, J. M. Soures, D. L. Brown, R. Boni, R. S. Craxton, R. L. Keck, T. J. Kessler, R. L. Kremens, S. A. Kumpan, S. A. Letzring, S. J. Loucks, R. L. McCrory, S. F. B. Morse, W. Seka, S. Skupsky, and C. P. Verdon, “The Acti- vation of the Upgraded OMEGA Laser at the University of Rochester,” to be published in the SPIE Proceedings of the 1st Annual International Conference on Solid-state Lasers for Application to Inertial Confinement Fusion (ICF), Monterey, CA, 30 May-2 June 1995.
T. J. Kessler, Y. Lin, L. S. Iwan, W. P. Castle, C. Kellogg, J. Barone, E. Kowaluk, A. W. Schmid, K. L. Marshall, D. J. Smith, A. L. Rigatti, J. Warner, and A. R. Staley, “Laser Phase Conversion Using Continuous Distributed Phase Plates,” to be published in the Proceedings of the Second Annual International Conference on Solid-state Lasers for Applica- tion to Inertial Confinement Fusion (ICF), Paris, France, 22-25 October 1996.
E. M. Korenic, S. D. Jacobs, S. M. Faris, and L. Li, “Colorim- etry of Cholesteric Liquid Crystals,” to be published in the Proceedings of Optics and Imaging in the Information Age, Rochester, NY, 20-25 October 1996.
K. S. Lebedev, E. A. Magulariya, S. G. Lukishova, S. V. Belyaev, N. V. Malirnonenko, and A. W. Schmid, “Reflective Nonlinearities of Nonabsorbing Chiral Liquid Crystals: Frustration of Selective Reflection by Powerful Laser Radia- tion,” to be published in the Bulletin of the American Physical Society.
LLE Review, Volume 70
M. Lindgren, M. Currie, C. Williams, T. Y. Hsiang, P. M. Fauchet, R. Sobolewski, S. H. Moffat, R. A. Hughes, J. S. Preston, and F. A. Hegmann, “Intrinsic Photoresponse of a Y-Ba-Cu-0 Superconductor,” to be published in Physical Re- view Letters.
M. Lindgren, M. Currie, C. Williams, T. Y. Hsiang, P. M. Fauchet, R. Sobolewski, S. H. Moffat, R. A. Hughes, J. S. Preston, and F. A. Hegmann, “Ultrafast Photoresponse in Microbridges and Pulse Propagation in Transmission Lines Made from High-T, Superconducting Y-Ba-Cu-0 Thin Films,” to be published in the IEEE Journal of Selected Topics in Quantum Electronics.
S. G. Lukishova, S. V. Belyaev, K. S. Lebedev, E. A. Magu- lariya, A. W. Schmid, and N. V. Malimonenko, “cw and High-Repetition-Rate Lasing in Nd:YAG Resonators with Chiral-Nematic Liquid-Crystal Mirrors: A Study of Non- linear Responses,” to be published in Quantum Electronics.
S. G. Lukishova, S. V. Belyaev, K. S. Lebedev, E. A. Magu- lariya, A. W. Schmid, and N. V. Malimonenko, “Nonlinear Bleaching in the Selective Reflection of Nonabsorbing Chiral-Nematic Liquid-Crystal Thin Films,” to be published in JETP Letters and in Molecular Crystals and Liquid Crystals.
S. M. McCormack,D.Fried, J. D. B.Featherstone,R. E. Glena, and W. Seka, “Scanning Electron Microscope Observations of CO, Laser Effects on Dental Enamel,” to be published in the Journal of Dental Research.
R. L. McCrory, “The LLE Direct-Drive Target Physics Experimental Program: First Year of ICF Experiments on OMEGA,” to be published in the Proceedings of the 24th ECLIM, Madrid, Spain, 3-7 June 1996 (invited).
A. V. Okishev and W. Seka, “Diode-Pumped Nd:YLF Master Oscillator for the 30-kJ (UV), 60-Beam OMEGA Laser Facility,” to be published in the IEEE Journal of Selected Topics in Quantum Electronics.
J. J. Ou and S.-H. Chen, “Molecular Dynamics Simulation of Organic Glass-Formers. I. ortho- Terphenyl and 1.3.5-Tri-a- Naphtyl Benzene,” to be published in Journal of Computa- tional Chemistry.

PUBLICATIONS AND CONFERENCE PRESENTATIONS
S. Papernov and A. W. Schmid, “Heat Transfer from Localized Absorbing Defects to the Host Coating Material in Hf02/ Si02 Multilayer Systems,” to be published in the Proceedings of the XXVIII Annual Symposium on Optical Materials for High Power Lasers, Boulder, CO, 7-9 October 1996.
R. D. Petrasso, C. K. Li, M. D. Cable, S. M. Pollaine, S. W. Haan, T. P. Bernat, J. D. Kilkenny, S. Cremer, J. P. Knauer, C. P. Verdon, and R. L. Kremens, “Implosion Symmetry and pR Measurements of the National Ignition Facility from Na- scent 31-MeV Tertiary Protons,” to be published in Physical Review Letters.
A. L. Rigatti and D. J. Smith, “Status of Optics on the OMEGA Laser System after 18 Months of Operation,” to be published in the Proceedings of the XXVIII Annual Sympo- sium on Optical Materials for High Power Lasers, Boulder, CO. 7-9 October 1996.
J. 2. Roach, A. Ninkov, S. W. Swales, and T. Morris, “Design and Evaluation of a Screen CCD Imaging System,” to be published in Optical Engineering.
A. W. Schmid, T. J. Kessler, S. Papernov, and J. Barone, “Low- Surface-Energy Photoresist as a Medium for Optical Replication,” to be published in Applied Physics Letters.
W. Seka, J. H. Kelly, S. E B. Morse, J. M. Soures, M. D. Skeldon, A. Okishev, A. Babushkin, R. L. Keck, and R. G. Roides, “OMEGA Laser Performance with Pulse Shaping,” to be published in the Proceedings of the Second Annual International Conference on Solid-state Lasers for Applica- tion to Inertial Confinement Fusion (ICF), Paris, France, 22-25 October 1996.
H. Shi, B. M. Conger, D. Katsis, and S.-H. Chen, “Circularly Polarized Fluorescence from Chiral Nematic Liquid Crys- talline Films: Theory and Experiment,” to be published in Liquid Crystals.
M. J. Shoup 111, J. H. Kelly, and D. L. Smith, “Design and Testing of a Large-Aperture, High-Gain, Brewster’s-Angle Zigzag Nd:Glass Slab Amplifier,” to be published in Applied Optics.
A. Simon, “Comparison Between SBS Theories and Experi- ment,” to be published in the Proceedings of the LaJolla Summer School ’95, Plasma Physics and Technology (AIP).
M. D. Skeldon, A. Babushkin, J. D. Zuegel, R. L. Keck, A. Okishev, and W. Seka, “Modeling of an Actively Stabilized Regenerative Amplifier for OMEGA Pulse-Shaping Applica- tions,’’ to be published in the Proceedings of the Second Annual International Conference on Solid-state Lasers for Application to ICF, Paris, France: 22-25 October 1996.
M. D. Skeldon, A. Babushkin, W. Bittle, A. V. Okishev, and W. Seka, “Modeling the Temporal-Pulse-Shape Dynamics of an Actively Stabilized Regenerative Amplifier for OMEGA Pulse-Shaping Applications,” to be published in the IEEE Journal of Quantum Electronics.
D. J. Smith, J. E Anzellotti, S. Papernov, and Z. R. Chrzan, “High Laser-Induced-Damage Threshold Polarizer Coatings for 1054 nm,” to be published in the Proceedings of the XXVIII Annual Symposium on Optical Materials for High Power Lasers, Boulder, CO, 7-9 October 1996.
J. M. Soures, “Inertial Fusion Research Using the OMEGA Laser Facility,” to be published in Physics Today.
J. M. Soures, S. J. Loucks, R. L. McCrory, C. P. Verdon, A. Babushkin, R. E. Bahr, T. R. Boehly, R. Boni, D. K. Bradley, D. L. Brown, J. A. Delettrez, R. S. Craxton, W. R. Donaldson, R. Epstein, R. Gram, D. R. Harding, P. A. Jaanimagi, S. D. Jacobs, K. Kearney, R. L. Keck, J. H. Kelly, T. J. Kessler, R. L. Kremens, J.P. Knauer, S. A. Letzring, D. J. Lonobile, L. D. Lund, E 5. Marshall, P. W. McKenty, D. D. Meyerhofer, S. F. B. Morse, A. Okishev, S. Papernov, G. Pien, W. Seka, R. W. Short, M. J. Shoup, 111, M. D. Skeldon, S. Skupsky, A. W. Schmid, D. J. Smith, S. Swales, M. D. Wittman, and B. Yaakobi, “The Role of the Laboratory for Laser Energetics in the National Ignition Facility Project,” to be published in Fusion Technology.
E. A. Startsev and C. J. McKinstrie, “Multiple Scale Deriva- tion of the Relativistic Ponderomotive Force,” to be published in Physical Review E.
C. Stockinger, W. Markowitsch, W. Lang, W. Kula, and R. Sobolewski, “Mechanisms of Photodoping in Oxygen-Defi- cient YBa2Cu30x Films Studied by In-Situ Transport,” to be published in Physical Review B.
M. D. Wittman, R. Q. Gram, H. Kim, C. K. Immesoete, S. G. Noyes, and S. Scarantino, “Increased Retention Time for Hydrogen and Other Gases by Polymer Shells Using Opti-
LLE Review, Volume 70

PUBLICATIONS AND CONFERENCE PRESENTATIONS
cally Transparent Aluminum Layers,” to be published in the Journal of Vacuum Science and Technology.
W. Xiong, Y. Kostoulas, X. Weng, P. M. Fauchet, and R. Sobolewski, “Femtosecond Study of the Electronic Structure in Semiconducting Y-Ba-Cu-0,” to be published in Physical Review B.
Z. Xu, Ju. V. Vandyshev, P. M. Fauchet, C. W. Rella, H. A. Schwettman, and C. C. Tsai, “Ultrafast Excitation and De- excitation of Local Vibrational Modes in a Solid Matrix: The Si-H Bond in Amorphous Silicon,” to be published in the Proceedings of OSA’s Tenth International Topical Meeting on Ultrafast Phenomena, San Diego, CA, 28 May-1 June 1996.
B. Yaakobi, F. J. Marshall, D. K. Bradley, J. A. Delettrez, R. S. Craxton, and R. Epstein, “Signatures of Target Performance and Mixing in Titanium-Doped Target Implosions on OMEGA,” to be published in Physics of Plasmas.
J. D. Zuegel and W. Seka, “Direct Measurements of Lower- Level Lifetime in Nd:YLF,” to be published in the Bulletin of the American Physical Society.
J. D. Zuegel and W. Seka, “Upconversion and Reduced 4F3,2 Upper-State Lifetime in Intensely Pumped Nd:YLF,” to be published in Optics Letters.
Conference Presentations
The following presentations were made at the Twelfth Top- ical Meeting on Advanced Solid-state Lasers, Orlando, FL, 27-29 January 1997:
R. W. Short and A. Simon, “Collisionless Damping of Plasma Waves Propagating in Filaments and Consequences for SRS in Filaments.”
A. Babushkin, W. Bittle, S. A. Letzring, A. Olushev, M. D. Skeldon, and W. Seka, “Stable, Reproducible, and Externally Synchronizable Regenerative Amplifier for Shaped Optical Pulses for the OMEGA Laser System.”
A. V. Okishev and W. Seka, “Diode-Pumped, Single-Fre- quency Pulsed Master Oscillator for the 60-Beam OMEGA Laser Facility.”
A. Okishev and W. Seka, “Diode-Pumped, Single-Frequency Nd:YLF Laser for the 60-Beam OMEGA Laser Pulse-Shaping System,” LASE ’97, San Jose, CA, 8-14 February 1997.
T. R. Boehly, R. L. McCrory, C. P. Verdon,W. Seka, S. J. Loucks,A. Babushkin, R. E. Bahr, R. Boni, D. K. Bradley, R. S. Craxton, J. A. Delettrez, W. R. Donaldson, R. Epstein, D. Harding, P.A. Jaanimagi, S. D. Jacobs, K. Kearney, R. L. Keck, J. H. Kelly, T. J. Kessler, R. L. Kremens, J. P. Knauer, D. J. Lonobile, L. D. Lund, F. J. Marshall, P. W. McKenty, D. D. Meyerhofer, S. F. B. Morse,A. Okishev, S. Papernov, G. Pien, T. Safford, J. D. Schnittman, R. Short, M. J. Shoup 111, M. Skeldon, S. Skupsky, A. W. Schmid, V. A, Smalyuk, D. J. Smith, J. M. Soures, M. Wittman, and B. Yaakobi, “Inertial Confinement Fusion Experiments with OMEGA-A 30-W, 60-Beam UV Laser,” 1997 IAEA Conference, Osaka, Japan, 10-14 March 1997.
The following presentations were made at the Second Interna- tional Workshop on Laser Plasma Interaction Physics, Banff, Alberta, Canada, 19-22 February 1997:
A. V. Chirokikh, W. Seka, and J. A. Delettrez, “Scattered Light Spectra Taken on OMEGA Implosion Experiments.”
R. L. McCrory and J. M. Soures, “Status of Direct-Drive Inertial Confinement Fusion Research at the Laboratory for Laser Energetics,” Second Symposium on Current Trends in International Fusion Research Review and Assessment, Washington, DC, 10-14 March 1997 (invited).
C. J. McKinstrie, A. V. Kanaev, and E. J. Turano, “Sideward Simulated Raman Scattering of a Short Laser Pulse in a Plasma Channel.”
LLE Review, Volume 70

PUBLICATIONS AND CONFERENCE PRESENTATIONS
The following presentations were made at Ultrafast Electronics and Optoelectronics, Incline Village, NV, 17-21 March 1997:
K. Green, M. Lindgren, T. Y. Hsiang, R. Sobolewski, and L. Fuller, “Picosecond Photoresponse in Polycrystalline Silicon.”
D. Jacobs-Perkins, M. Currie, C.-C. Wang, C. Williams, W. R. Donaldson, R. Sobolewski and T. Y. Hsiang, “Analysis of an Interferometric Subpicosecond Imager Based on the Electro-optic Effect.”
M. Lindgren, M. Currie, C. Williams, T. Y. Hsiang, P. M. Fauchet, R: Sobolewski, S. H. Moffat, R. A. Hughes, J. S. Preston, and E A. Hegmann, “An Ultrafast High-T, Super- conducting Y-Ba-Cu-0 Photodetector.”
The following presentations were made at the 1997 Applica- tions of High Field and Short Wavelength Sources VI1 (OSA), Santa Fe, NM, 19-22 March 1997:
B. Buerke, J. P. Knauer, S. J. McNaught, and D. D. Meyerhofer, “Precision Tests of Laser-Tunneling Ionization Models.”
J. L. Chaloupka,T. J. Kessler, andD. D. Meyerhofer, “AThree- Dimensional Ponderomotive Trap for High-Energy Electrons .”
F. Yang, D. Golini, H. Edwards, D. H. Raguin, and S. D. Jacobs, “Planarization of Gratings Using Magnetorheological Finish- ing,” MRS 1997 Spring Meeting, San Francisco, CA, 31 March4 April 1997.
LLE Review, Volume 70