
university of california san diego - eScholarship
307
UNIVERSITY OF CALIFORNIA SAN DIEGO Designing Certainty The Rise of Algorithmic Computing in an Age of Anxiety 1920-1970 A dissertation submitted in partial satisfaction of the Requirements for the degree Doctor of Philosophy in History (Science Studies) by Theodora Dryer Committee in charge: Professor Cathy Gere, Chair Professor Tal Golan Professor Mark Hendrickson Professor Lilly Irani Professor Martha Lampland Professor Charlie Thorpe 2019
-
Upload
khangminh22 -
Category
Documents
-
view
3 -
download
0
Transcript of university of california san diego - eScholarship

UNIVERSITY OF CALIFORNIA SAN DIEGO
Designing Certainty The Rise of Algorithmic Computing
in an Age of Anxiety 1920-1970
A dissertation submitted in partial satisfaction of the Requirements for the degree Doctor of Philosophy
in
History (Science Studies)
by
Theodora Dryer
Committee in charge:
Professor Cathy Gere, Chair Professor Tal Golan Professor Mark Hendrickson Professor Lilly Irani Professor Martha Lampland Professor Charlie Thorpe
2019

Copyright
Theodora Dryer, 2019
All rights reserved.

iii
The Dissertation of Theodora Dryer is approved, and it is acceptable in quality and form for publication on microfilm and electronically:
__________________________________________________________________
__________________________________________________________________
__________________________________________________________________
__________________________________________________________________
__________________________________________________________________
__________________________________________________________________
Chair
University of California San Diego 2019

iv
TABLE OF CONTENTS
Signature Page……………………………………………………………………………………. iii
Table of Contents……………......………………………………………………...……………… iv
List of Figures……………………………………………………………………………………...v
Acknowledgements……………………………………………………………………………….vii
Vita…………………………………………………………………………………………....…xiv
Abstract of the Dissertation………………………………………………………………….….xvi
Chapter 0: Introduction Mapping Uncertainty Between Crisis and Confidence………….………………………………..…1
Chapter 1: Crisis Crisis as Prologue: The New Agrarian Calculus and Anxious Quanta…………..................................33
Chapter 2: Confidence 1929: The Origins of Confidence Computing in Warsaw, Poland…………………………………70
Chapter 3: Control Seeds of Control: Sugar Beets, Control Logics, and New Deal Data Politics, 1920-1940…………108
Chapter 4: (Un)certainty Machine Over Mind: (Un)certainty Work in India's Rurual Reconstruction Programs and as U.S. Military Method……147
Chapter 5: Climate Computing Cloud Seeds: A Story of Anthropogenic Climate Change, 1940-1970………………..188
Chapter 6: Conclusion Automating (Un)certainty: Digital Cloud Seeds and Confidence Algorithms………………...…...247
Bibliography……………………………………………………………………………………..269

v
LIST OF FIGURES
Figure 1: “Confidence Intervals,” University College London Special Collections. ................................ 1
Figure 2: UCL, “Confidence Intervals,” https://tinyurl.com/y3utonfd (accessed May 20, 2015). ...... 4
Figure 3: Interval Estimations, Classroom Experiment, 1971. .................................................................. 6
Figure 4: “Evidence of widespread effect of cloud seeding at two Arizona experiments,” 1971........ 22
Figure 5: Duane Michals, “Madame Schrödinger’s Cat,” 1998, From the series Quantum. .................. 33
Figure 6: “Anthropometric Laboratory,” Frances Galton Papers, Digital Special Collections, UCL. 44
Figure 7: “Poultry at Government Farm, Beltsville, Maryland,” 1920. . ................................................ 48
Figure 8: “Agriculture and Landownership in Poland,” 1921. ................................................................. 70
Figure 9: Trans., “Sugar Beet Map of Poland,” Statisticia, 1933. .............................................................. 97
Figure 10: "The Accuracy of the "Dilution Method,” 1935. ................................................................... 102
Figure 11: “Confidence Interval for Dilution Experiment,” 1936. . ...................................................... 104
Figure 12: Jerzy Neyman’s Dedication to those Murdered by Gestapo, 1952 ..................................... 107
Figure 13: “White Improved Vilmorin Sugar Beet,” Farmers’ Bulletin 52, 1889. ................................... 108
Figure 14: “The Theoretical Beet-Sugar belt of the United States,” Farmers’ Bulletin 52, 1899 .......... 115
Figure 15: “The Michigan Sugar Beet Industry,” 1927. .......................................................................... 119
Figure 16: “Quality Control Charts,” Bell System Technical Journal, 1926. ............................................... 121
Figure 17: 160330 Telephone transmitter, Richard C. Winckel, Western Electric, 1926. ................... 126
Figure 18: “Quality Control Charts,” Bell System Technical Journal, 1926. ................................................ 128
Figure 19: “Composite Plot of Incendiary Sticks” in “Bomb Patterns” .............................................. 147
Figure 20: “Mathematical Machines,” Scientific American, 1949. ............................................................. 149
Figure 21: “An Illustration of the Use of Fiducial Limits,” Sankhyā, 1935. ......................................... 156
Figure 22: “Bengal Anthropometric Survey,” 1945. . ............................................................................... 159
Figure 23: “Handling Field, Valparaiso Fla.,” 1935, soon to become Eglin Field Proving Ground. 163

vi
Figure 24: “Aerial Schematic of Amagasaki, Japan,” 1945.. .................................................................... 164
Figure 25: “Coordinates of the Clock and Instrument Signals on the Tape,” 1943. ........................... 170
Figure 26: “Bombsight View of The Leader in Aiming at: Battleships/Destroyers,” 1944. .............. 173
Figure 27: “Dial Board and Visual Adjustment Board of the Computer of Probabilities,” 1943. .... 175
Figure 28: “The Norden Bombsight,” 1943.. ............................................................................................ 177
Figure 29: "View of Apparatus as Set Up." 1945. ..................................................................................... 183
Figure 30: "How the Bombsight Solves Problems," 1943...................................................................... 185
Figure 31: “The Desert Laboratory,” 1911. .............................................................................................. 188
Figure 32: “Rain Making Firm Takes Mexico Jobs,” 1949. ..................................................................... 210
Figure 33: “Rain Making Pioneer Hints Weather Control,” 1950. ......................................................... 218
Figure 34: “A Detailed Study of Desert Rainfall,” 1933. ......................................................................... 225
Figure 35: RAIN—Water Resources Corres. 1952. ................................................................................ 228
Figure 36: Weather Control Newspaper Article, Undated. ..................................................................... 241
Figure 37: Eduardo Paolozzi, “Conditional Probability Machine,” 1970. ............................................. 247
Figure 38: “Re-Evaluation of the Arizona Cloud-Seeding Experiment,” 1971. ................................... 253
Figure 39: “Probabilistic Logics and the Synthesis of Reliable Organism from Unreliable
Components,” 1956....................................................................................................................................... 258
Figure 40: "Algorithm 516: An Algorithm for Obtaining Confidence Intervals," ACM, 1977. ....... 262

vii
ACKNOWLEDGEMENTS
When I first drove to San Diego cross-country from Boston, Massachusetts to begin my
PhD program, I did not anticipate the worlds that would be opened for me or the depths to which
my life would change. Designing Certainty is the material product of this time: the individual and
collective thought, the fieldwork and community-building, and the personal and intellectual
transformations that occur when important questions are put forward and rigorously followed
through. This is a PhD dissertation. It is not perfect and not yet what it will soon be in book form.
However, this dissertation represents one of the most challenging and rewarding opportunities of
my life and there are many people without whom this would not have been possible. In expressions
like this, words are just not enough. But the word, ‘acknowledgement’ holds a number of meanings:
recognition, appreciation, realization, gratitude, and awareness. I am utterly humbled by the
contributions and support that brought this project to fruition.
My first expression of gratitude is to my advisor, Cathy Gere. Designing Certainty would not
exist without her support and intellectual engagement. She always saw the clarity through the fog,
encouraged me to pursue the bold questions, and empowered me to be the scholar and person that I
am. She worked with me in the many stages of this project from growing my nascent thoughts,
through conceptualizing the whole project, and the many layers of editing. Her work is present in
this dissertation and her intellectual and political influence will be with me for the rest of my life. I
also hold immense gratitude for Tal Golan, who is one of the earliest advocates of this project. Tal
taught me the joy and challenges of historical work and held unwavering support of me and my
ideas throughout my PhD. He writes and teaches with a balance of humor and rigor that I emulate
in my own scholarship.
The pages of this dissertation are likewise shaped by the personal support and intellectual
influences of an extraordinary dissertation committee. I was so fortunate to work with Martha

viii
Lampland with whom I share so many questions and interests about quantitative life. I am grateful
for her steadfast encouragement of my ideas and of me as a whole person throughout the PhD, and
I am indebted to her foundational scholarship. I am also grateful to Charlie Thorpe who engaged me
on questions of militarism, military power, and the history and philosophy of technology; these
influences are crucially important to this dissertation and in my ongoing research. Likewise, Mark
Hendrickson worked with me in histories of labor, capitalism, and economics, which has directly
informed my conceptions of data economies and other facets of my work. I greatly enjoyed our time
reading and teaching together due in no small part to his professionalism, humor, and general
enthusiasm. Finally, I hold immense gratitude for Lilly Irani, who grew our attention to critical
algorithm and data studies and workers’ rights in the expanding technology fields. Her unwavering
commitments to community-work, interdisciplinarity, and empirical rigor deeply influenced my
intellectual journey.
I am indebted to the University of California, San Diego’s Science Studies Program and
Department of History for giving me the training and freedoms I needed to conduct this project. I
am appreciative of History Chair Pamela Radcliff for her steadfast leadership and Rachel Klein for
her support and many wonderful conversations. Bob Westman asked me six years ago: ‘is this a
history of uncertainty?’ His friendship, coffee conversations, and questions—always to the core of
things—meant a great deal to me. I remain in awe of the Science Studies Program’s unparalleled
intellectual setting. I hold dear my coursework and engagements with Nancy Cartwright, JP Pardo-
Guerra, Kalindi Vora, Kerry McKenzie, Kelly Gates, Lisa Cartwright, Morana Alac, and Dan
Navon. I had the great privilege of teaching with Claire Edington and am lucky to have her
mentorship and friendship over these years. My brilliant history cohort friends, Laura Gutiérrez and
Alina Méndez gave me support and laughter, and many memories of eating delicious food. A special

ix
acknowledgement goes to the program administrators: Sally Hargate, Susan Bernal, Jennifer Dieli,
Maureen McCormick, Amber Rieder, and Van Lee-Yamamoto, who make our work possible.
The larger interdisciplinary setting at UCSD transformed my thinking and research,
especially in collaboration with ethnic studies, communication, sociology, and anthropology. I
cherish my friendships with Yelena Gluzman, Sarah Klein, and Louise Hickman: thank you for
building our community and for your powerful contributions to feminist STS. Likewise, thank you
to my SSP cohort: Chad Valasek, Don Everhart, Rebecca Hardesty, Monika Sengal-Jones, Audrey
Lackner, Trisha Tschopp, Kris Nelson, Joan Donovan, Matthew Shindell, and Wissam Alshaibi. I
spent four wonderful years teaching at Thurgood Marshall College that became my home on
campus. Thank you to my colleagues: Jorge Mariscal, Jeff Gagnon, Sue Hawkins, Ekhlas Fajardo,
Nancy Madrid, Davorn Sisaveth, James Davenport, Linh Nguyễn, Aundrey Jones, and Marilisa
Navarro.
I am a proud recipient of a number of dissertation fellowship awards. The Consortium for
the History of Science, Technology, and Medicine gave me an intellectual home in Philadelphia over
the last few years. Thank you to Babak Ashrafi, Aaron Slater, Sheila O’Shaughnessy, Larry Kessler,
Lisa Ruth Rand, Elaine Ayers, Kevin Baker, Ashley Inglehart, Ayah Nuriddin, Michelle Smiley,
Alana Staiti, Nicole Belolan, Jordan Katz, Nabeel Hamid, Daniel Vandersommers, Katya Babintseva,
Adam Shapiro, Joseph Martin, Juliet Larkin-Gilmore and Taylor Moore.I am also grateful to Penn’s
History and Sociology of Science Department for hosting me: Susan Lindee, Etienne Benson,
Stephanie Dick, and Harun Küçük, with whom I share so much academic background. In my final
PhD year, I was awarded the Erwin and Adelle Tomash Fellowship in the History of Information
Technology; thank you to Charles Babbage Institute at the University of Minnesota, especially
Jeffrey Yost, Amanda Wick, and Juliet Burba. I am also grateful to be the 2018-2019 recipient of the

x
IEEE Life Member Fellowship in the History of Electrical and Computing Technology that
supported completion of this project.
Historical work depends on archives and on the work of archivists; I am grateful to the
libraries and institutions that supported Designing Certainty. Primarily, I was awarded the Bancroft
Library Research Fellowship at University of California, Berkeley, which holds my main collections.
My fellowship with the American Philosophical Society provided me with wonderful resources and
community; thank you to Adrianna Link, David Gary, and Patrick Spero. This project was likewise
supported by the Smithsonian libraries, Harvard University, Columbia University, the National
Agricultural Library, and UCLA. The archivists at different branches of the National Archives
Records Administration, which house many of my papers, work especially hard and with little
resources, to keep those archives open. A special thank you to the University College London for
providing me with access even in the midst of construction.
The history of mathematics and quantification community has been enormously supportive
of my work. A special thank you to Kavita Philip for our early conversations on postcolonial
statistics and Ted Porter for his generous engagements. I am indebted to Karen Parshall for creating
the history of mathematics forum, which has been a crucial part of our community. And likewise, to
Brittney Shields and Emily Hamilton for organizing the annual AMS HPM and community
outreach. A very special thank you to Bill Donahue and Dana Densmore for their ongoing support
over the last 15 years. Clare Kim is an esteemed collaborator and friend, especially in our shared
interest on mathematics and the pitfalls of modernity. With Matthew Jones and Christopher Phillips,
I had the privilege of shaping our subfield in mathematical statistics together, always with warm and
productive engagements. My gratitude extends to Peggy Kidwell for her ongoing interest in my work
and aiding me with Smithsonian materials. Likewise, in Washington D.C., I am appreciative of Will
Thomas for his support and conversations since the very early stages of this project. And Teasel

xi
Muir-Harmony is a cherished colleague; I am inspired by her historical and public work at the
Smithsonian and beyond.
The history of computing and technology community provided me with unparalleled
resources and engagement during this time. Thank you especially to the SIGCIS collective: Laine
Nooney, Gerardo Con Diaz, Colin Garvey, Katya Babintseva, Andrew Russell, Whitney Pow,
Alexandre Hocquet, Danielle Judith Zola Carr, Beth Semel, Nathan Ensmenger, Mar Hicks, Eileen
Clancey, Jacqueline Wernimont, and Justin Joque. I am indebted to Steph Dick for her scholarship
and friendship, and our enthusiastically shared interests on models and machines and formal
methods. Thank you to Bradley Fidler for his support of my work and in our collaborative projects,
and his wonderful humor to always brighten my day. Joy Rankin is an inspiration in our field and to
me, and I am immensely thankful for her scholarship, guidance, friendship, and collaboration. I owe
a special thank you to the organizers of the 2016 algorithms conferences at the University of
California, Berkeley’s CSTMS, Morgan Ames and Massimo Mazzotti, and the larger community of
scholars that came together, especially: Caitlin Rosenthal, Luke Stark, Beth Reddy, Nick Seaver, and
Tamara Kneese. A heartfelt thank you to Kate Crawford and Meredith Whittaker, and the AI Now
team, for seeing my vision and giving me inspiration at such a crucial moment in this project.
There are a number of people who were deeply influential to this work and in my larger life.
Naomi Oreskes, you gave me such a strong foundation and training in our field and have been a
consistent mentor and friend. Thank you for the world-saving work you do and for fostering my
own courage and power. Patrícia Martins Marcos, you are a force of nature and it is a great honor to
have you as interlocutor and friend. Thank you for your faithful solidarity, and all the joy and color
you bring to this work. Emily Hamilton, I am thankful that our combined love of mathematics and
food brought us together. I am moved by your story-telling and insights as scholar, teacher, and
friend; I could not have done this without you. Taylor Moore, I am so lucky we crashed into

xii
Philadelphia together, you are a true interlocutor and inspiration, and I look forward to growing and
changing our field together. My Philadelphia neighbors, Janine Utell and JP Spiro: your friendship,
laughter, support, and writing solidarity made South Third Street a home. And finally, Carrie
Streeter, my vocabulary is far too limited to adequately express the gratitude and awareness I have of
your unwavering love and support over the past seven years, through the highs and the lows. You
are my friend, family, collaborator, trusted editor, and coauthor, and through this you have helped
shape these pages.
I have immense appreciation for my friends who have supported me in countless and
significant ways over these years: Anna Biegelsen, Joshua Gleason, Andrew Payne, Jack Hughes,
Hannah Jayanti, Alexander Porter, Laura Zak, my soul sister Rachel Myrowitz, Karyn Coughlin, Mia
Posner, JD Maturen, Sonja Griffin, my wonderful older brother Ben, and Teegan Jansen. To my
family: you have always done the best you can with what you have been given, and that is incredible
strength; you will always be a part of me. To my little brothers J + J: I love you so much. And
Grammie Kay, you are my number one.
Thank you.
Chapter 0, contains material as it appears in “Algorithms under the Reign of Probability”
Think Piece in IEEE Annals of the History of Computing Vol. 40, No. 1 (Jan.-Mar. 2018): 93-96.
Dryer, Theodora. The dissertation author was the sole author of this material.
Chapter 2, contains material as it will appear in Dryer, Theodora. “From Soil to Bombs: A
History of Uncertainty Computing” (In Review HSNS). The dissertation author was the sole author of
this material.
Chapter 3, contains material as it will appear in Dryer, Theodora. “Seeds of Control:
Algorithmic Computing and the New Deal Farm Economy, 1933-1940” in Algorithmic Modernity, eds.

xiii
Massimo Mazzotti and Morgan Ames. Forthcoming with Oxford University Press. The dissertation author
was the sole author of this material.
Chapter 4, contains material as it will appear in Dryer, Theodora. “From Soil to Bombs: A
History of Uncertainty Computing” (In Review HSNS). The dissertation author was the sole author of
this material.

xiv
VITA
EDUCATION
2019 Ph.D., History (Science Studies), University of California, San Diego 2009 M.A., History and Philosophy of Science, University of Leeds, United Kingdom 2007 B.A., St. John’s College, Santa Fe, New Mexico FELLOWSHIPS AND AWARDS
2018-19 Charles Babbage Institute’s Adelle and Erwin Tomash Fellowship in History of Information Technology
2018-19 IEEE Life Member Fellowship in the History of Electrical and Computing Technology
2018-19 American Philosophical Society Library Resident Research Fellowship
2017-18 Dissertation Fellow, Consortium for the History of Science, Technology, and Medicine, Philadelphia
2016 Bancroft Library Research Fellowship, University of California, Berkeley 2016 Summer Graduate Teaching Scholars Program. University of California, San Diego 2016 Science Studies Program Dissertation Grant. University of California, San Diego. 2015 Science Studies Program Research Stipend. University of California, San Diego. 2015 University of California, Berkeley Travel Grant. 2015 History Department Research Stipend. University of California, San Diego.
PUBLICATIONS
2019 “The New Critical History of Surveillance and Human Data” in HSNS, forthcoming. 2019 “Seeds of Control: Algorithmic Planning and the New Deal Farm Economy, 1933-1940”
in Algorithmic Lives, eds. Massimo Mazzotti and Morgan Ames, forthcoming. 2019 REVIEW “Farm Worker Futurism: Speculative Technologies of Resistance” by Curtis
Marez (Minnesota University Press, 2016) in Technology & Culture Vol. 60, No. 3 (July 2019): 924-926.

xv
2018 “Algorithms under the Reign of Probability” Think Piece in IEEE Annals of the History of Computing Vol. 40, No. 1 (Jan.-Mar. 2018): 93-96.
2015 REVIEW “Sociology & Empire: The Imperial Entanglements of a Discipline” by ed.
George Steinmetz (Duke University Press, 2013) in Isis Vol. 106, No. 4 (December 2015): 948-949.
RECENT TALKS
2019 Data Optics: Aerial Reconnaissance Photographs as Algorithmic Medium. Society for the History of Technology Annual Meeting. Milan, Italy.
2019 (Un)certainty: History and Critique. Association for Computing and the Humanities. Pittsburgh,
PA. 2019 Digital Innovations and the Future(s) of Agriculture. American Society for Environmental
History Annual Conference. New Orleans, LA. 2019 Calculated Yields: Inter-War Projects of Math and Environment. American Society for
Environmental History Annual Conference. Columbus, OH. 2018 Computing Control for “Automatic Pilots”: Memory-Making in Early Twentieth Century
Bombing Machines and their Impacts, 1911-1953. Society for the History of Technology Annual Meeting, Special Interest Group in Computing Information Science (SIGCIS). St. Louis, MO.
2018 Presidential Round Table: An Offering of Tools and Advice for Post-Grad Life. Invited
Participant. Society for the History of Technology Annual Meeting. St. Louis, MO. 2018 Computing Sugar Beets. Society for the History of Technology Annual Meeting. St. Louis, MO. 2018 Algorithms before 1950. American Mathematical Society Eastern Section Meeting. Boston, MA. 2017 Probability Tables and Bombsight Optics in Building the Destruction Data Economy,
1942-1945. SIGCIS, Society for the History of Technology Annual Meeting. Philadelphia, PA. 2017 Sugar Beets and the Rise of Mathematical Statistics in Agriculture. History of Science Society
Annual Meeting. Toronto, Canada. 2017 Mathematical Statistics in New Deal Research Pedagogy. History and Pedagogy of
Mathematics—Americas Section. Philadelphia, PA. 2017 A Political History of Algorithmic Thinking in U.S. Agriculture, 1933-1939. Algorithmic
Thinking Conference. Berkeley, CA. 2016 From Soil to Bombs. Algorithms in Culture Conference. Berkeley, CA.

xvi
ABSTRACT OF THE DISSERTATION
Designing Certainty The Rise of Algorithmic Computing in an Age of Anxiety
1920-1970
by
Theodora Jewell Dryer
Doctor of Philosophy in History (Science Studies)
University of California San Diego, 2019
Professor Cathy Gere, Chair
This dissertation offers a political history of the cultural trope and technical apparatus:
‘with 95% certainty,’ and of uncertainty more broadly, from the early 1920s mathematical statistics
movement through the design of FORTRAN and ALGOL language digital algorithms of the 1960s
and 1970s. The work features a prominent twentieth-century data architecture: confidence interval
parameters (CIs). Confidence intervals are statistical hypothesis tests, and experimental design
mechanisms, used to make estimations about statistical data, and inform subsequent decision-
making based on that information and analysis. CIs connect across digital and predigital computing
and function as part of the underpinning logical and political infrastructures that make algorithmic
decision-making possible. I situate digital algorithms and statistical hypothesis tests as common ‘data

xvii
architectures,’ that operate under uncertainty (probabilistic thinking), and that are designed to make
certainty claims (political decisions) based on a set of information. By the 1960s, digital algorithms
were designed to take over the (un)certainty work of human computers.
At the scale of experimental data design, there are key computing concepts at work:
confidence (measure of validity), control (randomization), and uncertainty (probability limits) that
hold technical-mathematical meanings. I argue these computing concepts also hold affective
meanings, driven by human desires and anxieties. I link historical instances and applications of CI
logics, a practice that I term ‘confidence computing,’ with much larger historical forces in
agriculture, militarism, and environmental policy. I follow iterations of CI logics across a hundred-
year period, and in global applications in Poland, India, England, the United States, and Navajo and
Hopi land. I put forward two analytic categories to connect across these contexts: ‘(un)certainty
work’ is the twofold process of translating data into probabilistic information and analysis and
making certainty claims based on that information and analysis. And ‘computing landscapes’ are the
geographical areas of land, and political and cultural contexts, that are altered and transformed
through this computing work.
I argue this: Between 1920 and 1970 an information transformation occurred that
reconfigured economic, scientific, and environmental planning processes under a shared program to
command uncertainty in data management. This information movement is driven by iterations of
crisis that begin in the aftermath of WWI. Designations of crisis are generative of new technical
(un)certainty designs and new information systems just as they reaffirm extant information and
power structures. Waves of crisis and responsive computational design (and redesign) therefore give
impetus to an expanding power of (un)certainty work and oversight, across the twentieth-century.
Along this trajectory, confidence interval logics morph from handwritten statistical information on
graphing paper, through punch-card ballistics analysis, to coded inputs in digital system processing.
The chapters of this dissertation: crisis, confidence, control, (un)certainty, and climate, are
defined by war and crisis. The story begins in the aftermath of WWI in the context of a growing
agricultural industrialism, expanding western capitalism, and drought management. In the lead-up to
WWII, the rising aerial bombing economy then severs computational logics from their agrarian
roots and assumes a vantage point from 10,000 feet, “bombsight optics.” In the aftermath of WWII,
the U.S. war in Korea and the subsequent proxy wars were vectors for the expansion of
(un)certainty work, originating in the firestorm bombing of North African beaches. Throughout the
Cold War period, weather control programs, built with confidence logics, generated a new aerial-

xviii
agricultural economy to be taken over by the management of automated decision-making
systems. Designing Certainty ends where the story begins, with farm management. But this is
now an agricultural economy that has incorporated the colonial and aerial perspectives emergent
from decades of war.
Designing Certainty features the archives and work of Polish logician and statistician Jerzy
Spława-Neyman, the confidence interval’s initial designer. I move away from a male figurehead
genealogy and history and do not cast Neyman as the primary agent or “father” of CI logics. Rather,
this is a history of the world he lived in, of the many actors, influences, and historical contingencies
that contributed to the rise of (un)certainty computing as a dominant epistemological and political
force. My research on CI logics spans over 20 archives and special collections and technical and
cultural materials over a century.

1
Chapter 0: Introduction
Mapping Uncertainty between Crisis and Confidence
Designing Certainty
This dissertation is a history of uncertainty and the rise of algorithmic computing. It is a
story about numbers and mathematical logic, small and big data, digital and analog computing
machines, and of the promises of rationality to make the modern world make sense. Above all,
however, it is a history of crisis and anxiety. I argue that algorithmic computing is a modern mode of
quantitative governance that grew out of efforts to manage war, colonialism, economic and
technological expansion, drought, and climate change. In Designing Certainty, I aim to confront
Figure 1: “Confidence Intervals,” Box 60, Egon Sharpe Pearson Papers, University College London Special Collections.

2
mathematical logic and computational design through their concrete manifestations and real-world
applications. Engaging the dreams and ambitions of those who designed the systems, I reflect on the
often-devastating impact that these systems have had on the human and environmental worlds.
My history of algorithmic computing is foremost a history of information and data. I define
algorithmic computing as a multinational and multidisciplinary reordering of the informational world, according to
axiomatic-mathematical designs and bounded by computing technologies. Between 1920 and 1970, an
information transformation occurred that reconfigured economic, scientific, and environmental
planning processes under a shared program to command uncertainty in data management.1 I argue
that the catalyst for this transformation was not the famed electronic memory-stored digital
computer. Rather, much earlier in the twentieth century, this information movement, catalyzed by
1 Designing Certainty contributes to a robust and growing scholarship in histories of data, information, and quantification. My work is inspired by the newer field of critical data studies defined as the systematic study of data and its criticisms, usually pertaining to Big Data, see: Kate Crawford, “The Anxieties of Big Data,” The New Inquiry (2014), http://thenewinquiry.com/essays/the-anxieties-of-big-data/; Andrew Iliadis and Fredrica Russo, “Critical Data Studies: An Introduction,” Big Data & Society (2016): 1-7. For histories that seek to define data, see: Rob Kitchin, The Data Revolution: Big Data, Open Data, Data Infrastructures & Their Consequences (Los Angeles: SAGE, 2014); Daniel Rosenberg, “Data Before the Fact,” in “Raw Data” Is an Oxymoron ed. Lisa Gitelman (Cambridge: MIT Press, 2013). On early modern histories of data, see: Daniel Rosenberg, “Early Modern Information Overload,” Journal of the History of Ideas 64, no. 1(2003): 1-9; Staffan Müller-Wille and Isabelle Charmantier, “Natural history and information overload: The case of Linneaus,” Studies in History and Philosophy of Biological and Biomedical Sciences 43, no. 1 (2012): 4-15.
For histories of data and surveillance, and mass data, see: Ruha Benjamin, Race After Technology: Abolitionist Tools for the New Jim Code (Cambridge and Medford: Polity Press, 2019); Caitlin Rosenthal, Accounting for Slavery: Masters and Management (Cambridge: Harvard University Press, 2018); Matthew Jones, “Querying the Archive: Data Mining from Apriori to Page Rank,” in L. Daston, ed. Archives of the Sciences (Chicago: Chicago University Press, 2016); Sarah E. Igo, The Averaged American: Surveys Citizens, and the Making of a Mass Public (Cambridge: Harvard University Press, 2008); Sarah E. Igo, The Known Citizen: A History of Privacy in Modern America (Cambridge: Harvard University Press, 2018); Dan Bouk, “The History and Political Economy of Personal Data over the Last Two Centuries in Three Acts,” Osiris 32, no. 1 (2017): 85-106.
For histories of life and death data, see: Ian Hacking, “Biopower and the Avalanche of Printed Numbers,” Culture and History (1983); Kim TallBear, “Beyond the Life/Not Life Binary: A Feminist-Indigenous Reading of Cryopreservation, Interspecies Thinking and the New Materialisms,” in Cryopolitics: Frozen Life in a Melting World, eds. Joanna Radin and Emma Kowal (Cambridge: MIT Press, 2017); Kim TallBear, “The Emergence, Politics, and Marketplace of Native American DNA,” in The Routledge Handbook of Science, Technology, and Society, eds. Daniel Lee Kleinman and Kelly Moore (London: Routledge, 2014): 21-37. Jacqueline Wernimont, Life and Death in Quantum Media (Cambridge: MIT Press, 2018); Rebecca M. Lemov, Database of Dreams: The Lost Quest to Catalog Humanity (New Haven: Yale University Press, 2015).

3
assertions of informational crisis, gave impetus to drive probabilistic reasoning over state, society,
and technology, mobilizing powerful data economies and computing infrastructures to sustain the
ascendant epistemology. This movement set out to wrangle a whole world of missing, incomplete,
and porous information, hold it still, and transfigure it into predictive frameworks.
These transformations in knowledge production did not occur solely in the realm of
abstraction but through computational labor, technological design, and political and economic
intervention. The movement constitutes one of the most metamorphic events of the twentieth
century, but it has been hidden in plain sight. Like its subject, histories of quantification are hard to
hold still, as the power of numbers resides precisely in the ways they are designed to disappear.2
The Object: Confidence Intervals
My site of study, or the vessel that has carried me through this vast terrain, is a statistical inference
tool—the confidence interval parameter (CI)—that was first computed in 1920s Warsaw, Poland
(chapter 2). In practice, CIs are known as interval estimates, created from observed data that can
predict an unobserved general population value of interest. They are typically visualized and taught
as bounded areas in a normal density curve; a 95% confidence interval is said to cover 95% of the
area under the curve. The unobserved population value is thereby estimated to fall in this range.
They are quantified measures of the limits of knowability within a designed statistical experiment.
2 For cornerstone literature on giving history to these slippery numerical methods, see: Theodore Porter, “Funny Numbers,” Culture Unbound (online journal), 4 (2012): 585-598; Martha Lampland, “False numbers as formalizing practices,” Social Studies of Science 40, no. 3 (2010): 377-404.

4
The confidence interval parameter was designed before the 1950s wave of algorithmic theory
and applied optimal-decision algorithms, and before the 1970s and 1980s wave of FORTRAN-
language algorithms in digital computing. CI logics travel through these later information shifts, and
morph into corresponding iterations along the way, but they first proliferated in the interwar
world—they are mathematical logics built into the DNA of digital computing.
The core mathematical problem confidence intervals are designed to solve is the problem of
estimating the parameters of an unknown population value in statistics from a sample. Since the turn
of the nineteenth century, it had become common practice to take statistical samples. It was
impossible in both government and scientific statistics to enumerate entire populations (e.g. an
entire country of people or a microscale universe of virulent particles. Statistical work depended on
statistical estimation. Confidence intervals are a way of bounding the estimation processes. For
example, in estimating the time of day, one person may say it is 3 o’ clock, which is a point estimate.
Another person may say that is somewhere between 3 and 4, which is an interval estimate. A
Figure 2: UCL, “Confidence Intervals,” https://tinyurl.com/y3utonfd (accessed May 20, 2015).

5
confidence interval is an interval that is ascribed a certain probability of being correct. The wider the
interval, the higher the probability that the interval contains the true value, for example:
To be 100% sure that the interval contains the true time we would have to make the interval twenty-four hours long. This interval is of no use so we reduce the level of confidence. To be fairly confident, but not 100% sure of containing the true value, we may go from 5 minutes before 3 to 5 minutes after 3. 3
This example taken from a 1970s classroom demonstration of a confidence interval, explains the
logic behind CIs. The more precise one is in their estimation (exactly 3:00 pm), the less likely they
are correct; the wider their estimation interval (between 3:00 a.m. and 3:00 pm), the more likely they
are correct. In using interval estimation, certainty is relinquished for accuracy, and vice versa.
Confidence intervals are chosen before the experiment is conducted—the experimental
designer determines their interval or what percentage of certainty they would like to hold in the
experiment, for example 90%, 95%, or 99%, before conducting the calculations. In this 1970s
classroom experiment, 12 students selected 9 random samples from a larger unknown population set
with the mean value, 𝜇. Their job was to estimate this value, 𝜇. First the students calculated the
sample mean and standard deviation for their individual sets and drew intervals of estimation that
the real value of the population set falls within their range of values, using this equation:
𝐿! =𝑋$ − 𝑡 ∙ 𝑠√9
and
𝐿) =𝑋$ + 𝑡 ∙ 𝑠√9
3 For this pedagogical example from a 1970s U.S. classroom, see: Wayne Andrepont and Peter Dickenson, “Classroom Demonstration of a Confidence Interval,” The Two-Year College Mathematics Journal 9, no. 1 (1978): 24-36.

6
The upper limit, 𝐿 ! is equal to sample mean, $𝑋 minus the t-value multiplied by the standard
deviation, 𝑠 .4 This is then divided by the root of the total number of samples, √9. This equation
draws lower and upper limits to their interval estimations, after inputting their preselected p-value:
95% while computing the t-value.
The predetermined 95% is at work at multiple scales of the experiment. First as each student
calculates t-values for their 9 samples, they input their preselected probability-value, 95%. Then, as
pictured below, all of the students plotted their intervals. The teacher explained, “To give the
students a visual demonstration of the meaning of a 95% confidence interval, the intervals calculated
by all of the students can be plotted. Approximately 95% of the intervals should cross the line, 𝜇.”
Figure 3: Interval Estimations
4 t-values are found in t-tables, a statistical tool that was designed in 1925, during the confidence computing movement, by a Scottish beer brewer and statistician named William Gosset or ‘student.’ They were designed to make estimations at small scales with small sets of data that circulated in the form of reference chart of values. Student’s equation and corresponding t-table values are estimations of sample means when the standard deviation is unknown. They operate in small and incomplete sets of data and are used to construct confidence intervals. They are, in many ways, micro estimation tools.

7
This diagram shows that out of all the interval estimations made for the mean value of the
population set, by all of the students, 95% of them will have made estimates that contain the true
value of this estimation. This aggregate plotting can also be visualized as a bell curve, as pictured in
the first image. The bell curve is the common representation for confidence intervals, even though it
doesn’t represent the many layers of calculation.
Over the course of the twentieth and twenty-first centuries we have disengaged with the
epistemic and political complexity of this enormously impactful statistical architecture. In this
classroom experiment, the method is taught as intuitive and procedural. However, uncertainty lurks.
Even within a single experiment, there are many different meanings and measures for uncertainty and
confidence. Even experimental control, or randomization, can occur in different ways and introduce
bias. For example, each student can sample from the population set and then return their sample to
the set before the next student samples, or they might keep their sample before the next student
conducts a sample, changing the mathematical parameters of the experiment.
More confusion lurks at the level of practice, calculation, and description. Philosopher of
science Ian Hacking has warned that inductive statements made about confidence intervals are
frequently confused. For example, compare the following two statements:
a. The probability that the quantity q lies in the interval I is 95%.
b. On the basis of our data, we estimate that an unknown quantity q lies in an interval I; this estimate is made according to a method that is right with probability at least 95%.5
The first statement claims that the statistical thinker is 95% confident the interval area contains their
real value of interest. The second statement claims that the statistical thinker has made a statistical
5 Ian Hacking, An Introduction to Probability and Inductive Logic (Cambridge: Cambridge University Press, 2001), 235.

8
estimate with some method such as regression analysis and is 95% confident that the estimate
generated by their method is correct.
My core historical intervention is to confront information governance in the interwar period
(1920-1940) through engaging real-world applications of CI logics. In so doing, I uncover the
historical processes that gave rise to our late twentieth-century algorithmic society. Through this
analysis, I have isolated three dimensions or expressions of CI logics, which I argue constitute three
of the most important computing concepts across the twentieth-century: Confidence (chapter 2),
Control (chapter 3), and Uncertainty (chapter 4) and in Climate (chapter 5), these computing
concepts converge into Cold War weather modification programs and digital machinery.6
In 1929, when numerical calculations for this data architecture were first computed,
confidence was both a mathematical and economic concept, which held technical and affective-
cultural meanings. What I call, confidence computing, emblematized by confidence interval logics, began
as an interwar information movement to command uncertainty and assert control over preexisting
and burgeoning domains of data production. At the level of data and analysis, confidence computing
is a practice of identifying and minimizing error in statistical work and translating it into probabilities
in order to garner public confidence in the information. By the end of the twentieth century,
confidence would rarify into a digital computing mechanism and concept—achieving status quo in
university mathematics and computer science education, and become embedded in software,
hardware, and big data analysis. The ubiquitous cultural trope— ‘with 95% certainty’—owes its
existence to CI logics; they are also known in practice as confidence measures, confidence levels,
6 An obviously important fourth twentieth-century computing concept is ‘efficiency’ that is bound into these concepts, as they were fueled by industrial capitalism. There is a wide body of literature on histories of efficiency and its offspring, ‘optimality’ that is addressed in subsequent chapters.

9
certainty parameters, and interval measures, and are part of a larger family of p-value tests, statistical
significance, statistical correlations, and so on.
Confidence logics are data architectures used to dictate processes of data collection, test the
validity of data, and provide visual-mathematical evidence of the outcomes. They are axiomatic
mathematical frameworks used to quantify mathematical confidence and build affective confidence in data
analysis. Affective confidence then contributes to the valuation of the system, as it gains social and
economic power. There is a shift in confidence-computing labor between the early and late
twentieth-century. In the early-twentieth century, a confidence computer was part statistician, part
philosopher and logician, and part farmer or industrialist. By the late-twentieth century, confidence
computing is largely delegated to confidence algorithms and digital computing software. In the
course of this transformation, human computational labor has not disappeared, but is gradually
veiled behind larger algorithmic systems. This shift from logician to logic algorithm is the backbone
of Designing Certainty. However, this history cannot be reduced to technological or mathematical
determinism: these designs of certainty came to power through much larger human forces.
The chapters of this dissertation are shaped by war and crisis rather that corresponds with
technological change. The first half of Designing Certainty contends with the aftermath of WWI in the
context of a growing agricultural industrialism, expanding western capitalism, and drought
management. In the lead-up to WWII, the rising aerial bombing economy then severs computational
logics from their agrarian roots and assumes a vantage point from 10,000 feet— “bombsight
optics.” In the aftermath of WWII, the U.S. war in Korea and the subsequent proxy wars were
vectors for the expansion of (un)certainty work originating in the firebombing of North African
beaches. In the Cold War period, weather control programs, built with confidence logics, generated
a new aerial-agricultural economy to be taken over by the management of automated decision-
making systems. Designing Certainty ends where the story begins—with farm management. But this is

10
now an agricultural economy that has incorporated the colonial and aerial perspectives born of
decades of war.
My archives have likewise been shaped by war and crisis. Many are material products of
military and state confidence computing programs that resulted in devastating human and
environmental destruction. My central human protagonist and initial confidence interval designer is
Polish logician Jerzy Spława-Neyman—his archives exist by happenstance. He moved a number of
times throughout the twentieth-century: first, after spending a year in a soviet prison during WWI as
his home country disappeared, then after his new home of Warsaw was occupied by the Nazis. The
Gestapo murdered most of the logicians and statisticians in the initial confidence computing
collective and burned their libraries. Some of the statistics materials that moved with Neyman to his
subsequent position at the University College London were destroyed in the London Blitz. I found
surviving copies of Warsaw’s journal Statistica (1929-1939), but many of the sources pertaining to
confidence interval logics were generated retrospectively in the 1970s and 1980s, an overdetermined
resource that made it difficult to read the story forward, a source of my anxiety.
The Age of Anxiety
I define anxiety as a captivation with/by the past that manifests as a conditioned worry about the future.7 Anxiety,
like confidence computing, flourished in the aftermath of WWI. It was widely understood to be an
outcome of military trauma.8 Medical and public health professionals worked to make sense of the
mental anguish that had followed soldiers home. This overwhelming state of worry and anxiety
7 I am thinking about captivation in two ways: to hold the attention or interest of, as by beauty or excellence; to capture and subjugate. 8 “In Moments of Anxiety,” The Biblical World 51, no. 4 (1918): 193-194.

11
experienced by soldiers, only produced more worry and anxiety about how to live normally under
such a condition. In the legal and medical domains, material manifestations of anxiety were sought
after, such as the loss of work wage labor, in order to establish social legitimacy for the otherwise
elusive ailment.9
Anxiety first emerged as a symptom of shell shock and a manifestation of hysteria in
psychoanalysis.10 After WWI, anxiety evolved into its own medical condition with its own sciences
and typologies of interpretation. Psychologists defined “anxiety neurosis” as a condition of always
waiting for the future, a chronic anticipation. And this was largely studied in homecoming soldiers:
…the man in the navy was not subjected so frequently as his comrade in the army to the actual strain of battle, and consequently did not experience the vivid emotional disturbances accompanying imminent unavoidable danger. The sailor had to bear the stress of chronic anticipation […] and developed the anxiety neurosis rather than the hysterical dissociation. 11
In this rendering, anxiety describes the experience by which the Navy solider is spared the horrors of
the battlefield, only to become subject to their anticipation.
After 1926, practical field studies of anxiety corresponding to military shock collided with
Sigmund Freud’s new theoretical framework of the ego, producing anxiety-neurosis.12 In Freud’s
framing, anxiety was one of the ways in which the ego relieves itself of repressed wishes which have
become too strong. Freud’s theories of neurotic anxiety proliferated as psychologists sought to
define the personality of the anxious individual, with behavioral descriptions such as, “an anxious
9 M.H.V.G., “Mental Suffering: Evidence of Plantiff’s Poverty,” California Law Review 7, no. 4 (1919). 10 For example, George M. Parker, “The New Meaning of Symptoms in Hysteria,” The Cleveland Medical Journal XI, no. 4 (1912): 248-49; Sigmund Freud, “The Origin and Development of Psychoanalysis,” The American Journal of Psychology xxxi, no. 2 (1910); R.T. Williamson, “Remarks on the Treatment of Neurasthenia and Psychasthenia Following Shell Shock,” The British Medical Journal 2, no. 2970 (1917): 713. 11 “The Psycho-Neuroses,” The British Medical Journal 1, no. 3090 (1920): 408. 12 Sigmund Freud, “The Justification for Detaching from Neurasthenia a Particular Syndrome: The Anxiety-Neurosis,” in Collected Papers, Vol. 1 (London: Hogarth Press, 1953); Robert R. Morris, “Anxiety: Freud and Theology,” Journal of Religion and Health 12, no. 2 (1973).

12
person needs to control their environment.” Anxiety was studied in terms of an individual’s fears—
the objects of anxiety. For Freud, the greatest fear was the fear of castration, but all fears belonged
to the future. The chronic anticipation of an uncertain future is referenced throughout the
twentieth-century as a void, an abyss, a chasm. In 1944, W.H. Auden, began his book-length poem
The Age of Anxiety with reference to this void, and the failure of historical processes to make sense of
it: “When the historical process breaks down and armies organize with their embossed debates the
ensuing void which they can never consecrate […].”13
“The Age of Anxiety” is a historical epoch, characterized in reference to Auden’s Baroque
Eclogue, a poem responsive to the atrocities of WWII. Historians have used Auden’s poem as the
core analytic description of the period. Some have used the phrase to express the chronic
anticipation of nuclear holocaust that shaped Cold War politics.14 There are also a number of studies
that play with the idea of an age of anxiety in the twentieth-century, by linking to histories of
tranquilizing drugs in this same epoch, conflating anxiety as a mental anguish produced by war, with
anxiety as a pharmaceutical product.15 I demarcate ‘the age of anxiety’ beginning after WWI, in order
to draw explicit attention to the irrational, emotional, and affective forces driving numerical
governance under the guise of bounded rationality, and to situate confidence computing within
contexts of war, colonialism, technological expansionism, and climate change.
13 W.H. Auden: “The Age of Anxiety: A Baroque Eclogue,” in W.H. Auden Collected Poems, ed. Edward Mendelson (New York: Vintage International, 1991: 447. Thank you to Janine Utell and J.P. Spiro for discussing anxiety and the interwar literary world with me and for giving me this book. 14 Jessica Wang, American Science in an Age of Anxiety: Scientists, Anticommunism, and the Cold War (Chapel Hill/London: University of North Carolina Press, 1999): K.A. Cuordileone, “Politics in an Age of Anxiety”: Cold War Political Culture and the Crisis in American Masculinity, 1949-1960,” The Journal of American History 87, no. 2 (2000): 515-545. 15 Andrea Tone, The Age of Anxiety: A History of America’s Turbulent Affair with Tranquilizers (New York: Basic Books, 2009); Mickey C. Smith, A Social History of the Minor Tranquilizers: The Quest for Small Comfort in the Age of Anxiety (New York/London: Pharmaceutical Products Press, 1991).

13
Beyond Auden, there was a much wider constellation of twentieth-century public
intellectuals, psychoanalysts, and authors who read the twentieth-century through frameworks of
anxiety.16 These works reveal the age of anxiety to be a symptom of eurocentrism. Immediately after
WWI, French scholar Paul Valéry wrote The Crisis of the Mind that was foremost a manifesto on
European superiority and secondly an explanation of the “crisis of the mind” in art, literature, and
philosophy that would inevitably follow the economic and military crises of WWI. His response
makes explicit the ways in which the age of anxiety is really a crisis of the old guard. Anxiety was
caused by the revelation of doubt in the superiority of European civilization, as captured in his
statement, “everything has not been lost, but everything has sensed that it might perish.” Valéry’s
anxiety denotes a consciousness that Europe has lost its sense of superiority after the bloodbath of
WWI. Drawing attention to the complicity of European liberalism in producing wartime atrocities,
Hannah Arendt notes that Valéry had donated money to the Third Reich’s early presence in Paris.
For Arendt, the incomprehensible void of understanding following WWII is not really a void but
can be explained in terms of two power structures: race and bureaucracy.17
Throughout the 1960s, the period when this dissertation ends, French psychoanalyst Jacques
Lacan held his infamous anxiety seminars, that he titled l’angoisse (anguish) rather than anxiété.18
Lacan’s 1960s corpus on anxiety is itself a semi-psychotic display of inconsistencies, experimental
semiotics, and obscure diagrams, but his main contribution was to break from fear as the object of
16 Alan Watts, The Wisdom of Insecurity: A Message for an Age of Anxiety (New York: Pantheon Books, 1951). 17 See: Susannah Young-ah Gottlieb, Regions of Sorrow: Anxiety and Messianism in Hannah Arendt and W.H. Auden. Gottlieb links Auden to Arendt as literary figures that believe speech could be the redemption after world war II—it is the uncertainty of this hope that produces anxiety. 18 Robert Harari, Lacan’s Seminar on Anxiety: An Introduction, trans. Jane. C. Ruiz (New York: The Other Press, 2001); Jacques Lacan, Séminaire X: L’angoisse (Paris: Seuil, 2004); Erica Harris, “Sidestepping the Problem of the Unconscious: Why We Ought to Reframe the Lacan/Merleau-Ponty Debate in Bodily Terms,” The Journal of Speculative Philosophy, 30, no. 3 (2016): 267-277.

14
anxiety.19 For Lacan, anxiety has no object, only the absence and possibility of the object. He situates
anxiety as a median between desire and jouissance — “Desire is always linked to dissatisfaction (to the
lack of the object), while jouissance brings the subject close to the object, often in most painful ways.”
Anxiety, therefore is bounded between the object of desire and the painful pleasure of its unending
pursuit: it is at 95%. Anxiety is insatiable, and it is driven by guilt.
Freud, Lacan, and postcolonial psychoanalyst Frantz Fanon link anxiety to guilt. For Fanon
anxiety is a condition caused under the dominance of colonial rule. Anxiety manifests in the
personality of the colonial subject as well as in the colonizer, as a direct outcome of guilt. For the
subject, this is an embodied condition whereas the settler’s anxiety is in losing control of the future,
as with the crisis of eurocentrism described by Valéry. Fanon describes the embodied condition of
anxiety in the context of colonial domination:
As soon as the native begins to pull on his moorings, and to cause anxiety to the settler, he is handed over to well-meaning souls who in cultural congresses point out to him the specificity and wealth of Western values. But every time Western values are mentioned they produce in the native a sort of stiffening or muscular lockjaw.20
Defining anxiety as a captivation by the past that produces a conditioned worry about the future,
speaks to the traumas of twentieth-century war and colonialism. It also speaks to the anxiety and
indeterminacy of mathematical modeling, which is itself an undertaking to command what has been
in order to project what will be. Tying these two threads together: early twentieth-century computing
methods were designed to interpret historical data to establish frameworks for making decisions.
19 See: The Seminar of Jacques Lacan: The Four Fundamental Concepts of Psychoanalysis (Vol. Book XI) trans., Alan Sheridan (New York: W.W. Norton & Company, 1998) originally published in 1973; and J. Peter Burgess’s analysis in Politics of Anxiety, eds. Emmy Eklundh, Andreja Zevnik, and Emmanuel-Pierre Guittet (London: Rowman & Littlefield, 2017). 20 Frantz Fanon, The Wretched of the Earth, trans. Constance Farrington (New York: Grove Weidenfeld, 1963): 42.

15
They constitute a mathematical manipulation of historical and future time, that is rooted in
regression techniques, a colonial mathematics.
In mathematical prognostication, the promise of certainty is always on the horizon of
possibility, but never achieved. Situating my history of computing within the age of anxiety reveals
the larger cultural and market forces at work and makes the point that computing models are rooted
in military production and military trauma. Furthermore, I show how new modes of information
processing came to power through harnessing public anxieties in their applications. While
uncertainty is a technical numerical concept, certainty is always a political project. It is the process by
which uncertainty calculations are translated into evidence and concretized into decisions. Designing
Certainty further details the slippages between the technical and political in (un)certainty work.
The story begins in the post WWI moment when confidence computing arose as the
technocratic elite worked to establish a statistical control state over a crumpling European empire,
the primary source of their anxiety. This movement began after the designation of a “confidence
crisis” as informational crisis drove rehabilitation efforts in the wreckage of the postwar world.
Crisis!
Throughout this dissertation I will speak to designs of crisis, which are the identifications and
explanations of informational crisis, which overlay real conditions of instability, collapse, and
destruction. These are not designs in the sense that the underlying calamity is not real. They are
designs because they are technocratic, and predominantly mathematical, explanations of the
underlying crisis. It is the designer who decides what is and is not a crisis; by identifying the design,
we identify the designer. Designs of crisis are very powerful mechanisms in the production of
history; we use them to define periods of time and to explain events. It has largely been through
adopting the designer’s explanations of crisis that we have interpreted the past.

16
There is a huge body of scholarship on the history of crisis, on crisis as an analytic category,
and crisis theory.21 In its Greek etymology, crisis means to separate, decide, choose, judge. In human
experience, crisis denotes a sudden rupture in everyday life, a calamity that generates confusion
defying language and logical description. The inexplicable experience of human crisis coexists with
its political over-description at the scale of populations and society. I adhere to the common notion
that crisis is a function of western capitalism and a designation of technocratic society. Political
economists have been using crisis to reaffirm market society, through rationalizing economic ebbs
and flows, bubbles and bursts, depressions and growth. As expressed in political-economic
frameworks, crisis is a period of market instability or failure, explained within larger rational
frameworks. In contrast, Marxist crisis theory characterizes crisis as an entirely irrational process,
reflecting the inherent instability of western capitalism, which is designed to yield cycles of its own
disarray.22 Under capitalism, crisis is an extremely productive designation. Relating this to the
information sciences, I make use of anthropologist Janet Roitman’s notion that, “crisis is a
distinction that produces information and reaffirms extant hierarchies.”23
Information bodies and infrastructures follow from crisis and, in turn, anticipate future
crises, which they were designed to manage. For the designer of crisis, crisis is profitable. The late
twentieth-century has been described as “an age of crisis” after the United States destroyed the cities
21 In histories of finance, see: Charles P. Kindleberger and Robert Aliber, Manias Panics, and Crashes: A History of Financial Crises (New Jersey: John Wiley & Sons, Inc., 2005), previous editions in 1978, 1989, 1996, 2000, following financial crises. On page 21, they write: “For historians each event is unique. In contrast economists maintain that there are patterns in the data and particular events are likely to induce similar responses.” The 1907 confidence crisis and panic were a huge driver of crisis analysis, setting a precedent for the twentieth-century, see: O.M.W. Spargue, History of Crises under the National Banking System (1910; reprint edition, New York: Augustus M. Kelly, 1968). 22 Seize the Crisis! https://monthlyreview.org/2009/12/01/seize-the-crisis/ 23 Janet Roitman, Anti-Crisis (Durham: Duke University Press, 2014): 53. She writes on page 7: “Crisis serves as the noun-formation of contemporary historical narrative; it is a non-locus from which to claim access to both history and the knowledge of history.”
17
of Hiroshima and Nagasaki in August 1945.24 Following from this precedent, Cold War anxieties are
described as a series of political crises pertaining to the potential of mass destruction. The 1948
Berlin crisis constituted a grasp for occupation and power between western and USSR oversight and
monetary control within the parameters of the city, and this would manifest in the late 1950s with
the second Berlin crisis, culminating in the building of the wall in 1961. Other Cold War crises
constitute failed grasps for colonial power under decolonization. This is seen with the U.S. entry in
Korea, the Suez Crisis of 1956, the Cuban missile crisis, the Euromissiles crisis and so on.
Michelle Murphy defines this period of the Cold War and decolonization as the economization
of life— “a historically specific regime of valuation hinged to the macrological figure of national
“economy.”25 Heightened by the Chernobyl nuclear accident in 1986, economic crisis became
formally linked to ecological crisis through quantitative studies of risk that flourished in the 1970s
and 1980s.26 Risk management, risk assessment, and risk metrics became the science of crisis at the
nexus of climate change, ecological crisis, and the threat of financial collapse. Crisis managers
became risk calculators. As with anxiety, crisis is an outcome of a European colonialism. During the
recent crisis of the European Union and nation-state democracy, Ulrich Beck and Ciaran Cronin
wrote that the European crisis can only be truly understood by “deprovincializing” ourselves—
“that is, only by learning to see the world and ourselves with the eyes of others at the level of
methodology.”27
24 See: Joseph Masco, “The Crisis in Crisis,” Current Anthropology 58, no. 15 (2017): S65-S76. 25 Michelle Murphy, The Economization of Life (Durham and London: Duke University Press, 2017): 006. 26 The literature on risk society is huge, for some cornerstone texts see: Ulrich Beck, Risk Society: Towards a New Modernity (London: Sage Publications, 1992); Ulrich Beck World at Risk (London: Polity, 2008); Francis Ewald, “Two Infinities of Risk,” in The Politics of Everyday Fear ed. Brian Massumi (Minneapolis: University of Minnesota Press, 1991): 221-28; Paul Slovic, The Perception of Risk (New York: Routledge, 2000); Richard A. Posner, Catastrophe: Risk and Response (Oxford: Oxford University Press, 2005); Gina Neff, Venture Labor: Work and the Burden of Risk in Innovative Industries (Cambridge: MIT Press, 2012). 27 Ulrich Beck and Ciaran Cronin, “The European Crisis in the Context of Cosmopolitization,” New Literary History 43, no. 4 (2012): 641.

18
A growing literature in STS has sought to map out crisis through its human actors. In the
early 2000s, economic sociology extricated the study of economics from society to show how
finance economics functions as a reference to itself.28 The idea is that, “Economics does not
describe an existing external “economy,” but brings that economy into being: economics performs the
economy, creating the phenomena it describes.”29 In this framework, the system is self-contained—
or bounded—except in times of “extreme crisis,” as with the 1987 market crash, when options
theory was proven to not work under extreme volatility. Crisis is explained within or in relation to
market performativity—it is a failure of the market to do what it says it’s going to do. Sociologist of
economics Donald Mackenzie determined that ‘crisis’ can be explained through the study of human
actions. He relegated the 2008 credit crisis, for example, to be an outcome of, “market processes in
abstraction from the cognitive and organizational reality of evaluation practices.”30 Michel Callon
and Mackenzie assert counter-performativity as an explanation of crisis—for when the formula
driving the economy produces effects that undermine its own performance.
STS scholar Jens Schroter argues that Callon’s performativity theory lacks a true notion of
“crisis’ and therefore precludes alternative modes of explanation and organization.31 At its root,
counter-performativity should be read as a falsification of the formula driving the system rather than
as an explanation of the system. As seen with financial performativity theory, crisis plays a role in the
28 Michael Callon, “Introduction: the embeddedness of economic markets in economics,” The Sociological Review 46, no. 1 (1998); on page 30, Callon writes, the economy “is embedded not in society but in economics.” 29 Donald MacKenzie and Yuval Millo, “Constructing a Market, Performing Theory: The Historical Sociology of a Financial Derivatives Exchange,” American Journal of Sociology, 109, no. 1(2003): 108; Fabian Muniesa, The Provoked Economy: Economic Reality and the Performative Turn (London: Routledge, 2014). 30 See: Julia Elyachar, “Regulating Crisis: A Retrospective Ethnography of the 1982 Latin American Debt Crisis at the New York Federal Reserve Bank,” Valuation Studies 31 Jens Schröter, “Performing the economy, digital media and crisis. A critique of Michel Callon,” in eds. Martina Leeker, Imanuel Shipper, Timon Bayes, Performing the Digital: Performance Studies and Performances in Digital Cultures (Transcript Verlag, 2017).

19
determination of whether or not theories, models, and explanations of economic and social
phenomena work. It is used to confirm or falsify larger theories of explanation. Economist Milton
Friedman’s theory of economics hinges on the value of predictive accuracy—he argues that only
theories predicting crisis are correct.32 Crisis is intrinsic to neoliberal frameworks of economics, as it
is the metric by which this politics is rationalized. For Thomas Kuhn, crisis is the catalyst for theory
change and constitutes the structure of scientific revolutions— “the failure of rules that precludes
the search for new ones.”33 Crisis sustains the epistemological frameworks of our scientific society.
Recent literature in economic anthropology has moved beyond crisis frameworks. These
works reveal alternative modes of market-making and the hidden economies that shape our world.
Dominant frameworks of market capitalism, such as the notion of an ‘invisible hand’ and homo
economicus are relegated to the status of folk stories, and alternative ethnographic and semiotic
frameworks are deployed to describe economic processes.34 Their work has helped undo the reliance
on the designer’s explanation of crisis, as they have unearthed the many different experiences of
economy in subaltern contexts, revealing the stratification of human experience under crisis. They
show how commodities, value, and dollarization are deeply embedded in social and politic contexts
revealing otherwise hidden political and social conditions.35
Crisis is an intrinsic part of the rise of statistical inference, algorithmic computing, and
artificial intelligence in the twentieth-century. These modes of governance are outcomes of
32 See: Milton Friedman, Essays in Positive Economics (Chicago: Chicago University Press, 1966). 33 Thomas S. Kuhn, The Structure of the Scientific Revolutions (Chicago: Chicago University Press, 2012, originally published 1962). 34 Cathy Gere’s work current work, looking beyond neoliberalism, has opened my eyes to how the psychological attachment to the Cold War economic relics such as homo economicus limits possibilities for alternative frameworks. 35 Heonik Kwon, “The Dollarization of Vietnamese Ghost Money,” The Journal of the Royal Anthropological Institute 13, no. 1 (2007): 73-90; Julia Elyachar, Markets of Dispossession: NGOs, Economic Development and the State in Cairo (Durham and London: Duke University Press, 2005); Martha Lampland, The Value of Labor: The Science of Commodification in Hungary, 1920-1956 (Chicago: The University of Chicago Press, 2016).

20
reconfiguring information and information systems in response to crisis. Throughout Designing
Certainty, crisis is a reoccurring and prominent actors’ category. It is a term used by statisticians,
political economists, market makers, technologists, computing programmers, and so forth. Crisis is
used to explain transformations and failures in their systems, and at the root—crisis does work in
bringing number to power. New techniques and methods of analysis are designed in response to
crisis.
I engage three main types of crisis: economic, epistemic, and environmental. I will flesh out
designations of crisis in agriculture, in logic and mathematics, and in drought and climate control,
showing how they served as catalysts for generating information (and misinformation), and as
pretexts for new methods of making sense of that information. All of my cases are rooted in the
initial confidence crisis, a designed crisis of quantification that was asserted over these three
domains. Various economic, epistemic, and environmental crises were thereby linked together as a
problem of data and method, setting the stage for new anxiety-driven methods of analysis and
computation to arrive as the reigning solution. Crisis is prologue for the twentieth-century project of
designing certainty.
The Landscape: Argument and Method
At the nexus of crisis and confidence computing, Designing Certainty offers a genealogy of
shifting regimes of ‘(un)certainty work’ over the course of the twentieth-century.36 I present
36 My term “(un)certainty work” is informed by a wide body of scholarship in history, STS, critical algorithm and data studies, as well as from its technical usages in analog and digital data processing. I present uncertainty as an interdisciplinary meeting point, see: Theodora Dryer, “Algorithms under the Reign of Probability,” IEEE Annals of the History of Computing 40, no. 1 (2018): 93. For cornerstone work on histories of uncertainty as probability, see: The Empire of Chance: How Probability Changed Science and Everyday Life by Gerd Gigerenzer et al. (Cambridge: Cambridge University Press, 1989); Lorraine Daston, Classical Probability in the

21
(un)certainty work as an analytic category that links computational labor with epistemological
frameworks.37 (Un)certainty work constitutes the process of translating data into “probability data”
or information that is expressed in terms of probabilities, e.g. 95%. As a base definition, probability
describes likelihoods of propositions and events, usually expressed as a percentage, where perfect
certainty is 1 and uncertainty is <1. Beyond this, probabilistic knowing is a commitment to greater
analytic (laws, axioms, and definitions) and technological (computers and data systems) architectures
needed to express limited information in terms of likelihoods.38 This process involves everything
from collecting and organizing the data, designing mathematical architectures for analysis and
computation, and the subsequent uses of the data as uncertainty calculations become evidence or
material for decision-making processes.39 (Un)certainty work spans across different temporal
Enlightenment (Princeton: Princeton University Press, 1988); Lorraine Daston, Lorezn Krüger, and Michael Heidelberger, The Probabilistic Revolution (Cambridge: MIT Press, 1987); Lorraine Daston, “The Doctrine of Chances without Chance: Determinism, Mathematical Probability, and Quantification in the Seventeenth Century,” in: Mary Jo Nye, Joan Richards, and Roger Stuewer, eds., The Invention of Physical Science. Essay in Honor of Erwin Hiebert (Boston/The Netherlands: Kluwer Academic Publishers, 1992); Matthew Jones, Reckoning with Matter: Calculating Machines, Improvement, and Thinking about Thinking from Pascal to Babbage (Chicago: Chicago University Press, 2016). For literature on uncertainty in critical algorithm and data studies, see: Mei-Po Kwan, “Algorithmic Geographies: Big Data, Algorithmic Uncertainty, and the Production of Geographic Knowledge,” Annals of the American Association of Geographers 106, no. 2 (2016): 274-282. There is an anonymous collective of scholars from different disciplines, institutions and countries called “An uncertain commons,” see: Uncertain Commons, Speculate This! (Durham and London: Duke University Press, 2013): thank you to Lilly Irani for sending this to me. 37 My general thinking about the analytic and physical labor behind computing, data processing, and quantitative formalization is deeply informed and inspired by: Lilly Irani, “Difference and Dependence among Digital Workers: The Case of Mechanical Turk,” The South Atlantic Quarterly 114, no. 1 (2015): 225-234; Martha Lampland, “False numbers as formalizing practices,” Social Studies of Science 40, no. 3 (2010): 377-404; Mary S. Morgan, The World in the Model: How Economists Work and Think (Cambridge: Cambridge University Press, 2012); Theodore Porter, Trust in Numbers: The Pursuit of Objectivity in Science and Public Life (Princeton: Princeton University Press, 1996); Stephanie Dick, “Aftermath: the Work of Proof in the Age of Human-Machine Collaboration” in Isis 102.3 (September 2011): 494-505. 38 Dryer, “Algorithms under the Reign of Probability,” 93. 39 For work in STS and philosophy on the intrinsically political process of translating uncertainty into certainty, see: Susan Star, “Scientific Work and Uncertainty,” Social Studies of Science 15, no. 3 (1985): 391-427; Geoffrey Supran and Naomi Oreskes, “Assessing ExxonMobil’s Climate Change Communications (1977-2014),” Environmental Research Letters 12 (2017): 1-17; W.R. Freudenburg, R. Gramling, and D.J. Davidson, “Scientific Certainty Argumentation Methods (SCAMs): Science and the Politics of Doubt,” Sociological Inquiry 78, no. 1 (2008): 2-38; Wendy Parker, “Whose Probabilities? Predicting Climate Change with Ensembles of Models,” Philosophy of Science 77 (2010): 985-997.

22
geographical contexts and different scales of doing and knowing, permeating data generated at the
scale of a microorganic universe in a petri dish to data collected from a B-52 bomber flying 10,000
feet in the air.
Each one of the subsequent chapters constitutes a specific case study of confidence intervals
at work: small-farm analysis in interwar Poland (confidence), sugar beet analysis in the New Deal
United States (control), bombing campaigns during WWII (uncertainty), and cloud-seeding
programs in the larger context of the cold war proxy wars (climate). There are two significant
dimensions to these programs. First, they are economic in nature—they are used to stabilize larger
programs such as western pricing logics, agricultural development, military expansionism, and
technological design as with the electronic memory-stored digital computer.40 Second, the
40 The interfaces between confidence intervals and digital technology are addressed at length in Chapter 4, on military methods and in Chapter 6, on digital methods.
Figure 4: Jerzy Neyman and Herbert Osborn, “Evidence of widespread effect of cloud seeding at two Arizona experiments,” Proceedings of the National Academy of Sciences 68 (1971): 649.

23
(un)certainty work conducted towards these larger programs is generative of and responsive to
bodies of data that have contextually specific epistemic and political complexities. I focus on the
contexts in which the data is produced, beyond the statistical laboratories and computing centers
where it is ultimately processed, thereby decentering institutional centers of calculation. Instead, I
map out larger computing landscapes.
What I refer to a “computing landscapes” are the physical-geographical areas from which
data is generated and collected. These landscapes include farm areas, military proving grounds,
colonial land, and target areas in weather control experimentation. Processes of (un)certainty work
produce visual-metathetical maps that are overlaid on the landscapes. In the semi-arid southwestern
landscape, for example, data is generated from rain gauge measurements. These nodes of calculation
are depicted as coordinates drawn from an aerial perspective and used as coordinates in
mathematical analysis of the entire region. Computing landscapes constitute an abstracted
mathematical remapping of ground areas that is rooted in the physical alteration of those areas. In
the case of firestorm bombing during WWII, I define ‘destruction data’ as generated by the mass
destruction of the human and environment worlds. In all of my cases, (un)certainty work transforms
the human and environmental worlds, first through processes of data collection, and then through
continued intervention as dictated by the analysis and decision-making.
My genealogy of (un)certainty work follows a trajectory from the early twentieth-century
mathematical statistics movement through to the beginnings of our Big Data society. Over the
course of this period, and through my confidence interval applications, I touch on many different
mathematical and computing disciplines. These include logical positivism, mathematical statistics, set
theory, axiomatic probability theory, stochastic calculus, linear programming, operations research,
decision-science, and algorithmic theory. Designing Certainty does not offer a formal history of these
disciplines nor corresponding institutional histories. My analysis of (un)certainty work, and its

24
applications, serves to demonstrate larger shifts in numerical governance across different geopolitical
contexts, or computing landscapes, that span across these disciplines.
Chapter 1, ‘Crisis,’ the prologue chapter to this dissertation, sets the stage for subsequent
waves of crisis designation and computing design that begins after WWI. Crisis is a designation that
produces new information and reaffirms extant hierarchies of information and their corresponding
power structures. The initial ‘crisis of confidence’ occurred in two waves. The first wave occurred at
the turn of the twentieth-century when statistical thinkers increasingly interpreted poor economic
conditions in visual and quantitative terms of flagging public confidence. This set precedent for
designing increasingly technical quantitative explanations for ‘confidence.’ After WWI, a ‘crisis of
confidence’ ballooned in statistical information and corresponding statistical establishments
including global trade systems, paper currency, census administration. I engage this designated
computational crisis along three axes: economic, environmental, and epistemic and introduce
agricultural experimentation and the agricultural experimental station as the primary facilitator of a
new mechanized data management regime responsive to the confidence crisis. Throughout this
dissertation I contextualize four agricultural stations in Warsaw, Poland, London, England, Kolkata,
India, and Beltsville, Maryland.
Chapter 2, ‘Confidence,’ is the first computing concept explored in this dissertation and is
followed by two more: control and uncertainty. The computing concept ‘confidence’ is an
expression of trust that a logician or statistical thinker holds in their experimental design and
analysis. It is also an expression of trust that the public holds in numerical-economic informational
systems and technologies. In the 1920s, statistical thinkers designed new data architectures to
quantify and mechanize confidence logics in data management. This chapter details the first
numerical calculations for the confidence interval parameter in 1929 Warsaw, Poland. After WWI,
Poland became a sovereign nation state for the first time in 150 years and the dreams of a great

25
agrarian nation state were complicated by the realities of extreme poverty, ongoing border disputes
and turmoil, Jewish emigration and forced removal policy, inhumane labor conditions, the
circulation of foreign capital, and efforts to stabilize paper currency. In order to establish public
‘confidence’ in growing western pricing logics, paper currency, and quantitative oversight more
generally, fledgling agricultural administrative bodies turned their attention to “improving statistics.”
This turn towards emboldening quantitative oversight in agriculture fueled the global
circulation of new mechanized logics and data. In Poland, the newly formed Bureau of Agricultural
Economics employed a fringe-computing laboratory at the Nencki Institute for Experimental
Biology, a biometrics center, to compute tables for a “small farm problem,” deemed to be the
central issue in managing Polish agriculture. There the first numerical calculations for the ufności
przedzial or confidence interval parameter were conducted. They were handwritten on graphed
paper and calculated using an Odhner arithmometer machine. These calculations served as
numerical limits for ‘uncertainty’ within a statistical experiment and were quantitative expressions of
‘confusion’ that the statistical thinker—here Wacław Pytkowski—held in his method of
interpretation.
In 1929, agricultural workers in Warsaw reconfigured the economic and statistical concept of
‘confidence’ into a method of analysis that established limits for uncertainty in experimental design.
In this context ‘confidence’ became a mechanized computing concept; what I call ‘confidence
computing’ is a bounded philosophy of data production and analysis that galvanized agricultural
management as (un)certainty work. In this historical and geographical context, (un)certainty work
served the conflicting political aspirations of preserving peasant farming as the underpinning notion
of Polish sovereignty, while also aspiring to make the Polish economy legible on the world stage as
part of a growing western pricing geopolitics. In the period between 1929 and 1939, a confidence
computing collective emerged around Warsaw and nearby Lwów that integrating new methods of

26
interpretation, inspired by rising trends in axiomatic probability theory, with tacit agricultural work.
Applications included: Polish labor health analysis, virulent studies, sugar beet planning, and beyond.
Chapter 3, ‘Control’: Control is a computing concept that informs experimental design
through the procedures of conducting ‘control tests’ and establishing the terms of randomized
testing. Control is also a political-economic term indicating the acquisition and consolidation of data
and resources and the assertion of hierarchies of decision-making power. In the early twentieth-
century, statistical thinkers established new mechanized meanings and technologies for control
logics under probability. My case study for ‘control’ occurs in the 1933-1937 New Deal United
States, when statistical quality control logics converged with new farming programs under a rising
agricultural-industrialism. Like confidence, ‘quality control’ frameworks and ‘statistical control’ logics
were first mechanized in the 1930s. Prior to that, in the 1920s, quality control logics first emerged as
part of a new industrial manufacturing regime at Bell Laboratories that sought to control
manufacturing processes through new managerial oversight. In the New Deal moment, Quality
Control became Statistical Quality Control, or the transfiguration of manufacturing errors into
probabilistic data. This (un)certainty work part of control logics moved into agriculture and planted
seeds of computational control over agricultural resources, as part of the new U.S. control state.
Chapter 4, ‘(Un)certainty,’ begins at the end of WWII, when machine brains and the impulse
of “yes or no” processes of decision-making certainty began to dominate technocratic imagination.
Bounded rationality would soon come to flatten the complexities of the logical empiricist movement
in practice, computation, and discourse. I trace the shift from uncertainty computation to certainty
calculations back to U.S. and Allied firestorm bombing campaigns during the war. Data managers
created destruction data sites in North Africa, Japan, and U.S. National Parkland and translated
statistical destruction into ‘probability tables’ and other knowledge making apparatus for binary
decision making in military strategy. ‘Time’ measurements and ‘space’ measurements were cleaved

27
apart as calculating machines—including intervalometers, clocks, slide rulers, nomograms, and
bombsight calculators—were used to stabilize this data collection and organization process. I define
bombsight optics as the visualization of bombing waste and destruction as predictable, controllable,
and calculable sites of statistical study. This culture of visual-mathematical study led in 1945 to the
patent for the Optical Method calculating machine, the precursor to today’s drone technology.
In Chapter 5, ‘Climate,’ I confront the blurry boundaries of mathematical ‘experiment
making’ in the context of 1950s and 60s cloud seed experimentation over indigenous land in the
southwest. These experiments stitched together mathematical computing analysis and physical and
environmental alterations. I take apart conclusive mathematical experiments designed in the late
1960s and early 1970s to uncover their technological, philosophical, and environmental
underpinnings and impacts. Weather control is a critical site for understanding the interfaces
between and the environment and questions of human and environmental justice.
In Chapter 6, ‘Conclusion,’ I map out iterations of confidence intervals through two digital
computing movements: algorithmic programming languages and automata studies that contributed
to a new wave of (un)certainty work. Confidence logics were reconfigured as a new mode of
reasoning, pertaining to digital philosophies and coding practices. This is exhibited in the re-
evaluation of cloud-seeding, which incorporated digital machinery and centered algorithms in the
assessments. Significantly, confidence logics were not replaced by the new modes of computing and
machine development, but rather, they were built into the material and logical designs of digital
models, machines, and methods. I argue that CI logics are part of the material fabric of artificial
intelligence, they are a tuning apparatus in assessing the power and validity of other optimal
algorithms such as linear programming (the simplex algorithm) and Monte Carlo methods, and they
are algorithmic in their own right as they were reprogrammed and circulated as certified algorithms.
Digital computing is then a new iteration of (un)certainty work that has black-boxed the

28
philosophies of logic at work, and the material production of data, under its protocols, procedures,
and programs.
An Ode to Jerzy Spława-Neyman (1894-1981)
In 2014, when I began research for my dissertation project, I had difficulty finding an entry
point into the massive subject matter of algorithmic society. Inspired by recent scholarship in STS
on mobile artifacts and traveling rationality, I decided to center an algorithm or mathematical model
as the core site for my history. I would follow this potentially immutable—but probably mutable—
mobile around to see it at work, and through its applications. After researching a number of
candidates, including the simplex algorithm, the input-output model, Monte Carlo methods, and
minimum-maximum models, I landed on confidence intervals as my core site of study. CIs were a
bit more slippery and prolific, as they had been present in all of my former research. Innocuous in
their presentation, these statistical architectures were engrained in much of the data processing and
computational work I encountered: they appeared in my research as a tuning apparatus for data
analysis and algorithmic thought. A colleague encouraged me to look into their designer, Jerzy
Spława-Neyman.41 I found with Neyman a robust archive for the history of confidence intervals and
so much more.
Designing Certainty does not offer a traditional biography of Jerzy Spława-Neyman. Rather,
this is a history of the world he lived in. This is a history of the many human and technological
expressions, meanings, and impacts of his confidence intervals. My decision to engage Neyman’s
archives was part opportunity. The archives documenting his life and work probably would not exist
41 Thank you to Will Thomas for encouragement in the early stages of this project.

29
if he had been a woman logician or if things happened to roll out differently along his precarious
path from interwar Ukraine and Poland to England and finally resting in Berkeley, California. But
Neyman was also an exceptional person with an exceptional story. In his records in California,
London, and Poland, I discovered profound moments of dissent, raw emotion, and advocacy for a
different world. His archives serve as a unique view into the twentieth-century anxieties that I aim to
confront in this work. I have come to empathize with Neyman, not for his mathematical acuity, but
for his humanism and his very human life full of conflict, contradiction, and persistent optimism.
Neyman’s quintessentially modern life was shaped by circumstance and opportunity in equal
measure to the tragedies and uncertainties that inspired his work.
There is a large body of biographical material on Neyman that has been predominantly
generated by the mathematics community. While there has not been a comprehensive history on his
work, there is a well-documented timeline of his life through memoirs, biographies, and oral
interviews. As with most history of mathematics and computing topics, Neyman and his colleagues
have published a huge corpus of technical literature. Neyman began collecting his own personal
papers in 1937, after beginning his professorship at the University of California, Berkeley. In 1978,
mathematics biographer, Constance Reid began work with Jerzy Neyman recounting his life and
work. Over the course of the next six years, Reid interviewed Neyman and surrounding personal
contracts and professional colleagues and supplemented their oral testimony with visits to a select
number of archives, to fill out Neyman’s work. Her biography of Neyman constitutes the core
biographical material on his life.
Through her extensive and detailed oral interviews, Constance Reid produced Neyman’s
biography as a retrospective—looking backward—and I have worked to read the story of

30
confidence intervals forward, through their applications.42 Reid wrote that Neyman’s life can be
organized into three periods.43 The first period (1894-1921) constitutes his birth through his
departure to Poland Born in Kiev, Russia, Neyman arrived in Poland in 1921, after being released
from a Soviet jail that held him “as an enemy alien in Russia” due to the changing shape of the
Ukrainian border.44 He immediately took a position as the only statistician at the Agricultural
Institute in Bydgoszcz, where he worked on the applications of probability theory in agricultural
experimentation.45 Between 1923 and 1935 Neyman lectured at the University of Warsaw’s Nencki
Institute for Experimental Biology, where he established a mathematical statistics laboratory that
became the epicenter of a larger Polish planning collective, that I refer to as confidence computing.
An important characteristic of Neyman, that speaks to my larger history of uncertainty was his
inclination to put things to question.
If I did write a biography of Neyman, I would title it “The Objective Observer,” as this
failed desire of his, to be an objective observer, is evidenced throughout his life. In the 1920s when
Neyman began his career as a practical statistician, his preoccupation with challenging the logical
foundations of axiomatic probability theory was manifest in the questions he asked of his work. He
seems to me to have always held a drive towards a deeper truth and often discontent with the
injustices he witnessed in the world. I read in the archives his desperate letters he wrote after the
German invasion to try and secure university positions in the United States for his Polish colleagues.
42 While my analysis of information society concerns much broader contours, they map onto Neyman’s life and work. The materials collected at UC Berkeley constitute Neyman’s main personal archives.42 I have also visited his archives at the University College London. Using Neyman’s personal papers and technical work as a starting point, I extended my study of confidence intervals, and their select applications, to over twenty archives and a broad survey of technical material spanning the 1900-1980 period. 43 Constance Reid, Neyman—from life (New York: Springer-Verlag, 1982): 4. 44 Erich Lehmann, “Jerzy Neyman, 1894-1981,” Department of Statistics, University of California, Berkeley, Technical Report No. 155, May, 1998, accessed December 10, 2016, http://digitalassets.lib.berkeley.edu/sdtr/ucb/text/155.pdf, 1. 45 Ibid, 2.

31
I borrow the term “objective observer” itself from a French newspaper article that was
written about Neyman in 1947. Neyman had been sent to oversee the Greek Elections as part of the
U.S. occupation. He dissented from the U.S. intervention, after experiencing the violence they
generated in Salonika. A Parisian newspaper reported on Neyman’s dissent and they myth of
objectivity in overseeing the election during the occupation. In 1967, I read a number of letters that
Neyman wrote to acquaintances in Sweden petitioning them to grant Dr. Martin Luther King the
Nobel Peace Prize. He argued that international diplomacy would only be possible after confronting
race relations in the United States. Throughout his life, Neyman was part of many programs that
described him as an “objective observer,” as with the Cold War cloud seeding projects (chapter 5).
The pursuit of objectivity was important to Neyman, even though he remained subject to historical
contingency.
In the late 1970s, Constance Reid’s interview project catalyzed increased correspondence
between Jerzy Neyman and Egon Pearson, who worked to recount their own history and the
development of Confidence Intervals. The archive file on this subject contains 96 written letters. It
was during this time that Neyman became preoccupied with the process of writing history. In a
letter drafted to Egon, he wrote, “I am in full agreement with you about complexities of writing a
history, be it history of ideas or of developments in a country.”46 Their correspondence reflects an
anxious effort to wrangle memories and pinpoint significant moments in the timeline of their CI
research. At this point in time, Egon Pearson and Neyman had been writing letters for over 50 years,
and their very close friendship had survived all of the uncertainties presented in this dissertation.
Neyman died on August 5th, 1981, one year after Egon. He is revered in the mathematics community
as the architect of statistical inference.
46 Letter from Jerzy Neyman to E.S. Pearson, March 17, 1978, E.S. Pearson, Correspondence. Jerzy Neyman Papers, BANC MSS 84/30 c., Carton 1, The Bancroft Library, University of California, Berkeley.

32
As evidenced in the quote below, Neyman may not have been happy that a mildly sardonic,
millennial woman and so-called historian of science wrote a history of confidence intervals. But I do
believe, given his predilections, that he would respect my critical inquiry into the world he lived in
and the world we share. I, too, believe that we must put things to question.
I do not expect these letters and my comments will ever be published but knowing what so-called historians of science do in introducing their own guesses of what contacts and thoughts passed through the minds of their ‘subjects’, it seemed that I had almost a duty to put my memories and explanations on record in as objective a way as I could. 47
Chapter 0, contains material as it appears in “Algorithms under the Reign of Probability”
Think Piece in IEEE Annals of the History of Computing Vol. 40, No. 1 (Jan.-Mar. 2018): 93-96.
Dryer, Theodora. The dissertation author was the sole author of this material.
47 Ibid, Neyman Papers, Carton 1, Berkeley.

33
Chapter 1: Crisis
Crisis as Prologue: The New Agrarian Calculus and Anxious Quanta
CRISIS is a designation that produces new information and reaffirms extant information
systems and their corresponding power relations.1 In the early twentieth-century, the mathematical-
statistics movement came on the world stage to affirm a new science of calculation over statistical
material, but also to confront a crisis of information, generated by their own efforts to create a new
world of data and probabilistic oversight. New regimes of quantitative oversight involve much more
than internal procedural change. They transform entire informational systems, technological
1 I am inspired by Janet Roitman’s work, Anti-Crisis and am integrating her observations into my history of information and computing. Histories of crisis and crisis theory are intrinsically about information and the control of information and resources.
Figure 5: Duane Michals, “Madame Schrödinger’s Cat,” 1998, From the series Quantum.

34
infrastructures, and political decision-making apparatus. By the late nineteenth-century, the new
statistical calculus of mathematical statistics, in Karl Pearson’s terminology, required new methods
of statistical counts and new formulations and analysis of statistical material. Record keeping shifted
to aggregated statistical analysis, and this involved new ways of counting, organizing, and computing
information. Hypothesis tests, statistical estimations, and frequency analysis came to prominence in
the domains of quantitative governance. These new modes of thinking about information generated
new modes of data production, valued in terms of its usefulness for analysis, under the new
statistical calculus.
By the late nineteenth-century, the mathematical architectures for thinking about
information, rather than the things being counted, became the new objects and subjects of study.
These were predominantly probabilistic frameworks: error laws, standard deviations, hypothesis tests
and estimation mechanisms—all of which were inherently unstable subjects of analysis. Many of
these new architectures were designed to make sense of small data: information deemed too thin,
porous, and incomplete to make useful without an estimation tool. Experimental designs under the
new calculus were thereby conceived with inherent errors, limitations, uncertainty, and doubts. This
is from where the computational crisis emerged.
Probabilities are numerical expressions that attempt to quantify the limits of knowability
within a set of information and are expressed in terms of numerical uncertainty: < 100%. The
process of transfiguring information and decision-making systems into probabilistic frameworks is
what I call (un)certainty work. In this preliminary chapter, I will briefly sketch out how, in the early
twentieth-century, anxieties about incomplete, tattered, and porous information fueled an
international movement towards new probabilistic methods of computation and control, “an
improved statistics.” The drive to develop and implement this “improved statistics” emerged from a
designated computational crisis. And this was entirely a political project. What the technical elite
35
commonly identified as ‘crisis’ was an identified lack of public trust, or public confidence, in
statistical information and data. Through this lens, they explained away flagging market depressions,
failing administrative institutions, and the failure of paper currencies and standards to take hold as
an outcome of public doubt. They described this as a “crisis of confidence,” a distinct articulation of
economic instability that reconfigures crisis as a lack of control over data, rather than in terms of the
underlying real-world calamity (e.g. drought crisis becomes a crisis of water scarcity information).
The initial “crisis of confidence” occurred in two waves. The first wave occurred at the turn
of the twentieth-century, when statistical thinkers increasingly interpreted poor economic conditions
as quantitative and visual representations of flagging public confidence, setting a precedent in
designing increasingly technical explanations for “confidence.” Prior to this, nineteenth-century
affective-economic meanings of ‘confidence’ had been a primary, and rather vague, explanation of
economic processes. This affective-economic meaning of confidence emerged in the context of
shifting global gold and silver standards, and economic depression, especially the United States
recessions of 1890 and 1907, when political economists began to explain economic fluctuations in
terms of public confidence cycles. After WWI, identifications of a “crisis of confidence” ballooned
in statistical work and in the management of statistical institutions, including global trade systems,
paper currency, and census administration. Across these contexts, problems with the larger
economic and financial systems were attributed to flagging public confidence in those systems,
tractable in statistical data.
In this chapter, I introduce notions of computational crisis along three axes: epistemic,
environmental, and economic. I then introduce early twentieth-century agricultural experimentation,
and the agricultural experimental station, as the primary facilitator of a new mechanized data
management regime responsive to the confidence crisis. This involved the confluence and spread of
the mathematical statistics and transnational philosophy of science movements: the two major forces

36
shaping (un)certainty work in the early twentieth-century. These three threads converge over time
becoming less and less distinct in the new computational designs. The ‘economic’ domain pertains
to the realms of state statistics and trade mechanization. This primarily accounts for population data:
census information, labor statistics, immigration and emigration statistics, and anthropogenic and
eugenic heredity information. This also includes market information and data, that ranges from
consumption and production data to price indices and other quantitative trade mechanisms. In the
‘environmental’ realm, administrators identified a lack of confidence and control in agricultural data,
weather and climate data and maps, and water scarcity information. The ‘epistemic’ dimension
pertains to the complex ‘crises of foundations’ in physics and mathematics at turn of century.
During this time, physicists, mathematicians, and logicians put to question what data indicated about
the real, material world. In 1929, these three domains of inquiry and corresponding informational
architectures converged in the initial confidence interval designs and calculations.
While these changes in information society move along with the growing Anglophone
school of mathematical statistics, this crisis of data management does not belong to a single field,
institution, or nation state. It occurred in transnational as well as national contexts. It permeated the
exact sciences, the sciences of administration, and international trade and agriculture. Common
across these contexts is a notable grasp for control over the authority of information and resources.
Statisticians, eugenicists, biometricians, trade commissioners, bureaucrats, traders, census
administrators and others who oversaw the collection, organization and management of data,
statistics, and information, identified this crisis as a loss of public trust in the preexisting powers of
eighteenth and nineteenth-century quantitative oversight. The shared and growing anxiety and doubt
amongst the technocratic elite about the efficacy and validity of quantitative information, is
evidenced throughout this early twentieth-century period in the circulation of technical publications,
formal methods and data, letters, and front matter. Statistical and information work designed during

37
this time moved to stabilize hierarchies of control over purportedly unstable quantitative systems
and their corresponding economic and political bodies.
This initial informational crisis is demarcated by statistical thinkers and the technocratic elite.
Although, as I will show throughout this dissertation, formulations of crisis, and their responses,
involved many more actors and impacted many more people and environments. I decenter the
Anglophone school for two reasons. First, the initial mathematical statistics movement, or the turn
to transfigure statistical work into probability analysis, occurred on the world stage, and was made
sense of, in radically different ways, across different geopolitical contexts. Throughout Designing
Certainty, I travel to Warsaw, Poland, Kolkata, India, Beltsville, Maryland, and the sugar beet belt of
Detroit, Michigan. The data economies I identify are likewise transnational: they stretch into North
Africa, Korea, Japan, Mexico, Canada, Navajoland, and beyond.
I further decenter the Anglophone school in terms of historical explanation. I aim to give
visibility to the existence and impacts of Anglophone and Anglo-American designs of information
and decision-making, without carrying forward their historical explanations of those systems and
corresponding values. The intellectual history one can build from mathematical textbooks and
technical publications alone does not yield a sufficient explanation of the historical significance of
these shifting regimes of (un)certainty work and their impacts. As already stated, informational crises
were defined as a crisis of public confidence in that information and analysis. Therefore, the public
is an important and oft neglected participant in this history. Another important dimension to my
argument is that I understand data production as economy. Throughout this dissertation I engage a
number of data economies including the aerial-bombing economy, environmental policy planning,
and the rise of digital computing. But the story begins in interwar agriculture.
The initial confidence crisis and early twentieth-century computational anxiety is difficult to
pinpoint and map out, as it expands across different domains of inquiry and impact, and across

38
different temporal and geographical contexts. However, there are shared descriptions of crisis across
these domains that directly pertain to flagging public confidence in preexisting systems of numerical
governance. They are linked by technical expressions of confidence. I designate a general historical
period of confidence crisis between 1900-1940. While this historical periodization is quite large,
especially for a purportedly singular instance of ‘crisis’—it contains the family of identified crises
that directly contributed to the formulation of new numerical-statistical designs of certainty,
particularly confidence interval logics. As noted, a better formulation of this historical period, is to
understand it as two waves of transformation in numerical governance: the first at fin de siècle, and the
next following WWI.
At the turn of the twentieth-century, the technical elite defined the “confidence crisis” as a
problem of securing public certainty in numerical analysis and management that can only be
resolved through designing new quantitative experiments and techniques. This catalyzed a long-
durée cycle of crisis management through computational design and redesign: a cycle of
transfiguring social and economic problems into problems of information, then designing
techniques to manage that information. With this precedent: after the underlying calamity is not
resolved, or a new crisis is in the fold, resources are then mobilized towards development of a new
informational technique, rather than addressing the underlying calamity some other way. Social,
economic, and environmental problems are thus sustained as problems of information and technical
design. By the late 1920s, this larger context of confidence crisis gave rise to designs of confidence
interval parameters, the subject of this dissertation. As a bounded site of inquiry within much larger
information movements throughout the twentieth century, the various iterations and applications of
confidence intervals demonstrates the ongoing dialectic between ‘crisis’ and ‘confidence computing’
from mathematical statistics to the rise to digital algorithmic oversight.
39
Economic Confidence
In the U.S. context, ‘confidence’ first emerged as a nineteenth-century economic concept
and cultural creed at work in the development of white middle-class society and corporate
capitalism. Hermann Melville’s civil-war era novel The Confidence Man: His Masquerade (1857) captures
the popular anxiety and awe surrounding the folkloric mid-nineteenth century ‘confidence man.’2
Aboard a Mississippi steamboat, Melville’s confidence man used his wiles and cunning to convince
unsuspecting puritans to give him their money, their most cherished worldly possessions, and even
their souls. But the American confidence man was not just a literary character. Following the Civil
War, the rapid secularization and urbanization of U.S. society produced a cultural vacuum that
fueled progressive ideologies and a search for new social-organizational principles.3 By the late
nineteenth century ‘confidence’ held Janus-faced meaning in U.S. banking and trade systems. The
‘confidence’ of conservative white men was an attitude needed to sustain trust in banking before
federally mandated banking insurance, and to uphold ‘confidence’ in business cycles, market
ideology, and national identity. ‘Confidence’ therefore described the newly positioned white middle-
class middle-management man who worked tirelessly to secure public trust in the unprecedented
authority of banking logics.
At the same time, ‘confidence’ held the meaning explored by Melville in his satire: that the
American dream was a chimera of confidence tricks. Doubt about the reliability of the national
banking system was frequently described in these terms. For example, an 1885 review of the
National Banking System asserted: “…it is not possible for the legislatures of thirty-eight States to
adopt individually, and in such a way to inspire general confidence, a system that will make the bill-
2 See: Herman Melville, The Confidence-Man, ed. John Bryant (USA: The Modern Library, 2003); Karen Halttunen, Confidence Men and Painted Women: A Study of Middle-class Culture in America, 1830-1870 (Yale University Press, 1982). 3 See: Robert H. Wiebe, The Search for Order, 1877-1920 (New York: Hill & Wang, 1967).

40
holders secure in case of the failure of a bank.”4 This ambition to achieve ‘ general confidence’ in the
banking system was specifically intended to ward off Anglophone ‘confidence tricks,’ stating that,
“Our national banking system to-day is as good a thing, perhaps, as could possibly be derived from
such a source—the great British confidence game of specie basis, inflation, and suspension.”5
Confidence lived a double life of being both the threat and promise behind public participation in
the new banking institution. Confidence tricks were a threat to the growing finance society that also
needed public confidence to make the system work—confidence promised that which it was
predicated on.
Under the confidence crisis, doubt in numerical-statistical frameworks is doubt in the
economic systems to which they correspond. The term ‘confidence crisis’ is a prominent actor’s
category in the history of political economic thought and practice, and its influence pertaining to this
numerical and institutional doubt. In the U.S. context, studies of confidence economics galvanized
after the 1890 and 1907 market depressions, which were both predominantly described as “a crisis in
confidence.”6 These two periods of extreme crisis set a precedent in the use and inquiry of
confidence studies. Political economists identify crises of confidence to frame economic history,
denoting periods of flagging trust in market trade. Reference to confidence crises can be traced in
trade and planning journals from the seventeenth century. A crisis of confidence is a moment of
depletion, “a sudden disturbance” ascribed to a lack of public enthusiasm in the overarching finance
and banking systems. This terminology holds power in solidifying a market society defined by
periods of growth and depression.
4 F. J. Scott, George S. Boutwell, Edward H. G. Clark, and S. Dana Horton. "Our National Banking System." The North American Review 141, no. 346 (1885): 201 5 Scott et al., "Our National Banking System,” 206. 6 O.M.W. Sprague, “The American Crisis of 1907,” The Economic Journal 18, no. 71 (1908): 353; Myron T. Herrick, “The Panic of 1907 and Some of its Lesson,” Annals of the American Academy of Political and Social Science 31 (1908).

41
While political economists described the confidence crisis as a period of flagging public trust
in market trade, statistical administrators of the same time period interpreted it more distinctly as a
problem of distrust in the validity of material information. Without the willing participation of
people to be counted, or the ability of governing bodies to adequately collect and house information,
it was difficult to accurately enumerate and organize populations and resources. The confidence
crisis was therefore identified as a twofold problem—it was a public problem due to a lack of
participation in numerical systems and institutions, and it was a problem of expert oversight unable
to command a growing influx of statistical information.
In the progressive era, statistical thought and economic management blurred in the search
for new organizational mechanisms: price indices, wage measures, and labor statistics.7 The statistical
sciences, including census management, and spanning from industrial bookkeeping to agricultural
and economic statistics, were said to-be saturated with error. It was statistical error that undermined
public trust in statistical information, and worry spread about the future of statistical institutions
under their growing inability to manage and account for statistical error. For example, in 1908, an
address given at to the American Statistical Association reported on the confidence crisis in the U.S.
Census:
It would work an incalculable inquiry to the cause of statistical science if anything should happen to impair public confidence in the integrity and reliability of the census; and it is one of the best traditions of this office that its reports should point out and emphasize the limitations and sources of error in the statistics which it compiles and thus guard against their misinterpretation.8
7 For a detailed history of labor mechanisms in the era of “new capitalism,” see: Mark Hendrickson, American Labor and Economic Citizenship: New Capitalism from World War I to the Great Depression (New York: Cambridge University Press, 2013); for a comprehensive history of price statistics see: Thomas Stapleford, The Cost of Living in America: A Political History of Economic Statistics, 1880-2000 (Cambridge University Press, 2009). 8 S. N. D. North, "The Outlook for Statistical Science in the United States." Publications of the American Statistical Association 11, no. 81 (1908): 22, my emphasis.

42
Political economists and statisticians viewed error, generated in the production of statistical
information, as infecting people’s trust in larger numerical systems that depended on the data. Yet
error was unavoidable. Error occurred in statistical sampling, in data collection, in data organization,
and especially in the computation and interpretation of that information. Statistical administrators
interpreted error as both a computational and institutional problem.
While “sources of error” were vaguely defined, statistical administrators thus stressed the
importance of gathering observations on statistical error, “to build confidence in numerical data […] and
draw valid conclusions in spite of the defects of the materials.”9 Population data housed in various
collection centers ranging from census bureaus to clearing houses suffered from both
incompleteness and sheer quantity, described by U.S. statisticians as “an embarrass de richesses: […]the
difficulty was not so much in gathering material as in mastering it, in digesting [the] masses of
reports which have been stored in the archives and on the bookshelves of statistical offices.”10
Mastering statistical material meant ensuring public confidence in its validity. The confidence crisis
was both an embarrass de richesses, and a problem of producing knowledge under limited information.
There was at once too much and too little information.
Anxious and worried statistical practitioners sought, from the public, a “general confidence
and […] willingness to cooperate with the authorities.”11 The crisis of confidence in statistical
information ranged across business statistics, economic statistics, vitality and mortality statistics,
census statistics, labor statistics, medical statistics, and so on. This was seen especially in cases where
the population data was not in a ‘controlled’ state.12 A lack of controllability was another description
9 Westergaard, Harald. "Scope and Method of Statistics." Publications of the American Statistical Association 15, no. 115 (1916): 240. 10 Westergaard, "Scope and Method of Statistics," 237. 11 Westergaard, "Scope and Method of Statistics." Ibid. 12 Chapter two focuses on statistical and economic control and the controllability of data, both of which are historical computing categories.
43
of incomplete information. From this view, emigration ad immigration statistics became a popular
site of study in the search for statistical improvement, as fluctuating populations were difficult to
quantify. “Jewish statistics” was a common point of focus for statisticians experimenting with new
estimation methods. Population data about the Jewish people was difficult to generate due to their
conditions of migration and social exclusion. For example, in 1908, the American Jewish Year Book
described the need for estimation in counting Jewish populations “as confidence can be placed in
[these] figures not the result of an actual count.”13
Mathematical Statistics
The confidence crisis pertains to a widespread designation of flagging public trust in
numerical systems of governance in the late nineteenth and early twentieth centuries. This
designation is seen in political economic and administrative work in census, trade, and so forth. It is
also seen in academic institutions, predominantly in the growing fields of mathematical statistics,
part of the eugenics and anthropometric movements in England and the larger Anglophone colonial
landscape. Mathematical statistics is a field that applies mathematical laws, axioms, and models to
statistical information. The scientific field of mathematical statistics is attributed to English scientist
Karl Pearson, who in the late nineteenth century turned his scientific work to a study of statistics.
His goal was to establish “a new tool in science which would give certainty where all was obscurity
and hypothesis before.”14 His new statistics shaped and molded statistical information into bell
curves and derived new laws of assessing error, testing hypotheses, and designing methods of
prognostication. Along with eugenicist Francis Galton, Pearson headed up two departments at
13 "Jewish Statistics." The American Jewish Year Book 9 (1907): 431-35. 14 Theodore Porter, Karl Pearson, 3: “We are reminded that rationality, even it its guise as calculation, does not reduce to scientific and administrative routines. In Pearson’s life we experience it in a scene of personal cultivation and social struggle, where it has inspired the fiercest of passions.”

44
University College London (UCL), where a number of young practitioners from Poland, India, and
beyond would come to study.
Francis Galton founded the UCL anthropometric laboratory in 1884 intended, “for the
determination of height, weight, span, breathing, power, strength of pull and squeeze, quickness of
blow, hearing, seeing, colour-sense, and other personal data.”15 This laboratory arrived out of a
much longer history of heredity and social mapping through the acquisition, ordering, and
management of human information. As Theodore Porter has recently shown, beginning in the early
nineteenth century, human heredity data was collected in armies, prisons, immigration offices, insane
asylums, and schools. As he describes, “The science of human heredity arose first amid the moans,
stench, and unruly despair of mostly hidden places where data were recorded, combined, and
15 Francis Galton, F.R.S., Anthropometric Laboratory, 1884.
Figure 6: “Anthropometric Laboratory,” Frances Galton Papers, Digital Special Collections, UCL.

45
grouped into tables and graphs.”16 This information was generated on the transnational stage in
Denmark, France, Germany, India, Latin America, and the United States.
Late nineteenth and early twentieth-century Anglophone statistics—in eugenics, heredity,
and mathematical-statistics—asserted a new epistemology of calculated time through regression
techniques and anthropometric measurement. Statistical regressions captured the past through
discrete sets of anthropometric information, while asserting methods of analysis and interpretation,
which subjugated classes and types of people, and reaffirmed Anglophone dominance over the
future. Both the past and future were bound to mathematical process. Anthropometry achieved new
power in the expansive eugenics movement, which advanced a social politics around physical and
biological human difference stabilized by new methods of calculation.
In 1901, Karl Pearson established the mathematical-statistics journal Biometrika. The
commencement publication stated its purpose: “It is intended that Biometrika shall serve as a means
not only of collecting under one title biological data of a kind not systematically collected or
published under any other periodical, but also of spreading a knowledge of such statistical theory as
may be requisite for their scientific treatment.”17 Indeed, Biometrika would serve as a significant
conduit for the distribution of statistical methods throughout the twentieth century. Biological data,
the core currency of the initial program, was a data system to elucidate human difference and assert
Anglophone control. Through Anglophone mathematical statistics, race science gained legitimacy as
a mathematically proven program. The primacy of racial science to this program, is stated in the very
first paragraph of Biometrika— “the first step in an enquiry into the possible effect of a selective
16 Theodore Porter, Genetics in the Madhouse: The Unknown History of Human Heredity (Princeton: Princeton University Press, 2018): 2. 17 Editorial, “The Scope of Biometrika,”Biometrika 1, no. 1 (1901): 1.

46
process upon any character of a race must be an estimate of the frequency with which individuals,
exhibiting any given degree of abnormality with respect to that character, occur.”18
At the turn of century, mathematical statistics became a field that rendered statistics to be a
coherent science, through asserting laws of counting, measurement, and estimation over
designations of data: biological data, heredity data, and anthropometric data. Karl Pearson’s new
calculus of statistics hinged on key data architectures: chi-square test, standard deviation, correlation,
and regression techniques, that were deemed the new fundamental methods of data organization.
These methods of analysis circulated in publications and were widely and rapidly adopted in social
planning, biometrics, medical analysis, bacteriology, food studies, and so forth. They were integrated
into informational work just as they were being designed in academic settings. Biological data and
regression methods were the foundational components of the new mathematics, which would
spread into new applications and contexts through the interwar mathematical statistics movement.
By the end of the 1930s, these data architectures—regression techniques, standard deviation,
and correlations—would become dominant tools used in interpreting social and state information
on the world stage. Tracking the nodes and routes of global trade, the interwar “mathematical-
statistics movement” became a vast enterprise. On the transnational stage, the Anglophone
metropole distributed data and methods through widely-read publications such as Biometrika, but
there were also mathematical-statistical journals based in Korea, Japan, Germany, France, Italy,
Turkey, India, and Poland, to name a few, that were circulated transnationally. Some of the
corresponding programs were colonial extensions of the Anglophone school; others were built after
the Anglophone fashion. Yet other new statistics programs were entirely distinctive in their origins.
18 Ibid.

47
Across these geographical contexts, new statistical methods were designed and employed to support
local and regional political-economic projects, imbued with distinctive cultural and political
complexities. My interest here is not just in the history of the mathematical designs, but in the
history of computing and computation known through their applications.
While statistical methods were shared and traded transnationally, these were made sense of
in local contexts, with local epistemologies of data, and local processes of computational work, used
for specific political and economic ends. I use ‘confidence-computing’ to give visibility to this larger
information network, under the broader conditions of the confidence crisis, and also to describe
work conducted in local contexts. The crisis of quantification catalyzed a widespread reconfiguration
of planning processes, according to the “improved statistics.” But confidence computing only came
to fruition after WWI. It was a new epistemology of planning and a labor of calculation traveling in
the currents of postwar rehabilitation—state reorganization, colonial expansion, and a growing
empire of western pricing logics. How and why did this new statistical calculus rise to global heights of
quantitative governance?
Quant Farms in England, India, Poland, and the United States
In the period 1920-1940, “an improved statistics” emerged in response to the confidence
crisis, as a means of quantifying confidence, uncertainty, and control that hinged on assessing
likelihoods of error in statistical work. Improved statistics emerged at the nexus of the Anglophone
field of mathematical-statistics, the rise of axiomatic probability theory and set theory, and the rise of
industrial agriculture. I argue that as agriculture industrialized, it also became a data-driven program
and an enterprise geared towards (un)certainty work. This new regime of planners went to work on
the world stage to harness public confidence in new modes of agricultural production and oversight.

48
They reconfigured the incomprehensible destruction of the Great War into a mathematics problem,
which they deemed to be a crisis of calculation and flagging public confidence in numerical
oversight. The confidence crisis commanded explanation of the postwar moment, designed by
political economists, statisticians, scientists, logicians, administrators, and bureaucrats, as well as
agriculturalists and tradespeople, whose anxiety—a captivation with the past that manifests as a conditioned
worry about the future—drove them to grasp after a world they could no longer control. This catalyzed
the formation of new computing infrastructures in response. The central engines for the interwar
mathematical statistics movement were agriculture and trade. Agriculture was the predominant site
and environment for the second wave of mathematical-statistical production, following the
anthropometric and heredity programs of the late-nineteenth and early-twentieth centuries.
Throughout this dissertation, I develop histories for the Rothamsted experimental station
outside of London, England, the United States Department of Agriculture’s experimental station in
Beltsville, Maryland, the Indian Statistical Institute in Kolkata, India, and the Nencki Institute for
Figure 7: “Poultry at Government Farm, Beltsville, Maryland,” 1920, National Photo Company Collection glass negative.

49
Experimental Biology in Warsaw, Poland. By the early twentieth century, agricultural experimental
stations patchworked the United States landscape and were burgeoning around the globe. The
stations were laboratories, state managerial bodies, and education centers, situated on acres or miles
of land. They were centers for environmental study, agricultural production, and nodes of economic
exchange in the circulation of seed, plant, and food commodities. In the U.S. context, as emblems of
nineteenth-century state science, the agricultural experiment station arrived at the nexus of land
grant legislation, geological surveys, and global trade.
The early twentieth century agricultural experimental station constituted of both the library
and the laboratory for the new statistics. Situated as unofficial government planning centers, the
stations collected and ordered data from various entities in farming, agrarian planning, census
administration, and research in the agrarian sciences. They held the political-economic resources to
design, implement, and circulate new modes of data management, and they drove the information
revolution. In the early 1920s, at the height of the confidence crisis, the four stations in this
dissertation were designed under new leadership to develop new methods of computational
oversight, rooted in the tenets of mathematical statistics.
A significant dimension to the new statistics was the formulation of experimental design, the
process by which a physical or environmental experiment in sugar beet breeding, bacteriology, and
so forth were redesigned according to methods of probabilistic oversight. The “design of
experiments” is the fundamental epistemic leap within twentieth-century computing; it is the
presupposition that empirical processes should be represented and explained as mathematical
phenomena, in order to garner certainty within them. Between 1920 and 1940, statistical
experimental frameworks came to oversee these designs as industrial-agricultural methods.

50
Outside of the United States, the Rothamsted Experimental Station is considered to be the
oldest experimental station in Europe, originally founded in 1843. A major turning point was in 1919
when Rothamsted director Sir Edward John Russell gave eugenicist, statistician, and now
agriculturalist, Ronald A. Fisher free reign to digest and make sense of the vast amount of data
generated by the station. Fisher held vested interest in the advancement of mathematical statistics in
the domain of agriculture. In 1925, Fisher published a treatise titled, Statistical Methods for Research
Workers, which was a how-to book for statistical research workers, for applying the Anglophone
calculus of statistics in real-world applications.19 This treatise and his later 1935, Design of Experiments,
captures the indiscriminate enthusiasm of reconfiguring any program generative of data, as a
methods-based experiment.20
The confidence crisis was not confined to Anglophone providence, but had regionally
specific manifestations throughout Eastern Europe, Latin America, and South and East Asia. This is
especially clear in colonial contexts where capitalist logics from the U.S. and U.K. were failing to
take hold. India was a major site for colonial projects pertaining to the confidence crisis.21 Local
operatives in India worked towards the advancement of price mechanization driven by a desire to
overcome flagging trade and distrust in foreign exchange. In 1921, Prasanta Chandra Mahalanobis, a
Cambridge Mathematical Tripos and former student of Karl Pearson’s established a statistics
19 R.A. Fisher, Statistical Methods for Research Workers (Edinburgh: Oliver & Boyd, 1925). 20 R.A. Fisher, Design of Experiments (Edinburgh: Oliver & Boyd, 1935). 21 For scholarship on the legacies of political quantitative population administration in postcolonial India, see: Partha Chatterjee, The Politics of the Governed: Reflections on Popular Politics in Most of the World (New York: Columbia University Press: 2006), 34: “Unlike the concept of a citizen, which carries the ethical connotation of participation in the sovereignty of the state, the concept of population makes available to government functionaries a set of rationally manipuable instruments for reaching large sections of the inhabitants of a country as the targets of their “policies”—economic policy, administrative policy, law, and even political mobilization. […] This regime secures legitimacy not by the participation of citizens in matters of state but by claiming to provide for the well-being of the population. Its mode of reasoning is not deliberative openness but rather an instrumental notion of costs and benefits. Its apparatus is not the republican assembly but an elaborate network of surveillance through which information is collected on every aspect of the life of the population that is to be looked after.”

51
laboratory, which later became the Indian Statistical Institute (ISI) in 1931. In 1931, India’s Imperial
Council of Agricultural Research (ICAR) funded the ISI for studies related to agriculture.22
The Indian Statistical Institute grew out of a single-room statistical laboratory, founded in 1931
Kolkata, India. Its founder, Prasanta Chandra Mahalanobis had been a visiting student in the
Anglophone school of mathematical statistics, and he travelled back and forth to London.23 His
education at University College London with Karl Pearson and Ronald A. Fisher reinforced his
fascination with an anthropometric social order. While anthropometry is a science of quantifying
human populations, its methods begin with the individual human form, determining human
difference through physical bodily assessments of human individuals. This includes observable
measures that range from height, weight, motion, craniometry, and skin color, to theoretical
measures in genetics and human behavior. Anthropometric measures are not objective, but laden
with racialized, gendered, and other cultural valuations.24 In India, anthropometry is the longest-
used measure and science of human difference. It dates back to the eighteenth century and was
strengthened through colonial and post-colonial technoscience.25
The convergence of mathematical statistics with anthropometric reasoning, first through
Francis Galton’s method of regression analysis and then through the experimental design work of
22 Ghosh, Jayanta, Pulakesh Maiti, and Anil Bera. "Indian Statistical Institute: Numbers and beyond, 1931–47." Science and modern India: An institutional history, c 1947 (1784): 1019. 23 For primary literature on P.C. Mahalanobis’ life and influence, see: Mohan B. Reddy and Ranjan Gupta, “Introduction: P.C. Mahalanobis and the Symposium on Frontiers of Anthropology,” Human Biology 67, no. 6 (1995): 819-825; C.R. Rao, “In Memoriam: Prasanta Chandra Mahalanobis (1893-1972) Sankhyā: The Indian Journal of Statistics, Series B (1960-2002) 34, no. 3 (1972): 301-302. 24 See, for example: Lundy Braun, Breathing Race into the Machine: The Surprising Career of the Spirometer from Plantation to Genetics (Minnesota: University of Minnesota Press, 2014); Michael Yudell and J. Craig Venter, Race Unmasked: Biology and Race in the Twentieth Century (New York: Columbia University Press, 2014); Douglas Lorimer, Science, Race Relations and Resistance: Britain, 1870-1914 (Manchester: Manchester University Press, 2013); Ann Morning, The Nature of Race: How Scientists Think and Teach about Human Difference (Berkeley: University of California Press, 2011). 25 Stanley Uliaszek and John Komlos, “From a History of Anthropometry to Anthropometric History,” Human Variation: From the Laboratory to the Field (2010): 183-197.

52
Ronald A. Fisher, consolidated anthropometry as (un)certainty work—a practice of translating data
into probability tables, according to new, postwar methods in mathematical statistics. For
Mahalanobis, Fisher’s anthropometry laboratory symbolized the totalizing potential of the
mathematical-statistical gaze over human identity and societal value.
While functioning as a colonial laboratory, the ISI advanced its own distinctive philosophy
of computation, unique to Indian consciousness and local politics. In its founding, many dimensions
of the Indian Statistical Institute were modeled after the London school, especially Fisher’s
anthropometric laboratory and Karl Pearson’s international journal Biometrika. But, like the other
mathematical statistics publications, the ISI’s journal Sankhyā was designed to advance a locally
rooted politics and an Indian national identity. In its commencement publication, Mahalanobis
explicitly rooted the journal in 3,000 years of India’s history. He wrote:
[…] statistics finds adequate expression in the ancient Indian word Sankhyā. In Sanskrit the usual meaning is meaning is ‘number’, but the original root meaning was ‘determinate knowledge.’ […] The history of the word sankhyā shows the intimate conexxion which has existed for more than 3000 years in the Indian mind between ‘adequate knowledge’ and ‘number’ (sic). 26
The founding principle of the journal was that ‘statistics’ aimed to give ‘determinate’ and adequate
knowledge of ‘reality’ with the help of numbers and numerical analysis.27 Countering the larger
cultural sense of indeterminacy, this philosophy of statistics as determinate knowledge became a
legitimating apparatus in the computing work for India’s social and economic programs.28
26 P.C. Mahlanobis, “Why Statistics?” Sankhyā: The Indian Journal of Statistics (1933-1960), 10, no. 3 (1950): 224-225. 27 Ibid. 28 For a cornerstone text on the national imagination and its impact on questions of sovereignty, see: Partha Chatterjee, The Nation and Its Fragments: Colonial and Postcolonial Histories (New Jersey: Princeton University Press, 1993).

53
Throughout the 1930s, Sankhyā published local research conducted by Indian practitioners
as well as a percentage of publications from the transnational circuit. Annual reports were published
that surveyed all printed periodicals on methods-based computing. These were pulled from Belgium,
China, Finland, France, Japan, the Philippine Islands, Turkey, South Africa, and Poland, in addition
to many other countries. It was common practice for the computing laboratories in each of these
places to house a comprehensive library on current research from the other locations. The Warsaw
publication Statistica was especially popular in Kolkata. As evidenced in the journals, confidence
intervals, fiducial limits, interval estimates, and null-hypothesis tests were a major point of
investigation for ISI researchers—these logics shaped their data politics towards advancing rural
reconstruction and large-scale anthropometry programs throughout the twentieth century.29
During the 1920s, The Indian Trade Commissioner was notably interested in building
confidence to sustain the “normative order” or caste system, reflected in this 1926 British report
which bemoans India’s lack of confidence in trade activity, which was considered a microcosm for
the “world’s tendencies”:
Now the first most obvious and most deep-seated cause of the economic ills from which we are suffering to-day is admitted on all sides to be lack of confidence. The primary producer is uncertain of the market for his goods. The manufacturer is uncertain as to the prices he must pay for his raw materials and the prices he will get for his finished goods. The merchant is uncertain of the charges he must allow for in calculating transport, exchange and interest costs. Labour is uncertain of employment and too often also uncertain of wages and hours of work. The shipowner cannot count on cargoes nor the banker on a safe return to his capital. At all points lack of confidence prevails and hampers legitimate trade.30
29 See, for example: C. Radhakrishna Rao, “Statistical Inference Applied to Classificatory Problems,” Sankhyā: The Indian Journal of Statistics (1933-1960), 10, no. 3 (1950): 229-256. 30 Lindsay, H. A. F. "World Tendencies Reflected in India’s Trade." Journal of the Royal Society of Arts 75, no. 3876 (1927): 386. http://www.jstor.org/stable/41357454.

54
A publication in the Indian Journal of Statistics, Sankhyā reflected on the importance of “improved
statistics” in solving the confidence crisis. Statistician S.K. Datta Roy wrote that “adequate operating
statistics […] gave shareholders, employees and community accurate data upon which sound option
may be formed as to the adequacy of the return on capital or remuneration of labour.”
Datta Roy was interested in establishing confidence in modern trade economies. He stated, “The
confidence which should spring from such accurate and full knowledge [would] go far to eliminate the
suspicion which makes the investors unwilling and workers discontented.”31 The Indian Statistical
Institute was founded in 1931, constituting the institutionalization of mathematical statistics in India.
By 1923 there were four satellites in India, the ISI journal, Sankhyā was internationally
circulated, and ISI members made frequent visits to statistics laboratories in the United Kingdom,
the United States, South America, Germany, France, and Poland. The India Statistical Institute came
to power between 1920 and 1940 to address the confidence crisis, and garner authority within the
postwar global economy. Statistical model makers operating in agrarian production and management
established new institutions to facilitate the exchange of mathematical statistics on the international
stage.
Across colonial contexts, Western practices of price mechanization conflicted with already
existent or emergent market and monetary systems. Laborers driving these systems, including
merchants, tradespeople, and farmers, resisted the growing imperatives of a global trade economy.
For example, in their study of interwar Poland, U.S. and British political economists insisted that the
source of the economic crisis was the peasant farmers’ resistance to producing beyond their own
needs. The basic tenets of modern capitalism—producing beyond one’s own needs and trading and
31 Roy, S. K. Datta. "Railway Statistics." Sankhyā: The Indian Journal of Statistics (1933-1960) 4, no. 2 (1938): 242. http://www.jstor.org/stable/40383911.

55
investing in invisible commodities—relied first and foremost on maintaining confidence or trust in
the future of systems that did not yet exist.
Epistemic Crisis: The Probability Problem
The other major feature of the confidence computing movement is the ascendancy of
axiomatic probability over statistical programs. The influence of physics, transnational philosophy of
science movements, and the formation of new schools of logic in set theory and axiomatic
probability theory converged on the new statistical methods. Uncertainty was a logic and
computation problem. Administrators and laboratory scientists alike framed their inquiries as
problems of enumeration, estimation, and prognostication as they attempted to grasp hold of
slippery, shifting, and hard-to-measure entities. Shifting populations in rapidly changing nation states
were as difficult to quantify and predict as the alpha particle.
At the turn of the twentieth century, new mathematical approaches to old problems in
electrodynamics and atomic theory abandoned former conceptions of space, time, and energy with
rippling effects. Beginning in 1905, with the theories of Brownian motion and special relativity, an
anxiety over the limits of materialism emerged. At the heart of this crisis was a worry over whether
mathematical descriptions used to describe the world actually reflected the world itself. Central to
these epistemic anxieties, of course, was Albert Einstein’s 1905 work on molecular energy and
relativity theory. While he was not a lone contributor to these paradigm shifts, his anxiety about
mathematical description, culminating in his 1937 decree that “mathematics is uncertain,” is
particularly easy to follow.
Generally speaking, the crisis of materialism in the early twentieth-century physical sciences
was a problem of predicting the future. Mathematical descriptions of atomic particles and quantum

56
events predicated a forward-moving direction of time and space. The geometric design of Hermann
Minkowski’s 1908 space-time structure—a visual representation of Einstein’s relativity universe—
represented ‘events’ at specific space-time coordinates, measurable only in the direction of the future
and never in the past. Erwin Schrödinger’s wave-particle equation mapped the evolution of a wave-
particle into the indefinite future, but as soon as it was measured, it collapsed into a singular
numerical value—describing either a wave or a particle—as its evolution halted.
Quantum mechanics broke from the classical understandings of motion, light, and energy as
the Newtonian framework failed to describe the otherworldly properties of quantum particles.
Quantum particles did not move in continuous trajectories or orbits but jumped between quantum
states; they appeared and disappeared and obeyed strange and paradoxical laws such as Einstein’s
second principle of relativity that states no particle can move faster than the speed of light. Whereby
a particle moving at the speed of light within a frame of reference moving at the speed of light
remains moving at the speed of light, or c * c = c. Quantum particles are also described as waves, a
completely different configuration of matter, depending on the experiment and the timing of
observation. This early twentieth-century crisis of measurement occurring at new and strange scales
was a crisis of mathematical meaning. It catalyzed a search for imaginative mathematical description
that could adequately predict the evolution of a theoretical particle, the frequency of a quantum
state, and the physical properties of light.
Uncertainty is not an accidental feature of the search for mathematical description in physics
but was an intrinsic part of its design. It was a descriptor of the epistemological and ontological
complexities of the physical world beyond human experience and a signifier of reconciling
mathematical description across different paradigms of knowing. Uncertainty denoted an incomplete
mathematical language of competing truths, describing realties in which physical entities could be
both waves and particles.

57
At the turn of the twentieth century, axiomatic probability theory came to the forefront of
statistical inquiry in the domains of physics and philosophy, as well as state management, a
development which intensified after WWI.32 The confidence computing movement was a major
force in advancing the new science of axiomatic probability over analysis, management, and control
of statistical information. But at the same time, this move to reinterpret information as probability
data catalyzed an epistemic crisis: should probability theory be accepted as a valid epistemology in
state and science? And furthermore, what is uncertainty? Is it a language problem or a psychological
problem? Is it measurable in terms of data a priori or in frequency? This multidimensional ‘problem
of probability’ was a serious inquiry taken up by economists, politicians, physicists, and philosophers
of logic. Their inquiries into probability lay at the nexus of truth and politics. Questions of logic,
vagueness, and accuracy were either explicitly or implicitly entwined with questions of democracy,
colonialism, war, and poverty.
Congruent with this understanding of physical uncertainty as a search to reconcile competing
paradigms, historians of physics have shown that the popular conception of Heisenberg’s 1927
‘uncertainty principle,’ characterized as the fact that “a particle cannot simultaneously have a well-
defined position and a sharply defined velocity,”33 was not the central issue for Heisenberg.34
Cathryn Carson argues that interpreting the ‘uncertainty principle’ as an “impossibility of knowing
precisely,”35 flattens the epistemological and ontological complexity of measuring particles.
32 Hugues Leblanc, “The Autonomy of Probability Theory (Notes on Kolmogorov, Rényi, and Popper),” The British Journal for the Philosophy of Science 40, no. 2 (1989): 167-181; N. H. Bingham, “Studies in the History of Probability and Statistics SLVI. Measure into Probability: From Lebesgue to Kolmogorov,” Biometrika 87, no. 1 (2000): 145-156; Glenn Shafer and Vladimir Vovk, “The Sources of Kolmogorov’s “Grundbegriffe,” Statistical Science 21, no. 1 (2006): 70-98. 33 Erwin Schrödinger, "Are There Quantum Jumps? Part I." The British Journal for the Philosophy of Science 3, no. 10 (1952): 109-23. 34 David Cassidy, Uncertainty: The life and science of Werner Heisenberg (New York: Freeman, 1992). 35 Cathyrn Carson, Heisenberg in the Atomic Age: Science and the Public Sphere (Cambridge: Cambridge Univ. Press, 2010), 72.

58
Heisenberg’s ‘uncertainty’ was an act of measurement “involving interaction between a classical
measuring device and a quantum system to be measured.”36 This uncertainty required a view of
measurement that allowed “a (movable) cut between classical and quantum.”37
Heisenberg’s uncertainty was an acceptance that measurement of the quantum world
necessitated a reconciliation of different paradigms of knowing. Following the pre-established
tendencies of Weimar cosmopolitanism and transnational cultural exchange, the popular conception
of Heisenberg’s ‘uncertainty principle’ proliferated throughout the 1930s intellectual community.
The concept of indeterminacy had transcended the physics laboratory and permeated philosophy,
logic, economics, and psychology. Philosopher’s guilds, intellectual centers, and professional
organizations throughout Eastern and Western Europe and the United States engaged the problems
of materialism brought on by the destruction of absolute space and time. Indeterminacy was
manifest at every level of data and analysis.
***
In 1920s and 1930s London, the bright lights of modern cosmopolitanism and modern
science cast shadows of uncertainty over human experience and human knowing. The postwar
formation and revivification of the nation state with its electrified metropolitan capital and promises
of democratic order failed to distract people from the dark realities of modern empire and economy.
Political instability and poverty remained the prominent forces shaping their lives. Additionally, new,
everyday social changes, ranging from new technologies such as refrigeration and electricity, to new
cultural and political forms such as labor rights and secularization, unsettled societal norms. Social
36 Carson, Heisenberg in the Atomic Age, 72. 37 Carson, Heisenberg in the Atomic Age, 72.

59
change brought social anxiety, at the same time as early twentieth-century advances in the physical
and biological sciences opened new possible worlds and new scales of knowing from quantum states
to the microorganic universe. Fundamental beliefs about the known material world were in question.
These anxieties rippled through public imagination, colloquial language, and the formation of new
social institutions.
The mathematical statistics movement held its own distinct practices and conceptions of
uncertainty computation, and it belonged to a larger uncertainty crisis. In the growing empire of
probability, this was a dramatic moment of self-reflexivity that spread across disciplines and
contexts. In fact, distinct threads in economics, mathematical statistics, philosophy, and physics
shared a preoccupation with the ‘problem of probability’ in the interwar period. By the late 1930s,
fascism became the movement’s central political preoccupation just as the ‘certainty’ possibility was
more rigorously debated. The rise of fascism in Germany, Austria, and Poland later contributed to
the physical emigration of logical empiricists to the United States.
While the departments across University College London’s campus were diverse in their
pedagogical and political makeup, there was a clear engagement with various iterations and
interpretations of indeterminacy and uncertainty central to their research. UCL was founded in 1830
in the center of London as a secular alterative to Oxford and Cambridge. In 1904, UCL became
home to Francis Galton’s Eugenics laboratory, which would be inherited by Fisher ten years later. In
the 1930s, UCL brought in a number of German, French, and Eastern European intellectuals,
physicists, mathematicians, and logicians. This was part of a larger trend in the cosmopolitan
exchange of mathematical methods and philosophical query, and many at the University College
London were working on the problem of probability in their respective domains of study.
The problem with probability—whether or not newly formed statistical worlds (political,
economic, physical, biological) could and should be understood in probabilistic frameworks—

60
preoccupied public figures, logicians, psychologists, physicists, and statisticians. The question of
whether probability as a language and system of knowing should reign over these worlds was the
quandary for both the ivory tower and the corridors of power, and there was no consensus. The
‘probability problem’ was this: did the state of the lived world and the conflicting epistemological
systems for knowing the world fit with probabilistic reasoning, calculations, and valuations?
Accepting the probabilistic worldview meant that knowledge could never be absolute, as
‘knowledge’ would then be reduced to a translation of likelihoods. Rejecting the probabilistic
worldview also meant that knowledge could never be absolute, as it was believed that there would
then be no unified mathematical description by which to measure the world. It was this indeterminacy
about uncertainty that constituted the problem with probability, a double-layered doubt that
contributed to the larger cultural malaise of postwar European society.38
Beyond the elite logicians and scientists working in major cosmopolitan universities and
through the transnational philosophy of science movements, the problem of probability shaped
colloquial speech and the cultural imagination; it guided university-funded inquiry and was a widely
discussed political and public forum topic. For some, it was a language (albeit a poorly defined
language) befitting the anxieties of the postwar world; it offered a uniquely accurate description of a
social fabric fraying and disintegrating just as it was being sewn. Religious leaders recast
secularization as a rejection of ‘absolute knowing’ in favor of a faithless preoccupation with
probabilistic thinking. They used these questions to respond to the everyday living conditions of a
world shaken by war, as they reminded their congregations, of a “commerce halved in value, thirty
38 The role of probability in society has a much longer history in different domains. For foundational texts, see: Lorraine Daston, Classical Probability in the Enlightenment (Princeton: Princeton University Press, 1988); Gerd Gigerenzer, Zeno Swijtink, Theodore Porter, Lorraine Daston, John Beatty, and Lorenz Krüger, The Empire of Chance: How Probability Changed Science and Everyday Life (Cambridge: Cambridge University Press, 1989); Ian Hacking, An Introduction to Probability and Inductive Logic (Cambridge: Cambridge University Press, 2001).

61
million workers unemployed, vast numbers of people robbed of their life’s savings by catastrophic
monetary depreciations, foodstuffs burned or thrown into the sea in some places, people half
starving in others.”39 The literary world embraced the concept of probabilistic reasoning or
uncertainty in the psychological and emotional developments of their characters.40 These characters
embodied situated human questions of emancipation, disenfranchisement, poverty, and statehood as
part of the same condition of uncertainty.
The probability problem took many technical and cultural forms. Just in London alone, the
range of responses to the crisis of knowability can be seen in three exemplary texts. British
economist John Maynard Keynes 1921 A Treatise of Probability stated a total rejection of Bayes’
Theory of a priori data. It was an effort to break from classical probability theory more generally in
light of modern statistical methods, which rapidly popularized with mathematical statisticians and
political economists.41 Keynes’ discussions of data resonated with growing trends in the logical
empiricist movement, especially with the thought of the German philosopher Hans Reichenbach,
founder of the “Berlin Circle” that was disbanded following their persecution under the Third
Reich’s race laws. Shortly after Reichenbach was forced out of Germany in 1933, he published his
own Theory of Probability.42 Finally, in 1935, English physicist and mathematician, Arthur Eddington
offered a distinctive probability riddle in his text New Pathways in Science, a popular “laymen’s” book
that would circulate through London and world. His book was an extended reflection on the
multifarious uncertainties, irreconcilabilities, and areas of incalculability within quantum physics.
39 “Guiding the New Generation: Sir H. Samuel on Alliance of Philosophy, Religion, and Science,” The Guardian, January, 23, 1935. 40 Amy Bell, “Landscapes of Fear: Wartime London, 1939-1945,” Journal of British Studies 48, no. 1 (2009): 153-175. 41 John Maynard Keynes, A Treatise on Probability (London: Macmillan and Co., Limited, 1921). 42 Hans Reichenbach, The Theory of Probability. An Inquiry into the Logical Foundations of the Calculus of Probability, Transl. by E.H. Hutten and M. Reichenbach, Berkeley-Los Angeles: University of California Press. Originally printed in 1935 in German.

62
The ‘probability problem’ circulated through these texts was not just a confrontation of abstract
probabilistic reasoning, but an attempt to reconcile notions and philosophies of probability with
data. Keynes wrote A Treatise on Probability Theory before WWI, but only published it in 1921. In it,
Keynes argued that data, the material stuff that informs inductive statements, puts Bayesian logic to
question. For him, knowledge was deeply contextual, and modes of bounded reason could not
transcend material information. Bayes’ theory of a priori data was ill fitting in the world of material
information. With this view, he wrote about the certainty possibility:
The terms certain and probable describe the various degrees of rational belief about a proposition which different amounts of knowledge authorize us to entertain. All propositions are true or false, but the knowledge we have of them depends on our circumstances; and while it is often convenient to speak of propositions as certain or probable, this expresses strictly a relationship in which they stand to a corpus of knowledge, actual or hypothetical, and not a characteristic of the propositions themselves.43
Keynes’ treatise and engagement with the probability problem was specifically a study of the
relationship between probability theory and data. His ultimate rejection of the older conceptions of
the a priori data that “governed the minds of Laplace and Quetelet” was widely embraced by the
mathematical statistics movement. Their experimental designs, statistical estimation methods, and
data architectures existed in the same epistemic space between probability theory and empirical data
that Keynes aimed to confront. Throughout the 1930s, his text was read and circulated by R.A.
Fisher, the U.S. agricultural statisticians, Harold Jeffreys, and statistician Egon Pearson, son of Karl
Pearson, and Jerzy-Spława Neyman. For them it reaffirmed the power of statistical inference in
reconciling probability theory with the material world.
43 John Maynard Keynes, A Treatise of Probability.

63
Not everyone who engaged the probability problem abandoned Bayes. In fact, it was
precisely through the interwar uncertainty movement that the frequentist versus Bayesian debates
crystallized. Countering the more vaguely defined but palpable malaise of cultural uncertainty, the
logical empiricist movement desired to achieve precise definitions through rigorous engagement of
uncertainty’s various epistemological expressions. The movement was not necessarily unified in its
political or philosophical commitments, but the problem of probability was the central topic of
inquiry. In 1938, German philosopher Hans Reichenbach noted that the movement had, “spread all
over the world.”
American pragmatists and behaviorists, English logistic epistemologists, Austrian positivists, German representatives of the analysis of science, and Polish logisticians are the main groups to which is due the origin of that philosophic movement which we now call logistic empiricism […] and its representatives are to be found today in many other countries as well—in France, Italy, Spain, Turkey, Finland, Denmark, and elsewhere.44
As captured in Reichenbach’s statement, throughout the 1920s and 1930s the logical empiricist
movement held university strongholds in major European cities and in fringe organizations beyond
the university. These included work at University College London and the Warsaw School of Logic.
It was typical for logicians to make the transnational circuit to different universities. In his own
experience, Reichenbach spent a good deal of the 1930s at the University of Istanbul working on his
problem of probability. Throughout the 1930s he circulated three texts on the probability problem.
These are their English titles: Atom and Cosmos, The Theory of Probability, and Experience and Prediction.
Reichenbach’s 1935 German edition of The Theory of Probability began with a quotation from
Leibniz: “Les mathématiciens ont autant besoin d’être philosophes que les philosophes d’être mathématiciens.”
Reichenbach makes clear that while probability’s philosophical intricacies had long been a meeting
44 Hans Reichenbach, Experience and Prediction: An Analysis of the Foundations and the Structure of Knowledge (Chicago: The University of Chicago Press, 1938): 1938.

64
point for mathematicians and philosophers, who often wore both hats, the turn of the twentieth
century had catalyzed a revival of “the philosophical theory of the probability problem.”
Across the UCL campus from Karl Pearson’s statistics laboratory, in the school of
education, a recent Jewish émigré named Max Black was working on an article on the topic of
vagueness. Max Black was born in Baku, Azerbaijan, and spent a majority of his young life in London.
He attended Cambridge between 1925 and 1929, concurrently with Bertrand Russell and Ludwig
Wittgenstein, who were major influences on him.45 During his subsequent year at Göttingen he
wrote The Nature of Mathematics, an in-depth study of Bertrand Russell and Alfred Whitehead’s
Principia Mathematica and a survey of current trends in the philosophy of mathematics. Between 1936-
1940, Black taught at UCL’s Institute of Education before immigrating to the United States. The
problem of uncertainty had been addressed by philosophers since the fin de siècle as the problem of
‘vagueness’ in human language and reasoning.
U.S. pragmatist Charles Sanders Peirce first defined “vagueness” in the 1902 Dictionary of
Philosophy and Psychology. He wrote there, “A proposition is vague when there are possible states of
things concerning which it is intrinsically uncertain […] by intrinsically uncertain we mean not
uncertain in consequence of any ignorance of the interpreter, but because the speaker’s habits of
language were indeterminate.”46 Vagueness was the descriptor of philosophical complexity in the limits of
language.47 Preoccupied with the problem of quantum measurement, these philosophers took the
45 http://www.newworldencyclopedia.org/entry/Max_Black 46 Charles S. Peirce, “Vague,” in Dictionary and Philosophy and Psychology, J.M. Baldwin (ed.), New York: MacMillan, 748. 47 See: Richard Dietz and Sebastiano Moruzzi (eds.), Cuts and Clouds: Vagueness, Its Nature and its Logic (New York: Oxford University Press, 2010); Delia Graff and Timothy Willimson (eds.) Vagueness (Aldershot: Ashgate Publishing, 2002): Rosanna Keefe, Theories of Vagueness (Cambridge: Cambridge University Press, 2002); Rosanna Keefe and Peter Smith (eds.) Vagueness: A Reader (Cambridge: MIT Press, 1996); Matti Eklund, “Being Metaphysically Unsettled: Barnes and Williams on Metaphysical Indeterminacy and Vagueness.” Oxford Studies in Metaphysics 6 (2011).

65
position that uncertainty resided in the limits of human description. Throughout his lectureship at
UCL, Black immersed himself in the quandary of the ‘vague’ inspired by Bertrand Russell’s 1920s
work on The Analysis of Mind. Russell cast the analysis of mind as “an attempt to harmonize two
different tendencies, one in psychology, the other in physics.” Russell drew stark delineations
between the behaviorist psychologists’ unwavering “materialistic position,” where they “think matter
much more solid and indubitable than the mind,” against the impacts of relativity theory that had
“been making “matter” less and less material.”48 From either vantage, vagueness persisted in human
expression.
In Black’s work, ‘vagueness’ was an insurmountable characteristic of human language in the
same way as ‘indeterminacy’ was an insurmountable characteristic of all physical measurement.49
Citing English physicist Norman Robert Campbell, the crux of the argument was that “There is no
experimental method of assigning numerals in a manner which is free from error. If we limit
ourselves strictly to experimental facts we recognize that there is no such thing as true measurement,
and therefore no such thing as an error involved in a departure from it.”50 For many within the
logical empiricist movement, including Reichenbach and Black, vagueness described an inherent
condition of the world across the domains of linguistics and laboratory science. Engagement with
vagueness speaks to the efforts of the time to reconcile slippages across epistemological worlds, such
as psychology and physics, where practitioners witnessed the persistent and intractable phenomena
of uncertainty.
A participant in this relentless desire to clarify uncertainty terminology, British physicist Sir
Arthur Eddington spent a good deal of the 1930s making rallying cries throughout London about
48 Bertrand Russell, “Vagueness” Australasian Journal of Philosophy and Psychology 1 (1923): 86. 49 Max Black, “Vagueness. An Exercise in Logical Analysis,” Philosophy of Science 4 no. 4 (October 1937): 428. 50 Black, Vagueness, 429.

66
his probability problem. During this time, Eddington was a leading member of a philosopher’s guild
called the Aristotelian Society. Starting in 1920, the Aristotelian Society rented rooms on Gower
Street on the University College London campus to engage current and pressing issues in
philosophical thought. Throughout the late 1920s and 1930s the group worked on questions of
mind, determinacy, and probability, predominantly in reference to Bertrand Russell. In 1928,
epistemologist C.D. Broad worked with Keynes on the principles of probability and later developed
an entire program on indeterminacy with Eddington. Mathematical statisticians, including Harold
Jeffreys and H. Levy, contributed to the proceedings. The Aristotelian Society was a meeting place
for those concerned with the limits of probability as mathematical language, description, and mind.
Arthur Eddington’s 1935 New Pathways in Science broadcasted itself as a book written for the
“laymen” public. Newspaper advertisements for New Pathways described,
An entertaining wrangle between Maxwell’s Sorting Demon and Heisenberg’s Principle of Uncertainty is described. Determinism is compared with the gold standard of scientific law, while probability is described as the paper standard, until recently believed ultimately to be convertible into gold. Present-day physics is found to be off the gold standard.
In this quote the epistemic crisis in physics was likened to the economic crisis following the fall of
the gold standard, giving indication of the larger structure of feeling surrounding the philosophy
guilds in interwar Europe. Eddington also put forth probability riddles that were in popular
circulation, especially his 1919, “A, B, C, D probability problem.” His probability riddle widely
circulated in London and continues to be used in probability debates and pedagogical design to this
day:
If A, B, C, D each speak the truth once in three times (independently), and A affirms that B denies that C declares that D is a liar, what is the probability that D is speaking the truth?

67
Eddington’s response to the more general ‘probability problem’ was less vague than the logical
positivists; he drew clear delineations in what he deemed to be a haze of uncertainty. He advanced a
strictly frequentist interpretation of probability. “The common idea is that, since probability signifies
uncertainty, a statement like the foregoing which contains two uncertainties ought to be reducible to
simpler terms. But numerical probability is not an uncertainty; it is an ordinary physical datum—the
frequency of a certain characteristic in a class.”51
The American mathematical statisticians at this time took a stronger stance on the question
of indeterminacy by simply skirting many of the complexities within the uncertainty crisis. They
were eager to assert new statistical methods as the connective tissue between theoretical and
experimental physics, between physics and society, and between epistemic reasoning and the
ontological world. These mathematical designers believed that statistical computation methods
offered the most apt description of the real world, and that these methods could manage uncertainty
across the quantum, molecular, classical, and human scales. U.S. mathematical statisticians upheld
the statistical method as the best way of addressing both indeterminacy and (un)certainty, which
were frequently blurred together. They saw the statistical method as operable across scales of
measurability, whether at the quantum scale, the molecular scale, or from 10,000 feet above ground.
Statistical methods were asserted as the dominant epistemological framework for measuring
social and physical worlds. Mathematician Warren Weaver, who would serve as central command for
the applied mathematics group during WWII, made the resounding declaration that: “the first part
of the twentieth century […] should be known as the reign of probability.”52 In 1931, U.S.
51 Sir Arthur Edington, New Pathways in Science (Messenger Lectures delivered at Cornell University in April and May 1934) 52 Warren Weaver, "The Reign of Probability." The Scientific Monthly 31, no. 5 (1930): 466.

68
mathematician H.L. Reitz was quoted in the Journal Science stating, “the principle of uncertainty in
relation to either the position or the velocity of an electron is a statistical statement.”53 Building on
Weaver’s declaration, he stressed that the early twentieth century should be characterized not by
paradigm shifts in the physical sciences but by the rise of the statistical method. Just as he pondered,
“Is the statistical method in science simply a substitute for the mechanistic method or a last resort
when the situation becomes so complicated that we give up making predictions about each
individual item by any calculable process?”
As broadly sketched in this prologue, at the turn of the twentieth-century, a computational
crisis in agriculture and global trade led to a grasp for control over extant and newly designed
information structures. This occurred at the nexus of rising trends in axiomatic probability analysis
and statistical oversight, the convergences of which were generative of a new conception of
information: probability data. The larger tendency towards mechanizing probability or uncertainty in
context of statistical experimentation was then made possible by the transnational agricultural
experimental stations, which were positioned to command large bodies of information under the
conditions of a growing industrial agriculture, and to exchange this information, data, and methods
to other laboratories through new global trade systems. This early twentieth-century computational
crisis, and emergent trends of (un)certainty work, is not a neat story of a single institution or
individual, or even a discipline, that drove a new computational movement. What I described here is
cataclysm of crises in statistical governance, physics, and philosophy that propelled forward a new
regime of calculation and promise of uncertainty management. The drive to design certainty is
thereby rooted in crisis and is a multinational and multidisciplinary enterprise. In the next two
53 Weaver, "The Reign of Probability," 470.

69
chapters, I will detail the design and implementation of two data architectures, and their real-world
applications, within this larger movement.

70
Chapter 2: Confidence
1929
The Origins of Confidence Computing in Warsaw, Poland
CONFIDENCE is the first computing concept explored in this dissertation and is followed by two
more: control and uncertainty. The computing concept ‘confidence’ is an expression of trust that a
logician or statistical thinker holds in their experimental design and analysis. It is also an expression
of trust that the public holds in numerical-economic informational systems and technologies. In the
1920s, statistical thinkers designed new data architectures to quantify and mechanize confidence
logics in data management. This chapter details the first numerical calculations for the confidence
Figure 8: Image from: Henryk Arctowski, “Agriculture and Landownership in Poland,” Geographical Review 11, no. 2 (1921): 173.

71
interval parameter in 1929 Warsaw, Poland. After WWI, Poland became a sovereign nation state for
the first time in 150 years and the dreams of a great agrarian nation state were complicated by the
realities of extreme poverty, ongoing border disputes and turmoil, Jewish emigration and forced
removal policy, inhumane labor conditions, the circulation of foreign capital, and efforts to stabilize
paper currency. In order to establish public ‘confidence’ in growing western pricing logics, paper
currency, and quantitative oversight more generally, fledgling agricultural administrative bodies
turned their attention to “improving statistics.”
This turn towards emboldening quantitative oversight in agriculture fueled the global
circulation of new mechanized logics and data. In Poland, the newly formed Bureau of Agricultural
Economics employed a fringe-computing laboratory at the Nencki Institute for Experimental
Biology, a biometrics center, to compute tables for a “small farm problem,” deemed to be the
central issue in managing Polish agriculture. There the first numerical calculations for the ufności
przedzial or confidence interval parameter were conducted. They were handwritten on graphed
paper and calculated using an Odhner arithmometer machine. These calculations served as
numerical limits for ‘uncertainty’ within a statistical experiment and were quantitative expressions of
‘confusion’ that the statistical thinker—here Wacław Pytkowski—held in his method of
interpretation.
In 1929, agricultural workers in Warsaw reconfigured the economic and statistical concept of
‘confidence’ into a method of analysis that established limits for uncertainty in experimental design.
In this context ‘confidence’ became a mechanized computing concept; what I call ‘confidence
computing’ is a bounded philosophy of data production and analysis that galvanized agricultural
management as (un)certainty work. In this historical and geographical context, (un)certainty work
served the conflicting political aspirations of preserving peasant farming as the underpinning notion
of Polish sovereignty, while also aspiring to make the Polish economy legible on the world stage as

72
part of a growing western pricing geopolitics. In the period between 1929 and 1939, a confidence
computing collective emerged around Warsaw and nearby Lwów that integrating new methods of
interpretation, inspired by rising trends in axiomatic probability theory, with tacit agricultural work.
Applications include: Polish labor health analysis, virulent studies, sugar beet planning, and beyond.
The Confidence Crisis in Poland
In 1918 the dissolution of the Prussian empire and the end of the German war effort led to Poland
achieving national sovereignty for the first time in 150 years. Immediate efforts were made to
stabilize a democratic government and a centralized national economy. The initial move for a
provisional democratic government was followed by a decade of shifting political initiatives, and
Poland’s interwar borders remained unstable. There were uprisings and violent conflict along the
German and Czech borders, territorial disputes with Ukrainians and Lithuanians, and in 1920-21,
war broke out between the Poles and the Soviets.1
Throughout this time, the Polish people maintained a provisional government with a
working constitution and voting apparatus. In 1926, a coup d’état catalyzed a break from this initial
provisional government and secured Józef Piłsudski’s regime, which has been described as a “semi-
constitutional guided democracy.’”2 Poland’s achievement of nominal sovereignty in 1918 did not
usher in an age of peace and stability; it remained subject to ongoing war, violence, and political
turmoil and the future of the new nation was radically uncertain.
1 Michael Bernhard, “Interwar Poland,” in Institutions and the Fate of Democracy: Germany and Poland in the Twentieth Century (Pittsburgh: University of Pittsburgh Press, 2005): 78. 2 Bernhard, “Interwar Poland,” 82.

73
Against this backdrop of shifting political borders and contentious efforts to stabilize a
voting government, in the early 1920s Poland was identified by Western analysts and statisticians to
be a center of the confidence crisis. In the last chapter, I defined the transnational confidence crisis
as a distinct period between 1900-1940 characterized by widespread anxiety and flagging trust in
nineteenth-century modes of statistical governance and global trade. The confidence crisis catalyzed
an effort to establish public trust in both new and old systems of numerical oversight. This was
especially pronounced in 1920s and 30s Poland, where the landscape was being radically changed by
internal statistically-driven rehabilitation efforts and external monetary and economic forces.
Foreign capital began to circulate in Poland at the same time as Poland established a new
national paper currency and new banking institutions to build confidence in its value. Throughout
interwar Europe, confidence was the lubricant for circulating paper currency, as seen in this
description of the German mark:
The success of the rentenmark, backed by no liquid assets, is explained chiefly by the extraordinary growth of public confidence that it was a good currency and would not depreciate. This confidence so greatly reduced the desire to spend money quickly that the velocity of circulation was radically diminished. This confidence was strengthened by the refusal of the Rentenbank in January to grant additional credits to the Government, by the courageous restraint exercised in granting Reichsbank and Rentenbank private credits, and by the Expert Committee’s announcement (on February 2, 1924) that it would propose a gold bank of issue which should provide for the redemption of rentenmarks.3
Here the rentenmark is described as an entity that does not have an underlying asset and that is
valued through public participation in its circulation. Here confidence in paper currency is described
as an affective belief in the future value of the currency, that would be manifest in public spending
habits and reinforced by institutional policy.
3 Joseph S. Davis, “Economic and Financial Progress in Europe, 1923-1924,” The Review of Economics and Statistics 6, no. 3 (1924): 226.

74
Throughout the interwar period, Poland’s paper currency, the złoty, meaning the “gold,” was
a central inquiry in confidence analysis. The currency was in a constant state of fluctuation. In the
1920s it was afflicted by extreme inflation—it took hundreds of thousands of złoty to equal the U.S.
dollar. Political economists and statisticians characterized this period of inflation as a crisis of
confidence. Despite Poland’s hyper-inflation, throughout the 1920s it was considered by foreign
interests to be an incredibly valuable territory and investment. The new country became a popular
site of study by Anglophone and U.S. analysts that centered on public confidence-building in paper
currency and global trade. They were intrigued by the extreme currency inflation across Eastern
Europe more generally, in countries like Finland, Latvia, Esthonia, and Czechoslavakia. But Poland
was seen as an ideal confidence crisis laboratory because it was a new, relatively-stable country with
an abundance of natural resources. They contrasted the potential of this new country with Austria’s
much-reduced resources, and Germany, Hungary, and Bulgaria’s “overhanging cloud of
reparations.”4 Due to its strong agricultural production, the Republic of Poland was also deemed a
self-sustaining country.5 The land, resources, and geographical location attracted serious interest
from Britain, the United States, and its surrounding countries especially Germany and Soviet Russia.
This transnational preoccupation with Polish land and resources would only intensify under the
growing shadows of Germany’s Lebensraum and Soviet collectivization programs.
Situating currency and trade within the larger political realities of the Polish terrain, analysts
determined that, “The whole situation was such as to undermine confidence in the future of the
currency.”6 These outsider statisticians and economists drew correlations between shifting political,
4 E. Dana Durand, “Currency Inflation in Eastern Europe with Special Reference to Poland,” The American Economic Review 13, no. 4 (1923): 593. 5 Henryk Arctowski, “Agriculture and Landowndership in Poland,” Geographical Review 11, no. 2 (1921): 166. 6 Durand, “Currency Inflation in Eastern Europe with Special Reference to Poland,” 603.

75
economic, and environmental conditions and the people’s “confidence” in monetary systems. Still,
in their analysis, they treated Poland as a unit, with a homogenous landscape and people. Public
‘confidence’ referred to a general public known only by their market participation. A 1936 reflection
on the interwar period linked the failure of new monetary systems to flagging Polish confidence.
The author writes that, “It was inevitable in a country which had so recently experienced paper-
money inflation that a crisis in confidence would eventually be engendered by issues of inconvertible
paper money,” In turn, this produced “an effect on economic conditions and on people’s
confidence in the złoty.” For outsider technocrats, the new Polish economy became a laboratory for
understanding the confidence crisis.
Internally, for the Polish elite, the confidence crisis pointed to the instability inherent in the
project of cultivating a sentiment of Polish nationalism attached to new market and finance
structures. Since the early 1920s, the heterogenous Polish population did not uniformly embrace the
need for or trust in western pricing logics and foreign capital, or for generating capital by producing
beyond the requirements of self-sufficiency. In referring to the initial 1921 elections that put
Piłsudski in power, a U.S. economist remarked that, “The whole situation was such as to undermine
confidence in the future of the currency […] it will take years to restore the confidence of the
peasant in the advantage of producing a surplus beyond his own needs.” Due to the noted resistance
of agricultural workers and flagging public confidence in paper currency, administrators, industrial
heads, and entities such as the Finance Minister, went to work to build confidence in the złoty and
in the tenets of western price mechanization more broadly.
To calculate a people’s confidence in interwar Poland, analysts assumed a shared
consciousness in national identity that did not exist. But more than anything, the Polish people’s lack
of confidence was an outcome of surviving the labor and living conditions of a newly formed and

76
patchworked country. The Polish landscape and Polish labor conditions, and therefore the Polish
people, were deeply heterogeneous and still suffering the continued impacts of WWI. After 1920,
Poland was still fractured into former Russia Poland, former Prussia Poland, and former Austro-
Hungarian Poland. Within this general political landscape, after 1918, the country was divided into a
mosaic of new provinces. As depicted in the heading map, these boundaries were drawn by various,
sometimes conflicting interests.7 In some cases the provinces were determined by military oversight.
Sometimes the crop boundaries of agricultural production—such as sugar beet regions – were used
to demarcate the territories. Other borders were established through international sovereignty
oversight such as the Peace Conference of Paris. Throughout the interwar period, the borders of
Poland remained in flux, a radical instability reflected in efforts towards statistical oversight.
Efforts to quantify Poland involved efforts to stabilize immigration and emigration statistics,
population demographics, and labor statistics. Across the new province lines, Polish people were in
a constant flux of internal migration movements as they sought after livable conditions. The peasant
farming class was the most affected as they held little rights to designations of land ownership in the
transitions from empire to nation-state, even though it was the source of their livelihood. Systematic
internal migrations were also proposed to “balance” population densities—these proposals sought
to relocate 2,000,000 to 3,000,000 people from one part of the country to another.8 Throughout the
1920s, mass immigration and repatriation, as well as a steady stream of emigration contributed to a
fluctuating people.9 This was documented in statistical population assessments and corresponding
immigration and emigration policies. Throughout the 1920s, the population was deemed too small,
7 Arctowski, “Agriculture and Landowndership in Poland,” 163. 8 Arctowski, “Agriculture and Landowndership in Poland,” 170. 9 Office of Population Research, “Demographic Problems of Poland,” Population Index 5, no. 4 (1939): 233-238.

77
with death rates and emigration outweighing births. Into the 1930s, state entities determined an
overpopulation problem in Poland.10 After 1936, in the name of this population problem, there were
increased proposals for the systematic and forced emigration of Jews in an effort to build towards a
racially- and religiously-defined “national unity.”11
Initiatives to rapidly design a standard calculation of Polish labor failed to capture what was
a dynamic labor population. Despite the high population density of Poland’s metropolitan centers in
Warsaw and Cracow, the peasant farming class comprised a huge portion of the working population.
For confidence builders, they were not easy to count due to their geographic dispersion across
provinces and rural farm areas. For the same reason of geographical distance, these workers were
also in a separate class from workers in the metallurgy and textile industries. This latter set of
workers were able to organize through labor initiatives that were occurring on the international stage
that had a Polish delegation. In the early 1920s, labor efforts such as the International Labor Office
helped facilitate state actions in Poland towards work-shift organization delegated through the
Ministry of Labor and Social Assistance and the Ministry of Industry and Commerce in Poland.12 In
the year 1920 alone, 250,000 textile workers and miners conducted around 300 individual strikes
towards establishing just and livable working conditions in the new Poland.13
10 This is emblemized by Max Weber’s sociology, see: Max Weber, The Protestant Ethic and the Spirit of Capitalism (New York: Charles Scribner’s Sons, 1930). 11 Harry Schneiderman, “Poland,” The American Jewish Year Book 39 (Sept. 1937-Sept. 1938); In 1936, the proposed solution of Poland’s economic and social problems via the expropriation of the Jews was adopted as a government policy as part of the platform of a proposed new party calling itself “Camp for National Unity.” 12 The International Labor Office held International Labor Conferences with Poland in attendance since its commencement conference in 1919 Washington, D.C.; See: “Industrial Relations and Labor Conditions,” Monthly Labor Review 15, no. 5 (1922): 27-43; “Labor Organizations,” Monthly Labor Review, 24, no. 4 (1927): 74-76; “Directory of Labor Officials in United States and Foreign Countries,” Monthly Labor Review 19, no. 1 (1924): 245-266. 13 “Strikes and Lockouts,” Monthly Labor Review 13, no. 1 (1921): 218.

78
At the same time as the peasant farming class was not able to organize their labor in the
capacity of the metallurgical workers, their farm land also became the primary site for the managerial
overhaul. In response to the confidence crisis in Poland, agricultural became the primary focus of a
growing statistical oversight. New centralized planning centers were formed, just as older Prussian
institutes were repurposed. The larger agrarian landscape was drawn into composite units of rational
production, usually delimited by crop type. These provincial bounds outlined nodes of analysis used
in measuring gross domestic product and producing price indices. Price indices were the rational
currency desired to make Poland legible to confidence builders to the transnational stage as part of
an expanding world economy. Price indices were thereby needed towards a Polish nationalism and
as such, crop production needed to be counted. Polish provinces were then designed as regions of
calculation, parameters drawn to enumerate populations, assess rural density, and quantify material
resources and food crop production.
This sense of Polish nationalism hinged on organizing farm data, but interest in this data
extended beyond the Polish borders in the context of numerically driven global trade expansion.
Already in 1918, the American Delegation to the Peace Conference commissioned analysis on
Poland, to estimate populations, yields, and crop production using a long survey of former Russian,
Prussian, and Austrian data, with consideration of the current political reforms. An analyst from
Lwów described the notion of progress associated with industrial land reform in Poland:
The land-reform bill will specially aid in the opening of the north-eastern provinces—now backward and sparsely populated—to the more enterprising and progressive farmers and peasants of Galicia. The peasants, however, cannot settle in the devastated country without provision being made for housing and supplying them with the necessary farm stock and implements. If agricultural machinery, tractors, and farm animals were available, the migration of the people from one part of the country to another could be organized on a large scale, and the improvement would be rapid. Thus the progress made will depend primarily on the means placed at the disposal of the Polish Government.

79
Here the analyst described the “backward and sparsely populated” farm workers in contrast with the
“enterprising and progressive farmers of Galicia.” His proposal was to redistribute the people
through systematic internal migrations, so that the new provinces would have an equal distribution
of producers and would be easier to count. Polish confidence—it was imagined—would be
established through designing a landscape of neatly distributed populations and predictable farm
production. Descriptions of Polish progress and reformation generally, were rooted in land reform,
as agriculture was the largest producer of Polish commodities on the world stage. Postwar Poland
comprised a heterogenous landscape and diverse people subsumed under an approximated
imagination of national-economic identity. In designing this new configuration of the Polish
economy, a new statistics went to work to garner confidence in its borders.
Confidence Computing as State Making and Dissent
Against the backdrop of political and economic uncertainty shaping the New Republic of Poland,
and in the larger context of rational land reform, a collective of philosophers, statisticians, and
agrarian workers advanced a new conception of agricultural work rooted in mathematical statistics.
In 1929, the first numerical calculations for a new method of calculation—the ufności przedzial or
confidence interval, were conducted in Warsaw, Poland in the context of assessing what they called
the ‘small-farm problem.’ The confidence interval was an effort to give logical-mathematical
structure and precise, computational meaning to the notion of confidence. The confidence interval
reconfigured ‘confidence’ from its vague affective and economic descriptions into probability
measures and a mode of calculation.
This new method was also designed in the context of the Anglophone mathematical
statistics movement, but in its production, it was unique to Polish soil. In 1929, then 35-year-old

80
Jerzy Spława-Neyman had been living in Poland for ten years, working first as a field statistician in
Bydgoszcz and then as a professor through the Nencki Institute of Experimental Biology. In the
early 1920s Neyman visited London to work with Karl Pearson and had established a close
friendship with his son Egon Pearson. Their ongoing correspondence throughout the interwar
period reflects an effort to differentiate themselves from the older generation of mathematical
statisticians by designing new methods of calculation reflective of recent trends in axiomatic
probability theory and set theory, and responsive to their present-day work and living conditions. In
1929, Neyman gave a lecture at the University of Warsaw, on what he proposed as ‘confidence
intervals’ that could delimit intervals of certainty and uncertainty in statistical work. This design
taken up by his student Wacław Pytkowski.14
The first numerical calculations for the confidence interval were part of a growing dissent of
the routines of thought and practice attributed to the Anglophone school of mathematical statistics.
This tendency to put mathematics to questions circulated among a much larger community of
statistical workers, who oversaw applications in agriculture, biometrics, and social statistics. Their
epistemological practices were influenced not just by mathematical statistics, but by the foundational
crisis in mathematics led by the French and German Schools, and the Warsaw-Lwów school of
logic. I refer to this collective as “confidence computers.” Their work was empirical, rooted in
analyzing scientific and social information such as mapping potassium levels in the soil, sugar beet
harvesting, analysis of sickness experienced in Polish workers and on. Their work was also
theoretical—within their field statistics they confronted the foundational and paradoxical logics in
probability theory. This computing collective advanced a culture of dissent and philosophical
14 I do not have a transcript of the lecture, but Pytkowski references it, see: Wacław Pytkowski, “The Dependence of the Income in Small Farms upon their Area, the Outlay and the Capital Invested in Cows (English Summary),” Bibljoteka Puławska 34 (1932): 51.
81
existentialism in the service of a dynamic movement to imagine sovereign Poland as a modern and
prosperous agrarian nation state. The ambitions of their enterprise were part of a larger context of
the transnational philosophy of science movements and scientific institutionalization occurring after
WWI. Warsaw, in particular, was not just a central site for agricultural reform but a city that prided
itself on scientific cosmopolitanism.
Following WWI, Polish nationalists had moved to strengthen its scientific and technological
powers in Warsaw. Science institutes founded or reformed during this time—most were formerly
Prussian or German—integrated global trends in data production and statistical methods into their
establishments. In 1918, the Warsaw-based Polish Academy of Sciences founded the Nencki
Institute for Experimental Biology at the University of Warsaw, with hopes of becoming a world-
leading center of biometric research. Biometric research centered data and methods of calculation as
part of a new scientific epistemology within eugenics, public health, and medicine.15
The other major site for new methods was agricultural production. Following WWI,
Poland’s State Research Institute of Rural Husbandry, which had existed in some form for over a
hundred years, made moves to consolidate agrarian oversight. 16 Crucial to this trajectory was the
1926 creation of the Department of Agricultural Economics (DAE) in Warsaw to be led by
Franciszek Bujak, who is remembered as the first Polish economic historian.17 The creation of the
DAE was a clear effort to reform the agrarian economy through comprehensive data collection and
statistical analysis. Upon accepting his DAE role, Bujak immediately facilitated a data-collection
15 Katrin Steffen, "Experts and the Modernization of the Nation: The Arena of Public Health in Poland in the First Half of the Twentieth Century." Jahrbücher Für Geschichte Osteuropas, Neue Folge, 61, no. 4 (2013): 574-90. For an account of the coevolution of mathematical statistics and biometrics, see: Porter, Karl Pearson. 16 “150 Years of Agricultural Research in Puławy,” Institute of Soil Science and Plant Cultivation State Research Institute, accessed April 8, 2017, http://www.iung.pulawy.pl/eng/images/pdf/folder_eng_sepia.pdf. 17 “150 Years of Agricultural Research in Puławy,” 8.

82
campaign for a Polish “small-farm analysis” from which the first numerical calculations of
confidence intervals would be made.
While Bujak was not himself a theoretical statistician, his economic work was known to the
global confidence knowing movement, which was defined by the efforts of political economists and
statisticians to mechanize processes by which large amounts of data were collected, quantified, and
managed. As already discussed, throughout the 1920s, an international campaign of agrarian
economists moved to standardize data from world economies through the creation of price-tables.18
Bujak’s price-tables for Poland were widely circulated and revered by agrarian economists in
Western Europe and the United States as he produced impressive records purportedly dating back
to the 12th century.19 Price indices were a highly-valued type of confidence data that burgeoned after
WWI, in efforts to stabilize national identity as a function of economic strength. Discourse about
the larger confidence crisis often invoked volatile prices, as measured by fluctuating price indices, as
the core indicator of flagging public confidence.
In tension with efforts to standardize price metrics on the international stage, Poland’s
agrarian economy comprised a heterogeneous patchwork of peasant farms managed provincially by
culturally and ethnically diverse peoples. The State Research Institute sought to enumerate the crop
and material production of these farms, in order to translate those measures into price indices. This
involved remapping Poland’s agricultural districts, (as mentioned above), and consolidating farm
18 See: Arthur H. Cole and Ruth Crandall, "The International Scientific Committee on Price History," The Journal of Economic History 24, no. 3 (1964): 381-88; F.A. Pearson and G.E. Brandow, "Agricultural Price Statistics in the United States and Abroad," Journal of Farm Economics 21, no. 4 (1939): 788-98. For a look at the impact of the consumer price index mechanism in the U.S. context, see: Thomas Stapleford, The Cost of Living in America: A Political History of Economic Statistics, 1880-2000 (Cambridge: Cambridge University Press, 2009). 19 For further detail on Bujak’s price theories and work in economic history, see: Matthew M. Fryde, "Recent Studies in Polish Agrarian History," The Polish Review 7, no. 4 (1962): 37-54; Anita Shelton, "Franciszek Bujak (1875–1953)," in Nation and History: Polish Historians from the Enlightenment to the Second World War, ed. Peter Brock, et. al. (Toronto: University of Toronto Press, 2006), 280-96; Jan Rutkowski, "Les Centres D'études D'histoire économique En Pologne," Annales D'histoire économique Et Sociale 4, no. 13 (1932): 59-64.

83
data. After creating the newly formed Department of Agricultural Economics, the State Research
Institute acquired a number of regional agricultural experiment stations, including the Research
Institute in Bydgoszcz and the Botanical and Agricultural Experiment Station in Lwów.20 These two
experimental stations provided important statistical data, or what was called, materiały, for early
confidence computing analysis.21
The 1920s efforts to formalize peasant farm production metrics generated significant cultural
tensions between farm workers and newly formed initiatives. But while there were tensions, there
was not a stark bifurcation, and in fact many people working in the new statistics domains strongly
identified with peasant farming. Like the larger population in Poland, these planners were culturally
and ethnically diverse and held varying personal stakes in Polish nationalism. Notably, Franciszek
Bujak maintained that it was his ties with peasant farming that provided the epistemic basis of his
economic work.22 Many of the workers at the newly formed state institutes and agricultural
experimental stations had grown up on farms, where they continued to work as they pursued
university education in Cracow, Warsaw, Bydgoszcz, and Lwów. Their work reflected a sentiment of
working towards a new Poland, while trying to preserve the traditions of peasant farming. Polish
modernism therefore was not situated antithetically to regional production. Rural agrarianism was
upheld as the means by which Poland would become a powerful and independent nation state.
The Polish intelligentsia proved another influential group in the formation of Warsaw’s
scientific establishment and in the confidence computing movement. Beginning in 1921, a collective
20 “150 Years of Agricultural Research in Puławy.” 21 Jerzy Neyman, “Przedmowa” to Wacław Pytkowski, “Wpływ Obszaru, Nakładu I Kapitału Kròw Ta Dochód Surowy W Drobnych Gospodarstwach,” Biblojoteka Puławska, 34 (1932). 22 Helena Madurowicz-Urbańska, “Der Beginn des sozial- und wirtschaftsgeschichtlichen Faches in Polen: Die Schule von Franciszek Bujak (1875-1953),” VSWG: Vierteljahrschrift Für Sozial- Und Wirtschaftsgeschichte 75, no. 4 (1988): 483–502, here 483.

84
of university philosophers and logicians established themselves as the Warsaw School of Logic, a
philosopher’s guild between the University of Warsaw and the University of Lwów.23 Distinct from
the agricultural economists and biometricians, this group advocated for an engagement with
philosophical logic, largely preoccupied with recent advances in set theory from France and
Germany. The Warsaw School of Logic was an enterprise of a distinctively Polish sensibility.
Ultimately, the confidence computing work central to this story did not occur in the lofty towers of
the academy but in the everyday practices of seed counting, in which questions of mathematical
logic studied within university walls converged on the new designs for local agricultural reform.
The Warsaw School of Logic and the Crisis of Foundations
In the 1920s, The Warsaw School of Logic at the University of Warsaw was completely
enthralled with Théorie des Ensembles or Set Theory logic.24 Set theory is a mathematics of organizing
mathematical objects into sets—a framework for describing mathematical objects that could
potentially be applied across various fields of mathematics.25 In the late nineteenth and early
twentieth century, set theory was a movement towards a universal system of mathematical logic
catalyzing a crisis of consciousness. This period in mathematics is also known as “the foundations
crisis,” as the new drive towards a universal logic of mathematics yielded just as many foundational
23 For one of the first English survey histories on interwar Polish mathematics, see: Roman Murawski, The Philosophy of Mathematics and Logic in the 1920s and 1930s in Poland (Heidelberg: Spring Basel, 2014). 24 Murawski, The Philosophy of Mathematics, 33. 25 See: John Mayberry, “On the Consistency Problem for Set Theory: An Essay on the Cantorian Foundations of Classical Mathematics,” British Journal for the Philosophy of Science. Two foundational philosophical texts in théorie des ensemble include: A.N. Whitehead, “Introduction Logique a la Géométrie,” Revue de Métaphysique et de Morale 15, no. 1 (1907): 34-39; Bertrand Russell, “La Théorie des Types Logiques,” Revue de Métaphysiqe et de Morale 18, no. 3 (1910): 263-301.

85
contradictions as the bad old system it was supposed to supplant.26 The time period would soon
come to be identified with Hermann Weyl’s 1921 paper, “On the foundational crisis in
mathematics,” in which he dramatically likens the logical crisis in set theory with the turmoil of the
postwar world: “the antinomies of set theory are usually regarded as border skirmishes that concern
only the remotest provinces of the mathematical empire that can in no way imperil the inner
solidarity and security of the empire itself or of its genuine central areas.”27 Weyl’s work was written
in the postwar German context and so inspired by the larger crisis of confidence in the shaky
promises of modern progress. In the following passage, he explicitly uses ‘paper currency’ as a
metaphor for the classical use of existential statements:
The point of view sketched above only expresses the meaning which the general and existential propositions in fact have for us. In its light mathematics appears as a tremendous “paper economy”. Real value, comparable to that of food products in the national economy, attaches only to the direct, simple singular; general and existential statements participate only indirectly. And yet we mathematicians seldom think of cashing in this “paper money”! The existence theorem is not the valuable thing, but the construction carried out in the proof. Mathematics is, as Brouwer sometimes says, more activity than theory. 28
A leading logician at the Warsaw school, Wacław Sierpiński, took on the crisis of
foundations in mathematics as a core component of his research and pedagogical initiatives.
26 The most commonly referred to paradoxes in set theory, are ascribed to Georg Cantor, Bertrand Russell, and Richard. For a description of Bertrand Russell’s paradox and extensive bibliography on the foundational crisis in mathematics, see: Stephanie Aleen Dick, “After Math: (Re)configuring Minds, Proof, and Computing in the Postwar United States,” (PhD diss., Harvard University, 2014): 23. For long-view histories on the emergence of set theory and its discontents, see: Ivor Grattan-Guinness, The Search for Mathematical Roots, 1870-1940: Logics, Set Theories and the Foundations of Mathematics from Cantor through Russell to Gödel (Princeton, NJ: Princeton University Press, 2002); Joseph Dauben, Georg Cantor: His Mathematics and Philosophy of the Infinite (Princeton, NJ: Princeton University Press, 1999); David Rowe, “Anxiety and Abstraction in Nineteenth-Century Mathematics,” Science in Context 17, no. ½ (2004): 23-47. 27 Translated quote from: Hermann Weyl, Selecta Hermann Weyl, Birkhäuser, Basel, 1956; quote found in: Dirk Van Dalen, “Hermann Weyl’s Intuitionistic Mathematics,” The Bulletin of Symbolic Logic 1, no. 2 (1995): 147. 28 Dirk Van Dalen, “Hermann Weyl’s Intuitionistic Mathematics,” The Bulletin of Symbolic Logic 1, no. 2 (1995): 147.

86
Beyond this, Sierpiński founded the journal Fundamenta Mathematicae, which galvanized a singular
focus on set theory. The preface to the journal’s first edition began: “Lorsqu’on conçut en 1919 le project
hardi d’éditer un périodique consacré exclusivement à la Théorie des Ensembles et à ses Applications.”29 This
interest in set theory was underpinned by a preoccupation with the philosophical concept of
correspondence: the idea that ‘truth’ was a relational property.30 Distinct from the positivism of the
Vienna circle, the Warsaw logicians were not preoccupied with a one-to-one correspondence of
mathematical description to real world objects but with examining the relations between mathematical
objects.31 They maintained that mathematical architecture deserved to be studied in its own right as
“[mathematical] logic [was] an independent and autonomous mathematical discipline and not only a
mathematical method or tool.”32 The Warsaw School of Logic aspired to build a distinctive
community of philosophers and mathematicians through a shared engagement with pure
mathematical rationality. They believed this would constitute a thriving Polish intellectualism and
culture known throughout the world.
In 1923, Sierpiński had tasked his current student Jerzy-Spława Neyman (at that time, a new
arrival in Warsaw) with a query about measurable set theory. At that time in France, mathematician
Emile Bórel and his student Henri Lebesgue had surmised that a closed empty set in Euclidean
space could be measured by summing the series of intervals belonging to each point within the set.
So Sierpiński asked Neyman if it was possible to measure a series of intervals covering the set E and
find that the sum of their lengths is smaller than infinity or the measure of the outer bounds of the
29 “Préface À La Nouvelle Édition,” Fundamenta Mathematicae 1 (1920): V-VI. 30 “The Correspondence Theory of Truth,” Stanford Encyclopedia of Philosophy, accessed December 19, 2016, https://plato.stanford.edu/entries/truth-correspondence/. 31 Michael Friedman, "Hempel and the Vienna Circle," in Logical Empiricism in North America, ed. Gary L. Hardcastle, et. al, (Minnesota: University of Minnesota Press, 2003): 94-114. 32 Murawski, The Philosophy of Mathematics, 32; Georg Cantor, “Beiträge zur Begründung der transfiniten Mengenlehre” Mathematische Annalen, 49 (1897): 207-246.

87
set E. Sierpiński’s question may have been intended as a reductio ad absurdum but Neyman proved it in
the positive.33 He manipulated what was understood as the outer bounds of the set E by covering it
with another open set H, and thereby introduced ambiguity about which numbers belonged to
which set thus making possible a sum of numbers smaller than infinity.
At the core of his proof, Neyman revealed ambiguity in the established precepts of
measurable set theory. This challenged the dominant preconceptions of the French School and
showed that uncertainty exists in even the staunchest of mathematical truisms. Neyman’s impulse to
test the limits of the bounded set, part of the larger movement of confronting mathematical
foundations, captures a defining feature of Polish confidence computing. By virtue of the Warsaw
School’s dominance in the University, the language of axiomatic probability theory was present in
the minds of Warsaw’s mathematicians and statistical workers who trained there. As will soon be
discussed, this informed their movement to translate points of unknowability in statistical work into
probabilistic language.
Neyman worked to establish an applied statistics enterprise in Warsaw. In 1928, he managed
to secure laboratory space at the Nencki Institute for Experimental Biology. This space consisted of
two rooms, two Sunstrand electrical adding machines, and two Odhner arithmometers.34 Within
these two rooms Neyman founded and operated the “Biometric Laboratory of the Warsaw Scientific
Society,” and the “Mathematical Statistics Group of the Horticultural Faculty of Warsaw
Agricultural College.” The space was a meeting point for logicians, philosophers, and statisticians
33 Jerzy Spława-Neyman, “Sur un théorèm métrique concernant les ensembles fermés,” Fundamenta Mathematicae, 5 (1924): 329-330. At the end of this paper Neyman writes, “Je citerai enfin le problème suivant qui m’a été communiqué par M. Sierpiński.” 34 Mirosław Kryśko, “The History of the Mathematical Statistics Group at the Horticultural Faculty of the Central College of Agriculture in Warsaw, and the Biometric Laboratory at the Marceli Nencki Institute of the Warsaw Scientific Society,” Statistics in Transition – New Series 13, no. 3 (2012), 617.

88
working in different domains of field work. They were interested in how well probabilistic
frameworks fit statistical research in the laboratory, and the group included theorists and logicians,
farm workers, state workers, and statisticians, as well as those who wore many hats.35 Neyman also
had three student workers: Wacław Pytkowski who was studying to be an agricultural engineer;
Karolina Iwaszkiewicz, a horticultural student training in biometric research and statistics; and
Stefan Moszczeński, who came from the Agricultural Economy Group at Warsaw Agricultural
College.36
In 1929, through a local Warsaw press, the group began publishing Statistica, the memoirs of
the biometric laboratory collective, and this would continue through 1937.37 Part of the initial
collective, philosopher and logician Janina Hosiasson (1899-1942) was a student of Warsaw
University and a core member of the Warsaw-Lwów school of logic.38 She trained with ethicist
Tadeusz Kotarbinski and logician Jan Łukasiewicz.39 Her work, part of the foundations crisis in
mathematics and rising popularity of axiomatic probability theory, was directed towards assessing
the logical foundations of probability theory and its relationship to data.40 She directly confronted
35 People involved with the laboratory included Janina Hosiasson, Stanisław Kołodziejczyk, J. Mydlarski, M. Górski, Stanisław Kołodizejczyk, Stanisław Saks, Henryk Wilenski, Kazimierz Korniłowicz, Tadeusz Matuszewski, Jan Piekałkiewicz, Antoni Przeborski, and Josef Przyboroski. 36 Ibid., 618. 37 The Warsaw collective surveyed a wide breadth of international scholarship engaging a large-scale data analysis. This is best evidenced by Iwaszkiewicz’s erudite knowledge of the international medical community’s standards of toxicity. Between 1920 and 1935, the Nencki Institute facilitated an exchange of scientific material between the Soviet Union, England, Germany, and a dozen other countries. The library grew from housing 600 volumes in 1920 to housing about 23,000 volumes by 1935.37 Before 1933, most of their work was published in multilingual journals including Acta Biologiae Experimentalis and Archiwum Hydrobiologii I Rybactiwa. By 1933, the Nencki Institute’s laboratories established their own journals including M. Nenckiego, Prace Stacji Morksie, and Statistica. 38 Janina Hosiasson From Warsaw Archives in Jan Woleński, Logic and Philosoophy in the Lvov-Warsaw School (The Netherlands: Kluwer Academic Publishers, 1989). 39 See: Anna Jedynak, “Janina Hosiasson-Lindenbaumowa: The Logic of Induction,” in ed. Władysław Krajewski, Polish Philosophers of Science and Nature in the 20th Century (Amsterdam: Rodopi, 2001). 40 J. Hosiasson, “Why do we prefer probabilities relative to many data?” Mind XL, no. 157 (1931): 23-36.

89
paradoxes in probability theory, and she translated three of Bertrand Russell’s books into Polish. In
1929, she wrote a piece in the commencement publication of Statistica, entitled: “Quelques remarques
sur la dépendance des proabilités posteriori de celles a priori.” This piece illuminated a paradox within recent
Anglophone theories of probability, in application to frequency curves and statistical methods.41 In
its founding, the Polish mathematical statistics group was a coming together of philosophy with
statistical work. Core to this program was a desire to question the foundations of probability, and
what it was doing to the world.
The Small-Farm Data Problem
The fascination with uncertainty driving the new mathematics collective rapidly extended into
applications in biometrics, agriculture, and state statistics. The same year of the laboratory’s
founding at the Nencki institute, statistics student Wacław Pytkowski was commissioned by the
State Research Institute, to conduct a flagship analysis of Polish Small Farms. The impetus driving
Pytkowski’s first project, was the availability of data being generated by newly formed state
institutions, which Neyman referred to as a “treasure trove of valuable information.”42 For the ‘small
farm problem,’ the Department of Agricultural Economics provided information collected in 1927
and 1928.
The program was designed to reformulate Polish farm production into quantified
information conforming to Western capitalist logics. A majority of this production was generated on
41 Janina Hosiasson, “Quelques Remarques sur la dépendance des proabilités a posteriori de celles a priori,” Statistica 1 (1929-1930): 375-382. In this piece, Hosiasson is responding to U.S. statistician Arne Fisher’s The Mathematical Theory of Probabilities and its Application to Frequency Curves and Statistical Methods (New York: The Macmillian Company, 1915). 42 Spława-Neyman, “Przedmowa” to Pytkowski, “Wpływ Obszaru.”

90
small peasant farms. In 1927, Poland’s GDP was 62% agriculture and peasant farmers owned 68%
of the cultivable land.43 That year had been profitable for Polish agriculture due in part to an increase
of foreign investment from countries like France and the United States.44 This influx of western
capital, and the promise of further growth, motivated the Department of Agricultural Economics to
seek a mechanism for assessing the profitability of small farms in Poland. This was seen as a means
of stabilizing capital. Poland’s drive to reform as a sovereign nation state was not independent of
global pressures to make its economic and market formations legible to foreign investors, political
economists, scientists, and other governing bodies. In this view, efforts to enumerate and manage
the Polish production economy would depend on a clear ordering of regional and individual small
farm data.
Given the heterogenous farming traditions spanning the patchworked landscape, there was
limited information on small farm production, despite recent efforts to aggregate data. This was a
problem that the current director of the BAE, agricultural economist Witold Staniewicz, wanted to
correct. Staniewicz, who had taken over Franciszek Bujak’s directorship in 1927, described Poland’s
central agricultural and economic problem as being the “problem of small farms.”45 He wrote, “The
basis of the agrarian structure [is] a large number of small farms carrying on a traditional natural
economy.”46
Small farms referred to farms that measured at less than 20 hectares. Despite their small size,
in aggregate, they were the dominant producers of agriculture in Poland.47 However, given their size,
43 Witold Staniewicz, “The Agrarian Problem in Poland between the Two World Wars,” The Slavonic and East European Review, 43, No. 100 (1964): 24. 44 Neal Pease, Poland, the United States, and the Stabilization of Europe, 1919-1933 (New York: Oxford University Press, 1986): 105. 45 Staniewicz, “The Agrarian Problem in Poland,” 22. 46 Ibid. 47 Witold Staniewicz, “The Agrarian Problem in Poland,” 23.

91
it was difficult to collect enough data about them to accurately assess their profits.48 The 1927/1928
data collection project entitled “Analysis of Small-Farms in Poland” had initially been facilitated by
Bujak, but Staniewicz, who had been teaching agricultural economics at the University of Warsaw,
gave the data to Wacław Pytkowski of the newly formed mathematical statistics group. Staniewciz
viewed Pytkowski as a highly competent theoretical statistician who could aid the department in
stabilizing a mechanism for assessing small farm profitability.49 Aware of the mathematical
movement, it was hoped that statistical inference could help make sense of small-farm data, which
suffered from being underdetermined. This was a small data problem. Statistical inference was
needed to help make sense of an agrarian economy about which there was minimal information.
The Small-Farm analysis was designed to answer questions such as: “What would be the
effect of adding 100 złoty to the total outlay of a farm of a definite type other factors remaining
constant?”50 Questions like this one were typical in confidence building and were usually treated with
some mode of regression analysis. Regression analysis, dating back to Carl Gauss and first named by
eugenicist Francis Galton in the nineteenth century, was an established method of estimating the
relationship between variables (such as farm outlay and number of cows on a farm) by holding one
variable constant while assessing variability in its dependent variables. Given the already adopted
frameworks of the mathematical-statistical worldview—rooted in the central limit theorem—it was
assumed that greater quantities of data would yield better defined bell curves and give a clearer
determination of averages and deviations from the average.
48 Witold Staniewicz, “Przedmowa” to Pytkowski, “Wpływ Obszaru.” 49 “Witold Cezary Staniewicz,” iPSB, accessed April 8, 2017, http://www.ipsb.nina.gov.pl/a/biografia/witold-cezary-staniewicz. 50 Wacław Pytkowski, “The Dependence of the Income in Small Farms upon their Area, the Outlay and the Capital Invested in Cows (English Summary),” Bibljoteka Puławska 34 (1932): 51.

92
At small scales, when the data was insufficient to yield a clear view of things, there was a
small data problem. Probability was invoked to fill in the gaps. Pytkowski designed the confidence
interval to estimate mathematical-statistical values—such as averages and deviations—in a small set
of data. Logical hypotheses would be asserted about a set of data, such as the numerical value of a
mean value. New methods of calculation were designed to assess the level of confidence one could
have in that hypothesis. In 1929 Warsaw, Pytkowski was developing this architecture for assessing
the logical validity of methods (regression analysis) used in assessing the small-farm data problem.
The hypothesis in this example is the estimation that the value q lies within a certain range of
numerical values. What is in question, for Pytkowski, was how certain he could be that his
estimation was correct, based on the analytic method used. His eventual ufności przedzial or
confidence interval, hearkened back on a longer tradition of measuring confidence, from which the
Polish school would break.
As covered in chapter 1, regression analysis was the modus operandi of late nineteenth
century statistical work especially in the evolutionary and life sciences, named in Francis Galton’s
eugenics movement. In Galton’s universe, confidence was both a statistical and affective concept
pertaining to the trust he held in the specific technique of regression analysis, which ensured he
could draw general laws or “hereditary conclusions” from his data.51 In the 1870s, Galton worked to
discover the statistical properties of inheritance in nonhuman species such as plants and animals.
While his methods and data were limited, Galton was “confident that these laws were universal and,
once discovered, could be applied to inheritance of intellectual and moral traits.”52
51 Francis Galton, "Discontinuity in Evolution." Mind 3, no. 11 (1894): 362-72; Francis Galton, "Family Likeness in Eye-Colour." Proceedings of the Royal Society of London 40 (1886): 402-16; Francis Galton, "Regression Towards Mediocrity in Hereditary Stature." The Journal of the Anthropological Institute of Great Britain and Ireland 15 (1886): 246-63. 52 Theodore M. Porter, The Rise of Statistical Thinking, 286.

93
This philosophy of regression operated at once as a mathematical mode of reasoning, a
descriptor of biological and evolutionary processes, and as a means of stabilizing social hierarchy.53
This triadic meaning is best captured in Galton’s 1889 address to the Anthropological Institute of
Great Britain and Ireland, in which he stressed the confidence he had in regression analysis as a
classificatory principle in human history: “…what is confessedly undefined in the individual may be
definite in the group, and the uncertainty as regards the one is in no way incompatible with statistical
assurance as regards the other.”54 Quantitative linkages drawn between individual traits and social
position achieved legitimacy largely because of the confidence held in the statistical technique of
regression analysis.
By the early twentieth century, the law of regression was ubiquitous throughout the
psychological, medical, and social scientific fields especially in political economics and agronomics.
This widespread adoption of regression architectures set an important precedent for the rise of
mathematical statistics in the twentieth century by establishing authority in bounded mathematical
mechanisms to govern social, political, and economic systems.
Arguably, regression analysis itself may be considered algorithmic: it is a rote mode of data
collection and processing that dictates a precise order to its computation and interpretation.
Regression analysis also constitutes an economy of logic that depends on confidence in both its
affective and technical meanings to hold power. The eugenics movement was a deeply ideological
social philosophy stabilized by seemingly banal administrative procedures and computations. It was
53 For an example of regression as social philosophy, see: Cesare Lombroso, “Regressive Phenomena in Evolution,” The Monist, 8 No. 3 (1898): 377-383. 54 Francis Galton, “Address Delivered at the Anniversary Meeting of the Anthropological Institute of Great Britain and Ireland,” The Journal of the Anthropological Institute of Great Britain and Ireland, Vol. 18 (1889): 406.

94
precisely the affective confidence generated in regression techniques, that reinforced the authority of
numbers in the social and political world.
In his Small-Farm analysis, Pytkowski put to question the limits of Anglophone trends in
regression analysis in the analysis of Polish small-farms and thus introduced doubt into the
prevailing confidence of regression technique. As a tuning apparatus, he employed a new method of
assessing and measuring statistical error and a new philosophy of computation, both of which
centered uncertainty in the experiment. In estimating an unknown value in a general population set
using known values from a random sample set, there is an inherent likelihood of error. The English
school accounted for statistical error by measuring the misfit of data after statistical experiments were
complete. These measurements were often computed with R.A. Fisher’s coefficient of determination
equation: 1 − 𝑟-
√𝑛 which measured how well a regression line fit the data.55 Pytkowski saw the
coefficient of determination equation as an insufficient post hoc calculation. He believed error
should be at the forefront of the experiment as engaging unknowability was the whole point of
statistical analysis.
Pytkwoski’s term Ufności (or confidence) was therefore cast as logical reevaluation of the
teachings of the Anglophone school. He maintained that the tendency to calculate a multiple
regression surface on the entire body of material could not “be approximated with any sort of
accuracy” as the respective calculations were “complicated to the degree of being prohibitive.”56 In
efforts to address the problem of accuracy, Pytkowski organized the data into “class intervals”
before calculating his regression analysis. He drew up charts to classify the data in a way that would
honor its provincial idiosyncrasies, privileging three factors: farm size, outlay, and capital invested in
55 Pytkowski, “Wpływ Obszaru,” 29. 56 Pytkowski, “The Dependence of the Income,” 5453-4.

95
cows. For example, Pytkowski equated his outlay intervals to 300 złoty, relative to farm size. If a
farm had spent far less than 300 złoty on upkeep that year, it would no longer be part of the relevant
analysis. After carefully classifying the 1927/1928 data on the gross outlay, area, and net profit of
Small Farms, Pytkowski then calculated partial correlations and regressions for each one of his class
intervals. The ufności przedzial (or confidence interval) concept was outlined as a mechanism for
measuring confusion in his regression analysis.
This design further department from another well-known anglophone data architecture,
William Gosset’s t-distribution equation. Scottish mathematician William Gosset, who published
under the pseudonym “Student,” had developed the t-table in 1908 to achieve greater confidence in
the industrial applications of his work. An employee at Guinness Brewery in Dublin, Ireland, Gosset
was tasked with estimating the production of hard versus soft wheat grain in beer production, a task
that depended on sample sizes that were too small to assume a normal distribution. Gosset designed
a standardized chart that provided probability values for sample sets under 30, when the mean value
of the general population set was unknown. Again, the impetus in designing his model, here a
mobile table of numerical values, followed a real problem in agrarian work. By the time of
Pytkowski’s small-farm analysis, Gosset’s tables were well-known in Poland.
In calculating numerical values for the confidence interval parameters, Pytkowski
manipulated Student’s t-distribution equation.57 Instead of estimating a single characteristic value for
the general population set, as with Student’s equation, he drew a range of possible values by
bounding the upper and lower limits of where that value could probabilistically be in the general
57 William S. Gosset, "The present position of our knowledge of the connection between life and hops in the experimental brewery," Laboratory Report 10 (1908): 137-150.
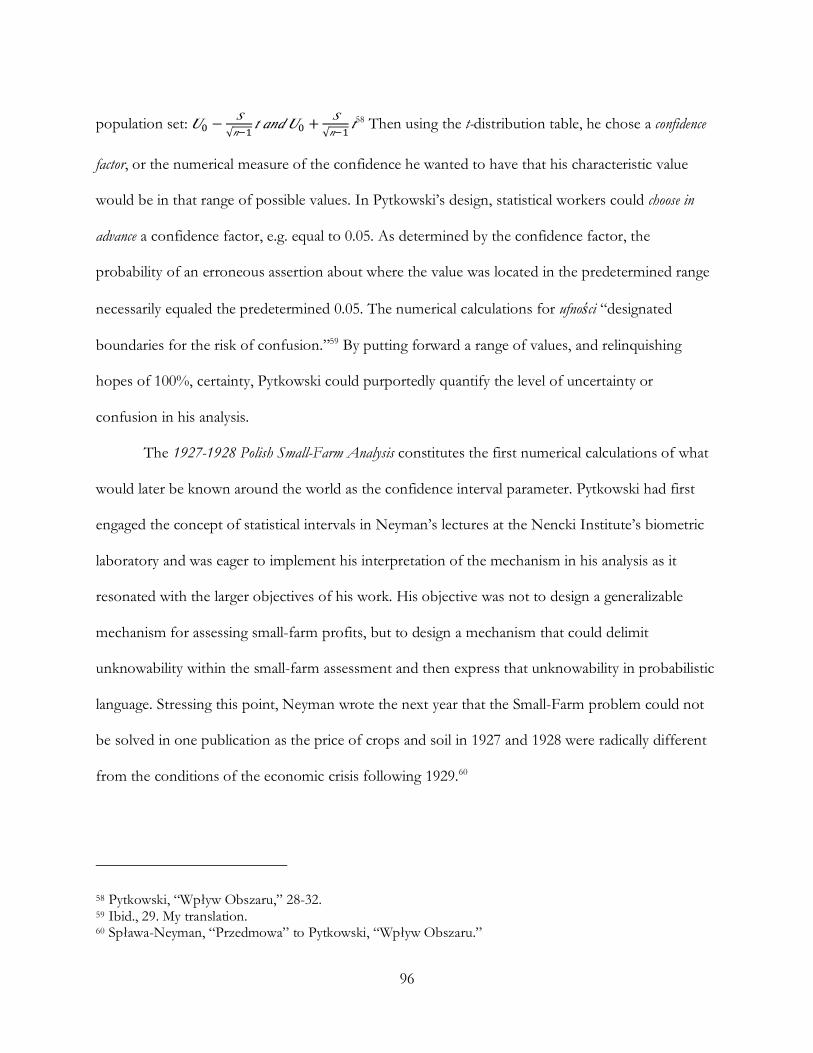
96
population set: 𝑈. −𝑆
√𝑛/! 𝑡𝑎𝑛𝑑𝑈. +𝑆
√𝑛/! 𝑡58 Then using the t-distribution table, he chose a confidence
factor, or the numerical measure of the confidence he wanted to have that his characteristic value
would be in that range of possible values. In Pytkowski’s design, statistical workers could choose in
advance a confidence factor, e.g. equal to 0.05. As determined by the confidence factor, the
probability of an erroneous assertion about where the value was located in the predetermined range
necessarily equaled the predetermined 0.05. The numerical calculations for ufności “designated
boundaries for the risk of confusion.”59 By putting forward a range of values, and relinquishing
hopes of 100%, certainty, Pytkowski could purportedly quantify the level of uncertainty or
confusion in his analysis.
The 1927-1928 Polish Small-Farm Analysis constitutes the first numerical calculations of what
would later be known around the world as the confidence interval parameter. Pytkowski had first
engaged the concept of statistical intervals in Neyman’s lectures at the Nencki Institute’s biometric
laboratory and was eager to implement his interpretation of the mechanism in his analysis as it
resonated with the larger objectives of his work. His objective was not to design a generalizable
mechanism for assessing small-farm profits, but to design a mechanism that could delimit
unknowability within the small-farm assessment and then express that unknowability in probabilistic
language. Stressing this point, Neyman wrote the next year that the Small-Farm problem could not
be solved in one publication as the price of crops and soil in 1927 and 1928 were radically different
from the conditions of the economic crisis following 1929.60
58 Pytkowski, “Wpływ Obszaru,” 28-32. 59 Ibid., 29. My translation. 60 Spława-Neyman, “Przedmowa” to Pytkowski, “Wpływ Obszaru.”

97
The earliest iteration of the confidence interval is not recognizable by today’s understanding
of computer algorithms. Firstly, machines did not compute it. A group of human logicians collected
the data, devised a logic of interpretation, conducted the computational labor, and provided a
numerical value to represent a certainty of interpretation, rarely above 95%. The Polish philosophers
embraced confidence as a mode of reasoning that dictated direct and ordered engagement with
uncertainty in statistical work and statistical governance. I have outlined their method of calculating
unknowability—(un)certainty work—in three stages:
STEP ONE: Identify as many points of unknowability in the field or laboratory experiment as possible using a combination of statistical knowledge and tacit field and economic knowledge
STEP TWO: Express these points of unknowability in the language of axiomatic probability theory
STEP THREE: Test the probability of being right about the probability of being wrong
Biometrical Uncertainty
Figure 9: Trans. Sugar Beet map of Poland, Statisticia (1933)

98
(Un)certainty work in the context of Polish land reform consisted of holding an experiment still,
unearthing the limits of human knowability within it, and translating this uncertainty or
unknowability into probabilities. Their (un)certainty work luxuriated in the limits of the data and the
analysis, as well as the limits of the experimental design. This is clear in the small-farm analysis that
established the experiment as a hypothesis test of two years of small-farm data. This (un)certainty
work was applied in agricultural, scientific, and social scientific experiments. The year prior to
Pytkowski’s small-farm analysis, Karolina Iwaszkiewicz arrived at the Nencki Institute to pursue her
doctorate in horticulture and mathematics and lecture in practical statistics. Over the next decade
she would publish over a dozen papers on her statistical work.61 One of Iwaszkiewicz’s more notable
projects was a reassessment of a common biometric procedure: measuring the poisoning power of a
given solution.62 In question was how biometric scientists should think about their statistical
estimations of virulent units (such as the bacterium diplococcus). In her assessment she replaced
analysis of causal claims in medicine with a computational process of bringing uncertainty to bear on
the experimental design.
Her analysis sought to explain the following type of scenario: “Why, when two animals which
have been injected apparently with identical doses of toxin does one die while the other remains healthy?”63
Iwaszkiewicz’s objective here was not to provide a causal explanation for the deaths of mice, but to
critically examine the dimensions of this problem and reveal points of unknowability in its
procedure. To begin, the two most apparent points of unknowability known throughout the medical
community were the chemical nature of the toxin and the “content of poison in any one batch of
61 Mirosław Krzyśko, “Karolina Iwaszkiewicz-Gintowt (1902-1999),” Acta Universitats Lodziensis Folia Oeconomica, 286 (2013): 32. 62 Karolina Iwaszkiewicz and Jerzy Neyman, “Counting Virulent Bacteria and Particles of Virus,” Acta Biologiae Experimentalis, VI (1931): 101. 63 Ibid., 140.

99
the drug.”64 Neither one of these were observable or measurable and therefore needed to be
estimated.
The objective, therefore, was to estimate how many virus units N were in any one batch of
the drug. In current practices of biometric research, this number N could easily be estimated using
Poisson’s probability law. But Iwaszkiewcz chose to resituate it as a point of investigation as she
maintained, “we cannot hope to be able to give a complete solution of this very complicated
problem.”65 She first tested the hypothesis that the estimate of virulent particles followed Poisson’s
law and then pushed beyond these more obvious points of uncertainty. There was “another possible
source of error” in the experiment’s design—variability in different mice bodies such as age, health,
and breed.66 Using current research from the Medical Research Council’s Department of Biological
Studies in London, Iwaszkiewicz drew confidence measures for variability of mice bodies in the
mice population showing that much was still unknown about them. Ufności was the mechanized
process by which innumerable points of unknowability within an experiment were expressed in
probabilistic language.
Unknowability remained even in the conclusion of Iwaszkiewicz’s assessment. She argued
that even the unstated initial assumption—that truly equal volumes of poison were injected into the
animals—was not really measurable in the existing data. But by the new methods, even
unknowability about this dataless hypothesis could be expressed as a probability. Her rigor and
precision in unfolding the layers of uncertainty within biometric experiments is paradigmatic of the
new statistics. Confidence computing unraveled experimental frameworks by revealing designs that
were partial, incomplete, porous, and tattered. These experiments were then reconfigured according
64 Ibid., 102. 65 Ibid., 105. 66 Ibid., 103.

100
to a new logic of interpretation, which asserted an interval of uncertainty—95%--as the guiding
epistemology and boundary of interpretation.
A Confidence Collective
Concurrent with Pytkowski’s Small-Farm analysis and Iwaszkiewicz’ work on virulent particles, a
cadre emerged around the Nencki Institute, the State Research for Rural Husbandry, and the
University of Warsaw. Their planning work in many cases made use of the confidence interval
architecture but in all cases demonstrated the same rigorous (un)certainty work from which the
mechanized expression of ufności first emerged. These statisticians worked with each other in places
like the Central College of Agriculture in Warsaw and the Institute of Plant Breeding and
Agricultural Experimentation.
This network worked on various problems pertaining to Poland’s rehabilitation efforts in the
domains of agriculture, biometric research, and social policy. Investigations fell under four rough
categories: agricultural experimentation (including plant breeding and field sampling), agricultural
industries (including brewing, milk and cheese production), chemical engineering, and economics.67
Investigations included estimating potassium levels in fertilizers and sickness in Polish workers.
Across these many areas of research, confidence computing operated between epistemic uncertainty
in statistical work and the limitations of experiments known from local field or laboratory work.
Józef Przyborowski and Henryk Wileński were statisticians affiliated with the Statistical
Laboratory at the Central College of Agriculture in Warsaw and worked at a seed sorting station at
67 Jerzy Spława-Neyman, “The Development of Industrial Applications of Statistical Theory in Poland,” Journal of the American Statistical Association, 30 (1935): 707.

101
the University of Cracow. One of the station’s daily tasks was testing red clover and other small
seeds for dodder, a parasitic plant that invaded crops. Since this random selection process comprised
the “routine work” of the station, the statisticians maintained it should have “a sound statistical
basis.”68 Their central question was, in the random selection of clover seeds, does the distribution of
dodder seeds follow Poisson’s probability law? In testing this hypothesis, they revealed further
points of uncertainty, particularly in the seed sorter’s claim to have selected the seed “at random” in
the first place.
In reality, they argued, dodder seeds were significantly heavier than clover seeds and during
transport would shift to the bottom of the sacks that held them, especially since the seeds were
typically transported over broken or nonexistent roads. It was clear that seed selected from the top
of the sack was probabilistically different from seed selected from the bottom. So Przyborowski and
Wileński redesigned the sampling experiment by developing new tables that compared their testing
of Poisson’s hypotheses at the top and the bottom of the sack. This gave a more accurate account
about what could be known about homogeneity in a mix of dodder and clover seeds. The Polish
collective of practical agrarian philosophers defined confidence as a measure of uncertainty. Their
algorithm both admits of and embraces the limits of human reasoning, of experimental data, and of
variability in the conditions of the world.
(Un)certainty work was a visual overlay that delimited what could and could not be known in
an experiment, as expressed probabilistically. In 1935, Neyman and two of his colleagues at
Warsaw’s Central College of Agriculture, T. Matuswski and J. Supinska applied confidence logics to
68 Józef Przyborowski and Henryk Wilenśki, “Statistical Principles of Routine Work in Testing Clover Seed for Dodder,” Biometrika 27 (1935): 273.

102
the popular “dilution method” being used in bacteriology across many biological fields.69
The dilution method in bacteriology can be traced back to Louis Pasteur. Around 1875, Pasteur
obtained pure cultures of bacteria by diluting the original inoculum during several successive
transfers to a suitable culture medium.70 The method consisted in diluting the original population,
usually in powers of 10, and inoculating equal volumes of the diluted material into liquid media.71
What was considered to be an inherently statistical problem was the assessment that “if growth
occurs from the inoculation of 1 cubic centimeter of a 1:100 dilution and not from a 1:1000 dilution,
the number of organisms present in the original material is said to be between 100 and 1000 per
69 Matuszewski, T., J. Neyman, and J. Supinska. "Statistical Studies in Questions of Bacteriology. Part I. The Accuracy of the "Dilution Method"." Supplement to the Journal of the Royal Statistical Society 2, no. 1 (1935): 63-82. 70 H.O. Halvorson and N.R. Ziegler. “Application of Statistics to Problems in Bacteriology.” Journal of Bacteriology 25, no. 2 (1932): p. 102. 71 H.O. Halvorson and N.R. Ziegler, Bacteriology, 1932, p. 102.
Figure 10: Matuszewski, T., J. Neyman, and J. Supinska. "Statistical Studies in Questions of Bacteriology. Part I. The Accuracy of the "Dilution Method"." Supplement to the Journal of the Royal Statistical Society 2, no. 1 (1935): 66.

103
cubic centimeter.”72 Dilution methodology was developed to determine the number of bacteria in a
given solution when other methods could not be used due to flawed experimental conditions. When
debris or other imperfections prevented the bacteriologist from actually counting the bacteria, there
was a need for a reliable statistical mechanism to estimate these numbers.
Throughout the 1920s, food industries such as beer brewing, cheese making, and meat
curing relied on dilution methodology because estimating bacteria populations was essential to
replicating their food production processes. By the 1930s, there was a distinct quantitative turn in
bacteriology that sought new statistical techniques and means for more efficient control over
bacteriological experimentation. The dilution method in particular had “been devised inter alia to
estimate the concentration of bacteria which are living and are able to develop under given
conditions of nutrient, temperature, etc.”73 By the time of the Warsaw experiment, many statistical
estimation techniques were circulating—such as the method of maximization—to try and estimate
original population values. Confidence intervals were employed to test the validity of these
preexisting estimation methods and techniques and rework the experiment and experimental testing
by its logic.
In Neyman, Matuswski, and Supinska’s dilution experiment, they tested the veracity of
population estimates of an unknown parameter, λ —the original suspension of bacteria. Unlike
other dilution method estimation techniques at the time—including Fisher’s fiduciary limits—they
gave “up constructing a unique estimate of λ.”74 So the point of the confidence gaze was not to find
the probability of the actual bacteria population in the original suspension population, λ, but to test
the veracity of the probability claims made about the original suspension population. The process of
72 H.O. Halvorson and N.R. Ziegler, Bacteriology, 1932, p. 102. 73 Matuszweski, Neyman, and Supinska, Dilution Method, 63. 74 Matuszweski, Neyman, and Supinska, Dilution Method, 66.

104
reimagining the experiment in terms of confidence intervals, depended “very much on the
arrangement of the experiment.”75 The purpose of their experiment consisted in describing the
accuracy of the estimate based on the total number of fertile samples.76 This meant that the entire
process of experimentation was reworked according to confidence interval framing, from
determining the objective of the problem, to selecting and computing the data, and finally to the
conclusions drawn from that data.
This figure is a visualization of confidence intervals for the dilution experiment. 77 The
unknown parameter λ, or the original suspension concentration, is related to the empirical series x—
the individual bacteria or groups of bacteria seen in many dilution samples. These intervals are
limited by the confidence coefficient a, designated here as 95% of unity. It is depicted that for each
of the x intervals, the bacteriologist could estimate—with 95% certainty—that the population
estimate λ is contained within its corresponding confidence interval. Furthermore, this visualization
reinforced the epistemic parameters of the experiment: “The smaller the value of λ, the greater the
75 Matuszweski, Neyman, and Supinska, Dilution Method, 75. 76 Matuszweski, Neyman, and Supinska, Dilution Method, 64. 77 Matuszweski, Neyman, and Supinska, Dilution Method, 68.
Figure 11: Confidence Interval for Dilution Experiment

105
probability the number of fertile tubes will equal zero and vice versa as λ approach[es] infinity.”78
Here a three-point relationship was designed between the known variables xn, the unknown
parameter λ, and the confidence coefficient a.
The uncertainty of the original concentration of bacteria is directly linked to empirical data
generated in dilution tests, by the designed confidence coefficient—with 95% certainty. Certainty and
uncertainty were held in suspension by a predetermined probability. The logics of uncertainty,
therefore, permeated the very process of sampling and the very design of the experiment.
Biometrical procedural was designed in terms of probability data and analysis.
The crisis of foundations guiding the initial impulse to put mathematical truisms to question
was adopted by a more practically-minded cadre of statistician that integrated experimental
knowledge in medicine, agriculture, and biometrics into their mathematical work. Pytkowski’s
calculations for the small farm problem represented an effort to mechanize ‘confidence’ as a process
of calculation in statistical study. This mechanism for quantifying confusion—confidence intervals—
was a mathematical architecture designed to operate on economic information by employing the
tenets of axiomatic probability theory in practice. The epistemic and economic crises shaping
intellectual cosmopolitanism in interwar Poland converged on the new method. Although this
method was designed to mechanize confidence and uncertainty, it was admitting of its own
limitations, and in fact it was a method of embracing the limits to knowledge within a given
experiment. Discrete experiments conducted by the confidence collective, from seed-sorting to
bacteriology, spoke to the much larger experiment of drawing boundaries for Polish nationalism.
The materiały feeding the experiments was generated, valued, and circulated through larger state-
78 Ibid.

106
making projects. The Polish conception of (un)certainty work advanced in its designs a dissent of
Anglophone experimental design. It was a confrontation with mathematical foundations and axioms
in applications towards a new Poland, drawn as a series of statistical provinces.
WWII disbanded the confidence computing collective in Warsaw, Poland and the Warsaw-
Lwów school of logic and destroyed their records. By the late 1930s, tensions mounted as proposals
increased for the forced emigration of Jewish citizens. Academic and university positions in Poland
were no longer stable and many made efforts to leave. Neyman emigrated in 1935 to London to
work with Egon Pearson. The mathematical statistics laboratory at the Nencki Institute was soon
shut down, and the last Statistica printed in 1937. After the Nazi invasion, their libraries were
destroyed. On September 1, 1942, the mathematics library at the University of Warsaw was
destroyed by fire. Again, between April and December 1944, the private mathematics collections
were systematically burned, destroying work and data from the prewar and wartime periods. Many
members of the Warsaw-Lwów philosopher’s guild and the Nencki Institute were murdered during
the war. After arriving in the United States in 1937, Neyman worked to place many members of his
former community in university positions, without success. In his post-WWII second-edition book
on probability and statistics, he commemorates the loss of his friends.79
79 Jerzy Neyman, Lectures and Conferences on Mathematical Statistics (Washington D.C.: U.S. Department of Agriculture, 1952): iii.

107
Figure 12: Jerzy Neyman’s Dedication to Lectures and Conferences on Mathematical Statistics, 1952
Chapter 2, contains material as it will appear in Dryer, Theodora. “From Soil to Bombs: A
History of Uncertainty Computing” (In Review HSNS). The dissertation author was the sole author of
this material.

108
Chapter 3: Control
Seeds of Control
Sugar Beets, Control Logics, and New Deal Data Politics, 1920-1940
Sugar Seeds and Statistical Control
What do sugar beets have to do with telephone transmitters? And what are the social and environmental
implications of reconfiguring industries, as distinctive as agricultural breeding and industrial
manufacturing, under a shared program of data-driven control analysis? In the New Deal era,
mathematical control logics came to power at the nexus of agricultural planning and industrial
Figure 13: “White Improved Vilmorin Sugar Beet,” Wiley, Farmers’ Bulletin 52 (1889), United States Department of Agriculture.

109
factory production. As with confidence, control is a computing concept that holds a variety of
technical, political, and affective meanings. In the interwar period, confidence logics in probability
and statistics converged with quality control logics—giving a distinctive corporate industrial framing
to the new statistics. This is emblematized by a mathematical model that circulated alongside
confidence logics. This control was a matter of stabilizing economic profit and industrial efficiency—
another computing concept at work in state and military projects throughout the twentieth century.1
The central laboratory for the expansion of control logics was not the factory floor, but agricultural
oversight at the U.S. Department of Agriculture. In the 1920s and 1930s, the sugar beet industry, in
particular, went through a series of transformations that made it an ideal laboratory for developing a
statistical control state. This confluence of corporate agriculture, method-based statistics, and
industrial sugar beet production would flourish after WWII.
In the Spring of 1937, Jerzy Neyman arrived from London to give a series of lectures related
to agricultural planning at the Beltsville, Maryland USDA Graduate School. His invitation was part
of a larger initiative to seek counsel from international technocrats, economists, and agriculturalists
on central planning in agriculture. Prior to arriving in the United States, he had been in
correspondence with soil scientist Edwards Deming, who was then organizing conferences, lectures,
publications, and a new pedagogical initiative on the topic of statistical control. The USDA
1 Control is a critically important concept in the history of computing. For a cornerstone text on the history of control in information society, see: James R. Beniger, The Control Revolution: Technological and Economic Origins of the Information Society (Cambridge: Harvard University Press, 1989); Michael Adas, Machines as the Measure of Men: Science, Technology, and Ideologies of Western Dominance (Ithaca, NY: Cornell University Press, 1989); Carl Mitcham, Thinking through Technology: The Path between Engineering and Philosophy (Chicago: University of Chicago Press, 1994). For a comprehensive, long-view study of efficiency, see: Jennifer Karns Alexander, Mantra of Efficiency: From Waterwheel to Social Control (Baltimore: Johns Hopkins University Press, 2008); see: Samuel P. Hays, Conservation and the Gospel of Efficiency: The Progressive Conservation Movement, 1890-1920 (Cambridge: Harvard University Press, 1959); Samuel Haber, Efficiency and Uplift: Scientific Management in the Progressive Era (Chicago: University of Chicago Press, 1964); Robert Kanigel, The One Best Way: Frederick Winslow Taylor and the Enigma of Efficiency (New York: Viking, 1997).

110
experimental farm in Beltsville, Maryland had long been linked to the Rothamsted experimental
station in London, and therefore Neyman, who was currently at UCL, was on the circuit of visiting
speakers. Deming requested that Neyman give lectures on practical, field-based statistics that would
be of use by the practically-minded U.S. agriculturalists. Over the span of a month, he drew in 221
participants to his mathematics lectures.
Neyman’s lectures evoked interest from economist Milton Friedman, who was currently in
D.C. working on Franklin D. Roosevelt’s New Deal agricultural programs, and Charles Sarle, who
was forming a farm statistics program as part of the Bureau of Agricultural Economics.
Transforming the farm economy into a mathematically-guided enterprise was of great interest to
these administrators; it was part of a larger movement to establish economic and political control of
agricultural production through mathematical oversight.2
Neyman’s first lecture was on a modern view of classical probability theory. His second lecture
was on practical uses of probability, and his third lecture on the testing of statistical hypotheses,
rooting the statistical work in foundational axiomatic probability theory. In his second lecture,
Neyman worked through examples from Poland, sharing the methods, data, and analysis from the
clover seed experiments, the bacteriology experiments, as well as data from sugar beet and oat
sampling. He spoke about the many uses of probability in application, promoting his colleagues in
Poland: “Two bacteriologist friends of mine, Miss J. Supinska and Dr. T. Matuszewski, were
interested in learning whether the calculus of probability could be applied to certain problems
concerning the colonies of bacteria on a Petri-plate.” Their sugar beet data provided a visual
representation of the high value of information organized for probability analysis.
2 Delivered by Jerzy Neyman, Lectures and Conference on Mathematical Statistics (Washington: The Graduate School of the USDA, 1937), USDA Graduate School Collection. Box 11: Graduate School USDA Publications. Special Collections, National Agricultural Library.

111
Throughout the years of the Great Depression, the USDA positioned itself as a scientific and
political center geared towards building an economically stable society through a thriving agricultural
economy and “good thinking.” Good thinking was a matter of asserting a scientific, data-driven
approach to social problems against the laissez-faire policies that were blamed for the economic
depression— it was believed that a controlled state of mind would yield a controlled national
economy. In line with this general political atmosphere and invoking Polish (un)certainty work or
the practical application of probability to the world, Neyman said that there were three dimensions
that should be studied.3
1. a mathematical theory; 2. the frequency of actual occurrence; 3. the psychological expectation of the participant.
Emphasizing the importance of ‘mind’ in applied probability, Neyman wrote: “It will be noticed that
the theory of my first lecture has nothing to do with the “state of mind,” though having found that
the probability of a certain property is equal to e.g. to 0.0001, the state of our mind will probably be
influenced by this finding.”4
Neyman’s final lecture on statistical inference addressed the problem with control in
agriculture and statistics. At this time, administrators at the USDA were fervently discussing the
apparent lack of control in agricultural planning and the agricultural economy and the search for
new technical solutions. The year prior, Ronald Fisher had visited the school in order to lecture on
randomization and the new null-hypothesis method—the process of asserting the hypothesis that
there is no significant difference between specified populations in order to falsify it. Fisher was
3 Delivered by Jerzy Neyman, Lectures and Conference on Mathematical Statistics (Washington: The Graduate School of the USDA, 1937), USDA Graduate School Collection. Box 11: Graduate School USDA Publications. Special Collections, National Agricultural Library. 4 Ibid.

112
advancing a central principle in his recently published, The Design of Experiments, that control equated
to randomization, and that experimental design should always include control elements that are not
altered by the experiment. For example, to test the effect of virulent material injected into 6 rabbits,
there needs to be a number of rabbits in the study that are not injected by the toxic fluid, to serve as
controls.
Uncontrolled experiments, he argued, relied on common sense in their assessment whereas a
controlled experiment, “is aimed deliberately at demonstrating beyond a question, or at excluding a
possibility that any unforeseen accident has affected the interpretation that we place upon the data.”5
A controlled experiment is guided by the logic of null-hypothesis.6 At this point in time, randomized
control experiments were not common practice and were being advocated for by technicians like
Fisher as part of a larger control logic initiative. This was a contested view. As Fisher remarked, “I
have been recommending randomization for experimental projects and though a great many people
agree with me, a great many do not.”7
Experimental control was the leading concern of the New Deal statistics programs, and
visiting speakers catered to this topic. On April 7, 1937, Neyman gave a special lecture on certain
5 R.A. Fisher, Statistical Inference and the Testing of Hypothesis (Washington: The Graduate School of the USDA, 1936), USDA Graduate School Collection. Box 7: Graduate School Lectures. Special Collections, National Agricultural Library. 6 R.A. Fisher, Statistical Inference and the Testing of Hypothesis (Washington: The Graduate School of the USDA, 1936), USDA Graduate School Collection. Box 7: Graduate School Lectures. Special Collections, National Agricultural Library. “When we say that we want to ascertain whether the experiment has demonstrated the statistical significance of the difference in reaction between the test animals and the control animals, we mean that the experimental data are capable of excluding or contradicting at least at a definite level of significance—that is, at a definite degree of probability—some hypothesis respecting the reaction of the animals, and that hypothesis must be capable of contraction of data of this kind—a hypothesis that in general we may call the null hypothesis. That hypothesis in this case is that the experimental and control animals are in fact reacting in the same way—that the two groups of animals are indistinguishable in their probability of death.” 7 First Lecture by Professor Fisher in the auditorium of the U.S. Department of Agriculture, September 21, 1936, USDA Graduate School Collection. Box 7: Graduate School Lectures. Special Collections, National Agricultural Library.
113
problems of sugar beet breeding. His focus on varieties of sugar beets was taken from sugar beet
breeders in Poland and the mathematical results were computed by Mrs. Y. Tang, M.Sc. of the
University College London. The example provided was from the Seed Testing Commission of the
Polish Beet Sugar Industry, who wanted to breed to new varieties of sugar beets for sweetness with
varieties of unknown seed origins.8
In Poland it is usual to take as standard the variety which in the preceding year proved to be
the sweetest. The beet sugar industry arranges each year competitive experiments with a number of
varieties produced by several leading firms. Those experiments are carried out in a number of places
all over the beet growing districts of Poland, and all according to a certain fixed method, with the
same number of replications, etc. The seeds are purchased on the market by a special committee and
set out to stations bearing conventional numbers but not the names of the producers.
The Polish sugar beet seed problem existed as a result of the data economy surrounding the
varietals in Poland. The problem was designed to estimate the unknown origins of the varietals, as
they were linked to different values of sweetness. This is to say that the process predicting the
sweetness of yields in sugar beet breeding was contextually specific to the customs of seed
circulation in Poland. Since seeds were circulated without the names of the farms that generated
them, these origins needed to be estimated. In order to achieve a “controlled” experiment the Polish
experimenters selected varieties of seeds from the same bag of seeds, for 4 of the 13 experiments,
“to serve as control of the accuracy of the experiment.”9 Control was a matter of stabilizing the
experimental conditions—Neyman exhorted his audience to “make your experiments as accurate as
8 Delivered by Jerzy Neyman, Lectures and Conference on Mathematical Statistics (Washington: The Graduate School of the USDA, 1937), 69. 9 Ibid, 72.

114
possible; if you cannot improve the method of experimentation, then increase the number of
replications.”10
At the time of Neyman’s lecture series, sugar beet production in the United States was
undergoing radical transformation. That year congress passed, “The Sugar Act of 1937,” an
extension of the Agricultural Adjustment Act, that classified sugar as a basic commodity, under
government control.11 The Act was intended to salvage an ailing sugar industry and also to address
child labor.12 Although the sugar industry had grown since WWI, consistent U.S. sugar beet
production was relatively new. The sugar economy did not take off until after 1890, due to a failure
of U.S. agriculturalists to model French and German sugar beet breeding in the U.S. climate. Despite
the conditions of climatic drought and economic uncertainty following the great depression, sugar
beet production ballooned in the 1917-1935 period, driven by industrial transformations including,
“increased applications of electricity that made possible the use of instruments and devices for
facilitating precise control of chemical processes… improved modes of coordinating mechanical
operations,” and the “Size and shape of plot in relation to field experiments with sugar beets.”13 In
this context of rapid industrialization, sugar beet breeding was determined to be out of statistical
control.
The description of a lack of controllability over the U.S. sugar industry had a much longer it
history, as U.S. sugar beet breeding failed to take hold for nearly 150 years. I describe U.S. sugar beet
10 Delivered by Jerzy Neyman, Lectures and Conference on Mathematical Statistics (Washington: The Graduate School of the USDA, 1937), 73. 11 See: “The Sugar Act of 1937,” The Yale Law Journal 47, no. 6 (1938): 980-993; “Minimum wages for sugar-beet and sugar-cane labor,” Monthly Labor Review (pre-1986) 53, no. 000001 (1941): 167; “Productivity and employment in the beet-sugar industry,” Monthly Labor Review (pre-1986) 48, no. 000003 (1939): 564. 12 Elizabeth S. Johnson, “Wages, Employment Conditions, and Welfare of Sugar-Beet Laborers,” Monthly Labor Review (pre-1986) 46, no. 000002 (1938): 322. 13 See, for example: John Wishart, “Bibliography of Agricultural Statistics 1931-1933,” Supplement to the Journal of the Royal Statistical Society 1, no. 1 (1934): 94-106.

115
breeding in three historical stages. The first period, 1800-1890 was overall marked by failure. While
sugar beet factories popped up, it wasn’t until 1870 that the first commercial factory was established
in California. I describe the 1890-1920 period as “beet dreams,” when U.S breeders persisted to
expand the enterprise through trial and error, as there was no model that could be transplanted.
For example, in 1899 H.W. Wiley wrote, “The experience of more than ten years in California has
shown that the climatic data, regarded as of prime importance in beet culture in Europe, [is not]
rigidly applicable to this country.”14 In this time of beet dreams, the dream of a profitable sugar
industry persisted, and a sugar beet belt was imagined as the ideal area of land for growing sugar
beets in the industrial-agricultural economy, after a century of trial-and-error. It was designed with
statistical weather data collection: 15
For growing most crops, the weather is even more important than the soil. The conditions of climate best suited to growing the sugar beet differ from that of many crops, and the weather that would seriously impair the production in other crops, may
14 See: H.W. Wiley, The Sugar Beet: Culture, Seed Development, Manufacture, and Statistics (Farmers’ Bulletin No. 52, 1899): 5. 15 Clinton Dewitt Smith and Robert Clark Kedzie, “Sugar Beets in Michigan in 1897,” Michigan State Agricultural College Experiment Station, Bulletin 150 (December, 1897): 124. Map from: “The Theoretical Beet-Sugar belt of the United States” in H.W. Wiley, The Sugar Beet: Culture, Seed Development, Manufacture, and Statistics (Farmers’ Bulletin No. 52, 1899): 5.
Figure 14: “The Theoretical Beet-Sugar belt of the United States” in H.W. Wiley, The Sugar Beet: Culture, Seed Development, Manufacture, and Statistics (Farmers’ Bulletin No. 52, 1899): 5.

116
be well suited to the crop of beets with a large content of sugar. In Germany, it has been found that a certain average temperature for the several months from May to November, and a certain average rainfall during these several months, are best adapted to the growing of the crop. Such a “sugar beet belt” sweeps through the lower peninsula of Michigan.
This theoretical belt was an outcome of mapping the ideal climatic conditions for sugar beet
breeding following a century of failed attempts to directly model after European breeding programs.
It is a map generated from statistical weather information.16 By the late nineteenth century, this
landscape was drawn as the ideal U.S. sugar beet breeding ground—it was an experimental landscape
painted across the United States. Significantly, this same ribbon of landscape would become the
target area for cloud-seeding experimentation in the Cold War period (chapter 5).
I describe the third stage of sugar beet breeding as “crisis and confidence,” in the 1920-1940
period. During this time a lack of controllability was asserted over the sugar beet belt and new
models and methods for statistical oversight were applied. Given its longer history of failure, the
U.S. sugar beet industry was seen as a program that had only been made possible through
technological and scientific prowess. The sugar industry, therefore, was ‘industrial’ from seed to soil
to refinery, and statistical information stabilized the entire process. Weather data was analyzed to
determine the ideal breeding belt, statistics was collected on breeding patterns and placement, labor
information was used to compare hand labor cost to the cost of mechanized processes that became
more popular in the interwar period. U.S. sugar beet breeding was a statistical and technological
enterprise. Plant Pathologist George H. Coons at the Bureau of Plant Industry, Soils and
Agricultural Engineering wrote a dramatic retrospective on the modern crisis of the U.S. sugar beet
and the high value of science and technology in its survival:
16 See: Robert Grimshaw and Lewis Sharpe Ware, “Various Issues,” The Sugar Beet: Scientific Quarterly 31, no. 1 (1910): 11.

117
Nor did the demands on science end with the launching of the beet-sugar enterprise, for crisis after crisis has confronted the new industry. From the beginning, sugar from the sugar beet was in competition with tropical and subtropical sugar. Even around the factory itself, the sugar beet has had to maintain itself against other crop plants competing for the farm acreage. […] plant breeders have constantly increased the productivity of the sugar beet; agronomists have discovered efficient methods of growing the crop; chemical engineers have improved the processes of sugar manufacture; and against epidemic diseases resistant varieties have been bred. Only through these contributions of science has it been possible for the sugar beet to survive. 17
The many dimensions and processes associated with sugar beet breeding evoked interest
from rising regimes of industrialists and technocratic oversight. For industrial agriculturalists, the
sugar beet belt was an ideal laboratory for expanding logics of efficiency and control. Under the
conditions of industrial agriculture, farm-management became an industry of calculation, of crop
production and resource consumption, prices and tariffs and human and machine labor. Sugar
industry companies—leading the reconfiguration of the landscape into sugar beet grids—also
oversaw much of the farm production and labor.18 Sugar beet production was assessed in terms of
hand labor calculations—the number of workers and time it would take to pick sugar beets by hand.
New Deal legislation had contributed to a drastic shift in labor conditions for sugar beet workers. In
1933 Minnesota, for example, 80% of field workers were white farmers; by 1937, New Deal
“A careful determination made in the Bureau of Soils shows that the so-called sugar beet belt contains a total area of 428,000 sq. miles or 274,000,000 acres. No attempt has been made yet to estimate the available acreage of land lying outside the theoretical belt.” 17 George H. Coons, “The Sugar Beet: Product of Science,” Scientific Monthly 68, no. 3 (1949): 149. 18 Speaking to the industrial-managerial logic of sugar beet production, see: F.A. Stilgenbauer, “The Michigan Sugar Beet Industry,” Economic Geography 3, no. 4 (1927): 486-506; “If the farmer is not amply supplied with working capital, the sugar companies advance cash to the laborers for duties performed in connection with the beet crop as per contract, and deduct these advances from the farmer’s credits for beets delivered at the end of the crop year. Where necessary the companies furnish the farmer with beet seed, fertilizer, and farm implements on the same basis. The hand labor on beets is very great and much labor has to be imported during the summer to care for the industry. Mexican labor is much in evidence in recent years. Child labor is utilized to some extent without any injurious effects.” Curtis Marez calls this the “agribusiness gaze,” see; Curtis Marez, Farm Worker Futurism: Speculative Technologies of Resistance (Minneapolis: Minnesota University Pres, 2016).

118
legislation emboldened white farm owners to “turn anew to migrant workers […] and almost three-
fourths of the Valley sugar-beet laborers were Mexican American.19 Sugar beet companies in
Michigan, the largest sugar-beet producing state, staffed their fields by seasonal labor contracts with
Mexicans who had migrated from other midwestern states.20 The shifting climatic and political
conditions of the U.S. sugar industry corresponded to a constantly changing labor force and efforts
towards managerial control.
For statisticians, the sugar beet belt was an ideal laboratory for inferential analysis. They
deemed that sugar beets offered a uniquely “controllable” laboratory for agrarian analysis, largely
ascribed to their annual and biannual harvesting customs and the even spacing of their seeds.21 For
example, an analyst noted that, unlike the uncertainties of computing sugar cane, “The beet sugar
industry […] presents no such accounting problem. The beets are planted in the spring and
harvested in the fall; so that the expenditures incurred by the companies in growing beets are almost
entirely confined to one fiscal year.”22 Sugar beet breeding also contained a multitude of analytic
points from spacing and harvesting to soil analysis and labor calculations, all of which were tied to
economic trade and tariff and state policy, as with the AAA.
19 Jim Norris, “Bargaining for Beets: Migrants and Growers in the Red River Valley,” Minnesota History 58, no. 4 (2002/2003): 199. 20 See: Zaragosa Vargas, “Life and Community in the “Wonderful City of the Magic Motor”: Mexican Immigrants in 1920s Detroit,” Michigan Historical Review, 15, no. 1 (1989): 45-68; Dennis Dodin Valdes, Al Norte: Agricultural Workers in the Great Lakes Region, 1917-1970 (Austin, University of Texas Press, 1991). 21 Sugar beet breeding itself was believed to skirt problems of computing under limited information as an ideal commodity. Since, for example, it skirted the tariff problems with sugar cane production since sugar cane took 18 months to grow and was incommensurable with accounting logics. Sugar beets were also considered to better withstand weather, one of the greatest variables in sugar beet analysis. 22 Joshua Bernhardt, “The Flexible Tariff and the Sugar Industry,” The American Economic Review 16, no. 1 (1926): 182-191.

119
Mathematical Statistical publications on sugar beets expanded during the interwar period
including publications such as, “The analysis of variance illustrated in its application to a complex
agricultural experiment with sugar beet.” The subject also started to show up in pedagogical training,
for example, “To illustrate, the statistician may be asked to draw a sample of sugar-beet farms in this
country, in order to provide, at minimum cost, certain information about sugar-beet growing which
is needed for policymaking.”23 While sugar was not a leading industry in the U.S. context, sugar-beet
analysis was a site common to agricultural experimental satiations around the globe and therefore a
shared site for the exchange of methods and data.
Throughout the New Deal period, statisticians working at the Department of Agriculture
invoked a specific notion and technical meaning of control in reference to the ailing sugar beet and
agricultural planning more broadly. This definition of control was founded on a material industrial
planning tool designed in the Bell Laboratories, at the heart of industrial America—the Quality
Control Chart (QCC) designed in 1924. The QCC offered a bounded mode of computing and
23 W.G. Cochran, “Graduate Training in Statistics,” The American Mathematical Monthly 53, no. 4 (1946): 193-199.
Figure 15: F.A. Stilgenbauer, “The Michigan Sugar Beet Industry,” Economic Geography 3, no. 4 (1927): 486

120
managing “quality control” in industrial manufacturing, an aspiration that was rapidly spreading
within the domain of agriculture. As part of a growing computational culture in industrial
agriculture, the QCC and its corresponding theory Statistical Quality Control (SQC), were widely
promoted as a mechanized data-driven managerial science. This managerial approach promised a
statistical control state over data as an accepted mathematical limit over statistical variance.
Like confidence logics, control was a mathematical architecture and limit applied to real-world
processes. Political, affective, and technological notions of control were reconfigured into a
mechanized process. In the early twentieth century, industrial agricultural emerged as a complex
confluence of machine and economic transformations—agriculture was saturated with industrial
logics. Critical to this convergence, I argue, was the adoption of data-driven analysis and the
proliferation of confidence and control logics.
Data Architectures on the Factory Floor: Statistical Quality Control
In its initial 1920s design, the Quality Control Chart merged progressive-era control logics
with new statistical methods rooted in axiomatic probability theory, which drove a modernizing
language of control logics. Prior to its formulation, industrial oversight was not a statistical program.
Within this production of statistical quality control analysis, engineering data and industrial data
developed as distinct conceptions of statistical information. The QCC design and SQC, more
broadly, were part of a new managerial class within the expanding U.S. telecommunications industry.
Bell Telephone Laboratories technicians Walter Shewhart, Victoria Mial, and Marion Carter
designed the analysis chart to oversee statistical data management in industrial manufacturing. The
chart was originally entitled “Inspection Engineering Analysis Sheet.” It comprised a formatted table
of calculations pertaining to a new mode of informatics—engineering data—that was manufactured

121
and collected on the factory floor.24 The entire inspection process of industrial manufacturing was
reformulated as a bounded mathematical statistical process.
The design of the QCC, a prototype of which is pictured here, emerged from a longer
history of control thinking in U.S. industry and telecommunications, which was, in turn, part of a
larger impetus to reinterpret manufacturing as a data-driven enterprise and to delegate human
computational labor and decision in corporate capital processes to quantitative methods. Similar to
confidence, the QCC redefined control as a set of mathematical limits over data.
Walter Shewhart first started as a quality inspector at Western Electric in 1920, overseeing
quality production of telephone-receivers.25 In 1925, Western Electric Company partnered with
24 W.A. Shewhart, “Quality Control Charts,” Bell System Technical Journal 5 no. 4 (October 1926): 600. 25 For a comprehensive study of this inspection regime, see: Paul J. Miranti, "Corporate Learning and Quality Control at the Bell System, 1877-1929," The Business History Review 79, no. 1 (2005): 54; for a discussion of Walter Shewhart in history of computing, see: David Alan Grier, “Programming and Planning,” IEEE Annals of the History of Computing 33, no. 1 (2011): 86-88.
Figure 16: W.A. Shewhart, “Quality Control Charts,” Bell System Technical Journal 5 no. 4 (October 1926): 600.

122
AT+T and became Bell Telephone Laboratories. Headquartered in New York city, Bell Telephone
Laboratories was widely known as a center for American electrical engineering and technological
innovation. It was also an important site for the development of new managerial and organization
structures to oversee rapidly growing telecommunication industries. Paul J. Miranti shows how,
during this time period, the Bell System made conscious efforts to extend “quality assurance”
capabilities.26 They hired technical employees to research new inspection capabilities for stabilizing
and controlling a rapidly growing telecommunications industry. Bell Telephone Laboratories
employed technical personnel such as Shewhart to streamline capital production through the
“modernization” of industrial manufacturing processes. This was an emergent managerial science in
the context of growing corporate integration in the United States.
Prior to the design of the SQC model of management, United States industrial
manufacturing was not considered to be a mathematical or a statistical program but a human
managerial program of training human “inspectors” to oversee technological production. These
inspection regimes adhered to cultural values of control and efficiency through counting and
accounting for time. Managerial control and control logics fueled the progressive era’s rapid
industrialization and corporate capitalist expansion, spurring efforts to stabilize managerial control
over the time logistics of expanding technological infrastructures such as the railroad and postal
systems. Time and labor measurements were organized into managerial instruments such as
bookkeeping charts, timetables, and graphs to assert managerial authority over a limited domain of
calculation.
26 Paul J. Miranti, " Quality Control at the Bell System, 1877-1929," 39-71.

123
The reduction of oversight to a limited number of quantifiable factors gave a structure to
managerial labor—control was linked to time measurement. Alfred Chandler’s Visible Hand
describes the managerial revolution as, “a large number of full-time managers to coordinate, control, and
evaluate the activities of a number of widely scattered operating units.”27 While the means took
different forms, these control logics persisted in new manifestations throughout the twentieth
century and would later gain considerable power in command and control logics of the Cold War
period.
Control was a dominant social value in progressive-era industrial society.28 It was a social
belief that managerial oversight and modern scientific methods could stabilize predictive expertise
over market processes. Control was a tendency towards the quantification of economic and
technological integration delimited by managerial instrumentation. The specific managerial creed of
quality control pertained to corporate capitalist oversight of factory production manifest through a
new managerial order. On the factory floor, inspectors assessed daily manufacturing processes for
quality assurance by mapping out the quality of machine products over time—usually recorded on
an annual and semiannual basis—to assess their profitability. Quality control was a means of
achieving higher quality at lower cost by streamlining production, isolating human and machine
errors, and reducing human inspector and computational labor.29 It was a tendency towards
constricting resources needed in the production processes, for profit.
27 Alfred D. Chandler, Jr., The Visible Hand: The Managerial Revolution in American Business (Cambridge: Harvard University Press, 1977): 79. 28 For comprehensive studies on American control systems, see: James R. Beringer, The Control Revolution: The Technological and Economic Origins of the Information Society (Cambridge: Harvard University Press, 1986); David Hounshell, From American System to Mass Production, 1800-1932 (Baltimore: Johns Hopkins University Press, 1984). 29 For comprehensive studies on the relationship between organizational design and corporate capitalism, see: Louis Galambos, “The Emerging Organizational Synthesis in Modern American History” The Business History Review, 44/3 (Autumn 1970): 279-90; Hunter Heyck, "The Organizational Revolution and the Human

124
Invoking the larger mathematical statistics movement, Shewhart maintained that it was
possible to make accurate predictions using a minimal amount of observed sampling data.30
Shewhart worked on the problem of estimating product quality using small sample sets in order to
minimize the inspection labor needed to oversee product quality. By the early 1920s, Shewhart had
become very interested in the Anglophone mathematical statistics movement. He read published
material and housed a copy of Karl Pearson’s Grammar of Science in his Bell Telephone Laboratories
office.31 Additionally, he was aware of the growing interest in mathematical statistics in United States
agriculture. As he reviewed this literature, he came to believe that the problems seen in industrial
manufacturing were inherently statistical problems and that new methods circulating the
international stage could help streamline inspection work by achieving accurate predictions from a
small set of randomized quality inspection tests.
Shewhart and his team asserted that there was a lack of control and a lack of profitability
within quality control management because quality control was inherently a statistical problem that
should be solved with probabilistic oversight. They reconfigured the problem of quality control as a
twofold problem of statistical sampling in industrial inspection. First, they argued that statistical
sampling was needed because it was actually impossible to enumerate the products and their
components. Given the larger number of transmitters in a product line, it was impossible to test
Sciences," Isis 105, no. 1 (2014): 1-31; David F. Noble, America by Design: Science, Technology, and the Rise of Corporate Capitalism (Oxford: Oxford University Press, 1979). 30 There is a longer history to integrating mathematics in industry noted by Bell technicians. For example, Bell employee George Camble wrote, “The necessity for mathematics in industry was recognized at least three centuries ago when [Francis] Bacon said: “For many parts of nature can neither be invented [discovered] with sufficient subtilty nor demonstrated with sufficient perspicuity nor accommodated onto use with sufficient dexterity without the aid and intervening of mathematics.” See: George A. Campbell, “Mathematics in industrial research,” The Bell System Technical Journal 3, no, 4 (1924): 550-557. 31 P. C. Mahalanobis, "Walter A. Shewhart and Statistical Quality Control in India," Sankhyā: The Indian Journal of Statistics (1933-1960) 9, no. 1 (1948): 52; Karl Pearson, The Grammar of Science (Cambridge: Cambridge University Press, 2014) originally published 1895.

125
every cell item. This was especially true in “destructive tests” that destroyed machine parts. Second,
they argued that statistical sampling would help reduce inspector computational labor. Bell
Telephone Laboratories manufactured 150,000 transmitters every year. It was not economical to
employ inspectors to test every one of the 150,000 items, while also managing the bookkeeping.
The Statistical Quality Control chart was designed to generate and structure industrial data
for a specific mode of computational work. Control was thus designed in 1924 as a bounded
computing mechanism that asserted mathematical limits for uncontrollability and statistical error
within a manufacturing process as a means of reducing inspector labor. The affective and economic
meanings of control were thus designed as a mechanized process.
Manufacturing Data and Mechanizing Error
In practice, the QCC was designed to uphold quality control while reducing inspector labor
and delegating assessments and decisions about the quality of manufacturing process to
mathematical assessment. It was designed to tell “the manufacturer at a glance whether or not the
product has been controlled,” by visually laying out the limits of possible variances in the production
process.32 The chart was a bounded apparatus that directed ‘stages of computation,’ starting with
collecting and calculating frequency observations of product quality, estimating future product
quality, and analyzing the validity of those predictions. The promise behind the design was to isolate
and control the factors in machine processing that could impact product quality—asserting a
mathematical control vision over the entire enterprise. This apparatus became the technical object
for a new approach to quality control in industrial manufacturing—statistical quality control—that
32 W.A. Shewhart, “Quality Control Charts,” 603.

126
advanced a data-driven approach to industrial manufacturing and fueled a cultural belief that
mathematical prognostication in machine production was possible.
As with other data architectures, the QCC configured data according to contextually specific
empirical and epistemic meanings. Inspired by the mathematical statistics movement, as well as the
material crisis in physics that had abandoned the idea of true measurement of a physical quantity and
turned attention to its most probable value, statistical quality control advanced a probabilistic view
of material processes. Frequency distributions collected from sampling real measurements and real
observations were interpreted in terms of probabilities that would ultimately describe the physical
process. Speaking to the slippage between math and material, for the SQC regime, error or variance
in the observations were considered to be inherent in “the statistical nature of the phenomenon
under question.”33
33 W.A. Shewhart, “Some Applications of Statistical Methods to the Analysis of Physical and Engineering Data,” Bell System Technical Journal 3, no. 1 (1924).
Figure 17: 160330 Telephone transmitter, Richard C. Winckel, Western Electric, Filed: Sep. 2, 1924, Pub: Oct. 19, 1926.

127
For example, in the case of carbon microphones—a key component in a telephone, the
physical manufacturing process needed to be “controlled within very narrow limits [elsewise] wide
variations [would be] produced in the molecular properties of the carbon.”34 From vibrations and
sound disturbances, to machine chamber conditions, and the precise mixtures of gases and
temperature, the conditions by which carbon was manipulated in the production process needed to
be highly controlled. This was difficult in corporate production that valued quantity over precision.
Frequency data collected to assess the quality of the molecular properties of carbon depended on
electric resistance tests as observations. Notable changes in the resistance measurements would
indicate heterogeneity in the carbon samples.35 Controllability was assessed down to the molecular
constitution of machine parts.36
Each year the Bell System produced upwards of 150,000 transmitters, a major and expensive
production process that Shewhart understood to be “out of control.” Homogeneity was intrinsically
impossible at each stage of production beginning with the raw granular carbon material from which
transmitters were made to the analysis of their production. Under commercial conditions, there were
clear problems with observation and estimation, as variation in the quality of product could occur at
any stage of the process from parts production to assembly. Beyond variability in the material and
process conditions, observers were limited by the economy of time. Statistical quality control was a
research philosophy that aimed to translate quality inspection into a concrete computational process
through delimiting the bounds of the controllable statistical state.
34 Shewhart, “Some Applications of Statistical Methods,” 47. 35 160330 Telephone transmitter, Richard C. Winckel, Western Electric, Filed: Sep. 2, 1924, Pub: Oct. 19, 1926. 36 Richard Winckel’s Western Electric diagram patent of a telephone transmitter captures the many material parts of the transmitter technology, each with their own material constitution and capacity for electricity.

128
Shewhart and his team of computers, Victoria Mial and Marion Carter, designed the Quality
Control Chart (QCC) to mechanize error management and establish mathematical control metrics.
The design of the chart was first produced from a large-scale data analysis conducted by Mial and
Carter. The guiding question in their interpretation was: “Do these data present any evidence of a
lack of control?” These women conducted the experimental results, which involved collecting
thousands of frequency observations, conducting statistical estimation calculations, and designing
graphical representations of the quality observations. They designed and calculated control as an
acceptable limit to error theory. That acceptable limit was defined as when the “four statistics”—
average, standard deviation, skewness, and kurtosis—fell within the limits established by current
practices of sampling theory.37 Shewhart emphasized that, “the preparation of such a chart requires
but a small amount of labor on the part of a computer,” papering over the amount of labor that
went into configuring it in an effort to underscore its promise of efficiency.38
By mechanizing the processes by which observational ‘error’ was measured and assessed,
authority over the production process blurred between the inspector and the inspection chart. The
37 Shewhart, Quality Control Charts, 601. 38 Ibid, 602.
Figure 18: W.A. Shewhart, “Quality Control Charts,” Bell System Technical Journal 5 no. 4 (October 1926): 600.

129
inspector was situated to think about engineering and industry production as both a physical and
mathematical process. Underpinning this reformulation of industrial processes was the
conceptualization of industrial data and engineering data as a distinct form of highly generative
statistical material.
In other words, manufacturing data was not homogenous, it was variant and entangled in the
physical machine processes from which it was generated. SQC therefore was a system of analysis
responsive to a particular kind of data manufacturing. The conceptualization of the QCC was drawn
in analogy with problems in physics to underscore the fact that there was both a physical and
mathematical processes as shown with the carbon microphones. The QCC was designed to isolate
and control specific factors that would improve the product—e.g. transmitters, telephones, etc.—
without changing the whole manufacturing process.39 Throughout the 1920s, the QCC and statistical
quality control more generally was promoted as a modernizing tool in industrial manufacturing.
This production logics reconfigured managerial control as a statistical program that could
achieve a “statistical control state” over manufacturing processes. This drove a strong progressive
narrative that mathematical control logics could transcend the manufacturing industry.
In the mid 1920s, SQC piqued the interest of mathematician and administrator Edwards
Deming, a mathematician working at the USDA’s Bureau of Nitrogen and Soil. A shared
modernizing effort to mechanize processes of data-driven research was evident in both industry
production and agricultural planning. For example, though technicians at Bell Telephone
Laboratories designed the QCC, the USDA widely proliferated this tool to advance agricultural
research pedagogy. In this vision, dreams of modernizing the United States economy were shared
between industrial practitioners and agricultural administrators. There was a shared initiative to
39 Shewhart, Quality Control Charts, 593.
130
‘modernize’ administrative and managerial processes through reformulating them as data-driven
research. In analogy with ‘manufacturing data’, agricultural data was described as ‘first principles’ and
‘elements’. The QCC would come to serve as a data architecture operable across both domains of
research.
At this time, The USDA aimed to bolster the U.S. economy by implementing a new
pedagogical initiative to train science researchers. Akin to the drive to modernize industrial
manufacturing, numerous administrators, politicians, scientists, and statisticians working for the
USDA were preoccupied with achieving authority over the central tenets of scientific research.
Increased discussion of ‘scientific first principles,’ ‘fundamental research,’ and ‘good data’ were
circulated. The shared interest in modernizing research across industry and agriculture provided the
conditions for SQC to become of central interest for the USDA’s Graduate School’s pedagogical
initiatives. Data-driven analysis became the ideal for this work. The USDA’s Graduate School hoped
to bring up a new regime of statistical researchers under the New Deal for the advancement of what
some envisioned as a better socialist society.
A new technocratic managerial class desired control over factory production for profit just as
the federal government desired to coordinate and control American farming for the advancement of
social welfare and economic control. The movement nonetheless achieved relative consensus across
the industrial-agricultural divide and between different scales of organization.40 I argue that these
domains shared a commitment to building a control state through data-driven research and new
methods of interpretation.
40 Deborah Fitzgerald, Every Farm a Factor: The Industrial Ideal in American Agriculture (New Haven: Yale University Press, 2003).

131
American Farm Data: The USDA Graduate School
Between 1920 and 1940, the United States Department of Agriculture acquired new authority as an
intermediary between federal oversight and state policy. Efforts to assert the USDA as a major
institution for social policy were heightened again during the New Deal period (1933-1940) as
President Franklin Delano Roosevelt’s administration held majority congressional power in
implementing new agricultural policy. The federal government went to work to try and coordinate and
control American farming.
The effort to coordinate and control American farming was catalyzed by a number of
considerable transformations beginning in the 1920s, when large-scale industrial farming
technologies such as tractors immediately impacted the landscape. But as Deborah Fitzgerald shows
in Every Farm a Factory, efforts to rationalize, organize, and industrialize American agriculture were
not just driven by new technology but by a new logic of production41—a future-looking industrial
ideal that the heterogonous patchwork of farming practices and problems could be made modern.
Undermining this ideal of a new farming society were the realities of social, economic, and climatic
crises. Economic depression, drought, fluctuating and dying commodities markets, and
impoverished farming communities brought the optimistic projection down to cold earth. In
response to these realities, administrators were emboldened in their drive to modernize agriculture
through statistical data control. They believed that agricultural science, research, and production
should be reconfigured by scientific principles and this would better the agrarian economy and the
lives of American farmers.
It has been well documented that both agriculture and industry experienced a turn towards
quantification during the interwar period. This was driven by larger enterprises such as
41 Fitzgerald, Every Farm a Factory, 16-17.

132
institutionalist economics but was also manifest in regional planning practices.42 In her study of
regional farm production, Fitzgerald rightfully situates this turn as a response to economic and
climatic crisis: “with the Great Depression coming fast on the heels of the farm depression, it is little
wonder that farmers became more numerically inclined by the 1930s.”43 Indeed, there was a grasp
for control over the shifting uncertainties of interwar agriculture that was thought to be recoverable
in numerical planning. A wide range of political agendas blurring corporate capitalist and socialist
ideologies motivated this turn towards a data-driven research agenda.
The USDA headquarters in Beltsville, Maryland became the central cite for this work. In
1921, President Warren G. Harding appointed Iowa-born Henry C. Wallace as Secretary of
Agriculture. Wallace was an ideal candidate for the position having “been in contact with actual
farming” his whole life.44 Periodicals emphasized his experienced roots as a “dirt farmer” and
suggested that he overcame this status through his agricultural college education, where he
“witnessed the discovery of important scientific principles and their practical application to
agriculture.”45 Despite his public climb to scientific and administrative power, Wallace remained
vigilant in his goal of addressing class discrimination in American farming as emblemized in his
posthumous 1925 book, In Debt and Duty to the Farmer.46 For Wallace, American farming was built on
poverty and this was an administrative problem that could be solved through advancing scientific
42 A good paper on the interwar formation of sociological labor data: Olaf F Larson and Julie N. Zimmerman, “The USDA’s Bureau of Agricultural Economics and Sociological Studies of Rural Life and Agricultural Issues, 1919-1953,” Agricultural History 74, no. 2 (Spring, 2000); and on the formation of social data: Dan Bouk, How Our Days Became Numbered: Risk and the Rise of the Statistical Individual (Chicago: Chicago University Press, 2015). 43 Fitzgerald, Every Farm a Factory, 74. 44 Olynthus B Clark, “Keeping Them on the Farm: The story of Henry C. Wallace, the secretary of agriculture, who has spent his life studying, teaching, improving and practising farming (sic)” The Independent 105 (1921): 333. 45 Olynthus B Clark, “Keeping Them on the Farm,” 333. 46 Henry C. Wallace, Our Debt and Duty to the Farmer (Central Company, 1925).

133
education. This approach to social welfare was of institutionalist economics, a class-conscious
movement emergent in 1918 that followed the work of Thorstein Veblen.47
Four years prior to his death, Wallace founded the United States Department of Agriculture
Graduate School to advance the education of USDA workers. Henry C. Wallace and his son Henry
A. Wallace, who would later be appointed Secretary by FDR in 1933, furthered an interest in income
distribution and a socialist view of farming labor that would significantly shape pedagogical
initiatives at the School. The New Deal science worker was to be trained in statistical methods and
socialist politics against what was described as the powerful mythologies of corporate capitalism.
Here there was a blurring of capitalist logics (profitable efficiencies in quality control) with a drive
towards ‘first principles’ that held radically different political and cultural meanings.
Immediately after taking his 1921 appointment, Henry C. Wallace announced the Graduate
School in an official statement: “The Department of Agriculture proposes to establish this fall an
unofficial system of advanced instruction in those scientific and technical subjects related to the
work of the Department, in which adequate instruction is not otherwise available in Washington.”
The purpose of the unofficial graduate school, according to Wallace, was “for greater usefulness
through better training and increased knowledge.” Two kinds of courses were offered the first were
“lecture and drill courses on […] certain fundamental subjects in which the personnel of two or
more Bureaus may be interested” and the second were “intensive graduate training in special
topics.”48 The school offered extended education for USDA employees to better their research work
and advance their participation in civic society. Located on the Department of Agriculture’s 13,000-
47 Thorstein Veblen, The Theory of the Leisure Class: An Economic Study of Institutions (New York: Dover Thrift Editions, 1994). 48 Unknown. 1921. “Plan to introduce graduate studies at the USDA Graduate School in 1921.” Special Collections, USDA National Agricultural Library. Accessed March 26, 2018, https://www.nal.usda.gov/exhibits/speccoll/items/show/8765.

134
acre farm in Beltsville, Maryland, the idea for the school stemmed from a study group conducted at
the Bureau of Standards in 1908. While it never established its own building, it held classes in the
Agricultural Department, in the Interior Department, and in the Smithsonian Institution.49 Under
the watchful eye of the public and congressional pundits, the school was careful not to use
government resources. Classes were held only in the early mornings and the late evenings to avoid
use of ‘government time’ and only the director received direct monetary support from the
government.
The Graduate School was established to “provide training for young scientific workers.”50 It
promoted a forward-looking education initiative of building a new economy through modern modes
of scientific research and socially conscious politics. Mathematical statistics was a central component
of this modernizing effort. In its founding year, the Graduate School offered courses in specialized
topics: Physics of the Air, Mathematical Statistics, Economic Entomology, Soil Physics, Agricultural Economics,
Plant Genetics, Plant Physiology, Animal Genetics, and Plant Cytology. Mathematical statistics was built into
the founding education initiative. Mathematician, Mr. H.R. Tolley taught the school’s first course,
“Statistical Methods” The course description stated its aims as:
A review course in the underlying principles, development and application of statistical methods, including application of averages, frequency distributions, measures of deviation, dispersion, association, and correlation. Methods of collection, tabulation, analyses, and preparation for publication will be illustrated. 51
The 1920s courses on statistical methods centered on methods based on the standard use of the law
of averages whereas later courses into the New Deal period were increasingly focused on new
49 Alfred Friendly, Agriculture’s School Is on the Upgrade. The Washington Daily News, Tuesday, August 30, 1938. USDA Graduate School Collection. Special Collections, National Agricultural Library. 50 Agriculture School in District Has No Diplomas, 3,915 Pupils. The Washington Post, Sunday, June 26, 1938. USDA Graduate School Collection. Special Collections, National Agricultural Library. 51 Course Promotional Materials. 1921. USDA Graduate School Collection. Special Collections, National Agricultural Library.

135
methods and models, including confidence intervals, null hypothesis tests, and statistical quality
control. From its inception, the statistical methods courses were attended by between 50% and 75%
women. The Department of Agriculture in Beltsville was an administrative center that employed a
number of women who were trained in accounting and bookkeeping and staffed as human
computers. The statistical methods courses were initially thought of as an extension of this work.
The Statistical Control State
On March 4, 1933, the Bell System’s Walter Shewhart gave a lecture at the Graduate School
on “The Specification of Accuracy and Precision.” The lecture was delivered the very same day and
hour that FDR delivered his inaugural lines, “The Only Thing We Have To Fear Is Fear Itself.”52
The new President advocated that day for engagement “on a national scale in a redistribution […] to
provide a better use of the land for those best fitted for the land […] helped by national planning for
and supervision of all forms of transportation and of communications and other utilities which have
a definitely public character.”53 This vision of America depended on a unified political order and the
formation of an administrative bureaucracy that could control these projects at the state and
institutional level.
Under the New Deal, the USDA Graduate school became a thriving educational center and
a permanent feature of the Beltsville farm, though still not endorsed or funded by government
bodies, which were predominantly under the control of subscribers to Hoover’s associative politics.
Throughout the 1930s, the school continued to receive widespread critique from local D.C.
52 Lectures and Promotional Materials, 1921-1976. USDA Graduate School Collection. Special Collections, National Agricultural Library. 53 Franklin D. Roosevelt (Franklin Delano), 1882-1945. Franklin D. Roosevelt's Inaugural Address of 1933. Washington, DC: National Archives and Records Administration, 1988.

136
politicians and national interests that wanted separation between ‘university’ and ‘government’. This
political backlash was heightened after the USDA began to implement New Deal legislation in 1933,
the year FDR instated Henry Wallace as Secretary of Agriculture. Like his father, Wallace believed
that the USDA had an important role in implementing New Deal programs on the state and regional
level. It was the USDA’s role to educate the scientific community and public on what they referred
to as first principled research and implement this policy through establishing a new bureaucratic
order that could sustain it.
Efforts to establish control at the state level and in scientific practice collided in the
pedagogical initiatives of the USDA Graduate School that were developed for both USDA
employees and the public. This included courses for USDA employees, a USDA Graduate School
printing press, and a number of public lectures and conferences. As the first wave of New Deal
policy was implemented, the Graduate School promoted statistical methods developed at the
Rothamsted Experimental Station outside London and the Bell Telephone Laboratories Statistical
Quality Control to educate their scientific workers: the “discoveries of this station have been so
outstanding that scientists from all over the world deem in a privilege to visit there and acquaint
themselves with its methods.”54
A long-standing tradition of the school was to host visiting speakers from statistical
experimental stations around the world. Edwards Deming directly facilitated exchanges with
statisticians at Bell Telephone Laboratories and the Rothamsted Station. As early as 1927, Deming
had become interested in the work of Dr. Walter Shewhart and Bell Laboratories. By 1933, Deming
facilitated Bell Telephone Laboratories and the Department of Agriculture to co-sponsor Shewhart’s
commissioned talks. These talks were organized under the umbrella topic of “The Statistical Method
54 John R. Mohler, Address to the Graduate School: Scientific Research, November 20, 1936, USDA Graduate School Collection. Special Collections, National Agricultural Library.

137
from the Viewpoint of Quality Control,” which would later become the title of Shewhart’s
influential 1939 book, due largely to the support of the Graduate School.55 Throughout 1933,
Shewhart gave four talks at the Graduate School on statistical control and the limits of variability.
Deming’s reflections on SQC makes clear the direct analogy drawn between industrial
manufacturing and agriculture in conceptualizing data-driven research. He said, “we in agriculture
are faced with the same problems” as in manufacturing.56 However, he argued that agriculture had
more at stake and was in greater need of control due to the temporal delays in sugar beet breeding.
He wrote:
When machines are turning out piece parts by the thousands or even millions month, the industrial statistician does not have to wait long to see [their] predictions tested out. In agriculture, years are often required—a crop must be sowed and harvested again and again […]. With time in our favor it is easy to become careless about fundamentals.57
Deming maintained that what agriculture should gain from industry was the concept of a statistical
quality control state, asserting that without control, “the statistician’s calculations by themselves are
an illusion if not a delusion.”58 While the process for achieving statistical control was indeed difficult,
Deming and Shewhart promoted the need for the control chart and attention to the physical
mechanism of the experiment or production process. Here agricultural testing and industry
production blurred as two iterations of the same method of computation. In Deming’s words: “The
state of statistical control [was] therefore the goal of all experimentation.”59
55 Walter A. Shewhart, Statistical Method from the Viewpoint of Quality Control (Washington, The Graduate School, USDA, 1939). 56 W. Edwards Deming, Foreward From the Editor in Statistical Method from the Viewpoint of Quality Control (Washington, The Graduate School, USDA, 1939): iv. USDA Graduate School Collection. Special Collections, National Agricultural Library. 57 Ibid, 1939: iii. 58 Ibid, 1939: iv. 59 Ibid, 1939: v.

138
Achieving a statistical control state was directly linked to market control in both industry and
agriculture. This sentiment is captured in another enthusiastic assessment from Deming:
When control (that is randomness) exists, the setting of limits within which certain percentages of the next 100 or 1000 measurements will lie is a purely statistical job, and the scientist’s work is finished when [s/he] turns over the data, so obtained, to the statistician. In this ideal sate of control, attainable in industry but hardly ever in the laboratory, such limits can actually be set, and as a matter of record are working in the economic advantage of both buyer and seller of raw materials and manufactured products. 60
In the ideal state of control, which was a computational process as well as an economic process, the
researcher could define the limits of uncontrollability and use this knowledge to their advantage. The
idea that data could be transferred from scientist to statistician underscores the new
conceptualization of statistical informatics as a commodified material in a modernizing state.
Under the New Deal, the United States Department of Agriculture became a dominant
institution in seeding scientific data production and collection. Increased references to ‘data’ as
‘industrial data’ and ‘engineering data’ in the case of Bell Laboratories and ‘agricultural data’ followed
the redefinition of statistics as a science of estimating and testing aggregated data in the name of
economic production. Data generated and circulated in the formation of the New Deal economy
held particular meaning for its administrators and practitioners. It was valued in terms of its
controllability.
Control Thinking for “A Better Society”
FDR’s two waves of legislation in 1933 and 1935 were geared to improving agriculture
through the formation of new bureaucratic bodies such as the Tennessee Valley Authority. This was
60 W. Edwards Deming and Raymond T. Birge, On the Statistical Theory of Errors, 1934. USDA Graduate School Collection. Special Collections, National Agricultural Library.

139
largely a response to Herbert Hoover’s “failing” associative state and to the collapse of laissez-faire
market capitalism more generally, which USDA administrators blamed for the current lack of
economic control in agriculture.61 FDR’s 1935 Resettlement Act emboldened the USDA in their
bureaucratic overhaul. Following the second wave of New Deal legislation in 1936, the Graduate
School hosted a series of lectures on the organizational culture and initiatives of the Department of
Agriculture, to help integrate New Deal policies into daily operations for administrative staff and
scientific workers.62 These lectures were organized into an official course for science workers to
teach “the purpose of the work they are doing [and] how it contributes to public welfare.”63 Wallace
was especially interested in treating the political miseducation of science workers who, he said,
unthinkingly subscribed to corporate capitalist or orthodox dogma.
Throughout 1936, statistical control methods, described as ‘research consultation,’ were
promoted as a necessary mode of “clear thinking” in improving scientific research and regulatory
work. Clear scientific thinking would provide the “foundation stones” to further Wallace’s vision
articulated by USDA Bureau of Animal Industry’s John R. Mohler:
1. The basic fact that research is the best means by which man controls and improves his environment
2. The knowledge that responsibility for conducting research rests on a relatively small group of persons having suitable ability and training
3. Research by Federal and State agencies is a wise investment authorized by Congress 64
Administrator John R. Mohler further advocated that mathematical statistics was key to thinking
clearly in all research work. Addressing the importance of ‘consultation’ across disparate fields and
departments, Mohler argued that cross-pollination was key to strengthening the USDA’s scientific
61 John R. Mohler, Address to the Graduate School: Scientific Research, November 20, 1936, USDA Graduate School Collection. Special Collections, National Agricultural Library. 62 Lectures 1927-1940, USDA Graduate School Collection. Special Collections, National Agricultural Library. 63 Graduate School U.S. Department of Agriculture, Special Series of Lectures on Department of Agriculture Objective. Lectures 1927-1940, USDA Graduate School Collection. Special Collections, National Agricultural Library. 64 John R. Mohler, Address to the Graduate School, 1936.
140
research directives. Part of the connective tissue, he contended, was knowing how to control
statistical data across various scientific fields. He emphasized, “Mathematics is now playing a very
important part in many lines of research work.”65
In a colorful example of ‘research consultation’ Mohler described a case where a biologist by
the name of Dr. Dorset “consulted other specialists freely” due to his recognition that all fields in
agriculture could enrich his knowledge. Dr. Dorset had wanted to know how many times he needed
to repeat his sugar beet field experiment so that the results were reliable “beyond a reasonable
doubt.” He obtained the answer from a well-trained statistician in the Bureau of Agricultural
Economics, M. Alexander Sturges:
A succession of seven positive results in a row in the same experiment gives, as the chance of error, only 1 in 128. By conducting the test three more times, getting 10 positive results in a row, the probability of error is only 1 in 1,024. In the type of work under consideration the probability of being right at least 999 times in 1,000 was deemed adequate.
Dr. Dorset’s problem generated in scientific research became a problem of statistical control. Even
though this example lacked the specific oversight of the QCC, it captured the popularizing idea of a
statistical control state, that it was adequate to be right 999 out of 1,000 times and the researcher
could therefore be confident in their assessment. Mohler concluded his ethnographic study of
scientific workers: “Knowing well that ‘all progress is wrought in the mystic realm of thought’, we
look to scientific workers to blaze the trail.”66
The turn to first principles in agrarian planning under the New Deal was deeply politicized.
Mohler used a popularizing terminology ‘superstitions’ to refer to the practices in laissez-faire market
capitalism and corporate governance that were thought of as currently rotting the minds of
65 John R. Mohler, Address to the Graduate School, 1936. 66 John R. Mohler, Address to the Graduate School: Scientific Research, November 20, 1936, USDA Graduate School Collection. Special Collections, National Agricultural Library.

141
Americans, preventing them from thinking clearly. He argued that these “unscientific forces” were
the enemies of progressive agrarianism, and that “the curious ceremonies” surrounding these
enterprises produced “superficial” and unscientific knowledge.67
The Politics of “First Principles”
In 1938 and 1939 the USDA Graduate School hosted a third series of widely-publicized
lectures on ‘American Democracy’ just as the school was falling under widespread public critique for
its use of government funds and perceived authoritarian socialist politics.68 A public discourse of
fear of too much control fell over the school and its research programs. In February of 1938 the
Washington Times announced the democracy talks, depicting Secretary of Agriculture Wallace as the
“Farm Fuehrer.”69
Visiting British statistician Hyman Levy spoke on the relationship between science and
democracy. Levy was at the time both a member of the British Labor Party and the Soviet
communist party. His talk resonated with the importance of unifying science towards progressive
ends, stressing the point that statistical work was not an apolitical enterprise. That same year his
book on modern science was published, developing a thesis that offered a Marxist analysis of
scientific production akin to that produced by Boris Hessen a few years earlier. Levy maintained that
‘democracy’ was strictly a product of industrial force, using Isaac Newton’s work as an example of
science that was produced by commercial and other social factors. In explicit consideration of the
67 For a leading example of this rhetoric, see: Thurman W. Arnold, The Folklore of Capitalism (Yale: Yale University Press, 1937). 68 In attendance were various statisticians, administrators, economists, and scientists concerned with the state of democracy, including émigré physicist Albert Einstein. 69 Unknown, Washington Times, February 23, 1938. USDA Graduate School Collection. Special Collections, National Agricultural Library.

142
political nature of ‘first principles’, Levy critiqued the Vienna circle as an apolitical campaign. “There
is a school of philosophy of which many of you must know, the logical positivists, who consider that
the essential problem is to discover how to ask a question. They are not concerned with the actual
question so much as the way in which the question should be asked.” Levy also admitted that,
“Today in Europe it is rather dangerous to ask questions; it is much safer to discuss how a question
should be asked.”70
Despite the political backlash seen in the school’s lack of support from Congress and in
critical public opinion, SQC education was in full fruition by the late 1930s. In 1938, Graduate
School Director A.F. Woods published a letter addressed to the “statistically minded research
workers in Washington” announcing the return lectures by Walter A. Shewhart of New York’s Bell
Telephone Laboratories.71 By this time, Shewhart was president of a joint committee of the
American Society for Testing Materials, the American Society of Mechanical Engineers, the
American Statistical Association, and the American Institute of Statistics. Through the formation of
these committees, SQC was situated as a guiding approach to economic planning. It was gaining
momentum as a modernizing ideal in capital production and scientific research. Woods wrote, “The
officers and staff of the Graduate School are highly desirous that he contents of this letter be given
as wide publicity as possible.”72
By 1938, the Graduate School offered 125 courses up from 70 in the previous years and half
of these were method-based courses: 17 accounting and mathematics courses, 17 in economics and
70 Quoted in George A. Reisch, How the Cold War Transformed Philosophy of Science: To the Icy Slopes of Logic (Cambridge: Cambridge University Press, 2005). 71 A.F. Woods, Letter to Statistically Minded Research Workers in Washington, February 1938. USDA Graduate School Collection. Special Collections, National Agricultural Library. 72 A.F. Woods, Letter to Statistically Minded, 1938.

143
law, and 16 in statistics.73 The QCC was increasingly thought of as the technical expression of
method-based thinking in scientific research and public welfare. Deming edited dozens of talks and
books on achieving statistical control in agrarian research. Out of eleven texts officially published by
the USDA Graduate School, half of them were a promotion of Quality Control.74 The 1939
Graduate School publication, Statistical Method from the Viewpoint of Quality Control became the
textbook on SQC logics. Miriam Harold, formerly Miriam Carter, produced the book for Shewhart
and Deming: she accumulated and analyzed the data for the case studies, designed the figures, and
compiled the contents.
Statistical quality control was promoted as a new managerial science that could benefit all
branches of economic oversight. The Statistical Method textbook began with a grandiose history of
control logics dating back to 8,000 BC, when humans were first attempting to fit of stone parts
together.75 The timeline titled “Some Important Historical Stages in the Control of Quality” showed
“little, if any, control” from 1,000,000 BC to 300,000 BC, which was “the beginning of control.”
The following historical stages included, 1787—the introduction of interchangeability; 1870—the
introduction of ‘go-no go limits’ in manufacturing; and, finally, the crowning achievement in 1924—
the advent of the Quality Control Chart.76 Shewhart and Deming’s promotional and pedagogical
materials continued to print during WWII and increased during the 1950s under the auspices of the
burgeoning managerial sciences.
73 Friendly, Alfred. Agriculture’s School Is on the Upgrade. The Washington Daily News, Tuesday, August 30, 1938. USDA Graduate School Collection. Special Collections, National Agricultural Library. 74 Graduate School Publications. USDA Graduate School Collection. Special Collections, National Agricultural Library. 75 Walter A. Shewhart, Statistical Method from the Viewpoint of Quality Control (Washington, The Graduate School, USDA, 1939): 6. 76 Shewhart, Statistical Method from the Viewpoint of Quality Control, 7.

144
The 1924 QCC design constitutes an effort to mechanize control as a mathematical limit in
machine processing and computational work. Prior to this moment, control held technical and
affective but not axiomatic meanings in industrial processes. Within confidence logics—confidence
intervals and null-hypothesis—control held slippery meanings as processes of randomization were
highly debated in statistical field work. The merging of these two logics, gave a distinctive meaning
to control that adhered to progressive ideologies of corporate capitalism. Akin to procedures in the
larger confidence computing movement, the chart was a visual representation of computing steps
that the managerial inspector “could view at a glance,” thus reducing human computational and
managerial labor in quality control oversight. This move reflected the larger cultural commitment to
control that had galvanized during the progressive-era industrial revolution as a guiding logic in
reconfiguring industrial managerial labor. SQC logics mechanized control as a computational
process and a mathematical limit to error analysis.
The politics of control logics shown in this chapter raise important questions about the role
of data analysis in stabilizing political-economic processes. In this story we see a complicated
blurring of socialist and capitalist ambitions at the level of the QCC and confidence logics as they
proliferated in agricultural planning. The transformations in administrative oversight that I have
outlined hold significant implications for agriculture. Edwards Deming and Walter Shewhart’s
friendship is emblematic of the marriage between industrial manufacturing and agriculture that
galvanized during the New Deal period. During this time, scientific research initiatives in agriculture
merged with industrial planning logics and were rewritten as “essentially statistical.” Radically
distinct social enterprises in agriculture and industrial manufacturing were thereby reconfigured to
be part of the same epistemic and procedural program. At the root of this transformation was
conceptualizing data—collected from frequency observations of machine parts on an assembly line
or collected in soil and harvesting samples—as probability data. Given the mass levels of production

145
in the telephone and sugar beet industries, estimation methods became the means by which labor
could be reduced as they operated on small sets of randomized data as opposed to the entire
experiment.
In 1947, Charles Sarle, administrator of the Bureau of Agricultural Economics, wrote on the
relationship between corporate agriculture and statistical oversight:
As a nation’s economy becomes more diversified and complex, demand for agricultural statistics increases. Demand is not only for broader coverage of agriculture, but also for other facts relating to the ever-changing agricultural process, for statistics at more frequent intervals, and for greater accuracy. This demand is accelerated by the strain put upon a nation’s economy at war. When national economies are subjected to world-wide depression and governments embark on production control and price-support programs, the demand for more and better agricultural statistics increases almost overnight. 77
In this passage, Sarle speaks to the role of crisis in catalyzing the need for control and the generation
of information and systems of information that occurred in the New Deal era. The processes of mass
industrialization and managerial oversight that transformed U.S. agriculture created a demand
economy for probability data. As indicated here, this was only emboldened by WWII that had put a
strain on agricultural production, especially sugar, in the war time economy.78 Analysts noted that
WWII galvanized a corporate agricultural economy that hinged on control logics: “Before the war,
77 Charles F. Sarle, “The Agricultural Statistics Program,” address 25th session, International Statistical Conferences, Washington, D.C., September 13, 1947. https://www.nass.usda.gov/Education_and_Outreach/Reports,_Presentations_and_Conferences/Yield_Reports/The%20Agricultural%20Statistics%20Program.pdf 78 On the early Cold War sugar beet industry, see: H.S. Owens, “Production and Utilization of Sugar Beets,” Economic Botany 5, no. 4 (1951): 348-366; H.G. Stigler and R. T. Burdick, “The Economics of Sugar-Beet Mechanization,” Bulletin 411-A (Agricultural Extension Service, Fort Collins,) April, 1950; H.B. Walker, “A Resume of Sixteen Years of Research in Sugar-Beet Mechanization,” Agricultural Engineering (1948): 425-30; P.B. Smith, “A Survey of Sugar-Beet Mechanization” (Fort Collins, 1950, mimeographed); R.K. Smith, “State Frontiers in Agricultural Statistics: Discussion,” Journal of Farm Economics 31, no. 1 (1949): 304-308.

146
the tractor was […] calling attention to the importance of controlled spacing of seedling by precision
planting. […] Processed seed, introduced in 1942, was almost universally adopted by 1947.”79
These efforts to attach economic control to the control of mathematical experimental design,
that came into fruition during the New Deal initiatives, would galvanize in bombing campaigns and
weather control programs during WWII and the Cold War decades. New Deal planning initiatives
established a number of computing principles in state and social management—randomization, the
law of large numbers, inferential management, and industrial data—that would come to fruition in
the wartime economy in the form of new military computing methods. A precedent was set in New
Deal planning that would achieve new heights—from 10,000 feet—during WWII. Efforts to map
populations and landscapes into a series of controlled statistical experiments is a defining feature of
twentieth-century quantitative governance. Significantly, beginning in the 1990s, there has been a
resurgence of SQC Big Data algorithms, a control oversight that was formerly conducted by human
practitioners.80 SQC and the computing concept of control more generally is a prolific belief that
electronic digital computing processes are in control of data.
Chapter 3, contains material as it will appear in Dryer, Theodora. “Seeds of Control:
Algorithmic Computing and the New Deal Farm Economy, 1933-1940” in Algorithmic Modernity, eds.
Massimo Mazzotti and Morgan Ames. Forthcoming with Oxford University Press. The dissertation author
was the sole author of this material.
79 Boris C. Swerling, “United States Sugar Policy and Western Development,” Proceedings of the Annual Meeting (Western Farm Economics Association) 24 (1951): 7 -11. 80 For an example of an SQC algorithm, see: A. Smirnov, B.N. Holben, T.F. Eck, O. Dubovik, “Cloud-Screening and Quality Control Algorithms for the AERONET Database,” Remote Sensing of Environment 73, no. 3 (2000).

147
Chapter 4: (Un)certainty
Machine over Mind
Uncertainty Work in India’s Rural Reconstruction Programs and as U.S. Military Method
Yes or No?
In 1945, United States polymath Herbert Simon published an overview of current scholarship in
statistical hypothesis testing, asking whether statistical methods could aid with binary, “yes or no”
decision-making. Simon was then a professor of Political Science at Illinois Institute of Technology,
where he worked closely with the Cowles Commission for Research in Economics, as part of his
Figure 19: Composite Plot of Incendiary Sticks” in “Bomb Patterns” appendix to M. Eudley, et. al., “A Cooperative Study.” Neyman Papers, Carton 5, Bancroft Library, University of California, Berkeley.

148
interest in the growing field of U.S. econometrics. This was an enterprise geared to reconfiguring
economic processes according to algorithms designed to achieve optimality and efficiency.1
Simon’s review of trends in mathematical decision making explicitly critiqued Polish
mathematician Jerzy Neyman’s agricultural work of the past decade and statistical hypothesis-testing
more generally. Simon had a decided preference for the null-hypothesis model, which he deemed to
be a crucial apparatus in binary decision-making. Neyman and his best friend Egon Pearson had
designed the null-hypothesis experiment in mid-1930s London, but its circulation among U.S.
mathematicians spiked during World War II. For Simon, the null-hypothesis model offered a
preferred statistical method, with more concrete outcomes. He wrote: “Tests of significance were
originally conceived as a means of measuring the “degree of certainty” or conversely the “degree of
doubt” of statistical conclusions […] now decisions are all-or-none phenomena. Even the decision
“to doubt” or “not to doubt” represents a clear dichotomy.”2
Simon was not alone in his thinking. Following the end of WWII, experts and public alike
hailed the vaguely-defined ‘statistical method’ as a defining technology in “yes or no” decision-
making. These discourses – driven by the growing belief that mathematical oversight had helped
“win the war”3 – were fueled further by technological dreams of new electric computing machines.
1 For institutional history on the Cowles Commission’s influence in econometrics, see: Phillip Mirowski, Machine Dreams: How Economics Became a Cyborg Science (Cambridge: Cambridge University Press, 2002); Phillip Mirowski, “The Cowles Commission as an Anti-Keynesian Stronghold, 1943-54,” Microfoundations Reconsidered (Edward Elgar Publishing, 2012); Carl F. Christ, “The Cowles Commission’s Contributions to Econometrics at Chicago, 1939-1955,” Journal of Economic Literature 32, no. 1 (1994). 2 Herbert A. Simon, "Statistical Tests as a Basis for "Yes-No" Choices." Journal of the American Statistical Association 40, no. 229 (1945): 80. 3 The first formal announcement that applied mathematics had helped win the war was: Vannevar Bush, James B. Conant, and Warren Weaver, “Probability and Statistical Studies in Warfare Analysis,” Summary Technical Report of the Applied Mathematics Panel, NRDC, Washington D.C., 3 (1946). In 1980, military mathematician Mina Rees wrote a declarative piece on wartime mathematics in the United States: Mina Rees “The Mathematical Sciences and World War II,” The American Mathematical Monthly 87, no. 8 (1980): 607-621. Recent scholarship on the role of United States Mathematical Sciences during WWII: Brittney Anne Shields, “A Mathematical Life: Richard Courant, New York University and Scientific Diplomacy in Twentieth Century

149
In these future-looking descriptions, statistical methods often functioned as part of machine
cognition. In 1949, the popular Scientific American published a piece on ‘Mathematical Machines,’
stating “A NEW revolution is taking place in technology today […] the mechanization and
electrification of brains.”4 The ‘revolution’ here was a total displacement of human calculation,
communication, and control with information-processing systems that could produce “an ‘on’ or
‘off’ signal […] a decision between ‘yes’ and ‘no’ […] a judgement as to ‘more’ or ‘less’ […] a logical
discrimination among ‘and,’ ‘or,’ and ‘neither.’”5 These decision-making machines were imagined to
take over ‘subjective’ procedures such as medical diagnosis, which were previously considered
“important multidimensional, multivariate and multidecision problem[s] of mathematical statistics.”6
America,” (PhD diss. Pennsylvania University, 2015); Alma Steingart, “Conditional Inequalities: American Pure and Applied Mathematics, 1940-1975,” (PhD diss. MIT, 2013). 4 Harry M. Davis, "Mathematical Machines." Scientific American 180, no. 4 (1949): 30-31: “The Digital Idea: The digital computer is distinguished by the fact that it does not measure; it counts. It never responds to a greater or lesser degree; at every stage of its action, it is an “all or nothing” device, operating with discrete signals that either exist or do not exist.” 5 Davis, "Mathematical Machines," 28-29. 6 J. A. Rafferty, "Mathematical Models in Biological Theory." American Scientist 38, no. 4 (1950): 549-79.
Figure 20: “Mathematical Machines,” Scientific American 180, no. 4 (1949)

150
From medical diagnostics to bombing strategy calculations, decision-making machines promised
‘certainty’ and ‘instantaneity’ in decision-making processes. The electrification of brains meant that
decision-making processes previously carried out by human hand-labor calculations, and priced in
time frames of days, weeks, and months, could be reduced to mechanical seconds.
Today, Herbert Simon is hailed as the pioneer of decision-theory and algorithmic computing
and indeed as the originator of the concept of ‘bounded rationality.’7 I begin this chapter with Simon
in order to pinpoint a distinct moment when mathematical statistics was positioned as the basis of
mechanistic (non-human) planning and as a foundational architecture in the design of electric
computing machines. Furthermore, 1945 has become the historiographical origin point of the
twentieth-century computing sciences, including algorithmic theory, information science, and the
decision-making sciences, of which Simon was a prominent part. But these were part of a wider
context, which has so far been overlooked.8 What I designate as the rise of mathematical certainty-
making projects in the 1950s and 1960s United States indicates a larger shift in social epistemology.
In this time period, the probabilistic worldview was increasingly accepted as a sufficient explanation
of knowledge, aligned to an advancing politics. This social epistemology drove business logics,
7 For example: James G. March, "In Memoriam Herbert Simon (1916-2001)." Journal for East European Management Studies 7, no. 1 (2002): 55-56; Ernest H. Weinwurm, "Measuring Uncertainty in Managerial Decision Making." Management International 3, no. 3/4 (1963): 114-22; Herbert A. Simon, "Rational Decision Making in Business Organizations." The American Economic Review 69, no. 4 (1979): 493-513. For Simon’s first printed articulation of bounded rationality, see: Herbert Simon, Models of Man, Social and Rational: Mathematical Essays on Rational Human Behavior in a Social Setting (New York: Wiley, 1957). For recent literature on the term itself see: Hunter Crowther-Heyck, “A New Model of Mind and Machine,” in Herbert A. Simon: The Bounds of Reason in Modern America (Baltimore: Johns Hopkins Univ. Press, 2005); Henry M. Cowles, William Deringer, Stephanie Dick, and Colin Webster. "Introduction." Isis 106, no. 3 (2015): 621-22. 8 On the history of Herbert Simon’s influence on decision sciences, see: Stephanie Dick, “Of Models and Machines: Implementing Bounded Rationality,” Isis 106, no. 3 (September 2015): 623-634; Hunter Crowther-Heyck, “Patrons of the Revolution: Ideals and Institutions in Postwar Behavioral Science,” Isis 97, no. 3 (2006): 420-446; Nathan Ensmenger, “Is chess the drosophila of artificial intelligence? A social history of an algorithm,” Social Studies of Science 42, no. 1 (2012): 5-30. Carolyn R. Miller, “The Rhetoric of Decision Science, or Herbert A. Simon Says,” Science, Technology, & Human Values 14, no. 1 (1989): 43-46; Nils-Eric Sahlin, Annika Wallin, Johannes Persson, “Decision Science: From Ramsey to Dual Process Theories, Synthese 172, no. 1 (2010): 129-143.

151
market logics, public health metrics, and scientific assessments, to name but a few of the probability-
driven social infrastructures. 1950s and 1960s uncertainty management programs hinged on the
promise of binary or singular outcomes as well as the concept of instantaneity in mathematical
computing processes.9
I argue against the idea of a progressive linear shift from prewar, doubt-laden statistical
estimation to certainty computing methods at the dawn of the digital age. This technologically
determinist explanation of the mechanization of statistical computing obscures the significant
cultural, political, and epistemological dimensions to this history.10 Firstly, uncertainty management
is a transnational and transdisciplinary story. As shown throughout this dissertation, the
mathematical statistics movement was a multinational information movement involving the
widespread exchange and proliferation of new computing methods that were made manifest in local
contexts. The cultural and technological values and computing concepts fueling this movement were
complex and layered in their meanings, applications, and politics. They involved a wide array of
actors and interests in global trade and agricultural development, in industrial planning, and in
biometrics and social statistics. Uncertainty was no different. Secondly, the creation and use of
probability tools and probability data involved complex interplays between two epistemic projects: 1.
delimiting uncertainty within computing work, and 2. providing evidence in decision-making
9 “A Model Airforce” talk given in 1948, from Stanford University Archives, Additional Materials: Guide to the George B. Dantzig Papers—SC0826; ACCN-2006-167, Box 11, Folder 6. 10 A major driver of this narrative are the fields of operations research, decision-science, and expert systems learning that came to power in the 1950s and 1960s. See, for example: Herbert A. Simon, George B. Dantzig, et. al., “Decision Making and Problem Solving,” INFORMS 17, np. 5 (1987): 11-31; Herbert A. Simon, “Theories of Decision-Making in Economics and Behavioral Science, The American Economic Review 49, no. 3 (1959): 253-283; Martin Shubik, “Studies and Theories of Decision Making,” Administrative Science Quarterly 3, no. 3 (1958): 289-306; William A. Wallace and Frank De Balogh, “Decision Support Systems for Disaster Management,” Public Administration Review 45 (1985): 134-146.

152
processes towards certain outcomes. These are not linear steps but processes that occur at the same
time.
Putting binary decision logic into a wider context raises some intriguing historical and
philosophical questions. If mathematical statistics—as shown in the first two chapters—was a
movement to design data architectures that could translate points of unknowability into probabilistic
language, where uncertainty is < 1, then how did this become a basis for binary decisions, where
probability is either 1 or 0? Furthermore, at what point did so many become committed to the
probabilistic world view (uncertainty) as the dominant epistemological framework for computational
work, data management, and numerical oversight? And how does this commitment to certainty-
making as social epistemology tie into military control?
The latter question marks a shift from management of uncertainty to the political production
of certainty outcomes. I contextualize this shift in the rising aerial-bombing economy at mid-century.
The conditions of U.S. militarism, which dominated the geopolitical landscape in the twentieth
century, saturated computing work with values of optimality that killed the earlier philosophy of
science movements. The computing concepts engaged in chapters two (confidence) and three
(control) of this dissertation clearly embraced the impossibility of mathematical certainty. The Polish
measure of confidence (ufności) was a spatially-represented measure of confusion, with ‘certainty’
operating as a heuristic limit. The control logics guiding the U.S. agricultural programs promised a
controlled state of randomized information within larger processes of inherently uncontrollable data,
both physical and mathematical. Optimality, like these other computing concepts, holds a variety of
meanings and expressions. As I will show in this chapter, optimality is technical approach to
computing that privileges yes/no outcomes and efficient methods. It also a way of seeing, a visual
standpoint that was generated from 10,000 feet.

153
In this chapter, I aim to contextualize Simon’s uncertainty binary by again situating CI data
production and architectural design within a larger genealogy of mathematical uncertainty hearkening
back on the material crisis physics and foundational crisis in mathematics at fin de siècle described in
earlier chapters. Continuing to explore the development and proliferation of CI logics, I contrast the
computational work involved in post-colonial anthropometric laboratories in India, with that of
Allied military campaigns. In analyzing the latter, my geographic contexts or ‘data laboratories’
extend to areas in North Africa, India, Germany, Japan, and Indigenous and U.S. National Park
Land that were transformed into what I call ‘destruction data’ sites. This work enfolded the mass
collection of bombing data into the cyclical production of uncertainty computations used to
rationalize military tactics.
In earlier chapters, my foray into uncertainty began in 1920 and 1930s when null-hypothesis,
fiducial limits, and confidence intervals were used to define different modes of uncertainty
computation. Surrounding this work was a potent anxiety about the probabilistic world view that
shaped the larger culture of research and politics at University College London. The ‘probability
problem’—whether or not this epistemological world view could and should reign over society—
was rigorously debated throughout the logical empiricist movement, and in economics and physics
research. This crisis of epistemes catalyzed different avenues of research and different political
responses. But it was, in fact, the shared intellectual and political preoccupation of computational
research in the interwar period. The probabilistic worldview had been rapidly gaining power and
prominence since the turn of the century, and this was a dramatic moment of self-reflexivity.
Uncertainty was a widely contested social epistemology; it was not an assumed explanation of the
world, nor was it rote and mechanistic.
During WWII, military-driven research reconfigured uncertainty management processes,
ultimately black-boxing their preexisting complexities within a shell of certainty-making procedures.
154
Throughout WWII, earlier political and philosophical engagements with computational uncertainty
did not go away but were obscured by a new “labor of calculation” promulgated by mathematicians
working as military personnel that upheld optimality.11 These certainty-making politics ultimately
worked to legitimate military violence and American expansion on the world stage.
This production of military certainty is what I designate as ‘bombsight optics.’ The mass
destruction of civilian areas in allied bombing campaigns was ultimately documented and archived in
terms of likelihoods and binary measures—the success or failure outcomes of their predictions.
WWII reconfigured interwar (un)certainty work with all the force and impact of the U.S. aerial
bombing economy. Both the outer shell of their research—the promise of certainty in military-
economic decision-making—and the complexities undergirding this promise, have persisted into
late-twentieth- and twenty-first-century digital and big data computing initiatives.12
I argue that the complexities of interwar (un)certainty have not disappeared. By developing
this longer history of uncertainty as a logical framework for social and scientific explanation, its
function in late-twentieth- and twenty-first-century computing and society can become visible. In
Simon’s view, the effort to confront and manage the limits of uncertainty in interwar agrarian
experimentation was only a precursor to a more valid program: “that statistical tests must give yes-
or-no answers.”13 Was 1945 Herbert Simon correct? Did the tendency to measure degrees of
uncertainty and doubt constrict into an improved binary architecture that could achieve certainty?
My answer to Simon is yes and no.
11 Desire for Pentagon based computing technology found in a prospectus titled “Prospectus for an AF Mathematical Computation Center,” from Stanford University Archives, Additional Materials: Guide to the George B. Dantzig Papers—SC0826; ACCN-2006-167, Box 2, Folder 23. 12 Comprehensive overview of OR literature and the use of ‘war memory’ in founding and expanding the Cold War decision-sciences. 13 Herbert A. Simon, "Statistical Tests as a Basis for "Yes-No" Choices," Journal of the American Statistical Association 40, no. 229 (1945): 80-84.

155
Uncertainty in Kolkata, India
In the same post-war moment when machine brains and the impulse of “yes or no” certainty
began to dominate the technocratic imagination in the United States, some prominent agrarian
administrators remained staunch in their prewar commitment: that one could only measure the limits of
uncertainty, never certainty itself. What was at stake was not a matter of semantics, but a loss of control
over prewar establishments. While United States statistics institutes rapidly reconfigured their work
for the aerial bombing economy, other national statistics enterprises held more stake in their
preestablished technoeconomic orders. The Indian Statistical Institute (ISI) headquartered in
Kolkata, India, for example, continued to expand its agricultural and anthropometric programs
through WWII and the period of decolonization, when it was officially recognized by India’s
parliament in 1956. Throughout this time, the ISI advanced uncertainty management in population
studies and economic analysis. Confidence logics were at work in colonial education initiatives, in
farming labor calculations, and as a legitimating logic for India’s racialized caste system.
Anglophone conceptions of mathematical statistics were at work through the ISI. For
example, throughout the 1930s, Pandurang Vasudeo Sukhatme and Egon Pearson worked together
on confidence intervals and fiduciary limits to capture uncertainty in sampling small databases.14
This was a small data problem. Small data problems were problems where the standard deviation, and
therefore the mean value of a sampling set, was unknown. Visual diagrams demonstrated how a very
small calculation of uncertainty could be mapped out into calculable regions. In fact, it was precisely
the insufficiency of the data that made this analysis possible. Pearson and Sukhatme wrote: “An
14 E.S. Pearson and A.V. Sukhatme, “An Illustration of the Use of Fiducial Limits in Determining the Characteristics of a Sampled Batch,” Sankhyā: The Indian Journal of Statistics (1933-1960), 2, no. 1 (1935): 13-32.

156
important point which these diagrams illustrate clearly is the great range of uncertainty that must
exist inevitably when estimates of a standard deviation are made from a small sample.”15 Diagrams
were important visual tools in representing the precision values of estimation, e.g. with 90%
confidence limit chosen in advance, plotted against the real number of samples. This chart is a
bounded representation of all the possible measures of uncertainty, given the small sampling data,
and the predetermined confidence level chosen at 90%. This example was a rote part the
pedagogical initiatives run by the ISI.
Despite training in industrial and corporate applications of CI logics, agriculture and
populations studies were the central sites for interwar (un)certainty work in India. This was catalyzed
in part from the wave of rural reconstruction initiatives that began in the 1920s. Statistical oversight
functioning through institutes like the ISI also held providence over a network of local institutes. By
the mid-1930s, (un)certainty work was a growing computing practice in India’s agricultural
administration. The statistical laboratory at Kolkata held oversight in the field of agriculture with
15 E.S. Pearson and A.V. Sukhatme, “An Illustration of the Use of Fiducial Limits,” 21.
Figure 21: “An Illustration of the Use of Fiducial Limits in Determining the Characteristics of a Sampled Batch,” Sankhyā: The Indian Journal of Statistics (1933-1960), 2, no. 1 (1935): 13.

157
studies that included: crop census, effects of pests on sugarcane, soil deterioration, effect of feeds on
yield of milk, cotton experiments, marketing and yields of rice, and many more. One example is the
Visva-Bharati Institute in Bolpur, where they collected data from villages, houses, and observatories
on the production and circulation of agricultural goods.
Statistician Santipriya Bose’s 1936 study of rice profit estimates in the village of Bolpur
exemplifies the conceptions of ‘uncertainty’ that prevailed in ISI’s 1930s planning initiatives.16
Uncertainty was considered to be an inherent component of any statistical estimation process. It was
a normal part of estimation work that could be identified in calculable profit margins and delimited
by confidence intervals. An unquestioned belief guiding this work was that the more robust the data
set, the more likely one could delimit uncertainty. In her analysis of rice production, Bose considered
her data to be a near complete labor and production information set, which allowed her to “easily
calculate the uncertainty of the difference between the value of the produce and the cost of human
labor.”17
Bose’s analysis of human labor was organized into a caste hierarchy of laborers who worked
within the larger system of rice cultivation.18 In her study, there was no bargā or land given out on
lease for a shared basis. The owners cultivated with the help of “family labor” māhindar—farm
servant paid in cash plus food and krishān—landless farm laborer paid in cash plus food. Labor was
calculated in terms of “man-days” per acre. Wages for labor varied between two and half annas and
five and a half annas per diem. Bose valued the labor in terms of capital production. For example,
16 Santipriya Bose and P.C. Mahalanobis, “Marketing of Rice at Bolpur,” Sankhyā: The Indian Journal of Statistics (1933-1960), 2, no. 2 (1936): 105-124. 17 Santipriya Bose, “Marketing of Rice at Bopur,” 106. 18 See: Sankyā 91 (1937): “Marketing of Rice at Bolpur: The marketing of rice at Bolpur has been studied in relation to the the cost of production, and a number of different factors such as rice-mills, brokers, stockists, freight, and transport. Although the cultivator supplies both capital and labour and bears the greater part of the risks of profit goes mostly to the middlemen. A paddy pool is likely to be helpful but will require a working capital of at least ten lakhs of rupees to be successful in this area.”

158
she wrote, “The cultivator although the most important agent as producer is the worst sufferer. He
is a financier who has to supply his own capital, he has to work himself as a labourer, and on top of
it he bears all the risks.”19 She decided that because of her robust information set, there was low
uncertainty in calculations pertaining to labor cost estimates, but that estimating the cost for
cultivators who did and did not own land held wider margins of uncertainty—indeterminate
uncertainty.
Bose defined an “indeterminate” uncertainty that occurs when either the data, or the
processes by which the data had been measured and assessed, could not be accounted for
mathematically. For example, if a human computer employs a quantitative value in the estimation
work that was intractable, the calculations would yield, “an undetermined margin of uncertainty.”20
This is to say that if a value for something like labor cost is estimated without recorded evidence or a
clearly outlined method of estimation, this obscures the entire estimation or hypothesis-testing
process. Indeterminate uncertainty is therefore not measurable, and intervals cannot be drawn to
delimit it. In the case of marketing rice at Bolpur, “indeterminate uncertainty” was a product of the
political structure of the data. Due to the fact that the cultivator was valued to have the highest labor
risks as the sole financier, and their work was not measurable in terms of acreage and man hours like
the lower classes of laborers, this generated an indeterminate uncertainty in calculating estimating
their labor cost.
Bose’s assessment of rice profits outlines the two main interpretations of (un)certainty work
in the context of India’s rural reconstruction program. Uncertainty calculations that were focused on
the margin of error in estimating labor costs, reaffirmed the preexisting labor structure at the level of
data and analysis.
19 Bose, “Marketing of Rice at Bopur,” 119. 20 Ibid, 106.

159
The rationalizing efforts of rural reconstruction initiatives and anthropometry programs
were the two most prominent domains of statistical-computing research in 1920s and 1930s India.
Without the immediate impacts of a rapidly-growing aerial bombing economy, as in the U.S.
context, these uncertainty management programs continued to gain power through the 1940s and
1950s. As treated in Kavita Philip and Benjamin Zachariah’s comprehensive studies,21 India’s
century-long history of anthropometric work in measuring and categorizing human difference was
emboldened in 1945, when Mahalanobis and industrialist Rajendra Nath Mookerjee designed and
implemented a powerful statistical anthropometry program.22 Their 1945 Anthropometry Survey of
Bengal, India was organized and driven by uncertainty management logics. These programs were
designed to quantify ‘social capacity’ along racialized caste lines, exemplified by their map of
21 Kavita Philip, Civilizing Natures: Race, Resources, and Modernity in Colonial South India (Rutgers University Press, 2003); Benjamin Zachariah, “Uses of Scientific Argument: The Case of ‘Development’ in India, c 1930-1950,” Economic and Political Weekly 36, no. 39 (2001): 3689-3702. 22 See: D.N. Majumdar, C. Radhakrishna Rao, and P.C. Mahalanobis, “Bengal Anthropometric Survey, 1945: A Statistical Study,” Sankhyā: The Indian Journal of Statistics (1933-1960) 19, no. 3/4 (1958): 201-408.
Figure 22: D.N. Majumdar, C. Radhakrishna Rao, and P.C. Mahalanobis, “Bengal Anthropometric Survey, 1945,” 212.

160
“Undivided Bengal showing the districts and some of the important centers visited for obtaining
samples of individuals.”23 In their 1945 study, after dividing 3,250 people into districts according to
caste, religious affiliation, and ethnic identifies, confidence logics were used to test the mean values
of these groups, reaffirming district lines. Anthropometry was a reconfiguration of the Anglophone
eugenics programs used to stabilize social hierarchies in colonial India. Here (un)certainty work is
seen as much more than a particular outcome of technological choice: it drove a specific social order
and reaffirmed colonial technologics.24
In 1950, Prasanta Chandra Mahalanobis was elected General President of India’s Statistical
Institute. In his inauguration speech, he stated in no fewer than sixteen different ways that
prediction is, “never absolutely certain, it is [only] possible to estimate the limits of uncertainty.”25
For Mahalanobis, the certainty movement represented a political economic shift that threatened
India’s larger agricultural and anthropometric establishments. Throughout WWII and the early
postwar years, Mahalanobis had worked with many U.S. mathematicians on wartime advances in
decision theory, including U.S. statistician Abraham Wald before he died in an airplane crash in
southern India.26 The growing attention to optimality that had permeated decision designs in U.S.
planning were of question for Mahalanobis, but he remained staunch in his commitment: “The
23 D.N. Majumdar, C. Radhakrishna Rao, and P.C. Mahalanobis, “Bengal Anthropometric Survey, 1945,” 212. 24 Philip, Civilizing Natures, 148: “Rationalist, technoscientific modernity is often regarded as radically disjunct from the morally charged universe of religion. If we ask how religious and humanist principles were translated into practice, what changes they required from colonized groups, and what specific economic needs motivated the systematization of particular ways of knowing and controlling, we find that religion and science appear contradictory only at the level of official, or high discourse. If we look at lower order or ground-level practices, we can see that this discursive contradiction is really a functional constituent of the kind of order that colonized societies had to be brought into as a result of their structural position in a global network of extraction, production, and distribution of resources.” 25 P. C. Mahalanobis, "Why Statistics?" Sankhyā: The Indian Journal of Statistics (1933-1960) 10, no. 3 (1950): 195-228. 26 See: “Prof. Wald Reported Among Victims of India Plane Crash,” Columbia Daily Spectator 52, no. 15, December 1950; also his last work that advanced a logic of optimality over statistical decision-making: Abraham Wald, Statistical Decision Functions (London: Chapman and Hall, 1950).

161
decision about the optimum design must necessarily involve a margin of uncertainty in such
estimates or forecasts. Refinements in the design which go beyond the actual margin of error or
uncertainty are of not much use.”27
Advancing the political importance of (un)certainty work in India, Mahalobis reconfigured
the ancient doctrine of Anekāntavāda, yielding the “Syādvāda system of prediction.”28 This was a
reinterpretation of the Sanskrit theory of conditioned predication into seven expressions of
statistical uncertainty. This conceptualization of uncertainty was taken up by Marxist statistician,
John Scott Haldane, who expatriated from England and became a naturalized citizen of India after
the Suez Canal crisis, which he deemed a reprehensible act of the British government. He wrote,
“The search for truth by the scientific method does not lead to complete certainty. Still less does it
lead to complete uncertainty. Hence any logical system which allows of conclusions intermediate
between certainty and uncertainty should interest scientists.”29 In his framing, these are the
saptabhangīnaya or seven types of prediction:
(1) syādasti. May be it is. (2) syātnāsti. May be it is not. (3) syādasti nāsti ca. May be it is and is not. (4) syādavaktavyah. May be it is indeterminate. (5) syādasti ca avaktavayaśca. May be it is and is indeterminate. (6) syātnāsti ca avaktavyaśca. May be it is not and is indeterminate. (7) syādasti nasti ca avaktavayaśca. May be it is, is not, and is indeterminate.
It is clear that the multifarious politics of (un)certainty work extends beyond technological
choice measured in computing labor and time processing. In this brief exposition of the Indian
27 See: P.C. Mahalanobis, “Some Aspects on the Design of Sample Surveys,” Sankhyā: The Indian Journal of Statistics (1933-1960) 12, no. ½ (1952): 7. 28 See: P.C. Mahalanobis, “The foundations of statistics,” Dialectica 8 (1954): 95-111. Historiography: https://link.springer.com/referenceworkentry/10.1007%2F978-94-024-0852-2_739 29 J.B.S. “The Syādvāda System of Prediction,” Sankhyā: The Indian Journal of Statistics (1933-1960) 18, no. ½ (1957): 195-200.

162
Statistical Institute and its political projects, (un)certainty work manifested in different ways.
Anglophone theorizations of industry control in India reaffirmed a racialized labor caste system in
rice cultivation projects and through the regional organization of population assessment. Exploring
the contrast between the Indian and U.S. contexts, it becomes clearer that Herbert Simon’s certainty
statement reflects a contextually-specific valuing of instantaneity and machine precision in the
context of U.S. militarism.
Bombing Laboratories and Destruction Data
Uncertainty politics in the WWII military economy emerged from generating data from
10,000 feet above the earth, “the view from above” and through processes of mass destruction and
land alteration.30 In WWII (un)certainty work, just as in the earlier cases, data architectures were
designed to respond to a particular corpus of information. In order to engage the meanings of this
information, it is important to look beyond the university laboratory spaces where the data was
computed. The wartime mathematics laboratory involves the larger spaces and environments altered
for this computing work. This includes proving grounds on U.S. and allied soil, official military
theatres, colonial territories, private computational centers, and university statistics departments.
Military theatres and proving grounds on U.S. soil were reconfigured as experimental stations for
30 For literature on the view from above and aerial governance, see: Jeanne Haffner, The View from Above: The Science of Social Space (Cambridge: MIT Pres, 2013); Seeing from Above: The Aerial View in Visual Culture eds. Mark Dorrain and Frédéric Pousin (New York: I.B. Tauris, 2013); Caren Kaplan, Aerial Aftermaths: Wartime From Above (Durham: Duke University Press, 2018); Life in the Age of Drone Warfare eds. Lisa Parks and Caren Kaplan (Durham: Duke University Press, 2017). For literature on the politics of mass death under capitalism, see: Charles Thorpe, Necroculture (New York, NY: Palgrave Macmillan, 2016); Jacqueline Wernimont, Numbered Lives: Life and Death in Quantum Media (Cambridge: MIT Press, 2019).

163
testing probabilities. These spaces were linked by a growing initiative to generate, collect, and
compute what I call ‘destruction data.’
DESTRUCTION DATA is first and foremost generated through processes of mass
destruction. Beyond this, there are two defining epistemic characteristics of the data. First, the
valuation of destruction data hinges on a mathematical truism: the central limit theorem. The
valuation of destruction data was towards the accumulation of ‘mass data,’ advancing the notion the
more data produced, the higher likelihood of accuracy in predicting future bombing activity. This
literally abided by the law of very large numbers. Underscoring this point, Neyman wrote in a 1943
field report, “Further trials prove nothing unless they are made in very large numbers so that a
statistically reliable result is obtained.” Second, as a corollary, destruction data is analyzed strictly as
information for future bombing activity, or for more destruction. This data is synonymous with
“operational data” as named by military personnel. The main point is that destruction data generated
from mass incendiary and firestorm bombing was valued as useful precisely because it was
numerous, not because it was accurate or complete.
Figure 23: Handling Field, Valparaiso Fla. 1935, soon to become Eglin Field Proving Ground.

164
The destruction data computations designed to “make sense of” military theatres across the
world were stabilized by experiments on U.S. soil. Throughout WWII, proving grounds and nuclear
testing grounds became permanent features of the U.S. landscape. On the east coast, the Aberdeen
proving grounds outside of Washington D.C. stretched through the Maryland marsh. In the
Southwest, the Yuma proving grounds covered 1,400 square miles in Arizona’s Sonoran Desert.
Eglin Field consumed 400,000 miles of Florida’s land and water. Beyond the proving grounds
allocated for ordinance and bomber experiments, land in New Mexico and Nevada, as well as atolls
near Hawaii, were the main wartime nuclear testing grounds. Other smaller testing grounds sprung
up throughout the Northeast corridor and the Midwest.
While military establishments and proving grounds on U.S. soil were not new in the
twentieth century, the rise of aerial bombing initiatives rapidly expanded the land allocated for
military consumption. Military and civilian landscapes blurred as bombs, bombing waste, and
nuclear material slowly saturated the earth without much public awareness or protest. For low-level
personnel working within the military, the distributed allocation and tiered secrecy of their work
contributed to the banality of these programs.
Figure 24: Aerial Schematic of Amagasaki, Japan from a 1945 report on probabilities of material destruction with firestorm bombing. Neyman Papers, Carton 5, Berkeley.

165
In this case of (un)certainty work, the bombing data collection process began on November
8th, 1942 in what was called Operation Torch, a four-day allied bombing campaign to secure all ports
along the North African coast between Casablanca and Algiers.31 The design behind Operation
Torch’s strategy bombing had been in the making for some time. In 1941, the Air War Plans
Division projected that the US Army Air Force would conduct systematic “precision bombing” in
daylight, while the Royal Air Force would conduct mass air attacks at night.32
This vision of synchronized allied aerial warfare was realized in Operation Torch. After only
four days, the 12th division of the U.S. Air Force and the 8th division of the Royal Air Force littered
the North African shores with a tonnage of bombs, thereby seizing much of the territory from the
Axis powers, and clearing a beach path for Allied ground troops. Operation Torch set a precedent
for continued bombing activity in the region. Between 1942 and 1944, the beaches of North Africa
were destroyed—a choice that introduced havoc and instability on local populations in ways that
impact this region to this day.
In analyzing United States military training grounds and military theatres, it is easy to forget
that their “data collection” process extends to colonial contexts. Before the firestorm bombings in
Japan and Germany, the initial dataset that was generated and valued by statistical bombing analysts
was produced in bombing campaigns over North Africa. While “total war” is often remembered in
the European and Pacific theatres, the war also stretched throughout the colonized world in the
Mediterranean, Middle East, and Africa. These sites for combat were translated into laboratories as
the ascendant technoscientific community labored to compute the success or failure of bombing
scenarios in these regions.
31 David Jablonsky, War by Land, Sea, and Air: Dwight Eisenhower and the Concept of Unified Command (New Haven: Yale University Press, 2010), 75-93. 32 Conrad C. Crane, American Airpower Strategy in World War II: Bombs, Cities, Civilians, and Oil (Lawrence: University Press of Kansas, 2016), 31.

166
This connection was not unique to the Second World War. The rise of aerial bombing in the
twentieth century marked a 10,000-foot high grasp for power that began in 1911 when the first aerial
bomb was dropped over Libya.33 Italian forces seeking to conquer Ottoman territory in North
Africa carried out these first bombing runs. One of the Italian officers later became one of the
strongest advocates for unrestrained bombing of civilian targets. In the First World War, he
unsuccessfully advocated for daily bombing runs against Austrian civilians in order to destroy
morale. During the Second World War, technoscientific military analysis depended on colonial
laboratories for bomb sampling data. The probability tables developed were initially based on
scenarios and data collected in North Africa. Colonial violence and modern militarism have never
been distinct.
In the days following Operation Torch, the United States Demolition of Obstacles to
Landing Operations Committee (DOLOC) articulated the problem: “To determine and to
characterize the efficiency of the best methods of bombing a beach selected for landing invasion
troops so that a substantial path across the beach could be cleared of land mines.”34 Destruction data
generated abroad was then collected and fed back into U.S. and UK statistics laboratories such as
the UC Berkeley Statistics Laboratory and the Princeton Institute for Advanced Study. The DOLOC
committee had strategized with the newly formed Applied Mathematics Group (AMG), and
Vannevar Bush’s National Defense Research Council, and commissioned the Berkeley Statistics
Laboratory to work on this problem.
33 Aerial aftermaths, governing from the skies, etc. 34 M. Eudey et. al., “Cooperative Study on Probability of Exploding Land Mines by Bombing,” April 1, 1944, Jerzey Neyman Papers, BANC MSS 84/30 c, Carton 5. The Bancroft Library, University of California, Berkeley (henceforth: Neyman Papers, Carton 5, Berkeley).

167
Labor of Calculation
The mostly west coast mathematics cooperative group included members from the Berkeley
Statistics Laboratory, Stanford University, and the Institute for Numerical Analysis. The Applied
Mathematics Group (AMG) via oversight at the National Defense Research Council (NDRC),
assigned them the specific problem: “Probability of exploding land mines by bombing.” Throughout
the remainder of the war, the cooperative would continue to work on this and similar problems. The
initial challenge derived from the early allied bombing campaigns over North African beaches and
was designed to predict the destruction of land mines for the sake of the landing troops. Later
problems would reflect the changing needs of military occupation and theatres over urban civilian
cities, oceans, or testing grounds on U.S. soil. Throughout, the central ‘problem’ was determining
the probability of respective bombing strategies as a means of improving (making more efficient)
future bombing runs and then documenting and archiving military outcomes in terms of probability
assessments.
The basic rhythm of this work was first to establish predictions for military outcomes and
then test those predictions using data generated from the bombing. And then do it again. Because of
the mathematical prediction mechanisms and infrastructures developed for this testing, military
strategy came to depend on the mass production of bombing information. The more data generated,
the more ‘efficient’ the outcomes.
To make sense of this computing work, I organize the wartime projects into three stages. In
each stage I aim to draw out the uncertainty architectures and epistemological commitments at
work. Beyond the base computational work conducted at the Berkeley Statistics laboratory and
supporting institutions, I consider the larger economic forces and ‘destruction data laboratories’—
areas where bombing waste was translated into useful material data and used in military strategy.

168
STEP ONE of the computational work was to reduce large bodies of disorganized
information to a singular problem upholding a singular military objective. In the first two years of
WWII, the computation group reformulated the question of the probability of exploding land mines
as a more specific line of inquiry, namely, to determine the “ideal tight-string crater flight formation
needed to clear an efficient path along a beach.” The specificities of this analysis resulted from
efforts to pluck definable problems out of the onslaught of destruction data generated from
bombing the beaches of North Africa. To this end, the group decided to just focus on two sources
of inquiry: bombardier time charts and aerial spatial images of bombing densities. These two material
sources provided base ‘space’ and ‘time’ measures, so that variance between the intended and actual
bomb drop times and locations could be calculated, giving sufficient information from which to
generate probability tables.
STEP TWO of the computational work was delimiting bombing sites (both physically and
mathematically) as controllable laboratory spaces. As military theatres and combatant air space were
considered too unpredictable, initiatives to delimit statistical control states involved physical
“controlled experiments” on U.S. soil. U.S. proving grounds were predominantly created from
expropriation of National Park and indigenous land. These were large ground areas where bomb
drops could be “controlled” and the mathematical delimitations of “error” established. The
probability tables generated in the first stage were tested against controlled runs to establish a
standard measure of prediction and bombing ‘error,’ in order that the larger bombing campaigns on
the world stage could be stabilized according to an expected error rate.
A particular series of experiments at Eglin Field in Florida exemplify the procedure. These
experiments were believed to generate proof that bombing error was predictable at a standard
dispersion error of 400 feet. This value was hotly contested, showing a lack of consensus throughout
the military and mathematics community as to what it meant to accept this error as a reliable

169
measure. Beyond the dispute, I point to a significant epistemological slippage between ‘statistical
error’ and ‘bombing error,’ phrases that were often used interchangeably, underscoring the real-
world antecedents and consequences behind the mathematical abstractions.
In STEP THREE of the computational work, new meanings of (un)certainty were coproduced
with military computing technologies, including bombsight calculators, part of a larger visual
epistemology that I call “bombsight optics.” Bombsight optics constitute the technomathematical processes by
which bomb site areas are translated into statistical and calculable areas and objects of study. The Optical Method,
which concludes this chapter, and the bombsight calculators used in the production of probability
tables, belong to a longer lineage of mathematical and physical technologies used to compute and
rationalize military strategy.
Beyond Beth Scott, Evelyn Fix, and Jerzy Neyman, other people commissioned to work on
the bombing problem included UC Berkeley computer Emma Lehmer, her husband, electrical
engineer Derrick Henry Lehmer, and his colleague Robert Weitbrecht. Mathematician George Pólya,
nearby at Stanford, contributed to the theoretic dimensions of the problem. Outside of the regional
cohort, Polish-Jewish mathematician Jacob Bronowski aided with providing data and analysis from
the British vantage, given the conditional entanglement of the U.S. and U.K. bombing data.
In his notes on the DOLOC problems, Bronowski captured the general tone of the group’s
wartime planning work, “The purpose of the analysis, post mortem, of raids is simple: to obtain
information which shall assist in the planning of future raids.”35AMP’s director, Warren Weaver
translated DOLOC’s beach landing problem into a probability problem, catalyzing the project’s
start. He wrote, “What is the desirable size and type of formation using what spacing and aiming
35 Jerzy Neyman and Joseph Bronowski, “A New Vulnerability Equation in the Analysis of Incendiary Raids.” Neyman Papers, Carton 5, Berkeley, emphasis added.

170
points, and how many such formations are required to assure that the expected fraction of
undetonated mines be P?”36 Here P meant the greatest probability of failing to detonate a land mine.
In this sense, the objective of the group was to use preexisting uncertainty tools to try and control
the error of an experiment in such as way that provided sufficient conditions for a real-world
scenario.
The initial data coming in from wartime bombing sites such as North Africa was
unorganized, to say the least. At these bombing sites, military personnel and travelling statisticians
collected aerial photographs, soil measurements, tactical information, measurements of enemy
resources destroyed, and idealized representations of bombing densities. Out of this cacophony of
information, the computation group homed in on two data sources that would allow them to
36M. Eudey et. al., “Cooperative Study on Probability of Exploding Land Mines by Bombing,” April 1, 1944, Jerzey Neyman Papers, BANC MSS 84/30 c, Carton 5. The Bancroft Library, University of California, Berkeley (henceforth: Neyman Papers, Carton 5, Berkeley).
Figure 25: “Coordinates of the Clock and Instrument Signals on the Tape.” Neyman Papers, Carton 5, Berkeley.

171
compute probability tables and confidence intervals: bombing aiming error and bombing dispersion
error. All of the analysis hinged on identifying time values. The group derived values for temporal
aiming error, denoted as 𝜎𝛼, from bombardier reports. These reports were charts that used
intervalometers, clocks, and bombsight calculators to measure the time when a bomb was dropped
against the time the bomb should have been dropped.
Uncertainty was calculated along every possible dimension where a time value could be
quantified. For example, uncertainty values were generated to assess the timing coincidence between
intervalometer counts and clock counts. Values for spatial dispersion error, denoted as 𝜎𝑑, were also
collected from aerial images of bombing densities used to compare the actual bomb landings against
the intended target area. Spatial images of bombing densities and charts of bomb release times were
the primary sources used to assess accuracy in the probability analysis. By reducing data points to
temporal intervals and spatial distance measurements, certainty calculations could be made for every
dimension of the bombing process, from bomb drop times, to machine quality, to prediction and
success or failure assessments. All these were efforts to control statistical error in such a way that
would generate confidence in future military tactics. A standard dispersion error value of 400 feet,
generated in a controlled experiment over U.S. soil, became an indicator of this possibility.
Standardizing Error: The Eglin Field Experiments
Part of the larger patchwork of proving grounds expanding during WWII was Eglin Field, a
significant site for the advancement of mathematical planning and operations research. Situated
along the Gulf coast of Florida and occupying 400,000 acres of land hundreds of miles from the
nearest city, Eglin Field was an ideal test site for aerial bombing above land and water. The land
originally belonged to the Muscogee (Creek) and Choctaw Tribes before they were forcibly removed

172
in the 1830s. In a 1908 commemorative effort, President Theodore Roosevelt established the
Choctawhatchee National Forest as part of his conservation planning programs. But in October of
1940, President Franklin D. Roosevelt issued a directive for the U.S. Forestry to cede 400,000 acres
of Choctawhatchee National Forest to the U.S. War Department. The Army Air Forces Proving
Ground at Eglin Field was activated April of 1942.
Testing conducted on proving grounds were well documented and calculated events. These
grounds were created with the express purpose of securing control and predictability over military
strategy and outcomes. Throughout the war, the AF proving ground became a significant test site
for AMG mathematicians, operations researchers, and military personnel eager to explore new
technoscientific combat strategies. 37 Eglin Field became an experimental station that merged military
and mathematical rationality in aerial combat decision-making.
Neyman made his first trip to Eglin Field on December 3, 1942 to meet with commanding
officer General Grandison Gardner about the application of probability to problems of aerial
warfare. At first the General was “rather skeptical” about the mathematics. Neyman recorded
bitterly that it was “almost without exception [that military persons were] prepared to believe every
word printed in their Training Manual.”38 Neyman argued that the data was in need of a bounded
computational mechanism because it was “mostly fragmentary and difficult to record.”39 The central
purpose of Neyman’s Florida trip was to design and execute an experiment “to test the validity of
NRDC tables of probabilities of multiple hits in train bombing attacks of multiple targets.”40 That is,
37 William Thomas, Rational Action: The Sciences of Policy in Britain and America, 1940-1960 (Cambridge: MIT Press, 2016). 38 Diary of J. Neyman, December 3-19, 1942, Neyman Papers, Carton 5, Berkeley. 39 Ibid. 40 Eglin Field Proof Department, “Final Report on Test Experiment with Bomb Sight Trainer to Illustrate Tables of Probabilities of Multiple Hits on Multiple Targets in Train Bombing,” October 29, 1943. Neyman Papers, Carton 5, Berkeley.

173
the bombing scenarios underpinning the statisticians’ probability tables were to be recreated over
U.S. soil (according to factors of altitude, flight formation, and bomb spacing). The results would
then be used to determine the accuracy of the tables in correctly estimating bombing error. Gardner
gave the verbal directive for the test on December 12th, 1942 with Air Corps captain W.D. Snyder,
Jr. as the officer in charge of the project.41
The preliminary phase of the experiment was designed to establish a normal expectancy for
dispersion error. In this phase, trainers dropped 50 bombs at 10,000 feet altitude at 250 miles per
hour making five runs on each target.42 This “optimal” formation had been established both
mathematically in the preexisting probability analysis and qualitatively under the advisement of
military personnel. The main phase of the experiment introduced various kinds of bombs, different
spacing between the bomb drops, and different speeds and altitudes of the trainers. For example, the
first run involved three hundred-pound M31 bombs dropped from 6,000 feet at 180 mph.43 These
41 W.D. Synder to Command Center, December 23, 1942. Neyman Papers, Carton 5, Berkeley. 42 Eglin Field Proof Department, “Final Report on Test Experiment.” 43 Ibid.
Figure 26: “Bombsight View of The Leader in Aiming at: Battleships/Destroyers.” Neyman Papers, Carton 5, Berkeley.

174
experiments, supplemented by another round in 1943, tested the variation of aiming error at various
altitudes. In their post-hoc assessment of the data collected at the proving grounds, the computation
group concluded that the variation of aiming was actually better than anticipated, at 400 σa.
In their 1944 “Probability of Exploding Land Mines by Bombing” final report, the
computation cooperative promoted the standard error value by charting a comparison of all of the
known variations of aiming error currently circulating Air Force oversight. This chart included
“typical values” and values computed in various AAF reports, an operations analysis report, and
from the Eglin Field experiments of 1942 and 1943. Of course, the Eglin Field experiments, by
virtue of being controlled experiments, were conducted under ideal conditions such as clear visibility
and without enemy combatants.
Proving ground journal entries make clear that the experimental testing of these probability
tables and the daily bombing runs quickly achieved rote normalcy. On January 21, 1944 Col. Walsh,
Major Dillworth, and Captains Leonard and Bleakney of the U.S. military drove to Vera Beach
Florida where they were picked up around 10:45 a.m. in a B-17 bomber and taken to an airfield in
Brooksville, Florida. Here a group of 18 B-17s were engaged in carrying out pattern trials for the
forthcoming tests on the beach at Ft. Pierce. Captains Leonard and Bleakney rode in a separate
reconnaissance B-17 and Walsh and Major Dillworth rode in planes of the formation. The
intervalometer was set at 50 feet and the bombs were lowered for deployment. Their conclusions
were rote and unremarkable. According to military journals from that day, “The pattern blanketed
the target perfectly” but was too broad and diffuse for the beach attack. They said the trial was
“convincing” in that it showed that the “javelin formation was definitely suited for the purpose.”

175
Bombsight Optics: Nomograms and Bombsight Calculators
Probability charts used in scenarios like the one at Vera Beach were coproduced by military
and mathematics personnel. They were undergirded by a technomathematical rationality, which I
refer to as ‘bombsight optics.’ I define bombsight optics as the visualization of bombing waste and destruction as
predictable, controllable, and calculable sites of statistical study. Bombsight optics first and foremost identify
“solvable problems,” within destruction data and idealize these problems with visual representations.
For example, the DOLOC problem of assessing how many flight formations were needed to
probably clear a beach landing strip of land mines, wherefore the beach is represented as a rectangle
around a set of perfect circles.
Bombsight optics also denote a convergence between military and mathematics personnel,
they are the mathematical and visual technologies that stabilize mathematical and data-driven
militarism. For example, nomograms (that date back to the 18th century French Military) were of
frequent use in the bomb idealization process, between military and mathematical personnel. They
are visual apparatus that depict a bombing scenario as a geometric relationship between number of
Figure 27: “Functional Diagram of Dial Board and Visual Adjustment Board of the Computer of Probabilities.” Neyman Papers, Carton 5, Berkeley.

176
bombs dropped, radius of the bomb, and width of the beach, etc. Nomograms represented bombing
scenarios as simple mathematical relationships between a small set of factors. These mathematical
diagrams provided context for military personnel and statistical workers to engage each other on
discrete points of military strategy such as the space intervals between planes in a given bombing
run. Using data such as reconnaissance photographs and tactical information about flight formation,
military personnel and mathematicians would then discuss the optimal formation for a given
bombing density as well as determine and agree on measures such as the standard error in flight
formation spacing.
Nomograms were therefore technical representations that served as meeting points for
military and mathematical expertise. Throughout the war, the computation group also became
increasingly preoccupied with reinventing bombsight calculators as a mechanized probability tool for
minimizing bombing error and achieving accuracy that would eventually replace human
computational labor.
Since the First World War, accuracy in bombing missions involved an elaborate
communication exercise between the pilot and bombardier. The burden of precision fell on the
pilots, requiring them to maintain straight and level flight at the precise altitude predetermined for
the mission. A combination of intervalometers, clocks, and slide-ruler calculators were used in these
efforts. Already by the 1930s, engineers Elmer Sperry and Carl Norden of the U.S. Navy were
developing electronic bombsight calculators to relieve the pilot of the burden of this coordination.44
These devices received direct input from the planes’ instruments to calculate the effects of gravity,
air drag and wind speed on the trajectory of a bomb. These competing bombsight machines were
widely circulated by the start of WWII.45
44 Thomas Hughes, Elmer Sperry: Inventor and Engineer (Baltimore: Johns Hopkins University Press, 1971). 45 Lloyd Searle, “The Bombsight War: Norden vs. Sperry,” IEEE Spectrum, (Sept. 1989): 60-64.

177
Both the Sperry and Norden bombsight calculators were used in the Eglin Field experiment
as statistical comparisons were made of the two machines. The importance of machine accuracy did
not go unnoticed by the statisticians. This was in part due to the military’s preoccupation with bomb
spacing machines. The machines were seen as crucially important to winning the war, and ongoing
comparisons were made to the predictive capabilities of enemy bombsights, especially the German
bombsight calculator.46 On November 4, 1943 the NDRC held a conference in Washington D.C.
specifically on the Bomb Spacing calculator of which members of the AMG were in attendance. It
was believed that the calculator could be redesigned “so as not to require any separate operation for
placing the center of the bomb train on the center of the target.”47 Designs of automated bombsight
calculators hinged on uncertainty calculations.
Inspired by the spatial relationships between numbers and calculated values on the slide
rules, in conjunction with the electric machine capabilities of the Norton and Sperry bombsight
calculators, the mathematicians designed various computing and machine possibilities. The central
46 F. Postlethwaite, “Notes on Enemy Bombsights” September, 1942. Neyman Papers, Carton 5, Berkeley. 47 Diary of J. Neyman, December 3-19, 1942. Neyman Papers, Carton 5, Berkeley.
Figure 28: The Norden Bombsight 1943. Neyman Papers, Carton 5, Berkeley.

178
idea was for the calculating devices to aid with (un)certainty work, and then feed that data into
calibrating the bombsight. A memo reporting on the “Bombardier’s Calculator,” stated that:
This device (whether chart, slide-rule, calculating instrument, or whatever) was asked to do three things: 1. To determine the change in the altitude setting on the bombsight so as to aim the
center of a train on a target rather the first bomb. 2. To determine the probability of at least one hit on a target with a train of n bombs,
attacking at a certain angle. 3. To determine the optimum spacing of the train. The first of these three is a relatively simple matter once the length of train is known. But it seems that we would do the Air Corps a dis-service if we did not investigate points 2. and 3. before attacking 1.; for otherwise we would have a mechanism for furnishing bad and misleading answers.48
The base processes of probabilistic estimation and calculation went unquestioned as visions of new
machine possibilities to take over this labor of calculation circulated. In winter of 1943, Neyman
conceptualized an instrument that married the bombsight calculator to the Berkeley Statistics Lab’s
probability table work from the past year. The machine he proposed would be able to instantly yield
probabilities of multiple hits in train bombing of arbitrary targets. This device was intended to
supplement “the more cumbersome numerical efforts of manually computing probabilities.”49 The
“Neyman method” was proposed as a means of feeding data established in the initial design of a
bombing run or ‘experiment’ back into the next set of bombing runs, without having to recalibrate
the sight of the machine on the target:
The following technique is proposed: When the number of bombs, the desired spacing between bombs, and the estimated ground speed are set into the intervalometer, these data then determine the length of the train in time, and this time is rather accurately produced on the basis of those data. It is possible then from the setting for the number of bombs and from the shaft rotation which determines the time interval from bomb to bomb in the intervalometer to extract directly a numerical time interval giving the time duration of the semi-train. Compensation for dropping in train, therefore, or
48 DIV. 7 NDRC, Memo Concerning Project #223, Bombardier’s Calculator, December 23, 1942, Neyman Papers, Carton 5, Berkeley. 49 Neyman, “Report to the Applied Mathematics Panel, N.D.R.C.” February 1, 1943. Neyman Papers, Carton 5, Berkeley.

179
offset of the aiming point by the half train may be directly accomplished by adding the half train duration thus obtained to the time of flight setting in the bombsight. This operation does not interfere with the synchronous operation of the sight and insures that the center of the train, regardless of the length, is aimed at the target.50
Neyman remained conflicted about the automation of computational labor, as he expressed
concern over reconciling the machine with the sheer complexity of the data. In a letter to
mathematicians John Williams and Warren Weaver, he cautioned, “you will see that the instrument
could not be considered an alternative to the computations.”51 Nevertheless, the visual and machine
culture within the bombing work, and the cultural directive to reduce the labor of computation, led
to a number of probability-machine designs.
Confidence Intervals as Sufficient Knowledge
The analysis for the computation group’s final 1944 bombing report was conducted using idealized
images of bombing densities collected at Eglin Field. Drawn from an aerial perspective, the bombing
densities were represented as a condensed group of circles, over which rectangles were drawn to
symbolize the “effective path” or the area of high probability that most of the mines had been
detonated. This rectangular area was drawn according to “a radius of efficiency” calculable by
analyzing the standard errors of past bomb dispersions on beach mines.
This imagery, of an idealized beach of some width B, over which a rectangular “effective
path” was drawn, became the standard representation of calculating probabilities for beach bombing
scenarios. The objective was to show the probability for “at least one” effective path given an
50 “Aiming-point Offset in Mark 15 Bombsight for Train Bombsight, October 28, 1943. Neyman Papers, Carton 5, Berkeley. 51 Neyman to Warren Weaver and John D. Williams, February 4, 1943. Neyman Papers, Carton 5, Berkeley.

180
“optimal” set of factors—plane formations, spacing of bombs, etc. The probability of a unique
effective path was drawn equal to the difference of the effective path and the width of the beach
divided by the standard error of the bombs dropped, 𝐸 = 𝑊𝑒/𝐵𝜎𝑎
. The group then calculated values for
the probability of a unique effective path “actually crossing the beach” equal to 𝛼. So the confidence
factor, α, translated to actual path measurements.52
Confidence intervals were computed using the equation:
𝐸𝛼0𝐹′ − 11 > 𝐸′ > 𝐸𝛼0𝐹′1.
They were calculated in order to produce a table that “at least 𝐹′[1 − 30] formations will be required
for the probability of having one (or more) “effective paths” leading from one end of the beach to
another to reach (or exceed) the level 𝛼[. 90, .95, .975].”53 For example, to achieve the probability of
an actual effective path across the beach with a confidence factor of 90, it was necessary to use at
least 22 flight formations.54 The general idea was to draw intervals to indicate sufficient flight
formation conditions for an effective crossing path. That is when attacking formations were “just
sufficient for the probability of at least one ‘effective path’ crossing the beach to attain the chosen
level 𝛼.”
As established in the Polish case, confidence hinged on measuring “error” in statistical
experimentation. The numerical confidence values produced in Pytkowski’s small-farm analysis
designated “error” as the risk of confusion he had about the population value he drew from his
52 M. Eudey, et. al., “A Cooperative Study” esp. 62-68. Neyman Papers, Carton 5, Berkeley. 53 Ibid., 69. 54 Using the E equation above, if an effective path is 500 feet wide, the beach is 400 feet wide, assuming the standard deviation of 400 feet currently being promoted by the computing group, then E = (500-400)/400, which is equal to .25. On the table of intervals, .25 fell between .250 - .261, the interval values for α = .90 when F (the number of flight formations) = 22.

181
method of estimation. Pytkowski’s confidence intervals, although unique to the 1927/1928 farming
data, pertained to his own process of inductive reasoning. His inquiry was largely a philosophical
one. In the bombing case, error had an unstable meaning. Error was a statistical term but also
referred to the recorded dispersion distances on the ground as well as the recorded gaps between the
desired and actual bomb drop times. Epistemic distinctions between ‘statistical error’ and ‘bombing
error’ blurred in discourse surrounding the experiments.
Confidence Intervals in the bombing case were not just a method of assessing the validity of
inductive logic used in experimental design (as in the meaning of the Polish word ufności), they were
also a method of controlling bombing error, with confidence (the American military’s term of art
being sufficiency). In its military expression, confidence was a method of predicting conditions that
were “just sufficient” for achieving a singular objective. According to the confidence interval table,
with the sufficient conditions of 29 flight formations, there was a 95% probability that at least one
effective path was cleared across the beach.
Designing Certainty Machines
In August of 1944, Berkeley engineer Derrick H. Lehmer developed an “Optical Method”
for planning bombing missions inspired by the ongoing research of the statistics group. This was a
film projector system that could display the target area on the wall of an airplane. The next year in
May of 1945, Lehmer circulated a revised version of his “photo-electric instrument for planning
bombing missions” to mathematicians and military personnel.55 As something produced by an
electrical engineer, Lehmer’s proposal had more to do with the instrumentation than with
55 Derrick H. Lehmer, “Optical Method,” August 31, 1944. Neyman Papers, Carton 5, Berkeley.

182
mathematics. The physics of light and film were discussed in detail, whereas the statistical
components were based in gross assumptions of “normal population sets” and “randomizations,”
ignoring even the most obvious complexities of the bombing data. The Optical Method was based
on a “sample bomb fall drawn from a normal population set.”56 Lehmer insisted that this single
apparatus would eventually provide a statistically accurate visual display of any target: “[The] optical
device [is] intended to replace the numerical treatment of the bombing problem. The device may be
used with targets having any size and shape and with any direction of attack.”57 He imagined the film
projection system to project targets of any size and shape and from any direction of attack. It
supposedly allowed “anyone with some experience in electronics to construct and operate the
apparatus with a small expenditure of time and effort.” Lehmer imagined an endless belt of film
rolling through of a finite set of several hundred frames, that would contain images of different
bomb patterns that had been drawn or abstracted by the computing group during the war. Potential
displacements would be calculated as standard aiming errors using P.C. Mahalanobis’ error charts
from his 1933 “Tables of Random Samples from a Normal Distribution.”
Despite the promises of seeing with certainty, significant doubt lingered about the accuracy
of these machines, given their reliance on the statistical assumptions produced in the probability
analysis, specifically the standard error of 400 feet. This doubt is evidenced in comments from
military personnel and operations researchers who advocated strong caution about this direction of
research. Military personnel protested, “this calculator idealizes the bomb fall pattern.” And
“patterns do not conform to a model of this type […] a bomb fall is termed a pattern by courtesy
56 Lehmer, “A Photo-Electric Instrument for Planning Bombing Missions,” May 25, 1945. Neyman Papers, Carton 5, Berkeley. 57 “An Optical Method of Planning Bombing Missions,” Summary. Derrick H. Lehmer, “Optical Method,” August 31, 1944. Neyman Papers, Carton 5, Berkeley.

183
only.”58 Lehmer nonchalantly admitted that, “The informal way in which the notion of a bomb
pattern is introduced into the above apparatus renders in unlikely that actual results, such as the
number of hits on the target or the number of sections hit at least once, could be predicted
accurately.” Still, the wartime planning work spawned a number of similar patents on “target seeking
missiles” that assumed the probability work. Discourses of statistically accurate aiming devices
would continue to dominate aerial bombing throughout the Cold War.59
(Un)certainty
The dramatic rise of a geopolitics 10,000 feet above ground reconfigured uncertainty
engagement. The resulting certainty-making politics were inextricably tied to the growing militarist
culture. The WWII aerial bombing economy constituted the fastest growing economy in late
modern history, and the commissioned computing work was inextricably linked to its economic
58 Lauriston C. Marshall to the Office of Field Service, “Comments Regarding Bombing Probability Calculators,” February 8, 1945. Neyman Papers, Carton 5, Berkeley. 59 Donald Mackenzie, Inventing Accuracy: A Historical Sociology of Nuclear Missile Guidance (Cambridge: MIT Press, 1990).
Figure 29: "View of Apparatus as Set Up." Neyman Papers, Carton 5, Berkeley.

184
production. Prior to 1940, the promise and possibility of a probabilistic order already existed,
although ‘(un)certainty work’ was not conceived as a well-ordered machine. To the contrary, in the
1930s the ‘probability problem’ inspired philosophical, mathematical, and economic work as well as
the larger cultural imagination. Probability computing was in place by the start of WWII because of
its large-scale and rigorous engagement throughout the interwar years, but it was understood as
explanandum rather than explanans.
(Un)certainty work in the WWII bombing economy shifted from a structured engagement
with unknowability and the limits of human reason to an engagement with binary decision-making,
sufficient conditions, and prognostication. This denotes a radical shift in the political-economic
conditions and cultural commitments fueling the applications of statistical modeling techniques. At
the heart of this shift, I identify an emboldened willingness to paper over ‘uncertainty’ in the name
of efficient calculation. This involved collapsing statistical error with ontological error and reducing
an overabundance of unorganized information to overdetermined mathematical problems. As the
war progressed, measures of statistical estimation error were increasingly confused with bombing
error, as the literal distance between the bomb drop point and the target. Here the epistemological
distinction between measuring uncertainty in human reasoning and measuring uncertainty in real
world impacts was blurred.
While statistical methods—especially the null hypothesis model and other tests of statistical
significance60—have come to represent an approach to binary decision-making or means of
ascertaining certainty, this does not elude the fact that they still function as managers of uncertainty
at the levels of both discourse and practice. The promise of certainty, designated by military
mathematicians as ‘sufficient knowability,’ relied on computational methods specifically designed to
60 See, for example: Andreas Stang and Charles Poole, "The Researcher and the Consultant: A Dialogue on Null Hypothesis Significance Testing." European Journal of Epidemiology 28, no. 12 (2013): 939-44.

185
delimited uncertainty, doubt, and error in their work. “Error” and “uncertainty” continued to have
slippery mathematical, epistemological, and technological meanings. These intricacies were largely
papered over by descriptions of ‘rational decision-making’ as the modus operandi for wartime
planning work. A 1943 edition of Popular Science boasted that the bombsight simply “solves
problems.”61
Military mathematicians achieved new practices of certainty-making in WWII. They
transformed an onslaught of statistical ‘destruction data’ into ‘probability tables’ and other
knowledge-making apparatus for binary decision-making in military strategy. Data managers
separated out ‘time’ measurements and ‘space’ measurements as the basis for their analysis.
Calculating machines—including intervalometers, clocks, slide rules, nomograms, and bombsight
61 Image 3: Source: N. Katula, Cover Art, Popular Science 12 (1943).
Figure 30: "How the Bombsight Solves Problems." Popular Science 12 (1943) Cover Art by N. Katula.

186
calculators—were used to stabilize this data collection and organization process. The growing desire
for certainty over the future, specifically for managing one of the fastest growing and most
destructive economies in modern history, overwrote the admission of an uncertain world organized
by an uncertain archive.62
These discourses are not insignificant. The way in which WWII programs were documented
and archived, and later remembered and popularized by technocrats, mathematicians, algorithmic
thinkers, and decision-makers, drove public belief that the WWII aerial bombing economy was an
emblem of high-modernist rationality and efficient management. This belief has shaped the
formation of the Cold War decision and computing sciences. In fact, the domains of operations
research, managerial science, and the information and computer science that came to prominence in
the 1960s are predicated on this memory and narrative of the war.
In confronting the myriad of ways that data was generated, ordered, and managed, we begin
to see how uncertainty logics justified not just the waging of war but also domestic policy towards
land allocation and use for mathematical-military planning, as well as the labor required to operate
these domestic and colonial laboratories. Uncertainty logics also helped reconfigure the nature of
war. Bombing strategies created damage and casualties at unprecedented scales, killing tens of
thousands of civilians in Dresden, Hamburg, and Tokyo alone. Through the powerful visual-
mathematical culture of bombsight optics, data collected from these events was economized into the
production of advanced statistical machinery, helping to set a precedent for the continued
deployment of these wartime strategies after WWII.
Akin to the race to weaponize atomic energy, the achievement of highly predictive and
efficient mathematical bombing techniques was a promise to control the postwar world. The realities
62 On data and the archive, see: Orit Halpern, Beautiful Data: A History of Vision and Reason Since 1945 (Durham: Duke University Press, 2015).

187
of these bombing programs—state sponsored mass killings, military expansionism, and the large-
scale destruction of land and natural resources—have been largely hidden by our preoccupation and
celebration of mathematical predictability. Here we see the power of numbers not only in
transforming culture but in dictating the focus of what has been officially documented about the
U.S. involvement in WWII. The banal quantification of human death, resource consumption, and
the destruction of land and infrastructure—and the wantonness at having predicted these as certain
outcomes—distracts from moral inquiry and implication.
Chapter 4, contains material as it will appear in Dryer, Theodora. “From Soil to Bombs: A
History of Uncertainty Computing” (In Review HSNS). The dissertation author was the sole author of
this material.

188
Chapter 5: Climate
Computing Cloud Seeds: A Story of Anthropogenic Climate Change, 1940-1970
Cloud Seeding
Out of the smoke and clouds of WWII research and development, a new regime of weather
managers arose with a promising objective: to control agriculture and the environment from the sky.1
As human “rainmakers” they promised to alter the “lives of clouds.” Such lofty goals were rooted in
the interwar physical and mathematical sciences. Since the early 1930s, physicists and meteorologists
1 There is a fairly robust and growing corpus on weather modification programs in the Cold War United States. Most recently, Kristen Harper, Make it Rain: State Control of the Atmosphere in Twentieth-Century America, (Chicago: University of Chicago Press, 2017); Daniel Freund, American Sunshine: Diseases of Darkness and the Quest for Natural Light (Chicago: University of Chicago Press, 2012); Jack Williams, The AMS Weather Book (Chicago: Chicago University Press, 2009). Important scholarship on numerical weather modification: Kristine Harper, Weather by the Numbers: The genesis of modern meteorology (Cambridge: MIT Press, 2008) and Phaedra Daipha, Masters of Uncertainty (Chicago: University of Chicago Press, 2015).
Figure 31: Ellsworth Huntington, “The Desert Laboratory,” Harper’s Magazine CXXII, No. DCCXXXI (April 1911): 658.

189
had theorized new methods of altering the precipitation capacity of clouds. In 1933, Swedish
meteorologist Tor Bergeron published a hypothetical mechanism for gaining precipitation from
supercooled clouds that attracted global interest.2 After WWII, this interest intensified when
laboratory physicists discovered that silver-iodide smoke could potentially implant ice crystals in
supercooled clouds.3 The advanced technology of new and improved military machines, such as
ground generators and airplanes, further strengthened researchers’ confidence that they could
effectively deliver the smoke. Beyond the scientific community, this possibility of mapping the sky
for “seedable” rainmaking clouds emerged as a feasible solution to a variety of agricultural and
environmental problems, and provoked the imagination of farmers, agricultural laborers,
environmentalists, scientists, mathematicians, military personnel, and the everyday American
consumer. Many shared the dream of managing agriculture and natural resources from above.
Cloud seeding was “an improvement on nature” that directly confronted the vulnerabilities
of agricultural uncertainty.4 An unpredicted early season of rain, for example, would yield an early
crop of produce, rendering it vulnerable to bugs, critters, and hailstorm and sun damage. Rainmakers
marketed their work as a viable investment for stabilizing rain season predictability. As early as 1945,
newspapers were reporting that, “cloud seeding [had] been going on high above [American] farms
for the past four years.”5 In 1941, agricultural specialists in Michigan had begun installation of silver-
iodide ground generators to seed clouds, a process that could “add 10 to 15 minutes to a cloud’s life
2 Tor Bergeron, “On the physics of clouds and precipitation,” Verbal Proceedings, International Geological and Geophysical Union, Fifth General Assembly, 2 (1933): 156-157. 3 See: V.J. Schaefer, “The production if ice crystals in a cloud of supercooled water droplets,” Science 104 (1946): 420-457; Bernard Vonnegut, “The nucleation of ice formation by silver iodide,” Journal of Applied Physics 18 (1947): 570-593; Irving Langmuir, “The Growth of Particles in Smokes and Clouds and the Production of Snow from Supercooled Clouds,” Proceedings of the American Philosophical Society 92, no. 3 (July 1948): 167-185. 4 “Cloud Seeding ‘Improves’ Nature,” The Morning Herald, Tuesday, October 23, 1945. 5 “Cloud Seeding ‘Improves’ Nature,” The Morning Herald, Tuesday, October 23, 1945.

190
and make it rain longer than it would ordinarily.”6 This initiative was catalyzed by the previous five
years of “drought” or below average rainfall over Michigan’s farmland.
Rainmakers harnessed these sorts of anxieties from the farming community in the
advancement of their programs; they promised to control the rain so that farmers could control their
crops. Newspaper articles on cloud seeding initiatives were predominantly published in rural papers,
nestled within advertisements for tractors and other industrial farming machinery. These public
education outlets underscore the fact that cloud seeding was an agricultural-atmospheric initiative.
Seen more directly, rainmakers harnessed monetary investment from local agricultural interests. For
example, rainmakers charged Michigan farming townships $1,000 per the 1945 rainmaking season.
Throughout the 1950s, the rainmaking enterprise grew into an elaborate transnational and
heterogeneous data economy where the currency—precipitation—was promised to those in need of
rain, such as farmers, unions, and agricultural laborers. While corporate, for-profit rainmakers largely
drove the solicitation of new silver-iodide experiments for agricultural administrators, uncertainty
managers and data scientists operated as a connective web between these interests. I center my
analysis of cloud seeding on UC Berkeley’s statistics group. Specifically, I uncover the cultural and
technological dimensions of their RAIN programs that commenced in 1953 and ended a decade
later.7 RAIN was not an acronym, but official correspondence used this military-esk title.
Map-making is at the heart of weather experimentation. Between 1953-1973 the Berkeley
Statistics Groups designed a number of area maps for their statistical analysis of the drought
program, RAIN. I stress here that in this Cold War moment that technical and conceptual practices
of statistical mapping and weather mapping were stitched together. And it is precisely this
6 “Cloud Seeding ‘Improves’ Nature,” 1945, ibid. 7 For example, The State of California commissioned a series of randomized mathematical experiments and data computational work to predict changes in precipitation levels over Santa Barbara County after cloud seeding.

191
convergence that gave rise to algorithmic modes of governance over climatic and weather sciences.
By unraveling the epistemological and technological components of mid-century drought programs,
I engage the larger data laboratories and economies functioning to stabilize weather modification
programs and the development of prediction models designed specifically to assess cloud-seeding
outcomes. My story begins in 1930 with a significant water-data initiative catalyzed by a period of
extreme drought. I then uncover the importance of sixteen European and Australian cloud-seeding
experiments, as well as numerous local for-profit experiments throughout the Southwestern United
States, Northern Mexico, and Hopi and Navajo land.
Cloud-seeding is an aerial-agricultural initiative. It is a large-scale techno-mathematical program designed to
control ground resources through physical intervention and occupation of the skies.
As with the agricultural and bombing economies discussed in the first half of this
dissertation, I analyze the cloud-seeding economy as a heterogeneous program of uncertainty
management. By the early 1950s, vaguely defined ‘uncertainty’ was widely acknowledged as a
component of weather modification and was harnessed by rainmakers to further their programs.
The promise was to overcome agricultural uncertainty through controlling the lives of clouds.
Uncertainty dogged the solution as well as the problem, as there was “no hard data […] to gauge the
seeding’s effectiveness.”8. Not only was uncertainty reduced to an informational problem (a problem
of incomplete data), it was believed that the effectiveness of cloud-seeding programs in general
would be determined by data scientists—not farmers—who would eventually use data, “to assess
the effectiveness of […] cloud seeding.”9 Data scientists were revered as an objective voice in
weather modification. However, as shown in this dissertation, uncertainty models were architectures
8 “Cloud Seeding ‘Improves’ Nature,” 1945, ibid. 9 “Cloud Seeding ‘Improves’ Nature,” 1945, ibid.

192
that translated unknowability into probabilistic language rather than objective representations of
physical phenomena.
Phaedra Daipha’s study of postwar weather forecasters is particularly resonant here. She
argues that, “No one can master deep uncertainty—but [forecasters] certainly are masters at
mastering uncertainty.”10 Her comprehensive genealogy of forecasting in the National Weather
Service and its larger “weather prediction enterprise” situates forecasting as an elaborate decision-
making practice, which leads to “the official weather story” for the public.11 Ultimately, Daipha
argues that uncertainty inherent to the forecaster’s decision-making practice is black-boxed by the
yes-or-no events presented to the public, as in rain or shine, overlooking the fact that these are
presented as probabilities—30% chance of rain. In contrast to this, in cloud-seeding initiatives,
‘uncertainty’ was visible to the public, specifically because rainmakers harnessed anxieties pertaining
to the uncertainty of weather events as justification for their interventions. Despite the centrality of
uncertainty to the whole enterprise, what rainmakers themselves meant by it remains murky. There
is a significant epistemic leap, for example, between managing the uncertainty of predicting the
behavior of an individual cloud and managing uncertainty technologies designed to alter cloud
behavior. In this sense, rainmakers, like Daipha’s forecasters, were also masters of mastering
uncertainty.
Lorraine Daston reminds us that even before this twentieth-century plight of predicting ‘the
lives of clouds,’ nineteenth century atlas makers struggled to “describe the indescribable” and
classify, collect, and represent cloud taxons.12 In her analysis, the inherent “vertiginous variability of
10 Phaedra Daipha, Masters of Uncertainty: Weather Forecasts and the Quest for Ground Truth (Chicago: University of Chicago Press, 2015): 3. 11 Daipha, Masters of Uncertainty, 30. 12 Lorraine Daston, “Cloud Physiognomy: Describing the Indescribable,” Representations 135 (2016): 45-71.

193
clouds”13 inevitably pushed the “resources of description to a breaking point”14 so a cloud ontology
was then only achieved through the creative process of “seeing in types and speaking in tongues.”15
Ultimately, vaguely captured rain observations helped to classify cloud types. For example, an 1896
Atlas describes the Nimbus cloud “without shape and with ragged edges, from which steady rain or snow
usually falls.”16 Consideration of the inherent indescribability of cloud behavior underscores the wild
instability of identifying clouds as the control object in Cold War rain experimentation.
The hubris undergirding these ambitions makes clear the enthusiasm for wartime technology
but also the deep anxieties about stabilizing an agricultural economy in the postwar world. It also
attests to how powerful the assertion of the probabilistic worldview can be in simply overwriting
unknowability.
Throughout this dissertation, Uncertainty is primarily a probability concept, which addresses
unknowability or in Daston’s nineteenth-century framing, indescribability, by asserting mathematical
limits to what is being managed. (Un)certainty work constitutes a regime of computation that
interprets experiments in terms of probability data. It is through engaging the dimensions of
(un)certainty work in infrastructure, data production and computation labor, technological
development, and so forth that the historical impacts are most salient. In the 1950s cloud-seeding
initiatives, this computing work began with the conceptualization and design of visual environmental
and weather maps. Akin to the WWII bombing images and the sugar beet breeding maps, these
contoured atmospheric abstractions became the visual medium by which mathematical experiments
were conducted. I therefore conceive of cloud seeding ‘experiments’ as a layered reordering of
13 Daston, Cloud Physiognomy, 47. 14 Daston, Cloud Physiognomy, 48. 15 Daston, Cloud Physiognomy, 63. 16 Daston, Cloud Physiognomy, 63 (my emphasis).

194
information, occurring in chronological phases of physical interventions, data collection, and
mathematical calculation. These were organized into visual representations (maps) and ordered with
central computing mechanisms (e.g. confidence intervals). Ultimately, in the Cold War period
‘clouds’ were translated into probabilistic computing events.
Over the course of the Cold War, the 1930s conception of supercooled clouds evolved into
identifiable convection band “targets” that were determined not just by their ability to be “seeded”
through silver iodide operations but also by their ability to serve as control targets in randomized
statistical experimentation.17 Like individual clouds, convection bands remain poor statistical
controls. They are a rare physical phenomenon, occurring within a highly specific terrestrial-
atmospheric environment (mountainous regions) and only under highly specific conditions. From
the ephemeral nineteenth-century cloud taxon, to the rare supercooled cloud, to today’s convection
band targets, clouds have served as a slippery subject in weather prediction and modification. Still,
the 1950s cloud seeding initiatives generated powerful data infrastructures and epistemological
frameworks that have persisted into twenty-first century weather and climate modeling.
In this final dissertation chapter, I confront the blurry boundaries of mathematical ‘experiment
making’ in the context of 1950s and 60s cloud seed experimentation, which involved a melding
together of mathematical computing analysis and physical and environmental alterations. I take apart
conclusive mathematical experiments designed in the late 1960s and early 1970s to uncover their
technological, informational, and environmental underpinnings. The data used in these programs
was first generated in the 1930s, with a powerful snow and rain data collection project, responsive to
Depression-Era drought anxieties. I then consider the importance of data generated in physical
17 See, for example, in its recent drone iteration: T.P. DeFelice and Duncan Axisa, “Developing the Framework for Integrating Autonomous Unmanned Aircraft Systems into Cloud Seeding Activities,” Journal of Aeronautics & Aerospace Engineering 5, no. 172 (2016): 1-6.
195
silver-iodide experiments in the 1946-1957 period. Following this prehistory, the heart of this
chapter addresses lesser known experiments conducted by corporate and private interests
throughout the 1950s, focusing on experiments over Navajo and Hopi Land. I conclude with the
series of randomized mathematical experiments during in the 1960s, which synthesized this
multifaceted data from the previous three decades. This is when the climate of public opinion
shifted to doubt and distrust for weather modification programs partly due to failed mathematical
results.
I recast 1950s cloud-seeding programs and computing analysis as a cultural and economic
movement rather than a strict disciplinary or state initiative. Reframing cloud seeding as a
heterogeneous movement rather than a top-down state initiative brings to light the larger
environmental geographies affecting and affected by its data production and reveals a larger
computing laboratory. Consistent with earlier studies in this dissertation, I demonstrate that
rainmaking initiatives were a response to economic and environmental crises. Weather modification,
like the confidence planning movement was a project of public participation. Cloud-seeding
initiatives were designed as a response to demand across the whole industrialized world for
increased precipitation in places of drought, such as Santa Barbara County18 and Australia’s outback
farm territories, and for decreased precipitation in places of destructive weather, such as the
damaging hailstorms pounding the French countryside.19 In response to these potential markets for
geo-engineering, and emboldened by WWII technologies and infrastructures, elaborate trans-
18 The Santa Barbara County physical rainmaking experiments were the main experiment overseen by the Berkeley Statistic’s Group, but their larger ‘experimental’ analysis involved all the experiments covered in this chapter. Their experimental surveys were largely published in the late 1960s 1970s, after the physical experiments and data collection initiatives were concluded. See, for example: Jerzy Neyman, Elizabeth Scott, and M.A. Wells, “Statistics in Meterology,” Revue de l’Institut International de Statistique 37, no. 2 (1969): 119-148.

196
disciplinary and transnational data economies formed in efforts to make it rain or in some places, to
make it stop raining. This drive for artificial weather control operated through and with information
at every level of implementation. Data was also its downfall.
Data Streams and Hydraulic Empire
The 1950s RAIN and cloud-seeding programs constitute heightened moments of (un)certainty
work. Cloud-seeding programs involved techno-chemical interventions into weather systems
through the use of airplanes and electrical ground generators, which delivered silver-iodide smoke.
However, the entire process -- from deciding which clouds to seed, to the delivery strategy, and,
especially, the determination of whether or not an experiment was successful—was guided by data-
based assessment. Tracing the history and creation of this data—mostly precipitation data—reveals a
larger landscape of computing work and production, and a much longer history of reconfiguring the
landscape for this computing work, streaming from the late-nineteenth century to our current big-
data ocean. The information used in Cold War cloud-seeding analysis dates back more than a
hundred years, to experiments that set precedents in data, analysis, and decision-making still
impacting the region today. These epistemological and technological projects are inseparable from
the political projects that drive them.20
20 My thinking in this chapter draws from literature on indigenous and postcolonial thought and labor at the nexus of data and computing, see: Lisa Nakamura, “Indigenous Circuits: Navajo Women and the Racialization of Early Electronic Manufacture,” American Quarterly 66, no. 4 (2014): 919-941; Kim Tallbear, “Beyond the Life/Not Life Binary: A Feminist-Indigenous Reading of Cryopreservation, Interspecies Thinking and the New Materialisms,” in Cryopolitics: Frozen Life in a Melting World, eds. Joanna Radin and Emma Kowal (Cambridge: MIT Press, 2017); Kim Tallbear, “The Emergence, Politics, and Marketplace of Native American DNA,” in The Routledge Handbook of Science, Technology, and Society, eds. Daniel Lee Kleinman and Kelly Moore (London: Routledge, 2014): 21-37; Eden Medina, Cybernetic Revolutionaries: Technology and Politics in Allende’s Chile. Cambridge, Mass: MIT Press, 2011; Eden Medina, “Forensic Identification in the Aftermath of Human Rights Crimes in Chile: A Decentered Computer History,”

197
I use the term data streams to stress the importance of precipitation or water information in
weather and climate modeling, and also to capture the longer political histories and environmental
impacts of this computing information. Data streams from its origin sources just as it is being
directed somewhere else, and it transforms the landscape along the way.
Information used in the mathematical assessment of 1950s cloud-seeding experiments did
not originate from a single source. Data streamed in from late nineteenth and early twentieth-
century geological, hydrogeological, and meteorological surveys, driven by the National Geological
Survey and the American Meteorological Service. It was also collected by 1920s and 1930s New
Deal institutes such as the Soil Conservation Service and the Bureau of Indian Affairs, and after
WWII, from the formation of rain gauge stations, as will be shown in the following sections. It
streamed in from private entities such as big oil and smaller state enterprises. Finally, data was
produced from the physical water modification experiments themselves. What is important in
visualizing flows of water data used in Cold War cloud-seeding analysis is that the production of this
information involves complex political processes, of varying impacts. These data streams provide
context for understanding the longer political and social consequences of these programs.
I argue that cloud-seeding is a mode of aerial power, which aims to transform and control
the political and physical environments of the earth below. This
chapter centers on Arizona and the Navajo nation, within a larger cloud-seeding data economy
throughout the southwest—Colorado, Utah, New Mexico, California with extensions into Mexico
and Canada. The Berkeley Statistics Group’s RAIN programs were conducted in Santa Barbara,
California, but their analysis was entangled with the Arizona experiments. In terms of the temporal
Technology & Culture 59, no. 4 (2008): S100-S133. In Critical Data Studies: Craig M. Dalton, Linnet Taylor, Jim Thatcher, “Critical Data Studies: A dialog on data and space,” Big Data & Society (2016): 1-9.

198
dimension, cloud-seeding analysis ballooned between 1945-1960, but the data streams originated in
the late-nineteenth century, with a significant inflection point in the 1930s water scarcity crisis.
Taking the aerial vantage of Arizona, a larger computing landscape becomes visible. To the
north east is Navajo and Hopi land, that would become and continue to be a major site and
laboratory for cloud-seeding experiments throughout the Cold War period. The Salt River and
adjacent Theodore Roosevelt dam were contested bodies of water in the so-called production of
artificial precipitation. Tucson, in the southern part of the state, is another important hub in military
planning. It is also situated near a number of experimental laboratories—watershed gulches and rain
gauge stations—created to collect precipitation information. The Santa Catalina Mountains
backdropping Tucson were a major silver-iodide delivery site, because of the conditions of mountain
air.
At the foot of the Santa Catalina Mountains are two centers of calculation: Walnut Gulch
Experimental Station and the Desert Laboratory, geophysical laboratories designed for generating
and collecting precipitation data. Both remain incredibly important sites in ongoing computing
analysis. In the context of the U.S. entry into Korea, the state capital, Phoenix, came to serve as a
command center for military-driven cloud-seeding programs throughout the Southwest region. After
WWII, Phoenix became an aerial hub for commercial and military flight and a gateway between the
eastern seaboard and the west. In 1946, Kleberg county capitalists set up the Precipitation Control
Company there in 1946, creating a demand economy for cloud-seeding experiments throughout the
region. This computing landscape from Navajo and Hopi land down through the Santa Catalinas
and west through California, constitutes the epicenter of Cold War cloud-seeding analysis.
I relate this computing landscape to German technology historian Karl Wittfogel’s notion of
hydraulic empire, especially his conclusion that “those who control the [water] networks, are uniquely

199
prepared to wield supreme power.”21 Wittfogel’s notion of hydraulic empire is particularly fitting to
mid-century cloud-seeding experiments and to the longer history of settler colonialist expansion in
the southwestern regions, even as his original, orientalist thesis counterposes his “hydraulic
civilizations,” with western societies.22 Wittfogel’s hydraulic empire is premised on the idea that
whoever controls the water, controls the people. Hydraulic civilizations produce social hierarchies
and power structures that are built on the unequal distribution of water resources. In his studies,
Wittfogel focuses on Mesopotamia’s complex irrigation systems and the forceful extraction of labor
to sustain those systems, but his idea of hydraulic empire is an even more fitting description of the
processes of American colonial expansion over Mexican and Indigenous territory. Settlers harnessed
the conditions of water scarcity to achieve control over the southwestern regions.
In 1985, Envirotech historian Donald Worster’s 1985, Rivers of Empire revealed the American
West as a hydraulic empire, tracing politics of those who seized control of water, through riverways,
damns, and streams in the late-nineteenth century. His study centers geologist Wesley Powell, who
in the 1890s was director of the U.S. Geological Survey. The arrival of the U.S.G.S. marks the start
of the data flow, beginning with Powell’s 1890s campaign of “the accumulation of facts for the
people.” In the late-nineteenth century, the manipulation of water sources occurred more quickly
than efforts to document and quantify these transformations. Dams were built, land was seen as
available to exploit, and there were not yet “a lot of maps and data with farmers poring over
them.”23 Between 1890-1930, the U.S.G.S. became a major driver of rational survey work in what
they deemed to be “the arid region,” generating geological and hydrogeological mapping of land and
21 Donald Worster, Rivers of Empire: Water, Aridity, and Growth of the American West (New York: Pantheon Books, 1985). 22 See: Karl A. Wittfogel, Oriental Despotism: A Comparative Study of Total Power (New Haven: Yale University Press, 1957). 23 Worster, Rivers of Empire, 140.

200
water.24 The enterprise produced libraries of material data in the form of maps, charts, and record
books, which provided the Geological Survey, and other state and federal bodies with information
about water resources throughout the western territories, used in remapping the land.25 This was
driven by a search for water in a land of water scarcity.26
The formation of western hydraulic empire through the U.S. Geological Survey’s seizure of
the rivers and streams, and formation of dams, reveals the entangled histories of violence against
indigenous communities with the emergence of data-systems for tracking and mapping water
scarcity. Once the USGS was in the game, efforts to control water were structured at the level of
data and analysis. This data production extended beyond water measurement to the people
themselves. In Powell’s late-nineteenth-century expeditions along the Western rivers, his
commission documented the existence of indigenous communities as his anthropological subjects,
including the Utes of Utah; Pai-Utes of Utah, Northern Arizona, Southern Nevada, and
Southeastern California; the Go-si Utes of Utah and Nevada; the Northwestern Shoshone of Idaho
and Utah; and the Western Shoshone of Nevada.27 They created graphs and charts, took
photographs, and intervened into the communities, “for the purpose of consulting with them
concerning the propriety of their removal to reservations.”28
24 John Wesley Powell, On the Lands of the Arid Region of the United States, with a More Detailed Account of the Lands of Utah. With Maps. (Washington: Government Printing Office, 1879). 25 For a history of Powell’s harnessing of water, see: John Wesley Powell, ed. Wallace Stenger, C.S. Howard (2004, originally published in 1848). “Quality of water of the Colorado River in 1926-1928,” (Water Supply Paper 636-A, U.S. Geological Survey, 1929). 26 Bringing critical attention to Powell’s terminology, Diana K. Davis argues that, “the perception of arid lands as wastelands is politically motivated and that these landscapes are variable, biodiverse ecosystems, whose inhabitants must be empowered.” See: Diana K. Davis, The Arid Lands: History, Power, and Knowledge (Cambridge: MIT Press, 2016). 27 Don D. Fowler, Robert C. Euler, and Catherine S. Fowler, “John Wesley Powell and the Anthropology of the Canyon Country,” Geological Survey Professional Paper 670, Washington: U.S. Government Printing Office, 1969. 28 United States Bureau of Indian Affairs, Report of special commissioners J.W. Powell and G.W. Ingalls (Washington: Washington Government Printing Office, 1873): 1.

201
White settlers occupied land along the water, on the streams and rivers of Utah and
Colorado. Powell’s USGS. commission reported on the displacement of people from water sources:
The commission found that the feelings of the white people inhabiting the territory under consideration were wrought to the high state of resentment, which frequently found vent in indignities on the Indians, while the latter were terrified, and many of them had fled to the mountains for refuge.29
Beyond their displacement and forced removal, Native peoples in the southwestern region were
relegated to subjects of analysis, as part of the larger campaign to rationalize water and land
resources. Powell’s geological survey incorporated the peoples living along the waterways as
anthropological subjects. This continued into the twentieth century under the ballooning trends of
quantitative mapping and survey work. The term ‘southwestern’ itself came into common usage in
the 1920s and 1930s as part of anthropological studies of indigenous peoples. Prior to this point in
time, ‘southwestern’ referred to land in the larger Mississippi valley. The newer designation of
‘southwestern’ became tied to arid climate, drought conditions, and indigenous inhabitants.30
The designation of the southwest as a racialized arid landscape shaped the sciences of
climatology and meteorology. In 1930, a prominent Harvard climatologist Robert DeCourcy Ward
published a somewhat literary piece, How Far Can Man Control His Climate? In it, he surveyed the
current and sometimes outlandish methods used to guard against fog, frost, and flooding around the
world. Ward’s broader conclusion was that it was impossible to, “produce rain or change the order
of nature,” but that “the future will bring further advances in the way of controlling local climates is
certain.”31 He haughtily addressed the very recent trend of, “numerous so-called “rain-makers” who
29 United States Bureau of Indian Affairs, Report of special commissioners J.W. Powell and G.W. Ingalls, 1. 30 See, for example: Donald D. Brand, “The Status of Anthropology in the Western United States,” New Mexico Anthropologist 2, no.1 (1937): 4-16; E.B. Renaud, “Undeformed Prehistoric Skulls from the Southwest,” Science New Series, 64, no. 1661 (1926): 430-432; Frank H.H. Roberts, Jr., “Archaeology in the Southwest,” American Antiquity 3, no. 1 (1937): 3-33. 31 Robert DeC. Ward, “How Far Can Man Control His Climate?,” The Scientific Monthly, 30, no. 1 (1930); 18.

202
have plied their trade and often made large profits by contracting with farmers.”32 In the early
twentieth century, there were “professional rain-makers,” operating in the western United States
who would promise farmers rain in exchange for money. These were based on “secret methods”
that involved “mixing chemicals in large tanks.”33
Stressing his disbelief in rainmaking, Ward wrote, “these “rain-makers are, of course, pure
fakirs.”34 The word “fakir,” referring to a Muslim religious ascetic, is used here by Ward as a racial
slur, an explicit reference to his racism and anti-immigration and eugenics policy work, for which he
was well-known and which directly informed his climatology. For Ward, ‘climate’ included the entire
ecosystem in a given geographical area and the human races that he deemed were conditioned to
survive there. His theory of climate related to his theory of racial differences in his eugenic
philosophy.35 In his own travels, he wrote about the ‘acclimatization’ of white people in foreign
environments and his research into ‘climate’ earned him prestige and standing in the Association of
American Geographers, the American Meteorological Society, and more. Taking Wittfogel’s
hydraulic civilization analytic forward, we see how processes of water control are racialized and
further how these modes of resource control are built into systems of quantification and scientific
order.
Water scarcity is a constant climatic feature of the western landscape, with periods of
extreme drought as recurrent event. The threat and reality of water scarcity was harnessed
throughout the 1890 and 1920 period in the formation of geological and hydrogeological mapping.
There were continued large-scale efforts to establish and control water resources and information in
32 Ward, “How Far Can Man Control His Climate?,” 18. 33 See: C.F. Brooks, “Rain-Makers,” Bulletin of the American Meteorological Society 1, no. 5 (1920): 48. 34 Ward, “How Far Can Man Control His Climate?,” 13-14. 35 Robert DeC. Ward, “Climate and Man,” Bulletin of the American Geographical Society 39, no. 12 (1907): 735-738.

203
the arid western landscape. Hydraulic empire here is not just a matter of resource control, but the
control of information about water scarcity. From the mid 1920s through the New Deal era, the
southwestern region was hit with a period of extreme drought. The 1930s were then designated by
federal and state oversight as a crisis. This crisis catalyzed a movement for data-driven water
management, which would balloon again in the interwar period—a major inflection-point in my
designation of (un)certainty work. The drought crisis also catalyzed a large-scale livestock reduction
program on Navajo, Hopi, and Zuni land, that was justified with quantitative metrics of water
analysis.
There are two dimensions to the southwestern New Deal that are needed background for
understanding the later 1950s, cloud-seeding programs. First is the formation of a computing
landscape through the widespread creation of rain-gauge networks and experimental stations.
Second are the 1930s livestock reduction programs that represent a significant, traumatic moment
revealing how agency over water allocation is appropriated from local decision-makers through
processes of computation. New Deal logics about the water economy in the indigenous southwest
were incommensurable with the lived environment. Mid-century cloud-seeding campaigns in this
region need to be contextualized within this longer history of data-driven water control over
indigenous and colonized land. It is precisely in times of crisis that the contradictions in decision-
making systems are the most apparent.
Hydroscapes: Rain Gauges and Water Stations
At the center of 1930s precipitation data production in the Southwestern and western territories,
were the mapping and measurement technologies—rain gauges. Rain gauges are seemingly
unremarkable, or simple technologies, but at the nexus of the climate and weather science and the

204
history of computing, rain gauges were vitally important. A major contributor to this movement, the
Western Snow Conferences, stated in their commencement 1933 proceedings, “The need for
knowledge of the yearly varying quantity of water in the snow-pack which furnishes varying volumes
of stream flow to lakes and reservoirs for irrigation and power development is paramount to semi-
arid agriculture in the Western States.”36 If water is life tó éí iiná, to those who inhabit the southwest
water is also data within a hydraulic empire. Water data is valued as precious information about the
conditions of drought and aridity that directly informs decisions in agriculture, livestock
management, resource distribution, and human life in a region. In the interwar period, changes in
rainfall were studied through the strategic distribution of rain gauges over areas of land. The study of
rain gauge areas emerged because rainfall is not uniform in a given storm, necessitating the averaging
of discrete values. In the 1930s, rain-gauge data-mapping projects increased in the southwestern and
western United States. The physical distribution of rain-gauges was a techno-environmental project,
which overlaid landscapes with grids-and-clusters of these little measuring devices. The grid
designated these spaces as research stations and laboratories, a process of turning the earth itself into
a series of computing landscapes.
In 1930, a detailed study of desert rainfall, conducted at the Tucson, Arizona’s “Desert
Laboratory” of the Carnegie Institution of Washington, claimed to be only the second study of
“rainfall difference on a small area,” using rain gauge technologies.37 The 860-acre Desert Laboratory
on Tumamoc Hill was originally established in 1903.38 In 1911, Harper’s Magazine writer Ellsworth
Huntington described the purpose of the station, recounting in dramatic detail the spectacle and
wonder of the Laboratory. Its guiding epistemological project was cast as a mode of colonial
36 https://westernsnowconference.org/biblio?s=year&o=asc 37 Robert R. Humphrey, “A Detailed Study of Desert Rainfall,” Ecology 14, no. 1(1933): 31. 38 For a primary history of the laboratory, see: Judith C. Wilder, “The Years of a Desert Laboratory,” The Journal of Arizona History 8, no. 3 (1967): 179-199.

205
expansion into an uninhabitable, alien landscape, where life somehow miraculously thrived in the
cracked earth. But underneath this natural-history expedition, the desert laboratory was a federal
satellite—understood as a necessary research center in national economy and population control.
This was driven by a Malthusian anxiety, expressed in a problem: “as population increases, and the
need of land for cultivation becomes greater, […] “How can a country so dry be made to yield
food?”39
This Desert Laboratory, backdropped by the Santa Catalina mountains, was designed for
long-term data collection, reflecting the eternal nature and timelessness of the desert landscape. As
the Harper’s Magazine author noted, “The problems [were] not selected with a view to immediate
“practical” results, although their solution may ultimately be of incalculable importance in the affairs
of every-day life.”40 Precipitation and hydrogeological research was likewise designed to aggregate
information over long periods of time. A single rain season, much less a single rainfall, are only
drops in a bucket of the information needed to make sense of, and control water in the southwest.
In 1930, Carnegie installed 24 rain gauges throughout the Desert Laboratory, distributed in
an idealized grid. Sixteen were placed in four rows of four gauges each at intervals of 100 m.,
creating a big square. Eight additional gauges were placed in a straight line at 100 m. intervals from
the east corner of the square. The gauges were galvanized iron funnels topped by a vertical collar 5
inches high, inserted through a cork in the top of quart mason jar. Through the creation of this
experimental laboratory, rainfall data collection in the desert Laboratory commenced. This was a
data-collection project admitting the uncertainties of environmental conditions, weather and rainfall,
as well as the uncertainties of quantification, placing all hope on the precarious placement of mason
39 Ellsworth Huntington, “The Desert Laboratory,” Harper’s Magazine CXXII, No. DCCXXXI (April 1911): 658. 40 Huntington, “The Desert Laboratory,” 655.

206
jars in a 4 x 4 square. With each storm, rain would fall, and the jars would fill. Analysts would
calibrate the water levels and translate these into numbers, averages, and rainfall records, displayed
as perfect column by row matrices of precipitation information. This rain gauge station generated a
widely-circulated corpus of data, even though it represented only 24 points in the sand, and no more
than 400 meters of the vast southwestern landscape.
Reports from the Desert Laboratory capture the drive to quantify water scarcity, “Here the
rainfall, because of its relative scarcity and uncertain distribution, is undoubtedly the most important
climatic factor to be considered.”41 By the 1940s, the southwestern regions surrounding the Sonoran
Desert were patchworked with rain gauge stations like the ones in Tuscon’s desert laboratory.
Meteorology was rooted to agriculture through the study of hydrology, what one statistician referred
to as “hydro-metrology,” where hydrology is a study of forecasting ground water, swelling,
precipitation, rivers, streams, and run-off through statistical methods.42 Water data was the most
valuable scientific currency in the twentieth-century southwest. In the same moment as rain gauge
networks were first being installed throughout the southwestern region, this information was already
being translated into decisions about water scarcity.
Drought as Crisis
A significant inflection point of tensions in water scarcity decision-making was the 1930s
livestock reduction programs, a devastating New Deal response to the interwar drought crisis.43 The
federally mandated livestock reduction programs, first implemented in 1933 through the Bureau of
41 T.D. Mallery, “Rainfall Records for the Sonoran Desert,” Ecology 17 (1936): 110. 42 Charles F. Sarle, “Meterology and Agriculture,” Bulletin of the American Meteorological Society 20, no. 4 (1939): 154. 43 Literature on New Deal policy in Navajoland, see: Donald A. Grinde Jr, “Navajo Oppostion to the Indian New Deal, Equity and Excellence in Education 19, no. 3-6 (1981).
207
Indian Affairs (BIA), were a response to the designated drought crisis throughout the American
West.44 But they were more urgently a response to a designated crisis of overgrazing, as livestock
grazing beyond the capacity of the land had devastating impacts on the carrying capacity of the
environment. Livestock programs were tied directly to hydrogeological politics, as livestock feed
needed water to grow.
As sites for political inquiry, sheep, goats, and horses are the living entities at the heart of
agriculture in the American West. They have been central to histories on livestock reduction
programs throughout the twentieth century. Historian Marsha Weisiger’s scholarship on livestock
reduction centers sheep and goats, telling the history of Navajo (Diné) women during livestock
reduction, the people who were most directly impacted and traumatized by these programs, and who
led the resistance against the programs at the local, state, and federal levels. Weiseger’s work
addresses the drastically incommensurable views of livestock animals between the New Deal
administrative gaze and the Navajo economy. The Navajo home economy was matriarchal and
centered on goats and sheep to feed and sustain homes, families, and communities. This sharply
contrasts with the New Deal programs, which were geared to design and order the U.S. economy
according to patriarchal family units as the quantified nodes of rational production. The official
justifications for state intervention and appropriation and slaughter of Diné animals were framed as
44 There is a large body of literature on livestock reduction programs. I focus on literature Marsha Weisiger, who centers Navajo women activists in her analysis, see: Marsha Weisiger, Dreaming of Sheep in Navajo County (University (Seattle: University of Washington Press, 2009); Marsha Weisiger, “Gendered Injustice: Navajo Livestock Reduction in the New Deal Era,” Western Historical Quarterly 38, no. 4 (2007). See also: William M. Denevan, “Livestock Numbers in Nineteenth-Century New Mexico, and the Problem of Gullying in the southwest,” Annals (Association of American Geographers) 57 (1967): 691-763; Ruth Roessel and Borderick H. Johnson, eds. Navajo Livestock Reduction: A National Disgrace (Arizona: Navajo Community College Press, 1974). For a history pertaining to earlier reclamation policies, see: Christian W. McMillen, “Rain, Ritual, and Reclamation: The Failure of Irrigation on the Zuni and Navajo Reservations, 1883-1914,” Western Historical Quarterly 31, no. 4 (2000): 434-456.

208
balancing the units of productive analysis for these male-centric households, which were entirely
incommensurable with the actual matriarchal structure of Navajo home economy.
New Deal logics were designed around water scarcity. Sheep, according to the Bureau of
Indian Affairs and the Soil Conservation Service, were quantified as units of water analysis. One
sheep unit was equivalent to one year’s worth of water needed to grow the feed for that sheep.45
Taking sheep as units of rational production was consistent with the New Deal’s quantitative
restructuring of family consumption and production towards reaffirming a white patriarchal farm
society. These expanding systems of model-based planning were further fueled by the 1920s towards
econometrics and industrial-agricultural management systems. These were rooted in the
formalization of measurable farm-family units—with the male head of household as primary
producer, and the wife and children as additional consumers.46
The ongoing violent slaughter of Navajo and Hopi goats and sheep, at the hands of the
Bureau of Indian Affairs and the Soil Conservation service, was justified as a means of balancing the
worksheet. While drought conditions in the 1930s American West were very real, and exacerbated
by conditions of overgrazing in the region, ‘excess’ in livestock ownership was determined by the
metrics of New Deal rational planning, not by the experience of Navajo and Hopi farmers and
home managers. And these policies were loudly contested throughout. The 1920s and 30s episodes
45 See: Marsha Weiseger, Dreaming of Sheep in Navajo County (Seattle and London: University of Washington Press, 2009): 7-8; Weiseger describes the anxiety of Federal agents in response to the crises of drought and over grazing: “Yet in their haste to an environmental crisis, federal administrators and conservationists unwittingly made matters worse, both ecologically and culturally. With missionary zeal, they imposed on the Navajos an experimental program based on the emerging sciences of ecology and soil conservation, while disparaging local knowledge and ignoring the importance of long-established cultural patterns.” 46 For primary literature on the development of agricultural statistics and farm economics applied to the Navajo region, see: Murray R. Benedict, “Development of Agricultural Statistics in the Bureau of the Census,” Journal of Farm Economics 21, no. 4 (1939): 735-760; Marion Clawson, “Suggestions for a Sample Census of Agriculture in the West,” Journal of Farm Economics 22, no. 3 (1940): 633-637; Robert Marshall, “Ecology and the Indians,” Ecology 18, no. 1 (1937): 159-161; J.W. Hoover, “Navajo Land Problems,” Economic Geography 13, no. 3 (1937): 281-300.

209
of drought crisis in the American West, and the generation of information and misinformation in
response, makes clear that the racialized creation of informal and de facto policies about the
environment and land allocation, and decisions in their implementation, were reaffirmed at the level
of data and analysis.
Following WWII, another drought crisis hit the southwestern region. This crisis gave rise to
weather modification programs, designed to generate precipitation in the region. A regime of
“rainmakers” harnessed drought anxieties in the formation of new water policy and quantitative
control. Their programs carried New Deal precedents in water control and data production that
forward, now emboldened by WWII technologies and economic systems. Most significantly,
weather modification was an aerial initiative, aiming to control the southwestern landscape, from the
sky. Hydraulic empire rose to new heights from 10,000 feet.
Rainmakers
In 1947, a regional paper reported, “Hopi snake dancers were described today as incensed over the
white man’s invasion of their realm as rainmakers.”47 The paper was reporting on a recent complaint
by Hopi people about recent silver-iodide experiments conducted over the Roosevelt Damn on the
Salt River, northeast of Phoenix. The paper quoted a Hopi commentator as saying, “If white men
want water, let them do their own dancing and make their own clouds.”48 This newspaper report
captures some of the contradictions in the term ‘rainmaker.’ Rainmaking is a term used in the article
to refer to the rain dancing ceremonies of the Hopi and Zuñi people. Rain dance ceremonies are an
indigenous concept and custom that in the twentieth century, had been requisitioned as the scientific
47 “Hopi Rainmakers File Complaint,” The Baltimore Sun, July, 23, 1947. 48 Ibid.

210
control over nature.49 The term “rain-making” was appropriated throughout the twentieth century,
by white administrators, scientists, capitalists, and meteorologists, who promised to make artificial
rain through aerial interventions. In the early 1950s cloud seeding campaigns, traditional Hopi
dances were racialized as “primitive” and efforts to control rain through literally bombing clouds
were upheld as “modern.”
In this chapter, I use ‘rainmakers’ for the people and institutions that directly contributed to
designing artificial rain and the formation of the cloud seeding data-economy. The term is a very
prominent actor’s category, primarily used by those with a for-profit interest to convince the public
that they could generate artificial rain. I extend the term to the entire network of interests working
on the cloud-seeding experimental programs, in order to underscore the fact that none of these
programs were politically neutral. My use of the actor’s category, rainmaker, should be read in the
context of its conflicts and contradictions, which persist throughout the cloud-seeding enterprise.
My direct focus is on two specific groups of rainmakers that have been largely overlooked in the
historiography on Cold War weather modification programs: statistical and algorithmic thinkers and
49 See: George List, “Hopi Kachina Dance Songs: Concepts and Context,” Ethnomusicology 41, no. 3 (1997): 413-432.
Figure 32: “Rain Making Firm Takes Mexico Jobs,” The Arizona Republic, Sunday, May 29, 1949.

211
private for-profit capitalists, who explicitly identified themselves as ‘rainmakers.’ Beyond the
technical and political work of the Berkeley Statistics Group, I study the expanding programs of the
Arizona Precipitation Control Company (PCC).
Throughout the 1950s, the Precipitation Control Company, headquartered in the semi-arid
Kleberg County, Arizona, executed cloud-seeding experiments over Arizona, California, Navajo and
Hopi land, and Coahuila, Mexico. There were two dimensions to producing these programs:
acquiring technological resources and creating a public need. By the start of the Korean War, the
Kleberg County rainmakers were successful in accruing technological and monetary resources left
over by WWII. For example, they acquired WWII machinery and commissioned military workers in
the U.S. and Mexico to redesign aerial bombers as cloud-seeding machines. They also came into
possession of ground generators used for cloud and smoke-screen research during WWII. As
pictured in the newspaper clip, “Cloud Busting Mapped for the Coahuila Area,” the PCC worked
with Mexican Air Force personnel and agricultural administrators to extend these programs to the
Coahuila region. Following this meeting, Mexican agricultural financier Federico Sanchez stated,
“We feel that our people can be benefited by this new rainmaking method.”50 In a spirit of
entrepreneurship, the PCC repurposed second-hand military technology for generating a profit
economy in agriculture.
The second dimension to the PCC’s rainmaking initiative was to generate a demand
economy and need for cloud-seeding programs. This was part of a larger trend of military,
government, and private interests working in local and regional contexts to harness resources from
those most in need of rain. Money was harnessed from agricultural administrators and farming
groups from Northern Mexico, the Navajo Nation Council, and farming townships throughout the
50 Quoted in “Rain Making Firm Takes Mexico Jobs,” The Arizona Republic, Sunday, May 29, 1949.

212
southwestern United States to the Saskatchewan and Manitoba regions of Canada. Common
throughout the growing forced-demand economy was that experiments were conducted over
indigenous land and funded by local farmers. Rainmakers harnessed resources from a wide and
diverse set of agricultural interests to fund their cloud seeding programs. It was an atmospheric
initiative that promised artificial rain to a needy public, through transforming public land and sky
into an experimental laboratory.
Entities like the Kleberg County rainmakers directly contributed to the production of
physical cloud-seed experiments, as well as the generation of cloud-seeding data and a growing
computing landscape. This is to say that those who sought expand cloud-seeding enterprise for-
profit converged with analysts commissioned as “objective observers,” contributing to a growing
computing network on the transnational stage geared to stabilize a mode of (un)certainty work over
weather control. By the early 1960s, a widespread public backlash against the programs would situate
the Precipitation Control Company in Phoenix, Arizona, and the Berkeley Statistics Group in
Northern, California as oppositional forces on the question of accuracy.
The Berkeley Statistics Group entered into cloud-seeding from a different vantage. In the
1920s and 1930s, mathematical-statistical analysis rapidly integrated into meteorological and
hydrogeological data collection processes in the United States. By the early 1950s, State survey
bodies were eager to officiate contracts for their mathematics departments, as they wanted to
maintain relevance in government and policy decision-making, in the postwar world. Cloud seeding
provoked the interest of a number of burgeoning data-science and computing outfits centered in
universities or private and government centers. It was an opportunity to assert state and public
relevancy in the postwar economy. These computing outfits were interested in consolidating and
standardizing the way weather data was processed and analyzed via new mathematical methods.

213
In March of 1952, a contract was made between the State Water Resources Board the
University of California Regents titled: "Statistical investigation of precipitation with particular
reference to rain making operations." The “contractor” in this case was the Berkeley Statistics
Group at the University of California, Berkeley. In its first year, Jerzy Neyman and Elizabeth Scott
began their data collection process, which was a painstaking process. Their eventual network of data
contributors included meteorological institutes, oil companies, military consultants, public works
administrators mostly in water management, and other university groups working on weather
modification. The contributors held varying rationales for having collected data in the first place and
varying interests in their willingness to share or exchange information. For example, competing
research groups at other universities, even as close as Stanford University, were resistant to share
their data.
The statistics group obtained information about potential sources through informal talks
with relevant parties, through letter writing, at conferences, or hassling central agencies interested in
weather information, especially the National Weather Bureau. In other words, much of the initial
data accumulation was hearsay about the locations of existing information and the identities of
people who might have collected, managed, and preserved that information. In July of 1952, for
example, Neyman wrote C.D. Ball, the General Superintendent of the Standard Oil Company of
California, to request a copy of their sporadic California records on ‘rainage’ in the southwestern San
Joaquin Valley and adjacent areas as well as several years of records obtained at Estero Bay. This
piecemeal gathering of existing information constituted the mathematicians’ early 1950s rainmaking
database.
These patchwork efforts to centralize a precipitation database delinked information from the
earthly conditions in which it was created. A measure of precipitation is a statistical estimation or
averaging of water levels in a designed region of water analysis that is limited by technologies and

214
data practices. It is a measure of unknowability, and an effort to grasp control over fleeting weather
conditions. These unreliable measurements represent nodes of designed certainty in unstable
systems of water collection and analysis. Conditions ranging from variability in weather systems, to a
lack of homogeneity in rainfall, inconsistent placement of rain-gauge technologies, and shaky
systems of data collection and analysis all contribute to this instability.
However, this same data holds very real political value in resource decision-making on the
ground level. This information is used to make decisions about life on earth. These computing
landscapes, and the computing systems designed to manage them, are not neutral. As with earlier
case studies in this dissertation, the commissioned RAIN project and analysis created by the
Berkeley Statistics Group were part of a larger international program to design certainty in the
context of social and economic crisis echoing the new deal era—the recurrent drought crisis.
Navajo (Diné) Skies and Arizona Rain in the Context of Korea
Efforts to quantify the skies between 1945 and 1955, directly link domestic water control in
the United States to the Pacific proxy wars. The first wave of cloud-seeding programs occurred at
the start of the U.S. war in Korea. As the United States military mobilized for entry into Korea, rain
makers in the U.S. Southwest mobilized new infrastructures for aerial-driven cloud-seed
experimentation, data collection, and quantitative analysis over domestic territory. Efforts to design
systems and infrastructures for aerial bombing abroad reflected the internal militarization of the
southwestern skies. Domestic programs purported to “control the weather” for public good, even as
they abided a strict military lexicon. From the vantage of military research and development, the
Korean War provided a needed opportunity for recovering weapons research and analysis programs.
It was an opportunity to redeem their embarrassingly inefficient management of the aerial bombing

215
economy during WWII by improving their programs. It was believed that with more efficient
weapons testing and mathematical oversight came the possibility of more profitable enterprise.
After 1945, Vannevar Bush’s Office of Scientific Research and Development (OSRD) had
officially stated a directive of ‘peacetime’ research. But while the Pentagon nominally moved into
peacetime spending, funding for Operations Research projects, mathematical ballistics analysis, and
algorithmic directed management of military resources ballooned. The Manhattan Project funding
that had purportedly dried up in the transition to peacetime research was reallocated to the
advancement of algorithmic systems and resource management.
Between 1950 and 1953, Pentagon and military spending increased for the continued testing
of probability-led experiments, to sustain the growing labor of calculation. This was manifest in new
computing education programs, bureaucratic reorganization, and the formation of new systems for
circulating destruction data. The Pacific theatres and North Korean soil were transformed into large-
scale laboratories, where tonnages of bombs were dropped generating a swell of destruction data.
This information was fed back into algorithmic data-management research in the United States.
There, the Pentagon allocated funding for internal computing projects, like Project S.C.O.O.P., for
the development of the simplex algorithm to manage military resource allocation. At the same time,
university mathematics departments received new military contracts similar to their wartime
programs. Ideological threats of communism in Korea thinly veiled an enthusiastic expansion of
military programs and computational testing.
This growing economy of bomb-data production and weapons analysis boosted
development of digital computing “war machines” in U.S. institutions. Electronic memory-stored
computers in use during the war in Korea included the Harvard Mark 1, or the IBM Automatic
Sequence Controlled Calculator. The overarching dream was to construct an artificially managed
military database to oversee military activity throughout the postwar world. The hope was that these

216
machines would help wrangle the daily onslaught of ballistics information that they were tasked with
organizing, and thereby render the daily activities of military field agents efficient, rote, and sensible.
These calculators were imagined to stabilize and manage the ascendant modes of data-driven aerial
governance on the world stage in occupied and wartime contexts, an ambition for aerial control that
had not yet been achieved.
Weather modification programs in North America were an extension of the Cold War proxy
wars. The ambition to control the skies through quantitative governance was shared between
rainmakers in the southwest and military personnel in the occupied Pacific. Rainmakers and
bombardiers shared the ambition to quantify the skies through the epistemological and experimental
world of probability. This (un)certainty work was stabilized by technologies and infrastructures
needed to sustain it. In this context, Phoenix, Arizona was the Pentagon of water modification
programs and resource control in the Southwest. The city did not necessarily hold monopoly over
the expanding water resource institutes; these were spread throughout Colorado, California, and
New Mexico. But Phoenix was the geographical center of Southwestern cloud-seeding programs,
and the home of the Kleberg County rainmakers. It also served as a nominal command center in
resource experimentation and decision-making throughout the Southwest territories, decentering
and marginalizing Navajo and Hopi councils in resource decision-making and the management of
water.
Many interests converged to shape the semi-arid Southwestern landscape into a data-driven
desert laboratory and computing landscape. This story cannot be reduced to military oversight, as
private enterprises such as the Kleberg County rainmakers harnessed funding from a patchwork of
state and local interests. In fact, by decentering military and federal oversight in this history, other
actors emerge on the stage, shedding light on the complexity of contested water resources in the
region. At the same time, these programs were saturated with military funding, technology, and logic

217
systems, even as rainmakers promised water as a public good. This was a mass mobilization effort,
that upon closer look, reveals significant complexities, and a grasp for control over decision-making
about ground water data.
On July 15, 1950, mechanical engineer Dr. Vincent J. Schaefer arrived in Phoenix, Arizona
for a meeting with regional water administrators, to map out a new watershed experimental station
in the valley. Schaefer was by then widely-known for the silver-iodide method and experimental
physics. But on this visit, he was serving in his capacity of research associate for General Electric
laboratories. His employment with General Electric stretched back to WWII, where he had gained
considerable experience with smoke and particle experimentation, over large landscapes. Employed
by General Electric Co., and funded by the United States Army, Schaefer and partner physicist
Irving Langmuir conducted smoke screen and artificial cloud experiments over hundreds of miles of
land and sky.51 Their work aimed to theorize cloud and smoke phenomena in outdoor contexts, as
they worked to stabilize military control of land visibility from the aerial vantage.
Smoke and cloud experimentation required technological machinery that consumed material
resources in large quantities. Smoke screens were primarily produced with ground generators. These
machines consumed tonnages of oil and water, as oil was converted into controllable smoke
material. The large amount of funding feeding WWII smoke screen programs, which utilized
cutting-edge military technology, set a precedent in the technological infrastructures behind artificial
rain experiments.
On this hot July day in Phoenix, Arizona, just a few weeks after the U.S. start of the Korean
War, Schaefer was visiting to oversee plans for a proposed experimental Watershed area, which
51 For an account of their wartime research conducted under a National Defense Research Committee (NDRC) contract, see: Irving Langmuir, “The Growth of Particles in Smokes and Clouds and the Production of Snow from Supercooled Clouds,” Proceedings of the American Philosophical Society 92, no. 3 (1948): 167-175.

218
would be used to collect data on rainfall, ground swelling, and other precipitation measures. The
proposed watershed would be an area of dug-out earth on the edge of Arizona’s Santa Catalina
mountains.
Over the course of the Cold War, and still today, Walnut Gulch experimental station, like the
Desert Laboratory, was a ‘controlled’ experimental environment for generating and collecting rainfall
and ground swell precipitation information. Experimental stations, like Walnut Gulch, were
geophysical centers of calculation in hydrogeological and meteorological analysis. These
experimental spaces served as important nodes for producing weather and climate data and
ultimately, for shaping decision-making systems and policy over the region.
The July 1950 meeting offers a perfect portrait of the represented interests in hydro-resource
oversight in the region. Pictured here are the four administrators and scientists who held
unrestrained authority in developing hydrogeological projects and weather experimentation. Vincent
Schaefer sits center, sketching out a map of the Arizona Valley, the proposed experimental
watershed area. Posed around him are R.J. McMullin, manager of Salt River Valley Water Users
Association, R.D. Searles, Water Users’ president, and S.A. Ward, manager of the Salt River Power
Figure 33: “Rain Making Pioneer Hints Weather Control,” Arizona Republic, July 16, 1950.

219
District. Searles of the River Valley Water Users had already spent over $120,000 on cloud-seeding
since 1947. This gives a clear picture of the powers of resource management and control in the
southwestern region, which aimed to reaffirm their position through the weather modification
programs. It further depicts the fact that aerial cloud-seeding experiments were designed to reaffirm
extant and newly-minted water control centers on the ground.
While the demand economy for cloud-seeding programs would emerge from various local
and regional contracts and individual programs, the military set a precedent in unregulated aerial
experimentation. Schaefer’s trip to Tucson came right after his involvement with ‘Project Cirrus,’ a
military cloud-seeding experiment currently active in New Mexico.52 Other programs included
‘Project Stormfury’ and ‘Project Firesky.’ At this point the process and results of the experiments
carried forward a wartime display of secrecy: “What happened in the two weeks experiment is
known only to residents of New Mexico and Dr. Schaefer and his associates.” This military backing
gave tremendous authority to scientists like Shaefer who served as liaison between the military and
local administrators. The Arizona Republic, wrote, “The first man to make the heavens weep—
[Vincent J. Shaefer]—believes tremendous strides have been made toward human control of
weather.”53 This hubris was counter-weighted by the work still needed to be done to bring these
programs to fruition, from experimentation, to data collection and analysis, to establishing systems
and protocols for decision-making after the rain. Human control of the weather, even as practiced
52 Project Cirrus began in 1947 as a contract between the Army Signal Corps and General Electric Company. See: “Rainmaking Project Stops,” The Science News-Letter 61, no. 8 (1952): 125. See also: “Project Skyfire Aimed at Stopping Lightening Fires,” The Science News-Letter 71, no. 24 (1957): 373. For a history of weather control more broadly, see: James Rodger Fleming, “The pathological history of weather and climate modification: Three cycles of promise and hype,” Historical Studies in the Physical and Biological Sciences 37, no. 1 (2006); 3-25. 53 “Rain Making Pioneer Hints Weather Control,” Arizona Republic, July 16th, 1950.
220
by anointed demigods such as Vincent Shaefer, was still very much beyond the horizon of
possibility.
Not in attendance at this July 1950 meeting were representatives from the Navajo and Hopi
communities, even though their communities were and are the most vulnerable to water scarcity.
The expansion of infrastructures for cloud-seed weather modification programs occurred
simultaneously with the appropriation of Navajo and Hopi ground resources through state and
federal mandates. And these two programs were not distinct, as private rainmakers appropriated
funds from Navajo and Hopi decision-makers directly into their cloud-seeding experiments.
Military-led cloud-seeding programs in the southwest opened the skies to private enterprise.
Just the week prior to arriving in Tuscon, Schaefer had convened in Phoenix with Charles Barnes,
president of the Precipitation Control Company (PCC), which was reported to have “contracts with
various groups in Arizona to put moisture on the ground.”54 As described earlier, Charles Barnes
founded the PCC in the immediate aftermath of WWII. The company had since worked to acquire
and repurpose wartime technologies, predominantly ground generators and retired B-52 bombers,
for the development of cloud-seeding programs. While official military and federal programs created
huge throughways for aerial-weather modification in the region, it was these semi-private companies
and firms that were generating interest on the ground.
The PCC worked to acquire seasonal resource and water funds from local and regional farm
organizations, at the city, county, and even town levels. A major interest of theirs was in the Navajo
Resource Council, as this was a means of appropriating federal relief and rehabilitation funds.
The Precipitation Control Company first solicited funds from the Navajo Resource Council
in 1945. Charles Barnes had inroads with his primary point-person, Navajo councilmen, Howard
54 Ibid.

221
Gorman. Over the next few years, Gorman would be an enthusiastic proponent for cloud-seed
programs, to such a degree that he earned the nickname “rain boy” by his Navajo community.
Gorman’s interest in cloud-seeding resonated with his larger initiatives over the past two decades in
expanding Navajo wage-labor force outside of the reservation. Gorman had been centrally involved
during the New Deal programs, as he served as liaison between the BIA and the Diné and was
personally traumatized by his witness of livestock slaughters in Ganado.55 From 1938-1942, Gorman
was vice chairman of the Navajo Tribal Council, and he would represent Ganado on the council for
another three decades. In the period following WWII, he worked as liaison between Navajo workers
and industrialists interested in their land and labor resources.
The integration of work-wage labor and the massive extraction of Navajoland resources by
external interests, set precedent for state and industrialist appropriation of indigenous resources and
labor in forming the cloud-seeding economy. A major shift in labor conditions occurred during
WWII, as Navajo men were commissioned for resource-related work outside of the reservation,
usually pertaining to energy work in steel, coal, and uranium mining.56 This was in the context of a
much-larger drive to extract natural resources, especially uranium from Navajo territory.57
In 1949, Gorman first appealed to the Navajo Resource Council to hire a rainmaker. When
C.B. Barnes of Arizona’s Precipitation Control Company solicited funds for an initial set of
experiments, he was chasing a storm up from El Paso, Texas. Gorman appealed to the Navajo
National Council in 1949 to hire a rainmaker. The council initially funded the PCC with $2,500 to
55 Weisiger, Dreaming of Sheep in Navajo Country, 17. For biographical background on Gorman, see: Howard Gorman, Interview by Mrs. Horace Biggs, Oral Recording Transcription, July 10, 1970. 56 For a comprehensive history of Navajo work wage labor, see: Colleen O’Neill, Working the Navajo Way: Labor and Culture in the Twentieth Century (University Press of Kansas, 2005). 57 See: Traci Brynne Voyles, Wastelanding: Legacies of Uranium Mining in Navajo Country (Minneapolis: University of Minnesota Press, 2013); The Navajo People and Uranium Mining, eds. Doug Brugge, Timonthy Benally, and Esther Yazzie Lewis (Albuquerque: University of New Mexico Press, 2007); Andrew Needham, Power Lines: Phoenix and the Making of the Modern Southwest (New Jersey: Princeton University Press, 2014).

222
begin the cloud seeding programs. The decision was not unanimous, with an almost 50% split
against. To be cautious, they set aside 5,000 as a relief fund, should the programs not work, to be
able to carry water to their sheep. Barnes was instructed to steer clear of Hopi land. The Albuquerque
Journal reported that, “The Navajos are going to trust to the white rain-makers, but the Hopis
continue their trust in their rain dances.58 Echoing of New Deal policy, the solicitation of funds
from Navajo council for cloud-seeding experiments became part of a larger state and federal interest
in directly appropriating resources for resource management programs.
On April 19th, 1950, the federal government mandated an Act “To promote the
rehabilitation of the Navajo and Hopi Tribes of Indians and a better utilization of the resources of
the Navajo and Hopi Indian Reservations, and for other purposes.”59 The ‘rehabilitation’ bill had
been in the making for some time, and it was hotly contested. The bill had become a stand-in for
debating the Indian commissioner John Collier’s destructive policies of the last 15 years. Collier
opposed the bill and so this gave many a good reason to support it. As things progressed, dissent
increased. In 1949, newspapers reported on oppositional voices in the Navajo and Hopi tribal
councils. In negotiating the proposed congressional rehabilitation fund, upwards of $100,000,000,
there were conflicting visions of how those monetary resources would be used. Some local Indian
Welfare groups favored putting the bill in front of Truman, primarily because they opposed Indian
commissioner Collier. The 1950 rehabilitation bill was a new iteration of an old dynamic describing
federal oversight of indigenous territory, reinscribing existing tensions between state administrative
entities, and Native decision-makers, over the management of water resources in the region. The
legacy of the livestock programs echoed in these new rehabilitation efforts.
58 “Hopis Scorn White Man’s Rain Making Devices, Stick to Snake Dances,” The Albuquerque Journal July, 04, 1950. 59 Act of April 19th, 1950 (64 Stat. 44; 25 U.S.C. 635).

223
After being denied by the Navajo council for a second round of cloud-seeding experiments,
the PCC directly appropriated rehabilitation funds from state oversight, arguing that this was
towards the advancement of weather modification programs. This set a precedent in appropriating
contested funds for allocation of water resources in the region for weather-modification research.
The PCC was not the only semi-private cloud-seeding enterprise operating in the region. Another
private enterprise was the Water Resources Development Corporation of Denver, Colorado
(WRDC), run by Dr. Irving P. Krick. The WRDC was a enterprise identical in kind to the PCC. In
the early 1950s period, the WRDC worked to collect funds, county by county throughout the greater
western regions, and this work would eventually extend internationally. In New Mexico, the WRDC
had solicited cloud-seeding funds from ranchers, who by 1951 were already skeptical of Krick’s
promises.60 And this stretched northwards, in the 1951 season, seven northeastern Wyoming
counties and one southeastern Montana county contributed to the overall cost of the cloud-seeding
operations carried on by the WDRC of Denver.61 On March 6th, 1952, in Colorado, 400 county
farmers voted to allocate $7,000 of their seasonal funds to the WRDC, in the hopes that the ground
generator and silver-iodide method interventions might alter the precipitation levels of their clouds.62
Ground level solicitation of interest, acquisition, and appropriation of funds from local
farmers contributed to a growing demand economy for cloud-seeding programs. Information
generated from their experiments eventually streamed into a much larger computing enterprise,
geared to stabilize and make sense of weather modification in the region. The initial surge of these
cowboy driven experiments, emboldened by the war in Korea, were followed by efforts to quantify
and assess the outcomes.
60 “Must Have Clouds First, Krick Says,” Albuquerque Journal, August 16th, 1951. 61 “Six Northeastern Counties to Join in Rain Program,” Casper Star-Tribune, December 23rd, 1951. 62 “Mitchell Votes for Rain Plan,” Abilene Reporter-News, March 7, 1952.

224
The political, administrative, and scientific actors on the ground, who represented the Republic of Arizona,
and who were working to harness control of ground water resources through intervention in the skies, relegated their
authority to mathematical decision-makers. Cloud-seeding was always a dual-experimental program,
involving the physical-environmental interventions as well as the production of experimental data
and analysis. Physical experiments conducted in the Arizona skies were deemed early-stage events, in
what was anticipated to be a 5-10 year wait for data accumulation towards a comprehensive data
analysis. At that same July 1950 meeting, Schaefer and Irving Langmuir remarked that, “We are now
through with the field work. For the next year we expect to be working on the evaluation of all the
rainmaking work that had been going on all over the world. From this evaluation may arise new
problems, or there may come the answers to a good many things (sic).”63 Already by 1950,
rainmakers relegated the authority of weather-modification to data analysts. They believed that
answers to the success and reliability of the programs, and the potential for human control of the
weather, would come through computing expertise.
Cloud-seeding programs were asserted by military, state, and private interests as a needed
solution to agricultural uncertainties. This was the primary justification for the programs. But the
adoption of cloud-seeding programs as agricultural ‘solution’ was not uniformly accepted, and a
closer look reveals the complexities in aerial-agricultural planning, as they relate to data analysis and
resource decision-making on the ground. Returning weather and climate control back to earth
uncovers political discontents in decision-making that are not visible from 10,000 feet. The politics
of the airways are not distinct from the politics of the ground, and especially with cloud-seed
programs geared to control precipitation levels and water resources, it is important to ask, for what
and, for whom? This is a question of whether techno-mathematical interventions into the weather
63 Arizona Republic, “Vast Strides in Rain Making Cited In Predictions For Controls,” July 16, 1950.

225
were designed towards economic and environmental equality, or to reaffirm extant and emergent
water politics on the ground.
Rain-Gauge Uncertainty Analysis
Following WWII, a significant shift occurred in statistical planning, decision-making systems,
and predictive analysis over weather control. This shift involved the formation of precipitation data-
collection systems, as treated in the data streams section, and a new mode of making-sense of data
through regression analysis and (un)certainty work. Regression analysis, probability tables,
hypothesis testing, and confidence intervals comprised the analytic-apparatus of Cold War weather-
modification assessment. In the 1950s, new mathematical frameworks for analyzing statistical
significance and outcomes were implemented to assess the viability of cloud-seeding experiments
around the globe. Motivated by the Cold War planning virtues of optimality and efficiency, an
international network of cloud-seed analysts, went to work to determine a singular and standard
Figure 34: Robert R. Humphrey, “A Detailed Study of Desert Rainfall,” Ecology 14, no. 1(1933): 31.

226
method of analysis. Their (un)certainty work translated preexisting precipitation data and
information collected from military and private-enterprise cloud-seeding programs into valued
material that would be used in forming larger infrastructures for quantitative and algorithmic
decision-making.
From World War II through the 1970s, rain-gauge generated precipitation data and mapping
analysis was the base information body in weather modification assessment. Over the course of the
twentieth century, this data streamed through an evolution of decision-making practices, from the
initial modes of collection and regression analysis, to confidence maps, to algorithmic decision-trees,
and Monte Carlo programs, that would be of more common usage by the 1970s. Late Cold War
advancements in radar and satellite technology would come to supplement and displace rain-gauge
technology as the predominant source of information. However, the streams of precipitation
information, generated within these earlier twentieth-century computing landscapes, relied on rain-
gauge technologies as the primary data source. Rain gauge technology informs these mathematical-
epistemological frameworks and is also the root of analytic uncertainty. Water captured in the
Sonoran Desert was abstracted from its local conditions, but not entirely, as uncertainty was first
calculated in the base design and placement of the mason jars.
In 1950, the University of California, Berkeley and the State Department of Public Works,
Division of Water Resources, commissioned the Berkeley Statistics Group for their RAIN
programs. The programs aimed to design a rain making experiment for the region, involving both
the design of silver-iodide interventions as well as the design of the computational analysis. At this
point in time, the group used information from the Arizona experiments, and experiments
conducted internationally, as a blueprint for their own experimental design. This began with a
happenstance data-collection project, as the quantitative assessment of clouds, by the current
methods, required a large and complete database:

227
…efforts will be made to organize a continuing statistical follow-up for treatment of those future rain making attempts which will be going on independently of the controlled experiment. It is hoped that within a few years it will be possible to collect and to analyze enough data to lead to the final authoritative conclusion regarding the important problem of artificial rain making.64
Their experimental design hinged on the collection of “basic rain data.”65 Some basic data was
available from already existing New Deal entities, such as the Western Snow Conferences, who had
already collected large-bodies of hydrogeological information in their water scarcity programs.
A majority of the basic rain data came from the ground stations. The analysts worked to
pool information generated in a number of “rain-gauge stations,” for their central precipitation
database. By the early 1950s, the U.S. Weather Bureau of Washington D.C. was operating a number
of stations, and so the Bureau held oversight on the data. The Berkeley Statistics Group traced
streams of information to this source, and in 1952, Jerzy Neyman wrote the chief of the Weather
Bureau, “Data from these stations are urgently required [we are] seeking satisfactory statistical
methods for the valuation of attempts at the artificial production and/or control of artificial rainfall
by private operators.”66 In addition to national enterprises, the group focused on a collective of
regional stations in South Central California, including the La Panza Ranch, Cholame Hatch Ranch,
Taft, Huasna, Cuyama R.S. and Cuyaman rain-gauge stations.67
64 “Outline of the project at the Statistical Laboratory under the proposed contract with the State Department of Public Works, Division of Water Resources, Sacramento, California.” RAIN—Water Resources Corres. 1952-6/52. Jerzy Neyman Papers, BANC MSS 84/30 c, Carton 7, Part VIII—RAIN 1951-1957. The Bancroft Library, University of California, Berkeley (henceforth: Neyman Papers, Carton 7, Berkeley). 65 Letter from Jerzy Neyman to Mr. Charles G. Wolfe, Senior Hydraulic Engineer, October 27th, 1959. RAIN—NSF Project Corres. 7/1959-12/59. Jerzy Neyman Papers, BANC MSS 84/30 c, Carton 7, Part VIII—RAIN 1951-1957. The Bancroft Library, University of California, Berkeley (henceforth: Neyman Papers, Carton 7, Berkeley). 66 Letter from Jerzy Neyman to Chief, U.S. Weather Bureau, July 3, 1952. RAIN—Water Resources Corres. 1952-6/52. Neyman Papers, Carton 7, Berkeley. 67 RAIN—Water Resources Corres. 1952-6/52. Neyman Papers, Carton 7, Berkeley.

228
Federal oversight did not hold a monopoly on rain gauge stations. Private money and capital
were another major source of precipitation information. One such entity was the Standard Oil
Company of California, who was rumored to have kept a fairly complete weather record at their San
Francisco Bay refinery for the past 100 years. Permission to obtain the rain gauge records of
Standard Oil depended entirely on building personal relationships, as this was a private company. In
customary confidence-planning form, Neyman requested information from them that would address
as many dimensions of uncertainty as possible—time frames, location, the frequency of
measurement, and the availability of the information.
Ideally, the Berkeley Statistics Group desired to obtain as detailed information as possible.
Precipitation data was a frequentist statistical project that relied on the aggregation of many data
points. In some cases, they requested daily and even hour-by-hour rainfall information, hoping that
at some sites, human technicians had calibrated their rain gauges on an hourly basis. For the material
exchange, the group requested this information to be transcribed, “on manuscript forms, on
Figure 35: RAIN—Water Resources Corres. 1952-6/52. Neyman Papers, Carton 7, Berkeley.

229
microfilm, or on punchcards.”68 They wanted the data to move as quickly as possible from rain
gauge to computing machines. While a lot of their initial work was still conducted by hand
calculation, they anticipated the labor of calculation to grow. Over the next decade, their cloud-seed
probability tables would be aided by digital computing machines, such as the IBM 701.69 Through
the design of their analysis, they imagined a larger computing landscape, with a more dense and
wider distribution of rain-gauge technologies. The more rain-gauge data generated, the higher their
confidence levels in the information.
(Un)certainty work then began at the level of the rain gauge, as probability tables were
created to assess the confidence that individual rain gauges were accurately reporting rainfall
measures. “The nature and timing of physical measurements likely to improve the precision of the
experiment and, at the same time provide important information on the mechanism of rainfall
[…].”70 It then extended to the scale of the entire network of rain gauges, or hydroscapes, to assess
confidence levels about how well the geophysical placement of these rain gauges captured accurate
rainfall measures. They calculated precipitation data averages, in inches, at each rain gauge node, and
then calculated averages for areas of nodes in the region or “target areas.” They then compared
regressions of these target areas, before and after seeding, and against the controlled or “not seeded”
areas. A probability of significance was calculated for each target area and each silver-iodide
experiment. The probability of significance value represented whether or not the silver-iodide
experiments had an effect on the precipitation capacity of the clouds. Their regional analysis in
68 Letter from Jerzy Neyman to Chief, U.S. Weather Bureau, July 3, 1952. RAIN—Water Resources Corres. 1952-6/52. Neyman Papers, Carton 7, Berkeley. 69 Digital cloud seeding will be treated in the next chapter. 70 Draft, “Statistical Evaluation. Of the Santa Barbara Randomized Cloud Seeding Experiment. RAIN—NSF Project Corres. 7/1959-12/59. Neyman Papers, Carton 7, Berkeley.

230
California fed into a much larger computing program occurring throughout the southwestern region
and internationally.
Quantitative Skies
The California cloud-seed experiments were independently commission by regional entities such as
the California State Water Board and the University of California. Regional entities held an interest
in the outcomes of the experiments, as they would be liable for any health risks associated with the
experiments. Beyond the local farm union resources funneled into the experiments, they were also
being funded by state money allocated to water management and resource, as with the Arizona
administrators who were, already by 1950, channeling hundreds-of-thousands of dollars of public
money into artificial rain. The California analysis was also operating as part of a much larger
enterprise involving a growing network of artificial rain analysts, who exchanged data, methods, and
other information in order to assess the viability of cloud-seeding methods. Throughout the 1950s,
this cadre of computers was commissioned by national and regional entities to be “objective
observers” in the growing cloud-seed economy. They were likewise stationed at regional institutes
throughout the United States and beyond.
One such regionally-managed entity was the National Weather Improvement Association,
Inc. (NWIA), By the early 1950s, the NWIA positioned itself as a central oversight in weather
modification programs.71 NWIA was headquartered in Denver, Colorado. The institute was also a
meeting point in facilitating mathematical and computation cloud-seed analysis. In July of 1952, a
71 For a history of the NWIA, see: Kristine Harper, Lous W. Uccellini, Eugenia Kalnay, Kenneth Carey, and Lauren Morone, “50th Anniversary of Operation Numerical Weather Prediction, AMS Journals Online (2007), https://journals.ametsoc.org/doi/abs/10.1175/BAMS-88-5-639; Kristen Harper, Make it Rain: State Control of the Atmosphere in Twentieth-Century America, (Chicago: University of Chicago Press, 2017)

231
Denver meeting on the “Weather Modification Operations Analysis Project” brought together
representative interests from American Institute of Aerological Research, the Weather Bureau,
California Electric Power Company, university physicists, engineers, and climatologists, Denver
Water Board, Colorado State Weather Control Board, Water Resources Development Corporation,
and others. The representatives at this meeting show the patchwork of local and state interests
coming together on these programs, “… in the hope that a comprehensive manual of techniques
could be devised over a period of time, and that the Association might, as a neutral organization,
assist every evaluator in obtaining current, accurate information and data concerning the subject of
weather modification.”72 This was a search for a standard method of analysis for assessing the
effectiveness of cloud-seeding operations.
In the early 1950s, analysts commissioned by local and state bodies throughout the United
States, Canada, and the world, began to organize a larger uncertainty computing collective, towards
achieving quantitative command and control over the skies. This program involved people from
many different institutional bodies. “Universities and scientists cannot avoid being drawn into the
investigation of matters of high public interest. When the public wants answers, it will have them,
one way or another.”73 The Berkeley Statistics Group was commissioned in the early 1950s by the
California Water Board and UC Berkeley’s board of regents. Local and state bodies held legal and
monetary interest in the success of cloud-seeding and weather modification programs. Since many of
these local interests had reallocated designated water resources towards the experiments, they were
72 “Minutes of Weather Modification Operations Analysis Project of National Weather Improvement Association, Inc.,” July 12, 1952. RAIN—Water Resources Corres. 1952-6/52. Neyman Papers, Carton 7, Berkeley. 73 “Minutes of Weather Modification Operations Analysis Project of National Weather Improvement Association, Inc.,” July 12, 1952. RAIN—Water Resources Corres. 1952-6/52. Neyman Papers, Carton 7, Berkeley.

232
possibly liable for any detrimental or failed outcomes, and they desired a profitable outcome on their
investments.
The larger analysis project involved an international circulation of data, methods, and
analysis that would continue through the 1960s and 1970s. This included exchanging local analysis
of seasonal records and comparisons with analysis of individual storms and “the dissemination of
materials on current thinking,” such as the use of confidence intervals in assessment as opposed to
other methods of analysis. While the previously-described probability analysis, conducted at the scale
of the rain gauge and rain gauge maps, very much resembled the interwar uncertainty programs, the
larger movement for a quantified sky followed from trends in operations research and algorithmic
systems analysis currently being used to manage military resources in the context of the Cold War.
Cloud-seeding work was not distinct from the military context. The project sought a general
method of analysis over the many facets of the programs from data collection to the orchestration of
the physical experiments themselves. The culture of seeking out general and optimal solutions was
part of research into efficient logistics that had ballooned during WWII and that was currently in
operation. This was a search for optimal methods of calculation yielding yes/no outcomes. The
cloud-seeding analysis was geared to mimic such an effort by describing cloud-seed agents as
rational actors, for example: “The operator is concerned with finding the optimum number of
generators per unit of ground, in order to minimize his operating costs.”74 The larger analysis project
was driven by minimum-maximum profit logics that they deemed would trickle down to the farmers
themselves. The farmer then became an agent within the systems analysis, as captured in this
analyst’s description: “The farmer is concerned with the timing of the storms, and maximizing
precipitation from specific storms at specific times, may be best served by the same type of
74 Ibid.

233
analysis.”75 Here the local farmer was transfigured into an operations researcher and rainmaker, who
could maximize storm precipitation and increase the profit margins of their field.
Calculating “Neutrality”: Towards the Cloud Computing Method
Despite the grand design of a system of strategic operators, uncertainty saturated the entire
program from data management to analysis. In terms of uncertainty management, cloud-seeding
programs constituted a leaky system. When one part of the experiment was held still, and confidence
intervals were calculated, uncertainty would leak out of another side. This was a program of
(un)certainty work, and it was the job of the analysts to tame this relentlessly ephemeral subject. For
the analysts, the undergirding uncertainty problem was a general lack of knowledge of the processes
of precipitation, viewed as incomplete. “To fill [knowledge] gaps, it is necessary to use statistical
methods of analysis, by which estimates can be obtained of the likelihood that given phenomena
would have occurred naturally.”76 Probabilistic thinking reigned over the entire epistemological
project—it was believed that unknowability about natural processes of water and weather could only
be managed with statistical methods of calculation. So, both the problem and the guiding
assumption were that incomplete knowledge was inherently probabilistic.
(Un)certainty work breeds more (un)certainty work. Uncertainty tools became the object of
project analysis, an epistemic process embodied in confidence interval calculations. Confidence
intervals were used to quantify the levels of tractable uncertainty within a designed cloud-seeding
75 “Minutes of Weather Modification Operations Analysis Project of National Weather Improvement Association, Inc.,” July 12, 1952. RAIN—Water Resources Corres. 1952-6/52. Neyman Papers, Carton 7, Berkeley. 76 “Minutes of Weather Modification Operations Analysis Project of National Weather Improvement Association, Inc.,” July 12, 1952. RAIN—Water Resources Corres. 1952-6/52. Neyman Papers, Carton 7, Berkeley.

234
experiment, while bounding the intractable uncertainty. The general problem of a lack-of-knowledge
was thereby relegated to the, “limitations of statistical methods,” currently guiding experimental
analysis. 77 The statisticians expressed the resignation to these limitations: “At best statistical method
can only estimate the effect, and not the operation, of unknown factors.” “It is mechanical, and the
finest electronic computer faces the limitations of the material with which it is presented.”78 This
acknowledges the fact that the philosophical issues with the program could not be overcome with
more advanced technology; they had to be solved at the level of analytic architecture. The
assumption of incomplete knowledge was transfigured into a problem of experimental design, and
the design of the experiment and the methods used became the entire epistemological project.
This reinforces again Phaedra Daipha’s statement that, “No one can master deep
uncertainty—but they certainly are masters at mastering uncertainty.”79
Confidence intervals wrangled experimental uncertainty by quantifying its limits within an
imperfect dataset—a visual-mathematical compromise between objectivity and subjectivity. Even in
1967, fifteen years after the initial wave of silver-iodide experiments, Neyman wrote: “While
“objective” methods of weather forecasting are frequently mentioned in the literature, we became
convinced that forecasting is still an art and involves subjective elements.”80 Since Ronald Fisher’s
1935 treatise on the Design of Experiments, the mathematical-statistics movement—what I have
identified as a growing epistemological commitment to the probabilistic worldview and
corresponding regimes of calculation—put forth a synthetic interpretation of the world—a design—
to grasp after a failing European world order that had begun to fall apart in the aftermath of WWI.
77 Ibid. 78 Ibid. 79 Phaedra Daipha, Masters of Uncertainty: Weather Forecasts and the Quest for Ground Truth (Chicago: University of Chicago Press, 2015): 3. 80 Jerzy Neyman, “Experimentation with Weather Control,” Journal of the Royal Statistical Society. Series A (General), 130, no. 3 (1967): 298.

235
Consistent with this history, the Cold War cloud-seeding analysis project reaffirmed extant policies
of state water control in indigenous land. This was a design of certainty or ‘neutrality’ over the
unlivable conditions of the southwestern United States.
This was also a matter of grasping for control over the institutions, technologies, and
environments surrounding the experiments. Akin to the USDA. agriculturalists, cloud-seeding
analysts visualized a statistical control state over natural and experimental processes. As addressed in
Chapter 2, Control was a matter of defining areas of analysis and producing randomized experiments,
where each experiment could be tested against a randomized ‘control’ experiment. Control is a
process of experimentation that assumes a complete historical database and an idealized
orchestration of experiments, where each experiment is coupled with another randomized
experiment—the control experiment. The ideal experiment coupled precipitation measurements
from one ‘seeded’ cloud experiment wanted with precipitation measurements from one ‘non-seeded’
cloud experiment.
Cloud-seeding analysts described their work as decontaminating the “contamination of
control areas.”81 They described the challenge thus: “The principle difficulty is that in using historical
records as a control over a large area, all but one or two instances are quickly eliminated as not
significant, and the accumulation of [analogous] circumstances for investigation is a lengthy
process.”82 This subscription to control design and efforts towards “decontamination,” became
manifest on the ground.
A major source of uncertainty, as already addressed, was a lack of control over the
measurement technologies. Rain gauges were the central nodes of analysis and primary culprits of
81 “Minutes of Weather Modification Operations Analysis Project of National Weather Improvement Association, Inc.,” July 12, 1952. RAIN—Water Resources Corres. 1952-6/52. Neyman Papers, Carton 7, Berkeley. 82 Ibid.

236
uncertainty. As with the WWII destruction data campaigns, it was believed that the more data
generated, the clearer the limits of uncertainty, and that this would paper over uncertainties in
smaller sample groups, such as data collected from a single rain gauge. There were two dimensions
to expanding the experimental work to achieve a larger quantity of data. First, analysts asked for
more rain gauges to be installed, in order to generate more information. Second, analysts advocated
for randomized control experiments. For every cloud seeded by the silver-iodide method, they
wanted precipitation information from clouds that were not seeded, to serve as statistical control
and generate more viable data towards a better-defined uncertainty analysis. Analysts called for an
increase in the number of physical silver-iodide experiments conducted, and an increase in the
number of rain gauges installed, towards achieving an ideal randomized experiment.
Randomization was a core component of the analytic vision. In 1956, the Statistical
Laboratory organized a conference on cloud-seeding with attendees from the North American
Weather Consultations, Inc. and the Department of Water Resources. A major topic of the
conference was persuading the Board of Supervisors of Santa Barbara to finance the seeding
operations on a randomized basis. Testament to the general atmosphere on this topic, at a dinner
that followed the conference the guests enthusiastically drank a toast “to the Cloud Seeder who is
not afraid of Randomization!”83
The exchange of cloud-seed information and analysis reveals an anxious grasp for
experimental control (political and mathematical) on the international stage. These data streams
carve out a much larger landscape, pertaining to quantitative control of water. Quantitative analysis
reinforced the growing postwar hydraulic empire. Analysis was a big-data project—and the demand
83 Letter from Jerzy Neyman to Mr. Charles G. Wolfe, Senior Hydraulic Engineer, October 27th, 1959. RAIN—NSF Project Corres. 7/1959-12/59. Jerzy Neyman Papers, BANC MSS 84/30 c, Carton 7, Part VIII—RAIN 1951-1957. The Bancroft Library, University of California, Berkeley (henceforth: Neyman Papers, Carton 7, Berkeley).

237
for data drove the formation of new infrastructure that contributed to an expanding physical
computing landscape on the ground. The entire analysis project, although designed to be objective
and impartial, reinforced extant and newly forming infrastructures of water control on the ground.
Consistent across the geographical contexts covered in the analysis project, cloud-seeding
experiments were conducted over indigenous land, were funded with appropriated and reallocated
water resources, and directly informed local farm policy.
Southwestern weather modification and management institutions conducted extended
operations from Mexico to Canada. In 1953 and 1954, the Water Resource Development
Corporation (WRDC) of Denver, Colorado, through a Canadian affiliate, undertook cloud-seeding
operations in two Canadian regions, in an area in the extreme southwestern sector of Manitoba
(referred to as area MT-1) and in two adjacent areas in Saskatchewan (referred to as SK-1 and SK-2).
These operations occurred from May 1 to August 6, 1953, and from May 22 to August 11, 1954.84
As pictured in this [image] map, of “target” and “control” areas depicted by the analysts. The land
areas in this map belonged to First Nations and were largely being funded by regional farm
collectives, who had entered into contracts with the WRDC, as they had done in the southwestern
United States.
The Canadian experiments were a major focal point in the movement towards an optimal
analytic method. Statisticians John W. Tukey, H.C.S. Thom, and the Berkeley Statistics Group wrote
back and forth, as they tested different confidence interval methods with each experimental set of
data, to determine the preferred method of analysis. In the process, they abstracted the data from
the Arizona cloud-seeding programs, as southwestern experiments were central to their analysis.
84 Warren L. Godson, “Report on Evaluation of Cloud-Seeding Operations in Manitoba and Saskatchewan.” Folder 1. Advisory Committee on Weather Control, 1953-1955. John W. Tukey Papers. Ms. Coll. 117, Series Correspondences.

238
This included Irving Krick’s unpublished, “Report on meteorological aspects of artificial nucleation
in the Phoenix area” and “Evaluation of cloud seeding operations in the Phoenix area.” Other
reports included, “An analysis of the results of the 1951 cloud seeding operations in central
Arizona,” and “An evaluation of the results of cloud seeding in western New Mexico and
southeastern Arizona during July and August 1951.”85 Using this broader southwestern database
and through their new experiments, the analysts aimed to create a formal typology of cloud-seeding
computing methods and a standardized mode of analysis to oversee artificial rain programs around
the globe. The objectives of achieving a standard method were to, “ensure that human bias was
completely excluded and that the maximum possible amount of information was extracted from the
rainfall data.”86 This work was guided by the virtue and promise of neutrality.
The drive to design a controlled, randomized experiment and aggregate a substantial data
base depended on a long history of information gathering. (Un)certainty work accounts for ‘time’ in
discrete quantities. The longer the history of information, the more valuable it was. The ideal
experiment had a robust database over long periods of time, generated by randomized experiments.
In practice, these dimensions were compromised.
For example, the Berkeley Statistics Group’s Santa Barbara experiments focused on a short
time span of five years of what they deemed adequately randomized, cloud-seeding experiments and
information. The Canadian experiments, on the other hand did not have good, randomized silver-
iodide experiments, but did have an established historical precipitation database or “history period”
from 1923-1954. This history period was used to make sense of their experimental cloud-seeding
85 Found reports in bibliography of: H.C.S. Thom, “Statistical Methods in Evaluation Cloud Seeding Effects,” Advisory Committee on Weather Control, Washington 25 D.C., September 1955. Folder 1. Advisory Committee on Weather Control, 1953-1955. John W. Tukey Papers. Ms. Coll. 117, Series Correspondences. 86 Advisory Committee on Weather Control, Washington 25 D.C. “Notes on Program.” Folder 1. Advisory Committee on Weather Control, 1953-1955. John W. Tukey Papers. Ms. Coll. 117, Series Correspondences.

239
period. So, the hypothesis testing about cloud-seed experiments that occurred in the 1953-1954
period, accounted for data dating back to the 1920s. The mathematical analysis, therefore, assessed
recent experiments through regression analysis of a longer period of precipitation data, in order to
point toward a recommendation for the future. Uncertainty shaped the design of the physical and
mathematical experiments.
In both the Santa Barbara and Manitoba experiments, the mathematical evaluation resulted
in negative outcomes for the hypothesis that silver-iodide cloud-seeding increased rainfall.
The evaluation of the nine seeded months indicated that the most likely effect of the seeding was a decrease in rainfall of 14.1 percent. The odds were 19 to 1 that the effect of cloud-seeding lay between decreases of 0.2 and 24.6 percent. Moreover, the odds were 39 to 1 against the hypothesis that seeding increases rainfall. It was possible to demonstrate in a general way from the results that there had been no significant differences of seeding effect between different areas, months, or years. 87
The method of evaluation hinged on assessing the “confidence range” for the seeding effect, here it
is rather glibly stated that “the odds were 39 to 1 against the hypothesis that seeding increases
rainfall.” Since this was a controlled experiment, there were controlled, non-seeded clouds in the
analysis, and statistically, there was no appreciable difference between the seeded and non-seeded
clouds. The analysts were not finding evidence of a controlled increase in precipitation levels. Doubt
leaked from the mathematical interpretation back into the tractability of the physical experiments.
Analyst Warren L. Godson, wrote: “It is well known that silver iodide smoke has a profound
precipitation effect on a supercooled cloud, in the laboratory. Similar experiments in nature, have
almost invariably produced considerably less conclusive results.”88
87 Warren L. Godson, “Report on Evaluation of Cloud-Seeding Operations in Manitoba and Saskatchewan.” Folder 1. Advisory Committee on Weather Control, 1953-1955. John W. Tukey Papers. Ms. Coll. 117, Series Correspondences. 88 Ibid.

240
The lack of empirical-mathematical results indicating cloud-seeding success, and the flagging
confidence in the outcome of the experiments generally, did not dissuade from expansion of the
experiments. This failure was used as evidence for the further production of these programs, as
reflected in this quote:
These figures, although providing significant evidence, are not necessarily the final answer. An evaluation covering a longer period of operations might increase or decrease the value given for the most likely effect of cloud-seeding and would certainly increase the degree of confidence in the results.89
The mathematical experiments did not yield positive results, but still the data and analysis were
formulated. WWII analysis resurged in Cold War weather modification management, as a regime of
evaluative oversight over a growing aerial-agricultural initiative on the world stage. The analysts’
dream was to obtain more information, over larger areas of analysis, and longer periods of time, and
design an infrastructure for managing uncertainty in artificial weather control programs. The guiding
epistemological project was towards a big-data program, organized to design and implement an
optimal computing technique over water management.
Toward the end of the 1960s, these inconclusive mathematical results amplified the
disenchantment of an already dissenting public with the topic of artificial weather control. In
Canada, A 1957 newspaper article explicitly blamed the “gullible public” and “desperate people” for
wasting millions on cloud-seeding experiments that had so far not worked or had actually decreased
rainfall.90 A large-scale assessment occurred, the results of which were anticipated on the ground
level. By the end of the 1950s, many analysts working on cloud-seed assessments determined the
89 Ibid. 90 Leiterman, Doug, “Rainmaking Called Humbug: U.S. Physicist Asserts Gullible Public is Wasting Millions, Calgary Herald, September 5th, 1957.

241
programs unreliable, and this fueled the misgivings of a public already doubtful about weather
modification.
1960s Doubt Politics
By the end of the 1950s, significant uncertainty about the veracity of silver-iodide cloud-
seeding programs impacted the climate of public opinion about the capacity of artificial rain to solve
the economic drought crisis. The general public disapproval of weather modification in the 1960s,
has been well documented in the historiography in the context of growing environmentalist and
anti-state interventionist movements. Doubt about the promises of artificial weather control was
amplified by official reports on the mathematical results—the fact that analysts had achieved
consensus that there were no significant findings that cloud-seeding had increased precipitation.
Long before the mathematical results were publicized, Navajo and Hopi tribal members were
already unconvinced that the programs would work at all, and if they did work, it would only be for
Figure 36: Weather Control Newspaper Article, undated, Neyman Papers, Carton 7, Berkeley.

242
the benefit of white men. Just as the programs were taking off, in 1950, Navajo protested that, “Rain
fell only over white men.”91 Navajo Councilman Billy Becenti went on record then to say that even if
artificial rain was possible, it would only benefit white people. One unidentified [Navajo] council
member suggested that, since it was difficult to tell which rains are increased by cloud-seeding, the
rainmakers should drop receipts over the reservation from airplanes when they believe they have
produced results.
In 1959, Jerzy Neyman and Elizabeth Scott of the Berkeley Statistics Group withdrew their
contract with the Santa Barbara cloud-seeding analysis project. They wrote that while they “had
certain doubts from the start,” they genuinely enjoyed their time on the project.”92 Their primary
reason for leaving was that “the experiment needs a new design and a new study.”93 Despite leaving
the official capacity as cloud-seed oversight, their work would not be in vain as they would publish
their results, analysis, and the greater significance of the programs, over the next fifteen-years. In
1960, a reviewer on their draft of “Statistical Evaluation of the Santa Barbara Randomized Cloud
Seeding Experiment,” objected, “This paper is incomplete, inaccurate, contains deliberate
misstatements of fact and the manner of its presentation is unethical.”94 The defense to this reviewer
was that yes, “it is true that a number of details are omitted,” and “we limit ourselves to quoting a
few sample figures.” This, they reminded, was part of the standard method of analysis. They
concluded, “Without further indications as to the exact location of alleged “inaccuracies” and
“misstatements” and “unethical presentation” we are not in a position to comment.”
91 “Council Backs Rehabilitation,” Tucson Daily Citizen, July 12, 1950. 92 Letter from Jerzy Neyman to Earl G. Droessler, Program Director Atmospheric Sciences, October 22, 1959. RAIN—NSF Project Corres. 7/1959-12/59. Neyman Papers, Carton 7, Berkeley. 93 Ibid. 94 Letter from Jerzy Neyman to Dean Werner A. Baum, January 27, 1960. RAIN—NSF Project Corres. 7/1959-12/59. Neyman Papers, Carton 7, Berkeley.

243
By the early 1960s, under growing uncertainty, both the Kleberg County rainmakers and
their mathematicians were publicly ridiculed. The Berkley Statistics Group, highlighting Jerzy
Neyman, were identified in a Bay Area newspaper as “fraudsters.”95 In efforts to differentiate
himself from the rainmakers, in 1961, Neyman flew to Phoenix to give a talk at the University of
Arizona, to warn the public about the real rain-gauge fraudsters. The flowing day, the Kleberg
County newspaper reported: “Seed-For-Pay Boys Can’t Prove It.” The article reported on Neyman’s
University of Arizona speech from the night before casting him as a docile, “slight, mild-mannered”
professor, and sharply contrasting him with the aggressive rainmakers with for-profit motives.
Neyman warned of “persons with profit motives” who he said, “made one uneasy” as they
could tamper with experimental results in their promise of making rain. Specifically, he invoked
consideration of rain gauge vulnerability, measuring devices stationed “in unprotected places where
they could have been tampered with.” Rain gauges were the primary means by which rainfall was
measured and thus generated crucial data on the cloud seeding experiments. Tampering with rain
gauges would compromise the validity of experimental results. Thus, Neyman implied that the
general flagging confidence in weather modification programs was due to extra-experimental actors
willing to cheat the experiments rather than any inherent uncertainty in the experimental design
itself.
At the height of this public uncertainty and rage about weather control programs, in 1962,
Rachel Carson published her widely circulated book, Silent Spring. In it, she broke down the barriers
between “controlled” experiment and the larger environment, as well as the barriers between blood
and water. She argued that if you poison one, you poison the other. The concluding sentence of
Silent Spring, states:
95 Misc. RAIN—NSF Project Corres. 7/1959-12/59. Neyman Papers, Carton 7, Berkeley.
244
The “control of nature” is a phrase conceived in arrogance born of the [early] age of biology and philosophy, when it was supposed that nature exists for the convenience of man. […] It is our alarming misfortunate that so [unevolved] a science has armed itself with the most modern and terrible weapons, and in turning them against the [earth], it has also turned them against [us].96
Carson’s critique of the whole concept of the ‘control of nature’ takes on new meaning in the
context of the computational work. Throughout this chapter, I have shown how the computing
concept control— a designed, randomized mathematical experiment—was at work in the control of
nature.
Impetus to generate water scarcity data in the southwestern regions emerged out of colonial
expansion and the formation of a hydraulic empire. The identification and control of natural water
systems through maps, charts, and naming, and the formation of networks of damns, were designed
to consolidate settler power into systems of water management. Data streamed from nineteenth
century initiatives into the formation of data centers and experimental stations responsive to the
1920s and 1930s drought crises. Precipitation data emerged as a currency for resource control, a
means by which the land could be mapped, and fed into decision-making systems. Livestock
reduction hinged on calculations of Navajo and Hopi animals as water units. After WWII, ambitions
to control the skies transfigured this currency into an (un)certainty work, overlaying the southwest
with a map of rational allocation, creating a larger computing landscape predicated on seeing
probabilistically. This set precedent for the resources and conditions for digital decision-making
systems to take over water allocation in the southwest, as will be discussed in my final chapter.
Artificial rain is a central experiment in the evolution of artificial intelligence.
96 Rachel Carson, Silent Spring (Houghton Mifflin Company, 1962): 319.

245
Cloud-seeding offers a critically important site of intervention into larger conversations
about computing networks and decision-making systems used to track and make sense of weather
and climate events. In fact, even in cases where there was a tractable increase of precipitation in
seeded-clouds, the effects of this precipitation for the farming communities remained negligible,
especially when weighted against the deleterious impacts of the cloud-seeding programs for those
same communities. Study of cloud-seeding initiatives makes clear that these programs, as promises
of development from 10,000 feet above ground, are still rooted in the soil. Agricultural remains
highly vulnerable to climate change and erratic weather and cloud-seeding continues to function as
an aerial-agricultural initiative, where those in control of aerial technological systems aim to control
resources on the ground.
I argue more broadly that water is the most valuable source of information in the long
twentieth-century history of computing. Water scarcity and uncontrollability is also a primary source
of modern anxiety. While this dissertation culminates in an explicit study of water data, it has been
present throughout. The data societies I have traced throughout this dissertation, beginning with
interwar agriculture, were primarily concerned with calculating water scarcity. Harvesting and farm
information exists on a spectrum between water scarcity and flooding over. The agricultural stations
addressed in this dissertation were also centers for the collection of precipitation data. In efforts to
rationalize agricultural practices and production, they documented rainfalls, soil precipitation, and
weather and climatic events—generating libraries of information. This water information was used
to demarcate harvest seasons, and even calculate the sweetness of a sugar beet. Anxieties pertaining
to the unruly and unpredictable nature of water, seen primarily as a hindrance in the formation of
western capitalist societies, inspired new methods of calculation and control.97 Mathematical
97 Water calculation emerged from efforts to control the U.S. slave economy in crop calculations and the Atlantic slave trade. See: Caitlin Rosenthal, Accounting for Slavery: Masters and Management (Cambridge: Harvard

246
statistics was a regime of calculation that created databases and designed new methods of regression-
analysis, to control water for capital production in agriculture.
The southwestern United States is a critically important geographical area in the history of
control and (un)certainty work. It was and is the epicenter in the history of artificial weather control
and critically important to broader histories of climate science and the history of computing. Water
scarcity in the region has shaped its brutal human history and informed its regimes of calculation.
Water data has been sourced as a highly valuable indicator of the possibility of resources in the
region. It is the central currency of southwestern decision-making systems. Water is data.
Precipitation data, like water itself, has a history and a future—it streams from its origin source as it
is being directed somewhere else, and it impacts the landscape along the way. Water is data, just as it
is a primary source of life and food. Water is life.98
University Press, 2018); Johnathan Levy, Freaks of Fortune: The Emerging World of Capitalism and Risk in America (Cambridge: Harvard University Press, 2012). 98 Water is Life is an ongoing indigenous resistance movement for land and water sovereignty. See, for example: Mary Annette, Pember, “Inside the Long, Hard Fight to Stop the Bayou Bridge Oil Pipline, Colorlines, https://www.colorlines.com/articles/inside-long-hard-fight-stop-bayou-bridge-oil-pipeline; Frank Bures, “Winona LaDuke’s Las Battle,” Belt Magazine, https://beltmag.com/winona-laduke-line-3-pipeline-future/. For histories of the water is life movement, see: Dina Gilio-Whitaker, As Long as Grass Grows: The Indigenous Fight for Environmental Justice from Colonization to Standing Rock (Boston: Beacon Press, 2019); Nick Estes, Our History is the Future: Standing Rock versus the Dakota Access Pipeline, and the Long Tradition of Indigenous Resistance (Verso Books, 2019); Leanne Betasamosake Simpson, As We Have Always Done: Indigenous Freedom through Radical Resistance (Minnesota University Press, 2017). Thank you to Juliet Larkin-Gilmore for her scholarship and engagements on these topics.

247
Chapter 6: Conclusion
Automating Uncertainty Digital Cloud Seeds and Confidence Algorithms
Digital Cloud Seeds: From Doubt Crisis to New Method
In the first two decades of the Cold War, cloud-seeding programs reconfigured the vast and
heterogenous southwestern landscape across Arizona, California, Navajo and Hopi Nations, and
spanning into Northern Mexico and Southern Canada. In this time period, over 10% of the U.S.
landscape became a target area for weather modification experiments. Artificial rain was sought after
globally, too, as the weather control enterprise that began in central Europe expanded over apartheid
South Africa, Australia, and South East Asia. The southwestern computing landscape was a layered
reordering of the geophysical world through installations of rain gauges, excavations of the earth to
Figure 37: Eduardo Paolozzi, “Conditional Probability Machine,” 1970. Secrets of Life—The Human machine and How it Works: Perception through Impression.

248
create experimental watersheds, and conducting ground generator and aerial explosions of chemical
smoke. The southwestern skies became experimental corporate and military proving grounds as
water as agricultural became managed from above. This geophysical remapping blurred with
mathematical descriptions of the area map, as hydroscapes were veiled over coordinate rain gauge
systems and clouds were transfigured into probability assessments. Uncertainty logics permeated the
mathematical and geophysical landscape, enabled by the control thinking dictating the experimental
design (seeded and not-seeded experiments), and the confidence logics driving the precipitation data
economy.
The early 1960s climate of public doubt and uncertainty about weather modification
impacted aerial-agricultural development more broadly. Public awareness of the physical and
mathematical failure of the programs, as well as the deleterious impacts on the environment,
blossomed from a larger context of conservationism and environmental activism of the early 1960s.
The Navajo Nation fought during this time to obtain sovereignty over the major bodies of water,
the Salt River, San Juan River and Colorado River Basin. The early 1960s Salt River Project, a
legislation designed to commandeer the damn water for a new coal mine, became a central site of
contest. Construction for Navajo Lake and Navajo Dam were completed in 1962. And in 1963, the
Navajo Transitional Energy Company (NTEC) was founded in the midst of the 1960s coal boom.
Silent Spring circulated in the context of increased public awareness of carcinogens, chemical waste,
and scientific misinformation. Drought continued to define the U.S. landscape; California recorded
its worst year in 1961. Finally, the U.S. farm economy was going through radical transformation:
between 1950 and 1970, the number of farms was cut in half, due to the rise of corporate agriculture
and, for many farmers, of bad weather. The public backlash against weather modification programs
was a multiplex of dissent.

249
While public uncertainty reined-in technocratic enthusiasm about the cloud-seeding
programs, the projects nonetheless persisted. The programs had already created information
systems and mathematical oversight on questions of resource allocation and weather and climate
prognostication. For analysts, the public doubt did not correspond wholly to a political or ecological
crisis, but a technological crisis, denoting a failure to harness certainty in their experimental designs.
Echoing the confidence crisis of the early twentieth century, analysts asserted a crisis of technique
and method over the uncertainties of weather data. This 1960s moment of public doubt was thereby
followed by an impulse to improve artificial weather control through computational analysis, rather
than abandon the artificial weather control programs in total. This 1957 NSF quote on Cold War
weather modification captures this dialectic between crisis and technological redesign at work:
UNCERTAINTY characterizes most thinking about the changes in natural systems that are subject to modification. […] The principal lesson to be drawn from this experience is that where uncertainty is large, as it continues to be with weather and climate modification, the basic social implications will tend to remain unexplored unless explicit and sustained effort is made to stir up and support the essential research. Otherwise, the human problems are ignored until they burst into prominence on the heels of an improvement in technique.
Throughout the late 1960s and 1970s, artificial rain persisted as a promise and solution for
flagging agriculture and ever-scarcer water resources and became a major site for the development
of new mathematical methods and digital computing techniques. The 1950s programs had generated
a substantial area of inquiry at the nexus of weather and climate science and probabilistic
architectures, and this was carried forward by the momentum already generated by the frameworks
and infrastructures designed to quantify the skies in the cloud-seed analysis project. New models
designed to visually display probabilities and confidence logics became a conduit for translating
these methods into digital code. The dissent against automation seen in the conservationist
movements was met with a growing captivation with automated systems by others. In 1960, Paul
Kircher’s popular book The Crisis We Face: Automation and the Cold War, argued that the crisis of

250
automation was a crisis of insufficient automation, which he melded into the contemporaneous
crises of military power and conditions of the Cold War. He wrote, “Our only hope is to multiply
the output of the man by giving him automatic weapons and machines—and to achieve this
multiplication so greatly, so rapidly, and efficiently as to hopelessly outdistance the enormous
populations now organizing against us.”1
By the early 1970s, decision-trees were conceptualized and used to map uncertainty in
weather and hurricane prediction and farm planning.2 These were diagrams, drawn as simple tree-
like figures- that broke decisions into consecutive steps of probabilistic outcomes. Other geometric
frameworks, such as Thiessen polygons, were used to represent hydroscapes as mathematical planes
and regions, further abstracting the data from its earthy origins and staging it for algorithmic
analysis. Studies on automation and weather control ballooned in the 1970s, and even more so in the
1980s. Resource management and data collection on the ground had been translated into an
uncertainty program drawn from the aerial vantage, and this set the stage for indigenous and local
farm water management to be relegated to digital systems of decision-making.
The analog dimensions of the computing landscape, rain gauge analysis and ground
generator maintenance, were fed into digital production. Already in the 1950s, the Berkeley Statistics
Group outsourced precipitation data to the IBM 701. While in development, this machine was
known as “the defense calculator,” but after its launch in 1953 it assumed the title of “IBM 701
Electronic Data Processing Machine.”3 At this time, IBM computers were stationed at university
1 Paul Kircher, The Crisis We Face: Automation and the Cold War (New York: McGraw-Hill, 1960). 2 For examples of technical literature at the nexus of probabilistic decision-science and weather analysis in this period, see: D. Yaron and U. Horowitz, “Short and Long-Run Farm Planning Under Uncertainty; Integration of Linear Programming and Decision Tree Analysis,” Agricultural Economics 20, no. 2 (1972): 17-30; Albert H. Brown, “Automation of Visual Weather Observations,” Report of the Air Force Geophysics Laboratory, April 1, 1980. 3 For technical primary sources on the machine design, see: Werner Buchholz, “The System Design of the IBM Type 701 Computer,” Proceedings of the I.R.E. 41, no. 10 (1953): 1262-1275; Clarence Frizzell,

251
computing centers that were being established around the United States, and operational programs
were launched through “customers” who commissioned computational work for various projects.
Significantly, the earliest customers of the IBM family were the U.S. Weather Bureau, for the
purpose of the mid-1950s Joint Numerical Weather prediction project. The first 36-hour forecast
was conducted in April of 1955, using the IBM 701.4 Cloud-seeding data was processed as part of a
larger convergence between climate mapping and the development of digital technology. These
programs hinged on a gradual development of uncertainty logics into code, programming languages,
and certified algorithms. Mirroring the evolution of mathematical statistics, digital computing
programs were first designed for basic statistical routines before methods such as confidence
intervals were programmed. Early projects began with translating basic statistical techniques, such as
the analysis of variance, covariance, and linear regressions, into code.5
The international cloud-seeding analysis that was conducted in the 1950s and 1960s went
through a second stage of analysis as part of a larger turn towards digital computing and the
application of new methods of analysis. The same data that was used in the first round of
mathematical experiments was reused in the second wave of experiments, but in the second wave of
mathematical experiments, new methods of analysis were employed and new computing
technologies, especially punch card programming, were used to expand computational oversight.
The use of digital computers involved another layer of work for the mathematicians and personnel
“Engineering Description of the IBM Type 701 Computer,” Proceedings of the I.R.E. 41, no. 10 (1953): 1275-1287; Louis D. Stevens, “Engineering Organization of Input and Output for the IBM 701 Electronic Data-Processing Machine,” Review of Input and Output Equipment Systems, Joint AIEE-IRE-ACM Computer Conference, American Institute of Electrical Engineers, New York (1953): 81-85; Charles L. Baker, “The PACT I Coding System for the IBM Type 701,” Journal of the ACM 3, no. 4 (1956): 272-278. For cultural and political histories of IBM, see: The IBM Century: Creating the IT Revolution, ed. Jeffrey Yost (New Jersey: IEEE, 2011). 4 See: Joseph Smagorjnsky, “The Beginnings of Numerical Weather Prediction and General Circulation Modeling: Early Recollections,” Advances in Geophysics 25 (1983): 3-37. 5 See, for example, John W. Hamblen, “Statistical programs for the IBM 650—Part 1,” Communications of the ACM 2, no. 8 (1959); 13-18.

252
who transcribed the data onto punch cards and utilized programming languages for translating
techniques into computer instructions.6 The physical Arizona experiments that began during the
U.S. war in Korea created an atmospheric-terrestrial testing ground over a semi-arid southwestern
landscape that had already been sustaining precipitation data collection and computational work for
decades. While the conditions of data production, and the bodies of data remained the same, new
modes of analysis were designed with these resources.
A computer-generated schematic map of Arizona, pictured below, depicts the nodes of rain
gauges that continued to be used in the second-wave analysis. The topography of the geological
surface, the political landscape and boundaries between Navajo and Hopi land, the waterways, and
distinction between farm land and metropolitan areas all vanished into a white backdrop, dotted
with uniform points representing rain gauge coordinates and distances. In this particular experiment,
a new “moving grid” technique is used, with the aid of a digital computer, to assess the gauges as
groups and networks of gauges, further abstracting the analog technologies from the uncertainties of
their ground placement.
6 There is a substantial body of primary and secondary scholarship on punch cards and programming, see: Wallace J. Eckert, Punched Card Methods in Scientific Computation (Lancaster, PA: Lancaster Press, Inc., 1940); Wallace J. Eckert, “Mathematical Tables on Punched Cards,” Mathematical Tables and Other Aids to Computation 1, no. 12 (1945): 433-436; Steven E. Jones, Robert Busa, S.J. and the Emergence of Humanities Computing: The Priest and the Punched Card (Routledge, 2016); George A. Fierheller, Do Not Fold, Spindle or Mutilate: The ‘Hole’ Story of Punched Cards (Ontario: Stewart Publishing & Printing, 2014); Steven Lubar, “Do Not Fold, Spindle or Mutilate”: A Cultural History of the Punch Card, Journal of American Culture 15, 4 (1992): 42-55; I ascribe to Lubar’s history of the punch card’s cultural colloquialisms, as it resonates with my own three computing concepts, he starts this article: “One hundred years have passed since Herman Hollerith invented the punch card to tabulate the 1890 census […] But one aspect of the ear of the punch card invaded the national subconscious to leave an ironic cultural legacy. The punch card era survives in the phrase “do not fold, spindle, or mutilate.” The phrase and the feelings it represents have outlasted the technology, not to mention the billions of cards on which it was printed. Culture changes more slowly than technology. Symbols outlast machines. The signified slides under its signifier.”
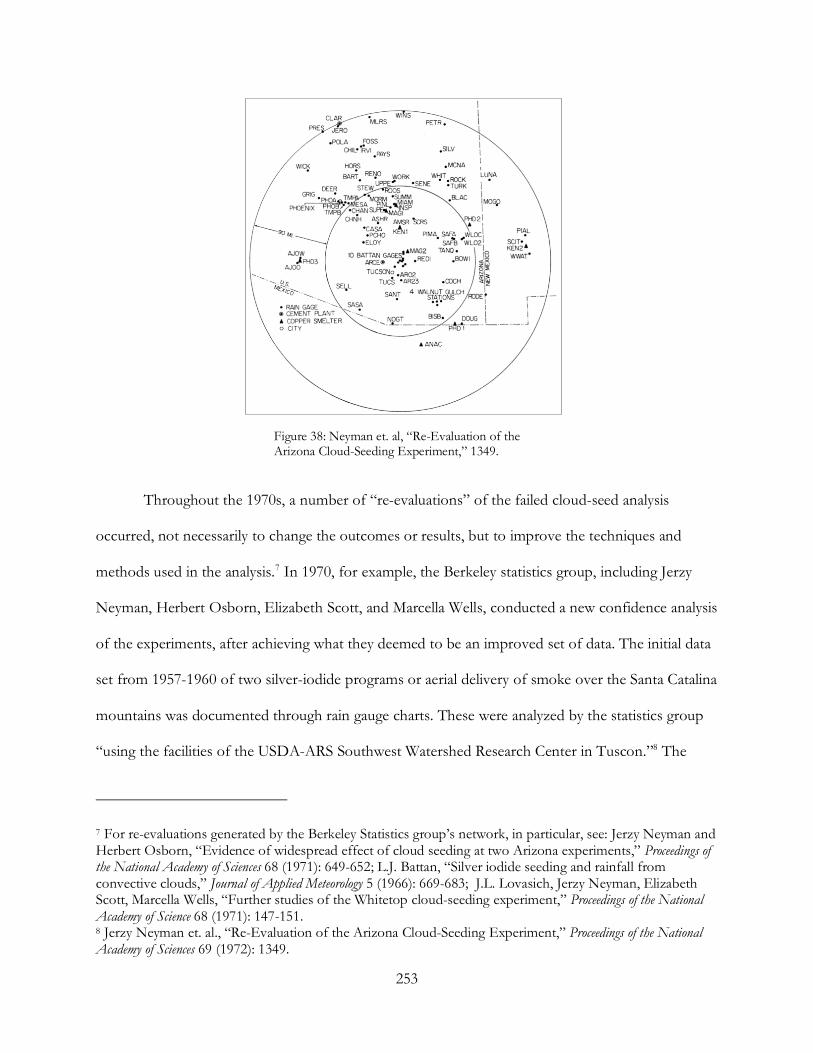
253
Throughout the 1970s, a number of “re-evaluations” of the failed cloud-seed analysis
occurred, not necessarily to change the outcomes or results, but to improve the techniques and
methods used in the analysis.7 In 1970, for example, the Berkeley statistics group, including Jerzy
Neyman, Herbert Osborn, Elizabeth Scott, and Marcella Wells, conducted a new confidence analysis
of the experiments, after achieving what they deemed to be an improved set of data. The initial data
set from 1957-1960 of two silver-iodide programs or aerial delivery of smoke over the Santa Catalina
mountains was documented through rain gauge charts. These were analyzed by the statistics group
“using the facilities of the USDA-ARS Southwest Watershed Research Center in Tuscon.”8 The
7 For re-evaluations generated by the Berkeley Statistics group’s network, in particular, see: Jerzy Neyman and Herbert Osborn, “Evidence of widespread effect of cloud seeding at two Arizona experiments,” Proceedings of the National Academy of Sciences 68 (1971): 649-652; L.J. Battan, “Silver iodide seeding and rainfall from convective clouds,” Journal of Applied Meteorology 5 (1966): 669-683; J.L. Lovasich, Jerzy Neyman, Elizabeth Scott, Marcella Wells, “Further studies of the Whitetop cloud-seeding experiment,” Proceedings of the National Academy of Science 68 (1971): 147-151. 8 Jerzy Neyman et. al., “Re-Evaluation of the Arizona Cloud-Seeding Experiment,” Proceedings of the National Academy of Sciences 69 (1972): 1349.
Figure 38: Neyman et. al, “Re-Evaluation of the Arizona Cloud-Seeding Experiment,” 1349.

254
combined “deck of IBM cards, baring hourly precipitation amounts for all the available gauges for
all of the 212 experimental days,” was delivered to meteorologist L.J. Battan.9 This data was
combined with new observations from Battan, who integrated radar data and photographs of clouds
taken over the mountain range, as new points of visual-mathematical analysis. The results of this
analysis concluded the apparent effect of seeding was a 73% loss of rain, but the analysis was not
toward proving the efficacy of the experiments, but the efficacy of the statistical analysis—this was
still a question of whether the results were randomized. Neyman noted, for example, that the
experiments were not randomized and therefore not in a state of control.
Even though, since the late 1950s, there has been consistent consensus that cloud-seeding
did not predictably generate precipitation in target clouds, these programs have continued to be a
central site for advancing automating decision-science and digital computing programs. These
mathematical re-evaluations of the early cold war experiments were not just a matter of reassessing
whether or not the programs worked but were projects of creating further experiments with the
data. These included studies of “aerial spread,’ “after-affects,” and so forth. Artificial rain-making
campaigns contained an ocean of uncertainty, which had generated substantial mathematical,
technological, and economic infrastructures to compute it, and therefore studies of its technologies,
methods, and models were of use and interest to ongoing (un)certainty work into the domains of
digital computing.
By the late 1970s, precipitation models indicating the effects of cloud-seeding were
programmed for digital computing. Neyman noted the transformation, “the widely accessible digital
computers make it relatively easy to use the Monte Carlo simulation techniques to study the
9 Neyman et. al, “Re-Evaluation of the Arizona Cloud-Seeding Experiment,” 1349.

255
statistical tests.”10 He went on to describe the use of confidence logics to assess the Monte Carol
method itself:
In addition to satisfying the maintenance of the chosen level of significance—𝛼 = 0.10 or 0.05 or 0.01, etc.—it is important to investigate the so-called “power” of the test. This would answer questions of the following kind: With the given level of significance 𝛼 and the given number of experimental units, say 𝑛 = 100 or 𝑛 = 200, what is the chance, 𝛽, of detecting a real seeded-not-seeded difference in precipitation if it represents a 20% (or some such) decrease (or increase) in the rain due to seeding? If the calculated 𝛽 = 0.1 or 0.2 and the 20% effect is all that is anticipated […] then the contemplated experiment can hardly be considered promising and changes in its design would be in order. 11
In the 1960s through 1970s period, the more visible human computing work in the Cold
War artificial rain analysis project was incrementally relegated to computerized management systems.
Thiessen geometric mapping diagrams, and decision-trees became some of the analytic mediums
through which confidence logics were translated into digital programming languages and relegated to
algorithmic oversight. This was part of a larger reconfiguration of uncertainty, and confidence
intervals, under automation, within the growing machine philosophy of “logics of automata” and the
professional design and certification of algorithms. It is important to map out iterations of
confidence intervals through these two computing movements—algorithms and automata—as they
contributed to the integration of CI logics into machine consciousness and algorithmic oversight.
“The Logics of Automata”: Conditional Probability Machines
After 1950, new designs for computational processing in digital computing impacted the
epistemic form and material production of (un)certainty work. As seen in the last section, while
10 Jerzy Neyman, “A Statistician’s View of Weather Modification Technology,” Proceedings of the National Academy of Sciences 74, no. 11 (1977): 4719. 11 Neyman, “A Statisticians View, 4718.

256
computing landscapes used to support these systems did not disappear, confidence logics were also
reconfigured as a new mode of reasoning, pertaining to digital philosophies and coding practices.
The theory of automata that popularized in the early 1950s, and designs of certified confidence
algorithms, which were circulating the 1960s, contributed to the new wave of (un)certainty work. This
is exhibited in the re-evaluation of cloud-seeding, which incorporated digital machinery and centered
algorithms in the assessments. Significantly, confidence logics were not replaced by the new modes of computing
and machine development, but rather, they were built into the material and logical designs of digital models, machines,
and methods. Confidence intervals are built into the material fabric of artificial intelligence, they are a
tuning apparatus in assessing the power and validity of other optimal algorithms such as linear
programming (the simplex algorithm) and Monte Carlo methods, and they are algorithmic in their
own right as they were reprogrammed and circulated as certified algorithms. Digital computing
brings new iterations of (un)certainty work that have black-boxed the philosophies of logic at work
under its protocols, procedures, and programs.
In 1954, Arthur Burks and Hao Wang of the University of Michigan, put forth a typology of
the logical systems and techniques used in the structure and behavior of “automata.”12 Burks had
12 For histories of “automata,” see: Robert Kline, “Cybernetics, Automata Studies, and the Darmouth Conference on Artificial Intelligence,” IEEE Annals of the History of Computing 33, no. 4 (2011): 5-16. “Automation” has been a central problematic and logical enigma in digital computing. For histories of automation in computing generally, see: Thomas Haigh, “Remembering the Office of the Future: The Origins of Word Processing and Office Automation,” IEEE Annals of the History of Computing 28, no. 4 (2006): 6-31. For histories of automation at the nexus of mathematical logic and machine intelligence, see: Donald Mackenzie, “Automation of proof: a historical and sociological exploration,” IEEE Annals of the History of Computing 17, no. 3 (1995): 7 -29; Stephanie Aleen Dick, “After Math: (Re)configuring Minds, Proof, and Computing in the Postwar United States. (Ph.D. Diss., Harvard University, 2015): Dick writes, 94: “The prospect of automation generated disagreement about the character of human mathematical faculties like intuition, reasoning, and understanding whether computers could be made to possess or participate in them.” Her conclusion is that “processes of automation seldom, if ever replace human thought. Instead automation attempts rather displace and transform human thinking at the same time as they enable the construction of new objects of thought—these develop always in tandem.”
For automation and risk, see: Rebecca Slayton, “Measuring Risk: Computer Security Metrics, Automation, and Learning,” IEEE Annals of the History of Computing 37, no. 2 (2015): 32-45. Automation is fundamentally a political process, for a recent study see: Virginia Eubanks, Automating Inequality: How High-Tech

257
long been interested in the design of logics within electronic computing machines, as he worked
with Hermann Goldstine and John von Neumann on the ENIAC machine at the Moore School—
the center of calculation for ballistics analysis during WWII.13 Chinese philosopher, logician, and
mathematician Hao Wang, from a less empirical vantage, was interested in automata as a study of
logic and philosophy. Burks and Wang give a general definition of automata in their following
description:
To begin with we will consider any object or system (e.g. a physical body, a machine, an animal, or a solar system) that changes its state in time; it may or may not change its size it time, and it may or may not interact with its environment. When we describe the state of the object at any arbitrary time, we have in general to take account of: the time under consideration, the past history of the object, the laws governing the inner action of the object or system, the state of the environment (which itself is a system of objects), and the laws governing the interaction of the objects and its environment. If we choose to, we may refer to all such objects and systems as automata. Automata studies became a way of explaining machines, mathematics, and machine
processes, which privileged the machine in explaining systems and networks. The machine was
intelligent, and processes were likened to the human nervous system, brain stimulation, and animal
qualities. Logic was a physical system that constituted the machine: “Logical propositions can be
represented as electrical networks or (idealized nervous systems) [and] networks are formed by
connecting basic components.”14 Despite the analogy with animal instincts throughout the
movement, the computing concepts of optimality and efficiency reigned supreme, as these processes
were organized in terms of input-output logics. Furthermore, as Von Neumann described,
tools Profile, Police, and Punish the Poor (New York: St. Martin’s Press, 2018). For a primary source on automation and formal methods: Automation of Reasoning 1: Classical Papers on Computational Logics 1957-1966, J. Siekmann, G. Wrightson, eds. (Berlin: Springer Verlag, 1983). 13 See: Arthur W. Burks, Herman Goldstine, and John von Neumann, Preliminary discussion of the logical design of an electronic computing instrument (Princeton: Institute for Advanced Study 14 John von Neumann, Lectures on “Probabilistic Logics and the Synthesis of Reliable Organisms from Unreliable Components,” delivered at the California Institute of Technology, January 4-15, 1952. http://www.dna.caltech.edu/courses/cs191/paperscs191/VonNeumann56.pdf.

258
“externally an automaton is a “black box” with a finite number of inputs and a finite number of
outputs.”15 In this conception, the input and output processes, relied on determining which inputs,
when stimulated, caused responses in the outputs— “responses” as in terms of animal behavior.
This larger epistemological framing of machines as living bodies, brains, and neural networks was
common to a family of machine intelligence work at this time including Turing machines, control
systems, cybernetics, general systems theory, and servo-systems.
Automata studies therefore did not view machines as tools or calculators, but as “thinking”
entities. Therefore, machines did not simply compute probabilities, but they could be probabilistic in
nature. In fact, Burke divided automata into two camps: deterministic and probabilistic. As described,
automata have a fixed number of elements and states in their system, and probabilistic automata,
have “an always changing, but finite, number of states.”16 Von Neumann in particular advanced the
notion that the problem with probabilistic automata was that their constituent parts were unreliable,
as it hadn’t yet been proved, “that these systems [would] do what is claimed for them—namely
15 See: John von Neumann, “Probabilistic Logics and the Synthesis of Reliable Organism from Unreliable Components,” in C.E. Shannon, Automata Studies (Princeton: Princeton University Press: 1956): 43. 16 John von Neumann, Lectures on “Probabilistic Logics and the Synthesis of Reliable Organisms from Unreliable Components,” delivered at the California Institute of Technology, January 4-15, 1952.
Figure 39: John von Neumann, “Probabilistic Logics and the Synthesis of Reliable Organism from Unreliable Components,” in C.E. Shannon, Automata Studies (Princeton: Princeton University Press: 1956): 43.

259
control error.”17 Error in automata was theorized to occur from mistakes by the central “organs” of
the machine and also, error would arise when operating bundles (lines going in and out of the
organs) that were not in the same state of stimulation. This was a matter of anticipating levels of
error in the network responses by asserting a value for error—or the probability of malfunction.
Error theory in probabilistic automata was a matter of assessing the stability or the reliability
of a network, in terms of input and output of bundles, into and out of the main organs. Since the
main organs were “black boxes” the error had to be assessed in terms of the bundles and, common
to confidence logics, estimated and established ahead of time. For example, Von Neumann wrote:
Having established this fiduciary level [∆= .07], there exists also an upper bound for the allowable values of ∈ [error]. This is ∈= .0107. In other words, if ∈≥ .0107, the risk of effective malfunction of the network will be above a fixed, positive lower bound, no matter how large a bundle size 𝒩 is used. I.e. stimulation of at least 93% of the lines of a bundle represents a positive message; stimulation of at most 7% of the lines of a bundle represents a negative message; the interval between 7% and 93% is a zone of uncertainty, indicating an effective malfunction of the network. 18
For von Neumann, uncertainty was a precondition of the machine that, as an intelligent entity, did
not reveal its thinking processes, akin to the vast unknowabilities of the human brain. The early
1950s conceptions of automata as neurological machine, that informed the major fields of systems
of analysis, cybernetics, and so forth situated uncertainty not as a production of the machine, but as
the machine itself. Conditional probability machines were probabilistic entities. Confidence intervals,
fiduciary limits, and related data architectures were employed to describe error in the animal-like
machine impulses and responses of the network. Network malfunction was bounded by the zone of
uncertainty, as defined by the intervals.
17 Ibid, 37. 18 Ibid, 44.

260
Confidence Logics as Algorithm
As CI logics were defined as part of the living system of animal-machines, they were also
being programmed into new machine languages, stripping them of their philosophical intricacies.
After 1954 the electronic computing language FORTRAN (FORmula TRANslation), was designed
to handle numerical computation. FORTRAN spawned a number of related programming languages
such as FORMAC (FORmula MAniupulation Compiler) and the ALGOL programming language
that was specifically designed to aid the translation of mathematical techniques into algorithmic
procedures. These programming languages were used in experimenting with mathematics and
machine processing. The American Computing Machinery (ACM) became the central oversight on
research and development pertaining to certifying algorithms. The development of algorithms by
designers at computing disparate departments, was funded for a variety of interests and purposes
under the auspices of entities like the US Atomic Energy Commission, the Bureau of Census &
Statistics, Oak Ridge National Laboratory, Boeing Scientific Research Laboratories, and so on.
Throughout the late 1960s and 1970s, programmers, computer scientists, and others who
worked on developing algorithms would find legitimacy for their designs through the ACM. The
ACM created a platform, “the Algorithms Department,” and established protocol for the format and
circulation of algorithmic designs. The standard code of conduct advanced by the Algorithms
Department, was outlined as a step of procedures: “A contribution to the Algorithms Department
should be in the form of an algorithm, a certification, or a remark [and] carefully follow the style of
this department.” The form of an algorithm was that it must written in the ALGOL 60
programming language or in ASA Standard FORTRAN or Basic FORTRAN. It should be
presented as a commented procedure, accompanied by a complete driver program in its language

261
that will not be published. For ALGOL 60 language in particular, the policy stated that “input and
output should be achieved by procedure statements,” out of eleven procedure statements, which
asserted a language and logic of efficiency over the mathematical processes:
insymbol inreal outarray ininterger
outsymbol outreal outboolean outinteger
length inarray outstring
Certified algorithms were a digital mathematical procedure that reconfigured logical interpretation
and mathematical methods into input-output statements, or the technical computing concept of
efficiency and optimality.
Reflective of a computing culture that upheld simplicity and procedure over complexity, much
of the computational process involved in reconfiguring mathematical processes—such as confidence
interval calculations—into code was not widely circulated. The math and machine interaction were
therefore not the central inquiry in circulation. For example, it was not communicated how exactly
the punch cards were used in computing the algorithmic tests. Another missing element was the
significance of data, where it came from, how it was sorted and organized, and how it was valued.
All data was communicated as an epistemologically flat, algorithmic processing data. Explanations of
engineering and hardware machine processes, that constitute the physical electronic computers, were
also not circulated. The computational labor in data collection, machine engineering, and
computational work was therefore missing from discussions about algorithmic language and
certification. (Un)certainty work was flatted in the formal presentation of algorithmic procedure.

262
While the ACM worked to standardize algorithmic procedure and communications, the
wider public speculated about the morality of algorithmic versus human decision-making. Popular
understanding of algorithms mirrored the captivation with elegance and simplicity reaffirmed by
protocol, but also reflected doubt about their crude, rote, and bureaucratic nature. There was both a
crisis and awe surrounding the new authority over human mind. In one report: “Soon, with total
mindlessness, [the civil service], may be working by the algorithm—a choice specimen […]
instructing hapless bureaucrats on the decisions they have to make […] like some science fiction
monster, the algorithms are coming, burying desks in decision-making trees.”19 A woman’s magazine
in support of offloading decision-making responsibility to algorithms explained, “One of the
problems of being human rather than a computer when faced with a decision is that emotion almost
invariably enters into the picture.”20 Many people were interested in the simplicity and the reduction
of human labor associated with algorithmic thought, stating things like, “Algorithms replace wordy
definitions in new methods,” and “algorithms make complicated decisions simple.”21
19 “The Treasury gets algorithm and initiative gets the bird,” The Guardian, Saturday, July 01, 1967. 20 “Decisions…decisions…decisions…,” The Woman’s Guardian, Monday, May 25th, 1970. 21 “Algorithms Replace Wordy Definitions in New Methods,” The Waco News-Tribune, Wednesday, February 9th, 1966.
Figure 40: "Algorithm 516: An Algorithm for Obtaining Confidence Intervals," ACM, 1977.

263
Indeed, practitioners viewed their algorithmic designs as reducing the procedural and
computational labor needed in mathematical processes, like probability estimations. Early 1960s
probability algorithms were designed to translate more basic mathematical statistical procedures in
probability and statistics into programming code. This included mapping normal bell curves,
randomizing information, conducting f-tests and t-tests, and drawing confidence intervals.22 For
example, “Algorithm 322 was coded into FORTRAN and run on a CDC 3200, and its accuracy for
moderate probability levels was tested using 5-figure critical values of the F-distribution at the .95
and .99 levels […] and 6-figure probability values taken from the t-distribution.”23 This particular t-
test algorithm was designed on a Control Data Corporation computer (CDC), a family of about 100
main frame computers that were released in the late 1960s.24
Throughout the 1960s and 70s, a family of confidence interval algorithms were designed per
the procedures of the ACM in the FORTRAN computing language. What is evident in the 1960s
and 70s confidence algorithms is that they were designed to take over the epistemic and the data
processing dimensions of (un)certainty work. These logic algorithms were literally designed to
replace the logicians, philosophers, and mathematicians of the early twentieth century. Algorithms
were designed to do the work of data sorting and organization, of calculation and computing, testing
and estimating, bounding and limiting, predicting and decision-making. In real-world applications,
however, algorithms proved to not reduce computational labor nor the complexity of the analysis.
Uncertainty reigned supreme.
22 M.D. MacLaren, “Algorithm 272: procedure for the normal distribution functions,” Communications of the ACM 8, no. 12 (1965): 789-791. John Morris, “Algorithm 346: F-test probabilities,” Communications of the ACM 12, no. 3 (1969): 184-185; John Morris, “Algorithm 321: t-test probabilities,” Communications of the ACM 11, no. 2 (1968): 115-116. 23 David A. Levine, “Algorithm 344: Student’s t-distribution,” Communications of the ACM 12, no. 1 (1969): 39. 24 Levine, “Algorithm 344,” 39.

264
In wider applications, confidence intervals were also built into the program designs of
algorithm-led experiments, as a tuning apparatus used in confirming the validity or power of the
models. As already discussed with the Monte Carlo method in the cloud-seeding re-evaluations,
confidence intervals and probability tests were used to assess the power and virtue of the method
itself. This proliferated throughout the 1960s and 70s in resource allocation work. During this time,
digital optimization models, especially in linear programming, were deployed in applications such as
overseeing resource analysis pertaining to water in the U.S. southwest and Navajo territory. A typical
dissertation in this field of research would be on studying how allocation of water resources affected
development in an arid environment. In this case, “linear programming techniques [would be] used
to determine optimum farm output and resource use patterns for different farm models representing
different farm size groups.”25 While the experiments were designed to establish optimal outcomes
through the use of specified technique—such as Monte Carlo methods or linear programming
techniques—(un)certainty work was indispensable to the experiment. confidence logics were used
first in the collection of farm data, as this still depended on estimation. And they were used in
assessing the probability that the methods used were accurate in their predictions of optimum
outcomes.
Experimental designers referred to their work as being “under uncertainty,” hence the need
for confidence logics. The initial pentagon designer of the simplex algorithm, George Dantzig, wrote
a paper titled, “Linear Programming Under Uncertainty.” Digital methods, models, and machines
25 Douglas Jones, “Economic aspects of agricultural use of Colorado River water in Yuma County, Arizona,” PhD. Diss., The University of Arizona, 1968. See also: James H. Milligan and Calvin G. Clyde, “Optimizing Conjunctive Use of Groundwater and Surface Water,” Reports 199 (1970); Donald William Boyd, “Simulation via time-partitioned linear programming: A ground and surface water allocation model for the Gallatin Valley of Montana,” WSC ’74 Proceedings of the 7th conference on Winter simulation—Volume 1 (1964): 161-170.

265
were subject to uncertainty in their applications even though the experimental design promised
yes/no outcomes.26
With 95% Certainty
In the introduction to this dissertation, I asserted that algorithmic computing is a
multinational and multidisciplinary reordering of the informational world, according to axiomatic-
mathematical designs and bounded by computing technology. This definition captures the expansive
empire of algorithmic society, a society that upholds the algorithm as manager, decision-maker, and
central oversight in geopolitics, global trade and economic development, military expansionism and
surveillance, public health, resource allocation and appropriation, and so forth. This definition also
captures the process of algorithmic computing, the reordering of the informational world, which did not
occur in a linear trajectory, but through waves of designed crisis and confidence computing—
projects that were manifest as a new statistics, a new method, a new mathematical machine.
Algorithms, artificial intelligence, computational statistics, decision trees, and the larger family of
twentieth-century data architectures that make appearances in this dissertation, were designed to
solve social and environmental problems—crises that were defined in terms of the preexisting
mathematical infrastructures and techniques that had failed to achieve certainty and control before
them. These problems were described as a flagging confidence in statistical information, a lack of
control in manufacturing and breeding processes, as error rates in target accuracy, and persistent
uncertainty in controlling the climate.
26 See: George B. Dantzig, “Linear Programming under Uncertainty,” Management Science 1 (1955): 197-206; Abraham Charnes and W.W. Cooper, “Chance-Constrained Programming,” Management Science 6 (1959): 73-80: Elliott E. Dudnik, “Optimization of planning and architectural decisions under conditions of uncertain demand,” DAC ’72 Proceedings of the 9th Design Automation Workshop (1972): 213-219.

266
The human problems and stories in these projects were used as evidence for the need of
new techniques, they were harnessed for resources, and hidden under a veneer of controlled
calculation. The anxiety driving these twentieth-century computing initiatives was, at its root, a grasp
for continued control over the world’s information—algorithmic computing is a preoccupation
with/by the past that manifests as a conditioned worry about the future. This view of the rise of
algorithmic computing subverts the notion of a progressive narrative of twentieth-century
computing—from analog to digital technology and from heuristic to bounded rationality—and
incites caution about this tendency in our ongoing search for certainty through artificial intelligence.
The mathematical and political contradictions and complexities existent in earlier iterations persist in
their new expressions.
Throughout this dissertation, I have expanded the notion of mathematical experiment to
include the larger cultural, political, and environmental contexts of uncertainty-work. Designing
Certainty is organized around four experiments—small-farm confidence computing in interwar
Poland, the assertion of control logics in New Deal policy, uncertainty management in U.S.
militarism, and (un)certainty work in cloud-seeding projects. The design of experiments, advanced
by the Anglophone school of mathematical statistics, was a planning philosophy that reconfigured
statistical experiments, usually conducted with frequency measures and regressions, into experiments
organized around confidence, control, and probability logics. Their experiments pertained to small-
scale projects—the testing of virulent particles in a sample, testing a finite set of precipitation data,
and so on. These experiments were designed to quantify confidence, control, and certainty in the
experimental results.
(Un)certainty work constitutes the larger translation of data, evidence, and analysis generated
from a statistical experiment into probabilistic frameworks. In my genealogy of (un)certainty work
throughout this dissertation, I show how computational work and analysis were ordered into tables

267
and graphs containing probability measures, and into visual displays and geometric diagrams
representing probabilistic frameworks. The computational routines of estimating and calculating
probabilistic outcomes, merged with adding machines, bombsight calculators, optical-display
devices, digital electronic memory-stored computers, programming code, and automata. Designing
Certainty’s epistemological story, of uncertainty, ties into stories of technology, labor, and the
environment that I develop through identifying the larger computing landscapes that support
(un)certainty work. Data is not only produced in the laboratories where it is computed, it is
generated through human and environmental intervention, often through processes of radical
transformation and mass destruction as with industrial agriculture, firestorm bombing, and
anthropogenic climate change. Historical data streams from its sources and origins into decision-
making procedures, and it impacts the landscape along the way.
The dialectic between crisis and computational development outlined in this dissertation
fueled a growing commitment to probabilistic thinking that by the late 1970s had become
hegemonic in digital computing and mathematical oversight. Unlike the probability debates of the
mid-1930s, this epistemological framing now reigns in scientific and social decision-making, without
major contest. I argue that this transformation is one of the most significant and understudied
information stories in twentieth-century history of computing. While probability has been at work in
state and social planning since the Enlightenment, its empire held limited power. It had not yet
permeated the various realms and dimensions of social thought explored in this dissertation. Current
uncertainty projects such as: “Probabilistic Weather Forecasting Analysis for Unmanned Aerial
Vehicle Path Planning,” show the layering of (un)certainty work and computing concepts introduced
in the first half of this dissertation, imbued with philosophies of digital machine interaction from the
domains of algorithms and automata just discussed. Designing Certainty begins and ends with

268
(un)certainty work in quantitative farm management, only today’s iteration is an outcome of the
years of war and colonialism that procured it.
1970s quantitative designs for achieving certain outcomes that were built into digital
computing programs promised certainty without its achievement. Procedurally, algorithms operate
as yes/no decision-makers, and automata are conceptualized as intelligent machine networks, but in
their applications, they remain subject to the uncertainty built into the technologies and landscapes
that sustain them. Uncertainty persists in designs of certainty. Hearkening back to Jacques Lacan’s
definition of anxiety as the perverse pleasure of an object’s pursuit—an object that can never be
obtained—and contextualizing this within this jagged history from fin de siècle through the 1970s,
there resides the fleeting persistence of this indeterminate mental and political architecture, with 95%
certainty.

269
BIBLIOGRAPHY
Archival Collections American History Special Collections. Smithsonian Institute.
Video History Program: The RAND Corporation. Trade Catalogue Collection.
American Philosophical Society. Special Collections.
Advisory Committee on Weather Control. Eugenics Office Records. Frederick Mosteller Papers John W. Tukey Papers. Herman Goldstine Papers. Stanislaw Marcin Ulam Papers. S.S. Wilks Papers.
Columbia University. Special Collections.
Harold Hotelling Papers.
Harvard University. Harvard Library Special Collections and Archives. Elizabeth Gilboy Papers. Harvard Economic Research Project Papers. Wassily Leontief Papers.
National Agricultural Library. Special Collections.
USDA Graduate School Collection. Dr. Hazel K. Stiebling Collection.
National Archives Records Administration. Maryland. Bureau of Aeronautics. Comptroller Deputy Chief of Staff Decimal File 1942-1953.
General Records of the Department of State Bureau of Near Eastern, South Asian & African Affairs.
National Defense Research Committee: Applied Mathematics Group. National Institute of Standards and Technology: AMD, Electronic Computers. Office of Scientific Research and Development. Records of the National Bureau of Standards. Records of the U.S. Air Force Commands, Activities, and Organizations.
National Archives Records Administration. Waltham.
Office of Scientific Research and Development. University of California, Berkeley. The Bancroft Library.
Jerzy Neyman Papers. Elizabeth Scott Papers.
University College London. Special Collections. Egon Pearson Papers.
Stanford University Archives.
George B. Dantzig Papers.

270
Digital Collections American Philosophical Society Proceedings. Carnegie Mellon University Libraries Digital Collections. Charles Babbage Institute Center for the History of Information Technology. Communications of the ACM. Hagley Museum and Library. Indian Statistical Institute Digital Collection. Monthly Labor Review Archives. National Agricultural Library Digital Collections. Navajo Times Newspaper Archive. University College London Digital Collections.
Technical, Primary, and Literary Sources “Jewish Statistics” in The American Jewish Year Book 9 (1907): 431-35. “In Moments of Anxiety” in The Biblical World 51, no. 4 (1918): 193-194. “The Psycho-Neuroses” in The British Medical Journal 1, no. 3090 (1920): 408. “The Scope of Biometrika” in Biometrika 1, no. 1 (1901): 1. “The Sugar Act of 1937” in The Yale Law Journal 47, no. 6 (1938): 980-993. Office of Population Research. “Demographic Problems of Poland” in Population Index 5, no. 4
(1939): 233-238. Auden, W.H. “The Age of Anxiety: A Baroque Eclogue,” in W.H. Auden Collected Poems, ed.
Edward Mendelson. New York: Vintage International, 1991. Andrepont, Wayne; Peter Dickenson. “Classroom Demonstration of a Confidence Interval” in The
Two-Year College Mathematics Journal 9, no. 1 (1978): 24-36. Arctowski, Henryk. “Agriculture and Landowndership in Poland” in Geographical Review 11, no. 2
(1921): 166.
Battan, L.J. “Silver iodide seeding and rainfall from convective clouds” in Journal of Applied Meteorology 5 (1966): 669-683
Bergeron, Tor. “On the physics of clouds and precipitation” in Verbal Proceedings, International
Geological and Geophysical Union, Fifth General Assembly, 2 (1933): 156-157.

271
Bernhardt, Joshua. “The Flexible Tariff and the Sugar Industry” in The American Economic Review 16, no. 1 (1926): 182-191.
Bingham, H.H. “Studies in the History of Probability and Statistics SLVI. Measure into Probability:
From Lebesgue to Kolmogorov,” Biometrika 87, no. 1 (2000): 145-156. Black, Max. “Vagueness. An Exercise in Logical Analysis” in Philosophy of Science 4 no. 4 (October
1937): 428. Brown, Albert H. “Automation of Visual Weather Observations” in Report of the Air Force
Geophysics Laboratory, April 1, 1980. Bose, Santipriya; P.C. Mahalanobis. “Marketing of Rice at Bolpur” in Sankhyā: The Indian Journal of
Statistics (1933-1960), 2, no. 2 (1936): 105-124. Buchholz, Werner. “The System Design of the IBM Type 701 Computer” in Proceedings of the I.R.E.
41, no. 10 (1953): 1262-1275. Campbell, George A. “Mathematics in Industrial Research” in The Bell System Technical Journal 3, no, 4
(1924): 550-557. Clark, Olynthus B. “Keeping Them on the Farm: The Story of Henry C. Wallace, the secretary of
agriculture, who has spent his life studying, teaching, improving and practising farming (sic)” in The Independent 105 (1921).
Cochran, W.G. “Graduate Training in Statistics” in The American Mathematical Monthly 53, no. 4
(1946): 193-199. Coons, George H. “The Sugar Beet: Product of Science” in Scientific Monthly 68, no. 3 (1949): 149. Cole, Arthur H.; Ruth Crandall, "The International Scientific Committee on Price History" in The
Journal of Economic History 24, no. 3 (1964): 381-88. Dantzig, George B. “Linear Programming under Uncertainty” in Management Science 1 (1955): 197-
206. Davis, Harry M. "Mathematical Machines" in Scientific American 180, no. 4 (1949): 30-31. Davis, Joseph S. “Economic and Financial Progress in Europe, 1923-1924” in The Review of Economics
and Statistics 6, no. 3 (1924): 226. DeFelice, T.P.; Duncan Axisa. “Developing the Framework for Integrating Autonomous Unmanned
Aircraft Systems into Cloud Seeding Activities” in Journal of Aeronautics & Aerospace Engineering 5, no. 172 (2016): 1-6.
Denevan, William M. “Livestock Numbers in Nineteenth-Century New Mexico, and the Problem of
Gullying in the Southwest” in Annals (Association of American Geographers) 57 (1967): 691-763.
Dietz, Richard; Sebastiano Moruzzi (eds). Cuts and Clouds: Vagueness, Its Nature and its Logic. New
York: Oxford University Press, 2010.

272
Dudnik, Elliott E. “Optimization of planning and architectural decisions under conditions of uncertain demand” in DAC ’72 Proceedings of the 9th Design Automation Workshop (1972): 213-219.
Durand, E. Dana. “Currency Inflation in Eastern Europe with Special Reference to Poland,” in The
American Economic Review 13, no. 4 (1923): 593. Eckert, William J. Punched Card Methods in Scientific Computation. Lancaster, PA: Lancaster Press, Inc.,
1940. Fisher, R.A. Statistical Methods for Research Workers. Edinburgh: Oliver & Boyd, 1925. __________. Design of Experiments. Edinburgh: Oliver & Boyd, 1935. __________. Statistical Inference and the Testing of Hypothesis. Washington: The Graduate School of the
USDA, 1936. Freud, Sigmund. “The Origin and Development of Psychoanalysis” in The American Journal of
Psychology xxxi, no. 2 (1910). __________. “The Justification for Detaching from Neurasthenia a Particular Syndrome: The
Anxiety-Neurosis” in Collected Papers, Vol. 1 (London: Hogarth Press, 1953). Friedman, Milton. Essays in Positive Economics. Chicago: Chicago University Press, 1966. Fryde, Matthew M. “Recent Studies in Polish Agrarian History” in The Polish Review 7, no. 4 (1962):
37-54. Galton, Francis. “Discontinuity in Evolution.” Mind 3, no. 11 (1894): 362-72. __________. “Family Likeness in Eye-Colour.” Proceedings of the Royal Society of London 40 (1886): 402-
16. __________. “Regression Towards Mediocrity in Hereditary Stature” in The Journal of the
Anthropological Institute of Great Britain and Ireland 15 (1886): 246-63. __________. “Address Delivered at the Anniversary Meeting of the Anthropological Institute of
Great Britain and Ireland” in The Journal of the Anthropological Institute of Great Britain and Ireland, Vol. 18 (1889): 406.
Ghosh, Jayanta; Pulakesh Maiti; Anil Bera. “Indian Statistical Institute: Numbers and beyond, 1931–
47” in Science and Modern India: An institutional history, c 1947 (1784): 1019. Golbeck, Amanda L. Equivalence: Elizabeth L. Scott at Berkeley. Boca Raton: CRC Press, 2017. Gurevich, Yuri. “What is an Algorithm (revised)?” in Church’s Thesis: Logic, Mind and Nature (eds) A.
Olszewski. Copernicus Center Press, 2014. Hamblen, John W. “Statistical programs for the IBM 650—Part 1” in Communications of the ACM 2,
no. 8 (1959); 13-18. Humphrey, Robert R. “A Detailed Study of Desert Rainfall,” Ecology 14, no. 1(1933): 31.

273
Iwaszkiewicz, Karolina and Jerzy Neyman, “Counting Virulent Bacteria and Particles of Virus” in Acta Biologiae Experimentalis, VI (1931): 101.
Johnson, Elizabeth S. “Wages, Employment Conditions, and Welfare of Sugar-Beet Laborers” in
Monthly Labor Review (pre-1986) 46, no. 000002 (1938): 322. Kowalski, Robert. “Algorithm = Logic + Control.” Communications of the ACM 22, no. 7 (1979). Krzyśko, Mirosław. “Karolina Iwaszkiewicz-Gintowt (1902-1999),” Acta Universitats Lodziensis Folia
Oeconomica, 286 (2013): 32. Halvorson, H.O; N.R. Ziegler. “Application of Statistics to Problems in Bacteriology” in Journal of
Bacteriology 25, no. 2 (1932): p. 102. Herrick, Myron T. “The Panic of 1907 and Some of its Lesson” in Annals of the American Academy of
Political and Social Science 31 (1908). Hooker, J.N. “Needed: An Empirical Science of Algorithms” in Operations Research 42, no. 2 (1994):
201-212. Hosiasson, Janina. “Quelques Remarques sur la dépendance des proabilités a posteriori de celles a
priori” in Statistica 1 (1929-1930): 375-382. __________. “Why do we prefer probabilities relative to many data?” Mind XL, no. 157 (1931): 23-
36. Hoover, J.W. “Navajo Land Problems,” Economic Geography 13, no. 3 (1937): 281-300. Keefe, Rosanna. Theories of Vagueness. Cambridge: Cambridge University Press, 2002. Keefe, Rosanna; Peter Smith (eds). Vagueness: A Reader. Cambridge: MIT Press, 1996. Keynes, John Maynard. A Treatise on Probability. London: Macmillan and Co., Limited, 1921. Kircher, Paul. The Crisis We Face: Automation and the Cold War. New York: McGraw-Hill, 1960. Langmuir, Irving. “The Growth of Particles in Smokes and Clouds and the Production of Snow from
Supercooled Clouds” in Proceedings of the American Philosophical Society 92, no. 3 (July 1948): 167-185.
Lacan, Jacques. The Seminar of Jacques Lacan: The Four Fundamental Concepts of Psychoanalysis
(Vol. Book XI) trans., Alan Sheridan. New York: W.W. Norton & Company, 1998. originally published in 1973.
Lehmann, Erich. “Jerzy Neyman, 1894-1981,” Department of Statistics, University of California, Berkeley,
Technical Report No. 155, May, 1998, accessed December 10, 2016, http://digitalassets.lib.berkeley.edu/sdtr/ucb/text/155.pdf.
Lindsay, H. A. F. "World Tendencies Reflected in India’s Trade." Journal of the Royal Society of Arts 75,
no. 3876 (1927): 386.

274
List, George. “Hopi Kachina Dance Songs: Concepts and Context” in Ethnomusicology 41, no. 3 (1997): 413-432.
Lovasich, J.L.; Jerzy Neyman; Elizabeth Scott,;Marcella Wells, “Further studies of the Whitetop
cloud-seeding experiment” in Proceedings of the National Academy of Science 68 (1971): 147-151. Mahalanobis, P.C. “Walter A. Shewhart and Statistical Quality Control in India” in Sankhyā: The
Indian Journal of Statistics (1933-1960) 9, no. 1 (1948). __________. “Why Statistics?” in Sankhyā: The Indian Journal of Statistics (1933-1960), 10, no. 3 (1950):
224-225.
__________. “Some Aspects on the Design of Sample Surveys” in Sankhyā: The Indian Journal of Statistics (1933-1960) 12, no. ½ (1952
Majumdar, D.N.; C. Radhakrishna Rao; P.C. Mahalanobis. “Bengal Anthropometric Survey, 1945: A
Statistical Study,” Sankhyā: The Indian Journal of Statistics (1933-1960) 19, no. 3/4 (1958): 201-408. Mayberry, John. “On the Consistency Problem for Set Theory: An Essay on the Cantorian
Foundations of Classical Mathematics” in British Journal for the Philosophy of Science. Melville, Herman. The Confidence-Man, ed. John Bryant. USA: The Modern Library, 2003. M.H.V.G. “Mental Suffering: Evidence of Plantiff’s Poverty,” California Law Review 7, no. 4 (1919).
Neyman (Spława-Neyman), Jerzy. “Sur un théorèm métrique concernant les ensembles fermés,”
Fundamenta Mathematicae, 5 (1924): 329-330 __________. “Przedmowa” to Wacław Pytkowski, “Wpływ Obszaru, Nakładu I Kapitału Kròw Ta
Dochód Surowy W Drobnych Gospodarstwach,” Biblojoteka Puławska, 34 (1932). __________. “The Development of Industrial Applications of Statistical Theory in Poland,” Journal
of the American Statistical Association, 30 (1935): 707. Neyman, Jerzy. Lectures and Conference on Mathematical Statistics. Washington: The Graduate School of
the USDA, 1937. __________. “Re-Evaluation of the Arizona Cloud-Seeding Experiment,” Proceedings of the National
Academy of Sciences 69 (1972): 1349. Neyman, Jerzy; Elizabeth Scott; M.A. Wells. “Statistics in Meterology,” Revue de l’Institut International
de Statistique 37, no. 2 (1969): 119-148. Neyman, Jerzy; Herbert Osborn, “Evidence of widespread effect of cloud seeding at two Arizona
experiments” in Proceedings of the National Academy of Sciences 68 (1971): 649-652 North, S.N.D. “The Outlook for Statistical Science in the United States.” Publications of the American
Statistical Association 11, no. 81 (1908).

275
Matuszewski, T., J. Neyman, and J. Supinska. "Statistical Studies in Questions of Bacteriology. Part I. The Accuracy of the "Dilution Method"." Supplement to the Journal of the Royal Statistical Society 2, no. 1 (1935): 63-82.
Parker, George M. “The New Meaning of Symptoms in Hysteria” in The Cleveland Medical Journal XI,
no. 4 (1912): 248-49. Pearson, E.S.; A.V. Sukhatme. “An Illustration of the Use of Fiducial Limits in Determining the
Characteristics of a Sampled Batch” in Sankhyā: The Indian Journal of Statistics (1933-1960), 2, no. 1 (1935): 13-32.
Pearson, F.A.; G.E. Brandow. “Agricultural Price Statistics in the United States and Abroad”
in Journal of Farm Economics 21, no. 4 (1939). Pearson, Karl. The Grammar of Science. Cambridge: Cambridge University Press, 2014. originally
published 1895. Peirce, Charles. “Vague” in Dictionary and Philosophy and Psychology, J.M. Baldwin (ed.), New York:
MacMillan, 748. Powell, John Wesley. On the Lands of the Arid Region of the United States, with a More Detailed Account of the
Lands of Utah. With Maps. Washington: Government Printing Office, 1879. Przyborowski, Józef; Henryk Wilenśki. “Statistical Principles of Routine Work in Testing Clover Seed
for Dodder” in Biometrika 27 (1935). Pytkowski, Wacław. “The Dependence of the Income in Small Farms upon their Area, the Outlay
and the Capital Invested in Cows (English Summary)” in Bibljoteka Puławska 34 (1932). Rafferty, J.A. “Mathematical Models in Biological Theory” in American Scientist 38, no. 4 (1950): 549-
79. Rao, C. Radhakrishna. “Statistical Inference Applied to Classificatory Problems” in Sankhyā: The
Indian Journal of Statistics (1933-1960), 10, no. 3 (1950): 229-256. __________. “In Memoriam: Prasanta Chandra Mahalanobis (1893-1972) in Sankhyā: The Indian
Journal of Statistics, Series B (1960-2002) 34, no. 3 (1972): 301-302. Rees, Mina. “The Mathematical Sciences and World War II” in The American Mathematical Monthly 87,
no. 8 (1980): 607-621.
Reddy, Mohan B.; Ranjan Gupta. “Introduction: P.C. Mahalanobis and the Symposium on Frontiers of Anthropology” in Human Biology 67, no. 6 (1995): 819-825.
Reichenbach, Hans. The Theory of Probability. An Inquiry into the Logical Foundations of the Calculus of
Probability, Transl. by E.H. Hutten and M. Reichenbach, Berkeley-Los Angeles: University of California Press. Originally printed in 1935 in German.
__________. Experience and Prediction: An Analysis of the Foundations and the Structure of Knowledge.
Chicago: The University of Chicago Press, 1938.

276
Roy, S. K. Datta. “Railway Statistics” in Sankhyā: The Indian Journal of Statistics (1933-1960) 4, no. 2 (1938): 241-244.
Russell, Bertrand. “La Théorie des Types Logiques” in Revue de Métaphysiqe et de Morale 18, no. 3
(1910): 263-301.
__________. “Vagueness” in Australian Journal of Philosophy and Psychology 1 (1923).
Sarle, Charles F. “Meterology and Agriculture” in Bulletin of the American Meteorological Society 20, no. 4 (1939).
Scott, F.J.; George S. Boutwell; Edward H. G. Clark; S. Dana Horton. “Our National Banking
System.” The North American Review 141, no. 346 (1885): 20.1 Shafer, Glenn; Vladimir Vovk. “The Sources of Kolmogorov’s “Grundbegriffe” in Statistical Science 21,
no. 1 (2006): 70-98. Shewhart, Walter A. “Some Applications of Statistical Methods to the Analysis of Physical and
Engineering Data” in Bell System Technical Journal 3, no. 1 (1924).
__________. “Quality Control Charts,” Bell System Technical Journal 5 no. 4 (October 1926). __________. Statistical Method from the Viewpoint of Quality Control. Washington, The Graduate School,
USDA, 1939. Shubik, Martin. “Studies and Theories of Decision Making” in Administrative Science Quarterly 3, no. 3
(1958): 289-306. Schneiderman, Harry. “Poland,” The American Jewish Year Book 39 (Sept. 1937-Sept. 1938). Schrödinger, Erwin. “Are There Quantum Jumps? Part I” in The British Journal for the Philosophy of
Science 3, no. 10 (1952): 109-23. Smith, Clinton Dewitt; Robert Clark Kedzie. “Sugar Beets in Michigan in 1897” in Michigan State
Agricultural College Experiment Station, Bulletin 150 (December, 1897). Simon, Herbert A. “Statistical Tests as a Basis for "Yes-No" Choices” in Journal of the American
Statistical Association 40, no. 229 (1945): 80-84. __________. Models of Man, Social and Rational: Mathematical Essays on Rational Human Behavior in a
Social Setting. New York: Wiley, 1957. __________. “Theories of Decision-Making in Economics and Behavioral Science” in The American
Economic Review 49, no. 3 (1959): 253-283. __________. “Rational Decision Making in Business Organizations.” The American Economic
Review 69, no. 4 (1979): 493-513. Simon, Herbert A.; George B. Dantzig. “Decision Making and Problem Solving,” INFORMS 17, np.
5 (1987): 11-31.

277
Smirnov, A.; B.N. Holben; T.F. Eck; O. Dubovik. “Cloud-Screening and Quality Control Algorithms for the AERONET Database” in Remote Sensing of Environment 73, no. 3 (2000).
Spargue, O.M.W. History of Crises under the National Banking System. New York: Augustus M. Kelly,
1968 (Reprint edition, 1910). Staniewicz, Witold. “The Agrarian Problem in Poland between the Two World Wars.” The Slavonic
and East European Review, 43, No. 100 (1964): 24. Uliaszek, Stanley and John Komlos. “From a History of Anthropometry to Anthropometric History”
in Human Variation: From the Laboratory to the Field (2010): 183-197. Veblen, Thorstein. The Theory of the Leisure Class: An Economic Study of Institutions. New York: Dover
Thrift Editions, 1994. Von Neumann, John. “Probabilistic Logics and the Synthesis of Reliable Organism from Unreliable
Components” in C.E. Shannon, Automata Studies. Princeton: Princeton University Press: 1956. Wallace, Henry C. Our Debt and Duty to the Farmer. Central Company, 1925. Wallace, William A.; Frank De Balogh. “Decision Support Systems for Disaster Management” in
Public Administration Review 45 (1985): 134-146. Wangsness, T; J. Franklin. “Algorithm” and “Formula” in Communications of the ACM 9, no. 4 (1966). Watts, Alan. The Wisdom of Insecurity: A Message for an Age of Anxiety. New York: Pantheon Books,
1951.
Weaver, Warren. “The Reign of Probability” in The Scientific Monthly 31, no. 5 (1930): 466. Weber, Max. The Protestant Ethic and the Spirit of Capitalism. New York: Charles Scribner’s Sons, 1930. Weinwurm, Ernest H. “Measuring Uncertainty in Managerial Decision Making” in Management
International 3, no. 3/4 (1963): 114-22. Westergaard, Harald. "Scope and Method of Statistics." Publications of the American Statistical
Association 15, no. 115 (1916): 240. Whitehead, A.N. “Introduction Logique a la Géométrie” in Revue de Métaphysique et de Morale 15, no. 1
(1907): 34-39. Wiebe, Robert H. The Search for Order, 1877-1920 (New York: Hill & Wang, 1967). Wiley, H.W. “The Sugar Beet: Culture, Seed Development, Manufacture, and Statistics” in Farmers’
Bulletin No. 52, 1899. Williamson, R.T. “Remarks on the Treatment of Neurasthenia and Psychasthenia Following Shell
Shock” in The British Medical Journal 2, no. 2970 (1917): 713. Wishart, John. “Bibliography of Agricultural Statistics 1931-1933” in Supplement to the Journal of the
Royal Statistical Society 1, no. 1 (1934): 94-106.

278
Wittfogel, Karl A. Oriental Despotism: A Comparative Study of Total Power. New Haven: Yale University Press, 1957.
Yaron D.; U. Horowitz. “Short and Long-Run Farm Planning Under Uncertainty; Integration of
Linear Programming and Decision Tree Analysis” in Agricultural Economics 20, no. 2 (1972): 17-30.
Secondary Sources Adas, Michael. Machines as the Measure of Men: Science, Technology, and Ideologies of Western Dominance.
Ithaca, NY: Cornell University Press, 1989. Agar, John. The Government Machine: A Revolutionary History of the Computer. Cambridge: The MIT Press,
2003. __________. “What Difference Did Computers Make to Science?” in Social Studies of Science 36, no. 6
(2006): 869-907. Alexander, Jennifer Karns. Mantra of Efficiency: From Waterwheel to Social Control (Baltimore: Johns
Hopkins University Press, 2008). Amoore, Louise. The Politics of Possibility: Risk and Security Beyond Probability. Durham: Duke University
Press, 2013. __________. “Data Derivatives: On the Emergence of a Security Risk Calculus for our Times” in
Theory, Culture, & Society 28 (2011): 24-43. __________. “Cloud Geographies: Computing, Data, Soverignty” in Progress in Human Geography 42
(2018): 4-24. Baker, Kevin T. Word Processors: Computer Modeling, Global Environmentalism, and the Birth of Sustainable
Development. PhD Diss. Northwestern University, 2019. Beck, Ulrich. Risk Society: Towards a New Modernity. London: Sage Publications, 1992. __________. World at Risk. London: Polity, 2008. Bell, Amy. “Landscapes of Fear: Wartime London, 1939-1945” in Journal of British Studies 48, no. 1
(2009): 153-175. Beniger, James R. The Control Revolution: Technological and Economic Origins of the Information Society.
Cambridge: Harvard University Press, 1989. Benjamin, Ruha. Race After Technology: Abolitionist Tools for the New Jim Code. Cambridge and Medford:
Polity Press, 2019. Bergman, James Henry. Climates on the Move: Climatology and the Problem of Economic and Environmental
Stability in the Career of C.W. Thornwaite, 1933-1963. PhD Diss, Harvard University, 2014. Bernhard, Michael. “Interwar Poland,” in Institutions and the Fate of Democracy: Germany and Poland in the
Twentieth Century. Pittsburgh: University of Pittsburgh Press, 2005.

279
Bouk, Dan. How Our Days Became Numbered: Risk and the Rise of the Statistical Individual. Chicago: Chicago University Press, 2015.
__________. “The History and Political Economy of Personal Data over the Last Two Centuries in
Three Acts” in Osiris 32, no. 1 (2017): 85-106. Braun, Lundy. Breathing Race into the Machine: The Surprising Career of the Spirometer from Plantation to
Genetics. Minnesota: University of Minnesota Press, 2014. Brugge, Doug; Timonthy Benally; Esther Yazzie Lewis (eds.). The Navajo People and Uranium Mining.
Albuquerque: University of New Mexico Press, 2007. Campbell-Kelly, Martin. Computer: A History of the Information Machine. New York: Basic Books, 1997. Carson, Cathryn. Heisenberg in the Atomic Age: Science and the Public Sphere. Cambridge: Cambridge Univ.
Press, 2010. Carson, Rachel. Silent Spring. Houghton Mifflin Company, 1962. Cassidy, David. Uncertainty: The Life and Science of Werner Heisenberg. New York: Freeman, 1992. Ceruzzi, Paul. A History of Modern Computing. Cambridge: The MIT Press, 2003. Chandler, Jr., Alfred D. The Visible Hand: The Managerial Revolution in American Business. Cambridge:
Harvard University Press, 1977. Chatterjee, Partha. The Nation and Its Fragments: Colonial and Postcolonial Histories. New Jersey: Princeton
University Press, 1993. __________. The Politics of the Governed: Reflections on Popular Politics in Most of the World. New York:
Columbia University Press: 2006. Christ, Carl F. “The Cowles Commission’s Contributions to Econometrics at Chicago, 1939-1955” in
Journal of Economic Literature 32, no. 1 (1994). Collins, Harry. Artificial Experts: Social Knowledge and Intelligent Machines. Cambridge: The MIT Press,
1992. Cowles, Henry M.; William Deringer; Stephanie Dick; Colin Webster. "Introduction" in Isis 106, no.
3 (2015): 621-22. Cuordileone, K.A. “Politics in an Age of Anxiety”: Cold War Political Culture and the Crisis in
American Masculinity, 1949-1960” in The Journal of American History 87, no. 2 (2000): 515-545. Crawford, Kate. “The Anxieties of Big Data,” in The New Inquiry (2014).
http://thenewinquiry.com/essays/the-anxieties-of-big-data/ Crowther-Heyck, Hunter. “A New Model of Mind and Machine,” in Herbert A. Simon: The Bounds of
Reason in Modern America. Baltimore: Johns Hopkins Univ. Press, 2005. __________. “Patrons of the Revolution: Ideals and Institutions in Postwar Behavioral Science” in
Isis 97, no. 3 (2006): 420-446

280
Dalton, Craig M.; Linnet Taylor; Jim Thatcher. “Critical Data Studies: A dialog on data and space” in
Big Data & Society (2016): 1-9. Daipha, Phaedra. Masters of Uncertainty. Chicago: University of Chicago Press, 2015.
Daston, Lorraine; Lorezn Krüger; Michael Heidelberger. The Probabilistic Revolution Cambridge: MIT
Press, 1987. Daston, Lorraine. Classical Probability in the Enlightenment. Princeton: Princeton University Press, 1988.
__________. “The Doctrine of Chances without Chance: Determinism, Mathematical Probability,
and Quantification in the Seventeenth Century” in Mary Jo Nye; Joan Richards; Roger Stuewer, eds. The Invention of Physical Science. Essay in Honor of Erwin Hiebert. Boston/The Netherlands: Kluwer Academic Publishers, 1992.
__________. “Cloud Physiognomy: Describing the Indescribable” in Representations 135 (2016): 45-
71. Dauben, Joseph. Georg Cantor: His Mathematics and Philosophy of the Infinite. Princeton, NJ: Princeton
University Press, 1999. Davis, Diana K. The Arid Lands: History, Power, and Knowledge. Cambridge: MIT Press, 2016. Dorrain, Mark; Frédéric Pousin (eds). Seeing from Above: The Aerial View in Visual Culture. New York:
I.B. Tauris, 2013. Dick, Stephanie. “Aftermath: the Work of Proof in the Age of Human-Machine Collaboration” in
Isis 102.3 (September 2011): 494-505 __________. “After Math: (Re)configuring Minds, Proof, and Computing in the Postwar United
States.” PhD diss., Harvard University, 2014. __________. “Of Models and Machines: Implementing Bounded Rationality” in Isis 106, no. 3
(September 2015): 623-634. Dryer, Theodora. “Algorithms under the Reign of Probability” in IEEE Annals of the History of
Computing 40, no. 1 (2018): 93-96. Dreyfus, Hubert. What Computers Still Can’t Do: A Critique of Artificial Reason. Cambridge: The MIT
Press, 1992. Eglash, Ron. African Fractals: Modern Computing and Indigenous Design. New York: Rutgers, 1999. Eklund, Matti. “Being Metaphysically Unsettled: Barnes and Williams on Metaphysical Indeterminacy
and Vagueness” in Oxford Studies in Metaphysics 6 (2011). Ensmenger, Nathan. “Is chess the drosophila of artificial intelligence? A social history of an
algorithm.” Social Studies of Science 42, no. 1 (2012): 5-30. Erickson, Paul. “Mathematical Models, Rational Choice, and the Search for Cold War Culture” in Isis
101 (2010): 386-392.

281
Erickson, Paul; Judy Klein; Lorraine Daston; Rebecca Lemov; Thomas Sturm; Michael Gordin. How
Reason Almost Lost Its Mind: The Strange Career of Cold War Rationality. Chicago; The University of Chicago Press, 2013.
Eubanks, Virginia. Automating Inequality: How High-Tech tools Profile, Police, and Punish the Poor. New
York: St. Martin’s Press, 2018. Ewald, Francis. “Two Infinities of Risk” in Brian Massumi (ed.). The Politics of Everyday Fear
Minneapolis: University of Minnesota Press, 1991. Estes, Nick. Our History is the Future: Standing Rock versus the Dakota Access Pipeline, and the Long Tradition
of Indigenous Resistance. Verso Books, 2019. Fanon, Frantz. The Wretched of the Earth, trans. Constance Farrington. New York: Grove Weidenfeld,
1963. __________. A Dying Colonialism, trans. Haakon Chevalier. New York: Grove Weidenfeld, 1965. Fidler, Bradley. Inventing Internet Protocol. Cambridge: The MIT Press, Forthcoming. Fitzgerald, Deborah. Every Farm a Factory: The Industrial Ideal in American Agriculture. New Haven: Yale
University Press, 2003.
Fleming, James Rodger. “The pathological history of weather and climate modification: Three cycles of promise and hype” in Historical Studies in the Physical and Biological Sciences 37, no. 1 (2006); 3-25.
__________. Fixing the Sky: The Checkered History of Weather and Climate Control. New York: Columbia
University Press, 2010. Freund, Daniel. American Sunshine: Diseases of Darkness and the Quest for Natural Light. Chicago:
University of Chicago Press, 2012. Friedman, Michael. “Hempel and the Vienna Circle” in Gary L. Hardcastle (ed.) Logical Empiricism in
North America. Minnesota: University of Minnesota Press, 2003. Kanigel, Robert. The One Best Way: Frederick Winslow Taylor and the Enigma of Efficiency. New York:
Viking, 1997. Kaplan, Caren. Aerial Aftermaths: Wartime From Above. Durham: Duke University Press, 2018. Gere, Cathy. Pain, Pleasure, and the Greater Good: From the Panopticon to the Skinner Box and Beyond.
Chicago: Chicago University Press, 2017. Gigerenzer, Gerd (eds.).The Empire of Chance: How Probability Changed Science and Everyday Life.
Cambridge: Cambridge University Press, 1989. Galambos, Louis. “The Emerging Organizational Synthesis in Modern American History” in The
Business History Review, 44/3 (Autumn 1970): 279-90. Galison, Peter. “The Ontology of the Enemy” in Critical Inquiry 21, no. 1 (1994): 228-266.

282
Gilio-Whitaker, Dina. As Long as Grass Grows: The Indigenous Fight for Environmental Justice from Colonization to Standing Rock. Boston: Beacon Press, 2019.
Grattan-Guinness, Ivor. The Search for Mathematical Roots, 1870-1940: Logics, Set Theories and the
Foundations of Mathematics from Cantor through Russell to Gödel. Princeton, NJ: Princeton University Press, 2002.
Grier, David Alan. When Computers Were Human. Princeton, N.J.: Princeton University Press, 2005. __________. “Programming and Planning” in IEEE Annals of the History of Computing 33, no. 1
(2011): 86-88. Grinde Jr., Donald A. “Navajo Oppostion to the Indian New Deal” in Equity and Excellence in
Education 19, no. 3-6 (1981). Haffner, Jeanne. The View from Above: The Science of Social Space. Cambridge: MIT Pres, 2013. Halttunen, Karen. Confidence Men and Painted Women: A Study of Middle-class Culture in America, 1830-
1870. Yale University Press, 1982.
Hamilton, Emily. The Math Mafia: How a Persistent Group of Reformers Standardized American Education. Book Manuscript.
Hays, Samuel P. Conservation and the Gospel of Efficiency: The Progressive Conservation Movement, 1890-1920.
Cambridge: Harvard University Press, 1959. Hendrickson, Mark. American Labor and Economic Citizenship: New Capitalism from World War I to the
Great Depression. New York: Cambridge University Press, 2013. Heyck, Hunter. “The Organizational Revolution and the Human Sciences” in Isis 105, no. 1 (2014):
1-31. Hounshell, David. From American System to Mass Production, 1800-1932. Baltimore: Johns Hopkins
University Press, 1984. Igo, Sarah E. The Averaged American: Surveys Citizens, and the Making of a Mass Public. Cambridge:
Harvard University Press, 2008. _________. The Known Citizen: A History of Privacy in Modern America. Cambridge: Harvard University
Press, 2018. Irani, Lilly. “Difference and Dependence among Digital Workers: The Case of Mechanical Turk,”
The South Atlantic Quarterly 114, no. 1 (2015): 225-234. _________. Chasing Innovation: Making Entrepreneurial Citizens in Modern India. Princeton: Princeton
University Press, 2019. Hacking, Ian. “Biopower and the Avalanche of Printed Numbers” in Culture and History (1983): 279-
295. _________. An Introduction to Probability and Inductive Logic. Cambridge: Cambridge University Press,
2001.

283
Halpern, Orit. Beautiful Data: A History of Vision and Reason Since 1945. Durham: Duke University
Press, 2015. Harper, Kristine. Weather by the Numbers: The genesis of modern meteorology. Cambridge: MIT Press, 2008. _________. Make it Rain: State Control of the Atmosphere in Twentieth-Century America. Chicago:
University of Chicago Press, 2017. Haigh, Thomas. “Remembering the Office of the Future: The Origins of Word Processing and
Office Automation” in IEEE Annals of the History of Computing 28, no. 4 (2006): 6-31. Hicks, Marie. Programmed Inequality: How Britain Discarded Women Technologists and Lost Its Edge In
Computing. Cambridge: The MIT Press, 2017.
Iliadis, Andrew; Fredrica Russo. “Critical Data Studies: An Introduction” in Big Data & Society (2016): 1-7.
Jedynak, Anna. “Janina Hosiasson-Lindenbaumowa: The Logic of Induction,” in. Władysław
Krajewski (ed.) Polish Philosophers of Science and Nature in the 20th Century. Amsterdam: Rodopi, 2001. Jones, Matthew. “Querying the Archive: Data Mining from Apriori to Page Rank,” in L. Daston, ed.
Archives of the Sciences. Chicago: Chicago University Press, 2016. _________. Reckoning with Matter: Calculating Machines, Improvement, and Thinking about Thinking from
Pascal to Babbage. Chicago: Chicago University Press, 2016. Kitchin, Rob. The Data Revolution: Big Data, Open Data, Data Infrastructures & Their Consequences. Los
Angeles: SAGE, 2014. Kindleberger, Charles P.; Robert Aliber. Manias Panics, and Crashes: A History of Financial Crises. New
Jersey: John Wiley & Sons, Inc., 2005. Kline, Robert. “Cybernetics, Automata Studies, and the Darmouth Conference on Artificial
Intelligence” in IEEE Annals of the History of Computing 33, no. 4 (2011): 5-16.
Miller, Carolyn R. “The Rhetoric of Decision Science, or Herbert A. Simon Says” in Science, Technology, & Human Values 14, no. 1 (1989): 43-46;
Kryśko, Mirosław. “The History of the Mathematical Statistics Group at the Horticultural Faculty of
the Central College of Agriculture in Warsaw, and the Biometric Laboratory at the Marceli Nencki Institute of the Warsaw Scientific Society” in Statistics in Transition – New Series 13, no. 3 (2012), 617.
Kwan, Mei-Po. “Algorithmic Geographies: Big Data, Algorithmic Uncertainty, and the Production of
Geographic Knowledge” in Annals of the American Association of Geographers 106, no. 2 (2016): 274-282.
Kwon, Heonik. “The Dollarization of Vietnamese Ghost Money” in The Journal of the Royal
Anthropological Institute 13, no. 1 (2007): 73-90.

284
Lampland, Martha. “False numbers as formalizing practices” in Social Studies of Science 40, no. 3 (2010): 377-404.
_________. The Value of Labor: The Science of Commodification in Hungary, 1920-1956. Chicago: The
University of Chicago Press, 2016. Larson, Olaf F.; Julie N. Zimmerman. “The USDA’s Bureau of Agricultural Economics and
Sociological Studies of Rural Life and Agricultural Issues, 1919-1953” in Agricultural History 74, no. 2 (Spring, 2000).
Leblanc, Hugues. “The Autonomy of Probability Theory (Notes on Kolmogorov, Rényi, and
Popper).” The British Journal for the Philosophy of Science 40, no. 2 (1989): 167-181. Lemov, Rebecca M. Database of Dreams: The Lost Quest to Catalog Humanity. New Haven: Yale
University Press, 2015. Levy, Johnathan. Freaks of Fortune: The Emerging World of Capitalism and Risk in America. Cambridge:
Harvard University Press, 2012. Light, Jennifer. “When Computers Were Women” in Technology and Culture 40, no. 3 (1999): 455-483. Lorimer, Douglas. Science, Race Relations and Resistance: Britain, 1870-1914. Manchester: Manchester
University Press, 2013. Lubar, Steven. “Do Not Fold, Spindle or Mutilate”: A Cultural History of the Punch Card, Journal of
American Culture 15, 4 (1992): 42-55. Madurowicz-Urbańska, Helena. “Der Beginn des sozial- und wirtschaftsgeschichtlichen Faches in
Polen: Die Schule von Franciszek Bujak (1875-1953)” in VSWG: Vierteljahrschrift Für Sozial- Und Wirtschaftsgeschichte 75, no. 4 (1988): 483–502.
Masco, Joseph. “The Crisis in Crisis,” Current Anthropology 58, no. 15 (2017): S65-S76. Mackenzie, Donald. Inventing Accuracy: A Historical Sociology of Nuclear Missile Guidance. Princeton:
Princeton University Press, 1990. _________. “Automation of proof: a historical and sociological exploration” in IEEE Annals of the
History of Computing 17, no. 3 (1995): 7 -29 _________. Mechanizing Proof: Computing Risk and Trust. Cambridge: The MIT Press, 2004. _________. An Engine, Not a Camera: How Financial Models Shape Markets. Cambridge: University of
Cambridge Press, 2008. MacKenzie, Donald.; Yuval Millo. “Constructing a Market, Performing Theory: The Historical
Sociology of a Financial Derivatives Exchange” in American Journal of Sociology, 109, no. 1(2003): 108.
Marcos, Patrícia Martins. “Bodies of Empire: Medicine, Agriculture, and Race in Colonial Brazil,
1750-1792” at Rocky Mountain Council for Latin American Studies (2019).

285
Mahoney, Michael. “The History of Computing in the History of Technology” in IEEE Annals of the History of Computing 10, no. 2 (1988): 113-125.
Marez, Curtis. Farm Worker Futurism: Speculative Technologies of Resistance. Minneapolis: Minnesota
University Pres, 2016. McMillen, Christian W. “Rain, Ritual, and Reclamation: The Failure of Irrigation on the Zuni and
Navajo Reservations, 1883-1914” in Western Historical Quarterly 31, no. 4 (2000): 434-456.
Medina, Eden. “Forensic Identification in the Aftermath of Human Rights Crimes in Chile: A Decentered Computer History” in Technology & Culture 59, no. 4 (2008): S100-S133.
_________. Cybernetic Revolutionaries: Technology and Politics in Allende’s Chile. Cambridge, Mass: MIT
Press, 2011
Mitcham, Carl. Thinking through Technology: The Path between Engineering and Philosophy. Chicago: University of Chicago Press, 1994.
Miranti, Paul J. “Corporate Learning and Quality Control at the Bell System, 1877-1929.” The Business
History Review 79, no. 1 (2005). Mirowski, Phillip. Machine Dreams: How Economics Became a Cyborg Science. Cambridge: Cambridge
University Press, 2002. _________. “The Cowles Commission as an Anti-Keynesian Stronghold, 1943-54,” Microfoundations
Reconsidered. Edward Elgar Publishing, 2012. Morning, Ann. The Nature of Race: How Scientists Think and Teach about Human Difference. Berkeley:
University of California Press, 2011. Morris, Robert R. “Anxiety: Freud and Theology.” Journal of Religion and Health 12, no. 2 (1973).
Morgan, Mary S.; W. Peter Howelett (eds). How Well Do Facts Travel? Cambridge: Cambridge
University Press, 2011. Morgan, Mary S. “Is Data Mining a Methodological Problem,” Symposium introduction with Roger
E. Backhouse in Journal of Economic Methodology 7, no. 2 (2000): 171-82. _________. “Economic Man as Model Man: Ideal Types, Idealization and Caricatures” in Journal of
the History of Economic Thought 28, no. 1 (2006): 1-27. _________. “The Curious Case of the Prisoner’s Dilemma: Model Situation? Exemplary Narrative?”
in A. Creager; Norton Wise; E. Lunbeck (eds.). Science Without Laws: Model Systems, Cases, Exemplary Narratives. Durham: Duke University Press, 2007.
_________. The World in the Model: How Economists Work and Think (Cambridge: Cambridge University
Press, 2012 _________. “Experiencing Life Through Modelling” in Perspectives on Science 21, no. 2 (2013): 245-
249.

286
Müller-Wille, Steffan; Isabelle Charmantier. “Natural history and information overload: The case of Linneaus” in Studies in History and Philosophy of Biological and Biomedical Sciences 43, no. 1 (2012): 4-15.
Muniesa, Fabian. The Provoked Economy: Economic Reality and the Performative Turn. London: Routledge,
2014. Murawski, Roman. The Philosophy of Mathematics and Logic in the 1920s and 1930s in Poland. Heidelberg:
Spring Basel, 2014. Murphy, Michelle. Sick Building Syndrome and the Problem of Uncertainty: Environemntal Politics, Technoscience
and Women Workers. Durham and London: Duke University Press, 2006. _________. The Economization of Life. Durham and London: Duke University Press, 2017. Nakamura, Lisa. “Indigenous Circuits: Navajo Women and the Racialization of Early Electronic
Manufacture” in American Quarterly 66, no. 4 (2014): 919-941. Needham, Andrew. Power Lines: Phoenix and the Making of the Modern Southwest. New Jersey: Princeton
University Press, 2014. Neff, Gina. Venture Labor: Work and the Burden of Risk in Innovative Industries. Cambridge: MIT Press,
2012. Noble, David F. America by Design: Science, Technology, and the Rise of Corporate Capitalism. Oxford:
Oxford University Press, 1979. Noble, Safia Umoja. Algorithms of Oppression: How Search Engines Reinforce Racism. New York: NYU
Press, 2018. Norris, Jim. “Bargaining for Beets: Migrants and Growers in the Red River Valley” in Minnesota
History 58, no. 4 (2002/2003): 199. O’Neill, Colleen. Working the Navajo Way: Labor and Culture in the Twentieth Century. University Press of
Kansas, 2005. Parker, Wendy. “Whose Probabilities? Predicting Climate Change with Ensembles of Models”
Philosophy of Science 77 (2010): 985-997. Pasquale, Frank. The Black Box Society; The Secret Algorithms That Control Money and Information.
Cambridge: Harvard University Press, 2015. Philip, Kavita. Civilizing Natures: Race, Resources, and Modernity in Colonial South India. Rutgers University
Press, 2003. Phillips, Christopher. The New Math: A Political History. University of Chicago Press, 2015. _________. “Knowing By Number: Learning Math for Thinking Well” in Endeavour 41/1 (2017): 8-
11. Porter, Theodore. Trust in Numbers: The Pursuit of Objectivity in Science and Public Life. Princeton:
Princeton University Press, 1996.

287
_________. Karl Pearson: The Scientific Life in a Statistical Age. Princeton: Princeton University Press,
2006. _________. “Funny Numbers” in Culture Unbound (online journal), 4 (2012): 585-598.
_________. Genetics in the Madhouse: The Unknown History of Human Heredity. Princeton: Princeton
University Press, 2018. Reid, Constance. Neyman—from life. New York: Springer-Verlag, 1982. Reisch, George A. How the Cold War Transformed Philosophy of Science: To the Icy Slopes of Logic.
Cambridge: Cambridge University Press, 2005. Roitman, Janet. Anti-Crisis. Durham: Duke University Press, 2014. Rosenberg, Daniel. “Early Modern Information Overload” in Journal of the History of Ideas 64, no.
1(2003): 1-9. Rosenberg, Daniel. “Data Before the Fact,” in “Raw Data” Is an Oxymoron. ed. Lisa Gitelman
Cambridge: MIT Press, 2013. Rosenthal, Caitlin. Accounting for Slavery: Masters and Management. Cambridge: Harvard University Press,
2018. Rowe, David. “Anxiety and Abstraction in Nineteenth-Century Mathematics” in Science in Context 17,
no. ½ (2004): 23-47. Rutkowski, Jan. “Les Centres D'études D'histoire économique En Pologne” in Annales D'histoire
économique Et Sociale 4, no. 13 (1932): 59-64. Sahlin, Nils-Eric; Annika Wallin; Johannes Persson. “Decision Science: From Ramsey to Dual
Process Theories” in Synthese 172, no. 1 (2010): 129-143. Schröter, Jens. “Performing the Economy, Digital Media and Crisis. A critique of Michel Callon” in
eds. Martina Leeker, Imanuel Shipper, Timon Bayes. Performing the Digital: Performance Studies and Performances in Digital Cultures. Transcript Verlag, 2017.
Seaver, Nick. “Knowing Algorithms” in Media in Transition 8, 2013. Shields, Brittney Anne. A Mathematical Life: Richard Courant, New York University and Scientific Diplomacy
in Twentieth Century America. PhD diss. Pennsylvania University, 2015. Simpson, Leanne Betasamosake. As We Have Always Done: Indigenous Freedom through Radical Resistance.
Minnesota University Press, 2017.
Slayton, Rebecca. “Measuring Risk: Computer Security Metrics, Automation, and Learning” in IEEE Annals of the History of Computing 37, no. 2 (2015): 32-45.
Stapleford, Thomas. The Cost of Living in America: A Political History of Economic Statistics, 1880-2000.
Cambridge University Press, 2009.

288
Steffen, Katrin. “Experts and the Modernization of the Nation: The Arena of Public Health in Poland in the First Half of the Twentieth Century.” Jahrbücher Für Geschichte Osteuropas, Neue Folge, 61, no. 4 (2013): 574-90.
Steingart, Alma. Conditional Inequalities: American Pure and Applied Mathematics, 1940-1975. PhD diss.
MIT, 2013. Streeter, Carrie. Self-Expression and Health: Mind-Body Medicine in the Era of the New Woman. PhD diss.
University of California, San Diego. 2020. Striphas, Ted. “Algorithmic Culture” in European Journal of Cultural Studies 18, no.4-5 (2015): 395-412.
Supran, Geoffrey; Naomi Oreskes. “Assessing ExxonMobil’s Climate Change Communications
(1977-2014)” in Environmental Research Letters 12 (2017): 1-17. TallBear, Kim. “Beyond the Life/Not Life Binary: A Feminist-Indigenous Reading of
Cryopreservation, Interspecies Thinking and the New Materialisms” in Cryopolitics: Frozen Life in a Melting World, eds. Joanna Radin and Emma Kowal. Cambridge: MIT Press, 2017.
_________. “The Emergence, Politics, and Marketplace of Native American DNA” in The
Routledge Handbook of Science, Technology, and Society, eds. Daniel Lee Kleinman and Kelly Moore. London: Routledge, 2014: 21-37.
Shelton, Anita. “Franciszek Bujak (1875–1953)” in Nation and History: Polish Historians from the
Enlightenment to the Second World War, ed. Peter Brock. Toronto: University of Toronto Press, 2006.
Smith, Mickey C. A Social History of the Minor Tranquilizers: The Quest for Small Comfort in the Age of
Anxiety. New York/London: Pharmaceutical Products Press, 1991. Star, Susan. “Scientific Work and Uncertainty.” Social Studies of Science 15, no. 3 (1985): 391-427. Thomas, William. Rational Action: The Sciences of Policy in Britain and America, 1940-1960. Cambridge:
MIT Press, 2016. Thorpe, Charles. Necroculture. New York, NY: Palgrave Macmillan, 2016. Tone, Andrea. The Age of Anxiety: A History of America’s Turbulent Affair with Tranquilizers. New York:
Basic Books, 2009. Uncertain Commons, Speculate This! (Durham and London: Duke University Press, 2013) Valdes, Dennis Dodin. Al Norte: Agricultural Workers in the Great Lakes Region, 1917-1970. Austin,
University of Texas Press, 1991. Vargas, Zaragosa. “Life and Community in the “Wonderful City of the Magic Motor”: Mexican
Immigrants in 1920s Detroit.” Michigan Historical Review, 15, no. 1 (1989): 45-68. Voyles, Traci Brynne. Wastelanding: Legacies of Uranium Mining in Navajo Country. Minneapolis:
University of Minnesota Press, 2013.

289
Wang, Jessica. American Science in an Age of Anxiety: Scientists, Anticommunism, and the Cold War. Chapel Hill/London: University of North Carolina Press, 1999.
Weisiger, Marsha. “Gendered Injustice: Navajo Livestock Reduction in the New Deal Era,” Western
Historical Quarterly 38, no. 4 (2007). _________. Dreaming of Sheep in Navajo County. Seattle: University of Washington Press, 2009. Wernimont, Jacqueline. Life and Death in Quantum Media. Cambridge: MIT Press, 2018. Williams, Jack. The AMS Weather Book. Chicago: Chicago University Press, 2009. Woleński, Jan. Logic and Philosophy in the Lvov-Warsaw School. The Netherlands: Kluwer Academic
Publishers, 1989. Worster, Donald. Rivers of Empire: Water, Aridity, and Growth of the American West. New York: Pantheon
Books, 1985. Yost, Jeffrey (ed.) The IBM Century: Creating the IT Revolution. New Jersey: IEEE, 2011. Yudell, Michael and J. Craig Venter. Race Unmasked: Biology and Race in the Twentieth Century. New York:
Columbia University Press, 2014. Zachariah, Benjamin. “Uses of Scientific Argument: The Case of ‘Development’ in India, c. 1930-
1950” in Economic and Political Weekly 36, no. 39 (2001): 3689-3702.