united states securities and exchange commission - Yum ...
56
UNITED STATES SECURITIES AND EXCHANGE COMMISSION Washington, D. C. 20549 FORM 10-Q (Mark One) ☒ QUARTERLY REPORT PURSUANT TO SECTION 13 OR 15(d) OF THE SECURITIES EXCHANGE ACT OF 1934 For the quarterly period ended June 30, 2019 OR ☐ TRANSITION REPORT PURSUANT TO SECTION 13 OR 15(d) OF THE SECURITIES EXCHANGE ACT OF 1934 For the transition period from ____________ to _________________ Commission file number 001-37762 Yum China Holdings, Inc. (Exact Name of Registrant as Specified in Its Charter) Delaware 81-2421743 (State or Other Jurisdiction of (I.R.S. Employer Incorporation or Organization) Identification No.) 7100 Corporate Drive Plano, Texas 75024 United States of America Yum China Building 20 Tian Yao Qiao Road Shanghai 200030 People’s Republic of China (Address, Including Zip Code, of Principal Executive Offices) (469) 980-2898 (Registrant’s Telephone Number, Including Area Code) Not Applicable (Former Name, Former Address and Former Fiscal Year, if Changed Since Last Report) Securities registered pursuant to Section 12(b) of the Act: Title of each class Trading Symbol(s) Name of each exchange on which registered Common Stock, par value $0.01 per share YUMC New York Stock Exchange Indicate by check mark whether the registrant (1) has filed all reports required to be filed by Section 13 or 15(d) of the Securities Exchange Act of 1934 during the preceding 12 months (or for such shorter period that the registrant was required to file such reports), and (2) has been subject to such filing requirements for the past 90 days. Yes ☒ No ☐ Indicate by check mark whether the registrant has submitted electronically every Interactive Data File required to be submitted pursuant to Rule 405 of Regulation S- T (§232.405 of this chapter) during the preceding 12 months (or for such shorter period that the registrant was required to submit such files). Yes ☒ No ☐ Indicate by check mark whether the registrant is a large accelerated filer, an accelerated filer, a non-accelerated filer, smaller reporting company, or an emerging growth company. See the definitions of “large accelerated filer,” “accelerated filer,” “smaller reporting company,” and “emerging growth company” in Rule 12b-2 of the Exchange Act. Large accelerated filer ☒ Accelerated filer ☐ Non-accelerated filer ☐ Smaller reporting company ☐ Emerging growth company ☐ If an emerging growth company, indicate by check mark if the registrant has elected not to use the extended transition period for complying with any new or revised financial accounting standards provided pursuant to Section 13(a) of the Exchange Act. ☐ Indicate by check mark whether the registrant is a shell company (as defined in Rule 12b-2 of the Exchange Act). Yes ☐ No ☒ The number of shares outstanding of the registrant’s common stock as of July 30, 2019 was 376,828,755 shares.
-
Upload
khangminh22 -
Category
Documents
-
view
1 -
download
0
Transcript of united states securities and exchange commission - Yum ...

UNITED STATESSECURITIES AND EXCHANGE COMMISSION
Washington, D. C. 20549
FORM 10-Q
(Mark One)☒ QUARTERLY REPORT PURSUANT TO SECTION 13 OR 15(d) OF THE SECURITIES EXCHANGE ACT OF 1934
For the quarterly period ended June 30, 2019
OR
☐ TRANSITION REPORT PURSUANT TO SECTION 13 OR 15(d) OF THE SECURITIES EXCHANGE ACT OF 1934
For the transition period from ____________ to _________________
Commission file number 001-37762
Yum China Holdings, Inc.(Exact Name of Registrant as Specified in Its Charter)
Delaware 81-2421743(State or Other Jurisdiction of (I.R.S. EmployerIncorporation or Organization) Identification No.)
7100 Corporate DrivePlano, Texas 75024
United States of America
Yum China Building20 Tian Yao Qiao Road
Shanghai 200030People’s Republic of China
(Address, Including Zip Code, of Principal Executive Offices)
(469) 980-2898(Registrant’s Telephone Number, Including Area Code)
Not Applicable(Former Name, Former Address and Former Fiscal Year, if Changed Since Last Report)
Securities registered pursuant to Section 12(b) of the Act:
Title of each classTrading
Symbol(s) Name of each exchange on which registeredCommon Stock, par value $0.01 per share YUMC New York Stock Exchange
Indicate by check mark whether the registrant (1) has filed all reports required to be filed by Section 13 or 15(d) of the Securities Exchange Act of 1934 during thepreceding 12 months (or for such shorter period that the registrant was required to file such reports), and (2) has been subject to such filing requirements for the past 90days. Yes ☒ No ☐
Indicate by check mark whether the registrant has submitted electronically every Interactive Data File required to be submitted pursuant to Rule 405 of Regulation S-T (§232.405 of this chapter) during the preceding 12 months (or for such shorter period that the registrant was required to submit such files). Yes ☒ No ☐
Indicate by check mark whether the registrant is a large accelerated filer, an accelerated filer, a non-accelerated filer, smaller reporting company, or an emerginggrowth company. See the definitions of “large accelerated filer,” “accelerated filer,” “smaller reporting company,” and “emerging growth company” in Rule 12b-2 of theExchange Act.
Large accelerated filer ☒ Accelerated filer ☐Non-accelerated filer ☐ Smaller reporting company ☐ Emerging growth company ☐
If an emerging growth company, indicate by check mark if the registrant has elected not to use the extended transition period for complying with any new or revisedfinancial accounting standards provided pursuant to Section 13(a) of the Exchange Act. ☐
Indicate by check mark whether the registrant is a shell company (as defined in Rule 12b-2 of the Exchange Act). Yes ☐ No ☒
The number of shares outstanding of the registrant’s common stock as of July 30, 2019 was 376,828,755 shares.

Yum China Holdings, Inc.
INDEX Page No. Part I. Financial Information Item 1 – Financial Statements 3 Condensed Consolidated Statements of Income – Quarters and Years to Date Ended June 30, 2019 and 2018 3 Condensed Consolidated Statements of Comprehensive Income – Quarters and Years to Date Ended June 30, 2019 and 2018 4 Condensed Consolidated Statements of Cash Flows – Years to Date Ended June 30, 2019 and 2018 5 Condensed Consolidated Balance Sheets – June 30, 2019 and December 31, 2018 6 Notes to Condensed Consolidated Financial Statements 7 Item 2 – Management’s Discussion and Analysis of Financial Condition and Results of Operations 31 Item 3 – Quantitative and Qualitative Disclosures about Market Risk 49 Item 4 – Controls and Procedures 49 Part II. Other Information Item 1 – Legal Proceedings 50 Item 1A – Risk Factors 50 Item 2 – Unregistered Sales of Equity Securities and Use of Proceeds 50 Item 6 – Exhibits 51 Signatures 52
2
PART I – FINANCIAL INFORMATION
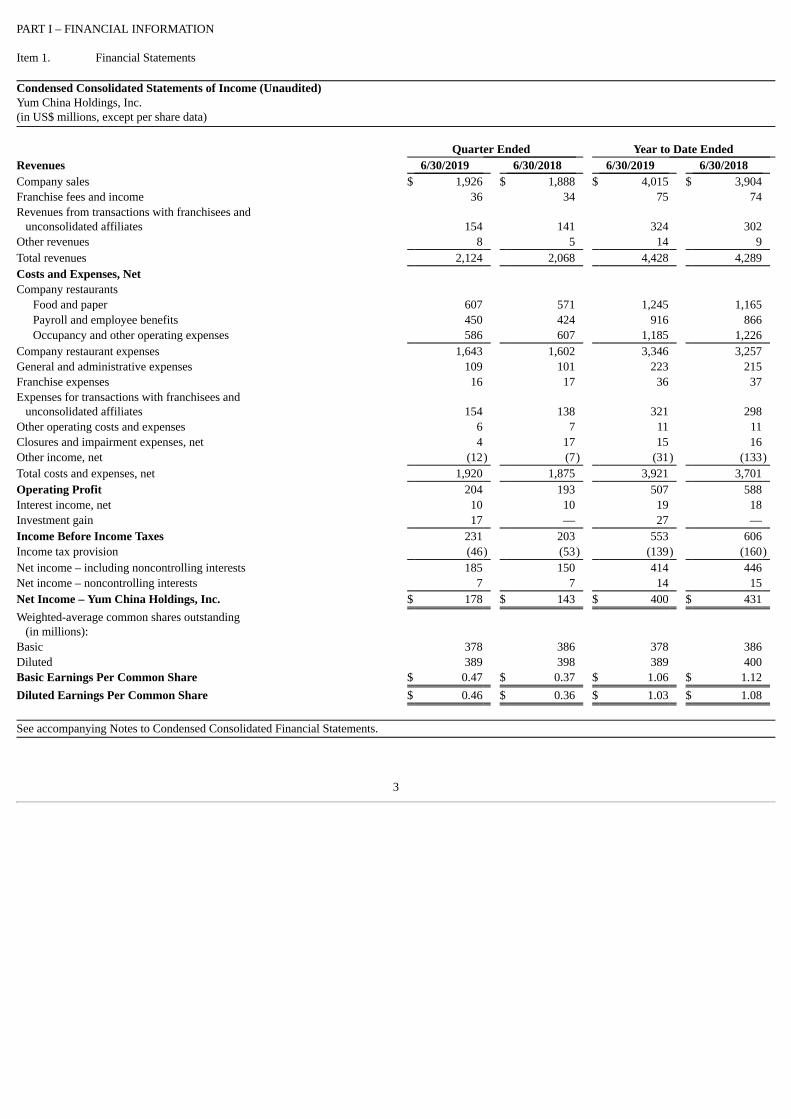
Item 1. Financial Statements Condensed Consolidated Statements of Income (Unaudited)Yum China Holdings, Inc.(in US$ millions, except per share data)
Quarter Ended Year to Date EndedRevenues 6/30/2019 6/30/2018 6/30/2019 6/30/2018 Company sales $ 1,926 $ 1,888 $ 4,015 $ 3,904 Franchise fees and income 36 34 75 74 Revenues from transactions with franchisees and unconsolidated affiliates 154 141 324 302 Other revenues 8 5 14 9 Total revenues 2,124 2,068 4,428 4,289 Costs and Expenses, Net Company restaurants
Food and paper 607 571 1,245 1,165 Payroll and employee benefits 450 424 916 866 Occupancy and other operating expenses 586 607 1,185 1,226
Company restaurant expenses 1,643 1,602 3,346 3,257 General and administrative expenses 109 101 223 215 Franchise expenses 16 17 36 37 Expenses for transactions with franchisees and unconsolidated affiliates 154 138 321 298 Other operating costs and expenses 6 7 11 11 Closures and impairment expenses, net 4 17 15 16 Other income, net (12) (7) (31) (133) Total costs and expenses, net 1,920 1,875 3,921 3,701 Operating Profit 204 193 507 588 Interest income, net 10 10 19 18 Investment gain 17 — 27 — Income Before Income Taxes 231 203 553 606 Income tax provision (46) (53) (139) (160) Net income – including noncontrolling interests 185 150 414 446 Net income – noncontrolling interests 7 7 14 15 Net Income – Yum China Holdings, Inc. $ 178 $ 143 $ 400 $ 431 Weighted-average common shares outstanding (in millions): Basic 378 386 378 386 Diluted 389 398 389 400 Basic Earnings Per Common Share $ 0.47 $ 0.37 $ 1.06 $ 1.12 Diluted Earnings Per Common Share $ 0.46 $ 0.36 $ 1.03 $ 1.08
See accompanying Notes to Condensed Consolidated Financial Statements.
3

Condensed Consolidated Statements of Comprehensive Income (Unaudited)Yum China Holdings, Inc.(in US$ millions)
Quarter Ended Year to Date Ended 6/30/2019 6/30/2018 6/30/2019 6/30/2018
Net income - including noncontrolling interests $ 185 $ 150 $ 414 $ 446 Other comprehensive income, net of tax of nil: Foreign currency translation adjustments (58) (148) 1 (58) Comprehensive income - including noncontrolling interests 127 2 415 388 Comprehensive income - noncontrolling interests 5 2 15 13 Comprehensive Income - Yum China Holdings, Inc. $ 122 $ — $ 400 $ 375
See accompanying Notes to Condensed Consolidated Financial Statements.
4

Condensed Consolidated Statements of Cash Flows (Unaudited)Yum China Holdings, Inc.(in US$ millions)
Year to Date Ended 6/30/2019 6/30/2018
Cash Flows – Operating Activities Net income – including noncontrolling interests $ 414 $ 446 Depreciation and amortization 217 235 Amortization of operating lease right-of-use assets 167 — Closures and impairment expenses 15 16 Gain from re-measurement of equity interest upon acquisition — (98)Investment gain (27) — Equity income from investments in unconsolidated affiliates (37) (35)Distributions of income received from unconsolidated affiliates 38 41 Deferred income taxes 6 42 Share-based compensation expense 15 13 Changes in accounts receivable (5) (2)Changes in inventories (1) 18 Changes in prepaid expenses and other current assets — (28)Changes in accounts payable and other current liabilities 70 182 Changes in income taxes payable 3 20 Changes in non-current operating lease liabilities (188) — Other, net (30) (31)Net Cash Provided by Operating Activities 657 819 Cash Flows – Investing Activities Capital spending (212) (230)Purchases of short-term investments (409) (370)Maturities of short-term investments 248 295 Acquisition of business, net of cash acquired — (88)Other, net 5 (13)Net Cash Used in Investing Activities (368) (406)Cash Flows – Financing Activities Repayment of short-term borrowings assumed from acquisition — (10)Repurchase of shares of common stock (143) (70)Cash dividends paid on common stock (91) (77)Dividends paid to noncontrolling interests (25) (27)Other, net — (2)Net Cash Used in Financing Activities (259) (186)Effect of Exchange Rates on Cash and Cash Equivalents — (25)Net Increase in Cash and Cash Equivalents 30 202 Cash and Cash Equivalents - Beginning of Period 1,266 1,059 Cash and Cash Equivalents - End of Period $ 1,296 $ 1,261 Supplemental Cash Flow Data
Cash paid for income tax 135 114
See accompanying Notes to Condensed Consolidated Financial Statements.
5
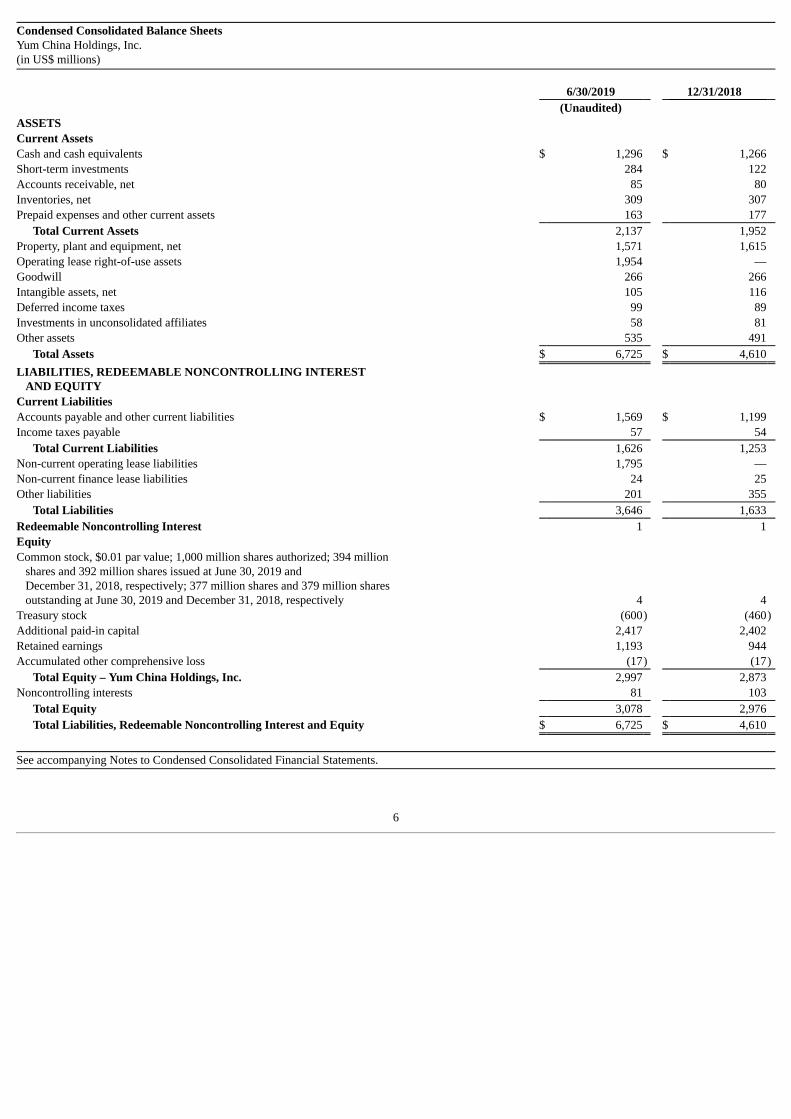
Condensed Consolidated Balance SheetsYum China Holdings, Inc.(in US$ millions)
6/30/2019 12/31/2018 (Unaudited)
ASSETS Current Assets Cash and cash equivalents $ 1,296 $ 1,266 Short-term investments 284 122 Accounts receivable, net 85 80 Inventories, net 309 307 Prepaid expenses and other current assets 163 177
Total Current Assets 2,137 1,952 Property, plant and equipment, net 1,571 1,615 Operating lease right-of-use assets 1,954 — Goodwill 266 266 Intangible assets, net 105 116 Deferred income taxes 99 89 Investments in unconsolidated affiliates 58 81 Other assets 535 491
Total Assets $ 6,725 $ 4,610 LIABILITIES, REDEEMABLE NONCONTROLLING INTEREST AND EQUITY Current Liabilities Accounts payable and other current liabilities $ 1,569 $ 1,199 Income taxes payable 57 54
Total Current Liabilities 1,626 1,253 Non-current operating lease liabilities 1,795 — Non-current finance lease liabilities 24 25 Other liabilities 201 355
Total Liabilities 3,646 1,633 Redeemable Noncontrolling Interest 1 1 Equity Common stock, $0.01 par value; 1,000 million shares authorized; 394 million shares and 392 million shares issued at June 30, 2019 and December 31, 2018, respectively; 377 million shares and 379 million shares outstanding at June 30, 2019 and December 31, 2018, respectively 4 4 Treasury stock (600) (460)Additional paid-in capital 2,417 2,402 Retained earnings 1,193 944 Accumulated other comprehensive loss (17) (17)
Total Equity – Yum China Holdings, Inc. 2,997 2,873 Noncontrolling interests 81 103
Total Equity 3,078 2,976 Total Liabilities, Redeemable Noncontrolling Interest and Equity $ 6,725 $ 4,610
See accompanying Notes to Condensed Consolidated Financial Statements.
6

Notes to Condensed Consolidated Financial Statements (Unaudited)(Tabular amounts in US$ millions)
Note 1 – Description of the Business Yum China Holdings, Inc. (“Yum China” and, together with its subsidiaries, the “Company,” “we,” “us” and “our”) was incorporated in Delaware on April 1,2016. The Company separated from Yum! Brands, Inc. (“YUM” or the “Parent”) on October 31, 2016 (the “separation”), becoming an independent publiclytraded company as a result of a pro rata distribution (the “distribution”) of all outstanding shares of Yum China common stock to shareholders of YUM. OnOctober 31, 2016, YUM’s shareholders of record as of 5:00 p.m. Eastern Time on October 19, 2016 received one share of Yum China common stock forevery one share of YUM common stock held as of the record date. Yum China’s common stock began trading “regular way” under the ticker symbol“YUMC” on the New York Stock Exchange on November 1, 2016. The Company owns, franchises or has an ownership in entities that own and operate restaurants under the KFC, Pizza Hut, East Dawning, Little Sheep, TacoBell and COFFii & JOY concepts (collectively, the “Concepts”). In connection with the separation of the Company from YUM, Yum! Restaurants Asia Pte.Ltd., a wholly-owned indirect subsidiary of YUM, and Yum Restaurants Consulting (Shanghai) Company Limited (“YCCL”), a wholly-owned indirectsubsidiary of Yum China, entered into a 50-year master license agreement with automatic renewals for additional consecutive renewal terms of 50 years each,subject only to YCCL being in “good standing” and unless YCCL gives notice of its intent not to renew, for the exclusive right to use and sub-license the useof intellectual property owned by YUM and its subsidiaries for the development and operation of the KFC, Pizza Hut and, subject to achieving certain agreed-upon milestones, Taco Bell brands and their related marks and other intellectual property rights for restaurant services in the People’s Republic of China (the“PRC” or “China”), excluding Hong Kong, Taiwan and Macau. In exchange, we pay a license fee to YUM equal to 3% of net system sales from both ourCompany and franchise restaurants. We own the intellectual property of East Dawning, Little Sheep and COFFii & JOY and pay no license fee related to these Concepts. The Company also owns a controlling interest in the holding company of DAOJIA.com.cn (“Daojia”), an established online food delivery service provider inChina. In addition, the Company started a new e-commerce business in 2017, offering a wide selection of products including electronics, home and kitchenaccessories, and other general merchandise to customers directly through the Company’s e-commerce platform. Note 2 – Basis of Presentation Our preparation of the accompanying Condensed Consolidated Financial Statements in conformity with Generally Accepted Accounting Principles in theUnited States of America (“GAAP”) requires us to make estimates and assumptions that affect reported amounts of assets and liabilities, disclosure ofcontingent assets and liabilities at the date of the financial statements, and the reported amounts of revenues and expenses during the reporting period. Actualresults could differ from these estimates.
7

We have prepared the Condensed Consolidated Financial Statements in accordance with the rules and regulations of the Securities and Exchange Commission(the “SEC”) for interim financial information. Accordingly, they do not include all of the information and footnotes required by GAAP for complete financialstatements. The Condensed Consolidated Financial Statements include all normal and recurring adjustments considered necessary to present fairly ourfinancial position as of June 30, 2019, results of our operations and comprehensive income for the quarters and years to date ended June 30, 2019 and 2018,and cash flows for the years to date ended June 30, 2019 and 2018. Our results of operations, comprehensive income and cash flows for these interim periodsare not necessarily indicative of the results to be expected for the full year. These statements should be read in conjunction with the consolidated financialstatements and notes thereto defined and included in the Company’s Annual Report on Form 10-K as filed with the SEC on February 27, 2019. Through the acquisition of Daojia in 2017, the Company also acquired a variable interest entity (“VIE”) and subsidiaries of the VIE effectively controlled byDaojia. There exists a parent-subsidiary relationship between Daojia and its VIE as a result of certain exclusive agreements that require Daojia to consolidateits VIE and subsidiaries of the VIE because Daojia is the primary beneficiary that possesses the power to direct the activities of the VIE that mostsignificantly impact its economic performance and has the obligation to absorb substantially all of the profits and all of the expected losses of the VIE. Theacquired VIE and its subsidiaries were considered immaterial, both individually and in the aggregate. The results of Daojia’s operations have been included inthe Company’s Condensed Consolidated Financial Statements since the acquisition date. During the first quarter of 2018, the Company completed the acquisition of an additional 36% equity interest in an unconsolidated affiliate that operates KFCstores in Wuxi, China (“Wuxi KFC”), for cash consideration of approximately $98 million, increasing the Company’s equity interest to 83%, allowing theCompany to consolidate the entity. The acquisition was considered immaterial. We began consolidating Wuxi KFC upon the completion of acquisition. Recently Adopted Accounting Pronouncements In February 2016, the Financial Accounting Standards Board (“FASB”) issued Accounting Standards Update (“ASU”) No. 2016-02, Leases (Topic 842)(“ASU 2016-02” or “ASC 842”), which increases transparency and comparability among organizations by recognizing lease assets and lease liabilities on thebalance sheet and disclosing key information about leasing arrangements. The FASB subsequently issued amendments to clarify the implementationguidance. The Company adopted these standards on January 1, 2019, using a modified retrospective method for leases that exist at, or are entered into after,January 1, 2019, and has not recast the comparative periods presented in the Condensed Consolidated Financial Statements. Additionally, we elected thepackage of practical expedients that allowed us to not reassess: (1) whether any expired or existing contracts are or contain leases, (2) lease classification forany expired or existing leases and (3) initial direct costs for any expired or existing leases. We also elected the hindsight practical expedient to determine thereasonably certain lease term for existing leases. Upon the adoption of ASC 842, the Company recognized right-of-use (“ROU”) assets and lease liabilities of approximately $2.0 billion and $2.2 billion,respectively, for operating leases of the land and/or building of our restaurants and office spaces based on the present value of lease payments over the leaseterm. In addition, an impairment charge of $60 million (net of related impact on deferred taxes and noncontrolling interests) on ROU assets arising fromexisting operating leases as of January 1, 2019 was recorded as an adjustment to retained earnings, as the additional impairment charge would have beenrecorded before adoption had the operating lease ROU assets been recognized at the time of impairment.
8

The following table summarizes the effect on the Consolidated Balance Sheet as a result of adopting ASC 842.
December 31, 2018 Effect of adoption January 1, 2019 ASSETS Current Assets Cash and cash equivalents $ 1,266 $ 1,266 Short-term investments 122 122 Accounts receivable, net 80 80 Inventories, net 307 307 Prepaid expenses and other current assets 177 (39) (a) 138
Total Current Assets 1,952 (39) 1,913 Property, plant and equipment, net 1,615 (1) 1,614 Operating lease right-of-use assets — 1,997 (b) 1,997 Goodwill 266 266 Intangible assets, net 116 (2) (c) 114 Deferred income taxes 89 19 (d) 108 Investments in unconsolidated affiliates 81 (1) 80 Other assets 491 (4) (c) 487
Total Assets $ 4,610 $ 1,969 $ 6,579 LIABILITIES, REDEEMABLE NONCONTROLLING INTEREST AND EQUITY
Current Liabilities Accounts payable and other current liabilities $ 1,199 $ 320 (e) $ 1,519 Income taxes payable 54 54
Total Current Liabilities 1,253 320 1,573 Non-current operating lease liabilities — 1,860 (f) 1,860 Non-current finance lease liabilities 25 — 25 Other liabilities 355 (148) (g) 207
Total Liabilities 1,633 2,032 3,665 Redeemable Noncontrolling Interest 1 1 Equity Common stock 4 4 Treasury stock (460) (460) Additional paid-in capital 2,402 2,402 Retained earnings 944 (60) (h) 884 Accumulated other comprehensive loss (17) (17)
Total Equity – Yum China Holdings, Inc. 2,873 (60) 2,813 Noncontrolling interests 103 (3) (i) 100
Total Equity 2,976 (63) 2,913 Total Liabilities, Redeemable Noncontrolling Interest and Equity $ 4,610 $ 1,969
$ 6,579
(a) Represents the current portion of prepaid rent reclassified to operating lease ROU assets. (b) Represents the net result of capitalization of operating lease payments and reclassification of prepaid rent, initial direct cost, deferred rent accrual and
lease incentives, and offset by impairment of operating lease ROU assets that existed prior to the date of adoption. (c) Represents initial direct cost, favorable lease and non-current prepaid rent reclassified to operating lease ROU assets.
9
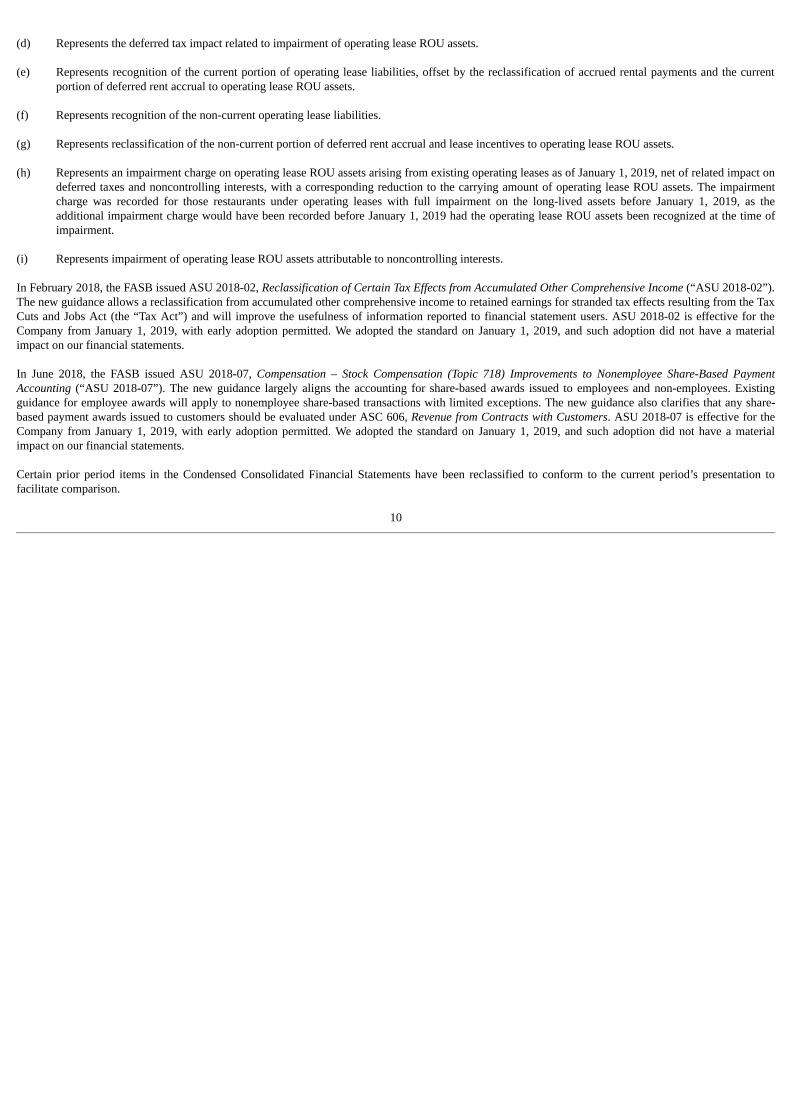
(d) Represents the deferred tax impact related to impairment of operating lease ROU assets. (e) Represents recognition of the current portion of operating lease liabilities, offset by the reclassification of accrued rental payments and the current
portion of deferred rent accrual to operating lease ROU assets. (f) Represents recognition of the non-current operating lease liabilities. (g) Represents reclassification of the non-current portion of deferred rent accrual and lease incentives to operating lease ROU assets. (h) Represents an impairment charge on operating lease ROU assets arising from existing operating leases as of January 1, 2019, net of related impact on
deferred taxes and noncontrolling interests, with a corresponding reduction to the carrying amount of operating lease ROU assets. The impairmentcharge was recorded for those restaurants under operating leases with full impairment on the long-lived assets before January 1, 2019, as theadditional impairment charge would have been recorded before January 1, 2019 had the operating lease ROU assets been recognized at the time ofimpairment.
(i) Represents impairment of operating lease ROU assets attributable to noncontrolling interests. In February 2018, the FASB issued ASU 2018-02, Reclassification of Certain Tax Effects from Accumulated Other Comprehensive Income (“ASU 2018-02”).The new guidance allows a reclassification from accumulated other comprehensive income to retained earnings for stranded tax effects resulting from the TaxCuts and Jobs Act (the “Tax Act”) and will improve the usefulness of information reported to financial statement users. ASU 2018-02 is effective for theCompany from January 1, 2019, with early adoption permitted. We adopted the standard on January 1, 2019, and such adoption did not have a materialimpact on our financial statements. In June 2018, the FASB issued ASU 2018-07, Compensation – Stock Compensation (Topic 718) Improvements to Nonemployee Share-Based PaymentAccounting (“ASU 2018-07”). The new guidance largely aligns the accounting for share-based awards issued to employees and non-employees. Existingguidance for employee awards will apply to nonemployee share-based transactions with limited exceptions. The new guidance also clarifies that any share-based payment awards issued to customers should be evaluated under ASC 606, Revenue from Contracts with Customers. ASU 2018-07 is effective for theCompany from January 1, 2019, with early adoption permitted. We adopted the standard on January 1, 2019, and such adoption did not have a materialimpact on our financial statements. Certain prior period items in the Condensed Consolidated Financial Statements have been reclassified to conform to the current period’s presentation tofacilitate comparison.
10

Note 3 – Revenue Recognition The Company’s revenues primarily include Company sales, Franchise fees and income and Revenues from transactions with franchisees and unconsolidatedaffiliates. Company Sales Revenues from Company-owned restaurants are recognized when a customer takes possession of the food and tenders payment, which is when our obligationto perform is satisfied. The Company presents sales net of sales-related taxes. We also offer our customers delivery through both our own mobile applicationsand third-party aggregators’ platforms. For delivery orders placed through our mobile applications, we use our dedicated riders, while for orders placedthrough third-party aggregators’ platforms, we use our dedicated riders, or, in limited cases, third-party aggregators’ delivery staff. With respect to deliveryorders delivered by our dedicated riders, we control and determine the price for the delivery service and generally recognize revenue, including delivery fees,when a customer takes possession of the food. When orders are fulfilled by the delivery staff of third-party aggregators, who control and determine the pricefor the delivery service, we recognize revenue, excluding delivery fees, when control of the food is transferred to the third-party aggregators’ delivery staff.The payment terms with respect to these sales are short-term in nature. We recognize revenues from prepaid stored-value products, including gift cards and product vouchers, when they are redeemed by the customer. Prepaid giftcards sold at any given point generally expire over the next 36 months, and product vouchers generally expire over a period up to 12 months. We recognizebreakage revenue, which is the amount of prepaid stored-value products that is not expected to be redeemed, either (1) proportionally in earnings asredemptions occur, in situations where the Company expects to be entitled to a breakage amount, or (2) when the likelihood of redemption is remote, insituations where the Company does not expect to be entitled to breakage, provided that there is no requirement for remitting balances to government agenciesunder unclaimed property laws. The Company reviews its breakage estimates at least annually based upon the latest available information regardingredemption and expiration patterns. Our privilege membership program offers privilege members benefits, such as free delivery and discounts on coffee or breakfast items. The associatedmembership fees are recognized ratably over the membership period. Franchise Fees and Income Franchise fees and income primarily include upfront fees, such as initial fees and renewal fees, and continuing fees. We have determined that the services weprovide in exchange for upfront fees and continuing fees are highly interrelated with the franchise right. We recognize upfront fees received from a franchiseeas revenue over the term of the franchise agreement or the renewal agreement because the franchise rights are accounted for as rights to access our symbolicintellectual property in accordance with ASC 606. The franchise agreement term is generally 10 years for KFC and Pizza Hut, and five or 10 years for LittleSheep. We recognize continuing fees, which are based upon a percentage of franchisee sales, as those sales occur. Revenues from Transactions with Franchisees and Unconsolidated Affiliates Revenues from transactions with franchisees and unconsolidated affiliates consist primarily of sales of food and paper products, advertising services and otherservices provided to franchisees and unconsolidated affiliates.
11

The Company centrally purchases substantially all food and paper products from suppliers for substantially all of our restaurants, including franchisees andunconsolidated affiliates, and then sells and delivers them to the restaurants. The performance obligation arising from such transactions is considered distinctfrom the franchise agreement as it is not highly dependent on the franchise agreement and the customer can benefit from the procurement service on its own.We consider ourselves the principal in this arrangement as we have the ability to control a promised good or service before transferring that good or service tothe franchisees and unconsolidated affiliates. Revenue is recognized upon transfer of control over ordered items, generally upon delivery to the franchiseesand unconsolidated affiliates. For advertising services, the Company often engages third parties to provide services and acts as a principal in the transaction based on our responsibilities ofdefining the nature of the services and administering and directing all marketing and advertising programs in accordance with the provisions of our franchiseagreements. The Company collects advertising contributions, which are generally based on a certain percentage of sales from substantially all of ourrestaurants, including franchisees and unconsolidated affiliates. Other services provided to franchisees and unconsolidated affiliates consist primarily ofcustomer support and technology support services. Advertising services and other services provided are highly interrelated to franchise right, and are notconsidered individually distinct. We recognize revenue when the related sales occur. Loyalty Programs Each of the Company’s KFC and Pizza Hut reportable segments operates a loyalty program that allows registered members to earn points for each qualifyingpurchase. Points, which generally expire 18 months after being earned, may be redeemed for future purchases of KFC or Pizza Hut branded products or otherproducts for free or at a discounted price. Points cannot be redeemed or exchanged for cash. The estimated value of points earned by the loyalty programmembers is recorded as a reduction of revenue at the time the points are earned, based on the percentage of points that are projected to be redeemed, with acorresponding deferred revenue liability included in Accounts payable and other current liabilities on the Condensed Consolidated Balance Sheets andsubsequently recognized into revenue when the points are redeemed or expire. The Company estimates the value of the future redemption obligations basedon the estimated value of the product for which points are expected to be redeemed and historical redemption patterns, including an estimate of the breakagefor points that members will never redeem. The Company reviews its breakage estimates periodically based upon the latest available information regardingredemption and expiration patterns. Disaggregation of Revenue The following table presents revenue disaggregated by types of arrangements and segments:
Quarter Ended 6/30/2019
Revenues KFC PizzaHut
All OtherSegments(a)
Corporate andUnallocated(a) Combined Elimination Consolidated
Company sales $ 1,410 $ 507 $ 9 $ — $ 1,926 $ — $ 1,926 Franchise fees and income 33 1 2 — 36 — 36 Revenues from transactions with franchisees and unconsolidated affiliates 15 1 5 133 154 — 154 Other revenues — 1 16 1 18 (10) 8 Total revenues $ 1,458 $ 510 $ 32 $ 134 $ 2,134 $ (10) $ 2,124
12
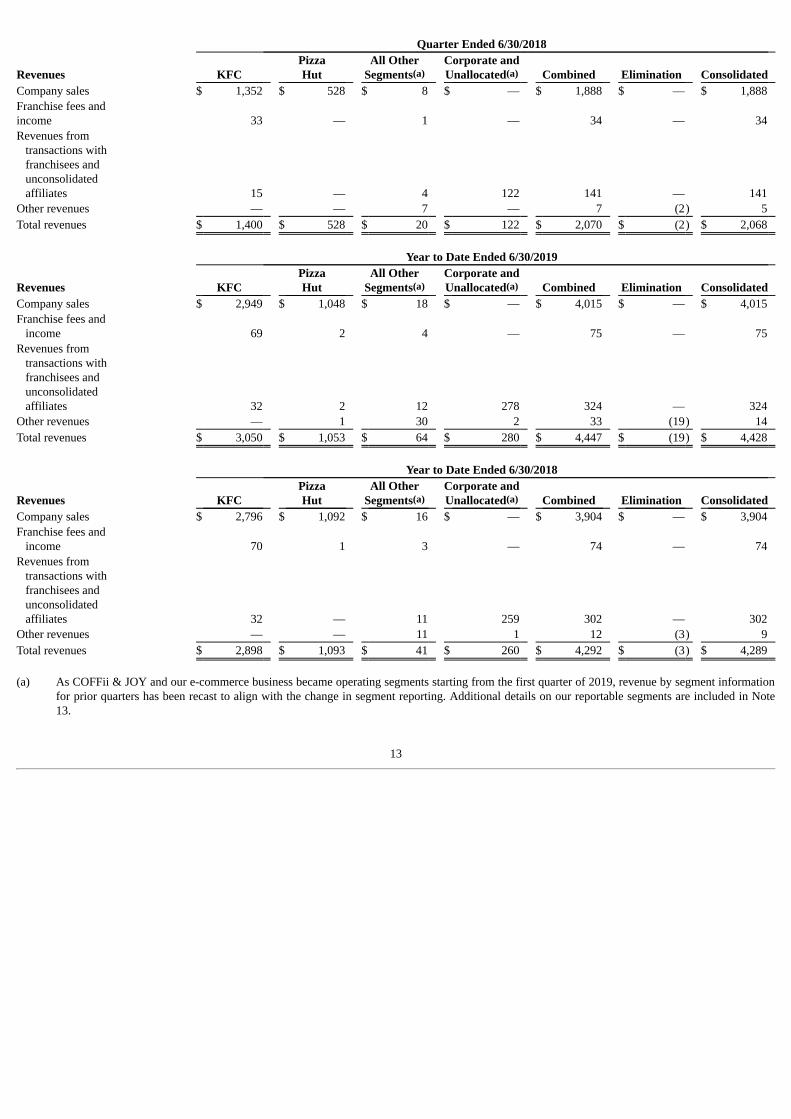
Quarter Ended 6/30/2018
Revenues KFC PizzaHut
All OtherSegments(a)
Corporate andUnallocated(a) Combined Elimination Consolidated
Company sales $ 1,352 $ 528 $ 8 $ — $ 1,888 $ — $ 1,888 Franchise fees andincome 33 — 1 — 34 — 34 Revenues from transactions with franchisees and unconsolidated affiliates 15 — 4 122 141 — 141 Other revenues — — 7 — 7 (2) 5 Total revenues $ 1,400 $ 528 $ 20 $ 122 $ 2,070 $ (2) $ 2,068
Year to Date Ended 6/30/2019
Revenues KFC PizzaHut
All OtherSegments(a)
Corporate andUnallocated(a) Combined Elimination Consolidated
Company sales $ 2,949 $ 1,048 $ 18 $ — $ 4,015 $ — $ 4,015 Franchise fees and income 69 2 4 — 75 — 75 Revenues from transactions with franchisees and unconsolidated affiliates 32 2 12 278 324 — 324 Other revenues — 1 30 2 33 (19) 14 Total revenues $ 3,050 $ 1,053 $ 64 $ 280 $ 4,447 $ (19) $ 4,428
Year to Date Ended 6/30/2018
Revenues KFC PizzaHut
All OtherSegments(a)
Corporate andUnallocated(a) Combined Elimination Consolidated
Company sales $ 2,796 $ 1,092 $ 16 $ — $ 3,904 $ — $ 3,904 Franchise fees and income 70 1 3 — 74 — 74 Revenues from transactions with franchisees and unconsolidated affiliates 32 — 11 259 302 — 302 Other revenues — — 11 1 12 (3) 9 Total revenues $ 2,898 $ 1,093 $ 41 $ 260 $ 4,292 $ (3) $ 4,289
(a) As COFFii & JOY and our e-commerce business became operating segments starting from the first quarter of 2019, revenue by segment information
for prior quarters has been recast to align with the change in segment reporting. Additional details on our reportable segments are included in Note13.
13

Accounts Receivable Accounts receivable mainly consist of trade receivables and royalties from franchisees and unconsolidated affiliates, and are generally due within 30 days ofthe period in which the corresponding sales occur and are classified as Accounts receivable on the Condensed Consolidated Balance Sheets. Our provision foruncollectible receivable balances is based upon pre-defined aging criteria or upon the occurrence of other events that indicate that we may not collect thebalance due. Additionally, we monitor the financial condition of our franchisees and record provisions for estimated losses on receivables when we believe itis probable that our franchisees will be unable to make their required payments. While we use the best information available in making our determination, theultimate recovery of recorded receivables is also dependent upon future economic events and other conditions that may be beyond our control. Tradereceivables that are ultimately deemed to be uncollectible, and for which collection efforts have been exhausted, are written off against the allowance fordoubtful accounts. Costs to Obtain Contracts Costs to obtain contracts consist of upfront license fees that we paid to YUM prior to the separation in relation to initial fees or renewal fees we received fromfranchisees and unconsolidated affiliates, as well as license fees that are payable to YUM in relation to our deferred revenue of prepaid stored-value productsand customer loyalty programs. They meet the requirements to be capitalized as they are incremental costs of obtaining contracts with customers and theCompany expects to generate future economic benefits from such costs incurred. Such costs to obtain contracts are included in Other assets on the CondensedConsolidated Balance Sheets and are amortized on a systematic basis that is consistent with the transfer to the customer of the goods or services to which theassets relate. Subsequent to the separation, we are no longer required to pay YUM initial or renewal fees that we receive from franchisees and unconsolidatedaffiliates. The Company did not incur any impairment losses related to costs to obtain contracts during any of the periods presented. Costs to obtain contractswere $9 million and $8 million at June 30, 2019 and December 31, 2018, respectively. Contract Liabilities Contract liabilities at June 30, 2019 and December 31, 2018 were as follows: Contract liabilities 6/30/2019 12/31/2018
- Deferred revenue related to prepaid stored-value products $ 80 $ 73 - Deferred revenue related to customer loyalty programs 22 17 - Deferred revenue related to upfront fees 37 37
Total $ 139 $ 127
Contract liabilities consist of deferred revenue related to prepaid stored-value products, customer loyalty programs and upfront fees. Deferred revenue relatedto prepaid stored-value products and customer loyalty programs is included in Accounts payable and other current liabilities on the Condensed ConsolidatedBalance Sheets. Deferred revenue related to upfront fees that we expect to recognize as revenue in the next 12 months is included in Accounts payable andother current liabilities, and the remaining balance is included in Other liabilities on the Condensed Consolidated Balance Sheets. Revenue recognized thatwas included in the contract liability balance at the beginning of each period amounted to $36 million and $18 million for the quarter ended June 30, 2019 and2018, respectively, and $48 million and $30 million for the years to date ended June 30, 2019 and 2018, respectively. Changes in contract liability balanceswere not materially impacted by business acquisition, change in estimate of transaction price or any other factors during any of the periods presented.
14

The Company has elected, as a practical expedient, not to disclose the value of remaining performance obligations associated with sales-based royaltypromised to franchisees in exchange for franchise right and other related services. The remaining duration of the performance obligation is the remainingcontractual term of each franchise agreement. We recognize continuing franchisee fees and revenues from advertising services and other services provided tofranchisees and unconsolidated affiliates based on a certain percentage of sales, as those sales occur. Note 4 – Earnings Per Common Share (“EPS”) The following table summarizes the components of basic and diluted EPS (in millions, except per share data):
Quarter Ended Year to Date Ended 6/30/2019 6/30/2018 6/30/2019 6/30/2018
Net Income – Yum China Holdings, Inc. $ 178 $ 143 $ 400 $ 431 Weighted-average common shares outstanding (for basic calculation) (a) 378 386 378 386 Effect of dilutive share-based awards (a) 8 10 8 11 Effect of dilutive warrants (b) 3 2 3 3 Weighted-average common and dilutive potential common shares outstanding (for diluted calculation) 389 398 389 400 Basic Earnings Per Common Share $ 0.47 $ 0.37 $ 1.06 $ 1.12 Diluted Earnings Per Common Share $ 0.46 $ 0.36 $ 1.03 $ 1.08 Share-based awards excluded from the diluted EPS computation (c) 2 1 2 1
(a) As a result of the separation, shares of Yum China common stock were distributed to YUM’s shareholders of record as of October 19, 2016 and
included in the calculated weighted-average common shares outstanding. Holders of outstanding YUM equity awards generally received bothadjusted YUM awards and Yum China awards, or adjusted awards on shares of common stock of either YUM or Yum China in their entirety. Anysubsequent exercise of these awards, whether held by the Company’s employees or YUM’s employees, would increase the number of common sharesoutstanding. The outstanding equity awards are included in the computation of diluted EPS, if there is dilutive effect.
(b) Pursuant to the investment agreements dated September 1, 2016, Yum China issued to strategic investors two tranches of warrants on January 9,
2017, with each tranche initially providing the right to purchase 8,200,405 shares of Yum China common stock, at an exercise price of $31.40 and$39.25 per share, respectively, subject to customary anti-dilution adjustments. The warrants may be exercised at any time through October 31, 2021.The outstanding warrants are included in the computation of diluted EPS, if there is dilutive effect when the average market price of Yum Chinacommon stock for the period exceeds the exercise price of the warrants.
(c) These outstanding stock appreciation rights, restricted stock units and performance share units were not included in the computation of diluted EPS
because to do so would have been antidilutive for the quarters and years to date presented.
15

Note 5 – Equity Changes in Equity and Redeemable Noncontrolling Interest
Yum China Holdings, Inc. Accumulated Common Additional Other Redeemable Stock Paid-in Retained Comprehensive Treasury Stock Noncontrolling Total Noncontrolling Shares Amount Capital Earnings Income (Loss) Shares Amount Interests Equity Interest
Balance at March 31, 2019 394 $ 4 $ 2,408 $ 1,060 $ 39 (15) $ (525) $ 76 $ 3,062 $ 1 Net Income 178 7 185 Foreign currency translation adjustments (56) (2) (58) Comprehensive income 127 Cash dividends declared ($0.12 per common share) (45) (45) Repurchase of shares of common stock (2) (75) (75) Exercise and vesting of share-based awards — — — — Share-based compensation 9 9 Balance at June 30, 2019 394 $ 4 $ 2,417 $ 1,193 $ (17) (17) $ (600) $ 81 $ 3,078 $ 1 Balance at March 31, 2018 390 $ 4 $ 2,381 $ 646 $ 224 (4) $ (148) $ 91 $ 3,198 $ 5 Net Income 143 7 150 Foreign currency translation adjustments (143) (5) (148) Comprehensive income 2 Cash dividends declared ($0.1 per common share) (38) (38) Repurchase of shares of common stock (2) (73) (73) Exercise and vesting of share-based awards 1 — — — Share-based compensation 7 7 Balance at June 30, 2018 391 $ 4 $ 2,388 $ 751 $ 81 (6) $ (221) $ 93 $ 3,096 $ 5
16

Yum China Holdings, Inc. Accumulated Common Additional Other Redeemable Stock Paid-in Retained Comprehensive Treasury Stock Noncontrolling Total Noncontrolling Shares Amount Capital Earnings (Loss) Income Shares Amount Interests Equity Interest
Balance at December 31, 2018 392 $ 4 $ 2,402 $ 944 $ (17) (13) $ (460) $ 103 $ 2,976 $ 1 Net Income 400 14 414 Foreign currency translation adjustments — 1 1 Comprehensive income 415 Cash dividends declared ($0.24 per common share) (91) (91) Dividends declared (34) (34) Repurchase of shares of common stock (4) (140) (140) Exercise and vesting of share-based awards 2 — — — Share-based compensation 15 15 Cumulative effect of accounting change (60) (3) (63) Balance at June 30, 2019 394 $ 4 $ 2,417 $ 1,193 $ (17) (17) $ (600) $ 81 $ 3,078 $ 1 Balance at December 31, 2017 389 $ 4 $ 2,375 $ 397 $ 137 (4) $ (148) $ 77 $ 2,842 $ 5 Net Income 431 15 446 Foreign currency translation adjustments (56) (2) (58) Comprehensive income 388 Acquisition of business 36 36 Cash dividends declared ($0.2 per common share) (77) (77) Dividends declared (33) (33) Repurchase of shares of common stock (2) (73) (73) Exercise and vesting of share-based awards 2 — — — Share-based compensation 13 13 Balance at June 30, 2018 391 $ 4 $ 2,388 $ 751 $ 81 (6) $ (221) $ 93 $ 3,096 $ 5
Share Repurchase Program On February 7, 2017, we announced that our Board of Directors authorized a $300 million share repurchase program. On October 4, 2017, the Board ofDirectors increased Yum China’s existing share repurchase authorization from $300 million to an aggregate of $550 million. On October 30, 2018, the Boardof Directors further increased the share repurchase authorization to an aggregate of $1.4 billion. The Company repurchased 3.5 million and 1.9 million sharesof Yum China common stock at a total cost of $140 million and $73 million for the years to date ended June 30, 2019 and 2018, respectively. The total costincludes $2 million and $3 million to be settled subsequent to June 30, 2019 and 2018, respectively, for shares repurchased with trade dates prior to June 30,2019 and 2018, respectively. As of June 30, 2019, $820 million remained available for future share repurchases under the authorization.
17

Note 6 – Items Affecting Comparability of Net Income and Cash Flows Gain from Re-Measurement of Equity Interest Upon Acquisition In the first quarter of 2018, the Company completed the acquisition of Wuxi KFC. In connection with the acquisition, the Company also recognized a gain of$98 million from the re-measurement of our previously held 47% equity interest at fair value using discounted cash flow valuation approach andincorporating assumptions and estimates that were not observable in the market. Key assumptions used in estimating future cash flows included projectedrevenue growth and operating expenses, which were based on internal projections, historical performance of stores and the business environment, as well asthe selection of an appropriate discount rate based on weighted-average cost of capital and company-specific risk premium. The gain was not allocated to anysegment for performance reporting purposes. Meituan Dianping (“Meituan”) Investment In the third quarter of 2018, the Company subscribed for 8.4 million, or less than 1%, of the ordinary shares of Meituan, an e-commerce platform for servicesin China, for a total consideration of approximately $74 million, when it launched its initial public offering on the Hong Kong Stock Exchange in September2018. The Company accounted for the equity securities at fair value with subsequent fair value changes recorded in our Condensed Consolidated Statementsof Income. The fair value of the investment in Meituan is determined based on the closing market price for the shares at the end of each reporting period. Asof June 30, 2019, the fair value of the investment was $74 million. The unrealized gain of $17 million and $27 million was included in Investment gain in ourCondensed Consolidated Statements of Income during the quarter and year to date ended June 30, 2019, respectively. Restaurant-Level Impairment Charge We performed an additional impairment evaluation of long-lived assets of restaurants as a result of adopting ASC 842 and recorded an incremental restaurant-level impairment charge of $12 million in the first quarter of 2019. In the second quarter of 2019, we performed our semi-annual impairment evaluation andrecorded a $7 million restaurant-level impairment charge. The restaurant-level impairment charge recorded in the second quarter of 2018 was $13 million.See Note 11 for additional information. Transition Tax We completed the evaluation of the impact on our transition tax computation based on the final regulations that were released by the U.S. TreasuryDepartment and the Internal Revenue Service (“IRS”) and became effective in the first quarter of 2019, and recorded an additional amount of $8 million forthe transition tax accordingly. See Note 12 for additional information.
18
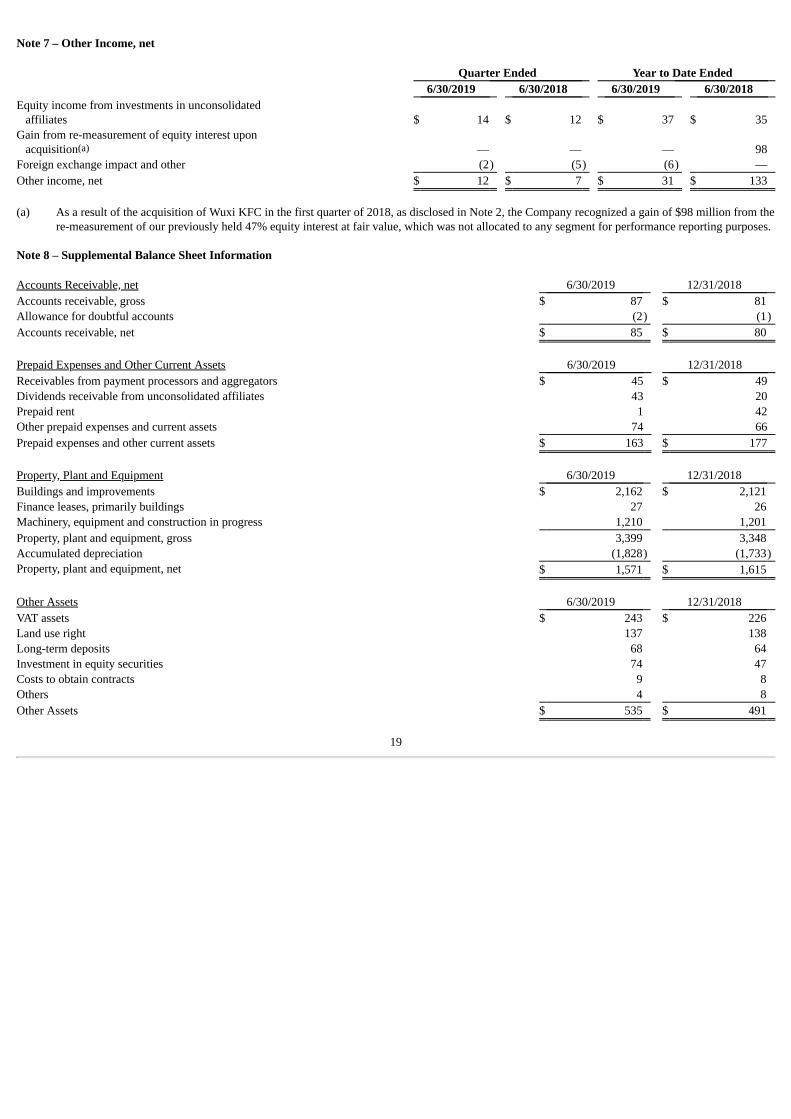
Note 7 – Other Income, net
Quarter Ended Year to Date Ended 6/30/2019 6/30/2018 6/30/2019 6/30/2018
Equity income from investments in unconsolidated affiliates $ 14 $ 12 $ 37 $ 35 Gain from re-measurement of equity interest upon acquisition(a) — — — 98 Foreign exchange impact and other (2) (5) (6) — Other income, net $ 12 $ 7 $ 31 $ 133
(a) As a result of the acquisition of Wuxi KFC in the first quarter of 2018, as disclosed in Note 2, the Company recognized a gain of $98 million from the
re-measurement of our previously held 47% equity interest at fair value, which was not allocated to any segment for performance reporting purposes. Note 8 – Supplemental Balance Sheet Information Accounts Receivable, net 6/30/2019 12/31/2018 Accounts receivable, gross $ 87 $ 81 Allowance for doubtful accounts (2) (1)Accounts receivable, net $ 85 $ 80
Prepaid Expenses and Other Current Assets 6/30/2019 12/31/2018 Receivables from payment processors and aggregators $ 45 $ 49 Dividends receivable from unconsolidated affiliates 43 20 Prepaid rent 1 42 Other prepaid expenses and current assets 74 66 Prepaid expenses and other current assets $ 163 $ 177
Property, Plant and Equipment 6/30/2019 12/31/2018 Buildings and improvements $ 2,162 $ 2,121 Finance leases, primarily buildings 27 26 Machinery, equipment and construction in progress 1,210 1,201 Property, plant and equipment, gross 3,399 3,348 Accumulated depreciation (1,828) (1,733)Property, plant and equipment, net $ 1,571 $ 1,615
Other Assets 6/30/2019 12/31/2018 VAT assets $ 243 $ 226 Land use right 137 138 Long-term deposits 68 64 Investment in equity securities 74 47 Costs to obtain contracts 9 8 Others 4 8 Other Assets $ 535 $ 491
19
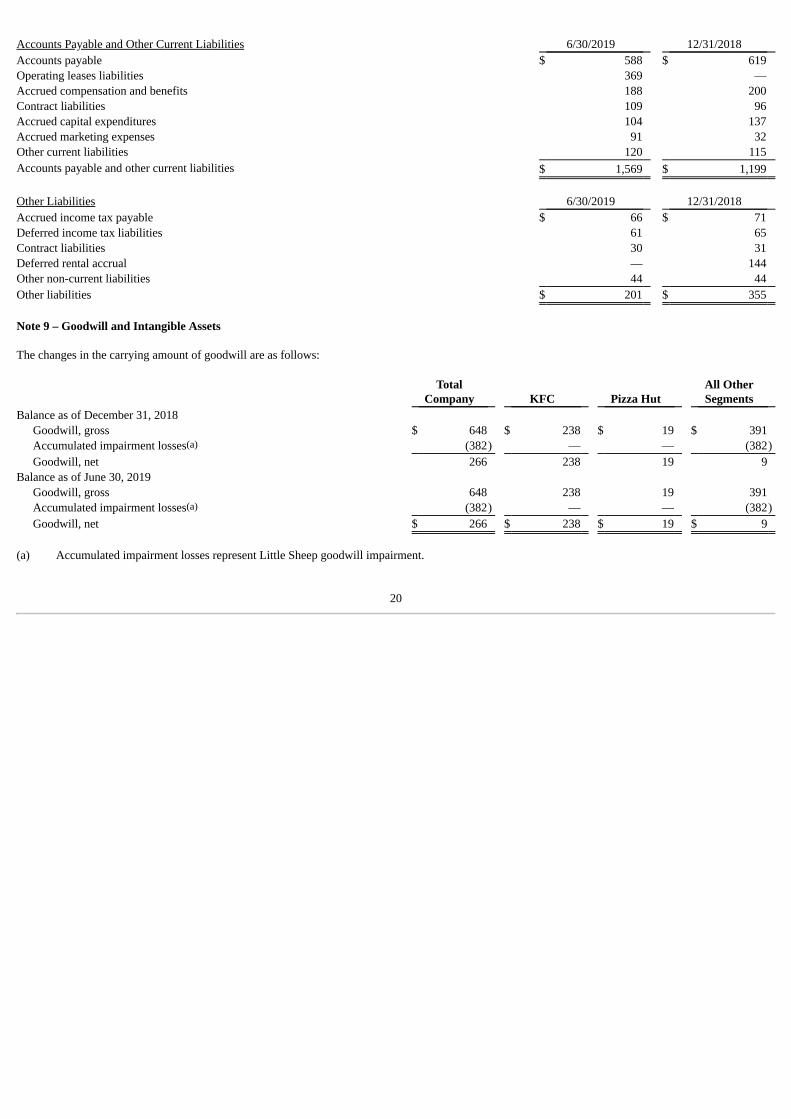
Accounts Payable and Other Current Liabilities 6/30/2019 12/31/2018 Accounts payable $ 588 $ 619 Operating leases liabilities 369 — Accrued compensation and benefits 188 200 Contract liabilities 109 96 Accrued capital expenditures 104 137 Accrued marketing expenses 91 32 Other current liabilities 120 115 Accounts payable and other current liabilities $ 1,569 $ 1,199
Other Liabilities 6/30/2019 12/31/2018 Accrued income tax payable $ 66 $ 71 Deferred income tax liabilities 61 65 Contract liabilities 30 31 Deferred rental accrual — 144 Other non-current liabilities 44 44 Other liabilities $ 201 $ 355
Note 9 – Goodwill and Intangible Assets The changes in the carrying amount of goodwill are as follows:
Total
Company KFC Pizza Hut All OtherSegments
Balance as of December 31, 2018 Goodwill, gross $ 648 $ 238 $ 19 $ 391 Accumulated impairment losses(a) (382) — — (382)Goodwill, net 266 238 19 9
Balance as of June 30, 2019 Goodwill, gross 648 238 19 391 Accumulated impairment losses(a) (382) — — (382)Goodwill, net $ 266 $ 238 $ 19 $ 9
(a) Accumulated impairment losses represent Little Sheep goodwill impairment.
20

Intangible assets, net as of June 30, 2019 and December 31, 2018 are as follows:
6/30/2019 12/31/2018
Gross Carrying
Amount(a) AccumulatedAmortization
Accumulatedimpairment
losses
NetCarryingAmount
Gross CarryingAmount
AccumulatedAmortization
Accumulatedimpairment
losses
NetCarryingAmount
Definite-lived intangible assets
Reacquired franchise rights $ 150 $ (109) $ — $ 41 $ 150 $ (100) $ — $ 50 Daojia platform 17 (3) (10) 4 16 (3) (10) 3 Customer-related assets 12 (9) (2) 1 12 (8) (2) 2 Others(b) 9 (3) — 6 17 (9) — 8
$ 188 $ (124) $ (12) $ 52 $ 195 $ (120) $ (12) $ 63 Indefinite-lived intangible assets
Little Sheep trademark $ 53 $ — $ — $ 53 $ 53 $ — $ — $ 53
Total intangible assets $ 241 $ (124) $ (12) $ 105 $ 248 $ (120) $ (12) $ 116 (a) Changes in gross carrying amount include the effect of currency translation adjustment. (b) Decrease in Others during year to date ended June 30, 2019 is primarily due to the reclassification of favorable lease assets, with a gross carrying
amount of $7 million and accumulated amortization of $5 million, to right-of-use assets upon adoption of ASC 842. Amortization expense of definite-lived intangible assets was $4 million and $7 million for the quarters ended June 30, 2019 and 2018, respectively, and $10million and $13 million for the years to date ended June 30, 2019 and 2018, respectively. As of June 30, 2019, expected amortization expense for theunamortized definite-lived intangible assets is approximately $7 million for the remainder of 2019, $13 million in 2020, $13 million in 2021, $13 million in2022 and $3 million in 2023. Note 10 – Leases As of June 30, 2019, we operated more than 8,700 restaurants, leasing the underlying land and/or building. We generally enter into lease agreements withinitial terms of 10 to 20 years. Most of our lease agreements contain termination options that permit us to terminate the lease agreement early if therestaurant’s unit contribution is negative for a specified period of time. We generally do not have renewal options for our leases. Such options are accountedfor only when it is reasonably certain that we will exercise the options. The rent under the majority of our current restaurant lease agreements is generallypayable in one of three ways: (i) fixed rent; (ii) the higher of a fixed base rent or a percentage of the restaurant’s sales revenue; or (iii) a percentage of therestaurant’s sales revenue. Most leases require us to pay common area maintenance fees for the leased property. In addition to restaurants leases, we also leaseoffice spaces, logistics centers and equipment. Our lease agreements do not contain any material residual value guarantees or material restrictive covenants.
21
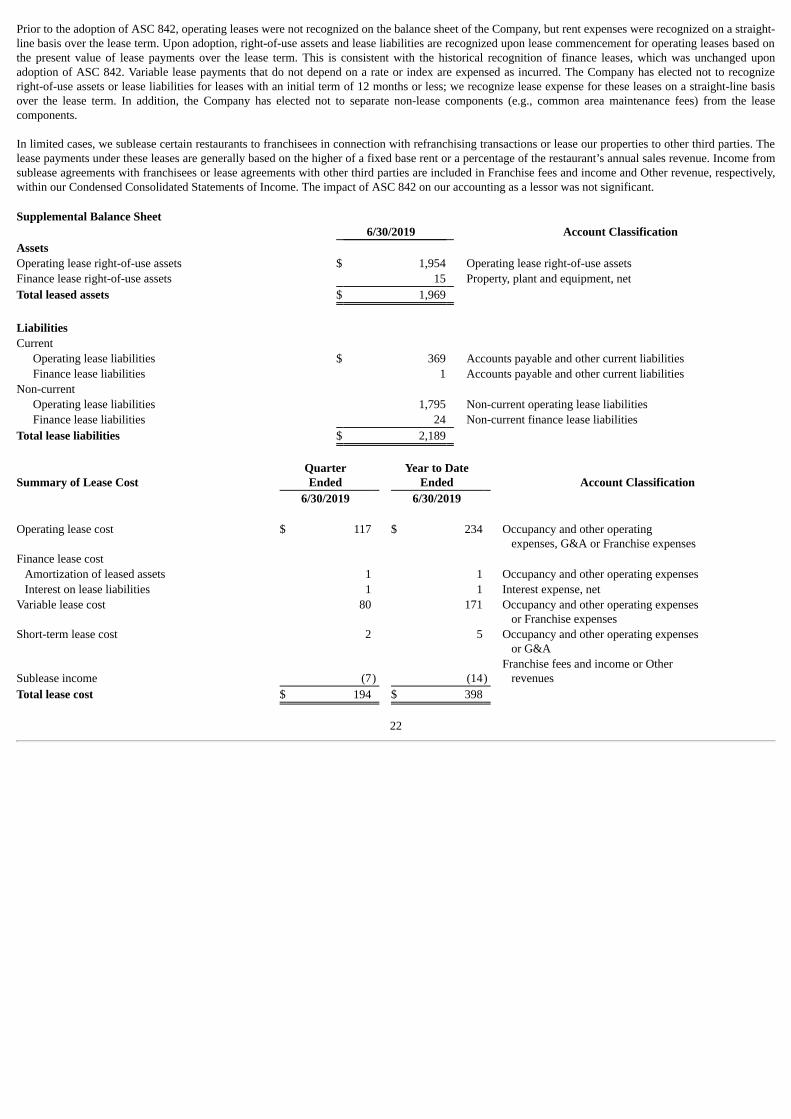
Prior to the adoption of ASC 842, operating leases were not recognized on the balance sheet of the Company, but rent expenses were recognized on a straight-line basis over the lease term. Upon adoption, right-of-use assets and lease liabilities are recognized upon lease commencement for operating leases based onthe present value of lease payments over the lease term. This is consistent with the historical recognition of finance leases, which was unchanged uponadoption of ASC 842. Variable lease payments that do not depend on a rate or index are expensed as incurred. The Company has elected not to recognizeright-of-use assets or lease liabilities for leases with an initial term of 12 months or less; we recognize lease expense for these leases on a straight-line basisover the lease term. In addition, the Company has elected not to separate non-lease components (e.g., common area maintenance fees) from the leasecomponents. In limited cases, we sublease certain restaurants to franchisees in connection with refranchising transactions or lease our properties to other third parties. Thelease payments under these leases are generally based on the higher of a fixed base rent or a percentage of the restaurant’s annual sales revenue. Income fromsublease agreements with franchisees or lease agreements with other third parties are included in Franchise fees and income and Other revenue, respectively,within our Condensed Consolidated Statements of Income. The impact of ASC 842 on our accounting as a lessor was not significant. Supplemental Balance Sheet 6/30/2019 Account ClassificationAssets Operating lease right-of-use assets $ 1,954 Operating lease right-of-use assetsFinance lease right-of-use assets 15 Property, plant and equipment, netTotal leased assets $ 1,969 Liabilities Current
Operating lease liabilities $ 369 Accounts payable and other current liabilitiesFinance lease liabilities 1 Accounts payable and other current liabilities
Non-current Operating lease liabilities 1,795 Non-current operating lease liabilitiesFinance lease liabilities 24 Non-current finance lease liabilities
Total lease liabilities $ 2,189
Summary of Lease Cost QuarterEnded
Year to DateEnded Account Classification
6/30/2019 6/30/2019 Operating lease cost
$ 117
$ 234
Occupancy and other operating expenses, G&A or Franchise expenses
Finance lease cost Amortization of leased assets 1 1 Occupancy and other operating expensesInterest on lease liabilities 1 1 Interest expense, net
Variable lease cost
80 171
Occupancy and other operating expenses or Franchise expenses
Short-term lease cost
2 5
Occupancy and other operating expenses or G&A
Sublease income (7) (14) Franchise fees and income or Other revenues
Total lease cost $ 194 $ 398
22

Supplemental Cash Flow Information QuarterEnded Year to Date Ended
6/30/2019 6/30/2019 Cash paid for amounts included in the measurement of lease liabilities:
Operating cash flows from operating leases $ 114 $ 241 Operating cash flows from finance leases 1 1 Financing cash flows from finance leases 1 1
Right-of-use assets obtained in exchange for new lease liabilities(a): Operating leases $ 62 $ 119 Finance leases 1 —
(a) This also includes noncash transactions resulting in adjustments to the lease liability or ROU asset due to modification or other reassessment events. Lease Term and Discount Rate 6/30/2019 Weighted-average remaining lease term (years)
Operating leases 7.2 Finance leases 12.1
Weighted-average discount rate
Operating leases 6.1%Finance leases 5.7%
Summary of Future Lease Payments and Lease Liabilities Maturities of lease liabilities as of June 30, 2019 were as follows:
Amount ofOperating
Leases
Amount ofFinanceLeases Total
Remainder of 2019 $ 256 $ 1 $ 257 2020 459 3 462 2021 415 3 418 2022 355 3 358 2023 290 3 293 Thereafter 916 22 938 Total undiscounted lease payment 2,691 35 2,726 Less: imputed interest (b) 527 10 537 Present value of lease liabilities $ 2,164 $ 25 $ 2,189
(b) As most of our leases do not provide an implicit rate, we use our incremental borrowing rate based on the information available at the lease
commencement date in determining the imputed interest and present value of lease payments. We used the incremental borrowing rate on January 1,2019 for operating leases that commenced prior to that date.
23
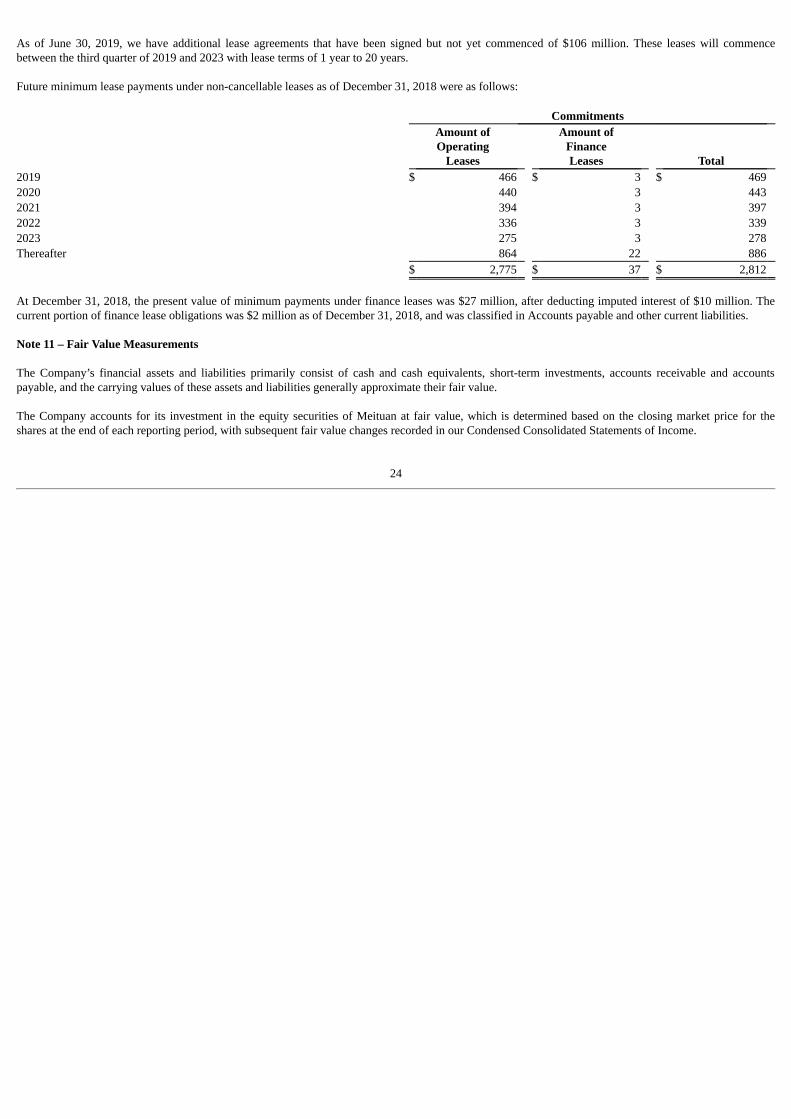
As of June 30, 2019, we have additional lease agreements that have been signed but not yet commenced of $106 million. These leases will commencebetween the third quarter of 2019 and 2023 with lease terms of 1 year to 20 years. Future minimum lease payments under non-cancellable leases as of December 31, 2018 were as follows:
Commitments
Amount ofOperating
Leases
Amount ofFinanceLeases Total
2019 $ 466 $ 3 $ 469 2020 440 3 443 2021 394 3 397 2022 336 3 339 2023 275 3 278 Thereafter 864 22 886 $ 2,775 $ 37 $ 2,812
At December 31, 2018, the present value of minimum payments under finance leases was $27 million, after deducting imputed interest of $10 million. Thecurrent portion of finance lease obligations was $2 million as of December 31, 2018, and was classified in Accounts payable and other current liabilities. Note 11 – Fair Value Measurements The Company’s financial assets and liabilities primarily consist of cash and cash equivalents, short-term investments, accounts receivable and accountspayable, and the carrying values of these assets and liabilities generally approximate their fair value. The Company accounts for its investment in the equity securities of Meituan at fair value, which is determined based on the closing market price for theshares at the end of each reporting period, with subsequent fair value changes recorded in our Condensed Consolidated Statements of Income.
24
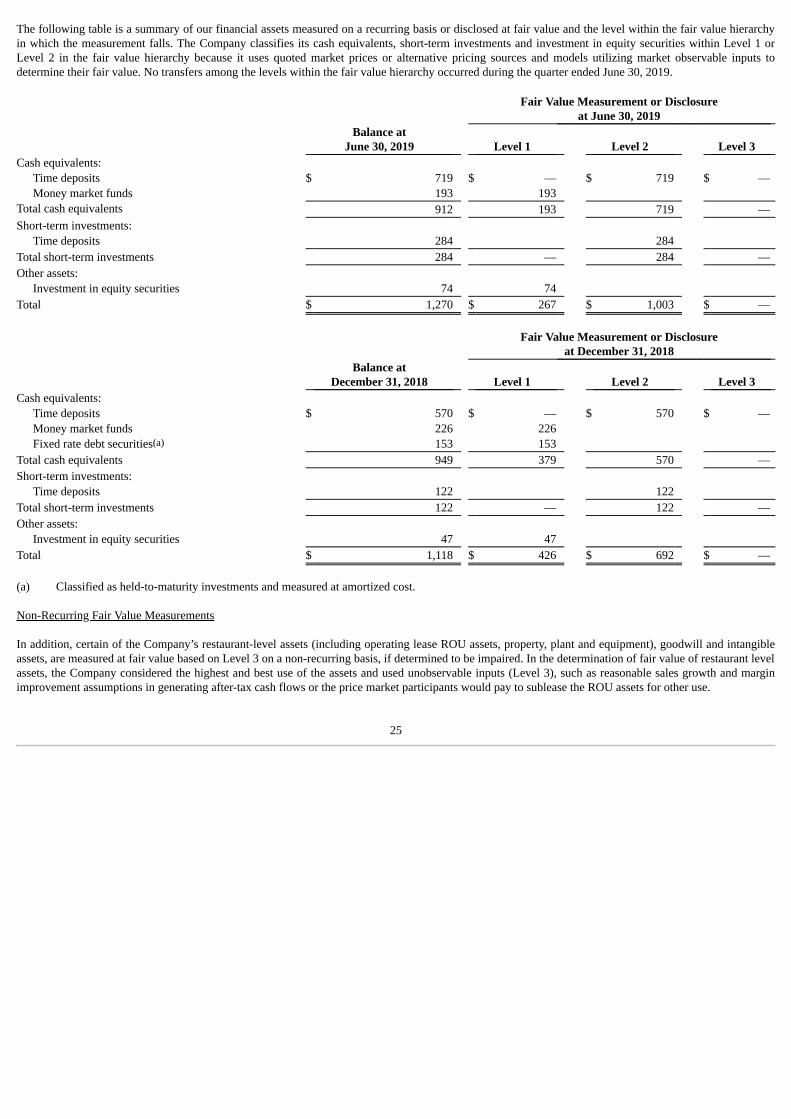
The following table is a summary of our financial assets measured on a recurring basis or disclosed at fair value and the level within the fair value hierarchyin which the measurement falls. The Company classifies its cash equivalents, short-term investments and investment in equity securities within Level 1 orLevel 2 in the fair value hierarchy because it uses quoted market prices or alternative pricing sources and models utilizing market observable inputs todetermine their fair value. No transfers among the levels within the fair value hierarchy occurred during the quarter ended June 30, 2019.
Fair Value Measurement or Disclosure
at June 30, 2019
Balance at
June 30, 2019 Level 1 Level 2 Level 3 Cash equivalents:
Time deposits $ 719 $ — $ 719 $ — Money market funds 193 193
Total cash equivalents 912 193 719 — Short-term investments:
Time deposits 284 284 Total short-term investments 284 — 284 — Other assets:
Investment in equity securities 74 74 Total $ 1,270 $ 267 $ 1,003 $ —
Fair Value Measurement or Disclosure
at December 31, 2018
Balance at
December 31, 2018 Level 1 Level 2 Level 3 Cash equivalents:
Time deposits $ 570 $ — $ 570 $ — Money market funds 226 226 Fixed rate debt securities(a) 153 153
Total cash equivalents 949 379 570 — Short-term investments:
Time deposits 122 122 Total short-term investments 122 — 122 — Other assets:
Investment in equity securities 47 47 Total $ 1,118 $ 426 $ 692 $ —
(a) Classified as held-to-maturity investments and measured at amortized cost. Non-Recurring Fair Value Measurements In addition, certain of the Company’s restaurant-level assets (including operating lease ROU assets, property, plant and equipment), goodwill and intangibleassets, are measured at fair value based on Level 3 on a non-recurring basis, if determined to be impaired. In the determination of fair value of restaurant levelassets, the Company considered the highest and best use of the assets and used unobservable inputs (Level 3), such as reasonable sales growth and marginimprovement assumptions in generating after-tax cash flows or the price market participants would pay to sublease the ROU assets for other use.
25

The following table presents amounts recognized from all non-recurring fair value measurements using Level 3 inputs during the quarters and years to dateended June 30, 2019 and 2018. These amounts exclude fair value measurements made for restaurants that were closed or refranchised prior to those respectiveperiod-end dates. Quarter Ended Year to Date Ended 6/30/2019 6/30/2018 6/30/2019 6/30/2018 Account Classification ROU impairment prior to the adoption of ASC 842(a) $ — $ — $ 82 $ — Retained EarningsIncremental restaurant-level impairment upon adoption of ASC 842(b) — — 12 — Closure and impairment expenses, netRestaurant-level impairment(c) 7 13 7 13 Closure and impairment expenses, netTotal $ 7 $ 13 $ 101 $ 13
(a) ROU impairment prior to the adoption of ASC 842 represents an impairment charge on operating lease ROU assets arising from existing operating
leases as of January 1, 2019. After netting with the related impact on deferred taxes of $19 million and the impact on noncontrolling interests of $3million, we recorded a cumulative adjustment of $60 million to retained earnings in accordance with the transition guidance for the new leasestandard. For those restaurants under operating leases with full impairment on their long-lived assets (primarily property, plant and equipment) beforeJanuary 1, 2019, an additional impairment charge would have been recorded before January 1, 2019 had the operating lease ROU assets beenrecognized at the time of impairment.
(b) Reflect incremental restaurant-level impairment upon adoption of ASC 842 in the first quarter of 2019. We performed an additional impairment
evaluation of long-lived assets of restaurants, which includes operating lease ROU assets, and property, plant and equipment. (c) Restaurant-level impairment changes resulted primarily from our semi-annual impairment evaluation of long-lived assets of individual restaurants
that were being operated at the time of impairment and had not been offered for refranchising. Note 12 – Income Taxes
Quarter Ended Year to Date Ended 6/30/2019 6/30/2018 6/30/2019 6/30/2018
Income tax provision $ 46 $ 53 $ 139 $ 160 Effective tax rate 20.0% 26.0% 25.2% 26.4% The lower effective tax rate for the quarter was primarily due to lower accrued tax on Global Intangible Low Taxed Income (“GILTI”), non-taxable gainrelated to our investment in equity securities of Meituan and lower foreign withholding tax on the estimated repatriation of earnings outside of China. Thelower year to date effective tax rate was primarily due to lower accrued tax on GILTI and non-taxable gain related to our investment in equity securities ofMeituan, partially offset by the additional adjustment of $8 million on transition tax pursuant to the Tax Act recorded in the first quarter of 2019. In December 2017, the U.S. enacted the Tax Act, which included a broad range of tax reforms, including, but not limited to, the establishment of a flatcorporate income tax rate of 21%, the elimination or reduction of certain business deductions and the imposition of tax on deemed repatriation of accumulatedundistributed foreign earnings. The Tax Act impacted Yum China in two material aspects: (1) in general, all of the foreign-source dividends received by YumChina from its foreign subsidiaries are exempted from taxation starting from the tax year beginning after December 31, 2017 and (2) Yum China recordedadditional income tax expense in the fourth quarter of 2017, including an estimated one-time transition tax on its deemed repatriation of accumulatedundistributed foreign earnings and additional tax related to the revaluation of certain deferred tax assets.
26

We completed our analysis of the Tax Act in the fourth quarter of 2018 according to guidance released by the U.S. Treasury Department and the IRS as ofDecember 2018 and made a reversal to provisional amount in the amount of $36 million for the transition tax recorded in 2017 accordingly. The U.S.Treasury Department and the IRS released the final transition tax regulations on January 15, 2019, which were published in the Federal Register and becameeffective on February 5, 2019. We completed the evaluation of the impact on our transition tax computation based on the final regulations released in the firstquarter of 2019 and recorded an additional amount of $8 million for the transition tax accordingly. The Tax Act requires a U.S. shareholder to be subject to tax on GILTI earned by certain foreign subsidiaries. We have elected the option to account for currentyear GILTI tax as a period cost as incurred, and therefore included it in estimating the annual effective tax rate. Note 13 –Segment Reporting We have two reportable segments: KFC and Pizza Hut. Starting from the first quarter of 2019, our newly developed COFFii & JOY concept and e-commercebusiness became operating segments, as their financial results started being regularly reviewed by the Company’s chief operating decision maker.Accordingly, our six non-reportable operating segments, reflecting the operations of East Dawning, Little Sheep, Taco Bell, Daojia, COFFii & JOY and our e-commerce business, are combined and referred to as All Other Segments, as those operating segments are insignificant both individually and in the aggregate.Segment financial information for prior quarters has been recast to align with this change in segment reporting. There was no impact on the consolidatedfinancial statements of the Company as a result of this change. Quarter Ended 6/30/2019
Revenues KFC Pizza Hut All OtherSegments
Corporate andUnallocated(a) Combined Elimination Consolidated
Revenue from external customers $ 1,458 $ 510 $ 22 $ 134 2,124 $ — $ 2,124 Inter-segment revenue — — 10 — 10 (10) — Total $ 1,458 $ 510 $ 32 $ 134 $ 2,134 $ (10) $ 2,124
Quarter Ended 6/30/2018
Revenues KFC Pizza Hut All OtherSegments
Corporate andUnallocated(a) Combined Elimination Consolidated
Revenue from external customers $ 1,400 $ 528 $ 18 $ 122 2,068 $ — $ 2,068 Inter-segment revenue — — 2 — 2 (2) — Total $ 1,400 $ 528 $ 20 $ 122 $ 2,070 $ (2) $ 2,068
Year to Date Ended 6/30/2019
Revenues KFC Pizza Hut All OtherSegments
Corporate andUnallocated(a) Combined Elimination Consolidated
Revenue from external customers $ 3,050 $ 1,053 $ 45 $ 280 4,428 $ — $ 4,428 Inter-segment revenue — — 19 — 19 (19) — Total $ 3,050 $ 1,053 $ 64 $ 280 $ 4,447 $ (19) $ 4,428
27
Year to Date Ended 6/30/2018
Revenues KFC Pizza Hut All OtherSegments
Corporate andUnallocated(a) Combined Elimination Consolidated
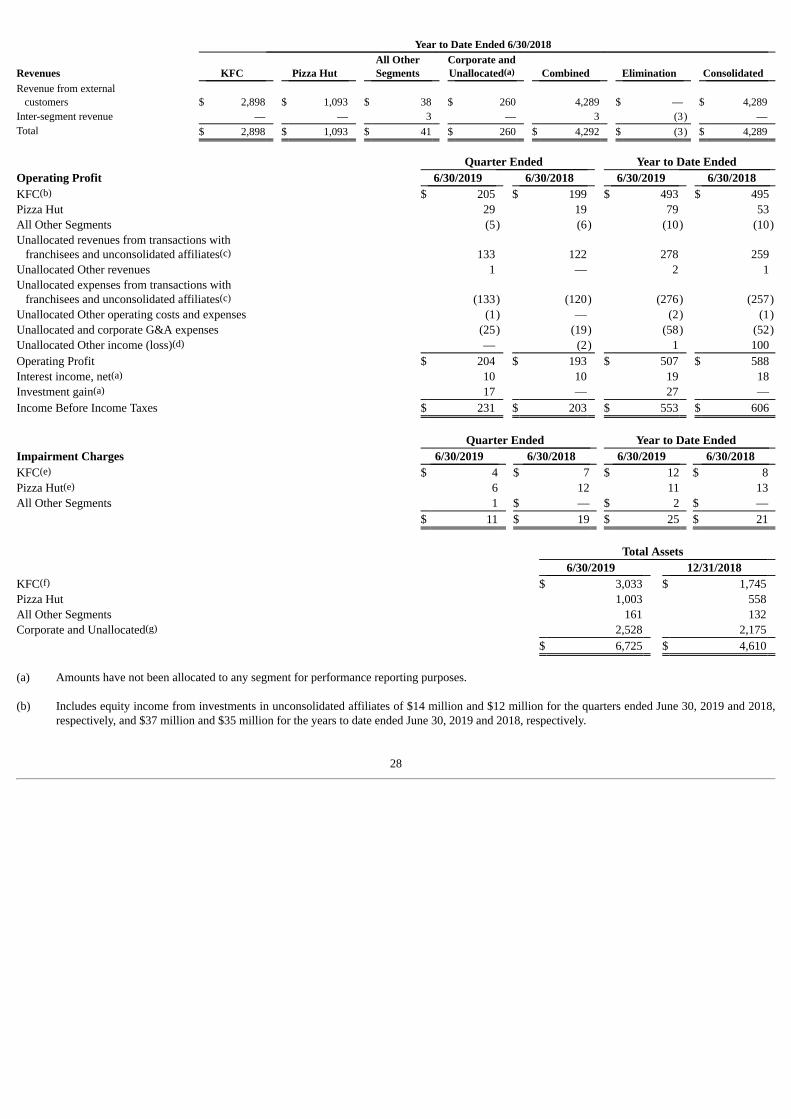
Revenue from external customers $ 2,898 $ 1,093 $ 38 $ 260 4,289 $ — $ 4,289 Inter-segment revenue — — 3 — 3 (3) — Total $ 2,898 $ 1,093 $ 41 $ 260 $ 4,292 $ (3) $ 4,289
Quarter Ended Year to Date Ended Operating Profit 6/30/2019 6/30/2018 6/30/2019 6/30/2018 KFC(b) $ 205 $ 199 $ 493 $ 495 Pizza Hut 29 19 79 53 All Other Segments (5) (6) (10) (10)Unallocated revenues from transactions with franchisees and unconsolidated affiliates(c) 133 122 278 259 Unallocated Other revenues 1 — 2 1 Unallocated expenses from transactions with franchisees and unconsolidated affiliates(c) (133) (120) (276) (257)Unallocated Other operating costs and expenses (1) — (2) (1)Unallocated and corporate G&A expenses (25) (19) (58) (52)Unallocated Other income (loss)(d) — (2) 1 100 Operating Profit $ 204 $ 193 $ 507 $ 588 Interest income, net(a) 10 10 19 18 Investment gain(a) 17 — 27 — Income Before Income Taxes $ 231 $ 203 $ 553 $ 606
Quarter Ended Year to Date Ended
Impairment Charges 6/30/2019 6/30/2018 6/30/2019 6/30/2018 KFC(e) $ 4 $ 7 $ 12 $ 8 Pizza Hut(e) 6 12 11 13 All Other Segments 1 $ — $ 2 $ — $ 11 $ 19 $ 25 $ 21
Total Assets 6/30/2019 12/31/2018
KFC(f) $ 3,033 $ 1,745 Pizza Hut 1,003 558 All Other Segments 161 132 Corporate and Unallocated(g) 2,528 2,175 $ 6,725 $ 4,610
(a) Amounts have not been allocated to any segment for performance reporting purposes. (b) Includes equity income from investments in unconsolidated affiliates of $14 million and $12 million for the quarters ended June 30, 2019 and 2018,
respectively, and $37 million and $35 million for the years to date ended June 30, 2019 and 2018, respectively.
28
(c) Primarily includes revenues and associated expenses of transactions with franchisee and unconsolidated affiliates derived from the Company’s central
procurement model whereby the Company centrally purchases substantially all food and paper products from suppliers and then sells and delivers torestaurants, including franchisees and unconsolidated affiliates. Amounts have not been allocated to any segment for purposes of making operatingdecisions or assessing financial performance as the transactions are deemed corporate revenues and expenses in nature.
(d) Primarily includes gain from re-measurement of the previously held equity interest in connection with the acquisition of Wuxi KFC (See Note 2). (e) Primarily includes store closure impairment charges, incremental restaurant-level impairment charges as a result of adopting ASC 842 and restaurant-
level impairment charges resulting from our semi-annual impairment evaluation (See Note 11). (f) Includes investments in unconsolidated affiliates. (g) Primarily includes cash and cash equivalents, short-term investments, investment in equity securities, and inventories that are centrally managed. Note 14 – Contingencies Indemnification of China Tax on Indirect Transfers of Assets In February 2015, the Chinese State Taxation Administration (“STA”) issued Bulletin 7 on Income arising from Indirect Transfers of Assets by Non-ResidentEnterprises. Pursuant to Bulletin 7, an “indirect transfer” of Chinese taxable assets, including equity interests in a Chinese resident enterprise, by a non-residententerprise, may be recharacterized and treated as a direct transfer of Chinese taxable assets, if such arrangement does not have reasonable commercial purposeand the transferor has avoided payment of Chinese enterprise income tax. As a result, gains derived from such an indirect transfer may be subject to Chineseenterprise income tax at a rate of 10%. YUM concluded and we concurred that it is more likely than not that YUM will not be subject to this tax with respect to the distribution. However, there aresignificant uncertainties regarding what constitutes a reasonable commercial purpose, how the safe harbor provisions for group restructurings are to beinterpreted and how the taxing authorities will ultimately view the distribution. As a result, YUM’s position could be challenged by Chinese tax authoritiesresulting in a 10% tax assessed on the difference between the fair market value and the tax basis of the separated China business. As YUM’s tax basis in theChina business is minimal, the amount of such tax could be significant. Any tax liability arising from the application of Bulletin 7 to the distribution is expected to be settled in accordance with the tax matters agreement betweenthe Company and YUM. Pursuant to the tax matters agreement, to the extent any Chinese indirect transfer tax pursuant to Bulletin 7 is imposed, such tax andrelated losses will be allocated between YUM and the Company in proportion to their respective share of the combined market capitalization of YUM and theCompany during the 30 trading days after the separation. Such a settlement could be significant and have a material adverse effect on our results of operationsand our financial condition. At the inception of the tax indemnity being provided to YUM, the fair value of the non-contingent obligation to stand ready toperform was insignificant and the liability for the contingent obligation to make payment was not probable or estimable.
29

Guarantees From time to time we have guaranteed certain lines of credit and loans of franchisees and unconsolidated affiliates. As of June 30, 2019, we have providedguarantees of approximately $1 million on behalf of franchisees and no guarantees were outstanding for unconsolidated affiliates. Legal Proceedings From time to time, the Company is subject to various lawsuits covering a variety of allegations. The Company believes that the ultimate liability, if any, inexcess of amounts already provided for these matters in the Condensed Consolidated Financial Statements, is not likely to have a material adverse effect onthe Company’s results of operations, financial condition or cash flows. Matters faced by the Company from time to time include, but are not limited to, claimsfrom landlords, employees, customers and others related to operational, contractual or employment issues. Note 15 – Subsequent Events On July 30, 2019, the Company announced that the Board of Directors declared a cash dividend of $0.12 per share, payable as of the close of business onSeptember 17, 2019 to stockholders of record as of the close of business on August 27, 2019. The total estimated cash dividend payable is approximately $46million.
30

Item 2. Management’s Discussion and Analysis of Financial Condition and Results of Operations References to the Company throughout this Management’s Discussion and Analysis of Financial Condition and Results of Operations (this “MD&A”) aremade using the first person notations of “we,” “us” or “our.” This MD&A contains forward-looking statements, including statements with respect to theongoing transfer pricing audit, the retail tax structure reform, our growth plans, future capital resources to fund our operations and anticipated capitalexpenditures, share repurchases, our ability to pay dividends and the impact of new accounting pronouncements not yet adopted. See “Cautionary NoteRegarding Forward-Looking Statements” at the end of this Item 2 for information regarding forward-looking statements. Introduction Yum China Holdings, Inc. is the largest restaurant company in China, with over 8,700 restaurants as of June 30, 2019. Our growing restaurant base consists ofChina’s leading restaurant brands and concepts, primarily the KFC and Pizza Hut brands, as well as brands such as East Dawning, Little Sheep, Taco Bell andCOFFii & JOY. Following our separation from YUM, we obtained the exclusive right to operate and sub-license the KFC, Pizza Hut and, subject to achievingcertain agreed-upon milestones, Taco Bell brands in China, excluding Hong Kong, Taiwan and Macau (the “PRC” or “China”), and we own the intellectualproperty of the East Dawning, Little Sheep and COFFii & JOY concepts outright. We were the first major global restaurant brand when we entered China in1987 and we have developed deep operating experience in the market. We have since grown to become one of China’s largest restaurant developers withlocations in over 1,300 cities as of June 30, 2019. KFC is the leading quick-service restaurant (“QSR”) brand in the PRC in terms of system sales and number of restaurants. As of June 30, 2019, KFCoperated over 6,100 restaurants in over 1,300 cities across China. Measured by number of restaurants, we believe KFC has an approximate two-to-one leadover the nearest Western QSR competitor in China, and KFC has continued to grow in both large and small cities. During the first quarter of 2018, theCompany completed the acquisition of an additional 36% interest in an unconsolidated affiliate that operates KFC stores in Wuxi, China (“Wuxi KFC”),increasing the equity interest to 83% and allowing the Company to consolidate the entity. Pizza Hut is the leading casual dining restaurant (“CDR”) brand in China in terms of system sales and number of restaurants. As of June 30, 2019, Pizza Hutoperated over 2,200 restaurants in over 500 cities. We believe Pizza Hut has an approximate four-to-one lead in terms of number of restaurants over itsnearest competitor in China. Overview We intend for this MD&A to provide the reader with information that will assist in understanding our results of operations, including metrics thatmanagement uses to assess the Company’s performance. Throughout this MD&A, we discuss the following performance metrics: • The Company provides certain percentage changes excluding the impact of foreign currency translation (“F/X”). These amounts are derived by
translating current year results at prior year average exchange rates. We believe the elimination of the F/X impact provides better year-to-yearcomparability without the distortion of foreign currency fluctuations.
31

• System sales growth reflects the results of all restaurants regardless of ownership, including Company-owned, franchise and unconsolidated
affiliate restaurants that operate our Concepts, except for non-Company-owned restaurants for which we do not receive a sales-basedroyalty. Sales of franchise and unconsolidated affiliate restaurants typically generate ongoing franchise fees for the Company at a rate ofapproximately 6% of system sales. Franchise and unconsolidated affiliate restaurant sales are not included in Company sales in the CondensedConsolidated Statements of Income; however, the franchise fees are included in the Company’s revenues. We believe system sales growth isuseful to investors as a significant indicator of the overall strength of our business as it incorporates all of our revenue drivers, Company andfranchise same-store sales as well as net unit growth.
• Effective January 1, 2018, the Company revised its definition of same-store sales growth to represent the estimated percentage change in sales offood of all restaurants in the Company system that have been open prior to the first day of our prior fiscal year. We refer to these as our “base”stores. Previously, same-store sales growth represented the estimated percentage change in sales of all restaurants in the Company system thathave been open for one year or more, and the base stores changed on a rolling basis from month to month. This revision was made to align withhow management measures performance internally and focuses on trends of a more stable base of stores.
• Company Restaurant profit (“Restaurant profit”) is defined as Company sales less expenses incurred directly by our Company-owned restaurantsin generating Company sales. Company restaurant margin percentage is defined as Restaurant profit divided by Company sales. Within theCompany sales and Restaurant profit analysis, Store Portfolio Actions represent the net impact of new unit openings, acquisitions, refranchisingand store closures, and Other primarily represents the impact of same-store sales as well as the impact of changes in restaurant operating costssuch as inflation/deflation.
• In addition to the results provided in accordance with GAAP throughout this MD&A, the Company provides measures adjusted for Special Items,which include Adjusted Operating Profit, Adjusted Net Income, Adjusted Earnings Per Common Share, Adjusted Effective Tax Rate andAdjusted EBITDA, which we define as net income including noncontrolling interests adjusted for income tax, interest income, net, investmentgain or loss, depreciation and amortization, and other items, including store impairment charges and Special Items. The Special Item for the yearto date ended June 30, 2019 represents the impact from the U.S. Tax Cuts and Jobs Act (the “Tax Act”). The Special Item for the year to dateended June 30, 2018 represents a gain recognized from the re-measurement of our previously held equity interest in Wuxi KFC at fair value uponacquisition, as described in Note 2. The Company excludes impact from Special Items for the purpose of evaluating performance internally.Special Items are not included in any of our segment results. In addition, the Company provides Adjusted EBITDA because we believe thatinvestors and analysts may find it useful in measuring operating performance without regard to items such as income tax, interest income, net,investment gain or loss, depreciation and amortization, and other items, including store impairment charges and Special Items. These adjustedmeasures are not intended to replace the presentation of our financial results in accordance with GAAP. Rather, the Company believes that thepresentation of these adjusted measures provides additional information to investors to facilitate the comparison of past and present results,excluding those items that the Company does not believe are indicative of our ongoing operations due to their nature.
All Note references in this MD&A refer to the Notes to the Condensed Consolidated Financial Statements. Tabular amounts are displayed in millions of U.S.dollars except percentages and per share and unit count amounts, or as otherwise specifically identified. Percentages may not recompute due to rounding.References to quarters are references to the Company’s fiscal quarters.
32

Quarters and years to date ended June 30, 2019 and 2018 Results of Operations Summary The Company has two reportable segments: KFC and Pizza Hut. Starting from the first quarter of 2019, our newly developed COFFii & JOY concept and e-commerce business became operating segments, as their financial results started being regularly reviewed by the Company’s chief operating decision maker.Accordingly, our six non-reportable operating segments, reflecting the operations of East Dawning, Little Sheep, Taco Bell, Daojia, COFFii & JOY and our e-commerce business, are combined and referred to as All Other Segments, as those operating segments are insignificant both individually and in the aggregate.Segment financial information for prior quarters has been recast to align with this change in segment reporting. There was no impact on the consolidatedfinancial statements of the Company as a result of this change. Additional details on our reportable operating segments are included in Note 13. Quarterly highlights:
% Change
System Sales(a) Same-Store
Sales(a) Net New Units
OperatingProfit
(Reported)
OperatingProfit
(Ex F/X) KFC +12 +5 +8 +3 +10 Pizza Hut +4 +1 +2 +50 +60 All Other Segments(b) +15 (7) +9 +4 — Total +10 +4 +7 +6 +14 Year to date highlights:
% Change
System Sales(a) Same-Store
Sales(a) Net New Units
OperatingProfit
(Reported)
OperatingProfit
(Ex F/X) KFC +12 +5 +8 (1) +6 Pizza Hut +3 +1 +2 +49 +58 All Other Segments(b) +7 (12) +9 +3 (1)Total +10 +4 +7 (14) (8) NM refers to changes over 100%, from negative to positive amounts or from zero to an amount. (a) System sales and same-store sales percentages as shown in tables exclude the impact of F/X. (b) Sales from non-Company-owned restaurants, for which we do not receive a sales-based royalty, are excluded from system sales and same-store
sales. As of June 30, 2019, the Company operated over 8,700 units, predominately KFC and Pizza Hut restaurants, which are the leading QSR and CDR brand,respectively, in mainland China. Given our strong competitive position, a growing economy and a population of approximately 1.4 billion in mainland China,the Company has rapidly added KFC and Pizza Hut restaurants. As compared to the second quarter of 2018, Company sales in the second quarter of 2019 increased 2%, or 9% if excluding the impact of F/X. Company salesfor the year to date ended June 30, 2019 increased 3%, or 10% if excluding the impact of F/X. The quarter and year to date increase in Company sales,excluding the impact of F/X, was driven by net unit growth and same-store sales growth.
33

The quarter and year to date increase in Restaurant profit, excluding the impact of F/X, was driven by same-store sales growth, net unit growth, lowerdepreciation expenses, utilities savings and labor efficiency, partially offset by wage inflation, commodity inflation, and higher promotion and productupgrade costs. The Consolidated Results of Operations for the quarters and years to date ended June 30, 2019 and 2018 are presented below:
Quarter Ended % B/(W) (a) Year to Date Ended % B/(W) (a)
6/30/2019 6/30/2018 Reported Ex F/X 6/30/2019 6/30/2018 Reported Ex F/XCompany sales $ 1,926 $ 1,888 2 9 $ 4,015 $ 3,904 3 10 Franchise fees and income 36 34 5 12 75 74 2 8 Revenues from transactions with franchisees and unconsolidated affiliates 154 141 10 18 324 302 7 14 Other revenues 8 5 48 55 14 9 51 58 Total revenues $ 2,124 $ 2,068 3 10 $ 4,428 $ 4,289 3 10 Restaurant profits $ 283 $ 286 (1) 6 $ 669 $ 647 3 10 Restaurant Margin % 14.7% 15.1% (0.4) ppts. (0.4) ppts. 16.7% 16.6% 0.1 ppts. 0.1 ppts.Operating Profit $ 204 $ 193 6 14 $ 507 $ 588 (14) (8) Interest income, net 10 10 (8) (2) 19 18 3 10 Investment gain 17 — NM NM 27 — NM NM Income tax provision (46) (53) 13 6 (139) (160) 13 8 Net Income - including noncontrolling interests 185 150 23 32 414 446 (7) (1) Net Income – noncontrolling interests 7 7 — (7) 14 15 7 1 Net Income – Yum China Holdings, Inc. $ 178 $ 143 24 33 $ 400 $ 431 (7) (1) Diluted Earnings Per Common Share $ 0.46 $ 0.36 28 36 $ 1.03 $ 1.08 (5) 2 Effective tax rate 20.0% 26.0% 25.2% 26.4% Adjusted Operating Profit $ 204 $ 193 $ 507 $ 490 Adjusted Net Income - Yum China Holdings, Inc. $ 178 $ 143 $ 408 $ 357 Adjusted Diluted Earnings Per Common Share $ 0.46 $ 0.36 $ 1.05 $ 0.89 Adjusted Effective Tax Rate 20.0% 26.0% 23.8% 26.6% Adjusted EBITDA $ 321 $ 329 $ 749 $ 746
(a) Represents the period-over-period change in percentage.
34
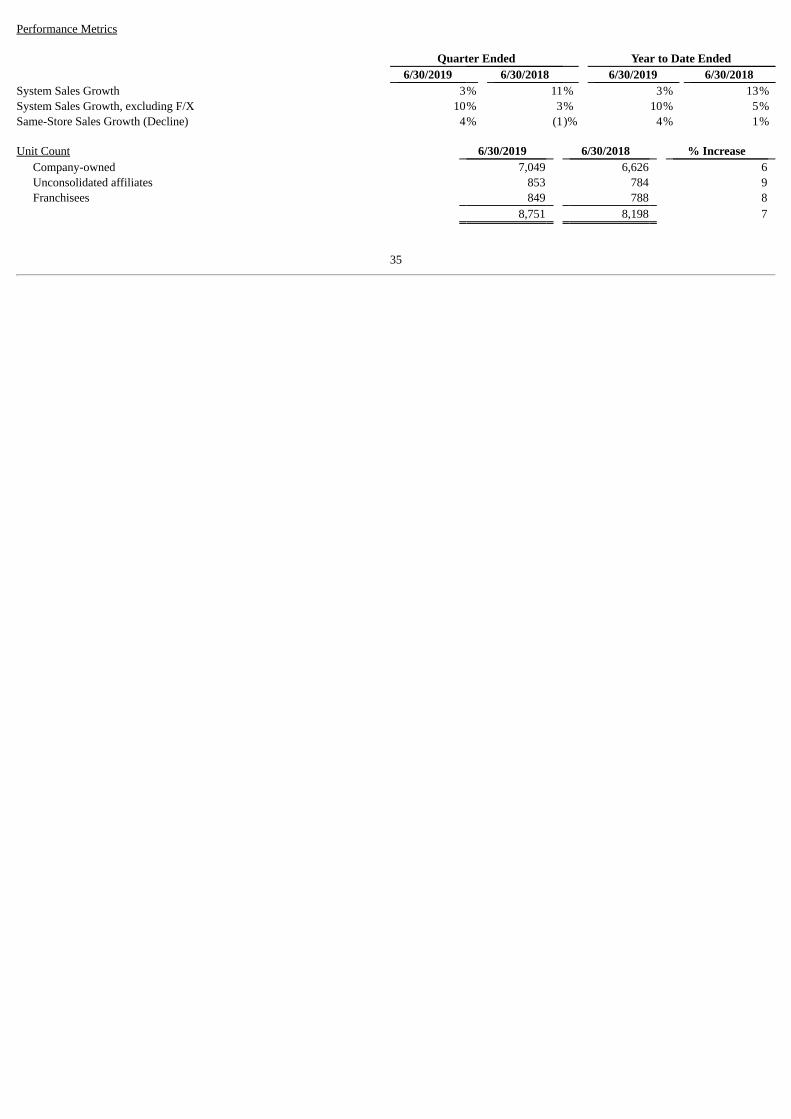
Performance Metrics
Quarter Ended Year to Date Ended 6/30/2019 6/30/2018 6/30/2019 6/30/2018
System Sales Growth 3% 11% 3% 13% System Sales Growth, excluding F/X 10% 3% 10% 5% Same-Store Sales Growth (Decline) 4% (1)% 4% 1%
Unit Count 6/30/2019 6/30/2018 % Increase
Company-owned 7,049 6,626 6 Unconsolidated affiliates 853 784 9 Franchisees 849 788 8
8,751 8,198 7
35

Special Items Special Items, along with the reconciliation of the most directly comparable GAAP financial measures to the non-GAAP financial measures, are presentedbelow.
Quarter Ended Year to Date Ended Detail of Special Items 6/30/2019 6/30/2018 6/30/2019 6/30/2018 Gain from re-measurement of equity interest upon acquisition(a) $ — $ — $ — $ 98 Special Items, Operating Profit — — — 98 Tax Expenses on Special Items(b) — — — (24)Impact from the Tax Act(c) — — (8) — Special items, net income – including noncontrolling interests — — (8) 74 Special items, net income – noncontrolling interests — — — — Special Items, Net income – Yum China Holdings, Inc. $ — $ — $ (8) $ 74 Weighted-average diluted shares outstanding (in millions) 389 398 389 400 Special Items, Diluted Earnings Per Common Share $ — $ — $ (0.02) $ 0.19 Reconciliation of Operating Profit to Adjusted Operating Profit Operating Profit $ 204 $ 193 $ 507 $ 588 Special Items, Operating Profit — — — 98 Adjusted Operating Profit $ 204 $ 193 $ 507 $ 490 Reconciliation of Net Income to Adjusted Net Income Net Income - Yum China Holdings, Inc. $ 178 $ 143 $ 400 $ 431 Special Items, Net Income – Yum China Holdings, Inc. — — (8) 74 Adjusted Net Income - Yum China Holdings, Inc. $ 178 $ 143 $ 408 $ 357 Reconciliation of EPS to Adjusted EPS Basic Earnings Per Common Share $ 0.47 $ 0.37 $ 1.06 $ 1.12 Special Items, Basic Earnings Per Common Share — — (0.02) 0.19 Adjusted Basic Earnings Per Common Share $ 0.47 $ 0.37 $ 1.08 $ 0.93 Diluted Earnings Per Common Share $ 0.46 $ 0.36 $ 1.03 $ 1.08 Special Items, Diluted Earnings Per Common Share — — (0.02) 0.19 Adjusted Diluted Earnings Per Common Share $ 0.46 $ 0.36 $ 1.05 $ 0.89 Reconciliation of Effective Tax Rate to Adjusted Effective Tax Rate Effective tax rate (See Note 12) 20.0% 26.0% 25.2% 26.4%Impact on effective tax rate as a result of Special Items(b)(c) —% —% 1.4% (0.2)%Adjusted effective tax rate 20.0% 26.0% 23.8% 26.6% (a) As a result of the acquisition of Wuxi KFC in the first quarter of 2018, the Company recognized a gain of $98 million from the re-measurement of
our previously held 47% equity interest at fair value, which was not allocated to any segment for performance reporting purposes. (See Note 2) (b) The tax expense was determined based upon the nature, as well as the jurisdiction, of each Special Item at the applicable tax rate. (c) We completed the evaluation of the impact on our transition tax computation based on the final regulations that were released by the U.S. Treasury
Department and the IRS and became effective in the first quarter of 2019, and recorded an additional amount of $8 million for the transition taxaccordingly.
36

Adjusted EBITDA Net income, along with the reconciliation to Adjusted EBITDA, is presented below.
Quarter Ended Year to Date Ended Reconciliation of Net Income to Adjusted EBITDA 6/30/2019 6/30/2018 6/30/2019 6/30/2018 Net Income — Yum China Holdings, Inc. $ 178 $ 143 $ 400 $ 431 Net Income — noncontrolling interests 7 7 14 15 Income tax provision 46 53 139 160 Interest income, net (10) (10) (19) (18)Investment gain (17) — (27) — Operating Profit 204 193 507 588 Special Items, Operating Profit — — — (98)Adjusted Operating Profit 204 193 507 490 Depreciation and amortization 106 117 217 235 Store impairment charges 11 19 25 21 Adjusted EBITDA $ 321 $ 329 $ 749 $ 746
Segment Results KFC
Quarter Ended Year to Date Ended % B/(W) % B/(W) 6/30/2019 6/30/2018 Reported Ex F/X 6/30/2019 6/30/2018 Reported Ex F/X
Company sales $ 1,410 $ 1,352 4 12 $ 2,949 $ 2,796 5 12 Franchise fees and income 33 33 2 10 69 70 — 6 Revenues from transactions with franchisees and unconsolidated affiliates 15 15 2 9 32 32 1 5 Total revenues $ 1,458 $ 1,400 4 12 $ 3,050 $ 2,898 5 12 Restaurant profit $ 225 $ 227 — 7 $ 534 $ 528 1 8 Restaurant margin % 16.1% 16.8% (0.7) ppts. (0.7) ppts. 18.1% 18.9% (0.8) ppts. (0.8) ppts. G&A expenses $ 49 $ 45 (11) (18) $ 98 $ 91 (8) (15) Franchise expenses $ 16 $ 17 2 (4) $ 35 $ 36 2 (5) Expenses for transactions with franchisees and unconsolidated affiliates $ 15 $ 15 (1) (8) $ 32 $ 32 — (5) Closures and impairment expenses, net $ — $ 6 NM NM $ 7 $ 6 (23) (27) Other income, net $ (12) $ (7) 61 76 $ (30) $ (30) (4) 3 Operating Profit $ 205 $ 199 3 10 $ 493 $ 495 (1) 6
37
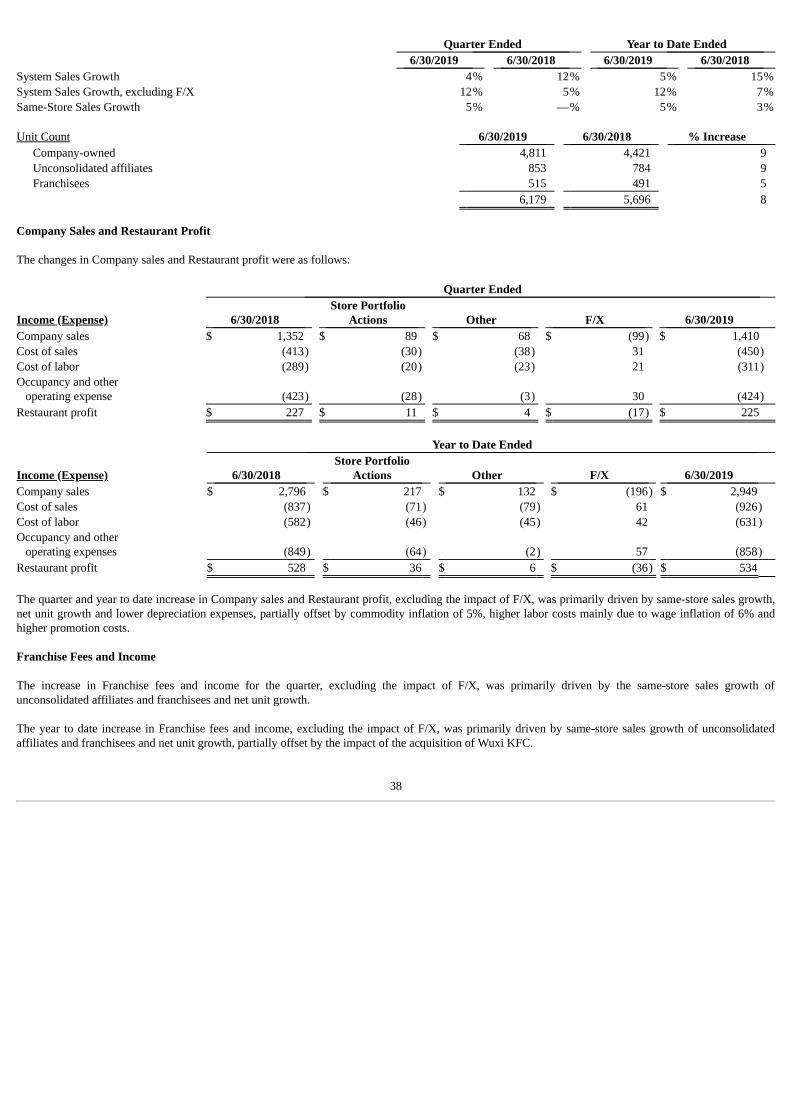
Quarter Ended Year to Date Ended 6/30/2019 6/30/2018 6/30/2019 6/30/2018
System Sales Growth 4% 12% 5% 15%System Sales Growth, excluding F/X 12% 5% 12% 7%Same-Store Sales Growth 5% —% 5% 3% Unit Count 6/30/2019 6/30/2018 % Increase
Company-owned 4,811 4,421 9 Unconsolidated affiliates 853 784 9 Franchisees 515 491 5
6,179 5,696 8
Company Sales and Restaurant Profit The changes in Company sales and Restaurant profit were as follows:
Quarter Ended
Income (Expense) 6/30/2018 Store Portfolio
Actions Other F/X 6/30/2019
Company sales $ 1,352 $ 89 $ 68 $ (99) $ 1,410 Cost of sales (413) (30) (38) 31 (450)Cost of labor (289) (20) (23) 21 (311)Occupancy and other operating expense (423) (28) (3) 30 (424)Restaurant profit $ 227 $ 11 $ 4 $ (17) $ 225
Year to Date Ended
Income (Expense) 6/30/2018 Store Portfolio
Actions Other F/X 6/30/2019 Company sales $ 2,796 $ 217 $ 132 $ (196) $ 2,949 Cost of sales (837) (71) (79) 61 (926) Cost of labor (582) (46) (45) 42 (631) Occupancy and other operating expenses (849) (64) (2) 57 (858) Restaurant profit $ 528 $ 36 $ 6 $ (36) $ 534
The quarter and year to date increase in Company sales and Restaurant profit, excluding the impact of F/X, was primarily driven by same-store sales growth,net unit growth and lower depreciation expenses, partially offset by commodity inflation of 5%, higher labor costs mainly due to wage inflation of 6% andhigher promotion costs. Franchise Fees and Income The increase in Franchise fees and income for the quarter, excluding the impact of F/X, was primarily driven by the same-store sales growth ofunconsolidated affiliates and franchisees and net unit growth. The year to date increase in Franchise fees and income, excluding the impact of F/X, was primarily driven by same-store sales growth of unconsolidatedaffiliates and franchisees and net unit growth, partially offset by the impact of the acquisition of Wuxi KFC.
38
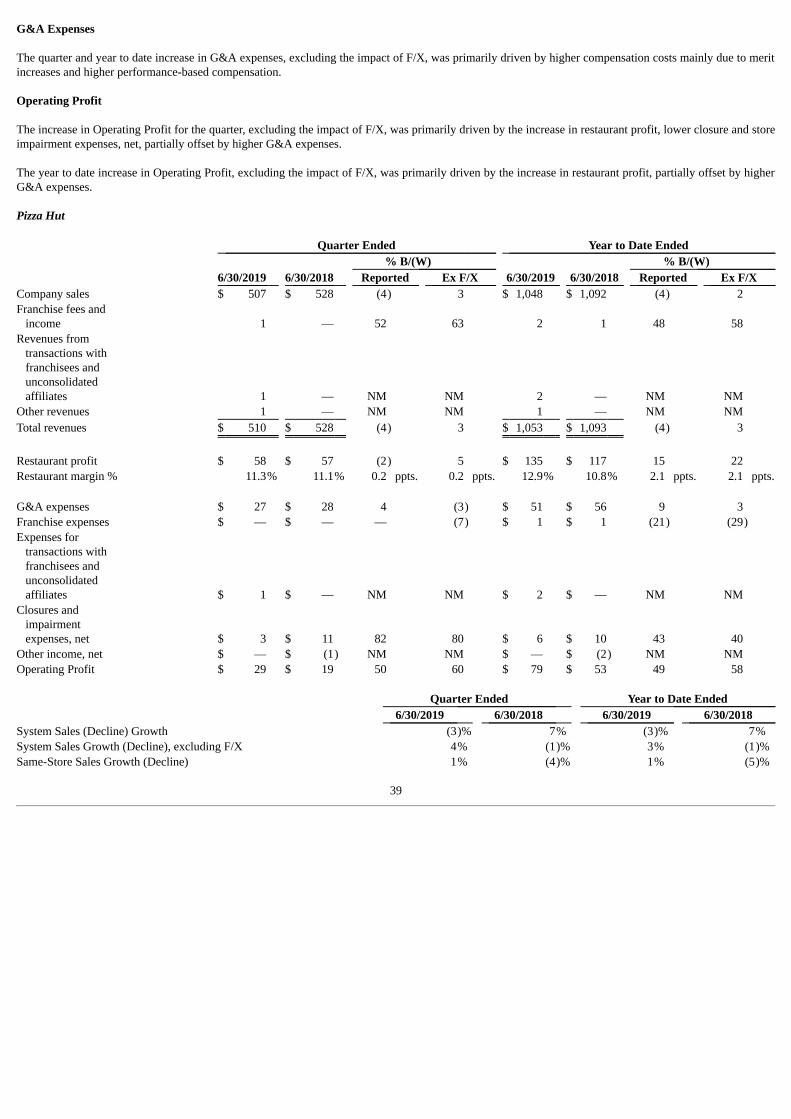
G&A Expenses The quarter and year to date increase in G&A expenses, excluding the impact of F/X, was primarily driven by higher compensation costs mainly due to meritincreases and higher performance-based compensation. Operating Profit The increase in Operating Profit for the quarter, excluding the impact of F/X, was primarily driven by the increase in restaurant profit, lower closure and storeimpairment expenses, net, partially offset by higher G&A expenses. The year to date increase in Operating Profit, excluding the impact of F/X, was primarily driven by the increase in restaurant profit, partially offset by higherG&A expenses. Pizza Hut
Quarter Ended Year to Date Ended % B/(W) % B/(W) 6/30/2019 6/30/2018 Reported Ex F/X 6/30/2019 6/30/2018 Reported Ex F/X
Company sales $ 507 $ 528 (4) 3 $ 1,048 $ 1,092 (4) 2 Franchise fees and income 1 — 52 63 2 1 48 58 Revenues from transactions with franchisees and unconsolidated affiliates 1 — NM NM 2 — NM NM Other revenues 1 — NM NM 1 — NM NM Total revenues $ 510 $ 528 (4) 3 $ 1,053 $ 1,093 (4) 3 Restaurant profit $ 58 $ 57 (2) 5 $ 135 $ 117 15 22 Restaurant margin % 11.3% 11.1% 0.2 ppts. 0.2 ppts. 12.9% 10.8% 2.1 ppts. 2.1 ppts. G&A expenses $ 27 $ 28 4 (3) $ 51 $ 56 9 3 Franchise expenses $ — $ — — (7) $ 1 $ 1 (21) (29) Expenses for transactions with franchisees and unconsolidated affiliates $ 1 $ — NM NM $ 2 $ — NM NM Closures and impairment expenses, net $ 3 $ 11 82 80 $ 6 $ 10 43 40 Other income, net $ — $ (1) NM NM $ — $ (2) NM NM Operating Profit $ 29 $ 19 50 60 $ 79 $ 53 49 58
Quarter Ended Year to Date Ended 6/30/2019 6/30/2018 6/30/2019 6/30/2018
System Sales (Decline) Growth (3)% 7% (3)% 7% System Sales Growth (Decline), excluding F/X 4% (1)% 3% (1)% Same-Store Sales Growth (Decline) 1% (4)% 1% (5)%
39

Unit Count 6/30/2019 6/30/2018 % Increase
Company-owned 2,178 2,179 — Franchisees 74 30 NM
2,252 2,209 2
Company Sales and Restaurant Profit The changes in Company sales and Restaurant profit were as follows:
Quarter Ended
Income (Expense) 6/30/2018 Store Portfolio
Actions Other F/X 6/30/2019 Company sales $ 528 $ 6 $ 8 $ (35) $ 507 Cost of sales (156) (2) (8) 11 (155)Cost of labor (133) (1) (13) 10 (137)Occupancy and other operating expenses (182) 1 13 11 (157)Restaurant profit $ 57 $ 4 $ — $ (3) $ 58
Year to Date Ended
Income (Expense) 6/30/2018 Store Portfolio
Actions Other F/X 6/30/2019 Company sales $ 1,092 $ 11 $ 14 $ (69) $ 1,048 Cost of sales (323) (3) (9) 21 (314) Cost of labor (280) (1) (17) 18 (280) Occupancy and other operating expenses (372) 1 31 21 (319) Restaurant profit $ 117 $ 8 $ 19 $ (9) $ 135
The quarter and year to date increase in Company sales and Restaurant profit, excluding the impact of F/X, was primarily driven by same-store sales growth,store portfolio actions, labor efficiency, commodity deflation and lower depreciation expenses, partially offset by higher promotion costs, and higher laborcosts mainly attributable to wage inflation of 5%. G&A Expenses The increase in G&A expenses for the quarter, excluding the impact of F/X, was primarily driven by higher compensation costs due to higher performance-based compensation and merit increases, partially offset by lower cost allocation reflecting reduced development activities. The year to date decrease in G&A expenses, excluding the impact of F/X, was primarily driven by lower cost allocation reflecting reduced developmentactivities, partially offset by higher compensation costs due to higher performance-based compensation and merit increases. Operating Profit The quarter and year to date increase in Operating Profit, excluding the impact of F/X, was primarily driven by the increase in restaurant profit and lowerclosure and store impairment expenses, net.
40

All Other Segments All Other Segments reflects the results of East Dawning, Little Sheep, Taco Bell, Daojia, COFFii & JOY and our e-commerce business.
Quarter Ended Year to Date Ended % B/(W) % B/(W) 6/30/2019 6/30/2018 Reported Ex F/X 6/30/2019 6/30/2018 Reported Ex F/X
Company sales $ 9 $ 8 27 36 $ 18 $ 16 14 22 Franchise fees and income 2 1 38 47 4 3 33 41 Revenues from transactions with franchisees and unconsolidated affiliates 5 4 25 33 12 11 12 19 Other revenues 16 7 NM NM 30 11 NM NM Total revenues $ 32 $ 20 62 72 $ 64 $ 41 56 65 Restaurant profit $ — $ — (65) (75) $ (1) $ — NM NM Restaurant margin % (9.9)% (7.6)% (2.3) ppts. (2.3) ppts. (7.8)% (2.7)% (5.1) ppts. (5.1) ppts. G&A expenses $ 8 $ 9 9 4 $ 16 $ 16 1 (4) Expenses for transactions with franchisees and unconsolidated affiliates $ 5 $ 3 (48) (57) $ 11 $ 9 (22) (30) Other operating costs and expenses $ 14 $ 7 (91) (100) $ 26 $ 11 NM NM Closures and impairment expenses, net $ 1 $ — NM NM $ 2 $ — NM NM Operating Loss $ (5) $ (6) 4 — $ (10) $ (10) 3 (1)
Quarter Ended Year to Date Ended 6/30/2019 6/30/2018 6/30/2019 6/30/2018
Same-Store Sales Decline (7)% (10)% (12)% (7)% The quarter and year to date increase in Company sales, excluding the impact of F/X, was primarily driven by higher sales generated from our e-commercebusiness and the launch of COFFii & JOY. The quarter and year to date increase in Other revenue and Other operating costs and expenses, excluding the impact of F/X, was primarily driven by inter-segment revenue transactions generated from our e-commerce business and Daojia.
41
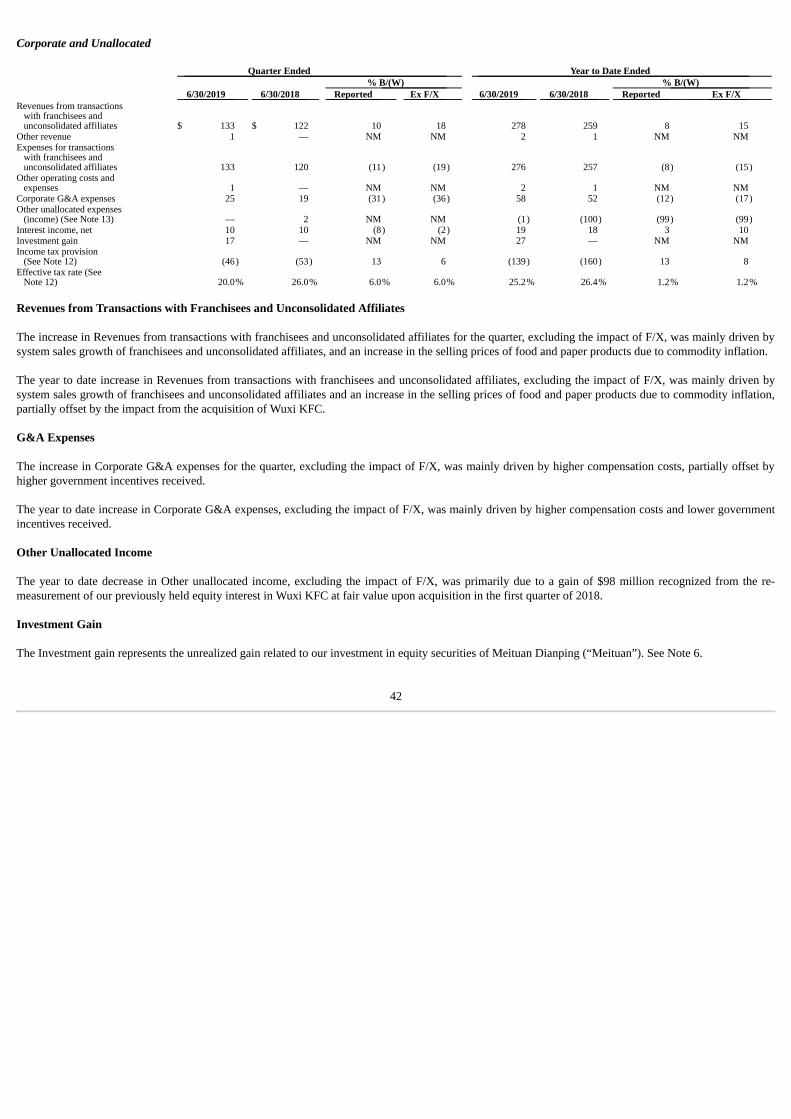
Corporate and Unallocated
Quarter Ended Year to Date Ended % B/(W) % B/(W) 6/30/2019 6/30/2018 Reported Ex F/X 6/30/2019 6/30/2018 Reported Ex F/X
Revenues from transactions with franchisees and unconsolidated affiliates $ 133 $ 122 10 18 278 259 8 15 Other revenue 1 — NM NM 2 1 NM NM Expenses for transactions with franchisees and unconsolidated affiliates 133 120 (11) (19) 276 257 (8) (15) Other operating costs and expenses 1 — NM NM 2 1 NM NM Corporate G&A expenses 25 19 (31) (36) 58 52 (12) (17) Other unallocated expenses (income) (See Note 13) — 2 NM NM (1) (100) (99) (99) Interest income, net 10 10 (8) (2) 19 18 3 10 Investment gain 17 — NM NM 27 — NM NM Income tax provision (See Note 12) (46) (53) 13 6 (139) (160) 13 8 Effective tax rate (See Note 12) 20.0% 26.0% 6.0% 6.0%
25.2% 26.4% 1.2% 1.2%
Revenues from Transactions with Franchisees and Unconsolidated Affiliates The increase in Revenues from transactions with franchisees and unconsolidated affiliates for the quarter, excluding the impact of F/X, was mainly driven bysystem sales growth of franchisees and unconsolidated affiliates, and an increase in the selling prices of food and paper products due to commodity inflation. The year to date increase in Revenues from transactions with franchisees and unconsolidated affiliates, excluding the impact of F/X, was mainly driven bysystem sales growth of franchisees and unconsolidated affiliates and an increase in the selling prices of food and paper products due to commodity inflation,partially offset by the impact from the acquisition of Wuxi KFC. G&A Expenses The increase in Corporate G&A expenses for the quarter, excluding the impact of F/X, was mainly driven by higher compensation costs, partially offset byhigher government incentives received. The year to date increase in Corporate G&A expenses, excluding the impact of F/X, was mainly driven by higher compensation costs and lower governmentincentives received. Other Unallocated Income The year to date decrease in Other unallocated income, excluding the impact of F/X, was primarily due to a gain of $98 million recognized from the re-measurement of our previously held equity interest in Wuxi KFC at fair value upon acquisition in the first quarter of 2018. Investment Gain The Investment gain represents the unrealized gain related to our investment in equity securities of Meituan Dianping (“Meituan”). See Note 6.
42
Income Tax Provision Our income tax provision includes tax on our earnings at the Chinese statutory tax rate of 25%, withholding tax on repatriation of earnings outside of Chinaand U.S. corporate income tax, if any. Our effective tax rate was 20.0% and 26.0% for the quarters ended June 30, 2019 and 2018, respectively, and 25.2%and 26.4% for the years to date ended June 30, 2019 and 2018, respectively. The lower effective tax rate for the quarter was primarily due to lower accruedtax on GILTI, non-taxable gain related to our investment in equity securities of Meituan and lower foreign withholding tax on estimated repatriation ofearnings outside of China. The lower year to date effective tax rate was primarily due to lower accrued tax on GILTI and non-taxable gain related to ourinvestment in equity securities of Meituan, partially offset by the additional adjustment of $8 million on transition tax pursuant to the Tax Act recorded in thefirst quarter of 2019. Significant Known Events, Trends or Uncertainties Expected to Impact Future Results Tax Examination on Transfer Pricing We are subject to reviews, examinations and audits by Chinese tax authorities, the IRS and other taxing authorities with respect to income and non-incomebased taxes. Currently we are under a national audit on transfer pricing by the STA in China regarding our related party transactions for the period from 2006to 2015. It is reasonably possible that there could be significant developments within the next 12 months. The ultimate assessment will depend upon furtherreview of the information provided and ongoing discussions with the STA and in-charge local tax authorities, and therefore it is not possible to reasonablyestimate the potential impact. We will continue to defend our transfer pricing position. However, if the STA prevails in the assessment of additional tax duebased on its ruling, the assessed tax, interest and penalties, if any, could have a material adverse impact on our financial position, results of operations andcash flows. PRC Value-Added Tax (“VAT”) Effective May 1, 2016, the Chinese government implemented reform to its retail tax structure, which is intended to be a progressive and positive shift to moreclosely align with a more modern service-based economy. Under this reform, a 6% output VAT replaced the 5% business tax (“BT”) previously applied tocertain restaurant sales. VAT was imposed on goods and services at the rates of 17%, 13%, 11% and 6%. Input VAT would be creditable to theaforementioned 6% output VAT. Effective from July 1, 2017, the 13% VAT rate primarily applicable to certain agricultural products was reduced to11%. Effective from May 1, 2018, the VAT rates of 17% and 11% were lowered to 16% and 10%, respectively. Effective from April 1, 2019, the VAT rates of16% and 10% were further lowered to 13% and 9%, respectively. These rate changes impact our input VAT on all materials and certain services, mainlyincluding construction, transportation and leasing. However, the impact on our operating results is not expected to be significant. Entities that are VAT general taxpayers are permitted to offset qualified input VAT paid to suppliers against their output VAT upon receipt of appropriatesupplier VAT invoices on an entity-by-entity basis. When the output VAT exceeds the input VAT, the difference is remitted to tax authorities, usually on amonthly basis; whereas when the input VAT exceeds the output VAT, the difference is treated as an input VAT credit asset which can be carried forwardindefinitely to offset future net VAT payables. VAT related to purchases and sales which have not been settled at the balance sheet date is disclosed separatelyas an asset and liability, respectively, on the Condensed Consolidated Balance Sheets. At each balance sheet date, the Company reviews the outstandingbalance of any input VAT credit asset for recoverability based on its forecasted operating results. We evaluate the recoverability of the net VAT credit assetbased on our estimated operating results and capital spending, which inherently includes significant assumptions that are subject to change.
43

As of June 30, 2019, an input VAT credit asset of $243 million and payable of $7 million were recorded in Other assets and Accounts payable and othercurrent liabilities, respectively, on the Condensed Consolidated Balance Sheets. The Company has not made an allowance for the recoverability of the inputVAT credit asset, as the balance is expected to be utilized to offset against VAT payables more than one year from June 30, 2019. Any input VAT credit assetwould be classified as Prepaid expenses and other current assets if the Company expected to use the credit within one year. We have been benefiting from the retail tax structure reform since it was implemented on May 1, 2016. However, the amount of our expected benefit fromthis VAT regime depends on a number of factors, some of which are outside of our control. The interpretation and application of the new VAT regime are notsettled at some local governmental levels. In addition, the timetable for enacting the prevailing VAT regulations into national VAT law, including ultimateenacted VAT rates, is not clear. As a result, for the foreseeable future, the benefit of this significant and complex VAT reform has the potential to fluctuatefrom quarter to quarter. Foreign Currency Exchange Rate The reporting currency of the Company is the US$. Most of the revenues, costs, assets and liabilities of the Company are denominated in Chinese Renminbi(“RMB”). Any significant change in the exchange rate between US$ and RMB may materially affect the Company’s business, results of operations, cashflows and financial condition, depending on the weakening or strengthening of RMB against the US$. See “Item 3. Quantitative and Qualitative DisclosuresAbout Market Risk” for further discussion. Consolidated Cash Flows Our cash flows for the years to date ended June 30, 2019 and 2018 were as follows: Net cash provided by operating activities was $657 million in 2019 as compared to $819 million in 2018. The decrease was primarily driven by timing ofpayments for inventory. Net cash used in investing activities was $368 million in 2019 as compared to $406 million in 2018. The decrease is mainly due to lapping cash outflow in2018 related to the acquisition of Wuxi KFC, and lower capital expenditures in 2019, partially offset by higher cash outflow related to short-term investmentactivities in 2019. Net cash used in financing activities was $259 million in 2019 as compared to $186 million in 2018. The increase was primarily driven by an increase inthe number of shares repurchased and cash dividends paid to stockholders in 2019. Liquidity and Capital Resources Historically we have funded our operations through cash generated from the operation of our Company-owned stores and from our franchise operations anddividend payments from our unconsolidated affiliates. Our ability to fund our future operations and capital needs will depend on our ongoing ability to generate cash from operations. We believe our principal usesof cash in the future will be primarily to fund our operations and capital expenditures, distributions to our stockholders and share repurchases as well as anyacquisition or investment we may make. We believe that our future cash from operations, together with our access to funds on hand and capital markets, willprovide adequate resources to fund these uses of cash and that our existing cash and net cash from operations will be sufficient to fund our operations andanticipated capital expenditures for the next 12 months.
44
If our cash flows from operations are less than we require, we may need to access the capital markets to obtain financing. Our access to, and the availabilityof, financing on acceptable terms and conditions in the future or at all will be impacted by many factors, including, but not limited to: • our financial performance;
• our credit ratings;
• the liquidity of the overall capital markets; and
• the state of the Chinese, U.S. and global economies. There can be no assurance that we will have access to the capital markets on terms acceptable to us or at all. Generally our income is subject to the Chinese statutory tax rate of 25%. However, to the extent our cash flows from operations exceed our China cashrequirements, the excess cash may be subject to an additional 10% withholding tax levied by the Chinese tax authority, subject to any reduction or exemptionset forth in relevant tax treaties or tax arrangements. Dividends and Share Repurchases Our Board of Directors has authorized an aggregate of $1.4 billion under our share repurchase program. Yum China may repurchase shares under thisprogram from time to time in open market or privately negotiated transactions, including block trades, accelerated share repurchase transactions and the useof Rule 10b5-1 trading plans. For the year to date ended June 30, 2019, the Company repurchased $140 million, or 3.5 million shares, of common stock underthe repurchase program. The Company repurchased $73 million, or 1.9 million shares, of common stock under the repurchase program for the year to dateended June 30, 2018. For the quarters to date ended June 30, 2019 and 2018, we paid cash dividends of approximately $45 million and $38 million, respectively, to ourstockholders through quarterly dividend payments of $0.12 and $0.10 per share, respectively. On July 30, 2019, the Board of Directors declared a cash dividend of $0.12 per share, payable as of the close of business on September 17, 2019 tostockholders of record as of the close of business on August 27, 2019. The total estimated cash dividend payable is approximately $46 million. Our ability to declare and pay any dividends on our stock may be restricted by applicable Chinese laws. The laws, rules and regulations applicable to ourChinese subsidiaries permit payments of dividends only out of their accumulated profits, if any, determined in accordance with applicable Chinese accountingstandards and regulations. Under Chinese law, an enterprise incorporated in China is required to set aside at least 10% of its after-tax profits each year, aftermaking up previous years’ accumulated losses, if any, to fund certain statutory reserve funds, until the aggregate amount of such a fund reaches 50% of itsregistered capital. As a result, our Chinese subsidiaries are restricted in their ability to transfer a portion of their net assets to us in the form of dividends. Atthe discretion of the Board of Directors, as an enterprise incorporated in China, each of our Chinese subsidiaries may allocate a portion of its after-tax profitsbased on Chinese accounting standards to staff welfare and bonus funds. These reserve funds and staff welfare and bonus funds are not distributable as cashdividends. Borrowing Capacity As of June 30, 2019, the Company had credit facilities of RMB 2,873 million (approximately $418 million), comprised of onshore credit facilities ofRMB1,500 million (approximately $218 million) in the aggregate and offshore credit facilities of $200 million in the aggregate.
45

The credit facilities had remaining terms of one year or less as of June 30, 2019. Each credit facility bears interest based on the prevailing rate stipulated bythe People’s Bank of China or London Interbank Offered Rate (LIBOR) administered by the ICE Benchmark Administration. Each credit facility contains across-default provision whereby our failure to make any payment on a principal amount from any credit facility will constitute a default on other creditfacilities. Some of the credit facilities contain covenants including, among other things, limitations on certain additional indebtedness and liens, and certainother transactions specified in the respective agreement. Some of the onshore credit facilities contain sublimits for overdrafts, non-financial bonding, standbyletters of credit and guarantees. As of June 30, 2019, we had outstanding bank guarantees of RMB 70 million (approximately $10 million) to secure our leasepayment to landlords for certain Company-owned restaurants. The borrowing capacity under the credit facilities was therefore reduced by the same amount,while there were no borrowings outstanding as of June 30, 2019. Off-Balance Sheet Arrangements See the Guarantees section of Note 14 for discussion of our off-balance sheet arrangements. New Accounting Pronouncements Recently Adopted Accounting Pronouncements See Note 2 for details of recently adopted accounting pronouncements. New Accounting Pronouncements Not Yet Adopted In June 2016, the FASB issued ASU 2016-13, Financial Instruments – Credit Losses (Topic 326): Measurement of Credit Losses on Financial Instruments(“ASU 2016-13”), which requires measurement and recognition of expected versus incurred credit losses for financial assets held. In November 2018, theFASB issued ASU 2018-19: Codification Improvements to Topic 326, Financial Instruments-Credit Losses to clarify the implementation guidance. ASU2016-13 is effective for the Company from January 1, 2020, with early adoption permitted. The adoption of this standard may result in a change of ourprovision policy primarily for accounts receivable, and we are currently evaluating the impact the adoption of this standard will have on our financialstatements. In August 2018, the FASB issued ASU 2018-13, Fair Value Measurement (Topic 820): Disclosure Framework—Changes to the Disclosure Requirements forFair Value Measurement (“ASU 2018-13”), which amended the fair value measurement guidance by modifying the disclosure requirements. ASU 2018-13 iseffective for the Company from January 1, 2020, with early adoption permitted. We are currently evaluating the impact the adoption of this standard will haveon our financial statements. In August 2018, the FASB issued ASU 2018-15, Intangibles—Goodwill and Other—Internal-Use Software: Customer’s Accounting for Implementation CostsIncurred in a Cloud Computing Arrangement That Is a Service Contract (“ASU 2018-15”), which aligns the requirements for capitalizing implementationcosts in a cloud computing arrangement service contract with those for an internal-use software license. ASU 2018-15 is effective for the Company fromJanuary 1, 2020, with early adoption permitted. We are currently evaluating the impact the adoption of this standard will have on our financial statements. In November 2018, the FASB issued ASU 2018-18, Collaborative Arrangements (Topic 808), Clarifying the Interaction between Topic 808 and Topic 606(ASU 2018-18) (“ASU 2018-18”), which clarifies that transactions in a collaborative arrangement should be accounted for under ASC 606 when thecounterparty is a customer for a distinct good or service. The amendment also precludes an entity from presenting consideration from a transaction in acollaborative arrangement as revenue if the counterparty is not a customer for that transaction. ASU 2018-18 is effective for the Company from January 1,2020, with early adoption permitted. We are currently evaluating the impact the adoption of this standard will have on our financial statements.
46

Cautionary Note Regarding Forward-Looking Statements Forward-looking statements can be identified by the fact that they do not relate strictly to historical or current facts. These statements often include wordssuch as “may,” “will,” “estimate,” “intend,” “seek,” “expect,” “project,” “anticipate,” “believe,” “plan,” “could,” “target,” “predict,” “likely,” “should,”“forecast,” “outlook,” “model,” “continue,” “ongoing” or other similar terminology. Forward-looking statements are based on our expectations, estimates,assumptions or projections concerning future results or events as of the date of the filing of this Form 10-Q. Forward-looking statements are neitherpredictions nor guarantees of future events, circumstances or performance and are inherently subject to known and unknown risks, uncertainties andassumptions that could cause our actual results and events to differ materially from those indicated by those statements. We cannot assure you that any of ourassumptions are correct or any of our expectations, estimates or projections will be achieved. Numerous factors could cause our actual results to differmaterially from those expressed or implied by forward-looking statements, including, without limitation, the following: • Risks related to our business and industry, such as (a) food safety and food-borne illness concerns, (b) significant failure to maintain effective
quality control systems for our restaurants, (c) significant liability claims, food contamination complaints from our customers or reports ofincidents of food tampering, (d) health concerns arising from outbreaks of viruses or other diseases, (e) the fact that we derive substantially all ofour revenue from our operations in China, (f) the fact that the operation of our restaurants is subject to the terms of the master license agreementwith YUM, (g) the fact that our success is tied to the success of YUM’s brand strength, marketing campaigns and product innovation, (h)shortages or interruptions in the availability and delivery of food and other supplies, (i) fluctuation of raw materials prices, (j) our inability toattain our target development goals and the potential cannibalization of existing sales by aggressive development, (k) risks associated with leasingreal estate, (l) inability to obtain desirable restaurant locations on commercially reasonable terms, (m) labor shortages or increases in labor costs,(n) the fact that our success depends substantially on our corporate reputation and on the value and perception of our brands, (o) the occurrence ofsecurity breaches and cyber-attacks, (p) failure to protect the integrity and security of our customer or employee personal, financial or other dataor our proprietary or confidential information that is stored in our information systems or by third parties on our behalf, (q) failures orinterruptions of service or security breaches in our information technology systems, (r) the fact that our business depends on the performance of,and our long-term relationships with, third-party mobile payment processors, delivery aggregators, internet infrastructure operators and internetservice providers, (s) failure to provide timely and reliable delivery services by our restaurants, (t) our growth strategy with respect to COFFii &JOY may not be successful, (u) challenges and risks related to our new e-commerce business; (v) the anticipated benefits of the acquisition ofDaojia may not be realized in a timely manner or at all, (w) the Chinese government may determine that the VIE structure of Daojia does notcomply with Chinese laws on foreign investment in restricted industries, (x) our inability or failure to recognize, respond to and effectivelymanage the accelerated impact of social media, (y) litigation and failure to comply with anti-bribery or anti-corruption laws, (z) U.S. federalincome taxes, changes in tax rates, disagreements with taxing authorities (including with respect to the transfer pricing audit) and imposition ofnew taxes, (aa) changes in consumer discretionary spending and general economic conditions, (bb) competition in the retail food industry, (cc)loss or failure to obtain or renew any or all of the approvals, licenses and permits to operate our business, (dd) our inability to adequately protectthe intellectual property we own or have the right to use, (ee) YUM’s failure to protect its intellectual property, (ff) seasonality and certain majorevents in China, (gg) our failure to detect, deter and prevent all instances of fraud or other misconduct committed by our employees, customers orother third parties, (hh) changes in accounting standards and subjective assumptions, estimates and judgments by management related to complexaccounting matters, (ii) failure of our insurance policies to provide adequate coverage for claims associated with our business operations, (jj)failure by us to maintain effective disclosure controls and procedures and internal control over financial reporting in accordance with the rules ofthe SEC and (kk) unforeseeable business interruptions;
47

• Risks related to doing business in China, such as (a) changes in Chinese political policies and economic and social policies or conditions, (b)
uncertainties with respect to the interpretation and enforcement of Chinese laws, rules and regulations, (c) changes in trade relations between theUnited States and China, including the imposition of new or higher taxes on goods imported from the United States, (d) fluctuation in the value ofthe Chinese Renminbi, (e) limitations on our ability to utilize our cash balances effectively due to governmental control of currency conversionand payments of foreign currency, (f) changes in laws and regulations, (g) reliance on distributions by our operating subsidiaries in China to fundoffshore cash requirements, (h) potential unfavorable tax consequences resulting from our classification as a China resident enterprise for Chineseenterprise income tax purposes, (i) uncertainty regarding indirect transfers of equity interests and enhanced scrutiny by Chinese tax authorities, (j)difficulties in effecting service of legal process, enforcing foreign judgments or bringing original actions in China against us, (k) inability to useproperties due to defects caused by non-registration of lease agreements related to certain properties, (l) risk in relation to unexpected landacquisitions, building closures or demolitions, (m) potential fines for failure to comply with law and (n) restrictions on our ability to make loansor additional capital contributions to our Chinese subsidiaries due to Chinese regulation of loans to, and direct investment in, Chinese entities byoffshore holding companies and governmental control of currency conversion;
• Risks related to the separation and related transactions, such as (a) not achieving all of the anticipated benefits, (b) incurring significant taxliabilities if the distribution does not qualify as a transaction that is generally tax-free for U.S. federal income tax purposes and the Companycould be required to indemnify YUM for material taxes and other related amounts pursuant to indemnification obligations under the tax mattersagreement, (c) being obligated to indemnify YUM for material taxes and related amounts pursuant to indemnification obligations under the taxmatters agreement if YUM is subject to Chinese indirect transfer tax with respect to the distribution, (d) limitations on our ability to engage instrategic transactions as a result of the separation, (e) our inability to satisfy financial reporting and other requirements to which we are subject asan independent publicly traded company, (f) limited experience of our management in managing a public company, (g) inability to access capitalmarkets on acceptable terms, (h) increased administrative and other costs incurred by virtue of our status as an independent public company, (i)limitations on our ability to compete with YUM and other restrictions on our operations contained in the master license agreement, (j) failure byYUM to perform its obligations under the transaction agreements that we entered into with it as part of the separation, (k) potentialindemnification liabilities owing to YUM pursuant to the separation and distribution agreement and there being no assurance that the indemnityprovided by YUM with respect to certain liabilities in connection with the separation will be sufficient to insure us against the full amount of suchliabilities, (l) the possibility that a court would require that we assume responsibility for obligations allocated to YUM under the separation anddistribution agreement, (m) potential liabilities due to fraudulent transfer considerations and (n) actual or potential conflicts of interest of certainof our executive officers and directors because of their previous positions at YUM.
In addition, other risks and uncertainties not presently known to us or that we currently believe to be immaterial could affect the accuracy of any suchforward-looking statements. All forward-looking statements should be evaluated with the understanding of their inherent uncertainty. You should consult ourfilings with the Securities and Exchange Commission (including the information set forth under the captions “Management’s Discussion and Analysis ofFinancial Condition and Results of Operations” and “Risk Factors” included in the Company’s Annual Report on Form 10-K for the year ended December 31,2018) for additional information regarding factors that could affect our financial and other results. You should not place undue reliance on forward-lookingstatements, which speak only as of the date of the filing of this Form 10-Q. We are not undertaking to update any of these statements, except as required bylaw.
48

Item 3. Quantitative and Qualitative Disclosures About Market Risk Foreign Currency Exchange Rate Risk Changes in foreign currency exchange rates impact the translation of our reported foreign currency denominated earnings, cash flows and net investments inforeign operations, virtually all of which are denominated in RMB. While substantially all of our supply purchases are denominated in RMB, from time totime, we enter into agreements at predetermined exchange rates with third parties to purchase certain amount of goods and services sourced overseas andmake payments in the corresponding local currencies when practical, to minimize the related foreign currency exposure with immaterial impact on ourfinancial statements. As substantially all of the Company’s assets are located in China, the Company is exposed to movements in the RMB foreign currency exchange rate. For thequarter ended June 30, 2019, the Company’s Operating Profit would have decreased by approximately $20 million if the RMB weakened 10% relative to theUS$. This estimated reduction assumes no changes in sales volumes or local currency sales or input prices. Commodity Price Risk We are subject to volatility in food costs as a result of market risks associated with commodity prices. Our ability to recover increased costs through higherpricing is, at times, limited by the competitive environment in which we operate. We manage our exposure to this risk primarily through pricing agreementswith our vendors. Investment Risk In September 2018, we invested $74 million in Meituan’s ordinary shares. The equity investment is recorded at fair value, which is measured on a recurringbasis and is subject to market price volatility. See Note 6 for further discussion on our investment in Meituan. Item 4. Controls and Procedures Evaluation of Disclosure Controls and Procedures The Company has evaluated the effectiveness of the design and operation of its disclosure controls and procedures pursuant to Rules 13a-15(e) and 15d-15(e)under the Securities Exchange Act of 1934 as of the end of the period covered by this report. Based on the evaluation, performed under the supervision andwith the participation of the Company’s management, including the Chief Executive Officer (the “CEO”) and the Chief Financial Officer (the “CFO”), theCompany’s management, including the CEO and the CFO, concluded that the Company’s disclosure controls and procedures were effective as of the end ofthe period covered by this report. Changes in Internal Control Over Financial Reporting There were no changes with respect to the Company’s internal control over financial reporting or in other factors that materially affected, or are reasonably likelyto materially affect, internal control over financial reporting during the quarter ended June 30, 2019.
49
PART II – Other Information Item 1. Legal Proceedings
Information regarding legal proceedings is incorporated by reference from Note 14 to the Company’s Condensed Consolidated Financial Statements set forthin Part I of this report. Item 1A. Risk Factors We face a variety of risks that are inherent in our business and our industry, including operational, legal and regulatory risks. Such risks could cause ouractual results to differ materially from our forward-looking statements, expectations and historical trends. There have been no material changes from the riskfactors disclosed in Part I, Item 1A. “Risk Factors” in our Annual Report on Form 10-K for the year ended December 31, 2018, which was filed with the SECon February 27, 2019. Item 2. Unregistered Sales of Equity Securities and Use of Proceeds On February 7, 2017, we announced that our Board of Directors authorized a $300 million share repurchase program. On October 4, 2017, the Board ofDirectors increased Yum China’s share repurchase authorization from $300 million to an aggregate of $550 million. On October 30, 2018, the Board of Directors further increased the share repurchase authorization to an aggregate of $1.4 billion. The authorizations do nothave an expiration date. The following table provides information as of June 30, 2019 with respect to shares of Yum China common stock repurchased by the Company during thequarter then ended:
Period
TotalNumber of
SharesRepurchased(thousands)
AveragePrice PaidPer Share
TotalNumber of
SharesRepurchased
as Part ofPublicly
AnnouncedPlans or
Programs(thousands)
ApproximateDollar Value
of Sharesthat May
Yet BeRepurchased
under thePlans or
Programs(millions)
4/1/19-4/30/19 471 $ 44.62 471 $ 874 5/1/19-5/31/19 822 $ 41.28 822 $ 840 6/1/19-6/30/19 466 $ 42.90 466 $ 820 Total 1,759 $ 42.60 1,759 $ 820
50

Item 6. Exhibits
ExhibitNumber Description of Exhibits 3.1
Amended and Restated Certificate of Incorporation of Yum China Holdings, Inc. (incorporated by reference to Exhibit 3.1 to Yum ChinaHoldings, Inc.’s Current Report on Form 8-K filed on November 1, 2016).
3.2
Amended and Restated Bylaws of Yum China Holdings, Inc. (incorporated by reference to Exhibit 3.2 to Yum China Holdings, Inc.’s CurrentReport on Form 8-K filed on November 1, 2016).
31.1 Certification of the Chief Executive Officer pursuant to Rule 13a-14(a) of Securities Exchange Act of 1934, as adopted pursuant to Section302 of the Sarbanes-Oxley Act of 2002.*
31.2 Certification of the Chief Financial Officer pursuant to Rule 13a-14(a) of Securities Exchange Act of 1934, as adopted pursuant to Section
302 of the Sarbanes-Oxley Act of 2002.* 32.1 Certification of the Chief Executive Officer pursuant to 18 U.S.C. Section 1350, as adopted pursuant to Section 906 of the Sarbanes-Oxley
Act of 2002.* 32.2 Certification of the Chief Financial Officer pursuant to 18 U.S.C. Section 1350, as adopted pursuant to Section 906 of the Sarbanes-Oxley Act
of 2002.* 101.INS XBRL Instance Document - the instance document does not appear in the Interactive Data File because its XBRL tags are embedded within
the Inline XBRL document * 101.SCH Inline XBRL Taxonomy Extension Schema Document * 101.CAL Inline XBRL Taxonomy Extension Calculation Linkbase Document * 101.LAB Inline XBRL Taxonomy Extension Label Linkbase Document * 101.PRE Inline XBRL Taxonomy Extension Presentation Linkbase Document * 101.DEF Inline XBRL Taxonomy Extension Definition Linkbase Document * * Filed or furnished herewith.
51

SIGNATURES
Pursuant to the requirement of the Securities Exchange Act of 1934, the registrant has duly caused this report to be signed on its behalf by the undersigned,thereunto duly authorized. Yum China Holdings, Inc. (Registrant)
Date: August 5, 2019 /s/ Xueling Lu Controller and Principal Accounting Officer
52

Exhibit 31.1
CERTIFICATION
I, Joey Wat, certify that:
1. I have reviewed this Quarterly Report on Form 10-Q of Yum China Holdings, Inc.;
2. Based on my knowledge, this report does not contain any untrue statement of a material fact or omit to state a material fact necessary tomake the statements made, in light of the circumstances under which such statements were made, not misleading with respect to the periodcovered by this report;
3. Based on my knowledge, the financial statements, and other financial information included in this report, fairly present in all materialrespects the financial condition, results of operations and cash flows of the registrant, as of, and for, the periods presented in this report;
4. The registrant’s other certifying officer and I are responsible for establishing and maintaining disclosure controls and procedures (as definedin Exchange Act Rules 13a-15(e) and 15d-15(e)) and internal control over financial reporting (as defined in Exchange Act Rules 13a-15(f)and 15d-15(f)) for the registrant and have:
(a) Designed such disclosure controls and procedures, or caused such disclosure controls and procedures to be designed under oursupervision, to ensure that material information relating to the registrant, including its consolidated subsidiaries, is made knownto us by others within those entities, particularly during the period in which this report is being prepared;
(b) Designed such internal control over financial reporting, or caused such internal control over financial reporting to be designedunder our supervision, to provide reasonable assurance regarding the reliability of financial reporting and the preparation offinancial statements for external purposes in accordance with generally accepted accounting principles;
(c) Evaluated the effectiveness of the registrant’s disclosure controls and procedures and presented in this report our conclusionsabout the effectiveness of the disclosure controls and procedures, as of the end of the period covered by this report based onsuch evaluation; and
(d) Disclosed in this report any change in the registrant’s internal control over financial reporting that occurred during theregistrant’s most recent fiscal quarter (the registrant’s fourth fiscal quarter in the case of an annual report) that has materiallyaffected, or is reasonably likely to materially affect, the registrant’s internal control over financial reporting; and
5. The registrant’s other certifying officer and I have disclosed, based on our most recent evaluation of internal control over financialreporting, to the registrant’s auditors and the audit committee of the registrant’s board of directors (or persons performing the equivalentfunctions):
(a) All significant deficiencies and material weaknesses in the design or operation of internal control over financial reporting whichare reasonably likely to adversely affect the registrant’s ability to record, process, summarize and report financial information;and
(b) Any fraud, whether or not material, that involves management or other employees who have a significant role in the registrant’sinternal control over financial reporting.
Date: August 5, 2019 /s/ Joey Wat Joey Wat
Chief Executive Officer

Exhibit 31.2
CERTIFICATION
I, Jacky Lo, certify that:
1. I have reviewed this Quarterly Report on Form 10-Q of Yum China Holdings, Inc.;
2. Based on my knowledge, this report does not contain any untrue statement of a material fact or omit to state a material fact necessary tomake the statements made, in light of the circumstances under which such statements were made, not misleading with respect to the periodcovered by this report;
3. Based on my knowledge, the financial statements, and other financial information included in this report, fairly present in all materialrespects the financial condition, results of operations and cash flows of the registrant, as of, and for, the periods presented in this report;
4. The registrant’s other certifying officer and I are responsible for establishing and maintaining disclosure controls and procedures (as definedin Exchange Act Rules 13a-15(e) and 15d-15(e)) and internal control over financial reporting (as defined in Exchange Act Rules 13a-15(f)and 15d-15(f)) for the registrant and have:
(a) Designed such disclosure controls and procedures, or caused such disclosure controls and procedures to be designed under oursupervision, to ensure that material information relating to the registrant, including its consolidated subsidiaries, is made knownto us by others within those entities, particularly during the period in which this report is being prepared;
(b) Designed such internal control over financial reporting, or caused such internal control over financial reporting to be designedunder our supervision, to provide reasonable assurance regarding the reliability of financial reporting and the preparation offinancial statements for external purposes in accordance with generally accepted accounting principles;
(c) Evaluated the effectiveness of the registrant’s disclosure controls and procedures and presented in this report our conclusionsabout the effectiveness of the disclosure controls and procedures, as of the end of the period covered by this report based onsuch evaluation; and
(d) Disclosed in this report any change in the registrant’s internal control over financial reporting that occurred during theregistrant’s most recent fiscal quarter (the registrant’s fourth fiscal quarter in the case of an annual report) that has materiallyaffected, or is reasonably likely to materially affect, the registrant’s internal control over financial reporting; and
5. The registrant’s other certifying officer and I have disclosed, based on our most recent evaluation of internal control over financialreporting, to the registrant’s auditors and the audit committee of the registrant’s board of directors (or persons performing the equivalentfunctions):
(a) All significant deficiencies and material weaknesses in the design or operation of internal control over financial reporting whichare reasonably likely to adversely affect the registrant’s ability to record, process, summarize and report financial information;and
(b) Any fraud, whether or not material, that involves management or other employees who have a significant role in the registrant’sinternal control over financial reporting.
Date: August 5, 2019 /s/ Jacky Lo Jacky Lo
Chief Financial Officer

Exhibit 32.1
CERTIFICATION OF CHIEF EXECUTIVE OFFICERPURSUANT TO
18 U.S.C. SECTION 1350,AS ADOPTED PURSUANT TO
SECTION 906 OF THE SARBANES-OXLEY ACT OF 2002
In connection with the Quarterly Report of Yum China Holdings, Inc. (the “Company”) on Form 10-Q for the quarter ended June 30, 2019, as filed with theSecurities and Exchange Commission on the date hereof (the “Periodic Report”), I, Joey Wat, Chief Executive Officer of the Company, hereby certify,pursuant to 18 U.S.C. Section 1350, as adopted pursuant to Section 906 of the Sarbanes-Oxley Act of 2002, that:
1. The Periodic Report fully complies with the requirements of Section 13(a) or 15(d) of the Securities Exchange Act of 1934; and
2. The information contained in the Periodic Report fairly presents, in all material respects, the financial condition and results of operations of theCompany.
Date: August 5, 2019 /s/ Joey Wat Joey Wat
Chief Executive Officer
A signed original of this written statement required by Section 906 has been provided to Yum China Holdings, Inc. and will be retained by Yum ChinaHoldings, Inc. and furnished to the Securities and Exchange Commission or its staff upon request.
Exhibit 32.2
CERTIFICATION OF CHIEF FINANCIAL OFFICERPURSUANT TO
18 U.S.C. SECTION 1350,AS ADOPTED PURSUANT TO
SECTION 906 OF THE SARBANES-OXLEY ACT OF 2002
In connection with the Quarterly Report of Yum China Holdings, Inc. (the “Company”) on Form 10-Q for the quarter ended June 30, 2019, as filed with theSecurities and Exchange Commission on the date hereof (the “Periodic Report”), I, Jacky Lo, Chief Financial Officer of the Company, hereby certify,pursuant to 18 U.S.C. Section 1350, as adopted pursuant to Section 906 of the Sarbanes-Oxley Act of 2002, that:
1. The Periodic Report fully complies with the requirements of Section 13(a) or 15(d) of the Securities Exchange Act of 1934; and
2. The information contained in the Periodic Report fairly presents, in all material respects, the financial condition and results of operations of theCompany.
Date: August 5, 2019 /s/ Jacky Lo Jacky Lo
Chief Financial Officer
A signed original of this written statement required by Section 906 has been provided to Yum China Holdings, Inc. and will be retained by Yum ChinaHoldings, Inc. and furnished to the Securities and Exchange Commission or its staff upon request.