SECURITIES AND EXCHANGE COMMISSION - PDS Group
245
No Yes CR02548-2022 SECURITIES AND EXCHANGE COMMISSION SEC FORM 17-A, AS AMENDED ANNUAL REPORT PURSUANT TO SECTION 17 OF THE SECURITIES REGULATION CODE AND SECTION 141 OF THE CORPORATION CODE OF THE PHILIPPINES 1. For the fiscal year ended Dec 31, 2021 2. SEC Identification Number 167423 3. BIR Tax Identification No. 000-477-103 4. Exact name of issuer as specified in its charter MEGAWORLD CORPORATION 5. Province, country or other jurisdiction of incorporation or organization Metro Manila 6. Industry Classification Code(SEC Use Only) 7. Address of principal office 30th Floor, Alliance Global Tower, 36th Street cor. 11th Avenue, Uptown Bonifacio, Taguig City Postal Code 1634 8. Issuer's telephone number, including area code (632) 8894-6300/6400 9. Former name or former address, and former fiscal year, if changed since last report N/A 10. Securities registered pursuant to Sections 8 and 12 of the SRC or Sections 4 and 8 of the RSA Title of Each Class Number of Shares of Common Stock Outstanding and Amount of Debt Outstanding Common 31,843,408,872 Preferred 6,000,000,000 11. Are any or all of registrant's securities listed on a Stock Exchange? If yes, state the name of such stock exchange and the classes of securities listed therein: Philippine Stock Exchange - Common and Preferred Shares 12. Check whether the issuer:
-
Upload
khangminh22 -
Category
Documents
-
view
2 -
download
0
Transcript of SECURITIES AND EXCHANGE COMMISSION - PDS Group

No Yes
CR02548-2022
SECURITIES AND EXCHANGE COMMISSIONSEC FORM 17-A, AS AMENDED
ANNUAL REPORT PURSUANT TO SECTION 17OF THE SECURITIES REGULATION CODE AND SECTION 141
OF THE CORPORATION CODE OF THE PHILIPPINES
1. For the fiscal year ended
Dec 31, 20212. SEC Identification Number
1674233. BIR Tax Identification No.
000-477-1034. Exact name of issuer as specified in its charter
MEGAWORLD CORPORATION5. Province, country or other jurisdiction of incorporation or organization
Metro Manila6. Industry Classification Code(SEC Use Only)
7. Address of principal office
30th Floor, Alliance Global Tower, 36th Street cor. 11th Avenue, Uptown Bonifacio,Taguig CityPostal Code1634
8. Issuer's telephone number, including area code
(632) 8894-6300/64009. Former name or former address, and former fiscal year, if changed since last report
N/A10. Securities registered pursuant to Sections 8 and 12 of the SRC or Sections 4 and 8 of the RSA
Title of Each Class Number of Shares of Common Stock Outstanding and Amount of Debt Outstanding
Common 31,843,408,872
Preferred 6,000,000,000
11. Are any or all of registrant's securities listed on a Stock Exchange?
If yes, state the name of such stock exchange and the classes of securities listed therein:
Philippine Stock Exchange - Common and Preferred Shares12. Check whether the issuer:

No Yes
No Yes
No Yes
(a) has filed all reports required to be filed by Section 17 of the SRC and SRC Rule 17.1thereunder or Section 11 of the RSA and RSA Rule 11(a)-1 thereunder, and Sections 26 and 141of The Corporation Code of the Philippines during the preceding twelve (12) months (or for suchshorter period that the registrant was required to file such reports)
(b) has been subject to such filing requirements for the past ninety (90) days
13. State the aggregate market value of the voting stock held by non-affiliates of the registrant. Theaggregate market value shall be computed by reference to the price at which the stock was sold, orthe average bid and asked prices of such stock, as of a specified date within sixty (60) days prior tothe date of filing. If a determination as to whether a particular person or entity is an affiliate cannot bemade without involving unreasonable effort and expense, the aggregate market value of the commonstock held by non-affiliates may be calculated on the basis of assumptions reasonable under thecircumstances, provided the assumptions are set forth in this Form
As of March 31, 2022 is Php31,149,303,448.97 based on the closing price of Php3.01per share.
APPLICABLE ONLY TO ISSUERS INVOLVED ININSOLVENCY SUSPENSION OF PAYMENTS PROCEEDINGS
DURING THE PRECEDING FIVE YEARS
14. Check whether the issuer has filed all documents and reports required to be filed by Section 17 ofthe Code subsequent to the distribution of securities under a plan confirmed by a court or theCommission.
DOCUMENTS INCORPORATED BY REFERENCE
15. If any of the following documents are incorporated by reference, briefly describe them and identifythe part of SEC Form 17-A into which the document is incorporated:
(a) Any annual report to security holders
N/A
(b) Any information statement filed pursuant to SRC Rule 20
N/A
(c) Any prospectus filed pursuant to SRC Rule 8.1
N/A

The Exchange does not warrant and holds no responsibility for the veracity of the facts and representations contained in all corporatedisclosures, including financial reports. All data contained herein are prepared and submitted by the disclosing party to the Exchange,and are disseminated solely for purposes of information. Any questions on the data contained herein should be addressed directly tothe Corporate Information Officer of the disclosing party.
Megaworld CorporationMEG
PSE Disclosure Form 17-1 - Annual ReportReferences: SRC Rule 17 and
Section 17.2 and 17.8 of the Revised Disclosure Rules
For the fiscal yearended Dec 31, 2021
Currency Philippine Pesos
Balance Sheet
Year Ending Previous Year Ending
Dec 31, 2021 Dec 31, 2020
Current Assets 227,834,770,361 210,673,606,855
Total Assets 397,977,251,108 375,690,419,945
Current Liabilities 61,908,026,419 72,720,149,599
Total Liabilities 168,273,260,161 163,159,939,748
RetainedEarnings/(Deficit) 143,903,318,444 131,464,174,188
Stockholders' Equity 229,703,990,947 212,530,480,197
Stockholders' Equity - Parent 198,838,867,474 185,464,231,260
Book Value Per Share 6.32 5.89
Income Statement
Year Ending Previous Year Ending
Dec 31, 2021 Dec 31, 2020
Gross Revenue 46,377,861,049 39,273,468,557
Gross Expense 30,825,894,679 26,603,889,336
Non-Operating Income 4,376,429,682 4,267,409,295
Non-Operating Expense 4,985,085,708 3,000,516,964
Income/(Loss) Before Tax 14,943,310,344 13,936,471,552
Income Tax Expense 564,917,329 3,347,906,258

Net Income/(Loss) After Tax 14,378,393,015 10,588,565,294
Net Income/(Loss) Attributable to ParentEquity Holder 13,434,466,763 9,885,989,490
Earnings/(Loss) Per Share (Basic) 0.42 0.29
Earnings/(Loss) Per Share (Diluted) 0.42 0.29
Financial Ratios
FormulaFiscal Year Ended Previous Fiscal Year
Dec 31, 2021 Dec 31, 2020
Liquidity Analysis Ratios:
; ; Current Ratio orWorking Capital Ratio
Current Assets / CurrentLiabilities 3.68 2.9
; ; Quick Ratio(Current Assets - Inventory -Prepayments) / CurrentLiabilities
1.66 1.33
; ; Solvency Ratio Total Assets / Total Liabilities 2.37 2.3
Financial Leverage Ratios
; ; Debt Ratio Total Debt/Total Assets 0.42 0.43
; ; Debt-to-Equity Ratio Total Debt/TotalStockholders' Equity 0.41 0.4
; ; Interest CoverageEarnings Before Interest andTaxes (EBIT) / InterestCharges
4.02 3.64
; ; Asset to Equity RatioTotal Assets / TotalStockholders' Equity 1.73 1.77
Profitability Ratios
; ; Gross Profit MarginSales - Cost of Goods Sold orCost of Service / Sales 45.79 44.52
; ; Net Profit Margin Net Profit / Sales 28.33 24.32
; ; Return on Assets Net Income / Total Assets 3.61 2.82
; ; Return on EquityNet Income / TotalStockholders' Equity 6.26 4.98
Price/Earnings RatioPrice Per Share / EarningsPer Common Share 7.46 13.82
Other Relevant Information
None
Filed on behalf by:
Name Anna Michelle Llovido
Designation Corporate Secretary

MEG Annual Report 2021 1
SECURITIES AND EXCHANGE COMMISSION SEC FORM 17-A
ANNUAL REPORT PURSUANT TO SECTION 17 OF THE SECURITIES REGULATION CODE
AND SECTION 141 OF THE CORPORATION CODE
1. For the fiscal year ended 31 December 2021 2. SEC Identification Number: 167423 3. BIR Tax Identification No.: 000-477-103 4. MEGAWORLD CORPORATION Exact name of issuer as specified in its charter 5. Metro Manila Province, Country or other jurisdiction of incorporation or organization 6. (SEC Use Only) Industry Classification Code 7. 30th Floor, Alliance Global Tower 36th Street cor. 11th Avenue Uptown Bonifacio, Taguig City 1634 Address of principal office 8. (632) 8894-6300/6400 Issuer’s telephone number, including area code 9. Securities registered pursuant to Sections 8 and 12 of the SRC, or Sec. 4 and 8 of the RSA Title of Each Class Number of Shares of Stock Outstanding
Common 31,843,408,8721 Preferred 6,000,000,000 Total 37,843,408,872
10. Are any or all of these securities listed on a Stock Exchange? Yes [x] No [ ] Philippine Stock Exchange Common and Preferred Shares 11. Check whether the issuer:
(a) has filed all reports required to be filed by Section 17 of the SRC and SRC Rule 17 thereunder or Section 11 of the RSA and RSA Rule 11(a)-1 thereunder, and Sections 26 and 141 of The Corporation Code of the Philippines during the preceding twelve (12) months.
Yes [x] No [ ]
(b) has been subject to such filing requirements for the past ninety (90) days.
Yes [x] No [ ] 12. Aggregate Market Value of Voting Common Stock held by Non-Affiliates as of March 31, 2022 is
Php31,149,303,448.97 based on the closing price of Php3.01 per share.
1As of 27 April 2022

MEG Annual Report 2021 2
PART I - BUSINESS AND GENERAL INFORMATION BUSINESS Business Development The Company was founded by Andrew Tan and incorporated under Philippine law on 24 August 1989 under the name of Megaworld Properties & Holdings, Inc. The Company was primarily organized to engage in real estate development, leasing and marketing. In 1994, the Company spun off Empire East Land Holdings, Inc. which focused on the middle income market. On 19 August 1999, the Company changed its name to Megaworld Corporation to coincide with the Company's conversion from a purely real estate company into a holding company, although the Company continues to focus on its core competence in real estate development. The Company's common stock was first listed on the PSE on 15 June 1994. From 1989 to 1996, the Company garnered a reputation for building high-end residential condominiums and office buildings on a standalone basis throughout Metro Manila. In 1996, the Company shifted its focus to providing office buildings to support BPO businesses when it began development of the Eastwood City township. In 1999, Eastwood City Cyberpark became the first IT park in the Philippines to be designated a Philippine Economic Zone Authority ("PEZA") special economic zone. Since its incorporation in 1989, the Company and its affiliates have launched more than 728 residential buildings, 72 premier offices, 24 lifestyle malls and commercial centers and 12 hotel brands including condotels. The following are some of the major residential and office projects completed by the Company:
Residential
Quezon City Makati City Corinthian Hills Greenbelt Chancellor Eastwood Le Grand 1-3 Greenbelt Excelsior Eastwood Park Residences Greenbelt Hamilton 1 & 2 Eastwood Parkview 1 & 2 Greenbelt Madison El Jardin del Presidente Greenbelt Parkplace Golf Hills Terraces Greenbelt Radissons Golfhill Gardens One Central Grand Eastwood Palazzo One Lafayette Square Kentwood Heights Paseo Heights Manhattan Heights – Tower A to D Paseo Parkview Suites 1 & 2 Manhattan Parkview 1-3 Salcedo Sky Suites Manhattan Parkview Garden The Manhattan Square Manhattan Parkway 1-3 The Salcedo Park 1 & 2 Manhattan Plaza Tower 1 Three Central Narra Heights Two Central Olympic Heights 1-3 Two Lafayette Square One Central Park One Eastwood Avenue Tower 1-2 One Orchard Road 1-3 The Eastwood Excelsior The Eastwood Lafayette 1-3 Taguig City Pasay City 115 Upper Mckinley 101 Newport Boulevard 8 Forbestown Road 150 Newport Boulevard Forbeswood Heights 81 Newport Boulevard
MEG Annual Report 2021 3
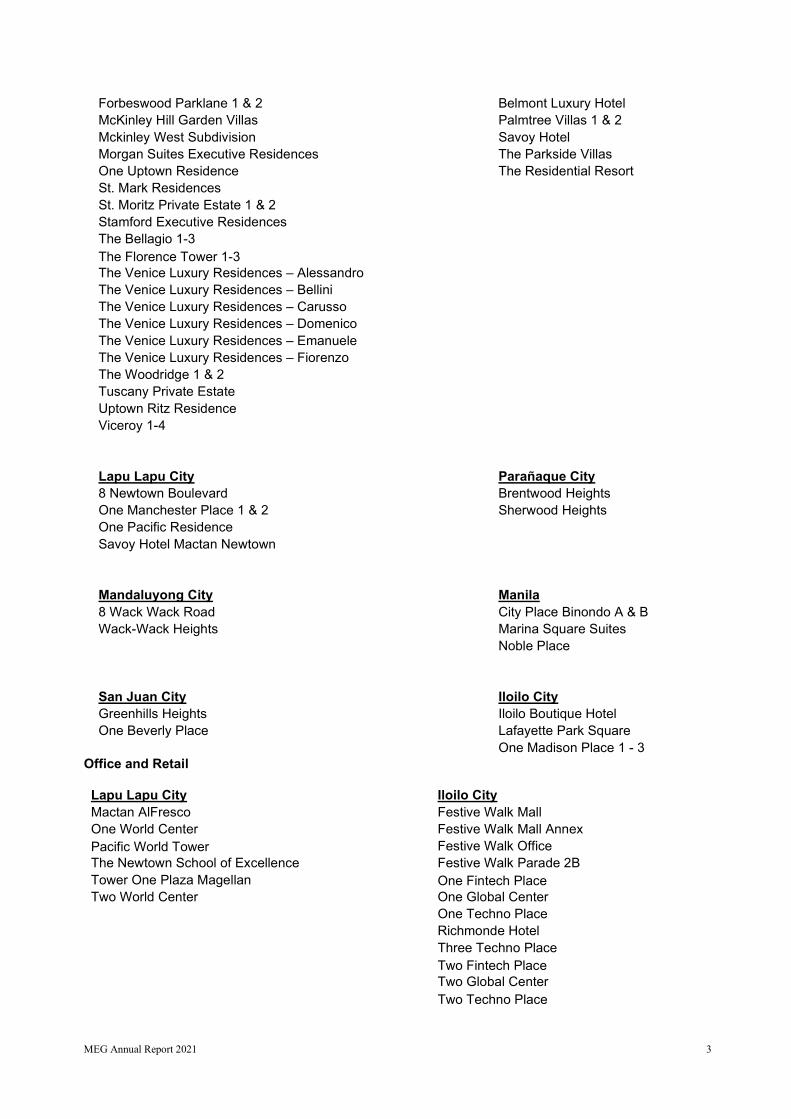
Forbeswood Parklane 1 & 2 Belmont Luxury Hotel McKinley Hill Garden Villas Palmtree Villas 1 & 2 Mckinley West Subdivision Savoy Hotel Morgan Suites Executive Residences The Parkside Villas One Uptown Residence The Residential Resort St. Mark Residences St. Moritz Private Estate 1 & 2 Stamford Executive Residences The Bellagio 1-3 The Florence Tower 1-3 The Venice Luxury Residences – Alessandro The Venice Luxury Residences – Bellini The Venice Luxury Residences – Carusso The Venice Luxury Residences – Domenico The Venice Luxury Residences – Emanuele The Venice Luxury Residences – Fiorenzo The Woodridge 1 & 2 Tuscany Private Estate Uptown Ritz Residence Viceroy 1-4 Lapu Lapu City Parañaque City 8 Newtown Boulevard Brentwood Heights One Manchester Place 1 & 2 Sherwood Heights One Pacific Residence Savoy Hotel Mactan Newtown Mandaluyong City Manila 8 Wack Wack Road City Place Binondo A & B Wack-Wack Heights Marina Square Suites Noble Place San Juan City Iloilo City Greenhills Heights Iloilo Boutique Hotel One Beverly Place Lafayette Park Square One Madison Place 1 - 3
Office and Retail Lapu Lapu City Iloilo City Mactan AlFresco Festive Walk Mall One World Center Festive Walk Mall Annex Pacific World Tower Festive Walk Office The Newtown School of Excellence Festive Walk Parade 2B Tower One Plaza Magellan One Fintech Place Two World Center One Global Center One Techno Place Richmonde Hotel Three Techno Place Two Fintech Place Two Global Center Two Techno Place

MEG Annual Report 2021 4
Taguig City Quezon City 8 Campus Place 1800 Eastwood Avenue Commerce and Industry Plaza 1880 Eastwood Avenue Eight West Campus Citibank Square Emperador Steel Parking Building Cybermall Five West Campus CyberOne Forbes Town Center Eastwood City Walk 1 & 2 Mckinley West Steel Deck Parking Eastwood Global Plaza Corporate Tower One Campus Place Eastwood Mall One Le Grand Tower Global One One West Campus IBM Plaza Science Hub ICITE Six West Campus Techno Plaza 1 & 2 Southeast Asian Campus Ten West Campus The Venice Piazza Three West Campus Three World Square Two West Campus Two World Square Uptown Parade Uptown Place Mall Uptown Place Towers Uptown Palazzo (Uptown Parksuites 1-2) Venice Corporate Center Venice Grand Canal Mall World Commerce Place 1-3 Makati City Manila 331 Building Landbank Plaza Paseo Center Lucky Chinatown Mall Petron Megaplaza The World Centre Pasig City Pasay City Arcovia Parade Retail 1 & 2 81 Newport Square Richmonde Plaza Belmont Luxury Hotel Arco Parade The View Deck One Paseo Davao City Davao Finance Center

MEG Annual Report 2021 5
Subsidiaries and Associates1 As of December 31, 2021, the Company holds interests in the following subsidiaries and associates: Subsidiaries and Associates Date of Incorporation Percentage
Ownership Subsidiaries
Megaworld Land, Inc. .............................................. May 26, 1994 100% Prestige Hotels & Resorts, Inc. ............................... February 16, 1999 100% Mactan Oceanview Properties and Holdings, Inc. ... August 16, 1996 100% Megaworld Cayman Islands, Inc. ............................. August 14, 1997 100% Richmonde Hotel Group International Ltd. ............... June 24, 2002 100% Eastwood Cyber One Corporation .......................... October 21, 1999 100% Megaworld Cebu Properties, Inc……………………. Megaworld Newport Property Holdings, Inc. ...........
February 6, 2002 October 6, 2003
100% 100%
Oceantown Properties, Inc………………………….. August 15, 2006 100% Piedmont Property Ventures, Inc……………………. Stonehaven Land, Inc…………………………………
August 28, 1996 August 21, 1996
100% 100%
Streamwood Property, Inc……………………………. Suntrust Properties, Inc……………………………….
August 21, 1996 November 14,1997
100% 100%
Arcovia Properties, Inc. ……………………………… Luxury Global Hotels and Leisure, Inc……………… Global One Integrated Business Services, Inc……. Luxury Global Malls, Inc……………….……………... Davao Park District Holdings, Inc............................. Belmont Newport Luxury Hotels, Inc………………... Global One Hotel Group, Inc………………………… Landmark Seaside Properties, Inc………………….. San Vicente Coast, Inc………………………………. Hotel Lucky Chinatown, Inc…………………………. Savoy Hotel Manila, Inc……………………………... Savoy Hotel Mactan, Inc……………………………. Kingsford Hotel Manila, Inc………………………….. Agile Digital Ventures, Inc. MREIT Fund Managers, Inc………………………… MREIT Property Managers, Inc…………………….. Megaworld Bacolod Properties, Inc…………………. Global-Estate Resorts, Inc………………………….. Empire East Land Holdings, Inc…………………….. Megaworld Central Properties Inc. .......................... Megaworld Capital Town, Inc………………………... Soho Café and Restaurant Group, Inc…………….. Manila Bayshore Property Holdings, Inc………..…. La Fuerza, Inc. ……………………………………….. MREIT, Inc.,,,,,,,,,,,,,,,,,,,,,,,,,,,,,,,,,,,,,,,,,,,,,,,,,,,,,,,,,,,,,, Megaworld-Daewoo Corporation …………………... Northwin Properties, Inc…………………………….. Gilmore Property Marketing Associates, Inc……….. Megaworld Resort Estates, Inc……………………… Megaworld-Globus Asia, Inc…………………………. Integrated Town Management Corporation………… Maple Grove Land, Inc………………………………..
March 28, 1985 July 17, 2013 September 25, 2014 September 18, 2014 April 14, 2014 March 5, 2015 May 4, 2015 January 6, 2011 March 7, 2016 October 19, 2018 March 1, 2018 December 13, 2018 January 10, 2020 June 3, 2020 November 18, 2020 October 13, 2020 May 12, 1918 May 18, 1994 July 15, 1994 September 15, 2005 June 26, 2012 February 15, 2005 October 14, 2011 January 24, 1958 October 2, 2020 November 29, 1996 December 14, 2016 September 5, 1996 April 30, 2007 March 17, 1995 March 25, 2002 July 20, 2016
100% 100% 100% 100% 100% 100% 100% 100% 100% 100% 100% 100% 100% 100% 100% 100% 91.55% 82.32% 81.73% 76.55% 76.28% 75% 68.03% 66.67% 62.09% 60% 60% 52.14% 51% 50% 50% 50%
1 Please refer to pages 1 to 4 of the attached Audited Financial Statements ended December 31, 2021 for a complete list.

MEG Annual Report 2021 6
Associates Bonifacio West Development Corporation…………. November 15, 2001 46.11% Suntrust Home Developers, Inc. ............................. January 18, 1956 34% Palm Tree Holdings & Development Corporation .... August 15, 2005 40%
Set out below is a description of each subsidiary or associate and its main activity.
Empire East Land Holdings, Inc. is a publicly-listed company engaged in the development and marketing of affordable housing projects either in the form of condominium communities or house-and-lot packages, and to a limited extent, commercial and office space and mixed-use complexes. Global-Estate Resorts, Inc. is a publicly-listed company engaged in diversified portfolio including integrated tourism estates development; horizontal residential subdivision lots and residential/commercial complexes; residential communities integrated with golf, resort and other leisure-related and commercial complexes; residential, office and commercial high rise; business park; and low cost housing. Suntrust Home Developers, Inc. is a publicly-listed company which owns interests in a property management company. MREIT, Inc. is a publicly-listed company engaged in the business of a real estate investment trust (REIT), as provided under Republic Act (R.A.) No. 9856 otherwise known as The Real Estate Investment Trust Act of 2009, its implementing rules and regulations and other applicable laws. Megaworld Land, Inc. provides a leasing service to the Company by locating tenants for rental properties and coordinating relations with brokers primarily in relation to the Eastwood Cyberpark. Prestige Hotels & Resorts, Inc. owns and operates Richmonde Hotel located in Ortigas Center, Pasig City, Eastwood Richmonde Hotel located in Eastwood, Bagumbayan, Quezon City and Richmonde Hotel located in Mandurriao, Iloilo City. Mactan Oceanview Properties and Holdings, Inc. was organized to develop a resort property in Cebu. Megaworld Cayman Islands, Inc. was incorporated in the Cayman Islands to act as a promoter and entrepreneur, carry on the business as a financier, broker, dealer, agent, and importer and to undertake investments, financial, trading and other operations. Richmonde Hotel Group International Ltd. was incorporated in the British Virgin Islands to undertake various investments on behalf of the Company and engage in trading, hotel, restaurant and related businesses. Eastwood Cyber One Corporation was set up as a special purpose entity to own and develop certain Business Process Outsourcing (BPO) rental properties located in the Eastwood City CyberPark. Megaworld Cebu Properties, Inc. was organized primarily to act as a principal agent or broker, on commission basis or otherwise, and to acquire by purchase or lease, construct, manage or sell real estate properties. Megaworld Newport Property Holdings, Inc. provides a sales and marketing service for development of the Newport City projects. Oceantown Properties, Inc. was incorporated to own land in Mactan, Cebu. Piedmont Property Ventures, Inc. was incorporated on 28 August 1996 and was acquired by the Company in 2008. Stonehaven Land, Inc. was incorporated on 21 August 1996 and was acquired by the Company in 2008. Streamwood Property, Inc. was incorporated on 21 August 1996 and was acquired by the Company in 2008.

MEG Annual Report 2021 7
Suntrust Properties, Inc. was incorporated on 14 November 1997 and is engaged in the development of affordable real estate projects. Arcovia Properties, Inc. is engaged primarily in real estate activities which include leasing out of real properties.
Luxury Global Hotels and Leisure, Inc. was formed to own, lease and manage hotels. Global One Integrated Business Services, Inc. was incorporated on 25 September 2014 and is engaged in BPO business. Luxury Global Malls, Inc. was incorporated on 18 September 2014 and is engaged in BPO business.
Davao Park District Holdings, Inc. is engaged in the real estate business and was incorporated on 14 April 2014. Belmont Newport Luxury Hotels, Inc. is engaged in owning, leasing, operation and management of hotels. Global One Hotel Group, Inc. is engaged in owning, leasing, operation and management of hotels.
Landmark Seaside Properties, Inc. is engaged primarily in real estate activities.
San Vicente Coast, Inc. is engaged primarily in real estate activities. Hotel Lucky Chinatown, Inc. is engaged in owning, leasing, operation and management of hotels. Savoy Hotel Manila, Inc. is engaged in owning, leasing, operation and management of hotels. Savoy Hotel Mactan, Inc. is engaged in owning, leasing, operation and management of hotels.
Kingsford Hotel Manila, Inc. is engaged in owning, leasing, operation and management of hotels. Agile Digital Ventures, Inc. is engaged in e-commerce through PICK.A.ROO, an online platform and the first premium all in-one, on-demand lifestyle delivery app. MREIT Fund Managers, Inc. is engaged in the business of providing fund management services to REIT companies. MREIT Property Managers, Inc. is engaged in the business of providing services in relateion to property management, lease management, marketing and project management. Megaworld Bacolod Properties, Inc. is engaged primarily in real estate activities. Megaworld Central Properties Inc. was formed to provide sales services in respect of residential units in the Manhattan Garden City project. Megaworld Capital Town, Inc. is engaged in real estate business and was incorporated on 26 June 2012 and was acquired by the Company in 2017. Soho Café and Restaurant Group, Inc. is engaged primarily in business of restaurants, cafes, cocktail bars, lounges, inns, apartments, private clubs and other allied businesses. Manila Bayshore Property Holdings, Inc. was organized to engage in real estate development. It started commercial operations on 1 January 2012. La Fuerza, Inc. is engaged in the real estate business, including leasing of real estate properties.

MEG Annual Report 2021 8
Megaworld-Daewoo Corporation is a joint venture between the Company and Daewoo Corporation which developed three residential condominium towers in Eastwood City. Northwin Properties, Inc. was incorporated on 14 December 2016 and is engaged primarily in real estate activities. Gilmore Property Marketing Associates, Inc. was incorporated on 5 September 1996 primarily to act as a principal agent or owner, on commission basis or otherwise, and to acquire, lease and construct or dispose of buildings and other real estate properties. Megaworld Resort Estates, Inc. was incorporated to engage in the real estate business. Megaworld-Globus Asia, Inc. was formed to develop and sell “The Salcedo Park”, a twin-tower residential condominium project located in Makati City which has been completed.
Integrated Town Management Corporation was incorporated to develop, sell, lease and hold for investment or otherwise, real estate properties to establishing or pursuing the business of owning, developing, managing, administering or otherwise dealing in any and all kinds of real property whether used for residential office, industrial, or commercial/retail purposes, and in relation thereto, nursery/plant growth building and to provide or render management and specialized technical services to the owners or users of such real property. Maple Grove Land, Inc. is engaged primarily in real estate activities. Bonifacio West Development Corporation is engaged in real estate business and was incorporated on 15 November 2001.
Palm Tree Holdings & Development Corporation was acquired in connection with its landholdings adjacent to the Company’s Eastwood City township. It is currently engaged in the real estate business. Neither the Company nor any of its subsidiaries have, during the past 3 years, been the subject of a bankruptcy, receivership or similar proceeding, or involved in any material reclassification, merger, consolidation, or purchase or sale of a significant amount of assets not in the ordinary course of business. Description of Business The Company is one of the leading property developers in the Philippines and is primarily engaged in the development of large scale mixed-use planned communities, or community townships, that comprise residential, commercial and office developments and integrate leisure, entertainment and educational/training components. Founded in 1989, the Company initially established a reputation for building high quality residential condominiums and commercial properties located in convenient urban locations with easy access to offices as well as leisure and entertainment amenities in Metro Manila. Beginning in 1996, in response to demand for the lifestyle convenience of having quality residences in close proximity to office and leisure facilities, the Company began to focus on the development of mixed-use communities, primarily for the middle-income market, by commencing the development of its Eastwood City project. In addition, the Company engages in other property related activities such as project design, construction oversight and property management. The Company's real estate portfolio includes residential condominium units, subdivision lots and townhouses as well as office projects and retail space. The Company has the following three primary business segments: (i) real estate sales of residential developments (ii) leasing of office space, primarily to Business Process Outsourcing ("BPO") enterprises and retail space and (iii) management of hotel operations. The Company's consolidated revenues for the year ended 31 December 2021 were ₱50.8 billion compared to ₱43.5 billion for the year ended 31 December 2020. Real estate sales of residential developments accounted for 61% of the Company's consolidated revenues in 2021 and 57% in 2020. Rental income from leasing operations accounted for approximately 26%. of the Company's consolidated revenues in 2021 and 30% in 2020. The Company's consolidated net profit for the year ended 31 December 2021 was ₱14.4 billion compared to ₱10.6 billion for the year ended 31 December 2020.

MEG Annual Report 2021 9
As of 31 December 2021, the Company owns or has development rights to over 5,000 hectares of land located throughout the Philippines. For more than three decades, the Company has been recognized by numerous institutions and prestigious international awards organizations for its property and real estate development capabilities, good corporate governance, corporate and social responsibility initiatives, and other achievements. The Company’s track record and established market position has made it one of the most recognized brands in the industry both within and outside the Philippines and has been awarded “Best Developer - Philippines” by International Finance Awards and “Best Real Estate Developer Philippines 2021” by Finance Derivative Awards. In 2021, Megaworld received a total of 84 awards, including 44 international awards, from several award-giving bodies that recognized not only its developments and cultural promotion campaigns, but also the Company’s COVID-19 response programs The Company's common shares were listed on the PSE in 1994 and as of 31 December 2021, the Company had a market capitalisation of ₱100 billion. Foreign sales contributed approximately 15%, 15% and 25%to the Company’s consolidated sales and revenues for the years 2021, 2020 and 2019, respectively. The percentage of sales broken down by major markets is as follow:
Current Property Development Projects The Company’s current development projects are mostly mixed-use township developments that typically have residential, office, and commercial components. These projects are located in key areas throughout the Philippines. The objective of each of the mixed-use developments is to provide an integrated community with high quality “live-work-play-learn” amenities within close proximity to each other. For each development, the Company’s real estate strategy is to lease all office and commercial properties and sell all residential units. Where the Company is not able to sell 100% of its residential units, upon completion of the residential project, it rents these unsold units on a lease-to-own basis or pursuant to a lease with an option to buy. The location of each of the Company’s township developments, together with their respective sizes in hectares, is set out in the following map and each project is described below.
Eastwood City Eastwood City is the first township to implement the Company’s “live-work-play-learn” concept. Its 18.50-hectare community property in Libis, Quezon City has 19 completed luxury condominium towers, 10 first-class corporate office buildings, and a modern IT park. The planning of Eastwood City adopts an integrated approach to urban planning, with an emphasis on the development of the Eastwood City Cyberpark to provide offices with infrastructure such as high-speed telecommunications and 24-hour power supply that support BPO and other technology-driven businesses. The township provides education/training, restaurants, leisure and retail facilities and residences. It is currently home to more than 25,000 residents and 85,000 workers. Eastwood city is also home to the four-level Eastwood Mall — a shopping and dining destination which has been declared the “Best Shopping Center” by the Philippine Retailers Association. Eastwood City has three malls and around 500 commercial and retail shops.
Forbes Town Center Forbes Town is located in a 5-hectare land in Bonifacio Global City, Taguig, Metro Manila adjacent to the Manila Golf Club, Manila Golf and Country Club, the Forbes Park residential subdivision and Dasmariñas
Market 2021 2020 2019 North America 37% 50% 31%
Europe 36% 26% 20%
Asia 15% 7% 48%
Middle East 12% 17% 1%
Total 100% 100% 100%

MEG Annual Report 2021 10
Village. Forbes Town has 12 residential towers which house more than 3,500 residential units. Upon completion, Forbes Town is expected to consist of residential, retail and entertainment properties. The focal point of activity in the township is Forbes Town Road, a retail strip with 37 restaurants and shops that cater to the diverse needs of the residents of the community’s three Bellagio towers, six towers of Forbeswood Heights, two towers of Forbeswood Parklane, and the 53-storey Eight Forbes Town Road. This is connected to another Fort Bonifacio landmark, Burgos Circle, a leisure spot with residential condominiums and a small park. These commercial centers along with each of the condominiums’ convenient location and top- notch resort-style amenities form a lifestyle of absolute leisure.
McKinley Hill McKinley Hill is a community township located on approximately 50 hectares of land in Fort Bonifacio, Taguig City, Metro Manila. McKinley Hill consists of office, residential, retail, educational, entertainment and recreational centers. The residential zone consists of subdivision lots for low-density single-detached homes, clusters of low-rise residential garden villas and residential condominiums. The office properties will include the McKinley Hill Cyberpark which is a PEZA-designated IT special economic zone. Tenants of the office properties will largely comprise of software developers, data encoding and conversion centers, call centers, system integrations, IT and computer system support. The leisure and entertainment zone will consist of bars, restaurants, specialty shops, cinemas and sports complex. Three international schools, the Chinese International School, the Korean International School and Enderun College, a hotel management institution affiliated with Les Roches of Switzerland, comprise the “learn” component of the township. McKinley Hill is also home to the British Embassy and the Korean Embassy.
Newport City Newport City is a community township located on 25 hectares of land at the Villamor Air Base, Pasay City, Metro Manila, across from the NAIA Terminal 3 and adjacent to the Villamor golf course. It will be targeted towards tenants and buyers who consider proximity to the NAIA Terminal 3 an advantage. The residential zone consists of eight to nine-storey medium-rise buildings. The corporate zone comprised of office buildings. The Company expects to establish a PEZA special economic zone cyberpark at Newport City. The leisure and entertainment zone consist of bars, restaurants, retail and tourist oriented shops, which are designed to complement the office and residential buildings in the community township. Newport City is home to Resorts World Manila, which is a leisure and entertainment complex comprising gaming facilities, restaurants, hotels and shopping outlets. The hotel zone comprises the Manila Marriott Hotel, Maxims Hotel, Holiday Inn Express Hotel, Hilton Hotel Manila, Hotel Okura Mnaila and Sheraton Manila managed by Travellers International Hotel Group, Inc. and Megaworld Hotels’ Belmont Hotel Manila and Savoy Hotel Manila.
McKinley West The Company is developing McKinley West on a 34.5-hectare portion of the JUSMAG property in Fort Bonifacio which is directly beside Forbes Park and Manila Polo Club and across McKinley Hill in Taguig, Metro Manila. The development of McKinley West is another joint venture undertaking with BCDA. McKinley West will have rows of luxury residential estates, some of which will have their own swimming pools and other amenities. The upscale residential enclave will be supplemented by a modern business district of sustainable office buildings, an international school, and a commercial center. These will all be complemented by open spaces and greenery. Ingress and egress points of the estate are conveniently located along Lawton Avenue which connects Fort Bonifacio to Pasay City and Makati City.
The Mactan Newtown The Company’s first township venture outside Luzon, Mactan Newtown is a mixed-use development on a 30-hectare property near Shangri-La’s Mactan Resort and Spa in Mactan, Cebu. Mactan Newtown combines high-end office towers, luxury condominiums, leisure amenities, retail shops, a school, and upscale hotels. It will also have its own exclusive, world-class beach club at the township’s beachfront, and sports facilities at the 11-hectare beachfront property formerly known as Portofino Beach. It is also near the Mactan-Cebu International Airport, making the township ideal for residence, business or leisure. The first phase of the project is expected, on completion, to comprise high-tech BPO offices, retail centers, luxury condominiums, leisure facilities and beach resort frontage. The Mactan Newtown is approximately 10

MEG Annual Report 2021 11
minutes away from the Mactan-Cebu International Airport, the Philippines’ second largest airport. Soon to rise are 5 hotels, two of which are at the beachfront.
Uptown Bonifacio Uptown Bonifacio is an approximately 15.4-hectare property in Fort Bonifacio in Taguig, Metro Manila. Modeled after the most progressive cities around the world – Paris, London, Milan, New York and Tokyo, Uptown Bonifacio is comprised of a residential portion in the northern part of Fort Bonifacio, and a portion for mixed-use, comprising office and retail space. It is well placed to cater to the fast -paced lives of today’s young professionals and growing families. Set in the heart of Fort Bonifacio, the township will be close to several of the new central business district’s (“CBD”) popular landmarks, such as Forbes Town, Burgos Circle, the Mind Museum, Bonifacio High Street, and The Fort Strip. First class health care and education will never be far with St. Luke’s Medical Center and the institutional zone mere footsteps away. Within the township is a complete community of its own: live luxuriously in the residences of Uptown Bonifacio; work in the top grade office sites; and play at its very own high-end commercial center, Uptown Place Mall. The township is easily accessible via Kalayaan Avenue, C-5 Road and EDSA.
Boracay Newcoast Boracay Newcoast is a 150-hectare mixed-use leisure and resort development. It is envisioned to be the next world-class tourism destination in the paradise island. Soon to rise in the tropical tourism development are luxury and boutique hotels, commercial and retail district, upscale villas, and an exclusive residential village. Among the first residential towers to rise is Oceanway Residences, a cluster of mid-rise condominiums offering amazing views of the Sibuyan Sea, Mt. Luho, the island’s highest peak, as well as the Fairways & Bluewater Golf Course. Aside from Oceanway Residences, among the upcoming projects here include four hotels and an Ibiza-inspired commercial and retail strip, all the more making it the most anticipated destination in Boracay.
Twin Lakes Twin Lakes is a 1,200-hectare mixed-use leisure and resort community that raises the bar of living in Tagaytay. The tourism estate features the best of Europe at the first residential cluster called The Vineyard Residences, which is composed of three mid-rise condominium towers named after famous grape varieties: Shiraz, Merlot, and Chardonnay. Twin Lakes also has a unique mixed-use community development called The Vineyard, which spans 177-hectare of natural landscape that offers the perfect view of the famous Taal Volcano, along with a view of the man-made lake within the estate. The Vineyard will have its own sports club and spa, wedding venue, and the 10-hectare vineyard that will produce real grapes that can be processed, stored, and aged in its very own chateau. The township will also have commercial and retail hubs (The Village and Lakeshore Town Center), a university park, as well as a nature park. Other developments in Twin Lakes include a retirement community, wellness center, hotel and chateau, among others. With these developments, one can enjoy both the natural and man-made wonders at Twin Lakes.
Iloilo Business Park Iloilo Business Park is a mixed-planned community in a 72-hectare property in Mandurriao, Iloilo. When completed, it will be a mixed-use business, tourism, commercial and residential hub with a residential community, BPO office buildings, hotels, a convention center, retail centers and a lifestyle center, all at the heart of Iloilo, a new growth center in the Visayas. The entire Iloilo Business Park development was registered as a special economic zone with the Government, which allows it to benefit from a tax holiday period as well as other incentives for investors. It also features The Street of Festive Walk, a 1.1-kilometer retail strip inspired by outlet shops in America and envisioned to be the longest shop-and-dine street outside of Metro Manila. Iloilo Business Park has launched 5 residential condominium developments to date – One Madison Place Luxury Residence, Lafayette Park Square, The Palladium, the tallest building in the region at 22 storeys high, Saint Dominique and Saint Honore. With Iloilo Business Park, the Company aims to transform Western Visayas into the next central district in the region.
Suntrust Ecotown
Sitting on a 350-hectare land in Tanza, Cavite, the Suntrust Ecotown will be the Company’s first mixed-use development with an industrial park, also a first in the country. The industrial park is the country’s first to be

MEG Annual Report 2021 12
accredited by PEZA with lifestyle amenities. It is also positioned to be the major hub for world-class light to medium export-oriented industries, residential, commercial, and institutional establishments in the south. At Suntrust Ecotown, 111 hectares will be allotted for the industrial park, another 40 hectares is dedicated for the expansion of the industrial park and the integration of lifestyle amenities such as a hotel, commercial and retail hubs, driving range, mini golf course, putting greens, swimming pool, jogging path, basketball and badminton courts, and open parks, and another 200 hectares of future development that may include residential and other recreational facilities.
Davao Park District
Davao Park District is the Company’s first township development in Mindanao, specifically on an 11-hectare property along S.P. Dakudao Loop in Lanang, Davao City which used to be the Lanang Golf and Country Club. The township is envisioned to be Mindanao’s new central business district, by being a center for BPO and other corporate entities over the next seven years. Also located in Davao Park District are the themed residential condominiums that will be built by Suntrust Properties, Inc., a wholly-owned subsidiary of the Company. The township will also have a lifestyle mall, commercial and retail strips, open parks, a lagoon, and a school. The first office tower to rise is the iconic 15-storey Davao Finance Center, which was completed in 2018. The first tower in One Lakeshore Drive, a 4-tower condominium cluster, started selling in 2014. Southwoods City
Southwoods City is the largest and only fully-integrated township with a golf course located in the south of Metro Manila. The 561-hectare property is a mixed-use development that features the Jack Nicklaus-designed Manila Southwoods Golf and Country Club, a central business district, a mall, schools, a church, and a medical facility among others. It maintains its suburban feel while being conveniently accessible via the South Luzon Expressway. Within Southwoods City is Pahara, a 26-hectare residential village consisting of over 600 lots, each having a spectacular view of the golf course and the Laguna de Bay. Pahara, which is a Bengali term for hills, was named due to its landscape and terrain. This residential village has a Mediterranean-inspired architectural theme with green open spaces and its own clubhouse, swimming pool, function halls, children’s playground, an outdoor circuit gym, and parks.
Alabang West
Alabang West is a 62-hectare township located at the heart of Alabang’s leisure, business and commercial district. It delivers the glitz and glamor of Beverly Hills by offering high-end shopping boutiques and world-class amenities, all in a posh neighborhood. It is easily accessible to and from Metro Manila via the South Luzon Expressway and the Daang Hari Exit. Alabang West has a 1.3-kilometer commercial and retail row inspired by Hollywood’s famous Rodeo Drive and an exclusive Alabang West Village that features over 700 residential lots. The village will have a clubhouse with badminton and basketball courts, function rooms, game room, a fitness center, and an infinity pool.
ArcoVia City Envisioned as an environment-friendly community, the 12.3-hectare ArcoVia City is located along the C-5 Road in Pasig City. A main “green” feature of the township is the approximately 1,000 trees that will be planted around the development. This greening feature will help provide an outdoor thermal comfort for the future residents, workers, tenants and visitors of the township. Sustainable buildings registered under Leadership in Energy and Environmental Design (LEED) are the standard of office developments in this township, with the first two to rise designed by world-renowned architectural firm Skidmore, Owings & Merrill. Other green features of ArcoVia City are a rainwater catchment facility, a network of bicycle lanes, and wide tree-lined sidewalks. Aside from office towers, the township will have residential condominiums, a lifestyle mall, retail and commercial strips, and open parks.
The Upper East The Upper East sits on a 34-hectare property in Bacolod City, Negros Occidental and is bound by Burgos Avenue on the north, Lopez Jaena Street on the west, the Circumferential Road on the east, and is just across the New Government Center. Modeled after New York City’s Upper East Side district, its prime

MEG Annual Report 2021 13
location is geared to be Bacolod’s own version of an upscale lifestyle district where residential condominiums, malls and commercial centers, BPO office towers, tourism and leisure facilities as well as recreational parks and open spaces are integrated to create an exciting Live-Work-Play township, which the company pioneered in the Philippines.
Northill Gateway Northill Gateway will rise in the northern part of Bacolod, where the famous Sugar Road was built. Sitting on a 53-hectare property along the new Circumferential Road on the boundaries of Talisay City and Bacolod City, it has direct access to the new Bacolod-Silay Airport. It will rise in an area that has a direct link to The Upper East via the Circumferential Road. Northill Gateway is envisioned to be a refreshing lifestyle district that will house upscale residential villages, mixed-use office and retail developments, leisure and recreational amenities as well as institutional facilities. The Company is constructing a ‘commercial town center’ on the Bacolod side of the rising Northill Gateway township occupying around 7.5 hectares, the Northill Town Center will be a sprawling horizontal commercial development composed mostly of stand-alone two-storey structures of retail shops and dining establishments, surrounded by landscaped parks and open spaces. The town center, which will be accessible along the Bacolod-Silay Airport Access Road, will also have a central plaza, an events venue, ‘pasalubong’ centers featuring local Negrense delicacies, a supermarket, and wellness and sports facilities.
Sta. Barbara Heights
Sta. Barbara Heights is a 173-hectare mixed-use development has 34 hectares allocated for residential lots, which offer a backdrop of a nearby natural lake and rolling hills in Sta. Barbara, Iloilo. The township is adjacent to the historic Santa Barbara Church and Convent and the Iloilo Golf Course and Country Club, the oldest golf course in Asia. Sta. Barbara Heights will have a direct access to the road leading to the Iloilo International Airport via the Iloilo International Avenue, a six-lane “spine” highway featuring rows of mixed-use and commercial buildings, retail shops, restaurants, boutique hotels and institutional facilities. Half of the entire development is allocated for the Sta. Barbara Heights Residential Estates, a residential village with three phases offering around 1,000 lots. The village will feature a five-hectare Village Center with amenities that include a 260-meter swimming pool, tennis and basketball courts, children’s park and picnic ground overlooking a lake beside the Iloilo Golf and Country Club.
Capital Town Capital Town is 35.6-hectare prime property beside the provincial capital of the City of San Fernando, Pampanga, 21st integrated urban township by the Company set to become the newest Central Business District of the North. It is situated at the heart of San Fernando, Pampanga, where Pampanga Sugar Development Company (PASUDECO) used to operate.
Its existence then became a catalyst for the exponential growth of the city. Backed by PASUDECO’s rich history, culture and heritage, the development of Capital Town will be at the forefront of business and progress as the area enters new phase of growth in moving forward while preserving its values.
Westside City Westside City will be the second site of Resorts World Manila in the Philippines. The 31-hectare leisure and entertainment township at the booming Entertainment City in Parañaque will also have international hotels, a luxury mall, and residential condominiums. The launch of Westside City marked the Company’s 20th integrated urban township, the most by any developer in the country. The township will also be home to the Company’s upscale residential condominiums, a luxury mall as well as international hotel brands such as The Westin Hotel of the Starwood Asia Pacific Hotels & Resorts Group, Hotel Okura Manila of the Okura Hotels & Resorts, the Genting Grand and Crockfords Tower of the Genting Group, and Kingsford Hotel. These hotels will have a total of around 1,500 rooms. Part of the Company’s vision for Westside City is to become the “Broadway of Asia” as the township highlights facilities for the performing arts. It will be home to the Philippines’ first Grand Opera House that has a total capacity of approximately 3,000 persons.
MEG Annual Report 2021 14
Maple Grove Maple Grove is a 140-hectare property in General Trias, Cavite. This vast property will be developed into another world-class mixed-use development, where relaxation and nature perfectly blend with the urban lifestyle. Just 45 minutes away from Makati and other Metro Manila CBDs via Coastal Road and Cavitex, Maple Grove is at the entry point of the booming industrial and residential center of the Cavite-Batangas corridor. The Company is allocating ₱10-billion in the next 10 years to develop Maple Grove. The township will have an eclectic mix of residential, retail, office and institutional components.
Eastland Heights Through its subsidiary, Global-Estate Resorts Inc., the Company is building Eastland Heights, an ‘integrated lifestyle community’ in Antipolo, Rizal on an expansive 640 hectares of land along Marcos Highway with some areas overlooking Metro Manila’s panoramic skyline. The vast property has its own iconic 36-hole golf course and country club, which will occupy around 20% of the entire development. It is also known for its rolling terrains on the foot of the scenic Sierra Madre Mountain Range. The Company is spending ₱5-billion to develop Eastland Heights in the next five to seven years. Aside from the golf course, the community will have residential, commercial and retail, and institutional components such as a school.
The Hamptons Caliraya
The Hamptons Caliraya is located in Lumban-Cavinti, Laguna, surrounding Lake Caliraya, The Hamptons Caliraya is a 300-hectare development set to feature a lakeside residential villages and villas, a town center, two 18-hole golf courses and clubhouse, and a Marina Club that offers a wide range of water sports activities such as boating, jet ski and kayaking, as well as a shophouse district and resort hotel district.
Highland City
Together with its subsidiary, Empire East Land Holdings, Inc., the Company is set to masterplan this 24-hectare property located at the convergence of Pasig City and Cainta, Rizal. This master-planned township, envisioned to be the first-ever “elevated city” in the Philippines, will be integrated with a lifestyle mall, retail arcades, mixed-use towers, a church, an expansive green park, and an exclusive sports club—raising the standards of urban living in the east side of Metro Manila.
Arden Botanical Estate
The Company, along with its subsidiary Global-Estate Resorts Inc., is jointly developing a 251-hectare property located at the boundary of Trece Martires and the municipality of Tanza in Cavite. Surrounded by natural rivers, the Arden Botanical Estate will have several residential and leisure villages, commercial areas, sports and adventure parks, and a mixed-use district. The expansive development, which will be curated to engage and stimulate the senses, will be highlighted by flower gardens and green parks.
Lucky Chinatown
Located at the heart of Binondo, the world’s oldest Chinatown, Lucky Chinatown is strategically located near Manila’s historic and cultural sites such as Intramuros, Manila City Hall and the National Museum. This 5-hectare property will have residential condominium projects, lifestyle mall, hotel, and a museum that perfectly blends history and modernity.
Northwin Global City
This 85-hectare property is located just 20 kilometers north of Metro Manila along North Luzon Expressway (NLEX), Northwin Global City is set to become Bulacan's first-ever metropolitan hub for business and lifestyle, characterized by its own themed commercial district, high-rise residential condominiums, hotels, malls, mixed-use commercial buildings, educational institutions, and state-of-the-art office towers.
Touted as a 'global business district', Northwin Global City will also carry Megaworld's iTownship features, such as the installation of solar-powered and LED streetlights, underground cabling system, fiber optic cabling, bike lanes, storm water detention facility for flood prevention, intermodal transport terminal, and other sustainable infrastructure for mobility and connectivity.

MEG Annual Report 2021 15
Northwin Global City spans the municipalities of Marilao and Bocaue in Bulacan. It can be accessed via the Marilao Exit of NLEX, and will be just 20 minutes away from the proposed New Manila International Airport in Bulacan, and just five minutes away from the Philippine Arena.
Paragua Coastown
In the laidback, charming beach town of San Vicente, Palawan will soon rise the 462-hectare Paragua Coastown, an 'eco-tourism community' where sustainable tourism and green living co-exist harmoniously.
Paragua Coastown will be highlighted not only by some of the island's most beautiful natural spots—including the famous Port Barton and the country's longest coastline that is also Southeast Asia's second-longest—but also by facilities that encourage a holistic lifestyle, including health and wellness sanctuaries, a cultural center, and even a mangrove reserve park, just to name a few.
Strategically located just a few minutes from the airport, Paragua Coastown is poised to become a true haven for families, couples, and individuals seeking a more mindful and eco-friendly way of life. Marketing and Sales The Company maintains an in-house marketing and sales division for each of its projects. The marketing and sales division is staffed by a trained group of property consultants who exclusively market the Company’s projects. All property consultants are trained prior to selling and the Company also provides a skills enhancement program intended to further develop the sales and marketing staff into high-caliber marketing professionals. Property consultants are required to meet the criteria set by the Company. The Company also works with outside agents who compete directly with the Company’s in-house personnel. The Company also employs marketing services staff whose job is to provide auxiliary services required by the marketing division for its sales and promotional activities. The group is also responsible for monitoring the latest developments in the economy and the real estate property markets as well as conducting market research studies for the marketing division. In addition, the Company has an international marketing division based in Manila who oversees a global network of sales offices which market the projects of the Company and its affiliates to overseas Filipino professionals and retirees throughout Asia, Europe, North America, the Middle East and Australia. The Company enters into marketing agreements with various brokers based in the different overseas markets, which will then market the Company’s projects overseas through their respective marketing networks. Construction The Company has its own architectural and engineering teams and engages independent groups to carry out the design of its high-profile development projects. The Company has a team of project managers who work closely with outside contractors in supervising the construction phase of each project. The Company has also established relationships with Philippine and international architectural firms.
The Company also has a broad base of construction contractors and suppliers and is not dependent on any one contractor or supplier.
Competition For three decades, Megaworld has made a name for itself as a trailblazer in Philippine real estate. Year after year, the Company notches impressive accomplishments, further solidifying its leadership in the industry. Megaworld differentiates itself from other real estate developers through its live-work-play-learn philosophy. This concept shaped the Company’s townships, an approach to real estate that it pioneered. The Company competes with other property investment, development, leasing and property holding companies to attract purchasers as well as tenants for its properties in Metro Manila. The principal bases of competition in the real estate development business are location, product, price, financing, execution, completion, quality of construction, brand and service. The Company believes it has several competitive advantages in each of these categories due to the prime locations of its properties, innovative projects, a reputation for high quality designs, affordable pre-sales financing, after-sales service and a consistent track record of completion. Total Assets of the Group for the year ended 31 December 2021 is ₱398 billion while Net Profit for the same year is ₱14.4 billion.

MEG Annual Report 2021 16
With respect to community township developments, the Company considers Ayala Land, Inc. (“ALI”) to potentially be its only significant competitor. ALI is present in Fort Bonifacio, which is where the Company’s Forbes Town Center, McKinley Hill, McKinley West and Uptown Bonifacio properties are located. With respect to its office and retail leasing business, the Company believes that it has many competitors in the industry such as Robinsons Land Corporation (“RLC”), ALI and SM Prime Holdings, Inc. (“SMPHI”). With respect to high-end and middle income land and condominium sales, ALI claims to compete for buyers primarily on the basis of reputation, reliability, price, quality and location. With respect to its office rental properties, ALI claims to compete for tenants primarily based on the quality and location of the relevant building, reputation of the building’s owner, quality of support services provided by the property manager, and rental and other charges. Total Assets of ALI and subsidiaries for the period ended 31 December 2021 is ₱745.4 billion while their Net Income for the same period is ₱15.6 billion1. RLC believes that its strength is in its mixed-use, retail, commercial and residential developments. For its commercial center business, RLC claims to compete on the basis of its flexibility in developing malls with different sizes. For its residential business, RLC claims to compete in terms of industry-specific technological know-how, capital, reputation and sales and distribution network. Total Assets of RLC and subsidiaries as of the period ended 31 December 2021 is ₱227.9 billion while their Net Income for the same period is ₱8.50 billion.2 SMPHI believes that it has certain significant competitive advantages which include the very good location of its malls, proven successful tenant mix and selection criteria and the presence of SM stores as anchor tenants. Total Assets of SMPHI and subsidiaries as of the period ended 31 December 2021 is ₱804.40 billion while their Net Income for the same period ₱21.91 billion.3 Sources and Availability of Raw Materials The Company has a broad base of suppliers from which it sources its construction materials. The Company is not dependent on any one or a limited number of suppliers. The Company also has no plans on being dependent on any one or a limited number of suppliers. Transactions with and/or dependence on related parties The Company and its subsidiaries, in their ordinary course of business, engage in transactions with its affiliates. The Company’s policy with respect to related party transactions is to ensure that these transactions are entered into on terms comparable to those available from unrelated third parties. Transactions with related parties include investments in and advances granted to or obtained from subsidiaries, associates and other related parties. Other related parties include joint venture partners (See Note 10 to the Audited Financial Statements, Advances to/from Landowners and Joint Operators) and investees which investments are accounted for at cost and other entities which are owned and managed by investors/owners of the Company (See Note 11 to the Audited Financial Statements, Investments in Associates). Advances granted to joint venture partners are in the nature of cash advances made to landowners under agreements covering the development of parcels of land, which are to be used for pre-development expenses such as relocation of existing occupants. Repayment of these advances shall be made upon completion of the project development either in the form of the developed lots corresponding to the landowner’s share in saleable lots or in the form of cash to be derived from sales of the landowner’s share in the saleable lots and residential and condominium units. The commitment for cash advances under the agreements has been fully granted by the Company. Advances granted to and obtained from subsidiaries, associates and other related parties are for purposes of working capital requirements. For more information, see Note 27 to the Audited Financial Statements.
1 2022 Definitive Information Statement of ALI. 2 2022 Definitive Information Statement of RLC. 3 2021 Annual Report of SMPHI.

MEG Annual Report 2021 17
Other related party transactions include collections from sales of land made in prior years to an associate company on an instalment basis. As part of the transaction, the related party entered into a management agreement with the Company, whereby the Company provides overall administration services in relation to the property. The Company avails of marketing services of Eastwood Property and Holdings, Inc. (“EPHI”), a wholly-owned subsidiary of Empire East Land Holdings, Inc. (“EELHI”), Megaworld Newport Property Holdings, Inc. (“MNPHI”) and Megaworld Land, Inc. (“MLI”), which acts as a manager and leasing agent for the commercial properties of the Company. (See Note 27 to the Audited Financial Statements, Related Party Transactions). As consideration for said marketing services, the Company pays commission based on contracted terms. Commission expenses charged by EPHI, MNPHI and MLI are based on prevailing market rates. Other than those disclosed in the Company’s Financial Statements, the Company has not entered into any other related party transactions. Intellectual Property In the Philippines, certificates of registration of trademarks filed with the Philippine Intellectual Property Office prior to the effective date of the Philippine Intellectual Property Code in 1998 are generally effective for a period of 20 years from the date of the certificate, while those filed after the Philippine Intellectual Property Code became effective are generally effective for a shorter period of 10 years, unless terminated earlier.
The Company owns the registered trademark over its name and logo which was renewed in March 2015 and is valid until March 2025. While important, the Company does not believe that its operations or its subsidiaries’ operations depend on its trademarks or any patent, license franchise, concession or royalty agreement. As of the date of this Offering Circular, the Company also has 65 registered trademarks over the names of its development projects.
Regulatory and Environmental Matters Presidential Decree No. 957 (“PD 957”), Republic Act No. 4726 (“RA 4726”) and Batas Pambasa Blg. 220 (“BP 220”) are the principal statutes which regulate the development and sale of real property as part of a condominium project or subdivision. PD 957, RA 4726 and BP 220 cover subdivision projects for residential, commercial, industrial or recreational purposes and condominium projects for residential or commercial purposes. The Housing and Land Use Regulatory Board (“HLURB”) is the administrative agency of the Government which, together with local government units (“LGUs”), enforces these decrees and has jurisdiction to regulate the real estate trade and business.
All subdivision and condominium plans for residential, commercial, industrial and other development projects are required to be filed with the HLURB and the pertinent LGU of the area in which the project is situated. Approval of such plans is conditional on, among other things, the developer’s financial, technical and administrative capabilities. Alterations of approved plans, which affect significant areas of the project, such as infrastructure and public facilities, also require the prior approval of the relevant government body or agency.
The development of subdivision and condominium projects can commence only after the relevant government body has issued the required development permit.
The issuance of a development permit is dependent on, among other things: (i) compliance with required project standards and technical requirements which may differ depending on the nature of the project and (ii) issuance of the barangay clearance, the HLURB locational clearance, Department of Environment and Natural Resources (“DENR”) permits and Department of Agrarian Reform (“DAR”) conversion or exemption orders, as discussed below. A bond equivalent to 10% of the total project cost is required to the posted by the project developer to ensure commencement of the project within one year from the issuance of the development permit.

MEG Annual Report 2021 18
Developers who sell lots or units in a subdivision or a condominium project are required to register the project with and obtain a license to sell from the HLURB. Subdivision or condominium units may be sold or offered for sale only after a license to sell has been issued by the HLURB. As a prerequisite for the issuance of a license to sell by the HLURB, developers are required to file with the HLURB any of the following to guarantee the construction and maintenance of the roads, gutters, drainage, sewerage, water system, lighting systems, and full development of the subdivision or condominium project and compliance with the applicable laws, rules and regulations:
a surety bond callable upon demand equivalent to 20.0% of the development cost of the unfinished portion of the approved plan, issued by a duly accredited surety company (whether private or government), and acceptable to the HLURB;
a real estate mortgage executed by the developer as mortgagor in favor of the Republic of the
Philippines as mortgagee, represented by the HLURB, over property other than the land used for the project for which the license to sell is being obtained, free from any liens and encumbrance and the value of such property, computed on the basis of the zonal valuation of the BIR, must be at least 20.0% of the total development cost; or
other forms of security equivalent to 10.0% of the development cost of the unfinished portion of the
approved plan which may be in the form of the following:
- a cash bond; - a fiduciary deposit made with the cashier and/or disbursing officer of the HLURB; - a certificate of guaranty deposit issued by any bank or financing institution of good standing in
favor of the HLURB for the total development cost; - a letter from any bank of recognized standing certifying that so much has been set aside from
the bank account of the developer in favor of the HLURB, which amount may be withdrawn by the Chief Executive Officer of HLURB or his authorized representative, at any time the developer fails or refuses to comply with his duties and obligations under the bond contract; or
- any irrevocable credit line to be utilized in the development of the project from any bank of recognized standing and a refinancing re-structuring program indicating sources of funding from duly accredited funding institutions.
Project permits and licenses to sell may be suspended, cancelled or revoked by the HLURB, by itself or upon a verified complaint from an interested party, for reasons such as involvement in fraudulent transactions, misrepresentation about the subdivision project or condominium project in any literature which has been distributed to prospective buyers. A license or permit to sell may only be suspended, cancelled or revoked after a notice to the developer has been served and all parties have been given an opportunity to be heard in compliance with the HLURB’s rules of procedure and other applicable laws. Real estate dealers, brokers and salesmen are also required to register and secure a certificate of registration with the HLURB before they can sell lots or units in a registered subdivision or condominium project. The certificate of registration will expire on the first day of December of each year. On June 29, 2009, Republic Act No. 9646 or the Real Estate Service Act of the Philippines (“RA 9646”) was signed into law. RA 9646 strictly regulates the practice of real estate brokers by requiring licensure examinations and attendance in continuing professional education programs. Environmental Laws
Development projects that are classified by law as environmentally critical or projects within statutorily defined environmentally critical areas are required to obtain an Environmental Compliance Certificate (“ECC”) prior to commencement. The DENR, through its regional offices or through the Environmental Management Bureau (“EMB”), determines whether a project is environmentally critical or located in an environmentally critical area. As a requisite for the issuance of an ECC, an environmentally critical project is required to submit an Environmental Impact Statement (“EIS”) to the EMB while a project in an environmentally critical area is generally required to submit an Initial Environmental Examination (“IEE”) to the proper DENR regional office. In case of an environmentally critical project within an environmentally critical area, an EIS is required. The construction of major roads and bridges are considered environmentally critical projects for which EISs and ECCs are mandated.

MEG Annual Report 2021 19
The EIS refers to both the document and the study of a project’s environmental impact, including a discussion of scoping agreement identifying critical issues and concerns as validated by the EMB, environmental risk assessment if determined necessary by EMB during the scoping, environmental management program, the direct and indirect consequences to human welfare and ecological as well as environmental integrity. The IEE refers to the document and the study describing the environmental impact, including mitigation and enhancement measures, for projects in environmentally critical areas. While the EIS or an IEE may vary from project to project, as a minimum, it contains all relevant information regarding the projects’ environmental effects. The entire process of organization, administration and assessment of the effects of any project on the quality of the physical, biological and socio-economic environment as well as the design of appropriate preventive, mitigating and enhancement measures is known as the EIS System. The EIS System successfully culminates in the issuance of an ECC. The issuance of an ECC is a Government certification, indicating that the proposed project or undertaking will not cause a significant negative environmental impact; that the proponent has complied with all the requirements of the EIS System and that the proponent is committed to implement its approved Environmental Management Plan in the EIS or, if an IEE was required, that it shall comply with the mitigation measures provided therein before or during the operations of the project and in some cases, during the project’s abandonment phase. The ECC also provides for other terms and conditions, any violation of which would result in a fine or the cancellation of the ECC. Project proponents that prepare an EIS are required to establish an Environmental Guarantee Fund (“EGF”) when the ECC is issued to projects determined by the DENR to pose a significant public risk to life, health, property and the environment. The EGF is intended to answer for damages caused by such a project as well as any rehabilitation and restoration measures. Project proponents that prepare an EIS are mandated to include a commitment to establish an Environmental Monitoring Fund (“EMF”) when an ECC is eventually issued. The EMF shall be used to support the activities of a multi-partite monitoring team which will be organized to monitor compliance with the ECC and applicable laws, rules and regulations. Aside from the EIS and IEE, engineering, geological and geo-hazard assessment are also required for ECC applications covering subdivisions, housing and other development and infrastructure projects. All development projects, installations and activities that discharge liquid waste into and pose a threat to the environment of the Laguna de Bay Region are also required to obtain a discharge permit from the Laguna Lake Development Authority. The Company incurs expenses for purposes of complying with environmental laws that consist primarily of payments for government regulatory fees. Such fees are standard in the industry and are minimal. Research and Development The Company incurs minimal amounts for research and development activities which do not amount to a significant percentage of revenues. Employees As of December 31, 2021, the Company has 924 employees. The Company intends to hire additional employees if the present workforce becomes inadequate to handle the Company’s operations. The table below shows the breakdown of employees as of December 31, 2021:
Type Number
Senior Management 40
Middle Management 348
Staff 536
Total 924

MEG Annual Report 2021 20
The Company has no collective bargaining agreements with employees and there are no organized labor organizations in the Company. The Company maintains a tax-qualified, non-contributory retirement plan that is being administered by a trustee covering all regular full-time employees. The Company upholds professional and personal advancement of its employees through Megaworld Learning Academy (“MLA”). MLA offers a slew of leadership and training workshops that are facilitated by the Company’s “Learning Ambassadors”, who are all experts in their own fields, or third party consultants. Various programs have been specially designed to enable its employees to upgrade their skills and perform at optimum levels. It endeavours the progress of the Company’s workforce by offering training and workshops covering career, management and leadership development. Risks Associated with the Company’s Business Substantially all of the Company’s business activities are conducted in the Philippines and all of its assets are located in the Philippines, which exposes the Company to risks associated with the Philippines, including the performance of the Philippine economy. Historically, the Company has derived substantially all of its revenues and operating profits from sales of its real estate products in the Philippines, and its business is highly dependent on the state of the Philippine economy. Demand for, and prevailing prices of, developed land, house and lot units are directly related to the strength of the Philippine economy (including overall growth levels and interest rates), the overall levels of business activity in the Philippines and the amount of remittances received from overseas Filipino workers (“OFW”). As a result of the Asian financial crisis that began in 1997, the Philippine economy generally, and the Philippine property market specifically, went through a sharp downturn in the late 1990s. This downturn was further exacerbated during 2000 to 2001 by the political crisis resulting from the impeachment proceedings against, and the subsequent resignation of, former President Joseph Estrada. The global financial downturn also resulted in a general slowdown of the global economy in 2008 and 2009, which had a negative effect on the property market as Philippine property sales declined. More recently, the outbreak of COVID-19, which was declared a global pandemic by the World Health Organization, in the first quarter of 2020, has severely affected and continues to seriously affect the global economy. There is no assurance that there will not be a recurrence of an economic slowdown in the Philippines. Factors that may adversely affect the Philippine economy include:
• decreases in business, industrial, manufacturing or financial activity in the Philippines or in the global markets;
• scarcity of credit or other financing, resulting in lower demand for products and services provided by companies in the Philippines or in the global market;
• exchange rate fluctuations; • increase in trade barriers and tariffs; • a prolonged period of inflation or increase in interest rates; • changes in the Government’s taxation policies; • the emergence of COVID-19, the re-emergence of Severe Acute Respiratory Syndrome, (commonly
known as SARS), avian influenza (commonly known as the bird flu) H1N1 influenza (commonly known as swine flu) or the emergence of another similar disease in the Philippines or in other countries in Southeast Asia;
• natural disasters, including typhoons, earthquakes, fires, floods and similar events; • political instability, terrorism or military conflict in the Philippines, other countries in the region or • globally; and • other regulatory, political or economic developments in or affecting the Philippines.
There is also a degree of uncertainty regarding the economic and political situation in the Philippines. Any deterioration in economic conditions in the Philippines as a result of these or other factors could have a material adverse impact on the Philippine housing and property markets resulting in, among others, lower demand and values for real estate and increased difficulties on the part of tenants in meeting their lease and other financial obligations, which in turn would likely have a material adverse impact on the Company’s business, financial condition, results of operations and prospects. See “Risks Related to the Philippines.”

MEG Annual Report 2021 21
The Company’s business may be materially and adversely affected by the COVID-19 pandemic and other adverse public health developments. COVID-19, an infectious disease that was first reported to have been transmitted to humans in late 2019, has spread globally over the course of 2020. On January 30, 2020, the World Health Organization (“WHO”) declared the COVID-19 outbreak a Public Health Emergency of International Concern, and subsequently, a pandemic on March 11, 2020. In response to the pandemic, on March 13, 2020, the Philippine government placed Metro Manila under “community quarantine” starting on March 15, 2020, which, among others, restricted traveling through land, domestic air, and domestic sea from Metro Manila. On the second day of the implementation of the said community quarantine, the Philippine government declared a Luzon-wide “enhanced community quarantine” (“ECQ”) to arrest the continuing effect of the disease. The enhanced community quarantine mandated the temporary closure of all public and private offices, non-essential shops and businesses, prohibited mass gatherings and all means of public transportation, and restricted traveling through air, sea and land in and out of Luzon, except for diplomats and uniformed workers (carrying medical supplies), among others. In line with this, private establishments providing basic necessities, essential services and such other activities related to food and medicine were allowed to continue operations. On April 7, 2020, the Philippine government extended the ECQ period until April 30, 2020, which was further extended to May 15, 2020. After the ECQ was lifted in certain areas, a modified ECQ (“MECQ”), general community quarantine, (“GCQ”) or modified GCQ (“MGCQ”) was implemented. The graduated lockdown schemes from ECQ, MECQ and GCQ, and MGCQ impose varying degrees of restrictions on travel and business operations in the Philippines. The Government continues to calibrate the imposition of lockdown or community quarantine measures across the country depending on the situation in specific localities. On March 27, 2021, following a spike in COVID-19 cases, the Government placed Metro Manila and certain neighboring provinces under ECQ from March 29, 2021 until April 11, 2021. From April 12, 2021 to May 14, 2021, the quarantine classification for these areas was downgraded to MECQ. Thereafter, beginning May 15, 2021, the Government further reclassified the quarantine classification for the same regions to GCQ. On July 30, 2021, the Government again placed Metro Manila under ECQ from August 6, 2021 to August 20, 2021. On August 20, 2021, the Government downgraded Metro Manila to MECQ from August 21, 2021 to September 7, 2021, and further downgraded to GCQ from September 8, 2021 to September 15, 2021. Starting September 16, NCR piloted the implementation of granular lockdowns starting with a Level 4 category from September 16, 2021 to October 15, 2021. This was eventually transitioned to a less strict Level 3 from October 16, 2021 until November 4, 2021, and further downgraded to Alert Level 2 from November 5, 2021 to December 31, 2021. The outbreak of the COVID-19 and other adverse public health developments, such as the outbreak of avian influenza, severe acute respiratory syndrome, or SARS, Zika virus and Ebola virus could materially and adversely affect the Company’s business, financial condition and results of operations. These may include, temporary closures of the Company’s premises, hospitalization or quarantine of its employees, delay or suspension of supplies from its suppliers and supply chain generally, disruptions or suspension of its operational and construction activities and labor shortage due to restrictions on its employees’ ability to travel. Moreover, as a result of the quarantine measures implemented by the Government, the Company’s malls were forced to close, resulting in a significant decline in footfall, particularly those located within Metro Manila. The Company has provided rent concessions and waived rental charges of its tenants and retail partners for a certain period, particularly to those who are unable to operate due to quarantine measures, in addition to the concessions that the Company is required to provide pursuant to the Bayanihan Act, such as rent payment deferrals. As of December 31, 2021, the Company’s mall leasing activities has shifted to rental fees based on percentage of sales instead of fixed rent and percentage of sales rental fee arrangements. The Company has incurred additional expenses by adopting certain measures to prevent further transmission of COVID-19 such as making hand sanitizers available within its properties, increasing the frequency of disinfection of facilities and providing its employees with personal protective equipment, among others. There is no certainty that such measures will be sufficient or that the Company will not be required to incur additional expense to address the effect of COVID-19 on its operations. In addition, the continued spread of COVID-19 has led to disruption and volatility in the global capital markets. It is possible that the continued spread of COVID-19 could cause a global economic slowdown or recession. The impacts of the outbreak of COVID-19 on the global economy and financial markets generally and on the Company’s results of operations are highly uncertain. Furthermore, there can also be no

MEG Annual Report 2021 22
assurance that the policies and controls for outbreak prevention and disease recurrence introduced by governments, will be successful in preventing disease outbreaks or recurrences or that any actual or suspected outbreak of COVID-19 or other contagious disease affecting the Philippines or elsewhere will not occur. There can also be no assurance that any future outbreak of contagious diseases will not have a material adverse effect on the Company’s business, financial condition, and results of operations. The Company operates in an intensely competitive industry, which could limit the Company’s ability to maintain or increase its market share and maintain profitability. The Company’s real estate operations are subject to intense competition, and some competitors may have substantially greater financial and other resources than the Company, which may allow them to undertake more aggressive marketing and to react more quickly and effectively to changes in the markets and in consumer preferences. In addition, the entry of new competitors into the real estate industry could reduce the Company’s sales and profit margins. In the real estate development industry, the Company competes against a number of residential and commercial developers and real estate services companies, including Ayala Land, Inc. (“ALI”) for the Company’s projects in the Fort Bonifacio area of Metro Manila, and Robinsons Land Corporation, SM Prime Holdings, Inc. and ALI for the Company’s retail and office leasing activities. The Company competes for the acquisition of prime land, resources for development and prospective purchasers and tenants. For example, the city governments of Quezon City, Pasay City and Manila are offering land for the development of business districts, particularly to the developers targeting the BPO industry and that may have projects which compete with the Company’s current development projects. Increased competition from other real estate developers and real estate services companies may adversely affect the Company’s ability to acquire and sell properties or attract and retain tenants. The Philippine property market is cyclical. The Company expects to derive a substantial portion of its revenue in the future from its current portfolio of township development projects. Accordingly, it is heavily dependent on the state of the Philippine property market. The Philippine property market has in the past been cyclical and property values have been affected by the supply of and demand for comparable properties, the rate of economic growth in the Philippines and political and social developments. Since the second half of 2008, the global financial markets have experienced, and may continue to experience, significant dislocations, which originated from the liquidity disruptions in the United States and the European Union credit and sub-prime residential mortgage markets. These disruptions and other events, such as rising government deficits and debt levels, the sovereign credit ratings downgrades and ensuing public deficit and debt reduction measures of the United States and certain member states of the European Union, the risk of a partial collapse of the Eurozone, slower rates of growth in the Chinese economy and increasing level of debt in China, and the outbreak of COVID-19 pandemic have had and continue to have a significant adverse effect on the global financial markets. In particular, the COVID-19 pandemic may cause increasing concerns over the prospects of the Philippine property market, which may materially and adversely affect the demand for properties and property prices in the country. Given the uncertainties as to the development of the pandemic, it will be difficult to predict the extent to which this will continue to impact property development, sales, leasing and hotel operations and the Company. Demand for new residential projects in the Philippines has also fluctuated in the past as a result of prevailing economic conditions in both the Philippines and in other countries, such as the United States (including overall growth levels and interest rates), the strength of overseas markets (as a substantial portion of demand comes from OFWs and expatriate Filipinos), the political and security situation in the Philippines and other related factors. For example, the global financial crisis in 2008 and 2009 resulted in a generally negative effect on real estate property prices globally, including the Philippines. The Company expects this general cyclical trend to continue, which means that the Company’s results of operations may fluctuate from period to period in accordance with fluctuations in the Philippine economy, the Philippine property market and the global property market in general. There can be no assurance that such variances will not have a material adverse effect on the business, financial condition or results of operations of the Company. The Company is subject to significant competition in connection with the acquisition of land for development projects.

MEG Annual Report 2021 23
The Company is subject to significant competition in connection with the acquisition of land for development projects. The Company’s future growth and development are dependent, in part, on its ability to acquire or enter into agreements to develop additional tracts of land suitable for development projects. As the Company and its competitors attempt to locate sites for development, the Company may experience difficulty in locating parcels of suitable size in locations and at prices acceptable to the Company. The Company is exposed to geographic portfolio concentration risks. Properties located in the commercial areas of the Philippines account for a substantial portion of the appraised value of the Company’s assets. The Company’s current projects are primarily located within or at relatively short distances from the traditional main business districts, particularly in Metro Manila. Due to the concentration of the Company’s property portfolio, a decrease in property values in Metro Manila would have a material adverse effect on the business and results of operations of the Company. A domestic asset price bubble could adversely affect the Company’s business. One of the risks inherent in any real estate property market is the possibility of an asset price bubble. An asset price bubble occurs when there is a gross imbalance between the supply and demand in the property market, causing an unusual increase in asset prices. The rapid upsurge in asset prices might result into an eventual decline in prices as markets recalibrate. In the Philippines, the growth of the real estate sector is mainly driven by low interest rates, robust remittances from OFWs, and the fast-growing BPO sector which is vulnerable to global economic changes. The Company believes that the Philippine property sector is adequately protected against a domestic asset price bubble burst. The country has a very young demographic profile benefitting from rising disposable income. It likewise has one of the fastest growing emerging economies, registering Gross Domestic Product growth rates of 6.7% in 2017, 6.2% in 2018 and 5.9% in 2019 and the growth in the property sector is largely supported by infrastructure investments from both the public and private sectors and strong macroeconomic fundamentals. There can be no assurance however, that the Philippines will achieve strong economic fundamentals in the future. Changes in the conditions of the Philippine economy could materially and adversely affect the Company’s business, financial condition and results of operations. The Company faces certain risks related to the cancellation of sales involving its residential projects and in certain circumstances the Company’s revenue may be overstated due to cancelled sales. As a developer and seller of residential real estate, the Company’s business, financial condition and results of operations could be adversely affected in the event a material number of its residential sales are cancelled. The Company is subject to Republic Act No. 6552 (the “Maceda Law”), which applies to all transactions or contracts involving the sale or financing of real estate through instalment payments, including residential condominium units (but excluding industrial and commercial lots). Under the Maceda Law, buyers who have paid at least two years of instalments are granted a grace period of one month for every year of paid instalments to cure any payment default. If the contract is cancelled, the buyer is entitled to receive a refund of at least 50% of the total payments made by the buyer, with an additional 5% per annum in cases where at least five years of instalments have been paid (but with the total not to exceed 90% of the total payments). Buyers who have paid less than two years of instalments and who default on instalment payments are given a 60-day grace period to pay all unpaid instalments before the sale can be cancelled, but without right of refund. See “Regulatory and Environmental Matters — Real estate sales on instalments.” “While the Company historically has not experienced a material number of cancellations to which the Maceda Law has applied, there can be no assurance that it will not experience a material number of cancellations in the future, particularly during slowdowns or downturns in the Philippine economy, periods when interest rates are high or similar situations. In the event the Company does experience a material number of cancellations, it may not have enough funds on hand to pay the necessary cash refunds to buyers or it may have to incur indebtedness in order to pay such cash refunds. In addition, particularly during an economic slowdown or downturn, there can be no assurance that the Company would be able to

MEG Annual Report 2021 24
re-sell the same property or re-sell it at an acceptable price. Any of the foregoing events would have a material adverse effect on the Company’s business, financial condition and results of operations. In spite of the COVID-19 pandemic, the Company has not experienced a material number of cancellations beyond the historical rate of cancellations. However, there can be no assurance that the Company will not suffer from substantial cancellations and that such cancellations will not have a material adverse effect on its financial condition and results of operations. The Company operates in a regulated environment and its businesses are affected by the development and application of regulations in the Philippines. The Company operates its businesses in a regulated environment. Presidential Decree No. 957, as amended, (“PD 957”) and Republic Act No. 4726 or the Condominium Act (“RA 4726”) are the principal statutes which regulate the development and sale of real property as part of a condominium project or subdivision. Presidential Decree No. 957 and RA 4726 cover subdivision projects for residential, commercial, industrial or recreational purposes and condominium projects for residential or commercial purposes. The Department of Human Settlements and Urban Development (“DHSUD”) is the administrative agency of the Government of the Philippines which, together with local government units, enforces these statutes and has jurisdiction to regulate the real estate trade and business. Regulations applicable to the Company’s operations include standards regarding the suitability of the site, road access, necessary community facilities, open spaces, water supply, sewage disposal systems, electricity supply, lot sizes, the length of the housing blocks and house construction. All subdivision plans are required to be filed with and approved by the local government unit with jurisdiction over the area where the project is located, while condominium project plans are required to be filed with and approved by the DHSUD. Approval of such plans is conditioned on, among other things, completion of the acquisition of the project site and the developer’s financial, technical and administrative capabilities. Alterations of approved plans that affect significant areas of the project, such as infrastructure and public facilities, also require the prior approval of the relevant government unit and the DHSUD. There can be no assurance that the Company, its subsidiaries or associates or partners will be able to obtain governmental approvals for its projects or that when given, such approvals will not be revoked. In addition, owners or dealers of real estate projects are required to obtain licenses to sell before making sales or other disposition of lots or real estate projects. Project permits and any license to sell may be suspended, cancelled or revoked by the DHSUD by itself or upon complaint from an interested party and there can be no assurance that the Company, its subsidiaries, associates or partners will in all circumstances, receive the requisite approvals, permits or licenses or that such permits, approvals or licenses will not be cancelled or suspended. Continued compliance with, and any changes in, safety and environmental laws and regulations may adversely affect the Company’s results of operations and financial condition. The operations of the Company’s business are subject to a broad range of safety and environmental laws and regulations. These laws and regulations impose controls on the storage, handling, discharge and disposal of waste, and other aspects of the operations of each of the Company’s business. The Company has incurred, and expects to continue to incur, operating costs to comply with such laws and regulations. In addition, the Company has made and expects to continue to make capital expenditures on an ongoing basis to comply with safety, health and environmental laws and regulations. The discharge of hazardous substances or other pollutants into the air, soil or water that do not comply with relevant health regulations may cause the Company to be liable to third parties, the Government or to the local government units with jurisdiction over the areas where the Company’s facilities and real estate developments are located. The Company may be required to incur costs to remedy the damage caused by such action or pay fines or other penalties for non-compliance. Safety, health and environmental laws and regulations in the Philippines have been increasingly stringent and it is possible that these laws and regulations will become significantly more stringent in the future. The adoption of new safety, health and environmental laws and regulations, new interpretations of existing laws, increased governmental enforcement of environmental laws or other developments in the future may require additional capital expenditures or the incurrence of additional operating expenses in order to comply with such laws and to maintain current operations.

MEG Annual Report 2021 25
Furthermore, if the measures implemented by the Company to comply with these new laws and regulations are not deemed sufficient by the Government, compliance costs may significantly exceed current estimates. If the Company fails to meet safety, health and environmental requirements, it may also be subject to administrative, civil and criminal proceedings initiated by the Government, as well as civil proceedings initiated by environmental groups and other individuals, which could result in substantial fines and penalties against the Company, as well as orders that could limit or halt its operations. The Company cannot predict what safety, health and environmental legislation or regulations will be amended or enacted in the future, how existing or future laws or regulations will be enforced, administered or interpreted, or the amount of future expenditures that may be required to comply with these environmental laws or regulations or to respond to environmental claims. There can be no assurance that the Company will not become involved in future litigation or other proceedings or be held responsible in any such future litigation or proceedings relating to safety, health and environmental matters in the future, the costs of which could be material. The introduction or inconsistent application of, or changes in, laws and regulations applicable to the Company’s business could have a material adverse effect on the Company, its financial condition and results of operations. See “Regulatory and Environmental Matters”. The Company may experience difficulty in managing its expected growth. The Company expects that its operations will continue to grow over the long term as the Philippine real estate market continues to mature. Successful management of this rapid growth in the overall Philippine real estate developments market depends upon, among other things:
• favourable economic conditions and regulatory environment; • the continued acquisition of land for additional projects of the Company; • construction and completion of the Company’s projects in a timely and cost-efficient manner; • the ability to continue to attract purchasers to; and • the availability of sufficient levels of cash flow or necessary financing to support the development of
new projects. The Company may not be able to implement an effective growth strategy in the future to keep pace with the continued development it expects in the Philippine real estate market, and the Company may not be able to complete existing or build additional projects. Any failure by the Company to take advantage of the opportunities presented by a growing market may have a material adverse effect on its financial condition and results of operations. In addition, if the Company is unable to successfully manage the potential difficulties associated with growing its operations or developing additional projects, it may not be able to maintain operating efficiencies. The Company may not be able to meet its internal financial target and debt limit to meet financial objectives. If it is not able to continue to capture scale efficiencies, successfully manage personnel and hiring, improve its systems, continue its cost discipline strategies and grow its project portfolio, the Company may not be able to achieve or maintain its growth or profitability goals. Natural or other catastrophes, including severe weather conditions, may materially disrupt the Company’s operations and result in losses not covered by its insurance. The Philippines has experienced a number of major natural catastrophes over the years, including typhoons, floods, droughts, volcanic eruptions and earthquakes. There can be no assurance that the occurrence of such natural catastrophes will not materially disrupt the Company’s operations. These factors, which are not within the Company’s control, could potentially have significant effects on the Company’s housing and land development projects. In particular, damage to the Company’s structures resulting from such natural catastrophes could also give rise to claims against the Company from third parties or from customers for physical injuries or loss of property. For example, the Taal Volcano eruption in January 2020 affected the Company’s Twin Lakes township, which experienced a 24% decline in real estate sales as compared in the previous year. However, during the quarter the township accounted for only 3% of the Company’s consolidated real estate sales. Further, although the Company carries insurance for certain catastrophic events, of types (such as business interruption insurance), in amounts and with deductibles that the Company believes are in line with general industry practices in the Philippines, there are losses for which the Company cannot obtain insurance at a

MEG Annual Report 2021 26
reasonable cost or at all. Should an uninsured loss or a loss in excess of insured limits occur with respect to a particular development project, for instance, the Company could lose all or a portion of the capital invested for such project, as well as the anticipated future turnover, while remaining liable for any project costs or other financial obligations relative to such development. Any material uninsured loss could materially and adversely affect the Company’s business, financial condition and results of operations. See “Risks Related to the Philippines.” The Company faces risks relating to its real estate development projects, including risks relating to project cost and completion. The real estate development business involves significant risks, including the risk of obtaining required Government approvals and permits which may take substantially more time and resources than anticipated. Construction of projects also may not be completed on schedule and within budget or at all. Real estate development projects require substantial capital expenditures prior to and during the construction period for, among other things, land acquisition and construction. The construction of property projects may take a year or longer before generating positive net cash flow through sales or pre-sales. As a result, the Company’s cash flows and results of operations may be significantly affected by its project development schedules and any changes to those schedules. In addition, the time and costs involved in completing the development and construction of residential projects can be adversely affected by many factors, including shortages of materials, equipment and labor, adverse weather conditions, peso depreciation, natural disasters, labour disputes with contractors and subcontractors, accidents, changes in laws or in Government priorities and other unforeseen problems or circumstances. Where land to be used for a project is occupied by tenants and/or squatters, the Company may have to incur additional costs to remove such occupants and, if required by law, to provide relocation facilities for them. Any of these factors could result in project delays, cost overruns, or the termination or imposition of penalties under certain of the Company’s joint development agreements and financing agreements, all of which could negatively affect the Company’s operating margins. This could also result in sales and resulting profits from a particular development not being recognized in the year in which it was originally expected to be recognized, which could adversely affect the Company’s results of operations for that year. The Company is exposed to risks that it will be unable to lease its properties in a timely manner or collect rent at profitable rates or at all. The Company is subject to risk incidental to the ownership and operation of office and related retail properties including, among other things, competition for tenants, changes in market rents, inability to renew leases or re-let space as existing leases expire, inability to collect rent from tenants due to bankruptcy or insolvency of tenants or otherwise, increased operating costs and the need to renovate, repair and re-let space periodically and to pay the associated costs. In particular, the Company relies on the growth of the BPO business as a continued source of revenue from its rental properties. If the BPO business does not grow as the Company expects or if the Company is not able to continue to attract BPO-based tenants, it may not be able to lease its office space or as a consequence, its retail space, in a timely manner or otherwise at satisfactory rents, which could have a material adverse effect on the Company’s operations and financial condition. For example, in order to help the Company’s tenants cope with the impact of the COVID-19 pandemic, rental fees were waived for mall tenants for the months covered by the ECQ lockdown measures. Since then, mall leasing activities have shifted to rental fees based on a percentage of sales instead of fixed rent and percentage of sales rental fee arrangements. In line with the relevant Government regulations and directives, the Company also provided rent payment deferrals to several mall and office tenants. Although, the Company does not anticipate any challenges in collecting any rent due before the end of the year, there can be no guarantee that the Company will not face challenges collecting rental fees in the future. Increased inflation, fluctuations in interest rates, changes in Government borrowing patterns and Government regulations could have a material adverse effect on the Company’s and its customers’ ability to obtain financing. Interest rates, and factors that affect interest rates, such as the Company’s fiscal policy, could have a material adverse effect on the Company and on demand for its products. For example:

MEG Annual Report 2021 27
• Higher interest rates make it more expensive for the Company to borrow funds to finance ongoing projects or to obtain financing for new projects.
• Because the Company believes that a substantial portion of its customers procure financing to fund their property purchases, higher interest rates make financing, and therefore purchases of real estate, more expensive, which could adversely affect demand for the Company’s residential projects.
• If the Government significantly increases its borrowing levels in the domestic currency market or imposes new regulations that reduce the limit allowed on the exposure of banks to the real estate sector, this could increase the interest rates charged by banks and other financial institutions and also effectively reduce the amount of bank financing available to both prospective property purchasers and real estate developers, including the Company.
• The Company’s access to capital and its cost of financing are also affected by restrictions, such as single borrower limits, imposed by the BSP on bank lending. If the Company were to reach the single borrower limit with respect to any bank, the Company may have difficulty obtaining financing with reasonable rates of interest from other banks.
• Increased inflation in the Philippines could result in an increase in the cost of raw materials, which the Company may not be able to pass on to its customers as increased prices.
• A further expansion in the budget deficit of the Government could also result in an increase in interest rates and inflation, which could in turn have a material effect on the ability of the Company to obtain financing at attractive terms, and on the ability of its customers to similarly obtain financing.
The occurrence of any of the foregoing events, or any combination of them, or of any similar events could have a material adverse effect on the Company’s business, financial condition and results of operations. The Company’s reputation will be adversely affected if projects are not completed on time or if projects do not meet customers’ requirements. The Company has an established reputation and brand name in the real estate development business. If any of the Company’s projects experience construction or infrastructure failures, design flaws, significant project delays, quality control issues, natural calamities such as floods or otherwise, this could have a negative effect on the Company’s reputation and make it more difficult to attract new customers to its other housing and land development projects. For example, the Company is currently developing its projects in Mactan, Cebu and Iloilo province, respectively, two areas in which the Company historically did not have any developments. If the Company encounters specific development issues, such as project delays or local government issues with respect to its new projects in these areas, its business reputation may be negatively affected. Any negative effect on the Company’s reputation or its brand could also affect the Company’s ability to pre-sell its residential development projects. This would impair the Company’s ability to reduce its capital investment requirements. The Company cannot provide any assurance that such events will not occur in a manner that would adversely affect its results of operations or financial condition. Dependence on independent contractors and suppliers of construction materials may impact the Company’s ability to complete projects on time, within budget and according to certain quality standards. The Company relies on independent contractors to provide various services, including land clearing and infrastructure development, various construction projects and building and property fitting-out works. The Company selects independent contractors principally by conducting tenders and taking into consideration factors such as the contractors’ experience, its financial and construction resources, any previous relationship with the Company, its reputation for quality and its track record. There can be no assurance that the Company will be able to find or engage an independent contractor for any particular project or find a contractor that is willing to undertake a particular project within the Company’s budget, which could result in cost increases or project delays. Further, although the Company’s personnel actively supervise the work of such independent contractors, there can be no assurance that the services rendered by any of its independent contractors will always be satisfactory or meet the Company’s requirements for quality. Contractors may also experience financial or other difficulties. Any of these factors could delay the completion or increase the cost of certain development projects and could have a material adverse effect on the Company’s business, financial condition and results of operations.

MEG Annual Report 2021 28
The interests of joint development partners for the Company’s development projects may differ from the Company’s and they may take actions that adversely affect the Company. The Company obtains a significant portion of its land bank through joint development agreements with landowners, as part of its overall land acquisition strategy and intends to continue to do so. Under the terms of its joint development agreements, the Company takes responsibility for project development costs and project sales activities, while its joint venture partner typically supplies the project land. A joint venture involves special risks where the venture partner may have economic or business interests or goals inconsistent with or different from those of the Company’s. The development partner may also take actions contrary to the Company’s instructions or requests, or in direct opposition to the Company’s policies or objectives with respect to the real estate investments, or the development partner may not meet its obligations under the joint development arrangement. Disputes between the Company and its joint development partners could arise which could have an effect on the Company’s investment in the project. Construction defects and other building-related claims may be asserted against the Company, and the Company may be subject to liability for such claims. Philippine law provides that property developers, such as the Company, warrant the structural integrity of structures that were designed or built by them for a period of 15 years from the date of completion of the structures. The Company may also be held responsible for hidden (that is, latent or non-observable) defects in a structure sold by it when such hidden defects render the structures unfit for the use for which it was intended or when its fitness for such use is diminished to the extent that the buyer would not have acquired it or would have paid a lower price had the buyer been aware of the hidden defect. This warranty may be enforced within six months from the delivery of the house to the buyer. In addition, Republic Act No. 6541, as amended, or the National Building Code of the Philippines (the “Building Code”), which governs, among others, the design and construction of buildings, sets certain requirements and standards that must be complied with by the Company. The Company or its officials may be held liable for administrative fines or criminal penalties in case of any violation of the Building Code. There can be no assurance that the Company will not be held liable for damages, the cost of repairs, and/or the expense of litigation surrounding possible claims or that claims will not arise out of uninsurable events, such as landslides or earthquakes, or circumstances not covered by the Company’s insurance and not subject to effective indemnification agreements with the Company’s contractors. Neither can there be any assurance that the contractors hired by the Company will be able to either correct any such defects or indemnify the Company for costs incurred by the Company to correct such defects. In the event a substantial number of claims arising from structural or construction defects arise, this could have a material adverse effect on the Company’s reputation and on its business, financial condition and results of operations. Developments in technology could materially disrupt the Company’s operations and affect the commercial and retail developments of the Company. Changes in technology could materially disrupt the Company’s operations and affect the commercial and retail developments of the Company. For example, customers’ increased use of e-commerce platform may reduce foot traffic at the Company’s malls. The Company has a number of initiatives that utilize technological solutions such as the iTownships or the E-Concierge mobile application. Implementing, maintaining and upgrading technology solutions and supports may require significant investment and there can be no guarantee that the Company will be successful in meeting and serving changing consumer demands. Additionally, these technological and digital platforms may be damaged or interrupted by power loss, technological failures, user errors, other forms of sabotage or other force majeure. Although the Company believes it is adequately protected against identified potential risks and that there are sufficient control processes in place, failure by the Company to maintain and keep pace with technology could have a negative effect on the Company’s business and results of operations.

MEG Annual Report 2021 29
The Company depends on its trademarks and proprietary rights and any failure to protect such intellectual property rights could have a material adverse effect on its ability to market certain products and its results of operations. The Company owns or has pending applications for the registration of, intellectual property rights for various trademarks associated with its projects and corporate names and logos to operate its business. Protection of these intellectual property rights is important to maintaining the distinctive corporate and market identities of the Company. If third parties use counterfeit versions or otherwise look confusingly similar to the Company trademarks, customers and clients may mistake its projects with those, which could negatively affect the brand image and sales of the Company. There is no assurance that third parties will not challenge, invalidate or circumvent any existing or future trademarks issued to, or licensed by, the Company and its subsidiaries. There is also no assurance that the Company will be able to successfully protect its proprietary rights and any failure to protect such proprietary rights could harm its competitive position, which could materially and adversely affect the business, financial condition, results of operations, prospects and reputation of the Company. The Company may be unable to retain key personnel and attract and retain skilled professionals, such as management, sales staff, architects and engineers. Any loss of key personnel, the inability to replace such personnel and failure to train and retain replacement personnel could materially and adversely affect the ability of the Company to provide products and services to its customers. In addition, the Company has relied and will continue to rely significantly on the continued individual and collective contributions of its senior management team. If any key personnel, including senior management, are unable or unwilling to continue in their present positions, the Company may not be able to replace them easily, and its business may be significantly disrupted. The Company’s ability to plan, design and execute current and future projects depends on its ability to attract, train, motivate and retain highly skilled personnel, particularly architects, engineers and project managers. The Company believes that there is significant demand for such personnel not only from its competitors but also from companies outside the Philippines, particularly companies operating in the Middle East. Any inability on the part of Company to hire and, more importantly, retain qualified personnel could impair its ability to undertake project design, planning and execution activities in-house and could require the Company to incur additional costs by having to engage third parties to perform these activities. Any deterioration in the Company’s employee relations could materially and adversely affect the Company’s operations. The Company’s success depends partially on its ability to maintain a productive workforce. Any strikes, work stoppages, work slowdowns, grievances, complaints or claims of unfair practices or other deterioration in the Company’s employee relations could have a material and adverse effect on the Company’s financial condition and results of operations. The Company may be involved in legal and other proceedings from time to time. The Company may, from time to time, be involved in disputes with various parties in the operations of its businesses, including contractual disputes, as well as disputes relating to construction, property development and investigations by regulatory enforcement proceedings. Regardless of the outcome, these disputes and investigations may lead to legal or other proceedings and may result in substantial costs and the diversion of resources and management’s attention. In addition, the Company may also have disagreements with regulatory bodies in the course of operations, which may subject the Company to administrative proceedings and unfavourable decisions that may result in penalties or other liabilities. Any of these outcomes could materially and adversely affect the Company’s business, financial condition and results of operations. The Company enters into transactions with related parties. In the ordinary course of business, the Company transacts with its related parties, such as its subsidiaries and certain of its associated companies, and joint ventures. These transactions have principally consisted of advances, loans, bank deposits, reimbursement of expenses, lease, purchase and sale of real estate and

MEG Annual Report 2021 30
other properties and services, guarantees, construction contracts and development, management, marketing and administrative service agreements. Under Section 50 of the National Internal Revenue Code, in the case of two or more businesses owned or controlled directly or indirectly by the same interests, the BIR Commissioner is authorised to distribute, apportion, or allocate gross income or deductions between or among such businesses upon determination of the necessity to prevent evasion of taxes or to clearly reflect the income of any such business. There can be no assurance that the BIR may confirm these transactions as arm’s length on the basis of the Transfer Pricing Regulations and there can be no assurance that any transfer pricing adjustments by the BIR will not have a material adverse effect on the Company’s business, financial condition or results of operations. Alliance Global Group, Inc. is the single largest shareholder of the Company whose interests may not be the same as those of other shareholders and the Shareholders Alliance Global Group, Inc. is the single largest shareholder of the Company and can exert influence over the policies, management and affairs of the Company. The interests of Alliance Global Group, Inc. may differ from those of the Shareholders or of other shareholders of the Company, which may, as a result, adversely affect the interests of the Shareholders. There can be no assurance that any conflicts of interest between the other shareholders of the Company and Alliance Global Group, Inc. will be resolved in favour of the Shareholders or that Alliance Global Group, Inc. would not cause the Company to take action in manner which might conflict with the interests of Shareholders. RISKS RELATING TO THE PHILIPPINES Political and social instability. The Philippines has, from time to time, experienced political and military instability, including acts of political violence. In the last decade, there has been political instability in the Philippines, including extra-judicial killings, alleged electoral fraud, impeachment proceedings against two former presidents, two chief justices of the Supreme Court of the Philippines, and public and military protests arising from alleged misconduct by the previous and current administrations. In addition, a number of officials of the Philippine Government are currently under investigation or have been indicted on corruption charges stemming from allegations of misuse of public funds, extortion, bribery or usurpation of authority. In addition, the Philippine has also been subject to a number of terrorist attacks and the Armed Forces of the Philippines has been in conflict with groups which have been identified as being responsible for kidnapping and terrorist activities in the Philippines. In addition, bombings have taken place in the Philippines, mainly in cities in the southern part of the country. For example, in May 2017, the city of Marawi in Lanao del Sur, Mindanao, was assaulted by the Maute Group, terrorists who were inspired by pledged allegiance to the Islamic State of Iraq and Syria. Due to the clash between the Philippine Government forces and the terrorists and the risk of the armed conflict spilling over to other parts of Mindanao, martial law was declared in the entire island of Mindanao, Philippines. In October 2017, the city was declared liberated from the terrorists. Despite this, the Philippine Congress extended the imposition of martial law in Mindanao until the end of 2019, citing persistent threats of terrorism and rebellion. The martial law in Mindanao was lifted on January 1, 2020, however Mindanao remains under a state of emergency as a measure against potential terror threats and communist insurgency and to maintain peace and order in the region. An increase in the frequency, severity or geographic reach of these terrorist acts could destabilize the Philippines, and adversely affect the country’s economy. These armed conflict and terror attacks could lead to further injuries or deaths by civilians and members of the military, which could destabilize parts of the country and adversely affect the country’s economy. In addition, the Philippine legislature recently passed the Anti-Terrorism Act of 2020, which has drawn criticism from, and sparked protests by, various sectors because of its controversial provisions on warrantless arrests and its broad definition of terrorist acts, which may be used to target government critics. The said bill will pass into law upon approval by, or within 30 days of receipt upon inaction of, President Rodrigo Duterte. There can be no assurance that the political environment in the Philippines will be stable or that the current or any future government will adopt economic policies that are conducive to sustained economic growth or which do not materially and adversely impact the current regulatory environment for the telecommunications and other companies. An unstable political or social environment in the Philippines could negatively affect

MEG Annual Report 2021 31
the general economic conditions and business environment in the Philippines which, in turn, could have a materially and adverse impact on the Company’s business, financial position and financial performance. Territorial disputes. The Philippines, China and several Southeast Asian nations have been engaged in a series of long-standing territorial disputes arising from competing and overlapping claims over certain islands and features in the West Philippine Sea. China claims historic rights to nearly all of the West Philippine Sea based on its so-called “ninedash line” and in recent years dramatically expanded its military presence in the sea which has raised tension in the region among the claimant countries. In 2013, the Philippines became the first claimant country to file a case before the Permanent Court of Arbitration, the internal arbitration tribunal based at the Hague, Netherlands to legally challenge claims of China in the West Philippine Sea and to resolve the dispute under the principles of international law as provided for under the United Nations Convention on the Law of the Sea. In July 2016, the Permanent Court of Arbitration rendered a decision stating that the Philippines has exclusive sovereign rights over the West Philippine Sea (in the South China Sea) and that the “nine-dash line” claim of China is invalid. The Philippine Government, under the Duterte administration, has taken action to de-escalate tensions concerning the territorial dispute with China. There is no guarantee that the territorial dispute between the Philippines and other countries, including China, would end or that any existing tension will not escalate further, as China has taken steps to exercise control over the disputed territory. Should these territorial disputes continue or escalate further, the Philippines and its economy may be disrupted and the Company’s operations could be adversely affected as a result. In particular, further disputes between the Philippines and China may lead both countries to impose trade restrictions on the other’s imports. Any such impact from these disputes could adversely affect the Philippine economy, and materially and adversely affect the Company’s business, financial position and financial performance. If foreign exchange controls were to be imposed, the Company’s ability to meet its foreign currency payment obligations could be adversely affected. In general, Philippine residents may freely dispose of their foreign exchange receipts and foreign exchange may be freely sold and purchased outside the Philippine banking system. However, the Monetary Board of the BSP has statutory authority, with the approval of the President of the Philippines, during a foreign exchange crisis or in times of national emergency, to:
• suspend temporarily or restrict sales of foreign exchange; • require licensing of foreign exchange transactions; or • require the delivery of foreign exchange to the BSP or its designee banks for the issuance and
guarantee • of foreign currency-denominated borrowings.
The Philippine Government has, in the past, instituted restrictions on the conversion of the Philippine peso into foreign currencies and the use of foreign exchange received by Philippine companies to pay foreign currency denominated obligations. There can be no assurance that foreign exchange controls will not be imposed in the future. If imposed, these restrictions could materially and adversely affect the Company’s ability to obtain foreign currency to service its foreign currency obligations. STRENGHTS The Company believes that it has the following competitive strengths:
• Leading real estate player with established market position and strong brand recognition. • High quality and diversified portfolio provide stability to income generation. • Defensive and recurring income portfolio provides resilience amid economic uncertainty. • High earnings visibility supported by substantial land bank and proven execution track record. • Leading real estate player with an established market position and strong brand recognition. • Experienced management team with robust corporate governance policies.

MEG Annual Report 2021 32
• Conservative balance sheet supported by diversified funding sources and prudent financial management.
STRATEGIES The Company’s objective is to increase its profitability and maintain its leading position as a major property developer in the Philippines, specifically in the middle-income residential condominium market and the market for BPO-related office developments. The Company intends to achieve its objective through the following principal strategies:
• Maximize earnings through integrated community township developments. • Capitalize on brand and reputation. • Build on synergies across the Megaworld group and the larger Alliance Global Group, Inc. group of
companies. • Maintain a strong financial position. • Sustain a diversified development portfolio. • Capitalize on growing opportunities in tourism development.
PROPERTIES Description of Principal Properties The principal properties of the Company as of 31 December 2021 consist of projects under development, condominium units in completed projects, and land for future development, rental properties and hotels, including the following:
TYPE LOCATION OWNED/LEASED/ LIMITATIONS ON OWNERSHIP
A. Condominium Units and Subdivision Lots Under Development 18 Avenue De Triomphe Arcovia City, Pasig City Owned Arcovia Palazzo - Altea Arcovia City, Pasig City Owned Arcovia Palazzo - Benissa Arcovia City, Pasig City Owned Arcovia Palazzo - Cantabria Arcovia City, Pasig City Owned Eastwood Global Plaza Luxury Residence Eastwood, Quezon City Owned One Eastwood Avenue 2 Eastwood, Quezon City Owned Maple Grove Commercial District General Trias, Cavite Joint Venture The Verdin At Maple Grove General Trias, Cavite Owned La Cassia Residences General Trias, Cavite Owned San Antonio Residences East & West Gil Puyat Ave., Makati City Owned Belmont Hotel Iloilo Iloilo Business Park, Iloilo City Owned Lafayette Park Square Iloilo Business Park, Iloilo City Owned Saint Dominique Iloilo Business Park, Iloilo City Owned Saint Honore Iloilo Business Park, Iloilo City Owned The Palladium Iloilo Business Park, Iloilo City Owned The Pinnacle Iloilo Business Park, Iloilo City Owned Belmont Hotel Mactan Newtown Mactan Newtown, Cebu Owned La Victoria Global Residences Mactan Newtown, Cebu Owned The Pearl Global Residences Mactan Newtown, Cebu Owned Manhattan Plaza Tower 2 Manhattan Garden City, Quezon City Joint Venture
St. Mark Residences McKinley Hill, Fort Bonifacio, Taguig City Owned
Park Mckinley West McKinley West, Fort Bonifacio, Joint Venture

MEG Annual Report 2021 33
Taguig City
The Albany Luxury Residences – Kingsley McKinley West, Fort Bonifacio, Taguig City Joint Venture
The Albany Luxury Residences – Yorkshire McKinley West, Fort Bonifacio, Taguig City Joint Venture
Forbes Hill Northill Gateway, Bacolod Joint Venture
Vion Tower Pasong Tamo corner EDSA, Makati City Joint Venture
The Ellis Salcedo Village, Makati City Owned Kingsquare Residence Sta. Cruz, Manila Owned One Regis The Upper East, Bacolod City Owned Two Regis The Upper East, Bacolod City Owned One Manhattan The Upper East, Bacolod City Owned Arden Botanical Village Trece Martires City, Cavite Joint Venture
Uptown Arts Uptown Bonifacio, Fort Bonifacio, Taguig City Joint Venture
Uptown Parksuites Residence Uptown Bonifacio, Fort Bonifacio, Taguig City Joint Venture
B. Condominium Units in Completed Projects Greenbelt Radisson Aguirre St., Legaspi Village, Makati City Owned Cityplace Binondo A & B Binondo, Manila Owned Noble Place Binondo, Manila Joint Venture Kentwood Heights Cubao, Quezon City Owned Narra Heights Cubao, Quezon City Owned Eastwood Le Grand 1-3 Eastwood, Quezon City Owned Eastwood Parkview 1 & 2 Eastwood, Quezon City Owned Grand Eastwood Palazzo Eastwood, Quezon City Owned One Central Park Eastwood, Quezon City Owned One Orchard Road 1-3 Eastwood, Quezon City Owned The Eastwood Excelsior Eastwood, Quezon City Owned The Eastwood Lafayette 1-3 Eastwood, Quezon City Owned One Eastwood Avenue 1 Eastwood, Quezon City Owned 8 Forbestown Road Forbestown Center, Fort Bonifacio, Taguig City Joint Venture The Bellagio 1-3 Forbestown Center, Fort Bonifacio, Taguig City Joint Venture Forbeswood Heights Forbestown Center, Fort Bonifacio, Taguig City Joint Venture Forbeswood Parklane 1 & 2 Forbestown Center, Fort Bonifacio, Taguig City Joint Venture Salcedo SkySuites Gil Puyat Ave., Makati City Owned One Beverly Place Greenhills, San Juan Joint Venture One Madison Place 1 - 3 Iloilo Business Park, Iloilo City Owned Iloilo Boutique Hotel Iloilo Business Park, Iloilo City Owned Wack Wack Heights Lee St., Mandaluyong City Owned Greenbelt Hamilton 1 & 2 Legaspi St., Legaspi Village, Makati City Owned Greenbelt Madison Legaspi Village, Makati City Owned 8 Newtown Boulevard Mactan Newtown, Cebu City Owned One Pacific Residence Mactan Newtown, Cebu City Owned One Manchester Place 1 & 2 Mactan Newtown, Cebu City Owned Savoy Hotel Mactan Newtown Mactan Newtown, Cebu City Owned One Lafayette Square Makati City Owned Two Lafayette Square Makati City Owned Manhattan Parkway 1-3 Manhattan Garden City, Quezon City Joint Venture Manhattan Parkview 1-3 Manhattan Garden City, Quezon City Joint Venture Manhattan Parkview Garden Manhattan Garden City, Quezon City Joint Venture Manhattan Heights Tower A Manhattan Garden City, Quezon City Joint Venture

MEG Annual Report 2021 34
Manhattan Heights Tower B Manhattan Garden City, Quezon City Joint Venture Manhattan Heights Tower C Manhattan Garden City, Quezon City Joint Venture Manhattan Heights Tower D Manhattan Garden City, Quezon City Joint Venture Manhattan Plaza Tower 1 Manhattan Garden City, Quezon City Joint Venture 115 Upper McKinley McKinley Hill, Fort Bonifacio, Taguig City Joint Venture McKinley Hill Garden Villas McKinley Hill, Fort Bonifacio, Taguig City Joint Venture Tuscany Private Estate McKinley Hill, Fort Bonifacio, Taguig City Joint Venture Morgan Suites Executive Residences McKinley Hill, Fort Bonifacio, Taguig City Owned Stamford Executive Residences McKinley Hill, Fort Bonifacio, Taguig City Owned The Venice Luxury Residences – Alessandro McKinley Hill, Fort Bonifacio, Taguig City Owned
The Venice Luxury Residences – Bellini McKinley Hill, Fort Bonifacio, Taguig City Owned
The Venice Luxury Residences – Carusso McKinley Hill, Fort Bonifacio, Taguig City Owned
The Venice Luxury Residences – Domenico McKinley Hill, Fort Bonifacio, Taguig City Owned
The Venice Luxury Residences – Emanuele McKinley Hill, Fort Bonifacio, Taguig City Owned
The Venice Luxury Residences – Fiorenzo McKinley Hill, Fort Bonifacio, Taguig City Owned
Viceroy 1-4 McKinley Hill, Fort Bonifacio, Taguig City Owned The Florence (1-3) McKinley Hill, Fort Bonifacio, Taguig City Owned McKinley West Subdivision McKinley West, Taguig City Joint Venture St. Moritz Private Estate 1 & 2 McKinley West, Taguig City Joint Venture Brentwood Heights Multinational Village, Parañaque City Owned Sherwood Heights Multinational Village, Parañaque City Owned 101 Newport Boulevard Newport, Pasay City Joint Venture 150 Newport Boulevard Newport, Pasay City Joint Venture 81 Newport Boulevard Newport, Pasay City Joint Venture Palm Tree Villas 1 & 2 Newport, Pasay City Joint Venture The Parkside Villas Newport, Pasay City Joint Venture The Residential Resort at Newport Newport, Pasay City Joint Venture Belmont Luxury Hotel Newport, Pasay City Joint Venture Savoy Hotel Newport, Pasay City Joint Venture Golf Hills Terraces Old Balara, Quezon City Joint Venture Golfhill Gardens Old Balara, Quezon City Owned Greenbelt Parkplace Palanca St., Legaspi Village, Makati City Owned Greenbelt Excelsior Palanca St., Legaspi Village, Makati City Joint Venture Marina Square Suites Pedro Gil, Manila Owned Greenhills Heights Pinaglabanan San Juan Joint Venture Greenbelt Chancellor Rada St., Legaspi Village, Makati City Owned Paseo Heights Salcedo Village, Makati City Owned One Central Sen. Gil Puyat Ave., Makati City Owned El Jardin Del Presidente 1 & 2 Sgt. Esguerra Ave., Quezon City Owned One Uptown Residence Uptown Bonifacio, Taguig City Joint Venture Uptown Ritz Residence Uptown Bonifacio, Taguig City Joint Venture Paseo Parkview Suites 1& 2 Valero St. Salcedo Village, Makati City Owned Two Central Valero St., Makati City Owned Three Central Valero St., Makati City Owned The Manhattan Square Valero St., Makati City Joint Venture 8 Wack Wack Road Wack Wack Road, Mandaluyong City Owned

MEG Annual Report 2021 35
C. Rental Properties Arcovia Parade Retail 1 & 2 Arcovia City, Pasig City Owned City Place Retail Mall Binondo, Manila Owned Hotel Lucky Chinatown Binondo, Manila Owned Lucky Chinatown Mall Binondo, Manila Owned Davao Finance Center Davao Park District, Davao City Owned 1800 Eastwood Avenue Eastwood, Quezon City Owned 1880 Eastwood Avenue Eastwood, Quezon City Owned Cyber Mall Eastwood, Quezon City Owned Cyber One Units Eastwood, Quezon City Owned Eastwood Citywalk Eastwood, Quezon City Owned Eastwood Mall Eastwood, Quezon City Owned Eastwood Richmonde Hotel Eastwood, Quezon City Owned E-Commerce Plaza Eastwood, Quezon City Owned Global One Eastwood, Quezon City Owned IBM Plaza Eastwood, Quezon City Owned ICITE Eastwood, Quezon City Owned Techno Plaza 1 Eastwood, Quezon City Owned Techno Plaza 2 Units Eastwood, Quezon City Joint Venture Eastwood Global Plaza Corporate Center Eastwood, Quezon City Owned Burgos Circle Forbestown Center, Fort Bonifacio, Taguig City Joint Venture The World Centre Gil Puyat Ave., Makati City Owned One Beverly Place Retail Greenhills, San Juan Owned Festive Walk Mall Iloilo Business Park, Iloilo City Owned Festive Walk Mall Annex Iloilo Business Park, Iloilo City Owned Festive Walk Parade 2B Iloilo Business Park, Iloilo City Owned Festive Walk Office Tower Iloilo Business Park, Iloilo City Owned One Global Center Iloilo Business Park, Iloilo City Owned One Techno Place Iloilo Business Park, Iloilo City Owned Richmonde Hotel Iloilo & Richmonde Tower Iloilo Business Park, Iloilo City Owned Two Global Center Iloilo Business Park, Iloilo City Owned Three Techno Place Iloilo Business Park, Iloilo City Owned Two Techno Place Iloilo Business Park, Iloilo City Owned One Fintech Place Iloilo Business Park, Iloilo City Owned Two Fintech Place Iloilo Business Park, Iloilo City Owned California Garden Square Retail Libertad cor Calbayog, Mandaluyong City Owned 8 Newtown Boulevard Mactan Newtown, Cebu Owned Mactan Alfresco Mactan Newtown, Cebu Owned One World Center Mactan Newtown, Cebu Owned Tower One Plaza Magellan Mactan Newtown, Cebu Owned Two World Center Mactan Newtown, Cebu Owned Pacific World Tower Mactan Newtown, Cebu Owned The Newtown School of Excellence Mactan Newtown, Cebu Owned 8 Campus Place McKinley Hill, Fort Bonifacio, Taguig City Ground Lease 8 Upper McKinley McKinley Hill, Fort Bonifacio, Taguig City Owned Commerce and Industry Plaza McKinley Hill, Fort Bonifacio, Taguig City Ground Lease Emperador Steel Parking Building McKinley Hill, Fort Bonifacio, Taguig City Ground Lease McKinley Hill (Phase 3) Lots McKinley Hill, Fort Bonifacio, Taguig City Ground Lease McKinley Parking Building McKinley Hill, Fort Bonifacio, Taguig City Owned One Campus Place McKinley Hill, Fort Bonifacio, Taguig City Ground Lease One World Square McKinley Hill, Fort Bonifacio, Taguig City Owned

MEG Annual Report 2021 36
Science Hub Towers McKinley Hill, Fort Bonifacio, Taguig City Ground Lease Southeast Asian Campus McKinley Hill, Fort Bonifacio, Taguig City Ground Lease The Venice Canal Mall McKinley Hill, Fort Bonifacio, Taguig City Ground Lease The Venice Piazza McKinley Hill, Fort Bonifacio, Taguig City Ground Lease Three World Square McKinley Hill, Fort Bonifacio, Taguig City Owned Tuscany Retail McKinley Hill, Fort Bonifacio, Taguig City Joint Venture Two World Square McKinley Hill, Fort Bonifacio, Taguig City Owned Venice Corporate Center McKinley Hill, Fort Bonifacio, Taguig City Ground Lease Woodridge Residences McKinley Hill, Fort Bonifacio, Taguig City Joint Venture Five West Campus McKinley West, Taguig City Joint Venture One West Campus McKinley West, Taguig City Joint Venture Ten West Campus McKinley West, Taguig City Joint Venture Three West Campus McKinley West, Taguig City Joint Venture Two West Campus McKinley West, Taguig City Joint Venture Six West Campus McKinley West, Taguig City Joint Venture Eight West Campus McKinley West, Taguig City Joint Venture Mckinley West Steel Deck Parking McKinley West, Taguig City Joint Venture One Le Grand Tower McKinley West, Taguig City Joint Venture 81 Newport Square Newport City, Pasay City Joint Venture Belmont Luxury Hotel Newport City, Pasay City Joint Venture The Richmonde Hotel Ortigas, Mandaluyong City Owned Paseo Center Paseo Center, Makati City Owned 331 Building Sen. Gil Puyat Ave., Makati City Owned Corinthian Hills Retail Temple Drive, Quezon City Owned Uptown Parade Uptown Bonifacio, Taguig City Joint Venture Uptown Place Mall Uptown Bonifacio, Taguig City Joint Venture Uptown Place Towers Uptown Bonifacio, Taguig City Joint Venture World Commerce Place 1-3 Uptown Bonifacio, Taguig City Joint Venture
The Company’s principal office is located on the 30th Floor, Alliance Global Tower, 36th Street cor. 11th Avenue, Uptown Bonifacio, Taguig City. While the Company has sufficient land for future development, it continuously seeks opportunities to acquire and develop land in prime locations through purchase, joint venture arrangements or otherwise. There are no mortgages, liens or encumbrances over any of the properties owned by the Company. LEGAL PROCEEDINGS No Material Pending Legal Proceedings Neither the Company nor any of its subsidiaries or any of their properties are involved in or the subject of any legal proceedings which would have a material adverse effect on the business or financial position of the Company or any of its subsidiaries, or any of its or their properties. SUBMISSION OF MATTERS TO A VOTE OF SECURITY HOLDERS No matter was submitted during the fourth quarter of 2021 to a vote of security holders.

MEG Annual Report 2021 37
PART II – OPERATIONAL AND FINANCIAL INFORMATION MARKET FOR COMMON EQUITY AND RELATED STOCKHOLDER MATTERS Market Price Information The common shares of the Company are traded on the Philippine Stock Exchange (“PSE”) under the symbol of MEG. The Company’s common stock was first listed on the PSE on June 15, 1994. The following table sets out, for the periods indicated, the high and low sales price for the Company’s common shares as reported on the PSE:
Year First Quarter Second Quarter Third Quarter Fourth Quarter
2020 High 4.45 3,45 3.30 4.15 Low 1.86 2.35 2.84 2.88 2021 High 4.30 3.76 3.30 3.43 Low 3.30 2.60 2.71 2.83 2022 High 3.41 Low 2.90 04/26/2022 Close 2.91
Market price of the Issuer’s Shares as at 31 December 2021 was ₱3.15 per share.
Holders
As of 31 December 2021, the Company has 2,419 shareholders of record worldwide. The following table sets forth the twenty largest shareholders of the Company as of 31 December 2021.
Name of Shareholder
Number of Shares Held
Percent of Total Outstanding Shares
1. Alliance Global Group, Inc. 14,390,844,058
38.01%
6,000,000,00 15.85%
20,390,844,058
53.86%
2. PCD Nominee Corporation (Filipino) 6,925,043,077
18.29%
3. New Town Land Partners, Inc. 5,668,530,324 14.97%
4. PCD Nominee Corporation (Non-Filipino) 3,679,560,765
9.72%
5. First Centro, Inc. 873,012,500 2.31%
6. Richmonde Hotel Group International limited 420,000,000 1.11%
7. Megaworld Cebu Properties, Inc. 143,000,000 0.38%
8. Simon Lee Sui Hee 8,845,200 0.02%
09. OCBC Securities Phils., Inc. FAO: Santiago Tanchan 7,371,000 0.02%

MEG Annual Report 2021 38
10. Luisa Co Li 5,525,697 0.01%
11. Evangeline Abdullah 5,400,000 0.01%
12. Jasper Karl Tanchan Ong 5,370,300 0.01%
13. Winston Co 5,180,760 0.01%
14. Luis U. Ang &/or Teresa W. Ang 4,000,000 0.01%
15. Luis Ang &/or Lisa Ang 3,785,532 0.01%
16. Lucio W. Yan 3,780,000 0.01%
17. Alberto Mendoza &/or Jeanie C. Mendoza 2,587,454 0.01%
18. Luis U. Ang &/or Liza W. Ang 2,529,345 0.01%
19. Tiong Lam Ku &/or Nelson O. Ku 2,520,000 0.01%
20. Vicente de Vera 2,098,826 0.01% Dividend Policy The payment of dividends, either in the form of cash or stock, will depend upon the Company's earnings, cash flow and financial condition, among other factors. The Company may declare dividends only out of its unrestricted retained earnings. These represent the net accumulated earnings of the Company with its capital unimpaired, which are not appropriated for any other purpose. The Company may pay dividends in cash, by the distribution of property, or by the issue of shares of stock. Dividends paid in cash are subject to the approval by the Board of Directors. Dividends paid in the form of additional shares are subject to approval by both the Board of Directors and at least two-thirds of the outstanding capital stock of the shareholders at a shareholders' meeting called for such purpose. Cash dividends amounting to ₱1.36 billion, ₱1.19 billion and ₱2.39 billion were declared on the Company’s common shares in 2021, 2020 and 2019, respectively. The dividends were paid in December 2021, January 2021 and July 2019, respectively. Cash dividends were declared on the Company’s Series “A” Preferred Shares in 2021, 2020 and 2019 in the amount of ₱600,000 for each year. The dividends were paid in December 2021, January 2021 and July 2019. The Company declares cash dividends to shareholders of record usually in the first half of each year. These dividends are paid from unrestricted retained earnings. The Company intends to maintain an annual cash dividend payment ratio of 20% of its net income from the preceding year, subject to the requirements of applicable laws and regulations and the absence of circumstances that may restrict the payment of such dividends, such as where the Company undertakes major projects and developments. The Company’s Board of Directors may, at any time, modify its dividend payout ratio depending upon the results of operations and future projects and plans of the Company. Recent Sales of Unregistered or Exempt Securities The following securities were issued as exempt from the registration requirements of the Securities Regulation Code (SRC) and therefore have not been registered with the SEC: (a) In 2013, the Company issued US$250,000,000 worth of corporate notes due in 2023 with a coupon of
4.25%. UBS acted as sole global coordinator and bookrunner for the issue. The corporate notes are listed in the Singapore Exchange Securities Trading Limited.
(b) In 2018, the Company issued US$200,000,000 worth of perpetual bonds with a coupon of 5.375%. JP Morgan acted as Sole Bookrunner. The perpetual bonds are listed in the Singapore Exchange Securities Trading Limited.

MEG Annual Report 2021 39
MANAGEMENT’S DISCUSSION AND ANALYSIS OF RESULTS OF OPERATIONS AND FINANCIAL CONDITION Results of Operations (Based on Financial Statements adopted in accordance with the Philippine Financial Reporting Standards) Review of December 31, 2021 versus December 31, 2020 Megaworld, the country’s largest developer of integrated urban townships, saw its net income increased by 35.79% to Php14.38 billion in the fourth quarter of 2021 from Php10.59 billion during the same period in 2020, just as the company registered gains in line with the improving business environment. Net income attributable to parent company stood at Php13.43 billion, increased by 35.89% from Php9.89 billion last year. Megaworld’s consolidated revenues increased by 16.57% from Php43.54 billion in the fourth quarter of 2020 to Php50.75 billion during the same period this year. Development. Among product portfolios, the bulk of consolidated revenues came from the sale of condominium units and commercial lot, comprising 61.33% of total revenues. Real estate sales grew by 25.23% year-on-year to Php31.13 billion from the previous year’s Php24.86 billion as construction activities picked up during the year. The Group’s registered sales mostly came from the following projects: Golfhill Gardens, Park McKinley West, One Regis, Eastwood Global Plaza Luxury Residence, Uptown Parksuites Tower 1&2, Bayshore Residential Resort 2 Phase 2, San Antonio Residence, Vion Tower, Grand Westside Hotel, Mactan Belmont Luxury Hotel, The Palladium, The Albany-Yorkshire & Kingsley, Lafayette Park Square, The Ellis, Savoy Hotel Mactan Newtown, Maple Grove Commercial District, Eastwood Le Grand Tower 2, Gentry Manor, The Venice Luxury Residence – St. Marks Residences, Iloilo Boutique Hotel, Manhattan Plaza Tower 1, St. Moritz Private Estate 2 and Saint Dominique. Leasing. The Group’s rental businesses, comprising of office and lifestyle mall leasing, registered a 2.99% increase, reaching Php13.32 billion in the fourth quarter of 2021 from the previous year’s Php12.93 billion. This contributed 26.24% of the total consolidated revenues for the first twelve months of the year. Hotel Operations. The Group’s revenues attributable to hotel operations posted a strong recovery in 2021 to Php1.93 billion during the fourth quarter of 2021 with an increase of 30.14% from Php1.48 billion for the same period last year. Total costs and expenses amounted to Php36.38 billion, an increase by 10.39% from Php32.95 billion last year. Interest and other charges – net increased by 64.08%, amounting to Php4.81 billion this year from Php2.93 billion in 2020. Tax expense in 2021 amounting to Php565 million resulted to a decrease of 83.13% from 2020 reported amount of Php3.35 billion due to lower taxable income. There were no seasonal aspects that had a material effect on the financial condition or financial performance of the Group. Neither were there any trends, events or uncertainties that have had or that are reasonably expected to have a material impact on net sales or revenues or income from continuing operations. The Group is not aware of events that will cause material change in the relationship between costs and revenues. There are no significant elements of income or loss that did not arise from the Group’s continuing operations. Financial Condition The Group maintains a prudent financial policy as it engages to a more competitive and challenging environment. The Group’s Statements of Financial Position reflects stable financial growth. Total resources as at December 31, 2021 amounted to Php397.98 billion, posting an increase of 5.93% compared to Php375.69 billion as at December 31, 2020.

MEG Annual Report 2021 40
The Group shows steady liquid position as at December 31, 2021 by having its current assets at Php227.83 billion as against its current obligations at Php61.91 billion. Current assets posted an increase of 8.15% from December 31, 2020 balance of Php210.67 billion. Current obligations reflected a decrease of 14.87% from December 31, 2020 balance of Php72.72 billion. Cash and cash equivalents increased by 9.03% from Php40.17 billion in 2020 to Php43.79 billion as at December 31, 2021. Current and non-current trade and other receivables – net increased by 7.15%, amounting to Php46.97 billion as at December 31, 2021 compared to Php43.84 billion as at December 31, 2020. Contract assets increased by 2.79%, amounting to Php19.92 billion as at December 31, 2021 compared to Php19.38 billion as at December 31, 2020. Inventories increased by 9.05% from Php106.13 billion in 2020 to Php115.74 billion as at December 31, 2021. This includes raw land for residential development and property development cost reclassified due to adoption PFRS 15 and PIC Q&As 2018-11, 2018-15 and 2018-12. Investment properties – net increased by 3.69% amounting to Php119.22 billion in December 31, 2021 from Php114.98 billion in December 31, 2020. This includes raw land and property development cost for office and commercial development reclassified due to adoption of PIC Q&As 2018-11, 2018-15 and 2018-12. Trade and other payables amounted to Php22.88 billion and Php23.33 billion as at December 31, 2021 and December 31, 2020, respectively, reflecting a decrease of 1.95%. Contract liabilities increased by 26.70%, amounting to Php7.40 billion as at December 31, 2021 compared to Php5.84 billion as at December 31, 2020. Total current and non-current customers’ deposits as at December 31, 2021 amounted to Php12.15 billion compared Php14.69 billion as at December 31, 2020 with 17.25% decrease. The interest-bearing loans and borrowings current and non-current amounted to Php51.65 billion and Php45.58 billion for December 31, 2021 and December 31, 2020, respectively, reflecting an increase of 13.32%. Bonds payable increased by 4.22%, amounting to Php41.98 billion as at December 31, 2021 compared to Php40.28 billion as at December 31, 2020. Total other liabilities amounted to Php16.57 billion from Php17.69 billion as at December 31, 2021 and December 31, 2020, respectively, translating to a decrease of 6.36%. Total Equity (including non-controlling interests) increased by 8.08% from Php212.53 billion as at December 31, 2020 to Php229.70 billion as at December 31, 2021. The top five (5) key performance indicators of the Group are shown below:
December 31, 2021 December 31, 2020
Current Ratio*1 3.68:1.00 2.90:1.00 Debt to Equity Ratio *2 0.41:1.00 0.40:1.00 Net Debt to Equity Ratio *3 0.22:1.00 0.22:1.00 December 31, 2021 December 31, 2020
Return on Assets *4 4.00% 3.00% Return on Equity *5 7.00% 5.00%
*1 – Current Assets / Current Liabilities *2 – Total Debt / Equity (Total debt includes interest bearing loans and borrowings and bonds payable) *3 – Net Debt / Equity (Net debt is total debt less cash and cash equivalents) *4 – Net Profit / Average Total Assets *5 – Net Profit / Average Equity (Computed using figures attributable only to parent company shareholders)
With its strong financial position, the Group will continue investing in and pursuing expansion activities as it focuses on identifying new markets, maintaining established markets and tapping business opportunities. Material Changes in the Year 2021 Financial Statements (Increase/decrease of 5% or more versus December 31, 2020)
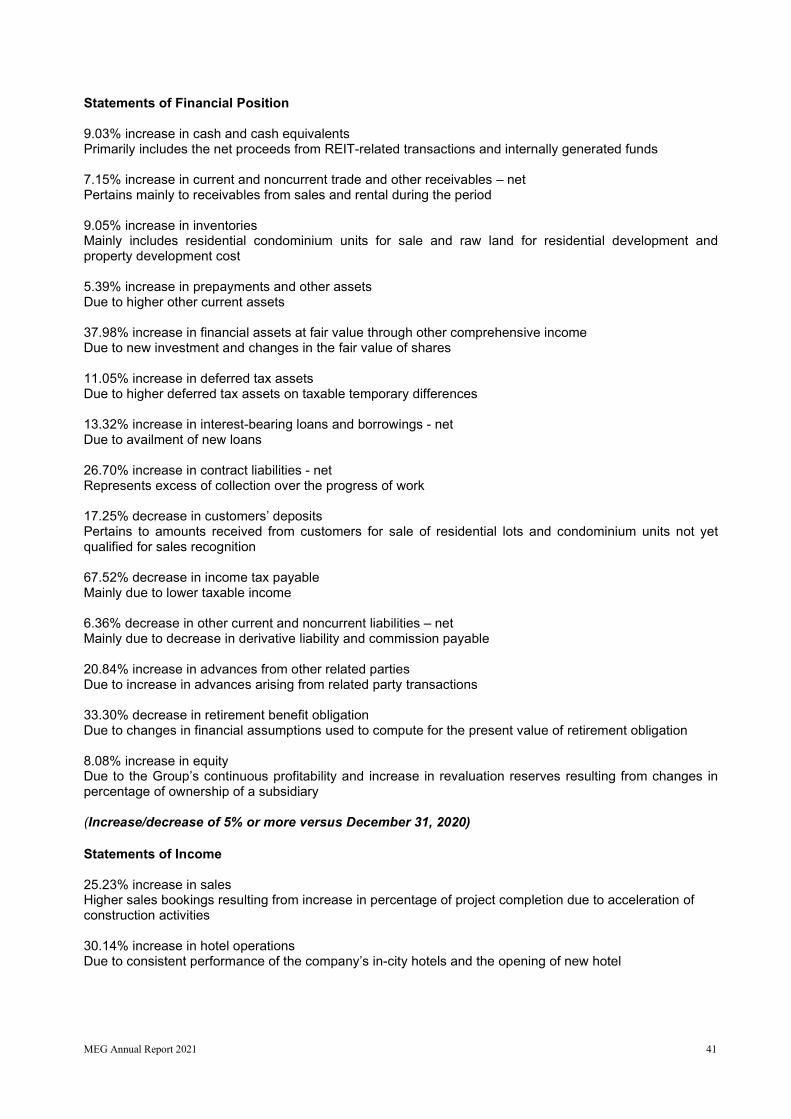
MEG Annual Report 2021 41
Statements of Financial Position 9.03% increase in cash and cash equivalents Primarily includes the net proceeds from REIT-related transactions and internally generated funds 7.15% increase in current and noncurrent trade and other receivables – net Pertains mainly to receivables from sales and rental during the period 9.05% increase in inventories Mainly includes residential condominium units for sale and raw land for residential development and property development cost 5.39% increase in prepayments and other assets Due to higher other current assets 37.98% increase in financial assets at fair value through other comprehensive income Due to new investment and changes in the fair value of shares 11.05% increase in deferred tax assets Due to higher deferred tax assets on taxable temporary differences 13.32% increase in interest-bearing loans and borrowings - net Due to availment of new loans 26.70% increase in contract liabilities - net Represents excess of collection over the progress of work 17.25% decrease in customers’ deposits Pertains to amounts received from customers for sale of residential lots and condominium units not yet qualified for sales recognition 67.52% decrease in income tax payable Mainly due to lower taxable income 6.36% decrease in other current and noncurrent liabilities – net Mainly due to decrease in derivative liability and commission payable 20.84% increase in advances from other related parties Due to increase in advances arising from related party transactions 33.30% decrease in retirement benefit obligation Due to changes in financial assumptions used to compute for the present value of retirement obligation 8.08% increase in equity Due to the Group’s continuous profitability and increase in revaluation reserves resulting from changes in percentage of ownership of a subsidiary (Increase/decrease of 5% or more versus December 31, 2020) Statements of Income 25.23% increase in sales Higher sales bookings resulting from increase in percentage of project completion due to acceleration of construction activities 30.14% increase in hotel operations Due to consistent performance of the company’s in-city hotels and the opening of new hotel

MEG Annual Report 2021 42
152.65% increase in equity share in net losses of associates Mainly due to incurred losses of associates 22.36% increase in cost of sales Higher sales bookings resulting from increase in percentage of project completion due to acceleration of construction activities 12.86% increase in cost of hotel operations Represents direct costs attributable to hotel operations 64.08% increase in interest and other charges-net Primarily due to higher finance costs and foreign currency losses incurred during the period 83.13% decrease in income tax expense Due to lower taxable income and tax effects of deductible temporary differences 8.56% increase in operating expenses Mainly due to increase in selling, administrative and miscellaneous expenses There are no other significant changes in the Group’s financial position (5% or more) and condition that will warrant a more detailed discussion. Further, there are no material events and uncertainties known to management that would have impact or change the reported financial information and condition on the Group. There are no known trends or demands, commitments, events or uncertainties that will result in or that are reasonably likely to result in increasing or decreasing the Group’s liquidity in any material way. The Group does not anticipate having any cash flow or liquidity problems. The Group is not in default or breach of any note, loan, lease or other indebtedness or financing arrangement requiring it to make payments. There are no material off-balance sheet transactions, arrangements, obligations (including contingent obligations), and other relationships of the Group with unconsolidated entities or other persons created during the reporting period. The Group has no unusual nature of transactions or events that affects assets, liabilities, equity, net income or cash flows. There were no seasonal aspects that had a material effect on the financial condition or results of operations of the Group. There were no known material events subsequent to the end of the period that have not been reflected in the Group’s Financial Statements as at fourth quarter of 2021. There were no changes in estimates of amount reported in the current financial year or changes in estimates of amounts reported in prior financial years. There was no contingent liability reflected in the most recent annual financial statement, the same in the consolidated financial statements as at fourth quarter of 2021. There are no commitments, guarantees and contingent liabilities that arise in the normal course of operations of the Group which are not reflected in the accompanying consolidated financial statements. There were no other material issuances, repurchases or repayments of debt and equity securities.

MEG Annual Report 2021 43
Results of Operations (Based on Financial Statements adopted in accordance with the Philippine Financial Reporting Standards) Review of December 31, 2020 versus December 31, 2019 Megaworld, the country’s largest developer of integrated urban townships, saw its net income decline by 45.13% to Php10.59 billion in 2020 from Php19.30 billion last year. The Group’s weaker earnings was traced mainly due to COVID-19 pandemic affecting the core businesses. Net income attributable to parent company stood at Php9.89 billion, lower by 44.87% from Php17.93 billion last year. Megaworld’s consolidated revenues decreased by 35.42% from Php67.31 billion in 2019 to Php43.47 billion in 2020. Development. Among product portfolios, the bulk of consolidated revenues came from the sale of condominium units and commercial lot, comprising 57.18% of total revenues. Real estate sales decreased by 41.65%, amounting to Php24.86 billion and Php42.60 billion for the years 2020 and 2019, respectively. The Group’s registered sales mostly came from the following projects: San Antonio Residence, Maple Grove Commercial District, The Florence, Albany Kingsley, Bayshore Residential Resort 2 Phase 2, The Palladium at Iloilo Business, One Eastwood Avenue Tower 1&2, Uptown Parksuites Tower 2, Park McKinley West, Gentry Manor, Eastwood Global Plaza Luxury Residence and Bayshore Residential Resort 2. Leasing. The Group’s rental businesses, comprising of office and lifestyle mall leasing, registered a 23.08% decline, reaching Php12.93 billion in 2020 from the previous year’s Php16.81 billion. This contributed 29.75% of the total consolidated revenues for the first nine months of the year. Hotel Operations. The Group’s revenues attributable to hotel operations posted an amount of Php1.48 billion during 2020 with a decrease of 41.73% from Php2.54 billion last year. Total costs and expenses amounted to Php32.88 billion, a decrease by 31.52% from Php48.02 billion last year. Interest and other charges – net decreased by 10.15%, amounting to Php2.93 billion this year from Php3.26 billion in 2019. Tax expense in 2020 amounting to Php3.35 billion resulted to a decrease of 44.95% from 2019 reported amount of Php6.08 billion due to lower taxable income. There were no seasonal aspects that had a material effect on the financial condition or financial performance of the Group. Neither were there any trends, events or uncertainties that have had or that are reasonably expected to have a material impact on net sales or revenues or income from continuing operations. The Group is not aware of events that will cause material change in the relationship between costs and revenues. There are no significant elements of income or loss that did not arise from the Group’s continuing operations. Financial Condition The Group maintains a prudent financial policy as it engages to a more competitive and challenging environment. The Group’s Statements of Financial Position reflects stable financial growth. Total resources as at December 31, 2020 amounted to Php375.69 billion, posting an increase of 7.45% compared to Php349.63 billion as at December 31, 2019. The Group shows steady liquid position as at December 31, 2020 by having its current assets at Php210.67 billion as against its current obligations at Php72.72 billion. Current assets posted an increase of 10.59% from December 31, 2019 balance of Php190.51 billion. Current obligations reflected an increase of 26.37% from December 31, 2019 balance of Php57.54 billion.

MEG Annual Report 2021 44
Cash and cash equivalents increased by 73.85% from Php23.10 billion in 2019 to Php40.17 billion in 2020. Current and non-current trade and other receivables – net decreased by 2.17%, amounting to Php43.84 billion as at December 31, 2020 compared to Php44.81 billion as at December 31, 2019. Contract assets increased by 3.96%, amounting to Php19.38 billion as at December 31, 2020 compared to Php18.64 billion as at December 31, 2019. Inventories increased by 3.20% from Php102.85 billion in 2019 to Php106.13 billion in 2020. This includes raw land for residential development and property development cost reclassified due to adoption PFRS 15 and PIC Q&As 2018-11, 2018-15 and 2018-12. Investment properties – net increased by 3.69% amounting to Php114.98 billion in December 31, 2020 from Php110.89 billion in December 31, 2019. This includes raw land and property development cost for office and commercial development reclassified due to adoption of PIC Q&As 2018-11, 2018-15 and 2018-12. Trade and other payables amounted to Php23.11 billion and Php19.31 billion as at December 31, 2020 and December 31, 2019, respectively, reflecting a 19.71% increase. Contract liabilities increased by 12.09%, amounting to Php5.84 billion as at December 31, 2020 compared to Php5.21 billion as at December 31, 2019. Total current and non-current customers’ deposits as at December 31, 2020 amounted to Php14.69 billion compared Php13.80 billion as at December 31, 2019 with 6.44% increase. The interest-bearing loans and borrowings current and non-current amounted to Php45.58 billion and Php51.26 billion for December 31, 2020 and December 31, 2019, respectively, reflecting an 11.08% decrease. Bonds payable increase by 63.59%, amounting to Php40.28 billion as at December 31, 2020 compared to Php24.62 billion as at December 31, 2019. Total other liabilities amounted to Php17.91 billion from Php14.66 billion as at December 31, 2020 and December 31, 2019, respectively, translating to an increase of 22.19%. Total Equity (including non-controlling interests) increased by 3.74% from Php204.87 billion as at December 31, 2019 to Php212.53 billion as at December 31, 2020. The top five (5) key performance indicators of the Group are shown below:
December 31, 2020 December 31, 2019
Current Ratio*1 2.90:1.00 3.31:1.00 Debt to Equity Ratio*2 0.40:1.00 0.37:1.00 Net Debt to Equity Ratio*3 0.22:1.00 0.26:1.00 December 31, 2020 December 31, 2019
Return on Assets*4 3.00% 6.00% Return on Equity*5 5.00% 10.00%
*1 – Current Assets / Current Liabilities *2 – Total Debt / Equity (Total debt includes interest bearing loans and borrowings and bonds payable) *3 – Net Debt / Equity (Net debt is total debt less cash and cash equivalents) *4 – Net Profit / Average Total Assets *5 – Net Profit / Average Equity (Computed using figures attributable only to parent company shareholders)
With its strong financial position, the Group will continue investing in and pursuing expansion activities as it focuses on identifying new markets, maintaining established markets and tapping business opportunities. Material Changes in the Year 2020 Financial Statements (Increase/decrease of 5% or more versus December 31, 2019) Statements of Financial Position 73.85% increase in cash and cash equivalents Proceeds from issuance of dollar bonds 7.19% decrease in financial assets at fair value through other comprehensive income Due to changes in the fair value of shares
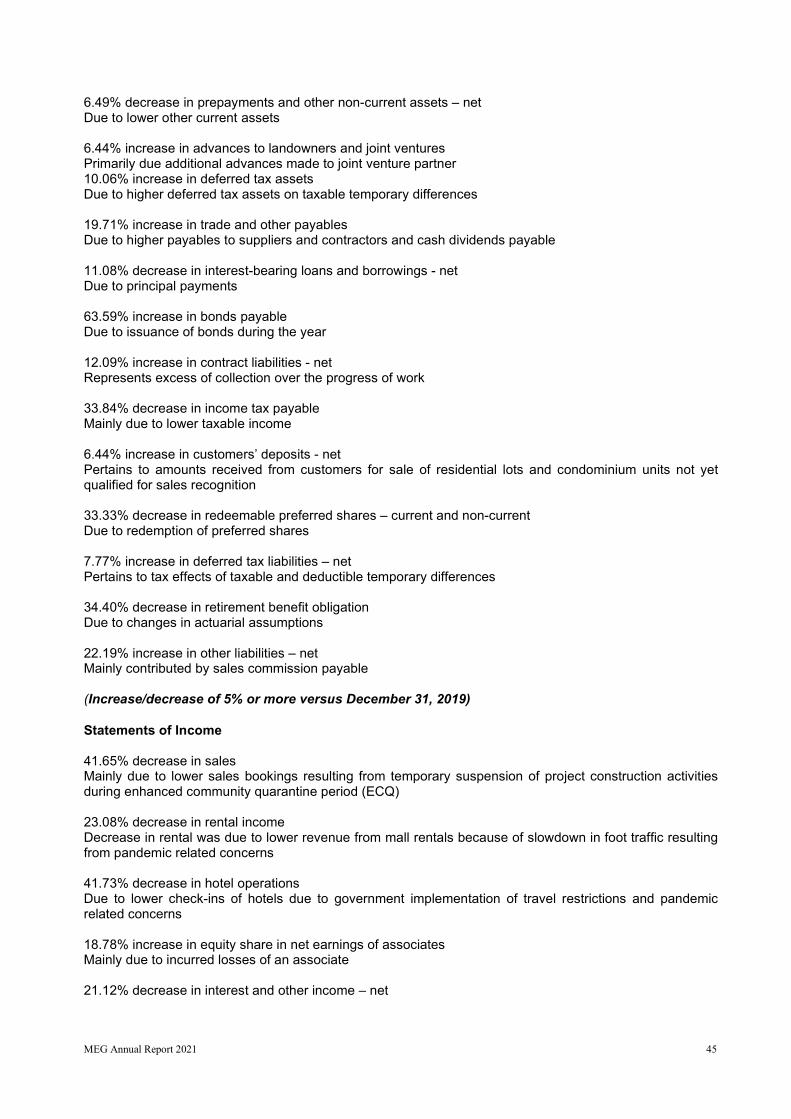
MEG Annual Report 2021 45
6.49% decrease in prepayments and other non-current assets – net Due to lower other current assets 6.44% increase in advances to landowners and joint ventures Primarily due additional advances made to joint venture partner 10.06% increase in deferred tax assets Due to higher deferred tax assets on taxable temporary differences 19.71% increase in trade and other payables Due to higher payables to suppliers and contractors and cash dividends payable 11.08% decrease in interest-bearing loans and borrowings - net Due to principal payments 63.59% increase in bonds payable Due to issuance of bonds during the year 12.09% increase in contract liabilities - net Represents excess of collection over the progress of work 33.84% decrease in income tax payable Mainly due to lower taxable income 6.44% increase in customers’ deposits - net Pertains to amounts received from customers for sale of residential lots and condominium units not yet qualified for sales recognition 33.33% decrease in redeemable preferred shares – current and non-current Due to redemption of preferred shares 7.77% increase in deferred tax liabilities – net Pertains to tax effects of taxable and deductible temporary differences 34.40% decrease in retirement benefit obligation Due to changes in actuarial assumptions 22.19% increase in other liabilities – net Mainly contributed by sales commission payable (Increase/decrease of 5% or more versus December 31, 2019) Statements of Income 41.65% decrease in sales Mainly due to lower sales bookings resulting from temporary suspension of project construction activities during enhanced community quarantine period (ECQ) 23.08% decrease in rental income Decrease in rental was due to lower revenue from mall rentals because of slowdown in foot traffic resulting from pandemic related concerns 41.73% decrease in hotel operations Due to lower check-ins of hotels due to government implementation of travel restrictions and pandemic related concerns 18.78% increase in equity share in net earnings of associates Mainly due to incurred losses of an associate 21.12% decrease in interest and other income – net
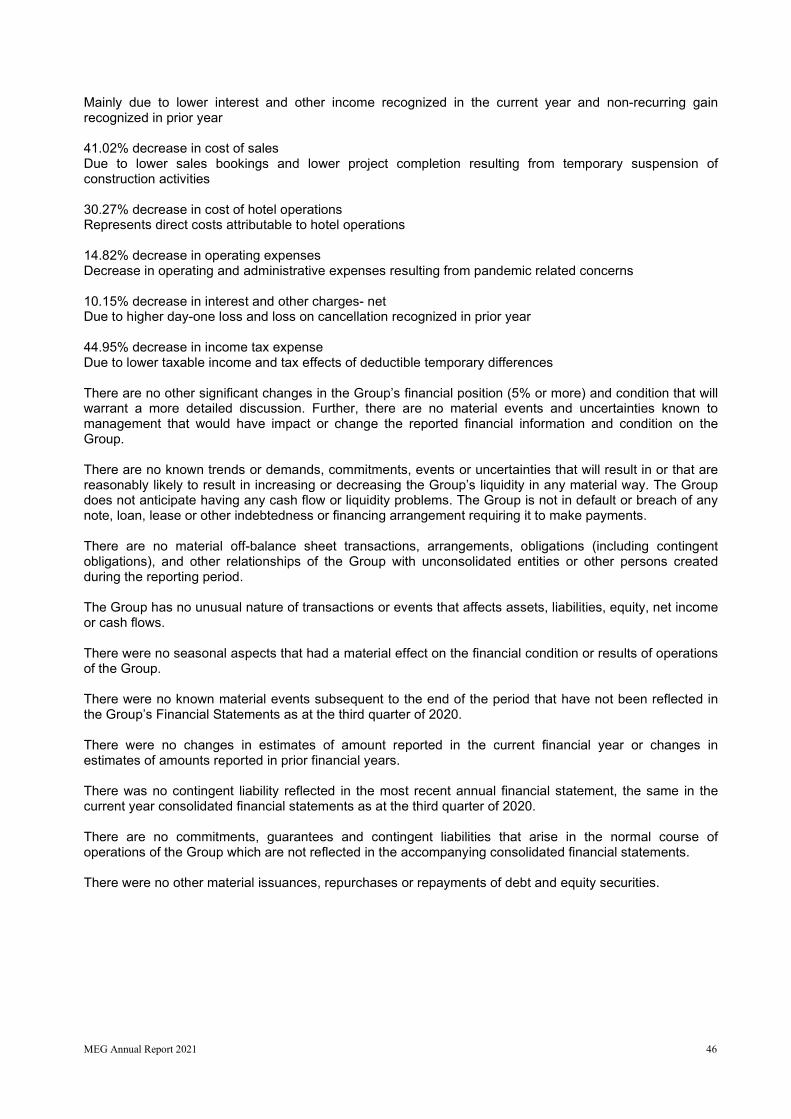
MEG Annual Report 2021 46
Mainly due to lower interest and other income recognized in the current year and non-recurring gain recognized in prior year 41.02% decrease in cost of sales Due to lower sales bookings and lower project completion resulting from temporary suspension of construction activities 30.27% decrease in cost of hotel operations Represents direct costs attributable to hotel operations 14.82% decrease in operating expenses Decrease in operating and administrative expenses resulting from pandemic related concerns 10.15% decrease in interest and other charges- net Due to higher day-one loss and loss on cancellation recognized in prior year 44.95% decrease in income tax expense Due to lower taxable income and tax effects of deductible temporary differences There are no other significant changes in the Group’s financial position (5% or more) and condition that will warrant a more detailed discussion. Further, there are no material events and uncertainties known to management that would have impact or change the reported financial information and condition on the Group. There are no known trends or demands, commitments, events or uncertainties that will result in or that are reasonably likely to result in increasing or decreasing the Group’s liquidity in any material way. The Group does not anticipate having any cash flow or liquidity problems. The Group is not in default or breach of any note, loan, lease or other indebtedness or financing arrangement requiring it to make payments. There are no material off-balance sheet transactions, arrangements, obligations (including contingent obligations), and other relationships of the Group with unconsolidated entities or other persons created during the reporting period. The Group has no unusual nature of transactions or events that affects assets, liabilities, equity, net income or cash flows. There were no seasonal aspects that had a material effect on the financial condition or results of operations of the Group. There were no known material events subsequent to the end of the period that have not been reflected in the Group’s Financial Statements as at the third quarter of 2020. There were no changes in estimates of amount reported in the current financial year or changes in estimates of amounts reported in prior financial years. There was no contingent liability reflected in the most recent annual financial statement, the same in the current year consolidated financial statements as at the third quarter of 2020. There are no commitments, guarantees and contingent liabilities that arise in the normal course of operations of the Group which are not reflected in the accompanying consolidated financial statements. There were no other material issuances, repurchases or repayments of debt and equity securities.

MEG Annual Report 2021 47
Results of Operations (Based on Financial Statements adopted in accordance with the Philippine Financial Reporting Standards) Review of December 31, 2019 versus December 31, 2018 Megaworld, the country’s largest developer of integrated urban townships, registered a net income of Php19.30 billion in 2019, up 21.87% compared to Php15.83 billion the previous year. Excluding non-recurring gains of Php691.03 million, net income grew 17.51% to a new record high of Php18.61 billion during the year. Net income attributable to parent company stood at Php17.93 billion in 2019 up 17.91% from Php15.21 billion the year before. Consolidated revenues grew at a robust pace of 17.21% to Php67.31 billion in 2019 from Php57.43 billion in 2018. The healthy growth was underpinned by the strong performances of all of its key businesses. Development. Among product portfolios, the bulk of consolidated revenues came from the sale of condominium units and residential lots, comprising 63.29% of total revenues. Real estate sales remained steady with a 12.01% increase, amounting to Php42.60 billion and Php38.04 billion for the years 2019 and 2018, respectively. The Group’s registered sales mostly came from the following projects: Maple Grove Commercial District, San Antonio Residence, Uptown Parksuites Tower 1 & 2, Gentry Manor, The Florence, One Pacific Residence, Bayshore Residential Resort 1&2, One Manchester Place, Uptown Ritz Residence, Greenbelt Hamilton Tower 2, Grand Westside Hotel, Eight Newtown Boulevard, Salcedo Sky Suites, One Eastwood Avenue Tower 2, Kingsford Hotel Bayshore, St. Moritz Private Estate, Eighty One Newport Boulevard and Manhattan Plaza Tower 1. Leasing. The company’s rental businesses, comprising of office and lifestyle mall leasing, strongly contributed to the topline, soaring 17.87% to Php16.81 billion in 2019 from the previous year’s Php14.26 billion. This contributed 24.98% of the total consolidated revenues during the year. Hotel Operations. The Group’s revenues attributable to hotel operations posted an amount of Php2.54 billion in 2019 with an increase of 67.42% from Php1.52 billion for the same period last year. Total costs and expenses amounted to Php48.02 billion, an increase by 15.90% from Php41.43 billion last year. Interest and other charges – net decreased by 1.05%, amounting to Php3.26 billion this year from Php3.30 billion in 2018. Tax expense in 2019 amounting to Php6.08 billion resulted to an increase of 9.69% from 2018 reported amount of Php5.54 billion due to higher taxable income. There were no seasonal aspects that had a material effect on the financial condition or financial performance of the Group. Neither were there any trends, events or uncertainties that have had or that are reasonably expected to have a material impact on net sales or revenues or income from continuing operations. The Group is not aware of events that will cause material change in the relationship between costs and revenues. There are no significant elements of income or loss that did not arise from the Group’s continuing operations. Financial Condition The Group maintains a prudent financial policy as it engages in a more competitive and challenging environment. The Group’s Statements of Financial Position reflects stable financial growth. Total resources as at December 31, 2019 amounted to Php349.63 billion, posting an increase of 8.48% compared to Php322.29 billion as at December 31, 2018.

MEG Annual Report 2021 48
The Group shows steady liquid position as at December 31, 2019 by having its current assets at Php190.51 billion as against its current obligations at Php57.54 billion. Current assets posted an increase of 8.77% from December 31, 2018 balance of Php175.15 billion. Current obligations reflected an increase of 21.39% from December 31, 2018 balance of Php47.40 billion. Cash and cash equivalents increased by 31.70% from Php17.54 billion in 2018 to Php23.10 billion in 2019. Current and non-current trade and other receivables – net increased by 28.34%, amounting to Php44.81 billion as at December 31, 2019 compared to Php34.91 billion as at December 31, 2018. Contract assets decreased by 16.13%, amounting to Php18.64 billion as at December 31, 2019 compared to Php22.23 billion as at December 31, 2018. Inventories increased by 2.17% from Php100.66 billion in 2018 to Php102.85 billion in 2019. This includes raw land for residential development and property development cost reclassified due to adoption PFRS 15 and PIC Q&As 2018-11, 2018-15 and 2018-12. Investment properties – net increased by 7.53% amounting to Php110.89 billion in December 31, 2019 from Php103.12 billion in December 31, 2018. This includes raw land and property development cost for office and commercial development reclassified due to adoption of PIC Q&As 2018-11, 2018-15 and 2018-12. Property and equipment – net amounted to Php6.70 billion, 8.63% higher from year-end 2018 balance of Php6.17 billion. Trade and other payables amounted to Php19.34 billion and Php15.03 billion as at December 31, 2019 and 2018, respectively, reflecting a 28.73% increase. Contract liabilities decreased by 2.89%, amounting to Php5.21 billion as at December 31, 2019 compared to Php5.37 billion as at December 31, 2018. Total current and non-current customers’ deposits as at December 31, 2019 amounted to Php13.80 billion compared Php11.81 billion as at December 31, 2018 with 16.86% increase. The interest-bearing loans and borrowings current and non-current amounted to Php51.26 and Php50.64 billion for December 31, 2019 and 2018, respectively, reflecting a 1.22% increase. Bonds payable decreased by 1.90%, amounting to Php24.62 billion as at December 31, 2019 compared to Php25.10 billion as at December 31, 2018. Total other liabilities amounted to Php14.62 billion from Php11.72 billion as at December 31, 2019 and 2018, respectively, translating to a 24.73% increase. Total Equity (including non-controlling interests) increased by 8.54% from Php188.74 billion as at December 31, 2018 to Php204.87 billion as at December 31, 2019 due to the Group’s continuous profitability. The top five (5) key performance indicators of the Group are shown below:
December 31, 2019 December 31, 2018
Current Ratio *1 3.31:1.00 3.69:1.00 Debt to Equity Ratio *2 0.37:1.00 0.40:1.00 Net debt to equity *3 0.26:1.00 0.31:1.00 December 31, 2019 December 31, 2018
Return on Assets *4 5.74% 5.22% Return on Equity *5 10.48% 9.97%
*1 – Current Assets / Current Liabilities *2 – Interest Bearing Loans and Borrowings and Bonds Payable / Equity *3 - Net Debt / Equity (Net debt is total debt less cash and cash equivalents) *4 – Net Profit / Average Total Assets *5 – Net Profit / Average Equity (Computed using figures attributable only to parent company shareholders)
With its strong financial position, the Group will continue investing in and pursuing expansion activities as it focuses on identifying new markets, maintaining established markets and tapping business opportunities.

MEG Annual Report 2021 49
Material Changes in the Year 2019 Financial Statements (Increase/decrease of 5% or more versus December 31, 2018) Statement of Financial Position 31.70% increase in cash and cash equivalents Mainly pertains to higher cash that is generated internally and net proceeds from debt issuance during the year 28.34% increase in trade and other receivables – net Primarily due to additional sales for the period 16.13% decrease in contract assets Represents excess of progress of work over the right to an amount of consideration 30.09% increase in advances to contractors and suppliers Represents advance payments to contractors and suppliers 75.85%increase in investment in associates - net Due to additional subscription made during the year 7.53% increase in investment properties – net Mainly includes completed properties for lease and raw land and property development cost for office and commercial development reclassified due to adoption of PIC Q&As 2018-11, 2018-15 and 2018-12 8.63% increase in property and equipment – net Represents additional costs incurred for hotel buildings 8.39% increase in deferred tax assets – net Due to higher deferred tax assets on taxable temporary differences 28.73% increase in trade and other payables Due to higher payables to suppliers and contractors 16.86% increase in customers’ deposits – current and non-current Pertains to amounts received from customers for sale of residential lots and condominium units not yet qualified for sales recognition 25.00% decrease in redeemable preferred shares – current and non-current Due to redemption of preferred shares 24.43%increase in income tax payable Mainly due to higher taxable income 19.86% increase in deferred tax liabilities – net Pertains to tax effects of taxable and deductible temporary differences 50.83% increase in retirement benefit obligation Additional accrual of retirement plan of employees 24.73% increase in other liabilities – current and non-current Mainly contributed by subscription payable to an associate, additional security deposits and advance rent from new tenants

MEG Annual Report 2021 50
8.54% increase in equity Due to the Group’s continuous profitability (Increase/decrease of 5% or more versus December 31, 2018) Statements of Income 12.01% increase in real estate sales Due to higher sales recognized for the period 17.87% increase in rental income Due to aggressive expansion of the Group’s leasing portfolio, escalation of rental rates and high demand for office space from BPO Companies 67.42% increase in hotel operations Due to increase in hotel occupancy rates and opening of new hotels 163.73% decrease in equity share in net earnings (losses) of associates Mainly due to losses incurred by associates 53.90% increase in interest and other income – net Primarily due to higher interest and other income recognized for the current period 13.93% increase in cost of real estate sales Due to increase in real estate sales 68.28% increase in cost of hotel operations Represents direct costs attributable to hotel operations 23.72% increase in operating expenses Due to increase in other administrative and corporate overhead expenses 9.69% increase in tax expense Due to higher taxable income and tax effects of deductible temporary differences There are no other significant changes in the Group’s financial position (5% or more) and condition that will warrant a more detailed discussion. Further, there are no material events and uncertainties known to management that would have impact or change the reported financial information and condition on the Group. There are no known trends or demands, commitments, events or uncertainties that will result in or that are reasonably likely to result in increasing or decreasing the Group’s liquidity in any material way. The Group does not anticipate having any cash flow or liquidity problems. The Group is not in default or breach of any note, loan, lease or other indebtedness or financing arrangement requiring it to make payments. There are no material off-balance sheet transactions, arrangements, obligations (including contingent obligations), and other relationships of the Group with unconsolidated entities or other persons created during the reporting period. The Group has no unusual nature of transactions or events that affects assets, liabilities, equity, net income or cash flows. There were no seasonal aspects that had a material effect on the financial condition or results of operations of the Group. There were no known material events subsequent to the end of the period that have not been reflected in the Group’s Financial Statements for the year 2019.

MEG Annual Report 2021 51
There were no changes in estimates of amount reported in the current financial year or changes in estimates of amounts reported in prior financial years. There was no contingent liability reflected in the most recent annual financial statement, the same in the current year consolidated financial statements as at 2019. There are no commitments, guarantees and contingent liabilities that arise in the normal course of operations of the Group which are not reflected in the accompanying consolidated financial statements. There were no other material issuances, repurchases or repayments of debt and equity securities. There were no seasonal aspects that had a material effect on the financial condition or results of operations of the Group. EXTERNAL AUDIT FEES AND SERVICES The external auditors of the Company and its subsidiaries billed the amounts of Php24,102,364 in 2021, Php19,613,109 in 2020, and Php18,844,740 in 2019 in fees for professional services rendered for the audit of the Company and its subsidiaries' annual financial statements and services that are normally provided by the external auditor in connection with statutory and regulatory filings or engagements for 2021, 2020 and 2019. Except as disclosed above, no other services were rendered or fees billed by the external auditors of the Company for the years 2021, 2020 and 2019. The Board of Directors, after consultation with the Audit Committee, recommends to the stockholders the engagement of the external auditors of the Company. The selection of external auditors is made on the basis of credibility, professional reputation, accreditation with the Philippine Securities and Exchange Commission, and affiliation with a reputable foreign partner. The professional fees of the external auditors of the Company are approved by the Company’s Audit Committee after approval by the stockholders of the engagement and prior to the commencement of each audit season. FINANCIAL STATEMENTS Financial Statements meeting the requirements of SRC Rule 68, as amended, are attached hereto as Exhibit 1 and incorporated herein by reference. CHANGES IN AND DISAGREEMENTS WITH ACCOUNTANTS ON ACCOUNTING AND FINANCIAL DISCLOSURE In compliance with SEC Memorandum Circular No. 8, Series of 2003, which was subsequently incorporated in SRC Rule 68, paragraph 3(b)(iv), and the Company’s Manual of Corporate Governance, which require that the Company’s external auditor be rotated or the handling partner changed every five (5) years or earlier, Mr. Renan A. Piamonte of Punongbayan and Araullo was designated as handling partner for the audit of the financial statements of the Company starting the year ending 31 December 2016. Punongbayan & Araullo was also the auditor of the Company for 2021, 2020 and 2019. There are no disagreements with the auditors on any matter of accounting principles or practices, financial statement disclosure, or auditing scope or procedure, which, if not resolved to their satisfaction, would have caused the auditors to make reference thereto in their reports on the financial statements of the Company and its subsidiaries.
PART III – CONTROL AND COMPENSATION INFORMATION BOARD OF DIRECTORS AND SENIOR MANAGEMENT The overall management and supervision of the Company is undertaken by the Board of Directors (“Board”). Currently, the Board consists of seven members, of which three are independent directors. All of the directors were elected at the Company’s annual stockholders meeting on 18 June 2021 and will hold office until their successors have been duly elected and qualified.

MEG Annual Report 2021 52
The table sets forth each member of the Company’s Board as of 31 March 2022. Name Age Citizenship Position Andrew L. Tan 72 Filipino Director, Chairman, President and CEO Katherine L. Tan 70 Filipino Director Kingson U. Sian 60 Filipino Director and Executive Director Enrique Santos L. Sy 72 Filipino Director Jesus B. Varela 65 Filipino Independent Director Cresencio P. Aquino 68 Filipino Independent Director Roberto S. Guevara 70 Filipino Independent Director The table below sets forth the Company’s executive officers in addition to its executive directors listed above as of 31 March 2022. Name Age Citizenship Position Lourdes T. Gutierrez-Alfonso 58 Filipino Chief Operating Officer Kevin Andrew L. Tan 42 Filipino Executive Vice President and Chief Strategy Officer Francisco C. Canuto 64 Filipino Senior Vice President, Chief Finance Officer, Treasurer, Compliance Officer, Corporate Information Officer and Chief Audit Executive Noli D. Hernandez 51 Filipino Executive Vice President for Sales and Marketing Giovanni C. Ng 47 Filipino Senior Vice President and Finance Director Maria Victoria M. Acosta 60 Filipino Senior Vice President for International Marketing and Leasing Maria Carla T. Uykim 45 Filipino Head of Corporate Advisory and Compliance Rafael Antonio S. Perez 53 Filipino Head of Human Resources and Corporate Admin. Graham M. Coates 57 British Head of Megaworld Lifestyle Malls Jennifer L. Romualdez 52 Filipino Head for Operations Division Kimberly Hazel A. Sta. Maria 41 Filipino Assistant Vice President for Corporate
Communications and Advertising Cheryll B. Sereno 42 Filipino Chief Risk Officer Anna Michelle T. Llovido 43 Filipino Corporate Secretary Nelileen S. Baxa 43 Filipino Assistant Corporate Secretary Andrew L. Tan Chairman of the Board/President Mr. Tan is the founder of the Company and has served as its Chairman and President since its incorporation in 1989. He pioneered the live-work-play-learn model in real estate development through the Company’s integrated township communities, fueling the growth of the business process outsourcing (BPO) industry. He embarked on the development of integrated tourism estates through publicly-listed Alliance Global Group, Inc. and Global-Estate Resorts, Inc., which he both chairs, while continuing to focus on consumer-friendly food and beverage and quick service restaurants. Mr. Tan serves as Chairman of the Board of Empire East Land Holdings, Inc., a publicly-listed subsidiary of the Company, and Suntrust Properties, Inc., a subsidiary engaged in the development and marketing of affordable housing projects. He also serves in the boards of other Megaworld subsidiaries including Eastwood Cyber One Corporation, Megaworld Land, Inc., Megaworld Central Properties Inc., Megaworld Bacolod Properties, Inc., Mactan Oceanview Properties and Holdings, Inc., Megaworld Newport Property Holdings, Inc. and Richmonde Hotel Group International Limited. He is also the Chairman of Emperador Inc., a public-listed company which owns Emperador Distillers, Inc., the leading brandy manufacturer and distributor in the Philippines. Mr. Tan is Chairman of Megaworld Foundation, the Company’s corporate social responsibility arm, which primarily focuses on the promotion of education through scholarship programs for financially handicapped but deserving students, and supports causes that promote poverty alleviation, people empowerment, social justice, good governance and environmental conservation. He is a director of Travellers International Hotel

MEG Annual Report 2021 53
Group, Inc., which owns Resorts World Manila, and the food and beverage companies, Emperador Distillers, Inc. Alliance Global Brands, Inc. and Golden Arches Development Corporation.
Katherine L. Tan Director Ms. Tan has served as Director of the Company since 1989. She is concurrently a Director and Treasurer of publicly-listed Alliance Global Group, Inc. and Emperador Inc. She has extensive experience in the food and beverage industry and is currently Director and Corporate Secretary of The Bar Beverage, Inc. and Director and President of Andresons Global, Inc., Raffles & Company, Inc., The Andresons Group, Inc. and Choice Gourmet Banquet, Inc. She is also a Director and Treasurer of Alliance Global Brands, Inc. and Emperador Distillers, Inc.
Kingson U. Sian Director and Executive Director Mr. Sian has served as Director of the Company since April 13, 2007. He joined the Megaworld Group in September 1995 as Senior Vice President and is currently Executive Director of the Company. He is concurrently Director, President and Chief Operating Officer of publicly-listed Alliance Global Group, Inc. and Travellers International Hotel Group, Inc. He is the Chairman and President of Prestige Hotels & Resorts, Inc. and Luxury Global Hotels and Leisure, Inc., the Senior Vice President of Megaworld Land, Inc. and the President of Eastwood Cyber One Corporation. Mr. Sian was formerly a Vice President of FPB Asia Ltd/First Pacific Bank in Hong Kong from 1990 to 1995. Prior to that, he was connected with Citicorp Real Estate, Inc. in the United States from 1988 to 1990. Mr. Sian graduated from the University of the Philippines with the degree of Bachelor of Science in Business Economics. He obtained his Master’s Degree in Business Administration for Finance and Business Policy from the University of Chicago.
Enrique Santos L. Sy Director
Mr. Sy has served as Director of the Company since July 2009. He was formerly a Vice President for the Corporate Communications & Advertising Division of the Company until his retirement in March 2011. He is concurrently a Director of publicly-listed Empire East Land Holdings, Inc. and a Director of Eastin Holdings, Inc. and First Oceanic Property Management Inc. He is also a Director and the Corporate Secretary of Asia Finest Cuisine, Inc. and Soho Café & Restaurant Group, Inc. and Corporate Secretary of Empire East Communities, Inc. Mr. Sy previously worked as Advertising Manager of Consolidated Distillers of the Far East, Inc., Creative Director of AdCentrum Advertising, Inc., Copy Chief of Admakers, Inc. and Peace Advertising Corporation, and Creative Associate of Adformatix, Inc. Mr. Sy graduated with honors from the Ateneo de Manila University with the degree of Bachelor of Arts in Communication Arts.
Jesus B. Varela Independent Director Mr. Varela has served as Director of the Company since June 2016. He concurrently serves as independent director in the boards of publicly-listed, Global-Estate Resorts, Inc. and Travellers International Hotel Group, Inc. He is also the Director General of International Chamber of Commerce Philippines and Board Regent of Unibersidad de Manila. He is the President of Foundation for Crime Prevention, Philippine Greek Business Council and Philippine Peru Business Council. He is also a Director and Chair of Governance & Investment Committee of Oil & Petroleum Holdings International Reserve, HK Ltg. (OPHIR, HK Ltd) and Honorary Chairman of Euro Exim Consultancy Limited. Mr. Varela has more than 20 years of experience in the fields of marketing, human resources, international labor affairs, agriculture, and commerce, among others. He has done executive work with the Department of Agriculture, National Food Authority Council, Philippine Genetics, Inc., National Irrigation Administration, Philippine Planters Products, National Agri- Business Corporation, Agriculture Anti-Smuggling Task Force, and Nautical Highway Board. He served as Labor Attaché to Kobe, Japan, to the Commonwealth of Northern Marianas Island, and to Athens. Mr. Varela obtained his bachelor’s degree in Economics from Ateneo De Manila University. He attended training courses in Labor Administration and Policy Formulation under the International Labor Organization/ARPLA program, the Corporate Planning Course at the Center for Research Communication, Foreign Exchange Training by Metro Bank and Forex Club of the Philippines, Systems Analysis by the

MEG Annual Report 2021 54
Presidential Management Staff, Asian Productivity Seminar and other in-house seminars conducted by the Department of Labor and the Development Academy of the Philippines. Cresencio P. Aquino Independent Director Atty. Aquino is currently the Managing Partner of The Law Firm of CP Aquino & Partners. He concurrently serves as independent director in the boards of publicly-listed, Global-Estate Resorts, Inc. and Empire East Land Holdings, Inc. He is a graduate of the San Sebastian College Manila with degrees in Bachelor of Arts and Bachelor of Laws. Atty. Aquino has extensive experience in both the public and private sectors as Director of Clark Development Corporation from 2012 to 2016., Independent Director of Suntrust Home Developers, Inc. from 2009 to 2012, Corporate Legal Counsel of MBF Card and One Card Corporation from June 1998 to May 2004, Special Assistant and Chief Legal Counsel of the Government Service Insurance System from September 1992 to June 1998, Director of the Meat Packaging Corporation of the Philippines from September 1992 to June 1998, Personnel and Administrative Manager, Corporate Secretary and Chief Legal Counsel of ComSavings Bank from September 1992 to June 1998, and Executive Director of the Department of Interior and Local Government (“DILG”) from 1988 to 1992, and concurrently Ex-Officio Commissioner of the DILG with the Housing and Land Use Regulatory Board also for the same period. Atty. Aquino was formerly an Associate Professor with the San Sebastian College. Atty. Aquino has been a member of the Integrated Bar of the Philippines since 1978 and is also a member of the Capitol Bar Association, Knights of Columbus, and the Lawyers League of the Philippines. Roberto S. Guevara Independent Director Mr. Guevara has been an Independent Director of the Company since June 20, 2001. He is Chairman of the Board of Directors of Seed Capital Ventures, Inc. He serves on the board of other companies, such as G & S Transport Corporation, a licensee of Avis Car Rentals, Guevent Industrial Development Corporation, and Investment and Capital Corporation of the Philippines, and as Independent Director of First Centro, Inc., Honeycomb Builder and Kalahi Realty, Inc. Mr. Guevara graduated from San Beda College in 1974, and received a graduate degree from the Asian Institute of Management and a post graduate course at the Institute for Management Development, in Lausanne, Switzerland.
Lourdes T. Gutierrez-Alfonso Chief Operating Officer Ms. Gutierrez joined the Company in 1990. She is the Company’s Chief Operating Officer and is a member of the Company’s Management Executive Committee. Ms. Gutierrez has extensive experience in real estate and a strong background in finance and marketing. A certified public accountant by profession, she previously held the position of Senior Executive Vice President for Finance and Administration in the Company. Ms. Gutierrez is Chairman of the property management company, First Oceanic Property Management, Inc. She serves as director in numerous affiliate companies including publicly-listed Global-Estate Resorts, Inc. and Suntrust Properties, Inc., Twin Lakes Corporation, Southwoods Mall, Inc., Mactan Oceanview Properties and Holdings, Inc., Megaworld Resort Estates, Inc., Megaworld Cebu Properties, Inc., Oceantown Properties, Inc., Megaworld Bacolod Properties, Inc., Eastwood Cyber One Corporation, Davao Park District Holdings, Inc., and Prestige Hotels & Resorts, Inc. She is currently the Chairman of Belmont Newport Luxury Hotels, Inc., Megaworld Global-Estate, Inc and, Savoy Hotel Manila, Inc. She is also a trustee and a Corporate Secretary of Megaworld Foundation, Inc. Kevin Andrew L. Tan Executive Vice President and Chief Strategy Officer Mr. Tan holds the rank of Executive Vice President and Chief Strategy Officer of the Company. He previously held the position of Senior Vice President for Commercial Division which markets and operates the Megaworld Lifestyle Malls including Eastwood Mall and The Clubhouse at Corinthian Hills in Quezon City, Venice Piazza at McKinley Hill and Burgos Circle at Forbestown Center, both in Fort Bonifacio, California Garden Square in Mandaluyong City, Newport Mall at Resorts World Manila in Pasay City, Lucky Chinatown Mall in Binondo, Manila and Uptown Mall in Bonifacio Global City. He is the Chief Executive Officer and Vice Chairman of public-listed company, Alliance Global Group, Inc. He is also concurrently a

MEG Annual Report 2021 55
Director of publicly-listed companies, Empire East Land Holdings, Inc., Emperador Inc. and Global-Estate Resorts, Inc. and of Eastwood Cyber One Corporation, Uptown Cinemas, Inc., Megaworld Central Properties Inc., Twin Lakes Corporation, Megaworld Land, Inc., Townsquare Development, Inc., Emperador Distillers, Inc., Alliance Global Brands, Inc., Anglo Watsons Glass, Inc., Yorkshire Holdings, Inc., The Bar Beverage, Inc., Emperador Brandy, Inc., and New Town Land Partners, Inc. He is also a trustee and an Executive Director of Megaworld Foundation, Inc. Mr. Tan obtained his bachelor’s degree in Business Administration major in Management from the University of Asia and the Pacific. Francisco C. Canuto Senior Vice President, Chief Finance Officer, Treasurer, Compliance Officer, Corporate Information Officer and Chief Audit Executive
Mr. Canuto joined the Company in 1995. He is a Certified Public Accountant and currently holds the rank of Senior Vice President and Treasurer of the Company and is Senior Assistant to the Chairman. He is a member of the Company’s Management Executive Committee. He holds a bachelor’s degree in Commerce major in Accounting and a Master’s Degree in Business Administration. He is concurrently Director of Megaworld Global-Estate, Inc. and Eastwood Property Holdings, Inc., Director and Corporate Secretary of Megaworld Central Properties, Inc. and Director and Treasurer of Megaworld Cebu Properties, Inc., Twin Lakes Corporation, Oceantown Properties, Inc., Megaworld Resort Estates, Inc., Megaworld Land, Inc., Megaworld-Daewoo Corporation, Eastwood Cyber One Corporation, and Prestige Hotels & Resorts, Inc. He serves as a Director and President of Arcovia Properties, Inc., Lucky Chinatown Cinemas, Inc., Festive Walk Cinemas, Inc., Southwoods Cinemas, Inc., McKinley Cinemas, Inc., Uptown Cinemas, Inc. and Gilmore Property Marketing Associates, Inc. He is also the President of Megaworld Foundation, Inc. Before joining the Company, he worked as Audit Manager of SGV & Company and Controller of Federal Express Corporation.
Noli D. Hernandez Executive Vice President for Sales and Marketing Mr. Hernandez joined the Company in February 1994 as a property consultant. He is currently an Executive Vice President for Sales and Marketing. Mr. Hernandez rose from the ranks in the Company, starting out as a property consultant then becoming Sales Manager, Assistant Vice President, Senior Assistant Vice President, Vice President and Senior Vice President for Marketing. Mr. Hernandez graduated from the University of the Philippines with a degree of Bachelor of Science in Political Science. He serves as Director and President of Megaworld Cebu Properties, Inc. and President of the Newtown School of Excellence in the Mactan Newtown development of the Company. Giovanni C. Ng Senior Vice President and Finance Director Mr. Ng, is a Senior Vice President and Finance Director of the Company. He serves as director in Eastwood Property Holdings, Inc., Oceantown Properties, Inc., Empire East Communities, Inc., Gilmore Property Marketing Associates, Inc., First Centro, Inc., Valle Verde Properties, Inc., Lucky Chinatown Cinemas, Inc., McKinley Cinemas, Inc., Uptown Cinemas, Inc., Mactan Oceanview Properties and Holdings, Inc. and New Town Land Partners, Inc. He also serves as Treasurer of publicly-listed Empire East Land Holdings, Inc., Adams Properties, Inc. and Townsquare Development, Inc. He is also a Director and Corporate Secretary of Megaworld Land, Inc. Previously, he worked as Analyst Associate in Keppel IVI Investments. Mr. Ng obtained his bachelor’s degree in Quantitative Economics from the University of Asia and the Pacific, graduating summa cum laude in 1995. Maria Victoria M. Acosta Senior Vice President for International Marketing Ms. Acosta is Senior Vice President for International Marketing. She joined the Company in September 1999. Prior to her appointment, she had 20 years of marketing experience in real estate and consumer products with other companies. Ms. Acosta was Executive Vice President and Chief Operating Officer of Empire East Land Holdings, Inc. from 1997 to 1998 and was Executive Director for Marketing from 1996 to 1997. Earlier, she also served as Senior Vice President and General Manager of Raffles & Co., Inc. She is

MEG Annual Report 2021 56
concurrently Director and Corporate Secretary of Eastwood Property Holdings, Inc. and Corporate Secretary of Gilmore Property Marketing Associates, Inc. Maria Carla T. Uykim Head of Corporate Advisory and Compliance Ms. Uykim is the head of the Corporate Advisory and Compliance of Megaworld Corporation and a member of the Management Executive Committee. She is primarily responsible for the special projects group which handles the negotiation and documentation of the Company’s various land acquisitions, joint venture agreements and other corporate transactions. She also heads the property registration group, which is in charge of the registration of the Company’s real estate projects, including the deeds of restriction, and issuance of the certificates of title for the individual units or lots and the intellectual property group, which handles the registration, protection and enforcement of the Company’s trademarks. She is concurrently the Corporate Secretary of San Vicente Coast, Inc., Northwin Properties, Inc. and Maple Grove Land, Inc. and a Director and Corporate Secretary of Luxury Global Malls, Inc. and Mactan Oceanview Properties and Holdings, Inc. She joined the Company in April 2007 as a Senior Manager of the Corporate Management Department and handled buyer’s concerns, including documentation of sales transactions, labor and human resources issues, and the registration and protection of intellectual property. Prior to joining the Company, Atty. Uykim was an Associate at Andres Marcelo Padernal Guerrero and Paras law offices from August 2005 to April 2007, where she specialized in labor and corporate law, and at ACCRA Law from February 2003 to January 2004, where she practiced immigration law. She also served as Chief of Staff of Congresswoman Remedios L. Petilla from July 2004 until June 2005. Atty. Uykim obtained her Juris Doctor Degree from the Ateneo De Manila School of Law and is a graduate of the double degree program of De La Salle University, with a Bachelor of Arts in Psychology and a Bachelor of Science in Marketing Management. Rafael Antonio S. Perez Head for HR and Corporate Admin. Division Mr. Perez joined the Company in June 2008 as head of the Human Resources Division. He is currently the Vice President for Human Resources & Corporate Administration Division. He is concurrently the President and Managing Director of Global One Integrated Business Services, Inc. and Luxury Global Malls, Inc. Mr. Perez graduated Cum Laude from the Philippine Normal University with the degree of Bachelor of Arts in Psychology. Graham M. Coates Head of Megaworld Lifestyle Malls Mr. Coates, is a British national, and has an extensive international management experience in numerous culturally diverse locations such as Asia (twenty years), Europe (eight years) and the United States (four years). He joined the company in January 2019. Throughout his career, he has demonstrated a record of sustained profitable growth, building world-class organizations and driving change for global, multinational and family-owned corporations and entrepreneurial companies worldwide. Mr. Coates is skilled in P&L, Operations, Merchandising, Marketing, Customer Development, Business Development and Logistics. He brings with him a wealth of experience that cuts through many retail formats and cross functions. He has the unique advantage of being familiar with all retail formats, together with a solid perspective of mall and landlord operations. Mr. Coates is the President of the Coates Charity Foundation, a non-profit organization set up several years ago to support Christian missionaries, students, fellow church members and others in need. He is the Vice President and board member of HAND Philippines, an offshoot of HAND International, a Christian humanitarian aid organization that uses its resources and efforts on helping the rehabilitation needs of the natural disaster-stricken areas in the Philippines, an example being Typhoon Yolanda victims. Jennifer L. Romualdez Senior Vice President and Head for Operations Division Ms. Romualdez, prior to her appointment to her current position in Megaworld in February 2020, served the Company for nine years, from 1995 to 2004, in various capacities in the areas of procurement, contracts,

MEG Annual Report 2021 57
interior design and special projects. She was previously the Senior Vice President of the Operations Division of Global Estate-Resorts, Inc. (GERI), Megaworld’s subsidiary and the country’s biggest developer of master-planned integrated lifestyle communities (ILCs) oriented toward tourism. She headed the development of GERI’s various projects and ILCs, including Boracay Newcoast in Boracay Island; Twin Lakes in Alfonso, Batangas, near Tagaytay; Southwoods City on the boundaries of Cavite and Laguna; Eastland Heights in Antipolo, Rizal; and Sta. Barbara Heights in Mandurriao, Iloilo. From 2006 to 2011, she served different companies in various roles—Corporate Director for Quantity Surveying and Tender of Ding Feng (Shanghai) Real Estate Development Co., Ltd.; Assistant Director for Marketing - Interior Design and Graphics of Ho Cheng (China) Co., Ltd.; and Consultant for the HCG Beijing Flagship Showroom project. Ms. Romualdez graduated from the University of the Philippines Diliman with a B.S. Architecture degree. She completed and passed the Philippine Licensure Examination for Architects in 1993. Kimberly Hazel A. Sta. Maria Assistant Vice President for Corporate Communications and Advertising Ms. Sta. Maria holds the rank of Assistant Vice President and heads the Corporate Communication and Advertising Division of the Company. She joined the Company in 2002 as Head Writer and is responsible for the creative conceptualization and production of advertising and marketing campaigns and materials for the Company’s projects. Ms. Sta. Maria is a cum laude graduate of the University of the Philippines Manila and holds a bachelor’s degree in Organizational Communication. Cheryll B. Sereno Chief Risk Officer Ms. Sereno is the Chief Risk Officer of the Company. She joined the Company in November 2017 and currently heads the Opportunity and Risk Management department. Her responsibilities include identification and assessment of business risks and ensuring that the Company continuously develop risk management strategies that are aligned with its corporate goals and objectives. Prior to joining the Company, Ms. Sereno worked in the field of external audit, finance and has extensive experience handling Enterprise Risk Management and Business Continuity Management for the real estate industry. She graduated from Ateneo de Naga University with the degree of Bachelor of Science in Accountancy. Ms. Sereno is a Certified Public Accountant and a Certified Business Continuity Professional. Anna Michelle T. Llovido Corporate Secretary Ms. Llovido is the Corporate Secretary of the Company and has held this position since August 2014. She concurrently serves as Senior Corporate Legal Counsel of Emperador Distillers, Inc. Ms. Llovido is an experienced in-house counsel with core practice in labor and intellectual property law. Prior to her employment in Emperador Distillers, Inc., Ms. Llovido was a Manager at Reeves & Associates International Corporation and was charged with the management of its Philippine representative office. She also served as Legal Counsel to Transnational Diversified Group, Inc. from May 2008 to September 2009 where she serviced the legal requirements of over 30 companies engaged in total logistics, ship management, air and travel services, and information and communications technology. She was an Associate Lawyer at Tantoco Villanueva De Guzman & Llamas law offices from April 2006 to April 2008. Ms. Llovido obtained her bachelor’s degrees in Laws in 2004 and Hotel and Restaurant Management in 1999 from the University of Santo Tomas. Nelileen S. Baxa Assistant Corporate Secretary Ms. Baxa is currently a Senior Accounting Manager of the Company. She is a Certified Public Accountant with over 18 years of experience in the fields of accounting and finance. Ms. Baxa concurrently serves as a Director of Bordeaux Properties, Inc., Langham Properties, Inc., Rowenta International, Inc., and Venetian Properties, Inc. Ms. Baxa obtained her Bachelor’s Degree in Accountancy from the University of Sto. Tomas.

MEG Annual Report 2021 58
Significant Employees While the Company values its workforce, the business of the Company is not highly dependent on the services of personnel outside of Senior Management. Family Relationships Chairman and President Andrew L. Tan is married to Director Katherine L. Tan. Their son, Kevin Andrew L. Tan, is presently a Executive Vice President and Chief Strategy Officer of the Company and is also a director and Corporate Secretary of Alliance Global Brands, Inc. and a director of publicly listed subsidiaries Empire East Land Holdings, Inc. and Global-Estate Resorts, Inc., and Director, Chief Executive Officer and Vice Chairman of parent company Alliance Global Group, Inc. Involvement in Certain Legal Proceedings The Company is not aware of the occurrence, as of the date hereof and during the past five (5) years preceding this date, of any of the following events which it believes to be material to the evaluation of the ability or integrity of any of its directors, nominees for election as director, or executive officers: 1. Any bankruptcy petition filed by or against any business of a director, nominee for election as director, or executive officer who was a general partner or executive officer either at the time of the bankruptcy or within two years prior to that time; 2. Any director, nominee for election as director, or executive officer being convicted by final judgment in a criminal proceeding, domestic or foreign, or being subject in his personal capacity to a pending criminal proceeding, domestic or foreign, excluding traffic violations and other minor offenses; 3. Any director, nominee for election as director, or executive officer being subject to any order, judgment, or decree, not subsequently reversed, suspended or vacated, of any court of competent jurisdiction, domestic or foreign, permanently or temporarily enjoining, barring, suspending or otherwise limiting his involvement in any type of business, securities, commodities or banking activities; and 4. Any director, nominee for election as director, or executive officer being found by a domestic or foreign court of competent jurisdiction (in a civil action), the Commission or comparable foreign body, or a domestic or foreign exchange or other organized trading market or self-regulatory organization, to have violated a securities or commodities law or regulation, and the judgment has not been reversed, suspended, or vacated. EXECUTIVE COMPENSATION Summary Compensation Table Aggregate compensation paid to Megaworld’s Chief Executive Officer and the four most highly compensated executive officers as a group for the last two fiscal years and the estimate for the ensuing year are as follows:
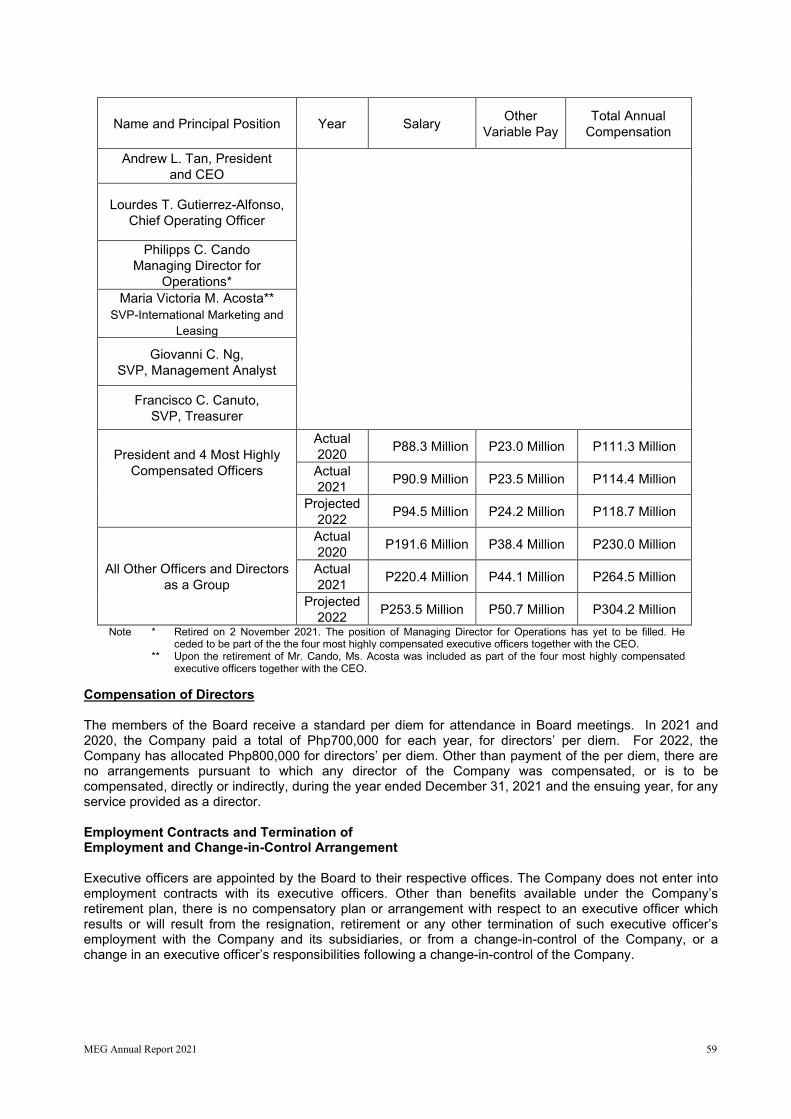
MEG Annual Report 2021 59
Note * Retired on 2 November 2021. The position of Managing Director for Operations has yet to be filled. He ceded to be part of the the four most highly compensated executive officers together with the CEO.
** Upon the retirement of Mr. Cando, Ms. Acosta was included as part of the four most highly compensated executive officers together with the CEO.
Compensation of Directors The members of the Board receive a standard per diem for attendance in Board meetings. In 2021 and 2020, the Company paid a total of Php700,000 for each year, for directors’ per diem. For 2022, the Company has allocated Php800,000 for directors’ per diem. Other than payment of the per diem, there are no arrangements pursuant to which any director of the Company was compensated, or is to be compensated, directly or indirectly, during the year ended December 31, 2021 and the ensuing year, for any service provided as a director. Employment Contracts and Termination of Employment and Change-in-Control Arrangement Executive officers are appointed by the Board to their respective offices. The Company does not enter into employment contracts with its executive officers. Other than benefits available under the Company’s retirement plan, there is no compensatory plan or arrangement with respect to an executive officer which results or will result from the resignation, retirement or any other termination of such executive officer’s employment with the Company and its subsidiaries, or from a change-in-control of the Company, or a change in an executive officer’s responsibilities following a change-in-control of the Company.
Name and Principal Position Year Salary Other Variable Pay
Total Annual Compensation
Andrew L. Tan, President and CEO
Lourdes T. Gutierrez-Alfonso, Chief Operating Officer
Philipps C. Cando Managing Director for
Operations* Maria Victoria M. Acosta**
SVP-International Marketing and Leasing
Giovanni C. Ng, SVP, Management Analyst
Francisco C. Canuto, SVP, Treasurer
President and 4 Most Highly Compensated Officers
Actual 2020 P88.3 Million P23.0 Million P111.3 Million
Actual 2021 P90.9 Million P23.5 Million P114.4 Million
Projected 2022 P94.5 Million P24.2 Million P118.7 Million
All Other Officers and Directors as a Group
Actual 2020 P191.6 Million P38.4 Million P230.0 Million
Actual 2021 P220.4 Million P44.1 Million P264.5 Million
Projected 2022 P253.5 Million P50.7 Million P304.2 Million

MEG Annual Report 2021 60
Outstanding Warrants and Options There are executive officers of the Company who were granted options to subscribe to common shares of the Company pursuant to the Company’s Employee Stock Option Plan approved by the Board and stockholders of the Company in 2012.
Name No. of Outstanding
Options
No. of Options Exercised
Date of Grant Exercise Price Market Price at Date of Grant
President and 4 Most Highly Compensated Officers
80,000,000 0 Various Dates Php1.773054* Php 2.54*
All Other Officers and Directors as a Group
20,000,000 0 Various Dates Php2.4173535* Php3.42*
*Average prices The Company’s Employee Stock Option Plan is intended to (i) enable qualified employee who are largely responsible for the further growth and development of the Company to participate in the growth of the Company; (ii) encourage the long-term commitment of such employees; and (iii) motivate such employees to continue their efforts in contributing to the long-term financial success of the Company. The Company has not adjusted the exercise price of the option since the last grant and issuance on 11 June 2014. Security Ownership of Record and Beneficial Owners of more than 5% of the Company’s Shares as of 31 December 2021
Title of Class
Name, address of Record Owner and Relationship with Issuer
Name of Beneficial Owner and Relationship with Record Owner
Citizenship No. of Shares Held
Percent of Class
Common Preferred
Alliance Global Group, Inc. (AGI)1 7/F 1880 Eastwood Avenue, Eastwood City, E. Rodriguez Jr. Avenue, Bagumbayan, Quezon City
Alliance Global Group, Inc.2
Filipino
14,390,844,058
6,000,000,000
38.01%
15.85%
Total
20,390,844,058 53.86%
Common PCD Nominee Corporation (Filipino), G/F MKSE Bldg., 6767 Ayala Ave., Makati
Participants of the PCD composed of custodian banks and brokers.
Non-Filipino
6,925,043,077 18.29%
1The Chairman of the Board of AGI, Mr. Andrew L. Tan, is also Chairman of the Board and President of the Company. 2 The Board of Directors of AGI has voting and investment power over AGI’s shares of stock in the Company. AGI normally authorizes its Chairman, or in his absence, the Chairman of the Meeting, to vote AGI’s shares of stock in the Company.

MEG Annual Report 2021 61
Common
New Town Land Partners, Inc. (NTLPI)1, 6/F The World Centre, Sen. Gil Puyat, Ave., Makati
New Town Land Partners, Inc.
Filipino 5,668,530,324 14.97%
Common PCD Nominee Corporation (Non-Filipino) G/F MKSE Bldg., 6767 Ayala Ave., Makati
Participants of the PCD composed of custodian banks and brokers.
Filipino 3,679,560,765 9.72%
Other than the persons identified above, there are no other beneficial owners of more than 5% of the Company’s outstanding capital stock that are known to the Company. Security Ownership of Management as of 31 December 2021
Title of Class Name of Beneficial Owner
Amount and Nature of Beneficial
Ownership*
Citizenship Percent of Class
Directors/Nominees Common Andrew L. Tan 1 Filipino .00000% 1,891,6322 Filipino .00499% 20,390,844,0583 Filipino 53.8627% 5,668,530,3244 Filipino 14.9735% Common Cresencio P. Aquino 1 Filipino .00000% Common Kingson U. Sian 1 Filipino .00000% 612,5005 Filipino .00161% Common Katherine L. Tan 1,891,632 Filipino .00499% 16 Filipino .00000% Common Jesus B. Varela 1 Filipino .00000% Common Roberto S. Guevara 1 Filipino .00000% Common Enrique Santos L. Sy 80,553 Filipino .00021% CEO and Four Most Highly Compensated Officers Common Andrew L. Tan Same as above Common Lourdes T. Gutierrez-
Alfonso 806,271 Filipino .00257%
167,9737 Common Francisco C. Canuto 369,054 Filipino .00097% Common Giovanni C. Ng 0 Filipino n/a Common Maria Victoria M. Acosta 0 Filipino n/a Other Executive Officers
1 The Board of Directors of NTLPI has voting and investment power over NTLPI’s shares of stock in the Company, NTLPI has authorized the Chairman of the Board of the Company, or in his absence the Chairman of the Meeting to vote NTLPI’s shares of stock in the Company. 2 Indirect ownership; shares beneficially owned by spouse Katherine L. Tan. 3 Indirect ownership; shares held by Alliance Global Group, Inc., which normally authorizes Andrew L. Tan, in his capacity as Chairman of the Company, or in his absence the Chairman of the meeting, to vote AGIs common shares in the Company. 4 Indirect ownership; shares held by NTLPI which normally authorizes Andrew L. Tan, in his capacity as Chairman of the Company, or in his absence the Chairman of the meeting, to vote NTLPIs common shares in the Company. 5 Shares are lodged with PCD Nominee Corporation. 6 Indirect ownership; shares beneficially owned by spouse Andrew L. Tan. 7 Shares are lodged with PCD Nominee Corporation.

MEG Annual Report 2021 62
Common Noli D. Hernandez 0 Filipino n/a Common Kevin Andrew L. Tan 367,205 Filipino .00096% Common Maria Carla T. Uykim 0 Filipino n/a Common Rafael Antonio S. Perez 0 Filipino n/a Common Graham M Coates 0 British n/a Common Jennifer L. Romualdez 0 Filipino n/a Common Kimberly Hazel A. Sta.
Maria 0 Filipino n/a
Common Cheryll B. Sereno 0 Filipino n/a Common Anna Michelle T. Llovido 0 Filipino n/a Common Nelileen S. Baxa 0 Filipino n/a Common All directors and
executive officers as a group
4,295,193 0.01134%
*all direct ownership unless otherwise specified Voting Trust Holders of 5% or More The Company is not aware of the existence of persons holding more than five percent (5%) of the Company’s common shares under a voting trust or similar agreement. Changes in Control There has been no change in the control of the Company since it was incorporated in 1989. CERTAIN RELATIONSHIPS AND RELATED TRANSACTIONS Please refer to the discussion under Transactions with and/or dependence on related parties on page 16.
The Group's policy on related party transactions is disclosed in Note 2.23, Page 38 of the Audited Financial Statements.
In Note 1, Pages 1 to 5 of the Audited Financial Statements, the interest of the Company on its subsidiaries and associates as well as other explanatory notes are disclosed. Moreover, Notes 27 to 27.8, Pages 85 to 89, cite the conditions, purpose and types of transactions (i.e., real estate sales and rendering services to related parties, sale and purchase of investment, advances provided to associates and other related parties, advances from associates and other related parties and other accounts). Further, in accordance with PAS 24.18, the Group disclosed the amount of the transactions with its related parties, including the amount of outstanding balances of the reporting dates. With regard to determination of transaction prices, these are determined based on the agreement of the parties involved and are usually based on prevailing market sales.
The Company has no transaction for the covered period with parties that fall outside the definition of “related parties” under PAS 24 but with whom the Company or its related parties has a relationship that enables the parties to negotiate terms of material transactions that may not be available from other, more clearly independent parties on an arm’s length basis.

MEG Annual Report 2021 63
PART V – EXHIBITS AND SCHEDULES EXHIBITS AND REPORTS ON SEC FORM 17-C Exhibits
Exhibit No. Description of Exhibit 1 Audited Consolidated Financial Statements as of December 31, 2021 and 2020 2 Sustainability Report for 2021
The Company filed the following reports on SEC Form 17-C during the last six-month period covered by this report.
Date Disclosures 14 July 2021 Share Buy Back Transaction 27 July 2021 Notice of Analyst’s Briefing for the First Half of 2021 04 August 2021 Press Release: “Megaworld Q2 Income Soars 39% To P2.6-B” 31 August 2021 Share Buy Back Transaction 02 September 2021
Press Release: “Megaworld Leased Out 415,000 Sqm. of Office Spaces Since the Start of Coronavirus Pandemic”
02 September 2021
Clarification on the News Article ““Billionaire Andrew Tan says Megaworld ready to proceed with casino project in Boracay”
13 September 2021
Press Release: "MREIT Aims to be 'Fastest Growing REIT’ Supported by a High-Quality Pipeline”
20 September 2021
Press Release: “Megaworld Earmarks P40-B to Develop 462-Hectare ‘Eco-Tourism Township in Palawan”
27 September 2021
Share Buy Back Transaction
06 October 2021 Press Release: “Megaworld to Build P98-B Global Business District in Bulacan”
25 October 2021 Press Release: “Megaworld’s Office Leases Up 12% During First 9 Months of 2021”
25 October 2021 Share Buy Back Transaction
02 November 2021 Retirement of Mr. Philipps C. Cando
02 November 2021 Notice of Analyt’s Briefing for MEG 9M 2021 Financial and Operting Results
08 and 09 November 2021
Share Buy Back Transaction
10 November 2021 Cash Dividend Declaration for 2021
10 November 2021 Press Release: “Megaworld Income Rebounds as Real Estate Sales Double in Q3”
16, 17, 18 and 19 November 2021
Share Buy Back Transaction
22 November 2021 Press Release: “Megaworld to Develop P6-B Shophouse, Commercial District Inside Northwin Global City”
22, 23, 24, 25, 26 and 29 November 2021
Share Buy Back Transaction
01 December 2021 Press Release: “Megaworld to Develop P5-B Shophouse and Boutique Hotel District in Paragua Coastown”

MEG Annual Report 2021 64
01, 02, 03, 07, 09, 13, 14 and 15 December 2021
Share Buy Back Transaction
15 December 2021 Material Information/Transaction
15 December 2021 Reinvestment Plan
16 December 2021 Disposition of Assets
16 and 17 December 2021
Share Buy Back Transaction

SIGNATURES
Pursuant to the requirements of Section 17 of the Securities Regulation Code and Section 141 of the Corporation Code, this report is signed on behalf of the issuer by the undersigned, thereunto duly authorized, in the City of Makati, on ____ _
MEGAWORLD CORPORATION
. By:
AN EWL. TAN
President (Principal Executive Officer)
-./, /, /�....,..,......LOURDES T. GUTIE
Chief Operatin fficer (Principal Operating Officer)
Company
FRAlfCI� Treasurer
(Principal Financial Officer)
rincipal Accounting Officer and Comptroller)
· 2 7 APR 2022
SUBSCRIBED AND SWORN to before me this __ day of ______ , affiants exhibiting to me their respective government issued identification cards, as follows:
NAMES
Andrew L. Tan
Francisco C. Canute
Identification Card Number
Passport Number P9281984A expiring until October 23, 2028
Driver's License Number N02-80-016791 Expiring until August 4, 2023
Lourdes T. Gutierrez-Alfonso Passport Number P5005287B
Lourdes O. Ramilo
Anna Michelle T. Llovido
Doc. No. 3. \.�; Page No.�: Book No. "'":l,,'-� Series of 2022.
MEG Annual Report 2021
expiring until March 1, 2030
UMID Number 0003-9283391-4
Driver's License Number N04-95-346720 Expiring until July 20, 2024
HW\'"MLINO A. RAMOSCO _ N NO M-239
NOTARYB Bl..l�FORMAKATICITY UNTILJU 30,2022PERB.M NO l795
11 KALAYAAN AVENUE OOENSION BARANGAY WESTREMBO, MAKAT! Cl1Y
SC Roll No.62179/04-26--2013 IBP NO. 17136S/Ol-03· 2022/PasiJ! City
PTR NO. MKT88S2502/01-03-2022/Makat:1 City MCLE Compliance No. Vl-0007878/4-06-2018
65
I


Punongbayan & Araullo (P&A) is the Philippine member firm of Grant Thornton International Ltd
Consolidated Financial Statements and Independent Auditors’ Report
Megaworld Corporation and Subsidiaries December 31, 2021, 2020 and 2019
FOR SEC FILING

Punongbayan & Araullo
20th Floor, Tower 1
The Enterprise Center
6766 Ayala Avenue
1200 Makati City
Philippines
T +63 2 8988 2288
a
Certified Public Accountants
Punongbayan & Araullo (P&A) is the Philippine member firm of Grant Thornton International Ltd.
Offices in Cavite, Cebu, Davao
BOA/ PRC Cert of Reg. No. 0002
SEC Accreditation No. 0002
grantthornton.com.ph
Report of Independent Auditors The Board of Directors and Stockholders Megaworld Corporation and Subsidiaries (A Subsidiary of Alliance Global Group, Inc.) 30th Floor, Alliance Global Tower 36th Street cor. 11th Avenue Uptown Bonifacio, Taguig City
Opinion
We have audited the consolidated financial statements of Megaworld Corporation and
Subsidiaries (the Group), which comprise the consolidated statements of financial position as at
December 31, 2021 and 2020, and the consolidated statements of income, consolidated
statements of comprehensive income, consolidated statements of changes in equity and
consolidated statements of cash flows for each of the three years in the period ended
December 31, 2021 and notes to the consolidated financial statements, including a summary of
significant accounting policies.
In our opinion, the accompanying consolidated financial statements present fairly, in all material
respects, the consolidated financial position of the Group as at December 31, 2021 and 2020,
and its consolidated financial performance and its consolidated cash flows for each of the
three years in the period ended December 31, 2021 in accordance with Philippine Financial
Reporting Standards (PFRS), as modified by the application of the financial reporting reliefs
issued and approved by the Securities and Exchange Commission (SEC) and described in
Note 2 to the consolidated financial statements.
Basis for Opinion
We conducted our audits in accordance with Philippine Standards on Auditing (PSA). Our
responsibilities under those standards are further described in the Auditors’ Responsibilities for
the Audit of the Consolidated Financial Statements section of our report. We are independent
of the Group in accordance with the Code of Ethics for Professional Accountants in the
Philippines (Code of Ethics) together with the ethical requirements that are relevant to our
audits of the consolidated financial statements in the Philippines, and we have fulfilled our other
ethical responsibilities in accordance with these requirements and the Code of Ethics. We
believe that the audit evidence we have obtained is sufficient and appropriate to provide a basis
for our opinion.

Certified Public Accountants
Punongbayan & Araullo (P&A) is the Philippine member firm of Grant Thornton International Ltd.
- 2 -
Emphasis of Matter We draw attention to Note 1 to the consolidated financial statements, which describes
management's assessment of the continuing impact on the Group's consolidated financial
statements of the business disruption brought by the COVID-19 pandemic.
We draw attention to Note 2 to the consolidated financial statements, which indicates that the
consolidated financial statements have been prepared in accordance with PFRS, as modified
by the financial reporting reliefs issued and approved by the SEC. The qualitative impact of the
financial reporting reliefs on the consolidated financial statements are disclosed in Note 2 to the
consolidated financial statements.
Our opinion is not modified in respect of these matters.
Key Audit Matters
Key audit matters are those matters that, in our professional judgment, were of most
significance in our audit of the consolidated financial statements of the current period. These
matters were addressed in the context of our audit of the consolidated financial statements as a
whole and in forming our opinion thereon, and we do not provide a separate opinion on these
matters.
(a) Revenue Recognition on Real Estate Sales and Determination of Related Costs
Description of the Matter
The Group’s revenue recognition process, policies and procedures on real estate sales are
significant to our audit because these involve the application of significant judgment and
estimation. In addition, real estate sales and costs of real estate sales amounted to P31.1
billion or 61.3% of consolidated Revenues and Income and P16.9 billion or 46.4% of
consolidated Cost and Expenses, respectively, for the year ended December 31, 2021. The
areas affected by revenue recognition, which requires significant judgments and estimates,
include determining when a contract will qualify for revenue recognition, measuring the
progress of the development of real estate projects which defines the amount of revenue to be
recognized and determining the amount of actual costs incurred as cost of real estate sales.
These areas were significant to our audit as an error in application of judgments and estimates
could cause a material misstatement in the consolidated financial statements.
The Group’s policy for revenue recognition on real estate sales are more fully described in
Note 2 to the consolidated financial statements. The significant judgments applied and
estimates used by management related to revenue recognition are more fully described in Note
3 to the consolidated financial statements. The breakdown of real estate sales and costs of
real estate sales are also disclosed in Notes 20 and 21, respectively, to the consolidated
financial statements.
How the Matter was Addressed in the Audit
We obtained an understanding of the revenue recognition policy regarding real estate sales
transactions and the related significant business processes of the Group.

Certified Public Accountants
Punongbayan & Araullo (P&A) is the Philippine member firm of Grant Thornton International Ltd.
- 3 -
Our procedures in testing the appropriateness and proper application of the Group’s revenue
recognition policy and process include test of design and operating effectiveness of relevant
controls over revenue generation and recognition, as well as tests of information technology
general controls (ITGC). We also performed tests of mathematical accuracy and completeness
of supporting contract summary, examination of supporting documents of a sample of
agreements, and performed overall analytical review of actual results.
In addressing the risks of material misstatements in revenue recognition, we have performed
inspection of sample agreements for compliance with a set of criteria for revenue recognition
and test of controls over contract approval. We have also tested the reasonableness of
management’s judgment in determining the probability of collection of the consideration in a
contract which involves a historical analysis of customer payment pattern and behavior.
Relative to the Group’s measurement of progress towards complete satisfaction of performance
obligation using the input method, we have tested the progress reported for the year in
reference to the actual costs incurred relative to the total budgeted project development costs.
Our procedures include test of controls over recognition and allocation of costs per project and
direct examination of supporting documents. We have also performed physical inspection of
selected projects under development to assess if the completion based on costs is not
inconsistent with the physical completion of the project. In testing the reasonableness of
budgetary estimates, we have ascertained the qualification of projects engineers who prepared
the budgets and reviewed the actual performance of completed projects with reference of their
budgeted costs.
In relation to cost of real estate sales, we obtained an understanding of the Group’s cost
accumulation process and performed tests of the relevant controls, including IT application
controls. On a sampling basis, we traced costs accumulated to supporting documents such as
invoices and accomplishment reports from the contractors and official receipts.
(b) Consolidation Process
Description of the Matter
The Group’s consolidated financial statements comprise the financial statements of Megaworld
Corporation and its subsidiaries, as enumerated in Note 1 to the consolidated financial
statements, after the elimination of material intercompany transactions. The Group’s
consolidation process is significant to our audit because of the complexity of the process. It
involves identifying and eliminating voluminous intercompany transactions to properly reflect
realization of profits and measurement of controlling and non-controlling interests.
The Group’s policy on consolidation process is more fully described in Note 2 to the
consolidated financial statements.
How the Matter was Addressed in the Audit
We obtained understanding of the Group structure and its consolidation process including the
procedures for identifying intercompany transactions and reconciling intercompany balances.
We tested significant consolidation adjustments which include elimination of intercompany
revenues, expenses, receivables, payables and investments, reversal of unrealized fair value
adjustments on intercompany investments, and recognition of equity transactions to measure
non-controlling interest.

Certified Public Accountants
Punongbayan & Araullo (P&A) is the Philippine member firm of Grant Thornton International Ltd.
- 4 -
Other Information
Management is responsible for the other information. The other information comprises the
information included in the Group’s SEC Form 20-IS (Definitive Information Statement), SEC
Form 17-A and Annual Report for the year ended December 31, 2021, but does not include the
consolidated financial statements and our auditors’ report thereon. The SEC Form 20-IS, SEC
Form 17-A and Annual Report for the year ended December 31, 2021 are expected to be made
available to us after the date of this auditors’ report.
Our opinion on the consolidated financial statements does not cover the other information and
we will not express any form of assurance conclusion thereon.
In connection with our audits of the consolidated financial statements, our responsibility is to
read the other information identified above when it becomes available and, in doing so,
consider whether the other information is materially inconsistent with the consolidated financial
statements or our knowledge obtained in the audits, or otherwise appears to be materially
misstated.
Responsibilities of Management and Those Charged with Governance for the Consolidated Financial Statements
Management is responsible for the preparation and fair presentation of the consolidated
financial statements in accordance with PFRS, and for such internal control as management
determines is necessary to enable the preparation of consolidated financial statements that are
free from material misstatement, whether due to fraud or error.
In preparing the consolidated financial statements, management is responsible for assessing
the Group’s ability to continue as a going concern, disclosing, as applicable, matters related to
going concern and using the going concern basis of accounting unless management either
intends to liquidate the Group or to cease operations, or has no realistic alternative but to do
so.
Those charged with governance are responsible for overseeing the Group’s financial reporting
process.
Auditors’ Responsibilities for the Audit of the Consolidated Financial Statements
Our objectives are to obtain reasonable assurance about whether the consolidated financial
statements as a whole are free from material misstatement, whether due to fraud or error, and
to issue an auditors’ report that includes our opinion. Reasonable assurance is a high level of
assurance, but is not a guarantee that an audit conducted in accordance with PSA will always
detect a material misstatement when it exists. Misstatements can arise from fraud or error and
are considered material if, individually or in the aggregate, they could reasonably be expected
to influence the economic decisions of users taken on the basis of these consolidated financial
statements.

Certified Public Accountants
Punongbayan & Araullo (P&A) is the Philippine member firm of Grant Thornton International Ltd.
- 5 -
As part of an audit in accordance with PSA, we exercise professional judgment and maintain
professional skepticism throughout the audit. We also:
• Identify and assess the risks of material misstatement of the consolidated financial
statements, whether due to fraud or error, design and perform audit procedures responsive
to those risks, and obtain audit evidence that is sufficient and appropriate to provide a
basis for our opinion. The risk of not detecting a material misstatement resulting from fraud
is higher than for one resulting from error, as fraud may involve collusion, forgery,
intentional omissions, misrepresentations, or the override of internal control.
• Obtain an understanding of internal control relevant to the audit in order to design audit
procedures that are appropriate in the circumstances, but not for the purpose of expressing
an opinion on the effectiveness of the Group’s internal control.
• Evaluate the appropriateness of accounting policies used and the reasonableness of
accounting estimates and related disclosures made by management.
• Conclude on the appropriateness of management’s use of the going concern basis of
accounting and, based on the audit evidence obtained, whether a material uncertainty
exists related to events or conditions that may cast significant doubt on the Group’s ability
to continue as a going concern. If we conclude that a material uncertainty exists, we are
required to draw attention in our auditors’ report to the related disclosures in the
consolidated financial statements or, if such disclosures are inadequate, to modify our
opinion. Our conclusions are based on the audit evidence obtained up to the date of our
auditors’ report. However, future events or conditions may cause the Group to cease to
continue as a going concern.
• Evaluate the overall presentation, structure and content of the consolidated financial
statements, including the disclosures, and whether the consolidated financial statements
represent the underlying transactions and events in a manner that achieves fair
presentation.
• Obtain sufficient appropriate audit evidence regarding the financial information of the
entities or business activities within the Group to express an opinion on the consolidated
financial statements. We are responsible for the direction, supervision and performance of
the group audit. We remain solely responsible for our audit opinion.
We communicate with those charged with governance regarding, among other matters, the
planned scope and timing of the audit and significant audit findings, including any significant
deficiencies in internal control that we identify during our audit.
We also provide those charged with governance with a statement that we have complied with
relevant ethical requirements regarding independence, and communicate with them all
relationships and other matters that may reasonably be thought to bear on our independence
and, where applicable, related safeguards.

Certified Public Accountants
Punongbayan & Araullo (P&A) is the Philippine member firm of Grant Thornton International Ltd.
- 6 -
From the matters communicated with those charged with governance, we determine those
matters that were of most significance in the audit of the consolidated financial statements of
the current period and are therefore the key audit matters. We describe these matters in our
auditors’ report unless law or regulation precludes public disclosure about the matter or when,
in extremely rare circumstances, we determine that a matter should not be communicated in
our report because the adverse consequences of doing so would reasonably be expected to
outweigh the public interest benefits of such communication.
The engagement partner on the audits resulting in this independent auditors’ report is Renan A.
Piamonte.
PUNONGBAYAN & ARAULLO
By: Renan A. Piamonte Partner CPA Reg. No. 0107805 TIN 221-843-037 PTR No. 8852342, January 3, 2022, Makati City SEC Group A Accreditation Partner - No. 107805-SEC (until Dec. 31, 2023) Firm - No. 0002 (until Dec. 31, 2024) BIR AN 08-002511-037-2019 (until Sept. 4, 2022) Firm’s BOA/PRC Cert. of Reg. No. 0002 (until Aug. 27, 2024)
February 28, 2022

Notes 2021 2020
A S S E T S
CURRENT ASSETS
Cash and cash equivalents 5 43,794,605,919 P 40,166,755,908 P
Trade and other receivables - net 6 34,482,656,507 31,576,137,172
Contract assets 20 11,970,852,843 13,265,242,603
Inventories 7 115,741,508,821 106,134,963,211
Advances to contractors and suppliers 2 12,233,167,915 11,659,294,719
Prepayments and other current assets 8 9,611,978,356 7,871,213,242
Total Current Assets 227,834,770,361 210,673,606,855
NON-CURRENT ASSETS
Trade and other receivables - net 6 12,489,998,575 12,261,216,378
Contract assets 20 7,951,394,519 6,115,483,710
Advances to contractors and suppliers 2 2,783,551,177 3,871,630,205
Advances to landowners and joint operators 10 7,158,576,223 7,513,380,172
Financial assets at fair value through
other comprehensive income 9 5,760,368,447 4,174,886,430
Investments in associates - net 11 3,287,474,516 3,443,096,702
Investment properties - net 12 119,222,248,947 114,982,489,429
Property and equipment - net 13 6,530,887,796 6,719,600,005
Deferred tax assets 26 377,447,575 339,876,737
Other non-current assets - net 14 4,580,532,972 5,595,153,322
Total Non-current Assets 170,142,480,747 165,016,813,090
TOTAL ASSETS 397,977,251,108 P 375,690,419,945 P
(Amounts in Philippine Pesos)
MEGAWORLD CORPORATION AND SUBSIDIARIES
(A Subsidiary of Alliance Global Group, Inc.)
CONSOLIDATED STATEMENTS OF FINANCIAL POSITION
DECEMBER 31, 2021 AND 2020

Notes 2021 2020
LIABILITIES AND EQUITY
CURRENT LIABILITIES
Interest-bearing loans and borrowings 15 12,685,534,491 P 21,037,756,478 P
Trade and other payables 17 22,875,967,140 23,331,957,972
Contract liabilities 20 2,447,089,883 2,647,780,045
Customers’ deposits 2 10,872,699,457 11,719,861,211
Redeemable preferred shares 18 251,597,580 251,597,580
Advances from associates and
other related parties 27 3,243,336,539 2,683,950,114
Income tax payable 55,404,855 170,556,697
Other current liabilities 19 9,476,396,474 10,876,689,502
Total Current Liabilities 61,908,026,419 72,720,149,599
NON-CURRENT LIABILITIES
Interest-bearing loans and borrowings 15 38,964,170,107 24,540,409,939
Bonds and notes payable 16 41,982,042,246 40,282,855,986
Contract liabilities 20 4,956,605,925 3,195,849,258
Customers’ deposits 2 1,281,160,572 2,968,470,263
Deferred tax liabilities - net 26 11,541,788,887 11,563,425,960
Retirement benefit obligation 25 546,802,701 819,755,696
Redeemable preferred shares 18 - 251,597,580
Other non-current liabilities 19 7,092,663,304 6,817,425,467
Total Non-current Liabilities 106,365,233,742 90,439,790,149
Total Liabilities 168,273,260,161 163,159,939,748
EQUITY 28
Total equity attributable to
the Company’s shareholders 198,838,867,474 185,464,231,260
Non-controlling interests 30,865,123,473 27,066,248,937
Total Equity 229,703,990,947 212,530,480,197
TOTAL LIABILITIES AND EQUITY 397,977,251,108 P 375,690,419,945 P
See Notes to Consolidated Financial Statements.
- 2 -

Notes 2021 2020 2019
REVENUES AND INCOME
Real estate sales 20 31,129,417,724 P 24,858,537,303 P 42,603,984,572 P
Rental income 12 13,319,580,244 12,932,770,278 16,814,091,846
Hotel operations 20 1,928,863,081 1,482,160,976 2,543,769,508
Interest and other income - net 23 4,376,429,682 4,267,409,295 5,409,726,260
50,754,290,731 43,540,877,852 67,371,572,186
COSTS AND EXPENSES
Cost of real estate sales 21 16,874,283,279 13,790,525,832 23,379,819,000
Cost of hotel operations 21 1,086,978,559 963,104,532 1,381,156,765
Operating expenses 22 12,864,632,841 11,850,258,972 13,912,479,751
Equity share in net losses of associates 11 176,548,383 69,879,672 58,832,233
Interest and other charges - net 24 4,808,537,325 2,930,637,292 3,261,597,997
Tax expense 26 564,917,329 3,347,906,258 6,081,657,290
36,375,897,716 32,952,312,558 48,075,543,036
NET PROFIT FOR THE YEAR 14,378,393,015 P 10,588,565,294 P 19,296,029,150 P
Net profit attributable to:
Company’s shareholders 13,434,466,763 P 9,885,989,490 P 17,931,417,072 P
Non-controlling interests 943,926,252 702,575,804 1,364,612,078
14,378,393,015 P 10,588,565,294 P 19,296,029,150 P
Earnings Per Share: 29
Basic 0.422 P 0.295 P 0.546 P
Diluted 0.421 P 0.294 P 0.543 P
See Notes to Consolidated Financial Statements.
MEGAWORLD CORPORATION AND SUBSIDIARIES
(A Subsidiary of Alliance Global Group, Inc.)CONSOLIDATED STATEMENTS OF INCOME
FOR THE YEARS ENDED DECEMBER 31, 2021, 2020 AND 2019
(Amounts in Philippine Pesos)

Notes 2021 2020 2019
NET PROFIT FOR THE YEAR 14,378,393,015 P 10,588,565,294 P 19,296,029,150 P
OTHER COMPREHENSIVE INCOME (LOSS)
Items that will not be reclassified
subsequently to consolidated profit or loss:
Fair value gains (losses) on financial assets
at fair value through other comprehesive income 9 1,347,392,142 323,225,082 )( 23,271,788
Actuarial gains (losses) on retirement
benefit obligation 25 325,125,100 354,133,354 350,479,591 )(
Share in other comprehensive income (loss)
of associates 11 - 1,474,538 11,417,059 )(
Tax income (expense) 25, 26 62,880,238 )( 106,240,006 )( 105,143,877
1,609,637,004 73,857,196 )( 233,480,985 )(
Items that will be reclassified
subsequently to consolidated profit or loss:
Unrealized gains (losses) on cash flow hedge 30 199,713,502 144,749,961 )( 293,369,328 )(
Exchange difference on translating
foreign operations 2 47,027,439 14,884,569 )( 3,326,261 )(
Share in other comprehensive income (loss)
of associates 11 20,926,197 - -
Tax income (expense) 26 11,756,858 )( 4,465,371 934,833
255,910,280 155,169,159 )( 295,760,756 )(
Total Other Comprehensive Income (Loss) 1,865,547,284 229,026,355 )( 529,241,741 )(
TOTAL COMPREHENSIVE INCOME
FOR THE YEAR 16,243,940,299 P 10,359,538,939 P 18,766,787,409 P
Total comprehensive income attributable to:
Company’s shareholders 15,276,423,950 9,684,718,799 P 17,422,846,318 P
Non-controlling interests 967,516,349 674,820,140 1,343,941,091
16,243,940,299 P 10,359,538,939 P 18,766,787,409 P
See Notes to Consolidated Financial Statements.
MEGAWORLD CORPORATION AND SUBSIDIARIES
(A Subsidiary of Alliance Global Group, Inc.)CONSOLIDATED STATEMENTS OF COMPREHENSIVE INCOME
FOR THE YEARS ENDED DECEMBER 31, 2021, 2020 AND 2019
(Amounts in Philippine Pesos)

Additional Treasury Shares - Revaluation Perpetual Non-controlling
Capital Stock Paid-in Capital At Cost Reserves Securities Retained Earnings Interests
(See Note 28) (See Note 28) (See Note 28) (See Notes 9, 11 and 25) (See Note 28) (See Note 28) Total (See Note 2) Total Equity
Balance at January 1, 2021 32,430,865,872 P 16,660,844,347 P 1,627,041,094 )( P 3,702,510,630 )( P 10,237,898,577 P 131,464,174,188 P 185,464,231,260 P 27,066,248,937 P 212,530,480,197 P
Changes in percentage of ownership - - - 9,488,420,708 - - 9,488,420,708 3,227,048,107 12,715,468,815
Redemption of perpetual securities - - - - 10,237,898,577 )( 484,257,436 9,753,641,141 )( - 9,753,641,141 )(
Cash dividends - - - - - 1,337,820,837 )( 1,337,820,837 )( 263,692,340 )( 1,601,513,177 )(
Acquisition of treasury shares - - 156,987,360 )( - - - 156,987,360 )( - 156,987,360 )(
Distribution to holders of perpetual securities - - - - - 151,963,438 )( 151,963,438 )( - 151,963,438 )(
Reduction in capital of a subsidiary - - - - - - - 141,998,580 )( 141,998,580 )(
Share-based employee compensation - - - - - 10,204,332 10,204,332 - 10,204,332
Acquisition of a new subsidiary with
non-controlling interest - - - - - - - 10,001,000 10,001,000
Total comprehensive income for the year - - - 1,841,957,187 - 13,434,466,763 15,276,423,950 967,516,349 16,243,940,299
Balance at December 31, 2021 32,430,865,872 P 16,660,844,347 P 1,784,028,454 )( P 7,627,867,265 P - 143,903,318,444 P 198,838,867,474 P 30,865,123,473 P 229,703,990,947 P
Balance at January 1, 2020 32,430,865,872 P 16,658,941,725 P 633,270,575 )( P 3,501,239,939 )( P 10,237,898,577 P 123,270,889,661 P 178,464,085,321 P 26,401,437,184 P 204,865,522,505 P
Cash dividends - - - - - 1,177,796,572 )( 1,177,796,572 )( 10,008,387 )( 1,187,804,959 )(
Acquisition of treasury shares - - 994,672,630 )( - - - 994,672,630 )( - 994,672,630 )(
Distribution to holders of perpetual securities - - - - - 535,258,625 )( 535,258,625 )( - 535,258,625 )(
Share-based employee compensation - - - - - 21,381,914 21,381,914 - 21,381,914
Exercise of stock options - 1,902,622 902,111 - - 1,031,680 )( 1,773,053 - 1,773,053
Total comprehensive income for the year - - - 201,270,691 )( - 9,885,989,490 9,684,718,799 674,820,140 10,359,538,939
Balance at December 31, 2020 32,430,865,872 P 16,660,844,347 P 1,627,041,094 )( P 3,702,510,630 )( P 10,237,898,577 P 131,464,174,188 P 185,464,231,260 P 27,066,248,937 P 212,530,480,197 P
MEGAWORLD CORPORATION AND SUBSIDIARIES
(A Subsidiary of Alliance Global Group, Inc.)
CONSOLIDATED STATEMENTS OF CHANGES IN EQUITY
FOR THE YEARS ENDED DECEMBER 31, 2021, 2020 AND 2019
(Amounts in Philippine Pesos)
Attributable to the Company’s Shareholders

Additional Treasury Shares - Revaluation Perpetual Non-controlling
Capital Stock Paid-in Capital At Cost Reserves Securities Retained Earnings Interests
(See Note 28) (See Note 28) (See Note 28) (See Notes 9, 11 and 25) (See Note 28) (See Note 28) Total (See Note 2) Total Equity
Balance at January 1, 2019 32,430,865,872 P 16,657,990,413 P 633,721,630 )( P 3,085,712,274 )( P 10,237,898,577 P 108,252,842,723 P 163,860,163,681 P 24,892,898,397 P 188,753,062,078 P
Cash dividends - - - - - 2,379,182,809 )( 2,379,182,809 )( 68,013,915 )( 2,447,196,724 )(
Distribution to holders of perpetual securities - - - - - 562,913,000 )( 562,913,000 )( - 562,913,000 )(
Share-based employee compensation - - - - - 17,824,456 17,824,456 892,953 18,717,409
Exercise of stock options - 951,312 451,055 - - 515,840 )( 886,527 - 886,527
Recycling due to disposal and dilution - - - - - 11,417,059 11,417,059 - 11,417,059
Other reserves arising from consolidation - - - 93,043,089 - - 93,043,089 - 93,043,089
Total comprehensive income for the year - - - 508,570,754 )( - 17,931,417,072 17,422,846,318 1,343,941,091 18,766,787,409
Balance at December 31, 2019 32,430,865,872 P 16,658,941,725 P 633,270,575 )( P 3,501,239,939 )( P 10,237,898,577 P 123,270,889,661 P 178,464,085,321 P 26,169,718,526 P 204,633,803,847 P
- 2 -
Attributable to the Company’s Shareholders
See Notes to Consolidated Financial Statements.

Notes 2021 2020 2019
CASH FLOWS FROM OPERATING ACTIVITIES
Profit before tax 14,943,310,344 P 13,936,471,552 P 25,377,686,440 P
Adjustments for:
Depreciation and amortization 12, 13, 14 3,467,925,032 3,104,661,233 2,718,633,789
Interest expense 24 1,941,630,481 1,641,304,190 1,512,905,580
Unrealized foreign currency losses (gains) - net 1,625,333,145 1,086,060,295 )( 493,907,863 )(
Interest income 23 1,566,929,419 )( 1,445,447,319 )( 1,631,604,213 )(
Equity share in net losses (earnings) of associates 11 176,548,383 69,879,672 58,832,233
Gain on sale of investment property 12 136,206,674 )( - 45,781,949 )(
Loss on derecognition of property and equipment 13 43,603,084 - -
Dividend income 23, 27 24,456,757 )( 8,193,611 )( 8,464,814 )(
Employee share options 25 10,204,332 21,381,914 18,717,409
Loss (gain) on sale of property and equipment 13 1,225,627 )( 592,954 )( 279,902
Gain on finance lease 6 - - 350,218,385 )(
Gain on sale and dilution of investment in an associate 23 - - 340,809,382 )(
Operating profit before working capital changes 20,479,736,324 16,233,404,382 26,816,268,747
Decrease (increase) in trade and other receivables 1,835,285,029 )( 3,064,093,048 7,300,973,342 )(
Decrease (increase) in contract assets 541,521,049 )( 737,721,626 )( 3,584,275,000
Increase in inventories 8,951,566,293 )( 2,510,261,657 )( 1,395,055,726 )(
Increase in advances to contractors and suppliers 514,205,832 217,097,481 )( 3,542,558,329 )(
Decrease (increase) in prepayments and other current assets 1,740,765,114 )( 699,913,970 244,367,564 )(
Decrease (increase) in advances to landowners
and joint operators 354,803,949 454,495,711 )( 148,706,559 )(
Increase in other non-current assets 146,217,428 )( 887,291,362 )( 202,306,675 )(
Increase in trade and other payables 606,265,488 2,510,777,198 5,373,481,027
Increase (decrease) in contract liabilities 1,560,066,505 630,074,260 155,112,252 )(
Increase (decrease) in customers’ deposits 2,534,471,445 )( 888,463,236 1,990,581,863
Increase (decrease) in other liabilities 1,327,724,229 )( 2,766,117,805 2,051,184,398
Cash generated from operations 6,437,527,511 21,985,976,062 26,826,710,588
Cash paid for income taxes 813,914,179 )( 2,886,445,031 )( 3,647,117,078 )(
Net Cash From Operating Activities 5,623,613,332 19,099,531,031 23,179,593,510
CASH FLOWS FROM INVESTING ACTIVITIES
Additions to:
Investment properties 12 7,055,426,460 )( 6,731,614,968 )( 10,390,591,440 )(
Property and equipment 13 519,098,962 )( 430,709,071 )( 350,116,842 )(
Interest received 2,052,061,538 1,039,449,706 1,296,340,364
Acquisition and subscription of shares of stock of
subsidiaries and associates 1,001,843,366 )( - 1,350,050,000 )(
Advances to associates and other related parties: 27
Granted 413,989,152 )( 260,769,847 )( 1,500,167,429 )(
Collected 89,575,462 35,608,643 129,918,481
Additions to financial assets at fair value through
other comprehensive income 9 238,089,875 )( - -
Proceeds from sale of investment property 12 136,607,144 - 23,562,500
Dividends received 24,456,757 8,193,611 8,464,814
Proceeds from sale of property and equipment 13 4,739,942 6,385,095 1,245,112
Proceeds from sale of investments in an associate
and subsidiaries 11 - - 1,017,844,908
Net Cash Used in Investing Activities 6,921,006,972 )( 6,333,456,831 )( 11,113,549,532 )(
Balance carried forward 1,297,393,640 )( P 12,766,074,200 P 12,066,043,978 P
MEGAWORLD CORPORATION AND SUBSIDIARIES(A Subsidiary of Alliance Global Group, Inc.)
CONSOLIDATED STATEMENTS OF CASH FLOWSFOR THE YEARS ENDED DECEMBER 31, 2021, 2020 AND 2019
(Amounts in Philippine Pesos)

Notes 2021 2020 2019
Balance brought forward 1,297,393,640 )( P 12,766,074,200 P 12,066,043,978 P
CASH FLOWS FROM FINANCING ACTIVITIES
Proceeds from availments of long and short-term liabilities 15, 36 26,643,083,897 7,800,000,000 12,500,000,000
Repayments of long and short-term liabilities 36 20,982,065,248 )( 13,107,450,229 )( 11,537,252,522 )(
Proceeds from secondary offering of subsidiary's shares 28 14,717,312,432 - -
Payments for redemption of perpetual capital securities 8,552,741,141 )( 1,200,900,000 )( -
Interest paid 3,977,876,007 )( 3,843,166,540 )( 4,209,271,308 )(
Cash dividends paid 28 2,515,617,409 )( - 2,379,182,809 )(
Advances from associates and other related parties: 27, 36
Obtained 608,170,119 24,157,233 32,361,651
Paid 48,783,694 )( 255,089,920 )( 2,941,968 )(
Cash dividends declared and paid to non-controlling interest 263,692,340 )( 10,008,387 )( 68,013,915 )(
Redemption of preferred shares 18 251,597,580 )( 251,597,580 )( 251,597,580 )(
Acquisition of treasury shares 28 156,987,360 )( 994,672,630 )( -
Distribution to holders of perpetual securities 28 151,963,438 )( 535,258,625 )( 562,913,000 )(
Payments for return of capital to non-controlling interest 141,998,580 )( - -
Issuance of bonds and notes payable 16, 36 - 16,692,935,192 -
Repayments of lease liabilities 19, 36 - 24,915,531 )( 26,338,703 )(
Proceeds from exercise of stock rights 28 - 1,773,053 886,528
Net Cash From (Used in) Financing Activities 4,925,243,651 4,295,806,036 6,504,263,626 )(
NET INCREASE IN CASH AND
CASH EQUIVALENTS 3,627,850,011 17,061,880,236 5,561,780,352
CASH AND CASH EQUIVALENTS
AT BEGINNING OF YEAR 40,166,755,908 23,104,875,672 17,543,095,320
CASH AND CASH EQUIVALENTS
AT END OF YEAR 43,794,605,919 P 40,166,755,908 P 23,104,875,672 P
Supplemental Information on Non-cash Investing and Financing Activities:
See Notes to Consolidated Financial Statements.
- 2 -
1) In the normal course of business, the Group enters into non-cash transactions such as exchanges or purchases on account of real estate and other assets. Other non-cash transactions include transfers of property between Inventories, Property and Equipment, and Investment Properties. These non-cash activities are not reflected in the consolidated statements of cash flows (see Notes 7, 12 and 13).
2) In 2021 and 2020, the Group recognized right-of-use assets amounting to P3.6 million and P35.6 million, respectively, and lease liabilties amounting to P3.6 million and P36.8 million, respectively (see Notes 13 and 19).
MEGAWORLD CORPORATION AND SUBSIDIARIES (A Subsidiary of Alliance Global Group, Inc.)
NOTES TO CONSOLIDATED FINANCIAL STATEMENTS DECEMBER 31, 2021, 2020 AND 2019
(Amounts in Philippine Pesos) 1. CORPORATE INFORMATION
Megaworld Corporation (the Parent Company) was incorporated in the Philippines on
August 24, 1989, primarily to engage in the development of large scale, mixed-use planned communities or townships that integrate residential, commercial, leisure and entertainment components. The Parent Company is presently engaged in property-related activities such as project design, construction and property management. The Parent Company’s real estate portfolio includes residential condominium units, subdivision lots and townhouses, condominium-hotel projects as well as office projects and retail spaces.
Alliance Global Group, Inc. (AGI or the Ultimate Parent Company) is the ultimate parent
company of Megaworld Corporation and its subsidiaries (the Group). AGI is a holding company and is presently engaged in food and beverage, real estate development, quick-service restaurant, tourism-entertainment and gaming businesses.
The Parent Company and AGI’s common shares are publicly-listed at the Philippine Stock
Exchange (PSE).
The Parent Company’s registered office address, which is also its principal place of business, is located at 30th Floor, Alliance Global Tower, 36th Street cor. 11th Avenue, Uptown Bonifacio, Taguig City. AGI’s registered office address, which is also its principal place of business, is located at the 7th Floor, 1880 Eastwood Avenue, Eastwood City CyberPark, 188 E. Rodriguez, Jr. Avenue, Bagumbayan, Quezon City.
1.1 Composition of the Group
As at December 31, the Parent Company holds ownership interests in the following subsidiaries and associates:
Effective Percentage of Ownership
Subsidiaries 2021 2020 2019
Prestige Hotels and Resorts, Inc. (PHRI) 100% 100% 100%
Richmonde Hotel Group International Ltd. (RHGI) 100% 100% 100%
Eastwood Cyber One Corporation (ECOC) 100% 100% 100%
Megaworld Cebu Properties, Inc. (MCP) 100% 100% 100%
Megaworld Newport Property
Holdings, Inc. (MNPHI) 100% 100% 100%
Oceantown Properties, Inc. (OPI) 100% 100% 100%
Luxury Global Hotels and Leisure, Inc. (LGHLI) 100% 100% 100%
Arcovia Properties, Inc. (API) 100% 100% 100%

- 2 -
Explanatory Effective Percentage of Ownership
Subsidiaries Notes 2021 2020 2019
Mactan Oceanview Properties
and Holdings, Inc. (MOPHI) (a) 100% 100% 100%
Megaworld Cayman Islands, Inc. (MCII) (a) 100% 100% 100%
Piedmont Property Ventures, Inc. (PPVI) (a) 100% 100% 100%
Stonehaven Land, Inc. (SLI) (a) 100% 100% 100%
Streamwood Property, Inc. (SP) (a) 100% 100% 100%
Global One Integrated Business Services, Inc. (GOIBSI) 100% 100% 100%
Luxury Global Malls, Inc. (LGMI) 100% 100% 100%
Davao Park District Holdings, Inc. (DPDHI) 100% 100% 100%
Belmont Newport Luxury Hotels, Inc. (BNLHI) 100% 100% 100%
Global One Hotel Group, Inc. (GOHGI) 100% 100% 100%
Landmark Seaside Properties, Inc. (LSPI) (a) 100% 100% 100%
San Vicente Coast, Inc. (SVCI) (a) 100% 100% 100%
Hotel Lucky Chinatown, Inc. (HLCI) 100% 100% 100%
Savoy Hotel Manila, Inc. (SHMI) 100% 100% 100%
Savoy Hotel Mactan, Inc. (SHM) 100% 100% 100%
Kingsford Hotel Manila, Inc. (KHMI) (j) 100% 100% -
Agile Digital Ventures, Inc. (ADVI) (n) 100% 100% -
MREIT Fund Managers, Inc. (MFMI) (h) 100% - -
MREIT Property Managers, Inc. (MPMI) (h) 100% - -
MREIT, Inc. (MREIT) (h) 62.09% - -
Megaworld Bacolod Properties, Inc. (MBPI) 91.55% 91.55% 91.55%
Megaworld Central Properties, Inc. (MCPI) (b) 76.55% 76.55% 76.55%
Megaworld Capital Town, Inc. (MCTI) 76.28% 76.28% 76.28%
Soho Café and Restaurant Group, Inc. (SCRGI) 75% 75% 75%
La Fuerza, Inc. (LFI) 66.67% 66.67% 66.67%
Megaworld-Daewoo Corporation (MDC) (l) 60% 60% 60%
Northwin Properties, Inc. (NWPI) (a) 60% 60% 60%
Gilmore Property Marketing Associates, Inc. (GPMAI) (a, c) 52.14% 52.14% 52.14%
Manila Bayshore Property Holdings, Inc. (MBPHI) (d) 68.03% 68.03% 68.03%
Megaworld Globus Asia, Inc. (MGAI) 50% 50% 50%
Integrated Town Management Corporation (ITMC) 50% 50% 50%
Maple Grove Land, Inc. (MGLI) (a) 50% 50% 50%
Megaworld Land, Inc. (MLI) 100% 100% 100%
City Walk Building Administration, Inc. (CBAI) (e) 100% 100% 100%
Forbestown Commercial Center
Administration, Inc. (FCCAI) (e) 100% 100% 100%
Paseo Center Building
Administration, Inc. (PCBAI) (e) 100% 100% 100%
Uptown Commercial Center
Administration, Inc. (UCCAI) (e) 100% 100% 100%
Iloilo Center Mall Administration, Inc. (ICMAI) (e) 100% 100% 100%
Newtown Commercial Center
Administration, Inc. (NCCAI) (e) 100% 100% 100%
Valley Peaks Property Management, Inc. (VPPMI) (e) 100% 100% 100%
San Lorenzo Place Commercial Center
Administration, Inc. (SLPCCAI) (e) 100% 100% 100%
Southwoods Lifestyle Mall Management, Inc. (SLMMI) (e) 100% 100% 100%

- 3 -
Explanatory Effective Percentage of Ownership
Subsidiaries Notes 2021 2020 2019
Suntrust Properties, Inc. (SPI) 100% 100% 100%
Suntrust Ecotown Developers, Inc. (SEDI) 100% 100% 100%
Governor’s Hills Science School, Inc. (GHSSI) 100% 100% 100%
Sunrays Property Management, Inc. (SPMI) 100% 100% 100%
Suntrust One Shanata, Inc. (SOSI) (a) 100% 100% 100%
Suntrust Two Shanata, Inc. (STSI) (a) 100% 100% 100%
Stateland, Inc. (STLI) (k) 98.31% 96.87% 96.87%
Global-Estate Resorts, Inc. (GERI) (f) 82.32% 82.32% 82.32%
Elite Communities Property Services, Inc. (ECPSI) 82.32% 82.32% 82.32%
Southwoods Mall, Inc. (SMI) 91.09% 91.09% 91.09%
Megaworld Global-Estate, Inc. (MGEI) (f) 89.39% 89.39% 89.39%
Twin Lakes Corporation (TLC) (f) 90.99% 90.99% 90.99%
Twin Lakes Hotel, Inc. (TLHI) 90.99% 90.99% 90.99%
Fil-Estate Properties, Inc. (FEPI) 82.32% 82.32% 82.32%
Aklan Holdings, Inc. (AHI) (a) 82.32% 82.32% 82.32%
Blu Sky Airways, Inc. (BSAI) (a) 82.32% 82.32% 82.32%
Fil-Estate Subic Development Corp. (FESDC) (a) 82.32% 82.32% 82.32%
Fil-Power Construction Equipment
Leasing Corp. (FPCELC) (a) 82.32% 82.32% 82.32%
Golden Sun Airways, Inc. (GSAI) (a) 82.32% 82.32% 82.32%
La Compaña De Sta. Barbara, Inc. (LCSBI) 82.32% 82.32% 82.32%
MCX Corporation (MCX) (a) 82.32% 82.32% 82.32%
Pioneer L-5 Realty Corp. (PLRC) (a) 82.32% 82.32% 82.32%
Prime Airways, Inc. (PAI) (a) 82.32% 82.32% 82.32%
Sto. Domingo Place Development
Corp. (SDPDC) 82.32% 82.32% 82.32%
Fil-Power Concrete Blocks Corp. (FPCBC) (a) 82.32% 82.32% 82.32%
Fil-Estate Industrial Park, Inc. (FEIPI) (a) 65.03% 65.03% 65.03%
Sherwood Hills Development, Inc. (SHD) 45.28% 45.28% 45.28%
Fil-Estate Golf and Development, Inc. (FEGDI) 82.32% 82.32% 82.32%
Golforce, Inc. (Golforce) 82.32% 82.32% 82.32%
Southwoods Ecocentrum Corp. (SWEC) 49.39% 49.39% 49.39%
Philippine Aquatic Leisure Corp. (PALC) (a) 49.39% 49.39% 49.39%
Fil-Estate Urban Development Corp. (FEUDC) 82.32% 82.32% 82.32%
Novo Sierra Holdings Corp. (NSHC) (a) 82.32% 82.32% 82.32%
Global Homes and Communities, Inc. (GHCI) (a) 82.32% 82.32% 82.32%
Savoy Hotel Boracay, Inc. (SHBI) (f) 82.32% 82.32% 82.32%
Belmont Hotel Boracay, Inc. (BHBI) (f) 82.32% 82.32% 82.32%
Oceanfront Properties, Inc. (OFPI) 41.13% 41.13% 41.13%
Empire East Land Holdings, Inc. (EELHI) 81.73% 81.73% 81.73%
Eastwood Property Holdings, Inc. (EPHI) 81.73% 81.73% 81.73%
Valle Verde Properties, Inc. (VVPI) (a) 81.73% 81.73% 81.73%
Sherman Oak Holdings, Inc. (SOHI) (a) 81.73% 81.73% 81.73%
Empire East Communities, Inc. (EECI) (a) 81.73% 81.73% 81.73%
20th Century Nylon Shirt, Inc. (CNSI) (a) 81.73% 81.73% 81.73%
Laguna BelAir School, Inc. (LBASI) 59.67% 59.67% 59.67%
Sonoma Premier Land, Inc. (SPLI) (a) 49.04% 49.04% 49.04%
Pacific Coast Mega City, Inc. (PCMI) (m) 58.53% 32.69% 32.69% Megaworld Resort Estates, Inc. (MREI) (b, c) 51% 51% 51%
Townsquare Development, Inc. (TDI) 30.60% 30.60% 30.60%
Golden Panda-ATI Realty
Corporation (GPARC) 30.60% 30.60% 30.60%

- 4 -
Explanatory Effective Percentage of Ownership
Associates Notes 2021 2020 2019
Bonifacio West Development Corporation (BWDC) 46.11% 46.11% 46.11%
Palm Tree Holdings and Development
Corporation (PTHDC) (a) 40% 40% 40%
Suntrust Home Developers, Inc. (SHDI) (g) 34% 34% 34%
SWC Project Management Limited (SPML) (o) 34% 34% -
WC Project Management Limited (WPML) (o) 34% 34% -
First Oceanic Property Management, Inc. (FOPMI) (i) - 8.16% 8.16%
Citylink Coach Services, Inc. (CCSI) (i) - 8.16% 8.16%
GERI
Fil-Estate Network, Inc. (FENI) (a) 16.46% 16.46% 16.46%
Fil-Estate Sales, Inc. (FESI) (a) 16.46% 16.46% 16.46%
Fil-Estate Realty and Sales Associates, Inc.
(FERSAI) (a) 16.46% 16.46% 16.46%
Fil-Estate Realty Corp. (FERC) (a) 16.46% 16.46% 16.46%
Nasugbu Properties, Inc. (NPI) 11.52% 11.52% 11.52%
Explanatory Notes:
(a) These are entities which have not yet started commercial operations or are non-operating entities as at December 31, 2021.
(b) As at December 31, 2021, the Parent Company owns 76.55% of MCPI consisting of 51% direct ownership, 18.97% indirect
ownership through EELHI and 6.58% indirect ownership through MREI.
(c) As at December 31, 2021, the Parent Company’s ownership in GPMAI is at 52.14%, which consists of 38.72% and 13.42%
indirect ownership from EELHI and MREI, respectively.
(d) As at December 31, 2021, the Parent Company owns 68.03% of MBPHI, which consists of 67.43% direct ownership and 0.60%
indirect ownership from TIHGI
(e) These were incorporated to engage in operation, maintenance, and administration of various malls and commercial centers. These
companies became subsidiaries of the Parent Company through MLI, their immediate parent company.
(f) As a result of the additional investments in GERI in 2016, the Parent Company’s indirect ownership interest over these
subsidiaries increased in proportion to the increase in effective interest over GERI. Effective ownership interest over MGEI
and TLC increased to 89.39% and 83.37%, respectively. In 2018, the Parent Company acquired shares of TLC increasing its
effective ownership to 90.99%, which consists of 49% direct ownership and 41.99% indirect ownership from GERI. In 2019,
SHBI and BHBI were incorporated to operate and manage resort hotels.
(g) In 2019, the Parent Company and TDI disposed certain number of shares over SHDI. In addition, the Parent Company and a
third-party investor subscribed to the increase in capitalization over SHDI, with the third party investor becoming the controlling
shareholder. The foregoing transactions decreased the Parent Company’s effective ownership over SHDI to 34%.
(h) MFMI, MPMI and MREIT are newly incorporated subsidiaries. MFMI is engaged in the business of providing fund management
services to real estate investment trust (REIT) companies. MPMI is engaged in the business of providing services in relation to
property management, lease management, marketing and project management. MREIT is engaged in the business of an REIT,
as provided under Republic Act (R.A.) No. 9856, The Real Estate Investment Trust Act of 2009, including its implementing rules and
regulations, and other applicable laws.
(i) In 2021, SHDI disposed its investments in FOPMI and SHDI.
(j) KHMI was incorporated in 2020 and also engaged in hotel operations.
(k) In 2021, the Parent Company acquired additional common shares of STLI from previous stockholders representing 1.44% direct
ownership. As at December 31, 2021, the effective ownership of Parent Company over STLI is 98.31%, consisting of 18.84%
direct ownership and 79.47% indirect ownership through SPI.
(l) In 2021, the SEC approved the application of MDC for the decrease of its authorized capital stock. As a result, MDC paid a
total of P355.0 million to its current stockholders for the return of capital. The Parent Company’s ownership interest over MDC
remains at 60%.

- 5 -
(m) EELHI obtained de facto control over PCMI in 2018 by aligning their Boards of Directors (BOD) and key executives (see
Note 1.2). In 2019, EELHI acquired additional shares of PCMI, increasing the effective ownership of EELHI to 40%. Further,
in 2021, certain number of shares owned by the Ultimate Parent Company were transferred to the Parent Company, increasing
the effective ownership of the Parent Company to 58.53%, which consists of 25.83% direct ownership and 32.69% indirect
ownership from EELHI.
(n) ADVI is a newly-incorporated subsidiary in 2020 engaged in e-commerce business.
(o) SPML and WPML are newly incorporated subsidiaries of SHDI in 2020. These companies are engaged in project management
and consultancy services.
Except for MCII and RHGI, all the subsidiaries and associates were incorporated and have their principal place of business in the Philippines. MCII was incorporated and has principal place of business in the Cayman Islands while RHGI was incorporated and has principal place of business in the British Virgin Islands.
The Parent Company and its subsidiaries, except for entities which have not yet started commercial operations as at December 31, 2021, are presently engaged in the real estate business, hotel, condominium-hotel operations, construction, restaurant operations, business process outsourcing, educational facilities provider, property management operations, marketing services and e-commerce. There are no significant restrictions on the Parent Company’s ability to access or use the assets and settle the liabilities of the Group.
EELHI, GERI, SHDI and MREIT are publicly-listed companies in the Philippines. 1.2 Subsidiaries with Material Non-controlling Interest
The subsidiaries with material non-controlling interest (NCI) are shown below (in thousands).
Proportion of Ownership Subsidiary’s Consolidated Interest and Voting Profit (Loss) Allocated Rights Held by NCI to NCI Name 2021 2020 2019 2021 2020 2019 GERI 17.68% 17.68% 17.68% P 273,591 P 216,179 P 117,431 EELHI 18.27% 18.27% 18.27% 131,173 102,361 114,360 MCTI 23.72% 23.72% 23.72% 42,215 38,765 34,743 MREIT 37.91% - - 218,295 - - MBPHI 31.97% 31.97% 31.97% 134,394 283,219 547,545 LFI 33.33% 33.33% 33.33% 103,742 46,099 66,592 NWPI 40.00% 40.00% 40.00% ( 1,040) ( 505)( 534 ) Accumulated Equity of NCI Name 2021 2020 2019 GERI 5,924,064 5,659,306 P 6,580,032 EELHI 10,947,572 11,721,428 11,367,843 MCTI 1,478,957 1,436,742 1,397,977 MREIT 4,193,831 - - MBPHI 3,380,091 3,245,697 2,967,678 LFI 1,331,477 1,261,066 1,224,967 NWPI 2,304,126 2,305,165 2,305,671
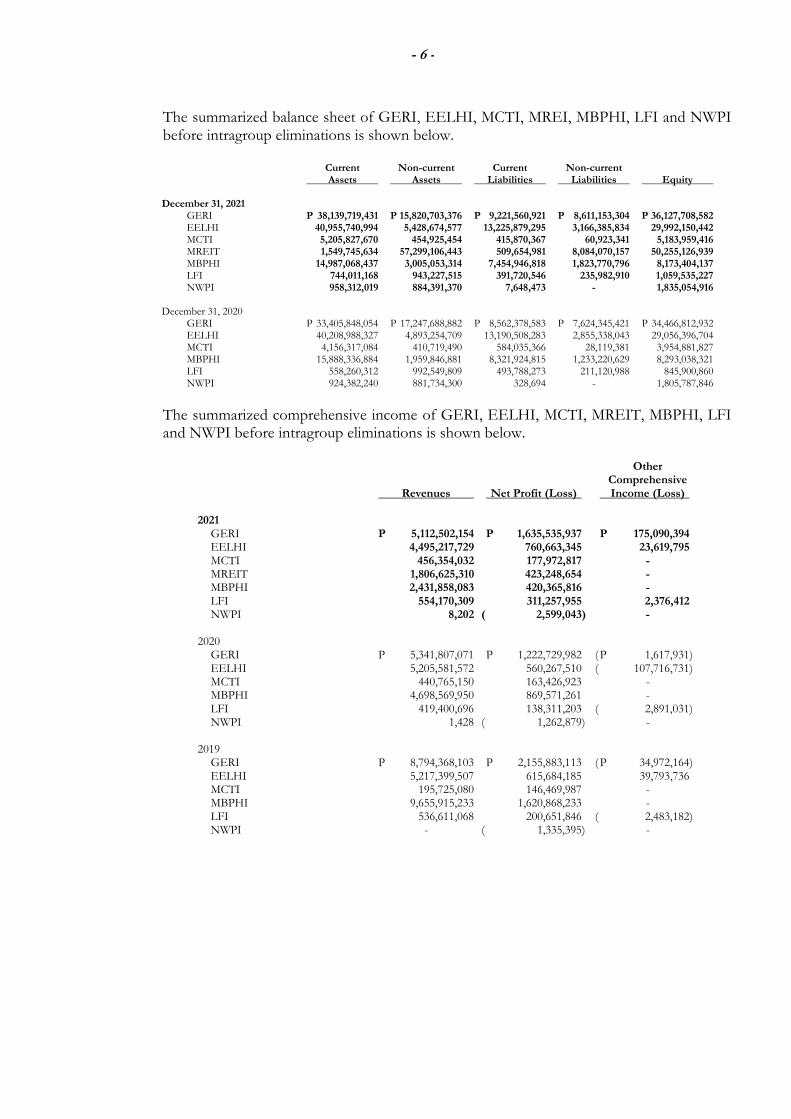
- 6 -
The summarized balance sheet of GERI, EELHI, MCTI, MREI, MBPHI, LFI and NWPI before intragroup eliminations is shown below. Current Non-current Current Non-current Assets Assets Liabilities Liabilities Equity December 31, 2021 GERI P 38,139,719,431 P 15,820,703,376 P 9,221,560,921 P 8,611,153,304 P 36,127,708,582 EELHI 40,955,740,994 5,428,674,577 13,225,879,295 3,166,385,834 29,992,150,442 MCTI 5,205,827,670 454,925,454 415,870,367 60,923,341 5,183,959,416 MREIT 1,549,745,634 57,299,106,443 509,654,981 8,084,070,157 50,255,126,939 MBPHI 14,987,068,437 3,005,053,314 7,454,946,818 1,823,770,796 8,173,404,137 LFI 744,011,168 943,227,515 391,720,546 235,982,910 1,059,535,227 NWPI 958,312,019 884,391,370 7,648,473 - 1,835,054,916 December 31, 2020 GERI P 33,405,848,054 P 17,247,688,882 P 8,562,378,583 P 7,624,345,421 P 34,466,812,932 EELHI 40,208,988,327 4,893,254,709 13,190,508,283 2,855,338,043 29,056,396,704 MCTI 4,156,317,084 410,719,490 584,035,366 28,119,381 3,954,881,827 MBPHI 15,888,336,884 1,959,846,881 8,321,924,815 1,233,220,629 8,293,038,321 LFI 558,260,312 992,549,809 493,788,273 211,120,988 845,900,860 NWPI 924,382,240 881,734,300 328,694 - 1,805,787,846
The summarized comprehensive income of GERI, EELHI, MCTI, MREIT, MBPHI, LFI and NWPI before intragroup eliminations is shown below.
Other Comprehensive Revenues Net Profit (Loss) Income (Loss) 2021 GERI P 5,112,502,154 P 1,635,535,937 P 175,090,394 EELHI 4,495,217,729 760,663,345 23,619,795 MCTI 456,354,032 177,972,817 - MREIT 1,806,625,310 423,248,654 - MBPHI 2,431,858,083 420,365,816 - LFI 554,170,309 311,257,955 2,376,412 NWPI 8,202 ( 2,599,043) - 2020 GERI P 5,341,807,071 P 1,222,729,982 ( P 1,617,931) EELHI 5,205,581,572 560,267,510 ( 107,716,731) MCTI 440,765,150 163,426,923 - MBPHI 4,698,569,950 869,571,261 - LFI 419,400,696 138,311,203 ( 2,891,031) NWPI 1,428 ( 1,262,879) - 2019 GERI P 8,794,368,103 P 2,155,883,113 ( P 34,972,164) EELHI 5,217,399,507 615,684,185 39,793,736 MCTI 195,725,080 146,469,987 - MBPHI 9,655,915,233 1,620,868,233 - LFI 536,611,068 200,651,846 ( 2,483,182) NWPI - ( 1,335,395) -

- 7 -
The summarized cash flows of GERI, EELHI, MCTI, MBPHI, LFI and NWPI before intragroup eliminations is shown below.
Net Cash from (Used in) Operating Investing Financing Activities Activities Activities 2021 GERI P 296,711,694 ( P 23,628,604) P 1,434,041,992 EELHI 1,295,015,628 5,622,495 ( 40,942,556) MCTI ( 147,010,156) ( 22,025,041) 1,051,104,773 MREIT 1,552,973,207 ( 9,116,000,000) 6,587,915,869 MBPHI 1,425,208,741 ( 372,827,723) ( 94,039,779) LFI 149,327,127 23,562,500 ( 103,912,836) NWPI ( 28,229,018) - 31,866,113 2020 GERI ( P 155,538,806) ( P 358,228,252) P 131,398,685 EELHI 1,131,309,023 ( 2,721,264) ( 144,199,581) MCTI ( 70,435,493) 47,671,293 - MBPHI 1,489,075,211 ( 56,992,141) - LFI 271,532,158 171,938 ( 158,972,586) NWPI ( 103,343) - - 2019 GERI P 657,521,604 ( P 344,933,491) P 537,583,173 EELHI ( 447,213,978) 2,378,163 ( 580,455,232) MCTI 23,924,863 114,429,182 1,051,104,773 MBPHI ( 545,095,966) 42,174,405 871,674,056 LFI 212,520,618 46,309,192 ( 138,160,779) NWPI ( 2,765,150) - 2,628,052
In 2021, only MREIT and LFI have declared and paid dividends amounting to P607.7 million and P100.0 million, respectively. In 2020, only LFI has declared and paid dividends amounting to P30.0 million.
1.3 Continuing Impact of COVID-19 Pandemic on the Group’s Business
The COVID-19 pandemic started to become widespread in the Philippines in early March 2020. The measures taken by the government to contain the virus have affected economic conditions and the Group’s business operations.
In response to this matter, the Group has taken the following actions:
maximized digital platforms to sell real estate projects in order to limit face to face engagements;
assisted tenants in implementing social distancing measures;
continues to work closely with tenants to determine and address their needs;
incorporated ADVI, a subsidiary focused on e-commerce and caters to the Parent Company’s commercial spaces tenants and retail partners;
launched E-Concierge, a mobile application that allows contactless interaction between guests and hotel staff from check-in to check-out, including virtual ordering of food from various food and beverage outlets inside the hotels;

- 8 -
reduced its overall capital expenditures spending for the year 2021;
obtained lower cost funding through the debt market to support its business operations, such as financing capital expenditures, land banking and refinancing of loans, and maintain its cash preservation objective;
undertook an intensive vaccination program to protect the employees and eligible dependents against COVID-19. By end of 2021, all employees have already been fully vaccinated and have received booster shots;
provided “care kits” and financial loan assistance to employees who have contracted COVID-19 and have undergone quarantine; and,
provided supplies of disinfectant alcohol, face masks, face shields, vitamins and other high-level hygiene kits to employees.
The following are the results of the actions taken by the management: Real estate sales in 2021 closed at 25.2% higher as compared to that of 2020 as a result
of resumption of construction activities. Rental income posted an increase of 3.0% in 2021. This is the net effect of an increase
in occupancy rate and lease concessions offered in 2021. Revenue from hotel operations increased by 30.1% as a result of lifting of travel
restrictions. In recognition for its program related to the pandemic, the Group received 25 local and
international awards during the year.
Although the Group posted higher revenue in 2021, it is still to reach pre-pandemic level of operations. Management will continue to take actions to continually improve the operations as the need arises. Based on the foregoing improvements, management projects that the Group would continue to report positive results of operations and would remain liquid to meet current obligations as they fall due. Accordingly, management has not determined a material uncertainty that may cast significant doubt on the Group’s ability to continue as a going concern due to the effects of the pandemic.
1.4 Approval of the Consolidated Financial Statements
The consolidated financial statements of the Group as at and for the year ended December 31, 2021 (including the comparative consolidated financial statements as at December 31, 2020 and for the years ended December 31, 2020 and 2019) were authorized for issue by the Group’s BOD on February 28, 2022.
2. SUMMARY OF SIGNIFICANT ACCOUNTING POLICIES
The significant accounting policies that have been used in the preparation of these financial statements are summarized in the succeeding pages. The policies have been consistently applied to all the years presented, unless otherwise stated.

- 9 -
2.1 Basis of Preparation of Consolidated Financial Statements
(a) Statement of Compliance with Philippine Financial Reporting Standards
The consolidated financial statements of the Group have been prepared in accordance with Philippine Financial Reporting Standards (PFRS), as modified by the application of the financial reporting reliefs issued and approved by the Securities and Exchange Commission (SEC) in response to the COVID-19 pandemic. The financial reporting reliefs availed of by the Group are disclosed in details below and in the succeeding pages. PFRS are adopted by the Financial Reporting Standards Council (FRSC) from the pronouncements issued by the International Accounting Standards Board, and approved by the Philippine Board of Accountancy (BOA).
The consolidated financial statements have been prepared using the measurement bases specified by PFRS, as modified by the application of the financial reporting reliefs issued and approved by the SEC in response to the COVID-19 pandemic, for each type of asset, liability, income and expense. The measurement bases are more fully described in the accounting policies that follow.
(b) SEC Financial Reporting Reliefs Availed by the Group
In 2020, the Group has availed of several financial reporting reliefs granted by the SEC under Memorandum Circular (MC) No. 14-2018, Philippine Interpretation Committee Question and Answer (PIC Q&A) No. 2018-12 Implementation Issues Affecting Real Estate Industry, MC No. 3-2019, PIC Q&A Nos. 2018-12-H and 2018-14, MC No. 4-2020, Deferment of the Implementation of IFRS Interpretations Committee (IFRIC) Agenda Decision on Over Time Transfer of Constructed Goods (PAS 23, Borrowing Costs) for Real Estate Industry, and MC 34-2020, Deferral of PIC Q&A No. 2018-12 and IFRIC Agenda Decision on Over Time Transfer of Constructed Goods (PAS 23) for Real Estate Industry for Another Period of Three Years or Until 2023, relating to several implementation issues of PFRS 15, Revenue from Contracts with Customers, affecting the real estate industry. In 2021, MC No. 2021-08, Amendment to SEC MC No. 2018-14, MC No. 2019-03, MC No. 2020-04, and MC No. 2020-34 to Clarify Transitory Provision, provides real estate companies the accounting policy option of applying either the full retrospective approach or the modified retrospective approach when they apply the provisions of the PIC and IFRIC pronouncement.
Discussed in the succeeding pages are the financial reporting reliefs availed of by the Group, including the descriptions of the implementation issues and their qualitative impacts to the financial statements. The Group opted to avail the reliefs until the end of the deferment period as provided under the relevant MC.

- 10 -
Relief Description and Implication Deferral Period
IFRIC Decision on Over Time Transfer of Constructed Goods (PAS 23) for Real Estate Industry
The IFRIC concluded that any inventory (work-in-progress) for unsold units under construction that the entity recognizes is not a qualifying asset, as the asset is ready for its intended sale in its current condition (i.e., the developer intends to sell the partially constructed units as soon as it finds suitable customers and, on signing a contract with a customer, will transfer control of any work-in-progress relating to that unit to the customer). Accordingly, no borrowing costs can be capitalized on such unsold real estate inventories. Had the Group elected not to defer the IFRIC Agenda Decision, it would have the following impact in the consolidated financial statements:
• interest expense would have been higher;
• cost of real estate inventories would have been lower;
• total comprehensive income would have been lower;
• retained earnings would have been lower; and,
• the carrying amount of real estate inventories would have been lower.
Until end of 2023
PIC Q&A No. 2018-12-D, Concept of the Significant Financing Component in the Contract to Sell and PIC Q&A No. 2020-04, Addendum to PIC Q&A 2018-12-D: Significant Financing Component Arising from Mismatch Between the Percentage of Completion and Schedule of Payments
PFRS 15 requires that in determining the transaction price, an entity shall adjust the promised amount of consideration for the effects of the time value of money if the timing of payments agreed to by the parties to the contract (either explicitly or implicitly) provides the customer or the entity with a significant benefit of financing the transfer of goods or services to the customer. In those circumstances, the contract contains a significant financing component. There is no significant financing component if the difference between the promised consideration and the cash selling price of the good or service arises for reasons other than the provision of finance to either the customer or the entity, and the difference between those amounts is proportional to the reason for the difference. Further, the Group does not need to adjust the promised amount of consideration for the effects of a significant financing component if the entity expects, at contract inception that the timing difference of the receipt of full payment of the contract price and that of the completion of the project, are expected within one year and significant financing component is not expected to be significant.
Until end of 2023

- 11 -
Had the Group elected not to defer this provision of the standard, it would have an impact in the consolidated financial statements as there would have been a significant financing component when there is a difference between the POC of the real estate project and the right to the consideration based on the payment schedule stated in the contract. The Group would have recognized an interest income when the POC of the real estate project is greater than the right to the consideration and an interest expense when lesser. Both interest income and expense will be calculated using the effective interest rate method. This will impact the retained earnings, real estate sales, and profit or loss in 2021 and prior years.
(c) Presentation of Consolidated Financial Statements
The consolidated financial statements are presented in accordance with Philippine Accounting Standard (PAS) 1, Presentation of Financial Statements. The Group presents a consolidated statement of comprehensive income separate from the consolidated statement of income.
The Group presents a third consolidated statement of financial position as at the beginning of the preceding period when it applies an accounting policy retrospectively, or makes retrospective restatement or reclassification of items that has a material effect on the information in the statement of financial position at the beginning of the preceding period. The related notes to the third statement of financial position are not required to be disclosed.
(d) Functional and Presentation Currency
These consolidated financial statements are presented in Philippine Peso, the Group’s presentation and functional currency, and all values represent absolute amounts except when otherwise indicated.
Items included in the consolidated financial statements of the Group are measured using the Group’s functional currency. Functional currency is the currency of the primary economic environment in which the Group operates.
2.2 Adoption of New and Amended PFRS
(a) Effective in 2021 that are Relevant to the Group
The Group adopted for the first time the following amendments to existing standards, which are mandatorily effective for annual periods beginning on or after January 1, 2021:
PFRS 7, PFRS 9 and PFRS 16 (Amendments) : Financial Instruments: Disclosures, Financial Instruments and Leases – Interest Rate Benchmark Reform Phase 2 PFRS 16 (Amendments) : Leases – COVID-19-Related Rent Concessions beyond June 30, 2021

- 12 -
Discussed below are the relevant information about these pronouncements.
(i) PFRS 7 (Amendments), Financial Instruments: Disclosures, PFRS 9 (Amendments), Financial Instruments, and PFRS 16 (Amendments), Leases - Interest Rate Benchmark Reform Phase 2. The amendments address issues that may affect financial reporting during the interest rate benchmark reform, including the effect of changes to contractual cash flows or hedging relationships resulting from the replacement of the London Interbank Offered Rate (LIBOR) with alternative benchmark rates. When changes are made to the hedging instruments, hedged item and hedged risk as a result of the interest rate benchmark reform, the Group updates the hedge documentation without discontinuing the hedging relationship and, in the case of a cash flow hedge, the amount accumulated in the cash flow hedge reserve is deemed to be based on the alternative reference rate. The Phase 2 amendments are relevant to the Group because it is exposed to the effects of the LIBOR reform on its interest-bearing loan and the designated hedging instruments that use LIBOR as interest benchmark rates [see Notes 15.1(a), 15.1(j) and 30]. Management assessed that the exposure is minimal as the benchmark rate of the hedging instruments will likely follow the benchmark rate of the interest-bearing loans.
(ii) PFRS 16, Leases – COVID-19-Related Rent Concessions beyond June 30, 2021 (effective from April 1, 2021). The amendment extends for one year the use of practical expedient of not assessing whether rent concessions reducing payments up until June 30, 2022 occurring as a direct consequence of the COVID-19 pandemic are lease modifications and instead to account for those rent concessions as if they are not lease modifications. The application of these amendments had no significant impact to the Group’s consolidated financial statements as the Group did not receive any rent concession from its lessors in 2021.
(b) Effective Subsequent to 2021 but not Adopted Early
There are pronouncements effective for annual periods subsequent to 2021, which are adopted by the FRSC. Management will adopt the following relevant pronouncements in accordance with their transitional provisions; and, unless otherwise stated, none of these are expected to have significant impact on the Group’s consolidated financial statements:
(i) PFRS 3 (Amendments), Business Combination – Reference to the Conceptual Framework (effective from January 1, 2022)
(ii) PAS 16 (Amendments), Property, Plant and Equipment – Proceeds Before Intended Use
(effective from January 1, 2022)
(iii) PAS 37 (Amendments), Provisions, Contingent Liabilities and Contingent Assets – Onerous Contracts – Cost of Fulfilling a Contract (effective from January 1, 2022)

- 13 -
(iv) Annual Improvements to PFRS 2018-2020 Cycle. Among the improvements, the following amendments, which are effective from January 1, 2022, are relevant to the Group:
PFRS 9 (Amendments), Financial Instruments – Fees in the ’10 percent’ Test for Derecognition of Liabilities
Illustrative Examples Accompanying PFRS 16, Leases – Lease Incentives
(v) PAS 1 (Amendments), Presentation of Financial Statements – Classification of Liabilities as Current or Non-current (effective from January 1, 2023)
(vi) PAS 1 (Amendments), Presentation of Financial Statements – Disclosure of Accounting Policies (effective January from 1, 2023)
(vii) PAS 1 (Amendments), Presentation of Financial Statements – Definition of Accounting Estimates (effective from January 1, 2023)
(viii) PAS 12 (Amendments), Income Taxes – Deferred Tax Related to Assets and Liabilities Arising from a Single Transaction (effective from January 1, 2023)
(ix) PFRS 10 (Amendments), Consolidated Financial Statements, and PAS 28
(Amendments), Investments in Associates and Joint Ventures – Sale or Contribution of Assets Between an Investor and its Associates or Joint Venture (effective date deferred indefinitely).
(c) PIC Q&As Relevant to the Real Estate Industry Applicable in 2021
Discussed below and in the succeeding page are the PIC Q&As effective January 1, 2021 that are applicable to the Group, including the description of their impact to the Group’s consolidated financial statements.
(i) PIC Q&A No. 2018-12-E, Treatment of uninstalled materials in the determination of POC
and PIC Q&A No. 2020-02, Conclusion on PIC Q&A No. 2018-12-E: On the Treatment of Materials Delivered on Site But Not Yet Installed in Measuring the Progress of the Performance Obligation
PIC Q&A No. 2018-12-E specifies, in recognizing revenue using a cost-based input
method, the cost incurred for customized materials not yet installed are to be included in the measurement of progress to properly capture the efforts expended by the Group in completing its performance obligation. In the case of uninstalled materials delivered on-site that are not customized, such as steels and rebars, elevators and escalators, which are yet to be installed or attached to the main structure are excluded in the assessment of progress. Control over the uninstalled materials is not transferred to the customer upon delivery to the site but only when these are installed or when they are used in the construction. The application of the PIC Q&A had no significant financial impact to Group’s consolidated financial statements since the Group does not include uninstalled materials that are not customized in determining measure of progress for revenue recognition.

- 14 -
(ii) PIC Q&A No. 2020-03, Conclusion on PIC Q&A No. 2018-12-D: On the Accounting Treatment for the Difference When the POC is Ahead of the Buyer’s Payment PIC Q&A No. 2020-03 concludes that the difference when the POC is ahead of the buyer’s payment can be accounted for either as a contract asset or receivable. The PIC has concluded that both views are acceptable as long as this is consistently applied in transactions of the same nature. The Group assessed to continue its current treatment of accounting for the difference when the POC is ahead of the buyer’s payment as part of the Contract Assets account, hence, the adoption did not have a significant impact on the 2021 consolidated financial statements.
(iii) PIC Q&A No. 2020-05, Accounting for Cancellation of Real Estate Sales (PIC Q&A No. 2020-05 Will Supersede PIC Q&A No. 2018-14) This PIC Q&A superseded PIC Q&A No. 2018-14. The interpretation provides three acceptable approaches in accounting for sales cancellation and repossession of the property as follows:
a. repossessed property is recognized at fair value less cost to repossess; b. repossessed property is recognized at fair value plus repossession cost; or, c. cancellation is accounted for as a modification of the contract.
The Group assessed to continue to account for cancellations of sales contracts and repossession of property as a modification of contract; hence, the adoption of this PIC Q&A did not have a significant impact on the Group’s consolidated financial statements.
2.3 Basis of Consolidation The Group’s consolidated financial statements comprise the accounts of the Parent Company, and its subsidiaries as enumerated in Note 1, after the elimination of material intercompany transactions. All intercompany assets and liabilities, equity, income, expenses and cash flows relating to transactions between entities under the Group, are eliminated in full on consolidation. Unrealized profits and losses from intercompany transactions that are recognized in assets are also eliminated in full. In addition, the shares of the Parent Company held by the subsidiaries are recognized as treasury shares and these are presented as deduction in the consolidated statement of changes in equity. Any changes in the market values of such shares as recognized separately by the subsidiaries are likewise eliminated in full.
The financial statements of subsidiaries are prepared for the same reporting period as the Parent Company’s, using consistent accounting principles. Adjustments are made to bring into line any dissimilar accounting policies that may exist. The Parent Company accounts for its investments in subsidiaries, associates, interests in jointly-controlled operations, and non-controlling interests as follows:
(a) Investments in Subsidiaries Subsidiaries are entities (including structured entities) over which the Parent Company has control. The Parent Company controls an entity when: it has the power over the entity; it is exposed, or has rights to, variable returns from its involvement with the entity; and, has the ability to affect those returns through its power over the entity. Subsidiaries are consolidated from the date the Parent Company obtains control.

- 15 -
The Parent Company reassesses whether or not it controls an entity if facts and circumstances indicate that there are changes to one or more of the three elements of controls indicated above. Accordingly, entities are deconsolidated from the date that control ceases.
The acquisition method is applied to account for acquired subsidiaries. This requires recognizing and measuring the identifiable assets acquired, the liabilities assumed and any non-controlling interest in the acquiree. The consideration transferred for the acquisition of a subsidiary is the fair values of the assets transferred, the liabilities incurred to the former owners of the acquiree and the equity interests issued by the Group, if any. The consideration transferred also includes the fair value of any asset or liability resulting from a contingent consideration arrangement. Acquisition-related costs are expensed as incurred and subsequent change in the fair value of contingent consideration is recognized directly in profit or loss.
Identifiable assets acquired and liabilities and contingent liabilities assumed in a business combination are measured initially at their fair values at the acquisition date. On an acquisition-by-acquisition basis, the Group recognizes any non-controlling interest in the acquiree either at fair value or at the non-controlling interest’s proportionate share of the acquiree’s net assets.
The excess of the consideration transferred, the amount of any non-controlling interest in the acquiree and the acquisition-date fair value of any existing equity interest in the acquiree over the acquisition-date fair value of the identifiable net assets acquired is recognized as goodwill. If the consideration transferred is less than the fair value of the net assets of the subsidiary acquired in the case of a bargain purchase, the difference is recognized directly as gain in profit or loss (see Note 2.13).
(b) Investments in Associates
Associates are those entities over which the Group is able to exert significant influence but not control and which are neither subsidiaries nor interests in a joint venture. Investments in associates are initially recognized at cost and subsequently accounted for in the consolidated financial statements using the equity method. Acquired investment in associate is subject to the purchase method. The purchase method involves the recognition of the acquiree’s identifiable assets and liabilities, including contingent liabilities, regardless of whether they were recorded in the financial statements prior to acquisition. Goodwill represents the excess of acquisition cost over the fair value of the Group’s share of the identifiable net assets of the acquiree at the date of acquisition. Any goodwill or fair value adjustment attributable to the Group’s share in the associate is included in the amount recognized as investment in an associate.
All subsequent changes to the ownership interest in the equity of the associates are recognized in the Group’s carrying amount of the investments. Changes resulting from the profit or loss generated by the associates are credited or charged against the Equity Share in Net Earnings of Associates account in the consolidated statement of income.
Impairment loss is provided when there is objective evidence that the investment in an associate will not be recovered (see Note 2.18).

- 16 -
Changes resulting from other comprehensive income of the associates or items recognized directly in the associates’ equity are recognized in other comprehensive income or equity of the Group, as applicable. However, when the Group’s share of losses in an associate equals or exceeds its interest in the associate, including any other unsecured receivables, the Group does not recognize further losses, unless it has incurred obligations or made payments on behalf of the associate. If the associate subsequently reports profit, the investor resumes recognizing its share of those profits only after its share of the profits exceeds the accumulated share of losses that has previously not been recognized. Distributions received from the associates are accounted for as a reduction of the carrying value of the investment.
Unrealized gains on transactions between the Parent Company and its associates are eliminated to the extent of the Group’s interest in the associates. Unrealized losses are also eliminated unless the transaction provides evidence of an impairment of the assets transferred. Accounting policies of associates are changed when necessary to ensure consistency with the policies adopted by the Group.
(c) Interests in Jointly-controlled Operations
For interests in jointly-controlled operations, the Group recognizes in its consolidated financial statements the assets that it controls, the liabilities and the expenses that it incurs and its share in the income from the sale of goods or services by the joint venture. The amounts of these related accounts are presented as part of the regular asset and liability accounts and income and expense accounts of the Group.
No adjustment or other consolidation procedures are required for the assets, liabilities, income and expenses of the joint operation that are recognized in the separate financial statements of the joint operators.
(d) Transactions with Non-controlling Interests
The Group’s transactions with non-controlling interests that do not result in loss of control are accounted for as equity transactions – that is, as transaction with the owners of the Group in their capacity as owners. The difference between the fair value of any consideration paid and the relevant share acquired of the carrying value of the net assets of the subsidiary is recognized in equity. Disposals of equity investments to non-controlling interests result in gains and losses for the Group that are recognized in equity.
When the Parent Company ceases to have control over a subsidiary, any retained interest in the entity is remeasured to its fair value at the date when control is lost, with the change in carrying amount recognized in profit or loss. The fair value is the initial carrying amount for the purposes of subsequently accounting for the retained interest as an associate, joint venture or financial asset. In addition, any amount previously recognized in other comprehensive income in respect of that entity are accounted for as if the Parent Company had directly disposed of the related assets or liabilities. This means that amounts previously recognized in other comprehensive income are reclassified to profit or loss.

- 17 -
The Parent Company holds interests in various subsidiaries and associates as presented in Notes 1.1 and 11.
2.4 Foreign Currency Transactions and Translation
(a) Transactions and Balances
Except for MCII and RHGI which use the United States (U.S.) dollar as their functional currency, the accounting records of the Parent Company and its subsidiaries are maintained in Philippine Peso. Foreign currency transactions during the year are translated into the functional currency at exchange rates which approximate those prevailing on transaction dates. Foreign currency gains and losses resulting from the settlement of such transactions and from the translation at year-end exchange rates of monetary assets and liabilities denominated in foreign currencies are recognized under Interest and Other Income or Charges – net in the consolidated statement of income.
(b) Translation of Financial Statements of Foreign Subsidiaries
The operating results and financial position of MCII and RHGI, which are measured using the U.S. dollar, their functional currency, are translated to Philippine Peso, the Parent Company’s functional currency, as follows:
(i) Assets and liabilities for each statement of financial position presented are translated at
the closing rate at the end reporting period;
(ii) Income and expenses for each profit or loss account are translated at the annual average exchange rates (unless this average is not a reasonable approximation of the cumulative effect of the rates prevailing on the transaction dates, in which case income and expenses are translated at the dates of the transactions); and,
(iii) All resulting exchange differences are recognized as a separate component of equity.
On consolidation, exchange differences arising from the translation of the net investment in MCII and RHGI are recognized under Exchange Difference on Translating Foreign Operations account in the consolidated statement of comprehensive income. As these entities are wholly owned subsidiaries, the translation adjustments are fully allocated to the Parent Company’s shareholders. When a foreign operation is partially disposed of or sold, such exchange differences are recognized in the consolidated statement of comprehensive income as part of gains or loss on sale.
Goodwill and fair value adjustments arising on the acquisition of a foreign entity are treated as assets and liabilities of the foreign entity and translated at the closing rate.
The translation of the consolidated financial statements into Philippine Peso should not be construed as a representation that the U.S. dollar amounts could be converted into Philippine Peso amounts at the translation rates or at any other rates of exchange.

- 18 -
2.5 Financial Assets
Financial assets are recognized when the Group becomes a party to the contractual terms of the financial instruments. For purposes of classifying financial assets, an instrument is considered as an equity instrument if it is non-derivative and meets the definition of equity for the issuer in accordance with the criteria of PAS 32, Financial Instruments: Presentation. All other non-derivative financial instruments are treated as debt instruments. (a) Classification, Measurement and Reclassification of Financial Assets The classification and measurement of financial assets is driven by the entity’s business
model for managing the financial assets and the contractual cash flow characteristics of the financial assets. Financial assets are categorized into the following categories: financial assets at amortized cost, financial assets at fair value through profit or loss and financial assets at FVOCI.
(i) Financial Assets at Amortized Cost
Financial assets are measured at amortized cost if both of the following conditions are met:
the asset is held within the Group’s business model whose objective is to hold financial assets in order to collect contractual cash flows (“hold to collect”); and,
the contractual terms of the instrument give rise, on specified dates, to cash flows that are solely payments of principal and interest (SPPI) on the principal amount outstanding.
Except for trade receivables that do not contain a significant financing component and are measured at the transaction price in accordance with PFRS 15, all financial assets meeting these criteria are measured initially at fair value plus transaction costs. These are subsequently measured at amortized cost using the effective interest method, less any impairment in value.
The Group’s financial assets at amortized cost are presented in the consolidated statement of financial position as Cash and Cash Equivalents, Trade and Other Receivables, and Guarantee and other deposits (presented as part of Other Non-current Assets). Financial assets measured at amortized cost are included in current assets, except for those with maturities greater than 12 months after the end of reporting period, which are classified as non-current assets. For purposes of cash flows reporting and presentation, cash and cash equivalents comprise accounts with original maturities of three months or less, including cash. These generally include cash on hand, demand deposits and short-term, highly liquid investments readily convertible to known amounts of cash and which are subject to insignificant risk of changes in value.

- 19 -
Interest income is calculated by applying the effective interest rate to the gross carrying amount of the financial assets except for those that are subsequently identified as credit-impaired. For credit-impaired financial assets at amortized cost, the effective interest rate is applied to the net carrying amount of the financial assets (after deduction of the loss allowance). The interest earned is recognized in the consolidated statements of income as part of Interest and Other Income – net.
(ii) Financial Assets at Fair Value Through Other Comprehensive Income
The Group accounts for financial assets at FVOCI if the assets meet the following conditions:
they are held under a business model whose objective is to hold to collect the associated cash flows and sell (“hold to collect and sell”); and,
the contractual terms of the financial assets give rise to cash flows that are SPPI on the principal amount outstanding.
At initial recognition, the Group can make an irrevocable election (on an instrument-by-instrument basis) to designate equity investments as at FVOCI; however, such designation is not permitted if the equity investment is held by the Group for trading or as mandatorily required to be classified as FVTPL or if it is a contingent consideration recognized arising from a business combination. Accordingly, the Group has designated equity instruments as at FVOCI.
Financial assets at FVOCI are initially measured at fair value plus transaction costs. Subsequently, they are measured at fair value, with no deduction for any disposal costs. Gains and losses arising from changes in fair value, including the foreign exchange component, are recognized in other comprehensive income, net of any effects arising from income taxes, and are reported as part of Revaluation Reserves account in equity. When the asset is disposed of, the cumulative gain or loss previously recognized in the Revaluation Reserves account is not reclassified to profit or loss but is reclassified directly to Retained Earnings account, except for those debt securities classified as FVOCI wherein cumulative fair value gains or losses are recycled to profit or loss. Interest income is calculated by applying the effective interest rate to the gross carrying amount of the financial assets except for those that are subsequently identified as credit-impaired. For credit-impaired financial assets, the effective interest rate is applied to the net carrying amount of the financial assets (after deduction of the loss allowance). The interest earned is recognized in the consolidated statements of income as part of Interest and Other Income – net.
Any dividends earned on holding equity instruments are recognized in the consolidated statements of income as part of Interest and Other Income – net, when the Group’s right to receive dividends is established, it is probable that the economic benefits associated with the dividend will flow to the Group, and, the amount of the dividend can be measured reliably, unless the dividends clearly represent recovery of a part of the cost of the investment.

- 20 -
(iii) Financial Assets at Fair Value Through Profit or Loss
Financial assets that are held within a different business model other than “hold to collect” or “hold to collect and sell” are categorized at FVTPL. Further, irrespective of business model, financial assets whose contractual cash flows are not SPPI are accounted for at FVTPL. Also, equity securities are classified as financial assets at FVTPL, unless the Group designates an equity investment that is not held for trading as at FVOCI at initial recognition. The Group’s financial assets at FVTPL include derivatives with positive fair value and are presented in the consolidated statement of financial position as part of Prepayments and Other Current Assets.
Financial assets at FVTPL are initially measured at fair value. Subsequently, they are measured at fair value with gains or losses recognized in profit or loss as part of Interest and Other Income – net in the consolidated statements of income unless the Group has elected to apply hedge accounting by designating the derivative as hedging instrument in an eligible hedging relationship in which some or all gains and losses may be recognized in other comprehensive income and included under Revaluation Reserves in the statements of changes in equity.
The Group can only reclassify financial assets if the objective of its business model for managing those financial assets changes. Accordingly, the Group is required to reclassify financial assets: (i) from amortized cost to FVTPL, if the objective of the business model changes so that the amortized cost criteria are no longer met; and, (ii) from FVTPL to amortized cost, if the objective of the business model changes so that the amortized cost criteria start to be met and the characteristic of the instrument’s contractual cash flows meet the amortized cost criteria.
A change in the objective of the Group’s business model will take effect only at the beginning of the next reporting period following the change in the business model.
(b) Impairment of Financial Assets
The Group assesses its expected credit losses (ECL) on a forward-looking basis associated with its financial assets carried at amortized cost and debt instruments measured at FVOCI. The measurement of ECL involves consideration of broader range of information that is available without undue cost or effort at the reporting date about past events, current conditions, and reasonable and supportable forecasts of future economic conditions (i.e., forward-looking information) that may affect the collectability of the future cash flows of the financial assets. Measurement of the ECL is determined by a probability-weighted estimate of credit losses over the expected life of the financial instruments evaluated based on a range of possible outcome. The Group applies the simplified approach in measuring ECL, which uses a lifetime expected loss allowance for all trade and other receivables and contract assets including those which contain significant financing component. These are the expected shortfalls in contractual cash flows, considering the potential for default at any point during the life of the financial assets. The Group also assesses impairment of trade receivables on a collective basis as they possess shared credit risk characteristics, and have been grouped based on the days past due [see Note 32.3(b)].

- 21 -
The Group applies a general approach specifically, in relation to advances to related parties. The maximum period over which ECL should be measured is the longest contractual period where an entity is exposed to credit risk. In the case of these receivables from related parties, which are repayable on demand, the contractual period is the very short period needed to transfer the cash once demanded. Management determines possible impairment based on the sufficiency of the related parties’ highly liquid assets in order to repay the Group’s receivables if demanded at the reporting date taking into consideration the historical defaults of the related parties. If the Group cannot immediately collect its receivables, management considers the expected manner of recovery to measure ECL. If the recovery strategies indicate that the outstanding balance of advances to related parties can be collected, the ECL is limited to the effect of discounting the amount due over the period until cash is realized.
For other financial assets at amortized cost, ECLs are recognized in two stages. For credit exposures for which there has not been a significant increase in credit risk since initial recognition, ECLs are provided for credit losses that result from default events that are possible within the next 12 months (a 12-month ECL). For those credit exposures for which there has been a significant increase in credit risk since initial recognition, a loss allowance is required for credit losses expected over the remaining life of the exposure, irrespective of the timing of the default (a lifetime ECL).
For cash and cash equivalents, the Group applies the low credit risk simplification. The probability of default and loss given defaults are publicly available and are considered to be low credit risk investments. It is the Group’s policy to measure ECLs on such instruments on a 12-month basis. However, when there has been a significant increase in credit risk since origination, the allowance will be based on the lifetime ECL.
The key elements used in the calculation of ECL are as follows:
(i) Probability of default – It is an estimate of likelihood of a counterparty defaulting at
its financial obligation over a given time horizon, either over the next 12 months or the remaining lifetime of the obligation.
(ii) Loss given default – It is an estimate of loss arising in case where a default occurs at a
given time. It is based on the difference between the contractual cash flows of a financial instrument due from a counterparty and those that the Group would expect to receive, including the realization of any collateral or effect of any credit enhancement.
(iii) Exposure at default – It represents the gross carrying amount of the financial
instruments in the event of default which pertains to its amortized cost.
The Group recognizes an impairment loss in profit or loss for all impaired financial instruments with a corresponding adjustment to their carrying amount through a loss allowance account, except for debt instruments measured at FVOCI, for which the loss allowance is recognizes in other comprehensive income and accumulated in Revaluation Reserves account, and does not reduce the carrying amount of the financial asset in the statement of financial position.

- 22 -
(c) Derecognition of Financial Assets The financial assets (or where applicable, a part of a financial asset or part of a group of financial assets) are derecognized when the contractual rights to receive cash flows from the financial instruments expire, or when the financial assets and all substantial risks and rewards of ownership have been transferred to another party. If the Group neither transfers nor retains substantially all the risks and rewards of ownership and continues to control the transferred asset, the Group recognizes its retained interest in the asset and an associated liability for amounts it may have to pay. If the Group retains substantially all the risks and rewards of ownership of a transferred financial asset, the Group continues to recognize the financial asset and also recognizes a collateralized borrowing for the proceeds received.
2.6 Derivative Financial Instruments and Hedge Accounting
The Group occasionally uses derivative financial instruments to manage its risks associated with foreign currency and interest rates. Derivatives are recognized initially at fair value and are subsequently remeasured at fair value. Such derivatives are carried as assets when the net fair value is positive and as liabilities when the net fair value is negative.
The Group uses hedge accounting when it assigns hedging relationships between a hedging instrument, usually a derivative financial instrument, and a hedged item. The hedging relationship must meet several strict conditions with respect to documentation, probability of occurrence of the hedged transaction and hedge effectiveness to qualify for hedge accounting. The hedging relationship must be expected to be highly effective over the period for which it is designated as cash flow hedge. Changes in fair value of derivatives designated as hedging instruments in cash flow hedges are recognized in other comprehensive income and included under Revaluation Reserves in equity to the extent that the hedge is effective. Any ineffectiveness in the hedge relationship is recognized immediately in profit or loss. If the hedged future cash flows are no longer expected, the amount that has been accumulated in Revaluation Reserves shall be immediately reclassified to profit or loss.
2.7 Inventories
Cost of inventories includes acquisition costs of raw land intended for future development, including other costs and expenses incurred to effect the transfer of the property to the Group; related property development costs; and borrowing costs on certain loans incurred during the development of the real estate properties are also capitalized by the Group (see Note 2.21). All costs relating to the real estate property sold are recognized as expense as the work to which they relate is performed. Costs of inventories are assigned using specific identification of their individual costs. These properties and projects are valued at the lower of cost and net realizable value. Net realizable value is the estimated selling price in the ordinary course of business, less estimated costs to complete and the estimated costs necessary to make the sale. The Group recognizes the effect of revisions in the total project cost estimates in the year in which these changes become known. Any impairment loss from a real estate project is charged to operations during the period in which the loss is determined.

- 23 -
Repossessed property arising from sales cancellation is recognized at cost. The difference between the carrying amount of the receivable or contract asset to be derecognized plus any amount to be refunded to customers and the cost of the repossessed property is recognized in the consolidated statement of income. 2.8 Prepayments and Other Assets
Prepayments and other assets pertain to other resources controlled by the Group as a result of past events. They are recognized in the consolidated financial statements when it is probable that the future economic benefits will flow to the Group and the asset has a cost or value that can be measured reliably. Advances to contractors and suppliers pertain to advance payments made by the Group, which are subsequently amortized as the performance obligation is performed.
Other recognized assets of similar nature, where future economic benefits are expected to flow to the Group beyond one year after the end of the reporting period or in the normal operating cycle of the business, if longer, are classified as non-current assets.
2.9 Property and Equipment
Property and equipment, including land, are carried at acquisition or construction cost less subsequent depreciation and/or amortization for property and equipment, and any impairment losses. As no finite useful life for land can be determined, related carrying amounts are not depreciated.
The cost of an asset comprises its purchase price and directly attributable costs of bringing the asset to working condition for its intended use. Expenditures for additions, major improvements and renewals are capitalized while expenditures for repairs and maintenance are charged to expenses as incurred.
Depreciation and amortization are computed on the straight-line basis over the estimated useful lives of the assets. Amortization of office improvements is recognized over the estimated useful lives of improvements or the term of the lease, whichever is shorter.
The depreciation and amortization periods for other property and equipment, based on the above policies, are as follows:
Buildings and improvements 5-25 years Office improvements 5-20 years
Transportation equipment 5 years Office furniture, fixtures and equipment 3-5 years
The measurement for right-of-use assets is disclosed in Note 2.17(a). Fully depreciated and amortized assets are retained in the accounts until they are no longer in use and no further charge for depreciation and amortization is made in respect of these assets.

- 24 -
An asset’s carrying amount is written down immediately to its recoverable amount if the asset’s carrying amount is greater than its estimated recoverable amount (see Note 2.18). The residual values, estimated useful lives and method of depreciation and amortization of property and equipment are reviewed, and adjusted if appropriate, at the end of each reporting period.
An item of property and equipment, including the related accumulated depreciation, amortization and any impairment losses, is derecognized upon disposal or when no future economic benefits are expected to arise from the continued use of the asset. Any gain or loss arising on derecognition of the asset (calculated as the difference between the net disposal proceeds and the carrying amount of the item) is included in the consolidated profit or loss in the year the item is derecognized. 2.10 Investment Properties
Investment properties include properties held for lease under operating lease agreements, properties intended to be held for lease, and properties held for currently undetermined use. These properties are carried at cost, net of accumulated depreciation and any impairment in value, except for land which is not subject to depreciation. The cost of an asset comprises its purchase price and directly attributable costs of bringing the asset to working condition for its intended use. Depreciation of investment properties, excluding land, is computed using the straight-line method over the estimated useful lives of the assets ranging from 5 to 40 years.
An asset’s carrying amount is written down immediately to its recoverable amount if the asset’s carrying amount is greater than its recoverable amount (see Note 2.18).
The residual values, estimated useful lives and method of depreciation of investment properties, except for land, are reviewed and adjusted, if appropriate, at the end of each reporting period.
Transfers to, or from, investment properties shall be made when and only when there is a change in use or purpose for such property.
Investment properties are derecognized upon disposal or when permanently withdrawn from use and no future economic benefit is expected from its disposal. Any gain or loss on the retirement or disposal of investment properties are recognized in the consolidated statement of income in the year of retirement or disposal.
2.11 Financial Liabilities
Financial liabilities of the Group, which include interest-bearing loans and borrowings, bonds and notes payable, trade and other payables (except tax-related liabilities), derivative liabilities, redeemable preferred shares, advances from associates and other related parties, commission payable and subscription payable (presented as part of Other Current Liabilities and Other Non-current Liabilities in the consolidated statement of financial position), are recognized when the Group becomes a party to the contractual terms of the instrument. Financial liabilities (except derivative liabilities) are initially recognized at their fair values and subsequently measured at amortized cost using effective interest method for maturities beyond one year, less settlement payments. Derivative liabilities are initially recognized and subsequently measured at fair value. Changes in fair value are recognized in profit or loss unless designated as hedging instrument in a cash flow hedge (see Note 2.6).

- 25 -
All interest-related charges, except for capitalized borrowing costs, are recognized as expense in profit or loss under the caption Interest and Other Charges in the consolidated statement of income.
Interest-bearing loans and borrowings, bonds payable and redeemable preferred shares are raised for support of long-term funding of operations. Finance charges, including premiums payable on settlement or redemption and direct issue costs, are charged to profit or loss, except for capitalized borrowing cost, on an accrual basis using the effective interest method and are added to the carrying amount of the instrument to the extent that these are not settled in the period in which they arise. Preferred shares, which carry a mandatory coupon or are redeemable on specific date or at the option of the shareholder, are classified as financial liabilities and presented as a separate line item in the consolidated statement of financial position as Redeemable Preferred Shares. These shares are also issued for support of long-term funding. Dividend distributions to shareholders, if any, are recognized as financial liabilities when the dividends are approved by the BOD. The dividends on the redeemable preferred shares are recognized in the consolidated statement of income as interest expense on an amortized cost basis using the effective interest method.
Financial liabilities are classified as current liabilities if payment is due to be settled within one year or less after the reporting period (or in the normal operating cycle of the business, if longer), or the Group does not have an unconditional right to defer settlement of the liability for at least 12 months after the reporting period. Otherwise, these are presented as non-current liabilities.
Financial liabilities are derecognized from the consolidated statement of financial position only when the obligations are extinguished either through discharge, cancellation or expiration. The difference between the carrying amount of the financial liability derecognized and the consideration paid or payable is recognized in consolidated statement of income.
2.12 Offsetting Financial Instruments
Financial assets and financial liabilities are offset and the resulting net amount, considered as a single financial asset or financial liability, is reported in the consolidated statement of financial position when the Group currently has legally enforceable right to set-off the recognized amounts and there is an intention to settle on a net basis, or realize the asset and settle the liability simultaneously. The right of set-off must be available at the end of the reporting period, that is, it is not contingent on future event. It must also be enforceable in the normal course of business, in the event of default, and in the event of insolvency or bankruptcy; and, must be legally enforceable for both entity and all counterparties to the financial instruments.

- 26 -
2.13 Business Combination
(a) Accounting for Business Combination Using the Acquisition Method
Business acquisitions of entities not under common control of a principal stockholder are accounted for using the acquisition method of accounting.
Goodwill represents the excess of the cost of an acquisition over the fair value of the Parent Company’s share of the net identifiable assets of the acquired subsidiary at the date of acquisition. Subsequent to initial recognition, goodwill is tested annually for impairment and carried at cost less accumulated impairment losses. Impairment losses on goodwill are not reversed (see Note 2.18).
Negative goodwill, which is the excess of the Parent Company’s interest in the fair value of net identifiable assets acquired over acquisition cost, is charged directly to profit or loss.
For the purpose of impairment testing, goodwill is allocated to cash-generating units or groups of cash-generating units that are expected to benefit from the business combination in which the goodwill arose. The cash-generating units or groups of cash-generating units are identified according to operating segment. Gains and losses on the disposal of an interest in a subsidiary include the carrying amount of goodwill relating to it. If the business combination is achieved in stages, the Parent Company is required to remeasure its previously held equity interest in the acquiree at its acquisition-date fair value and recognize the resulting gain or loss, if any, in the consolidated profit or loss or other comprehensive income, as appropriate. If the initial accounting for a business combination is incomplete by the end of the reporting period in which the combination occurs, the Parent Company is required to report in its financial statements provisional amounts for the items for which accounting is incomplete. The recognized provisional amounts may be adjusted during the measurement period as if the accounting for the business combination had been completed at the acquisition date. The measurement period ends as soon as the Parent Company receives the information it was seeking about facts and circumstances that existed as of the acquisition date or learns that more information is not obtainable. However, the measurement period shall not exceed one year from the acquisition date. Any contingent consideration to be transferred by the Parent Company is recognized at fair value at the acquisition date. Subsequent changes to the fair value of the contingent consideration that is deemed to be an asset or liability is recognized in accordance with PAS 37, Provisions, Contingent Liabilities and Contingent Assets, either in profit or loss or as a change to other comprehensive income. Contingent consideration that is classified as equity is not remeasured, and its subsequent settlement is accounted for within equity.

- 27 -
(b) Accounting of Business Combination Using the Pooling-of-interests Method
Business combinations arising from transfers of interests in entities that are under the common control of the principal stockholder are accounted for under the pooling-of interests method. Transfers of assets between commonly-controlled entities are accounted for under historical cost accounting; hence, the assets and liabilities are reflected in the consolidated financial statements at carrying values and no adjustments are made to reflect fair values or recognize any new assets or liabilities, at the date of the combination that otherwise would have been done under the acquisition method. No restatements are made to the financial information in the consolidated financial statements for periods prior to the business combination as allowed under PIC Q&A No. 2012-01, PFRS 3.2; Application of the Pooling of Interests Method for Business Combinations of Entities under Common Control in Consolidated Financial Statements, (Amended by PIC Q&A No. 2015-01and PIC Q&A No. 2018-13); hence, the profit and loss of the acquiree is included in the consolidated financial statements for the full year, irrespective of when the combination took place. Also, no goodwill is recognized as a result of the business combination and any excess between the net assets of the acquiree and the consideration paid is accounted for as “equity reserves”, which will eventually be closed to additional paid-in capital. Also, any pre-acquisition income and expenses of a subsidiary are no longer included in the consolidated financial statements.
2.14 Segment Reporting
Operating segments are reported in a manner consistent with the internal reporting provided to the Group’s Strategic Steering Committee (SSC), its chief operating decision-maker. The SSC is responsible for allocating resources and assessing performance of the operating segments. In identifying its operating segments, management generally follows the Group’s products and service lines as disclosed in Note 4, which represent the main products and services provided by the Group. Each of these operating segments is managed separately as each of these products and service lines requires different technologies and other resources as well as marketing approaches. All inter-segment transfers are carried out at arm’s length prices.
The measurement policies the Group uses for segment reporting under PFRS 8, Operating Segments, are the same as those used in its consolidated financial statements, except that the following are not included in arriving at the operating profit of the operating segments:
• interest cost from post-employment benefit obligation;
• equity in net earnings of associates, fair value gains, dividend income and foreign currency gains/losses; and,
• gain on sale of investments in associate.
In addition, corporate assets which are not directly attributable to the business activities of any operating segment are not allocated to a segment. 2.15 Provisions and Contingencies
Provisions are recognized when present obligations will probably lead to an outflow of economic resources and they can be estimated reliably even if the timing or amount of the outflow may still be uncertain. A present obligation arises from the presence of a legal or constructive obligation that has resulted from past events.

- 28 -
Provisions are measured at the estimated expenditure required to settle the present obligation, based on the most reliable evidence available at the end of the reporting period, including the risks and uncertainties associated with the present obligation. Where there are a number of similar obligations, the likelihood that an outflow will be required in settlement is determined by considering the class of obligations as a whole. When time value of money is material, long-term provisions are discounted to their present values using a pretax rate that reflects market assessments and the risks specific to the obligation. The increase in the provision due to passage of time is recognized as interest expense. Provisions are reviewed at the end of each reporting period and adjusted to reflect the current best estimate.
In those cases where the possible outflow of economic resource as a result of present obligations is considered improbable or remote, or the amount to be provided for cannot be measured reliably, no liability is recognized in the consolidated financial statements. Similarly, probable inflows of economic benefits to the Group that do not yet meet the recognition criteria of an asset are considered contingent assets; hence, are not recognized in the consolidated financial statements. On the other hand, any reimbursement that the Group can be virtually certain to collect from a third party with respect to the obligation is recognized as a separate asset not exceeding the amount of the related provision. 2.16 Revenue and Expense Recognition
Revenue comprises revenue from sale of real properties, property management fees and hotel operations. To determine whether to recognize revenue from sale of real properties and hotel operations, the Group follows a five-step process: 1. Identifying the contract with a customer; 2. Identifying the performance obligation; 3. Determining the transaction price; 4. Allocating the transaction price to the performance obligations; and, 5. Recognizing revenue when/as performance obligations are satisfied. For Step 1 to be achieved, the following five gating criteria must be present:
the parties to the contract have approved the contract either in writing, orally or in accordance with other customary business practices;
each party’s rights regarding the goods or services to be transferred or performed can be identified;
the payment terms for the goods or services to be transferred or performed can be identified;
the contract has commercial substance (i.e., the risk, timing or amount of the future cash flows is expected to change as a result of the contract); and,
collection of the consideration in exchange of the goods and services is probable.
Revenue is recognized only when (or as) the Group satisfies a performance obligation by transferring control of the promised goods or services to a customer. The transfer of control can occur over time or at a point in time.

- 29 -
A performance obligation is satisfied at a point in time unless it meets one of the following criteria, in which case it is satisfied over time:
the customer simultaneously receives and consumes the benefits provided by the Group’s performance as the Group performs;
the Group’s performance creates or enhances an asset that the customer controls as the asset is created or enhanced; and,
the Group’s performance does not create an asset with an alternative use to the Group and the entity has an enforceable right to payment for performance completed to date.
The transaction price allocated to performance obligations satisfied at a point in time is recognized as revenue when control of the goods or services transfers to the customer. If the performance obligation is satisfied over time, the transaction price allocated to that performance obligation is recognized as revenue as the performance obligation is satisfied.
The Group develops real properties such as developed land, house and lot, and condominium units. The Group often enters into contracts to sell real properties as they are being developed. The Group also enters into transactions involving hotel accommodations, food and beverage operations, and other incidental activities. The significant judgment used in determining the timing of satisfaction of the Group’s performance obligation with respect to its contracts to sell real properties is disclosed in Note 3.1(b). Sales cancellations are accounted for as contract modification on the year of forfeiture. Cumulative revenue and costs recognized on cancelled contracts are reversed, any gain or loss is charged to profit or loss. (a) Real estate sales on pre-completed real estate properties – Revenue from real estate sales is
recognized over time proportionate to the progress of the development. The Group measures its progress based on actual costs incurred relative to the total expected costs to be incurred in completing the development. Revenue recognized from real estate sales is presented as part of Real Estate Sales under the Revenues and Income section in the consolidated statement of comprehensive income.
(b) Real estate sales on completed real estate properties – Revenue from real estate sales is recognized
at point in time when the control over the real estate property is transferred to the buyer. Revenue recognized from real estate sales is presented as part of Real Estate Sales under the Revenues and Income section in the consolidated statement of comprehensive income.
For tax reporting purposes, a modified basis of computing the taxable income for the year based on collections from sales is used by the Parent Company, GERI, EELHI, SPI, ECOC, MBPHI, SEDI, LFI, OPI, MGAI, MCTI and STLI.
(c) Sale of undeveloped land and golf and resort shares for sale – Revenues on sale of undeveloped land and golf and resort shares for sale are recognized at a point in time when the control over the undeveloped land and golf and resort shares have passed to the buyer and the amount of revenue can be measured reliably.
(d) Hotel accommodation – Revenues are recognized over time during the occupancy of hotel
guest and ends when the scheduled hotel room accommodation has lapsed (i.e., the related room services have been rendered). As applicable, invoices for hotel accommodations are due upon receipt by the customer.
(e) Food, beverage and others – Revenues are recognized at point in time upon delivery to and receipt of consumer goods by the customer. Invoice for consumer goods transferred are due upon receipt by the customer.

- 30 -
(f) Rendering of services – Revenues are recognized over time (i.e., time-and-materials basis as the services are provided or based on the actual work done) until the performance of contractually agreed tasks has been substantially rendered. Revenue from rendering of services include property management, commission and construction income.
Incremental costs of obtaining a contract to sell real estate property to customers are recognized as an asset and are subsequently amortized over the duration of the contract on the same basis as revenue from such contract is recognized.
Cost of real estate sales include the acquisition cost of the land, development costs incurred to date, applicable borrowings costs (see Note 2.21) and estimated costs to complete the project, determined based on estimates made by the project engineers. Operating expenses and other costs are recognized in profit or loss upon utilization of services or receipt of goods or at the date they are incurred. Finance costs are reported on an accrual basis, except capitalized borrowing costs which are included as part of the cost of the related qualifying asset (see Note 2.21).
Contract assets pertain to rights to consideration in exchange for goods or services that the Group has transferred to a customer that is conditioned on something other than passage of time. Under its contracts with customers, the Group will receive an unconditional right to payment for the total consideration upon the completion of the development of the property sold. Any rights to consideration recognized by the Group as it develops the property are presented as Contract Assets in the consolidated statement of financial position. Contract assets are subsequently tested for impairment in the same manner as how the Group assesses impairment of its financial assets [see Note 2.5(b)]. Any consideration received by the Group in excess of the amount for which the Group is entitled is presented as Contract Liabilities in the consolidated statement of financial position. A contract liability is the Group’s obligation to transfer goods or services to a customer for which the Group has received consideration (or an amount of consideration is due) from the customer. If the transaction does not yet qualify as contract revenue under PFRS 15, the deposit method is applied until all conditions for recording the sale are met. Pending the recognition of revenue on real estate sale, consideration received from buyers are presented under the Customers’ Deposits account in the liabilities section of the consolidated statement of financial position.
2.17 Leases
The Group accounts for its leases as follows:
(a) Group as Lessee
For any new contracts entered into, the Group considers whether a contract is, or contains, a lease. A lease is defined as a contract, or part of a contract, that conveys the right to use an asset (the underlying asset) for a period of time in exchange for consideration.

- 31 -
To apply this definition, the Group assesses whether the contract meets three key evaluations which are whether: (a) the contract contains an identified asset, which is either explicitly identified in the
contract or implicitly specified by being identified at the time the asset is made available to the Group;
(b) the Group has the right to obtain substantially all of the economic benefits from
use of the identified asset throughout the period of use, considering its rights within the defined scope of the contract; and,
(c) the Group has the right to direct the use of the identified asset throughout the
period of use. The Group assess whether it has the right to direct ‘how and for what purpose’ the asset is used throughout the period of use.
At lease commencement date, the Group recognizes a right-of-use asset and a lease liability in the statement of financial position. The right-of-use asset is measured at cost, which is made up of the initial measurement of the lease liability, any initial direct costs incurred by the Group, an estimate of any costs to dismantle and remove the asset at the end of the lease, and any lease payments made in advance of the lease commencement date (net of any incentives received). Subsequently, the Group amortizes the right-of-use asset on a straight-line basis from the lease commencement date to the earlier of the end of the useful life of the right-of-use asset or the end of the lease term. The Group also assesses the right-of-use asset for impairment when such indicators exist (see Note 2.18).
On the other hand, the Group measures the lease liability at the present value of the lease payments unpaid at the commencement date, discounted using the interest rate implicit in the lease if that rate is readily available or the Group’s incremental borrowing rate. Lease payments include fixed payments (including in-substance fixed) less lease incentives receivable, if any, variable lease payments based on an index or rate, amounts expected to be payable under a residual value guarantee, and payments arising from options (either renewal or termination) reasonably certain to be exercised. Subsequent to initial measurement, the liability will be reduced for payments made and increased for interest. It is remeasured to reflect any reassessment or modification, or if there are changes in in-substance fixed payments. When the lease liability is remeasured, the corresponding adjustment is reflected in the right-of-use asset, or profit and loss if the right-of-use asset is already reduced to zero.
The Group has elected to account for short-term leases and leases of low-value assets using the practical expedients. Instead of recognizing a right-of-use asset and lease liability, the payments in relation to these are recognized as an expense in profit or loss on a straight-line basis over the lease term.
On the consolidated statement of financial position, right-of-use assets and lease liabilities have been presented as part of property and equipment and other liabilities, respectively.

- 32 -
(b) Group as Lessor
The Group determines whether an arrangement is, or contains, a lease based on the substance of the arrangement. It makes an assessment of whether the fulfillment of the arrangement is dependent on the use of a specific or identified asset or assets and the arrangement conveys a right to use the asset for a period of time in exchange for consideration. Leases wherein the Group substantially transfers to the lessee all risks and benefits incidental to ownership of the leased item are classified as finance leases and are presented as receivable at an amount equal to the Group’s net investment in the lease. Finance income is recognized based on the pattern reflecting a constant periodic rate of return on the Group’s net investment outstanding in respect of the finance lease.
Leases which do not transfer to the lessee substantially all the risks and benefits of ownership of the asset, are classified as operating leases. Lease income from operating leases is recognized in profit or loss on a straight-line basis over the lease term.
2.18 Impairment of Non-financial Assets
The Group’s Investments in Associates, Goodwill and Leasehold rights (included as part of Other Non-current Assets), Investment Properties, Property and Equipment, and other non-financial assets are subject to impairment testing. Goodwill and intangible assets with an indefinite useful life or those not yet available for use are tested for impairment at least annually. All other individual assets are tested for impairment whenever events or changes in circumstances indicate that the carrying amount may not be recoverable.
For purposes of assessing impairment, assets are grouped at the lowest levels for which there are separately identifiable cash flows (cash-generating units). As a result, assets are tested for impairment either individually or at the cash-generating unit level.
Impairment loss is recognized in profit or loss for the amount by which the asset’s or cash-generating unit’s carrying amount exceeds its recoverable amount, which is the higher of its fair value less costs-to-sell and its value in use. In determining value in use, management estimates the expected future cash flows from each cash-generating unit and determines the suitable interest rate in order to calculate the present value of those cash flows. The data used for impairment testing procedures are directly linked to the Group’s latest approved budget, adjusted as necessary to exclude the effects of asset enhancements. Discount factors are determined individually for each cash-generating unit and reflect management’s assessment of respective risk profiles, such as market and asset-specific risk factors.
Except for goodwill and intangible assets with indefinite life, all assets are subsequently reassessed for indications that an impairment loss previously recognized may no longer exist. An impairment loss is reversed if the asset’s or cash generating unit’s recoverable amount exceeds its carrying amount.

- 33 -
2.19 Share-based Employee Remuneration
The Group grants share options to qualified employees of the Group eligible under a share option plan. The services received in exchange for the grant, and the corresponding share options, are valued by reference to the fair value of the equity instruments granted at grant date. This fair value excludes the impact of non-market vesting conditions (for example profitability and sales growth targets and performance conditions), if any. The share-based remuneration is recognized as an expense in the consolidated profit or loss with a corresponding credit to retained earnings. The expense is recognized during the vesting period based on the best available estimate of the number of share options expected to vest. The estimate is subsequently revised, if necessary, such that it equals the number that ultimately vests on vesting date. No subsequent adjustment is made to expense after vesting date, even if share options are ultimately not exercised.
Share options issued by a subsidiary is accounted for as non-controlling interests at fair value at the date of grant in the consolidated statement of changes in equity. However, during the period the option is outstanding, the non-controlling interest related to the option holder should not be attributed any profit or loss of the subsidiary until the option is exercised. Meanwhile, the related share option expense is recognized in full in profit or loss. Upon exercise of share option, the proceeds received net of any directly attributable transaction costs up to the nominal value of the shares issued are allocated to capital stock with any excess being recorded as additional paid in capital (APIC). 2.20 Employee Benefits
The Group provides post-employment benefits to employees through a defined benefit plan, defined benefit contribution plans, and other employee benefits which are recognized as follows:
(a) Short-term Employee Benefits Short-term employee benefits include wages, salaries, bonuses, and non-monetary benefits provided to current employees, which are expected to be settled before twelve months after the end of the annual reporting period during which an employee services are rendered but does not include termination benefits. The undiscounted amount of the benefits expected to be paid in respect of services rendered by employees in an accounting period is recognized in the profit or loss during that period and any unsettled amount at the end of the reporting period is included as part of Trade and Other Payables account in the consolidated statement of financial position.
(b) Post-employment Defined Benefit Plan
A defined benefit plan is a post-employment plan that defines an amount of post-employment benefit that an employee will receive on retirement, usually dependent on one or more factors such as age, years of service and salary. The legal obligation for any benefits from this kind of post-employment plan remains with the Group, even if plan assets for funding the defined benefit plan have been acquired. Plan assets may include assets specifically designated to a long-term benefit fund, as well as qualifying insurance policies. The Group’s post-employment defined benefit pension plans covers all regular full-time employees. The pension plans are tax-qualified, noncontributory and administered by trustees.

- 34 -
The liability recognized in the consolidated statement of financial position for a defined benefit plan is the present value of the defined benefit obligation (DBO) at the end of the reporting period less the fair value of plan assets. The DBO is calculated annually by independent actuaries using the projected unit credit method. The present value of the DBO is determined by discounting the estimated future cash outflows for expected benefit payments using a discount rate derived from the interest rates of a zero-coupon government bonds, that are denominated in the currency in which the benefits will be paid and that have terms to maturity approximating to the terms of the related post-employment liability. The interest rates are based from the reference rates published by Bloomberg using its valuation technology, Bloomberg Valuation (BVAL). BVAL provide evaluated prices that are based on market observations from contributed sources.
Remeasurements, comprising of actuarial gains and losses arising from experience adjustments and changes in actuarial assumptions and the return on plan assets (excluding amount included in net interest) are reflected immediately in the consolidated statement of financial position with a charge or credit recognized in other comprehensive income in the period in which they arise. Net interest is calculated by applying the discount rate at the beginning of the period, unless there is a plan amendment, curtailment or settlement during the reporting period. The calculation also takes into account any changes in the net defined benefit liability or asset during the period as a result of contributions to the plan or benefit payments. Net interest is reported as part of Interest and Other Charges – net or Interest and Other Income – net in the consolidated statement of income.
Past-service costs are recognized immediately in consolidated profit or loss in the period of a plan amendment and curtailment.
(c) Post-employment Defined Contribution Plans A defined contribution plan is a post-employment plan under which the Group pays fixed contributions into an independent entity. The Group has no legal or constructive obligations to pay further contributions after payment of the fixed contribution. The contributions recognized in respect of defined contribution plans are expensed as they fall due. Liabilities or assets may be recognized if underpayment or prepayment has occurred and are included in current liabilities or current assets as they are normally of a short-term nature.
(d) Termination Benefits
Termination benefits are payable when employment is terminated by the Group before the normal retirement date, or whenever an employee accepts voluntary redundancy in exchange for these benefits. The Group recognizes termination benefits at the earlier of when it can no longer withdraw the offer of such benefits and when it recognizes costs for a restructuring that is within the scope of PAS 37 and involves the payment of termination benefits. In the case of an offer made to encourage voluntary redundancy, the termination benefits are measured based on the number of employees expected to accept the offer. Benefits falling due more than 12 months after the reporting period are discounted to their present value.

- 35 -
(e) Compensated Absences
Compensated absences are recognized for the number of paid leave days (including holiday entitlement) remaining at the end of the reporting period. They are included in the Trade and Other Payables account in the consolidated statement of financial position at the undiscounted amount that the Group expects to pay as a result of the unused entitlement.
2.21 Borrowing Costs
For financial reporting purposes, borrowing costs are recognized as expenses in the period in which they are incurred, except to the extent that they are capitalized. Borrowing costs that are directly attributable to the acquisition, construction or production of a qualifying asset (i.e., an asset that takes a substantial period of time to get ready for its intended use or sale) are capitalized as part of the cost of such asset. The capitalization of borrowing costs commences when expenditures for the asset are being incurred, borrowing costs are being incurred and activities that are necessary to prepare the asset for its intended use or sale are in progress. Capitalization ceases when substantially all such activities are complete. Investment income earned on the temporary investment of specific borrowings pending their expenditure on qualifying assets is deducted from the borrowing costs eligible for capitalization.
For income tax purposes, interest and other borrowing costs are charged to expense when incurred.
2.22 Income Taxes Tax expense recognized in consolidated profit or loss comprises the sum of current tax and deferred tax not recognized in consolidated other comprehensive income or directly in equity, if any.
Current tax assets or liabilities comprise those claims from, or obligations to, fiscal authorities relating to the current or prior reporting period, that are uncollected or unpaid at the reporting period. They are calculated using the tax rates and tax laws applicable to the fiscal periods to which they relate, based on the taxable profit for the year. All changes to current tax assets or liabilities are recognized as a component of tax expense in consolidated profit or loss.
Deferred tax is accounted for using the liability method on temporary differences at the end of the reporting period between the tax base of assets and liabilities and their carrying amounts for financial reporting purposes. Under the liability method, with certain exceptions, deferred tax liabilities are recognized for all taxable temporary differences and deferred tax assets are recognized for all deductible temporary differences and the carry forward of unused tax losses and unused tax credits to the extent that it is probable that taxable profit will be available against which the deferred income tax asset can be utilized.
Unrecognized deferred tax assets are reassessed at the end of each reporting period and are recognized to the extent that it has become probable that future taxable profit will be available to allow such deferred tax assets to be recovered.
Deferred tax assets and liabilities are measured at the tax rates that are expected to apply to the period when the asset is realized or the liability is settled provided such tax rates have been enacted or substantively enacted at the end of the reporting period.

- 36 -
The carrying amount of deferred tax assets is reviewed at the end of each reporting period and reduced to the extent that it is probable that sufficient taxable profit will be available to allow all or part of the deferred tax asset to be utilized. The measurement of deferred tax liabilities and assets reflects the tax consequences that would follow from the manner in which the Group expects, at the end of the reporting period, to recover or settle the carrying amount of its assets and liabilities. Most changes in deferred tax assets or liabilities are recognized as a component of tax expense in consolidated profit or loss, except to the extent that it relates to items recognized in consolidated other comprehensive income or directly in equity. In this case, the tax is also recognized in other comprehensive income or directly in equity, respectively.
Deferred tax assets and deferred tax liabilities are offset if the Group has a legally enforceable right to set-off current tax assets against current tax liabilities and the deferred taxes relate to the same entity and the same taxation authority.
2.23 Related Party Transactions and Relationships
Related party transactions are transfers of resources, services or obligations between the entities in the Group and their related parties, regardless whether a price is charged.
Parties are considered to be related if one party has the ability to control the other party or exercise significant influence over the other party in making financial and operating decisions. Related parties include: (a) individuals owning, directly or indirectly through one or more intermediaries, control or are controlled by, or under common control with the Group; (b) associates; (c) individuals owning, directly or indirectly, an interest in the voting power of the Group that gives them significant influence over the Group and close members of the family of any such individual; and, (d) the Group’s funded post-employment plan.
In considering each possible related party relationship, attention is directed to the substance of the relationship and not merely on the legal form. Based on the requirement of SEC Memorandum Circular 2019-10, Rules of Material Related Party Transactions of Publicly-listed Companies, transactions amounting to 10% or more of the total consolidated assets based on its latest consolidated financial statements that were entered into with related parties are considered material. All individual material related party transactions shall be approved by at least two-thirds (2/3) vote of the Parent Company’s board of directors, with at least a majority of the independent directors voting to approve the material related party transactions. In case that a majority of the independent directors’ vote is not secured, the material related party transaction may be ratified by the vote of the stockholders representing at least two-thirds of the outstanding capital stock. For aggregate related party transactions within a 12-month period that breaches the materiality threshold of 10% of the Group’s consolidated total assets based on the latest consolidated financial statements, the same board approval would be required for the transactions that meet and exceeds the materiality threshold covering the same related party.

- 37 -
2.24 Equity Capital stock is determined using the nominal value of shares that have been issued. APIC includes any premiums received on the issuance of capital stock. Any transaction costs associated with the issuance of shares are deducted from APIC, net of any related income tax benefits. Treasury shares are stated at the cost of reacquiring such shares and are deducted from equity attributable to the Parent Company’s equity holders until the shares are cancelled, reissued or disposed of. Also, this includes shares of the Parent Company held by certain subsidiaries (see Note 2.3). Revaluation reserves consist of: (a) Net fair value gains or losses recognized due to changes in fair values of financial assets
recognized through other comprehensive income; (b) Accumulated actuarial gains and losses arising from remeasurements of retirement
benefit obligation, net of tax;
(c) Cumulative share in other comprehensive income of associates attributable to the Group;
(d) Translation adjustments resulting from the translation of foreign-currency
denominated financial statements of certain foreign subsidiaries into the Group’s functional and presentation currency;
(e) The effective portion of gains and losses on hedging instruments in a cash flow hedge;
and,
(f) Changes in ownership interest in subsidiaries that do not result in a loss of control.
Retained earnings represent all current and prior period results of operations and share-based employee remuneration as reported in the consolidated statement of income, reduced by the amounts of dividends declared.
2.25 Earnings Per Share Basic earnings per share (EPS) is computed by dividing consolidated net profit attributable to equity holders of the Parent Company by the weighted average number of shares issued and outstanding, adjusted retroactively for any share dividend, share split and reverse share split during the current year, if any. Diluted EPS is computed by adjusting the weighted average number of ordinary shares outstanding to assume conversion of potential dilutive common shares (see Note 29).
2.26 Events After the End of the Reporting Period
Any post-year-end event that provides additional information about the Group’s financial position at the end of the reporting period (adjusting event) is reflected in the consolidated financial statements. Post-year-end events that are not adjusting events, if any, are disclosed when material to the consolidated financial statements.

- 38 -
3. SIGNIFICANT ACCOUNTING ESTIMATES AND JUDGMENTS The preparation of Group’s consolidated financial statements in accordance with PFRS
requires management to make judgments and estimates that affect amounts reported in the consolidated financial statements and related notes. Judgments and estimates are continually evaluated and are based on historical experience and other factors, including expectations of future events that are believed to be reasonable under the circumstances. Actual results may ultimately vary from these estimates.
3.1 Critical Management Judgments in Applying Accounting Policies
In the process of applying the Group’s accounting policies, management has made the
following judgments, apart from those involving estimation, which have the most significant effect on the amounts recognized in the consolidated financial statements.
(a) Determination of Lease Term of Contracts with Renewal and Termination Options
In determining the lease term, management considers all relevant factors and circumstances that create an economic incentive to exercise a renewal option or not exercise a termination option. Renewal options and/or periods after termination options are only included in the lease term if the lease is reasonably certain to be extended or not terminated. The lease term is reassessed if an option is actually exercised or not exercised or the Group becomes obliged to exercise or not exercise it. The assessment of reasonable certainty is only revised if a significant event or a significant change in circumstances occurs, which affects this assessment, and that is within the control of the Group. The Group determines whether any non-cancellable period or notice period in a lease would meet the definition of a contract and thus, would be included as part of the lease term. A contract would be considered to exist only when it creates rights and obligations that are enforceable.
In assessing the enforceability of a contract, the Group considers whether the lessor can refuse to agree to a request from the Group to extend the lease. In contrast, a lessor’s right to terminate a lease is ignored when determining the lease term because, in that case, the lessee has an unconditional obligation to pay for the right to use the asset for the period of the lease, unless and until the lessor decides to terminate the lease.
(b) Evaluation of Timing of Satisfaction of Performance Obligations
(i) Real Estate Sales
The Group exercises critical judgment in determining whether each performance obligation to develop properties promised in its contracts with customers is satisfied over time or at a point in time. In making this judgment, the Group considers the following:
any asset created or enhanced as the Group performs;
the ability of the customer to control such asset as it is being created or enhanced;
the timing of receipt and consumption of benefits by the customer; and,
the Group’s enforceable right for payment for performance completed to date.

- 39 -
The Group determines that its performance obligation for pre-completed real estate properties is satisfied over time, while completed real estate properties is satisfied at a point in time, since it does not have an alternative use of the specific property sold as it is precluded by its contract from redirecting the use of the property for a different purpose. Further, the Group has rights over payment for development completed to date as the Group can choose to complete the development and enforce its rights to full payment under its contracts even if the customer defaults on amortization payments.
(ii) Hotel Operations
The Group determines that its revenue from hotel accommodations shall be recognized over time. In making its judgment, the Group considers the timing of receipt and consumption of benefits provided by the Group to the customers. The Group provides the services without the need of reperformance of other entities. This demonstrates that the customers simultaneously receive and consume the benefits of the Group’s rendering of hotel services as it performs.
(iii) Food and Beverages, and Others
In determining the appropriate method to use in recognizing the Group’s revenues from food, beverage and other consumer goods, management assesses that revenue is recognized at a point in time when the control of the goods has passed to the customer, i.e. generally when the customer acknowledged delivery of goods. The service component of the restaurant operations is deemed as an insignificant cause on the timing of satisfaction of performance obligation since it is only passage of time until the customer receives and consumes all the benefits after delivery of the food and beverage items.
(iv) Forfeited Collections and Deposits
The Group determines that its revenue from forfeited collections and deposits shall be recognized at point in time in the year the contract was cancelled.
(v) Property Management Services
The Group determines that its revenue from property management services shall be recognized over time. In making its judgment, the Group considers the timing of receipt and consumption of benefits provided by the Group to the customers. The Group applies the practical expedient to recognize revenue at the amount to which it has a right to invoice, which corresponds directly to the value to the customer of the entity’s performance completed to date i.e., generally when the customer has acknowledged the Group’s right to invoice.
(c) Estimation of Collection Threshold for Revenue Recognition
The Group uses judgment in evaluating the probability of collection of contract price on real estate sales as a criterion for revenue recognition. The Group uses historical payment pattern of customers in establishing a percentage of collection threshold over which the Group determines that collection of total contract price is reasonably assured.

- 40 -
(d) Determination of ECL on Trade and Other Receivables The Group uses a provision matrix to calculate ECL for trade and other receivables. The provision rates are based on days past due for groupings of various customer segments that have similar loss patterns (i.e., by geography, product type, customer type and rating, and coverage by letters of credit and other forms of credit insurance).
The provision matrix is based on the Group’s historical observed default rates. The Group’s management intends to regularly calibrate (i.e., on an annual basis) the matrix to consider the historical credit loss experience with forward-looking information (i.e., forecast economic conditions). The Group has considered the continuing impact of COVID-19 pandemic and revised its assumptions in determining the macroeconomic variables and loss rates in the computation of ECL. Details about the ECL on the Group’s trade and other receivables are disclosed in Notes 2.5(b) and 32.3(b).
(e) Distinction Among Investment Properties and Owner-occupied Properties
The Group determines whether a property should be classified as investment property or owner-occupied property. The Group applies judgment upon initial recognition of the asset based on intention and also when there is a change in use. In making its judgment, the Group considers whether the property generates cash flows largely independently of the other assets held by an entity. Owner-occupied properties generate cash flows that are attributable not only to property but also to other assets used in the production or supply process.
Some properties comprise a portion that is held to earn rental or for capital appreciation
and another portion that is held for use in the Group’s main line of business or for administrative purposes. If these portions can be sold separately (or leased out separately under finance lease), the Group accounts for the portions separately. If the portions cannot be sold separately, the property is accounted for as investment property only if an insignificant portion is held for use in the Group’s main line of business or for administrative purposes. Judgment is applied in determining whether ancillary services are so significant that a property does not qualify as investment property. The Group considers each property separately in making its judgment.
(f) Distinction Between Inventories and Investment Properties
Inventories comprise properties that are held for sale in the ordinary course of business. Meanwhile, investment properties comprise of land and buildings which are not occupied substantially for use by, or in the operations of, the Group, nor for sale in the ordinary course of business, but are held primarily to earn rental income and capital appreciation. The Group considers management’s intention over these assets in making its judgment.
(g) Distinction Between Investments in Financial Instruments and Inventories
Being a real estate developer, the Group determines how golf and resort shares shall be
accounted for. In determining whether these shares shall be accounted for as either inventories or investments in financial instruments, the Group considers its role in the development of the club and its intent for holding these shares. The Group classifies such shares as inventories when the Group acts as the developer and its intent is to sell a developed property together with the club share.

- 41 -
(h) Presentation of Perpetual Debt Securities The Group exercises judgment in classifying its perpetual debt securities as financial liabilities or equity instruments. In making its judgment, the Group considers the terms of the securities including any restrictions on the Group’s ability to defer interest payments. Based on management’s assessment, the perpetual debt securities are classified as equity securities as the Group has the ability to defer payments of principal and interest indefinitely (see Note 28.7).
(i) Distinction Between Asset Acquisition and Business Combinations
The Parent Company acquires subsidiaries that own real estate properties. At the time of acquisition, the Parent Company considers whether the acquisition represents acquisition of a business or asset. The Parent Company accounts for an acquisition as a business combination where an integrated set of activities is acquired in addition to the property. More specifically, consideration is made with regard to the extent to which significant processes are acquired and, in particular, the extent of ancillary services provided by the Group (e.g., maintenance, cleaning, security, bookkeeping, hotel services, etc.). The significance of any process is judged with reference to the guidance in PAS 40, Investment Property, on ancillary services.
(j) Distinction Between Operating and Finance Leases (as a Lessor)
The Group has entered into various lease agreements. Critical judgment was exercised by management to distinguish each lease agreement as either an operating or finance lease by looking at the transfer or retention of significant risk and rewards of ownership of the properties covered by the agreements. Failure to make the right judgment will result in either overstatement or understatement of assets and liabilities. Based on management assessment, the Group’s lease agreements, as lessor, are classified either operating or finance leases.
(k) Consolidation of Entities in which the Group Holds 50% or Less of Voting Rights
Management considers that the Group has de facto control over investees even though it effectively holds less than 50% of the ordinary shares and voting rights in those companies when it has the ability to exercise control over these entities through voting rights held by its subsidiaries or through interlocking directors (see Note 1.1).
(l) Significant Influence on Investees Even if the Group Holds Less than 20% of Voting Rights
The Group considers that it has significant influence over investees when it has board representation which allows them to participate in the financial and operating policy decisions but has no control or joint control of those policies (see Notes 1.1 and 11).
(m) Determination on whether Lease Concessions Granted constitute a Lease Modification In line with the rental relief framework implemented by the government to support businesses and the broader economy due to the impact of COVID-19, the Group waived its right to collect rent and other charges as part of various lease concessions it granted to lessees such as lease payment holidays or lease payment reductions.

- 42 -
In making this judgment, the Group determines whether the rent concessions granted has changed the scope of the lease, or the consideration thereof, that was not part of the original terms and conditions of the lease. The Group assessed that the lease concessions it granted to lessees do not qualify as lease modifications since the terms and conditions under the corresponding lease contracts have not been modified by the waiver and therefore, is not a lease modification under PFRS 16. The rent concessions granted by the Group amounted to P2.3 billion and P2.2 billion in 2021 and 2020, respectively.
(n) Recognition of Provisions and Contingencies
Judgment is exercised by management to distinguish between provisions and contingencies. Accounting policies on recognition and disclosure of provision are discussed in Note 2.15 and disclosures on relevant provisions and contingencies are presented in Note 31.
3.2 Key Sources of Estimation Uncertainty The following are the key assumptions concerning the future, and other key sources of estimation uncertainty at the end of the reporting period, that have a significant risk of causing a material adjustment to the carrying amounts of assets and liabilities within the next reporting period: (a) Revenue Recognition for Performance Obligation Satisfied Over Time
In determining the amount of revenue to be recognized for performance obligations satisfied over time, the Group measures progress on the basis of actual costs incurred relative to the total expected costs to complete such performance obligation. Specifically, the Group estimates the total development costs with reference to the project development plan and any agreement with customers. Management regularly monitors its estimates and apply changes as necessary. A significant change in estimated total development costs would result in a significant change in the amount of revenue recognized in the year of change.
(b) Estimation of Allowance for ECL The measurement of the allowance for ECL on financial assets at amortized cost is an area that requires the use of significant assumptions about the future economic conditions and credit behavior (e.g., likelihood of customers defaulting and the resulting losses). Explanation of the inputs, assumptions and estimation used in measuring ECL is further detailed in Note 2.5(b).
(c) Determination of Net Realizable Value of Inventories
In determining the net realizable value of inventories, management takes into account the most reliable evidence available at the times the estimates are made. The future realization of the carrying amounts of real estate inventory is affected by price changes in the different market segments as well as the trends in the real estate industry. These are considered key sources of estimation uncertainty and may cause significant adjustments to the inventories within the next reporting period. In evaluating net realizable value of inventories, recent market conditions and current market prices have been considered. The carrying value of Inventories is disclosed in Note 7.

- 43 -
(d) Fair Value of Share Options
The Group estimates the fair value of the share option by applying an option valuation model, taking into account the terms and conditions on which the share options were granted. The estimates and assumptions used are presented in Note 28.6 which include, among other things, the option’s time of expiration, applicable risk-free interest rate, expected dividend yield, volatility of the Group’s share price and fair value of the Group’s common shares. Changes in these factors can affect the fair value of share options at grant date.
The fair value of share options recognized as part of Salaries and employee benefits in 2021, 2020 and 2019 is presented in Note 25.2.
(e) Fair Value Measurement of Investment Properties
Investment properties are measured using the cost model. The Group determines the fair value of properties earning rental income through discounted cash flows valuation technique. The Group uses assumptions that are mainly based on market conditions existing at each reporting period, such as: the receipt of contractual rentals; expected future market rentals; void periods; maintenance requirements; and appropriate discount rates. These valuations are regularly compared to actual market yield data and actual transactions by the Group and those reported by the market. The expected future market rentals are determined on the basis of current market rentals for similar properties in the same location and condition.
The Group determines the fair value of idle properties through appraisals by independent valuation specialists using market-based valuation approach where prices of comparable properties are adequate for specific market factors such as location and condition of the property. A significant change in these elements may affect prices and the value of the assets. The fair value of investment properties is disclosed in Notes 12 and 34.4.
(f) Estimation of Useful Lives of Investment Properties, Property and Equipment, and Leasehold Rights
The Group estimates the useful lives of investment properties, property and equipment, and leasehold rights based on the period over which the assets are expected to be available for use. The estimated useful lives of investment properties and property and equipment are reviewed periodically and are updated if expectations differ from previous estimates due to physical wear and tear, technical or commercial obsolescence and legal or other limits on the use of the assets. In addition, estimation of the useful lives of investment properties and property and equipment are based on collective assessment of industry practice, internal technical evaluation and experience with similar assets. An analysis of the movements in the carrying amount of Investment Properties, Property and Equipment, and Leasehold Rights is presented in Notes 12, 13 and 14, respectively.

- 44 -
(g) Valuation of Financial Assets at Fair Value through Other Comprehensive Income
The Group carries certain financial assets at fair value, which requires the extensive use of accounting estimates and judgment. In cases when active market quotes are not available, fair value is determined by reference to the fair value of a comparable instrument adjusted for inputs internally developed by management to consider the differences in corporate profile and historical performance of the investee. The amount of changes in fair value would differ had the Group utilized different valuation methods and assumptions. Any change in fair value of these financial assets would affect consolidated profit and loss and equity. Valuation methods used in determining the fair value of these financial assets are disclosed in Note 34.2(a).
The carrying amounts of financial asset at FVOCI and the amounts of fair value changes recognized during the years on those assets are disclosed in Note 9.
(h) Determination of Appropriate Discount Rate in Measuring Lease Liabilities
The Group measures its lease liabilities at present value of the lease payments that are not paid at the commencement date of the lease contract. The lease payments were discounted using a reasonable rate deemed by management equal to the Group’s incremental borrowing rate. In determining a reasonable discount rate, management considers the term of the leases, the underlying asset and the economic environment. Actual results, however, may vary due to changes in estimates brought about by changes in such factors.
(i) Determination of Realizable Amount of Deferred Tax Assets
The Group reviews its deferred tax assets at the end of each reporting period and reduces the carrying amount to the extent that it is no longer probable that sufficient taxable profit will be available to allow all or part of the deferred tax asset to be utilized. Management assessed that the balance of deferred tax assets recognized as at December 31, 2021 and 2020 will be utilized in the succeeding years. The carrying amount of the net deferred tax assets as at December 31, 2021 and 2020 is disclosed in Note 26.
(j) Impairment of Goodwill and Other Non-financial Assets
Goodwill is reviewed annually for impairment while other non-financial assets are tested whenever certain impairment indicators become evident. In assessing impairment, management estimates the recoverable amount of each asset or a cash-generating unit based on expected future cash flows and uses an interest rate to calculate the present value of those cash flows. Estimation uncertainties relates to assumptions about future operating results and the determination of suitable discount rate. Also, the Group’s policy on estimating the impairment of goodwill and other non-financial assets is discussed in detail in Note 2.18. Though management believes that the assumptions used in the estimation of fair values reflected in the consolidated financial statements are appropriate and reasonable, significant changes in these assumptions may materially affect the assessment of recoverable values and any resulting impairment loss could have a material adverse effect on the results of operations.

- 45 -
There were no impairment losses on the Group’s goodwill and other non-financial assets required to be recognized in 2021, 2020 and 2019 based on management’s assessment.
(k) Valuation of Retirement Obligation
The determination of the Group’s obligation and cost of post-employment defined benefit is dependent on the selection of certain assumptions used by independent actuaries in calculating such amounts. Those assumptions include, among others, discount rates and salary rate increase. A significant change in any of these actuarial assumptions may generally affect the recognized expense, other comprehensive income or losses and the carrying amount of the retirement benefit obligation in the next reporting period.
The amounts of retirement benefit obligation and expense and an analysis of the movements in the estimated present value of post-employment benefit, as well as the significant assumptions used in estimating such obligation are presented in Note 25.3.
(l) Business Combinations
On initial recognition, the assets and liabilities of the acquired business and the consideration paid for them are included in the consolidated financial statements at their acquisition date fair values. In measuring fair value, management uses estimates of future cash flows and discount rates. Any subsequent change in these estimates would affect the amount of goodwill if the change qualifies as a measurement period adjustment.
4. SEGMENT INFORMATION
4.1 Business Segments
The Group’s operating businesses are organized and managed separately according to the nature of products and services provided, with each segment representing a strategic business unit that offers different products and serves different markets. The Group is engaged in the development of residential and office units including urban centers integrating office, residential and commercial components. The Real Estate segment pertains to the development and sale of residential and office developments. The Rental segment includes leasing of office and commercial spaces. The Hotel Operations segment relates to the management of hotel business operations. The Corporate and Others segment includes business process outsourcing, educational facilities provider, maintenance and property management operations, marketing services, e-commerce, general and corporate income and expense items. Segment accounting policies are the same as the policies described in Note 2.14. The Group generally accounts for intersegment sales and transfers as if the sales or transfers were to third parties at current market prices.

- 46 -
4.2 Segment Assets and Liabilities
Segment assets are allocated based on their physical location and use or direct association with a specific segment and they include all operating assets used by a segment and consist principally of operating cash and cash equivalents, receivables, real estate inventories, property and equipment, and investment properties, net of allowances and provisions. Similar to segment assets, segment liabilities are also allocated based on their use or direct association with a specific segment. Segment liabilities include all operating liabilities and consist principally of accounts, wages, taxes currently payable and accrued liabilities. Segment assets and segment liabilities do not include deferred taxes.
4.3 Intersegment Transactions
Segment revenues, expenses and performance include sales and purchases between business segments. Such sales and purchases are eliminated in consolidation.
4.4 Analysis of Segment Information
The tables presented below and in the succeeding page present revenue and profit information regarding industry segments for the years ended December 31, 2021, 2020 and 2019 and certain asset and liability information regarding segments as at December 31, 2021 and 2020.
2021 Hotel Corporate Real Estate Rental Operations and Others Elimination Consolidated
TOTAL REVENUES Sales to external customers P 31,129,417,724 P 13,319,580,244 P 1,928,944,451 P 2,110,869,982 P - P 48,488,812,401 Interest income 1,595,744,496 505,566,953 2,009,599 1,575,221 - 2,104,896,269
Intersegment sales - 501,620,089 - 2,643,674,522 ( 3,145,294,611 ) - Total revenues 32,725,162,220 14,326,767,286 1,930,954,050 4,756,119,725 ( 3,145,294,611) 50,593,708,670
RESULTS
Cost of sales and operating expenses excluding depreciation and amortization 22,143,407,538 1,718,745,957 1,654,286,432 4,431,168,282 ( 2,589,557,191) 27,358,051,018 Interest expense 1,784,594,833 587,334,964 - 28,965,294 - 2,400,895,091 Depreciation and amortization 305,468,041 2,815,266,472 148,945,316 198,245,202 - 3,467,925,031 24,233,470,413 5,121,347,393 1,803,231,748 4,658,378,778 ( 2,589,557,191) 33,226,871,140 Segment results P 8,491,691,807 P 9,205,419,894 P 127,722,302 P 97,740,947 (P 555,737,420) P 17,366,837,530
Unallocated other income 160,663,430 Unallocated other expenses ( 2,407,642,233) Equity in net earnings of associates ( 176,548,383 ) Tax expense ( 564,917,329 )
Net profit P 14,378,393,015
ASSETS AND LIABILITIES Segment assets P 246,748,867,643 P 127,778,100,601 P 4,800,909,509 P 10,810,311,371 P - P 390,138,189,125 Investments in and advances to associates and other related parties - net - - - 7,839,061,983 - 7,839,061,983
Total assets P 246,748,867,643 P 127,778,100,601 P 4,800,909,509 P18,649,373,355 P - P 397,977,251,108
Segment liabilities P 110,574,147,992 P47,869,814,875 P 1,185,567,816 P 8,643,729,477 P - P 168,273,260,161
OTHER SEGMENT INFORMATION
Project and capital expenditures P 38,150,906,263

- 47 -
2020 Hotel Corporate Real Estate Rental Operations and Others Elimination Consolidated
TOTAL REVENUES Sales to external customers P 24,858,537,303 P 12,932,770,278 P 1,482,160,976 P 1,466,834,056 P - P 40,740,302,613 Interest income 1,400,701,643 599,253,561 2,646,996 1,184,963 - 2,003,787,163
Intersegment sales - 467,049,014 - 2,294,445,202 ( 2,761,494,216 ) - Total revenues 26,259,238,946 13,999,072,853 1,484,807,972 3,762,464,221 ( 2,761,494,216 ) 42,744,089,776
RESULTS
Cost of sales and operating expenses excluding depreciation and amortization 19,252,024,183 1,745,331,616 1,438,867,811 3,669,211,000 ( 2,606,206,509) 23,499,228,101 Interest expense 1,401,027,748 451,200,603 - 58,857,029 - 1,911,085,380 Depreciation and amortization 306,863,866 2,485,169,230 133,495,376 179,132,761 - 3,104,661,233 20,959,915,797 4,681,701,449 1,572,363,187 3,907,200,790 ( 2,606,206,509) 28,514,974,714 Segment results P 5,299,323,149 P 9,317,371,404 (P 87,555,215) (P 144,736,569) (P 155,287,707) P 14,229,115,062
Unallocated other income 796,788,076 Unallocated other expenses ( 1,019,551,914) Equity in net earnings of associates ( 69,879,672 ) Tax expense ( 3,347,906,258 )
Net profit P 10,588,565,294
ASSETS AND LIABILITIES Segment assets P 235,599,151,575 P114,390,474,604 P 5,117,468,238 P 12,913,055,054 P - P 368,020,149,471 Investments in and advances to associates and other related parties - net - - - 7,670,270,474 - 7,670,270,474
Total assets P 235,599,151,575 P114,390,474,604 P 5,117,468,238 P 20,583,325,528 P - P 375,690,419,945
Segment liabilities P 113,607,944,849 P 41,276,479,486 P 1,114,130,648 P 7,161,384,765 P - P 163,159,939,748
OTHER SEGMENT INFORMATION
Project and capital expenditures P 27,907,230,441
2019 Hotel Corporate Real Estate Rental Operations and Others Elimination Consolidated
TOTAL REVENUES Sales to external customers P 42,603,984,572 P 16,814,091,846 P 2,543,769,508 P 1,889,033,843 P - P 63,850,879,769 Interest income 1,789,992,697 532,557,186 4,213,073 2,050,744 - 2,328,813,700
Intersegment sales - 497,191,017 - 2,773,501,898 ( 3,270,692,915 ) - Total revenues 44,393,977,269 17,843,840,049 2,547,982,581 4,664,586,485 ( 3,270,692,915 ) 66,179,693,469
RESULTS
Cost of sales and operating expenses excluding depreciation and amortization 30,747,680,397 1,952,200,282 1,905,111,557 4,464,159,187 ( 3,114,329,696) 35,954,821,727 Interest expense 1,524,194,888 420,528,292 - 63,111,421 - 2,007,834,601 Depreciation and amortization 188,556,394 2,236,868,294 106,992,256 186,216,845 - 2,718,633,789 32,460,431,679 4,609,596,868 2,012,103,813 4,713,487,453 ( 3,114,329,696) 40,681,290,117 Segment results P 11,933,545,590 P13,234,243,181 P 535,878,768 (P 48,900,968) (P 156,363,219) P 25,498,403,352
Unallocated other income 1,191,878,718 Unallocated other expenses ( 1,253,763,397) Equity in net earnings of associates ( 58,832,233 ) Tax expense ( 6,081,657,290 )
Net profit P 19,296,029,150
ASSETS AND LIABILITIES Segment assets P 226,831,920,357 P 102,878,993,500 P 5,385,458,355 P 7,023,188,130 P - P 342,119,560,342 Investments in and advances to associates and other related parties - net - - - 7,513,514,402 - 7,513,514,402
Total assets P 226,831,920,357 P 102,878,993,500 P 5,385,458,355 P 14,536,702,532 P - P 349,633,074,744
Segment liabilities P 102,921,026,112 P 33,672,147,628 P 1,331,766,296 P 6,842,612,203 P - P 144,767,552,239
OTHER SEGMENT INFORMATION
Project and capital expenditures P 48,224,935,584

- 48 -
5. CASH AND CASH EQUIVALENTS
Cash and cash equivalents include the following components as of December 31:
2021 2020 Cash on hand and in banks P 10,751,423,572 P 7,042,548,724
Short-term placements 33,043,182,347 33,124,207,184
P 43,794,605,919 P 40,166,755,908 Cash in banks generally earn interest based on daily bank deposit rates. Short-term placements are made for varying periods between 30 to 60 days and earn effective interest ranging from 0.05% to 4.50% in 2021, 0.10% to 4.00% in 2020, and 1.00% to 4.88% in 2019 (see Note 23).
6. TRADE AND OTHER RECEIVABLES
This account is composed of the following: Notes 2021 2020 Current: Trade 15.3(g), 27.1 P25,298,080,162 P 23,502,944,474 Allowance for impairment ( 761,550,836) ( 839,881,663) 24,536,529,326 22,663,062,811
Advances to associates
and other related parties 27.2 4,551,587,462 4,227,173,772 Others 27.4 5,394,539,719 4,685,900,589 34,482,656,507 31,576,137,172
Non-current: Trade 15.3(g) 7,878,577,198 7,777,378,604 Allowance for impairment ( 12,224,936) ( 12,224,936 ) 7,866,352,262 7,765,153,668 Others 27.1 4,623,646,313 4,496,062,710 12,489,998,575 12,261,216,378 P46,972,655,082 P 43,837,353,550 Trade receivables mainly pertain to receivables from real estate sales and rental transactions.

- 49 -
The installment period of sales contracts averages one to five years. Noninterest-bearing trade receivables from real estate sales with maturity of more than one year after the end of the reporting period are remeasured at amortized cost using the effective interest rate of similar financial instruments. Interest income recognized amounted to P641.6 million, P408.3 million and P697.2 million in 2021, 2020 and 2019, respectively. These amounts are presented as part of Interest income from trade receivables under Interest and Other Income – net account in the consolidated statements of income (see Note 23).
In 2020, the Group provided reliefs under R.A. No. 11469, Bayanihan to Heal as One Act (Bayanihan 1 Act) and R.A. 11494, Bayanihan to Recover as One Act (Bayanihan 2 Act), which offered financial reliefs to its customers and counterparties as a response to the effect of the COVID-19 pandemic. These relief measures included the extension of payment terms without incurring interest on interests, penalties, fees, or other charges.
Based on the management’s assessment, the modifications in the timing of contractual cash flows as a result of the above reliefs are not substantial and, therefore, do not result in the impairment of trade and other receivables and contract assets. Other current receivables also include accrued interest.
Others include finance lease receivables arising from sublease transaction entered by the Group [see Note 31.1(b)]. As of December 31, 2021 and 2020, the current portion of the finance lease receivables amounted to P49.7 million and P52.6 million, respectively, while non-current portion amounted to P523.3 million and P540.6 million, respectively. Other current receivables also include accrued interest.
All trade receivables are subject to credit risk exposure. However, the Group does not identify specific concentrations of credit risk with regard to trade receivables from real estate sales as the amounts recognized consist of a large number of receivables from various customers. The Group considers the market value of properties sold held as collateral in assessing the expected credit loss on trade receivables and contract assets from real estate sales [see Note 32.3(b)].
A reconciliation of the allowance for impairment losses on trade receivables at the beginning and end of 2021 and 2020 is shown below.
Current Non-current Total December 31, 2021: Balance at beginning of year P 839,881,663 P 12,224,936 P 852,106,599 Reversal of impairment ( 77,349,260 ) - ( 77,349,260 ) Write off ( 981,567 ) - ( 981,567 )
Balance at end of year P 761,550,836 P 12,224,936 P 773,775,772
December 31, 2020: Balance at beginning of year P 718,476,454 P 12,224,936 P 730,701,390 Impairment losses 121,405,209 - 121,405,209 Balance at end of year P 839,881,663 P 12,224,936 P 852,106,599

- 50 -
Certain past due rent receivables presented as part of Trade receivables were found to be impaired using the provisional matrix as determined by management; hence, credit loss of P121.4 million was recognized in 2020 (see Note 24). In 2021, based on management’s reassessment, the Group reversed a portion of allowance for impairment amounting to P77.1 million. The resulting gain on reversal is presented as part of Miscellaneous – net under Interest and Other Income – net account in the consolidated statements of income (see Note 23).
7. INVENTORIES
The composition of this account as at December 31 is shown below.
2021 2020
Residential and condominium units P 87,357,060,915 P 82,285,326,268 Property development costs 12,770,169,977 8,746,972,339 Raw land inventory 12,718,498,816 12,151,377,975 Golf and resort shares 2,895,779,113 2,951,286,629 P115,741,508,821 P106,134,963,211
Residential and condominium units mainly pertain to the accumulated costs incurred in developing the Group’s horizontal and condominium projects and certain integrated-tourism projects. Property development costs pertain to accumulated costs incurred for properties undergoing development. The relative cost of a unit sold under development is charged to cost of sales in the same manner as revenue is recognized. The relative costs of units completed prior to sale are reclassified to Residential and condominium units. Raw land inventory pertains to properties which the Group intends to develop into residential properties to be held for sale.
Golf and resort shares pertain to proprietary or membership shares (landowner resort shares and founders shares) that are of various types and costs. The cost of the landowner resort shares is based on the acquisition and development costs of the land and the project. The cost of the founders shares is based on the par value of the resort shares which is P100 per share. Borrowing costs capitalized as part of inventories amounted to P655.0 million and P793.7 million in 2021 and 2020, respectively, which represent the interest costs incurred on the general and specific borrowings obtained by the Group to fund its construction projects (see Notes 15 and 16). None of the Group’s inventories are used as collateral for its interest-bearing loans and borrowings. Based on management’s assessment, no allowance for inventory write-down is required to be recognized in 2021, 2020 and 2019; hence, inventories are recorded at cost as at December 31, 2021 and 2020.

- 51 -
8. PREPAYMENTS AND OTHER CURRENT ASSETS
The composition of this account is shown below. Note 2021 2020 Input VAT P 3,472,235,583 P 3,548,681,253 Creditable withholding taxes 2,654,752,614 1,150,713,335 Deferred commission 20.3 1,552,396,393 1,805,210,470 Prepaid rent and other prepayments 1,371,970,679 1,056,369,780 Deposits 175,938,357 57,285,237 Others 384,684,730 252,953,167 P 9,611,978,356 P 7,871,213,242
Others include supplies and food and beverage inventories.
9. FINANCIAL ASSETS AT FAIR VALUE THROUGH OTHER COMPREHENSIVE INCOME
As of December 31, financial assets at FVOCI is composed of the following:
Note 2021 2020 Equity securities: Quoted P 3,098,501,606 P 1,902,709,257 Unquoted 2,661,866,841 2,272,177,173
27.4 P 5,760,368,447 P 4,174,886,430 The Group’s securities are investments from local entities.
The reconciliation of the carrying amount of financial assets at FVOCI is as follows:
2021 2020
Balance at beginning of year P 4,174,886,430 P 4,498,219,487 Additions 238,089,875 - Fair value gains (losses) 1,281,339,596 ( 323,225,082 ) Foreign currency gains (losses) 66,052,546 ( 107,975 ) Balance at end of year P 5,760,368,447 P 4,174,886,430
The quoted equity securities pertain to investments in publicly-listed holding and service companies with fair values determined directly by reference to published prices in the PSE.
Other information about the fair value measurement and disclosures related to the investments in financial assets are presented in Note 34.2.

- 52 -
In 2021, 2020 and 2019, the Group received cash dividends amounting to P24.5 million, P8.2 million and P8.5 million, respectively. The amount of dividends received is presented as Dividend income under Interest and Other Income – net account in the consolidated statements of income (see Note 23).
10. ADVANCES TO/FROM LANDOWNERS AND JOINT OPERATORS
10.1 Advances to Landowners and Joint Operators The Group enters into numerous joint arrangements for the joint development of various projects. These are treated as jointly-controlled operations. The joint arrangements stipulate that the Group’s co-operator shall contribute parcels of land while the Group shall be responsible for the planning, conceptualization, design, demolition of existing improvements, construction, financing and marketing of residential and condominium units to be constructed on the properties. In addition, there were no separate entities created by these joint arrangements. Costs incurred by the Group on these projects are recorded under the Inventories account in the consolidated statements of financial position (see Note 2.7). The Group also grants noninterest-bearing, secured cash advances to a number of landowners and joint ventures under agreements they entered into with the landowners covering the development of certain parcels of land. Under the terms of the arrangements, the Group, in addition to providing specified portion of total project development costs, also commits to advance mutually agreed-upon amounts to the landowners to be used for pre-development expenses such as the relocation of existing occupants. The total amount of advances made by the Group less repayments, is presented as part of the Advances to Landowners and Joint Operators account in the consolidated statements of financial position.
As at December 31, 2021 and 2020, management has assessed that the advances to joint ventures are fully recoverable. Further, there has been no outstanding commitment for cash advances under the joint agreements.
The net commitment for construction expenditures amounts to:
2021 2020
Total commitment for construction expenditures P 43,260,563,281 P 34,237,388,185 Total expenditures incurred ( 28,723,107,507) ( 24,563,557,032 )
Net commitment P 14,537,455,774 P 9,673,831,153
The Group’s interests in jointly-controlled operations and projects range from 57% to 90% in both 2021 and 2020. The listing of the Group’s jointly-controlled projects are as follows:
Parent Company:
McKinley Hill
McKinley West
Newport City
Manhattan Garden City

- 53 -
Parent Company (continued):
Noble Place
Uptown Bonifacio
Northill Gateway
The Maple Grove
Vion Tower GERI:
Alabang West
Caliraya Spring
Forest Hills
Kingsborough
Monte Cielo de Peñafrancia
Mountain Meadows
Pahara at Southwoods
Sta. Barbara Heights Phase 2 & 3
Holland Park
Sta. Barbara Heights Shophouse District EELHI:
Pioneer Woodlands
San Lorenzo Place
Various Metro Manila and Calabarzon Projects
SPI:
Capitol Plaza
Governor’s Hills
Mandara
Sta. Rosa Heights
Sta. Rosa Hills
Sentosa
Asmara
88 Gibraltar
One Lakeshore
Two Lakeshore
Riva Bella
Solana
Gentri Heights
Fountain Grove
Palm City
The Mist Residence
The aggregate amounts of the current assets, long-term assets, current liabilities, long-term liabilities as at December 31, 2021 and 2020, and income and expenses for each of the three years in the period ended December 31, 2021 related to the Group’s interests in joint arrangements are not presented or disclosed in the consolidated financial statements as the joint arrangements in which the Group is involved are not joint ventures (see Note 2.3).

- 54 -
As at December 31, 2021 and 2020, the Group either has no other contingent liabilities with regard to these joint operations or has assessed that the probability of loss that may arise from contingent liabilities is remote. 10.2 Advances from Joint Operators This account represents the share of joint venture partners in the proceeds from the sale of certain projects in accordance with various joint arrangements entered into by the Group.
The advances from golf share partners and lot owners recognized in 2021 and 2020 amounted to P333.2 million and P277.2 million is presented as part of Advances from Associates and Other Related Parties account in the consolidated statements of financial position (see Note 27.3).
11. INVESTMENTS IN ASSOCIATES
11.1 Breakdown of Carrying Values
The details of investments in associates, accounted for using the equity method, are as follows:
2021 2020
Acquisition costs: SHDI P 2,619,800,008 P 2,619,800,008 NPI 734,396,528 734,396,528 BWDC 199,212,026 199,212,026 PTHDC 64,665,000 64,665,000 3,618,073,562 3,618,073,562
Accumulated equity in
net losses: Balance at beginning of year ( 223,171,574 ) ( 153,291,902) Equity share in net losses of associates for the year ( 176,548,383) ( 69,879,672)
Balance at end of year ( 399,719,957) ( 223,171,574 )
Accumulated equity in other comprehensive income:
Balance at beginning of year 48,194,714 46,720,176 Share in other comprehensive income of associates 20,926,197 1,474,538 Balance at end of year 69,120,911 48,194,714
P 3,287,474,516 P 3,443,096,702

- 55 -
The shares of stock of SHDI are listed in the PSE. The fair values of all other investments in associates are not available as at December 31, 2021 and 2020. The related book values of the Group’s holdings in all of the associates exceed or approximate their carrying values; hence, management deemed that the recognition of impairment loss is not necessary.
a. Investment in SHDI
In October 2019, the Parent Company acquired additional 115.0 million shares of SHDI at market price, totaling P100.1 million. Subsequently, the Group disposed of a certain number of shares. In December 2019, the Company subscribed to additional 2,177 million shares from SHDI at P1.00 par value. The Company paid P1.25 billion out of the P2.20 billion additional subscribed capital, the unpaid portion is presented as Subscription payable under Other Current Liabilities account in the consolidated statements of financial position (see Note 19). However, another investor subscribed to more new shares and, as a result, the Company’s effective ownership was diluted to 34% and dilution gain amounting to P152.3 million was recognized and presented under Interest and Other Income – Net in the 2019 consolidated statement of income (see Note 23). There was no similar transaction in 2021 and 2020.
b. Investment in BNHGI
In 2019, FEPI sold 15% ownership interest over BNHGI for P297.5 million. Gain on sale of investment in an associate amounting to P188.5 million was recognized in 2019 and is presented under Interest and Other Income – net account in the 2019 consolidated statement of income (see Note 23). There was no similar transaction in 2021 and 2020.
11.2 Summarized Financial Information
The aggregated amounts of assets, liabilities, equity, revenues, net profit (loss), other comprehensive income (loss) of the associates are as follows:
Current Non-current Current Non-current Assets Assets Liabilities Liabilities Equity December 31, 2021 SHDI P 6,828,835,591 P 23,851,491,561 P 7,459,884,544 P 15,336,700,444 P 7,883,742,164 NPI 255,482,161 5,411,008,680 1,317,011,624 - 4,349,479,217 BWDC 941,814,221 1,664,189,610 882,306,335 31,659,593 1,723,697,496 PTHDC 1,134,958,743 146,281 1,010,048,029 - 125,056,995 P 9,161,090,716 P 30,926,836,132 P 10,669,250,532 P 15,368,360,037 P 14,081,975,872 December 31, 2020 SHDI P 5,934,435,559 P 16,559,530,064 P 350,878,800 P 13,816,020,878 P 8,327,065,945 NPI 255,482,161 5,411,008,680 1,317,011,624 - 4,349,479,217 BWDC 941,814,221 1,664,189,610 882,306,335 31,659,593 1,692,037,903 PTHDC 1,134,958,743 146,281 1,010,048,029 - 125,056,995 P 8,069,689,964 P 23,849,455,865 P 3,551,540,850 P 13,857,818,140 P 14,493,640,060
Other Comprehensive Revenues Net Loss Income 2021 SHDI P 358,988 (P 504,878,084) 61,547,638 NPI - - - BWDC 75,876,205 ( 10,380,773) - PTHDC 1,354 ( 258,146) - P 76,236,547 ( P 515,517,003) P 61,547,638

- 56 -
Other Comprehensive Revenues Net Profit (Loss) Income (Loss)
2020 SHDI P 15,197,042 ( P 211,545,268) P 4,336,876 NPI - - - BWDC 66,586,695 5,048,071 - PTHDC 4,633 ( 704,866) - P 81,788,370 ( P 207,202,063) P 4,336,876
2019 SHDI P 582,956,270 (P 314,779,735) ( P 9,235,871) NPI 8,725 ( 726,177) - BWDC 165,496,452 104,863,479 - PTHDC 12,790 ( 461,651) - P 748,474,237 (P 211,104,084) ( P 9,235,871)
12. INVESTMENT PROPERTIES
The gross carrying amounts and accumulated depreciation of investment properties at the beginning and end of 2021 and 2020 are shown below.
Land Buildings Total December 31, 2021 Cost P 27,587,597,724 P 109,340,437,817 P 136,928,035,541 Accumulated depreciation - ( 17,705,786,594 ) ( 17,705,786,594 ) Net carrying amount P 27,587,597,724 P 91,634,651,223 P 119,222,248,947 December 31, 2020 Cost P 27,000,062,823 P 102,872,946,728 P 129,873,009,551 Accumulated depreciation - ( 14,890,520,122 ) ( 14,890,520,122 ) Net carrying amount P 27,000,062,823 P 87,982,426,606 P 114,982,489,429 January 1, 2020 Cost P 26,838,600,559 P 96,457,689,526 P 123,296,290,085 Accumulated depreciation - ( 12,405,350,892 ) ( 12,405,350,892 ) Net carrying amount P 26,838,600,559 P 84,052,338,634 P 110,890,939,193
A reconciliation of the carrying amounts at the beginning and end of 2021, 2020 and 2019 of investment properties is shown below.
Land Buildings Total
Balance at January 1, 2021, net of accumulated depreciation P 27,000,062,823 P 87,982,426,606 P 114,982,489,429 Additions 587,935,371 6,467,491,089 7,055,426,460 Disposal ( 400,470) - ( 400,470 ) Depreciation charges for the year - ( 2,815,266,472) ( 2,815,266,472 ) Balance at December 31, 2021, net of accumulated depreciation P 27,587,597,724 P 91,634,651,223 P 119,222,248,947

- 57 -
Land Buildings Total Balance at January 1, 2020, net of accumulated depreciation P 26,838,600,559 P 84,052,338,634 P 110,890,939,193 Transfer to property and equipment - ( 169,332,500) ( 169,332,500 ) Transfer from inventories 34,421 14,402,577 14,436,998 Additions 161,427,843 6,570,187,125 6,731,614,968 Depreciation charges for the year - ( 2,485,169,230) ( 2,485,169,230 ) Balance at December 31, 2020, net of accumulated depreciation P 27,000,062,823 P 87,982,426,606 P 114,982,489,429 Balance at January 1, 2019, net of accumulated depreciation P 26,538,840,239 P 76,583,233,293 P 103,122,073,532 Transfer to property and equipment - ( 400,488,452 ) ( 400,488,452 ) Additions 300,047,161 10,090,544,279 10,390,591,440 Disposals ( 286,841 ) ( 1,056,210 ) ( 1,343,051 ) Depreciation charges for the year - ( 2,219,894,276 ) ( 2,219,894,276 ) Balance at December 31, 2019, net of accumulated depreciation P 26,838,600,559 P 84,052,338,634 P110,890,939,193
Rental income earned from these properties amounted to P13.3 billion, P12.9 billion and P16.8 billion in 2021, 2020 and 2019, respectively, and is shown as Rental Income in the consolidated statements of income. The direct operating costs, exclusive of depreciation incurred by the Group relating to these investment properties amounted to P802.7. million in 2021, P882.7 million in 2020 and P737.2 million in 2019. On the other hand, the direct operating costs, which mostly pertain to real property taxes, of investment properties that did not generate rental income in 2021, 2020 and 2019 amounted to P29.6 million, P37.2 million and P34.7 million, respectively. The operating lease commitments of the Group as a lessor are fully disclosed in Note 31.1.
In 2019, changes were made on use of certain properties from being held for lease to being used for hotel operations. As a result, the Group occupied the property and the carrying amount of P400.5 million were reclassified from Investment Properties to Property and Equipment (see Note 13). In 2020, the Group reclassified investment properties with a carrying amount of P169.3 million to property and equipment as such properties are used for operations (see Note 13). The Group has also reclassified inventories with a carrying amount of P14.4 million to investment properties as such properties are held to earn rentals (see Note 7). In 2021, the Group sold certain parcels of land with a total carrying value of P0.4 million for a total consideration of P136.6 million to a related party under common ownership (see Note 27.9). The related gain on disposal amounting to P136.2 million is presented as Gain on sale of properties under Interest and Other Income – net in the 2021 consolidated statement of income (see Note 23). In 2019, the Group sold certain land and building and improvements with a total carrying value of P1.3 million for a total consideration of P47.1 million. The related gain on disposal amounting to P45.8 million is presented as Gain on sale of properties under Interest and Other Income – net in the 2019 consolidated statement of income (see Note 23).

- 58 -
Borrowing costs that are capitalized as part of investment properties amounted to P1,607.2 million and P1,846.7 million in 2021 and 2020, respectively, which represent the interest costs incurred on the general and specific borrowings obtained by the Group to fund their construction projects (see Notes 15 and 16).
Depreciation of investment properties is presented as part of Depreciation and amortization under Operating Expenses account in the consolidated statements of income (see Note 22).
The fair market values of the properties that generated rental income in 2021 and 2020 are P464.5 billion and P437.9 billion as at December 31, 2021 and 2020, respectively, while the fair market value of idle land as of December 31, 2021 and 2020 is P55.5 billion and P53.8 billion, respectively. Other information about the fair value measurement and disclosures related to the investment properties are presented in Note 34.4. As of December 31, 2021 and 2020, the Group does not have any contractual commitments for acquisition of investment properties. None of the Group’s investment properties are used as collateral for its interest-bearing loans and borrowings.
13. PROPERTY AND EQUIPMENT
The gross carrying amounts and accumulated depreciation and amortization of property and equipment at the beginning and end of 2021 and 2020 are shown below.
Office Furniture, Buildings & Fixtures and Office Transportation Right-of-use Improvements Equipment Improvements Equipment Land Assets Total December 31, 2021 Cost P 7,382,669,895 P 1,772,495,392 P 465,326,962 P 576,330,596 P 245,672,573 P 286,374,169 P 10,728,869,587 Accumulated depreciation and amortization ( 1,830,502,734 ) ( 1,404,967,191) ( 358,856,827) ( 529,501,166) - ( 74,153,873) ( 4,197,981,791)
Net carrying amount P 5,552,167,161 P 367,528,201 P 106,470,135 P 46,829,430 P 245,672,573 P 212,220,296 P 6,530,887,796 December 31, 2020 Cost P 7,071,037,859 P 1,700,048,652 P 432,875,962 P 562,606,119 P 245,672,573 P 310,518,800 P 10,322,759,965 Accumulated depreciation and amortization ( 1,509,924,901 ) ( 1,238,333,340) ( 310,435,212) ( 485,892,991) - ( 58,573,516) ( 3,603,159,960)
Net carrying amount P 5,561,112,958 P 461,715,312 P 122,440,750 P 76,713,128 P 245,672,573 P 251,945,284 P 6,719,600,005 January 1, 2020 Cost P 6,687,643,357 P 1,571,660,277 P 390,225,553 P 522,789,975 P 245,672,573 P 274,892,443 P 9,692,884,178 Accumulated depreciation and amortization ( 1,234,320,268 ) ( 1,049,205,240) ( 267,383,440) ( 422,750,209) - ( 16,974,018) ( 2,990,633,175)
Net carrying amount P 5,453,323,089 P 522,455,037 P 122,842,113 P 100,039,766 P 245,672,573 P 257,918,425 P 6,702,251,003
A reconciliation of the carrying amounts at the beginning and end of 2021, 2020 and 2019, of property and equipment is shown below and in the succeeding page.
Office Furniture, Buildings & Fixtures and Office Transportation Right-of-use Improvements Equipment Improvements Equipment Land Assets Total Balance at January 1, 2021, net of accumulated depreciation and amortization P 5,561,112,958 P 461,715,312 P 122,440,750 P 76,713,128 P 245,672,573 P 251,945,284 P 6,719,600,005 Additions 311,632,036 153,516,424 32,451,000 21,499,502 - 3,560,977 522,659,939 Derecognition - ( 47,388,166) - - - ( 14,776,324) ( 62,164,490 ) Disposals - ( 2,551,136) - ( 963,179) - - ( 3,514,315 ) Depreciation charges for the year ( 320,577,833) ( 197,764,233) ( 48,421,615) ( 50,420,021) - ( 28,509,641) ( 645,693,343 ) Balance at December 31, 2021, net of accumulated depreciation P 5,552,167,161 P 367,528,201 P 106,470,135 P 46,829,430 P 245,672,573 P 212,220,296 P 6,530,887,796

- 59 -
Office Furniture, Buildings & Fixtures and Office Transportation Right-of-use Improvements Equipment Improvements Equipment Land Assets Total Balance at January 1, 2020, net of accumulated depreciation and amortization P 5,453,323,089 P 522,455,037 P 122,842,113 P 100,039,766 P 245,672,573 P 257,918,425 P 6,702,251,003 Additions 214,062,002 133,827,341 42,650,409 40,169,319 - 35,626,357 466,335,428 Transfer from investment properties 169,332,500 - - - - - 169,332,500 Disposals - ( 5,438,966 ) - ( 353,175) - - ( 5,792,141 ) Depreciation charges for the year ( 275,604,633) ( 189,128,100 ) ( 43,051,772) ( 63,142,782) - ( 41,599,498) ( 612,526,785 ) Balance at December 31, 2020, net of accumulated depreciation P 5,561,112,958 P 461,715,312 P 122,440,750 P 76,713,128 P 245,672,573 P 251,945,284 P 6,719,600,005 Balance at January 1, 2019, net of accumulated depreciation and amortization 5,167,324,452 537,596,155 118,314,647 101,144,746 245,672,573 399,145,961 6,569,198,534 Transfer from investment properties 400,488,452 - - - - - 400,488,452 Additions 51,483,517 163,734,664 46,805,568 88,093,093 - 194,882,491 544,999,333 Derecognition - - - - - ( 319,136,009 ) ( 319,136,009 ) Disposals - ( 733,402 ) - ( 791,609) - - ( 1,525,011 ) Depreciation charges for the year ( 165,973,332) ( 178,142,380 ) ( 42,278,102) ( 88,406,464) - ( 16,974,018) ( 491,774,296 ) Balance at December 31, 2019, net of accumulated depreciation P 5,453,323,089 P 522,455,037 P 122,842,113 P 100,039,766 P 245,672,573 P 257,918,425 P 6,702,251,003
Depreciation and amortization of property and equipment is presented as part of Depreciation and amortization under Operating Expenses account in the consolidated statements of income (see Note 22). The table below describes the nature of the Group’s leasing activities by type of right-of-use asset recognized in the statement of financial position. Number of Number of Number of Range of Average leases with leases with right-of-use remaining remaining extension termination assets leased term lease term options options 2021 Offices 4 1 – 12 years 7 years 2 1 Commercial lot 3 1 – 26 years 14 years 2 1
2020 Offices 5 2 – 13 years 7 years 3 1 Commercial lot 3 1 – 27 years 14 years 2 1
The breakdown of the Group’s right-of-use assets as at December 31, 2021 and 2020 and the movements during the years are shown below.
Commercial Offices Lot Total Balance at January 1, 2021 P 28,163,734 P 223,781,550 P 251,945,284 Additions 3,560,977 - 3,560,977 Derecognition ( 14,776,324 ) - ( 14,776,324 ) Depreciation and amortization ( 5,447,040 ) ( 23,062,601 ) ( 28,509,641 ) Balance at December 31, 2021 P 11,501,347 P 200,718,949 P 212,220,296

- 60 -
Commercial Offices Lot Total Balance at January 1, 2020 P 11,074,273 P 246,844,152 P 257,918,425 Additions 35,626,357 - 35,626,357 Depreciation and amortization ( 18,536,896 ) ( 23,062,602 ) ( 41,599,498 ) Balance at December 31, 2020 P 28,163,734 P 223,781,550 P 251,945,284
As of December 31, 2021 and 2020, the Group does not have any contractual commitments for acquisition of property and equipment. None of the Group’s property and equipment are used as collateral for its interest-bearing loans and borrowings.
14. OTHER NON-CURRENT ASSETS This account consists of:
Note 2021 2020 Deferred commission 20.3 P 2,022,525,348 P 1,554,862,853 Goodwill 1,385,124,597 1,385,124,597 Guarantee and other deposits 877,329,410 1,186,605,535 Leasehold rights – net 90,547,817 97,513,034 Deposit for cancellation of perpetual securities - 1,200,900,000 Miscellaneous 205,005,800 170,147,303
P 4,580,532,972 P5,595,153,322
Goodwill primarily relates to growth expectations arising from operational efficiencies that will be achieved by combining the resources, skills and expertise of the Company and its subsidiaries. Significant portion of the total goodwill is allocated to GERI, MLI, and STLI amounting to P947.1 million, P255.1 million and P94.9 million respectively. The remaining P88.0 million is allocated to other subsidiaries.
The recoverable amounts of the cash generating units assigned to GERI, MLI and STLI are P57.2 billion, P473.2 million and P4.6 billion, respectively, at end of 2021 and P46.5 billion, P349.4 million and P2.6 billion, respectively, at end of 2020. These were computed using cash flows projections covering a five-year period and extrapolating cash flows using a conservative steady growth rate for both GERI, MLI and STLI of 3.6%. The aggregate recoverable amounts of the cash generating units assigned to other subsidiaries is P93.3 million and P122.0 million in 2021 and 2020, respectively, while the average growth rate used in extrapolating cash flows covering five-year projections is 5%. The average discount rates applied in determining the present value of future cash flows is 7.3% in 2021 and 7.1% in 2020.

- 61 -
The discount rates and growth rates are the key assumptions used by management in determining the recoverable amount of the cash generating units. Based on management’s analysis, no impairment is required to be recognized on goodwill. Management has also determined that a reasonably possible change in these key assumptions would not cause the carrying value of the cash generating units to exceed their respective value in use.
Goodwill is subject to annual impairment testing while leasehold rights is subject to testing whenever there is an indication of impairment. No impairment losses were recognized in 2021, 2020 and 2019 as the recoverable amounts of the intangible assets determined by management are higher than their carrying values. On December 23, 2020, a wholly-owned subsidiary advanced an amount of P1,200.9 million for the purchase of the Parent Company’s perpetual securities. As the securities are under the trusteeship of a third party, the amount was presented as Deposit for cancellation of perpetual securities. In 2021, the perpetual securities were redeemed in full (see Note 28.7). Leasehold rights represent separately identifiable asset recognized from the acquisition of GPARC and is amortized over a period of 20 years. Leasehold rights amortization amounted to P7.0 million each in 2021, 2020 and 2019, and is presented as part of Depreciation and amortization under Operating Expenses account in the consolidated statements of income (see Note 22). Guarantee deposits mainly pertain to payments made for compliance with construction requirements in relation to the Group’s real estate projects.
15. INTEREST-BEARING LOANS AND BORROWINGS
Interest-bearing Loans and Borrowings account represents the following loans of the Group as at December 31:
2021 2020
Parent Company: Php-denominated P 28,909,550,457 P 27,762,950,312 U.S. Dollar-denominated 4,580,587,013 6,660,010,889 33,490,137,470 34,422,961,201
Subsidiaries – Php-denominated 18,159,567,128 11,155,205,216
P 51,649,704,598 P 45,578,166,417
The current and non-current classification of the Group’s Interest-bearing Loans and Borrowings is shown below.
2021 2020
Current P 12,685,534,491 P 21,037,756,478 Non-current 38,964,170,107 24,540,409,939
P 51,649,704,598 P 45,578,166,417

- 62 -
The Group has complied with applicable loan covenants, including maintaining certain financial ratios, at the end of the reporting periods.
Finance costs arising from interest-bearing loans that are mainly and directly attributable to construction of the Group’s projects are capitalized as part of Inventories and Investment Properties accounts. The remaining interest costs are expensed outright.
The total finance costs attributable to all the loans of the Group amounted to P2,251.7 million, P2,726.2 million and P2,967.8 million in 2021, 2020 and 2019, respectively. Of these amounts, portion charged as expense amounted to P788.9 million, P666.9 million and P709.7 million in 2021, 2020 and 2019, respectively, and are presented as part of Interest expense under Interest and Other Charges – net account in the consolidated statements of income (see Note 24). Interest capitalized in 2021, 2020 and 2019 amounted to P1,462.8 million, P2,059.3 million and P2,258.1 million, respectively. The outstanding interest payable as of December 31, 2021 and 2020 is presented as part of Accrued Interests under Trade and Other Payables account in the consolidated statements of financial position (see Note 17). Capitalization rate used in determining the amount of interest charges qualified for capitalization is 3.01%, 4.25% and 4.48% in 2021, 2020 and 2019, respectively. The reconciliation of the unamortized loans issue costs is presented below.
2021 2020 2019 Balance at beginning of year P 104,739,347 P 134,084,993 P 103,429,007 Additions 102,375,000 37,500,000 75,000,000 Amortization ( 61,848,866 ) ( 66,845,646 ) ( 44,344,014 ) Balance at end of year P 145,265,481 P 104,739,347 P 134,084,993
The amortization of loans issue costs is recognized as part of Interest expense under Interest and Other Charges – net account in the consolidated statements of income. 15.1 Parent Company
(a) U.S. Dollar, five-year loan due 2022
In December 2017, the Parent Company obtained an unsecured long-term loan from a local bank amounting to U.S. $98.87 million. The loan is payable quarterly for a term of five years with a grace period of one year upon availment. The principal repayment on the loan shall commence in March 2019 and a floating interest is paid quarterly based on a three-month London interbank offered rate (LIBOR) plus a certain spread. The Company entered into a cross-currency swap transaction to hedge the U.S. Dollar and interest rate exposure of the loan (see Note 30).
(b) Philippine Peso, seven-year loan due 2022
In November 2015, the Parent Company obtained an unsecured long-term loan from a local bank amounting to P5.0 billion. The loan is payable semi-annually for a term of seven years. The principal repayments on this loan commenced in November 2016 and interest is paid semi-annually based on a fixed 5.25% annual interest rate.

- 63 -
(c) Philippine Peso, seven-year loan due 2022 In March 2015, the Parent Company signed a financing deal with a local bank in which the latter may avail of a P10.0 billion unsecured loan, divided equally into two tranches which the Parent Company fully availed in 2015. The proceeds of the loan were used to fund the development of the Parent Company’s various real estate projects and retire currently maturing obligations. The loan is payable quarterly for a term of seven years. The principal repayments on this loan commenced in June 2016 and interest is paid quarterly based on a fixed 5.63% annual interest rate, which was further negotiated to 4.00% effective July 1, 2021.
(d) Philippine Peso, five-year loan due 2021
In November 2016, the Parent Company obtained an unsecured long-term loan from a local bank amounting to P5.0 billion. The loan is payable quarterly for a term of five years with a grace period of one year upon availment. The principal repayment on the loan commenced in February 2018 and interest is paid quarterly based on a fixed 6.43% annual interest rate. In 2021, the Parent Company has paid in full its outstanding loan balance.
(e) Philippine Peso, five-year loan due 2021 In August 2016, the Parent Company obtained an unsecured long-term loan from a local bank amounting to P2.0 billion. The loan is payable quarterly for a term of five years with a grace period of two years upon availment. The principal repayment on the loan commenced in November 2018 and interest is paid quarterly based on a fixed 5.26% annual interest rate. In 2021, the Parent Company has paid in full its outstanding loan balance.
(f) Philippine Peso, seven-year loan due 2021 In August 2014, the Parent Company obtained an unsecured long-term loan from a local bank amounting to P5.0 billion. The loan is payable semi-annually for a term of seven years. The principal repayments on this loan commenced in August 2015 and interest is paid semi-annually based on a fixed 5.38% annual interest rate. In 2021, the Parent Company has paid in full its outstanding loan balance.
(g) Philippine Peso, five-year loan due 2023 In December 2018, the Parent Company obtained an unsecured long-term loan from a local bank amounting to P5.0 billion. The loan is payable quarterly for a term of five years with a grace period of two years upon availment. The principal repayment of the loan commenced in March 2021 and interest is paid quarterly based on a fixed 7.85% annual interest rate which was further negotiated to 6.30% effective September 2, 2020.
(h) Philippine Peso, three-year loan due 2021
In July 2018, the Parent Company obtained an unsecured long-term loan from a local bank amounting to P5.0 billion. The principal of the loan is payable upon maturity and floating interest is payable quarterly commencing in October 2018, based on a 5-day average reference rate plus a certain spread. In 2021, the Parent Company has paid in full its outstanding loan balance.

- 64 -
(i) Philippine Peso, three-year loan due 2021 In December 2018, the Parent Company obtained an unsecured long-term loan from a local bank amounting to P5.0 billion. The loan is payable quarterly for a term of three years with a grace period of six months upon availment. The principal repayment on the loan commenced in September 2019 and interest is paid quarterly based on a floating rate plus certain spread. In 2021, the Parent Company has paid in full its outstanding loan balance.
(j) U.S. Dollar, five-year loan due 2024
In September 2019, the Parent Company obtained an unsecured long-term loan from a local bank amounting to U.S. $95.62 million. The loan is payable quarterly for a term of five years with a grace period of one year upon availment. The principal repayment on the loan commenced in December 2020 and a floating interest is paid quarterly based on a three-month LIBOR plus a certain spread. The Parent Company entered into a cross-currency swap transaction to hedge the U.S. Dollar and interest rate exposure of the loan (see Note 30).
(k) Philippine Peso, five-year loan due 2024 In December 2019, the Parent Company obtained an unsecured long-term loan from a local bank amounting to P5.0 billion. The loan is payable quarterly for a term of five years with a grace period of one year upon availment. The principal repayment on the loan commenced in December 2020 and interest is paid quarterly based on the higher of 4.75% fixed rate and floating rate plus certain spread.
(l) Philippine Peso, five-year loan due 2025 In March 2020, the Parent Company obtained an unsecured long-term loan from a local bank amounting to P5.0 billion. The loan is payable quarterly for a term of five years with a grace period of two years upon availment. The principal repayment on the loan shall commence in June 2022 and a floating interest is paid quarterly based on a five-day average reference rate plus a certain spread.
(m) Philippine Peso, five-year loan due 2026
In March 2021, the Parent Company obtained an unsecured long-term loan from a local bank amounting to P5.0 billion. The loan is payable quarterly for a term of five years with a grace period of one year upon availment. The principal repayment on the loan shall commence in March 2022. Interest on the loan is fixed at 4.00% payable quarterly.
(n) Philippine Peso, five-year loan due 2026
In August 2021, the Parent Company obtained an unsecured long-term loan from a local bank amounting to P5.0 billion. The loan is payable quarterly for a term of five years with the first principal payment due in November 2022. Interest is payable quarterly at a floating rate based on a reference rate plus a certain spread.

- 65 -
(o) Philippine Peso, five-year loan due 2026
In May 2021, the Parent Company obtained an unsecured long-term loan from a local bank amounting to P6.0 billion. The loan is payable quarterly beginning August 2022. The interest is payable quarterly at a floating rate.
15.2 EELHI
(a) Philippine Peso, seven-year loan due 2022 In 2015, EELHI obtained a P2.0 billion unsecured loan from a local bank. The loan was released in three tranches from 2015 to 2016 and bears fixed interest of 5.4% for the first and second tranches, and floating rate ranging from 3.2% to 3.5% subject to quarterly re-pricing for the third tranche. The proceeds of the loan were used to fund the development of EELHI’s various real estate projects.
(b) Philippine Peso, three-year loan due in 2021
In 2018, EELHI obtained a bridge financing from a local bank. The loan was released in February 2018 and subject to floating rate of 4.5%. The proceeds of the loan were used to fund the development of EELHI’s various real estate projects. The principal of the loan is payable upon maturity and interest is payable monthly in arrears. In 2021, EELHI has paid in full its outstanding loan balance.
(c) Philippine Peso, 90-day loan due in 2021 In 2020, EELHI obtained unsecured loans from local banks. The loans bear fixed interest rates at 3.12%. The proceeds of the loan were used to fund the development of EELHI’s various real estate projects. The principal of the loan is payable upon maturity and interest is payable monthly. In 2021, the EELHI has paid in full its outstanding loan balance.
(d) Philippine Peso, seven-year loan due in 2028 In 2021, EELHI obtained an unsecured interest-bearing, seven-year, P1.0 billion loan from a local bank. The loan was released in full in February 2021 and bears a floating interest rate of 3.5% per annum. The proceeds of the loan were used to fund the development of its various real estate projects. The principal of the loan is payable in 20 equal quarterly payments starting in May 2023 with a two-year grace period and interest is payable quarterly in arrears.
15.3 SPI
(a) Philippine Peso, five-year loan due in 2025 In 2018, SPI obtained an unsecured long-term loan from a local bank amounting to P2.2 billion. The principal amount is payable on a monthly basis after a grace period of three years from the date of availment. The loan bears 4.50% floating interest subject to repricing every 30 to 180 days and will mature in 2025. The proceeds of the loan were used to fund the acquisition of STLI in 2018.

- 66 -
(b) Philippine peso, seven-year loan due in 2027 In 2020, SPI obtained an unsecured long-term loan from a local bank amounting to P300.0 million. The loan bears fixed interest of 4.50%. The principal amount is payable on a monthly basis after a grace period of two years from the date of availment.
(c) Philippine peso, six-month loan
In 2021, SPI obtained an unsecured loan from a local bank amounting to P500.0 million. The loan bears fixed interest of 4.0%. The principal amount is payable at maturity date.
(d) Philippine Peso, various six-year loans due in 2027
In 2021, SPI obtained an unsecured long-term loan from a local bank amounting to P400.0 million and P200.0 million. The principal amount is payable on a monthly basis after a grace period of three years from the date of availment. The loans bear fixed interest rates of 4.38% and 4.50%, respectively.
(e) Philippine Peso, six-year loan due in 2027 In 2021, SPI obtained an unsecured long-term loan from a local bank amounting to P100.0 million. The principal amount is payable on a monthly basis after a grace period of three years from the date of availment. The loans bears floating interest rate of 4.38% subject to quarterly repricing.
(f) Philippine Peso, various short-term loans In prior years, SPI obtained various unsecured short-term loans from different local banks. The loans bear fixed and floating interest ranging from 5.25% to 5.75%. The outstanding balances of the loans as of December 31, 2021 and 2020 amount to P500.0 million and P314.0 million, respectively.
(g) Philippine Peso, liability on assigned receivables
In 2021 and prior years, SPI obtained various loans from a local bank through assignment of trade receivables (see Note 6). The loans bear floating interests ranging from 5.50% to 15.00%. The loans and interests are being paid as the receivables are collected. The outstanding balance pertaining to these loans as of December 31, 2021 and 2020 amounted to P0.9 billion and P1.4 billion, respectively. The carrying value of assigned receivables is equal to the outstanding balance of the loan as of December 31, 2021 and 2020.
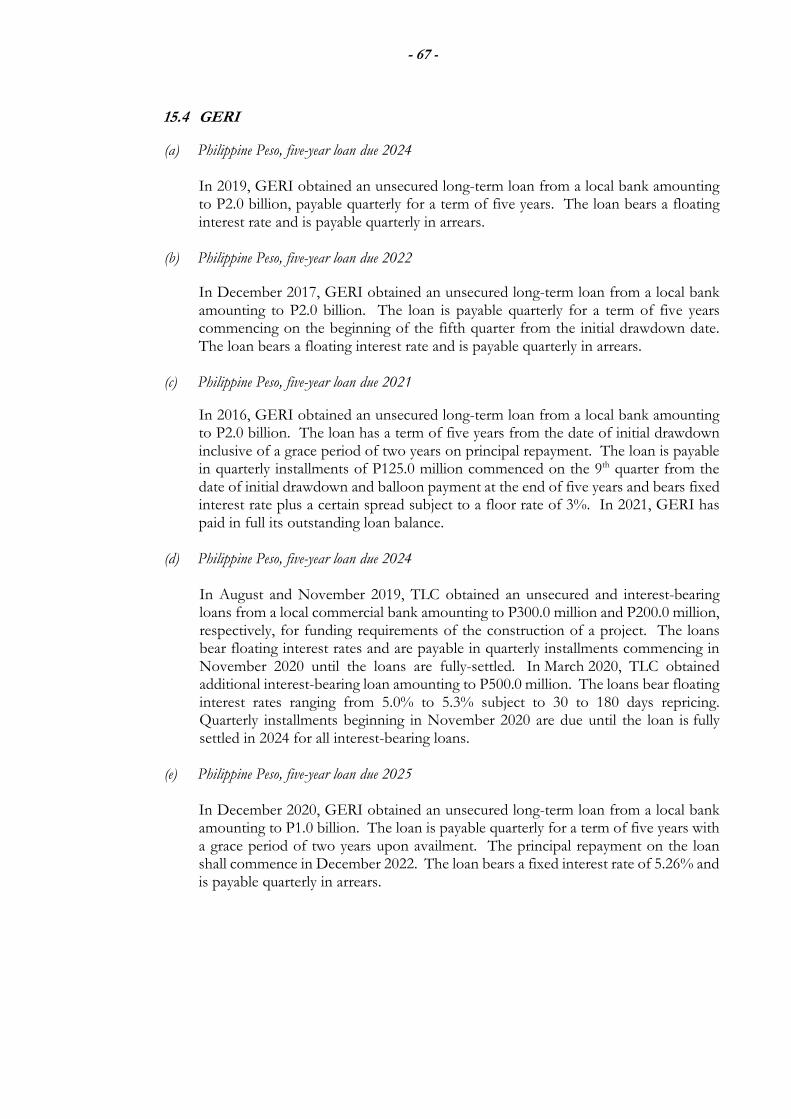
- 67 -
15.4 GERI
(a) Philippine Peso, five-year loan due 2024 In 2019, GERI obtained an unsecured long-term loan from a local bank amounting to P2.0 billion, payable quarterly for a term of five years. The loan bears a floating interest rate and is payable quarterly in arrears.
(b) Philippine Peso, five-year loan due 2022
In December 2017, GERI obtained an unsecured long-term loan from a local bank amounting to P2.0 billion. The loan is payable quarterly for a term of five years commencing on the beginning of the fifth quarter from the initial drawdown date. The loan bears a floating interest rate and is payable quarterly in arrears.
(c) Philippine Peso, five-year loan due 2021
In 2016, GERI obtained an unsecured long-term loan from a local bank amounting to P2.0 billion. The loan has a term of five years from the date of initial drawdown inclusive of a grace period of two years on principal repayment. The loan is payable in quarterly installments of P125.0 million commenced on the 9th quarter from the date of initial drawdown and balloon payment at the end of five years and bears fixed interest rate plus a certain spread subject to a floor rate of 3%. In 2021, GERI has paid in full its outstanding loan balance.
(d) Philippine Peso, five-year loan due 2024 In August and November 2019, TLC obtained an unsecured and interest-bearing loans from a local commercial bank amounting to P300.0 million and P200.0 million, respectively, for funding requirements of the construction of a project. The loans bear floating interest rates and are payable in quarterly installments commencing in November 2020 until the loans are fully-settled. In March 2020, TLC obtained additional interest-bearing loan amounting to P500.0 million. The loans bear floating interest rates ranging from 5.0% to 5.3% subject to 30 to 180 days repricing. Quarterly installments beginning in November 2020 are due until the loan is fully settled in 2024 for all interest-bearing loans.
(e) Philippine Peso, five-year loan due 2025 In December 2020, GERI obtained an unsecured long-term loan from a local bank amounting to P1.0 billion. The loan is payable quarterly for a term of five years with a grace period of two years upon availment. The principal repayment on the loan shall commence in December 2022. The loan bears a fixed interest rate of 5.26% and is payable quarterly in arrears.

- 68 -
(f) Philippine Peso, seven-year loan due 2027 In December 2020, GERI obtained an unsecured long-term loan from a local bank amounting to P0.5 billion. The loan is payable quarterly for a term of seven years with a grace period of one year upon availment. The principal repayment on the loan shall commence in March 2022. The loan bears a floating interest rate and is payable quarterly in arrears.
(g) Philippine Peso, seven-year loan due 2027 In March 2021, GERI obtained an unsecured long-term loan from a local bank amounting to P0.5 billion. The loan is payable quarterly for a term of seven years with a grace period of two years upon availment. The loan bears a floating interest rate and is payable quarterly in arrears.
(h) Philippine Peso, four-year loan due 2025 In July 2021, GERI obtained an unsecured long-term loan from a local bank amounting to P1.0 billion. The loan is payable quarterly for a term of four years commencing on the beginning of the fifth quarter from the date of availment. The loan bears a fixed interest rate of 5.37% and is payable quarterly in arrears.
15.5 MREIT
Philippine Peso, ten-year loan due 2031
In December 2021, MREIT obtained an unsecured, 10-year, P7.25 billion term loan from a local bank to finance the acquisition of investment properties from the Parent Company. The principal is payable quarterly in installment beginning in the last quarter of the fifth year with a balloon payment at the end of the term. Interest is payable quarterly at 3.64% per annum subject to repricing in December 2024.
16. BONDS AND NOTES PAYABLE
This account is composed of the following:
2021 2020
Philippine peso P 11,981,932,912 P 11,973,903,096 U.S. Dollar 30,000,109,334 28,308,952,890
P 41,982,042,246 P 40,282,855,986
(a) U.S. Dollar, seven-year senior unsecured notes due 2027
On July 30, 2020, the Parent Company issued seven-year senior unsecured notes totaling to U.S. $350 million. The notes carry a coupon rate of 4.125% per annum and interest is payable semi-annually in arrears on January 30 and July 30. The notes shall mature on July 30, 2027. The notes are listed in the Singapore Exchange Securities Trading Limited (SGX-ST).

- 69 -
(b) Philippine Peso, seven-year bonds due 2024
On March 28, 2017, the Parent Company issued seven-year term bonds totaling P12.0 billion. The bond carries a coupon rate of 5.35% payable semi-annually in arrears every March 28 and September 28. The bonds shall mature on March 28, 2024. The bonds are listed Philippine Dealing & Exchange Corp. (PDEx).
(c) U.S. Dollar, ten-year bonds due 2023
On April 17, 2013, the Parent Company issued ten-year term bonds totaling U.S. $250 million. The bond carries a coupon rate of 4.25% per annum and interest is payable semi-annually in arrears every April 17 and October 17. The proceeds of the bond issuance are being used by the Parent Company for general corporate purposes. The bonds are listed in the SGX-ST.
The Parent Company has complied with bond covenants including maintaining certain financial ratios at the end of the reporting periods.
Total interest incurred on these bonds amounted to P1,983.9 million, P1,496.5 million and P1,201.8 million in 2021, 2020 and 2019, respectively. Of these amounts, portion charged as expense amounted to P1,103.1 million, P872.2 million and P717.4 million in 2021, 2020 and 2019, respectively, and are presented as part of Interest expense under Interest and Other Charges account in the consolidated statements of income (see Note 24). The outstanding interest payable as at December 31, 2021 and 2020 is presented as part of Accrued interest payable under Trade and Other Payables account in the consolidated statements of financial position (see Note 17). Unrealized foreign currency gains in relation to these foreign bonds are presented as part of Foreign currency gains – net under Interest and Other Income – net account in the consolidated statements of income (see Note 23).
Interest capitalized amounted to P799.4 million and P581.2 million in 2021 and 2020, respectively. Capitalization rate used in determining the amount of interest charges qualified for capitalization is 3.87% in 2021 and 2.89% in 2020.
The reconciliation of the unamortized bonds issue costs is presented below.
2021 2020 2019 Balance at beginning of year P 538,744,014 P 48,903,571 P 64,652,759 Additions - 533,014,807 - Amortization ( 81,423,244 ) ( 43,174,364 ) ( 15,749,188 ) Balance at end of year P 457,320,770 P 538,744,014 P 48,903,571
The amortization of bonds issue costs is recognized as part of Interest expense under Interest and Other Charges – net account in the consolidated statements of income.

- 70 -
17. TRADE AND OTHER PAYABLES
This account consists of:
Notes 2021 2020 Trade payables P 14,438,713,317 P 13,965,119,893 Retention payable 5,092,856,605 5,143,997,192 Refund liability 1,598,037,403 1,042,344,049 Accrued interest 15, 16 673,948,706 789,488,958 Cash dividends payable 28.4 - 1,128,400,869 Miscellaneous 1,072,411,109 1,262,607,011
P 22,875,967,140 P 23,331,957,972
Trade payables mainly represent obligations to subcontractors and suppliers of construction materials for the Group’s projects. Retention payable pertains to amounts withheld from payments made to contractors to ensure compliance and completion of contracted projects equivalent to 10% of every billing made by the contractor. Upon completion of the contracted projects, the amounts are returned to the contractors. The non-current portion of Retention payable is presented as under Other Non-Current Liabilities in the statements of financial position (see Note 19). Refund liability pertains to amounts payable to customers due to sales cancellation in respect of installment sales contracts as covered by the R.A. No. 6552, Realty Installment Buyer Protection Act, otherwise known as the Maceda Law.
Miscellaneous payables include withholding taxes payable and accrual of salaries, wages and utilities.
18. REDEEMABLE PREFERRED SHARES
On September 4, 2012, TLC’s BOD approved the additional subscriptions to 1,258.0 million preferred shares out of TLC’s authorized capital stock as partial payment for certain parcels of land with total fair value of P1,338.2 million. The SEC approved the issuance through the exchange of certain parcels of land on April 17, 2013. Generally non-voting, these preferred shares earn dividends at a fixed annual rate of 2.5% subject to the existence of TLC’s unrestricted retained earnings. The accrued dividends on these preferred shares amounting to P0.5 million and P0.9 million as at December 31, 2021 and 2020, respectively, are presented as part of Other payables under Other Non-current Liabilities account in the consolidated statements of financial position (see Note 19). The related interest expense recognized amounting to P11.1 million, P16.9 million, and P22.7 million in 2021, 2020 and 2019, respectively, is presented as part of Interest expense under the Interest and Other Charges – Net account in the consolidated statements of income (see Note 24). The preferred shares have a maturity of 10 years and shall be redeemed on every anniversary date beginning on the sixth anniversary date until expiration of the ten-year period. Only 1/5 of the aggregate face value of preferred shares may be redeemed per year during such redemption period, with all remaining shares to be redeemed on the 10th anniversary date.

- 71 -
The preferred shares are considered as financial liabilities. Accordingly, the redeemable preferred shares are recognized at fair value on the date of issuance. The par value of the redeemable preferred shares on the date of issuance approximate their fair value.
19. OTHER LIABILITIES
This account consists of:
Notes 2021 2020
Current: Unearned income P 2,928,397,465 P 3,668,867,976 Commission payable 2,632,525,561 3,164,723,364 Advances from customers 1,558,113,579 1,993,994,411 Subscription payable 11.1(a), 27 1,114,665,008 1,114,665,008 Derivative liability 30 147,793,407 758,026,441 Lease liabilities 72,195,557 55,716,783 Other payables 1,022,705,897 120,695,519 P 9,476,396,474 P 10,876,689,502
Non-current: Deferred rent - net P 3,950,438,046 P 3,997,245,649
Retention payable 17 2,144,942,479 2,168,836,637 Lease liabilities 517,377,243 531,900,188 Other payables 18 479,905,536 119,442,993 7,092,663,304 6,817,425,467
P 16,569,059,778 P 17,694,114,969 Unearned income includes the current portion of deferred rent and advance payment for other services. Deferred rental income refers to the rental payments advanced by the lessee at the inception of the lease which will be applied to the remaining payments at the end of the lease term. Other current payables as of December 31, 2021 mainly pertain to the outstanding balance on the purchase of PCMI shares (see Note 27.6).
The total cash outflows relating to lease liabilities for the years ended December 31, 2021
and 2020 are as follows:
Note 2021 2020
Principal of lease liability P - P 24,915,531 Interest on lease liability 24 29,570,421 15,899,599
P 29,570,421 P 40,815,130

- 72 -
The maturity analysis of lease liabilities as at December 31 is presented as follows:
Net Lease Payment Finance Charges Present Value 2021 Within one year P 110,776,861 ( P 38,581,304 ) P 72,195,557 After one year but not more than two years 59,622,870 ( 37,208,976 ) 22,413,894 After two years but not more than three years 60,085,188 ( 35,567,044 ) 24,518,144 After three years but not more than four years 59,560,155 ( 33,951,583 ) 25,608,572 After four years but not more than five years 60,370,357 ( 32,294,017 ) 28,076,340 More than five years 810,937,480 ( 394,177,187 ) 416,760,293 P 1,161,352,911 ( P 571,780,111 ) P 589,572,800 2020 Within one year P 95,493,072 ( P 39,776,289 ) P 55,716,783 After one year but not more than two years 62,013,611 ( 37,803,334 ) 24,210,277 After two years but not more than three years 57,576,405 ( 36,399,767 ) 21,176,638 After three years but not more than four years 58,653,069 ( 34,874,713 ) 23,778,356 After four years but not more than five years 57,306,048 ( 33,398,616 ) 23,907,432 More than five years 864,682,102 ( 425,854,617 ) 438,827,485 P 1,195,724,307 ( P 608,107,336 ) P 587,616,971
The Group has elected not to recognize a lease liability for short-term leases. Payments made under such leases are expensed on a straight-line basis. The expenses relating to short term leases amounting to P77.0 million, P181.1 million and P241.0 million in 2021, 2020 and 2019, respectively, presented as Rent under Operating Expenses under Cost and Expenses in the statements of income (see Note 22).
20. REVENUES
20.1 Disaggregation of Revenues The Group derives revenues from sale of real properties and hotel operations.
An analysis of the Group’s major sources of revenues is presented in the succeeding page.

- 73 -
Segments
Hotel
Real Estate Operations Total
2021
Types of products or services
Residential units P 27,349,657,783 P - P 27,349,657,783
Commercial lot 1,989,948,174 - 1,989,948,174
Residential lot 1,555,674,397 - 1,555,674,397
Industrial lot 234,137,370 - 234,137,370
Room accommodation - 1,427,615,363 1,733,188,767
Food and beverages - 471,620,410 166,047,006
Other hotel services - 29,627,308 29,627,308
P 31,129,417,724 P 1,928,863,081 P 33,058,280,805
2020
Types of products or services
Residential units P 21,667,844,909 P - P 21,667,844,909
Commercial lot 1,114,034,859 - 1,114,034,859
Residential lot 1,974,800,043 - 1,974,800,043
Industrial lot 101,857,492 - 101,857,492
Room accommodation - 1,129,655,569 1,129,655,569
Food and beverages - 327,418,219 327,418,219
Other hotel services - 25,087,188 25,087,188
P 24,858,537,303 P 1,482,160,976 P 26,340,698,279
2019
Types of products or services
Residential units P 37,676,733,245 P - P 37,676,733,245
Commercial lot 1,135,140,901 - 1,135,140,901
Residential lot 3,438,496,828 - 3,438,496,828
Industrial lot 353,613,598 - 353,613,598
Room accommodation - 1,820,667,836 1,820,667,836
Food and beverages - 671,443,538 671,443,538
Other hotel services - 51,658,134 51,658,134
P 42,603,984,572 P 2,543,769,508 P 45,147,754,080
20.2 Contract Accounts The significant changes in the contract assets and contract liabilities balances as of December 31 are as follows:
2021 2020
Contract Contract Contract Contract
Assets Liabilities Assets Liabilities
Balance at beginning of year P19,380,726,313 P5,843,629,303 P18,643,004,687 P 5,213,555,043
Transfers from contract assets
recognized at the beginning of
year to trade receivables ( 6,331,845,183) - ( 4,684,255,962) -
Increase due to satisfaction of
performance obligation over time,
net of cash collections 6,873,366,232 - 5,421,977,588 -
Revenue recognized that was included in contract liability at
the beginning of year - ( 1,704,149,276) - ( 1,195,609,872 )
Increase due to cash received
in excess of performance to date - 3,264,215,781 - 1,825,684,132
Balance at end of year P19,922,247,362 P7,403,695,808 P19,380,726,313 P 5,843,629,303

- 74 -
The current and non-current classification of the Group’s Contract Assets account as presented in the statements of financial position is shown below.
2021 2020
Current P 11,970,852,843 P 13,265,242,603 Non-current 7,951,394,519 6,115,483,710 P 19,922,247,362 P 19,380,726,313
The current and non-current classification of the Group’s Contract Liabilities account as presented in the statements of financial position is shown below.
2021 2020
Current P 2,447,089,883 P 2,647,780,045 Non-current 4,956,605,925 3,195,849,258 P 7,403,695,808 P 5,843,629,303
The outstanding balance of trade receivables arising from real estate sales and hotel
operations presented as part of Trade Receivables under Trade and Other Receivables
account in the consolidated statements of financial position, amounted to P27.5 billion and
P25.7 billion as of December 31, 2021 and 2020, respectively (see Note 6).
20.3 Direct Contract Costs The Group incurs sales commissions upon execution of contracts to sell real properties to customers. Incremental costs of commission incurred to obtain contracts are capitalized and presented as Deferred commission under Prepayments and Other Current Assets, and Other Non-current Asset accounts in the consolidated statements of financial position (see Notes 8 and 14). These are amortized over the expected construction period on the same basis as how the Group measures progress towards complete satisfaction of its performance obligation in its contracts. The total amount of amortization is presented as part of Commission under Operating Expenses (see Note 22).
The movements in the balances of deferred commission in 2021 and 2020 is presented below.
2021 2020
Balance at beginning of year P 3,360,073,323 P 2,113,414,716 Additional capitalized costs 1,049,897,401 1,898,751,533 Reversal due to back out ( 14,187,040) ( 12,545,654 ) Amortization for the year ( 820,861,943) ( 639,547,272 ) Balance at end of year P 3,574,921,741 P 3,360,073,323

- 75 -
20.4 Transaction Price Allocated to Unsatisfied Performance Obligations
The aggregate amount of transaction price allocated to partially or wholly unsatisfied
contracts amounted to P47.1 billion and P41.8 billion as of December 31, 2021 and 2020,
respectively, which the Group expects to recognize as follows:
2021 2020 Within a year P 21,139,283,515 P 17,112,265,610 More than one year to three years 19,761,215,172 19,283,075,464 More than three to five years 6,225,643,643 5,426,500,143 P 47,126,142,330 P 41,821,841,217
21. DIRECT COSTS
21.1 Cost of Real Estate Sales
The nature of the cost of real estate sales for the years ended December 31 are as follows: 2021 2020 2019
Contracted services P 13,921,991,148 P 11,219,299,981 P 17,531,181,959 Land cost 1,870,060,652 1,884,946,036 4,927,689,375 Borrowing cost 792,405,811 462,338,695 549,543,413 Other costs 289,825,668 223,941,120 371,404,253
P 16,874,283,279 P 13,790,525,832 P 23,379,819,000
21.2 Cost of Hotel Operations
The nature of the cost of hotel operations for the years ended December 31 are as follows: Note 2021 2020 2019 Salaries and employee benefits 25.1 P 272,425,884 P 294,423,195 P 313,010,398 Rent 251,186,534 174,698,043 223,425,060 Utilities 246,934,596 145,490,772 256,609,404 Food and beverage 191,503,125 113,744,576 267,202,449 Outside services 7,071,957 143,269,354 177,371,037 Hotel operating supplies 74,716,451 46,365,836 74,877,359 Miscellaneous 43,140,012 45,112,756 68,661,058 P 1,086,978,559 P 963,104,532 P 1,381,156,765

- 76 -
22. OPERATING EXPENSES
Presented below are the details of this account. Notes 2021 2020 2019 Depreciation and amortization 12, 13, 14 P 3,467,925,032 P 3,104,661,233 P 2,718,633,789 Salaries and employee benefits 25.1 2,878,758,053 2,774,714,292 3,125,673,095 Commission 20.3 1,220,192,387 1,211,294,878 2,330,502,280 Taxes and licenses 1,192,439,947 1,058,641,173 1,010,811,356 Outside services 826,990,607 553,576,807 617,984,919 Utilities and supplies 494,027,066 470,914,537 735,437,981 Advertising and promotions 764,372,156 551,242,571 1,202,536,624 Professional fees 594,801,585 511,233,774 530,988,612 Association dues 365,873,255 435,179,281 373,994,646 Donation 149,743,170 252,789,709 43,880,408 Transportation 194,751,215 154,786,603 338,320,212 Rent 19 76,988,707 181,081,217 240,973,409 Miscellaneous 11.2 637,769,661 590,142,897 642,742,420 P 12,864,632,841 P 11,850,258,972 P 13,912,479,751
Miscellaneous operating expenses include repairs and maintenance, insurance expense, and training and development expense.
23. INTEREST AND OTHER INCOME
Presented below are the details of this account.
Notes 2021 2020 2019 Interest income 5, 6, 27.1 P 2,104,896,268 P 2,003,787,163 P 2,328,813,700 Property management, commission and construction income 1,617,611,176 1,269,150,213 1,679,042,730 Gain on sale of property 12 136,206,674 - 45,781,949 Dividend income 9, 27.4 24,456,757 8,193,611 8,464,814 Foreign currency gains – net 5, 15, 16 - 788,594,465 492,386,136 Gain on finance lease 31.1(b) - - 350,218,385 Gain on sale and dilution of investment in associates 11 - - 340,809,382 Miscellaneous – net 6 493,258,807 197,683,843 164,209,164
P 4,376,429,682 P 4,267,409,295 P 5,409,726,260

- 77 -
24. INTEREST AND OTHER CHARGES
Presented below are the details of this account. Notes 2021 2020 2019 Interest expense 10.2 15, 16 18, 25.3 P 1,941,630,481 P 1,641,304,190 P 1,512,905,580 Other charges: Foreign currency losses – net 15, 16 1,265,498,741 - - Impairment and other losses 6 682,473,797 659,918,645 943,762,442 Day one loss 6 483,265,727 269,781,190 494,929,021 Miscellaneous – net 435,668,579 359,633,267 310,000,954 P 4,808,537,325 P 2,930,637,292 P 3,261,597,997
Impairment and other losses include net losses from backout sales and impairment losses from trade receivables. Miscellaneous charges pertain to amortization of discounts on security deposits, bank charges and other related fees.
25. EMPLOYEE BENEFITS
25.1 Salaries and Employee Benefits Expenses recognized for salaries and employee benefits are presented below.
Notes 2021 2020 2019 Short-term benefits P 3,010,286,233 P 2,975,240,661 P 3,322,484,310 Employee share option benefit 25.2, 28.6 10,204,332 21,381,914 18,717,409 Post-employment benefits 25.3 130,693,372 72,514,912 97,481,774 21, 22 P 3,151,183,937 P 3,069,137,487 P 3,438,683,493
25.2 Employee Share Option Plan (ESOP)
The Group’s share option benefit expense includes the amounts recognized by the Parent Company and GERI over the vesting period granted by them. As at December 31, 2021 and 2020, all 400.0 million shares of GERI’s options were fully vested, but none of these have been exercised by any of the option holders. As at December 31, 2021, 2020, and 2019, 50.0 million, 40.0 million, and 35.0 million, respectively, of the Parent Company’s shares options were fully vested.
Employee option benefits expense, included as part of Salaries and employee benefits under Operating Expenses account in the consolidated statements of income, amounted to P10.2 million, P21.4 million and P18.7 million in 2021, 2020 and 2019, respectively (see Note 25.1).

- 78 -
25.3 Post-employment Defined Benefit Plan
(a) Characteristics of Defined Benefit Plan
The Group maintains a funded, tax-qualified, non-contributory post-employment benefit plan that is being administered by trustee banks. The post-employment plan covers all regular full-time employees. The normal retirement age is 60 with a minimum of five years of credited service. The post-employment defined benefit plan provides for retirement ranging from 60% to 200% of plan salary for every year of credited service, but shall not be less than the regulatory benefit under R.A. 7641, The Retirement Pay Law, or the applicable retirement law at the time of the member’s retirement.
(b) Explanation of Amounts Presented in the Financial Statements
Actuarial valuations are made annually to update the retirement benefit costs and the amount of contributions. All amounts presented below and in the succeeding pages are based on the actuarial valuation reports obtained from independent actuaries in 2021 and 2020. The amounts of retirement benefit obligation, presented as non-current liability in the consolidated statements of financial position, are as follows:
2021 2020 Present value of the obligation P 1,121,810,503 P 1,345,331,303 Fair value of plan assets ( 575,007,802) ( 525,575,607) Net defined benefit liability P 546,802,701 P 819,755,696
The movements in the present value of the retirement benefit obligation recognized in the books are as follows:
2021 2020
Balance at beginning of year P 1,345,331,303 P 1,636,406,311 Current service costs 130,693,372 72,514,912 Interest costs 49,827,794 82,498,054 Remeasurements –
Actuarial gains arising from changes in: Financial assumptions ( 134,104,864 ) ( 267,188,298 )
Experience adjustments ( 202,235,817) ( 100,470,130 ) Benefits paid ( 67,701,285 ) ( 78,429,546 ) Balance at end of year P 1,121,810,503 P 1,345,331,303

- 79 -
The movements in the fair value of plan assets are presented below.
2021 2020 Balance at beginning of year P 525,575,607 P 386,831,493 Contributions received 82,108,139 168,250,000 Interest income 20,862,500 23,461,025 Benefits paid ( 42,322,863 ) ( 39,441,837 ) Loss on plan assets
(excluding amount included in net interest cost) ( 11,215,581 ) ( 13,525,074 )
Balance at end of year P 575,007,802 P 525,575,607
The plan assets are composed of cash and cash equivalents of P184.4 million and P319.8 million in 2021 and 2020, respectively, investment in equity securities of P242.5 million and P1.10 million in 2021 and 2020, respectively, and investment in debt securities of P148.1 million and P204.7 million in 2021 and 2020, respectively. Debt securities pertain to corporate and government securities while equity securities consist of investments in private corporations. The contributions to the retirement plan are made annually by the Group. The amount of contributions to the retirement plan is determined based on the expected benefit payments that the Group will incur within five years.
Actual return on plan assets were P9.6 million, P23.7 million and P22.1 million in 2021, 2020 and 2019, respectively. The components of amounts recognized in the consolidated statements of income and consolidated statements other comprehensive income in respect of the post-employment defined benefit plan are as follows:
Notes 2021 2020 2019
Reported in consolidated statements of income: Current service costs 25.1 P 130,693,372 P 72,514,912 P 97,481,774 Net interest costs 24 28,965,294 59,037,029 63,111,421 P 159,658,666 P 131,551,941 P 160,593,195
Reported in consolidated statements of comprehensive income: Actuarial gains (losses) arising from changes in: Experience adjustments P 202,235,817 P 100,470,130 P 13,610,270 Financial assumptions 134,104,864 267,188,298 ( 362,928,641 )
Loss on plan assets (excluding amounts
included in net interest expense) ( 11,215,581 ) ( 13,525,074 ) ( 1,161,220 ) 325,125,100 354,133,354 ( 350,479,591 ) Tax expense (benefit) 26 ( 62,880,238 ) ( 106,240,006 ) 105,143,877
P262,244,862 P 247,893,348 (P 245,335,714)
- 80 -
Current service costs are presented as part of Salaries and employee benefits under Operating Expenses account in the consolidated statements of income (see Notes 22 and 25.1). The net interest costs are included as part of Interest expense under Interest and Other Charges – net account in the consolidated statements of income (see Note 24).
Amounts recognized in consolidated other comprehensive income were included within items that will not be reclassified subsequently to consolidated profit or loss.
In determining the amounts of the retirement benefit obligation, the following significant actuarial assumptions were used:
2021 2020 2019
Discount rates 3.58% - 5.20% 3.70% - 5.09% 5.09% - 6.08% Expected rate of salary increases 3.00% - 7.00% 3.00% - 10.00% 5.00% - 10.00%
Assumptions regarding future mortality experience are based on published statistics and mortality tables. The average remaining working lives of an individual retiring at the age of 60 is 25 years for both males and females. These assumptions were developed by management with the assistance of independent actuaries. Discount factors are determined close to the end of each reporting period by reference to the interest rates of a zero coupon government bonds with terms to maturity approximating to the terms of the retirement benefit obligation. Other assumptions are based on current actuarial benchmarks and management’s historical experience.
(c) Risks Associated with the Retirement Plan
The plan exposes the Group to actuarial risks such as investment risk, interest rate risk, longevity risk and salary risk.
(i) Investment and Interest Rate Risks
The present value of the DBO is calculated using a discount rate determined by reference to market yields of government bonds. Generally, a decrease in the interest rate of a reference government bonds will increase the plan obligation. However, this will be partially offset by an increase in the return on the plan’s investments in debt securities and if the return on plan asset falls below this rate, it will create a deficit in the plan. Currently, the plan has relatively balanced investment in cash and cash equivalents and debt securities. Due to the long-term nature of the plan obligation, a level of continuing debt investments is an appropriate element of the Group’s long-term strategy to manage the plan efficiently.
(ii) Longevity and Salary Risks
The present value of the DBO is calculated by reference to the best estimate of the mortality of the plan participants both during their employment and to their future salaries. Consequently, increases in the life expectancy and salary of the plan participants will result in an increase in the plan obligation.

- 81 -
(d) Other Information
The information on the sensitivity analysis for certain significant actuarial assumptions, the Group’s asset-liability matching strategies, and the timing and uncertainty of future cash flows related to the retirement plan are described below and in the succeeding page. (i) Sensitivity Analysis The following table summarizes the effects of changes in the significant actuarial assumptions used in the determination of the DBO as at December 31, 2021 and 2020:
Impact on Retirement Benefit Obligation Change in Increase in Decrease in Assumption Assumption Assumption
December 31, 2021
Discount rate 0.50% ( P 134,872,845 ) P 154,277,589 Salary increase rate 1.00% 192,679,302 ( 147,803,409 )
December 31, 2020
Discount rate 0.50% ( P 97,067,007 ) P 148,243,875 Salary increase rate 1.00% 102,156,149 ( 123,167,728 )
The above sensitivity analysis is based on a change in an assumption while holding all other assumptions constant. This analysis may not be representative of the actual change in the DBO as it is unlikely that the change in assumptions would occur in isolation of one another as some of the assumptions may be correlated. Furthermore, in presenting the above sensitivity analysis, the present value of the DBO has been calculated using the projected unit credit method at the end of the reporting period, which is the same as that applied in calculating the DBO recognized in the consolidated statements of financial position. The methods and types of assumptions used in preparing the sensitivity analysis did not change compared to the previous years.
(ii) Asset-liability Matching Strategies
The Group, through its BOD, envisions that the investment positions shall be managed in accordance with its asset-liability matching strategies to achieve that long-term investments are in line with the obligations under the retirement scheme. This aims to match the plan assets to the retirement obligations by investing in debt securities and maintaining cash and cash equivalents that match the benefit payments as they fall due and in the appropriate currency. There has been no change in the Group’s strategies to manage its risks from previous periods.

- 82 -
(iii) Funding Arrangements and Expected Contributions
The Group’s objective is to maintain a level of funding sufficient to cover the projected retirement benefit obligation. While there are no minimum funding requirements in the country, the size of the underfunding may pose a cash flow risk in about 25 years’ time when a significant number of employees is expected to retire. The Group expects to make contributions of P111.6 million to the plan during the next reporting period. The maturity profile of undiscounted expected benefit payments from the plan follows:
2021 2020
Within one year P 183,023,171 P 131,296,356 More than one year to 5 years 169,124,514 427,118,652 More than 5 years to 10 years 426,063,067 443,099,489 More than 10 years to 15 years 375,319,675 386,693,838 More than 15 years to 20 years 642,769,942 698,110,905
P 1,796,300,369 P 2,086,319,240
The weighted average duration of the DBO at the end of the reporting period range from 8 to 23 years.
26. TAXES
On March 26, 2021, Republic Act (R.A.) No. 11534, Corporate Recovery and Tax Incentives for Enterprises (CREATE) Act, as amended, was signed into law and shall be effective beginning July 1, 2020. The following are the major changes brought about by the CREATE Act that are relevant to and considered by the Group:
regular corporate income tax (RCIT) rate was reduced from 30% to 20% or 25% starting July 1, 2020;
minimum corporate income tax (MCIT) rate was reduced from 2% to 1% starting July 1, 2020 until June 30, 2023; and,
the allowable deduction for interest expense is reduced from 33% to 20% of the interest income subjected to final tax.
As a result of the application of the lower RCIT rate of 20% to 25% starting July 1, 2020, the current income tax expense and income tax payable, as presented in the 2020 annual income tax return (ITR) of the Group, would be lower by P188.1 million than the amount presented in the 2020 financial statements and such amount was charged to 2021 profit or loss.
In 2021, the recognized net deferred tax liabilities as of December 31, 2020 was remeasured to the effective tax rates that applies to the components. This resulted in a decline in the recognized deferred tax liability in 2020 by P1,911.5 million and such was recognized in the 2021 profit or loss (P1,893.1 million) and in other comprehensive income (P18.4 million).

- 83 -
The components of tax expense as reported in the consolidated statements of income and consolidated statements of comprehensive income are as follows:
2021 2020 2019 Reported in consolidated statements of income: Current tax expense: Regular corporate income tax (RCIT) at 25%, 20% and 10% in 2021, and 30% and 10% in 2020 and 2019 P 847,820,456 P 2,707,466,693 P 3,541,256,471 Adjustment in 2020 income taxes due to change in income tax rate ( 188,097,109) - - Final tax at 15% and 7.5% 38,763,811 58,700,066 136,799,818 Minimum corporate income tax (MCIT) at 1% in 2021 and, 2% in 2020 and 2019 275,179 33,058,126 3,139,384 Preferential tax at 5% - - 16,535,903 698,762,337 2,799,224,885 3,697,731,576 Deferred tax expense relating to: Effect of the change in income tax rate ( 1,893,077,651) - - Origination and reversal of temporary differences 1,759,232,643 548,681,373 2,383,925,714 P 564,917,329 P 3,347,906,258 P 6,081,657,290 Reported in consolidated statements of comprehensive income – Deferred tax expense (income) relating to: Effect of the change in income tax rate (P 18,401,038) P - P - Origination and reversal of temporary differences 93,038,135 101,774,635 ( 106,078,710)
P 74,637,097 P 101,774,635 (P 106,078,710)
A reconciliation of tax on pretax profit computed at the applicable statutory rates to tax expense reported in the consolidated statements of income is as follows:
2021 2020 2019 Tax on pretax profit at 25% in 2021, and 30% in 2020 and 2019 P 3,735,827,587 P 4,180,941,466 P 7,613,305,932 Effect of change in income tax rate ( 2,081,174,760) - - Adjustment for income subjected to lower income tax rates ( 185,194,162 ) ( 135,250,737) ( 156,046,868) Tax effects of: Non-taxable income ( 1,156,058,029) ( 1,062,695,429) ( 1,713,474,896) Non-deductible expenses 203,836,087 229,869,981 376,780,416 Unrecognized deferred tax assets on temporary differences 64,569,571 31,518,283 12,498,461 Miscellaneous ( 16,888,965) 103,522,694 ( 51,405,755 )
P 564,917,329 P 3,347,906,258 P 6,081,657,290

- 84 -
The deferred tax assets and liabilities relate to the following as of December 31:
2021 2020
Deferred tax assets – net: Difference between the fair value and carrying value of net assets acquired P 141,225,062 P 141,225,062 Retirement benefit obligation 48,881,410 48,209,554 Allowance for impairment of receivables 92,800,723 9,254,356 Allowance for property development costs 7,689,776 9,227,732 NOLCO 51,712,686 75,292,529
MCIT 43,703,007 26,392,264 Others ( 8,565,089) 30,275,240
P 377,447,575 P 339,876,737 Deferred tax liabilities – net:
Uncollected gross profit P 7,095,801,281 P 6,623,820,829 Capitalized interest 3,873,011,389 4,161,467,864 Difference between the tax reporting base and financial reporting base of rental income 1,037,372,316 1,071,596,877 Unrealized foreign currency losses – net ( 715,939,540 ) ( 382,023,042) Retirement benefit obligation ( 155,553,920) ( 219,106,014) Bond issuance costs 140,644,041 197,548,382 Share options ( 122,086,372) ( 129,256,812) Uncollected rental income 65,973,836 37,264,192 Others 322,565,856 202,113,684 P 11,541,788,887 P 11,563,425,960
No deferred tax liability has been recognized on the accumulated equity in net earnings of associates. The Group has no liability for tax should the amounts be declared as dividends since dividend income received from domestic corporation is not subject to income tax. Some of the entities within the Group are subject to MCIT which is computed at 1% of gross income, net of allowable deductions as defined under the tax regulations. Pursuant to Section 4(bbbb) of Bayanihan 1 Act for taxable years 2020 and 2021 NOLCO can be claimed as deduction within five consecutive years immediately following the year of such loss.
The details of the Group’s MCIT that are valid and deductible from future taxable income are as follows:
Original Valid Year Amount Until 2021 P 17,464,096 2026 2020 26,458,789 2023 2019 177,937 2022
P 44,100,822

- 85 -
The details of the Group’s NOLCO that are valid and deductible from future taxable income are as follows:
Original Valid Year Amount Until 2021 P 156,313,788 2026 2020 80,505,896 2025 2019 5,906,383 2022 P 242,726,067
Certain subsidiaries within the Group did not recognize the deferred tax assets on their MCIT and NOLCO as realization of such amounts is uncertain. Except for certain subsidiaries, management has assessed that the net losses incurred, as well as the related NOLCO, can be recovered through future operations and are not significant to the overall financial condition and financial performance of the Group.
In 2021, 2020 and 2019, the Group opted to continue claiming itemized deductions, except for MDC and MREIT which opted to use OSD in computing for income tax dues. MREIT is registered as a real estate investment trust entity under R.A. 9846 which enjoys certain income tax-free incentives, including deductibility of dividend distribution (subject to certain conditions) and exemption from MCIT. ECOC and SEDI are registered with the Philippine Economic Zone Authority (PEZA) pursuant to Presidential Proclamation No. 191 dated October 6, 1999. As PEZA-registered entities, ECOC and SEDI are entitled to a preferential tax rate of 5% on gross income earned from registered activities, in lieu of all local and national taxes, and to other tax privileges.
SPI’s The Regal Homes project has qualified in the definition of socialized housing under Section 3(r) of R.A. 7279, Urban Development and Housing Act of 1992. Under Section 20 of R.A. 7279, private sector participating in socialized housing shall be exempted from the payment of project-related income taxes, capital gains tax on raw lands use for the project, VAT for the project concerned, transfer tax for both raw and completed projects, and donor’s tax for both lands certified by the local government units to have been donated for socialized housing purposes.
27. RELATED PARTY TRANSACTIONS
The Group’s related parties include the Ultimate Parent Company, associates, the Group’s key management and other related parties under common ownership as described in the succeeding pages.

- 86 -
The summary of the Group’s transactions with its related parties as of December 31, 2021 and 2020, and for the years ended December 31, 2021, 2020 and 2019 are as follows:
Outstanding Investment/
Related Party Amount of Transactions Receivable (Payable)
Category Notes 2021 2020 2019 2021 2020
Ultimate Parent
Company:
Dividends paid 27.5 (P 609,361,023) (P 535,472,192 ) (P 1,115,364,612) P - (P 535,472,192)
Investments in
equity securities 27.4 ( 563,303,640) ( 129,956,000 ) ( 29,424,000) 1,862,863,640 1,299,560,000
Dividend income 27.4 10,127,290 6,130,000 - 10,127,290 6,130,000
Advances granted 27.2 - - 930,000,000 930,000,000 930,000,000
Acquisition of PCMI
shares 27.6 2,000,000,250 - - ( 1,000,000,250) -
Associates:
Advances granted
(collected) 27.2 ( 89,575,460) 2,252,794 ( 34,488,474) 1,009,737,833 1,099,313,294
Subscription payable 19 - - 1,114,665,008 ( 1,114,655,008) 1,114,665,008
Related Parties Under
Common Ownership:
Reimbursement of
construction costs 27.1 - - - 3,056,180,769 3,056,180,769
Advances availed (paid) 27.3 739,639,479 ( 230,932,687 ) ( 148,172,551) ( 3,243,336,539) ( 2,503,697,060)
Rendering of services 27.1 137,222,809 111,141,371 256,588,091 150,993,738 73,872,419
Advances granted 27.2 413,989,151 222,908,412 474,737,422 2,611,849,629 2,197,860,478
Dividend income 27.4 13,538,826 2,061,115 8,291,304 - -
Investments in
equity securities 27.4 992,357,068 ( 163,041,128 ) 682,407,513 3,859,308,095 2,866,951,027
Sale of investment
properties 27.9 136,607,414 - 47,125,000 - -
Key Management
Personnel –
Compensation 27.7 316,686,607 307,865,292 325,018,986 - -
None of the companies within the Group is a joint venture. The Group is not subject to joint control and none of its related parties exercise significant influence over it.
27.1 Real Estate Sales and Rendering of Services to Related Parties
The Group renders services to its related parties on a cost-plus basis, allowing a certain margin agreed upon by the parties at arm’s length.
The Group leases some of its investment properties to its associates and other related parties under common ownership with rental payments mutually agreed generally before the commencement of the lease. Most of the leases have terms ranging from one to 25 years, with renewal options, and include annual escalation rates of 3% to 10%, except for contingent rent. The revenues earned from these related parties are included as part of Rental Income in the consolidated statements of income (see Note 12). The related outstanding receivables from these transactions, which are collectible on demand, unsecured and noninterest-bearing, are presented as part of Trade under the Trade and Other Receivables account in the consolidated statements of financial position (see Note 6).

- 87 -
The Parent Company and a related party under common ownership are parties to a management agreement whereby the former provides management services for the overall administration of the latter’s leasing operations for a fee, which is based on certain rates of collections plus commission. Further, there are other management services provided to related parties under common ownership related to management of construction and development activities.
Occasionally, the Parent Company sells real properties to its related parties in the normal course of business. Unless otherwise indicated, the Group’s outstanding receivables from related parties arising from the above transactions are unsecured, noninterest-bearing, and collectible in cash under normal credit terms or through offsetting arrangements. There were no impairment losses recognized on the Group’s receivables from related parties in 2021, 2020 and 2019.
In 2018, the Parent Company agreed with a related party under common ownership to turn over a certain property under terms that the related party will reimburse the construction cost incurred by the Parent Company amounting to P4.0 billion (see Note 12). The outstanding balance, which is collectible on demand, interest-bearing and unsecured, amounted to P3.1 billion as of both December 31, 2021 and 2020, and is presented under non-current Other Trade Receivables in the consolidated statements of financial position (see Note 6). 27.2 Advances to Associates and Other Related Parties
Associates and other related parties under common ownership are granted noninterest-bearing, unsecured and collectible on demand advances by the Parent Company and other entities within the Group with no definite repayment terms for working capital purposes. These are generally collectible in cash or through offsetting arrangements with the related parties.
The outstanding balances of Advances to associates and other related parties shown as part of Trade and Other Receivables account under Current Assets section in the consolidated statements of financial position are below (see Note 6).
2021 2020
Advances to associates P1,009,737,832 P 1,099,313,294 Advances to other related parties 3,541,849,630 3,127,860,478
P4,551,587,462 P 4,227,173,772 The movements in advances to associates and other related parties are as follows: 2021 2020
Balance at beginning of year P4,227,173,772 P 4,002,012,566 Advances granted 413,989,152 260,769,849 Advances collected ( 89,575,462 ) ( 35,608,643 ) Balance at end of year P4,551,587,462 P4,227,173,772

- 88 -
Advances to other related parties pertain to advances granted to entities under common ownership of the Parent Company. No impairment losses on the advances to associates and other related parties were recognized in 2021, 2020 and 2019 based on management’s assessment. 27.3 Advances from Associates and Other Related Parties
Certain expenses of the entities within the Group are paid by other related parties on behalf of the former. The Group also received cash advances from a certain related party under common ownership, for the development of a certain entertainment site which is an integrated tourism project planned by the Philippine Amusement and Gaming Corporation. The advances are noninterest-bearing, unsecured and with no repayment terms and are generally payable in cash upon demand or through offsetting arrangements with the related parties.
The outstanding balances from these transactions, which are payable on demand, unsecured and noninterest-bearing, are presented as Advances from Associates and Other Related Parties under Current Liabilities Section account in the consolidated statements of financial position and are broken down below:
2021 2020
Advances from associates P - P 180,253,054 Advances from other related parties 3,243,336,539 2,503,697,060
P3,243,336,539 P 2,683,950,114 The movements in advances from associates and other related parties are as follows: 2021 2020
Balance at beginning of year P 2,683,950,114 P 2,914,882,801 Advances availed 608,170,119 24,157,233 Advances paid ( 48,783,694 ) ( 255,089,920 ) Balance at end of year P3,243,336,539 P2,683,950,114 27.4 Investments in Equity Securities
The Group’s equity securities include investment in shares of the Ultimate Parent Company and related parties under common ownership. The fair values of these securities have been determined directly by reference to published prices in an active market, except for the investment in shares of a related party under common ownership which was delisted in the stock exchange in 2019 and was subsequently measured using the discounted cash flows valuation technique [see Note 34.2(a)]. Movements and the related fair value gains or losses on these investments are shown and discussed in Note 9. Also, the Group received dividend income from these investments, presented as part of Dividend income under Interest and Other Income – net account in the consolidated statements of income (see Note 23). Outstanding receivable from this transaction is presented as part of Others under the current portion of Trade and Other Receivables account in the 2021 statement of financial position (see Note 6).
- 89 -
27.5 Dividends Paid to the Ultimate Parent Company
The Ultimate Parent Company received dividends from the Parent Company amounting to P0.6 billion, P0.5 billion and P1.1 billion in 2021, 2020 and 2019, respectively. Outstanding liability from these transactions amounted to P0.5 billion as of December 31, 2020 (nil in 2021), and is presented as part of Cash dividends payable under Trade and Other Payables account in the 2020 statement of financial position (see Notes 17 and 28.4).
27.6 Acquisition of PCMI shares
In 2021, the Parent Company acquired 968,932,750 shares of PCMI from AGI for a total price of P2.0 billion. The Parent Company paid P1.0 billion of the total consideration upon execution of the deed of sale. The unpaid portion is payable in the succeeding year, and is presented as part of Other Current Liabilities in the 2021 statement of financial position (see Note 19).
27.7 Key Management Personnel Compensation The Group’s key management personnel compensation includes the following:
2021 2020 2019 Short-term benefits P 258,281,464 P 222,375,207 P 266,299,232 Post-employment benefits 48,200,811 64,108,171 40,002,345 Employee share option benefit 10,204,332 21,381,914 18,717,409 P 316,686,607 P 307,865,292 P 325,018,986
27.8 Post-employment Plan
The Group has a formal retirement plan established separately for the Parent Company and each of the significant subsidiaries, particularly GERI, EELHI and PHRI. The Group’s retirement fund for its post-employment defined benefit plan is administered and managed by trustee banks. The fair value and the composition of the plan assets as of December 31, 2021 and 2020 are presented in Note 25.3.
The Group’s transactions with the fund mainly pertain to contribution, benefit payments and interest income.
The retirement fund neither provides any guarantee or surety for any obligation of the Group
nor its investments covered by any restrictions or liens.
27.9 Sale of Investment Properties
In 2021, the Group sold certain parcels of land classified as investment properties for a total consideration of P136.6 million to a related party under common ownership. In 2019, the Group sold land and building classified as investment properties at an aggregate amount of P47.1 million to a related party under common ownership (see Note 12). There are no outstanding balances arising from these transactions in the consolidated statements of financial position. No similar transaction occurred in 2020.

- 90 -
28. EQUITY
Capital stock of the Parent Company consists of: Shares Amount 2021 2020 2019 2021 2020 2019 Preferred shares Series “A”- P0.01 par value Authorized 6,000,000,000 6,000,000,000 6,000,000,000 P 60,000,000 P 60,000,000 P 60,000,000 Issued and outstanding 6,000,000,000 6,000,000,000 6,000,000,000 P 60,000,000 P 60,000,000 P 60,000,000 Common shares – P1 par value Authorized 40,140,000,000 40,140,000,000 40,140,000,000 P 40,140,000,000 P 40,140,000,000 P 40,140,000,000 Issued 32,370,865,872 32,370,865,872 32,370,865,872 P 32,370,865,872 P 32,370,865,872 P 32,370,865,872 Treasury shares: Balance at beginning of year ( 471,552,000 ) ( 130,920,000 ) ( 131,420,000 ) ( 1,111,874,917) ( 118,104,398 ) ( 118,555,453 ) Acquisitions during the year ( 42,243,000 ) ( 341,632,000) - ( 156,987,360) ( 994,672,630) - Issuances during the year - 1,000,000 500,000 - 902,111 451,055 Balance at end of year ( 513,795,000 ) ( 471,552,000 ) ( 130,920,000 ) ( 1,268,862,277) ( 1,111,874,917 ) ( 118,104,398 ) Issued and outstanding 31,857,070,872 31,899,313,872 32,239,945,872 P 31,102,003,595 P 31,258,990,955 P 32,252,761,474 Total issued and outstanding shares P 31,162,003,595 P 31,318,990,955 P 32,312,761,474
On June 15, 1994, the SEC approved the listing of the Parent Company’s common shares totaling 140,333,333. The shares were initially issued at an offer price of P4.80 per common share. As of December 31, 2021, there are 2,419 holders of the listed shares, which closed at P3.15 per share as of that date.
The following also illustrates the additional listings made by the Parent Company (in shares): May 23, 1996 – 1.6 billion; January 8, 1997 – 2.1 billion; November 23, 1998 – 2.0 billion; August 19, 1999 – 3.0 billion; October 12, 2005 – 5.5 billion; November 21, 2006 – 10.0 billion and July 17, 2007 – 3.9 billion and 2012 – 3.1 billion. The Parent Company also listed 700.0 million shares in 2013, 300.0 million shares in 2014, and 8.0 million shares in 2015. There were no additional issuance of shares in the succeeding years. As of December 31, 2021, 2020 and 2019, RHGI holds certain number of common shares with costs of P515.2 million, which are treated as treasury shares on the Group’s consolidated financial statements (see Note 28.5).
28.1 Preferred Shares Series “A”
The preferred shares are voting, cumulative, non-participating, non-convertible and non-redeemable with a par value of P0.01 per share. The shares earn dividends at 1% of par value per annum cumulative from date of issue. Dividends paid on cumulative preferred shares amounted to P0.6 million in 2021, 2020 and 2019 (see Note 28.4).
28.2 Common Shares
On May 23, 2013, the Parent Company’s BOD approved a P10.0 billion increase in authorized capital stock (ACS) consisting of 10.0 billion shares with par value of P1.00 per share. On November 20, 2013, the SEC approved the P10.0 billion increase in ACS, of which 2.5 billion shares were subscribed and paid by the Parent Company at a price of P4.29 per share for a total subscription price of P10.7 billion. In 2009, 5,127,556,725 common shares were subscribed and issued through pre-emptive share rights offering. Moreover, shareholders were given four additional share warrants for every five share rights subscribed. For every share warrant, shareholders can avail of one common share at P1.00 per share.

- 91 -
Relative to the share subscription, 4,102,045,364 share warrants were issued of which 4,101,662,246 warrants were exercised while the remaining 383,118 have expired.
28.3 Additional Paid-in Capital
The APIC pertains to the excess of the total proceeds received from the Parent Company’s shareholders over the total par value of the common shares. There were no movements in the Parent Company’s APIC accounts in 2021. In 2020 and 2019, APIC amounting to P1.9 million and P1.0 million, respectively, was recognized by the Parent Company from the exercise of 1,000,000 and 500,000 stock options, respectively. 28.4 Cash Dividends
The details of the Group’s cash dividend declarations, both for preferred and common shares, are as follows:
2021 2020 2019 Declaration date/date of approval by BOD November 10, 2021 December 4, 2020 June 21, 2019 Date of record November 24, 2021 December 18, 2020 July 5, 2019 Date of payment December 10, 2021 January 8, 2021 July 31, 2019 Amounts declared Common P 1,355,083,689 P 1,177,196,572 P 2,378,582,809 Preferred 600,000 600,000 600,000 P 1,355,683,689 P 1,177,796,572 P 2,379,182,809 Dividends per share: Common P 0.04 P 0.04 P 0.07 Preferred P 0.01 P 0.01 P 0.01
28.5 Treasury Shares
This account also includes the Parent Company’s common shares held and acquired by RHGI. The amount of treasury common shares aggregated to P1,784.0 million as at December 31, 2021. The changes in market values of these shares held by RHGI, recognized as fair value gains or losses by the subsidiary, were eliminated in full and not recognized in the consolidated financial statements. In 2019, the Parent Company has reissued 500,000 treasury shares as a result of exercise of the same number of stock options. A portion of the Parent Company’s retained earnings is restricted for dividend declaration up to the cost of treasury shares as of the end of the reporting period.

- 92 -
28.6 ESOP
A total of P10.2 million, P21.4 million and P18.7 million share option benefits expense in 2021, 2020 and 2019, respectively, is recognized and presented as part of Salaries and employee benefits under Operating Expenses account in the consolidated statements of income (see Notes 22 and 25.2).
(a) Parent Company
In 2012, the Parent Company’s BOD approved and the shareholders adopted an ESOP for the Parent Company’s key executive officers.
The options shall generally vest on the 60th birthday of the option holder and may be exercised until the date of his/her retirement from the Parent Company. The exercise price shall be at a 15% discount from the volume weighted average closing price of the Parent Company’s shares for nine months immediately preceding the date of grant. Pursuant to this ESOP, on November 6, 2012, the Parent Company granted share options to certain key executives to subscribe to 235.0 million common shares of the Parent Company, at an exercise price of P1.77 per share. In 2013, additional share options were granted to certain key executives to subscribe to 20.0 million common shares of the Parent Company at an exercise price of P2.33 per share. Additional 40.0 million share options were granted in 2014 at an average exercise price of P3.00 per share. In 2019, additional 10.0 million share options were granted at an exercise price of P1.77. There were no additional share options granted in 2018, and 2017. In 2021 and 2019, 15.0 million and 10.0 million share options, respectively, were forfeited due to resignation of certain key executive officers. There was no forfeiture due to resignation in 2020. A total of 10.0 million, 5.0 million and 10.0 million share options have vested in 2021, 2020 and 2019, respectively. A total of 1.0 million and 0.5 million share options were exercised at a price of P1.77 per share in 2020 and 2019, respectively. There was no similar transaction in 2021. The fair value of the option granted was estimated using a variation of the Black-Scholes valuation model that takes into account factors specific to the ESOP. The following principal assumptions were used in the valuation:
Option life 6.08 to 30.17 years Share price at grant date P 2.54 to P 4.52 Exercise price at grant date P 1.77 to P 3.23 Fair value at grant date P 0.98 to P 2.15 Average standard deviation of share price return 10.98 % Average dividend yield 0.82 % Average risk-free investment rate 3.93 %

- 93 -
The underlying expected volatility was determined by reference to historical date of the Parent Company’s shares over a period of time consistent with the option life. The Parent Company recognized a total of P10.2 million, P21.4 million and P18.7 million share-based executive compensation in 2021, 2020 and 2019, respectively, as part of Salaries and employee benefits and a corresponding credit in Retained Earnings (see Note 25.2).
(b) GERI
In 2011, the BOD of GERI approved and the stockholders adopted an ESOP for its key executive officers.
Under the ESOP, GERI shall initially reserve for exercise of share options up to 500.0 million common shares of the GERI’s outstanding shares to be issued, in whole or in part, out of the authorized but unissued shares. Share options may be granted within 10 years from the adoption of the ESOP and may be exercised within seven years from date of grant.
The options shall vest within three years from date of grant and the holder of an option may exercise only a third of the option at the end of each year of the three-year period. The exercise price shall be at a 15% discount from the volume weighted average closing price of the GERI’s shares for twelve months immediately preceding the date of grant. As of December 31, 2021, pursuant to this ESOP, GERI has granted the option to its key company executives to subscribe to 400.0 million shares of GERI. An option holder may exercise in whole or in part his vested option provided, that, an option exercisable but not actually exercised within a given year shall accrue and may be exercised at any time thereafter but prior to the expiration of said option’s life cycle. All 400.0 million options were fully vested as of December 31, 2019. However, none of these have been exercised yet by any of the option holders as of December 31, 2021. The fair value of the option granted was estimated using a variation of the Black-Scholes valuation model that takes into account factors specific to the ESOP. The following principal assumptions were used in the valuation:
Average option life 7 years Share price at grant date P1.02 to P2.10 Exercise price at grant date P1.0 to P1.93 Fair value at grant date P0.24 to P2.27 Standard deviation of share price return 12.16% to 57.10% Risk-free investment rate 2.14% to 2.59%
The underlying expected volatility was determined by reference to historical date of the GERI’s shares over a period of time consistent with the option life.

- 94 -
GERI recognized a total of P0.9 million and P3.3 million share-based compensation in 2019, as part of Salaries and employee benefits and a corresponding credit in Non-controlling Interest, respectively, (see Note 25.2). There was no share-based compensation in 2021 and 2020 since all the options fully vested as of December 31, 2019.
28.7 Perpetual Capital Securities
On April 11, 2018, the Group issued bonds amounting $200.0 million. The bonds were issued with a nominal interest of 5.375% per annum and interest is payable semi-annually in arrears every April 11 and October 11. The bonds are currently listed in the SGX-ST. The financial instruments are treated as equity securities. These bonds may be voluntarily redeemed by the Parent Company on April 11, 2023 or on any distribution date thereafter [see Note 3.1(h)]. In 2021, the Group fully redeemed its perpetual capital securities for P9.8 billion resulting in a gain on redemption amounting to P484.3 million. The gain was directly credited to the consolidated retained earnings as presented in the 2021 consolidated statement of changes in equity. 28.8 Revaluation Reserves
The components and reconciliation of items of other comprehensive income presented in the consolidated statement of changes in equity at their aggregate amount under Revaluation Reserves account, are shown below and in the succeeding page. Financial Retirement Cross Assets at Benefit Translation Currency Equity FVOCI Obligation Reserves Swaps Reserves (Note 9) (Note 25.3) (Note 2) (Note 30) (Note 1) Total Balance as of January 1, 2021 ( P 2,466,854,141 ) P 272,676,077 ( P 393,248,156 ) ( P 253,255,979 ) ( P 861,828,431 ) ( P 3,702,510,630 ) Remeasurements of retirement benefit post-employment obligation - 325,125,100 - - - 325,125,100 Fair value losses on financial assets at FVOCI 1,347,392,142 - - - - 1,347,392,142 Fair value losses on cash flow hedge - - - 199,713,502 - 199,713,502 Share of non-controlling interest ( 24,690,393 ) 1,100,297 - - - ( 23,590,096 ) Share in OCI of associates - - 20,926,197 - - 20,926,197 Exchange difference on translating foreign operations - 47,027,439 - - 47,027,439 Effect of change in percentage of ownership - - - - 9,488,420,708 9,488,420,708 Other comprehensive income (loss) before tax 1,322,701,749 326,225,397 67,953,636 199,713,502 9,488,420,708 11,405,014,992 Tax income (expense) - ( 62,880,238 ) ( 11,756,859 ) - - ( 74,637,097 ) Other comprehensive income (loss) after tax 1,332,701,749 263,345,159 56,196,777 199,713,502 9,488,420,708 11,330,377,895 Balance as of December 31, 2021 ( P 1,144,152,392 ) P 536,021,236 ( P 337,051,379 ) ( P 53,542,477 ) P 8,626,592,277 ( P 7,627,867,265 ) Balance as of January 1, 2020 ( P 2,165,438,907 ) P 17,362,375 ( P 382,828,958 ) ( P 108,506,018 ) ( P 861,828,431 ) ( P 3,501,239,939 ) Remeasurements of retirement benefit post-employment obligation - 354,133,354 - - - 354,133,354 Fair value losses on financial assets at FVOCI ( 323,225,082 ) - - - - ( 323,225,082 ) Fair value losses on cash flow hedge - - - ( 144,749,961 ) - ( 144,749,961 ) Share of non-controlling interest 21,809,848 5,945,816 - - - 27,755,664 Share in OCI of associates - 1,474,538 - - - 1,474,538 Exchange difference on translating foreign operations - - ( 14,884,569 ) - - ( 14,884,569 ) Other comprehensive income (loss) before tax ( 301,415,234 ) 361,553,708 ( 14,884,569 ) ( 144,749,961 ) - ( 99,496,056 ) Tax income (expense) - ( 106,240,006 ) 4,465,371 - - ( 101,774,635 ) Other comprehensive income (loss) after tax ( 301,415,234 ) 255,313,702 ( 10,419,198 ) ( 144,749,961 ) - ( 201,270,691 ) Balance as of December 31, 2020 ( P 2,466,854,141 ) P 272,676,077 ( P 393,248,156 ) ( P 253,255,979 ) ( P 861,828,431 ) ( P 3,702,510,630 )

- 95 -
Financial Retirement Cross Assets at Benefit Translation Currency Equity FVOCI Obligation Reserves Swaps Reserves (Note 9) (Note 25.3) (Note 2) (Note 30) (Note 1) Total Balance as of January 1, 2019 ( P 2,193,648,774 ) P 258,382,240 ( P 380,437,530 ) P 184,863,310 ( P 954,871,520 ) ( P 3,085,712,274 ) Remeasurements of retirement benefit post-employment obligation - ( 350,479,591 ) - - - ( 350,479,591 ) Fair value gains on financial assets at FVOCI 23,271,788 - - - - 23,271,788 Fair value losses on cash flow hedge - - - ( 293,369,328 ) - ( 293,369,328 ) Effect of change in percentage of ownership - - - - 93,043,089 93,043,089 Share of non-controlling interest 4,938,079 15,732,908 - - - 20,670,987 Share in OCI of associates - ( 11,417,059 ) - - - ( 11,417,059 ) Exchange difference on translating foreign operations - - ( 3,326,261 ) - - ( 326,261 ) Other comprehensive income (loss) before tax 28,209,867 ( 346,163,742 ) ( 3,326,261 ) ( 293,369,328 ) 93,043,089 ( 521,606,375 ) Tax income - 105,143,877 934,833 - - 106,078,710 Other comprehensive income (loss) after tax 28,209,867 ( 241,019,865 ) ( 2,391,428 ) ( 293,369,328 ) 93,043,089 ( 415,527,665 )
Balance as of December 31, 2019 ( P 2,165,438,907 ) P 17,362,375 ( P 382,828,958 ) ( P 108,506,018 ) ( P 861,828,431 ) ( P 3,501,239,939 )
In 2021, MREIT offered and sold 949,837,500 shares or 37.51% ownership interest held by the Parent Company, through an initial public offering for P16.10 per share or P14.7 billion. The sale of shares did not result in Parent Company’s loss of control over MREIT. The difference between the proportionate net book value and the consideration received amounting to P10.5 billion is credited to Equity reserves under Revaluation Reserves in the 2021 consolidated statement of changes in equity. Also in 2021, the Parent Company acquired additional shares of PCMI and STLI for P2.0 billion and P1.8 million, respectively. The difference between the proportionate net book value and the consideration received of PCMI and STLI resulted in P1.1 billion debit and P29.6 million credit, respectively, to Equity reserves under Revaluation Reserves in the 2021 consolidated statement of changes in equity.
29. EARNINGS PER SHARE
EPS amounts were computed as follows: 2021 2020 2019
Net profit attributable to the Parent Company’s shareholders P13,434,466,763 P 9,885,989,490 P 17,931,417,072 Dividends on cumulative preferred shares Series “A” ( 600,000) ( 600,000 ) ( 600,000 ) Distribution to holders of perpetual securities ( 151,963,438) ( 535,258,625 ) ( 562,913,000 ) Profit available to the Parent Company’s common shareholders P13,281,903,325 P 9,350,130,865 P 17,367,904,072 Divided by weighted average number of outstanding common shares 31,447,978,960 31,662,256,883 31,819,612,539 Basic EPS P 0.422 P 0.295 P 0.546 Divided by weighted average number of outstanding common shares and potential dilutive shares 31,544,782,959 31,762,511,001 31,977,656,102 Diluted EPS P 0.421 P 0.294 P 0.543

- 96 -
Unexercised share warrants have already expired; hence, were no longer included in the computation. In addition, the potentially dilutive outstanding share options totaling 233.5 million in 2021, 248.5 million in 2020, and 249.5 million in 2019 were also considered in the computations (see Note 28.6).
30. CROSS CURRENCY SWAPS In 2017, the Parent Company entered into a cross currency swap agreement with a local bank. Under the agreement, the Parent Company will receive a total of $98.87 million to be paid on a quarterly basis beginning March 2019 up to December 2022 plus interest based on three-month LIBOR plus a certain spread. In exchange, the Parent Company shall make fixed quarterly payments in Philippine peso plus a fixed interest of 4.91%.
In 2019, another cross currency swap was also agreed upon with the same bank. The Parent Company will receive $95.62 million to be paid on a quarterly basis beginning December 2020 up to September 2024 plus interest based on three-month LIBOR plus a certain spread. The Parent Company shall make fixed quarterly payments in Philippine peso plus a fixed interest of 4.82%. The Parent Company has designated the cross currency swaps as hedging instruments to hedge the risk in changes in cash flows of its loan denominated in U.S. dollar as an effect of changes in foreign currency exchange rates and interest rates [see Notes 15.1(a) and 15.1(k)].
The table below sets out information about the Group’s hedging instruments and the related carrying amounts as of December 31:
USD Notional Derivative Amount Liabilities
2021 Cash flow hedge – Cross currency swaps $ 90,457,359 P 147,793,407
2020 Cash flow hedge – Cross currency swaps $ 139,080,716 P 758,026,441
The hedging instruments have a negative fair value of P147.8 million in 2021 and P758.0 million in 2020. These are presented as Derivative liabilities under Other Current Liabilities in the consolidated statements of financial position (see Note 19). The Parent Company recognized a total of P199.7 million unrealized gain on cash flow hedges in 2021, and P144.7 million and P293.4 million unrealized loss on cash flow hedges in 2020 and 2019, respectively. These are presented as part of other comprehensive income in the consolidated statements of comprehensive income. As of December 31, 2021, the Parent Company has assessed that the cross currency swaps designated as cash flow hedges will continue to be highly effective over the term of the agreement; hence, the Parent Company expects to continuously use hedge accounting on the hedging relationship of its cross currency swaps and on its interest-bearing loans.

- 97 -
31. COMMITMENTS AND CONTINGENCIES
31.1 Lease Commitments – Group as Lessor
The Group is subject to risk incidental to the operation of its office and commercial properties, which include, among others, changes in market rental rates, inability to renew leases upon lease expiration, and inability to collect rent from tenants due to bankruptcy or insolvency of tenants. Majority of the Group’s revenue from rental properties are derived from commercial and BPO-based tenants. If the expected growth, particularly from BPO-based tenants, does not meet management’s expectations, or in the case of commercial tenants more stringent health measures are imposed resulting to further temporary or permanent closures of commercial establishments, the Group may not be able to lease their properties in a timely manner or collect rent at profitable rates. To mitigate these risks, tenants pay security deposits and advance rent equal to three to six months’ rent, which are forfeited in case a tenant pre-terminates without prior notice or before the expiry of lease term without cause. In addition, tenants are usually required to pay the monthly rent in advance on a monthly basis, without need of further demand. Security deposits and advance rent are presented as part of Unearned income under Other Current Liabilities and Deferred rent under Other Non-current Liabilities in the consolidated statements of financial position (see Note 19). (a) Operating Leases
The Group is a lessor under several non-cancellable operating leases covering office, commercial and properties for a period of two to ten years with annual escalation rates of 5% to 10% (see Note 12). Future minimum lease receivables under these agreements are as follows:
2021 2020 2019
Within one year P 15,346,826,374 P 12,632,761,053 P 16,115,991,723 After one year but not more than two years 19,794,874,132 20,521,928,927 18,650,355,567 After two years but not more than three years 20,409,706,265 21,458,334,550 20,985,308,875 After three years but not more than four years 22,140,397,894 23,144,750,760 21,954,423,486 After four years but not more than five years 22,902,976,810 25,236,915,271 23,504,678,022 More than five years 28,951,568,529 29,407,145,172 27,249,075,851 P129,546,350,004 P 132,401,835,733 P128,459,833,524

- 98 -
(b) Finance Lease
In 2019, the Group, through GERI, subleased its development rights over the undivided portions of a land co-terminus with the term of its head lease. As a result, the Group recognized finance lease receivable amounting to P669.3 million, and gain on finance lease amounting to P350.2 million which is presented as Gain on finance lease under Interest and Other Income account (see Note 23). Accordingly, the right-of-use asset amounting to P319.1 million was derecognized (see Note 13). Finance lease receivable arising from the transaction is presented as part Trade and Other Receivables account in the consolidated statements of financial position (see Note 6). Interest income on the finance lease amounted to P42.1 million, P45.5 million and P44.3 million in 2021, 2020 and 2019, respectively, and is presented as part of Interest and Other Income account in the consolidated statements of income.
The maturity analysis of finance lease receivable at December 31 is as follows:
Net Lease Collection Interest Income Present Value 2021 Within one year P 88,070,235 ( P 38,419,379 ) P 49,650,856 After one year but not more than two years 88,699,119 ( 34,355,507 ) 54,343,612 After two years but not more than three years 89,346,871 ( 29,909,018 ) 59,437,853 After three years but not more than four years 90,014,054 ( 25,047,216 ) 64,966,838 After four years but not more than five years 58,545,847 ( 24,407,402 ) 34,138,445 More than five years 679,150,148 ( 368,782,763 ) 310,367,385 P 1,093,826,274 ( P 520,921,285 ) P 572,904,989 2020 Within one year P 94,764,348 ( P 42,130,838 ) P 52,633,510 After one year but not more than two years 88,070,235 ( 38,419,379 ) 49,650,856 After two years but not more than three years 88,699,119 ( 34,355,507 ) 54,343,612 After three years but not more than four years 89,346,871 ( 29,909,018 ) 59,437,853 After four years but not more than five years 90,014,054 ( 25,047,216 ) 64,966,838 More than five years 705,431,648 ( 393,190,165 ) 312,241,483 P 1,156,326,275 ( P 563,052,123 ) P 593,274,152
31.2 Others
As at December 31, 2021 and 2020, the Group has unused long-term credit facilities amounting to P16.8 billion and P11.9 billion, respectively. In addition, the Group is committed to certain project and capital expenditures as disclosed in Note 4.4. There are other commitments and contingent liabilities that arise in the normal course of operations of the Group which are not reflected in the consolidated financial statements. The management of the Group is of the opinion that losses, if any, from these items will not have any material effect on its consolidated financial statements.

- 99 -
32. RISK MANAGEMENT OBJECTIVES AND POLICIES The Group has various financial instruments such as cash and cash equivalents, financial assets at FVOCI, interest-bearing loans and borrowings, bonds payable, trade receivables and payables which arise directly from the Group’s business operations. The financial liabilities were issued to raise funds for the Group’s capital expenditures. The Group does not actively engage in the trading of financial assets for speculative purposes.
32.1 Foreign Currency Sensitivity
Most of the Group’s transactions are carried out in Philippine peso, its functional currency. Exposures to currency exchange rates arise mainly from the Group’s U.S. dollar-denominated cash and cash equivalents, loans and bonds payable, which have been used to fund new projects and to refinance certain indebtedness for general corporate purposes. As of December 31, 2021 and 2020, net foreign currency-denominated financial liabilities in U.S. dollar, translated into Philippine Peso at the closing rate, amounted to P29.1 billion and P20.3 billion, respectively. Management assessed that the reasonably possible change in exchange rates of Philippine Peso to U.S. dollar, based on the average market volatility in exchange rates, using standard deviation, in the previous 12 months at 68% confidence level is 4.11% and 2.69% in 2021 and 2020, respectively. If the exchange rate increased or decreased by such percentages, the profit before tax in 2021 and 2020 would have changed by P1006.7 million and P547.2 million, respectively.
Exposures to foreign exchange rates vary during the year depending on the volume of overseas transactions and mainly affect consolidated profit or loss of the Group. There are no material exposures on foreign exchange rate that affect the Group’s consolidated other comprehensive income. Nonetheless, the analysis above is considered to be representative of the Group’s currency risk.
32.2 Interest Rate Sensitivity
The Group interest risk management policy is to minimize interest rate cash flow risk exposures to changes in interest rates. The Group maintains a debt portfolio unit of both fixed and floating interest rates. Most long-term borrowings are subject to fixed interest rate while other financial assets subject to variable interest rates. The Group’s ratio of fixed to floating rate debt stood at 1.68:1.00 and 1.99:1.00 as of December 31, 2021 and 2020, respectively.
The sensitivity of the consolidated net results in 2021 and 2020 to a reasonably possible change of 1.0% in floating rates is P303.1 million and P286.9 million, respectively. The sensitivity of the consolidated equity in 2021 and 2020 to a reasonably possible change of 1.0% in floating rates is P227.3 million and P200.8 million, respectively. The calculations are based on the Group’s financial instruments held at each reporting date. All other variables are held constant.

- 100 -
32.3 Credit Risk
The Group’s credit risk is attributable to trade receivables, rental receivables and other financial assets. The Group maintains defined credit policies and continuously monitors defaults of customers and other counterparties, identified either individually or by group, and incorporates this information into its credit risk controls. Where available at a reasonable cost, external credit ratings and/or reports on customers and other counterparties are obtained and used. The Group’s policy is to deal only with creditworthy counterparties. In addition, for a significant proportion of rentals, advance payments are received to mitigate credit risk. Generally, the maximum credit risk exposure of financial assets is the carrying amount of the financial assets and contract assets as shown in the consolidated statements of financial position (or in the detailed analysis provided in the notes to consolidated financial statements), as summarized below.
Notes 2021 2020 Cash and cash equivalents 5 P43,794,605,919 P 40,166,755,908 Trade receivables 6 25,554,518,598 26,015,811,682 Rent receivables 6 6,848,362,991 4,412,404,797 Other receivables 6 10,018,186,031 9,181,963,292 Advances to associates and other related parties 6 4,551,587,462 4,227,173,772 Contract assets 20.2 19,922,247,362 19,380,726,313 Guarantee and other deposits 14 877,329,410 1,186,605,535 P 111,566,837,773 P104,571,441,299
(a) Cash and Cash Equivalents
The credit risk for cash and cash equivalents is considered negligible since the counterparties are reputable banks with high quality external credit ratings. Included in the cash and cash equivalents are cash in banks and short-term placements which are insured by the Philippine Deposit Insurance Corporation up to a maximum coverage of P0.5 million for every depositor per banking institution.
(b) Trade and Other Receivables The Parent Company applies the PFRS 9 simplified approach in measuring ECL which uses a lifetime expected loss allowance for all trade receivables and other receivables.
To measure the expected credit losses, trade receivables and other receivables have been grouped based on shared credit risk characteristics and the days past due (age buckets). The other receivables relate to receivables from both third and related parties other than trade receivables and have substantially the same risk characteristics as the trade receivables. The Parent Company has therefore concluded that the expected loss rates for trade receivables are a reasonable approximation of the loss rates for the other assets.
- 101 -
The expected loss rates are based on the payment profiles of sales over a period of 36 months before December 31, 2021, and the corresponding historical credit losses experienced within such period. The historical loss rates are adjusted to reflect current and forward-looking information on macroeconomic factors affecting the ability of the customers to settle the receivables. The Group identifies headline inflation rate and bank lending rate to be the most relevant factors and accordingly adjusts the historical loss rates based on expected changes in these factors. The total loss allowance based on the provision matrix is P773.8 million and P852.1 million as of December 31, 2021 and 2020, respectively.
The Group considers credit enhancements in determining the expected credit loss. Trade receivables from real estate sales are collateralized by the real properties sold while rental receivables are secured to the extent of advanced rental and security deposits received from lessees. Further, customers are typically required to issue post-dated checks, which provide additional credit enhancement. The estimated fair value of collateral and other security enhancements held against trade receivables are presented below.
Gross Fair Maximum Value of Net Exposure Collaterals Exposure
2021 Real estate sales receivables P 24,648,043,135 P47,366,699,973 P - Contract assets 19,922,247,362 39,245,568,476 - Rental receivables 6,848,362,991 6,868,267,197 - P 51,418,653,488 P93,480,535,646 P -
2020 Real estate sales receivables P 25,161,593,375 P 51,002,905,196 P - Contract assets 19,380,726,313 36,253,449,145 - Rental receivables 4,412,404,797 7,685,122,965 - P 48,954,724,485 P 94,941,477,306 P -
Some of the unimpaired trade receivables and other receivables, which are mostly related to real estate sales, are past due as at the end of the reporting period and are presented below.
2021 2020 Current (not past due) P 43,932,107,669 P 41,196,951,543 Past due but not impaired: More than one month but not more than 3 months 974,190,192 1,064,885,684 More than 3 months but not more than 6 months 548,006,308 537,113,120 More than 6 months but not more than one year 819,948,803 681,867,418 More than one year 698,402,110 356,535,785 P 46,972,655,082 P 43,837,353,550

- 102 -
(c) Advances to Associates and Other Related Parties ECL for advances to associates, and other related parties, and other trade receivables from related parties, are measured and recognized using the liquidity approach. Management determines possible impairment based on the related party’s ability to repay the advances upon demand at the reporting date taking into consideration the historical defaults from the related parties.
The Parent Company does not consider any significant risks in the advances to related parties as these are entities whose credit risks for liquid funds are considered negligible, have committed to financially support these related parties as part of AGI’s long-term corporate strategy. As of December 31, 2021 and 2020, impairment allowance is not material.
(d) Guarantee and Other Deposits
The credit risk for guarantee and other deposits is considered negligible as the Group has ongoing transactions with the counterparties and the latter are considered to be with sound financial condition and sufficient liquidity.
32.4 Liquidity Risk
The Group manages its liquidity needs by carefully monitoring scheduled debt servicing payments for long-term financial liabilities as well as cash outflows due in a day-to-day business. Liquidity needs are monitored in various time bands, on a day-to-day and week-to-week, as well as on the basis of a rolling 30-day projection. Long-term needs for a six-month and one-year period are identified monthly. The Group maintains cash to meet its liquidity requirements for up to 60-day periods. Excess cash is invested in time deposits or short-term marketable securities. Funding for long-term liquidity needs is additionally secured by an adequate amount of committed credit facilities and the ability to sell long-term financial assets.
As at December 31, 2021 and 2020, the Group’s financial liabilities have contractual maturities which are presented below.
Within 1 to 5 More than Notes 1 Year Years 5 Years 2021: Interest-bearing loans and borrowings* 15 P 13,774,904,323 P 32,538,000,744 P 10,235,411,126 Trade and other payables 17 22,593,431,337 - - Bonds and notes payable* 16 1,846,322,250 28,001,900,250 17,506,119,750 Redeemable preferred shares* 18 251,597,580 - - Advances from associates and other related parties 27.3 3,243,336,539 - - Subscription payable 19 1,114,665,008 - - Other liabilities 19 2,632,525,561 2,144,942,479 - P 45,456,782,590 P 62,684,843,473 P 27,741,530,876 2020: Interest-bearing loans and borrowings* 15 P 21,278,938,909 P 22,801,992,603 P 195,629,735 Trade and other payables 17 22,701,125,783 - - Bonds and notes payable* 16 1,846,322,250 29,154,792,750 18,199,639,500 Redeemable preferred shares* 18 257,384,324 251,597,580 - Advances from associates and other related parties 27.3 2,683,950,114 - - Subscription payable 19 1,114,665,008 - - Other liabilities 19 3,164,723,364 2,168,836,637 - P 53,047,109,752 P 54,377,219,570 P 18,395,269,235
*Inclusive of future interest costs
- 103 -
The contractual maturities in the above reflect the gross cash flows, which may differ from the carrying values of the liabilities at the reporting dates.
32.5 Other Price Risk Sensitivity
The Group’s market price risk arises from its financial assets carried at fair value. It manages its risk arising from changes in market price by monitoring the changes in the market price of the investments.
For equity securities listed in the Philippines, the observed volatility rates of the fair values of the Group’s investments held at fair value is determined based on the average market volatility in exchange rates, using standard deviation, in the previous 12 months, estimated at 99% level of confidence. Their impact on the Group’s consolidated net profit and consolidated equity as at December 31, 2021 and 2020 are summarized below.
Observed Impact on Equity Volatility Rates Increase Decrease 2021 Investment in equity securities: Holding company +/-5.98% P 64,836,746 ( P 64,836,746 ) Manufacturing +/-6.96% 63,977,136 ( 63,977,136 ) 2020 Investment in equity securities: Holding company +/-9.00% P 81,828,814 ( P 81,828,814 ) Manufacturing +/-6.47% 26,931,746 ( 26,931,746 )
The investments in listed equity securities are considered long-term strategic investments. In accordance with the Group’s policies, no specific hedging activities are undertaken in relation to these investments. The investments are continuously monitored and voting rights arising from these equity instruments are utilized in the Group’s favor. The Group is also exposed to other price risk in respect of its derivative financial assets and liabilities arising from foreign exchange margins trading spot and forward, and interest rate changes. These financial instruments will continue to be measured at fair value based on net present value computation.
33. CATEGORIES AND FAIR VALUES OF FINANCIAL ASSETS AND FINANCIAL LIABILITIES 33.1 Carrying Amounts and Fair Values by Category The carrying values and fair values of the categories of financial assets and financial liabilities presented in the consolidated statements of financial position are shown below and in the succeeding page.
2021 2020 Notes Carrying Values Fair Values Carrying Values Fair Values Financial Assets At amortized costs: Cash and cash equivalents 5 P 43,794,605,919 P 43,794,605,919 P 40,166,755,908 P 40,166,755,908 Trade and other receivables – net 6, 27.2 46,972,655,082 47,357,915,588 43,837,353,550 44,051,691,412 Guarantee and other deposits 14 877,329,410 877,329,410 1,186,605,535 1,186,605,535 P 91,644,590,411 P 92,029,850,917 P 85,190,714,993 P 85,405,052,855 Financial assets at FVOCI – Equity securities 9 P 5,760,368,447 P 5,760,368,447 P 4,174,886,430 P 4,176,886,430

- 104 -
2021 2020 Notes Carrying Values Fair Values Carrying Values Fair Values Financial Liabilities At amortized costs: Interest-bearing loans and borrowings 15 P 51,649,704,598 P 51,056,234,787 P 45,578,166,417 P 48,094,617,843 Bonds and notes payable 16 41,982,042,246 42,567,948,736 40,282,855,986 43,032,299,663 Redeemable preferred shares 18 251,597,580 251,597,580 503,195,160 503,195,160 Trade and other payables 17 22,593,431,337 22,593,431,337 22,701,125,783 22,701,125,783 Advances from associates and
other related parties 27.3 3,243,336,539 3,243,336,539 2,683,950,114 2,683,950,114 Subscription payable 19 1,114,665,008 1,114,665,008 1,114,665,008 1,114,665,008 Other liabilities 19 4,777,468,040 4,777,468,040 5,333,560,001 5,333,560,001 P 125,612,245,348 P125,604,682,027 P 118,197,518,469 P 123,463,413,572 Financial liabilities at FVTPL – Derivative liabilities 19, 30 P 147,793,407 P 147,793,407 P 758,026,441 P 758,026,441
See Notes 2.5, 2.6 and 2.11 for a description of the accounting policies for each category of financial instrument. A description of the Group’s risk management objectives and policies for financial instruments is provided in Note 32. 33.2 Offsetting of Financial Assets and Financial Liabilities The Group has not set-off financial instruments in 2021 and 2020 and does not have relevant offsetting arrangements, except as disclosed in Notes 27.2, 27.3 and 15.3(g). Currently, all other financial assets and financial liabilities are settled on a gross basis; however, each party to the financial instrument (particularly related parties) will have the option to settle all such amounts on a net basis in the event of default of the other party through approval by both parties’ BOD and shareholders. As such, the Group’s outstanding receivables from and payables to the same related parties can be potentially offset to the extent of their corresponding outstanding balances. Further, certain trade receivables that were assigned on a with-recourse basis may be offset against the related outstanding borrowings from local banks (see Notes 15.2 and 15.4).
34. FAIR VALUE MEASUREMENT AND DISCLOSURES
34.1 Fair Value Hierarchy
In accordance with PFRS 13, Fair Value Measurement, the fair value of financial assets and liabilities and non-financial assets which are measured at fair value on a recurring or non-recurring basis and those assets and liabilities not measured at fair value but for which fair value is disclosed in accordance with other relevant PFRS, are categorized into three levels based on the significance of inputs used to measure the fair value. The fair value hierarchy has the following levels:
Level 1: quoted prices (unadjusted) in active markets for identical assets or liabilities that an entity can access at the measurement date;
Level 2: inputs other than quoted prices included within Level 1 that are observable for the asset or liability, either directly (i.e., as prices) or indirectly (i.e., derived from prices); and,
Level 3: inputs for the asset or liability that are not based on observable market data (unobservable inputs).

- 105 -
The level within which the asset or liability is classified is determined based on the lowest level of significant input to the fair value measurement.
For purposes of determining the market value at Level 1, a market is regarded as active if quoted prices are readily and regularly available from an exchange, dealer, broker, industry group, pricing service, or regulatory agency, and those prices represent actual and regularly occurring market transactions on an arm’s length basis. For investments which do not have quoted market price, the fair value is determined by using generally acceptable pricing models and valuation techniques or by reference to the current market of another instrument which is substantially the same after taking into account the related credit risk of counterparties, or is calculated based on the expected cash flows of the underlying net asset base of the instrument.
When the Parent Company uses valuation technique, it maximizes the use of observable market data where it is available and relies as little as possible on entity specific estimates. If all significant inputs required to determine the fair value of an instrument are observable, the instrument is included in Level 2. Otherwise, it is included in Level 3.
34.2 Financial Instruments Measurement at Fair Value
The table below shows the fair value hierarchy of the Group’s classes of financial assets and financial liabilities measured at fair value in the consolidated statements of financial position on a recurring basis as at December 31, 2021 and 2020 (see Notes 9 and 30). Level 1 Level 2 Level 3 Total 2021 Financial assets –
Equity securities P 3,098,501,606 P - P2,661,866,841 P 5,760,368,447 Financial liability – Derivatives P - P 147,793,407 P - P 147,793,407
2020 Financial assets –
Equity securities P 1,902,709,257 P - P 2,272,177,173 P 4,174,886,430 Financial liability – Derivatives P - P 758,026,441 P - P 758,226,041
Described below and in the succeeding page are the information about how the fair values of the Group’s classes of financial assets are determined.
(a) Equity Securities
As at December 31, 2021 and 2020, instruments included in Level 1 comprise equity securities classified as financial assets at FVOCI. These securities were valued based on their market prices quoted in the PSE at the end of each reporting period.
In 2021 and 2020, the fair value of these equity securities is determined using discounted cash flows valuation technique with discount rate of 6.9% and 8.1% in 2021 and 2020, respectively, and growth rate of 3.6% and 2.6% in 2021 and 2020, respectively. The forecasted annual net cash flows were also derived by taking into consideration the market conditions, economic factors, and historical performance and future projects of the investee company.

- 106 -
A reconciliation of the carrying amounts of Level 3 FVOCI equity securities at the beginning and end of 2021 and 2020 is shown below.
2021 2020
Balance at beginning of year P 2,272,177,173 P 2,632,232,316 Fair value gains (losses) 389,689,668 ( 360,055,143 )
Balance at end of year P 2,661,866,841 P 2,272,177,173
The Group recognized P957.7 million fair value gains and P36.7 million fair value gains in 2021 and 2020, respectively, on the Level 1 equity securities. For the Level 3 equity securities, the Group recognized P389.7 million fair value gains and P360.1 million fair value losses in 2021 and 2020, respectively (see Notes 9 and 28.8).
(b) Derivatives The fair value of derivative financial instruments, related to the cross currency swaps , is
measured at inputs other than quoted prices that are indirectly observable for the financial instruments and are categorized within Level 2 (see Note 30). The fair value is determined through valuation techniques using the net present value computation. The future principal and interest receipts and payments are discounted using readily observable reference rates at the date of valuation. The resulting net present value is translated into Philippine peso using the U.S. dollar exchange rate at the date of valuation to arrive at the fair value of the derivative financial instruments.
34.3 Financial Instruments Measured at Amortized Cost for which Fair Value is
Disclosed
The Group’s financial assets which are not measured at fair value in the consolidated statements of financial position but for which fair value is disclosed include cash and cash equivalents, which are categorized as Level 1, and trade and other receivables – net, and guarantee and other deposits which are categorized as Level 3. Financial liabilities which are not measured at fair value but for which fair value is disclosed pertain bonds payable, which are categorized as Level 1, and interest-bearing loans and borrowings, redeemable preferred shares, trade and other payables and advances from associates and other related parties which are categorized as Level 3. The fair value of the Group’s debt securities which consist of corporate bonds is estimated by reference to quoted bid price in active market at the end of the reporting period and is categorized within Level 1. For financial assets with fair values included in Level 1, management considers that the carrying amounts of these financial instruments approximate their fair values due to their short-term duration. The fair values of the financial assets and financial liabilities included in Level 3, which are not traded in an active market, are determined based on the expected cash flows of the underlying net asset or liability based on the instrument where the significant inputs required to determine the fair value of such instruments are not based on observable market data. Further, management considers that the carrying amounts of these financial instruments approximate their fair values as the effect of discounting is insignificant.

- 107 -
34.4 Fair Value of Investment Properties Measured at Cost for which Fair Value is Disclosed
The fair value of the Group’s investment properties earning rental income was determined through discounted cash flows valuation technique. The Group uses assumption that are mainly based on market conditions existing at each reporting period, such as: the receipt of contractual rentals; expected future market rentals; void periods; maintenance requirements; and appropriate discount rates. These valuations are regularly compared to actual market yield data and actual transactions by the Group and those reported by the market. The expected future market rentals are determined on the basis of current market rentals for similar properties in the same location and condition.
The Group determines the fair value of idle properties through appraisals by independent valuation specialists using market – based valuation approach where prices of comparable properties are adequate for specific market factors such as location and condition of the property. As at December 31, 2021 and 2020, the fair value of the Group’s investment properties is classified within Level 3 of the fair value hierarchy. The Level 3 fair value of the investment properties was determined using the income approach which is performed with values derived using a discounted cash flow model. The income approach uses future free cash flow projections and discounts them to arrive at a present value. The discount rate is based on the level of risk of the business opportunity and costs of capital. The most significant inputs into this valuation approach are the estimated expected future annual cash inflow and outgoing expenses, anticipated increase in market rental, discount rate and terminal capitalization rate. Also, there were no transfers into or out of Level 3 fair value hierarchy in 2021 and 2020.
35. CAPITAL MANAGEMENT OBJECTIVES, POLICIES AND PROCEDURES
The Group’s capital management objective is to ensure its ability to continue as a going concern and to provide an adequate return to shareholders by pricing products and services commensurately with the level of risk. The Group manages its capital structure and makes adjustments to it, in the light of changes in economic conditions. It monitors capital using the debt-to-equity ratio using amounts of contracted borrowings versus total equity. Capital for the reporting periods under review is summarized as follows:
2021 2020
Interest-bearing loans and borrowings P 51,649,704,598 P 45,578,166,417 Bonds and notes payable 41,982,042,246 40,282,855,986
P 93,631,746,844 P 85,861,022,403 Total equity P 229,703,990,947 P212,530,480,197
Debt-to-equity ratio 0.41 : 1.00 0.40 : 1.00

- 108 -
The Group has complied with its covenant obligations, including maintaining the required debt-to-equity ratio for the years presented above.
36. RECONCILIATION OF LIABILITIES ARISING FROM FINANCING ACTIVITIES
Presented below is the reconciliation of the Group’s liabilities arising from financing activities, which includes both cash and non-cash changes.
Advances from Interest-bearing Associates Loans and Bonds and Lease and Other Borrowings Notes Payable Liabilities Related Parties (See Note 15) (See Note 16) (See Note 19) (See Note 27) Total Balance as of January 1, 2021 P 45,578,166,417 P 40,282,855,986 P 587,616,971 P 2,683,950,114 P 89,132,589,488 Net cash flows: Proceeds 26,643,083,897 - - 608,170,119 27,251,254,016 Repayments ( 20,982,065,248 ) - ( 29,570,421 ) ( 48,783,694 ) ( 21,060,419,363 ) Non-cash financing activities: Foreign currency exchange 410,519,532 1,617,763,016 7,570,126 - 2,035,852,674 Amortization of bond issue cost - 81,423,244 - - 81,423,244 Additional lease liabilities - 3,560,977 - 3,560,977 Interest amortization on
lease liabilities - - 38,956,553 - 38,956,553 Derecognition - - ( 18,561,406 ) - ( 18,561,406 ) Balance as of December 31, 2021 P51,649,704,598 P41,982,042,246 P 589,572,800 P 3,243,336,539 P97,464,656,183 Balance as of January 1, 2020 P 51,256,475,989 P 24,623,883,690 P 653,588,108 P 2,914,882,801 P 79,448,830,588 Net cash flows: Proceeds 7,800,000,000 16,692,935,192 - 24,157,233 24,517,092,425 Repayments ( 13,107,450,229 ) - ( 40,815,130 ) ( 255,089,920 ) ( 13,403,355,279 ) Non-cash financing activities: Foreign currency exchange ( 370,859,343 ) ( 1,077,137,260 ) ( 8,923,035 ) - ( 1,456,919,638 ) Amortization of bond issue cost - 43,174,364 - - 43,174,364 Offset from finance lease receivables - - ( 93,931,898 ) ( 93,931,898 ) Additional lease liabilities - - 36,791,892 - 36,791,892 Interest amortization on
lease liabilities - - 40,907,034 - 40,907,034 Balance as of December 31, 2020 P 45,578,166,417 P 40,282,855,986 P 587,616,971 P 2,683,950,114 P 89,132,589,488 Balance as of January 1, 2019 50,640,611,750 25,102,042,365 467,901,950 2,885,463,118 79,096,019,183 Net cash flows: Proceeds 12,500,000,000 - - 32,361,651 12,532,361,651 Repayments ( 11,537,252,522 ) - ( 35,429,332 ) ( 2,941,968 ) ( 11,575,623,822 ) Non-cash financing activities: Foreign currency exchange ( 346,883,239 ) ( 493,907,863 ) ( 5,718,846 ) - ( 846,509,948 ) Amortization of bond issue cost - 15,749,188 - - 15,749,188 Additional lease liabilities - - 194,882,491 - 194,882,491 Interest amortization on
lease liabilities - - 31,951,845 - 31,951,845 Balance as of December 31, 2019 P 51,256,475,989 P 24,623,883,690 P 653,588,108 P 2,914,882,801 P 79,448,830,588
37. OTHER MATTER
The Parent Company was awarded a certificate of registration under ISO 9001:1994 on November 26, 1999 by Certification International Philippines, Inc. which was upgraded to ISO 9001:2000 and ISO 9001:2008 series on November 21, 2002 and November 25, 2011, respectively. Effective December 18, 2017, the Parent Company has upgraded its Certification to ISO 9001:2015 for its quality management system. The scope of the certification covers all areas of the Parent Company’s real estate development and marketing. Among others, the Parent Company is required to undergo surveillance audits every six months.

Punongbayan & Araullo
20th Floor, Tower 1
The Enterprise Center
6766 Ayala Avenue
1200 Makati City
Philippines
T +63 2 8988 2288
a
Certified Public Accountants
Punongbayan & Araullo (P&A) is the Philippine member firm of Grant Thornton International Ltd.
Offices in Cavite, Cebu, Davao
BOA/ PRC Cert of Reg. No. 0002
SEC Accreditation No. 0002
grantthornton.com.ph
Report of Independent Auditors
to Accompany Supplementary
Information Required by the Securities
and Exchange Commission Filed
Separately from the Basic
Consolidated Financial Statements
The Board of Directors and Stockholders
Megaworld Corporation and Subsidiaries
(A Subsidiary of Alliance Global Group, Inc.)
30th Floor, Alliance Global Tower
36th Street cor. 11th Avenue
Uptown Bonifacio, Taguig City
We have audited, in accordance with Philippine Standards on Auditing, the consolidated
financial statements of Megaworld Corporation and Subsidiaries (the Group) for the year ended
December 31, 2021, on which we have rendered our report dated February 28, 2022. Our audit
was made for the purpose of forming an opinion on the basic consolidated financial statements
taken as a whole. The applicable supplementary information (see List of Supplementary
Information) is presented for purposes of additional analysis in compliance with the requirements
of the Revised Securities Regulation Code Rule 68 and is not a required part of the basic
consolidated financial statements prepared in accordance with Philippine Financial Reporting
Standards. Such supplementary information is the responsibility of the Group’s management.
The supplementary information has been subjected to the auditing procedures applied in the
audit of the basic consolidated financial statements and, in our opinion, is fairly stated in all
material respects in relation to the basic consolidated financial statements taken as a whole.
PUNONGBAYAN & ARAULLO
By: Renan A. Piamonte Partner CPA Reg. No. 0107805 TIN 221-843-037 PTR No. 8852342, January 3, 2022, Makati City SEC Group A Accreditation Partner - No. 107805-SEC (until Dec. 31, 2023) Firm - No. 0002 (until Dec. 31, 2024) BIR AN 08-002511-037-2019 (until Sept. 4, 2022) Firm’s BOA/PRC Cert. of Reg. No. 0002 (until Aug. 27, 2024)
February 28, 2022

Page No.
Schedules Required under Annex 68-J of the Revised Securities Regulation Code Rule 68
A Financial Assets 1
B Amounts Receivable from Directors, Officers, Employees,
Related Parties and Principal Stockholders (Other than Related Parties) 2
C
3
D Long-term Debt 4
E Indebtedness to Related Parties (Long-term Loans from Related Companies) N/A
F Guarantees of Securities of Other Issuers N/A
G Capital Stock 5
Other Required Information
Reconciliation of Retained Earnings Available for Dividend Declaration
Map Showing the Relationship Between the Company and its Related Entities
Amounts Receivable/Payable from/to Related Parties which are Eliminated
during the Consolidation of Financial Statements
MEGAWORLD CORPORATION AND SUBSIDIARIES
List of Supplementary Information
December 31, 2021
Schedule Content

Name of issuing entity and association of each issue
Number of shares or principal amount of
bonds or notes
Amount shown on the balance sheet
Valued based on the market quotation at balance sheet date
Income received and accrued
Alliance Global Group, Inc. 157,869,800 1,862,863,640 P 1,862,863,640 P 10,127,290 P
Emperador, Inc. 58,889,000 1,224,891,152 1,224,891,152 13,538,826
Various quoted equity securities 190,923 10,746,814 10,746,814 790,641 Various unquoted equity securities 510,088,162 2,661,866,841 2,661,866,841 -
5,760,368,447 P 5,760,368,447 P 24,456,757 P
Megaworld Corporation and Subsidiaries
Schedule A - Financial Assets
Financial Assets at Fair Value through Other Comprehensive Income
December 31, 2021
- 1 -
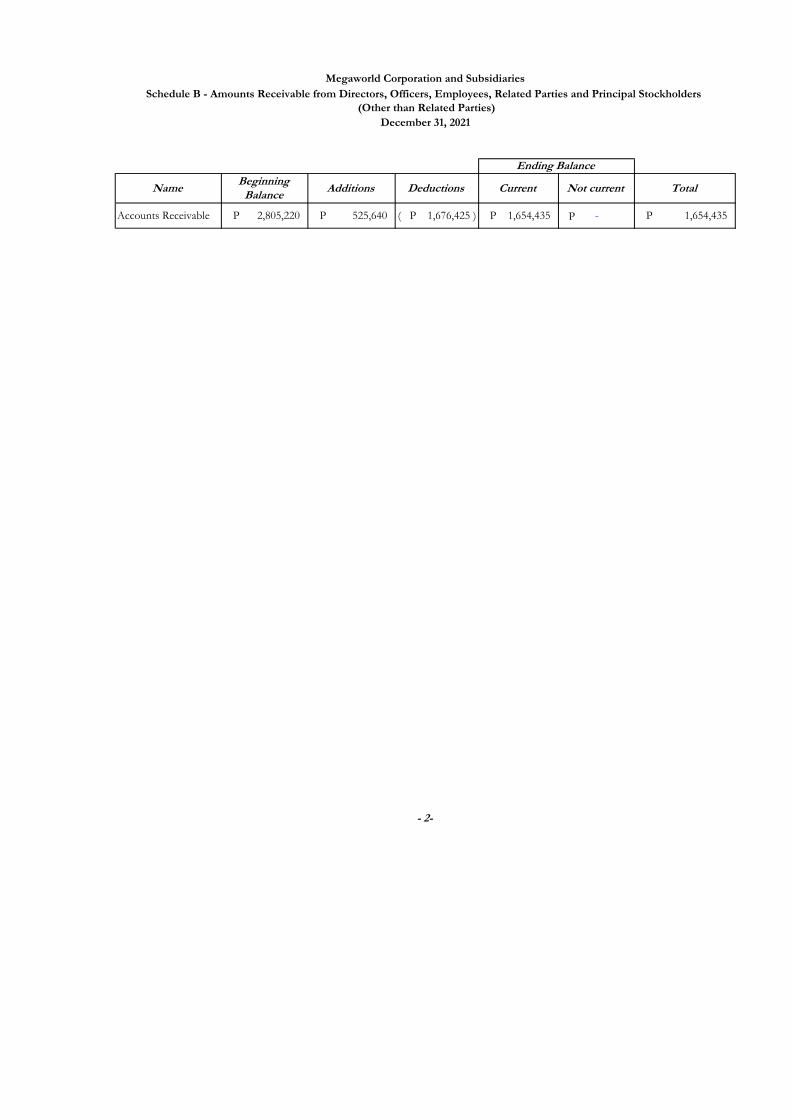
Name Beginning Balance
Additions Deductions Current Not current Total
Accounts Receivable 2,805,220 P 525,640 P 1,676,425 )( P 1,654,435 P - 1,654,435 P
Megaworld Corporation and Subsidiaries
Schedule B - Amounts Receivable from Directors, Officers, Employees, Related Parties and Principal Stockholders
(Other than Related Parties)
December 31, 2021
Ending Balance
- 2-
P

Name and designation of debtor Balance at the
beginning of period Additions Amounts collected Amounts written off Current Non current Balance at the end of the period
Due from Related Parties:
Suntrust Properties Inc. (SPI) 3,873,455,352 478,871,243 - - 4,352,326,595 4,352,326,595
Empire East Land Holdings, Inc. (EELHI) 2,802,663,199 290,518,940 - - 3,093,182,139 3,093,182,139
San Vicente Coast, Inc. (SVCI) 1,521,618,709 27,987,622 - - 1,549,606,331 1,549,606,331
Megaworld Cebu Properties, Inc. (MCP) 1,507,523,220 848 - - 1,507,524,068 1,507,524,068
Twin Lakes Corporation (TLC) 139,042,062 1,130,116,366 - - 1,269,158,428 1,269,158,428
Global Estate Resorts, Inc. (GERI) 171,779,426 1,010,129,879 - - 1,181,909,305 1,181,909,305
Landmark Seaside Properties, Inc. (LSPI) 1,097,855,192 9,339 - - 1,097,864,531 1,097,864,531
Manila Bayshore Property Holdings, Inc. (MBPHI) 505,642,264 148,286 - - 505,790,550 505,790,550
Maple Grove Land, Inc. (MGLI) 476,178,360 1,568,172 - - 477,746,532 477,746,532
Southwoods Malls, Inc (SMI) 471,813,471 - 50,000,000 - 421,813,471 421,813,471
Agile Digital Ventures, Inc. (ADVI) 86,648,831 138,811,975 - - 225,460,806 225,460,806
Megaworld Daewoo Corporation (MDC) - 153,224,657 - - 153,224,657 153,224,657
Arcovia Properties, Inc. (API) 86,729,114 3,443,619 - - 90,172,733 90,172,733
Megaworld Bacolod Properties Inc. (MBPI) 63,724,123 5,923,413 - - 69,647,536 69,647,536
Kingsford Hotel Manila, Inc. (KHMI) - 53,572,957 - - 53,572,957 53,572,957
Townsquare Development, Inc. (TDI) 24,922,739 26,704,026 - - 51,626,765 51,626,765
Savoy Hotel Mactan, Inc. (SHM) 29,769,722 19,166,058 - - 48,935,780 48,935,780
Megaworld Newport Property Holdings, Inc. (MNPHI) 48,365,410 46,348,261 48,365,410 - 46,348,261 46,348,261
Hotel Lucky Chinatown, Inc. (HLC) 16,085,253 - 392,263 - 15,692,990 15,692,990
Oceantown Properties, Inc. (OPI) 10,843,654 4,074,498 - - 14,918,152 14,918,152
Eastwood Property Holdings, Inc. (EPHI) 10,495,881 3,939,720 - - 14,435,601 14,435,601
Savoy Hotel Manila, Inc. (SHMI) 37,252,182 - 24,108,964 - 13,143,218 13,143,218
Soho Café and Restaurant Group, Inc. (SCRGI) 2,574,210 9,554,795 - - 12,129,005 12,129,005
Belmont Newport Luxury Hotels Inc. (BNLHI) - 4,762,174 - - 4,762,174 4,762,174
Global One Hotel Group, Inc. (GOHGI) 4,065,019 - 211,019 - 3,854,000 3,854,000
Global One Integrated Business Services, Inc. (GOIBSI) 3,485,490 21,300 - - 3,506,790 3,506,790
Luxury Global Hotels and Leisure, Inc. (LGHLI) 1,650,601 5,790 - - 1,656,391 1,656,391
Streamwood Property, Inc. (SP) 1,466,222 25,908 - - 1,492,130 1,492,130
Luxury Global Malls Inc (LGMI) 840,667 546,025 - - 1,386,692 1,386,692
Richmonde Hotel Group International Ltd. (RHGI) 535,625,421 - 535,625,421 - - -
Eastwood Cyber One Corporation (ECOC) 66,516,918 - 66,516,918 - - -
Integrated Town Management Corporation (ITMC,formerly PIPI) 6,745,112 - 6,745,112 - - -
Various subsidiaries 859,093 226,395 - - 1,085,488 1,085,488
Due to Related Parties:
Richmonde Hotel Group International, Ltd. (RHGI) - 4,439,294,452 - - 4,439,294,452 4,439,294,452
Megaworld Globus Asia, Inc. (MGAI) 240,579,082 - - - 240,579,082 240,579,082
Megaworld Central Properties, Inc. (MCPI) 198,384,084 3,340,793 - - 201,724,876 201,724,876
Davao Park District Holdings, Inc. (DPDHI) 159,983,843 3,411,671 - - 163,395,514 163,395,514
Prestige Hotels and Resorts, Inc. (PHRI) 52,167,687 24,483,713 - - 76,651,401 76,651,401
Integrated Town Management Corporation (ITMC,formerly PIPI) - 3,314,086 - - 3,314,086 3,314,086
Gilmore Property Marketing Associates Inc. (GPMAI) 3,125,100 - - - 3,125,100 3,125,100
Megaworld-Daewoo Corporation (MDC) 59,776,763 - 59,776,763 - - -
Belmont Newport Luxury Hotels, Inc. (BNLHI) 1,381,242 - 1,381,242 - - -
- 3 - - 3 -
Megaworld Corporation and Subsidiaries
Schedule C- Amounts Receivable/ Payable from/ to Related Parties which are Eliminated During the Consolidation of Financial Statements
December 31, 2021
Deductions

Title of issue and type of obligationAmount authorized
by indenture
Amount shown under caption"Current
portion of long-term debt" in related balance sheet
Amount shown under caption"Long-Term
Debt" in related balance sheet
Long -term loan (Domestic) P 95,930,507,289 P 12,685,534,491 50,946,103,019 P
Foreign borrowings $ 600,000,000 - 30,000,109,334 P
P 12,685,534,491 80,946,212,353 P
Megaworld Corporation and Subsidiaries
Schedule D - Long-Term Debt
December 31, 2021
- 4-
P

Title of IssueNumber of shares
authorized
Number of shares issued and outstanding as
shown under the related balance sheet caption
Number of shares reserved for options, warrants, conversion
and other rights
Related partiesDirectors, officers and employees
Others
Common shares - P1 par value 40,140,000,000 31,857,070,872 233,500,000 21,495,386,882 4,295,193 10,357,388,797
Preferred shares - P.01 par value 6,000,000,000 6,000,000,000 6,000,000,000
Megaworld Corporation and Subsidiaries
Schedule G - Capital Stock
December 31, 2021
Number of shares held by
- 5 -

Unappropriated Retained Earnings at Beginning of Year 106,762,084,835 P
Prior Years Outstanding Reconciling Items:
Adjustment for rental income under PFRS 16 1,377,369,961 )(
Deferred tax income 577,837,553 )(
Day-one gain from security deposits at amortized cost 638,143,671 )(
Day-one loss on intial measurement of trade receivables at amortized cost 214,337,863
Adjustments to commission expense due to change in accounting policy 204,805,498 )(
Recognition of expected credit loss on financial assets 256,312,383 2,327,506,437 )(
Unappropriated Retained Earnings Available for
Dividend Declaration at Beginning of Period, as Adjusted 104,434,578,398
Net Profit Realized during the period
Net profit per audited financial statements 52,844,166,409
Non-actual/unrealized income
Deferred tax expense 230,381,015 )(
Adjustments to commission expense due to change in
accounting policy 22,555,974 )(
Amortization of day-one gain from security deposits
at amortized cost 321,624,147
Recognition of day-one gain on initial measurement
of security deposits at amortized cost 144,072,633 )(
Amortization of interest from trade receivables 247,698,970 )(
Recognition of expected credit loss on financial assets 78,433,499 )(
Recognition of day-one loss on intial measurement
of trade receivables at amortized cost 418,621,609
Rental income from straight-line amortization
in excess of rental collections 11,857,683 )( 5,245,982
Dividends declared during the year 1,355,683,689 )(
Retained Earnings Restricted for Treasury Shares 1,268,862,277 )(
Unappropriated Retained Earnings Available for
Dividend Declaration at End of Year 154,659,444,823 P
For the Year Ended December 31, 2021
MEGAWORLD CORPORATION
(A Subsidiary of Alliance Global Tower, Inc.)30th Floor, Alliance Global Tower,
36th Street cor. 11th Avenue, Uptown Bonifacio, Taguig City
Reconciliation of Retained Earnings Available for Dividend Declaration

ALLIANCE GLOBAL GROUP, INC. AND SUBSIDIARIES
Map Showing the Relationship Between Alliance Global Group, Inc.
and its Related Parties
December 31, 2021
Legend
(1) Subsidiary A Megaworld Corporation F Manila Bayshore Property Holdings, Inc. K Megaworld Global Estates, Inc. P Sonoma Premier Land, Inc.
(2) Associate B Adams Properties, Inc. G Westside City Resorts World, Inc. L Megaworld Central Properties, Inc. Q Gilmore Property Marketing Associates, Inc.
(3) Jointly Controlled Entity C First Centro, Inc. H Townsquare Development, Inc. M Shiok Success International, Ltd. R Emperador Inc.
D Newtown Land Partners, Inc. I Megaworld Resort Estates, Inc. N Dew Dreams International, Ltd. S Empire East Land Holdings, Inc.
E Travellers International Hotel Group, Inc. J Twin Lakes Corporation O Southwoods Mall, Inc. T Suntrust Home Developers, Inc.
Alliance Global Group, Inc.(Parent Company)
Emperador, Inc. and Subsidiaries****
(1)
M
N
First Centro, Inc.(1)
Megaworld Corporation and Subsidiaries*
(1)
C
D
Adams Properties, Inc.(1)
Megaworld Resort Estates, Inc.(1)
A
Greenspring Investment Holdings Properties, Ltd.
(1)
Venezia Universal, Ltd.(1)
Travellers Group, Ltd.(1)
Oceanic Realty Group Int'l, Inc.(1)
ERA Real Estate Exchange, Inc.(1)
A
E
G
P
A
C
BWestside City Resorts World, Inc.
(1)
Golden Arches Development, Inc. and Subsidiaries***
(1)
Townsquare Development, Inc.(1)
A
C
B
Alliance Global Group Cayman Islands, Inc.
(1)
Alliance Global Brands, Inc.(1)
Travellers International Hotel Group, Inc. and Subsidiaries**
(1)
Great American Foods, Inc.(1)
McKester Pik-Nik International, Ltd.(1)
New Town Land Partners, Inc.(1)
A
Shiok Success International, Ltd.(1)
Dew Dreams International, Ltd.(1)
R
Purple Flamingos Amusement and Leisure Corporation
(1)
Red Falcon Amusement and Leisure Corporation
(1)
Q
Golden Panda-ATI Realty Corporation
(1)
Infracorp Development, Inc..(1)
E
Shiok Success International, Inc.(1)
Dew Dreams International, Inc.(1)
Boracay Newcoast Resorts, Inc.(1)
Pacific Coast Megacity, Inc..(1)
S

ALLIANCE GLOBAL GROUP, INC. AND SUBSIDIARIES
Map Showing the Relationship Between Alliance Global Group, Inc.
and Megaworld Corporation Group
December 31, 2021
Legend
Relationship with Megaworld Corporation
(1) Subsidiary
(2) Associate
(3) Jointly Controlled Entity
A Megaworld Corporation E Travellers International Hotel Group, Inc. I Megaworld Resort Estates, Inc. M Shiok Success International, Ltd. Q Gilmore Property Marketing Associates, Inc.
B Adams Properties, Inc. F Manila Bayshore Property Holdings, Inc. J Twin Lakes Corporation N Dew Dreams International, Ltd. R Emperador Inc.
C First Centro, Inc. G Westside City Resorts World, Inc. K Megaworld Global Estates, Inc. O Southwoods Mall, Inc. S Empire East Land Holdings, Inc.
D Newtown Land Partners, Inc. H Townsquare Development, Inc. L Megaworld Central Properties, Inc. P Sonoma Premier Land, Inc. T Suntrust Home Developers, Inc.
Alliance Global Group, Inc.(Parent Company)
Megaworld Corporation(I)
Arcovia Properties, Inc.(1)
Palm Tree Holdings Development Corporation
(2)
Megaworld Cayman Islands, Inc.(1)
Eastwood Cyber OneCorporation
(1)
Megaworld Cebu Properties, Inc.(1)
Mactan Oceanview Properties and Holdings, Inc.
(1)
Oceantown Properties, Inc.(1)
Megaworld Newport Property Holdings, Inc.
(1)
Megaworld Globus Asia, Inc.(1)
Piedmont Property Ventures, Inc.(1)
Stonehaven Land, Inc.(1)
Streamwood Property, Inc.(1)
Megaworld-Daewoo Corporation(1)
Suntrust Home Developers, Inc.(2)
Suntrust Properties, Inc.(1)
Integrated Town Management Corporation
(1)
Richmonde Hotel Group International Ltd.
(1)
Empire East Land Holdings, Inc.(1)
Valle Verde Properties, Inc.(1)
Empire East Communities, Inc.(1)
Sonoma Premier Land, Inc.(1)
Gilmore Property Marketing Associates, Inc.
(1)
Laguna BelAir Science School, Inc.(1)
Eastwood Property Holdings, Inc.(1)
Sherman Oak Holdings, Inc.(1)
Megaworld Central Properties, Inc.(1)
E G I J
C H
A
K L
San Vicente Coast, Inc.(1)
Luxury Global Hotels and Leisures, Inc.
(1)
Landmark Seaside Properties, Inc..(1)
Suntrust One Shanata, Inc.(1)
Global One Integrated Business Services Inc.
(1)
Suntrust Two Shanata, Inc.(1)
Manila Bayshore Property Holdings, Inc.
(1)
Bonifacio West Development Corporation
(2)
Pacific Coast Mega City, Inc.(1)
20th Century Nylon Shirt, Inc.(1)
Davao Park District Holdings, Inc.(1)
Belmont Newport Luxury Hotels, Inc.
(1)
Suntrust Ecotown Developers, Inc.(1)
SWC Project Management Limited.
(2)
WC Project Management Limited(2)
Governor's Hills Science School, Inc.(1)
Sunrays Property Management, Inc.(1)
Newtown Commercial Center Administration, Inc.
(1)
Iloilo Center Mall Administration, Inc.(1)
Luxury Global Malls, Inc.(1) E
Paseo Center Building Administration, Inc.
(1)
La Fuerza, Inc.(1)
City Walk Building Adminstration, Inc.
(1)
Maple Grove Land, Inc.(1)
Forbestown Commercial Center Administration, Inc.
(1)
Soho Cafe Restaurant Group, Inc.(1)
Uptown Commercial Center Administration, Inc.
(1)
Global-Estate Resorts, Inc. and Subsidiaries
(1)
J
O
K
Valley Peaks Property Management, Inc.
(1)
Prestige Hotels and Resorts, Inc.(1)
Global One Hotel Group, Inc.(1)
Megaword Bacolod Properties, Inc.(1)
San Lorenzo Place Commercial Center Administration, Inc. (1)
Northwin Properties, Inc.(1)
Hotel Lucky Chinatown, Inc.(1)
Megaworld Land, Inc.(1)
Stateland, Inc.(1)
Megaworld Capital Town, Inc.(1)
Savoy Hotel Manila, Inc.(1)
Southwoods Lifestyle Mall Management, Inc.
(1)
Savoy Hotel Mactan, Inc.(1)
Kingsford Hotel Manila, Inc.(1)
Agile Digital Ventures, Inc.(1)
MREIT Fund Managers, Inc.(1)
MREIT Property Managers, Inc.(1)
MREIT, Inc.(1)
O
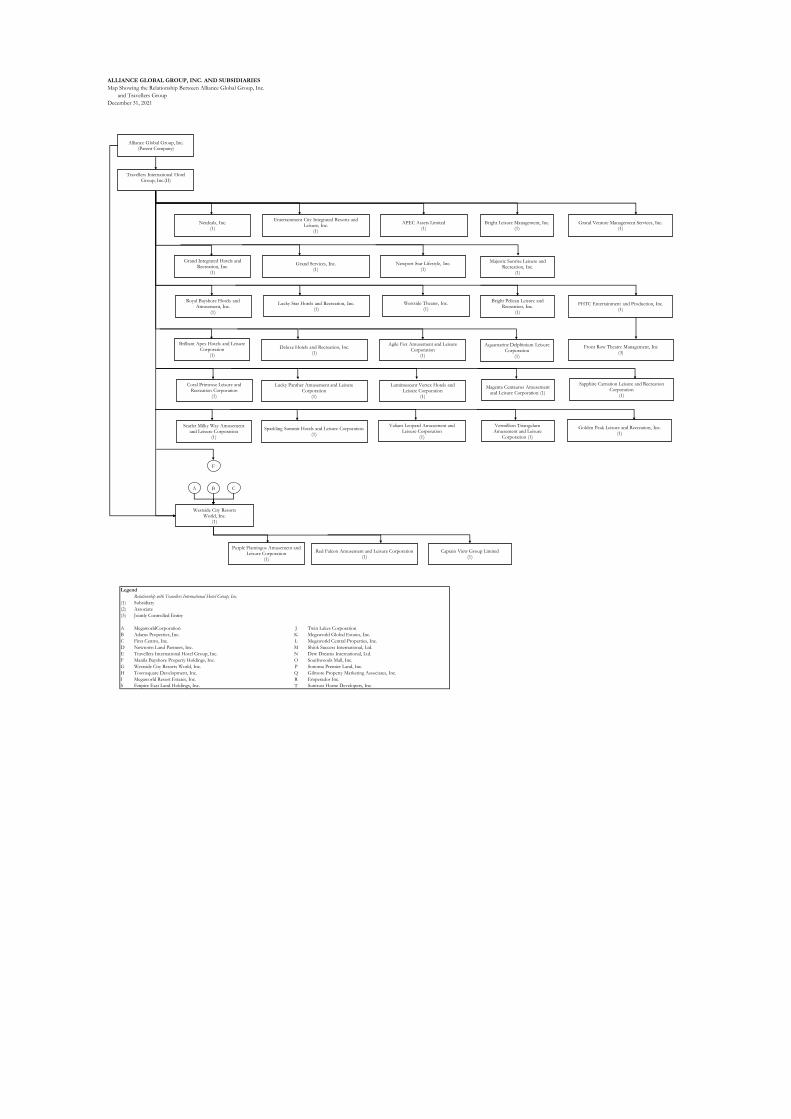
ALLIANCE GLOBAL GROUP, INC. AND SUBSIDIARIES
Map Showing the Relationship Between Alliance Global Group, Inc.
and Travellers Group
December 31, 2021
Legend
Relationship with Travellers International Hotel Group, Inc.
(1) Subsidiary
(2) Associate
(3) Jointly Controlled Entity
A MegaworldCorporation J Twin Lakes Corporation
B Adams Properties, Inc. K Megaworld Global Estates, Inc.
C First Centro, Inc. L Megaworld Central Properties, Inc.
D Newtown Land Partners, Inc. M Shiok Success International, Ltd.
E Travellers International Hotel Group, Inc. N Dew Dreams International, Ltd.
F Manila Bayshore Property Holdings, Inc. O Southwoods Mall, Inc.
G Westside City Resorts World, Inc. P Sonoma Premier Land, Inc.
H Townsquare Development, Inc. Q Gilmore Property Marketing Associates, Inc.
I Megaworld Resort Estates, Inc. R Emperador Inc.
S Empire East Land Holdings, Inc. T Suntrust Home Developers, Inc.
Alliance Global Group, Inc.(Parent Company)
Travellers International Hotel Group, Inc.(II)
Netdeals, Inc.(1)
Grand Integrated Hotels and Recreation, Inc.
(1)
Royal Bayshore Hotels and Amusement, Inc.
(1)
Entertainment City Integrated Resorts and Leisure, Inc.
(1)
Grand Services, Inc.(1)
Lucky Star Hotels and Recreation, Inc.(1)
APEC Assets Limited(1)
Bright Leisure Management, Inc.(1)
Newport Star Lifestyle, Inc.(1)
Bright Pelican Leisure and Recreation, Inc.
(1)
Grand Venture Management Services, Inc.(1)
F
Deluxe Hotels and Recreation, Inc.(1)
Westside City Resorts World, Inc.
(1)
A CB
Purple Flamingos Amusement and Leisure Corporation
(1)
Red Falcon Amusement and Leisure Corporation(1)
Agile Fox Amusement and Leisure Corporation
(1)
Aquamarine Delphinium Leisure Corporation
(1)
Coral Primrose Leisure and Recreation Corporation
(1)
Lucky Panther Amusement and Leisure Corporation
(1)
Lumimescent Vertex Hotels and Leisure Corporation
(1)
Magenta Centaurus Amusement and Leisure Corporation (1)
Sapphire Carnation Leisure and Recreation Corporation
(1)
Scarlet Milky Way Amusement and Leisure Corporation
(1)
Sparkling Summit Hotels and Leisure Corporation(1)
Valiant Leopard Amusement and Leisure Corporation
(1)
Vermillion Triangulum Amusement and Leisure
Corporation (1)
Front Row Theatre Management, Inc(3)
Golden Peak Leisure and Recreation, Inc.(1)
Westside Theater, Inc.(1)
FHTC Entertainment and Production, Inc.(1)
Brilliant Apex Hotels and Leisure Corporation
(1)
Majestic Sunrise Leisure and Recreation, Inc.
(1)
Captain View Group Limited(1)

ALLIANCE GLOBAL GROUP, INC. AND SUBSIDIARIES
Map Showing the Relationship Between Alliance Global Group, Inc.
and Golden Arches Development Corporation Group
December 31, 2021
Legend
Relationship with Golden Arches Development Corporation
(1) Subsidiary
(2) Associate
(3) Jointly Controlled Entity
A MegaworldCorporation J Twin Lakes Corporation
B Adams Properties, Inc. K Megaworld Global Estates, Inc.
C First Centro, Inc. L Megaworld Central Properties, Inc.
D Newtown Land Partners, Inc. M Shiok Success International, Ltd.
E Travellers International Hotel Group, Inc. N Dew Dreams International, Ltd.
F Manila Bayshore Property Holdings, Inc. O Southwoods Mall, Inc.
G Westside City Resorts World, Inc. P Sonoma Premier Land, Inc.
H Townsquare Development, Inc. Q Gilmore Property Marketing Associates, Inc.
I Megaworld Resort Estates, Inc. R Emperador Inc.
S Empire East Land Holdings, Inc. T Suntrust Home Developers, Inc.
Alliance Global Group, Inc.(Parent Company)
Golden Arches Development Corp. (III)
Clark Mac Enterprises, Inc.(1)
First Golden Laoag Ventures(1)
Golden Laoag Foods Corporation
(1)
Davao City Food Industries, Inc.(1)
Golden Arches Realty, Corp.(1)
McDonald's Puregold Taguig(1)
Golden City Food Industries, Inc.(1)
McDonald's Bonifacio Global City(1)
Advance Food Concepts Manufacturing, Inc.(1)
Red Asian Food Solutions(1)
McDonald's Anonas City Center(1)
Molino First Golden Foods, Inc.(1)
GY Alliance Concepts, Inc.(1)

ALLIANCE GLOBAL GROUP, INC. AND SUBSIDIARIES
Map Showing the Relationship Between and
Among Megaworld and Global Estate Resorts Inc. Group
December 31, 2021
Legend
(1) Subsidiary
(2) Associate
(3) Jointly Controlled Entity
A MegaworldCorporation J Twin Lakes Corporation
B Adams Properties, Inc. K Megaworld Global Estates, Inc.
C First Centro, Inc. L Megaworld Central Properties, Inc.
D Newtown Land Partners, Inc. M Shiok Success International, Ltd.
E Travellers International Hotel Group, Inc. N Dew Dreams International, Ltd.
F Manila Bayshore Property Holdings, Inc. O Southwoods Mall, Inc.
G Westside City Resorts World, Inc. P Sonoma Premier Land, Inc.
H Townsquare Development, Inc. Q Gilmore Property Marketing Associates, Inc.
I Megaworld Resort Estates, Inc. R Emperador Inc.
S Empire East Land Holdings, Inc. T Suntrust Home Developers, Inc.
Megaworld Corporation
Global Estate Resorts, Inc.(1)
Novo Sierra Holdings, Corp.(1)
Fil-Estate Urban Development, Inc.(1)
Fil-Estate Realty and Sales Associates, Inc.(2)
Oceanfront Properties, Inc.(1)
Megaworld Global Estates, Inc.(1)
Fil-Estate Network, Inc.(2)
File-Estate Sales, Inc.(2)
Fil-Estate Realty Corporation(2)
Nasugbu Properties, Inc.(2)
Twin Lakes Corporation(1)
Fil-Estate Golf and Development, Inc.
(1)
Golforce Inc.(1)
Southwoods Ecocentrum Corp.(1)
Philippine Acquatic Leisure Corp.(1)
Fil-Estate Properties, Inc.(1)
Aklan Holdings, Inc.(1)
Pioneer L-5 Realty Corporation(1)
Blue Sky Airways, Inc..(1)
Prime Airways, Inc.(1)
Fil-Estate Subic Development Corp.(1)
Sto. Domingo Place Development Corporation
(1)
Fil-Power Concrete Blocks Corporation(1)
Golden Sun Airways, Inc.(1)
Fil-Power Construction Equipment Leasing Corp.(1)
Fil-Estate Industrial Park.(1)
La Compaña De Sta. Barbara, Inc.(1)
Sherwood Hills Development, Inc.(1)
MCX Corporation(1)
Boracay Newcoast Hotel Group, Inc.(2)
J
A
A
Global Homes and Communities, Inc.(1)
Southwoods Mall, Inc.(1) A
Elite Communities Property Services, Inc.(1)
Twin Lakes Hotel, Inc.(1)
Savoy Hotel Boracay, Inc.(1)
Belmont Hotel Boracay, Inc.(1)

ALLIANCE GLOBAL GROUP, INC. AND SUBSIDIARIES
Map Showing the Relationship Between Alliance Global Group, Inc.
and Emperador Group
December 31, 2021
Legend
Relationship with Emperador Inc.
(1) Subsidiary (100%)
(2) Subsidiary (50%)
(3) Subsidiary (51%)
(4) Jointly Controlled Entity
Alliance Global Group, Inc.(Parent Company)
Emperador Inc. (IV)
Emperador Distillers, Inc.(1)
Emperador International Ltd.(1)
Anglo Watsons Glass, Inc.(1)
The Bar Beverage, Inc.(1)
Emperador Asia Pte Ltd.(1)
Grupo Emperador Spain, S.A.U.(1)
Bodega Las Copas S.L.(4)
Bodega San Bruno, S.L.(1)
Alcoholera de la Mancha Vinicola, S.A.U.(1)
Viñedos del Rio Tajo, S.L.U.(1)
Emperador UK Limited(1)
Emperador Holdings (GB) Limited
(1)
Whyte and Mackay Group Limited
(1)
Cocos Vodka Distillers Philippines, Inc.
(1)
Emperador Europe SARL(1)
Whyte and Mackay Limited(1)
Whyte and Mackay Warehousing Ltd.(1)
Emperador Gestion S.L.(1)
Tradewind Estates, Inc.(1)
Alcazar De Bana Holdings Company, Inc.
(1)
ProGreen Agricorp., Inc.(1)
South Point Science Park, Inc.(1)
Bodegas Fundador S.L.U.(1)
Zabana Rum Company, Inc.(1)
Whyte and Mackay Americas Ltd, LLC(1)
Harvey's Cellars S.L.U.(Formerly Destilados de la Mancha
S.L.)
Domecq Bodega Las Copas, S.L.(2)
Pedro Domecq S.A. de C.V.(2)
Domecq Distribucion de Bebidas S.A. de C.V.
(2)
BoozyLife, Inc.(3)
Whyte and Mackay Global Limited
(1)
Stillman Spirits, S.L.(1)

Punongbayan & Araullo
20th Floor, Tower 1
The Enterprise Center
6766 Ayala Avenue
1200 Makati City
Philippines
T +63 2 8988 2288
a
Certified Public Accountants
Punongbayan & Araullo (P&A) is the Philippine member firm of Grant Thornton International Ltd.
Offices in Cavite, Cebu, Davao
BOA/ PRC Cert of Reg. No. 0002
SEC Accreditation No. 0002
grantthornton.com.ph
Report of Independent Auditors
on Components of
Financial Soundness Indicator
The Board of Directors and Stockholders
Megaworld Corporation and Subsidiaries
(A Subsidiary of Alliance Global Group, Inc.)
30th Floor, Alliance Global Tower
36th Street cor. 11th Avenue
Uptown Bonifacio, Taguig City
We have audited, in accordance with Philippine Standards on Auditing, the financial statements
of Megaworld Corporation and Subsidiaries (the Group) as at December 31, 2021 and 2020
and for each of the three years in the period ended December 31, 2021, and have issued our
report thereon dated February 28, 2022. Our audits were made for the purpose of forming an
opinion on the basic financial statements taken as a whole. The Supplementary Schedule on
Financial Soundness Indicators, including their definitions, formulas, calculation, and their
appropriateness or usefulness to the intended users, are the responsibility of the Group’s
management. These financial soundness indicators are not measures of operating
performance defined by Philippine Financial Reporting Standards (PFRS) and may not be
comparable to similarly titled measures presented by other companies. This schedule is
presented for the purpose of complying with the Revised Securities Regulation Code Rule 68
issued by the Securities and Exchange Commission, and is not a required part of the basic
financial statements prepared in accordance with PFRS. The components of these financial
soundness indicators have been traced to the Group’s financial statements as at December
31, 2021 and 2020 and for each of the three years in the period ended December 31, 2021
and no material exceptions were noted.
PUNONGBAYAN & ARAULLO
By: Renan A. Piamonte Partner CPA Reg. No. 0107805 TIN 221-843-037 PTR No. 8852342, January 3, 2022, Makati City SEC Group A Accreditation Partner - No. 107805-SEC (until Dec. 31, 2023) Firm - No. 0002 (until Dec. 31, 2024) BIR AN 08-002511-037-2019 (until Sept. 4, 2022) Firm’s BOA/PRC Cert. of Reg. No. 0002 (until Aug. 27, 2024)
February 28, 2022

MEGAWORLD CORPORATION AND SUBSIDIARIES
ANNEX 68-E - SCHEDULE OF FINANCIAL SOUNDNESS INDICATORS
December 31, 2021 and 2020
Ratio Formula Current Year Prior Year
Current ratio Current assets / Current liabilities 3.68 2.90
Acid test ratio Quick assets / Current liabilities (Quick assets include current assets less inventories)
1.81 1.44
Solvency ratio EBITDA / Total debt (Total debt includes interest bearing loans and borrowings and bonds and notes payable )
0.22 0.22
Debt-to-equity ratio Total debt / Total stockholders' equity (Total debt includes interest bearing loans and borrowings and bonds and notes payable )
0.41 0.40
Asset-to-equity ratio Total assets / Total stockholders' equity 1.73 1.77
Interest rate coverage ratio EBIT / Total Interest (Total interest includes interest expense and capitalized interest)
4.02 3.64
Return on equity Net profit attributable to Company's shareholders / Average total equity attributable to the Company's shareholders
0.07 0.05
Return on assets Net profit/ Average total assets 0.04 0.03
Net profit margin Net profit / Total revenues 0.28 0.24

Megaworld Corporation FY 2021 ESG Report

Annex A: Reporting Template
(For additional guidance on how to answer the Topics, organizations may refer to Annex B: Topic Guide)
Contextual Information
Company Details
Name of Organization Megaworld Corporation
Location of Headquarters Megaworld: Uptown Bonifacio, Taguig City (Main office). Other Corporate Offices: Eastwood City, QC, McKinley Hill, Taguig City
Location of Operations Philippines (Megaworld currently has 11 international sales offices and is present in over 60 countries.)
Report Boundary: Legal entities
(e.g. subsidiaries) included in this report*
Megaworld Corporation, Global Estate and Resorts, Inc. (GERI), Empire East Land Holdings (EELHI), Suntrust Properties, Inc., MREIT, Inc.
Business Model, including Primary Activities, Brands, Products, and Services
The Company is one of the leading property developers in the Philippines and is primarily engaged in the development of large scale mixed-use planned communities, or community townships, that comprise residential, commercial and office developments and integrate leisure, entertainment and educational/training components. Founded in 1989, the Company initially established a reputation for building high quality residential condominiums and commercial properties located in convenient urban locations with easy access to offices as well as leisure and entertainment amenities in Metro Manila. The Company's real estate portfolio includes residential condominium units, subdivision lots and townhouses as well as office projects and retail space. The Company has the following three primary business segments: (i) real estate sales s (ii) leasing of office and retail spaces, and (iii) management of hotel operations
Reporting Period 01 January 2021 - 31 December 2021
Highest Ranking Person
responsible for this report
Lourdes Gutierrez - Alfonso

Explain how you applied the materiality principle (or the materiality process) in identifying your material topics.14
Process in Determining Materiality
For 2021, Megaworld Corporation conducted a materiality assessment to identify the economic,
environmental, and social topics that are material to the group and its stakeholders. The materiality process was in accordance with the Global Reporting Initiative (GRI) G4 Guidelines. Furthermore, the Company examined different trends and issues related to sustainability within its industry, ensuring that the questions that would determine the topics that are material in 2021 are in line with reporting frameworks such as GRI, SASB, and other standards. In addition, the Company reviewed topics that were material in 2020. These served as guides for the Company to update its materiality for the year.
Megaworld Corporation assessed different topics and identified those that are material based on the
importance of the topic to the group and the group’s ability to act on these topics. With that, topics that were seen to have the highest ratings in the materiality matrix were selected as material.
Megaworld’s Materiality Matrix

Matrix Ref
Material Topics Matrix
Ref Material Topics
1 Business Ethics and Integrity 12 Diversity & Equal Opportunity
2 Occupational Health & Safety 13 Water Management
3 Customers 14 Market Presence
4 Economic Performance 15 Human Rights
5 Regulatory Compliance 16 Land Use
6 Employee Welfare 17 Open Spaces
7 Corporate Social Responsibility 18 Accessibility/Walkability
8 Climate Change 19 Procurement Practices
9 Energy Management 20 Tax
10 Data Privacy 21 Air Quality
11 Waste Management 22 Greenhouse Gas Emissions
Approach to Stakeholder Engagement
Engagement is done through meetings (face-to-face or virtual) at least once a month to get stakeholder feedback and inputs, including the community outreach done in coordination with Megaworld Foundation, supporting LGU programs, sending donations to the LGU if there are calamities and emergencies, as well as attendance in relevant functions, consultations, meetings and seminars together with its partners.
14 See GRI 102-46 (2016) for more guidance.

ECONOMIC
Economic Performance
Direct Economic Value Generated and Distributed
Disclosure Amount Units
Direct economic value generated (revenue) 50,754,290,730.62 PhP
Direct economic value distributed: PhP
a. Direct operating costs and other operating expenses 22,864,602,593.00 PhP
b. Employee wages and benefits 3,151,183,937.00 PhP
c. Payments to suppliers and other operating costs (included in a) Php
d. Dividends given to stockholders and interest payments
to loan providers 6,983,114,546.50 PhP
e. Taxes given to government 2,079,299,393.00 PhP
f. Investments to community (e.g. donations, CSR) 149,743,170.00 PhP
Megaworld’s Management Approach on Economic Performance
Measuring the economic and financial performance of the organization is critical in understanding how
the Company manages and allocates resources prudently. The onset of the coronavirus pandemic in 2020
has gravely affected the property industry. To minimize the impact of the pandemic, the Company
undertook initiatives to ensure the safety of its stakeholders, support business continuity, and seize
opportunities to boost sales and manage costs. The Company adopted the hub and spoke model for the
workforce to mitigate the potential disruption of COVID-19 to its operations. The Company continued the
conduct of its businesses while placing paramount consideration on the health and welfare of its
employees, customers, and other stakeholders and have implemented measures to mitigate the
transmission of COVID-19, such as by adjusting operating hours, making hand sanitizers available within
its properties, increasing the frequency of disinfection of facilities, limiting face-to-face meetings,
requiring temperature checks for employees and customers, and implementing health protocols for
employees. Business continuity plans were activated at the corporate and business operations levels, and
scenario planning and analysis were conducted to activate contingency plans.
The Company also continued to identify opportunities in the midst of the pandemic and provided property
offerings that aligned with the overall demand for properties outside Metro Manila. Meanwhile, the
Company’s in-city hotels provided much-needed quarantine services for international travelers. This was
complemented by the expansion of the Company’s sales channels into the virtual space to satisfy health
protocols and align with emerging consumer preferences.
As a policy, Megaworld sets its corporate objectives and budgets annually to clearly identify the
requirements across the Company. With cost-saving measures implemented across key areas of the
organization, budgets have been regularly monitored, and funds management has been consistently
implemented to ensure that 2021 targets will be met. Further, various layers of internal controls, policies,

and procedures are implemented to ensure that the Company is on track with its set objectives and
budgets. Regular reviews of corporate objectives and budget variances are conducted monthly to
understand the resources utilized and expected scorecards have been achieved.
Consequently, the Company's consolidated revenues for the year ended 31 December 2021 were Php
50.8 billion compared to Php 43.5 billion for the year ended 31 December 2020. Real estate sales
accounted for 61% of the Company’s consolidated revenues in 2021 and 57% in 2020. Rental income from
leasing operations accounted for approximately 26% of the Company's consolidated revenues in 2021 and
30% in 2020. The Company's consolidated net profit for the year ended 31 December 2021 was Php 14.4
billion compared to Php 10.6 billion for the year ended 31 December 2020.

Climate-related risks and opportunities
The Philippines has experienced a number of major natural catastrophes over the years, including
typhoons, floods, droughts, volcanic eruptions, and earthquakes. Megaworld recognizes that this risk is
inherent in the country, which could materially disrupt and have significant impact on the Company’s
operations. Likewise, damage to Megaworld properties resulting from such natural disasters could also
give rise to claims against the Company from third parties or customers for physical injuries or loss of
property.
While some of these catastrophic events are covered by insurance, the Company has also put in place
mitigations and controls to prepare for such occurrences and to minimize business interruptions. As an
example, several properties in its Mactan Newtown Township in Cebu suffered physical damages due to
typhoon Odette in December 2021. Because the underground utility networks are part of the standard
design of the company’s townships, this enabled its Cebu township to restore operations faster. Likewise,
communication lines with Manila headquarters remained unhampered due to the preparedness activities
done by the crisis teams prior to the landfall.
Procurement Practices
Proportion of spending on local suppliers
Disclosure Quantity Units
Percentage of procurement budget used for significant locations
of operations that is spent on local suppliers
97.04 %
The percentage of local procurement is based on the total awarded purchase orders to Local Suppliers.
In 2021, Megaworld’s Contracts and Procurement Department engaged 642 suppliers and contractors.
Out of the 642 suppliers, 623 (97.04%) were local and 19 were foreign.
Megaworld’s Management Approach on Procurement Practices
The Company’s procurement processes and protocols are important to ensuring that its partners and
vendors have reputable backgrounds. Megaworld also believes that supporting its local suppliers helps
improve economic activities in the areas where it operates.
The Company has a well-defined process to ensure that all procurement activities pass the quality
standards set by the company, in line with its ISO 9001 QMS certification. Partnering and multi-sourcing
strategies are also being implemented, ensuring availability of essential materials needed in its
construction and operating activities.

Anti-corruption
Training on Anti-corruption Policies and Procedures
Disclosure Quantity Units
Percentage of employees to whom the organization’s anti-
corruption policies and procedures have been communicated to 100 %
Percentage of business partners to whom the organization’s anti-corruption policies and procedures have been communicated to
100 %
Percentage of directors and management that have received
anti-corruption training 100 %
Percentage of employees that have received anti-corruption
training 100 %
All employees of Megaworld and its subsidiaries have been communicated to on the organization’s anti-
corruption policies and procedures through the Employee Code of Conduct.
Incidents of Corruption
Disclosure Quantity Units
Number of incidents in which directors were removed or
disciplined for corruption 0 #
Number of incidents in which employees were dismissed or
disciplined for corruption 0 #
Number of incidents when contracts with business partners
were terminated due to incidents of corruption 0 #
There are no incidences of corruption for 2021.
Megaworld’s Management Approach on Anti-Corruption
Megaworld deals with various government and non-government agencies in its business operations. Any
instances of corruption, especially within the industry of real estate development and investment
property management, could result in the loss of trust of existing investors and shareholders, distort
markets, underline competition, and increase costs to firms. To help ensure that corruption does not
occur, the Company ensures the conduct of annual training through all levels of management, and the
leadership mandate prioritizing integrity is communicated regularly throughout the organization.
Megaworld Corporation is committed to doing business with honesty and integrity in compliance with all
applicable laws and regulations and the highest ethical standards. In support of this, the Company has
implemented several policies to ensure that it fairly conducts business.
● Money Laundering and Terrorist Financing Prevention Program - adopted to ensure the
prevention of money laundering and terrorist financing, taking into account the minimum

requirements set by applicable laws, rules and regulations, and international best practices;
● Anti-corruption and non-acceptance of gift policy - this prohibits any employee, officer, and
director from soliciting or accepting gifts, regardless of value, from clients, suppliers and other
parties who may have interests in the transactions of the company;
● Conflict of Interest Policy - All employees are expected to promote the Company’s interests.
No employee shall compete with Megaworld, nor shall he or she allow business dealing on
behalf of the Company to be influenced, or even appear to be influenced, by personal or family
interests;
● Grievance mechanism - has an Ethics Committee that receives reports of wrongdoing by the
Company’s directors, senior management, and employees and investigates them while ensuring
the confidentiality of information and protection of the whistleblowers.

ENVIRONMENTAL
Resource Management
Energy consumption within the organization:
Disclosure Quantity Units
Energy consumption (renewable sources - biodiesel) 89.75 GJ
Energy consumption (gasoline) 13,202.39 GJ
Energy consumption (LPG) 0 GJ
Energy consumption (diesel) 37,152.26 GJ
Energy consumption (electricity) 1,443,336.1 GJ
Reduction of energy consumption
Disclosure Quantity Units
Energy reduction (gasoline) 156 GJ
Energy reduction (LPG) 0 GJ
Energy reduction (diesel) 42.07 GJ
Energy reduction (electricity) 1,480.23 GJ
Energy reduction (gasoline) 0 GJ
The Company has recorded a reduction in energy consumption for 2021, particularly in electricity, due to
mitigation activities like the Chiller Optimization program, energy efficiency initiatives, and proper
maintenance of facilities and equipment.
Megaworld’s Management Approach on Energy Consumption
The nature of Megaworld’s operations requires it to maintain and operate equipment and facilities that
require significant energy utilization, mainly to satisfy cooling and lighting requirements in its malls,
offices, and hotel properties. It is therefore important to manage energy use efficiently.
To demonstrate the Company’s adherence to principles of sustainability, Megaworld has been advocating
green developments through its township’s individual “green” buildings, which take into account the
standards of LEED (Leadership in Energy and Environment Design). To date, Megaworld’s current
certifications and accreditations are listed below:
● Uptown Tower 1 - LEED Certification (SILVER): Last Certified on March 20, 2017
● Uptown Tower 2 - LEED Certification (SILVER): Last Certified on May 20, 2017
● 8 Campus A - LEED Certification (GOLD): Last Certified on September 23, 2014
● 8 Campus B - LEED Certification (GOLD): Last Certified on December 09, 2014
● 8 Campus C - LEED Certification (GOLD): Last Certified on September 14, 2015
● Le Grand Avenue - LEED Certification (SILVER): Last Certified on September 07, 2017

● 10 West - LEED Certification (GOLD): Last Certified on April 22, 2019
● Southeast Asian Campus - LEED Certification (GOLD): Last certified on November 02, 2019
● One Le Grand - LEED Certification (Target): SILVER): Certification in progress
Megaworld regularly monitors its facilities and equipment, through its property managers, to see areas
where energy conservation initiatives can be applied. Where applicable, the Company utilizes and
continuously upgrades its equipment to energy-efficient complements. High efficiency elevators, highly
efficient LED lighting equipped with light and movement sensors, and power transformers and distribution
systems are also being used across its properties.
In 2021, the Company initiated a pilot project, which is the chiller optimization program, that helps reduce
the energy consumption in some of its malls. Megaworld will expand the program utilizing chillers as
cooling to increase energy reduction rates to its other malls.
For Megaworld’s ongoing township developments and projects, the following criteria to ensure efficiency
in its property operations are already incorporated:
1. Installation of solar panel systems on buildings
2. Double glazed and tinted windows
3. Use of LED lights as a standard in all properties
4. Use of occupancy sensors at hallways and parking areas
5. Requiring High EE rating for mechanical equipment
6. Green roofs, open spaces and pocket garden features in its buildings
Water consumption within the organization
Disclosure Quantity Units
Water withdrawal 5,030.35 Megaliters
Water consumption 13,372.85 Megaliters
Water recycled and reused 151.22 Megaliters
Effluents
Disclosure Quantity Units
Total volume of water discharges 7,890.35 Megaliters
Percent of wastewater recycled Not available %

Megaworld’s Management Approach on Water and Effluents
The Company believes that it has a key role to play in the management and protection of the country’s
limited water resources. Water-saving initiatives in Megaworld’s operations help conserve this natural
resource, such as the rainwater harvesting and reuse systems that have been installed in several of its
townships.
Megaworld also ensures that its water storage facilities and holding tanks undergo annual cleaning and
disinfection to maintain the quality of water supplied to its customers. Project designs already incorporate
low flow rate fixtures, utilization of water discharge by using them for cooling tower water requirements
and water for flushing in the comfort rooms for increased water conservation and consumption efficiency.
Effluents are equally relevant to Megaworld for efficiently monitoring the discharged water and tracking
if the discharge is acceptable based on the water quality guidelines and general effluent standards. This
is in compliance with the government requirement for us to have a Wastewater Discharge Permit
(WWDP), which refers to the legal authorization issued by the Department of Environment and Natural
Resources - Environmental Management Bureau (DENR-EMB) and Laguna Lake Development Authority
(LLDA). Megaworld is 100% compliant with all applicable regulatory standards. The Company trains
technical personnel to be a Pollution Control Officer to monitor and comply with the standards.
Materials used by the organization
Disclosure Quantity Units
Materials used by weight or volume
renewable
Supplied Water 512,684.16 cubic meters
Water Abstracted 163,654.19 cubic meters
Carpet-area rug 2,615.63 kgs
Carpet tiles 36.98 kgs
Tiles 57,554.75 kgs
Outdoor furniture 362.29 kgs
Polycarbonate divider 110.41 kgs
Pendant lights 226 kgs
Reupholstery and fabric 36.08 kgs
Roller shades 179.18 kgs
non-renewable
Diesel 1,610,072.92 liters
Gasoline 41,077.45 liters
Cement 40,233,053.60 kgs
Ceramic tiles 332,454.22 pcs
Paint 38,231.74 sqm
Gypsum board 5,302.10 sqm

PVC pipes 34,023.00 m
Reinforcing steel bars 3,333,094.99 kgs
Wood (doors and cabinets) 83,525.00 kgs
Glass 19,350.00 kgs
Wires 1,225.00 m
Steel pipes 19,551.00 m
Percentage of recycled input materials used to manufacture the organization’s primary products and services
Not available %
Data for materials used by Megaworld are records on Fuel Consumption, Supplied Water, and Water
Abstracted collected from its 70 projects under construction.
Records and monitoring of reclaimed materials such as scrap metal, scrap plastic, and scrap wood are in
place and are being reviewed annually to identify areas where performance can be improved. Total
reclaimed materials reported in 2021 amounted to 290,918 kilograms.
Megaworld’s Management Approach on Materials
Megaworld recognizes its responsibility for the input materials used in its construction activities. Energy,
water, and materials such as steel and cement, make up the resources used in property development. Bulk
of materials used by the Company’s ongoing projects is procured by its stable of accredited contractors
and vendors that are ISO140001 compliant, thus guaranteeing that these contractors adhere to the highest
environmental standards.
For Megaworld’s projects where most of its contractors have limited capacity, the Company sources its
own materials. These materials are continuously monitored and managed as part of its commitment to use
resources efficiently.
Ecosystems and biodiversity (whether in upland/watershed or coastal/marine)
Disclosure Quantity Units
Operational sites owned, leased, managed in, or adjacent to, protected areas and areas of high biodiversity value outside protected areas
Four sites (Boracay
Newcoast, Twin Lakes,
Sta. Barbara Heights,
The Hamptons
Caliraya)
#
Habitats protected or restored N/A ha
IUCN17 Red List species and national conservation list species
with habitats in areas affected by operations
N/A
17 International Union for Conservation of Nature

Megaworld’s Management Approach on Biodiversity
As the leader in the development of integrated tourism estates, Megaworld highly considers nature and
biodiversity as part of the Company’s townships and project amenities. As such, it is important for the
Company to implement measures to protect and preserve the ecosystem of its biodiversity-rich tourism
estate developments.
With Megaworld’s commitment to the protection of the environment, 60% of Boracay Newcoast’s 150-
hectare development is devoted to green and open spaces. The Company has likewise been proactively
implementing green initiatives and programs such as the use of solar-powered and LED street lamps and
e-jeepneys, the installation of detention and siltation tanks, the construction of its own material recovery
facility, its compliance to the 25+5 meter 'No Build' rule in the beach area, and the construction of its own
sewage treatment plant that has the capacity of treating five times more than the development’s actual
waste.
As Megaworld continues to add more tourism estates in its portfolio, it not only transforms the land that
it develops, but it also takes the responsibility to think of ways to nurture and augment the diversified
natural environment of its tourism estates.
Environmental impact management
Air Emissions
GHG
Disclosure Quantity Units
Direct (Scope 1) GHG Emissions 4,235.74 Tonnes CO2e
Energy indirect (Scope 2) GHG Emissions 261,518.73 Tonnes CO2e
Emissions of ozone-depleting substances (ODS) N/A Tonnes
Air pollutants
Disclosure Quantity Units
NOx N/A kg
SOx N/A kg
Persistent organic pollutants (POPs) N/A kg
Volatile organic compounds (VOCs) N/A kg
Hazardous air pollutants (HAPs) N/A kg
Particulate matter (PM) N/A kg

Megaworld’s Management Approach on Emissions
The Alliance Global group has started a target of being carbon neutral by 2035. As part of the group, Megaworld aims to significantly contribute to the achievement of this target. By setting targets and goals for reducing carbon emissions, Megaworld can identify initiatives that will allow the Company to reach its target in a timely and efficient manner.
Sustainable approaches and business practices extend to its operating properties. The Company’s malls have begun to use solar roof panels while utilizing an open layout scheme for passive cooling and natural lighting in common areas, thus providing more natural ventilation and reducing the need for energy-consuming cooling and ventilation systems and artificial lights. Moreover, the Company also implements periodic upgrades for its mall and office equipment to increase energy efficiency and reduce consumption. In 2021, consistent with the Company’s drive to reduce its energy requirements derived from fossil fuel sources, 90% of the energy requirements of Megaworld Lifestyle Malls are already sourced from renewable energy. Conversion plans are in place to transition the rest of the Company’s office and hotel properties in line with its 2035 goal.
Included in the operations and project development planning are ways the Company can use its resources efficiently, thereby reducing consumption and GHG emissions. The Company’s land development plans allow for better mobility and connectivity, like having biking network facilities, and transport terminals within the townships, thereby helping reduce carbon footprint and energy consumption among its locators and residents. Where appropriate, Megaworld’s new developments seek to achieve a 40% ratio for green and open spaces. Also included in its project development plans is the preservation of centuries-old trees within its townships. The Company also uses endemic trees as part of the Company’s efforts to maximize greenery in its townships and to contribute to the carbon offsets for Megaworld. To date, the Company has 4,096 native trees in all of its townships. and Its carbon offset efforts also include the management of 240 hectares of forest areas under its allocating tracts of land to support its Adopt-a-Forest program, as well as the management of two (2) hectares of mangrove forests in Palawan. Currently, Megaworld has adopted 240 hectares of forest area in Iloilo Also standard in the Company’s new developments are the use of drip irrigation, water reuse systems, and other energy and water conservation programs.
Solid and Hazardous Wastes
Solid Waste
Disclosure Quantity Units
Total solid waste generated 26,157.52 metric tonnes
Reusable 4.7 metric tonnes
Recyclable 104.94 metric tonnes
Composted 66.83 metric tonnes
Incinerated 0 metric tonnes
Residuals/Landfilled 25,969.59 metric tonnes
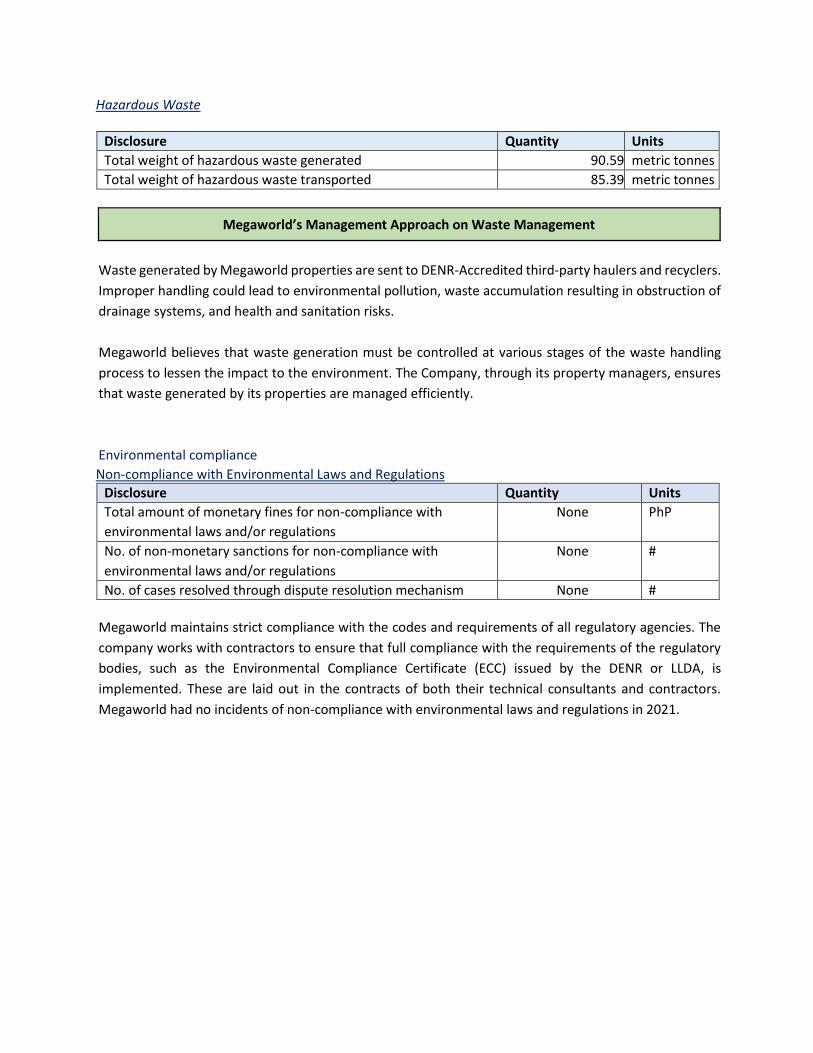
Hazardous Waste
Disclosure Quantity Units
Total weight of hazardous waste generated 90.59 metric tonnes
Total weight of hazardous waste transported 85.39 metric tonnes
Megaworld’s Management Approach on Waste Management
Waste generated by Megaworld properties are sent to DENR-Accredited third-party haulers and recyclers.
Improper handling could lead to environmental pollution, waste accumulation resulting in obstruction of
drainage systems, and health and sanitation risks.
Megaworld believes that waste generation must be controlled at various stages of the waste handling
process to lessen the impact to the environment. The Company, through its property managers, ensures
that waste generated by its properties are managed efficiently.
Environmental compliance
Non-compliance with Environmental Laws and Regulations
Disclosure Quantity Units
Total amount of monetary fines for non-compliance with
environmental laws and/or regulations
None PhP
No. of non-monetary sanctions for non-compliance with
environmental laws and/or regulations
None #
No. of cases resolved through dispute resolution mechanism None #
Megaworld maintains strict compliance with the codes and requirements of all regulatory agencies. The
company works with contractors to ensure that full compliance with the requirements of the regulatory
bodies, such as the Environmental Compliance Certificate (ECC) issued by the DENR or LLDA, is
implemented. These are laid out in the contracts of both their technical consultants and contractors.
Megaworld had no incidents of non-compliance with environmental laws and regulations in 2021.

SOCIAL
Employee Management
Employee Hiring and Benefits
Employee data
Disclosure Quantity Units
Total number of employees18 5,393 # a. Number of female employees 2,812 #
b. Number of male employees 2,581 #
Attrition rate19 rate
Ratio of lowest paid employee against minimum wage N/A ratio
18 Employees are individuals who are in an employment relationship with the organization, according to national law or its
application (GRI Standards 2016 Glossary) 19 Attrition are = (no. of new hires – no. of turnover)/(average of total no. of employees of previous year and total no. of employees of current year)
No employees are below minimum wage.
Employee benefits
Megaworld
List of Benefits Y/N % of female employees who availed for the year
% of male employees who availed for the year
SSS Y 27.39 36.98
PhilHealth Y 17.38 30.36
Pag-ibig Y 19.59 30.86
Parental leaves Y 3.33 2.03
Vacation leaves Y 89.78 93.06
Sick leaves Y 77.38 77.32
Medical benefits (aside from
PhilHealth)) Y
Housing assistance (aside from Pag-
ibig) Y 0.20 0.28
Retirement fund (aside from SSS) Y 0.02 0.55
Further education support Y 0.00 0.00
Company stock options Y 0.00 0.00
Telecommuting (Work-From-Home) Y 52.09 31.78
Flexible-working Hours Y 8.18 9.56
Others (Bereavement) Y 0.00 0.00

Megaworld’s Management Approach on Employment
Megaworld recognizes its human resources as one of its most important assets. The acquisition thereof
plays a vital role in its operations. Thus, it places value on its talents by taking care of their well-being. Upon
hiring, the Company covers for an employee’s physical well-being through an HMO coverage, provides
security through a life insurance coverage, and recognizes an employee’s performance through annual
appraisals and incentives. In line with the Company’s prioritization of its employees’ health, Megaworld
facilitates annual physical examinations and anti-flu vaccinations in partnership with our HMO provider for
its employees.
Also, as a leading developer of top-notch properties, the Company also offers a housing plan to qualified
employees by providing them with significant discounts on all Megaworld properties, including its
subsidiaries.
As needed, the Company benchmarks against competitors and even other industries to check if its
practices, processes, and compensation and benefits packages are at par.
Employee Training and Development
Disclosure Quantity Units
Total training hours provided to employees
a. Female employees 272,125
hours
b. Male employees hours
Average training hours provided to employees
a. Female employees 50.46
hours/employee
b. Male employees hours/employee
Megaworld’s Management Approach on Training and Development
Training and development are essential to retaining employees, helping improve skills, and sustaining
the growth of the Company’s talent pool. Megaworld believes that a successful training and development
program would result in enhanced employee competency, spirit, and resilience in terms of overcoming
challenges that they may face.
To encourage learning among its employees, the Company implements a policy requiring employees to
get a minimum of eight (8) hours of relevant training per year. Likewise, Megaworld embedded this
requirement in its Performance Management System to include training as part of the employees’
performance metrics.
The learning programs that the Company offers are highly inclusive, and everyone is given an equal
opportunity to participate. Part of the Company’s 2022 initiatives is to improve monitoring by including
gender and other personal details in an individualized employee learning track record to ensure equitable
training access for all its employees. Training needs analyses are periodically conducted to determine and

customize the training programs that are appropriate to their needs. Megaworld Learning Academy, HR
Business Partners, Organizational Development, and other Training Groups collaborate to promote and
manage the learning and development needs of its employees. The teams use a combination of
Zoom/Google Meet for online learning sessions, Google suite for data/material management and tracking,
and Facebook for live streams and learning and development-related postings.
The effectiveness of the training and development initiatives/programs is determined through post-
training evaluation/feedback in order for the Company to understand what needs to be replicated, what
needs to be modified, and what needs to be improved for a particular training program.
Labor-Management Relations
Disclosure Quantity Units
% of employees covered with Collective Bargaining
Agreements
N/A %
Number of consultations conducted with employees
concerning employee-related policies
N/A #
Labor-Management Relations was not identified as material to Megaworld. The Company has no
collective bargaining agreements.
Diversity and Equal Opportunity
Disclosure Quantity Units
% of female workers in the workforce 52.14 %
% of male workers in the workforce 47.86 %
Number of employees from indigenous communities and/or
vulnerable sector*
N/A #
*Vulnerable sector includes elderly, persons with disabilities, vulnerable women, refugees, migrants, internally displaced persons,
people living with HIV and other diseases, solo parents, and the poor or the base of the pyramid (BOP; Class D and E).
Megaworld’s Management Approach on Diversity and Equal Opportunity
Through a culture that values diversity and equal opportunity, Megaworld has not only consistently
strengthened its workforce as well as its competitiveness in the property industry, but it has also been able
to offer quality employment to a broad pool of qualified individuals. The inclusivity implemented by the
Company in its work environment increases access to employment opportunities within the organization.
Not only is Megaworld creating jobs, which is part of its mission, but it is also doing so in a way that values
different characteristics, skill sets, knowledge, experience, and perspectives. Diversity and equal
opportunity boost productivity, creativity, and innovation, and enhance employee engagement and
retention—which also translates to improved business performance, longevity, and sustainability.
Megaworld’s commitment to inclusivity encompasses its establishment of programs and initiatives that are
beneficial to the diverse workforce and are geared towards each member’s continued growth and
development.

Workplace Conditions, Labor Standards, and Human Rights
Occupational Health and Safety
Disclosure Quantity Units
Safe Man-Hours 12,339,184 Man-hours
No. of work-related injuries None #
No. of work-related fatalities None #
No. of work-related ill-health None #
No. of safety drills 2 #
Megaworld’s Management Approach on Occupational Health and Safety
Megaworld believes that employee well-being is vital to attaining its vision of uplifting lives and its mission
statement of delivering long-term value to its employees. Megaworld’s Occupational Safety and Health
(OSH) Policy’s focus is on maintaining a safe and healthy work environment across its supply chain. The
Company is in the low-risk category relative to Occupational Safety and Health Assessment (OSHA) risk
category. Risks include a decrease in productivity and healthcare financing for accidents and illness.
Safety Protocol Officers were assigned to each significant department and location to help address safety-
related concerns and promote guidelines related to health and safety. With the onset of the coronavirus
pandemic, an internal task force was also organized to specifically manage the COVID-19-related cases and
concerns of the company since the pandemic.
A continuous review of OSH audits, monitoring, and reporting incidents of illness and accidents in the
workplace is routinely done to acquire a more accurate representation of all recorded incidents of work-
related accidents and ill-health for the reporting period. In 2021, Megaworld recorded a total of 12,339,184
safe man-hours with zero incidents of work-related injuries, fatalities, or ill-health.
Labor Laws and Human Rights
Disclosure Quantity Units
No. of legal actions or employee grievances involving forced
or child labor
None #
Do you have policies that explicitly disallow violations of labor laws and human rights (e.g.
harassment, bullying) in the workplace?
Topic Y/N If Yes, cite reference in the company policy
Forced labor Y The Company conducts thorough audits on its vendors and contractors to ensure that underage workers are not employed in their operation.
Child labor Y
Human Rights Y Policy against Sexual Harassment Policy for Supporting Breastfeeding Employees Policy supporting the Magna Carta for Women Policy in support of the Family Welfare Act Special Leave Benefits For Women Employees

Workplace policy and program on Hepatitis B Anti-discrimination policy
Supply Chain Management
Do you have a supplier accreditation policy? If yes, please attach the policy or link to the policy:
The Company has a broad base of contractors and suppliers from the construction stage up to the operation, maintenance, and upkeep of the Company’s properties. The accreditation of these suppliers, conducted through third party accreditation firms, helps to ensure the quality and timeliness in the delivery of the projects. Having reputable accreditation firms helps ensure that suppliers and contractors chosen are compliant with all government regulations and standards. This, in turn, ensures the satisfaction of the customers of the Company. .
Do you consider the following sustainability topics when accrediting suppliers?
Topic Y/N If Yes, cite reference in the supplier policy
Environmental performance Y The Company has a third-party accreditation firm that handles the screening process and ensures that these metrics are considered.
Forced labor Y
Child labor Y
Human rights Y
Bribery and corruption Y

Relationship with Community
Significant Impacts on Local Communities
Operations with significant (positive or negative) impacts on local communities (exclude CSR projects; this has to be business operations
Township Development
Location Philippines
Vulnerable groups, if applicable Children and youth, elderly, persons with disabilities, vulnerable women, refugees, migrants, internally displaced persons, people living with HIV and other diseases, solo parents, and the poor or the base of the pyramid (BOP; Class D and E)
Does the particular operation have impacts on indigenous people (Y/N)?
does not directly impact indigenous people as most projects are in developed area
Collective or individual rights that have been identified that or particular concern for the community
As the pioneer of township developments, it has always been Megaworld’s pursuit to create game-changing property innovations that will improve the livelihood and positively impact the nation. By spurring stronger economic activity through its townships, Megaworld will be able to promote reverse migration and persuade those who have left their localities to come back and build a career in their own hometowns. This way, the Company also helps keep Filipino families intact.
Mitigating measures (if negative) or enhancement measures (if positive)
As the company expands into more locations, it is able to provide more employment and business opportunities for all sectors of the society
Operations with significant (positive or negative) impacts on local communities (exclude CSR projects; this has to be business operations
Real Estate Development
Location Philippines
Vulnerable groups, if applicable N/A
Does the particular operation have impacts on indigenous people (Y/N)?
does not directly impact indigenous people as most projects are in developed area
Collective or individual rights that have been identified that or particular
As Megaworld crafts a legacy of bringing value to people’s lives through its real estate offerings, the Company is also pursuing

concern for the community opportunities that will allow it to become more transformative and impactful as a developer. Through its wholly-owned subsidiary, Suntrust Properties, Inc. (SPI), Megaworld acquired Stateland Inc., a 42-year-old real estate company known for building affordable quality homes and communities in South Luzon and several parts of Metro Manila. This has allowed the Company to participate in the government’s shelter programs, pioneering in areas with potential growth and conducive to economic development.
Mitigating measures (if negative) or enhancement measures (if positive)
As the company expands into more locations, it is able to provide more employment and business opportunities for all sectors of the society
Operations with significant (positive or negative) impacts on local communities (exclude CSR projects; this has to be business operations
Office Development and Leasing
Location Philippines
Vulnerable groups, if applicable N/A
Does the particular operation have impacts on indigenous people (Y/N)?
does not directly impact indigenous people as most projects are in developed area
Collective or individual rights that have been identified that or particular concern for the community
Megaworld designs its buildings to adhere to Green building standards. This promotes employee well-being, which increases productivity in the workplace. Green developments also help reduce the carbon footprint of these buildings thus minimizing any unfavorable impact to the environment. These types of developments not only attract multinational corporations to locate their offices in the country, but also contribute over the long term to the government’s efforts to provide more job opportunities in the country.
Mitigating measures (if negative) or enhancement measures (if positive)
As the company expands into more locations, it is able to provide more employment and business opportunities for all sectors of the society

Operations with significant (positive or negative) impacts on local communities (exclude CSR projects; this has to be business operations
Mall Development and Leasing
Location Philippines
Vulnerable groups, if applicable N/A
Does the particular operation have impacts on indigenous people (Y/N)?
does not directly impact indigenous people as most projects are in developed area
Collective or individual rights that have been identified that or particular concern for the community
Megaworld Lifestyle Malls epitomizes the Philippines most inventive lifestyle centers that offer groundbreaking experiences to the metropolitan communities of the country. Each mall has a unique personality and story that takes its guests on a world-class adventure through pioneering design, state of the art facilities, and commercial establishments never before seen in the Philippines. This way, Filipinos are exposed to world-class amenities and shopping experiences, while celebrating the country’s local finest. Megaworld Lifestyle Malls likewise has converted several open spaces in its select lifestyle malls into outdoor farmers’ markets to support Filipino farmers, fisherfolks and food entrepreneurs who have been directly impacted by the global pandemic to showcase and market their products while giving the mall-going public access to a wide range of fresh fruits, vegetables, seafood, meat products, and other food choices in a much safer shopping environment. This is part of the Company’s continuing support to the government’s thrust to help the economy recover fast.
Mitigating measures (if negative) or enhancement measures (if positive)
As the company expands into more locations, it is able to provide more employment and business opportunities for all sectors of the society
Operations with significant (positive
or negative) impacts on local
communities (exclude CSR projects;
this has to be business operations
Hotel Development and Operations
Location Philippines
Vulnerable groups, if applicable N/A

Does the particular operation have
impacts on indigenous people (Y/N)?
does not directly impact indigenous people as most projects
are in developed area
Collective or individual rights that
have been identified that or particular
concern for the community
Megaworld has been developing world-class hotels and resorts
that befit the status of the Philippines as a prime haven for
international travelers. The Company has been closely working
with the Department of Tourism (DoT) to ensure that the
Company is able to customize its developments and services to
the needs and peculiarities of the local tourism market through
Megaworld Hotels.
More than just developing hotels, Megaworld enlivens its
hotels with the warmth and hospitality inherent to the Filipino
culture. This Filipino brand of hospitality has become
Megaworld Hotel’s signature brand of service, setting them
apart from other hotel developers and operators in the
country.
Mitigating measures (if negative) or
enhancement measures (if positive)
As the company expands into more locations, it is able to
provide more employment and business opportunities for all
sectors of the society
*Vulnerable sector includes children and youth, elderly, persons with disabilities, vulnerable women, refugees, migrants, internally
displaced persons, people living with HIV and other diseases, solo parents, and the poor or the base of the pyramid (BOP; Class D
and E)
For operations that are affecting IPs, indicate the total number of Free and Prior Informed Consent (FPIC)
undergoing consultations and Certification Preconditions (CPs) secured and still operational and provide
a copy or link to the certificates if available:
Certificates Quantity Units
FPIC process is still undergoing N/A #
CP secured N/A #
Properties owned by the organization are not located within ancestral domains and are mostly located in the
central districts of localities.
Megaworld’s Management Approach on Local Communities
The Company supports the government’s thrust to promote economic development and intends to
continue to pursue revenue and geographical diversification as it develops community townships
embodying the “live-work-play-learn” concept in various stages and strategic locations both within and
outside Metro Manila.

The Company commits to create inclusive growth for its stakeholders and the communities around it by
providing equal access to relevant resources and opportunities in order to promote shared prosperity and
social harmony.
Megaworld’s position as a leader in crafting and delivering community township developments has
strengthened over the years and continues to be its key strategy in bringing new projects to the market
and entering into new joint venture developments. In the same manner, this strength is also used by the
Company to create value to the communities that it operates in. The development of Megaworld
townships has helped spur economic growth by providing job opportunities and creating new markets for
the benefit of nearby communities.
For instance, the Company’s community programs include micro, small, and medium enterprises (MSME)
development assistance like providing livelihood opportunities for farmers and MSMEs to sell their
products in its malls and retail areas., engaging with local stakeholders to address common concerns,
providing various corporate social responsibility programs to assist local communities. In all of its
townships, the Company makes government services more accessible to the local communities by
providing space for such services in its buildings.
Customer Management
Customer Satisfaction
Disclosure Score Did a third party conduct
the customer satisfaction study (Y/N)?
Customer satisfaction Not available N
No third-party service was tapped to conduct a customer satisfaction survey for the organization.
Health and Safety
Disclosure Quantity Units
No. of substantiated complaints on product or service
health and safety*
0 #
No. of complaints addressed 0 # *Substantiated complaints include complaints from customers that went through the organization’s formal communication
channels and grievance mechanisms as well as complaints that were lodged to and acted upon by government agencies.

Megaworld’s Management Approach on Customer Health and Safety
Megaworld and its subsidiaries have been strictly and consistently following government guidelines in
promulgating a secure, safe, and wonderful experience to its customers. The Company adheres to all
relevant rules and regulations in the design, construction, and operations of all of its properties.
Megaworld seeks to assure customers of their safety when entering the Company’s establishments via
the implementation of enhanced health and safety protocols. With the onset of the coronavirus
pandemic, the Company also made sure that its townships are in full compliance with the Inter-Agency
Task Force (IATF) Safety Guidelines, and have been issued Safety Seals from the various local government
units (LGU).
The Company has launched initiatives to enforce better health and safety protocols for its customers, such
as regular monitoring and implementation of updated IATF Guidelines and allocation of venue, thermal
cameras, Safety-on-Track System, health declaration forms, and hotline for Customer Services. The
Company also ensures availability of critical services through online permits requests and approvals;
Partnerships with different LGUs for their vaccination programs were also established. As a result, the
number of individuals vaccinated across ten (10) Megaworld sites amounted to 630,400; Related to this,
the Company has provided satellite venues for certifications from Department of Health - Bureau of
Quarantine (DOH-BOQ) to assist individuals in securing their vaccination cards and certificates.
Marketing and labeling
Disclosure Quantity Units
No. of substantiated complaints on marketing and
labeling*
n/a #
No. of complaints addressed n/a # *Substantiated complaints include complaints from customers that went through the organization’s formal communication
channels and grievance mechanisms as well as complaints that were lodged to and acted upon by government agencies.
Marketing and labeling was not identified as material to the organization.
Customer privacy
Disclosure Quantity Units
No. of substantiated complaints on customer privacy* None #
No. of complaints addressed None #
No. of customers, users and account holders whose
information is used for secondary purposes
None #
*Substantiated complaints include complaints from customers that went through the organization’s formal communication
channels and grievance mechanisms as well as complaints that were lodged to and acted upon by government agencies.

Data Security
Disclosure Quantity Units
No. of data breaches, including leaks, thefts and losses
of data
0 #
Megaworld’s Management Approach on Customer Privacy and Data Security
The Company gathers and processes a significant amount of data from its clients, partners, and vendors.
As such, compliance with the promulgations of the National Privacy Commission and Data Privacy Act
requirements are strictly observed to ensure that such private information from the Company’s
stakeholders is properly secured and managed.
Privacy impact assessments are periodically conducted with information processors and data handlers.
Megaworld takes reasonable steps to securely destroy or permanently de-identify or anonymize personal
information if it is no longer needed. Disposal is in a manner that the personal data is unreadable (for
paper) or irretrievable (for digital records), disposal methods are adopted in accordance with the
Company’s data privacy policy.

UN SUSTAINABLE DEVELOPMENT GOALS
Product or Service Contribution to UN SDGs
Key products and services and its contribution to sustainable development.
Key Products and
Services
Societal Value /
Contribution to UN SDGs
Potential Negative
Impact of Contribution
Management Approach
to Negative Impact
Real estate, Office rentals, Mall rentals, Hotel operations
SDG 5: Gender Equality Equal opportunities in employment, skills training, and career advancement SDG 6: Clean Water and Sanitation Proper handling of wastewater and effluents through STPs in Megaworld properties prior to being discharged. SDG 7: Affordable and Clean Energy Adapting DOE’s Energy Efficiency Program SDG 11: Sustainable Cities and Communities Supported the Plastic Smart Cities Campaign. SDG 12: Responsible Consumption and Production Reallocation of excess materials from previous projects, use of natural materials SDG 13: Climate Action -Adopt-a-Forest program -Management of mangrove forest in Palawan
Megaworld’s operations on real estate and property development could potentially result in environmental risks and risks associated with health and safety.
The Company prides itself in being sustainable by maintaining an efficient system of handling natural resources and raw materials in its townships and development projects. Megaworld handles its environmental impacts through water management practices such as installing rainwater collection tanks to conserve water, as well as installing sewage treatment facilities that ensure all water discharged is within standard quality. On the other hand, the Company adapts DOE’s Energy Efficiency program in its energy-saving initiatives. Furthermore, Megaworld puts an active stance on climate action with its Adopt-a-Forest program, as well as with its tree planting activities at the La Mesa Watershed and a 2035 carbon neutrality goal ever since the Company began tracking its GHG emissions.
Corporate Social Responsibility
SDG 1: No Poverty -Stitches to Riches Livelihood Program for families in Megaworld-GK Village in Mandaluyong -Livelihood for street
Megaworld believes in bringing social change and opportunities to the communities that it supports. However, this could encourage a sense
Megaworld adapts CSR programs that have a strong focus on community development through livelihood and education. This promotes

families and for those who lost their jobs living in Makati & Manila SDG 2: Zero Hunger - Sustainable food source garden project (Cottolengo Filipino) - Rice Together Campaign:
● in 6 Barangays near Megaworld Projects (Donated 2,400 kgs of Rice in total)
● in Rizal that benefitted 200 families (Donation 2,000 kgs of Rice)
- Feeding Program for 138 malnourished children (Negrense Volunteers for Change Foundation, Inc.) SDG 4: Quality Education - Continuous Scholarship Programs through Megaworld Foundation -Donated materials and equipment to produce educational materials needed for DepEd's Modular Educational System amidst COVID (6 public schools nationwide; 7 printers and printing materials; year 2020-2021) - Education on Wheels (Tech Voc to Degree) - E-Learning Hubs (Donated 2 Learning hubs in total) - Supported the construction of Yellow School of Hope for Badjao students in Basilan - Supported 20 classes of public school students in Marinduque for 1 Whole S.Y - Supported 5 Learning Hubs in Camarines Sur that will benefit 125 preschool students
of dependence and complacency of the community to the Company’s CSR programs.
long-term benefits to the beneficiaries of its supported communities by becoming self-sufficient.

SDG 5: Gender Equality -Supported the education of the 10 abused girls in Cebu for 1 whole SY SDG 8: Decent Work and Economic Growth - Stitches to Riches Livelihood Program (Megaworld-GK residents in Mandaluyong) - Tinalak Weavers Livelihood Assistance Project: 10 IP weavers; South Cotabato (LASIWWAI Learning Institute) - Livelihood for street families or for those who lost their jobs (Makati & Manila) - Supported the Plastic Smart Cities Campaign. Livelihood (upcycle) for community in Dosol, Sorsogon SDG 10: Reduced Inequalities -Support to 1 Deaf student's college education SDG 13: Climate Action - Planted 500 native seedlings in Tanauan Quezon SDG 14: Life Below Water - Supported the Plastic Smart Cities Campaign SDG 15: Life on Land - Planted 500 native seedlings in Tanauan Quezon
* None/Not Applicable is not an acceptable answer. For holding companies, the services and products of its subsidiaries may be
disclosed.

Annex B: Topic Guide
In line with the Disclosure Topic and Management Approach discussion above, this Annex will provide a guide on what to disclose in the Topics provided in the Reporting Template. The guide is based on the GRI Standards, SASB Standards and Recommendations of the Task Force on Climate-related Financial Disclosures.
ECONOMIC
Economic disclosures relate to how the company directly increases the pool of economic resources that flows in the local and national economy. Included in the disclosures are the risks and opportunities due to climate change, procurement practices with respect to local suppliers and anti-corruption.
Economic Performance
Measuring the direct economic value generated, measured as revenue and distributed (costs) shows that an organization does not just create economic value for itself but also ensures that this value flows back to its various stakeholders such as stockholders, suppliers, employees, government, and the community. This also discloses the remaining value that is retained in the company for liquidity and for future investments. Figures for this disclosure can be derived using the audited financial statement with the revenue as the economic value generated for the reporting period.
This disclosure answers the questions:
• How much direct economic value (revenue) did you generate?
• How much of this flowed back to society (costs disaggregated according to stakeholders)?
• How much of this was retained in the company for liquidity and to fund future investments?
See GRI 201-1 for more guidance on the disclosure.
Disclosure of an organization’s climate-related issues helps stakeholders make sound and reasonable assessments of the impact climate change may have on the organization. Companies should disclose the climate-related risks and opportunities they have identified and how they assess and manage those issues. See GRI 201-2 and the Recommendations of the Task Force on Climate-related Financial Disclosures for more guidance on the disclosure.
Procurement Practices
Disclosure on the proportion of spending on local suppliers show’s an organization’s support for local groups, including those owned by women or members of vulnerable sectors. Supporting local suppliers can indirectly attract additional investments to the local economy. The disclosure describes the policies and practices used to select locally-based suppliers and to promote economic inclusion when selecting suppliers. See GRI 204 for more guidance on disclosures
Anti-corruption
Disclosures on training on anti-corruption policies and procedures show how the company ensures that it has the necessary capability to fight against corruption through proper training and awareness building for its directors, management, employees and business partners. Disclosures on incidents of corruption and

how the company responded on the incidents show how serious an organization is on combatting corruption. See GRI 205 and SASB Standards General Issue Category: Business Ethics for more guidance on the disclosures.
ENVIRONMENT
Environmental disclosures relate to how the company manages the natural resources it needs for its business, as well as how it minimizes its negative impacts to the environment, including biodiversity. The company’s ability to access materials needed for its operations is critical to company’s long-term success.
Resource Management
Disclosures on resource management such as energy consumption, water consumption, and materials use show how efficiently an organization uses scarce natural resources, which has implications on reduction of environmental impacts from extraction and processing of these resources. The efficiency of managing resources relates to profitability of the organization. See GRI 301, GRI 302, GRI 303 and SASB Standards General Issue Categories: Energy Management; Water and Wastewater Management; Material Sourcing and Efficiency for more guidance on the disclosures.
Ecosystems and Biodiversity
Disclosure on activities that show how an organization protects, conserves, or rehabilitates ecosystems and biodiversity therein such as in watersheds and coastal and marine areas gives an idea of how that organization appreciates the ecosystem and the services it gives that make business thrive. Ecosystems and Biodiversity is vital to human existence. Companies have the responsibility and clear business case for ensuring ecosystems and biodiversity around its sites are protected and restored. See GRI 303, GRI 304 and SASB Standards General Issue Category: Ecological Impacts for more guidance on the disclosures.
Environmental Impact Management
Reporting on an organization’s impact on air, soil, and water through emissions, wastes, and effluents provides basis for companies to manage these impacts. Responsible companies take an effort to minimize such impacts through cleaner production and pollution prevention measures. Companies should disclose on their performance on these topics including how well the organization mitigates, reduces, and/or prevents these impacts to the environment in compliance to Philippine Environmental Laws or on efforts beyond compliance. See GRI 305, GRI 306 and SASB Standards General Issue Categories: GHG Emissions; Air Quality; Water & Wastewater Management; Waste & Hazardous Materials Management for more guidance on the disclosures.
Environmental Compliance
Disclosure on an organization’s compliance with environmental laws and/or regulations shows an organization’s ability to conform to certain performance parameters. The strength of an organization’s compliance indicates its concern for environmental protection. See GRI 307 and SASB Standards General Issue Categories: Ecological Impacts; Air Quality; Water & Wastewater Management; Waste and Hazardous Materials Management for more guidance on the disclosures

SOCIAL
Disclosures on social topics relate to how the organization relates and manages its relationship with its stakeholders such as employees, communities, customers, and suppliers.
Employee Management
Disclosing employee management indicates how good an employer the organization is in engaging its employees. It also provides a sense on how the organization develops its employees and gives equal opportunity for all, such as indigenous people and those coming from vulnerable groups which include elderly, persons with disabilities, vulnerable women, refugees, migrants, internally displaced persons, people living with HIV and other diseases, solo parents, and the poor or the base of the pyramid (BOP; Class D and E). See GRI 401, GRI 402, GRI 404, GRI 405, GRI 406, GRI 407, GRI 102-8, GRI 102-41 and SASB Standards General Issue Categories: Labor Practices; Employee, Engagement Diversity & Inclusion
for more guidance on the disclosures.
Workplace Conditions,Labor Standards and Human Rights
Disclosures on workplace conditions and labor standards show how an organization gives importance to occupational health and safety and how it upholds labor standards and human rights in the workplace. See GRI 403, GRI 408, GRI 409, GRI 412 and SASB Standards General Issue Category: Employee Health & Safety for more guidance on the disclosures.
Supply Chain Management
Disclosures on supply chain management are most relevant for companies with a significant portion of value creation carried out by suppliers. Organizations can report on how the reporting company ensures that suppliers uphold sustainability standards and practices including compliance to Philippine laws. The reporting company may also disclose how it influences its suppliers to be sustainable through supplier accreditation processes, among other approaches. See GRI 308, GRI 414 and SASB Standards General Issue Category: Supply Chain Management for more guidance on the disclosures.
Relationship with Community
These disclosures show how an organization meaningfully engages the community around their sites and how it aims to create a net positive impact to its host or neighbors. These also includes how the company contributes in addressing issues of indigenous people and those coming from vulnerable groups [youth, elderly, persons with disabilities, vulnerable women, refugees, migrants, internally displaced persons, people living with HIV and other diseases, solo parents, and the poor or the base of the pyramid (BOP; Class D and E)] in its business operations. See GRI 411, GRI 412, GRI 413 and SASB Standards General Issue Category: Human Rights & Community Relations for more guidance on the disclosures.
Customer Management
Disclosing on customer management shows how well an organization upholds the rights of its customers to privacy, safety, and security from probable negative impacts of its products and services. See GRI 416, GRI 417, GRI 418 and SASB Standards General Issue Categories: Product Quality & Safety; Customer Welfare; Selling Practices & Product Licensing for more guidance on the disclosures.

Data Security
Reporting on the number of data breaches, including leaks, thefts and losses of data shows how much importance an organization places on keeping data secure. Organizations can indicate how they manage risks related to the collection, retention and use of sensitive information. See SASB Standards General Issue Category: Data Security for more guidance on the disclosure.
UN SUSTAINABLE DEVELOPMENT GOALS
The SDG Compass can be used as guidance for companies on how they can align their strategies as well as measure and manage their contribution to the realization of the SDGs. The SDG Compass can be accessed at https://sdgcompass.org/
Moreover, a recent publication with the title: Integrating the SDGs into Corporate Reporting: A Practical Guide,20 helps companies of all sizes to prioritize SDG targets to act and report on, set related business objectives, and measure and report on progress. This is a co-production between GRI and UN Global Compact (UNGC).
Companies may also use the following framework to determine which area of sustainable development
its company is contributing to improve people’s quality of life.
For more information on how the private sector can contribute to sustainable development, companies
may visit www.sdgsbiz.ph.
20 This publication may be accessed at https://www.globalreporting.org/resourcelibrary/GRI_UNGC_Reporting-on-SDGs_Practical_Guide.pdf